Attached files
Table of Contents
Exhibit 13

Table of Contents
VALUES WE SHARE
| Our Purpose: |
C |
USTOMER SATISFACTION | ||
| — Strive to exceed customer expectations | ||||
| — Listen, understand and respond to customer needs — Serve in a friendly, professional, caring way, adding that personal touch — Earn confidence and loyalty of customers through exceptional service | ||||
| Our Foundation: |
I |
NTEGRITY | ||
| — Uncompromising, adhere to highest professional and personal ethics | ||||
| — Accept responsibility, fulfill commitments and maintain credibility — Actions founded on honesty, fairness and trust — Do what’s right | ||||
| Our Goal: |
E |
XCELLENCE | ||
| — Approach responsibilities with passion and commitment | ||||
| — Consistently endeavor to do the best job possible — Committed to the concept of rising expectations and continual improvement — Set challenging goals, learn from mistakes, demonstrate innovation and creativity and attention to detail | ||||
| Our Style: |
T |
EAMWORK | ||
| — Value diversity and the contributions of others | ||||
| — Share information and expertise — Build trust and relationships through open candid communication — Enthusiastically work together to achieve common goals | ||||
| Our Responsibility: |
C |
OMMUNITY INVOLVEMENT | ||
| — Give time, skills and resources to improve our communities | ||||
| — Be a positive role model; strive to make a difference | ||||
| Our Strength: |
L |
EADERSHIP | ||
| — Lead by example in both words and actions | ||||
| — Stimulate and relish opportunities for positive change — Recognize performance, effectively plan and communicate, demand quality — Respect others and encourage a balanced life approach | ||||
Table of Contents
| Table of Contents | ||||
| 2 | ||||
| 4 | ||||
| 6 | ||||
| Management’s Discussion and Analysis of |
7 | |||
| 28 | ||||
| 33 | ||||
| 71 | ||||
| Management’s Reports to ESB Financial Corporation Shareholders |
73 | |||
| 74 | ||||
| 77 | ||||
| 78 | ||||
| 79 |
| inside back cover |
| Company Profile | ||||
| ESB Financial Corporation (NASDAQ: ESBF), a publicly traded financial services company, provides a wide range of retail and commercial financial products and services to customers in Western Pennsylvania through its wholly owned subsidiary, ESB Bank. | ||||

|
ESB Bank is a Pennsylvania chartered, FDIC insured stock savings bank which, as of December 31, 2009, conducted business through 24 offices in Allegheny, Beaver, Butler and Lawrence counties, Pennsylvania. To compliment retail and commercial operations conducted through its bank offices, the Company invests in U.S. Government, municipal and mortgage-backed securities through its subsidiary savings bank and through its investment subsidiary, PennFirst Financial Services, Inc., a Delaware corporation. | |||
| Mission Statement | ||||
| The mission of ESB Financial Corporation and its subsidiaries is to effectively provide for the financial service needs of our customers and community while creating value for our shareholders. Our mission will be accomplished by growing in a profitable and controlled manner; by identifying and meeting the financial needs of our customers; by offering quality products and services that are competitively priced and serviced by a knowledgeable, attentive and friendly staff; and by creating a positive work environment that maximizes the alignment of customer and employee objectives. | ||||
Table of Contents
Consolidated Financial Highlights
(Dollar amounts in thousands, except share data)
| As of or for the year ended December 31, | ||||||
| 2009 | 2008 | Change | ||||
| Total assets |
$1,960,677 | $1,974,839 | (1%) | |||
| Securities available for sale |
1,106,910 | 1,096,806 | 1% | |||
| Loans receivable, net |
671,387 | 691,315 | (3%) | |||
| Total deposits |
944,347 | 877,329 | 8% | |||
| Borrowed funds, including junior subordinated notes |
829,641 | 932,901 | (11%) | |||
| Stockholders’ equity |
164,752 | 143,065 | 15% | |||
| Net interest income |
38,148 | 31,143 | 22% | |||
| Net income |
12,012 | 10,215 | 18% | |||
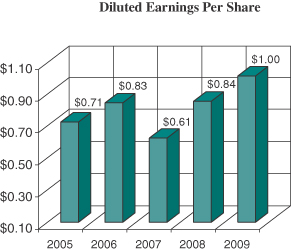
| Net income per share (diluted) |
$1.00 | $0.84 | 19% | |||
| Cash dividends declared per share |
$0.40 | $0.40 | - | |||
| Return on average assets |
0.61% | 0.53% | 15% | |||
| Return on average stockholders’ equity |
7.66% | 7.88% | (3%) | |||
| ESB Financial Corporation | 2 | 2009 Annual Report |
Table of Contents
Consolidated Financial Highlights (continued)
| ESB Financial Corporation | 3 | 2009 Annual Report |
Table of Contents
Dear Fellow Shareholders:
I am pleased to present ESB Financial Corporation’s Annual Report for the year 2009 and to report that the Company posted record earnings per diluted share of $1.00 on net income of $12.0 million for the year ended December 31, 2009, compared to earnings of $0.84 per diluted share on net income of $10.2 million for the year ended December 31, 2008.
The Company achieved record financial results in what was clearly another demanding year for the banking industry. Our performance in this difficult and uncertain operating environment reflects the quality of our organization, the dedication of our employees, the guidance by our Board of Directors, and the focused commitment to our fundamental strategies that have delivered consistent results to our shareholders since our initial public offering in 1990.
Throughout our 94-year history, ESB has continually and successfully responded to change. However, we believe that sticking to basics and maintaining our commitment to the strategies that have made us a leading financial service provider remains a solid roadmap for continued growth and success. In this regard our priorities have not changed and remain:
| • | Focusing on per share results and working diligently to maintain our reputation as a company that creates superior shareholder value; |
| • | Being financially conservative and managing our Company to the highest ethical standards; |
| • | Growing the Company in a controlled and safe manner; |
| • | Maintaining strong credit quality; |
| • | Continuing to strive to exceed our customer expectations for quality products and services; |
| • | Continuing to make investments in human capital, technology and physical infrastructure to ensure our long-term success; |
| • | Continuing to provide a productive work environment that maximizes the alignment of customer and employee objectives and |
| • | Seeking and consummating acquisition opportunities when practical. |
Dividends
I am also pleased to report that during 2009, the Company maintained the current quarterly cash dividend payout of $0.10 per share, which extends our record of paying cash dividends to 78 consecutive quarters. As in previous years, the Board of Directors approved a Common Stock Repurchase Program and, for the year, the Company repurchased approximately 232,000 shares with a market value of $2.9 million.
Branch Office Expansion
In July 2009, the Company opened its 24th office in Renfrew, Connoquenessing Township, Butler, Pennsylvania.
In November 2009, the Company broke ground to relocate its Zelienople Office approximately 1.4 miles south of the current location. The new location is expected to open during the fourth quarter of 2010. This full service facility will afford our customers a large lobby, safe deposit boxes, six teller windows, three drive thru lanes, a full service 24-hour ATM machine and a night drop box.
| ESB Financial Corporation | 4 | 2009 Annual Report |
Table of Contents
Letter to Shareholders (continued)
More than the Money
At ESB, we define success more broadly than just financial results. We also define it by our community involvement, both financially and through volunteerism, and our commitment and adherence to our Mission Statement, Values We Share Statement and Code of Ethics policy, which sets forth the guidance on the way we do business. We are committed to our customers, to the highest ethical behavior, to our communities, and to continued improvement in every aspect of our business. We invite you to review these essential documents which are easily accessible through our website www.esbbank.com. Through our “Casual for Charity Day” program, nearly $20,000 was donated in 2009 to organizations including The American Diabetes Association, The American Heart Association, The American Cancer Society and Project Bundle Up.
Recognition
I am very proud to report that in October 2009, ESB Bank was named as one of the “50 Best Places to Work in Western Pennsylvania” in a competition sponsored by the Pittsburgh Business Times. ESB Bank received this recognition, which is based solely on employee survey results, for the fourth time in 2009
The Year Ahead
With a sound corporate strategy, the hard work and dedication of our employees and the guidance provided by our Board of Directors, I am confident that we have a sound foundation to sustain our performance, to seize new business opportunities, and to initiate new programs that will enhance service to our customers and continue to provide value to our shareholders. As always, we would like to thank all of our customers and our shareholders for their consistent support and we look forward to opportunities for further growth and profitability in 2010.
I would like to express my appreciation to the directors, officers and employees of ESB who have all contributed to our success over the past year. We are very fortunate to have such a talented and dedicated group of individuals who are committed to serving the needs of our customers.
We invite our shareholders to join us at our annual shareholders’ meeting to be held Wednesday, April 21st, at 4:00 p.m. at the Connoquenessing Country Club, 1512 Mercer Road, Ellwood City, PA. Your attendance will be very much appreciated.
Sincerely,

Charlotte A. Zuschlag
President and Chief Executive Officer
| ESB Financial Corporation | 5 | 2009 Annual Report |
Table of Contents
Selected Consolidated Financial Data
(Dollar amounts in thousands, except share data)
| As of December 31, | |||||||||||||||
| Financial Condition Data | 2009 | 2008 | 2007 | 2006 | 2005(1) | ||||||||||
| Total assets |
$ | 1,960,677 | $ | 1,974,839 | $ | 1,880,235 | $ | 1,922,722 | $ | 1,852,779 | |||||
| Securities |
1,106,910 | 1,096,806 | 1,059,972 | 1,143,924 | 1,117,063 | ||||||||||
| Loans receivable, net |
671,387 | 691,315 | 624,251 | 589,642 | 540,277 | ||||||||||
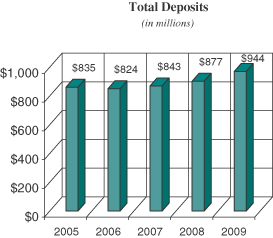
| Deposits |
944,347 | 877,329 | 842,854 | 823,644 | 834,530 | ||||||||||
| Borrowed funds, including subordinated debt |
829,641 | 932,901 | 876,727 | 951,153 | 869,242 | ||||||||||
| Stockholders’ equity |
164,752 | 143,065 | 133,657 | 129,231 | 127,367 | ||||||||||
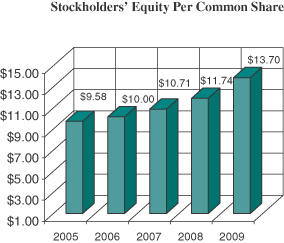
| Stockholders’ equity per common share |
$13.70 | $11.74 | $10.71 | $10.00 | $9.58 | ||||||||||
| For the year ended December 31, | |||||||||||||||
| Operations Data | 2009 | 2008 | 2007 | 2006 | 2005(1) | ||||||||||
| Net interest income |
$ | 38,148 | $ | 31,143 | $ | 24,983 | $ | 28,667 | $ | 30,530 | |||||
| Provision for loan losses |
912 | 1,406 | 865 | 1,113 | 568 | ||||||||||
| Net interest income after provision for loan losses |
37,236 | 29,737 | 24,118 | 27,554 | 29,962 | ||||||||||
| Noninterest income |
3,595 | 5,277 | 7,216 | 7,786 | 3,142 | ||||||||||
| Noninterest expense |
26,784 | 23,042 | 22,667 | 22,770 | 22,812 | ||||||||||
| Income before income taxes |
14,047 | 11,972 | 8,667 | 12,570 | 10,292 | ||||||||||
| Provision for income taxes |
2,382 | 1,548 | 400 | 1,317 | 810 | ||||||||||
| Net income |
11,665 | 10,424 | 8,267 | 11,253 | 9,482 | ||||||||||
| Less: net income attributable to the noncontrolling interest |
(347) | 209 | 606 | 637 | 303 | ||||||||||
| Net income |
$ | 12,012 | $ | 10,215 | $ | 7,661 | $ | 10,616 | $ | 9,179 | |||||
| Net income per common share: |
|||||||||||||||
| Basic |
$1.01 | $0.85 | $0.62 | $0.84 | $0.73 | ||||||||||
| Diluted |
|
$1.00
|
|
$0.84
|
|
$0.61
|
|
$0.83
|
|
$0.71
| |||||
| As of or for the year ended December 31, | |||||||||||||||
| Other Data | 2009 | 2008 | 2007 | 2006 | 2005(1) | ||||||||||
| Performance Ratios (for the year ended) |
|||||||||||||||
| Return on average assets |
0.61% | 0.53% | 0.40% | 0.56% | 0.52% | ||||||||||
| Return on average equity |
7.66% | 7.88% | 5.98% | 8.55% | 7.16% | ||||||||||
| Average equity to average assets |
7.95% | 6.72% | 6.74% | 6.57% | 7.28% | ||||||||||
| Interest rate spread (2) |
2.14% | 1.73% | 1.38% | 1.63% | 1.93% | ||||||||||
| Net interest margin (2) |
2.29% | 1.90% | 1.57% | 1.79% | 2.06% | ||||||||||
| Efficiency ratio |
57.84% | 55.21% | 63.88% | 57.27% | 55.84% | ||||||||||
| Noninterest expense to average assets |
1.36% | 1.20% | 1.22% | 1.24% | 1.31% | ||||||||||
| Dividend payout ratio (3) |
40.00% | 47.62% | 65.57% | 48.19% | 56.34% | ||||||||||
| Asset Quality Ratios (as of year end) |
|||||||||||||||
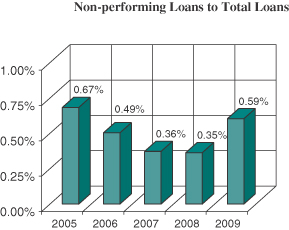
| Non-performing loans to total loans |
0.59% | 0.35% | 0.36% | 0.49% | 0.67% | ||||||||||
| Non-performing assets to total assets |
0.25% | 0.17% | 0.23% | 0.22% | 0.28% | ||||||||||
| Allowance for loan losses to total loans |
0.88% | 0.85% | 0.85% | 0.84% | 0.86% | ||||||||||
| Allowance for loan losses to non-performing loans |
147.58% | 239.95% | 236.21% | 171.75% | 127.26% | ||||||||||
| Capital Ratios (as of year end) |
|||||||||||||||
| Stockholders’ equity to assets |
8.40% | 7.24% | 7.07% | 6.69% | 6.85% | ||||||||||
| Tangible stockholders’ equity to tangible assets |
5.19% | 4.77% | 4.78% | 4.71% | 4.72% | ||||||||||
| (1) | Selected consolidated financial data for 2005 reflects increases due to the acquisition of PHSB Financial Corporation. |
| (2) | Interest income utilized in calculation is on a fully tax equivalent basis, which is deemed to be the most prevalent industry standard for measuring interest rate spread and net interest margin. |
| (3) | Dividend payout ratio calculation utilizes diluted net income per share for all periods. |
| ESB Financial Corporation | 6 | 2009 Annual Report |
Table of Contents
Management’s Discussion and Analysis of
Financial Condition and Results of Operations
Overview
ESB Financial Corporation (the Company) is a Pennsylvania corporation and thrift holding company that provides a wide range of retail and commercial financial products and services to customers in Western Pennsylvania through its wholly-owned subsidiary, ESB Bank (ESB or the Bank). The Company is also the parent company of ESB Capital Trust II (Trust II), ESB Statutory Trust III (Trust III) and ESB Capital Trust IV (Trust IV), Delaware statutory business trusts established to facilitate the issuance of trust preferred securities to the public by the Company, and THF, Inc., a Pennsylvania corporation established as a title agency to provide residential and commercial loan closing services and title closing services.
ESB is a Pennsylvania chartered Federal Deposit Insurance Corporation (FDIC) insured stock savings bank. At December 31, 2009, the bank conducted business through 24 offices in Allegheny, Beaver, Butler and Lawrence counties, Pennsylvania. ESB operates two wholly-owned subsidiaries: (i) AMSCO, Inc., which engages in the management of certain real estate development partnerships on behalf of the Company, and (ii) ESB Financial Services, Inc., a Delaware corporation which holds loans and other investments.
ESB is a financial intermediary whose principal business consists of attracting deposits from the general public and investing such deposits in real estate loans secured by liens on residential and commercial properties, consumer loans, commercial business loans, securities and interest-earning deposits.
The Company is subject to examination and regulation by the Office of Thrift Supervision as a savings and loan holding company. The Bank is subject to examination and comprehensive regulation by the FDIC and the Pennsylvania Department of Banking. ESB is a member of the Federal Home Loan Bank (FHLB) of Pittsburgh, which is one of the twelve regional banks comprising the FHLB System. ESB is further subject to regulations of the Board of Governors of the Federal Reserve System, which governs the reserves required to be maintained against deposits and certain other matters.
During the year ended December 31, 2009, the Company reported net income of $12.0 million, an increase of $1.8 million, or 17.6%, compared to the year ended December 31, 2008. The income for the year reflects the Company’s sustained efforts to manage the net interest margin during this challenging time for the banking industry without compromising asset quality or future earnings potential. The results of these efforts are reflected in our earnings, which increased substantially over the prior year, our strong net interest margin, which increased 39 basis points since last year and the growth to our deposit base. The increase in the net interest margin was driven by a decrease to interest expense of $10.8 million, or 16.5%, partially offset by a decrease in interest income of $3.8 million, or 3.9%. The Company has an ongoing campaign to increase commercial, public and personal checking accounts. The results of which were an increase in low cost core deposits. The Company was able to replace higher priced borrowings with these lower rate deposits therefore contributing to the decline in the cost of funds for the year of 64 basis points to 3.03% at December 31, 2009 from 3.67% at December 31, 2008 and overall interest expense.
The Company is continuing efforts to improve the net interest margin by employing strategies to decrease the cost of funds, while attempting to increase the yield from the investment portfolio. The Company employs a strategy of purchasing cash-flowing fixed and variable rate mortgage-backed securities funded by wholesale borrowings, which are comprised of FHLB advances and repurchase agreements.
The Company has utilized a wholesale strategy since its initial public offering in 1990. The Company manages this strategy through its interest rate risk management on a macro level. The wholesale strategy operates with a lower cost of operations, although with lower interest rate spreads and, therefore, at a lower margin than the retail operations of the Company. This strategy historically produces wider margins during periods of lower short-term
| ESB Financial Corporation | 7 | 2009 Annual Report |
Table of Contents
Management’s Discussion and Analysis of
Financial Condition and Results of Operations (continued)
interest rates, reflected in a steep yield curve and can be susceptible to net interest margin strain in rapidly rising rates and rapidly declining rates as well as a sustained inverted yield curve. During 2009, this wholesale leverage strategy accounted for $6.9 million, on a tax equivalent basis, of the Company’s tax equivalent net interest income of $41.3 million.
Management continues to pursue methods of insulating this wholesale strategy from significant fluctuations in interest rates by: (1) incorporating a laddered maturity schedule of up to five years on the wholesale borrowings; (2) purchasing interest rate caps; (3) providing structure in the investment portfolio in the form of corporate bonds and municipals securities; (4) utilizing cash flows from fixed and adjustable rate mortgage-backed securities; and (5) including the Company’s securities in the available for sale portfolio thereby creating the flexibility to change the composition of the portfolio through restructuring as management deems it necessary due to interest rate fluctuations. Management believes that this insulation affords them the ability to react to measured changes in interest rates and restructure the Company’s balance sheet accordingly. This strategy is continually evaluated by management on an ongoing basis.
In addition to managing the net interest margin in the current rate environment, management was successful in maintaining strong asset quality as the Company has only been minimally impacted by the sub prime mortgage and credit issues that are currently affecting the financial industry. Our percentage of non performing loans to total loans was 0.59% at December 31, 2009 compared to 0.35% at December 31, 2008 and our non performing assets to total assets was 0.25% at December 31, 2009 compared to 0.17% at December 31, 2008.
This Management Discussion and Analysis section of the Annual Report contains certain forward-looking statements (as defined in the Private Securities Litigation Reform Act of 1995). In the normal course of business, we, in an effort to help keep our shareholders and the public informed about our operations, may from time to time issue or make certain statements, either in writing or orally, that are or contain forward-looking statements, as that term is defined in the U.S. federal securities laws. Generally, these statements relate to business plans or strategies, projected or anticipated benefits from acquisitions made by or to be made by us, projections involving anticipated revenues, earnings, profitability or other aspects of operating results or other future developments in our affairs or the industry in which we conduct business. Forward-looking statements may be identified by reference to a future period or periods or by the use of forward-looking terminology such as “anticipate,” “believe,” “expect,” “intend,” “plan,” “estimate” or similar expressions.
Although we believe that the anticipated results or other expectations reflected in our forward-looking statements are based on reasonable assumptions, we can give no assurance that those results or expectations will be attained. Forward-looking statements involve risks, uncertainties and assumptions (some of which are beyond our control), and as a result actual results may differ materially from those expressed in forward-looking statements. Factors that could cause actual results to differ from forward-looking statements include, but are not limited to, the following, as well as those discussed elsewhere herein:
| • | our investments in our businesses and in related technology could require additional incremental spending, and might not produce expected deposit and loan growth and anticipated contributions to our earnings; |
| • | general economic or industry conditions could be less favorable than expected, resulting in a deterioration in credit quality, a change in the allowance for loan and lease losses or a reduced demand for credit or fee-based products and services; |
| • | changes in the interest rate environment could reduce net interest income and could increase credit losses; |
| ESB Financial Corporation | 8 | 2009 Annual Report |
Table of Contents
Management’s Discussion and Analysis of
Financial Condition and Results of Operations (continued)
| • | the conditions of the securities markets could change, which could adversely affect, among other things, the value or credit quality of our assets, the availability and terms of funding necessary to meet our liquidity needs and our ability to originate loans and leases; |
| • | changes in the extensive laws, regulations and policies governing financial holding companies and their subsidiaries could alter our business environment or affect our operations; |
| • | the potential need to adapt to industry changes in information technology systems, on which we are highly dependent, could present operational issues or require significant capital spending; |
| • | competitive pressures could intensify and affect our profitability, including as a result of continued industry consolidation, the increased availability of financial services from non-banks, technological developments such as the internet or bank regulatory reform; |
| • | acquisitions may result in one-time charges to income, may not produce revenue enhancements or cost savings at levels or within time frames originally anticipated and may result in unforeseen integration difficulties; and |
| • | acts or threats of terrorism and actions taken by the United States or other governments as a result of such acts or threats, including possible military action, could further adversely affect business and economic conditions in the United States generally and in our principal markets, which could have an adverse effect on our financial performance and that of our borrowers and on the financial markets and the price of our common stock. |
You should not put undue reliance on any forward-looking statements. Forward-looking statements speak only as of the date they are made, and we undertake no obligation to update them in light of new information or future events except to the extent required by federal securities laws.
Critical Accounting Policies and Estimates
The Company’s consolidated financial statements are prepared in accordance with U.S. generally accepted accounting principles and follow general practices within the industry in which it operates. Application of these principles requires management to make estimates, assumptions and judgments that affect the amounts reported in the financial statements and accompanying notes. These estimates, assumptions and judgments are based on information available as of the date of the financial statements; accordingly, as this information changes, the financial statements could reflect different estimates, assumptions and judgments. Certain policies inherently have a greater reliance on the use of estimates, assumptions and judgments and as such have a greater possibility of producing results that could be materially different than originally reported. Estimates, assumptions and judgments are necessary when assets and liabilities are required to be recorded at fair value, when a decline in the value of an asset not carried on the financial statements at fair value warrants an impairment write-down or valuation reserve to be established, or when an asset or liability needs to be recorded contingent upon a future event. Carrying assets and liabilities at fair value inherently results in more financial statement volatility. The fair values and the information used to record valuation adjustments for certain assets and liabilities are based either on quoted market prices or are provided by other third-party sources, when available. When third-party information is not available, valuation adjustments are estimated in good faith by management primarily through the use of internal cash flow modeling techniques.
The Company’s most significant accounting policies are presented in Note 1 to the consolidated financial statements. These policies along with the disclosures presented in the other financial statement notes and in this financial review, provide information on how significant assets and liabilities are valued in the financial
| ESB Financial Corporation | 9 | 2009 Annual Report |
Table of Contents
Management’s Discussion and Analysis of
Financial Condition and Results of Operations (continued)
statements and how those values are determined. Based on the valuation techniques used and the sensitivity of financial statement amounts to the methods, assumptions and estimates underlying those amounts, management has identified the determination of the fair value of securities, the allowance for loan losses and the valuation of goodwill and intangible assets to be the accounting areas that require the most subjective or complex judgments.
Securities
Securities are reported at fair value adjusted for premiums and discounts which are recognized in interest income using the interest method over the period to maturity. Declines in the fair value of individual securities below their amortized cost, and that are deemed to be other than temporary, will be written down to current market value and included in earnings as realized losses. For a discussion on the determination of an other than temporary decline, please refer to Note 1 of the consolidated financial statements. Management systematically evaluates securities for other than temporary declines in fair value on a quarterly basis. The Company had impairment charges of approximately $66,000 on three of its equity investments in small banks that had experienced a decline in their market value for the last several quarters. Additionally, in 2009 the Company took an impairment charge of approximately $552,000 on a $2.5 million collateralized debt obligation that is comprised of sixteen financial institutions, this charge was in addition to a $553,000 impairment charge taken on the same security in 2008. The Company utilized a discounted cash flow method which is a level three pricing method. During this analysis, the Company determined that three of these financial institutions are currently deferring interest payments, and the Company is aware of two additional financial institutions that will begin deferring interest payments in February 2010. In addition, two financial institutions have defaulted. All five financial institutions that are/will be deferring interest payments as of February 2010 either lost money or broke even for the most recent quarter. Also, there were four financial institutions (including two of the five deferrals) within this pool that the non-performing assets to loans plus real estate owned ratio was greater than 10%. One institution currently deferring interest payments had a Tier 1 Risk Ratio of less than 6% and non-performing assets to loans plus real estate owned ratio greater than 10%. The Company believes, at this time, the remaining financial institutions are currently financially stable but will continue to monitor this bond to determine if additional other than temporary charges are necessary.
Allowance for loan losses
The allowance for loan losses is increased by charges to income and decreased by charge-offs (net of recoveries). The Company’s periodic evaluation of the adequacy of the allowance for loan losses is determined by management through evaluation of the loss exposure on individual non-performing, delinquent and high-dollar loans; review of economic conditions and business trends; historical loss experience and growth and composition of the loan portfolio, as well as other relevant factors.
A quantitative analysis is utilized to support the adequacy of the allowance for loan losses. This analysis includes review of historical charge-off rates for loan categories, fluctuations and trends in the amount of classified loans and economic factors. Significant to this analysis are any changes in observable trends that may be occurring relative to loans to assess potential weaknesses within the credit. Current economic factors and trends in risk ratings are considered in the determination and allocation of the allowance for loan losses.
The allowance for loan losses at December 31, 2009 and 2008 was $6.0 million, allocated as follows for 2009: residential loans $2.2 million, or 36.6%; commercial real estate $1.6 million, or 26.9%; commercial business loans $864,000, or 14.3%; consumer loans $1.3 million, or 22.2%.
Goodwill and other intangible assets
The guidance in U.S. generally accepted accounting principles (GAAP) regarding goodwill and other intangible assets establishes standards for the amortization of acquired intangible assets and the non-amortization and
| ESB Financial Corporation | 10 | 2009 Annual Report |
Table of Contents
Management’s Discussion and Analysis of
Financial Condition and Results of Operations (continued)
impairment assessment of goodwill. At December 31, 2009, the Company had $1.3 million of core deposit intangible assets subject to amortization and $41.6 million in goodwill, which was not subject to periodic amortization.
Goodwill arising from business combinations represents the value attributable to unidentifiable intangible elements in the business acquired. The Company’s goodwill relates to value inherent in the banking business and the value is dependent upon the Company’s ability to provide quality, cost effective services in a competitive market place. As such, goodwill value is supported ultimately by revenue that is driven by the volume of business transacted. A decline in earnings as a result of a lack of growth or the inability to deliver cost effective services over sustained periods can lead to impairment of goodwill that could adversely impact earnings in future periods.
GAAP requires an annual evaluation of goodwill for impairment. The fair value of the Company and the implied fair value of goodwill at the respective reporting unit level are estimated using the market value approach utilizing industry comparable information. The Companies implied fair value of goodwill is based on a four step approach utilizing the last twelve months earnings per share, stated book value, tangible book value and total deposits to the most recent deal values supplied by a third party. At December 31, 2009, the Company concluded that the recorded value of goodwill was not impaired as a result of the evaluation.
Income taxes
The Company files a consolidated federal income tax return. Deferred tax assets and liabilities are computed based on the difference between the financial statement and the income tax basis of assets and liabilities using the enacted marginal tax rates. Deferred income taxes or benefits are based on changes in the deferred tax asset or liability from period to period. Deferred tax assets and liabilities are reflected at currently enacted income tax rates applicable to the period in which such items are expected to be realized or settled. As changes in tax rates are enacted, deferred tax assets and liabilities are adjusted through the provision for income taxes.
Changes in Financial Condition
General. The Company’s total assets decreased $14.2 million, or 0.7%, to $1.96 billion at December 31, 2009 from $1.97 billion at December 31, 2008. This decrease was primarily composed of net decreases in cash and cash equivalents, loans receivable, real estate held for investment and intangible assets of $2.6 million, $19.9 million, $7.1 million and $517,000, respectively, partially offset by increases to securities available for sale, loans held for sale, accrued interest receivable, premises and equipment, real estate acquired through foreclosure, prepaid expenses and other assets, and bank owned life insurance of $10.1 million, $201,000, $260,000, $1.4 million, $186,000, $3.0 million and $900,000, respectively.
The decrease in the Company’s total assets reflects a corresponding decrease in total liabilities of $35.8 million, or 2.0%, to $1.80 billion at December 31, 2009 compared to $1.83 billion at December 31, 2008 and an increase in total stockholders’ equity of $21.7 million, or 15.2%, to $164.8 million at December 31, 2009 from $143.1 million at December 31, 2008. The decrease in total liabilities was primarily due to decreases in FHLB advances, other borrowings, advance payments by borrowers for taxes and insurance and accounts payable for land development of $105.3 million, $3.5 million, $155,000, and $2.0 million, respectively, partially offset by increases to deposits, repurchase agreements and accrued expenses and other liabilities of $67.0 million, $5.5 million, and $2.6 million, respectively. The net increase in total stockholders’ equity can be attributed primarily to increases in additional paid in capital, retained earnings and accumulated other comprehensive income of $530,000, $5.9 million and $16.2 million, respectively as well as decreases in unearned employee stock ownership plan (ESOP) of $858,000. These items were partially offset by an increase in treasury stock of $931,000.
| ESB Financial Corporation | 11 | 2009 Annual Report |
Table of Contents
Management’s Discussion and Analysis of
Financial Condition and Results of Operations (continued)
Cash on hand, Interest-earning deposits and Federal funds sold. Cash on hand, interest-earning deposits and federal funds sold represent cash equivalents which decreased a combined $2.6 million, or 13.7%, to $16.3 million at December 31, 2009 from $18.9 million at December 31, 2008. Deposits from customers into savings and checking accounts, loan and security repayments and proceeds from borrowed funds typically increase these accounts. Decreases result from customer withdrawals, new loan originations, security purchases and repayments of borrowed funds.
Securities. The Company’s securities and loan portfolios represent its two largest balance sheet asset classifications. The Company’s securities portfolio increased by $10.1 million, or 0.9%, to $1.1 billion at December 31, 2009. During 2009, the Company recorded purchases of available for sale securities of $197.1 million consisting primarily of $90.1 million of fixed-rate mortgage-backed securities, $32.4 million of adjustable-rate mortgage backed securities, $10.4 million of municipal bonds, $63.3 million of corporate bonds and $911,000 of equity securities. The portfolio also increased by $24.4 million due to increases in market value. These fair value adjustments represent temporary fluctuations resulting from changes in market rates in relation to average yields in the available for sale portfolio. If securities are held to their respective maturity dates, no fair value gain or loss is realized. Offsetting these increases were repayments and maturities of securities of $209.6 million, premium amortizations of $438,000, equity securities sold of $746,000 and realized losses of $618,000.
Loans receivable. The loans receivable category consists primarily of single family mortgage loans used to purchase or refinance personal residences located within the Company’s market area and commercial real estate loans used to finance properties that are used in the borrowers’ businesses or to finance investor-owned rental properties, and to a lesser extent commercial and consumer loans. Net loans receivable decreased $19.9 million, or 2.9%, to $671.4 million at December 31, 2009 from $691.3 million at December 31, 2008. Included in this decrease were decreases in mortgage loans and other loans of $16.8 million, or 3.2%, and $3.5 million, or 1.7%, respectively, partially offset by decreases in the allowance for loan losses, deferred fees and loans in process of approximately $318,000, or 2.0%, combined. The decrease in net loans receivable is due to several factors, including an increase of approximately $50.5 million in repayments to $193.7 million in 2009 as compared to $143.2 million in 2008. These repayments were only partially offset by originations of approximately $174.0 million, which decreased approximately $32.7 million when compared to 2008. The decline in originations was the result of approximately $18.3 million of loans originated for sale as well as an overall decline in the housing market. The yield on the loan portfolio decreased to 5.82% at December 31, 2009 from 6.07% at December 31, 2008.
Loans held for sale. Loans held for sale increased to $201,000 at December 31, 2009 from $0 at December 31, 2008. During the period the Company originated loans held for sale of approximately $18.3 million and sold approximately $18.1 million, with a resulting gain of approximately $203,000.
Non-performing assets. Non-performing assets include non-accrual loans, repossessed vehicles, real estate acquired through foreclosure (REO) and troubled debt restructuring (TDR). Non-performing assets increased to $5.0 million, or 0.25%, of total assets at December 31, 2009 from $3.3 million, or 0.17%, of total assets at December 31, 2008. Non-performing assets consisted of non-performing loans, REO, repossessed vehicles and TDR of $3.8 million, $724,000, $166,000 and $254,000, respectively, at December 31, 2009 and $2.2 million, $539,000, $293,000 and $257,000, respectively, at December 31, 2008.
Accrued interest receivable. Accrued interest receivable increased by $260,000, or 2.6%, to $10.3 million at December 31, 2009 as compared to $10.1 million at December 31, 2008. This increase was a result of increases in the balances on the securities portfolio, including increases to corporate fixed rate bonds that pay interest semiannually, partially offset by decreases in the yields on both the loan and securities portfolios and the balance on the loan portfolio.
| ESB Financial Corporation | 12 | 2009 Annual Report |
Table of Contents
Management’s Discussion and Analysis of
Financial Condition and Results of Operations (continued)
FHLB stock. FHLB stock remained the same at $27.5 million at December 31, 2009 and December 31, 2008. The Bank is required to maintain an investment in capital stock of the FHLB of Pittsburgh in an amount not less than 5.0% of its outstanding notes payable to the FHLB of Pittsburgh. However, the FHLB of Pittsburgh has currently restricted future redemptions of its stock, and therefore the investment could be greater than 5.0% of such notes.
Premises and equipment. Premises and equipment increased $1.4 million, or 11.9%, to $13.0 million at December 31, 2009 from $11.7 million at December 31, 2008. This increase was primarily due to the construction of the Company’s second Butler County office, which opened in July 2009. The Company has incurred costs of approximately $1.4 million related to the construction, $298,000 of which was incurred in 2008, and the remainder in 2009.
Real estate held for investment. The Company’s real estate held for investment decreased $7.1 million, or 20.6%, to $27.5 million at December 31, 2009 from $34.6 million at December 31, 2008. This decrease is the result of sales activity in the joint ventures in which the Company has a 51% ownership as well as write-downs of land acquisition and development costs and unit construction costs of approximately $2.5 million at two of the Company’s joint ventures. For a complete description of the existing projects see “Item 1. Business—Subsidiaries” in the Company’s Annual Report on Form 10-K for the year ended December 31, 2009.
Intangible assets. Intangible assets decreased $517,000, or 28.3%, to $1.3 million at December 31, 2009 from $1.8 million at December 31, 2008. The decrease primarily resulted from amortization of the core deposit intangible created through acquisitions of approximately $494,000. Additionally, the mortgage servicing asset resulting from the loan sale and securitization in 2002 experienced amortization of approximately $15,000 in 2009.
Prepaid expenses and other assets. Prepaid expenses and other assets increased $3.0 million, or 25.5%, to $14.6 million at December 31, 2009 from $11.6 million at December 31, 2008. The increase resulted primarily from the FDIC’s decision to amend its regulations and require insured institutions to prepay their estimated quarterly risk-based assessments through the year 2012. The prepaid assessments will be applied against the future quarterly assessments until the prepaid assessment is exhausted or the balance is returned, whichever occurs first. The Company’s prepaid assessment was $6.7 million and was paid in the fourth quarter of 2009. The increase also resulted from increases to securities receivable of $1.8 million, partially offset by decreases in the deferred tax asset.
Bank owned life insurance. Bank owned life insurance (BOLI) is universal life insurance, purchased by the Bank, on the lives of the Bank’s employees. The beneficial aspects of these universal life insurance policies are tax-free earnings and a tax-free death benefit, which are realized by ESB as the owner of the policies. The Company purchased the $15.0 million universal life insurance policies on December 29, 1998. In 2001, the policy was increased by the addition of Workingmens Savings Bank’s BOLI of $1.3 million in connection with their acquisition and an addition to the original policy of $3.5 million. The cash surrender value of the BOLI as of December 31, 2009 was $29.4 million.
Deposits. The Company considers various sources when evaluating funding needs, including but not limited to deposits, which are a significant source of funds totaling $944.3 million, or 53.2%, of the Company’s total funding sources at December 31, 2009. Total deposits increased $67.0 million, or 7.6%, to $944.3 million at December 31, 2009 from $877.3 million at December 31, 2008. For the year, the Company’s interest-bearing demand and savings deposits increased $26.0 million, or 11.0%, time deposits increased $38.4 million, or 6.7%, and noninterest-bearing deposits increased $2.7 million, or 4.1%. The increase to core deposits of approximately $28.6 million is primarily due to the Company’s ongoing campaign to increase these types of accounts. The Company continues to be diligent in monitoring the rates being offered by regional banks in the Company’s market area and offering special time deposit rates to remain competitive.
| ESB Financial Corporation | 13 | 2009 Annual Report |
Table of Contents
Management’s Discussion and Analysis of
Financial Condition and Results of Operations (continued)
Advance payments by borrowers for taxes and insurance. Advance payments by borrowers for taxes and insurance decreased $155,000, or 5.5%, to $2.7 million at December 31, 2009 from $2.8 million at December 31, 2008 due to the decrease in the net loans receivable.
Borrowed funds. The Company utilizes short and long-term borrowings as another source of funding used for asset growth and liquidity needs. These borrowings primarily include FHLB advances and repurchase agreement borrowings. Borrowed funds decreased $103.3 million, or 11.1%, to $829.6 million at December 31, 2009 from $932.9 million at December 31, 2008. FHLB advances decreased $105.3 million, or 20.0%, repurchase agreements increased $5.5 million, or 1.6%, other borrowings decreased $3.5 million, or 15.0%, while junior subordinated notes remained the same at $46.4 million. The Company is reviewing its continued utilization of advances from the FHLB as a source of funding based upon recent decisions by the FHLB to suspend the dividend on, and restrict the repurchase of, FHLB stock.
Accounts payable for land development. Accounts payable for land development decreased by $2.0 million to $4.6 million at December 31, 2009 from $6.6 million at December 31, 2008. This account represents the unpaid portion of the development costs for the Company’s joint ventures. The decrease is primarily due to ongoing construction activity at the Company’s existing joint venture projects and that the Company did not begin any new projects in 2009.
Stockholders’ equity. Stockholders’ equity increased by $21.7 million, or 15.2%, to $164.8 million at December 31, 2009 from $143.1 million at December 31, 2008. The net increase in total stockholders’ equity can be attributed primarily to increases in additional paid in capital, retained earnings and accumulated other comprehensive income of $530,000, $5.9 million and $16.2 million, respectively as well as decreases in unearned employee stock ownership plan (ESOP) of $858,000. These items were partially offset by an increase in treasury stock of $931,000.
Results of Operations
General. The Company reported net income of $12.0 million, $10.2 million and $7.7 million in 2009, 2008, and 2007, respectively.
Average Balance Sheet and Yield/Rate Analysis. The following table sets forth, for the periods indicated, information concerning the total dollar amounts of interest income from interest-earning assets and the resultant average yields, the total dollar amounts of interest expense on interest-bearing liabilities and the resultant average costs, net interest income, interest rate spread and the net interest margin earned on average interest-earning assets. For purposes of this table, average balances are calculated using monthly averages and the average loan balances include non-accrual loans and exclude the allowance for loan losses, and interest income includes accretion of net deferred loan fees. Yields on tax-exempt securities and loans (tax-exempt for federal income tax purposes) are shown on a fully tax equivalent basis utilizing a federal tax rate of 34%.
| ESB Financial Corporation | 14 | 2009 Annual Report |
Table of Contents
Management’s Discussion and Analysis of
Financial Condition and Results of Operations (continued)
| (Dollar amounts in thousands) | 2009 | Year ended December 31, 2008 |
2007 | |||||||||||||||||||||||||
| Average Balance |
Interest | Yield / Rate |
Average Balance |
Interest | Yield / Rate |
Average Balance |
Interest | Yield / Rate | ||||||||||||||||||||
| Interest-earning assets: |
||||||||||||||||||||||||||||
| Taxable securities available for sale |
$ | 847,578 | $ | 43,095 | 5.08% | $ | 922,276 | $ | 48,140 | 5.22% | $ | 950,433 | $ | 48,848 | 5.14% | |||||||||||||
| Taxable adjustable corporate bonds AFS |
109,089 | 4,709 | 4.32% | 46,325 | 1,960 | 4.23% | 48,604 | 3,090 | 6.36% | |||||||||||||||||||
| Tax-exempt securities available for sale |
121,078 | 5,400 | 6.76% | 109,786 | 4,844 | 6.68% | 109,024 | 4,927 | 6.85% | |||||||||||||||||||
| 1,077,745 | 53,204 | 5.19% | 1,078,387 | 54,944 | 5.33% | 1,108,061 | 56,865 | 5.36% | ||||||||||||||||||||
| Mortgage loans |
489,817 | 28,438 | 5.81% | 485,950 | 29,142 | 6.00% | 451,331 | 27,785 | 6.16% | |||||||||||||||||||
| Other loans |
173,324 | 10,027 | 5.79% | 163,179 | 10,210 | 6.26% | 148,375 | 9,897 | 6.67% | |||||||||||||||||||
| Tax-exempt loans |
19,124 | 806 | 6.38% | 16,098 | 683 | 6.43% | 11,977 | 586 | 7.41% | |||||||||||||||||||
| 682,265 | 39,271 | 5.82% | 665,227 | 40,035 | 6.07% | 611,683 | 38,268 | 6.31% | ||||||||||||||||||||
| Cash equivalents |
21,529 | 20 | 0.09% | 15,665 | 157 | 1.00% | 17,727 | 464 | 2.62% | |||||||||||||||||||
| FHLB stock |
27,470 | - | - | 29,649 | 1,122 | 3.78% | 33,052 | 1,987 | 6.01% | |||||||||||||||||||
| 48,999 | 20 | 0.04% | 45,314 | 1,279 | 2.82% | 50,779 | 2,451 | 4.83% | ||||||||||||||||||||
| Total interest-earning assets |
1,809,009 | 92,495 | 5.29% | 1,788,928 | 96,258 | 5.54% | 1,770,523 | 97,584 | 5.67% | |||||||||||||||||||
| Other noninterest-earning assets |
162,422 | - | - | 141,204 | - | - | 129,907 | - | - | |||||||||||||||||||
| Total assets |
$ | 1,971,431 | $ | 92,495 | 4.85% | $ | 1,930,132 | $ | 96,258 | 5.13% | $ | 1,900,430 | $ | 97,584 | 5.28% | |||||||||||||
| Interest-bearing liabilities: |
||||||||||||||||||||||||||||
| Interest-bearing demand deposits |
$ | 255,929 | $ | 761 | 0.30% | $ | 238,426 | $ | 1,350 | 0.57% | $ | 224,099 | $ | 1,779 | 0.79% | |||||||||||||
| Time deposits |
588,496 | 17,035 | 2.89% | 558,076 | 21,058 | 3.77% | 557,808 | 25,927 | 4.65% | |||||||||||||||||||
| 844,425 | 17,796 | 2.11% | 796,502 | 22,408 | 2.81% | 781,907 | 27,706 | 3.54% | ||||||||||||||||||||
| FHLB advances |
459,727 | 20,372 | 4.43% | 578,565 | 27,671 | 4.78% | 657,267 | 31,274 | 4.76% | |||||||||||||||||||
| Repurchase agreements |
344,146 | 12,704 | 3.69% | 266,771 | 11,262 | 4.22% | 188,458 | 9,371 | 4.97% | |||||||||||||||||||
| Other borrowings |
29,425 | 955 | 3.25% | 18,785 | 811 | 4.32% | 14,410 | 776 | 5.39% | |||||||||||||||||||
| 833,298 | 34,031 | 4.08% | 864,121 | 39,744 | 4.60% | 860,135 | 41,421 | 4.82% | ||||||||||||||||||||
| Preferred securities- fixed |
36,083 | 2,111 | 5.85% | 36,083 | 2,111 | 5.85% | 36,083 | 2,111 | 5.85% | |||||||||||||||||||
| Preferred securities- adjustable |
10,310 | 409 | 3.97% | 13,094 | 852 | 6.51% | 15,399 | 1,363 | 8.85% | |||||||||||||||||||
| 46,393 | 2,520 | 5.43% | 49,177 | 2,963 | 6.03% | 51,482 | 3,474 | 6.75% | ||||||||||||||||||||
| Total interest-bearing liabilities |
1,724,116 | 54,347 | 3.15% | 1,709,800 | 65,115 | 3.81% | 1,693,524 | 72,601 | 4.29% | |||||||||||||||||||
| Noninterest-bearing demand deposits |
70,134 | - | - | 66,258 | - | - | 58,549 | - | - | |||||||||||||||||||
| Other noninterest-bearing liabilities |
20,438 | - | - | 24,389 | - | - | 20,237 | - | - | |||||||||||||||||||
| Total liabilities |
1,814,688 | 54,347 | 2.99% | 1,800,447 | 65,115 | 3.62% | 1,772,310 | 72,601 | 4.10% | |||||||||||||||||||
| Stockholders’ equity |
156,743 | - | - | 129,685 | - | - | 128,120 | - | - | |||||||||||||||||||
| Total liabilities and equity |
$ | 1,971,431 | $ | 54,347 | 2.76% | $ | 1,930,132 | $ | 65,115 | 3.37% | $ | 1,900,430 | $ | 72,601 | 3.82% | |||||||||||||
| Net interest income |
$ | 38,148 | $ | 31,143 | $ | 24,983 | ||||||||||||||||||||||
| Interest rate spread (difference between weighted average rate on interest-earning assets and interest-bearing liabilities) |
2.14% | 1.73% | 1.38% | |||||||||||||||||||||||||
| Net interest margin (net interest income as a percentage of average interest-earning assets) |
2.29% | 1.90% | 1.57% | |||||||||||||||||||||||||
| ESB Financial Corporation | 15 | 2009 Annual Report |
Table of Contents
Management’s Discussion and Analysis of
Financial Condition and Results of Operations (continued)
Analysis of Changes in Net Interest Income. The following table analyzes the changes in interest income and interest expense in terms of: (i) changes in volume of interest-earning assets and interest-bearing liabilities and (ii) changes in yield and rates. The table reflects the extent to which changes in the Company’s interest income and interest expense are attributable to changes in rate (change in rate multiplied by prior year volume), changes in volume (changes in volume multiplied by prior year rate) and changes attributable to the combined impact of volume/rate (change in rate multiplied by change in volume). The changes attributable to the combined impact of volume/rate are allocated on a consistent basis between the volume and rate variances.
| (Dollar amounts in thousands) | 2009 vs. 2008 | 2008 vs. 2007 | ||||||||||||||||
| Increase (decrease) due to | Increase (decrease) due to | |||||||||||||||||
| Volume | Rate | Total | Volume | Rate | Total | |||||||||||||
| Interest income: |
||||||||||||||||||
| Securities |
$ | (33) | $ | (1,707) | $ | (1,740) | $ | (1,514) | $ | (407) | $ | (1,921) | ||||||
| Loans |
1,009 | (1,773) | (764) | 3,261 | (1,494) | 1,767 | ||||||||||||
| Cash equivalents |
43 | (180) | (137) | (49) | (258) | (307) | ||||||||||||
| FHLB stock |
(77) | (1,045) | (1,122) | (188) | (677) | (865) | ||||||||||||
| Total interest-earning assets |
942 | (4,705) | (3,763) | 1,510 | (2,836) | (1,326) | ||||||||||||
| Interest expense: |
||||||||||||||||||
| Deposits |
1,283 | (5,895) | (4,612) | 508 | (5,806) | (5,298) | ||||||||||||
| FHLB advances |
(5,376) | (1,923) | (7,299) | (3,763) | 160 | (3,603) | ||||||||||||
| Repurchase agreements |
2,980 | (1,538) | 1,442 | 3,463 | (1,572) | 1,891 | ||||||||||||
| Other borrowings |
380 | (236) | 144 | 207 | (172) | 35 | ||||||||||||
| Subordinated debt |
(162) | (281) | (443) | (151) | (360) | (511) | ||||||||||||
| Total interest-bearing liabilities |
(895) | (9,873) | (10,768) | 264 | (7,750) | (7,486) | ||||||||||||
| Net interest income |
$ | 1,837 | $ | 5,168 | $ | 7,005 | $ | 1,246 | $ | 4,914 | $ | 6,160 | ||||||
2009 Results Compared to 2008 Results
General. The Company reported net income of $12.0 million and $10.2 million for 2009 and 2008, respectively. The $1.8 million, or 17.6%, increase in net income between 2009 and 2008 can primarily be attributed to a decrease in interest expense, provision for loan losses, and net income attributable to the noncontrolling interest of $10.8 million, $494,000 and $556,000, respectively, partially offset by decreases in interest income and noninterest income of $3.8 million and $1.7 million, respectively, and increases in noninterest expense and provision for income taxes of $3.7 million and $834,000, respectively.
Net interest income. Net interest income, the primary source of revenue for the Company, is determined by the Company’s interest rate spread, which is defined as the difference between income on earning assets and the cost of funds supporting those assets, and the relative amounts of interest earning assets and interest bearing liabilities. Management periodically adjusts the mix of assets and liabilities, as well as the rates earned or paid on those assets and liabilities in order to manage and improve net interest income. The level of interest rates and changes in the amount and composition of interest earning assets and liabilities affect the Company’s net interest income. Historically from an interest rate risk perspective, it has been management’s perception that differing interest rate environments can cause sensitivity to the Company’s net interest income, these being extended low long-term interest rates or rapidly rising short-term interest rates as well as a sustained inverted yield curve. Net interest income increased by $7.0 million, or 22.5%, to $38.1 million for 2009, compared to $31.1 million for 2008. This increase in net interest income can be attributed to a decrease in interest expense of $10.8 million, or 16.5%, which was only partially offset by a decrease in interest income of $3.8 million, or 3.9%. The decrease to interest expense reflects a 66 basis point decrease in the cost of interest bearing liabilities to 3.15% for 2009 from 3.81% for 2008.
| ESB Financial Corporation | 16 | 2009 Annual Report |
Table of Contents
Management’s Discussion and Analysis of
Financial Condition and Results of Operations (continued)
Interest income. Interest income decreased $3.8 million, or 3.9%, to $92.5 million for 2009, compared to $96.3 million for 2008. This decrease in interest income can be attributed to decreases in interest earned on loans receivable, securities available for sale, FHLB stock and cash equivalents of $764,000, $1.7 million, $1.1 million, and $137,000, respectively. Cash equivalents include cash on hand and in banks, interest-earning deposits and federal funds sold.
Interest earned on loans receivable decreased $764,000, or 1.9%, to $39.3 million for 2009, compared to $40.0 million for 2008. This decrease was attributable to a decrease in the yield on the portfolio to 5.82% at December 31, 2009 as compared to 6.07% at December 31, 2008, partially offset by an increase in the average balance of loans outstanding of $17.0 million, or 2.6%, to $682.3 million for the year ended December 31, 2009, as compared to $665.2 million for the year ended December 31, 2008.
Interest earned on securities decreased $1.7 million, or 3.2%, to $53.2 million for 2009 compared to $54.9 million for 2008. This decrease was primarily attributable to a decline in the tax equivalent yield on the portfolio of 14 basis points to 5.19% for 2009, compared to 5.33% for 2008, as well as a slight decrease in the average balance of securities of $642,000, or 0.06%.
Interest earned on FHLB stock decreased $1.1 million, or 100.0%, for the year ended December 31, 2009 compared to the same period in the prior year. This decrease was the result of the decision by the FHLB of Pittsburgh to suspend dividends on FHLB stock beginning in the fourth quarter of 2008.
Interest earned on cash equivalents decreased $137,000, or 87.3%, to $20,000 for 2009, compared to $157,000 for 2008 as the yield decreased to 0.09% for 2009, compared to 1.00% for 2008. This decline was partially offset by an increase in the average balance of these instruments of $5.9 million, or 37.4%, to $21.5 million at December 31, 2009 as compared to $15.7 million at December 31, 2008.
Interest expense. Interest expense decreased $10.8 million, or 16.5%, to $54.3 million for 2009, compared to $65.1 million for 2008. This decrease in interest expense can be attributed to decreases in interest incurred on deposits, borrowed funds and junior subordinated notes of $4.6 million, $5.7 million and $443,000, respectively.
Interest incurred on deposits decreased $4.6 million, or 20.6%, to $17.8 million for 2009, compared to $22.4 million for 2008. This decrease was primarily attributable to a decrease in the cost of interest earning deposits to 2.11% in 2009 from 2.81% in 2008, partially offset by an increase of $47.9 million, or 6.02%, in the average balance of interest-bearing deposits to $844.4 million for 2009 as compared to $796.5 million for 2008. The Company manages its cost of interest-bearing deposits by diligently monitoring the interest rates on its products as well as the rates being offered by its competition through weekly interest rate committee meetings and utilizing rate surveys and hence subsequently adjusting rates accordingly.
Interest incurred on borrowings, which includes FHLB advances and repurchase agreements decreased $5.7 million, or 14.4%, to $34.0 million for 2009, compared to $39.7 million for 2008. This decrease was primarily attributable to a decrease in the cost of these funds to 4.08% for 2009 compared to 4.60% for 2008, as well as a decrease in the average balance of borrowed funds of $30.8 million, or 3.6%, to $833.3 million for 2009, compared to $864.1 million for 2008. The Company, as part of its wholesale strategy, continues to manage its cost of funds through its policy of laddering the maturities of borrowings up to a five year period. This strategy allows the Company the flexibility to alter its borrowing structure quarterly. During 2009, the Company replaced approximately $281.8 million of maturing wholesale borrowings at a weighted average rate of 5.15% and an original call/maturity of 2.8 years with borrowings of approximately $189.1 million at a weighted average rate of 2.89% and an average call/maturity of 3.9 years. The restructuring of these borrowings contributed to the overall decline in interest expense for 2009. For purposes of determining the average life of the borrowings, the Company utilizes the call date if applicable.
| ESB Financial Corporation | 17 | 2009 Annual Report |
Table of Contents
Management’s Discussion and Analysis of
Financial Condition and Results of Operations (continued)
Interest expense on junior subordinated notes decreased $443,000, or 15.0%, to $2.5 million at December 31, 2009 from $3.0 million at December 31, 2008. This decrease was primarily attributable to a decrease in the cost of these funds to 5.43% for 2009, compared to 6.03% for 2008 as well as a decrease in the average balance of these funds of $2.8 million, or 5.7%, to $46.4 million for 2009, compared to $49.2 million for 2008.
Provision for loan losses. The Company records provisions for loan losses to bring the total allowance for loan losses to a level deemed adequate to cover probable losses in the loan portfolio. In determining the appropriate level of allowance for loan losses, management considers historical loss experience, the financial condition of borrowers, economic conditions (particularly as they relate to markets where the Company originates loans), the status of non-performing assets, the estimated underlying value of the collateral and other factors related to the collectibility of the loan portfolio. The provision for loan losses decreased $494,000 to $912,000 for the year ended December 31, 2009 compared to $1.4 million in the prior year. These provisions were part of the normal operations of the Company for 2009. As a result of the provisions for loan losses during 2009 and 2008, the Company’s allowance for loan losses amounted to $6.0 million, or 0.88%, of the Company’s total loan portfolio at December 31, 2009, compared to $6.0 million, or 0.85%, at December 31, 2008. The Company’s allowance for loan losses as a percentage of non-performing loans at December 31, 2009 and December 31, 2008 was 147.58% and 239.95%, respectively.
Noninterest income. Noninterest income decreased $1.7 million, or 31.9%, to $3.6 million for 2009, compared to $5.3 million for 2008. This decrease can be attributed to decreases in income from real estate joint ventures of $3.0 million and a decrease in the cash surrender value of the bank owned life insurance of $229,000, partially offset by increases in fees and service charges, net gain on sale of loans and other income of $50,000, $201,000, and $202,000, respectively, as well as a decrease in the net realized loss on securities available for sale and derivatives of $485,000 and $616,000, respectively.
Net realized loss on investments decreased $485,000 to reflect an overall loss of $371,000 for 2009 compared to a net loss of $856,000 for 2008. During 2009 the Company incurred pre-tax impairment charges of approximately $617,000, including approximately $552,000 on a $2.5 million collateralized debt obligation that is comprised of sixteen financial institutions and approximately $66,000 on three of its equity investments in small banks that had experienced a decline in their market value for the last several quarters. These losses were offset by gains of approximately $246,000 on the sale of two of the Company’s equity investments. Additionally, the Company had a gain on derivatives in 2009 of $120,000 compared to losses in 2008 of $616,000 because of market value adjustments to the Company’s interest rate caps. For additional information see Note 2 of the consolidated financial statements.
Income from real estate joint ventures decreased $3.0 million to a loss of $1.9 million for 2009 compared to income of $1.1 million for 2008. Included in this decrease was a pre-tax write-down of land acquisition and development costs as well as unit construction costs of approximately $2.5 million at two of the Company’s joint ventures.
Fees and service charges increased $50,000, or 1.3%, to $4.0 million for 2009, compared to $3.9 million for 2008. These increases are primarily attributed to increase in fees on our checking and savings products of approximately $97,000, including an increase of $72,000 in fees on NOW accounts primarily due to increased participation in our ESB Rewards program for debit card holders. The ESB Rewards program offers customers the ability to earn points, based on debit card usage, which can be redeemed for prizes. Offsetting the increase in fees related to checking and savings products were decreases to various loan fees of approximately $47,000.
Net gain on sale of loans held for sale increased to $203,000 for the period ended December 31, 2009 from $2,000 at December 31, 2008. During the period the Company originated loans held for sale of approximately $18.3 million and sold approximately $18.1 million.
| ESB Financial Corporation | 18 | 2009 Annual Report |
Table of Contents
Management’s Discussion and Analysis of
Financial Condition and Results of Operations (continued)
Noninterest expense. Noninterest expenses increased $3.8 million, or 16.2%, to $26.8 million for 2009, compared to $23.0 million for 2008. This increase can be primarily attributed to increases in compensation and employee benefits, federal deposit insurance premiums, data processing, advertising and other expenses of $1.1 million, $2.4 million, $166,000, $132,000 and $128,000, respectively, partially offset by decreases to premises and equipment and amortization of intangible assets of $80,000 and $107,000, respectively.
Compensation and employee benefits increased $1.1 million, or 8.0%, to $14.7 million for 2009, compared to $13.6 million in 2008. This increase was related to normal salary adjustments and bonuses between the years of approximately $734,000 as well as increases to stock option expense, retirement plan expense and various taxes and insurance of $46,000, $221,000 and $80,000, respectively.
Federal deposit insurance premiums expense increased $2.4 million to $2.5 million for 2009, compared to $119,000 for 2008. This increase is primarily due to increases in the quarterly rates assessed by the Federal Deposit Insurance Corporation, as well as a special assessment by the FDIC in the amount of $891,000, paid in the third quarter of 2009.
Data processing expense increased $166,000, or 8.5%, to $2.1 million for 2009, compared to $2.0 million for 2008. This increase is primarily related to enhancements in technology.
Amortization of intangible assets decreased $107,000, or 17.8%, to $494,000 for 2009, compared to $601,000 for 2008. The decrease was to the normal amortization of the core deposit intangible of prior acquisitions. Amortization is expected to total $413,000, $332,000, $251,000, $170,000, $100,000 and $8,000 for the years 2010, 2011, 2012, 2013, 2014 and 2015, respectively.
Provision for income taxes. The provision for income taxes increased $834,000, or 53.9%, to $2.4 million for 2009 as compared to $1.5 million in 2008. The effective tax rate for 2009 was 16.6% compared to 13.2% for 2008. This was primarily due to the $2.6 million, or 22.4%, increase in pre-tax income as well as a decrease in the percentage of the Company’s tax free income to total income.
Net Income Attributable to the noncontrolling interest. Minority interest decreased $556,000 to a loss of $347,000 for 2009 compared to income of $209,000 for 2008. This decrease was directly related to the previously mentioned write-downs at the joint ventures as well as the decrease in income from sales and represents the portion of the profits on the consolidated joint ventures earned by the partners.
2008 Results Compared to 2007 Results
General. The Company reported net income of $10.2 million and $7.7 million for 2008 and 2007, respectively. The $2.6 million, or 33.3%, increase in net income between 2008 and 2007 can primarily be attributed to a decrease in interest expense of $7.5 million, partially offset by decreases in interest income and noninterest income of $1.3 million and $1.9 million, respectively, and increases in provision for loan losses and provision for income taxes of $541,000 and $1.1 million, respectively.
Net interest income. Net interest income, the primary source of revenue for the Company, is determined by the Company’s interest rate spread, which is defined as the difference between income on earning assets and the cost of funds supporting those assets, and the relative amounts of interest earning assets and interest bearing liabilities. Management periodically adjusts the mix of assets and liabilities, as well as the rates earned or paid on those assets and liabilities in order to manage and improve net interest income. The level of interest rates and changes in the amount and composition of interest earning assets and liabilities affect the Company’s net interest income. Historically from an interest rate risk perspective, it has been management’s perception that differing interest rate environments can cause sensitivity to the Company’s net interest income, these being extended low long-term
| ESB Financial Corporation | 19 | 2009 Annual Report |
Table of Contents
Management’s Discussion and Analysis of
Financial Condition and Results of Operations (continued)
interest rates or rapidly rising short-term interest rates as well as a sustained inverted yield curve. Net interest income increased by $6.2 million, or 24.7%, to $31.1 million for 2008, compared to $25.0 million for 2007. This increase in net interest income can be attributed to a decrease in interest expense of $7.5 million, or 10.3%, which was only partially offset by a decrease in interest income of $1.3 million, or 1.4%. The decrease to interest expense reflects a 48 basis point decrease in cost of funds to 3.67% for 2008 from 4.14% for 2007.
Interest income. Interest income decreased $1.3 million, or 1.4%, to $96.3 million for 2008, compared to $97.6 million for 2007. This decrease in interest income can be attributed to decreases in interest earned on securities available for sale, FHLB stock and cash equivalents of $1.9 million, $865,000, and $307,000, respectively. Cash equivalents include cash on hand and in banks, interest-earning deposits and federal funds sold. Partially offsetting these decreases was an increase in interest earned on loans receivable of $1.8 million.
Interest earned on loans receivable increased $1.8 million, or 4.6%, to $40.0 million for 2008, compared to $38.3 million for 2007. This increase was attributable to an increase in the average balance of loans outstanding of $53.5 million, or 8.8%, to $665.2 million for the year ended December 31, 2008, as compared to $611.7 million for the year ended December 31, 2007. Partially offsetting this increase was a decrease in the yield on the portfolio to 6.07% at December 31, 2008 as compared to 6.31% at December 31, 2007. The increase in loans outstanding is primarily attributed to growth in the residential mortgage loan portfolio.
Interest earned on securities decreased $1.9 million, or 3.4%, to $54.9 million for 2008 compared to $56.9 million for 2007. This decrease was primarily attributable to a decrease in the average balance of securities of $29.7 million, or 2.7%, and a decline in the tax equivalent yield on the portfolio of 3 basis points to 5.33% for 2008, compared to 5.36% for 2007.
Income from FHLB stock decreased $865,000, or 43.5%, to $1.1 million for 2008, compared to $2.0 million for 2007. This decrease can be primarily attributed to a decline in the yield on the FHLB stock of 223 basis points to 3.78% for 2008 compared to 6.01% for 2007, as well as a decline in the average balance of FHLB stock of $3.4 million to $29.6 million at December 31, 2008 from $33.1 million at December 31, 2007.
Interest earned on cash equivalents decreased $307,000, or 66.2%, to $157,000 for 2008, compared to $464,000 for 2007 as the yield decreased to 1.00% for 2008, compared to 2.62% for 2007 and the average balance decreased $2.1 million to $15.7 million at December 31, 2008 compared to $17.7 million at December 31, 2007.
Interest expense. Interest expense decreased $7.5 million, or 10.3%, to $65.1 million for 2008, compared to $72.6 million for 2007. This decrease in interest expense can be attributed to decreases in interest incurred on deposits, borrowed funds and junior subordinated notes of $5.3 million, $1.7 million and $511,000, respectively.
Interest incurred on deposits decreased $5.3 million, or 19.1%, to $22.4 million for 2008, compared to $27.7 million for 2007. This decrease was primarily attributable to a decrease in the cost of interest earning deposits to 2.81% in 2008 from 3.54% in 2007, partially offset by an increase of $14.6 million, or 1.9%, in the average balance of interest-bearing deposits to $796.5 million for 2008 as compared to $781.9 million for 2007. The Company manages its cost of interest-bearing deposits by diligently monitoring the interest rates on its products as well as the rates being offered by its competition through weekly interest rate committee meetings and utilizing rate surveys and hence subsequently adjusting rates accordingly.
Interest incurred on borrowings, which includes FHLB advances and repurchase agreements, the largest components of the Company’s interest-bearing liabilities, decreased $1.7 million, or 4.0%, to $39.7 million for 2008, compared to $41.4 million for 2007. This decrease was primarily attributable to a decrease in the cost of these funds to 4.60% for 2008 compared to 4.82% for 2007, partially offset by an increase in the average balance of borrowed funds of $4.0 million, or 0.5%, to $864.1 million for 2008, compared to $860.1 million for 2007. The
| ESB Financial Corporation | 20 | 2009 Annual Report |
Table of Contents
Management’s Discussion and Analysis of
Financial Condition and Results of Operations (continued)
Company, as part of its wholesale strategy, continues to manage its cost of funds through its policy of laddering the maturities of borrowings up to a five year period. This strategy allows the Company the flexibility to alter its borrowing structure quarterly. During 2008, the Company replaced approximately $297.1 million of maturing wholesale borrowings at a weighted average rate of 4.50% and an original call/maturity of 3.6 years with borrowings of approximately $340.9 million at a weighted average rate of 3.73% and an average call/maturity of 3.9 years, which caused a decrease in the cost of these borrowings by 77 basis points. For purposes of determining the average life of the borrowings, the Company utilizes the call date if applicable.
Interest expense on junior subordinated notes decreased $511,000, or 14.7%, to $3.0 million at December 31, 2008 from $3.5 million at December 31, 2007. This decrease was primarily attributable to a decrease in the cost of these funds to 6.03% for 2008, compared to 6.75% for 2007 as well as a decrease in the average balance of these funds of $2.3 million, or 4.5%, to $49.2 million for 2008, compared to $51.5 million for 2007.
Provision for loan losses. The Company records provisions for loan losses to bring the total allowance for loan losses to a level deemed adequate to cover probable losses in the loan portfolio. In determining the appropriate level of allowance for loan losses, management considers historical loss experience, the financial condition of borrowers, economic conditions (particularly as they relate to markets where the Company originates loans), the status of non-performing assets, the estimated underlying value of the collateral and other factors related to the collectibility of the loan portfolio. The provision for loan losses increased $541,000 to $1.4 million for the year ended December 31, 2008 compared to $865,000 in the prior year. These provisions were part of the normal operations of the Company for 2008. As a result of the provision for loan losses during 2008 and 2007, the Company’s allowance for loan losses amounted to $6.0 million, or 0.86%, of the Company’s total loan portfolio at December 31, 2008, compared to $5.4 million, or 0.85%, at December 31, 2007. The Company’s allowance for loan losses as a percentage of non-performing loans at December 31, 2008 and December 31, 2007 was 239.95% and 236.11%, respectively.
Noninterest income. Noninterest income decreased $1.9 million, or 26.9%, to $5.3 million for 2008, compared to $7.2 million for 2007. This decrease can be attributed to decreases in net realized gain on sale of securities available for sale and income from real estate joint ventures of $1.5 million and $725,000, respectively, partially offset by increases in fees of $129,000.
Net realized loss recognized on both investments and derivatives increased by $1.6 million to reflect an overall loss of $1.5 million for 2008 as compared to a loss of $96,000 for 2007. In 2007, the Company terminated its cash flow hedge resulting in the loss on sale of derivatives. During 2008, the Company incurred pre-tax impairment charges of approximately $303,000 on four of its equity investments in small banks that had experienced a decline in their market value for the last several quarters. Additionally, the Company took a pre-tax impairment charge of approximately $553,000 on a $2.5 million collateralized debt obligation that is comprised of sixteen financial institutions. For additional information see Note 2 of the consolidated financial statements. Additionally, the net realized loss on derivatives for 2008 of $616,000 was due to a market value devaluation of the Company’s interest rate caps.
Income from real estate joint ventures decreased $725,000, or 39.7%, to $1.1 million for 2008 compared to $1.8 million for 2007. Included in this decrease was a pre-tax write-down of approximately $398,000 at one of the Company’s joint venture projects. This write-down was due to construction costs on existing units that exceeded expectations and projected increased costs to finish the project.
Fees and service charges increased $129,000, or 3.4%, to $3.9 million for 2008, compared to $3.8 million for 2007. These increases are primarily attributed to increase in fees on our checking and savings products of approximately $120,000, including an increase of $197,000 to fees on NOW accounts primarily due to increased participation in our platinum overdraft program and ESB Rewards program for debit card holders. The platinum
| ESB Financial Corporation | 21 | 2009 Annual Report |
Table of Contents
Management’s Discussion and Analysis of
Financial Condition and Results of Operations (continued)
overdraft program is a service provided by the Bank which enables customers limited ability to overdraft their checking accounts without the Bank returning the check. The ESB Rewards program offers customers the ability to earn points, based on debit card usage, which can be redeemed for prizes. Offsetting the increase to fees related to checking and savings products were decreases to various loan fees of approximately $82,000, which included a write-down of approximately $32,000 on the servicing asset related to the securitization of loans that the Company completed in 2002.
Noninterest expense. Noninterest expenses increased $375,000, or 1.7%, to $23.0 million for 2008 as compared to $22.7 million for 2007. This increase can be primarily attributed to increases in compensation and employee benefits, premises and equipment and data processing of $360,000, $55,000 and $46,000, respectively, partially offset by decreases in amortization of intangible assets and minority interest of $114,000 and $397,000, respectively.
Amortization of intangible assets decreased $114,000, or 15.9%, to $601,000 for 2008, compared to $715,000 for 2007. The decrease was to the normal amortization of the core deposit intangible of prior acquisitions. Amortization is expected to total $494,000, $413,000, $332,000, $251,000, $169,000 and $95,000 for the years 2009, 2010, 2011, 2012, 2013 and thereafter, respectively.
Minority interest decreased $397,000, or 65.5%, to $209,000 for 2008, compared to $606,000 for 2007. This decrease was directly related to the decrease in income from real estate joint ventures and represents the portion of the profits on the consolidated joint ventures earned by the partners.
Compensation and employee benefits increased $360,000, or 2.7%, to $13.6 million for 2008, compared to $13.2 million in 2007. This increase was related to normal salary adjustments between the years of approximately $207,000 as well as increases to stock option expense, retirement plan expense and various taxes and insurance of $69,000, $62,000 and $22,000, respectively.
Premises and equipment increased $55,000, or 2.2%, to $2.5 million at December 31, 2008. This increase is primarily due to normal operating increases between the years.
Data processing expense increased $46,000, or 2.4%, to $2.0 million for 2008, compared to $1.9 million for 2007. This increase is primarily related to enhancements to the technology for the teller and sales platforms.
Provision for income taxes. The provision for income taxes increased $1.1 million, or 287.0%, to $1.5 million for 2008 as compared to $400,000 in 2007. The effective tax rate for 2008 was 13.2% compared to 5.0% for 2007. This was primarily due to the $3.7 million, or 45.9%, increase in pre-tax income.
Asset and Liability Management
The primary objective of the Company’s asset and liability management function is to maximize the Company’s net interest income while simultaneously maintaining an acceptable level of interest rate risk given the Company’s operating environment, capital and liquidity requirements, performance objectives and overall business focus. The principal determinant of the exposure of the Company’s earnings to interest rate risk is the timing difference between the repricing or maturity of interest-earning assets and the repricing or maturity of its interest-bearing liabilities. The Company’s asset and liability management policies are designed to decrease interest rate sensitivity primarily by shortening the maturities of interest-earning assets while at the same time extending the maturities of interest-bearing liabilities. The Board of Directors of the Company continues to believe in strong asset/liability management in order to insulate the Company from material and prolonged increases in interest rates. As a result of this policy, the Company emphasizes a larger, more diversified portfolio of residential mortgage loans in the form of mortgage-backed securities. Mortgage-backed securities generally
| ESB Financial Corporation | 22 | 2009 Annual Report |
Table of Contents
Management’s Discussion and Analysis of
Financial Condition and Results of Operations (continued)
increase the quality of the Company’s assets by virtue of the insurance or guarantees that back them, are more liquid than individual mortgage loans and may be used to collateralize borrowings or other obligations of the Company.
The Company’s Board of Directors has established an Asset and Liability Management Committee consisting of outside directors, the President and Chief Executive Officer, Group Senior Vice President/Chief Financial Officer, Group Senior Vice President/Operations and Group Senior Vice President/Lending. This committee, which meets quarterly, generally monitors various asset and liability management policies and strategies, which were implemented by the Company over the past few years. These strategies have included: (i) an emphasis on the investment in adjustable-rate and shorter duration mortgage-backed securities, (ii) an emphasis on the origination of single-family residential adjustable-rate mortgages (ARMs), residential construction loans and commercial real estate loans, which generally have adjustable or floating interest rates and/or shorter maturities than traditional single-family residential loans, and consumer loans, which generally have shorter terms and higher interest rates than mortgage loans, (iii) increase the duration of the liability base of the Company by extending the maturities of savings deposits, borrowed funds and repurchase agreements and (iv) the purchase of off-balance sheet interest rate caps and structured borrowings with embedded caps which help to insulate the Bank’s interest rate risk position from increases in interest rates.
As of December 31, 2009, the implementation of these asset and liability initiatives resulted in the following: (i) $244.6 million or 29.6% of the Company’s portfolio of mortgage-backed securities were secured by ARMs; (ii) $198.6 million or 28.9% of the Company’s total loan portfolio had adjustable interest rates or maturities of 12 months or less and $79.5 million or 22.5% of the Company’s portfolio of single-family residential mortgage loans (including residential construction loans) consisted of ARMs, (iii) the weighted average call/maturity of the Company’s FHLB advances and repurchase agreements was 3.6 years and (iv) the Company had $50.0 million in notional amount of interest rate caps and $135.0 million in structured borrowings with $160.0 million in notional amount of embedded caps.
Interest Rate Sensitivity Gap Analysis
The implementation of the foregoing asset and liability initiatives and strategies, combined with other external factors such as demand for the Company’s products and economic and interest rate environments in general, has resulted in the Company historically being able to maintain a one-year interest rate sensitivity gap ranging between 0.0% of total assets to a negative 20.0% of total assets. The one-year interest rate sensitivity gap is defined as the difference between the Company’s interest-earning assets, which are scheduled to mature or reprice within one year and its interest-bearing liabilities, which are scheduled to mature or reprice within one year. At December 31, 2009, the Company’s interest-earning assets maturing or repricing within one year totaled $643.8 million while the Company’s interest-bearing liabilities maturing or repricing within one-year totaled $708.9 million, providing a deficiency of interest-earning assets over interest-bearing liabilities of $65.1 million or a negative 3.3% of total assets. At December 31, 2009, the percentage of the Company’s assets to liabilities maturing or repricing within one year was 90.8%. The Company strives to maintain its one-year interest rate sensitivity gap between a range of 0.0% and a negative 20.0% of total assets.
| ESB Financial Corporation | 23 | 2009 Annual Report |
Table of Contents
Management’s Discussion and Analysis of
Financial Condition and Results of Operations (continued)
The following table presents the amounts of interest-earning assets and interest-bearing liabilities outstanding as of December 31, 2009 which are expected to mature, prepay or reprice in each of the future time periods presented:
| (Dollar amounts in thousands) | Due in six months or less |
Due within six months to one year |
Due within one to three years |
Due within three to five years |
Due in over five years |
Total | ||||||||||||
| Total interest-earning assets |
$ | 415,794 | $ | 228,048 | $ | 512,772 | $ | 222,018 | $ | 402,164 | $ | 1,780,796 | ||||||
| Total interest-bearing liabilities |
507,045 | 201,849 | 519,554 | 307,206 | 232,192 | 1,767,846 | ||||||||||||
| Maturity or repricing gap during the period |
$ | (91,251) | $ | 26,199 | $ | (6,782) | $ | (85,188) | $ | 169,972 | $ | 12,950 | ||||||
| Cumulative gap |
$ | (91,251) | $ | (65,052) | $ | (71,834) | $ | (157,022) | $ | 12,950 | ||||||||
| Ratio of gap during the period to total assets |
(4.65%) | 1.34% | (0.35%) | (4.34%) | 8.67% | |||||||||||||
| Ratio of cumulative gap to total assets |
(4.65%) | (3.32%) | (3.66%) | (8.01%) | 0.66% | |||||||||||||
| Total assets |
$ | 1,960,677 | ||||||||||||||||
The one-year interest rate sensitivity gap has been the most common industry standard used to measure an institution’s interest rate risk position. In recent years, in addition to utilizing interest rate sensitivity gap analysis, the Company has increased its emphasis on the utilization of interest rate sensitivity simulation analysis to evaluate and manage interest rate risk.
Interest Rate Sensitivity Simulation Analysis
The Company also utilizes income simulation modeling in measuring its interest rate risk and managing its interest rate sensitivity. The Asset and Liability Management Committee of the Company believes that simulation modeling enables the Company to more accurately evaluate and manage the possible effects on net interest income due to the exposure to changing market interest rates, the slope of the yield curve and different loan and mortgage-backed security prepayment and deposit decay assumptions under various interest rate scenarios.
As with gap analysis and earnings simulation modeling, assumptions about the timing and variability of cash flows are critical in economic value of equity (EVE) valuation analysis. Particularly important are the assumptions driving mortgage prepayments and the assumptions about expected attrition of the core deposit portfolios. These assumptions are based on the Company’s historical experience and industry standards and are applied consistently across the different rate risk measures.
The Company has established the following guidelines for assessing interest rate risk:
Net interest income simulation. Given a 200 basis point parallel and gradual increase or decrease in market interest rates, the Company strives to maintain the change in net interest income to no more than approximately 10% for a one-year period.
Economic Value of Equity (EVE). EVE is the net present value of the Company’s existing assets and liabilities. EVE is expressed as a percentage of the value of equity to total assets. Given a 200 basis point immediate and permanent increase or decrease in market interest rates, the Company strives to maintain the EVE increase or decrease to no more than approximately 50% of stockholders equity.
| ESB Financial Corporation | 24 | 2009 Annual Report |
Table of Contents
Management’s Discussion and Analysis of
Financial Condition and Results of Operations (continued)
The following table presents the simulated impact of a 100 basis point or 200 basis point upward or downward shift of market interest rates on net interest income, return on average equity, diluted earnings per share and the change in EVE. This analysis was done assuming that the interest-earning asset and interest-bearing liability levels at December 31, 2009 remained constant. The impact of the market rate movements was developed by simulating the effects of rates changing gradually over a one-year period from the December 31, 2009 levels for net interest income, return on average equity and diluted earnings per share. The impact of market rate movements was developed by simulating the effects of an immediate and permanent change in rates at December 31, 2009 for the change in EVE. The impact of the rate change for net interest income is compared to the base amount which can fluctuate from period to period. The base amount of net income at December 31, 2009, increased from December 31, 2008.
| Increase | Decrease | |||||||||
| +100 BP |
+200 BP |
-100 BP |
-200 BP | |||||||
| Net interest income - increase (decrease) |
2.31% | 3.70% | (0.49%) | N/A | ||||||
| Return on average equity - increase (decrease) |
3.85% | 6.12% | (0.79%) | N/A | ||||||
| Diluted earnings per share - increase (decrease) |
3.95% | 6.30% | (0.76%) | N/A | ||||||
| EVE - increase (decrease) |
(7.87%) | (19.35%) | (5.62%) | N/A | ||||||
The following table presents the simulated impact of a 100 basis point or 200 basis point upward or downward shift of market interest rates on net interest income, return on average equity, diluted earnings per share and the change in EVE. This analysis was done assuming that the interest-earning asset and interest-bearing liability levels at December 31, 2008 remained constant. The impact of the market rate movements was developed by simulating the effects of rates changing gradually over a one-year period from the December 31, 2008 levels for net interest income, return on average equity and diluted earnings per share. The impact of market rate movements was developed by simulating the effects of an immediate and permanent change in rates at December 31, 2008 for the change in EVE. The impact of the rate change for net interest income is compared to the base amount which can fluctuate from period to period. The base amount of net income at December 31, 2008, increased from December 31, 2007.
| Increase | Decrease | |||||||||
| +100 BP |
+200 BP |
-100 BP |
-200 BP | |||||||
| Net interest income - increase (decrease) |
0.55% | 0.17% | (1.53%) | N/A | ||||||
| Return on average equity - increase (decrease) |
1.11% | 0.60% | (2.62%) | N/A | ||||||
| Diluted earnings per share - increase (decrease) |
1.07% | 0.49% | (2.79%) | N/A | ||||||
| EVE - increase (decrease) |
(12.06%) | (29.72%) | (22.03%) | N/A | ||||||
Liquidity and Capital Resources
The Company’s goal in liquidity management is to ensure that sufficient cash flow exists to address deposit fluctuation, loan demand and debt service requirements. Liquidity is the availability of funds, or assurance that funds will be available, to honor all cash outflow commitments as they come due. These commitments are generally met through cash inflows. The Company’s primary sources of funds generally have been deposits obtained through the offices of the Bank, borrowings from the FHLB, repurchase agreement borrowings and amortization and prepayments of outstanding loans and maturing investment securities. While payments of principal and interest on loans and other investments are relatively predictable sources of funds, deposit flows are much less predictable since they are greatly influenced by the level of interest rates, the state of the economy,
| ESB Financial Corporation | 25 | 2009 Annual Report |
Table of Contents
Management’s Discussion and Analysis of
Financial Condition and Results of Operations (continued)
competition and industry conditions. Liquidity risk is the risk of not being able to obtain funds at a reasonable price within a reasonable period of time to meet financial commitments when due. The Company measures its liquidity position on an ongoing basis and estimates how funding requirements are likely to evolve over time. Liquidity management is integral to other key elements such as capital adequacy, asset quality and profitability and is a fundamental component in the safe and sound management of the Company. The Company supports the process of liquidity planning by assessing potential future liquidity needs and taking into account various possible changes in economic, market, political, regulatory and other external or internal conditions. Such planning involves identifying known, expected and potential cash outflows and weighing alternative business management strategies to ensure adequate cash inflows. The Board of Directors has approved a Liquidity Policy and has designated the Asset Liability Committee (ALCO) to oversee compliance of this policy. The ALCO has assigned responsibility of the management and supervision of the overall liquidity to the Investment Committee.
Net cash provided by operating activities totaled $7.5 million for the year ended December 31, 2009. Net cash provided by operating activities was primarily comprised of net income of $12.0 million partially offset by slight variances in other operating activities. Other operating activities included the proceeds from the sale of loans available for sale and origination of loans available for sale, both of which were $18.3 million
Funds used in investing activities totaled $33.2 million during the year ended December 31, 2009. Primary uses of funds included $174.0 million for loan originations and purchase, purchases of securities available for sale of $197.1 million as well as $10.5 million for funding of real estate held for investment. These uses were partially offset by sources of funds from repayments of loans and securities available for sale of $193.7 million and $209.6 million, respectively and proceeds from real estate held for investment $12.9 million.
Funds used by financing activities totaled $43.3 million for the year ended December 31, 2009. The primary uses of funds were for repayments of long and short term borrowings, funding dividends paid and the purchase of treasury stock of $292.4 million, $4.8 million and $2.9 million. Partially offsetting these uses were sources of funds including an increase in deposits and proceeds from long-term borrowings of $67.0 million and $189.1 million, respectively.
At December 31, 2009, the total approved loan commitments outstanding amounted to $22.7 million. At the same date, commitments under unused lines of credit and credit card lines amounted to $72.5 million and the unadvanced portion of construction loans approximated $12.0 million. Certificates of deposit scheduled to mature in one year or less at December 31, 2009 totaled $410.9 million.
Historically, the Company used its sources of funds primarily to meet its ongoing commitments to pay maturing savings certificates and savings withdrawals, fund loan commitments and maintain a substantial portfolio of investment securities. The Company has been able to generate sufficient cash through the retail deposit market, its traditional funding source, and through FHLB advances and other borrowings, to provide the cash utilized in investing activities. Management believes that the Company currently has adequate liquidity available to respond to liquidity demands.
| ESB Financial Corporation | 26 | 2009 Annual Report |
Table of Contents
Management’s Discussion and Analysis of
Financial Condition and Results of Operations (continued)
The Company’s contractual obligations at December 31, 2009 are as follows:
| (Dollar amounts in thousands) | Payment due by period | ||||||||||||||
| Contractual Obligations | Total | Less than 1 year |
1-3 Years | 3-5 Years | More than 5 years | ||||||||||
| Long-term debt obligations (1) |
$ | 776,106 | $ | 157,345 | $ | 200,350 | $ | 265,849 | $ | 152,562 | |||||
| Time deposits (1) |
494,363 | 291,493 | 163,864 | 36,134 | 2,872 | ||||||||||
| Operating lease obligations |
521 | 110 | 91 | 92 | 228 | ||||||||||
| Supplemental executive retirement plan |
3,278 | 85 | 170 | 170 | 2,853 | ||||||||||
| Directors’ retirement plan |
970 | 119 | 291 | 268 | 292 | ||||||||||
| Total Contractual Obligations |
$ | 1,275,238 | $ | 449,152 | $ | 364,766 | $ | 302,513 | $ | 158,807 | |||||
| (1) | Excludes Interest |
The sources of liquidity and capital resources discussed above are believed by management to be sufficient to fund outstanding loan commitments and meet other obligations.
Current regulatory requirements specify that ESB and similar institutions must maintain, tier one leverage capital equal to 3.0% of adjusted total assets and total capital equal to 8.0% of risk-weighted assets. The Office of the Comptroller of the Currency and the FDIC have adopted more stringent core capital requirements which require that all banks, except for the most highly rated banks, have at least an additional 100 to 200 basis points over those levels to be considered well capitalized. Therefore, an absolute minimum leverage ratio of not less than 4.0% must be maintained by those banks that are not highly rated or that are anticipating or experiencing significant growth. The FDIC reserves the right to apply this higher standard to any insured financial institution when considering an institution’s capital adequacy. At December 31, 2009, ESB was in compliance with all regulatory capital requirements with tier one leverage capital and risk-based capital ratios of 7.6% and 14.2%, respectively.
Impact of Inflation and Changing Prices
The consolidated financial statements of the Company and related notes presented herein have been prepared in accordance with U.S. generally accepted accounting principles which require the measurement of financial condition and operating results in terms of historical dollars, without considering changes in the relative purchasing power of money over time due to inflation.
Unlike most industrial companies, substantially all of the assets and liabilities of a financial institution are monetary in nature. As a result, interest rates have a more significant impact on a financial institution’s performance than the effects of general levels of inflation. Interest rates do not necessarily move in the same direction or in the same magnitude as the prices of goods and services since such prices are affected by inflation to a larger degree than interest rates. In the current interest rate environment, liquidity and the maturity structure of the Company’s assets and liabilities are critical to the maintenance of acceptable performance levels.
Recent Accounting and Regulatory Pronouncements
The Company’s discussion of recent accounting and regulatory pronouncements can be found in Note 1 of the Company’s consolidated financial statements.
| ESB Financial Corporation | 27 | 2009 Annual Report |
Table of Contents
Consolidated Statements of Financial Condition
(Dollar amounts in thousands, except share data)
| December 31, | ||||||||
| 2009 | 2008 | |||||||
| Assets | ||||||||
| Cash on hand and in banks |
$ | 5,894 | $ | 6,680 | ||||
| Interest-earning deposits |
10,390 | 11,032 | ||||||
| Federal funds sold |
16 | 1,181 | ||||||
| Cash and cash equivalents |
16,300 | 18,893 | ||||||
| Securities available for sale; cost of $1,072 and $1,086 |
1,106,910 | 1,096,806 | ||||||
| Loans receivable, net of allowance for loan losses of $6,027 and $6,006 |
671,387 | 691,315 | ||||||
| Loans held for sale |
201 | - | ||||||
| Accrued interest receivable |
10,312 | 10,052 | ||||||
| Federal Home Loan Bank (FHLB) stock |
27,470 | 27,470 | ||||||
| Premises and equipment, net |
13,043 | 11,657 | ||||||
| Real estate acquired through foreclosure, net |
725 | 539 | ||||||
| Real estate held for investment |
27,479 | 34,594 | ||||||
| Goodwill |
41,599 | 41,599 | ||||||
| Intangible assets |
1,313 | 1,830 | ||||||
| Bank owned life insurance |
29,381 | 28,481 | ||||||
| Prepaid expenses and other assets |
14,557 | 11,603 | ||||||
| Total assets |
$ | 1,960,677 | $ | 1,974,839 | ||||
| Liabilities and Stockholders’ Equity | ||||||||
| Liabilities: |
||||||||
| Deposits |
$ | 944,347 | $ | 877,329 | ||||
| FHLB advances |
420,422 | 525,684 | ||||||
| Repurchase agreements |
343,000 | 337,500 | ||||||
| Other borrowings |
19,826 | 23,324 | ||||||
| Junior subordinated notes |
46,393 | 46,393 | ||||||
| Advance payments by borrowers for taxes and insurance |
2,661 | 2,816 | ||||||
| Accounts payable for land development |
4,608 | 6,621 | ||||||
| Accrued expenses and other liabilities |
14,668 | 12,107 | ||||||
| Total liabilities |
1,795,925 | 1,831,774 | ||||||
| Stockholders’ Equity: |
||||||||
| Preferred stock, $.01 par value, 5,000,000 shares authorized; none issued |
- | - | ||||||
| Common stock, $.01 par value, 30,000,000 shares authorized; |
||||||||
| 13,805,812 and 13,806,812 shares issued; |
||||||||
| 12,036,553 and 12,123,076 shares outstanding |
138 | 138 | ||||||
| Additional paid-in capital |
101,571 | 101,041 | ||||||
| Treasury stock, at cost; 1,769,259 and 1,682,736 shares |
(20,302 | ) | (19,371 | ) | ||||
| Unearned Employee Stock Ownership Plan (ESOP) shares |
(814 | ) | (1,672 | ) | ||||
| Retained earnings |
61,660 | 55,789 | ||||||
| Accumulated other comprehensive income, net |
22,658 | 6,459 | ||||||
| Total ESB Financial Corporation’s stockholders’ equity |
164,911 | 142,384 | ||||||
| Noncontrolling interest |
(159 | ) | 681 | |||||
| Total stockholders’ equity |
164,752 | 143,065 | ||||||
| Total liabilities and stockholders’ equity |
$ | 1,960,677 | $ | 1,974,839 | ||||
See accompanying notes to consolidated financial statements.
| ESB Financial Corporation | 28 | 2009 Annual Report |
Table of Contents
Consolidated Statements of Operations
(Dollar amounts in thousands, except share data)
| Year ended December 31, | ||||||||||||
| 2009 | 2008 | 2007 | ||||||||||
| Interest income: |
||||||||||||
| Loans receivable |
$ | 39,271 | $ | 40,035 | $ | 38,268 | ||||||
| Taxable securities available for sale |
47,804 | 50,100 | 51,938 | |||||||||
| Tax-exempt securities available for sale |
5,400 | 4,844 | 4,927 | |||||||||
| FHLB stock |
- | 1,122 | 1,987 | |||||||||
| Interest-earning deposits and federal funds sold |
20 | 157 | 464 | |||||||||
| Total interest income |
92,495 | 96,258 | 97,584 | |||||||||
| Interest expense: |
||||||||||||
| Deposits |
17,796 | 22,408 | 27,706 | |||||||||
| FHLB advances and repurchase agreements |
34,031 | 39,744 | 41,421 | |||||||||
| Junior subordinated notes |
2,520 | 2,963 | 3,474 | |||||||||
| Total interest expense |
54,347 | 65,115 | 72,601 | |||||||||
| Net interest income |
38,148 | 31,143 | 24,983 | |||||||||
| Provision for loan losses |
912 | 1,406 | 865 | |||||||||
| Net interest income after provision for loan losses |
37,236 | 29,737 | 24,118 | |||||||||
| Noninterest income: |
||||||||||||
| Fees and service charges |
3,966 | 3,916 | 3,787 | |||||||||
| Net gain on sale of loans |
203 | 2 | 7 | |||||||||
| Increase of cash surrender value of bank owned life insurance |
899 | 1,128 | 1,104 | |||||||||
| Net realized gain on securities available for sale |
246 | - | 735 | |||||||||
| Impairment losses on investment securities |
(617 | ) | (856 | ) | (141 | ) | ||||||
| Net realized gain (loss) on derivatives |
120 | (616 | ) | (690 | ) | |||||||
| (Loss) income from real estate joint ventures |
(1,905 | ) | 1,102 | 1,827 | ||||||||
| Other |
683 | 601 | 587 | |||||||||
| Total noninterest income |
3,595 | 5,277 | 7,216 | |||||||||
| Noninterest expense: |
||||||||||||
| Compensation and employee benefits |
14,678 | 13,596 | 13,236 | |||||||||
| Premises and equipment |
2,440 | 2,520 | 2,465 | |||||||||
| Federal deposit insurance premiums |
2,540 | 119 | 98 | |||||||||
| Data processing |
2,118 | 1,952 | 1,906 | |||||||||
| Amortization of intangible assets |
494 | 601 | 715 | |||||||||
| Advertising |
574 | 442 | 424 | |||||||||
| Other |
3,940 | 3,812 | 3,823 | |||||||||
| Total noninterest expense |
26,784 | 23,042 | 22,667 | |||||||||
| Income before provision for income taxes |
14,047 | 11,972 | 8,667 | |||||||||
| Provision for income taxes |
2,382 | 1,548 | 400 | |||||||||
| Net income before noncontrolling interest |
11,665 | 10,424 | 8,267 | |||||||||
| Less: net (loss) income attributable to noncontrolling interest |
(347 | ) | 209 | 606 | ||||||||
| Net income attributable to ESB Financial Corporation |
$ | 12,012 | $ | 10,215 | $ | 7,661 | ||||||
| Net income per share: |
||||||||||||
| Basic |
$ | 1.01 | $ | 0.85 | $ | 0.62 | ||||||
| Diluted |
$ | 1.00 | $ | 0.84 | $ | 0.61 | ||||||
| Cash dividends declared per share |
$ | 0.40 | $ | 0.40 | $ | 0.40 | ||||||
| Weighted average shares outstanding |
11,944,901 | 12,044,075 | 12,403,495 | |||||||||
| Weighted average shares and share equivalents outstanding |
12,031,533 | 12,124,485 | 12,529,668 | |||||||||
See accompanying notes to consolidated financial statements.
| ESB Financial Corporation | 29 | 2009 Annual Report |
Table of Contents
Consolidated Statements of Changes in Stockholders’ Equity
(Dollar amounts in thousands, except share data)
| Common stock |
Additional paid-in capital |
Treasury stock |
Unearned ESOP shares |
Retained earnings |
Accumulated other comprehensive income (loss), net of tax |
Noncontrolling Interest |
Total stockholders’ equity |
||||||||||||||||||||||||
| Balance at January 1, 2007 |
$ | 138 | $ | 100,661 | $ (12,126) | $ | (3,512) | $ | 48,626 | $ (5,252) | $ | 696 | $ | 129,231 | |||||||||||||||||
| Comprehensive results: |
|||||||||||||||||||||||||||||||
| Net income |
- | - | - | - | 7,661 | - | 606 | 8,267 | |||||||||||||||||||||||
| Other comprehensive results, net |
- | - | - | - | - | 5,908 | - | 5,908 | |||||||||||||||||||||||
| Reclassification adjustment |
- | - | - | - | - | (392 | ) | - | (392 | ) | |||||||||||||||||||||
| Total comprehensive results |
- | - | - | - | 7,661 | 5,516 | 606 | 13,783 | |||||||||||||||||||||||
| Cash dividends at $0.40 per share |
- | - | - | - | (4,946 | ) | - | - | (4,946 | ) | |||||||||||||||||||||
| Purchase of treasury stock, at cost (508,834 shares) |
- | - | (5,374 | ) | - | - | - | - | (5,374 | ) | |||||||||||||||||||||
| Reissuance of treasury stock for stock option exercises (63,193 shares) |
- | - | 812 | - | (523 | ) | - | - | 289 | ||||||||||||||||||||||
| Compensation expense on ESOP |
- | (26 | ) | - | 941 | - | - | - | 915 | ||||||||||||||||||||||
| Tax effect of compensatory stock options |
- | 97 | - | - | - | - | - | 97 | |||||||||||||||||||||||
| Effect of compensation expense for stock options |
- | 102 | - | - | - | - | - | 102 | |||||||||||||||||||||||
| Capital disbursement for noncontrolling interest |
- | - | - | - | - | - | (490 | ) | (490 | ) | |||||||||||||||||||||
| Accrued compensation expense MRP |
- | 50 | - | - | - | - | - | 50 | |||||||||||||||||||||||
| Balance at December 31, 2007 |
138 | 100,884 | (16,688 | ) | (2,571 | ) | 50,818 | 264 | 812 | 133,657 | |||||||||||||||||||||
| Comprehensive results: |
|||||||||||||||||||||||||||||||
| Net income |
- | - | - | - | 10,215 | - | 209 | 10,424 | |||||||||||||||||||||||
| Other comprehensive results, net |
- | - | - | - | - | 5,630 | - | 5,630 | |||||||||||||||||||||||
| Reclassification adjustment |
- | - | - | - | - | 565 | - | 565 | |||||||||||||||||||||||
| Total comprehensive results |
- | - | - | - | 10,215 | 6,195 | 209 | 16,619 | |||||||||||||||||||||||
| Cash dividends at $0.40 per share |
- | - | - | - | (4,783 | ) | - | - | (4,783 | ) | |||||||||||||||||||||
| Purchase of treasury stock, at cost (334,273 shares) |
- | - | (3,410 | ) | - | - | - | - | (3,410 | ) | |||||||||||||||||||||
| Reissuance of treasury stock for stock option exercises (51,285 shares) |
- | - | 727 | - | (461 | ) | - | - | 266 | ||||||||||||||||||||||
| Compensation expense on ESOP |
- | 1 | - | 899 | - | - | - | 900 | |||||||||||||||||||||||
| Additional ESOP shares purchased |
(76 | ) | (76 | ) | |||||||||||||||||||||||||||
| Tax effect of compensatory stock options |
- | 20 | - | - | - | - | - | 20 | |||||||||||||||||||||||
| Effect of compensation expense for stock options |
- | 175 | - | - | - | - | - | 175 | |||||||||||||||||||||||
| Capital disbursement for noncontrolling interest |
- | - | - | - | - | - | (340 | ) | (340 | ) | |||||||||||||||||||||
| Accrued compensation expense MRP |
- | 37 | - | - | - | - | - | 37 | |||||||||||||||||||||||
| Balance at December 31, 2008 |
138 | 101,041 | (19,371 | ) | (1,672 | ) | 55,789 | 6,459 | 681 | 143,065 | |||||||||||||||||||||
| Comprehensive results: |
|||||||||||||||||||||||||||||||
| Net income |
- | - | - | - | 12,012 | - | (347 | ) | 11,665 | ||||||||||||||||||||||
| Other comprehensive results, net |
- | - | - | - | - | 15,954 | - | 15,954 | |||||||||||||||||||||||
| Reclassification adjustment |
- | - | - | - | - | 245 | - | 245 | |||||||||||||||||||||||
| Total comprehensive results |
- | - | - | - | 12,012 | 16,199 | (347 | ) | 27,864 | ||||||||||||||||||||||
| Cash dividends at $0.40 per share |
- | - | - | - | (4,766 | ) | - | - | (4,766 | ) | |||||||||||||||||||||
| Purchase of treasury stock, at cost (232,151 shares) |
- | - | (2,932 | ) | - | - | - | - | (2,932 | ) | |||||||||||||||||||||
| Reissuance of treasury stock for stock option exercises (145,628 shares) |
- | - | 2,001 | - | (1,375 | ) | - | - | 626 | ||||||||||||||||||||||
| Compensation expense on ESOP |
- | 234 | - | 858 | - | - | - | 1,092 | |||||||||||||||||||||||
| Additional ESOP shares purchased |
- | (123 | ) | - | - | - | - | - | (123 | ) | |||||||||||||||||||||
| Tax effect of compensatory stock options |
- | 166 | - | - | - | - | - | 166 | |||||||||||||||||||||||
| Effect of compensation expense for stock options |
- | 218 | - | - | - | - | - | 218 | |||||||||||||||||||||||
| Capital disbursement for noncontrolling interest |
- | - | - | - | - | - | (493 | ) | (493 | ) | |||||||||||||||||||||
| Accrued compensation expense MRP |
- | 35 | - | - | - | - | - | 35 | |||||||||||||||||||||||
| Balance at December 31, 2009 |
$ | 138 | $ | 101,571 | $ | (20,302 | ) | $ | (814 | ) | $ | 61,660 | $ | 22,658 | $ | (159 | ) | $ | 164,752 | ||||||||||||
See accompanying notes to consolidated financial statements.
| ESB Financial Corporation | 30 | 2009 Annual Report |
Table of Contents
Consolidated Statements of Cash Flows
(Dollar amounts in thousands)
| Year ended December 31, | ||||||||||||
| 2009 | 2008 | 2007 | ||||||||||
| Operating activities: |
||||||||||||
| Net income |
$ | 12,012 | $ | 10,215 | $ | 7,661 | ||||||
| Adjustments to reconcile net income to net cash provided by operating activities: |
||||||||||||
| Depreciation for premises and equipment |
902 | 946 | 1,027 | |||||||||
| Provision for loan losses |
912 | 1,406 | 865 | |||||||||
| Amortization of premiums |
2,043 | 1,681 | 1,885 | |||||||||
| Origination of loans held for sale |
(18,296 | ) | (364 | ) | (193 | ) | ||||||
| Proceeds from sale of loans held for sale |
18,298 | 366 | 390 | |||||||||
| Gain on sale of loans held for sale |
(203 | ) | (2 | ) | (7 | ) | ||||||
| Net realized loss (gain) on securities available for sale |
371 | 240 | (594 | ) | ||||||||
| Net realized (gain) loss on derivatives |
(120 | ) | 616 | 690 | ||||||||
| Amortization of intangible assets |
494 | 601 | 715 | |||||||||
| Compensation expense on ESOP and MRP |
1,127 | 937 | 965 | |||||||||
| Compensation expense on stock options |
218 | 175 | 102 | |||||||||
| Increase of cash surrender value of bank owned life insurance |
(899 | ) | (1,128 | ) | (1,104 | ) | ||||||
| (Increase) decrease in accrued interest receivable |
(260 | ) | (413 | ) | 232 | |||||||
| Increases in deferred tax asset |
(1,206 | ) | (971 | ) | (1,380 | ) | ||||||
| (Increase) decrease in prepaid expenses and other assets |
(10,852 | ) | 707 | 2,716 | ||||||||
| Increase (decrease) in accrued expenses and other liabilities |
3,767 | 63 | (1,646 | ) | ||||||||
| Other |
(774 | ) | 620 | 104 | ||||||||
| Net cash provided by operating activities |
7,534 | 15,695 | 12,428 | |||||||||
| Investing activities: |
||||||||||||
| Loan originations and purchases |
(174,026 | ) | (206,658 | ) | (148,932 | ) | ||||||
| Purchases of: |
||||||||||||
| Securities available for sale |
(197,107 | ) | (189,968 | ) | (150,282 | ) | ||||||
| Interest rate cap contracts |
(189 | ) | (774 | ) | - | |||||||
| FHLB stock |
- | (7,047 | ) | (9,201 | ) | |||||||
| Premises and equipment |
(2,302 | ) | (672 | ) | (1,758 | ) | ||||||
| Principal repayments of: |
||||||||||||
| Loans receivable |
193,668 | 143,178 | 114,107 | |||||||||
| Securities available for sale |
209,631 | 161,144 | 165,098 | |||||||||
| Proceeds from the sale of: |
||||||||||||
| Securities available for sale |
992 | - | 76,973 | |||||||||
| Real estate acquired through foreclosure |
137 | 1,212 | 157 | |||||||||
| Proceeds from bank owned life insurance |
- | 645 | 631 | |||||||||
| Redemption of FHLB stock |
- | 11,027 | 12,094 | |||||||||
| Funding of real estate held for investment |
(10,532 | ) | (17,154 | ) | (21,708 | ) | ||||||
| Proceeds from real estate held for investment |
12,934 | 6,513 | 12,326 | |||||||||
| Net cash provided by (used in) investing activities |
33,206 | (98,554 | ) | 49,505 | ||||||||
| Financing activities: |
||||||||||||
| Net increase in deposits |
67,018 | 34,475 | 19,210 | |||||||||
| Proceeds from long-term borrowings |
189,093 | 346,766 | 252,328 | |||||||||
| Repayments of long-term borrowings |
(284,418 | ) | (273,015 | ) | (230,945 | ) | ||||||
| Net decrease in short-term borrowings |
(7,935 | ) | (12,451 | ) | (95,884 | ) | ||||||
| Redemption of junior subordinated notes |
- | (5,155 | ) | - | ||||||||
| Proceeds received from exercise of stock options |
792 | 286 | 386 | |||||||||
| Dividends paid |
(4,828 | ) | (4,926 | ) | (5,097 | ) | ||||||
| Payments to acquire treasury stock |
(2,932 | ) | (3,410 | ) | (5,374 | ) | ||||||
| Stock purchased by ESOP |
(123 | ) | (76 | ) | - | |||||||
| Net cash (used in) provided by financing activities |
(43,333 | ) | 82,494 | (65,376 | ) | |||||||
| Net decrease in cash and cash equivalents |
(2,593 | ) | (365 | ) | (3,443 | ) | ||||||
| Cash and cash equivalents at beginning of period |
18,893 | 19,258 | 22,701 | |||||||||
| Cash and cash equivalents at end of period |
$ | 16,300 | $ | 18,893 | $ | 19,258 | ||||||
Continued
| ESB Financial Corporation | 31 | 2009 Annual Report |
Table of Contents
Consolidated Statements of Cash Flows (continued)
(Dollar amounts in thousands, except share data)
| Year ended December 31, | |||||||||
| 2009 | 2008 | 2007 | |||||||
| Supplemental information: |
|||||||||
| Interest paid |
$ | 56,282 | $ | 65,163 | $ | 73,020 | |||
| Income taxes paid |
3,245 | 2,278 | 1,507 | ||||||
| Supplemental schedule of non-cash investing and financing activities: |
|||||||||
| Transfers from loans receivable to real estate acquired |
469 | 81 | 477 | ||||||
| Dividends declared but not paid |
1,204 | 1,212 | 1,255 | ||||||
See accompanying notes to consolidated financial statements.
| ESB Financial Corporation | 32 | 2009 Annual Report |
Table of Contents
Notes to Consolidated Financial Statements
| 1. | Summary of Significant Accounting Policies |
Principles of Consolidation
ESB Financial Corporation (the Company) is a publicly traded Pennsylvania thrift holding company. The consolidated financial statements include the accounts of the Company and its direct and indirect wholly owned subsidiaries, ESB Bank (ESB or the Bank), THF, Inc. (THF), AMSCO, Inc. (AMSCO) and ESB Financial Services, Inc. ESB is a Pennsylvania chartered Federal Deposit Insurance Corporation (FDIC) insured stock savings bank.
AMSCO is engaged in real estate development and construction of 1- 4 family residential units independently or in conjunction with its joint ventures. The Bank has provided all development and construction financing. The joint ventures which are 51% owned or greater by AMSCO have been included in the consolidated financial statements and are reflected within other noninterest income or expense. The Bank’s loans to AMSCO and related interest have been eliminated in consolidation.
In addition to the elimination of the loans and interest to the joint ventures described above, all other significant intercompany transactions and balances have been eliminated in consolidation.
Basis of Presentation
The preparation of financial statements in conformity with GAAP requires management to make some estimates and assumptions that affect the reported amounts in the consolidated financial statements and accompanying notes. Actual results could differ from those estimates. Certain amounts previously reported have been reclassified to conform to the current year financial statement presentation. The reclassification had no effect on net income.
Operating Segments
An operating segment is defined as a component of an enterprise that engages in business activities that generate revenue and incur expense, the operating results of which are reviewed by management and for which discrete financial information is available. At December 31, 2009, the Company was doing business through 24 full service banking branches, one loan production office, and its various other subsidiaries. Loans and deposits are primarily generated from the areas where banking branches are located. The Company derives its income predominantly from interest on loans and securities and to a lesser extent, noninterest income. The Company’s principal expenses are interest paid on deposits and borrowed funds and normal operating costs. The Company’s operations are principally in the savings and loan industry. Consistent with internal reporting, the Company’s operations are reported in one operating segment, which is community banking.
Cash Equivalents
Cash equivalents include cash on hand and in banks, interest-earning deposits with original maturities of 90 days or less and federal funds sold. The Board of Governors of the Federal Reserve System imposes certain reserve requirements on all depository institutions. These reserves are maintained in the form of vault cash or as a noninterest bearing balance with the Federal Reserve Bank. Required reserves at the Federal Reserve Bank averaged $652,000 and $691,000 during the year 2009 and 2008, respectively.
Securities Available for Sale and Held for Maturity
Securities include investments primarily in bonds, notes and to a lesser extent equity securities and are classified as either available for sale or held to maturity at the time of purchase based on management’s intent. Such intent includes consideration of the interest rate environment, prepayment risk, credit risk,
| ESB Financial Corporation | 33 | 2009 Annual Report |
Table of Contents
Notes to Consolidated Financial Statements (continued)
| 1. | Summary of Significant Accounting Policies (continued) |
maturity and repricing characteristics, liquidity considerations, investment and asset/liability management policies and other pertinent factors. Unrealized holding gains and losses, net of applicable income taxes, on available for sale securities are reported as accumulated other comprehensive income until realized. Gains and losses on the sale of securities are determined using the specific identification method and are included in operations in the period sold.
Declines in the fair value of equity securities below their cost that are determined to be other than temporary result in the security being written down to fair value on an individual basis. Any related write-downs are included in operations as realized losses.
Declines in the fair value of marketable debt securities that are determined to be other than temporary due to a decline in the credit of the issuer are written down to fair value accordingly, with a resulting charge to realized loss and an adjustment to the cost basis of the security. With respect to the other-than-temporary impairments of marketable debt securities where the decline in the market value is solely attributable to an increase in market interest rates, this would not trigger an other-than-temporary impairment charge if the Company does not intend to sell the investments and it is not more likely than not that the Company will be required to sell the investments before recovery of their amortized cost basis. At each reporting date, management will re-challenge their intent and ability to hold such debt security until recovery and document the basis for this assertion. To the extent that market conditions have changed and management can no longer assert that they have the intent and ability to hold a debt security until the market value recovers, the Company will recognize an other-than-temporary impairment at that time.
Yields and carrying values for certain mortgage-backed securities are subject to normal interest rate and prepayment risks. Premiums and discounts on securities are recognized in interest income using the interest method over the period to maturity.
Loans Receivable
Loans receivable, for which management has the intent and the Company has the ability to hold for the foreseeable future or until maturity or payoff, are reported at their outstanding unpaid principal balances reduced by any charge-offs and net of any deferred fees or costs on loans originated, unamortized premiums or discounts on loans purchased and the allowance for loan losses.
Interest income on loans is accrued and credited to operations as earned. Interest income is not accrued for loans delinquent 90 days or greater. Interest on impaired loans is discontinued when, in management’s opinion, the borrower may be unable to meet contractual payments. When interest accrual is discontinued, all unpaid accrued interest is reversed. Interest receipts on nonaccrual and impaired loans are recognized as interest revenue or applied to principal when management believes the ultimate collectibility of principal is in doubt.
Discounts and premiums on purchased loans are recognized in interest income using the interest method over the remaining period to contractual maturity, adjusted for prepayments. Loan origination fees and certain direct origination costs are capitalized and recognized as an adjustment to the yield of the related loan over the loan’s period to maturity. Loans originated and intended for sale are carried at the lower of cost or estimated market value in the aggregate.
Impaired loans are commercial and commercial real estate loans for which it is probable the Company will not be able to collect all amounts due according to the contractual terms of the loan agreement. The Company individually evaluates such loans for impairment and does not aggregate loans by major risk classifications. The definition of impaired loans is not the same as the definition of nonaccrual loans,
| ESB Financial Corporation | 34 | 2009 Annual Report |
Table of Contents
Notes to Consolidated Financial Statements (continued)
| 1. | Summary of Significant Accounting Policies (continued) |
although the two categories overlap. The Company may choose to place a loan on nonaccrual status due to payment delinquency or uncertain collectibility, while not classifying the loan as impaired. Factors considered by management in determining impairment include payment status and collateral value. The amount of impairment for these types of impaired loans is determined by the difference between the present value of the expected cash flows related to the loan, using current interest rates, and its recorded value, or, as a practical expedient in the case of collateralized loans, the difference between the fair value of the collateral and the recorded amount of the loans. When foreclosure is probable, impairment is measured based on the fair value of the collateral.
Mortgage loans on one-to four family properties and all consumer loans are large groups of smaller balance homogeneous loans and are measured for impairment collectively. Loans that experience insignificant payment delays, which are defined as less than 90 days, generally are not classified as impaired. Management determines the significance of payment delays on a case-by-case basis, taking into consideration all circumstances surrounding the loan and the borrower including the length of the delay, the borrower’s prior payment record and the amount of shortfall in relation to the principal and interest owed.
The allowance for loan losses is maintained at a level believed to be adequate by management to absorb probable losses inherent in the portfolio and is based on the size and current risk characteristics of the loan portfolio, an assessment of individual problem loans and actual loss experience, current economic events in specific industries and other pertinent factors such as regulatory guidance and general economic conditions. Determination of the allowance is inherently subjective as it requires significant estimates, including the amounts and timing of expected future cash flows on impaired loans, estimated losses on pools of homogeneous loans based on historical loss experience and consideration of current economic trends, all of which may be susceptible to significant change. Loan losses are charged off against the allowance, while recoveries of amounts previously charged off are credited to the allowance. A provision for loan losses is charged to operations based on management’s periodic evaluation of the factors previously mentioned, as well as other pertinent factors. Evaluations are conducted quarterly, during which loans may be charged off upon reaching various stages of delinquency and depending upon the loan type.
Real Estate Acquired Through Foreclosure
Real estate properties acquired through foreclosure are initially recorded at the lower of cost or fair value at the date of foreclosure, establishing a new cost basis. After foreclosure, management periodically performs valuations and the real estate is carried at the lower of cost or fair value less estimated costs to sell. Revenue and expenses from operations of the properties, gains and losses on sales and additions to the valuation allowance are included in operating results.
Premises and Equipment
Land is carried at cost. Premises, furniture and equipment, and leasehold improvements are carried at cost less accumulated depreciation or amortization. Depreciation is calculated on a straight-line basis over the estimated useful lives of the related assets, which are twenty-five to fifty years for buildings and three to ten years for furniture and equipment. Amortization of leasehold improvements is computed using the straight-line method over the term of the related lease.
Goodwill and Intangible Assets
Goodwill consisted of $41.6 million at December 31, 2009 and 2008, respectively. The Company evaluates goodwill for impairment. This impairment assessment is performed at least annually. The fair value of the Company and the implied fair value of goodwill at the respective reporting unit level were estimated as of
| ESB Financial Corporation | 35 | 2009 Annual Report |
Table of Contents
Notes to Consolidated Financial Statements (continued)
| 1. | Summary of Significant Accounting Policies (continued) |
October 31, 2009 using the market value approach, utilizing industry comparable information. The Company concluded that the recorded value of goodwill was not impaired as a result of the evaluation. Core deposit intangible was $1.3 million and $1.8 million at December 31, 2009 and 2008, respectively. The core deposit intangible assets are amortized on a sum of the year’s digit basis over the estimated useful life, generally up to ten years. Amortization of finite lived assets is expected to total $413,000, $332,000, $251,000, $170,000, $110,000 and $8,000 for the years 2010, 2011, 2012, 2013, 2014 and 2015, respectively.
Mortgage Servicing Assets
At December 31, 2009, the remaining balance and fair value of the servicing asset was $29,000, which is recorded in other assets. Servicing assets are amortized in proportion to, and over the period of, estimated net servicing revenues. Impairment of servicing assets is based on fair value of those assets, estimated using discounted cash flows and prepayment assumptions for the market area of the servicing portfolio. For purposes of measuring impairment, the servicing asset is stratified based on interest rate. The amount of impairment recognized is the amount by which the capitalized servicing asset for a stratum exceeds the fair value of that stratum. During 2009 the Company recorded an additional impairment valuation of approximately $7,000, for a total impairment valuation of $39,000 at December 31, 2009. There was an impairment valuation of $32,000 at December 31, 2008. No impairment valuation existed at December 31, 2007. The amortization taken on the servicing asset for the year ended December 31, 2009 and 2008 was $15,000 and $23,000, respectively. The Company had total loans serviced for others of $21.6 million, $24.8 million and $23.2 million at December 31, 2009, 2008 and 2007, respectively.
Income Taxes
Deferred tax assets and liabilities are reflected at currently enacted income tax rates applicable to the period in which the deferred tax assets or liabilities are expected to be realized or settled. As changes in tax laws or rates are enacted, deferred tax assets and liabilities are adjusted through the provision for income taxes.
Bank-Owned Life Insurance (BOLI)
The Company owns insurance on the lives of a certain group of key employees. The policies were purchased to help offset the increases in the costs of various fringe benefit plans including healthcare. The cash surrender value of these policies is included as an asset on the consolidated statements of financial condition, and any increases in cash surrender value are recorded as noninterest income on the consolidated statement of income. In the event of the death of an insured individual under these policies, the Company would receive a death benefit.
Financial Instruments
The Company records all derivatives on the consolidated statement of financial condition at fair value. The accounting for changes in the fair value of derivatives depends on the intended use of the derivative and the resulting designation. Derivatives used to hedge the exposure to changes in the fair value of an asset, liability, or firm commitment attributable to a particular risk, such as interest rate risk, are considered fair value hedges. Derivatives used to hedge the exposure to variability in expected future cash flows, or other types of forecasted transactions, are considered cash flow hedges.
For derivatives designated as fair value hedges, changes in the fair value of the derivative and the hedged item related to the hedged risk are recognized in earnings. For derivatives designated as cash flow hedges, the effective portion of changes in the fair value of the derivative is initially reported in other comprehensive
| ESB Financial Corporation | 36 | 2009 Annual Report |
Table of Contents
Notes to Consolidated Financial Statements (continued)
| 1. | Summary of Significant Accounting Policies (continued) |
income (outside of earnings) and subsequently reclassified to earnings when the hedged transaction affects earnings, and the ineffective portion of changes in the fair value of the derivative is recognized directly in earnings. The Company assesses the effectiveness of each hedging relationship by comparing the changes in fair value or cash flows of the derivative hedging instrument with the changes in fair value or cash flows of the designated hedged item or transaction. For derivatives not designated as hedges, changes in fair value are recognized in earnings.
Stock-Based Compensation
The Company accounts for stock compensation based on the grant-date fair value of all share-based payment awards that are expected to vest, including employee share options to be recognized as employee compensation expense over the requisite service period.
During the years ended December 31, 2009, 2008 and 2007 the Company recorded $218,000, $175,000, and $102,000, respectively, in compensation expense and tax benefits of $20,000, $22,000 and $11,000, respectively, related to our share-based compensation awards. As of December 31, 2009, there was approximately $46,000 of unrecognized compensation cost related to unvested share-based compensation awards granted in 2006. That cost is expected to be recognized during 2010. There was approximately $91,000 of unrecognized compensation cost related to unvested share-based compensation awards granted in 2007. That cost is expected to be recognized over the next two years. There was approximately $147,000 of unrecognized compensation cost related to unvested share-based compensation awards granted in 2008. That cost is expected to be recognized over the next three years. Finally, there was approximately $264,000 of unrecognized compensation cost related to unvested share-based compensation awards granted in 2009. That cost is expected to be recognized over the next four years.
The Company has recorded $166,000, $20,000 and $97,000 in excess tax benefits has been classified as financing cash inflows for the years ended December 31, 2009, 2008 and 2007 in the Consolidated Statement of Cash Flows.
For purposes of computing results, the Company estimated the fair values of stock options using the Black-Scholes option-pricing model. The model requires the use of subjective assumptions that can materially affect fair value estimates. Therefore, the pro forma results are estimates of results of operations as if compensation expense had been recognized for the stock option plans. The fair value of each option is amortized into compensation expense on a straight line basis between the grant date for the option and each vesting date. The fair value of each stock option granted was estimated using the following weighted-average assumptions:
| 2009 | 2008 | 2007 | ||||||
| Assumptions |
||||||||
| Volatility |
33.10% | 36.29% | 35.80% | |||||
| Interest Rates |
2.69% | 3.29% | 3.63% | |||||
| Dividend Yields |
3.47% | 3.88% | 3.96% | |||||
| Weighted Average Life ( in years) |
7.2 | 6.9 | 6.6 |
The weighted average fair value of each stock option granted for 2009, 2008 and 2007 was $2.70, $2.78, and $2.69, respectively. The total intrinsic value of options exercised during the years ended December 31, 2009, 2008 and 2007, was $498,000, $259,000 and $281,000, respectively.
| ESB Financial Corporation | 37 | 2009 Annual Report |
Table of Contents
Notes to Consolidated Financial Statements (continued)
| 1. | Summary of Significant Accounting Policies (continued) |
Net Income Per Share
The following table summarizes the Company’s net income per share for the years ended December 31:
| (Amounts in thousands, except per share data) | |||||||||
| 2009 | 2008 | 2007 | |||||||
| Net income |
$ | 12,012 | $ | 10,215 | $ | 7,661 | |||
| Weighted-average common shares outstanding |
11,945 | 12,044 | 12,403 | ||||||
| Basic earnings per share |
$ | 1.01 | $ | 0.85 | $ | 0.62 | |||
| Weighted-average common shares outstanding |
11,945 | 12,044 | 12,403 | ||||||
| Common stock equivalents due to effect of stock options |
87 | 80 | 127 | ||||||
| Total weighted-average common shares and equivalents |
12,032 | 12,124 | 12,530 | ||||||
| Diluted earnings per share |
$ | 1.00 | $ | 0.84 | $ | 0.61 | |||
The unallocated shares controlled by the ESOP of 74,349 and 152,687 at December 31, 2009 and 2008 respectively, are not considered in the weighted average shares outstanding until the shares are committed for allocation to an employee’s individual account.
Options to purchase 80,310 shares of common stock at a weighted average exercise price of $15.35 per share expiring November 2013 and 84,040 shares of common stock at a weighted average exercise price of $14.50 per share expiring November 2014 were outstanding as of December 31, 2009 but were not included in the computation of diluted earnings per share for 2009 because the options’ exercise price was greater than the average market price of the common shares.
Options to purchase 91,632 shares of common stock at a weighted average exercise price of $10.83 per share expiring November 2012, 80,310 shares of common stock at a weighted average exercise price of $15.35 per share expiring November 2013, 84,040 shares of common stock at a weighted average exercise price of $14.50 per share expiring November 2014, 78,300 shares of common stock at a weighted average exercise price of $12.20 per share expiring June 2015, 16,110 shares of common stock at a weighted average exercise price of $12.40 per share expiring June 2015 and 89,730 shares of common stock at a weighted average exercise price of $10.75 per share expiring November 2016 were outstanding as of December 31, 2008 but were not included in the computation of diluted earnings per share for 2008 because the options’ exercise price was greater than the average market price of the common shares.
Options to purchase 97,092 shares of common stock at a weighted average exercise price of $10.83 per share expiring November 2012, 85,010 shares of common stock at a weighted average exercise price of $15.35 per share expiring November 2013, 88,740 shares of common stock at a weighted average exercise price of $14.50 per share expiring November 2014, 82,300 shares of common stock at a weighted average exercise price of $12.20 per share expiring June 2015, 16,660 shares of common stock at a weighted average exercise price of $12.40 per share expiring June 2015 and 94,480 shares of common stock at a weighted average exercise price of $10.75 per share expiring November 2016 were outstanding as of December 31, 2007 but were not included in the computation of diluted earnings per share for 2007 because the options’ exercise price was greater than the average market price of the common shares.
| ESB Financial Corporation | 38 | 2009 Annual Report |
Table of Contents
Notes to Consolidated Financial Statements (continued)
| 1. | Summary of Significant Accounting Policies (continued) |
Effect of Recent Accounting and Regulatory Pronouncements
In June 2009, the Financial Accounting Standards Board (“FASB”) issued Accounting Standards Update (“ASU”) No. 2009-01, Topic 105—Generally Accepted Accounting Principles—FASB Accounting Standards Codification™ and the Hierarchy of Generally Accepted Accounting Principles. The Codification is the single source of authoritative nongovernmental GAAP. The Codification does not change current GAAP, but is intended to simplify user access to all authoritative GAAP by providing all the authoritative literature related to a particular topic in one place. Rules and interpretive releases of the SEC under federal securities laws are also sources of authoritative GAAP for SEC registrants. The Company adopted this standard for the interim reporting period ending September 30, 2009.
In June 2008, the FASB issued accounting guidance related to determining whether instruments granted in share-based payment transactions are participating securities, which is effective for financial statements issued for fiscal years beginning after December 15, 2008, and interim periods within those years. This guidance clarified that instruments granted in share-based payment transactions can be participating securities prior to the requisite service having been rendered. A basic principle of this guidance is that unvested share-based payment awards that contain nonforfeitable rights to dividends or dividend equivalents (whether paid or unpaid) are participating securities and are to be included in the computation of EPS pursuant to the two-class method. All prior-period EPS data presented (including interim financial statements, summaries of earnings, and selected financial data) are required to be adjusted retrospectively to conform to this guidance. This accounting guidance was subsequently codified into ASC Topic 260, Earnings Per Share. The adoption of this new guidance did not have a material effect on the Company’s results of operations or financial position.
In April 2009, the FASB issued new guidance impacting ASC Topic 820, Fair Value Measurements and Disclosures. This ASC provides additional guidance in determining fair values when there is no active market or where the price inputs being used represent distressed sales. It reaffirms the need to use judgment to ascertain if a formerly active market has become inactive and in determining fair values when markets have become inactive. The adoption of this new guidance did not have a material effect on the Company’s results of operations or financial position.
In September 2006, the FASB issued an accounting standard related to fair value measurements, which was effective for the Company on January 1, 2008. This standard defined fair value, established a framework for measuring fair value, and expanded disclosure requirements about fair value measurements. On January 1, 2008, the provisions of this accounting standard became effective for the Company’s financial assets and financial liabilities and on January 1, 2009 for nonfinancial assets and nonfinancial liabilities. This accounting standard was subsequently codified into ASC Topic 820, Fair Value Measurements and Disclosures. See Note 12 for the necessary disclosures.
In August 2009, the FASB issued ASU No. 2009-05, Fair Value Measurements and Disclosures (Topic 820)—Measuring Liabilities at Fair Value. This ASU provides amendments for fair value measurements of liabilities. It provides clarification that in circumstances in which a quoted price in an active market for the identical liability is not available, a reporting entity is required to measure fair value using one or more techniques. ASU 2009-05 also clarifies that when estimating a fair value of a liability, a reporting entity is not required to include a separate input or adjustment to other inputs relating to the existence of a restriction that prevents the transfer of the liability. ASU 2009-05 is effective for the first reporting period (including interim periods) beginning after issuance or fourth quarter 2009. The adoption of this new guidance did not have a material impact on the Company’s financial position or results of operations.
| ESB Financial Corporation | 39 | 2009 Annual Report |
Table of Contents
Notes to Consolidated Financial Statements (continued)
| 1. | Summary of Significant Accounting Policies (continued) |
In April 2009, the FASB issued new guidance impacting ASC 825-10-50, Financial Instruments, which relates to fair value disclosures for any financial instruments that are not currently reflected on the balance sheet of companies at fair value. This guidance amended existing GAAP to require disclosures about fair value of financial instruments for interim reporting periods of publicly traded companies as well as in annual financial statements. This guidance is effective for interim and annual periods ending after June 15, 2009. The Company has presented the necessary disclosures in Note 13 herein.
In April 2009, the FASB issued new guidance impacting ASC 320-10, Investments—Debt and Equity Securities, which provides additional guidance designed to create greater clarity and consistency in accounting for and presenting impairment losses on securities. This guidance is effective for interim and annual periods ending after June 15, 2009. The Company has presented the necessary disclosures in Note 12 herein.
In June 2009, the FASB issued an accounting standard related to the accounting for transfers of financial assets, which is effective for fiscal years beginning after November 15, 2009, and interim periods within those fiscal years. This standard enhances reporting about transfers of financial assets, including securitizations, and where companies have continuing exposure to the risks related to transferred financial assets. This standard eliminates the concept of a “qualifying special-purpose entity” and changes the requirements for derecognizing financial assets. This standard also requires additional disclosures about all continuing involvements with transferred financial assets including information about gains and losses resulting from transfers during the period. This accounting standard was subsequently codified into ASC Topic 860, Transfers and Servicing. The adoption of this standard is not expected to have a material effect on the Company’s results of operations or financial position.
In December 2007, the FASB issued an accounting standard related to noncontrolling interests in consolidated financial statements, which is effective for fiscal years beginning on or after December 15, 2008. This standard establishes accounting and reporting standards for the noncontrolling interest in a subsidiary and for the deconsolidation of a subsidiary. It clarifies that a noncontrolling interest in a subsidiary, which is sometimes referred to as minority interest, is an ownership interest in the consolidated entity that should be reported as equity in the consolidated financial statements. Among other requirements, this statement requires consolidated net income to be reported at amounts that include the amounts attributable to both the parent and the noncontrolling interest. It also requires disclosure, on the face of the consolidated income statement, of the amounts of consolidated net income attributable to the parent and to the noncontrolling interest. This accounting standard was subsequently codified into ASC 810-10, Consolidation. The Company has presented the necessary disclosures on the financial statements.
On April 1, 2009, the FASB issued new authoritative accounting guidance under ASC Topic 805, Business Combinations, which became effective for periods beginning after December 15, 2008. ASC Topic 805 applies to all transactions and other events in which one entity obtains control over one or more other businesses. ASC Topic 805 requires an acquirer, upon initially obtaining control of another entity, to recognize the assets, liabilities and any non-controlling interest in the acquiree at fair value as of the acquisition date. Contingent consideration is required to be recognized and measured at fair value on the date of acquisition rather than at a later date when the amount of that consideration may be determinable beyond a reasonable doubt. This fair value approach replaces the cost-allocation process required under previous accounting guidance whereby the cost of an acquisition was allocated to the individual assets acquired and liabilities assumed based on their estimated fair value. ASC Topic 805 requires acquirers to expense acquisition-related costs as incurred rather than allocating such costs to the assets acquired and liabilities assumed, as was previously the case under prior accounting guidance. Assets acquired and liabilities assumed in a business combination that arise from contingencies are to be recognized at fair value
| ESB Financial Corporation | 40 | 2009 Annual Report |
Table of Contents
Notes to Consolidated Financial Statements (continued)
| 1. | Summary of Significant Accounting Policies (continued) |
if fair value can be reasonably estimated. If fair value of such an asset or liability cannot be reasonably estimated, the asset or liability would generally be recognized in accordance with ASC Topic 450, Contingencies. Under ASC Topic 805, the requirements of ASC Topic 420, Exit or Disposal Cost Obligations, would have to be met in order to accrue for a restructuring plan in purchase accounting. Pre-acquisition contingencies are to be recognized at fair value, unless it is a non-contractual contingency that is not likely to materialize, in which case, nothing should be recognized in purchase accounting and, instead, that contingency would be subject to the probable and estimable recognition criteria of ASC Topic 450, Contingencies. The adoption of this new guidance did not have a material impact on the Company’s financial position or results of operations.
In June 2009, the FASB issued new authoritative accounting guidance under ASC Topic 810, Consolidation, which amends prior guidance to change how a company determines when an entity that is insufficiently capitalized or is not controlled through voting (or similar rights) should be consolidated. The determination of whether a company is required to consolidate an entity is based on, among other things, an entity’s purpose and design and a company’s ability to direct the activities of the entity that most significantly impact the entity’s economic performance. The new authoritative accounting guidance requires additional disclosures about the reporting entity’s involvement with variable-interest entities and any significant changes in risk exposure due to that involvement as well as its affect on the entity’s financial statements. The new authoritative accounting guidance under ASC Topic 810 will be effective January 1, 2010 and is not expected to have a significant impact on the Company’s financial statements.
On December 30, 2008, the FASB issued new authoritative accounting guidance under ASC Topic 715, Compensation—Retirement Benefits, which provides guidance related to an employer’s disclosures about plan assets of defined benefit pension or other post-retirement benefit plans. Under ASC Topic 715, disclosures should provide users of financial statements with an understanding of how investment allocation decisions are made, the factors that are pertinent to an understanding of investment policies and strategies, the major categories of plan assets, the inputs and valuation techniques used to measure the fair value of plan assets, the effect of fair value measurements using significant unobservable inputs on changes in plan assets for the period and significant concentrations of risk within plan assets. This guidance is effective fiscal year ending after December 15, 2009. The new authoritative accounting guidance under ASC Topic 715 became effective for the Company’s financial statements for the year-ended December 31, 2009 and the required disclosures are reported in Note 9.
| ESB Financial Corporation | 41 | 2009 Annual Report |
Table of Contents
Notes to Consolidated Financial Statements (continued)
| 2. | Securities |
The following table summarizes the Company’s securities as of December 31:
| (Dollar amounts in thousands) | Amortized cost |
Unrealized gains |
Unrealized losses |
Fair value | ||||||||
| December 31, 2009: |
||||||||||||
| Trust preferred securities |
$ | 47,272 | $ | 66 | $ | (6,761) | $ | 40,577 | ||||
| Municipal securities |
145,642 | 5,014 | (562) | 150,094 | ||||||||
| Equity securities |
775 | 189 | (57) | 907 | ||||||||
| Corporate bonds |
84,332 | 4,052 | (203) | 88,181 | ||||||||
| Mortgage-backed securities |
793,714 | 34,322 | (885) | 827,151 | ||||||||
| $ | 1,071,735 | $ | 43,643 | $ | (8,468) | $ | 1,106,910 | |||||
| December 31, 2008: |
||||||||||||
| Trust preferred securities |
$ | 47,819 | $ | - | $ | (8,303) | $ | 39,516 | ||||
| Municipal securities |
135,220 | 1,624 | (2,799) | 134,045 | ||||||||
| Equity securities |
676 | 30 | - | 706 | ||||||||
| Corporate bonds |
20,564 | 128 | (1,246) | 19,446 | ||||||||
| Mortgage-backed securities |
881,782 | 22,068 | (757) | 903,093 | ||||||||
| $ | 1,086,061 | $ | 23,850 | $ | (13,105) | $ | 1,096,806 | |||||
The proceeds from the sale of securities as of December 31, 2009 were $992,000. Gross realized gains on sales of securities available for sale were $246,000 in 2009. Impairment charges on available for sale securities of $617,000 were recorded for 2009 on securities that were deemed to be other-than-temporarily impaired. Included in the impairment charges for 2009 was approximately $66,000 on three of the Company’s equity investments in small banks that had experienced a decline in their market value for several quarters and $552,000 on a corporate bond. Additionally, the Company recorded a gain of approximately $120,000 on its interest rate caps due to a market value adjustment.
During 2008 the Company did not have any security sales, however the Company recorded impairment charges of $553,000 and $303,000, respectively on corporate bonds and four of its equity investments in small banks that had experienced a decline in their market value for several quarters. Additionally, the Company recorded a loss of approximately $616,000 on its interest rate caps due to a market value adjustment.
The proceeds from the sale of securities as of December 31, 2007 were $77.0 million respectively. Gross realized gains and gross realized losses were $1.7 million and $944,000, respectively in 2007. Impairment charges on available for sale securities of $141,000 were recorded for 2007 on securities that were deemed to be other-than-temporarily impaired. In addition, there were gross unrealized losses on sales of interest rate caps of $690,000 in 2007.
Included in the $40.6 million of trust preferred securities are standalone trust preferred securities with a fair value of $39.2 million that are investment-grade rated by at least one rating agency. In addition, there was one pooled trust preferred security with a par value of $2.5 million that was not investment-grade rated. The impairment charges for 2009 and 2008 of $552,000 and $553,000, respectively were recorded against one corporate bond that has been determined to be other than temporarily impaired due solely to credit related factors. This security is a collateralized debt obligation currently comprised of trust preferred securities of 16 financial institutions and has a Moody’s rating of Ca, which is below investment grade. The Company utilized a discounted cash flow method which is a level three pricing method to estimate the impairment. During this analysis, the Company determined that three of these financial institutions are currently
| ESB Financial Corporation | 42 | 2009 Annual Report |
Table of Contents
Notes to Consolidated Financial Statements (continued)
| 2. | Securities (continued) |
deferring interest payments and the Company is aware of two additional financial institutions that will begin deferring interest payments in February 2010. In addition, two financial institutions have defaulted. All five financial institutions that are/will be deferring interest payments as of February 2010 either lost money or broke even for the most recent quarter. Also, there were four financial institutions (including two of the five deferrals) within this pool that the non-performing assets to loans plus real estate owned ratio was greater than 10%. One institution currently deferring interest payments had a Tier 1 Risk Ratio of less than 6% and non-performing assets to loans plus real estate owned ratio greater than 10%.
Because of the sub prime crisis current markets for variable rate corporate trust preferred bonds are illiquid. In order to determine prices of these securities the Company utilizes a discounted cash flow method, mentioned above. This method is described more fully in footnote 12, Fair Value.
At December 31, 2009 and 2008, the Company did not have any corporate bonds whose book value exceeded 10% of equity.
The following table shows the Company’s investments’ gross unrealized losses and fair value aggregated by investment category and length of time that individual securities have been in a continuous unrealized loss position, at December 31, 2009 and 2008:
| As of December 31, 2009 | ||||||||||||||||||||||||
| (Dollar amounts in thousands) | Less than 12 Months | 12 Months or more | Total | |||||||||||||||||||||
| # of Securities |
Fair Value | Unrealized losses |
# of Securities |
Fair Value | Unrealized losses |
# of Securities |
Fair Value | Unrealized losses | ||||||||||||||||
| Trust Preferred Securities |
- | $ | - | $ | - | 9 | $ | 37,608 | $ | 6,761 | 9 | $ | 37,608 | $ | 6,761 | |||||||||
| Municipal securities |
1 | 2,222 | 54 | 13 | 16,336 | 508 | 14 | 18,558 | 562 | |||||||||||||||
| Equity Securities |
- | - | - | 4 | 350 | 57 | 4 | 350 | 57 | |||||||||||||||
| Corporate bonds |
1 | 2,996 | 33 | 1 | 3,613 | 170 | 2 | 6,609 | 203 | |||||||||||||||
| Mortgage-backed securities |
13 | 53,402 | 494 | 5 | 10,289 | 391 | 18 | 63,691 | 885 | |||||||||||||||
| 15 | $ | 58,620 | $ | 581 | 32 | $ | 68,196 | $ | 7,887 | 47 | $ | 126,816 | $ | 8,468 | ||||||||||
| As of December 31, 2008 | ||||||||||||||||||||||||
| (Dollar amounts in thousands) | Less than 12 Months | 12 Months or more | Total | |||||||||||||||||||||
| # of Securities |
Fair Value | Unrealized losses |
# of Securities |
Fair Value | Unrealized losses |
# of Securities |
Fair Value | Unrealized losses | ||||||||||||||||
| Trust Preferred Securities |
1 | $ | 1,305 | $ | 212 | 9 | $ | 36,264 | $ | 8,091 | 10 | $ | 37,569 | $ | 8,303 | |||||||||
| Municipal securities |
53 | 43,714 | 1,830 | 23 | 20,571 | 969 | 76 | 64,285 | 2,799 | |||||||||||||||
| Corporate bonds |
3 | 11,293 | 1,246 | - | - | - | 3 | 11,293 | 1,246 | |||||||||||||||
| Mortgage-backed securities |
6 | 9,535 | 359 | 12 | 18,625 | 398 | 18 | 28,160 | 757 | |||||||||||||||
| 63 | $ | 65,847 | $ | 3,647 | 44 | $ | 75,460 | $ | 9,458 | 107 | $ | 141,307 | $ | 13,105 | ||||||||||
The Company primarily invests in mortgage-backed securities, variable and fixed rate corporate bonds, municipal bonds, government bonds and to a lesser extent equity securities. The policy of the Company is to recognize an other than temporary impairment on equity securities where the fair value has been significantly below cost for three consecutive quarters. Declines in the fair value of the corporate bonds that can be attributed to specific adverse conditions affecting the credit quality of the investment would be recorded as other than temporary impairment losses, and charged to earnings. In order to determine if a decline in fair value is other than temporary, the Company reviews corporate ratings of the investment,
| ESB Financial Corporation | 43 | 2009 Annual Report |
Table of Contents
Notes to Consolidated Financial Statements (continued)
| 2. | Securities (continued) |
analyst reports and SEC filings of the issuers. For fixed maturity investments with unrealized losses due to interest rates where the Company expects to recover the entire amortized cost basis of the security, declines in value below cost are not assumed to be other than temporary. The Company reviews its position quarterly and has asserted that at December 31, 2009, the declines outlined in the above table represent temporary declines due to changes in interest rates and are not reflections of an impairment in the credit quality of the securities. Additionally, the Company does not intend to sell the investment and it is not more likely than not that the Company will be required to sell the investment before recovery of its amortized cost basis.
The Company reviews investment debt securities on an ongoing basis for the presence of other than temporary impairment (OTTI) with formal reviews performed quarterly. Credit –related OTTI losses on individual securities were recognized during 2009 in earnings while noncredit-related OTTI on securities not expected to be sold is recognized in other comprehensive income (loss) (OCI). The credit-related OTTI recognized during 2009 and 2008 was $552,000 and $553,000, respectively and was solely related to securities having a book value of $1.4 million. There were no noncredit-related OTTI on these securities recognized in OCI during 2009.
The following table summarizes scheduled maturities of the Company’s securities as of December 31, 2009, excluding equity securities which have no maturity dates:
| (Dollar amounts in thousands) | Available for sale | ||||||||
| Weighted Average Yield |
Amortized cost |
Fair value | |||||||
| Due in one year or less |
11.44 | % | $ | 3,882 | $ | 4,145 | |||
| Due from one year to five years |
5.48 | % | 68,954 | 71,716 | |||||
| Due from five to ten years |
4.71 | % | 126,635 | 132,081 | |||||
| Due after ten years |
4.76 | % | 871,489 | 898,061 | |||||
| 4.83 | % | $ | 1,070,960 | $ | 1,106,003 | ||||
For purposes of the maturity table, mortgage-backed securities, which are not due at a single maturity date, have been allocated over maturity groupings based on weighted-average contractual maturities of underlying collateral. The mortgage-backed securities may mature earlier than their weighted-average contractual maturities because of principal prepayments.
Securities, with carrying values of $80.9 million and $106.9 million as of December 31, 2009 and 2008, respectively, were pledged to secure public deposits and for other purposes required or permitted by law.
| ESB Financial Corporation | 44 | 2009 Annual Report |
Table of Contents
Notes to Consolidated Financial Statements (continued)
| 3. | Loans Receivable |
The following table summarizes the Company’s loans receivable as of December 31:
| (Dollar amounts in thousands) | 2009 | 2008 | ||||||||
| Mortgage loans: |
||||||||||
| Residential - single family |
$ | 329,984 | $ | 353,658 | ||||||
| Residential - multi family |
37,664 | 33,680 | ||||||||
| Commercial real estate |
84,409 | 76,633 | ||||||||
| Construction |
51,109 | 55,979 | ||||||||
| Subtotal mortgage loans |
503,166 | 519,950 | ||||||||
| Other loans: |
||||||||||
| Consumer loans: |
||||||||||
| Home equity loans |
73,195 | 71,271 | ||||||||
| Dealer auto and RV loans |
56,876 | 60,896 | ||||||||
| Other loans |
10,421 | 10,656 | ||||||||
| Commercial business |
43,377 | 44,508 | ||||||||
| Subtotal other loans |
183,869 | 187,331 | ||||||||
| Total Loans Receivable |
687,035 | 707,281 | ||||||||
| Less: |
||||||||||
| Allowance for loan losses |
6,027 | 6,006 | ||||||||
| Deferred loan fees and net discounts |
(2,334 | ) | (2,825 | ) | ||||||
| Loans in process |
11,955 | 12,785 | ||||||||
| Net Loans Receivable |
$ | 671,387 | $ | 691,315 | ||||||
| Loans Held for Sale |
||||||||||
| Residential - single family |
$ | 201 | $ | - | ||||||
Non-performing loans, which include non-accrual loans and troubled debt restructuring, were $4.1 million and $2.5 million at December 31, 2009 and 2008, respectively.
For non-performing loans, the interest income that would have been recorded under the original terms of such loans and the interest income actually recognized for the years ended December 31 are summarized below:
| (Dollar amounts in thousands) | 2009 | 2008 | 2007 | ||||||
| Interest income that would have been recorded |
$ | 294 | $ | 207 | $ | 171 | |||
| Interest income recognized |
140 | 122 | 88 | ||||||
| Interest income foregone |
$ | 154 | $ | 85 | $ | 83 | |||
The Company is not committed to lend additional funds to debtors whose loans are on non-accrual status.
| ESB Financial Corporation | 45 | 2009 Annual Report |
Table of Contents
Notes to Consolidated Financial Statements (continued)
| 3. | Loans Receivable (continued) |
The following table is a summary of the loans considered to be impaired as of December 31:
| (Dollar amounts in thousands) | 2009 | 2008 | 2007 | ||||||
| Impaired loans with an allocated allowance |
$ | 790 | $ | 260 | $ | 419 | |||
| Impaired loans without an allocated allowance |
357 | 363 | 440 | ||||||
| Total impaired loans |
$ | 1,147 | $ | 623 | $ | 859 | |||
| Allocated allowance on impaired loans |
$ | 108 | $ | 33 | $ | 20 | |||
| Portion of impaired loans on non-accrual |
1,147 | 623 | 859 | ||||||
| Average impaired loans |
899 | 684 | 688 | ||||||
| Income recognized on impaired loans |
50 | 69 | 82 | ||||||
The following is a summary of the changes in the allowance for loan losses:
| (Dollar amounts in thousands) | ||||
| Totals | ||||
| Balance, January 1, 2007 |
$ | 5,113 | ||
| Provision for loan losses |
865 | |||
| Charge offs |
(841 | ) | ||
| Recoveries |
277 | |||
| Balance, December 31, 2007 |
5,414 | |||
| Provision for loan losses |
1,406 | |||
| Charge offs |
(996 | ) | ||
| Recoveries |
182 | |||
| Balance, December 31, 2008 |
6,006 | |||
| Provision for loan losses |
912 | |||
| Charge offs |
(1,019 | ) | ||
| Recoveries |
128 | |||
| Balance, December 31, 2009 |
$ | 6,027 | ||
Large groups of smaller balance homogenous loans that are collectively evaluated for impairment. The Company collectively reviews all residential real estate and consumer loans for impairment.
At December 31, 2009 and 2008, the Company conducted its business through 24 offices in Allegheny, Beaver, Butler and Lawrence counties, Pennsylvania which also serves as its primary lending area. Management does not believe it has significant concentrations of credit risk to any one group of borrowers given its underwriting and collateral requirements.
| 4. | Investment Required by Regulation |
The Company’s subsidiary bank is a member of the FHLB System. As a member, the Bank maintains an investment in the capital stock of the FHLB of Pittsburgh, at cost, in an amount not less than 1.0% of the unpaid principal balances of residential mortgage loans, 0.3% of total assets or approximately 5.0% of outstanding advances, if any due to the FHLB, whichever is greater, as calculated periodically by the FHLB. Purchases and redemptions of FHLB stock are made directly with the FHLB at par. The FHLB Bank of Pittsburgh has currently restricted future redemptions of its stock; therefore the investment could be greater than 5.0%.
| ESB Financial Corporation | 46 | 2009 Annual Report |
Table of Contents
Notes to Consolidated Financial Statements (continued)
| 5. | Premises and Equipment |
Premises and equipment at December 31 are summarized by major classification as follows:
| (Dollar amounts in thousands) | 2009 | 2008 | ||||
| Land |
$ | 3,236 | $ | 2,880 | ||
| Buildings and improvements |
17,666 | 16,285 | ||||
| Leasehold improvements |
835 | 835 | ||||
| Furniture, fixtures and equipment |
7,996 | 9,318 | ||||
| 29,733 | 29,318 | |||||
| Less accumulated depreciation and amortization |
16,690 | 17,661 | ||||
| $ | 13,043 | $ | 11,657 | |||
Depreciation expense for the years December 31, 2009, 2008 and 2007 were $902,000, $946,000 and $1.0 million, respectively.
The Company is obligated under non-cancelable long term operating lease agreements for certain branch offices. These lease agreements, each having renewal options and none expiring later than 2019, have approximate aggregate rentals of $109,916, $45,253, $45,253, $45,253, $47,139 and $228,150 for the years ended December 31, 2010, 2011, 2012, 2013, 2014 and thereafter, respectively. Rent expense for the years ended December 31, 2009, 2008 and 2007 was $126,000, $119,000 and $131,000, respectively.
| ESB Financial Corporation | 47 | 2009 Annual Report |
Table of Contents
Notes to Consolidated Financial Statements (continued)
| 6. | Deposits |
The following table summarizes the Company’s deposits as of December 31:
| (Dollar amounts in thousands) | 2009 | 2008 | ||||||||
| Type of accounts | Amount | % | Amount | % | ||||||
| Noninterest-bearing deposits |
$ | 68,404 | 7.2% | $ | 65,726 | 7.5% | ||||
| NOW account deposits |
110,379 | 11.8% | 105,235 | 12.0% | ||||||
| Money Market deposits |
32,256 | 3.4% | 26,876 | 3.0% | ||||||
| Passbook account deposits |
119,556 | 12.7% | 104,109 | 11.9% | ||||||
| Time deposits |
613,752 | 64.9% | 575,383 | 65.6% | ||||||
| $ | 944,347 | 100.0% | $ | 877,329 | 100.0% | |||||
| Time deposits mature as follows: |
||||||||||
| Within one year |
$ | 410,882 | 66.9% | $ | 399,167 | 69.4% | ||||
| After one year through two years |
120,073 | 19.6% | 90,832 | 15.8% | ||||||
| After two years through three years |
43,791 | 7.1% | 75,145 | 13.1% | ||||||
| After three years through four years |
6,953 | 1.1% | 2,364 | 0.4% | ||||||
| After four years through five years |
29,181 | 4.8% | 6,461 | 1.1% | ||||||
| Thereafter |
2,872 | 0.5% | 1,414 | 0.2% | ||||||
| $ | 613,752 | 100.0% | $ | 575,383 | 100.0% | |||||
The Company had a total of $193.7 million and $179.5 million in time deposits of $100,000 or more at December 31, 2009 and 2008, respectively.
Interest expense by type of deposit account for the year ended December 31 is as follows:
| (Dollar amounts in thousands) | 2009 | 2008 | 2007 | ||||||
| NOW account deposits |
$ | 296 | $ | 796 | $ | 1,235 | |||
| Money Market deposits |
122 | 133 | 128 | ||||||
| Passbook account deposits |
343 | 421 | 417 | ||||||
| Time deposits |
17,035 | 21,058 | 25,926 | ||||||
| $ | 17,796 | $ | 22,408 | $ | 27,706 | ||||
| ESB Financial Corporation | 48 | 2009 Annual Report |
Table of Contents
Notes to Consolidated Financial Statements (continued)
| 7. | Borrowed Funds |
Borrowed funds, which include FHLB advances, repurchase agreements, ESOP borrowings, corporate borrowings and treasury tax and loan notes payable, as of December 31 are summarized as follows:
| (Dollar amounts in thousands) | 2009 | 2008 | ||||||||
| Weighted average rate |
Amount | Weighted average rate |
Amount | |||||||
| FHLB advances: |
||||||||||
| Due within 12 months |
4.61% | $ | 180,400 | 4.82% | $ | 249,750 | ||||
| Due beyond 12 months but within 2 years |
2.87% | 71,866 | 4.98% | 165,000 | ||||||
| Due beyond 2 years but within 3 years |
2.80% | 30,684 | 3.32% | 51,866 | ||||||
| Due beyond 3 years but within 4 years |
3.71% | 69,027 | 3.59% | 10,000 | ||||||
| Due beyond 4 years but within 5 years |
3.24% | 47,876 | 3.83% | 29,027 | ||||||
| Due beyond 5 years |
3.86% | 20,569 | 3.85% | 20,041 | ||||||
| $ | 420,422 | $ | 525,684 | |||||||
| Repurchase agreements: |
||||||||||
| Due within 12 months |
2.02% | $ | 28,000 | 4.55% | $ | 72,500 | ||||
| Due beyond 12 months but within 2 years |
2.65% | 20,000 | 5.02% | 10,000 | ||||||
| Due beyond 2 years but within 3 years |
3.74% | 75,000 | 3.56% | 10,000 | ||||||
| Due beyond 3 years but within 4 years |
3.34% | 120,000 | 3.74% | 75,000 | ||||||
| Due beyond 4 years but within 5 years |
2.86% | 20,000 | 3.47% | 90,000 | ||||||
| Due beyond 5 years |
4.38% | 80,000 | 4.38% | 80,000 | ||||||
| $ | 343,000 | $ | 337,500 | |||||||
| Other borrowings: |
||||||||||
| ESOP borrowings |
||||||||||
| Due within 12 months |
4.25% | $ | 945 | 5.25% | $ | 945 | ||||
| Due beyond 12 months but within 2 years |
- | - | 4.75% | 945 | ||||||
| $ | 945 | $ | 1,890 | |||||||
| Corporate borrowings |
||||||||||
| Due within 12 months |
6.30% | $ | 1,400 | 6.30% | $ | 1,400 | ||||
| Due beyond 12 months but within 2 years |
6.30% | 1,400 | 6.30% | 1,400 | ||||||
| Due beyond 2 years but within 3 years |
6.30% | 1,400 | 6.30% | 1,400 | ||||||
| Due beyond 3 years but within 4 years |
6.30% | 1,400 | 6.30% | 1,400 | ||||||
| Due beyond 4 years but within 5 years |
6.30% | 1,400 | 6.30% | 1,400 | ||||||
| Due beyond 5 years |
6.30% | 5,600 | 6.30% | 7,000 | ||||||
| $ | 12,600 | $ | 14,000 | |||||||
| Treasury tax and loan note payable |
||||||||||
| Due within 12 months |
- | $ | 135 | - | $ | 203 | ||||
| Borrowings for joint ventures |
||||||||||
| Due beyond 2 years but within 3 years |
3.75% | 6,146 | 3.75% | 7,231 | ||||||
| Junior subordinated notes |
||||||||||
| Due beyond 5 years |
5.44% | 46,393 | 5.94% | 46,393 | ||||||
| ESB Financial Corporation | 49 | 2009 Annual Report |
Table of Contents
Notes to Consolidated Financial Statements (continued)
| 7. | Borrowed Funds (continued) |
Included in the $420.4 million of FHLB advances at December 31, 2009 is approximately $20.0 million of convertible select advances. These advances reset to the three month LIBOR index and have various spreads and call dates. At the reset date, if the three month LIBOR plus the spread is lower than the contract rate on the advance, the advance will remain at the contracted rate. The FHLB has the right to call these convertible select advances on the call date or quarterly thereafter. Also included in the $420.4 million of FHLB advances is $20.0 million in structured advances in which the rate is fixed for four years, and after four years on a specified date, the FHLB has the one time right (European Call) to call the advance. If the FHLB does not call these advances on the specified date, the rate remains the same for the remaining term. Should these advances be called, the Company has the right to pay off the advances without penalty. Also included in the $420.4 million of FHLB advances is $50.0 million in structured advances with imbedded caps at various strike rates based on the 3 month LIBOR rate. If during the term of the advance, the 3 month LIBOR rate exceeds the strike rate, the interest rate on the structured advance is reduced by the difference between the rate and the strike rate.
Included in the $343.0 million of repurchase agreements (REPOs) are $60.0 million in structured REPOs with imbedded caps at various strike rates based on the 3 month LIBOR rate. The terms and conditions of these structured REPOs are that the rate is fixed for three years and after 3 years, on a specified date the counterparty has the one time right (European Call) to call the REPO. If the counterparty does not call the REPO on the specified date, the rate remains the same for the remaining two years. These structured REPOs also include an imbedded cap for the first three year period with a strike rate to the 3 month LIBOR rate. If during the first three years, the 3 month LIBOR rate exceeds the strike rate, the interest rate on the structured REPO is reduced by the difference between the rate and the strike rate. In addition, the Company has $25.0 million in structured REPOs with double, or $50.0 million notional amount of imbedded caps, at a strike rate of 3.75% based on the 3 month LIBOR rate. The terms and conditions of these structured REPOs are that the rate is fixed for five years and after 5 years, on a specified date the counterparty has the one time right (European Call) to call the REPO. If the counterparty does not call the REPO on the specified date, the rate remains the same for the remaining five years. These structured REPOs also include a double imbedded cap for the first five year period with a strike rate to the 3 month LIBOR rate. If during the first five years, the 3 month LIBOR rate exceeds the strike rate, the interest rate on the structured REPO is reduced by two times the difference between the rate and the strike rate. At no point shall the interest rate on these structured REPOs with imbedded caps be less than zero.
Also included in the $343.0 million of REPOs is a $25.0 million structured REPO in which the Company pays a fixed rate of interest. At the reset date and every quarterly period thereafter, the counterparty has the right to terminate the transaction. Also included in the $343.0 million of REPOs are $30.0 million in structured REPOs in which the rate is fixed for four years, and after four years on a specified date, the counterparty has the one time right (European Call) to call the REPO. If the counterparty does not call the REPO on the specified date, the rate remains the same for the remaining term. It has historically been the Company’s position to pay off any borrowings and replace them with fixed rate funding if converted by the counterparty.
FHLB advances are secured by FHLB stock, qualifying residential mortgage loans and mortgage-backed securities to the extent that the fair value of such pledged collateral must be at least equal to the advances outstanding. At December 31, 2009, the Company had a maximum borrowing capacity with the FHLB of $539.6 million, with $119.2 million available for use.
The Company enters into sales of securities under agreements to repurchase. Such repurchase agreements are treated as borrowed funds. The dollar amount of the securities underlying the agreements remain in their respective asset accounts.
| ESB Financial Corporation | 50 | 2009 Annual Report |
Table of Contents
Notes to Consolidated Financial Statements (continued)
| 7. | Borrowed Funds (continued) |
Repurchase agreements are collateralized by various securities that are either held in safekeeping at the FHLB or delivered to the dealer who arranged the transaction, and the Company maintains control of these securities.
The market value of such securities exceeded the amortized cost of the securities sold under agreements to repurchase. The market value of the securities as of December 31, 2009 was $394.6 million with an amortized cost of $374.0 million. The market value of the securities as of December 31, 2008 was $399.6 million with an amortized cost of $388.7 million. The average maturity date of the mortgage backed securities sold under agreements to repurchase was greater than 90 days for the year ended December 31, 2009 and 2008.
As of both December 31, 2009 and 2008, the Company had repurchase agreements outstanding with Citigroup of $165.0 million. As of both December 31, 2009 and 2008, the Company had repurchase agreements outstanding with Barclays Capital of $70.0 million. As of December 31, 2009 and 2008, the Company had repurchase agreements outstanding with Credit Suisse of $103.0 million and $97.5 million, respectively. As of both December 31, 2009 and 2008, the Company had repurchase agreements outstanding with PNC of $5.0 million.
As of December 31, 2009, the Company had repurchase agreements with Citigroup with $20.7 million at risk (where the market value of the securities exceeds the borrowing), with a weighted average maturity of 45 months, repurchase agreements with Barclays Capital with $11.9 million at risk with a weighted average maturity of 58 months, repurchase agreements with Credit Suisse with $17.9 million at risk with a weighted average maturity of 46 months and repurchase agreements with PNC with $1.0 million at risk with a weighted average maturity of 27 months.
Borrowings under repurchase agreements averaged $344.4 million, $273.3 million and $188.3 million during 2009, 2008 and 2007, respectively. The maximum amount outstanding at any month-end was $366.0 million, $337.5 million and $202.0 million during 2009, 2008 and 2007, respectively.
The Company, through ESB, has an agreement with the Federal Reserve Bank of Cleveland whereby ESB is an authorized treasury tax loan depository. Under the terms of the note agreement, funds deposited to the Company’s treasury tax and loan account (limited to $150,000 per deposit) accrue interest at a rate of 0.25% below the overnight federal funds rate.
On April 10, 2003, ESB Capital Trust II (Trust II), a statutory business trust established under Delaware law that is a subsidiary of the Company, issued $10.0 million variable rate preferred securities with a stated value and liquidation preference of $1,000 per share. The Company purchased $310,000 of common securities of Trust II. The preferred securities reset quarterly to equal the three month LIBOR index plus 3.25%. Trust II’s obligations under the preferred securities issued are fully and unconditionally guaranteed by the Company. The proceeds from the sale of the preferred securities and the common securities were utilized by the Trust II to invest in $10.3 million of variable rate subordinated debt of the Company. The subordinated debt is unsecured and ranks subordinate and junior in right of payment to all indebtedness, liabilities and obligations of the Company. The subordinated debt primarily represents the sole assets of the Trust II. Interest on the preferred securities is cumulative and payable quarterly in arrears. The Company has the right to optionally redeem the Subordinated Debt prior to the maturity date of April 24, 2033, on or after April 24, 2008, at the redemption price, plus accrued and unpaid distributions, if any, at the redemption date. Under the occurrence of certain events, specifically, a tax event, investment company event or capital treatment event as more fully defined in the Indenture dated April 10, 2003, the Company may redeem in whole, but not in part, the subordinated debt at any time within 90 days following the occurrence of such event. Proceeds from any redemption of the subordinated debt would cause a mandatory redemption of the preferred securities and the common securities
| ESB Financial Corporation | 51 | 2009 Annual Report |
Table of Contents
Notes to Consolidated Financial Statements (continued)
| 7. | Borrowed Funds (continued) |
having an aggregate liquidation amount equal to the principal amount of the subordinated debt redeemed. The Company had no unamortized deferred debt issuance costs associated with the preferred securities at December 31, 2009 and 2008. On July 23, 2008 the Company redeemed $5.0 million of the preferred securities of ESB Capital Trust II with proceeds from a $14.0 million loan with First Tennessee Bank, National Association (“First Tennessee”), with a fixed interest rate of 6.30%. The remainder of the First Tennessee loan was used to repay an existing loan with First Tennessee with a remaining balance of $9.0 million, which had an interest rate of 5.55% and was due on December 31, 2008.
On December 17, 2003, ESB Statutory Trust (Trust III), a statutory business trust established under Delaware law that is a subsidiary of the Company, issued $5.0 million variable rate preferred securities with a stated value and liquidation preference of $1,000 per share. The Company purchased $155,000 of common securities of Trust III. The preferred securities reset quarterly to equal the three month LIBOR Index plus 2.95%. Trust III’s obligations under the preferred securities issued are fully and unconditionally guaranteed by the Company. The proceeds from the sale of the preferred securities and the common securities were utilized by Trust III to invest in $5.2 million of variable rate subordinated debt of the Company. The subordinated debt is unsecured and ranks subordinate and junior in right of payment to all indebtedness, liabilities and obligations of the Company. The subordinated debt primarily represents the sole assets of Trust III. Interest on the preferred securities is cumulative and payable quarterly in arrears. The Company has the right to optionally redeem the subordinated debt prior to the maturity date of December 17, 2033, on or after December 17, 2008, at the redemption price, plus accrued and unpaid distributions, if any, at the redemption date. Under the occurrence of certain events, specifically, a tax event, investment company event or capital treatment event as more fully defined in the Indenture dated December 17, 2003, the Company may redeem in whole, but not in part, the subordinated debt at any time within 90 days following the occurrence of such event. Proceeds from any redemption of the subordinated debt would cause a mandatory redemption of the preferred securities and the common securities having an aggregate liquidation amount equal to the principal amount of the subordinated debt redeemed. There were no unamortized deferred debt issuance costs associated with the preferred securities at December 31, 2009 and 2008.
On February 10, 2005, ESB Capital Trust IV (Trust IV), a statutory business trust established under Delaware law that is a subsidiary of the Company, issued $35.0 million fixed/variable rate preferred securities. The Company purchased $1.1 million of common securities of Trust IV. The preferred securities are fixed at a rate of 6.03% for six years and then are variable with a quarterly reset equal to the three month LIBOR index plus 1.82%. The preferred securities have a stated maturity of thirty years. Trust IV’s obligations under the preferred securities issued are fully and unconditionally guaranteed by the Company. The proceeds from the sale of the preferred securities and the common securities were utilized by Trust IV to invest in $36.1 million of fixed/variable rate subordinated debt of the Company. The subordinated debt is unsecured and ranks subordinate and junior in right of payment to all indebtedness, liabilities and obligations of the Company. The subordinated debt primarily represents the sole assets of Trust IV. Interest on the preferred securities is cumulative and payable quarterly in arrears. The Company has the right to optionally redeem the subordinated debt prior to the maturity date of February 10, 2035, on or after February 10, 2011, at the redemption price, which is equal to the liquidation amount, plus accrued and unpaid distributions, if any, at the redemption date. Under the occurrence of certain events, specifically, a tax event, investment company event or capital treatment event as more fully defined in the Indenture dated February 10, 2005, the Company may redeem in whole, but not in part, the subordinated debt at any time within 90 days following the occurrence of such event. Proceeds from any redemption of the subordinated debt would cause a mandatory redemption of the preferred securities and the common securities having an aggregate liquidation amount equal to the principal amount of the subordinated debt redeemed. The issuance of these preferred securities did not have any deferred debt issuance costs associated with it.
| ESB Financial Corporation | 52 | 2009 Annual Report |
Table of Contents
Notes to Consolidated Financial Statements (continued)
| 8. | Income Taxes |
The provision for income taxes for the years ended December 31, is comprised of the following:
| (Dollar amounts in thousands) | 2009 | 2008 | 2007 | |||||||||
| Current expense: |
||||||||||||
| Federal |
$ | 3,442 | $ | 2,559 | $ | 1,738 | ||||||
| State |
41 | (40 | ) | 42 | ||||||||
| 3,483 | 2,519 | 1,780 | ||||||||||
| Deferred benefit: |
||||||||||||
| Federal |
(1,026 | ) | (971 | ) | (1,380 | ) | ||||||
| State |
(75 | ) | - | - | ||||||||
| $ | 2,382 | $ | 1,548 | $ | 400 | |||||||
In addition to income taxes applicable to income before taxes in the consolidated statements of operations, the following income tax amounts were recorded to stockholders’ equity during the years ended December 31:
| (Dollar amounts in thousands) | 2009 | 2008 | 2007 | |||||||||
| Net gain on securities available for sale |
$ | (8,307 | ) | $ | (3,166 | ) | $ | (3,099 | ) | |||
| Compensation expense for tax purposes in excess of amounts recognized for financial statement purposes |
166 | 20 | 97 | |||||||||
| $ | (8,141 | ) | $ | (3,146 | ) | $ | (3,002 | ) | ||||
| ESB Financial Corporation | 53 | 2009 Annual Report |
Table of Contents
Notes to Consolidated Financial Statements (continued)
| 8. | Income Taxes (continued) |
The tax effects of temporary differences between the financial reporting basis and income tax basis of assets and liabilities that are included in the net deferred tax asset as of December 31 relate to the following:
| (Dollar amounts in thousands) | 2009 | 2008 | |||||
| Deferred tax assets: |
|||||||
| Allowances for losses on loans and real estate owned |
$ | 2,049 | $ | 2,042 | |||
| General business credit |
1,705 | 1,999 | |||||
| Minimum tax credit carry forward |
3,880 | 3,880 | |||||
| Writedown of debt |
725 | 349 | |||||
| Real estate acquired through foreclosure, net |
70 | 65 | |||||
| State net operating loss carryover |
446 | 235 | |||||
| Defined benefit plans |
359 | 326 | |||||
| Mortgage servicing rights |
3 | - | |||||
| Other |
1,783 | 1,099 | |||||
| Total gross deferred tax assets |
11,020 | 9,995 | |||||
| Less valuation allowance |
136 | - | |||||
| Deferred tax assets after valuation allowance |
10,884 | 9,995 | |||||
| Deferred tax liabilities: |
|||||||
| Investment in securities available for sale |
11,960 | 3,653 | |||||
| Accretion of discounts |
44 | 27 | |||||
| Core deposit intangible |
437 | 605 | |||||
| Purchase price adjustments |
168 | 218 | |||||
| Mortgage servicing rights |
- | 2 | |||||
| Other |
265 | 232 | |||||
| Gross deferred tax liabilities |
12,874 | 4,737 | |||||
| Net deferred tax (liability) asset |
$ | (1,990 | ) | $ | 5,258 | ||
As of December 31, 2009 and 2008, the Company determined that it was not required to establish a valuation allowance for federal deferred tax assets since it is more likely than not that the deferred tax asset will be realized through carry-back to taxable income in prior years, future reversals of existing taxable temporary differences and, to a lesser extent, future taxable income.
The general business credit of $1.7 million will be available to reduce future federal income tax up to the year 2028. The alternative minimum tax credit of $3.9 million is available to reduce future regular income taxes over an indefinite period.
A portion of the deferred tax assets relating to the federal and state net operating loss carryforwards were recorded as part of the purchase price allocation of the acquisition of PHSB Financial Corporation and its wholly owned subsidiary Peoples Home Savings Bank during 2005. The state net operating loss carryforward of $3.6 million expires in 2024. These net operating losses were generated by Peoples Home Savings Bank and PHSB Financial Corporation in their final tax returns. During 2009, the Company created an additional state deferred tax asset relating to write-downs taken at the Company’s joint venture projects. The Company did establish a partial valuation allowance of approximately $136,000 for this asset since it is more likely than not that a portion of the deferred tax asset will not be realized through future taxable income. At December 31, 2008, the Company did not establish a valuation allowance for state deferred tax assets.
| ESB Financial Corporation | 54 | 2009 Annual Report |
Table of Contents
Notes to Consolidated Financial Statements (continued)
| 8. | Income Taxes (continued) |
A reconciliation between the provision for income taxes and the amount computed by multiplying operating results before income taxes by the statutory federal income tax rate of 34% for the years ended December 31 is as follows:
| 2009 | 2008 | 2007 | ||||
| Tax at statutory rate |
34.0% | 34.0% | 34.0% | |||
| (Decrease) increase resulting from: |
||||||
| Tax free income, net of interest disallowance |
(12.8%) | (13.6%) | (20.0%) | |||
| State income taxes, net of Federal income tax benefit |
0.2% | (0.2%) | 0.3% | |||
| Earnings of BOLI |
(2.1%) | (3.3%) | (4.7%) | |||
| Other, net |
(2.8%) | (3.7%) | (4.6%) | |||
| Effective rate |
16.5% | 13.2% | 5.0% | |||
The Company and its subsidiaries file a consolidated federal income tax return. Prior to 1996, the Bank was permitted under the Internal Revenue Code to deduct an annual addition to a reserve for bad debts in determining taxable income, subject to certain limitations. Subsequent to 1995, the Bank’s bad debt deduction is based on actual net charge-offs. Bad debt deductions for income tax purposes are included in taxable income of later years only if the Bank’s base year bad debt reserve is used subsequently for purposes other than to absorb bad debt losses. Because the Bank does not intend to use the reserve for purposes other than to absorb losses, no deferred income taxes have been provided prior to 1987. Retained earnings at December 31, 2008 (the most recent date for which a tax return has been filed) include approximately $17.7 million, representing such bad debt deductions for which no deferred income taxes have been provided.
The Company prescribes a recognition threshold and a measurement attribute for the financial statement recognition and measurement of a tax position taken or expected to be taken in a tax return. Benefits from tax positions should be recognized in the financial statements only when it is more likely than not that the tax position will be sustained upon examination by the appropriate taxing authority that would have full knowledge of all relevant information. A tax position that meets the more-likely-than-not recognition threshold is measured at the largest amount of benefit that is greater than fifty percent likely of being realized upon ultimate settlement. Tax positions that previously failed to meet the more-likely-than-not recognition threshold should be recognized in the first subsequent financial reporting period in which that threshold is met. Previously recognized tax positions that no longer meet the more-likely-than-not recognition threshold should be derecognized in the first subsequent financial reporting period in which that threshold is no longer met. Guidance is also provided on the accounting for and disclosure of unrecognized tax benefits, interest and penalties.
| 9. | Employee Benefit Plans |
Retirement Savings Plan
The Company has a defined contribution employee retirement plan for the benefit of substantially all employees. The plan provides for regular employer payments that match each participating employee’s contribution to their individual tax-deferred retirement account. Employees can contribute up to 100% of their compensation, less required deductions, to the plan, and the Company matches 100% of the first 1% and 50% of the remaining 2% through 6% of employee contributions in stock of the Company. The Company contributed $268,000, $243,000 and $248,000 to the plan during 2009, 2008 and 2007, respectively.
| ESB Financial Corporation | 55 | 2009 Annual Report |
Table of Contents
Notes to Consolidated Financial Statements (continued)
| 9. | Employee Benefit Plans (continued) |
Employee Stock Ownership Plan
The Company has a tax qualified Employee Stock Ownership Plan (ESOP) for the benefit of its employees. Employees begin to participate in the plan January 1 of the year following their date of hire. Participants become 25% vested in their accounts after two years of service, 50% after three years of service, 75% after four years of service and 100% after five years of service or, if earlier, upon death, disability or attainment of normal retirement age.
The purchase of shares of the Company’s stock by the ESOP is funded by a loan and contributions from the Company, through the Bank. Unreleased ESOP shares collateralize the loan payable, and the cost of these shares is recorded as a contra-equity account in stockholders’ equity of the Company. The ESOP’s loan payable bears a weighted-average interest rate of 4.25% and matures in 2010. Shares released as debt payments are made by the ESOP to the loan. The ESOP’s sources of repayment of the loans can include dividends, if any, on the unallocated stock held by the ESOP and discretionary contributions from the Company to the ESOP and earnings thereon.
Dividends received on unallocated ESOP shares during 2009, 2008 and 2007 amounted to $53,241, $85,712 and $119,697, respectively. All of the unallocated dividends were used for debt service on the loan. The Company contributed $1.1 million, $1.1 million and $1.0 million for the years ended December 31, 2009, 2008 and 2007, respectively. The ESOP incurred interest on the loan of $81,000, $130,000, and $180,000 for the years ended December 31, 2009, 2008 and 2007, respectively.
Compensation is recognized under the shares released method and compensation expense is equal to the fair value of the shares committed to be released and unallocated ESOP shares are excluded from outstanding shares for purposes of computing EPS.
During 2009, 2008 and 2007, the Company recognized compensation expense related to the ESOP of $1.1 million, $900,000 and $915,000, respectively.
As of December 31, 2009 and 2008, the ESOP held a total of 1,652,893 and 1,632,179 shares, respectively, of the Company’s stock, and there were 74,349 and 152,687 unallocated shares, respectively, with a fair value of $983,000 and $1.6 million, respectively. During 2009 and 2008, 78,338 and 82,122 shares were released for allocation, respectively. During 2009 and 2008, 11,662 and 7,878 additional shares were purchased by the Company to be released for allocation at a cost of $123,000 and $76,000, respectively. These amounts were included in the Company’s compensation expense related to the ESOP.
| ESB Financial Corporation | 56 | 2009 Annual Report |
Table of Contents
Notes to Consolidated Financial Statements (continued)
| 9. | Employee Benefit Plans (continued) |
Stock Option Plans
The Company maintains various stock option plans (Option Plans), which provide for the grant of stock options to directors, officers and other key employees. The Option Plans provide for the grant of both incentive stock options and compensatory stock options. Stock options are granted at an exercise price equal to the market price at the date of grant, the options vest over a specified time and are exercisable on the date they vest and have a maximum term of ten years. These terms are discretionary. Stock option activities under the Option Plans for the years ended December 31 are as follows:
| 2009 | 2008 | 2007 | ||||||||||||||||
| Options | Weighted Average Exercise Price/Share |
Options | Weighted Average Exercise Price/Share |
Options | Weighted Average Exercise Price/Share | |||||||||||||
| Outstanding at beginning of year |
891,002 | $ | 10.45 | 948,150 | $ | 10.21 | 945,104 | $ | 9.89 | |||||||||
| Granted |
124,730 | 11.54 | 91,030 | 10.30 | 95,150 | 10.11 | ||||||||||||
| Exercised |
(145,628 | ) | 7.15 | (51,285 | ) | 6.82 | (63,193 | ) | 6.41 | |||||||||
| Forfeited |
(59,824 | ) | 7.26 | (96,893 | ) | 9.93 | (28,911 | ) | 7.61 | |||||||||
| Outstanding at end of year |
810,280 | 11.45 | 891,002 | 10.45 | 948,150 | 10.21 | ||||||||||||
| Exercisable at end of year |
552,448 | $ | 11.75 | 730,596 | $ | 10.47 | 815,342 | $ | 10.19 | |||||||||
The weighted-average fair values of options granted during 2009, 2008 and 2007 utilizing the Black-Scholes Valuation Model were $2.70, $2.78 and $2.69, respectively.
The following table summarizes certain characteristics of issued stock options as of December 31, 2009:
| Year Issued | Options Outstanding |
Exercise Price |
Average Remaining Contractual Life (in years) | ||||
| 2000 |
25,637 | $ | 6.01 | 0.4 | |||
| 2001 |
48,903 | 7.83 | 1.9 | ||||
| 2002 |
85,476 | 10.83 | 2.9 | ||||
| 2003 |
80,310 | 15.35 | 3.9 | ||||
| 2004 |
84,040 | 14.50 | 4.9 | ||||
| 2005 |
76,650 | 12.20 | 5.3 | ||||
| 2005 |
15,120 | 12.40 | 5.3 | ||||
| 2006 |
88,752 | 10.75 | 6.9 | ||||
| 2007 |
90,358 | 10.11 | 7.9 | ||||
| 2008 |
90,304 | 10.30 | 8.9 | ||||
| 2009 |
124,730 | 11.54 | 9.9 | ||||
| 810,280 | $ | 11.45 | 6.1 | ||||
| ESB Financial Corporation | 57 | 2009 Annual Report |
Table of Contents
Notes to Consolidated Financial Statements (continued)
| 9. | Employee Benefit Plans (continued) |
Management Recognition Plan
In connection with previous acquisitions, the Company acquired shares of stock held in trust for potential future distribution to management and key employees for compensation purposes. As of December 31, 2009, there were 12,498 shares held in the Management Recognition Plan (MRP) trust.
In November 2001, the Company awarded 13,000 shares to eligible individuals, 2,600 shares vested on the date of the grant. The remaining 10,400 shares vested over a four year period ending in 2005. This grant was adjusted for two 20% stock splits that occurred on October 25, 2002 and May 15, 2003.
In May 2004, the Company awarded 31,450 shares to eligible individuals, 4,820 shares vested on the date of the grant, 20,380 shares subsequently vested and 2,380 shares have been forfeited and the remaining 8,530 shares will vest over a scheduled vesting period ending in 2011.
In May 2005, the Company awarded 700 shares to eligible individuals, 75 shares vested on the date of the grant, 360 shares subsequently vested and the remaining 265 shares will vest over a scheduled vesting period ending in 2011.
Compensation expense recognized in 2009, 2008 and 2007 was $35,000, $37,000 and $50,000, respectively. The Company is expected to recognize compensation expense of $35,000 and $15,000 for the years 2010 and 2011, respectively.
The following is a summary of the changes in the stock for the MRP during the year ended December 31, 2009:
| Shares | |||
| Nonvested restricted stock as of January 1, 2008 |
12,875 | ||
| Granted |
- | ||
| Vested |
(3,600 | ) | |
| Forfeited and expired |
(1,000 | ) | |
| Nonvested restricted stock as of December 31, 2008 |
8,275 | ||
| Granted |
- | ||
| Vested |
(2,760 | ) | |
| Forfeited |
- | ||
| Nonvested restricted stock as of December 31, 2009 |
5,515 | ||
Excess Benefit Plan
The Company has adopted an excess benefit plan for the purpose of permitting an executive officer, and any other employees of the Company who may be designated pursuant to the plan, to receive certain benefits that the executive officer and any other employees of the Company otherwise would be eligible to receive under the Company’s retirement and profit sharing plan and ESOP but for the limitations set forth in Section 401(a)(17), 402(g) and 415 of the Internal Revenue Code of 1986, as amended (the “Code”). Pursuant to the excess benefit plan, during any plan year the Company shall make matching contributions on behalf of the participant in an amount equal to the amount of matching contributions that would have been made by the Company on behalf of the participant but for limitations in the Code, less the actual amount of matching contributions actually made by the Company on behalf of the participant. Finally, the excess benefit plan generally provides that during any plan year a participant shall receive a supplemental ESOP allocation in an amount equal to the amount which would have been allocated to the participant but for
| ESB Financial Corporation | 58 | 2009 Annual Report |
Table of Contents
Notes to Consolidated Financial Statements (continued)
| 9. | Employee Benefit Plans (continued) |
limitations in the Code, less the amount actually allocated to the participant pursuant to the ESOP. The supplemental benefits to be received by a participant pursuant to the excess benefit plan shall be credited to an account maintained pursuant to the plan within 180 days after the end of each plan year. In connection with its adoption of the excess benefit plan, the Company established a trust which currently holds 50,451 shares of common stock to fund its obligation under the excess benefit plan.
Supplemental Executive Retirement Plan and Directors’ Retirement Plan
The Company has adopted a Supplemental Executive Benefit Plan (SERP) in order to provide supplemental retirement and death benefits for certain key employees of the Company. Under the SERP, participants shall receive an annual retirement benefit following retirement at age 65 equal to 25% of the participant’s final average pay multiplied by a target retirement benefit percentage. Final average pay is based upon the participant’s last three year’s compensation and the target benefit percentage is equal to the fraction resulting from the participant’s years of credited service divided by 20, this targeted percentage is capped at 100%. Benefits under the plan are payable in ten equal annual payments and a lesser benefit is payable upon early retirement at age 50 with at least twelve years of service. If a participant dies prior to retirement, the participant’s estate will receive a lump sum payment equal to the net present value of future benefit payments under the plan. At December 31, 2009, the participants in the plan had credited service under the SERP ranging from 19 to 31 years.
The Company and the Bank have adopted the ESB Financial Corporation Directors’ Retirement Plan and entered into director retirement agreements with each director of the Company and the Bank. The plan provides that any retiring director with a minimum of five or more years of service with the Company or the Bank and a minimum of 10 total years of service, including years of service with any bank acquired by the Company or the Bank, that remains in continuous service as a board member until age 75 will be entitled to receive an annual retirement benefit equal to his or her director’s fees earned during the last full calendar year prior to his or her retirement date, multiplied by a ratio, ranging from 25% to 80%, based on the director’s total years of service. The maximum ratio of 80% of fees requires 20 or more years of service and the minimum ratio of 25% of fees requires 10 years of service. Retirement benefits may also be payable under the plan if a director retires from service as a director prior to attaining age 75. During 2009, four directors received monthly benefits under the plan.
| ESB Financial Corporation | 59 | 2009 Annual Report |
Table of Contents
Notes to Consolidated Financial Statements (continued)
| 9. | Employee Benefit Plans (continued) |
The following table sets forth the obligation and funded status as of December 31:
| (Dollar amounts in thousands) | Directors’ Retirement Plan | SERP | ||||||||||||||||
| December 31, | December 31, | |||||||||||||||||
| 2009 | 2008 | 2009 | 2008 | |||||||||||||||
| Change in benefit obligation |
||||||||||||||||||
| Benefit obligation at beginning of year |
$ | 865 | $ | 803 | $ | 1,946 | $ | 1,781 | ||||||||||
| Service Cost |
28 | 34 | 49 | 48 | ||||||||||||||
| Interest Cost |
46 | 45 | 105 | 102 | ||||||||||||||
| Amendments |
- | 22 | - | - | ||||||||||||||
| Actuarial (gains)/losses |
(8 | ) | (4 | ) | 264 | 60 | ||||||||||||
| Benefits paid |
(51 | ) | (35 | ) | (85 | ) | (45 | ) | ||||||||||
| Benefit obligation at end of year |
880 | 865 | 2,279 | 1,946 | ||||||||||||||
| Change in plan assets |
||||||||||||||||||
| Fair value of plan assets at beginning of year |
- | - | - | - | ||||||||||||||
| Employer contributions |
51 | 35 | 85 | 45 | ||||||||||||||
| Benefits paid |
(51 | ) | (35 | ) | (85 | ) | (45 | ) | ||||||||||
| Fair value of plan assets at end of year |
- | - | - | - | ||||||||||||||
| Funded Status |
$ | (880 | ) | $ | (865 | ) | $ | (2,279 | ) | $ | (1,946 | ) | ||||||
| Amounts recognized in accumulated other comprehensive income, net consist of: |
||||||||||||||||||
| Net loss |
$ | 18 | $ | 23 | $ | 353 | $ | 199 | ||||||||||
| Prior service cost |
137 | 194 | - | - | ||||||||||||||
| Transition obligation |
- | - | 190 | 217 | ||||||||||||||
| Total |
$ | 155 | $ | 217 | $ | 543 | $ | 416 | ||||||||||
The accumulated benefit obligation for the director’s retirement plan was $834 and $818 at December 31, 2009 and 2008, respectively and for the SERP was $2.0 million and $1.7 million at December 31, 2009 and 2008, respectively.
| ESB Financial Corporation | 60 | 2009 Annual Report |
Table of Contents
Notes to Consolidated Financial Statements (continued)
| 9. | Employee Benefit Plans (continued) |
The components of net periodic benefit cost and other amounts recognized in accumulated other comprehensive income are as follows:
| (Dollar amounts in thousands) | Directors’ Retirement Plan | SERP | ||||||||||||||||||||||||
| December 31, | December 31, | |||||||||||||||||||||||||
| 2009 | 2008 | 2007 | 2009 | 2008 | 2007 | |||||||||||||||||||||
| Net Periodic Pension Cost |
||||||||||||||||||||||||||
| Service cost |
$ | 28 | $ | 34 | $ | 7 | $ | 49 | $ | 48 | $ | 51 | ||||||||||||||
| Interest cost |
46 | 45 | 33 | 105 | 102 | 96 | ||||||||||||||||||||
| Amortization of transition obligation |
- | - | - | 41 | 65 | 58 | ||||||||||||||||||||
| Amortization of net loss |
- | - | - | 30 | - | - | ||||||||||||||||||||
| Amortization of prior service cost |
87 | 87 | 63 | - | - | - | ||||||||||||||||||||
| Net periodic pension cost |
161 | 166 | 103 | 225 | 215 | 205 | ||||||||||||||||||||
| Other changes in plan assets and benefit obligations recognized in accumulated other comprehensive income |
||||||||||||||||||||||||||
| Net actuarial loss/(gain) |
(5 | ) | 12 | 163 | 154 | 40 | 62 | |||||||||||||||||||
| Amortization of transition obligation |
- | - | - | (27 | ) | (43 | ) | (38 | ) | |||||||||||||||||
| Amortization of prior service cost |
(57 | ) | (57 | ) | (63 | ) | - | - | - | |||||||||||||||||
| Total recognized in other comprehensive income |
(62 | ) | (45 | ) | 100 | 127 | (3 | ) | 24 | |||||||||||||||||
| Total recognized in Net Periodic Benefit Cost and accumulated other comprehensive income |
$ | 99 | $ | 121 | $ | 203 | $ | 352 | $ | 212 | $ | 229 | ||||||||||||||
The estimated net loss and prior service cost for the SERP and director’s retirement plan plans that will be amortized from accumulated other comprehensive income into net periodic benefit cost over the next fiscal year are $64,262 and $57,384, respectively.
The weighted average assumptions used to determine benefit obligations and net periodic pension cost at the measurement dates were as follows:
| Directors’ Retirement Plan | SERP | |||||||||
| 2009 | 2008 | 2009 | 2008 | |||||||
| Discount rate |
5.50% | 5.50% | 5.50% | 5.50% | ||||||
| Rate of compensation increase |
2.50% | 4.00% | 4.00% | 4.00% | ||||||
At December 31, 2009 the projected benefit payments for the director’s retirement plan were $118,546 $145,516, $145,211, $119,222, $148,444 and $292,157 for years 2010, 2011, 2012, 2013, 2014 and thereafter, respectively. At December 31, 2009, the projected benefit payments for the SERP were $85,000, $85,000, $85,000, $85,000, $85,000 and $2.8 million for years 2010, 2011, 2012, 2013, 2014 and thereafter. The projected payments were calculated using the same assumptions as those used to calculate the benefit obligations listed above.
| ESB Financial Corporation | 61 | 2009 Annual Report |
Table of Contents
Notes to Consolidated Financial Statements (continued)
| 10. | Other Comprehensive Income (loss) |
The Company has developed the following table which includes the tax effects of the components of other comprehensive (loss) income. Other comprehensive (loss) income consists of net unrealized gain (loss) on securities available for sale and the net fair value adjustment on derivatives. Other comprehensive income and related tax effects for the years ended December 31 consists of:
| (Dollar amounts in thousands) | 2009 | 2008 | 2007 | |||||||||
| Net income before noncontrolling interest: |
$ | 11,665 | $ | 10,424 | $ | 8,267 | ||||||
| Other Comprehensive income (loss) - net of tax (benefit) expense |
||||||||||||
| Fair value adjustment on securities available for sale, net of tax expense of $8,180 in 2009, $2,875 in 2008 and $3,302 in 2007 |
15,878 | 5,581 | 6,409 | |||||||||
| Securities losses (gains) reclassified into earnings, net of tax benefit (expense) of $126 in 2009, $291 in 2008 and ($202) in 2007 |
245 | 565 | (392 | ) | ||||||||
| Pension and postretirement amortization, net of tax expense of $54 in 2009 $52 in 2008 and $41 in 2007 |
104 | 101 | 80 | |||||||||
| Adjustment to minimum pension liability of the SERP plan, net of tax benefit of $87 in 2009, $26 in 2008 and $105 in 2007 |
(169 | ) | (52 | ) | (203 | ) | ||||||
| Fair value adjustment on derivatives, net of tax expense (benefit) of $72 in 2009 and ($195) in 2007 |
141 | - | (378 | ) | ||||||||
| Other Comprehensive income |
16,199 | 6,195 | 5,516 | |||||||||
| Comprehensive income |
$ | 27,864 | $ | 16,619 | $ | 13,783 | ||||||
| 11. | Commitments and Contingencies |
In the ordinary course of business, the Company has various outstanding commitments and contingent liabilities that are not reflected in the accompanying consolidated financial statements. In addition, the Company is involved in certain claims and legal actions arising in the ordinary course of business. The outcome of these claims and actions are not presently determinable; however, in the opinion of the Company’s management, after consulting legal counsel, the ultimate disposition of these matters will not have a material adverse effect on the Company’s financial position. The following table presents the notional amount of the Company’s off-balance sheet financial instruments as of December 31:
| (Dollar amounts in thousands) | 2009 | 2008 | ||||
| Loans in process and commitments: |
||||||
| Fixed interest rate |
$ | 16,510 | $ | 12,802 | ||
| Variable interest rate |
18,152 | 25,677 | ||||
| Lines of credit (unfunded): |
||||||
| Commercial |
22,443 | 29,158 | ||||
| Consumer |
50,061 | 47,251 | ||||
| Letters of credit: |
||||||
| Standby |
18,825 | 6,592 | ||||
| Interest Rate Cap Contracts |
50,000 | 40,000 | ||||
| Interest Rate Swap Contracts |
35,000 | - | ||||
Commitments to extend credit involve, to a varying degree, elements of credit and interest rate risk in excess of amounts recognized in the consolidated statement of financial condition. The Company’s exposure to credit loss in the event of non-performance by the other party for commitments to extend credit is
| ESB Financial Corporation | 62 | 2009 Annual Report |
Table of Contents
Notes to Consolidated Financial Statements (continued)
| 11. | Commitments and Contingencies (continued) |
represented by the contractual amount of these commitments, less any collateral value obtained. The Company uses the same credit policies in making commitments as for on-balance sheet instruments.
The Company’s distribution of commitments to extend credit approximates the distribution of loans receivable outstanding. The fair value of the off balance sheet items approximated the carrying value of those items at those dates.
| 12. | Fair Value |
The following disclosures show the hierarchal disclosure framework associated with the level of pricing observations utilized in measuring assets and liabilities at fair value. The three broad levels defined by U.S. generally accepted accounting principles are as follows:
| Level I: |
Quoted prices are available in the active markets for identical assets or liabilities as of the reported date. | |
| Level II: |
Pricing inputs are other than quoted prices in active markets, which are either directly or indirectly observable as of the reported date. The nature of these assets and liabilities include items for which quoted prices are available but traded less frequently, and items that are fair valued using other financial instruments, the parameters of which can be directly observed. | |
| Level III: |
Assets and liabilities that have little to no pricing observability as of the reported date. These items do not have two-way markets and are measured using management’s best estimate of fair value, where the inputs into the determination of fair value require significant management judgment or estimation. | |
The following table presents the assets and liabilities reported on the consolidated statements of financial condition at their fair value on a recurring basis as of December 31, 2009 and 2008 by level within the fair value hierarchy. Financial assets and liabilities are classified in their entirety based on the lowest level of input that is significant to the fair value measurement.
| (Dollar amounts in thousands) | As of December 31, 2009 | |||||||||||
| Level I | Level II | Level III | Total | |||||||||
| Assets: |
||||||||||||
| Securities available for sale |
||||||||||||
| Trust preferred securities |
$ | - | $ | 1,574 | $ | 39,003 | $ | 40,577 | ||||
| Municipal securities |
- | 150,094 | - | 150,094 | ||||||||
| Equity securities |
907 | - | - | 907 | ||||||||
| Corporate bonds |
- | 88,181 | - | 88,181 | ||||||||
| Mortgage backed securities |
- | 827,151 | - | 827,151 | ||||||||
| Total securities available for sale |
$ | 907 | $ | 1,067,000 | $ | 39,003 | $ | 1,106,910 | ||||
| Other Assets |
||||||||||||
| Interest rate caps |
$ | - | $ | 466 | $ | - | $ | 466 | ||||
| Interest rate swaps |
- | 213 | - | 213 | ||||||||
| Total other assets |
$ | - | $ | 679 | $ | - | $ | 679 | ||||
| ESB Financial Corporation | 63 | 2009 Annual Report |
Table of Contents
Notes to Consolidated Financial Statements (continued)
| 12. | Fair Value (continued) |
| (Dollar amounts in thousands) | As of December 31, 2008 | |||||||||||
| Level I | Level II | Level III | Total | |||||||||
| Assets: |
||||||||||||
| Securities available for sale |
||||||||||||
| Trust preferred securities |
$ | - | $ | 1,305 | $ | 38,211 | $ | 39,516 | ||||
| Municipal securities |
- | 134,045 | - | 134,045 | ||||||||
| Equity securities |
706 | - | - | 706 | ||||||||
| Corporate bonds |
- | 19,446 | - | 19,446 | ||||||||
| Mortgage backed securities |
- | 903,093 | - | 903,093 | ||||||||
| Total securities available for sale |
$ | 706 | $ | 1,057,889 | $ | 38,211 | $ | 1,096,806 | ||||
| Other Assets |
||||||||||||
| Interest rate caps |
$ | 157 | $ | 157 | ||||||||
| Total other assets |
$ | - | $ | 157 | $ | - | $ | 157 | ||||
Due to recent uncertainties in the credit markets broadly, and the lack of both trading and new issuance of floating rate trust preferred securities, market price indications generally reflect the lack of liquidity in these markets. Due to this lack of practical quoted prices, fair value for floating rate trust preferred securities has been determined using a discounted cash-flow technique. Cash flows are estimated based upon the contractual terms of each instrument. Market rates have been calculated based upon the five year historical discount margin for these instruments from August 2002 through August 2007, when the market was more liquid. These market rates were then adjusted for credit spreads and liquidity risk given the current markets. Credit spreads are based upon the Moody’s rating for each bond and range from 15 to 145 basis points. Liquidity risk adjustments ranged from 30 to 100 basis points where the securities of the 10 largest banks in the United States are assigned 30 basis points and banks outside of the top 10 were given a higher liquidity risk adjustment. Approximately $14.7 million or 37.7% of the $39.0 million in floating rate trust preferred securities represent investments in two of the four largest banks in the United States.
The following table presents the changes in the Level III fair-value category for the years ended December 31, 2009 and 2008. The Company classifies financial instruments in Level III of the fair-value hierarchy when there is reliance on at least one significant unobservable input to the valuation model. In addition to these unobservable inputs, the valuation models for Level III financial instruments typically also rely on a number of inputs that are readily observable either directly or indirectly.
Fair value measurements using significant unobservable inputs (Level III):
| Securities available for sale | ||||||
| 2009 | 2008 | |||||
| Beginning balance January 1, |
$ | 38,211 | $ | - | ||
| Total net realized/unrealized gains (losses) |
||||||
| Included in earnings: |
||||||
| Interest income on securities |
14 | 3 | ||||
| Net realized loss on securities available for sale |
(552) | (553) | ||||
| Included in other comprehensive income (loss) |
1,330 | (348) | ||||
| Transfers in and/or out of Level III |
- | 39,109 | ||||
| Ending balance, December 31, |
$ | 39,003 | $ | 38,211 | ||
| ESB Financial Corporation | 64 | 2009 Annual Report |
Table of Contents
Notes to Consolidated Financial Statements (continued)
| 12. | Fair Value (continued) |
The following table summarizes changes in unrealized gains and losses recorded in earnings for the year ended December 31, 2009 and December 31, 2008, for Level III assets and liabilities that were still held at December 31, 2009 and 2008.
| Securities available for sale | ||||||||
| 2009 | 2008 | |||||||
| Interest income on securities |
$ | 14 | $ | 3 | ||||
| Net realized loss on securities available for sale |
(552 | ) | (553 | ) | ||||
| Total |
$ | (538 | ) | $ | (550 | ) | ||
The following table presents the assets and liabilities reported on the consolidated statements of financial condition at their fair value on a non-recurring basis as of December 31, 2009 and 2008 by level within the fair value hierarchy. Financial assets and liabilities are classified in their entirety based on the lowest level of input that is significant to the fair value measurement.
| (Dollar amounts in thousands) | As of December 31, 2009 | |||||||||||
| Level I | Level II | Level III | Total | |||||||||
| Assets: |
||||||||||||
| Impaired Loans |
$ | - | $ | - | $ | 1,039 | $ | 1,039 | ||||
| Loans held for sale |
- | 201 | - | 201 | ||||||||
| Real estate acquired through foreclosure |
- | - | 725 | 725 | ||||||||
| Servicing assets |
- | - | 29 | 29 | ||||||||
| (Dollar amounts in thousands) | As of December 31, 2008 | |||||||||||
| Level I | Level II | Level III | Total | |||||||||
| Assets: |
||||||||||||
| Impaired Loans |
$ | - | $ | - | $ | 590 | $ | 590 | ||||
| Real estate acquired through foreclosure |
- | - | 539 | 539 | ||||||||
| Servicing assets |
- | - | 51 | 51 | ||||||||
| 13. | Financial Instruments |
In the ordinary course of business, the Company has entered into off-balance sheet financial instruments, consisting of commitments to extend credit, commitments under line of credit lending arrangements and letters of credit. Such financial instruments are recorded in the financial statements when they are funded or related fees are received.
The following methods and assumptions were used in estimating fair values of financial instruments.
Cash and cash equivalents – The carrying amounts of cash equivalents approximate their fair values.
Securities – With the exception of floating rate trust preferred securities, fair values for securities available for sale are determined by obtaining quoted prices on nationally recognized securities exchanges or matrix pricing, which is a mathematical technique which is widely used in the industry to value debt securities without relying exclusively on quoted prices for the specific securities but rather by relying on the securities’ relationship to other benchmark quoted securities.
Loans receivable – Fair values for loans are estimated using discounted cash flow analyses, using interest rates currently being offered for loans with similar terms to borrowers of similar credit quality. Fair values of impaired loans are estimated using discounted cash flow analyses or underlying collateral values, where applicable.
| ESB Financial Corporation | 65 | 2009 Annual Report |
Table of Contents
Notes to Consolidated Financial Statements (continued)
| 13. | Financial Instruments (continued) |
Loan commitments – The fair value of loan commitments at December 31, 2009 and December 31, 2008 approximated the cash surrender value of the policies at those dates.
Accrued interest receivable and payable – The carrying amounts of accrued interest approximate their fair values.
FHLB stock – FHLB stock is restricted from trading purposes, and thus, the carrying value approximates fair value.
Bank owned life insurance (BOLI) – The fair value of BOLI at December 31, 2009 and December 31, 2008 approximated the cash surrender value of the policies at those dates.
Interest rate cap and interest rate swap contracts – Fair values of interest rate cap and interest rate swap contracts are based on dealer quotes.
Deposits – The fair values disclosed for demand deposits are, by definition, equal to the amount payable on demand at the reporting date. Fair values for certificates of deposit are estimated using a discounted cash flow calculation that applies current market interest rates to a schedule of aggregated expected monthly maturities.
Borrowed funds and subordinated debt – For variable rate borrowings, fair values are based on carrying values. For fixed rate borrowings, fair values are based on the discounted value of contractual cash flows and on the Company’s current incremental borrowing rates for similar types of borrowing arrangements. Fair values of structured borrowings are based on dealer quotes.
Advance payments by borrowers for taxes and insurance – The fair value of the advance payments by borrowers for taxes and insurance approximated the carrying value of those commitments at those dates.
The following table sets forth the carrying amount and fair value of the Company’s financial instruments included in the consolidated statement of financial condition as of December 31:
| (Dollar amounts in thousands) | 2009 | 2008 | ||||||||||
| Carrying amount |
Fair value |
Carrying amount |
Fair value | |||||||||
| Financial assets: |
||||||||||||
| Cash and cash equivalents |
$ | 16,300 | $ | 16,300 | $ | 18,893 | $ | 18,893 | ||||
| Securities |
1,106,910 | 1,106,910 | 1,096,806 | 1,096,806 | ||||||||
| Loans receivable and held for sale |
671,588 | 690,024 | 691,315 | 711,324 | ||||||||
| Accrued interest receivable |
10,312 | 10,312 | 10,052 | 10,052 | ||||||||
| FHLB stock |
27,470 | 27,470 | 27,470 | 27,470 | ||||||||
| Bank owned life insurance |
29,381 | 29,381 | 28,481 | 28,481 | ||||||||
| Interest rate cap contracts |
466 | 466 | 157 | 157 | ||||||||
| Interest rate swap contracts |
213 | 213 | - | - | ||||||||
| Financial liabilities: |
||||||||||||
| Deposits |
944,347 | 954,568 | 877,329 | 886,647 | ||||||||
| Borrowed funds |
783,248 | 808,984 | 886,508 | 925,396 | ||||||||
| Junior subordinated notes |
46,393 | 75,178 | 46,393 | 66,402 | ||||||||
| Advance payment by borrowers for taxes and insurance |
2,661 | 2,661 | 2,816 | 2,816 | ||||||||
| Accrued interest payable |
3,182 | 3,182 | 5,119 | 5,119 | ||||||||
| 14. | Regulatory Matters and Insurance of Accounts |
The Company’s subsidiary bank, ESB Bank, is subject to various regulatory capital requirements administered by the federal banking agencies. Failure to meet minimum capital requirements could result in certain mandatory—and possibly additional discretionary—actions by regulators that, if undertaken, could have a direct material effect on the Company’s consolidated financial statements. Under capital adequacy
| ESB Financial Corporation | 66 | 2009 Annual Report |
Table of Contents
Notes to Consolidated Financial Statements (continued)
| 14. | Regulatory Matters and Insurance of Accounts (continued) |
guidelines and the regulatory framework for prompt corrective action, the Bank must meet specific capital guidelines that involve quantitative measures of assets, liabilities and certain off-balance sheet items as calculated under regulatory accounting practices. The capital amounts and their related classification for the Bank are also subject to qualitative judgments by the regulators about components, risk weightings and other factors. Quantitative measures established by regulation to ensure capital adequacy requires the Bank to maintain minimum amounts and ratios (set forth in the table below) of total capital (as defined in the regulations), tier 1 leverage capital (as defined) and tier 1 risk-based capital (as defined). As of December 31, 2009, the Bank meets all capital adequacy requirements to which it is subject.
As of December 31, 2009 and 2008 the most recent notification from the FDIC categorized the Bank as well capitalized under the regulatory framework for prompt corrective action. To be categorized as well capitalized, the Bank must maintain minimum total, tier 1 leverage and tier 1 risk-based capital ratios as set forth in the following table. As of December 31, 2009, there are no conditions or events since that notification that have changed the categorization.
Tier 1 leverage capital level in the following table is presented as a percentage of total adjusted assets (as defined in the regulations); total capital and tier 1 risk based capital levels are shown as a percentage of risk-weighted assets (as defined).
The minimum required regulatory capital percentages to be well capitalized under prompt corrective action provisions is 5%, 6% and 10% for tier 1 leverage, tier I risk-based and total capital ratios, respectively.
The following table sets forth certain information concerning regulatory capital of the Bank:
| (Dollar amounts in thousands) | Actual | For Capital Adequacy Purposes: |
To Be
Well Capitalized Under Prompt Corrective Action Provisions: |
|||||||||||||||
| Amount | Ratio | Amount | Ratio | Amount | Ratio | |||||||||||||
| As of December 31, 2009: |
||||||||||||||||||
| Total Capital |
$ | 147,394 | 14.79 | % | $ | 79,741 | 8.00 | % | $ | 99,677 | 10.00 | % | ||||||
| (to Risk Weighted Assets) |
||||||||||||||||||
| Tier 1 Leverage Capital |
$ | 141,367 | 7.61 | % | $ | 74,290 | 4.00 | % | $ | 92,863 | 5.00 | % | ||||||
| (to Adjusted Tangible Assets) |
||||||||||||||||||
| Tier 1 Risk Based Capital |
$ | 141,367 | 14.18 | % | $ | 39,871 | 4.00 | % | $ | 59,806 | 6.00 | % | ||||||
| (to Risk Weighted Assets) |
||||||||||||||||||
| As of December 31, 2008: |
||||||||||||||||||
| Total Capital |
$ | 141,208 | 14.87 | % | $ | 75,955 | 8.00 | % | $ | 94,944 | 10.00 | % | ||||||
| (to Risk Weighted Assets) |
||||||||||||||||||
| Tier 1 Leverage Capital |
$ | 135,202 | 7.19 | % | $ | 75,222 | 4.00 | % | $ | 94,028 | 5.00 | % | ||||||
| (to Adjusted Tangible Assets) |
||||||||||||||||||
| Tier 1 Risk Based Capital |
$ | 135,202 | 14.24 | % | $ | 37,978 | 4.00 | % | $ | 56,966 | 6.00 | % | ||||||
| (to Risk Weighted Assets) |
||||||||||||||||||
Congress has temporarily increased FDIC deposit insurance from $100,000 to $250,000 per depositor through December 31, 2013. Prior to the increase, the FDIC through the Deposit Insurance Fund insured deposits of account holders up to $100,000 per insured depositor. The standard insurance coverage will revert to $100,000 per depositor January 1, 2014. To provide for this insurance, the Bank must pay an annual premium.
| ESB Financial Corporation | 67 | 2009 Annual Report |
Table of Contents
Notes to Consolidated Financial Statements (continued)
| 15. | Quarterly Financial Data (unaudited) |
Quarterly earnings per share data may vary from annual earnings due to rounding.
| (Dollar amounts in thousands, except share data) | First Quarter |
Second Quarter |
Third Quarter |
Fourth Quarter |
|||||||||||
| 2009: |
|||||||||||||||
| Interest income |
$ | 23,692 | $ | 23,202 | $ | 22,898 | $ | 22,703 | |||||||
| Interest expense |
14,861 | 13,917 | 13,141 | 12,428 | |||||||||||
| Net interest income |
8,831 | 9,285 | 9,757 | 10,275 | |||||||||||
| Provision for loan losses |
310 | 206 | 236 | 160 | |||||||||||
| Net interest income after provision for loan losses |
8,521 | 9,079 | 9,521 | 10,115 | |||||||||||
| Net realized loss on securities available for sale |
- | (7 | ) | (210 | ) | (154 | ) | ||||||||
| Other noninterest income (loss) |
1,362 | 2,110 | 1,531 | (1,037 | ) | ||||||||||
| Noninterest expense |
6,249 | 7,265 | 6,414 | 6,856 | |||||||||||
| Income before income taxes |
3,634 | 3,917 | 4,428 | 2,068 | |||||||||||
| Provision for income taxes |
597 | 697 | 848 | 240 | |||||||||||
| Net income |
3,037 | 3,220 | 3,580 | 1,828 | |||||||||||
| Less: net income (loss) attributable to the noncontrolling interest |
5 | 94 | 74 | (520 | ) | ||||||||||
| Net income attributable to the noncontrolling interest |
$ | 3,032 | $ | 3,126 | $ | 3,506 | $ | 2,348 | |||||||
| Net income per share |
|||||||||||||||
| Basic |
$ | 0.25 | $ | 0.26 | $ | 0.29 | $ | 0.20 | |||||||
| Diluted |
$ | 0.25 | $ | 0.26 | $ | 0.29 | $ | 0.20 | |||||||
| 2008: |
|||||||||||||||
| Interest income |
$ | 24,011 | $ | 23,662 | $ | 24,135 | $ | 24,450 | |||||||
| Interest expense |
17,244 | 16,047 | 15,914 | 15,910 | |||||||||||
| Net interest income |
6,767 | 7,615 | 8,221 | 8,540 | |||||||||||
| Provision for loan losses |
221 | 290 | 409 | 486 | |||||||||||
| Net interest income after provision for loan losses |
6,546 | 7,325 | 7,812 | 8,054 | |||||||||||
| Net realized loss on securities available for sale |
- | - | - | (856 | ) | ||||||||||
| Other noninterest income |
1,326 | 2,512 | 1,531 | 764 | |||||||||||
| Noninterest expense |
5,765 | 5,751 | 5,665 | 5,861 | |||||||||||
| Income before income taxes |
2,107 | 4,086 | 3,678 | 2,101 | |||||||||||
| Provision for income taxes |
138 | 777 | 591 | 42 | |||||||||||
| Net income |
1,969 | 3,309 | 3,087 | 2,059 | |||||||||||
| Less: net income (loss) attributable to the noncontrolling interest |
14 | 148 | (37 | ) | 84 | ||||||||||
| Net income attributable to the noncontrolling interest |
$ | 1,955 | $ | 3,161 | $ | 3,124 | $ | 1,975 | |||||||
| Net income per share |
|||||||||||||||
| Basic |
$ | 0.16 | $ | 0.26 | $ | 0.26 | $ | 0.16 | |||||||
| Diluted |
$ | 0.16 | $ | 0.26 | $ | 0.26 | $ | 0.16 | |||||||
| ESB Financial Corporation | 68 | 2009 Annual Report |
Table of Contents
Notes to Consolidated Financial Statements (continued)
| 16. | ESB Financial Corporation – Condensed Financial Statements (Parent Company Only) |
Following are condensed financial statements for the parent company as of and for the years ended December 31:
| Condensed Statements of Financial Condition | ||||||||||||
| (Dollar amounts in thousands) | 2009 | 2008 | ||||||||||
| Assets: |
||||||||||||
| Interest-earning deposits |
$ | 3,320 | $ | 1,812 | ||||||||
| Securities available for sale |
31,310 | 3,062 | ||||||||||
| Equity in net assets of subsidiaries |
205,275 | 200,531 | ||||||||||
| Other assets |
4,697 | 5,117 | ||||||||||
| Total assets |
$ | 244,602 | $ | 210,522 | ||||||||
| Liabilities and stockholders’ equity: |
||||||||||||
| Subordinated debt, net |
$ | 46,393 | $ | 46,393 | ||||||||
| Payable to subsidiaries |
- | 4,150 | ||||||||||
| Accrued expenses and other liabilities |
33,298 | 17,595 | ||||||||||
| Stockholders’ equity |
164,911 | 142,384 | ||||||||||
| Total liabilities and stockholders’ equity |
$ | 244,602 | $ | 210,522 | ||||||||
| Condensed Statements of Operations | ||||||||||||
| (Dollar amounts in thousands) | 2009 | 2008 | 2007 | |||||||||
| Income: |
||||||||||||
| Equity in undistributed earnings of subsidiaries |
$ | 6,871 | $ | (3,407 | ) | $ | 1,553 | |||||
| Dividends from subsidiaries |
7,000 | 16,500 | 9,000 | |||||||||
| Management fee income, from subsidiaries |
24 | 24 | 24 | |||||||||
| Net realized gain (loss) on sale of securities available for sale |
180 | (303 | ) | 274 | ||||||||
| Interest and other income |
833 | 175 | 266 | |||||||||
| Total income |
14,908 | 12,989 | 11,117 | |||||||||
| Expense: |
||||||||||||
| Interest expense, to subsidiary |
3,526 | 4,017 | 4,787 | |||||||||
| Compensation and employee benefits |
290 | 243 | 181 | |||||||||
| Other |
336 | 335 | 140 | |||||||||
| Total expense |
4,152 | 4,595 | 5,108 | |||||||||
| Income before benefit from income taxes |
10,756 | 8,394 | 6,009 | |||||||||
| Benefit from income taxes |
(1,256 | ) | (1,821 | ) | (1,652 | ) | ||||||
| Net income |
$ | 12,012 | $ | 10,215 | $ | 7,661 | ||||||
| ESB Financial Corporation | 69 | 2009 Annual Report |
Table of Contents
Notes to Consolidated Financial Statements (continued)
| 16. | ESB Financial Corporation – Condensed Financial Statements (Parent Company Only) (continued) |
| Condensed Statements of Cash Flows | ||||||||||||
| (In thousands) | 2009 | 2008 | 2007 | |||||||||
| Operating activities: |
||||||||||||
| Net income |
$ | 12,012 | $ | 10,215 | $ | 7,661 | ||||||
| Adjustments to reconcile net income to net cash provided by operating activities: |
||||||||||||
| Equity in undistributed earnings of subsidiaries |
(6,871 | ) | 3,407 | (1,553 | ) | |||||||
| Net realized (gain) loss on securities AFS |
(180 | ) | 303 | (274 | ) | |||||||
| Compensation expense on ESOP/MRP |
1,127 | 861 | 965 | |||||||||
| Other, net |
3,830 | (549 | ) | 5,059 | ||||||||
| Net cash provided by operating activities |
9,918 | 14,237 | 11,858 | |||||||||
| Investing activities: |
||||||||||||
| Purchases of securities |
(911 | ) | (184 | ) | (206 | ) | ||||||
| Principal repayments of securities |
2,750 | 388 | 446 | |||||||||
| Proceeds from the sale of securities available for sale |
992 | - | 1,241 | |||||||||
| Net cash provided by investing activities |
2,831 | 204 | 1,481 | |||||||||
| Financing activities: |
||||||||||||
| Repayment of loan to subsidiaries |
(4,150 | ) | (5,100 | ) | (3,500 | ) | ||||||
| Amortization of deferred debt issuance costs |
- | 29 | 75 | |||||||||
| Redemption of junior subordinated notes |
- | (5,155 | ) | - | ||||||||
| Proceeds from long term borrowings |
- | 5,000 | - | |||||||||
| Proceeds received from exercise of stock options |
792 | 286 | 386 | |||||||||
| Dividends paid |
(4,828 | ) | (4,926 | ) | (5,097 | ) | ||||||
| Payments to acquire treasury stock |
(2,932 | ) | (3,410 | ) | (5,374 | ) | ||||||
| Stock purchased by ESOP |
(123 | ) | - | - | ||||||||
| Net cash used in financing activities |
(11,241 | ) | (13,276 | ) | (13,510 | ) | ||||||
| Increase (decrease) in cash equivalents |
1,508 | 1,165 | (171 | ) | ||||||||
| Cash equivalents at beginning of period |
1,812 | 647 | 818 | |||||||||
| Cash equivalents at end of period |
$ | 3,320 | $ | 1,812 | $ | 647 | ||||||
| ESB Financial Corporation | 70 | 2009 Annual Report |
Table of Contents
Report of Independent Registered Public Accounting Firm
Board of Directors and Shareholders
ESB Financial Corporation
We have audited ESB Financial Corporation and subsidiaries’ internal control over financial reporting as of December 31, 2009, based on criteria established in Internal Control—Integrated Framework issued by the Committee of Sponsoring Organizations of the Treadway Commission. ESB Financial Corporation management is responsible for maintaining effective internal control over financial reporting and for its assessment of the effectiveness of internal control over financial reporting included in the accompanying Report on Management’s Assessment of Internal Control Over Financial Reporting. Our responsibility is to express an opinion on the Company’s internal control over financial reporting based on our audit.
We conducted our audit in accordance with the standards of the Public Company Accounting Oversight Board (United States). Those standards require that we plan and perform the audit to obtain reasonable assurance about whether effective internal control over financial reporting was maintained in all material respects. Our audit included obtaining an understanding of internal control over financial reporting, assessing the risk that a material weakness exists, and testing and evaluating the design and operating effectiveness of internal control based on the assessed risk. Our audit also included performing such other procedures as we considered necessary in the circumstances. We believe that our audit provides a reasonable basis for our opinion.
A company’s internal control over financial reporting is a process designed to provide reasonable assurance regarding the reliability of financial reporting and the preparation of financial statements for external purposes in accordance with generally accepted accounting principles. A company’s internal control over financial reporting includes those policies and procedures that (1) pertain to the maintenance of records that, in reasonable detail, accurately and fairly reflect the transactions and dispositions of the assets of the company; (2) provide reasonable assurance that transactions are recorded as necessary to permit preparation of financial statements in accordance with generally accepted accounting principles, and that receipts and expenditures of the company are being made only in accordance with authorizations of management and directors of the company; and (3) provide reasonable assurance regarding prevention or timely detection of unauthorized acquisition, use, or disposition of the company’s assets that could have a material effect on the financial statements.
Because of its inherent limitations, internal control over financial reporting may not prevent or detect misstatements. Also, projections of any evaluation of effectiveness to future periods are subject to the risk that controls may become inadequate because of changes in conditions, or that the degree of compliance with the policies or procedures may deteriorate.
In our opinion, ESB Financial Corporation maintained, in all material respects, effective internal control over financial reporting as of December 31, 2009, based on criteria established in Internal Control—Integrated Framework issued by the Committee of Sponsoring Organizations of the Treadway Commission.
We have also audited, in accordance with the standards of the Public Company Accounting Oversight Board (United States), the Audit Report of ESB Financial Corporation and our report dated March 11, 2010, expressed an unqualified opinion.

Wexford, Pennsylvania
March 11, 2010
| ESB Financial Corporation | 71 | 2009 Annual Report |
Table of Contents
Report of Independent Registered Public Accounting Firm
Board of Directors and Shareholders
ESB Financial Corporation
We have audited the accompanying consolidated statements of financial condition of ESB Financial Corporation (the “Company”) and subsidiaries as of December 31, 2009 and 2008, and the related consolidated statements of operations, changes in stockholders’ equity, and cash flows for each of the years in the three-year period ended December 31, 2009. These consolidated financial statements are the responsibility of the Company’s management. Our responsibility is to express an opinion on these consolidated financial statements based on our audits.
We conducted our audits in accordance with the standards of the Public Company Accounting Oversight Board (United States). Those standards require that we plan and perform the audits to obtain reasonable assurance about whether the financial statements are free of material misstatement. An audit includes examining, on a test basis, evidence supporting the amounts and disclosures in the financial statements. An audit also includes assessing the accounting principles used and significant estimates made by management, as well as evaluating the overall financial statement presentation. We believe that our audits provide a reasonable basis for our opinion.
In our opinion, the consolidated financial statements referred to above present fairly, in all material respects, the consolidated financial position of ESB Financial Corporation and subsidiaries as of December 31, 2009 and 2008, and the consolidated results of their operations and their cash flows for each of the three years in the period ended December 31, 2009, in conformity with U.S. generally accepted accounting principles.
We have also audited, in accordance with the standards of the Public Company Accounting Oversight Board (United States), ESB Financial Corporation and subsidiaries’ internal control over financial reporting as of December 31, 2009, based on criteria established in Internal Control—Integrated Framework issued by the Committee of Sponsoring Organizations of the Treadway Commission, and our report dated March 11, 2010, expressed an unqualified opinion on the effectiveness of ESB Financial Corporation’s internal control over financial reporting.
Wexford, Pennsylvania
March 11, 2010
| ESB Financial Corporation | 72 | 2009 Annual Report |
Table of Contents
Management’s Reports to ESB Financial Corporation Shareholders
Management’s Report on Financial Statements and Practices
ESB Financial Corporation is responsible for the preparation, integrity, and fair presentation of the consolidated financial statements included in this annual report. The consolidated financial statements and notes included in this annual report have been prepared in conformity with United States generally accepted accounting principles and necessarily include some amounts that are based on management’s best estimates and judgments.
The system of internal control over financial reporting as it relates to the financial statements is evaluated for effectiveness by management and tested for reliability through a program of internal audits. Actions are taken to correct potential deficiencies as they are identified. Any system of internal control, no matter how well designed, has inherent limitations, including the possibility that a control could be circumvented or overridden and misstatements due to error or fraud may occur and not be detected. Also, because of changes in conditions, internal control effectiveness may vary over time. Accordingly, even an effective system of internal control will provide only reasonable assurance with respect to financial statement preparation.
The Audit Committee, consisting entirely of independent directors, meets regularly with management, internal auditors and the independent registered public accounting firm, and reviews audit plans and results, as well as management’s actions taken in discharging responsibilities for accounting, financial reporting, and internal control. S.R. Snodgrass, independent registered public accounting firm, and the internal auditors have direct and confidential access to the Audit Committee at all times to discuss the results of their examinations.
Report on Management’s Assessment of Internal Control Over Financial Reporting
We, as management of ESB Financial Corporation, are responsible for establishing and maintaining effective internal control over financial reporting that is designed to produce reliable financial statements in conformity with United States generally accepted accounting principles. Management assessed the Corporation’s system of internal control over financial reporting as of December 31, 2009, in relation to criteria for effective internal control over financial reporting as described in “Internal Control—Integrated Framework,” issued by the Committee of Sponsoring Organizations of the Treadway Commission. Based on this assessment, management concludes that, as of December 31, 2009, its system of internal control over financial reporting is effective and meets the criteria of the “Internal Control—Integrated Framework”. S.R. Snodgrass, independent registered public accounting firm, has issued an attestation report on management’s assessment of the Corporation’s internal control over financial reporting.
Charlotte A. Zuschlag
President and Chief Executive Officer

Charles P. Evanoski
Group Senior Vice President and Chief Financial Officer
March 11, 2010
| ESB Financial Corporation | 73 | 2009 Annual Report |
Table of Contents
Stock and Dividend Information
Listings and Markets
ESB Financial Corporation common stock is traded on the NASDAQ Global Select Stock Market under the symbol “ESBF”. Some of the listed market makers for the Company’s common stock include:
| Keefe, Bruyette & Woods, Inc. |
Stifel Nicolaus & Co., Inc. |

| ||
| 787 7th Avenue, 4th Flr |
18 Columbia Turnpike |
|||
| New York, NY 10019 |
Florham Park NJ 07932 |
|||
| Telephone: (800) 966-1559 |
Telephone: (800) 342-2325 |
|||
|
UBS Financial Services |
||||
| One North Wacker Drive, 35th Flr |
||||
| Chicago, IL 60606 |
||||
| Telephone: (800) 525-4313 |
Number of Stockholders and Shares Outstanding
As of December 31, 2009, there were 2,642 registered stockholders of record and 12,036,553 shares of common stock outstanding entitled to vote, receive dividends and considered outstanding for financial reporting purposes. The number of stockholders of record does not include the number of persons or entities who hold their stock in nominee or “street” name.
Dividend Reinvestment Plan
Common stockholders may have cash dividends reinvested to purchase additional shares. Participants may also make optional cash purchases of common stock through the reinvestment plan and pay no brokerage commissions or fees. To obtain a plan prospectus and authorization card call (800) 368-5948.
Registrar and Transfer Agent
Registrar and Transfer Company
10 Commerce Drive
Cranford, NJ 07016
Cash Dividends
The Company has paid regular quarterly cash dividends since its inception in June 1990. During the past two years ended December 31, 2009, the Company declared cash dividends with the following record and payment dates:
| Record Date |
Payment Date |
Cash | ||
| December 31, 2009 |
January 25, 2010 |
$0.10 | ||
| September 30, 2009 |
October 23, 2009 |
$0.10 | ||
| June 30, 2009 |
July 24, 2009 |
$0.10 | ||
| March 31, 2009 |
April 24, 2009 |
$0.10 | ||
| December 31, 2008 |
January 23, 2009 |
$0.10 | ||
| September 30, 2008 |
October 24, 2008 |
$0.10 | ||
| June 30, 2008 |
July 25, 2008 |
$0.10 | ||
| March 31, 2008 |
April 25, 2008 |
$0.10 | ||
| ESB Financial Corporation | 74 | 2009 Annual Report |
Table of Contents
Stock and Dividend Information (continued)
Stock Splits and Dividends
The Company has declared the following stock splits or dividends since its inception:
| Record Date |
Payment Date |
Percentage | ||
| May 1, 2003 |
May 15, 2003 |
20% | ||
| September 30, 2002 |
October 25, 2002 |
20% | ||
| May 18, 2001 |
May 30, 2001 |
20% | ||
| May 17, 2000 |
May 31, 2000 |
10% | ||
| May 15, 1998 |
May 29, 1998 |
10% | ||
| July 31, 1997 |
August 25, 1997 |
10% | ||
| December 31, 1994 |
January 25, 1995 |
20% | ||
| December 31, 1993 |
January 25, 1994 |
20% | ||
| May 12, 1993 |
June 7, 1993 |
20% | ||
| December 31, 1992 |
January 25, 1993 |
20% | ||
| June 30, 1992 |
July 25, 1992 |
20% | ||
| December 31, 1991 |
January 25, 1992 |
20% |
Stock Price Information
The bid and ask price of the Company’s common stock were $11.71 and $11.72, respectively, as of January 29, 2010.
The following table sets forth the high and low sale market prices of the Company’s common stock as of and during the quarterly periods presented:
| Market Price | |||||||||
| High | Low | Close | |||||||
| 2009 Quarter Ended |
|||||||||
| December 31 |
$ | 13.96 | $ | 10.62 | $ | 13.22 | |||
| September 30 |
15.00 | 12.62 | 13.39 | ||||||
| June 30 |
15.44 | 10.08 | 13.12 | ||||||
| March 31 |
12.38 | 9.03 | 10.99 | ||||||
| 2008 Quarter Ended |
|||||||||
| December 31 |
$ | 10.95 | $ | 7.28 | $ | 10.74 | |||
| September 30 |
10.97 | 8.50 | 9.40 | ||||||
| June 30 |
11.31 | 9.33 | 9.73 | ||||||
| March 31 |
10.42 | 9.30 | 9.92 | ||||||
| ESB Financial Corporation | 75 | 2009 Annual Report |
Table of Contents
Stock and Dividend Information (continued)
Performance Graph
The following graph compared the yearly cumulative total return on the common stock over a five-year measurement period with the yearly cumulative total return on the stocks included in (i) the NASDAQ—Total US companies and (ii) the SNL Securities All Banks and Thrifts Index. All of these cumulative returns are computed assuming the reinvestment of dividends at the frequency with which dividends were paid during the applicable year.
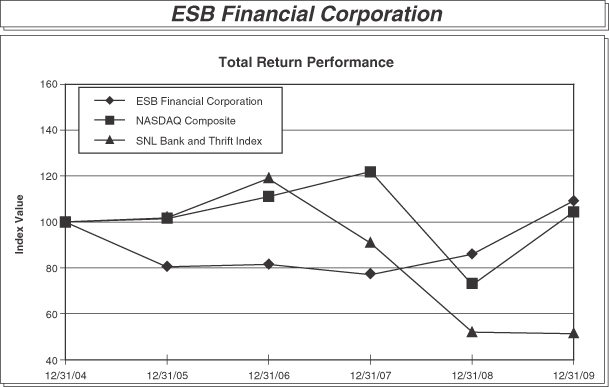
Performance Graph provided by SNL Financial.
| ESB Financial Corporation | 76 | 2009 Annual Report |
Table of Contents
Annual Meeting
The annual meeting of the Company’s stockholders will be held at 4:00 p.m., on Wednesday, April 21, 2010, at the Connoquenessing Country Club, 1512 Mercer Road, Ellwood City, PA 16117.
Stockholder and Investor Information
Copies of annual reports on Form 10-K, quarterly reports on Form 10-Q, current reports on Form 8-K and related stockholder literature are available upon written request without charge to stockholders. Requests should be addressed to Frank D. Martz, Group Senior Vice President of Operations and Corporate Secretary, ESB Financial Corporation, 600 Lawrence Avenue, Ellwood City, PA 16117.
We make available on our website www.esbbank.com, our annual report on Form 10-K, quarterly reports on Form 10-Q and current reports on Form 8-K, on the date which we electronically file these reports with the Securities and Exchange Commission, as well as our code of ethics. Investors are encouraged to access these reports and the other information about our business and operations on our web site.
Equal Employment Opportunity
ESB Financial Corporation has adopted an affirmative action program to assure equal opportunity for every employee and hires, trains, promotes, compensates and makes all other employment decisions without regard to race, color, religion, sex, age, national origin, disability or veteran status.
Corporate Headquarters
ESB Financial Corporation
600 Lawrence Avenue
Ellwood City, PA 16117
Phone: (724) 758-5584
Subsidiary Companies
| ESB Bank | ESB Capital Trust II | |
| ESB Financial Services, Inc. | ESB Capital Trust III | |
| AMSCO, Inc. | ESB Statutory Trust IV | |
| AMS Ventures, LLC |
THF, Inc d/b/a Elite Settlement Services | |
| Madison Woods Joint Venture |
||
| The Links at Deer Run Associates, LLC |
||
| McCormick Farms, LLC |
||
| Brandy One, LLC |
||
| The Vineyards at Brandywine, LP |
||
| Cobblestone Village, LP |
||
| The Meadows at Hampton, LP |
||
| BelleVue Park |
||
| MW 42 |
| Independent Registered Public Accounting Firm | Special Counsel | |
| S.R. Snodgrass, A.C. |
Elias, Matz, Tiernan & Herrick L.L.P. | |
| 2100 Corporate Drive, Suite 400 |
734 15th Street, NW | |
| Wexford, PA 15090 |
Washington, DC 20005 | |
| ESB Financial Corporation | 77 | 2009 Annual Report |
Table of Contents
ESB FINANCIAL CORPORATION
| William B. Salsgiver |
Mario J. Manna | |
| Chairman of the Board |
Retired Tax Collector - Borough of Coraopolis | |
| A Principal - Perry Homes |
||
| Herbert S. Skuba |
Lloyd L. Kildoo | |
| Vice Chairman of the Board |
Supervisor & Funeral Director - Glenn-Kildoo Funeral Homes | |
| Retired Director, President & CEO - Ellwood City Hospital |
||
| Charlotte A. Zuschlag |
James P. Wetzel, Jr. | |
| President & Chief Executive Officer |
Retired President & CEO - PHSB Financial Corporation |
ESB BANK
| William B. Salsgiver |
Lloyd L. Kildoo | |
| Chairman of the Board |
Supervisor & Funeral Director - Glenn-Kildoo Funeral Homes | |
| A Principal - Perry Homes |
||
| Herbert S. Skuba |
Mario J. Manna | |
| Vice Chairman of the Board |
Retired Tax Collector - Borough of Coraopolis | |
| Retired Director, President & CEO - Ellwood City Hospital |
||
| Charlotte A. Zuschlag |
Joseph W. Snyder | |
| President & Chief Executive Officer |
Sourcing Agent - EQT Corporation | |
| Raymond K. Aiken |
Jefrey F. Wall | |
| Retired President & COO - Lockhart Chemical Co. |
Business Manager, Penns Valley School District | |
| Joseph D. Belas |
James P. Wetzel, Jr. | |
| Retired Director - PHSB Financial Corporation |
Retired President & CEO - PHSB Financial Corporation | |
| Johanna C. Guehl |
||
| Owner - Law Offices of Johanna C. Guehl |
||
| Affiliate - Kathy L. Hess & Associates, CPA’s |
||
| ESB Financial Corporation | 78 | 2009 Annual Report |
Table of Contents
Corporate Officers, Advisory Board and Bank Officers
| ESB FINANCIAL CORPORATION |
ESB BANK, (continued) | |
| William B. Salsgiver |
First Vice Presidents | |
| Chairman of the Board |
Deborah A. Allen | |
| Charlotte A. Zuschlag |
Kathleen A. Bender | |
| President & Chief Executive Officer |
Nancy A. Glitsch | |
| Brian W. Hulme | ||
| Group Senior Vice Presidents |
Mary Ann Leonardo | |
| Charles P. Evanoski - Chief Financial Officer |
Sally A. Mannarino | |
| Frank D. Martz - Operations & Corporate Secretary |
Larry Mastrean | |
| Todd F. Palkovich - Lending |
Pamela K. Zikeli | |
| Senior Vice Presidents |
Vice Presidents | |
| Robert A. Ackerman - Audit & Loan Review |
Charlotte M. Bolinger | |
| Richard E. Canonge - Treasurer |
Thomas E. Campbell | |
| Robert J. Colalella - Marketing |
Louis C. Frischkorn | |
| John W. Donaldson II - Lending |
Deborah S. Goehring | |
| Teresa Krukenberg - Business Development |
Peter J. Greco | |
| Ronald J. Mannarino - Asset/Liability Management |
Paul F. Hoyson | |
| Mark A. Platz - Information Technology |
Penny K. Koch | |
| Ronald E. Pompeani - Lending |
Mary C. Magestro | |
| Marilyn Scripko - Lending & CRA Officer |
John J. Mottes | |
| John T. Stunda - Human Resources |
Joseph R. Pollock, III | |
| Bonita L. Wadding - Controller |
||
| Assistant Vice Presidents | ||
| ESB BANK, ADVISORY BOARD |
Theresa M. Adler | |
| Joseph W. DeNardo |
Susan B. Antolic | |
| Retired Chief Meteorologist for WTAE - TV |
Kelley J. Avena | |
| George C. Dorsch |
Janet S. Barletta | |
| Retired Engineer - |
James D. Bish | |
| Dept. of Transportation, Commonwealth of Pennsylvania |
Amy E. Dicks | |
| Dr. Allan Gastfriend |
Judy L. Diesing | |
| Retired Dentist |
Susan C. Fisher | |
| Charles W. Hergenroeder |
Theresa A. Gerst | |
| Partner - Hergenroeder, Rega, Sommer, LLC |
Norene Greer | |
| Watson F. McGaughey, Jr. |
Margaret A. Haefele | |
| Retired President - McGaughey Buses, Inc. |
Teri L. Huston | |
| Martin Miller |
David L. Kramer | |
| President Owner/Operator - Miller & Sons Chevrolet |
Kyle R. Krupa | |
| Ronald W. Owen |
Barbara E. Martinelli | |
| Senior Relationship Executive - First American Title Insurance Co. |
Beth A. McClymonds | |
| Craig E. Wynn |
Kristin E. McKelvey | |
| President - Herskowitz and Wynn, P.C. |
Marianne L. Mills | |
| Ann R. Nelson | ||
| ESB BANK |
Jonathan D. Newell | |
| William B. Salsgiver |
Madeline Orfitelli | |
| Chairman of the Board |
Deborah F. Pagley | |
| Charlotte A. Zuschlag |
James P. Perenovich | |
| President & Chief Executive Officer |
Thomas G. Pfeiffer | |
| Keith R. Poleti | ||
| Group Senior Vice Presidents |
Timothy S. Robinson | |
| Charles P. Evanoski |
Cynthia L. Scaramazza | |
| Frank D. Martz |
Jackie A. Smith | |
| Todd F. Palkovich |
Linda Smith | |
| Kathy A. Smyth | ||
| Senior Vice Presidents |
Sharon L. Speicher | |
| Robert A. Ackerman |
Karla L. Spinelli | |
| Richard E. Canonge |
Nancy Straley | |
| Robert J. Colalella |
Volynda Teets | |
| John W. Donaldson II |
Janice L. Voynik | |
| Teresa Krukenberg |
Alan P. Weber | |
| Ronald J. Mannarino |
||
| Mark A. Platz |
Assistant Secretaries | |
| Ronald E. Pompeani |
Linda A. MacMurdo | |
| Marilyn Scripko |
Dana M. Martz | |
| John T. Stunda |
Robin Scheffler | |
| Bonita L. Wadding |
||
| THF, Inc. | ||
| Rocco Abbatangelo - President |
| ESB Financial Corporation | 79 | 2009 Annual Report |
Table of Contents
Board of Directors

Board of Directors of ESB Bank are seated from left, William B. Salsgiver, Lloyd L. Kildoo, Mario J. Manna, Jefrey F. Wall and Johanna C. Guehl. Standing from the left are Herbert S. Skuba, Charlotte A. Zuschlag, Joseph W. Snyder, James P. Wetzel, Raymond K. Aiken and Joseph D. Belas.
| ESB Financial Corporation | 80 | 2009 Annual Report |
Table of Contents
Office Locations and Financial Services Managers
| ALIQUIPPA | CHIPPEWA TOWNSHIP | NEW BRIGHTON | ||
| Janet Barletta | Teri Huston | Linda Smith | ||
| Financial Services Manager | Financial Services Manager | Financial Services Manager | ||
| Phone: 724-378-4436 | Phone: 724-846-6200 | Phone: 724-846-4920 | ||
| Fax: 724-378-1204 | Fax: 724-846-6242 | Fax: 724-846-7805 | ||
| 2301 Sheffield Road | 2521 Darlington Road | 800 Third Avenue | ||
| Aliquippa, PA 15001 | Beaver Falls, PA 15010 | New Brighton, PA 15066 | ||
| AMBRIDGE | CORAOPOLIS | NORTH SHORE | ||
| Keith Poleti | Jackie Smith | Jan Orr | ||
| Financial Services Manager | Financial Services Manager | Customer Service Manager | ||
| Phone: 724-266-5002 | Phone: 412-264-8862 | Phone: 412-231-7297 | ||
| Fax: 724-266-6178 | Fax: 412-264-5960 | Fax: 412-231-4097 | ||
| 506 Merchant Street | 900 Fifth Avenue | 807 Middle Street | ||
| Ambridge, PA 15003 | Coraopolis, PA 15108 | Pittsburgh, PA 15212 | ||
| BALDWIN | DARLINGTON | NORTHERN LIGHTS | ||
| Barbara Martinelli | Kelley Avena | David Kramer | ||
| Financial Services Manager | Financial Services Manager | Financial Services Manager | ||
| Phone: 412-655-8670 | Phone: 724-827-8500 | Phone: 724-869-2193 | ||
| Fax: 412-655-8116 | Fax: 724-827-8502 | Fax: 724-869-2196 | ||
| 5035 Curry Road | 233 Second Street, PO Box 305 | 1555 Beaver Road | ||
| Pittsburgh, PA 15236 | Darlington, PA 16115 | Baden, PA 15005 | ||
| BEAVER | ELLWOOD CITY | SHENANGO TOWNSHIP | ||
| Larry Mastrean | Pamela Zikeli | Charlotte Bolinger | ||
| Regional Financial Services Manager | Regional Financial Services Manager | Assistant Regional Financial Services Manager | ||
| Phone: 724-775-1052 | Phone: 724-758-5584 | Phone: 724-654-7781 | ||
| Fax: 724-775-6687 | Fax: 724-758-0576 | Fax: 724-654-1643 | ||
| 701 Corporation Street | 600 Lawrence Avenue | 2731 Ellwood Road | ||
| Beaver, PA 15009 | Ellwood City, PA 16117 | New Castle, PA 16101 | ||
| BEAVER FALLS | FOX CHAPEL | SPRING HILL | ||
| Susan Fisher | Theresa Gerst | Marianne Mills | ||
| Financial Services Manager | Financial Services Manager | Financial Services Manager | ||
| Phone: 724-847-4004 | Phone: 412-782-6500 | Phone: 412-231-0819 | ||
| Fax: 724-846-0718 | Fax: 412-782-1279 | Fax: 412-231-0822 | ||
| 1427 Seventh Avenue | 1060 Freeport Road | Itin & Rhine Streets | ||
| Beaver Falls, PA 15010 | Pittsburgh, PA 15238 | Pittsburgh, PA 15212 | ||
| BEECHVIEW | FRANKLIN TOWNSHIP | TROY HILL | ||
| Madeline Orfitelli | Thomas Campbell | Sharon Speicher | ||
| Financial Services Manager | Assistant Regional Financial Services Manager | Financial Services Manager | ||
| Phone: 412-344-7211 | Phone: 724-752-2500 | Phone: 412-231-8238 | ||
| Fax: 412-344-7213 | Fax: 724-752-2502 | Fax: 412-231-1910 | ||
| 1550 Beechview Avenue | 1793 Mercer Road | 1706 Lowrie Street | ||
| Pittsburgh, PA 15216 | Ellwood City, PA 16117 | Pittsburgh, PA 15212 | ||
| BUTLER | HOPEWELL TOWNSHIP | WEXFORD | ||
| Margaret Haefele | Karla Spinelli | Deborah Allen | ||
| Financial Services Manager | Financial Services Manager | Regional Financial Services Manager | ||
| Phone:724-789-0057 | Phone: 724-378-0505 | Phone: 724-934-8989 | ||
| Fax: 724-789-9156 | Fax: 724-378-0530 | Fax: 724-934-3026 | ||
| 831 Evans City Road | 2293 Broadhead Road | 101 Wexford-Bayne Road | ||
| Renfrew, PA 16053 | Aliquippa, PA 15001 | Wexford, PA 15090 | ||
| CENTER TOWNSHIP | NESHANNOCK TOWNSHIP | ZELIENOPLE | ||
| Judy Diesing | Cynthia Scaramazza | Deborah Goehring | ||
| Financial Services Manager | Financial Services Manager | Assistant Regional Financial Services Manager | ||
| Phone: 724-774-0332 | Phone: 724-658-8825 | Phone: 724-452-6500 | ||
| Fax: 724-774-7869 | Fax: 724-658-5483 | Fax: 724-452-6503 | ||
| 3531 Broadhead Road | 3360 Wilmington Road | 17 Northgate Plaza Unit 22 | ||
| Monaca, PA 15061 | New Castle, PA 16105 | Harmony, PA 16037 | ||
Table of Contents

Coming Fall 2010
Our New Zelienople Office
527 South Main Street
Zelienople, PA 16063
| ESB FINANCIAL CORPORATION 600 Lawrence Avenue Ellwood City, Pennsylvania 16117 Phone: (724) 758-5584 |