Attached files
Table of Contents
UNITED STATES
SECURITIES AND EXCHANGE COMMISSION
Washington, D.C. 20549
FORM 10-K
| x | ANNUAL REPORT PURSUANT TO SECTION 13 OR 15(d) OF THE SECURITIES EXCHANGE ACT OF 1934 |
For the Fiscal Year Ended December 31, 2009
| ¨ | TRANSITION REPORT PURSUANT TO SECTION 13 OR 15(d) OF THE SECURITIES EXCHANGE ACT OF 1934 |
For the transition period from to
Commission file number 0-20740
EPICOR SOFTWARE CORPORATION
(Exact name of registrant as specified in its charter)
| Delaware | 33-0277592 | |
| (State or other jurisdiction of incorporation or organization) |
(I.R.S. Employer Identification No.) |
18200 Von Karman Ave, Suite 1000
Irvine, California 92612
(Address of principal executive offices, zip code)
Registrant’s telephone number, including area code: (949) 585-4000
| Securities registered pursuant to Section 12(b) of the Act: | Common Stock, par value $.001 per share Preferred Share Purchase Rights | |
| Securities registered pursuant to Section 12(g) of the Act: | None. | |
Indicate by check mark if the registrant is a well-known seasoned issuer, as defined in Rule 405 of the Securities Act. Yes ¨ No x
Indicate by check mark if the registrant is not required to file reports pursuant to Section 13 or Section 15(d) of the Act. Yes ¨ No x
Indicate by check mark whether the registrant (1) has filed all reports required to be filed by Section 13 or 15(d) of the Securities Exchange Act of 1934 during the preceding 12 months (or for such shorter period that the registrant was required to file such reports), and (2) has been subject to such filing requirements for the past 90 days. Yes x No ¨
Indicate by check mark whether the registrant has submitted electronically and posted on its corporate Web site, if any, every Interactive Data File required to be submitted and posted pursuant to Rule 405 of Regulation S-T during the preceding 12 months (or for such shorter period that the registrant was required to submit and post such files). Yes ¨ No ¨
Indicate by check mark if disclosure of delinquent filers pursuant to Item 405 of Regulation S-K is not contained herein, and will not be contained, to the best of the registrant’s knowledge, in definitive proxy or information statements incorporated by reference in Part III of this Form 10-K or any amendment to this Form 10-K. ¨
Indicate by check mark whether the registrant is a large accelerated filer, an accelerated filer, a non-accelerated filer or a smaller reporting company. See the definitions of “large accelerated filer,” “accelerated filer” and “smaller reporting company” in Rule 12b-2 of the Exchange Act. (Check one):
Large accelerated filer ¨ Accelerated filer x Non-accelerated filer ¨ Smaller reporting company ¨
(Do not check if a smaller reporting company)
Indicate by check mark whether the registrant is a shell company (as defined in Rule 12b-2 of the Act). Yes ¨ No x
The aggregate market value of the registrant’s voting Common Stock held by non-affiliates of the registrant was approximately $237,352,571 computed using the closing sales price of $5.30 per share of Common Stock on June 30, 2009 as reported by the Nasdaq Global Select Market. Shares of Common Stock held by each officer and director and each person who owns 10% or more of the outstanding Common Stock have been excluded in that such persons may be deemed affiliates. The determination of affiliate status is not necessarily a conclusive determination for other purposes.
The number of shares of Common Stock outstanding as of March 1, 2010 was 61,100,212.
DOCUMENTS INCORPORATED BY REFERENCE
Portions of the registrant’s definitive Proxy Statement for the 2010 Annual Meeting of Stockholders, which Proxy Statement will be filed no later than 120 days after the close of the registrant’s fiscal year ended December 31, 2009, are incorporated by reference in Part III of this Annual Report on Form 10-K.
1
Table of Contents
| Item 1. | BUSINESS |
Forward Looking Statements – Safe Harbor
Certain statements in this Annual Report on Form 10-K are forward looking statements within the meaning of Section 27A of the Securities Act of 1933, as amended, and Section 21E of the Securities and Exchange Act of 1934, as amended, that involve risks and uncertainties. Any statements contained herein (including without limitation statements to the effect that the Company or Management “estimates,” “expects,” “anticipates,” “plans,” “believes,” “projects,” “continues,” “should,” “may” or “will” or statements concerning “potential” or “opportunity” or variations thereof or comparable terminology or the negative thereof) that are not statements of historical fact should be construed as forward-looking statements including statements about (i) the Company’s future financial results, (ii) the impact of new accounting pronouncements, (iii) the Company’s product development plans, (iv) the Company’s capital spending, (v) the Company’s future cash flow from operations, (vi) sufficient sources of financing to continue operations for next twelve months and to satisfy contractual obligations and commercial commitments, (vii) the effect of current legal proceedings, (viii) payment of obligations related to the Company’s restructurings, (ix) the future use of forward or other hedging contracts, (x) the future impact of recent acquisitions on the Company, (xi) future investments in product development, (xii) schedule of amortization of intangible assets, (xiii) future impact of valuation allowance review and (xiv) future expense levels. Actual results could differ materially and adversely from those anticipated in such forward looking statements as a result of certain factors, including the factors listed at pages 24 to 32. Because these factors may affect the Company’s operating results, past performance should not be considered an indicator of future performance and investors should not use historical results to anticipate results or trends in future periods. The Company undertakes no obligation to revise or publicly release the results of any revision to these forward-looking statements. Investors should carefully review the risk factors described below and in other documents the Company files from time to time with the Securities and Exchange Commission.
Introduction
Epicor Software Corporation (Epicor or the Company) designs, develops, markets and supports enterprise application software solutions and services primarily for use by midsized companies and the divisions and subsidiaries of Global 1000 enterprises, which generally consist of companies with annual revenues between $25 million and $1 billion, and emerging enterprises, which generally consist of rapidly growing businesses with annual revenues under $25 million. Epicor’s solutions are designed to help companies focus on their customers, suppliers, partners and employees through enterprise-wide management of resources and information. This collaborative focus distinguishes the Company from conventional enterprise resource planning (ERP) vendors, whose primary focus is improving internal business processes and efficiencies. The Company believes that by automating and integrating information and critical business processes across their entire value chain, enterprises can improve not just their bottom line, but also their top line, allowing them to compete more effectively in today’s increasingly global economy.
The Company’s products include back office applications for production management, supply chain management (SCM), retail management and financial accounting, as well as front office customer relationship management (CRM) and service management. Epicor also provides industry-specific solutions to the manufacturing, distribution, services, retail and hospitality industry sectors, as well as to a range of industries and vertical markets within these sectors including financial services, professional services, industrial machinery, instrumentation/controls, medical device, consumer goods, automotive, aerospace, hotels and general merchandise and specialty retail. Epicor’s solutions also focus on the need for increased supply chain visibility and transparency, and offer e-commerce and collaborative portal capabilities that allow companies to further extend beyond the traditional “four walls” of their enterprise and further integrate their operations with those of their customers, suppliers and partners.
The Company’s products are increasingly developed on and use a service-oriented architecture (SOA) and incorporate Web 2.0 technologies, which can help organizations more quickly and efficiently respond to changing business requirements and practices and empower users to be more productive through collaboration. SOA is a modular, standards-based approach to software development and its deployment is designed to provide a more agile and adaptable application foundation, which can help companies more effectively align their IT resources and enterprise software with their overall business objectives. Web 2.0 is commonly associated with web applications and technologies that provide a rich, user-centric design to facilitate more interactive information sharing, content development, search, retrieval, interoperability and collaboration over the Internet.
2
Table of Contents
The Company offers solutions targeted to the following industries:
Manufacturing—Epicor’s manufacturing solutions provide integrated ERP solutions for discrete and mixed-mode manufacturers. The Company’s solutions are designed to meet the challenges of today’s agile manufacturing environment typified by short product lifecycles, continual process improvement, mass customization and lean manufacturing initiatives. The Company’s products have been designed to support a variety of manufacturers – from single plants, to regional or national manufacturers with multiple facilities, to complex, distributed multinational companies that require integrating manufacturing, distribution and outsourced or third-party operations worldwide. Epicor’s manufacturing solutions are designed to meet the unique requirements of specific industries including industrial machinery, instrumentation/controls, medical devices, metal fabrication, automotive, electronics, aerospace and defense.
Distribution—Epicor’s distribution solutions are designed to meet the expanding requirement to support a demand-driven supply network (DDSN) by increasing focus on the customer and providing a more seamless order to shipment cycle, as well as inventory and warehouse management, sales and order processing, financials, CRM and planning and forecasting solutions. The Company’s distribution solution is designed to automate a business, from customer acquisition and order management, to warehouse fulfillment, shipping and logistics, accounting and customer service. The distribution suite offers an end-to-end solution set tailored for wholesale distributors, including third-party logistics providers.
Retail—Epicor’s retail solutions can support large, distributed point-of-sale (POS) environments in specialty, general merchandise retailing and large department and specialty store chains that require a comprehensive multichannel retail solution with POS, loyalty management, merchandising and sales audit capabilities. The retail suite is highly scalable and can support a variety of retail formats from small single PC-based POS retail outlets to distributed multi-store, multi-register global retailers with thousands of stores and registers. Epicor provides “best-of-breed” retail solutions for large tier-one retailers, as well as complete “post-to-host” solutions which can integrate all elements of the retail supply chain from the store registers through to merchandising, planning, cross-channel order management, customer relationship management and financial applications.
Hospitality—Epicor’s hospitality solutions, designed for the hotel, resort, casino, food service, sports and entertainment industry, can manage and streamline virtually every aspect of a hospitality organization, from point-of-sale (POS) or property management system (PMS) integration, to cash and sales management, centralized procurement, food costing and beverage management, core financials and business intelligence for daily reporting and analysis by outlet and property, all within a single solution.
Services—Epicor’s solutions for services-based organizations are focused on delivering complete, end-to-end capabilities designed to meet the critical business requirements of both midsized and larger, distributed service firms, providing them with the tools to improve staff utilization, maximize billing and revenue recognition, optimize resources and increase cash flow. The Company’s business services solution includes financial management, opportunity and bid management, resource and engagement management, project accounting, portfolio and performance management and collaborative commerce applications tailored for specific industries including financial services, audit and accountancy, architectural, engineering and construction, commercial research, not-for-profit organizations, software and computer services and management consulting.
Beyond the targeted enterprise-wide solutions described above, Epicor also offers the following point solutions:
Accounting and Financial Management—Epicor’s financial and accounting solutions provide a foundation for good fiscal governance and accurate financial performance through a combination of core ledger, cash and asset management, deferred revenue accounting, contract renewal and electronic payment facilities. These solutions are designed to offer complete financial control through support of global accounting standards, allocation and consolidation capabilities and advanced financial reporting and analysis.
Supply Chain Management (SCM)—Epicor’s supply chain management solutions enable companies to extend and optimize their enterprises and more effectively collaborate with their customers, suppliers and partners. From business-to-business e-commerce and advanced planning and scheduling applications to advanced warehouse management, forecasting and fulfillment, Epicor offers solutions that can improve operational performance, while strengthening relationships across the supply chain to increase customer value.
Supplier Relationship Management (SRM)—Epicor’s supplier relationship management solutions include applications for strategic sourcing, procurement and spend analytics. These solutions are designed to enable an organization to reduce costs by driving inefficiencies out of the sourcing and procurement processes. They provide a complete Web-based, buy-side commerce solution that can rapidly be deployed standalone or as part of an integrated enterprise solution.
3
Table of Contents
Customer Relationship Management (CRM)—Epicor’s customer relationship management solution is designed to enable small and midsized enterprises to manage their entire customer lifecycle. Epicor’s collaborative CRM solution enables businesses to gather, organize, track and share prospect, customer, competitor and product information, as well as service and support existing customers more effectively, to increase overall customer satisfaction, retention and loyalty.
IT Service Management (ITSM)—Epicor ITSM provides a robust set of service management features that support key IT processes as outlined by the Information Technology Infrastructure Library (ITIL) version 2 (ITIL v2) and version 3 (ITIL v3) and has been certified by Pink Elephant as ITIL Compatible in five key service management areas: incident management, problem management, change management, configuration management and service level management.
Enterprise Performance Management (EPM)—Epicor EPM solutions include applications for financial and operational budgeting, forecasting and planning, as well as advanced analytical tools. These solutions, which include data warehousing, online analytical processing (OLAP), role-based dashboards and the graphical visualization of key performance indicators (KPIs), are designed to enable an organization to derive greater insights into business metrics to support more effective decision making, continuous improvement initiatives and overall business performance.
Enterprise Mobility—Epicor Mobile delivers a comprehensive platform for managing information between mobile devices that can be either connected via a wireless or cellular network, or disconnected in mobile or remote field workforce scenarios, where real-time connectivity is not available or practical. Epicor Mobile is designed to provide complete visibility and integration between office operations and field activities. Incorporating in-context workflows, attachments and global positioning system (GPS) support with full data synchronization of tasks such as scheduling, dispatch, inventory and service operations, Epicor Mobile Field Service can assist a mobile workforce in collaborating more effectively, being more responsive and providing superior levels of service and productivity.
The Company’s software products incorporate a significant number of features localized to address international market opportunities, including support for multiple languages, multiple currencies and accounting for global taxation methods.
The Company offers consulting, training and support services to supplement the use of its software products by its customers. Midmarket companies require cost effective systems that have broad functionality, yet are rapidly implemented, easily adapted and highly configurable to their unique business requirements.
The Company was incorporated in Delaware in November 1987, under the name Platinum Holdings Corporation. In September 1992, the Company changed its name to Platinum Software Corporation. In April 1999, the Company changed its name to Epicor Software Corporation. The Company has fifteen active operating subsidiaries worldwide.
As part of its business strategy, the Company has pursued acquisitions to expand its customer base, global product offering and geographic footprint. The acquisition of NSB Retail Systems PLC (NSB) in 2008, CRS Retail Technology Group, Inc. (CRS) in 2005 and Scala Business Solutions N.V. (Scala) in 2004 are typical of this ongoing strategy.
NSB
In February 2008, the Company acquired NSB, a publicly held software company headquartered in Montreal, Canada and previously listed on the London Stock Exchange. The acquisition of NSB expanded the portfolio of products and services for large and midsized specialty retailers and department stores, as well as a fully hosted, managed service offering designed for smaller retailers who are interested in rapid implementation via an on-demand versus on-premise offering. The Company recorded the acquisition of NSB as a business combination in 2008, and the results of NSB’s operations have been included in the Company’s Consolidated Statements of Operations from the date of acquisition.
CRS
In December 2005, pursuant to a stock purchase agreement, the Company acquired CRS, a privately held company headquartered in Newburgh, New York. The acquisition of CRS provided the Company with complementary product and service offerings designed for the retail and hospitality industries—particularly large
4
Table of Contents
and midsized specialty and general merchandise retailers globally. The Company recorded the acquisition of CRS as a business combination in 2005, and the results of CRS’ operations have been included in the Company’s Consolidated Statements of Operations from the date of acquisition.
Scala
In June 2004, Epicor acquired Scala, a publicly held software company headquartered in Amsterdam, the Netherlands, by means of an exchange offer made for all of the outstanding ordinary shares of Scala. The acquisition of Scala provided increased operational scale, expanded geographic reach and complementary product offerings expanding the opportunities for the Company in the global ERP market and in the divisions and operating subsidiaries of large multinational corporations. The Company recorded the acquisition of Scala as a business combination in 2004, and the results of Scala’s operations are included in the Company’s Consolidated Statements of Operations from the date of acquisition.
Background
Epicor designs its products and services primarily for midmarket companies and the divisions and subsidiaries of Global 1000 enterprises, which generally consist of companies with annual revenues between $25 million and $1 billion, and emerging enterprises, which generally consist of rapidly growing businesses with annual revenues under $25 million. In the past, midmarket companies were underserved by smaller “best-of-breed” applications with limited functionality or overburdened by complex financial, retail and ERP systems that had originally been designed for multi-billion dollar, global corporations. These large enterprise systems, though highly functional, are also extremely complex and expensive to purchase, install, integrate and maintain. The breadth of functionality and often inflexible design of these systems can require considerable implementation services and ongoing support, particularly when business processes change, which can occur frequently in rapidly growing organizations. The complexity of the infrastructure and ongoing maintenance to support large enterprise systems often results in a centralized or head office deployment model supplemented by other often disparate systems at the subsidiary or division level. This can limit access to critical, real-time operational data, which in turn can impact the timely availability of information to decision makers, managers and key employees. Moreover, due to their size and complexity, these mostly proprietary systems can be slower to incorporate than newer, more flexible technologies and are often built around restrictive best-practice templates that provide little adaptability to meet the constantly evolving requirements of growing midmarket companies.
Global 1000 companies have aggressively invested in information technology (IT) to help them increase productivity, streamline processes and integrate disparate business processes. The push to optimize operations across these global enterprises has created tremendous demand in their operating subsidiaries to deploy robust software solutions, but much more quickly and cost-effectively than the parent company’s enterprise system. Additionally, small to midsized enterprises (SME) face tremendous global competitive pressures as they compete for business against larger corporations, other midsized competitors and smaller start-ups. They generally understand the need to remain close to their customers and suppliers, while making the most effective use of relatively limited resources.
In their quest to boost productivity and profits, as well as to gain a competitive advantage, midsized companies have increasingly turned to integrated application software to automate and link their business processes. However, due to the requirement by midmarket companies for highly functional and adaptable software, along with their unique business constraints of limited budgets and rapid implementation timeframes, so called tier-one or “best-of-breed” solutions and after-market application integrations can be far too complex and costly to offer an effective enterprise solution. Midsized companies frequently demand a quick return on technology investments and require that solutions be flexible, scalable and affordable, not only to acquire and implement, but also to maintain and support, throughout their entire operational life span.
Epicor’s experience is that midsized companies are practical consumers with respect to technology, typically selecting affordable, proven solutions. The dramatic decrease in information technology costs over the past decade, coupled with a simultaneous increase in computing power, has made key new technologies accessible to this cost-conscious market. Microsoft Corporation took advantage of increased computing capabilities to develop the Microsoft® Server family, including Microsoft Windows Server® , a robust network operating system, and Microsoft SQL Server® , a scalable relational database that provides midsized businesses with a sophisticated technology infrastructure previously accessible only to Global 1000 corporations. Microsoft continues to enhance the scalability, performance and capabilities of their platforms, while lowering development costs for solution providers and IT departments. This strategy has continued to make Microsoft a preferred technology platform for SME companies, mainly for its features, familiarity and ease-of-use.
The recent development of more cost-effective, adaptable and agile infrastructures, such as the emergence of SOA and technologies like the Microsoft .NET Framework and Web services, are also driving midsized companies to
5
Table of Contents
increase their investment in enterprise applications. Unlike monolithic, tightly-coupled systems, SOA and Web services provide the ability to create highly functional applications through the assembly or collection of loosely coupled, self-describing business services. These services or components expose application functions as granularly as possible, easing the complexity of integrating with other systems or tailoring the application to best suit a specific business process. Additionally, Web services specifications have emerged to standardize cross-application communication, especially over the Internet. This standards-based design approach provides a secure, scalable, unified design framework that allows both developers and information workers to more easily access, combine, and reuse software application functionality. Together SOA and Web services can enable businesses to more efficiently align their information systems and technology resources, allowing them the ability to respond quickly to continually changing business requirements.
Epicor’s early adoption of the Microsoft .NET Framework and Web services, which are based on Extensible Markup Language (XML) allows its product offerings, development and services to leverage the benefits of SOA and provide growing midsized businesses with increased flexibility, interoperability, and cross-platform capability. These capabilities are extremely important to increasing the value that IT already provides to businesses. Despite the drop in overall IT investment in 2009 due to the difficult global economic conditions, institutions continue to recognize that IT is crucial to business execution and therefore competitiveness – whether standardizing and deploying business processes quickly across their enterprise or outmaneuvering competitors by shortening time-to-market and product release cycles. Analysts expect that IT, and particularly software and enterprise applications, spending will rebound and return to growth in 2010. According to a January 21, 2010 press release issued by Gartner, Inc., “Worldwide IT spending will reach $3.4 trillion in 2010, a 4.6 percent increase from 2009. Software spending is projected to grow 4.9 percent to $231.5 billion.”[1]
Industry Segments and Geographic Information
Epicor’s reportable operating segments include license fees, consulting, maintenance and hardware and other. A breakout of the Company’s sales by segment is provided in Note 14 of the “Notes to Consolidated Financial Statements” under Item 8, “Financial Statements and Supplementary Data.” A summary of the Company’s sales by geographic region is incorporated herein by reference to Note 14 of the “Notes to Consolidated Financial Statements” under Item 8, “Financial Statements and Supplementary Data.”
Technology Strategy
The Company’s technology strategy is to develop leading enterprise software applications using industry-standard tools where possible and to take advantage of leading third-party, industry-standard technologies for database management systems, operating systems, user-interface components, infrastructure and network connectivity. As the Company continues to focus on delivering flexible, scalable enterprise software applications, it is increasingly leveraging Web services which support the integration of computing and communication paradigms as one across multiple devices. The Company is further expanding its use of concepts and practices that have become commonplace on the Internet. Enterprise search, links, tags, syndication and social networking have evolved to enhance communications, secure information sharing and increase collaboration and functionality of the Web. These second generation or Web 2.0 capabilities have become pervasive in their use and adoption by Internet and online users. Businesses recognize that leveraging these skills across their enterprise resources and systems can improve productivity and foster more active collaboration and innovation. For businesses to compete in what is now a real-time, “business anywhere, anytime” world, they need the infrastructure, software and systems that can rapidly aggregate distributed enterprise data and online resources to securely deliver information not only to the desktop, but to new generations of mobile devices and users.
The Company has long recognized that technology and business requirements while connected, evolve differently. The Company’s design and development strategy segregates the functional or business aspects of product development from the technology aspects. The functional aspects include components and libraries of processes for executing business transactions, while the technological aspects, which can be more pervasive, involve security, interoperability, mobility, globalization, communication, integration, customization and user experience.
| [1] | Source: Gartner, Inc. press release dated January 21, 2010 “ Gartner Says Worldwide IT Spending To Grow 4.6 Percent in 2010.” |
The Gartner Report(s) described herein, (the “Gartner Report(s)”) represent(s) data, research opinion or viewpoints published, as part of a syndicated subscription service, by Gartner, Inc. (“Gartner”), and are not representations of fact. Each Gartner Report speaks as of its original publication date (and not as of the date of this Prospectus) and the opinions expressed in the Gartner Report(s) are subject to change without notice.
6
Table of Contents
The Company believes the ability to innovate and deliver functional and technological enhancements independently, improves its ability to quickly react to an ever-changing technology landscape, while also maintaining focus on the longer-term evolution of industry and vertical business practices. The Company will continue to focus on leveraging emerging and industry-standard technologies to provide rapid return on investment and lower overall total cost of ownership for the Company’s customers.
Architecture
The Company’s architectural approach to its products is focused on helping its customers and partners economically deploy, tailor and integrate highly functional applications to meet their specific business processes and industry requirements. Ease-of-use and high usability are key strategic objectives of the architecture and through the development and enhancement of specialized frameworks, interfaces and end-user tools, companies and individuals can optimize labor-intensive data management and processing tasks. The Company continues to extend and enhance this strategic approach to architecture across its product lines – enabling enterprises to incorporate new and existing capabilities more seamlessly, better leverage their existing IT assets and implement new industry processes and best practices more fully.
The Company’s product architecture is designed to increase a business’s efficiency and agility by automating business processes, improving the visibility and reliability of information and supporting increased volumes and faster processing of new and existing business transactions. In addition to driving efficiency, the Company’s architecture is designed to manage complex workflows between operations, processes and functions based on events, conditions, tolerances and rules to orchestrate and link interactions, approvals and notifications. This flexibility can allow an organization to more rapidly implement and propagate their unique and mission critical business processes and practices across their enterprise. The product architecture provides the capability for enterprises to change strategy, innovate or implement new ideas or processes quickly – which in turn can improve overall competitiveness.
The Company’s technology direction currently embraces the Microsoft .NET Framework for XML-based Web services, networking architecture, and graphical user interface components. Through the .NET Framework, the Company provides comprehensive support for Web services deployment and Enterprise Application Integration (EAI). Utilizing the .NET Framework and the XML standard for data exchange allows the Company’s products to provide customers with increased access to information both within and between their organizations – no matter where their offices or employees are located. This strategy enables the Company’s development teams to leverage Microsoft technology wherever feasible, while still allowing the use of specialized development tools, databases and technologies appropriate to the requirements of each product’s industry, vertical or target market. As a long standing Microsoft Gold Certified Partner and an early adopter of the .NET Framework, and more recently Windows Vista®, Epicor is able to leverage its expertise with Microsoft technology to benefit its customers worldwide.
The Company is focused on SOA, a next-generation computing model designed to increase a business’ efficiency and agility. Business efficiency typically improves through the systemization, automation and standardization of processes and functions, which allows an organization to increase throughput or output, using the same or less resources; whether time, capital, employees or facilities. In addition to driving efficiency, the Company’s architecture can manage complex workflows between operations, processes and functions based on events, conditions, tolerances and rules to orchestrate and link interactions, approvals and notifications. This allows an organization to more rapidly implement and propagate their unique and often business critical processes across their enterprise. This flexibility can improve an enterprise’s agility – the capability to quickly change strategy, innovate or implement new ideas or processes, which in turn can improve the enterprise’s competitiveness.
The Company continues to enable its solutions to support Web services, which are self-describing software components that allow the creation of applications that can be programmed and published over the Web. Because Web services are portable and interoperable and because they are not vendor specific, they have become a standard means to facilitate the integration of disparate systems and applications. Epicor develops its Web services using the Microsoft .NET Framework, which helps ensure the Company’s products have incorporated the latest standards and security capabilities. The Company’s adoption of Web services across its major product lines helps business more easily integrate, collaborate and securely share information throughout the enterprise and with its customers and suppliers.
The Company utilizes open database technology to provide extremely flexible, integrated, enterprise business applications. This open database orientation is predominately based on the Microsoft SQL Server relational database management system (RDBMS). The Company also utilizes Progress Software Corporation’s Progress
7
Table of Contents
RDBMS and open database technology and tools from Rocket Software, Inc. (acquired from IBM Corporation in October 2009) in certain products. The Company has chosen these open databases in order to maximize the throughput of its customers’ transactions, to provide realistic models of business data for customers and to maximize price performance under the budget and resource constraints typical of customers in its primary market sector.
The Company has incorporated numerous usability features into its user interfaces (UIs) to simplify the operation of, and access to, its products. All of the Company’s product lines incorporate the popular Microsoft Windows® graphical user interface (GUI). The Company's UI tools include industry-standard field controls, pull-down menus, tool bars and tab menus that facilitate the use of the software. The Company's products incorporate many of the latest and most advanced UI features such as process wizards, cue cards, advanced on-line help, and on-line documentation. As the model for distributed computing continues to evolve through the advent of Internet technologies, the Company offers additional client deployment models, including thin-client, smart-client, browser-based and mobile client access.
The Company provides comprehensive application development, extension and customization capabilities for all its product lines. Complementing the SOA, these customization tools deliver a complete development environment, enabling a user to make changes ranging from a simple field name change to building an integrated custom application. Although significant customization can be supported, the Company attempts to minimize customization of its products by delivering high functionality, industry focused templates and best practices, coupled with application tailoring capabilities and SOA, which provides for significant flexibility in the look and feel, business process, reporting and workflow of the applications.
The Company’s architecture is also designed to help optimize the efficiency and effectiveness of software development, deployment and support. The Company invests in software tools and frameworks focused on creating consistent, high quality code, which combined with formal development standards, methodologies and practices, is comprehensively tested throughout the development process. The architecture includes tools to help the Company maintain consistency and high developer productivity across its worldwide development organization. The Company’s architectural approach and ongoing investment in its development frameworks and tools allows it to both develop new products and enter new markets more quickly, as well as to enhance and support its existing products more effectively.
Epicor True SOA™
The Company has significantly expanded the scope and capabilities of its SOA in the Epicor product, which it refers to as Epicor True SOA™, around six major areas: addressable components, open standards, customization, business process management, globalization, and distributed data management. The Epicor True SOA™ further extends the ability for individual operations, functions, services, and events to be more easily deployed and managed in user-definable processes and integration scenarios. Additionally, these capabilities help extend Epicor’s suitability to more deeply penetrate existing vertical markets, address adjacent verticals, and expand into new countries and regions.
Addressable components form the application programming interface (API), which is made available to users for each product. APIs are essentially the building blocks of the system, as they are the conventions, protocols and semantics that define how a software service, function, process or application is invoked or accessed. APIs provide consistency and flexibility by ensuring that all programs using a common API will have similar interfaces. The Company’s API’s are highly granular in nature, meaning that data can be accessed or transactions invoked at any level of detail across the entire product.
Individual components can be invoked using open standards like Web services, which allow functions to be executed from other software products or via the Internet, regardless of their platform. The Company believes both the wide functionality capabilities and the use of open standards in its API is a significant benefit to its customers.
Application components can be customized to hide unnecessary data, add new data, revise or reorganize application forms or establish specialized workflows for users. These customizations do not affect the core or baseline product, which allows customers the ability to extend and enhance the application without becoming locked-out of future updates or new software releases.
Business process management (BPM) extends the ability to connect, automate, augment or change transaction flows between operations, processes and functions by exposing business processes as services. Customers can create unique “orchestrations” between internal and external systems, including secure, long-running business-to-business operations.
8
Table of Contents
Epicor Service Connect is a middleware platform that coordinates integrations and business processes between the Company’s solutions, external systems and users to automate business processes, task assignments, logical routings and interaction points. Service Connect’s graphical workflow designer allows customers to define, model and map their business processes and apply conditional business rules, monitor actions, set notifications, and modify business flows and processes. Together, BPM and Service Connect provide customers with the ability to increase governance and corporate controls through enhanced transactional integrity and compliancy of data, and by providing monitoring, tracking and audit trails on their key transactions and business processes.
The Epicor True SOA™ also includes advanced distributed data management capabilities that allow the secure replication or consolidation of enterprise data for offline reporting or publication to mobile devices. Distributed data management capabilities allow large or distributed enterprises with multiple facilities and operations to control, share and coordinate master and reference data to minimize the creation of multiple, and potentially inconsistent, versions of master data in different parts of its operations.
For companies with global operations or conducting global commerce, the extended globalization capabilities of Epicor provide increased support for complex journal posting, multiple books, tax, rounding and legal numbering to support the needs of foreign subsidiaries, evolving financial reporting standards, entering new markets and regional localizations. Configurable global “engines” allow companies to configure their specific rules for posting, currency, tax and multi-book integration, while providing support for key regulatory and local reporting requirements. As of January 2009, the Epicor product had been shipped to more than 47 countries, in 18 languages with full Unicode and double byte support.
The Company’s Epicor product includes new data indexing and searching features that enable end users and information workers to locate and navigate information in their enterprise business system similarly to the consumer search experience that is ubiquitous on the Internet. Enterprise Search enables users to quickly and securely locate and access enterprise information, without the requirement to navigate traditional menus, screens and look ups. Enterprise Search is specifically designed for use with relational databases and business information. It manages the structured and relational nature of business data as part of the search criteria to determine the relevancy and ranking of the results to the user. The ability to use Enterprise Search and the level of access to reference data, transactions, documents, repositories and content is controlled based on the permissions and security of the user conducting the search.
The Company’s Epicor product includes a browser-compatible user interface (UI) that complements the traditional Microsoft Windows client application. Compatible with leading Internet browsers, including Microsoft Internet Explorer®, Mozilla Firefox™, Google™ Chrome™ and Apple® Safari®, the browser user interface can allow broader access to Epicor by remote or mobile employees over the Internet. The Epicor Everywhere™ framework provides a unique technology that stores all client business logic as XML metadata, which permits Epicor applications to run as smart clients, Web clients or on mobile devices, all from the same source code. Since all of the UIs are dynamically created from the Windows client application, users do not have to develop, enhance, maintain or control separate versions of their forms for Web, mobile and desktop UIs. Additionally, user customizations and personalizations remain intact and business rules are consistently enforced across all of the UIs. Epicor can further extend both transactional and business intelligence capabilities by allowing end-user screens and forms to be embedded in scorecards, dashboards and collaborative portals through Microsoft SharePoint.
Industry Strategy
Epicor industry solutions provide focused software, services and industry knowledge designed specifically for the unique requirements of target industries, commercial sectors and related vertical markets. Historically, large enterprise application vendors have created vertical industry applications and practices designed for the Global 1000 in industries such as automotive, retail, government and healthcare. However, for midmarket companies in these industries, these vertical offerings are often too expensive and overly complex for their requirements. More importantly, many midmarket companies are not necessarily part of a traditional vertical market, but rather have a mix of vertical and specific processes, best practices and highly specialized functionality that are critical to their success.
Epicor industry solutions enable customers to leverage a solution tailored to the unique needs of their market, as well as focused industry and vertical expertise through the Company’s professional services organization. Epicor
9
Table of Contents
industry solutions are additionally complemented by strategic relationships with key partners to provide product extensions and domain expertise as part of an integrated, end-to-end solution. Customers can benefit through solutions that are easier to implement, easier to use and require less customization than a horizontal solution. Epicor industry solutions target the Manufacturing, Distribution, Retail, Hospitality, and Services sectors, and industries and verticals within each sector.
Epicor Manufacturing
Epicor’s industry solutions for manufacturers typically focus on the needs of discrete and mixed-mode manufacturers with increasingly complex and diverse operations including multi-site, off-shore and outsourced production, and warehousing and distribution. In particular, the following key industries are supported: Industrial Machinery, Metal Fabrication, Automotive, Aerospace and Defense, Energy, Electronics and High Tech, Medical Devices, Measuring and Controlling Devices, Rubber and Plastics, Furniture and Fixtures, Lumber and Wood and Primary Metals.
Epicor Distribution
Epicor’s industry solutions for distributors provide comprehensive end-to-end supply chain management capabilities for multi-location warehousing and fulfillment in areas such as Consumer Goods (Packaged and Durable), and for the following key types of distribution operations: Distribution and Warehouse Management, Value-Added Fulfillment, Beverage Distribution, Redistribution and Service Bureaus.
Epicor Retail
Epicor’s industry solutions for retail focus on the needs of multi-channel, multi-site retailers with key requirements such as POS, customer relationship management, cross-channel order management, merchandising, assortment planning, audit and operations and loss prevention. This includes General Merchandising and Specialty Retailers in Apparel, Footwear, Sporting Goods, Department Stores, Pharmacies, Books and Music, Beauty Supply and Cosmetics.
Epicor Hospitality
Epicor’s industry solutions for hospitality focus on the needs of completely integrated service environments that often span global properties and locations with multiple points of sale or customer interaction therein, such as Hotels, Resorts, Casinos, Sports Teams, Restaurants and Entertainment and Recreation complexes.
Epicor Services
Epicor’s industry solutions for business and professional services firms typically address companies who offer people-based services as opposed to products and can be member or non-profit based, as well as for-profit organizations. These businesses include Financial Services firms such as Banks, Insurers and Credit Unions; Enterprise Services firms such as Management Consulting, Audit and Accountancy and Marketing, Advertising and Communications; and Senior Living Services, such as providers of Aged Care and Community Care Services to clients either in their own home, at specialized facilities, assisted living or senior and retirement communities.
Products
The Company designs, develops, markets, sells, implements and supports enterprise software applications that provide midsized organizations and divisions of Global 1000 companies with highly functional, technically advanced business solutions that are aligned according to the markets and industries that they serve.
Global ERP - Epicor
Released in December 2008, Epicor offers a global configurable ERP solution built specifically to meet the needs of small, medium and large organizations across multiple industry sectors on a worldwide basis. Internally branded as Epicor 9, the Epicor product line incorporates a converged set of the functionality found within the Company’s Vantage®, Vista®, iScala, Enterprise, Epicor for Service Enterprises, Clientele®, Avanté® and Manage 2000® products. Built using Epicor True SOA™ and a series of configurable application engines, Epicor offers 13 comprehensive suites designed to enable effective business management, better business insight and support for business anywhere.
Epicor supports the manufacturing, distribution and business services industry sectors, as well as their hybrids, and offers functional capabilities and support for businesses operating in the following key vertical industries: Industrial Machinery, Metal Fabrication, Automotive, Aerospace and Defense, Energy, Electronics and High Tech, Medical Devices, Measuring and Controlling Devices, Rubber and Plastics, Furniture and Fixtures, Lumber and Wood, Primary Metals, Construction and Engineering, Consumer Goods (Packaged and Durable), Distribution and Warehouse Management, Value-Added Fulfillment, Beverage Distribution, Redistribution, Service Bureaus, Financial Services, Senior Living Services and General Business Services.
10
Table of Contents
Epicor includes the following application suites: Customer Relationship Management (CRM), Sales Management, Service Management, Human Capital Management (HCM), Financial Management, Supply Chain Management (SCM), Production Management, Planning and Scheduling Management, Product Data Management (PDM), Enterprise Performance Management (EPM), Governance, Risk and Compliance Management (GRC), Global Business Management (GBM) and Epicor ICE Business Architecture.
| • | Customer Relationship Management (Contact, Lead and Opportunity, Case and Marketing Management) is an integrated solution for controlling a company’s interaction with its customers, partners and prospective customers: from building, executing and tracking campaigns through lead generation, opportunity development, configuring quotations and managing pipelines and forecasts. Through the use of the Internet and Microsoft Office® integration, Epicor CRM affords companies with increased visibility, participation and interaction with their customers and prospects across all facets of the value chain process. |
| • | Sales Management (Estimate and Quote, Order, and Demand Management, Advanced EDI, Storefront) streamlines the sales process and assists in coordinating activities between sales, plant/warehouse operations, shipping and accounting. It facilitates more efficient management of inventory visibility, pricing, shipping, invoicing and commissions and provides tools to produce more accurate estimates, streamline the quote-to-cash cycle and improve customer service. |
| • | Service Management (Contract Management, Return Material Authorization, Field Service) provides a collaborative and mobile framework for streamlining service operations. It helps create a 360-degree view of a company’s customers to assist in the diagnosis and resolution of inquiries, cases, change requests and issues related to support or service contracts and service-level agreements. |
| • | Human Capital Management (Payroll, Human Resource Management, Training and Recruitment, Employee Self-Service) solutions deliver software support for all employee related functions whether distributed or centralized. This enables organizations to manage a geographically dispersed workforce in a global manner, ensuring support for various local payroll and legal reporting requirements. |
| • | Financial Management (Accounts Receivable, Accounts Payable, General Ledger, Financial Report Writer, Cash Management, Multicurrency Management, Fixed Asset Management, Consolidations and Eliminations, Rebates, Tax Connect) provides local, regional and multi-national businesses with a complete suite of modules to support the collection, monitoring and reporting of their financial information; maximizing visibility, increasing performance and improving cash flow. |
| • | Supply Chain Management (Purchase, Inventory, Warehouse, and Advanced Material Management, Sourcing and Procurement, Shipping and Receiving) helps increase supply chain visibility and remove non-value added processes. By synchronizing processes throughout its value chain, a company can improve its ability to meet customer demands, provide faster delivery and lower costs. |
| • | Production Management (Job Management, Lean Production, Manufacturing Execution, Quality Assurance, Advanced Quality Management, Data Collection and Handheld) includes modules and sophisticated technologies to help model best practices and empower shop floor personnel to make the decisions that can help to optimize production processes. |
| • | Planning and Scheduling Management (Forecasting and Master Production Scheduling, Material Requirements Planning, Scheduling and Resource Management, Advanced Planning and Scheduling, Project Management) offers flexible planning and scheduling solutions to help global make-to-order, make-to-stock and mixed-mode manufacturers and distributors improve service levels, response times and drive growth by optimally allocating materials, capacity and resources to meet increasingly complex order and delivery requirements. |
| • | Product Data Management (Bill of Materials, Product Costing, Routings, Engineering Change and Revision Control, Product Configuration, Product Lifecycle Management) serves as a central knowledge repository and system of record for the management and tracking all of the information related to a product and its lifecycle; from design and launch, through production, archiving and end of life. Product Data Management manages a wide variety of critical product information including product structure, |
11
Table of Contents
| technical specifications, drawings, documents and tooling, as well as revision history, versions, configurations and variants. Its modules help promote integration, data exchange, control, compliance, and communication across all constituents of the value chain (internal and external) that interact with the products. |
| • | Enterprise Performance Management (Management Reporter, Budgeting, Planning and Forecasting, Operational Data Store and Data Warehousing, Scorecards and KPIs, Trackers and Dashboards) provides reporting and analysis, real-time business activity monitoring (BAM), business activity queries (BAQ), system-wide inquiries with drill-around (Trackers) and role-based dashboards to enable increased collaboration, flow of information and better decision support between users, applications, suppliers and customers. Elements of Epicor EPM, Microsoft Management Reporter, Active Planner budgeting, planning and forecasting, and Epicor Cube Connect and Performance Canvas solutions are common component applications also available with the Company’s Enterprise, Clientele, E4SE and iScala products. |
| • | Governance, Risk and Compliance Management (Corporate Governance, Global Trade Compliance, Risk, Security, Environmental and Energy Management) enables companies to implement and operate ongoing GRC initiatives that can help them comply with the mandates, policies and tenets of the regulatory bodies that oversee their business. Epicor GRC provides process controls, documentation, business automation, and workflow tools that when applied with procedural controls, can greatly assist an organization in increasing the visibility and internal transparency necessary to meet their compliance and regulatory goals. |
| • | Global Business Management (Multicompany, Global Multisite, Multilingual and Master Data Management) increases the flexibility and operational control of information in a distributed ERP environment through the embedded support of master data management and control of transactional functions between systems and locations. Depending on the customer requirement, Epicor GBM allows for centralized or distributed operational control, enterprise-wide visibility, inter-company supply chain management and financial consolidation across the extended organization. |
| • | Epicor ICE Business Architecture (Epicor True SOA™, Microsoft .NET Framework, Web Services, Web 2.0, Operating System and Database Independence, SaaS, Hosted and On-Premise Deployment, Business Process Management) leverages both the social and technical aspects of Web 2.0 technologies with SOA to deliver a technology platform designed for people, built for business and ready for change. Epicor ICE includes the Epicor Everywhere™ Framework , which stores client business logic as XML metadata and permits Epicor applications to run as smart clients or Web clients, or on mobile devices, all from the same source code. It also includes embedded business process management (BPM) capabilities to manage user-defined workflows based on events, conditions, rules and/or established tolerances that can generate notifications, actions and alerts for transactions, metrics or processes. |
Epicor ICE Business Architecture includes the following common component applications known collectively as the Epicor Productivity Pyramid, which are also generally available with the Company’s Enterprise, Clientele, ITSM, iScala, Vantage and Vista products:
| • | Information Worker (IW) increases productivity by enabling users to work more efficiently by incorporating line-of-business information within Microsoft Office. Using service-oriented principles and the .NET Framework, IW utilizes the Microsoft Office system to enhance the user experience and interaction with Epicor applications through familiar Office desktop productivity tools. With IW, users are able to synchronize Microsoft Office Outlook® contacts, appointments and tasks with Epicor applications and data, such as customer information, sales history, inventory levels and production schedules both online and offline. |
| • | Portal is a Web-based enterprise information portal, offering a self-service middleware solution designed to help customers, suppliers and employees access relevant information from both within the enterprise (such as account information or support activity) and from external sources (industry information, news feeds, weather, etc). Portal consists of a Portal framework based on Microsoft SharePoint® products and technologies, which is enriched by role-based access and content-specific information packs (e.g. customer content, supplier content and employee content). |
| • | Service Connect is a business integration middleware platform which functions as a central point for secure workflow orchestrations within Epicor, as well as external connectivity to |
12
Table of Contents
| Epicor and non-Epicor applications. Business components, represented as Web services outside of the application, can be orchestrated within Service Connect to eliminate non-value added steps, increase efficiencies and speed up processes. Service Connect provides collaboration and integration between subsidiaries and their corporate headquarters, as well as to customers and suppliers, to support integrated supply chain trading. |
Global Retail - Epicor Retail
Epicor Retail integrates comprehensive retail management software with hardware and services to provide a complete solution for fashion, apparel and specialty retailers, as well as general merchandise and department stores. Designed for integration and scalability, Epicor Retail is a complete end-to-end retail solution for large multi-store, multi-channel retailers that can also be delivered preconfigured to small single-store retailers for rapid implementation or provided as a hosted, managed services offering, which can bring all of the benefits of “big retailer” functionality to small and midsized retailers. As a best-of-breed point solution, modules of Epicor Retail are deployed into some of the largest multi-register chain and department store environments. Epicor Retail is designed to help retailers choose, acquire and manage merchandise; engage, service and retain customers; and analyze and optimize sales to improve business operations and meet the evolving merchandise and service expectations of today’s multichannel consumers.
Epicor Retail is comprised of modules that can be deployed as a complete solution, preconfigured or fully hosted to support the retailer’s complete business process and provide an integrated “post-to-host” experience from POS through the retail supply chain to the back office. Applications of Epicor Retail are designed to be modular and can also be delivered as best-of-breed solutions – integrated into a retailers existing environment, to meet a specific need or requirement. The following applications are presently generally available in Epicor Retail: Planning, Sourcing and Product Lifecycle Management, Merchandising, Store, Cross-Channel Order Management, CRM, Audit and Operations Management, Business Intelligence and Financials.
| • | Planning automates the creation and balancing of product and store plans to enable retailers to allocate store plans more quickly and easily. Retailers can also plan assortments by store with combined visual and numeric planning. Plans can be synchronized across the retail organization, which can help retailers to develop effective inventory models that can maximize sales while minimizing risks. |
| • | Sourcing and Product Lifecycle Management (PLM) streamlines sourcing processes which can help retailers bring products to market quickly and cost effectively. With centralized workflow management for product development, collaborative vendor negotiation capability, production and logistics tracking, Sourcing and PLM provides the retailers with key tools that can increase visibility and productivity, and drive more efficient supply chain management. |
| • | Merchandising enables retailers to more effectively manage inventory across the enterprise and improve the performance and coordination of processes throughout the retail cycle. Merchandising includes a complete suite of advanced applications and tools to assist retailers in analyzing ordering, pricing, distribution, and the overall management of merchandise to maximize return on investment. Leveraging consistent data across processes, the solution synchronizes and integrates purchasing, pricing, receiving, allocation, replenishment and inventory management. Merchandising is designed for scalability and can support many users, stores and large volumes of data. Highly adaptable and easy to tailor, Merchandising also includes powerful decision-support tools. Built using an open architecture, the Microsoft .NET Framework and Web services, Merchandising equips retailers to operate efficiently, respond to trends, and continue to grow – in local markets and around the world. |
| • | Store is an integrated suite of retail applications designed to address in-store technology requirements, enable retailers to deliver a superior shopping experience to their customers, and increase the efficiency and service levels of store personnel. Store is designed around a flexible, multi-tier architecture using the Microsoft .NET Framework to enable a high degree of scalability, extensibility and interoperability. Store provides a variety of deployment options and configurations including thin and thick client, as well as an enterprise model, where the server functions are in a central location versus at each store or store group. Store includes a feature-rich POS and complete in-store system with a highly flexible configurator. Real-time features include CRM, stock locate and returns management, as well as a full complement of in-store back office modules. Mobile Store extends key functionality from the POS and back office solutions to wireless devices; un-tethering managers and other store personnel so that they can more freely engage with customers to increase service levels and improve the overall shopping experience. |
13
Table of Contents
| • | Enterprise Selling is a cross-channel order management solution that combines real-time inventory and location management with a configurable order manager to integrate inventory and transaction processing across multiple sales channels, allowing retailers to sell merchandise and satisfy customer demand from anywhere in the enterprise. Enterprise Selling is fully integrated to the Epicor Retail solutions. It receives product and inventory data from Merchandising, creates and fulfills orders in Store, transmits orders to WMS for fulfillment, reserves product for orders in Merchandising and updates Sales Audit with new, changed, fulfilled and cancelled order information. |
| • | CRM provides a broad set of complementary tools to enable mutually beneficial relationships between a retailer and its customers. These tools are designed to drive sales, increase loyalty and support the business processes necessary for success in today’s competitive marketplace. CRM provides integrated capabilities for customer analysis, customer segmentation, campaign management and loyalty points program management with real-time targeted communications to POS or other sales channels. Designed to support multiple sales channels and employing powerful analysis tools, this solution provides a complete and consolidated view of the customer through dashboards, key performance indicators (KPIs) and reporting templates. The CRM Customer Dashboard is created from a library of Web parts which provides a building-block approach that allows users to select the information that is meaningful to them and display it on a Web page. Users can also add information from other sources to complement or enhance their Customer Dashboard. |
| • | Audit and Operations Management consolidates, validates and secures data from all sales channels into one location and to one standard, then maps it consistently to your enterprise applications. Sales Audit manages the integrity and accuracy of the data flowing into corporate or head office information systems by auditing, validating and correcting errors up front and bridging the gap between the enterprise and its sales channels. Voucher Management provides real-time updating of balances for gift cards, gift certificates, and merchandise credits. Loss Prevention automatically detects patterns of fraudulent activity and identifies procedural violations to reduce shrink, deter theft and increase profitability while keeping the store an employee-friendly workplace. Employee Productivity and Commissions enables a retailer to evaluate, track, encourage and reward employee performance correctly, fairly and automatically. |
| • | Business Intelligence assists retailers in the collection and aggregation of a wide variety of data from their sales audit, merchandising and CRM solutions. Analysis and reporting tools can provide fresh insights and reveal emerging trends sooner, enabling more rapid and accurate decision making. Business Intelligence uses a data warehouse and cubes optimized for queries, custom reporting, drill downs, rich analytics, critical business metrics and dashboards. A variety of direct action tools give retailers increased insight and broader control of their retail enterprise. |
| • | Financials are designed to automate and streamline a retailer’s financial processes with tools and controls to respond to increasingly complex legislative requirements and create value through timely financial monitoring and reporting. Financials provide a comprehensive end-to-end financial solution –which is integrated with Epicor Retail solutions. |
| • | Secure Data Manager (SDM) streamlines the process of securing retail information and payment data to support compliance with evolving Payment Card Industry (PCI) data security standards and Payment Application Data Security Standards (PA-DSS). Secure Data Manager is a single application that consolidates and manages cardholder payment data in a secure manner from a variety of sources and applications. Using tokens or codes as a reference for interfaced applications, SDM increases controls and secures personal data by managing payment information through a single product. SDM can reduce the time, effort and expense associated with establishing, verifying and maintaining compliance across multiple solutions and can streamline the process of securing sensitive cardholder data, wherever it may reside in an organization. |
To support implementation of Epicor Retail, a wide range of services are available including project management, requirements definition, system configuration, custom development, user training and standards documentation, store and corporate support, database administration and managed and ongoing client care services.
Industrial - iScala
iScala is an integrated ERP, CRM and SCM solution targeting the divisions and subsidiaries of Global 1000 corporations and large local and regional companies worldwide. iScala’s collaborative functionality, country-specific localizations and multi-language capabilities are designed to support global, multi-company deployments
14
Table of Contents
with significant cross-border trading requirements. iScala is targeted to meet the unique needs of companies in industry segments including: Pharmaceutical, Chemical and Allied Products, Industrial Machinery, Light Engineering, Automotive Components, Consumer Goods and Hospitality.
iScala enables Global 1000 enterprises to standardize their plants and operating divisions on a single system, while supporting country specific localizations and languages at each site. This allows a corporate headquarters consistent visibility of plant information and operations, as well as the ability to support the implementation of consistent procedures, practices and controls worldwide.
iScala is optimized for use with the Microsoft Windows 2000/2003/2008 operating system and the Microsoft SQL Server 2000/2005/2008 relational database. iScala leverages XML Web services to enable integration with other applications within and external to the enterprise. In addition to the availability of XML Web services, iScala supports various industry standard technologies, including Microsoft Message Queue Services, Transaction Services and COM+ architecture, which along with XML documents, improves componentization and supports reliable message-based integration between applications and distributed servers.
iScala can be configured as an Enterprise Server version targeted at multi-site operations or as a Business Server version targeted at single-site operations. Each server version consists of the following optional suites and components: Financials (including General Ledger, Sales Ledger, Purchase Ledger, Promissory Notes, Cash Flow, Direct Invoicing and Fixed Assets), Asset Management, CRM, Sales Order Management, Material Management (including Stock Control and Purchase Management), Warehouse Management, Supply Chain Tools, Requisition Management, Commission Management, Warehouse Data Collection, Manufacturing, Advanced Manufacturing, Manufacturing Value Pack, Service Contract Management, Purchase Contract Management, Sales Contract Management, Lease Contract Management, Project Management, Service Management and Payroll. In addition to these application components, Epicor Service Connect enables collaboration between applications, suppliers and customers, and the iScala Business Intelligence Server offers a suite of analytical and reporting tools designed to convert data into information that can be presented by the Web, portals, Windows or Office documents.
iScala’s global functionality and numerous country-specific localizations provide the ability to deliver a solution for over 140 countries and territories with the local requirements for tax management, currency handling, language capabilities, statutory reporting, banking interfaces and asset depreciation rules.
Local and distributed multi-company capabilities enable customers to manage complex business infrastructures. Multiple companies on a single server or on a server farm (multiple local servers) can be consolidated across differing charts of accounts and differing currencies, as well as enabling inquiring or reporting across companies or sharing Accounts Receivable and Accounts Payable. Global calendar management enables the system to manage companies, customers, suppliers, engineers, warehouses and any other resources across multiple time-zones. Global Administration provides central IT staff with the ability to manage distributed iScala system assets anywhere in the world as if they were local, including system updates, user roles, security, menu configuration and databases.
iScala’s customization and personalization capabilities provide the ability to enhance the application through parameterized set-up, tailored documents, reports and user defined database fields. Users may have their own customized menus and screens in their own language, as well as their own queries, reports and business intelligence analytics. Microsoft Visual Basic for Applications (VBA) is also included to enhance client customization and facilitate integration with third-party applications.
iScala’s implementation of Epicor Service Connect provides collaboration and integration between subsidiaries and their corporate headquarters as part of a distributed or two-tier ERP strategy, and to customers and suppliers to support integrated supply chain trading. Collaboration provides visibility through a web-based portal, transaction exchange and system-to-system connectivity. Workflow management is designed to maximize the automation of standard processes with events and alerts to handle exceptions.
Other Products
Epicor Enterprise
Epicor Enterprise (incorporates products formerly named e by Epicor, Platinum ERA/SQL and Clientele), an integrated, customer-centric suite of client/server and Web-based ERP software applications, is designed to meet the unique business needs of midsized companies worldwide (including divisions and subsidiaries of larger corporations). Epicor Enterprise is typically targeted to either distribution or service-based businesses with revenues between $25 million and $1 billion annually. These organizations require the functional depth and sophistication of traditional high-end enterprise business applications, but desire a rapid and cost-effective product implementation.
15
Table of Contents
Epicor Enterprise includes the following application suites: CRM Suite, Financials Suite, Supply Chain Management Suite, Portal Suite, Business Intelligence Suite, Project Suite, Payroll/Human Resources and industry-specific solutions delivered for a variety of markets.
Epicor for Service Enterprises
Epicor for Service Enterprises (E4SE) is a Microsoft .NET and Web services-based ERP for Services solution aimed at global, midmarket and enterprise service firms. E4SE is designed to streamline business processes, empower them to expand their value chain, grow revenue, and drive efficiency benefits to the bottom line. Whether it is a professional services organization (PSO), embedded service organization (ESO) or internal services organization (ISO), the Company believes that E4SE provides a comprehensive ERP for Services solution that can deliver long-term strategic value with a rapid return on investment.
Epicor Vantage®
Epicor Vantage is an integrated ERP solution built on a SOA that meets the dynamic requirements of discrete mixed-mode manufacturers who have lean or ‘to-order’ manufacturing requirements and increasing distribution and fulfillment needs. Vantage handles many manufacturing philosophies simultaneously including make-to-order, configure-to-order, engineer-to-order, make-to-stock and flow manufacturing. Vantage is designed as an easy-to-use, yet comprehensive solution that enables manufacturers to leverage their resources through its tools for customer relationship management, estimating, visual scheduling, job tracking and costing, as well as shop floor data collection. Vantage can manage enterprises from a single site, to multiple locations, to large global multi-company enterprises whose systems span multiple servers and databases across different geographies and languages.
Epicor Vantage is comprised of groups of modules or suites that can be differently configured to comprehensively support a manufacturer’s or a distributor’s unique business processes. Vantage includes the following application suites: CRM, Sales Management, Customer Service Management, Product Data Management, Planning and Scheduling, Materials Management, Financial Management, eBusiness Suite and Business Performance Management.
Epicor Vista®
Epicor Vista is an enterprise software solution specifically designed for the needs of smaller job shops, emerging manufacturers and the make-to-order departments of larger businesses that have less developed infrastructures, lower IT budgets, require a shorter deployment period and seek established, user-friendly products.
Epicor Vista fully integrates over 20 business modules including: Customer Connect, EDI, Contact Management, Quotes, Orders, Shipping/Receiving, Jobs, Scheduling, Data Collection, Quality Assurance, Advanced Bill of Materials, Document Management, Inventory, Purchasing, Advanced Inventory Management, Purchasing RFQ, Accounts Receivable, Accounts Payable, General Ledger, Payroll, Currency Management and Dashboard.
Epicor Clientele®
Epicor Clientele is an integrated CRM solution designed to meet the needs of rapidly growing, small and midsized organizations. Clientele combines employee applications, such as opportunity management, with customer applications, such as Web-based order entry/inquiry, to provide companies and customers a true, up-to-the-minute picture of their relationship. A smart client application, Clientele uses the Internet to interact with XML Web services, providing access to data according to specific business rules. Clientele leverages XML Web services to enable integration with other applications within and external to the enterprise.
Epicor Clientele is comprised of Clientele Customer Support, which provides call management, product tracking, RMA tracking, call queuing/follow-up and problem resolution and Clientele Sales and Marketing, which provide contact, lead, opportunity and account management, and Clientele Self-Service Portal, which enables customers to submit support calls as well as check on the status of existing calls, view their detailed product information and returned merchandise authorizations or drill down into the usage and adjustment details of their service agreements directly over the Web.
16
Table of Contents
Epicor ITSM
Epicor ITSM provides a set of service management features designed to help support IT processes and operations as outlined by the IT Infrastructure Library (ITIL), which defines the detailed descriptions of key IT practices along with detailed the checklists, tasks and procedures for implementation in IT organizations. Epicor ITSM supports the key IT processes outlined by ITIL version 2 and version 3 and has been certified by Pink Elephant as ITIL compatible in five key service management areas: incident management, problem management, change management, configuration management and service level management.
Epicor ITSM includes the following application suites: Incident Management, Problem Management, Change Management, Configuration Management, and Service Level Management. Epicor ITSM also provides IT financial management, including purchasing, inventory, and registration of assets, a self-service portal and business intelligence solution. The solution is built using Microsoft Visual Studio and Microsoft .NET Framework and is available in 13 languages.
Epicor iSolutions
The Company offers a number of additional manufacturing focused products incorporated under the iSolutions brand including Epicor Avanté, Dataflo, Manfact and Manage 2000. These products provide an extended ERP platform designed for midsized manufacturers of discrete, highly engineered products with complex requirements and operations in a variety of manufacturing environments and industries including make-to-stock, repetitive, configure-to-order, engineer-to-order, make-to-order and mixed-mode.
Other Product Offerings
The Company serves as an original equipment manufacturer, vendor or reseller for certain third-party software applications and pays royalties to various organizations in connection with the distribution of third-party software and the sale of products that incorporate third-party technologies. In addition, in certain cases, as part of solutions requested by customers of Epicor, Enterprise, Vantage, Vista, iScala, Avanté, DataFlo and Epicor Retail, the Company resells third-party computer hardware systems and related peripherals.
Marketing, Sales and Distribution
The Company sells, markets and distributes its products and services worldwide, primarily through a direct sales force, as well as through an indirect channel including a network of value added resellers (VARs), distributors and authorized consultants who market the Company’s products on a predominately nonexclusive basis. The Company’s products are sold to and used by a broad customer base, including manufacturers, distributors, retailers, sports and leisure, recreation and service organizations, as well as companies in technology/software, healthcare, government, education and other sectors. The Company sells its Epicor, Enterprise, iScala and Vantage solutions through a hybrid channel that includes a direct sales force and a network of VARs. The Company also sells its Clientele, ITSM and Vista solutions through an internal telesales organization and through a network of VARs. The Epicor Retail, Avanté and Manage 2000 products are presently sold by direct sales forces. In the United Kingdom, Epicor Retail products, which were previously sold by NSB, are sold by a distributor. The Avanté product is sold in certain international locations through VARs and distributors. The Company’s field sales organizations are generally organized on a geographic basis.
In recognition of global opportunities for its software products, the Company has committed resources to a global sales and marketing effort. The Company has established offices in the United Kingdom, Hungary, Romania, Sweden, Australia, New Zealand, Canada, Mexico, Hong Kong, Singapore, Taiwan, Malaysia and South Africa to further such sales and marketing efforts. The Company sells its products in Europe, Central and South America, Africa, Asia and the Middle East through a mix of direct operations, value-added resellers and certain third-party distributors.
The Company translates and localizes certain products directly or on occasion through outside contractors, for sale in Europe, the Middle East, Africa, Latin America and Asia Pacific.
The Company also provides access to its solutions through Epicor Outsourcing Services, which includes application hosting and related managed services. Customers can access the software over the Internet from servers that are typically housed in data centers or co-location facilities versus at the customer’s site. Epicor Outsourcing Services allows customers to purchase the infrastructure and system support on a monthly basis through leading global infrastructure providers like NaviSite, Inc. and IBM Corporation. Hosting provides a deployment alternative to companies that do not want to invest in the hardware, IT personnel or the technology infrastructure necessary to support a premise-based software deployment. By hosting the software through Epicor
17
Table of Contents
Outsourcing Services, a company can free up critical capital resources, both intellectual and monetary, and focus on its core business operations. Epicor Outsourcing Services manages data back-up and disaster recovery to increase continuity, security and support un-interrupted access to business applications. Alongside application hosting services, managed services can deliver application portfolio management, and enhance normal support and maintenance offerings with comprehensive release and application infrastructure management and administration, backed by full help desk access and service level protection services.
A natural progression from hosting and managed services is business process outsourcing (BPO), which offers companies the ability to increase focus on their core business, better manage cost, and gain access to skilled resources by the transitioning of non-value added business processes, such as the management of the accounts payable process, to Epicor.
Professional Services, Technical Support and Software Maintenance
The Company provides a range of value-added services as part of the Epicor Global Services offering. Epicor Consulting Services and Epicor Outsourcing Services provide consulting services, managed services, outsourcing and hosting services to support the implementation and integration of the Company's software products, as well other technical and business consulting and programming services. Epicor Education Services deliver embedded education, online learning and on-site training options. Professional services are available globally, as part of the Company’s Signature Methodology, on a time and materials basis. The Company also provides fixed fee and shared benefit engagements and occasionally, value-based engagements in which customer payments are tied to the achievement of specific milestones. Fixed fee or milestone-based contracts are based on developing mutually agreed upon project plans, which clearly define the activities that will be performed and the specific deliverables that will be produced, in accordance with predefined acceptance criteria.
The Company is committed to providing timely, high-quality technical support, which the Company believes is critical to maintaining customer satisfaction. Epicor Support Services provide technical support by offering telephone support, e-mail support, facsimile support and communications through its Web site. Telephone support is available five days a week during normal business hours on a nearly worldwide basis, with extended hours and emergency support additionally available.
The Company believes its Epicor Global Services, in conjunction with its current and planned product offerings, facilitates the licensing of technology to customers, stimulates demand for the Company’s products and provides a key market differentiator over many of its competitors as a single source vendor.
The Company also believes customer satisfaction can be maintained by ensuring that it’s Value-Added Resellers (VARs), distributors and authorized consultants are able to effectively provide front-line technical support and assistance to end users. The Company offers comprehensive training, telephone consultation and product support for its VARs, distributors and authorized consultants. Training courses are available electronically and in major cities worldwide.
The Company’s network of VARs and authorized consultants are required to undergo training and certification procedures provided by the Company on the use, installation and implementation of the Company’s products as a condition of being authorized by the Company to sell its products. The Company's VARs include consulting groups and resellers, the majority of which provide software and hardware installation, systems integration and consulting services to organizations. The Company’s authorized consultants generally are not resellers of the Company’s products, but professional firms who offer implementation services and product support to end users. The Company believes that its authorized consultants are product influencers and are a valuable part of the Company’s marketing, sales and distribution efforts.
18
Table of Contents
To support the Company's network of VARs and authorized consultants, the Company provides experienced personnel who are specifically tasked with VAR growth and support. These individuals are responsible for educating and training the distribution channel, disseminating information, implementing marketing programs and developing regional markets.
The Company’s software maintenance programs are the customers’ sole avenue for product updates and technical support. The annual maintenance fee is generally based on a percentage of the list price of the software purchased. Customers who subscribe for maintenance receive telephone and technical support, timely information on product enhancements and features and product updates and upgrades. Revenue from these software maintenance agreements is recognized ratably over the maintenance period. The Company provides a warranty for the media on which its products are licensed and also provides a performance warranty on certain products ranging from three months to one year.
Customer and Backlog
No single customer accounted for more than 10% of revenue for the years ended December 31, 2009, 2008 and 2007. Products are generally shipped as orders are received or within a short period thereafter and, accordingly, the Company has historically operated with little or no license backlog. Because of the generally short cycle between order and shipment, the Company believes that its backlog as of any particular date is not significant or meaningful.
Product Development and Quality Assurance
The Company plans to continue addressing the needs of midmarket users of client/server and Web-based enterprise software by continuing to develop high quality software products that feature advanced technologies. See “Certain Factors That May Affect Future Results – Forward Looking Statements – Safe Harbor.” The Company's technology strategy is to develop leading business application software using its own technologies, based on and combined with leading third-party, industry-standard technologies in database management systems, application development tools, operating systems, user interfaces and networks. The Company plans to use technologies from Microsoft Corporation whenever possible and plans to build technologies based on Microsoft Corporation’s recommended technical architecture. In particular, the Company believes that it remains an industry leader in designing and developing products for Microsoft platforms, including the .NET Framework. The Company also believes that it has been a pioneer in the use of browsers and GUIs with integrated business application software. Currently, the Company continues to pursue applications based on a SOA and Web services that can simplify the development, maintenance, deployment and customization of its products.
The Company intends to continue to invest in product development. In particular, the Company plans to continue to (i) develop product enhancements, including additional functions and features, for its product lines, (ii) continue to leverage a SOA, Web services and the Microsoft .NET Framework, (iii) develop additional enterprise applications supporting both business-to-business and business-to-consumer solutions and (iv) develop and/or acquire new applications or modules that build upon the Company’s business application strategy. See “Certain Factors That May Affect Future Results – Forward Looking Statements – Safe Harbor.”
The Company’s technical strategy for its Epicor, Epicor for Service Enterprises, iScala, Enterprise, Clientele, Epicor Retail, Vantage and Vista suites of applications is centered on the Microsoft .NET Framework to provide enhanced scalability, flexibility and interoperability. The architecture consists of a multi-tiered, distributed application model and a comprehensive set of infrastructure and application services. This architecture provides tools, technologies and services to develop highly adaptive applications that can support multiple client deployments including smart-client, browser-based and mobile clients. More importantly, this architecture provides the infrastructure for connecting enterprises through the Internet for enterprise application integration, electronic commerce and business interoperability through industry leading support for XML Web services. Epicor believes that it has maintained a leadership position with respect to the .NET Framework and Web services. The Company was among the first early adopters invited by Microsoft to work with Visual Studio® .NET and the .NET Framework and participated with Microsoft in the launch of the Web services Interoperability Organization (WS-I.org) to promote standards for interoperability and accelerate the adoption and deployment of Web services. The Company was also the first vendor to release enterprise CRM and ERP for Services applications fully re-architected for the .NET Framework. See “Certain Factors That May Affect Future Results – Forward Looking Statements – Safe Harbor.”
The computer software industry is characterized by rapid technological advances and continual changes in customer business requirements and priorities. The Company’s future success will depend upon its ability to enhance its current products and develop and introduce new products that keep pace with technological
19
Table of Contents
developments, respond to evolving customer requirements and continue to achieve market acceptance. In particular, the Company believes it must continue to respond quickly to users’ needs for broad functionality and multi-platform support and to advances in hardware and operating systems, particularly in the areas of Business Process Management, On-Demand Business and Collaborative Commerce.
The Company’s future business is dependent on the execution of the strategy that is in place to target the enterprise software needs of midsized businesses and the divisions of global enterprises. Any significant delay in shipping new modules or enhancements could have a material adverse effect on the Company’s results of operations. In addition, there can be no assurance that new modules or product enhancements developed by the Company will adequately achieve market acceptance.
Expenditures for software development were $49.2 million, $52.5 million and $37.4 million for the years ended December 31, 2009, 2008 and 2007, respectively. Expenditures for software development as a percentage of revenue were 12.0%, 10.8% and 8.7% for the years ended December 31, 2009, 2008 and 2007, respectively.
Competition
The enterprise business applications software industry is intensely competitive, rapidly changing and significantly affected by new product offerings and other market activities. A number of companies offer enterprise application suites similar to the Company’s product offerings that are targeted at the same markets. In addition, a number of companies offer “best-of-breed,” or point solutions, similar to or competitive with a portion of the Company’s enterprise business application suite. Some of the Company’s current competitors, as well as a number of new potential competitors, have larger technical staffs, larger more established marketing and sales organizations and significantly greater financial resources than the Company. There can be no assurance that competitors will not develop products that are superior to the Company’s products or that achieve greater market acceptance. The Company’s future success will depend significantly upon its ability to increase its share of its target markets and to license additional products and product enhancements to existing customers. There can be no assurance that the Company will be able to compete successfully or that competition will not have a material adverse effect on the Company’s results of operations. In addition, potential customers may increasingly demand that certain of the Company’s enterprise systems incorporate certain RDBMS or operating system software offered by competing products, but not currently supported by the Company’s products.
The Company primarily competes in three enterprise business applications markets: emerging enterprises, midmarket enterprises, and divisions of the Global 1000. The Company defines emerging enterprises as rapidly growing businesses under $25 million in annual revenues. Emerging enterprises generally lack dedicated information technology management resources and require affordable solutions that do not require a high level of ongoing maintenance and support for their continued operation. Products in this market are principally sold through VARs and telesales persons with the purchasing decision often influenced by professionals providing consulting services. The Company believes that purchases in this market are primarily influenced by functionality, performance, availability of a Web or Windows-based solution, price and quality. The Company believes it competes favorably with respect to all of these factors.
The Company competes primarily in the midmarket, which the Company defines as growing enterprises with revenues between $25 million and $1 billion. Businesses in the midmarket require solutions that provide a more sophisticated level of functionality to effectively manage their business. These businesses require applications that are easy to implement, extend, manage and use, as well as being affordable. Midmarket enterprises also often lack dedicated information technology management resources and need solutions that do not require a high level of ongoing maintenance and support for their continued operation. The Company believes that purchases in this market are primarily influenced by functionality, performance, availability of Web, Windows, and Mobile-based solutions, price, quality, and customer service. The Company believes it competes favorably with respect to all of these factors. Increasingly, customers in this market segment are looking for Microsoft SQL Server-based solutions, and the Company’s product lines are well positioned to address this requirement.
The Company also competes for the divisions and subsidiaries of larger Global 1000 corporations, which the Company defines as enterprises with over $1 billion in annual revenue. Global 1000 companies seeking to deploy a standard business solution across their subsidiary operations, in what is referred to as a two-tier ERP strategy, have typically been challenged with the total cost of ownership (TCO) of deploying their corporate level tier-1 system to operating units which often operate more like midmarket entities. Additionally, localization issues and technical infrastructure problems in remote locations have made tier-1 global roll-outs cost prohibitive. These businesses may require a single standardized application that can be deployed worldwide using a low cost decentralized implementation, as opposed to implementing through a centralized infrastructure. At the same time, they require the ability to roll-up management information on a daily or weekly basis, as well as support drill-down
20
Table of Contents
from corporate or regional offices to the underlying data in the subsidiaries as required. The Company believes that purchases in this market are primarily influenced by availability, high functionality, integration, localization, overall cost of ownership, availability of a Windows-based solution, standardization and a global customer support infrastructure. The Company believes it competes favorably with respect to all of these factors. Increasingly, customers in this market segment are looking for Microsoft SQL Server based solutions. The Company believes its product lines are well positioned to address this requirement.
The Company believes it is one of only a few vendors in this market space that is dedicated to providing midmarket companies and the divisions and subsidiaries of the Global 1000 with comprehensive, integrated enterprise business applications. However, there are competitors from both the high-end and low-end who are attracted to the business opportunity represented by the midmarket and are beginning to offer complete or partial enterprise business applications to this market. In order to compete in the future, the Company must respond effectively to customer needs in the area of business process management (BPM) and service-oriented architecture (SOA) and incorporate those technologies and application functionality that will meet the challenges posed by competitors’ innovations. To accomplish this objective, the Company will be required to continue to invest in enhancing its current products and, when necessary, introduce new products to remain competitive. There can be no assurance that the Company will be able to continue to invest in such enhancements or new products, or introduce such enhancements or new products in a timely fashion or at all.
The Company has a number of competitors that vary in size, target markets and overall product scope. The Company’s primary competition comes from independent software vendors in four distinct groups, including (i) large, multinational ERP vendors that are increasingly targeting midsized businesses as their traditional market becomes saturated, including Oracle Corporation (includes PeopleSoft and J.D. Edwards) and SAP AG, (ii) mid-range ERP vendors, including Infor Global Solutions (includes Geac, Mapics, SSA, Symix and Systems Union), Lawson Software Inc. (includes Intentia), IFS and Microsoft Corporation (includes Dynamics, Great Plains, Axapta and Navision), (iii) established “best-of-breed” or point solution providers that compete with only one portion of the Company’s overall ERP suite, including Sage Software, Ltd. and Systems Union, Ltd. (now part of Infor Global Solutions) for financial accounting; Deltek, Inc., UNIT4 Agresso N.V, and BST Global for professional services automation; HighJump Software, Inc. (owned by Battery Ventures), Activant Solutions Inc (Prophet21) , and Manhattan Associates, Inc. for distribution and warehousing; QAD, Inc., for specifically automotive manufacturing; JDA Software Group, Inc., SAP AG and DataVantage (owned by MICROS Systems, Inc.) for specialty retail; and Salesforce.com Inc., Siebel Systems Inc. (owned by Oracle Corporation), FrontRange Solutions USA, Inc. and Numara Software, Inc. for sales force automation, customer service and support and ITSM and (iv) emerging software-as-a-service (SaaS) providers including NetSuite Inc., Plex Online and Salesforce.com, Inc. In addition, as the Company sells its products to larger companies, it also faces increased competition from larger and well-established competitors such as Oracle and SAP AG. While these competitors offer dedicated applications, the Company believes that its broad product offerings, global infrastructure and level of product integration provide a significant competitive advantage.
Intellectual Property
The Company regards its software as proprietary in that title to and ownership of the software generally resides exclusively with the Company, and the Company attempts to protect it with a combination of copyright, trademark and trade secret laws, employee and third-party nondisclosure agreements and other industry standard methods for protecting ownership of its proprietary software. Despite these precautions, there can be no assurance unauthorized third parties will not copy certain portions of the Company’s products or reverse engineer or obtain and use information the Company regards as proprietary. To date, the Company has not relied on patent protection for its software products. While the Company’s competitive position may be affected by its ability to protect its proprietary information, the Company believes that trademark and copyright protections are less significant to the Company’s success than other factors such as the knowledge, ability and experience of the Company’s personnel, name recognition, and ongoing product development and support. There can be no assurance that the mechanisms used by the Company to protect its software will be adequate or that the Company’s competitors will not independently develop software products that are substantially equivalent or superior to the Company’s software products.
The Company’s software products are generally licensed to end users on a “right to use” basis pursuant to a perpetual, non-exclusive license that generally restricts use of the software to the organization’s internal business purposes. Additionally, the end user is generally not permitted to sublicense or transfer the products. When sold through VARs and distributors, the Company licenses its software products pursuant to “shrink wrap” licenses that are not signed by licensees and therefore may be unenforceable under the laws of certain jurisdictions. In addition, the laws of some foreign countries do not protect the Company’s proprietary rights to the same extent as do the laws of the United States. Certain components of the Company’s products are licensed from third parties.
21
Table of Contents
The source code for the Avanté and, in certain cases, Manage 2000, Vantage, and Enterprise products historically has been licensed to customers to enable them to customize the software to meet particular requirements. The standard customer license contains a confidentiality clause protecting the products. In the event of termination of the license agreement, the customer remains responsible for the confidentiality obligation and for any accrued and unpaid license fees. However, there can be no assurance that such customers will take adequate precautions to protect the source code or other confidential information.
As the number of software products in the industry increases and the functionality of these products further overlap, the Company believes that software programs will increasingly become subject to infringement claims. There can be no assurance that third parties will not assert infringement claims against the Company in the future with respect to current or future products or that any such assertion may not require the Company to enter into royalty arrangements or result in costly litigation.
Employees
As of January 31, 2010, the Company had 2,539 full-time employees. The Company had 558 in product development, 451 in support services, 758 in professional services, 374 in sales, 72 in marketing and 326 in administration. The Company’s employees are not represented by any collective bargaining organization, and the Company has never experienced a work stoppage. The Company believes that employee relations are good.
Available Information
Our Annual Report on Form 10-K, Quarterly Reports on Form 10-Q, Current Reports on Form 8-K and amendments to reports filed pursuant to Section 13(a) or 15(d) of the Securities Exchange Act of 1934, as amended, are available free of charge on our website at www.epicor.com, as soon as reasonably practicable after such reports are electronically filed with or furnished to the Securities and Exchange Commission.
22
Table of Contents
| Item 1A. | RISK FACTORS |
Certain Factors That May Affect Future Results
Economic conditions could materially adversely affect the Company.
The Company’s operations and performance depend significantly on worldwide economic conditions. Uncertainty about current global economic conditions poses a risk as consumers and businesses may continue to postpone spending in response to tighter credit, unemployment, negative financial news and/or declines in income or asset values, which could have a material negative effect on demand for the Company’s products and services. These and other economic factors could materially adversely affect demand for the Company’s products and services and on the Company’s financial condition and operating results. Uncertainty about current global economic conditions could also increase the volatility of the Company’s stock price.
Our future results could be harmed by economic, political, geographic, regulatory and other specific risks associated with our international operations.
The Company believes that any future growth of the Company will be dependent, in part, upon the Company’s ability to maintain and increase revenues in its existing and emerging international markets, including Asia and Latin America. During the fiscal years ended December 31, 2009, 2008 and 2007, 31.5%, 32.6% and 39.8%, respectively, of total Company revenues were generated by the Company’s international operations. There can be no assurance that the Company will maintain or expand its international sales. If the revenues that the Company generates from foreign activities are inadequate to offset the expense of maintaining foreign offices and activities, the Company’s business, financial condition and results of operations could be materially and adversely affected. The international reach of the Company’s businesses could also subject the Company and its results of operations to unexpected, uncontrollable and rapidly changing economic and political conditions. Specifically, our international sales and operations are subject to inherent risks, including:
| • | Differing intellectual property and labor laws; |
| • | Lack of experience in a particular geographic market; |
| • | Different and changing regulatory requirements in various countries and regions; |
| • | Tariffs and other barriers, including import and export requirements and taxes on subsidiary operations; |
| • | Fluctuating exchange rates and currency controls; |
| • | Difficulties in staffing and managing foreign sales and support operations; |
| • | Longer accounts receivable payment cycles; |
| • | Potentially adverse tax consequences, including repatriation of earnings; |
| • | Development and support of localized and translated products; |
| • | Lack of acceptance of localized products or the Company in foreign countries; |
| • | Shortage of skilled personnel required for local operations; and |
| • | Perceived health risks (e.g. swine flu), natural disasters or terrorist risks which impact a geographic region and business operations therein. |
Any one of these factors or a combination of them could materially and adversely affect the Company’s future international sales and, consequently, the Company’s business, operating results, cash flows and financial condition. A portion of the Company’s revenues from sales to foreign entities, including foreign governments, has been in the form of foreign currencies. While the Company does enter into hedges and other similar foreign currency contracts from time to time, there can be no assurance that such activities will effectively minimize the impact that fluctuations in the value of foreign currencies may have on the Company. Specifically, during 2009, foreign currency transaction losses totaled $0.5 million. Fluctuations in the value of foreign currencies have in the past and could continue to adversely impact the profitability of the Company’s foreign operations.
23
Table of Contents
We have a significant amount of debt in connection with our convertible senior note offering in 2007 and borrowings under our 2007 credit agreement.
As of December 31, 2009, we had approximately $230 million of outstanding debt related to our convertible note offering. In addition, in February 2008, we borrowed $160 million under our Credit Agreement dated December 16, 2007, as amended, of which $67.5 million is outstanding at December 31, 2009, to finance the acquisition of NSB and to pay certain fees and expenses incurred in connection with the acquisition. Our substantial indebtedness could adversely affect our business, financial condition and results of operations and our ability to meet our payment obligations under our outstanding liabilities.
This level of debt could have significant consequences on our future operations, including:
| • | Making it more difficult for us to meet our payment and other obligations under our outstanding debt; |
| • | Resulting in an event of default if we fail to comply with the financial and other restrictive covenants contained in our credit agreements, which event of default could result in all of our debt becoming immediately due and payable and, in the case of an event of default under our secured debt, such as our senior secured credit facility, could permit the lenders to foreclose on our assets securing that debt. For example, we have failed to meet the financial covenants in our credit agreement once and have been forced to seek a waiver or amendment by paying a penalty to prevent an event of default. Although we recently amended the financial covenants in a manner favorable to us, if we are unable to satisfy these amended financial covenants in the future, amendments or waivers to the credit agreement may not be available on reasonable terms or at all, which may result in an event of default and acceleration of the debt, which we may be unable to pay; |
| • | Reducing the availability of our cash flow to fund working capital, capital expenditures, acquisitions and other general corporate purposes, and limiting our ability to obtain additional financing for these purposes; |
| • | Subjecting us to the risk of increased sensitivity to interest rate increases on any indebtedness with variable interest rates; |
| • | Limiting our flexibility in planning for, or reacting to, and increasing our vulnerability to, changes in our business, the industry in which we operate and the general economy; and |
| • | Placing us at a competitive disadvantage compared to our competitors that have less debt or are less leveraged. |
Any of the above-listed factors could have an adverse effect on our business, financial condition and results of operations and our ability to meet our payment obligations under our outstanding liabilities.
Fluctuations in foreign currency exchange rates may negatively impact the financial results of the Company.
The results of operations or financial condition of the Company may be negatively impacted by fluctuations in foreign currency exchange rates. The Company operates throughout the world through international sales subsidiaries, networks of exclusive third party distributors, and non-exclusive dealers. As a result, certain sales and related expenses are denominated in currencies other than the United States dollar. The Company’s results of operations may fluctuate due to exchange rate fluctuation between the United States dollar and other currencies because our financial results are reported on a consolidated basis in United States dollars and through the use of foreign currency denominated loans available under the Company’s credit facility. In an effort to minimize operation fluctuations due to currency movements, we may attempt to limit foreign exchange exposure through operational strategies (e.g. natural hedges, netting, leading and lagging of accounts payables and account receivables) to offset the effects of exchange rate changes. In addition, the Company may enter into forward currency contracts and purchase options contracts to mitigate unfavorable impacts to our non-operating income.
The continued future success of our Epicor product could materially impact our ability to successfully grow our business.
Epicor, our next generation ERP software product, became generally available during the fourth quarter of 2008. Based on results to date, we expect Epicor to continue to be the ERP solution of choice for the focused vertical markets we serve and to provide near and long-term opportunities for license growth acceleration into current and new markets we plan to address, as well as generate migration and upgrade license sale opportunities into our installed base of customers worldwide. If we are not able to continue to successfully market and license Epicor in
24
Table of Contents
the future, it may have an adverse effect on our financial condition and results of operations. In addition, we operate in a highly competitive segment of the software industry and if our competitors develop more successful products or services, our revenue and profitability will most likely decline.
If the emerging and current technologies and platforms of Microsoft Corporation and others upon which the Company builds its products do not gain or retain broad market acceptance, or if we fail to develop and introduce in a timely manner new products and services compatible with such emerging technologies, we may not be able to compete effectively and our ability to generate revenues will suffer.
The Company’s software products are built and depend upon several underlying and evolving relational database management system (“RDBMS”) platforms such as Microsoft SQL Server, Progress and Rocket U2. To date, the standards and technologies that the Company has chosen to develop its products upon have proven to be popular and have gained broad industry acceptance. However, the market for the Company’s software products is subject to ongoing rapid technological developments, quickly evolving industry standards and rapid changes in customer requirements, and there may be existing or future technologies and platforms that achieve industry standard status, which are not compatible with our products. Additionally, because the Company’s products rely significantly upon popular existing user interfaces to third party business applications, the Company must forecast which user interfaces will be or will remain popular in the future. For example, the Company believes the Internet has and continues to transform the way businesses operate and the software requirements of customers, who are increasingly shifting towards Web-based applications and away from server-based applications. Specifically, the Company believes that customers desire business software applications that enable a customer to engage in commerce or service over the Internet. The Company is proceeding on its previously announced determination to continue with development of several of its primary product lines upon the Microsoft .NET technology. If the Company cannot continue to develop such .NET compatible products in time to effectively bring them to market, or if .NET does not continue to be a widely accepted industry standard, or if customers adopt competitors’ products when they shift to Web-based applications, the ability of the Company’s products to interface with popular third party applications will be negatively impacted and the Company’s competitive position, operating results and revenues could be adversely affected.
New software technologies could cause us to alter our business model resulting in adverse effects on our operating results.
Development of new technologies may also cause the Company to change how it licenses or prices its products, which may adversely impact the Company’s revenues and operating results. Emerging licensing models include Software as a Service (SaaS), hosting and subscription-based licensing, in which the licensee essentially rents software for a defined period of time, as opposed to the current perpetual license model. While the Company does currently offer a hosted model as well as a SaaS model to its NSB retail customers, and to a limited extent, its enterprise customers, it has to date chosen not to offer a subscription-based model. The Company’s future business, operating results and financial condition will depend on its ability to effectively train its sales force to sell an integrated comprehensive set of business software products and recognize and implement emerging industry standards and models, including new pricing and licensing models.
If the Company fails to respond to emerging industry standards, including licensing models and end-user requirements, the Company’s competitive position and revenues could be adversely affected.
A significant portion of our future revenue is dependent upon our existing installed base of customers continuing to license additional products, as well as purchasing consulting services and renewing their annual maintenance and support contracts. If our existing customers fail to renew their maintenance and support agreements or fail to purchase new user licenses or product enhancements or additional services from the Company at historical levels, the Company’s revenues and results of operations could be materially impacted.
Historically, approximately 50% to 60% of the Company’s license revenues, 90% of the Company’s maintenance revenues and a substantial portion of the Company’s consulting revenues are generated from the Company’s installed base of customers. Maintenance and support agreements with these customers are traditionally renewed on an annual basis at the customer’s discretion, and there is normally no requirement that a customer renew or that a customer pay new license or service fees to the Company following the initial purchase. For example, as a result of the recent economic downturn, some customers
25
Table of Contents
have not renewed their maintenance and support agreements. If the Company’s existing customers do not renew their maintenance and support agreements or fail to purchase new user licenses or product enhancements or additional services at historical levels, our revenues and results of operations could be materially impacted.
We have recorded a large amount of goodwill and other acquired intangible assets that we will be required to write down and record an expense if they become impaired.
In connection with our acquisitions, as of December 31 2009, we have goodwill of $368.3 million and $84.1 million of amortizing acquired intangible assets on our balance sheet. Although the goodwill is not amortized, we are required to test the goodwill for impairment at least yearly and any time there is an indication an impairment may have occurred. For example, a significant decline in stock price, like the one that occurred for our common stock following December 31, 2008, may require us to test our goodwill for impairment. If we determine that the carrying value of the goodwill or other acquired intangible assets is in excess of its fair value, we will be required to write down a portion or all of the goodwill or other acquired intangible assets, which would adversely impact our results of operations and our ability to satisfy financial covenants in our credit agreement.
Our increasingly complex software products may contain errors or defects, which could result in the rejection of our products and damage to our reputation as well as cause lost revenue, delays in collecting accounts receivable, diverted development resources and increased service costs and warranty claims.
The Company’s software products are made up of increasingly complex computer programs. Software products are complex and products offered by the Company often contain undetected errors or failures (commonly referred to as bugs) when first introduced to the market or as new updates or upgrades of such products are released to the market. Despite testing by the Company, and by current and potential customers, prior to general release to the market, the Company’s products may still contain material errors after their initial commercial shipment. Such material errors may result in loss of or delay in market acceptance of the Company’s products, damage to the Company’s reputation and increased service and warranty costs. Ultimately, such errors could lead to a decline in the Company’s revenues. The Company has from time to time been notified by some of its customers of errors in its various software products. Although it has not occurred to date, the possibility of the Company being unable to correct such errors in a timely manner could have a material adverse effect on the Company’s results of operations and its cash flows. In addition, if material technical problems with the current release of the various database and technology platforms, on which the Company’s products operate, including offerings by Progress Software Corporation, Rocket Software and Microsoft Corporation (i.e., SQL and .NET), occur, such difficulties could also negatively impact sales of these products, which could in turn have a material adverse effect on the Company’s results of operations.
The market for new development tools, application products and consulting and education services continues to emerge, which could negatively affect our client/server and Web-based products, and, if the Company fails to respond effectively to evolving requirements of these markets, the Company’s business, financial condition, results of operations and cash flows could be materially and adversely affected.
The Company’s development tools, application products and consulting and education services generally help organizations build, customize or deploy solutions that operate in both client/server-computing and Web-based environments. The Company believes that the environment for application software is continuing to change from client/server to a Web-based environment to facilitate commerce on the Internet. There can be no assurance that the market for client/server computing will continue to grow, or will not decrease, or that the Company will be able to continue to respond effectively to the evolving requirements of Web-based markets.
The market for our software products and services is highly competitive. If we are unable to compete effectively with existing or new competitors our business could be negatively impacted.
The business information systems industry in general and the manufacturing, distribution, retail, CRM and financial computer software industry specifically, in which the Company competes are very competitive and subject to rapid technological change, evolving standards, frequent product enhancements and introductions and changing customer requirements. Many of the Company’s current and potential competitors have (i) longer operating histories, (ii) significantly greater financial, technical and marketing resources, (iii) greater name recognition, (iv) larger technical staffs and/or (v) a larger
26
Table of Contents
installed customer base than the Company. In addition, as the Company continues to sell to larger companies outside the mid-market, it faces more competition from large well-established competitors such as SAP AG and Oracle Corporation. A number of companies offer products that are similar to the Company’s products and target the same markets. In addition, any of these competitors may be able to respond more quickly to new or emerging technologies and changes in customer requirements (such as commerce on the Internet and Web-based application software), and to devote greater resources to the development, promotion and sale of their products than the Company. Furthermore, because there are relatively low barriers to entry in the software industry, the Company expects additional competition from other established and emerging companies. Such competitors may develop products and services that compete with those offered by the Company or may acquire companies, businesses and product lines that compete with the Company. It also is possible that competitors may create alliances and rapidly acquire significant market share, including in new and emerging markets. Accordingly, there can be no assurance that the Company’s current or potential competitors will not develop or acquire products or services comparable or superior to those that the Company develops, combine or merge to form significant competitors or adapt more quickly than the Company to new technologies, evolving industry trends and changing customer requirements. Competition could cause price reductions, reduced margins or loss of market share for the Company’s products and services, any of which could materially and adversely affect the Company’s business, operating results and financial condition. There can be no assurance that the Company will be able to compete successfully against current and future competitors or that the competitive pressures that the Company may face will not materially adversely affect its business, operating results, cash flows and financial condition.
If we were to lose and not be able to replace the services of the members of our senior management team, we may not be able to execute our business strategy.
Our future success depends in a large part upon the continued service of key members of our senior management team. In particular, our executive officers and other senior members of our management team such as our chief marketing officer and executive and senior vice presidents are critical to the overall management of Epicor as well as the development of our technology, our operations and our strategic direction. All of our executive officers and key employees are at-will employees, and we do not maintain any key-person life insurance policies. The transition of key executives, such as at the CEO level over the last year, as well as the loss of other key members of our executive management team, such as the departure in 2008 of our Chief Operating Officer and Chief Financial Officer, could adversely affect our ability to compete effectively and seriously harm our business if the management team is unable to lead the Company during such times of transition or attract qualified replacements in a timely manner.
We may not be able to maintain and expand our product offerings or business if we are not able to retain, hire and integrate sufficiently qualified personnel.
The Company’s success depends in large part on the continued service of key management personnel that are not subject to employment agreements, including, but not limited to, several of the key personnel employed as a result of the Company’s recent acquisitions. In addition, the Company needs to expand its workforce to continue its growth, and the competition to attract, retain and motivate qualified technical, sales and software development personnel is intense. Additionally, the sudden unexpected loss of such technical personnel, such as developers can have a negative impact on the Company’s ability to develop and introduce new products in a timely and effective manner. There is no assurance that the Company will retain its key personnel, including those who came to the Company as part of acquisitions, or attract sufficient numbers of qualified key personnel in the future. The failure to retain or attract such persons could have a material adverse effect on the Company’s business, operating results, cash flows and financial condition.
Our software products incorporate and rely upon third party software products for certain key functionality and our revenues, as well as our ability to develop and introduce new products, could be adversely affected by our inability to control or replace these third party products and operations.
The Company’s products incorporate and rely upon software products developed by several other third party entities such as Microsoft Corporation, Progress Software Corporation, and Rocket Software, Inc. Specifically, the Company’s software products are built and depend upon several underlying and evolving relational database management system platforms including Microsoft SQL Server, Progress OpenEdge™ and Rocket® U2™, and also are integrated with several other third party provider products for the
27
Table of Contents
purpose of providing or enhancing necessary functionality. In the event that these third party products were to become unavailable to the Company or to our customers, either directly from the third party manufacturers or through other resellers of such products, the Company could not readily replace these products with substitute products. As a result, the Company cannot provide assurance that these third parties will:
| • | Remain in business; |
| • | Continue to support the Company’s product lines; |
| • | Maintain viable product lines; |
| • | Make their product lines available to the Company on commercially acceptable terms; and |
| • | Not make their products available to the Company’s competitors on more favorable terms. |
In the long term (i.e., a year or more), an interruption of supply from these vendors could potentially be overcome through migration to another third party supplier or development within the Company. However, any interruption in the short term could have a significant detrimental effect on the Company’s ability to continue to market and sell those of its products relying on these specific third party products and could have a material adverse effect on the Company’s business, results of operations, cash flows and financial condition.
We may pursue strategic acquisitions, investments and relationships and may not be able to successfully manage our operations if we fail to successfully integrate such acquired businesses and technologies, which could adversely affect our operating results.
As part of its business strategy, the Company may continue to expand its product offerings to include application software products and services that are complementary to its existing software applications, particularly in the areas of electronic commerce or commerce over the Internet, or may gain access to established customer bases into which the Company can sell its current products. The Company’s acquisitions of Scala in 2004, CRS in 2005 and NSB in 2008 are typical of this ongoing strategy. However, while this strategy has historically and may in the future involve acquisitions, investments in other businesses that offer complementary products, joint development agreements or technology licensing agreements, the specific risks we commonly encounter in these types of transactions include the following:
| • | Difficulty in effectively integrating any acquired technologies or software products into our current products and technologies; |
| • | Difficulty in predicting and responding to issues related to product transition such as development, distribution and customer support; |
| • | The possible adverse impact of such acquisitions on existing relationships with third party partners and suppliers of technologies and services; |
| • | The possibility that customers of the acquired company might not accept new ownership and may transition to different technologies or attempt to renegotiate contract terms or relationships, including maintenance or support agreements; |
| • | The possibility that the due diligence process in any such acquisition may not completely identify material issues associated with product quality, product architecture, product development, intellectual property issues, key personnel issues or legal and financial contingencies; |
| • | Difficulty in integrating acquired operations, including incorporating internal control structures, due to geographical distance, and language and cultural differences; and |
| • | Difficulty in retaining employees of the acquired company. |
A failure to successfully integrate acquired businesses or technology for any of these reasons could have a material adverse effect on the Company’s results of operations.
We rely, in part, on third parties to sell our products. Disruptions to these channels would adversely affect our ability to generate revenues from the sale of our products.
The Company distributes products through a direct sales force as well as through an indirect distribution channel, which includes VARs and other distributors and authorized consultants, consisting primarily of professional firms. During the fiscal years ended December 31, 2009, 2008 and 2007, approximately
28
Table of Contents
10%, 11% and 13%, respectively, of the Company’s software license revenues were generated by VARs and distributors. If the Company’s VARs, distributors or authorized consultants cease distributing or recommending the Company’s products or emphasize competing products, the Company’s results of operations could be materially and adversely affected. The success of the Company’s VARs, distributors and authorized consultants depends in part upon their ability to attract and maintain qualified sales and consulting personnel. Additionally, the Company’s VARs, distributors and authorized consultants may generally terminate their agreements with the Company upon as little as 30 days notice. Almost all partners though may effectively terminate their agreements at any time by ceasing to promote or sell our products. If our VARs or other distributors are unable to maintain such qualified personnel or if several of the Company’s VARs or other distributors were to cease doing business or terminate their agreements and the Company is unable to replace them in a timely fashion, such factors could negatively impact the Company’s results of operations. Further, there can be no assurance that having both a direct sales force and a distribution channel for the Company’s products will not lead to conflicts between those two sales forces that could adversely impact the Company’s ability to close sales transactions or could have a negative impact upon average selling prices, any of which may negatively impact the Company’s operating revenues and results of operations. Finally, many VARs, distributors and authorized consultants operate on narrow operating margins and have been negatively affected by the past by weak economic conditions. The Company’s financial condition and operating results could be materially adversely affected if the financial condition of these VARs, distributors or authorized consultants weakens.
If third parties infringe upon our intellectual property, we may expend significant resources enforcing our rights or suffer competitive injury, which could adversely affect our operating results. In addition, we may be subject to claims that we infringe upon the intellectual property of others.
The Company considers its proprietary software and the related intellectual property rights in such products to be among its most valuable assets. The Company relies on a combination of copyright, trademark and trade secret laws (domestically and internationally), employee and third party nondisclosure agreements and other industry standard methods for protecting ownership of its proprietary software. However, the Company cannot assure that in spite of these precautions, an unauthorized third party will not copy or reverse-engineer certain portions of the Company’s products or obtain and use information that the Company regards as proprietary. From time to time, the Company has in the past taken legal action against third parties whom the Company believed were infringing upon the Company’s intellectual property rights. However, there is no assurance that the mechanisms that the Company uses to protect its intellectual property will be adequate or that the Company’s competitors will not independently develop products that are substantially equivalent or superior to the Company’s products.
Moreover, the Company from time to time receives claims from third parties that the Company’s software products infringe upon the intellectual property rights of others. The Company expects that as the number of software products in the United States and worldwide increases and the functionality of these products further overlaps, the number of these types of claims will increase. This risk is potentially heightened in such diverse international markets as Eastern Europe, Asia and the Middle East. Although it has not yet occurred to date, any such claim, with or without merit, could result in costly litigation and require the Company to enter into royalty or licensing arrangements. The terms of such royalty or license arrangements, if required, may not be favorable to the Company. In addition, in certain cases, the Company provides the source code for some of its application software under licenses to its customers to enable them to customize the software to meet their particular requirements and to distributors or other third party developers to translate or localize the products for resale in foreign countries. Although the source code licenses contain confidentiality and nondisclosure provisions, the Company cannot be certain that such customers, distributors or third-party developers will take or have taken adequate precautions to protect the Company’s source code or other confidential information. Moreover, regardless of contractual arrangements, the laws of some countries in which the Company does business or distributes its products do not offer the same level of protection to intellectual property, as do the laws of the United States.
Our quarterly operating results are difficult to predict and subject to substantial fluctuation.
The Company’s quarterly operating results have fluctuated significantly in the past. For example, from the first quarter of 2007 through the fourth quarter of 2009, quarterly operating results have ranged from a net loss of $9.0 million to net income of $13.9 million. The Company’s operating results may continue to fluctuate in the future as a result of many specific factors that include:
| • | Continued turmoil in the global economy; |
29
Table of Contents
| • | The demand for the Company’s products, including reduced demand related to changes in marketing focus for certain products, software market conditions or general economic conditions as they pertain to information technology (IT) spending; |
| • | Fluctuations in the length of the Company’s sales cycles, which may vary depending on the complexity of our products as well as the complexity of the customer’s specific software and service needs; |
| • | The size and timing of orders for the Company’s software products and services, which, because many orders are completed in the final days of each quarter, may be delayed to future quarters; |
| • | The number, timing and significance of new software product announcements, both by the Company and its competitors; |
| • | Customers’ unexpected postponement or termination of expected system upgrades or replacement due to a variety of factors including economic conditions, credit availability, changes in IT strategies or management changes; |
| • | Changes in accounting standards, including software revenue recognition standards; |
| • | Currency fluctuations; and |
| • | Fluctuations in number of customers renewing maintenance and support. |
In addition, the Company has historically realized a significant portion of its software license revenues in the final month of any quarter, with a concentration of such revenues recorded in the final ten business days of that month. Further, the Company generally realizes a significant portion of its annual software license revenues in the final quarter of the fiscal year.
Due to the above factors, among others, the Company’s revenues are difficult to forecast. The Company, however, bases its expense levels, including operating expenses and hiring plans, in significant part, on its expectations of future revenue. As a result, the Company expects its expense levels to be relatively fixed in the short term. The Company’s failure to meet revenue expectations could adversely affect operating results. Further, an unanticipated decline in revenue for a particular quarter may disproportionately affect the Company’s operating results in that quarter because the majority of the Company’s expenses will be fixed in the short term. As a result, the Company believes that period-to-period comparisons of the Company’s results of operations are not, and will not, necessarily be meaningful, and you should not rely upon them as an indication of future performance. Due to the foregoing factors, it is likely that, as in past quarters, in some future quarters the Company’s operating results will be below the expectations of public market analysts and investors. As in those past quarters, such an event would likely have an adverse effect upon the price of the Company’s outstanding securities.
Our operating cash flows are subject to fluctuation, primarily related to our ability to timely collect accounts receivable and to achieve anticipated revenues and expenses. Negative fluctuations in operating cash flows may require us to seek additional cash sources to fund our working capital requirements. If additional cash sources are not available to the Company, our operations could be adversely affected.
From the first quarter of 2007 through the fourth quarter of 2009, the Company’s quarterly operating cash flows have ranged from $0.1 million provided by operating activities to $34.8 million provided by operating activities. The Company’s cash and cash equivalents have increased from $75.2 million at December 31, 2007 to $106.9 million at December 31, 2009. However, the Company has at times experienced decreasing revenues and, prior to the first quarter of 2003, continued operating losses. If, in the future, the Company is not successful in achieving its anticipated revenues and expenses or maintaining a positive cash flow, the Company may not have sufficient resources for planned growth and may be required to take actions to reduce its operating expenses, such as reductions in work force and/or seek additional sources of funding. Historically, the Company has also experienced fluctuations in the proportion of accounts receivable over 90 days old and days sales outstanding. These fluctuations have been due to various issues, including product and service quality, deteriorating financial condition of customers during the recent recession and lack of effectiveness of the Company’s collection processes. During the past two years, our days sales outstanding have fluctuated from lows of 65 to highs of 91, due to a variety of factors. Given the recent economic turmoil, if the Company cannot successfully collect a
30
Table of Contents
significant portion of its net accounts receivable, the Company may be required to seek alternative financing sources. As of December 31, 2009, the Company had a $230.0 million obligation to holders of the Company’s convertible bonds and $67.5 million in debt.
The market for our stock is volatile and fluctuations in operating results, changes in the Company’s guidance on revenues and earnings estimates and other factors could negatively impact our stock’s price.
During the three-year period ended December 31, 2009, the closing price of the Company’s common stock ranged from a low of $2.36 to a high of $15.49. For the year ended December 31, 2009, the price of the Company’s common stock ranged from a low of $2.36 to a high of $7.89. As of March 1, 2010, the Company had 61,100,212 shares of Common Stock outstanding. The market prices for securities of technology companies, including the Company’s, have historically been quite volatile. Quarter to quarter variations in operating results, changes in the Company’s guidance on revenues and earnings estimates, announcements of technological innovations or new products by the Company or its competitors, announcements of major contract awards, announcements of industry acquisitions by us or our competitors, changes in accounting standards or regulatory requirements as promulgated by the FASB, SEC, NASDAQ or other regulatory entities, changes in management and other events or factors may have a significant impact on the market price of the Company’s Common Stock. In addition, the securities of many technology companies have experienced extreme price and volume fluctuations, which have often been related more to changes in recommendations or financial estimates by securities analysts than to the companies’ actual operating performance. Any of these conditions may adversely affect the market price of the Company’s Common Stock.
A variety of specific business interruptions could adversely affect our business.
A number of particular types of business interruptions could greatly interfere with our ability to conduct business. For example, a substantial portion of our facilities, including our corporate headquarters and other critical business operations, are located near major earthquake faults. We do not carry earthquake insurance and do not fund for earthquake-related losses. In addition, our computer systems are susceptible to damage from fire, floods, earthquakes, power loss, telecommunications failures, and similar events. The Company continues to consider and implement its options and develop contingency plans to avoid and/or minimize potential disruptions to its telecommunication services.
If open source software expands into enterprise software applications, our software license revenues may decline.
Open source software includes a broad range of software applications and operating environments produced by companies, development organizations and individual software developers and typically licensed for use, distribution and modification at a nominal cost or often, free of charge. A notable example of open source software is the Linux operating system, which continues to gain in popularity. To the extent that the open source software models expand and non-commercial companies and software developers create and contribute competitive enterprise software applications to the open source community, we may have to adjust our pricing, maintenance and distribution strategies and models, which could adversely affect our revenue and operating margins.
Future acquisitions of technologies or companies, which are paid for partially, or entirely through the issuance of stock or stock rights could prove dilutive to existing shareholders.
Consistent with past experience, the Company expects that the consideration it might pay for any future acquisitions of companies or technologies could include stock, rights to purchase stock, cash or some combination of the foregoing. For example, the Company’s Scala acquisition in 2004 involved the issuance of approximately 4.25 million shares of the Company’s Common Stock. If the Company issues stock or rights to purchase stock in connection with future acquisitions, earnings (loss) per share and then-existing holders of the Company’s Common Stock may experience dilution.
Because of these and other factors affecting the Company’s operating results, past financial performance should not be considered an indicator of future performance, and investors should not use historical trends to anticipate results or trends in future periods.
31
Table of Contents
Our preferred share rights plan, blank check preferred stock and Delaware law contain provisions that may inhibit potential acquisition bids, which may harm our stock price or discourage potential acquirers.
We have in place a preferred share rights plan and our Board of Directors also has the authority to issue preferred stock and to determine the rights, preferences, privileges and restrictions, including voting rights, of the shares without any further vote or action by our stockholders. If we issue any of these shares of preferred stock in the future, the rights of holders of our common stock may be negatively affected. Although we have no current plans to issue shares of preferred stock, if we issue preferred stock, a change of control of our company could be delayed, deferred or prevented. Furthermore, Section 203 of the Delaware General Corporation Law restricts certain business combinations with any “interested stockholder” as defined by that statute. In the past, we have been the target of unsolicited takeover bids and an unsolicited tender offer. The preferred share rights plan and these other provisions are designed to encourage potential acquirers to negotiate with our Board of Directors and give our Board an opportunity to consider various alternatives to increase stockholder value. The preferred share rights plan and other provisions are also intended to discourage certain tactics that may be used in proxy contests. However, the operation of the preferred share rights plan, the potential issuance of preferred stock or the restrictions in Section 203 of the Delaware General Corporation Law could discourage potential acquisition proposals and could delay or prevent a change in control, which may adversely affect the market price of our stock.
32
Table of Contents
| Item 1B. | UNRESOLVED STAFF COMMENTS |
None.
| Item 2. | PROPERTIES |
The table below outlines the Company’s primary owned properties as of December 31, 2009:
| Location |
Square Footage | |
| Montreal, Canada |
125,000 | |
| Columbus, Ohio |
16,000 |
The table below outlines the Company’s primary property leases as of December 31, 2009:
| Location |
Square Footage | Lease Expiration | ||
| Irvine, California - HQ |
74,000 | July 2011 | ||
| Newburgh, New York |
110,000 | March 2010 to December 2010 | ||
| Monterrey, Mexico |
56,000 | July 2015 | ||
| Minneapolis, Minnesota |
52,000 | August 2012 | ||
| Moscow, Russia |
24,000 | April 2010 | ||
| Bracknell, United Kingdom |
23,000 | March 2019 |
The principal activities in Irvine, California are corporate headquarters, sales, marketing, development and customer support. The principal activities in Minneapolis, Montreal and Newburgh are sales, development, consulting and customer support. Internationally, Bracknell is the international headquarters for sales, marketing, consulting, customer support and administration. Of the total Bracknell space, approximately 8,700 square feet is currently being sublet to a third party. The Company also leases property in Monterrey, Kuala Lumpur, Bratislava, Budapest and Moscow primarily for its product development and customer support centers.
In addition to the locations listed above, the Company leases other offices for sales, service, and product development in various locations worldwide. The Company is continually evaluating its facilities for cost effectiveness and suitability for purpose and will adjust its facilities portfolio to fit the needs of the Company at any point in time. However, the Company believes its current facilities are suitable for their respective uses and adequate for the Company’s needs.
| Item 3. | LEGAL PROCEEDINGS |
On October 17, 2008, a purported class action complaint was filed against Epicor and members of its Board of Directors in Superior Court for Orange County, California, entitled Tola v. Epicor Software et al., Case No. 30-2008-00214327-CU-SL-CXC. On October 30, 2008, plaintiff filed an amended complaint. The amended complaint brought as a purported class action on behalf of a class of Epicor stockholders, alleged that the Board of Directors breached its fiduciary duties by rejecting and failing properly to consider the proposal of Elliott Associates, L.P. (Elliott) to acquire all of Epicor’s outstanding shares of Common Stock, by failing properly to consider other strategic alternatives that may be available to the Company, by failing to maximize shareholder value, and by making misleading disclosures and failing to disclose material information in its Schedule 14D-9. The amended complaint also alleged that the Board of Directors has breached its fiduciary duty by implementing measures that act as a barrier to Elliott’s proposal or to other possible proposals for acquisition of the Company. The complaint sought declaratory relief and injunctive relief requiring the Board of Directors to act in accordance with its fiduciary duties. The amended complaint was dismissed without prejudice by the plaintiff on January 24, 2009.
The Company is subject to other legal proceedings and claims in the normal course of business. The Company is currently defending such proceedings and claims, and, although the outcome of legal proceedings is inherently uncertain presently, the Company anticipates that it will be able to resolve these matters in a manner that will not have a material adverse effect on the Company’s consolidated financial position, results of operations or cash flows.
| Item 4. | RESERVED |
33
Table of Contents
PART II
| Item 5. | MARKET FOR REGISTRANT’S COMMON EQUITY, RELATED STOCKHOLDER MATTERS AND ISSUER PURCHASES OF EQUITY SECURITIES |
The Company’s Common Stock is traded on the NASDAQ Global Select Market under the symbol EPIC. The following table sets forth the range of high and low closing prices for the Company’s Common Stock for the periods indicated.
| Year ended December 31, 2008: |
||||||
| High | Low | |||||
| 1st Quarter |
$ | 12.62 | $ | 10.33 | ||
| 2nd Quarter |
$ | 11.51 | $ | 6.91 | ||
| 3rd Quarter |
$ | 8.71 | $ | 6.47 | ||
| 4th Quarter |
$ | 8.93 | $ | 3.05 | ||
| Year ended December 31, 2009: |
||||||
| High | Low | |||||
| 1st Quarter |
$ | 4.94 | $ | 2.36 | ||
| 2nd Quarter |
$ | 5.70 | $ | 4.01 | ||
| 3rd Quarter |
$ | 6.81 | $ | 5.28 | ||
| 4th Quarter |
$ | 7.89 | $ | 6.35 | ||
There were approximately 1,211 registered security holders of record as of March 1, 2010. Because many of the Company’s shares of common stock are held by brokers or other institutions on behalf of stockholders, the Company is unable to estimate the total number of stockholders represented by the record holders. The Company believes there are a substantially greater number of beneficial holders. The Company has not paid dividends to date and intends to retain any earnings for use in the business for the foreseeable future. The 2007 credit agreement limits the Company from making dividend or other distributions (including the ability to repurchase shares of the Company’s common stock) in connection with the Company’s equity interests. Under the 2007 credit facility, the Company may make up to $50 million of such dividend or other distributions, subject to the financial covenants under the 2007 credit facility.
Performance Graph
This performance graph shall not be deemed “filed” for purposes of Section 18 of the Securities Exchange Act of 1934, as amended (the “Exchange Act”) or otherwise subject to the liabilities under that Section and shall not be deemed to be incorporated by reference into any filing of Epicor Software Corporation under the Securities Act of 1933, as amended or the Exchange Act.
The following graph shows a comparison of cumulative total returns for the Company, the Center for Research in Securities Prices Index for the NASDAQ Stock Market (United States Companies) (the “CRSP NASDAQ Index”) and the Center for Research in Securities Prices Index for NASDAQ Computer and Data Processing Stocks (the “CRSP NASDAQ Computer Index”) for the last five fiscal years ended on December 31, 2009. The graph assumes that $100 was invested on December 31, 2004 in the common stock of the Company, the NASDAQ Market Index and the CRSP NASDAQ Computer Index and assumes that all dividends have been reinvested. The stock price performance on the following graph is not necessarily indicative of future stock price performance.
34
Table of Contents
COMPARISON OF FIVE-YEAR CUMULATIVE TOTAL RETURNS
(Epicor Software Corporation, CRSP NASDAQ Index, CRSP NASDAQ Computer Index)
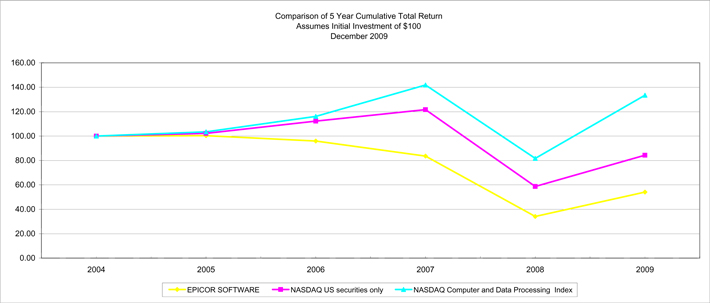
Purchases of Equity Securities by the Issuer and Affiliated Purchasers
| Dates |
(a) Total Number of Shares Purchased |
Average Price Paid Per Share |
Total Number of Shares Purchased as Part of Publicly Announced Plans or Programs |
Maximum Number (or Approximate Dollar Value) of Shares that may Yet Be Purchased Under the Plans or Programs | ||||||
| October 1, 2009 to October 31, 2009 |
1,143 | $ | 7.38 | N/A | N/A | |||||
| November 1, 2009 to November 30, 2009 |
4,472 | $ | 7.53 | N/A | N/A | |||||
| December 1, 2009 to December 31, 2009 |
151,169 | $ | 7.62 | N/A | N/A | |||||
| Total |
156,784 | $ | 7.62 | (1) | ||||||
| (1) | Represents the weighted average price per share purchased during the fourth quarter. |
All shares of the Company’s common stock purchased listed in column (a) were purchased through a plan or program not publicly announced and are shares repurchased under the Company’s restricted stock programs as consideration for the payment of the required withholding taxes.
On November 1, 2007, the Company announced that the Board of Directors authorized the Company to institute a stock repurchase program whereby up to $50 million of its common stock may be repurchased from time to time. The duration of the repurchase program is open-ended. Under the program, the Company is able to purchase shares of common stock through open market transactions at prices deemed appropriate by management. The timing and amount of repurchase transactions under this program will depend on market conditions and corporate and regulatory considerations. The program may be discontinued at any time by the Board of Directors. There were no repurchases that were made pursuant to this program during the fourth quarter of fiscal 2009.
35
Table of Contents
| Item 6. | SELECTED FINANCIAL DATA |
The following selected consolidated financial data should be read in conjunction with “Management’s Discussion and Analysis of Financial Condition and Results of Operations” and our consolidated financial statements and the related notes thereto appearing elsewhere in this Annual Report to fully understand factors that may affect the comparability of information presented below. The following selected Consolidated Statements of Operations data for the years ended December 31, 2009, 2008 and 2007, and the Consolidated Balance Sheet data at December 31, 2009 and 2008, have been derived from audited consolidated financial statements included elsewhere in this Annual Report. The Consolidated Statements of Operations data presented below for the years ended December 31, 2006 and 2005 and the Consolidated Balance Sheet data at December 31, 2007, 2006 and 2005, are derived from audited consolidated financial statements that are not included in this Annual Report.
| As of and for the years ended December 31, | |||||||||||||||||
| in thousands, except per share amounts | 2009 | 2008 | 2007 | 2006 | 2005 | ||||||||||||
| As Adjusted | As Adjusted | ||||||||||||||||
| (1) | (2) | (3) | (4) | (5) | |||||||||||||
| Total revenues |
$ | 409,624 | $ | 487,879 | $ | 429,832 | $ | 384,096 | $ | 289,413 | |||||||
| Net income (loss) |
$ | (1,238 | ) | $ | (3,451 | ) | $ | 39,075 | $ | 23,818 | $ | 52,035 | |||||
| Basic net income (loss) per share |
$ | (0.02 | ) | $ | (0.06 | ) | $ | 0.68 | $ | 0.43 | $ | 0.95 | |||||
| Diluted net income (loss) per share |
$ | (0.02 | ) | $ | (0.06 | ) | $ | 0.67 | $ | 0.42 | $ | 0.92 | |||||
| Total assets |
$ | 738,050 | $ | 752,378 | $ | 643,578 | $ | 441,890 | $ | 428,951 | |||||||
| Long-term debt (less current portion) |
$ | 255,535 | $ | 265,257 | $ | 173,086 | $ | 98,273 | $ | 124,639 | |||||||
| Total stockholders’ equity |
$ | 300,087 | $ | 295,955 | $ | 297,269 | $ | 208,620 | $ | 170,450 | |||||||
| (1) | For the year ended December 31, 2009, net income included restructuring and other charges of $2,210,000. |
| (2) | For the year ended December 31, 2008, net income, basic and diluted net income per share, total assets, long-term debt (less current portion) and total stockholders’ equity were all adjusted for retrospective application of new convertible debt accounting treatment, effective January 1, 2009 (see Note 1 in Notes to Consolidated Financial Statements for more information). Net income included restructuring charges of $9,143,000 and included the results of operations related to the NSB acquisition from February 7, 2008 (date of acquisition) through December 31, 2008. |
| (3) | For the year ended December 31, 2007, net income, basic and diluted net income per share, total assets, long-term debt (less current portion) and total stockholders’ equity were all adjusted for retrospective application of new convertible debt accounting treatment, effective January 1, 2009 (see Note 1 in Notes to Consolidated Financial Statements for more information). Net income included restructuring charges of $909,000 and a non-cash income tax benefit of $13,970,000. |
| (4) | The amounts included in 2006 and the following years reflect the adoption of the new accounting standard on stock-based compensation. |
| (5) | For the year ended December 31, 2005, net income included restructuring charges of $359,000, a non-cash income tax benefit of $18,189,000 and included the results of operations related to the CRS acquisition from December 6, 2005 (date of acquisition) through December 31, 2005. |
36
Table of Contents
| Item 7. | MANAGEMENT’S DISCUSSION AND ANALYSIS OF FINANCIAL CONDITION AND RESULTS OF OPERATIONS |
The following discussion should be read in conjunction with the consolidated financial statements and notes thereto.
Overview
Epicor Software Corporation (Epicor or the Company) designs, develops, markets and supports enterprise application software solutions and services primarily for use by midsized companies and the divisions and subsidiaries of Global 1000 enterprises, which generally consist of companies with annual revenues between $25 million and $1 billion, and emerging enterprises, which generally consist of rapidly growing businesses with annual revenues under $25 million. Epicor’s solutions are designed to help companies focus on their customers, suppliers, partners and employees through enterprise-wide management of resources and information. This collaborative focus distinguishes the Company from conventional enterprise resource planning (ERP) vendors, whose primary focus is improving internal business processes and efficiencies. The Company believes that by automating and integrating information and critical business processes across their entire value chain, enterprises can improve not just their bottom line, but also their top line, allowing them to compete more effectively in today’s increasingly global economy.
The financial market crisis at the end of 2008 and early 2009 has continued to disrupt credit and equity markets worldwide and has led to weakness in the global economic environment. While the effect of the weakness of the global economy is expected to continue to challenge Epicor’s ability to sell software licenses and may negatively impact demand for our consulting services and retail hardware systems, towards the end of 2009 the Company began to see some signs of improvement in revenue. Specifically, license and maintenance revenues for the 2009 fourth quarter each exceeded the 2008 fourth quarter license and maintenance revenues. The adverse economic environment has also increased the difficulty of forecasting revenues, as a decrease in license revenue may lead to a decrease in consulting revenue in the same or subsequent quarters. Lower license revenue may also decrease maintenance revenue since maintenance fees for new product licenses are directly related to software license sales. In late 2008, in response to the difficult economic environment, Epicor took steps to reduce its headcount and lower expenses and continued to do so in 2009 on a more limited basis in targeted areas. The Company continues to monitor the economic situation, the business environment and the Company’s outlook.
Total revenues for the year ended December 31, 2009, decreased 16.0% to $409.6 million, compared to $487.9 million for the year ended December 31, 2008. Net license revenue decreased by 22.3% to $70.2 million for the year ended December 31, 2009, when compared to net license revenue of $90.4 million for the year ended December 31, 2008. Net license revenue improved in the 2009 fourth quarter and was the highest of the 2009 year. 2009 fourth quarter net license revenue was significantly up sequentially over 2009 third quarter net license revenue and also increased when compared to net license revenues in the fourth quarter of 2008. Consulting revenue was $128.4 million for the year ended December 31, 2009, a decrease of 15.6% compared to consulting revenue of $152.2 million for the year ended December 31, 2008. Maintenance revenue for the year ended December 31, 2009 was $191.0 million, a decrease of 0.7% compared to maintenance revenue of $192.3 million for the year ended December 31, 2008. On a quarterly basis, maintenance revenues improved sequentially throughout the 2009 year, and in the fourth quarter of 2009 maintenance revenues increased when compared to the fourth quarter of 2008. Hardware and other revenue for the year ended December 31, 2009 was $20.0 million, a decrease of 62.2% compared to hardware and other revenue of $53.0 million for the year ended December 31, 2008. See discussion in Results of Operations for more detailed information.
Overall gross margin was 48.4% for the year ended December 31, 2009, compared to 44.1% for 2008. Overall gross margin improved principally due to cost reduction measures taken during the year, primarily in consulting and maintenance. Overall gross margins also benefited from a larger mix of higher margin revenues, as hardware revenues, which have significantly lower gross margins, were down significantly from 2008.
Cash flows from operations were $51.6 million during the year ended December 31, 2009, compared to 2008 cash flows from operations of $64.4 million. Cash flows from operating activities decreased due primarily due to lower license sales and less revenues from corresponding software implementations and less cash collected on accounts receivable and for deferred revenue during 2009, as compared to 2008.
The Company reported a net loss of $1.2 million, or $.02 per diluted share, for the year ended December 31, 2009, compared to a net loss of $3.5 million, or $.06 per diluted share, for the year ended December 31, 2008. Net loss for 2009 and 2008 include significant non-cash charges primarily consisting of amortization of intangible assets of $30.8 million and $32.9 million, stock-based compensation expense of $8.1 million and $7.0 million, amortization of long-term debt discount of $7.9 million and $7.4 million, and the write-off of debt issuance fees of $2.6 million
37
Table of Contents
and $0, respectively. Net loss for 2009 and 2008 also includes restructuring and other charges of $2.2 million and $9.1 million, respectively. The net loss for both years excludes revenues that would have been recorded if NSB’s deferred revenues had not been adjusted to fair value in purchase accounting equaling $0.4 million for the year ended December 31, 2009 and $7.7 million for the year ended December 31, 2008.
Critical Accounting Policies
The consolidated financial statements are prepared in conformity with United States of America generally accepted accounting principles (GAAP). As such, management is required to make judgments, estimates and assumptions that affect the reported amounts of assets and liabilities at the date of the consolidated financial statements and the reported amounts of revenues and expenses during the reporting period. The significant accounting policies which are most critical to aid in fully understanding and evaluating reported financial results include the following:
Revenue Recognition
The Company enters into contractual arrangements with end-users that may include licensing of the Company’s software products, product support and maintenance services, consulting services, resale of third-party hardware or various combinations thereof, including the sale of such products or services separately. The Company’s accounting policies regarding the recognition of revenue for these contractual arrangements is fully described in Note 1 of Notes to Consolidated Financial Statements.
The Company considers many factors when applying accounting principles generally accepted in the United States of America related to revenue recognition. These factors include, but are not limited to:
| • | The actual contractual terms, such as payment terms, delivery dates and pricing of the various product and service elements of a contract; |
| • | Availability of products to be delivered; |
| • | Time period over which services are to be performed; |
| • | Creditworthiness of the customer; |
| • | The complexity of customizations and integrations to the Company’s software required by service contracts; |
| • | The sales channel through which the sale is made (direct, VAR, distributor, etc.); |
| • | Discounts given for each element of a contract; |
| • | Any commitments made as to installation or implementation “go live” dates; and |
| • | Whether vendor specific objective evidence of the fair value of undelivered elements exists. |
Each of the relevant factors is analyzed to determine its impact, individually and collectively with other factors, on the revenue to be recognized for any particular contract with a customer. Management is required to make judgments regarding the significance of each factor in applying the revenue recognition standards, as well as whether or not each factor complies with such standards. Any misjudgment or error by management in its evaluation of the factors and the application of the standards, especially with respect to complex or new types of transactions, could have a material adverse affect on the Company’s future revenues and operating results.
Allowance for Doubtful Accounts
The Company’s accounts receivable go through a collection process that is based on the age of the invoice and requires attempted contacts with customers at specified intervals and assistance from other personnel within the Company who have a relationship with the customer. The Company writes off accounts to its allowance when the Company has determined that collection is not likely. The Company believes no significant concentrations of credit risk existed at December 31, 2009. Receivables from customers are generally unsecured.
The Company maintains an allowance for doubtful accounts based on historical collections performance and specific collection issues. If actual bad debts differ from the reserves calculated, the Company records an adjustment to bad debt expense in the period in which the difference occurs. Such adjustment could result in additional charges to the Company’s results of operations.
38
Table of Contents
Intangible Assets
The Company’s intangible assets were recorded as a result of the Company’s acquisitions and represent acquired technology, customer base and trademarks. These intangible assets are amortized over the estimated economic life of the asset. The Company periodically evaluates the recoverability of the intangible assets and considers any events or changes in circumstances that would indicate that the carrying amount of an asset may not be recoverable. Any material changes in circumstances, such as large decreases in revenue or the discontinuation of a particular product line, could require future write-downs in the Company’s intangibles assets and could have a material adverse impact on the Company’s operating results for the periods in which such write-downs occur.
Goodwill
Goodwill was recorded as a result of the Company’s acquisitions. The Company has recorded these acquisitions using the acquisition method and purchase method of accounting. The Company annually performs an impairment review of its recorded goodwill, and in 2009 determined that no impairment of goodwill existed because the estimated fair value of each reporting unit exceeded its carrying amount. The Company tests its recorded goodwill for impairment on an annual basis, or more often if indicators of potential impairment exist, by determining if the carrying value of each reporting unit exceeds its estimated fair value. Factors that could trigger an interim impairment test include, but are not limited to, underperformance relative to historical or projected future operating results, significant changes in the manner of use of the acquired assets or the Company’s overall business, significant negative industry or economic trends and a sustained period where market capitalization, plus an appropriate control premium, is less than stockholders’ equity. Future impairment reviews may require write-downs in the Company’s goodwill and could have a material adverse impact on the Company’s operating results for the periods in which such write-downs occur.
The Company assesses goodwill for impairment at the reporting unit level, which is defined as an operating segment or one level below an operating segment, referred to as a component (defined as a business for which discrete financial information is available and regularly reviewed by component managers). For the Company, the reporting units are the operating segments.
The fair value of each reporting unit is estimated using an average of a market approach and an income approach. The market approach utilizes a guideline company method, which derives applicable market multiples from the prices at which public companies that are comparable to our reporting units are trading in an active marketplace. The Company believes the market approach generally provides a meaningful indicator of fair value as it reflects the current value at which shares of comparable companies are actively traded in a free and open market. The income approach utilizes a discounted cash flow method (DCF) that estimates after-tax cash flows on a debt-free basis, discounted to present value using a risk-adjusted discount rate. The Company believes the DCF provides a meaningful indicator of fair value as well, since it appropriately measures the income producing assets and reflects the income potential that would establish the amount paid by an investor.
The key assumptions used in the market approach included:
| • | The use of comparable publicly traded companies, which the Company considered to be other software, technology and consulting companies in Epicor’s industry. |
| • | The selection of revenue and earnings multiples was based on similarity of size, earnings growth, profitability and other qualitative factors relative to each reporting unit. |
| • | The application of adjustments for a control premium and for risk and growth considerations, which were consistent with premiums and considerations in recent acquisitions. |
The key assumptions used in the DCF approach included:
| • | The reporting unit’s projected future financial results. Revenue growth rates represent estimates based on current and forecasted revenue mix and market conditions. The profit margins were projected by each reporting unit based on historical margins, projected sales mix and current expense structure. |
| • | The projected terminal value, which reflected the total present value of projected cash flows beyond the last period in the DCF. This value reflected the Company’s estimate for stable, perpetual growth of each reporting unit. |
| • | The discount rate was set by using a weighted average cost of capital method that considered market and industry data as well as Company-specific risk factors. |
39
Table of Contents
The Company utilized a combination of income and market approaches to determine the fair values of its reporting units. The Company believes these approaches provide the best indications of the fair values. To corroborate its calculations, the Company performed sensitivity analysis and reconciled its total market capitalization value to the sum of the fair values of the three reporting units. The Company’s market capitalization was in line with the sum of the fair values of the reporting units when a nominal control premium is factored in that the Company believes is consistent with acquisition premiums in its industry. Based on the Company’s calculations and analysis, the fair value of the reporting units exceeded the respective carrying value and the Company concluded no impairment to goodwill.
Based on the results of the first step of the impairment test, the second step was not required and no impairment was recognized. If circumstances change or events occur to indicate that the fair value of any of the Company’s reporting units (under the guidelines discussed above) has fallen below its carrying value, the Company will compare the implied fair value of the goodwill to its carrying value. If the book value of the goodwill exceeds the implied fair value of the goodwill, the Company will recognize the difference as an impairment charge in the determination of operating income.
Stock-Based Compensation
Under the fair value recognition provisions, stock-based compensation expense is measured at the grant date and is expensed ratably over the vesting period. Determining the fair value of stock options at the grant date requires judgment, including estimating expected dividends, volatility, terms and estimating the amount of share-based awards that are expected to be forfeited. If actual forfeiture rates differ significantly from the estimate, stock-based compensation expense and the Company’s results of operations could be materially impacted. Beginning in 2006, the Company changed its previous practice of predominantly granting stock options to employees, and began granting primarily performance-based and time-based restricted stock as an alternative. Compensation expense for restricted stock is based on the fair market value of the restricted stock on its grant date, and is expensed ratably over the vesting period.
Performance-based restricted stock vests upon the attainment of specific performance targets. The measurement date of restricted stock containing performance-based vesting is the date the restricted stock grant is authorized and the specific performance goals are communicated. Compensation expense is recognized based on the probability that the performance criteria will be met. The recognition of compensation expense associated with performance-based vesting requires judgment in assessing the probability of meeting the performance goals, as well as defined criteria for assessing achievement of the performance-related goals. The continued assessment of probability may result in additional expense recognition or expense reversal depending on the level of achievement of the performance goals.
Income Taxes
The Company provides for income taxes based on the estimated effective income tax rate for the complete fiscal year. The income tax provision (benefit) is computed on the pretax income (loss) of the consolidated entities located within each taxing jurisdiction based on current tax law. Deferred tax assets and liabilities are recognized for the future tax consequences attributable to temporary differences between the financial statement carrying amounts of existing assets and liabilities and their respective tax bases and operating loss and tax credit carryforwards. Deferred tax assets and liabilities are measured using enacted tax rates expected to apply to taxable income in the years in which those temporary differences are expected to be recovered or settled. The effect on deferred tax assets and liabilities of a change in tax rates is recognized in income in the period that includes the enactment date.
The Company regularly reviews the deferred tax assets for recoverability and has established a valuation allowance when it is more likely than not that some portion, or all, of the deferred tax assets will not be realized. The Company assesses the recoverability of the deferred tax assets and the need for a valuation allowance on an ongoing basis. In making this assessment, the Company is required to consider all available positive and negative evidence to determine whether, based on such evidence, it is more likely than not that some portion, or all, of the net deferred assets will be realized in future periods.
The Company is subject to income taxes in the United States and numerous foreign jurisdictions. Significant judgment is required in evaluating our uncertain tax positions and determining our provision for income taxes. The Company applies a two-step approach to recognizing and measuring uncertain tax positions. The first step is to evaluate the tax position for recognition by determining if the weight of available evidence indicates that it is more likely than not that the position will be sustained on audit, including resolution of related appeals or litigation processes, if any. The second step is to measure the tax benefit as the largest amount that is more than 50% likely of being realized upon settlement.
40
Table of Contents
Although the Company believes it has adequately reserved for its uncertain tax positions, no assurance can be given that the final tax outcome of these matters will not be different. The Company adjusts these reserves in light of changing facts and circumstances, such as the closing of a tax audit or the refinement of an estimate. To the extent that the final tax outcome of these matters is different than the amounts recorded, such differences will impact the provision for income taxes in the period in which such determination is made. The provision for income taxes includes the impact of reserve provisions and changes to reserves that are considered appropriate, as well as the related net interest.
During the ordinary course of business, there are many transactions and calculations for which the ultimate tax determination is uncertain. As a result, the Company recognizes tax liabilities based on estimates of whether additional taxes and interest will be due. These tax liabilities are recognized when, despite the Company’s belief that its tax return positions are supportable, the Company believes that certain positions may not be fully sustained upon review by tax authorities. The Company believes that its accruals for tax liabilities are adequate for all open audit years based on its assessment of many factors including past experience and interpretations of tax law. To the extent that the final tax outcome of these matters is different than the amounts recorded, such differences will impact income tax expense in the period in which such determination is made.
United States income taxes were not provided for on unremitted earnings from certain non-United States subsidiaries. Those unremitted earnings are considered to be indefinitely reinvested.
New Accounting Pronouncements
For new accounting pronouncements see Note 1 in Notes to the Consolidated Financial Statements.
Acquisition
NSB Retail Systems PLC
On February 7, 2008, the Company completed its acquisition of NSB Retail Systems PLC (NSB). NSB designs, develops, markets and supports store and merchandising solutions to retailers of apparel, footwear and specialty merchandise. The acquisition of NSB provides an expanded portfolio of products and services for large and mid-sized specialty retailers and department stores, as well as a fully hosted, managed service offering designed for smaller retailers who are interested in rapid implementation via an on-demand versus on-premise offering.
Pursuant to the terms of the acquisition agreement, shareholders of NSB received £0.38 in cash for each NSB ordinary share. The value of the fully diluted share capital of NSB was approximately $311.8 million, not including transaction costs, based on the exchange rates in effect at the time the United States dollars were converted to pounds sterling for purposes of the transaction. The consideration payable under the agreement was funded by the Company with approximately $161.0 million in existing cash balances, with the balance of the consideration being funded by drawing from funds available pursuant to the 2007 credit facility (Note 6 in Notes to Consolidated Financial Statements).
The total purchase price for NSB is shown below (in thousands):
| Cash |
$ | 311,845 | |
| Transaction costs |
6,449 | ||
| Total purchase price |
$ | 318,294 | |
The acquisition of NSB is accounted for as a purchase business combination. Under the purchase method of accounting, the purchase price was allocated to NSB’s tangible and intangible assets acquired and liabilities assumed based on their estimated fair values as of February 7, 2008, with any excess being ascribed to goodwill. Management is primarily responsible for determining the fair values of these assets. The fair value of the assets acquired and liabilities assumed represent management’s estimate of fair values. See Note 4 in Notes to the Consolidated Financial Statements for a discussion of goodwill and intangibles acquired.
41
Table of Contents
The following table summarizes the allocation of the purchase price (in thousands):
| Fair value of tangible assets acquired: |
||||
| Cash and cash equivalents |
$ | 33,181 | ||
| Accounts receivable |
18,274 | |||
| Inventory |
1,196 | |||
| Property and equipment |
16,038 | |||
| Prepaid and other assets |
4,720 | |||
| Deferred tax assets |
2,047 | |||
| Total tangible assets acquired |
75,456 | |||
| Acquired technology |
58,700 | |||
| Acquired in-process research and development |
200 | |||
| Customer base |
39,300 | |||
| Trade name |
3,500 | |||
| Goodwill |
198,240 | |||
| Accounts payable and accrued expenses |
(24,221 | ) | ||
| Deferred revenue |
(17,328 | ) | ||
| Other long-term liabilities |
(2,264 | ) | ||
| Deferred tax liabilities |
(13,289 | ) | ||
| Net assets acquired |
$ | 318,294 | ||
In connection with the acquisition, the Company formulated a restructuring plan for the NSB operations. As a result, the Company recorded a liability of $4.5 million for the costs related to involuntary employee terminations. This liability was included in the allocation of the purchase, as was appropriate under GAAP at the time of the acquisition. Execution of the restructuring plan was completed as of December 31, 2008.
Included in the Company’s operating results for the year ended December 31, 2008 is a charge of $0.2 million for the acquired in-process research and development projects related to the NSB acquisition. The in-process research and development projects arose from new products that were under development at the date of the acquisition and were expected to eventually lead to new products but had not yet established technological feasibility and for which no future alternative use was identified. The valuation of the in-process research and development projects was based upon the discounted expected future cash flows of the products over the products’ expected life, reflecting the estimated stage of completion of the projects and the estimate of the costs to complete the projects.
See Note 3 in Notes to Consolidated Financial Statements for Pro Forma information related to this acquisition.
42
Table of Contents
Results of Operations
Comparison of the Year Ended December 31, 2009 to the Year Ended December 31, 2008
The following table summarizes certain aspects of the Company’s results of operations for the year ended December 31, 2009 compared to the year ended December 31, 2008 (in millions, except percentages ):
| Year Ended December 31 | Change | ||||||||||||||
| 2009 | 2008 | Change $ | Change % | ||||||||||||
| As Adjusted | |||||||||||||||
| Revenues |
|||||||||||||||
| License |
$ | 70.2 | $ | 90.4 | $ | (20.2 | ) | (22.3 | )% | ||||||
| Consulting |
128.4 | 152.2 | (23.8 | ) | (15.6 | )% | |||||||||
| Maintenance |
191.0 | 192.3 | (1.3 | ) | (0.7 | )% | |||||||||
| Hardware and other |
20.0 | 53.0 | (33.0 | ) | (62.2 | )% | |||||||||
| Total revenues |
409.6 | 487.9 | (78.3 | ) | (16.0 | )% | |||||||||
| Gross profit % |
|||||||||||||||
| License |
79.1 | % | 79.9 | % | |||||||||||
| Consulting |
18.8 | % | 17.4 | % | |||||||||||
| Maintenance |
77.0 | % | 75.0 | % | |||||||||||
| Hardware and other |
12.2 | % | 9.7 | % | |||||||||||
| Amortization of intangible assets |
$ | 30.8 | $ | 32.9 | $ | (2.1 | ) | (6.5 | )% | ||||||
| % of total revenues |
7.5 | % | 6.7 | % | |||||||||||
| Gross profit |
$ | 198.3 | $ | 215.1 | $ | (16.8 | ) | (7.8 | )% | ||||||
| % of revenues |
48.4 | % | 44.1 | % | |||||||||||
| Sales and marketing |
$ | 75.1 | $ | 82.9 | $ | (7.8 | ) | (9.4 | )% | ||||||
| % of revenues |
18.3 | % | 17.0 | % | |||||||||||
| Software development |
$ | 49.2 | $ | 52.5 | $ | (3.3 | ) | (6.3 | )% | ||||||
| % of revenues |
12.0 | % | 10.8 | % | |||||||||||
| General and administrative |
$ | 54.4 | $ | 52.1 | $ | 2.3 | 4.4 | % | |||||||
| % of revenues |
13.3 | % | 10.7 | % | |||||||||||
| In-process research and development |
$ | — | $ | 0.2 | $ | (0.2 | ) | (100.0 | )% | ||||||
| % of revenues |
0.0 | % | 0.0 | % | |||||||||||
| Restructuring and other |
$ | 2.2 | $ | 9.1 | $ | (6.9 | ) | (75.8 | )% | ||||||
| % of revenues |
0.5 | % | 1.9 | % | |||||||||||
| Interest expense |
$ | 22.4 | $ | 22.5 | $ | (0.1 | ) | (0.7 | )% | ||||||
| % of revenues |
5.5 | % | 4.6 | % | |||||||||||
| Interest and other income, net |
$ | 0.4 | $ | 0.3 | $ | 0.1 | 35.6 | % | |||||||
| % of revenues |
0.1 | % | 0.1 | % | |||||||||||
| Benefit for income taxes |
$ | 3.3 | $ | 0.6 | $ | 2.7 | 461.8 | % | |||||||
| Effective tax rate |
73.0 | % | 14.7 | % | |||||||||||
| Net loss |
$ | (1.2 | ) | $ | (3.5 | ) | $ | 2.3 | 64.1 | % | |||||
| % of revenues |
(0.3 | )% | (0.7 | )% | |||||||||||
43
Table of Contents
Revenue
The decrease in license revenues for the year ended December 31, 2009, compared to 2008, is due primarily to the downturn of the overall economic environment, which led to lengthening sales cycles and a decrease in near-term demand for the Company’s software solutions. Due to continued uncertainty regarding the state of the economy and continued limited access to credit, as well as the cost of credit, customers continue to be reluctant to sign new deals, while others are implementing projects on a staged basis whereby they purchase and roll out smaller parts of their total solution. In addition, the Company’s license revenues were negatively impacted due to the strengthening of the United States dollar relative to other major currencies. License revenues for the year ended December 31, 2009, included three sales greater than $1.0 million. License revenues for the year ended December 31, 2008, included two sales greater than $1.0 million.
Consulting revenues for the year ended December 31, 2009, were lower than 2008. Consulting revenue is primarily driven by license sales, and as such has been negatively impacted by lower license revenues in the past several quarters. In addition, the Company’s consulting revenues were negatively impacted due to the strengthening of the United States dollar relative to other major currencies, partially offset by the February 2008 acquisition of NSB, which contributed consulting revenues during the entire year ended in 2009 compared to 10.5 months in 2008.
The slight decrease in maintenance revenues for the year ended December 31, 2009, compared to 2008, is due primarily to the strengthening of the United States dollar relative to other major currencies, which negatively impacted maintenance revenues, as well as lower license sales than in previous years. This is offset by continued high renewal rates in the Company’s customer base, continued new license sales and related maintenance contracts sold with new licenses and continued focus on re-signing customers whose maintenance agreements had previously lapsed, but who have now renewed their maintenance agreements.
Hardware and other revenues consist primarily of the resale of third-party hardware. The decrease in hardware and other revenue for the year ended December 31, 2009, as compared to 2008, is due to the timing of customer hardware orders, which vary based on the customers’ hardware roll-out schedules, resulting in a high degree of variability in the Company’s hardware revenues.
International revenues were $128.9 million and $159.1 million for the years ended December 31, 2009 and 2008, representing 31.5% and 32.6%, respectively, of total revenues. The decrease in international revenues as a percentage of total revenues was primarily due to the strengthening of the United States dollar relative to other major currencies. The decrease in international revenues in absolute dollars for the year ended December 31, 2009, compared to 2008, is due to the general global economic downturn as well as the strengthening of the United States dollar relative to other major currencies. Foreign currency exchange rate fluctuations resulted in foreign currency-based revenues during the year ended December 31, 2009 being reported $11.3 million, or 2.7%, lower than these revenues would have been if they had been translated at 2008 foreign currency exchange rates.
Cost of Revenues and Gross Margins
Cost of license revenues consists primarily of software royalties paid for third-party software incorporated into the Company’s products, referral fees paid to Value Added Resellers (VARs), costs associated with product packaging and documentation and software duplication. For the year ended December 31, 2009, compared to 2008, gross profit on license revenue decreased slightly due to lower revenue, which was offset partially by decreased costs due primarily to a lower mix of third-party software sales.
Cost of consulting revenues consists primarily of salaries, benefits, commissions, bonuses, other headcount-related expenses and travel for the Company’s consulting organization, which provides consulting services to customers in the implementation and integration of the Company’s software products, as well as education, training and other consulting and programming services. These costs decreased in absolute dollars during the year ended December 31, 2009, compared to 2008, primarily due to headcount reductions related to the Company’s restructuring activities in 2009 and 2008, as well as a continued focus on expense management, offset by the acquisition of NSB, whose costs were included for all of 2009. Also, the strengthening of the United States dollar relative to other currencies decreased costs as a large percentage of the consulting staff is outside the United States. Consulting services margins increased for the year ended December 31, 2009, compared to 2008, due primarily to the decreased costs, and the impact in the first quarter of 2008 of a strategic consulting contract with a large customer for whom the Company had to adjust estimated costs and record future estimated losses.
Cost of maintenance revenues consists primarily of salaries, benefits and other personnel-related expenses for the Company’s support organization as well as maintenance royalties on third-party software incorporated into the
44
Table of Contents
Company’s products. For the year ended December 31, 2009, compared to 2008, cost of maintenance revenues decreased in absolute dollars due primarily to headcount reductions from the Company’s restructuring activities in 2008 as well as the strengthening of the United States dollar relative to other currencies as a large percentage of the Company’s support staff are based outside the United States. This decrease is offset by the acquisition of NSB, whose costs were included for the entire year in 2009. Maintenance gross profit increased for the year ended December 31, 2009, compared to 2008, due to the decrease in maintenance costs.
Cost of hardware and other revenues decreased in absolute dollars in the year ended December 31, 2009, compared to 2008, due to the timing of customer hardware orders, which vary based on the customers’ hardware roll-out schedules and can result in a high degree of variability in our hardware gross profit margins. Gross profit margin for hardware and other revenues improved for the year ended December 31, 2009 as compared to 2008, due to an increase in lower volume, higher margin hardware sales.
Amortization of Intangible Assets
Amortization of intangible assets consists of amortization of capitalized acquired technology, customer base and trademarks that were recorded as a result of acquisitions. The Company’s intangible assets are amortized over the estimated economic lives of the assets. For the years ended December 31, 2009 and 2008, the Company recorded amortization expense, included in cost of revenues, related to intangible assets of $30.8 million and $32.9 million, respectively. The decrease in amortization expense for the year ended December 31, 2009, as compared to 2008, is due to intangible assets that became fully amortized during the period. Amortization of acquired technology, customer base and trademarks will be complete in 2015. See Note 4 in Notes to Consolidated Financial Statements for expected future amortization expense.
Sales and Marketing
Sales and marketing expenses consist primarily of salaries, commissions, travel, advertising and promotional expenses. These costs decreased in absolute dollars for the year ended December 31, 2009, compared to 2008. The decrease is due to headcount reductions related to the Company’s 2008 and 2009 restructuring activities, a reduction in stock-based compensation, a continued focus on expense management, as well as the strengthening of the United States dollar relative to other currencies.
Software Development
Software development costs consist primarily of compensation of development personnel, related overhead incurred to develop new products and upgrade and enhance the Company’s current products and fees paid to outside consultants. The majority of these expenses are being incurred by the Company in the United States, Canada, Mexico, Eastern Europe, Malaysia, Australia and Russia, where the Company operates development centers.
Software development expenses decreased in absolute dollars for the year ended December 31, 2009, compared to 2008, due primarily to a reduction in headcount as well as the strengthening of the United States dollar relative to other currencies as a large percentage of the Company’s development personnel are based outside the United States. The decrease is offset by the acquisition of NSB, whose costs were included for the entire year in 2009, compared to 10.5 months in 2008.
General and Administrative Expense
General and administrative expenses consist primarily of costs associated with the Company’s executive, financial, legal, human resources and information systems functions. General and administrative expenses increased in absolute dollars and as a percentage of total revenues during the year ended December 31, 2009, compared to 2008. This increase is primarily attributable to additional provision for doubtful accounts, legal expenses and stock-based compensation, as well as the acquisition of NSB, whose costs were included for the entire year in 2009, compared to 10.5 months in 2008. The increase was partially offset by a decrease due to headcount reductions related to the Company’s 2008 and 2009 restructuring activities, as well as the strengthening of the United States dollar relative to other currencies.
45
Table of Contents
Stock-Based Compensation Expense
Stock-based compensation expense includes compensation expense from restricted stock issued and stock options granted by the Company. For the years ended December 31, 2009 and 2008, stock-based compensation expense was $8.1 million and $7.0 million, respectively. Stock-based compensation expense increased due primarily to changes in senior management and additional shares granted.
At December 31, 2009, there was approximately $5.4 million and $2.4 million of unrecognized compensation expense related to performance-based restricted stock and other restricted stock grants, respectively. These costs are expected to be recognized over weighted-average periods of approximately one year.
The compensation cost related to the performance-based restricted stock depends on the estimated number of shares that will vest based on the probable outcome of the performance conditions. Therefore, the recognized compensation could vary significantly depending on the outcome of those conditions. The Company is required at each reporting date to assess whether achievement of any performance condition is probable. Quarterly compensation expense may include a cumulative adjustment resulting from changes in the estimated number of shares expected to be earned during that plan year. Based on the Company’s achievement of performance conditions applicable to the 2009 performance year, the Company has recorded compensation expense of $3.5 million related to performance-based restricted stock for the year ended December 31, 2009.
In addition to the above plans, in January 2010, the Company’s Board of Directors decided to expand the Company’s performance-based restricted stock program for 2010 and eliminate the Company’s prior cash based management bonus plan for 2010. The compensation cost related to the additional performance-based restricted stock depends on the estimated number of shares that will vest based on the probable outcome of the performance conditions, similar to the existing performance-based restricted stock. Unrecognized compensation cost associated with the additional performance-based restricted stock expected to be recognized in 2010 is $6.4 million. Because the additional performance-based restricted stock replaces the Company’s management cash bonus, overall expense for the Company is not expected to increase significantly.
The following table sets forth the total stock-based compensation expense resulting from restricted stock awards and stock options included in the Company’s Consolidated Statements of Operations (in thousands):
| Year Ended December 31, | ||||||
| 2009 | 2008 | |||||
| Cost of consulting revenues |
$ | 1,031 | $ | 408 | ||
| Cost of maintenance revenues |
433 | 359 | ||||
| Sales and marketing |
1,736 | 2,430 | ||||
| Software development |
728 | 591 | ||||
| General and administrative |
4,180 | 3,257 | ||||
| Total stock-based compensation expense |
$ | 8,108 | $ | 7,045 | ||
Restructuring and Other
For the year ended December 31, 2009, the Company recorded restructuring and other charges of $2.2 million. These charges represent $2.2 million of severance-related costs associated with the cost reduction initiatives taken in the second quarter, management severance and from the elimination of redundancies in the Company’s retail business resulting from the NSB acquisition. The Company recorded a net credit of $0.1 million related to changes in estimates on subleased facilities and charges related to closing facilities used in its retail business. The Company also recorded $0.1 million in asset impairments related to leasehold improvements and facilities redundancies in the Company’s retail business resulting from the NSB acquisition.
Interest Expense
Interest expense was relatively consistent for the year ended December 31, 2009, compared to 2008. Interest expense is comprised of interest on the Company’s convertible debt and credit facility, debt discount amortization, debt issuance fees amortization and debt issuance fees write-offs.
46
Table of Contents
Interest and Other Income, Net
Interest and other income, net, increased slightly for the year ended December 31, 2009, compared to 2008, due primarily to an increase in the value of deferred compensation assets in the current year, a lower loss in the current year on foreign currency losses relating to the strengthening of the United States dollar, offset by a change related to the Company’s interest rate swaps and a decrease in interest earned on the Company’s cash balances as a result of lower cash balances compared to early 2008.
Benefit for Income Taxes
The benefit for income taxes consists of federal, state and foreign income taxes. The Company operates in an international environment with significant operations in various locations outside the United States. Accordingly, the consolidated income tax rate is a composite rate reflecting the earnings in the various locations and the applicable rates.
The Company recorded an income tax benefit of $3.3 million and $0.6 million for the years ended December 31, 2009 and 2008, respectively. The effective income tax rates were 73.0% and 14.7% for the years ended December 31, 2009 and 2008, respectively.
The 2009 effective tax rate differs from the statutory U.S. federal income tax rate of 35% due to earnings in foreign jurisdictions taxed at different rates, state taxes, permanent differences between GAAP pre-tax income and taxable income, changes in valuation allowances established for deferred tax assets and releases of reserves for uncertain tax positions primarily related to statute closures and expected audit settlements in foreign jurisdictions.
The 2008 effective tax rate differs from the statutory U.S. federal income tax rate of 35% due to earnings in foreign jurisdictions taxed at different rates, state taxes, permanent differences between GAAP pre-tax income and taxable income, and changes in valuation allowances primarily in foreign jurisdictions. The increase in the 2008 effective tax rate was partially offset by recognition of an uncertain tax position relating to settlement of a foreign audit and certain statutes closing.
The Company maintains a $13.2 million and $16.2 million valuation allowance at December 31, 2009 and 2008, respectively, for certain deferred tax assets until sufficient positive evidence exists to support its reversal. The valuation allowance is principally related to net operating losses for which the recovery is uncertain.
The Company regularly reviews its deferred tax assets for recoverability and has established a valuation allowance when it is more likely than not that some portion, or all, of the deferred tax assets will not be realized. The Company assesses the recoverability of the deferred tax assets and the need for a valuation allowance on an ongoing basis. In making this assessment, the Company is required to consider all available positive and negative evidence to determine whether, based on such evidence, it is more likely than not that some portion, or all, of the net deferred assets will be realized in future periods. Given the increased global scope of our operations, and the complexity of global tax and transfer pricing regulations, it has become increasingly difficult to estimate earnings within each tax jurisdiction. If actual earnings within a tax jurisdiction differ materially from our estimates, an adjustment to income would occur if we determine that we are able to realize a different amount of our deferred tax assets than currently expected.
47
Table of Contents
Results of Operations
Comparison of the Year Ended December 31, 2008 to the Year Ended December 31, 2007
The following table summarizes certain aspects of the Company’s results of operations for the year ended December 31, 2008 compared to the year ended December 31, 2007 (in millions, except percentages ):
| Year Ended December 31 | Change | ||||||||||||||
| 2008 | 2007 | Change $ | Change % | ||||||||||||
| As Adjusted | As Adjusted | ||||||||||||||
| Revenues |
|||||||||||||||
| License |
$ | 90.4 | $ | 109.4 | $ | (19.0 | ) | (17.4 | )% | ||||||
| Consulting |
152.2 | 134.7 | 17.5 | 12.9 | % | ||||||||||
| Maintenance |
192.3 | 160.3 | 32.0 | 20.0 | % | ||||||||||
| Hardware and other |
53.0 | 25.4 | 27.6 | 108.8 | % | ||||||||||
| Total revenues |
487.9 | 429.8 | 58.1 | 13.5 | % | ||||||||||
| Gross profit % |
|||||||||||||||
| License |
79.9 | % | 78.3 | % | |||||||||||
| Consulting |
17.4 | % | 17.9 | % | |||||||||||
| Maintenance |
75.0 | % | 78.2 | % | |||||||||||
| Hardware and other |
9.7 | % | 11.4 | % | |||||||||||
| Amortization of intangible assets |
$ | 32.9 | $ | 17.4 | $ | 15.5 | 88.9 | % | |||||||
| % of total revenues |
6.7 | % | 4.1 | % | |||||||||||
| Gross profit |
$ | 215.1 | $ | 220.5 | $ | (5.4 | ) | (2.5 | )% | ||||||
| % of revenues |
44.1 | % | 51.3 | % | |||||||||||
| Sales and marketing |
$ | 82.9 | $ | 80.5 | $ | 2.4 | 3.0 | % | |||||||
| % of revenues |
17.0 | % | 18.7 | % | |||||||||||
| Software development |
$ | 52.5 | $ | 37.4 | $ | 15.1 | 40.6 | % | |||||||
| % of revenues |
10.8 | % | 8.7 | % | |||||||||||
| General and administrative |
$ | 52.1 | $ | 58.3 | $ | (6.2 | ) | (10.6 | )% | ||||||
| % of revenues |
10.7 | % | 13.6 | % | |||||||||||
| In-process research and development |
$ | 0.2 | $ | — | $ | 0.2 | 0.0 | % | |||||||
| % of revenues |
0.0 | % | 0.0 | % | |||||||||||
| Restructuring charge |
$ | 9.1 | $ | 1.6 | $ | 7.5 | 482.0 | % | |||||||
| % of revenues |
1.9 | % | 0.4 | % | |||||||||||
| Interest expense |
$ | 22.5 | $ | 12.5 | $ | 10.0 | 80.7 | % | |||||||
| % of revenues |
4.6 | % | 2.9 | % | |||||||||||
| Gain on sale of non-strategic asset |
$ | — | $ | 1.6 | $ | (1.6 | ) | (100.0 | )% | ||||||
| % of revenues |
0.0 | % | 0.4 | % | |||||||||||
| Interest and other income, net |
$ | 0.3 | $ | 6.6 | $ | (6.3 | ) | (95.4 | )% | ||||||
| % of revenues |
0.1 | % | 1.5 | % | |||||||||||
| Benefit for income taxes |
$ | 0.6 | $ | 0.5 | $ | 0.1 | 11.0 | % | |||||||
| Effective tax rate |
14.7 | % | 1.4 | % | |||||||||||
| Net income (loss) |
$ | (3.5 | ) | $ | 39.1 | $ | (42.6 | ) | (108.8 | )% | |||||
| % of revenues |
(0.7 | )% | 9.1 | % | |||||||||||
48
Table of Contents
Revenue
The decrease in license revenues for the year ended December 31, 2008, compared to the same period in 2007, is due primarily to the downturn of the overall economic environment and lengthening sales cycles. Due to the volatility surrounding the financial markets, the uncertainty regarding the state of the economy and tightening of the credit market, some customers were reluctant to sign new deals, and many retailers are implementing projects on a staged basis whereby they purchase and roll out smaller parts of their total solution. The decrease in license revenue was partially offset by additional license revenues due to the acquisition of NSB. License revenues for the year ended December 31, 2008, included two sales greater than $1.0 million. License revenues for the year ended December 31, 2007, included three deals greater than $1.0 million. One of the sales greater than $1.0 million in 2007 was related to the sale of a non-strategic asset (see “Sale of Non-Strategic Asset”).
Consulting revenues increased for the year ended December 31, 2008, compared to the same period in 2007, due to the acquisition of NSB and an increase in international managed services, which is a newly provided service, offset by decreased consulting revenue due to a significant international engagement in the prior period with no similar engagement in the current period. Consulting revenues were also negatively impacted by a strategic consulting deal with a large customer that required the Company to allocate significant consulting resources to this project with little additional associated revenues.
The increase in maintenance revenues for the year ended December 31, 2008, compared to the same period in 2007, is due primarily to the acquisition of NSB, which contributed maintenance revenues during the year, as well as continued high renewal rates in the Company’s customer base, continuing new license sales and related maintenance contracts sold with new licenses, and continued focus on re-signing customers whose maintenance agreements had previously lapsed, but who have now renewed their maintenance agreements.
Hardware and other revenues consist primarily of the resale of third-party hardware. The increase in hardware and other revenue for the year ended December 31, 2008, as compared to the same period in 2007, is due to the acquisition of NSB and the timing of customer hardware orders, which vary based on the customers’ hardware roll-out schedules, resulting in a high degree of variability in the Company’s hardware revenues.
International revenues were $159.1 million and $170.9 million for the year ended December 31, 2008 and 2007, representing 32.6% and 39.8%, respectively, of total revenues. The decrease in international revenues as a percentage of total revenues was primarily due to the acquisition of NSB whose customers are primarily in the United States. The decrease in international revenues for the year ended December 31, 2008 compared to the same period in 2007 in absolute dollars is due to the general global economic downturn, a significant license sale in 2007 (see “Sale of a Non-Strategic Asset” below) and the inclusion of a significant consulting engagement in the prior year. Foreign currency exchange rate fluctuations resulted in foreign currency-based revenues during the year ended December 31, 2008 being reported $0.6 million, or 0.1% of total revenue, lower than these revenues would have been if they had been translated at 2007 foreign currency exchange rates.
Cost of Revenues and Gross Margins
Cost of license revenues consists primarily of software royalties paid for third-party software incorporated into the Company’s products, referral fees paid to Value Added Resellers (VARs), costs associated with product packaging and documentation and software duplication. For the year ended December 31, 2008, compared to the same period in 2007, gross profit on license revenue increased as costs decreased due primarily to a lower mix of third-party software sales, which was partially attributable to the acquisition of NSB.
Cost of consulting revenues consists primarily of salaries, benefits, commissions, bonuses, other headcount-related expenses and travel for the Company’s consulting organization, which provides consulting services to customers in the implementation and integration of the Company’s software products, as well as education, training and other consulting and programming services. These costs increased in absolute dollars during the year ended December 31, 2008, compared to the same period in 2007, due primarily to the acquisition of NSB. Consulting services margins decreased slightly for the year ended December 31, 2008, compared to the same period in 2007, due primarily to losses incurred during 2008 on a strategic consulting contract. In addition, consulting services margins were negatively impacted in the first quarter of 2008 due to lower than expected utilization rates related to the integration of NSB and the significant hiring the Company has done in lower cost geographies over the past several quarters, which required more training to bring these consultants up to fully billable rates. The decrease in the first quarter of 2008 was offset by the Company’s successful focus on increasing utilization rates for the remainder of the year as well as NSB’s higher consulting gross margins.
49
Table of Contents
Cost of maintenance revenues consists primarily of salaries, benefits and other headcount-related expenses for the Company’s support organization as well as maintenance royalties on third-party software incorporated into the Company’s products. For the year ended December 31, 2008, compared to the same period of 2007, cost of maintenance revenues increased in absolute dollars due primarily to the acquisition of NSB. Maintenance gross profit decreased for the year ended December 31, 2008, compared to the same period in 2007, due to the addition of NSB maintenance revenue, which has lower gross margins.
Cost of hardware and other revenue increased in absolute dollars in the year ended December 31, 2008 compared to the same period in 2007, due to the timing of customer hardware orders, which vary based on the customers’ hardware roll-out schedules and can result in a high degree of variability in our hardware gross profit margins.
Amortization of Intangible Assets
Amortization of intangible assets consists of amortization of capitalized acquired technology, customer base and trademarks that were recorded as a result of acquisitions. The Company’s intangible assets are amortized over the estimated economic lives of the assets. For the year ended December 31, 2008 and 2007, the Company recorded amortization expense, included in cost of revenues, related to intangible assets of $32.9 million and $17.4 million, respectively. The increase in amortization expense for the year ended December 31, 2008, as compared to the same period in 2007, is due to the additional amortization expense related to intangible assets acquired in the NSB acquisition, offset by intangible assets that became fully amortized during the period.
Sales and Marketing
Sales and marketing expenses consist primarily of salaries, commissions, travel, advertising and promotional expenses. These costs increased in absolute dollars, but decreased as a percentage of revenue, for the year ended December 31, 2008, compared to the same period in 2007. The decrease as a percentage of revenue is due to increased revenues, as well as a continued focus on expense management. The increase in absolute dollars is due primarily to the NSB acquisition.
Software Development
Software development costs consist primarily of compensation of development personnel, related overhead incurred to develop new products and upgrade and enhance the Company’s current products and fees paid to outside consultants. The majority of these expenses have been incurred by the Company in the United States, Canada, Mexico, Eastern Europe and Russia, where the Company operates development centers.
Software development expenses increased in absolute dollars and as a percentage of revenue for the year ended December 31, 2008, compared to the same period in 2007, due primarily to the acquisition of NSB as well as to additional investments made in launching Epicor.
General and Administrative Expense
General and administrative expenses consist primarily of costs associated with the Company’s executive, financial, legal, human resources and information services functions. General and administrative expenses decreased in absolute dollars and as a percentage of total revenues during the year ended December 31, 2008, compared to the same period in 2007. This decrease is primarily attributable to reductions in overhead costs, personnel related costs, including stock-based compensation expense, associated with changes in senior management within the Company and reductions in provision for doubtful accounts, partially offset by an increase in costs from the acquisition of NSB.
Stock-Based Compensation Expense
Stock-based compensation expense includes compensation expense from stock options granted and restricted stock issued by the Company. For the years ended December 31, 2008 and 2007, stock-based compensation expense was $7.0 million and $11.7 million, respectively. Stock-based compensation expense decreased due primarily to changes in senior management as well as not issuing as many shares related to the performance-based restricted stock plan.
The compensation cost related to the performance-based restricted stock depends on the estimated number of shares that will vest based on the probable outcome of the performance conditions. Therefore, the recognized compensation could vary significantly, depending on the outcome of those conditions. The Company is required at each reporting date to assess whether achievement of any performance condition is probable. Quarterly compensation expense may include a cumulative adjustment resulting from changes in the estimated number of
50
Table of Contents
shares expected to be earned during that plan year. Based on the Company’s final achievement, the Company has recorded stock compensation expense related to these grants of $3.1 million for the year ended December 31, 2008.
The following table sets forth the total stock-based compensation expense resulting from stock options, restricted stock awards and the employee stock purchase plan included in the Company’s Consolidated Statements of Operations (in thousands):
| Year Ended December 31, | ||||||
| 2008 | 2007 | |||||
| Cost of consulting revenues |
$ | 408 | $ | 1,234 | ||
| Cost of maintenance revenues |
359 | 514 | ||||
| Sales and marketing |
2,430 | 3,909 | ||||
| Software development |
591 | 856 | ||||
| General and administrative |
3,257 | 5,181 | ||||
| Total stock-based compensation expense |
$ | 7,045 | $ | 11,694 | ||
Restructuring
For the year ended December 31, 2008, the Company recorded restructuring charges of $9.1 million. These charges represent $7.0 million of severance related costs. The severance costs are associated with the cost reduction initiatives taken in the fourth quarter of 2008, severance costs related to management severance and cost reductions primarily from the elimination of redundancies in the Company’s retail business resulting from the NSB acquisition. The company also had $2.1 million of facilities charges related primarily to changes in estimates on subleasing facilities located in the United Kingdom.
Interest Expense
Interest expense increased for the year ended December 31, 2008, as compared to the same period in 2007 due to increased interest on additional debt incurred in February for the acquisition of NSB, interest on the Company’s convertible senior notes issued in May of 2007 as well as the amortization of the debt discount which began in May of 2007.
Sale of Non-Strategic Asset
During March of 2007, the Company entered into an arrangement to sell the assets of its payroll bureau operations in Russia. In connection with this asset sale arrangement, the Company also entered into an arrangement with the same party to license the iScala payroll product for resale on an exclusive basis in certain Eastern European territories. This transaction was accounted for as a multiple-element arrangement under EITF Issue No. 00-21. Based on an estimated fair value of the payroll bureau, the Company allocated $2.5 million of the total consideration to the sale of these assets as well. This consideration, less the carrying amounts of $0.8 million of goodwill and $0.1 million of net customer base intangible assets originally recorded in connection with the 2004 acquisition of Scala and $22,000 of net tangible assets, resulted in a net gain of $1.6 million which is included in “gain on sale of non-strategic asset” in the accompanying Consolidated Statements of Operations for the year ended December 31, 2007. The remaining consideration related to the iScala payroll product license is included in “license” in the accompanying Consolidated Statements of Operations for the year ended December 31, 2007.
Interest and Other Income, Net
Interest and other income, net, decreased for the year ended December 31, 2008, as compared to the same period in 2007, due primarily to a decrease in interest earned on the Company’s cash balances as well as increased foreign currency transaction losses. The Company had a large cash balance in the prior year due to cash received from the convertible debt offering which occurred in May of 2007. The Company used this cash, as well as cash from a new credit facility to purchase NSB in February of 2008, resulting in a decrease of interest income. Excluding a loss of $1.6 million in the first quarter of 2008 resulting from the change in value of the Company’s British pound sterling call option contracts related to the NSB acquisition, the Company had foreign currency transaction losses for the year ended December 31, 2008 of $0.9 million, primarily due to the Company’s intercompany translation and the significant strengthening of the United States dollar against the British pound sterling, Australian dollar and the euro.
51
Table of Contents
Benefit for Income Taxes
The benefit for income taxes consists of federal, state and foreign income taxes. The Company operates in an international environment with significant operations in various locations outside the United States. Accordingly, the consolidated income tax rate is a composite rate reflecting the earnings in the various locations and the applicable rates.
The Company recorded an income tax benefit of $0.6 million and $0.5 million for the year ended December 31, 2008 and 2007, respectively. The effective income tax rates were (14.7)% and (1.4)% for the year ended December 31, 2008 and 2007, respectively.
The 2008 effective tax rate differs from the statutory U.S. federal income tax rate of 35% due to earnings in foreign jurisdictions taxed at different rates, state taxes, permanent differences between GAAP pre-tax income and taxable income, and changes in valuation allowances primarily in foreign jurisdictions. The increase in the 2008 effective tax rate was partially offset by recognition of an uncertain tax position relating to settlement of a foreign audit and certain statutes closing.
The 2007 effective tax rate differs from the statutory U.S. federal income tax rate of 35% primarily due to a non-cash income tax benefit resulting from the release of certain foreign valuation allowances. Effective January 1, 2009, any reduction to the valuation allowance established in purchase accounting is to be accounted for as a reduction in income tax expense.
The Company maintains a $16.2 million and $4.0 million valuation allowance at December 31, 2008 and 2007, respectively, for certain deferred tax assets until sufficient positive evidence exists to support its reversal. The valuation allowance is principally related to net operating losses for which the recovery is uncertain.
The Company regularly reviews its deferred tax assets for recoverability and has established a valuation allowance when it is more likely than not that some portion, or all, of the deferred tax assets will not be realized. The Company assesses the recoverability of the deferred tax assets and the need for a valuation allowance on an ongoing basis. In making this assessment, the Company is required to consider all available positive and negative evidence to determine whether, based on such evidence, it is more likely than not that some portion, or all, of the net deferred assets will be realized in future periods. Given the increased global scope of our operations, and the complexity of global tax and transfer pricing regulations, it has become increasingly difficult to estimate earnings within each tax jurisdiction. If actual earnings within a tax jurisdiction differ materially from our estimates, an adjustment to income would occur if we determine that we are able to realize a different amount of our deferred tax assets than currently expected.
52
Table of Contents
Liquidity and Capital Resources
The following table summarizes the Company’s cash and cash equivalents, working capital, long-term debt and cash flows as of and for the year ended December 31, 2009 (in millions):
| 2009 | ||||
| Cash and cash equivalents |
$ | 106.9 | ||
| Working capital |
65.6 | |||
| Net cash provided by operating activities |
51.6 | |||
| Net cash (used in) investing activities |
(5.1 | ) | ||
| Net cash (used in) financing activities |
(29.6 | ) | ||
| Long-term debt, less current portion |
255.5 | |||
Overview
As of December 31, 2009, the Company had cash and cash equivalents of $106.9 million and $65.6 million in net working capital (current assets in excess of current liabilities). The Company’s primary sources of operating cash are customer payments for license fees, consulting services and maintenance contracts. The Company’s primary use of operating cash is for employee costs, third-party software royalties, and facilities. The Company’s working capital excluding deferred revenue is $161.6 million. The Company believes this is a relevant measurement of working capital since deferred revenue is an obligation for services rather than for cash. The cost of providing these services is generally fixed in nature and ranges from 22% to 27% of the related revenues.
The Company’s cash balances are held in numerous locations throughout the world, including substantial amounts held outside the United States. In some countries, repatriation of certain foreign balances is restricted by local laws. Most of the amounts held outside of the United States could be repatriated to the United States, but under current law, would be subject to U.S. federal income taxes, less applicable foreign tax credits. We utilize a variety of tax planning and financing strategies with the objective of having our worldwide cash available in the location where it is needed.
The Company’s days sales outstanding (DSO) for the last eight quarters are set forth in the following table:
| Quarter Ended: |
2009 | 2008 | ||
| March 31 |
72 | 91 | ||
| June 30 |
78 | 66 | ||
| September 30 |
74 | 65 | ||
| December 31 |
74 | 68 |
The increase in DSOs in the first quarter of 2008 was due primarily to the Company’s higher accounts receivable balances without related revenues as a result of the NSB acquisition. Although the Company experienced relatively shorter payment cycles during most of 2008, these cycles began to lengthen during the fourth quarter of 2008 and continued into 2009 due primarily to the volatility surrounding the financial markets and uncertainty regarding the state of the economy as well as the tightening of the credit market.
As of December 31, 2009, the Company had $6.1 million in cash obligations for severance costs, lease terminations and other costs related to the Company’s restructurings. These obligations are expected to be paid through 2016 and the Company believes these obligations will be funded from existing cash reserves and cash generated from continuing operations.
Considering current cash reserves, funds from future operations and availability of funds under the Company’s 2007 credit facility, management believes that the Company will have sufficient liquidity to continue its operations through at least the next twelve months. However, the Company may require additional sources of liquidity to fund any future acquisitions and its future growth. There can be no assurance that the Company will not seek to raise additional capital through the incurrence of debt or issuance of equity securities in the future.
The Company is dependent upon its ability to generate cash flows from license and other operating revenues, providing services to its customers and on collection of its accounts receivable to maintain current liquidity levels. If the Company is not successful in achieving targeted revenues and expenses or positive cash flows from operations, the Company may be required to take further cost-cutting measures and restructuring actions or seek alternative sources of funding.
As of December 31, 2009, the Company had $32.5 million in borrowing capacity available under its 2007 credit facility. Borrowing capacity under the 2007 credit facility may be reduced or otherwise limited as a result of the
53
Table of Contents
Company’s obligation to comply with certain financial covenants. The Company increased its leverage to finance its CRS and NSB acquisitions. As described below, as of December 31, 2009, the Company had $230 million outstanding convertible notes and $67.5 million outstanding under its 2007 credit facility. This indebtedness may reduce the Company’s flexibility to respond to changing business and economic conditions or fund capital expenditures or working capital needs because the Company may require additional sources of liquidity to fund any future acquisitions and its future growth. While the Company currently expects that additional capital will be available to it through the incurrence of debt or issuance of equity securities, these alternative sources of funding may not be available on terms favorable to the Company or at all, in which case, the Company’s business, financial condition or results of operations may be adversely affected.
Operating Activities
The Company’s operations provided $51.6 million in cash during the year ended December 31, 2009. Cash flows from operating activities were generated even though the Company reported $1.2 million of net loss. Cash flows from operating activities differed from the net loss partially because of non-cash charges primarily consisting of $38.7 million of depreciation and amortization, $8.1 million of stock-based compensation expense, $4.3 million of provision for doubtful accounts, $4.4 million of debt issuance fee amortization, $7.9 million of debt discount amortization and $2.2 million of restructuring charges. Net working capital changes decreased overall cash provided from operations by $6.5 million. The working capital changes relate primarily to a decrease in other current assets of $3.0 million and a decrease in accrued restructuring costs of $5.9 million offset by $2.9 million in inventory usage.
Investing Activities
The Company’s principal investing activities for the year ended December 31, 2009, included $4.1 million for capital expenditures and $1.0 million in business combination costs.
Financing Activities
Financing activities for the year ended December 31, 2009, included $100.2 million in payments on the 2007 credit facility, $72.5 million in proceeds from the revolver (see below), $1.0 million in debt issuance fees and $2.2 million for the purchase of treasury stock. The Company repurchases a portion of employee’s vested shares to satisfy employee income tax withholding requirements and expects such treasury stock activity to recur due to the various vesting schedules of restricted stock. Cash provided by financing activities also included proceeds from the issuance of stock under the employee stock purchase plan and proceeds from the exercise of employee stock options of $0.7 million.
2007 Credit Facility
On December 16, 2007, the Company entered into a syndicated credit facility (the 2007 credit facility) for up to $250 million in term loan and revolving facilities, consisting of $100 million term loan and $150 million in revolving loan facility (after giving effect to an accordion feature). Funds from the 2007 credit facility were allowed to be used to finance the NSB acquisition and to pay certain fees and expenses incurred in connection with the NSB acquisition; and following such acquisition, to provide ongoing working capital and to be used for other general corporate purposes. The Company pledged all of its assets as collateral, subject to certain exceptions. The terms of the 2007 credit facility include various covenant compliance requirements. Amounts repaid under the term loan may not be re-borrowed. On December 30, 2008, the Company amended the 2007 credit facility to, among other things, reduce the commitments under the revolving loan facility from $150 million to $100 million.
On September 30, 2009, the Company amended the 2007 credit facility to, among other things (i) amend the financial covenants by eliminating the total leverage and fixed charge coverage ratios, lowering the maximum senior secured leverage ratio and adding a minimum EBITDA covenant and a minimum liquidity ratio, (ii) amend the maturity date from February 19, 2013 to September 30, 2012, and (iii) increase the applicable interest rates and commitment fees payable under the facility. Upon entering into the amendment, the Company was required to repay in full the outstanding term loan facility, which had an outstanding principal balance of $79 million. On September 30, 2009, the Company paid the outstanding term loan balance by drawing $72.5 million under the revolving facility and paying $6.5 million from discretionary funds. On December 31, 2009, the Company made an additional payment of $5 million from discretionary funds. As a result, the Company had $67.5 million outstanding and unused borrowing capacity of $32.5 million under the revolver at December 31, 2009.
As a result of the September 30, 2009 amendment to the 2007 credit facility, the Company is required to comply with the following financial covenants from September 30, 2009 through the remainder of the term of the 2007
54
Table of Contents
credit facility: (i) maximum senior leverage ratio, (ii) minimum EBITDA ratio, and (iii) minimum liquidity ratio; all measured on a consolidated basis. EBITDA, for purposes of these ratios, consists of net income, plus the following to the extent deducted in calculating net income for a given period: (a) interest expense; (b) the provision for taxes payable; (c) the amount of depreciation and amortization expense (including impairment of goodwill); (d) restructuring charges incurred during the fiscal quarter ended December 31, 2008, in an aggregate amount up to $4 million; (e) cash restructuring charges incurred after June 30, 2009, in an aggregate amount up to $5 million; and (f) non-cash charges.
Under the senior leverage ratio covenant, the Company’s senior leverage, consisting of amounts outstanding under the 2007 credit facility and any other secured borrowings, may not exceed two times the EBITDA for the preceding 12-month period, as measured at the end of each fiscal quarter.
Under the minimum EBITDA ratio, the Company’s EBITDA for the preceding 12-month period, as measured at the end of each fiscal quarter, must be at least $50 million.
Under the minimum liquidity ratio, the ratio of (a) the sum of (i) unrestricted cash and (ii) accounts receivable to (b) the sum of (i) current liabilities (exclusive of amounts outstanding under the 2007 credit facility), plus (ii) amounts outstanding under the 2007 credit facility, minus (iii) deferred revenue, minus (iv) accounts payable for inventory held for resale; may be no less than (aa) 1.15 to 1 for fiscal quarters ended September 30 and December 31, 2009, (bb) 1.25 to 1 for fiscal quarters ending March 31 and June 30, 2010, (cc) 1.40 to 1 for the fiscal quarter ending September 30, 2010, and (dd) 1.50 to 1 for the fiscal quarters ending on or after December 31, 2010.
Interest under the 2007 credit facility is variable, and at December 31, 2009, the effective weighted average interest rate was 5.17%. At December 31, 2009, the Company was in compliance with all covenants included in the terms of the 2007 credit facility.
On April 18, 2008, March 11, 2009 and March 12, 2009, the Company entered into interest rate swap agreements to convert a portion of the Company’s interest rate variability to a fixed rate basis as required under the 2007 credit facility in connection with the term loan there under. The interest rate swaps qualified for hedge accounting treatment at the time. The agreements effectively convert the Company’s floating-rate debt to fixed-rate debt. This reduces the risk of higher interest costs in periods of rising interest rates and increases our risk of paying higher interest costs in periods of decreasing interest rates.
Following is a summary of the interest rate swaps (rates for expired contracts are exclusive of an interest rate margin and active contracts are inclusive of the interest rate margin of 4.00% applicable at December 31, 2009 under the 2007 credit agreement):
| Contract Date |
Notional Amount | Interest Period Covered |
Rate | |||||
| 04/18/08 |
$ | 20 million | 06/30/08 – 03/31/09 | 3.170 | % | |||
| 04/18/08 |
$ | 15 million | 06/30/08 – 09/30/09 | 3.195 | % | |||
| 04/18/08 |
$ | 15 million | 06/30/08 – 09/30/09 | 3.150 | % | |||
| 03/11/09 |
$ | 20 million | 03/31/09 – 03/31/11 | 5.690 | % | |||
| 03/12/09 |
$ | 15 million | 09/30/09 – 03/31/11 | 5.890 | % | |||
| 03/12/09 |
$ | 5 million | 09/30/09 – 09/30/10 | 6.050 | % | |||
At December 31, 2009, the effective interest rate for the notional amounts covered by the swap agreements as of such date was 5.81% (inclusive of 4.00% interest rate margin applicable at December 31, 2009 under the 2007 credit agreement). As of September 30, 2009, as a result of repayment of the term loan facility, the interest rate swaps were de-designated and no longer qualify for hedge accounting treatment. The interest rate swaps resulted in a net liability of $504,000 included in accrued expenses and other long-term liabilities as of December 31, 2009, as well as a charge for the fair value of the interest rate swaps of $504,000 included in “interest and other income, net” in the accompanying Consolidated Statements of Operations for the year ended December 31, 2009.
Convertible Senior Notes
On May 8, 2007, the Company closed an offering of $230 million aggregate principal amount of 2.375% convertible senior notes due in 2027 (the convertible senior notes). The convertible senior notes are unsecured and pay interest semiannually at a rate of 2.375% per annum until May 15, 2027. The convertible senior notes are convertible into cash or, at the Company’s option, cash and shares of the Company’s common stock. Pursuant to
55
Table of Contents
the terms of the notes, the principal amount of the convertible senior notes is settleable in cash and only the amount of conversion value, as defined, in excess of the principal amount of the notes is settleable in cash or shares. The convertible senior notes do not contain any restrictive financial covenants.
On or after May 15, 2014, the Company may from time to time at its option redeem the convertible senior notes, in whole or in part, for cash, at a redemption price equal to 100% of the principal amount of the convertible senior notes we redeem, plus any accrued and unpaid interest to, but excluding, the redemption date. On May 15, 2014, May 15, 2017 and May 15, 2022, holders may require the Company to purchase all or a portion of their convertible senior notes at a purchase price equal to 100% of the principal amount of the convertible senior notes to be purchased, plus any accrued and unpaid interest to, but excluding, the purchase date.
Effective January 1, 2009, the Company changed its method of accounting for its convertible debt. In May 2008, the Financial Accounting Standards Board (FASB) issued new accounting guidance related to the accounting for convertible debt instruments that may be settled in cash upon conversion. This standard required the Company to retrospectively adjust its 2008 and 2007 financial statements to change the previous accounting method for its $230 million convertible senior notes (See Note 1 to the Consolidated Financial Statements for more information). Accordingly, the Company recorded a $61.8 million debt discount as additional paid-in capital, as of the convertible senior notes’ issuance date of May 15, 2007. At December 31, 2009, the debt discount was $42.1 million. The Company has $230 million in principal due under the convertible debt, for a net carrying amount of $187.9 million as of December 31, 2009.
The Company is amortizing the debt discount through the date at which the Company can begin to redeem the convertible senior notes, which is May 15, 2014. The effective interest rate used to measure the fair value of the debt was 7.35%, which was based on market conditions for nonconvertible debt at the time the debt was entered into. The Company recognized interest expense of $13.4 million and $12.8 million related to the convertible debt for the years ended December 31, 2009 and 2008, respectively, of which $5.5 million in each year is based on the coupon rate.
Contractual Obligations
The Company’s significant contractual obligations or commercial commitments consist of the Company’s operating and capital leases for office facilities and equipment, long-term debt, pension plan obligation and purchase obligations. As of December 31, 2009, future payments related to contractual obligations and commercial commitments are as follows:
| Payments Due by Period (in thousands) | |||||||||||||||
| Total | Less than 1 Year |
1-3 Years | 3-5 Years | More than 5 years | |||||||||||
| Operating and Capital Lease Obligations, |
|||||||||||||||
| Net of Sublease Income |
$ | 41,103 | $ | 11,920 | $ | 14,331 | $ | 8,408 | $ | 6,444 | |||||
| Long-term Debt |
297,500 | — | 67,500 | — | 230,000 | ||||||||||
| Estimated Interest Payments |
104,494 | 8,950 | 17,028 | 10,925 | 67,591 | ||||||||||
| Pension Benefit Payments |
8,717 | 118 | 433 | 642 | 7,524 | ||||||||||
| Purchase Obligations |
11,473 | 9,985 | 1,359 | 129 | — | ||||||||||
| Total Contractual Obligations |
$ | 463,287 | $ | 30,973 | $ | 100,651 | $ | 20,104 | $ | 311,559 | |||||
Due to the uncertainty with respect to the timing of future cash flows associated with our unrecognized tax benefits at December 31, 2009, we are unable to make reasonably reliable estimates of the period of cash settlement with the respective taxing authorities. Therefore, $3.0 million of unrecognized tax benefits have been excluded from the contractual obligations table above. In addition, due to uncertainty of future interest rates, $0.5 million of interest rate swap liabilities have been excluded from the contractual obligations table above.
The Company believes that its existing cash balances and funds expected to be generated from future operations will be sufficient to satisfy these contractual obligations and commercial commitments, and that the ultimate payments associated with these commitments will not have a material adverse impact on the Company’s liquidity position.
56
Table of Contents
Foreign Currency Risk
The Company has several operations in foreign locations around the world. These operations incur revenue and expenses in various foreign currencies. Revenues and expenses denominated in currencies other than the United States dollar expose the Company to foreign currency market risk. Unfavorable movements in foreign currency exchange rates between the United States dollar and other foreign currencies may have an adverse impact on the Company’s operations. These foreign currency market movements could create a foreign currency gain or loss that could be realized or unrealized for the Company. The Company’s Board of Directors has approved a foreign currency risk policy that allows the Company to enter into forward contracts and purchase option agreements to hedge foreign currency risks. The Company has an ongoing program to evaluate its foreign currency risk and to minimize these risks whenever possible through leading and lagging accounts payables and accounts receivables, centralized cash management and other forms of natural hedging. The Company also uses forward contracts or purchase options to hedge some of its foreign currency transaction exposure. Gains and losses resulting from these transactions are included in “interest and other income, net” in the accompanying Consolidated Statements of Operations. As of December 31, 2009, the Company had no open forward contracts or purchase options.
The Company conducts limited operations in Venezuela (e.g., revenue derived from Venezuelan operations represented less than 0.02% of the Company’s consolidated revenue for the year ended December 31, 2009). In January 2010, the government of Venezuela devalued its bolivar currency from 2.15 to 4.30 bolivares per United States dollar. As a result of the devaluation, the Company expects its cash and working capital balances will be reduced by and will incur a foreign currency charge of approximately $1.3 million due to the revaluing of its bolivar-based assets during the first fiscal quarter of 2010. This estimate is based on the Company’s bolivar-based assets at December 31, 2009.
Off-Balance Sheet Arrangements
Through December 31, 2009, the Company has not entered into any off-balance sheet arrangements or transactions with unconsolidated entities or other persons.
57
Table of Contents
| Item 7A. | QUANTITATIVE AND QUALITATIVE DISCLOSURE ABOUT MARKET RISK |
Interest Rate Risk
The Company’s exposure to market risk for changes in interest rates relates primarily to the Company’s cash and cash equivalents and outstanding debt. At December 31, 2009, the Company had $106.9 million in cash and cash equivalents. Based on the investment interest rate and the balance as of December 31, 2009, a hypothetical 1% decrease in interest rates would decrease interest income by approximately $1.1 million on an annual basis (to the extent the Company’s returns exceed 1%), as well as a commensurate decrease in the Company’s net income and a decrease in cash flows from operations. The Company places its investments with high credit quality issuers and, by policy, limits the amount of credit exposure to any one issuer. Deposits with its United States issuers may exceed the amounts of federal deposit insurance provided on such deposits, and deposits held outside the United States are not afforded such protection. The Company has approximately 77.2% of its cash and cash equivalents outside the United States. The Company is averse to principal loss and ensures the safety and preservation of its invested funds by limiting default, market and reinvestment risk. The Company mitigates default risk by investing in only the safest and highest credit quality securities and by constantly positioning its portfolio to respond appropriately to a significant reduction in a credit rating of any investment issuer or guarantor. The Company has not experienced any losses on deposits of cash or cash equivalents.
The Company cannot predict market fluctuations in interest rates and their impact on its variable rate debt, nor can there be any assurance that fixed rate long-term debt will be available to the Company at favorable rates, if at all. Consequently, future results may differ materially from the estimated adverse changes discussed above. Changes in interest rates do not affect the amount of interest we pay on our fixed rate senior convertible notes, but do affect the fair value of the debt.
Interest under the Company’s 2007 credit facility is computed on a floating rate basis. The 2007 credit facility required the Company to enter into interest rate swap agreements to protect against fluctuations in the floating rate for a portion of the outstanding term loan balance for a period of time. On April 18, 2008, March 11, 2009 and March 12, 2009 the Company entered into interest rate swap arrangements that convert a portion of its floating rate interest rate exposure under the 2007 credit facility to a fixed rate basis. At the time the Company entered into the interest rate swaps, they qualified for hedge accounting treatment. The changes in the fair value of the interest rate swaps were reflected in the carrying value of the interest rate swaps on the balance sheet. As of September 30, 2009, the Company de-designated the swaps as a result of its repayment of the term loan under the 2007 credit facility, and the fair value changes are now recorded in the accompanying Consolidated Statements of Operations. The differential to be paid or received on the interest rate swap agreements is accrued and recognized as an adjustment to interest expense as interest rates change. At December 31, 2009, the interest rates swap arrangements hedged the floating rate interest risk on $40.0 million of the $67.5 million balance then outstanding under the 2007 credit facility. Accordingly, at December 31, 2009, a hypothetical 1% increase in interest rates would increase interest expense by approximately $0.3 million (on the un-hedged principal amount) on an annual basis, as well as decrease the Company’s net income and decrease cash flows from operations.
Foreign Currency Risk
The Company did not have any foreign currency forward or option contracts open as of December 31, 2009. International revenues represented 31.5% of the Company’s total revenues for the year ended December 31, 2009, and 26.5% of revenues were denominated in foreign currencies. The Company had an unrealized and realized transactional foreign currency loss for the year ended December 31, 2009 of $0.5 million. For the year ended December 31, 2009, the transactional gains and losses were primarily due to settlement of inter-company balances and changes in value of certain cash and other net assets denominated in currencies other than the functional currencies.
58
Table of Contents
| Item 8. | FINANCIAL STATEMENTS AND SUPPLEMENTARY DATA |
Index to Consolidated Financial Statements
| Page | ||
| Financial Statements: |
||
| 60 | ||
| Consolidated Balance Sheets as of December 31, 2009 and 2008 |
61 | |
| Consolidated Statements of Operations for the years ended December 31, 2009, 2008 and 2007 |
62 | |
| 63 | ||
| Consolidated Statements of Cash Flows for the years ended December 31, 2009, 2008 and 2007 |
64 | |
| 65 | ||
| All financial statement schedules have been omitted because they are not required or the required information is included in the consolidated financial statements or notes thereto. | ||
59
Table of Contents
REPORT OF INDEPENDENT REGISTERED PUBLIC ACCOUNTING FIRM
To the Board of Directors and Stockholders
Epicor Software Corporation
We have audited the accompanying consolidated balance sheets of Epicor Software Corporation and subsidiaries as of December 31, 2009 and 2008, and the related consolidated statements of operations, stockholders’ equity and comprehensive income (loss), and cash flows for each of the three years in the period ended December 31, 2009. These financial statements are the responsibility of the Company’s management. Our responsibility is to express an opinion on these financial statements based on our audits.
We conducted our audits in accordance with the standards of the Public Company Accounting Oversight Board (United States). Those standards require that we plan and perform the audit to obtain reasonable assurance about whether the financial statements are free of material misstatement. An audit includes examining, on a test basis, evidence supporting the amounts and disclosures in the financial statements. An audit also includes assessing the accounting principles used and significant estimates made by management, as well as evaluating the overall financial statement presentation. We believe that our audits provide a reasonable basis for our opinion.
In our opinion, the consolidated financial statements referred to above present fairly, in all material respects, the financial position of Epicor Software Corporation and subsidiaries as of December 31, 2009 and 2008, and the results of their operations and their cash flows for each of the three years in the period ended December 31, 2009, in conformity with U.S. generally accepted accounting principles.
As described in Note 1 to the consolidated financial statements, effective January 1, 2009, the Company changed its method of accounting for convertible debt for all periods presented.
We have also audited, in accordance with the standards of the Public Company Accounting Oversight Board (United States), Epicor Software Corporation’s and subsidiaries’ internal control over financial reporting as of December 31, 2009, based on criteria established in Internal Control—Integrated Framework issued by the Committee of Sponsoring Organizations of the Treadway Commission, and our report dated March 12, 2010 expressed an unqualified opinion on the effectiveness of Epicor Software Corporation’s internal control over financial reporting.
/s/ McGladrey & Pullen, LLP
Irvine, California
March 12, 2010
60
Table of Contents
CONSOLIDATED BALANCE SHEETS
(in thousands, except per share amounts)
| December 31, 2009 |
December 31, 2008 |
|||||||
| As Adjusted (Note 1) |
||||||||
| ASSETS |
||||||||
| Current assets: |
||||||||
| Cash and cash equivalents |
$ | 106,861 | $ | 89,764 | ||||
| Accounts receivable, net |
90,011 | 90,624 | ||||||
| Deferred income taxes |
11,572 | 8,627 | ||||||
| Inventory, net |
1,819 | 5,068 | ||||||
| Prepaid expenses and other current assets |
13,976 | 11,064 | ||||||
| Total current assets |
224,239 | 205,147 | ||||||
| Property and equipment, net |
28,511 | 31,987 | ||||||
| Deferred income taxes |
21,867 | 24,038 | ||||||
| Intangible assets, net |
84,107 | 113,556 | ||||||
| Goodwill |
368,336 | 363,589 | ||||||
| Other assets |
10,990 | 14,061 | ||||||
| Total assets |
$ | 738,050 | $ | 752,378 | ||||
| LIABILITIES AND STOCKHOLDERS’ EQUITY |
||||||||
| Current liabilities: |
||||||||
| Accounts payable |
$ | 13,966 | $ | 13,913 | ||||
| Accrued compensation and benefits |
21,790 | 21,035 | ||||||
| Other accrued expenses |
24,964 | 24,142 | ||||||
| Current portion of long-term debt |
202 | 10,169 | ||||||
| Current portion of accrued restructuring costs |
1,694 | 4,073 | ||||||
| Current portion of deferred revenue |
96,040 | 92,361 | ||||||
| Total current liabilities |
158,656 | 165,693 | ||||||
| Long-term debt, less current portion |
255,535 | 265,257 | ||||||
| Long-term portion of accrued restructuring costs |
4,423 | 5,412 | ||||||
| Long-term portion of deferred revenue |
392 | 319 | ||||||
| Long-term deferred income taxes and other income taxes |
15,172 | 18,801 | ||||||
| Other long-term liabilities |
3,785 | 941 | ||||||
| Total long-term liabilities |
279,307 | 290,730 | ||||||
| Commitments and contingencies (Note 8) |
||||||||
| Stockholders’ equity: |
||||||||
| Common stock, $0.001 par value, 180,000 shares authorized: 63,121 and 61,450 shares issued and outstanding |
63 | 61 | ||||||
| Additional paid-in capital |
422,460 | 414,149 | ||||||
| Less: treasury stock at cost, 1,969 and 1,556 shares |
(20,670 | ) | (18,458 | ) | ||||
| Accumulated other comprehensive loss |
(4,825 | ) | (4,094 | ) | ||||
| Accumulated deficit |
(96,941 | ) | (95,703 | ) | ||||
| Total stockholders’ equity |
300,087 | 295,955 | ||||||
| Total liabilities and stockholders’ equity |
$ | 738,050 | $ | 752,378 | ||||
See accompanying notes to consolidated financial statements.
61
Table of Contents
CONSOLIDATED STATEMENTS OF OPERATIONS
(in thousands, except per share amounts)
| Year ended December 31, | ||||||||||||
| 2009 | 2008 | 2007 | ||||||||||
| As Adjusted (Note 1) |
As Adjusted (Note 1) |
|||||||||||
| Revenues: |
||||||||||||
| License fees |
$ | 70,235 | $ | 90,416 | $ | 109,443 | ||||||
| Consulting |
128,413 | 152,153 | 134,722 | |||||||||
| Maintenance |
190,943 | 192,308 | 160,278 | |||||||||
| Hardware and other |
20,033 | 53,002 | 25,389 | |||||||||
| Total revenues |
409,624 | 487,879 | 429,832 | |||||||||
| Cost of revenues: |
||||||||||||
| License fees |
14,646 | 18,215 | 23,748 | |||||||||
| Consulting |
104,307 | 125,747 | 110,668 | |||||||||
| Maintenance |
44,009 | 48,110 | 34,956 | |||||||||
| Hardware and other |
17,587 | 47,840 | 22,506 | |||||||||
| Amortization of intangible assets |
30,772 | 32,896 | 17,419 | |||||||||
| Total cost of revenues |
211,321 | 272,808 | 209,297 | |||||||||
| Gross profit |
198,303 | 215,071 | 220,535 | |||||||||
| Operating expenses: |
||||||||||||
| Sales and marketing |
75,105 | 82,883 | 80,508 | |||||||||
| Software development |
49,207 | 52,533 | 37,369 | |||||||||
| General and administrative |
54,410 | 52,139 | 58,302 | |||||||||
| Restructuring and other |
2,210 | 9,143 | 1,571 | |||||||||
| Write-off of in-process research and development |
— | 200 | — | |||||||||
| Total operating expenses |
180,932 | 196,898 | 177,750 | |||||||||
| Income from operations |
17,371 | 18,173 | 42,785 | |||||||||
| Other income (expense): |
||||||||||||
| Interest expense |
(22,363 | ) | (22,522 | ) | (12,464 | ) | ||||||
| Gain on sale of non-strategic asset |
— | — | 1,579 | |||||||||
| Interest and other income, net |
411 | 303 | 6,639 | |||||||||
| Other income (expense), net |
(21,952 | ) | (22,219 | ) | (4,246 | ) | ||||||
| Income (loss) before income taxes |
(4,581 | ) | (4,046 | ) | 38,539 | |||||||
| Income tax benefit |
(3,343 | ) | (595 | ) | (536 | ) | ||||||
| Net income (loss) |
$ | (1,238 | ) | $ | (3,451 | ) | $ | 39,075 | ||||
| Net income (loss) per share: |
||||||||||||
| Basic |
$ | (0.02 | ) | $ | (0.06 | ) | $ | 0.68 | ||||
| Diluted |
$ | (0.02 | ) | $ | (0.06 | ) | $ | 0.67 | ||||
| Weighted average common shares outstanding: |
||||||||||||
| Basic |
57,889 | 58,351 | 57,112 | |||||||||
| Diluted |
57,889 | 58,351 | 58,003 | |||||||||
62
Table of Contents
Consolidated Statements of Stockholders’ Equity and Comprehensive Income (Loss)
(in thousands)
| Common Stock | Additional Paid-in |
Treasury Stock | Accumulated Other Comprehensive Income (Loss) |
Accumulated Deficit |
Net Stockholders’ Equity |
Comprehensive Income (Loss) |
|||||||||||||||||||||||||
| Shares | Amount | Capital | Shares | Amount | |||||||||||||||||||||||||||
| Balance December 31, 2006 |
58,810 | $ | 59 | $ | 350,605 | 903 | $ | (10,895 | ) | $ | (954 | ) | $ | (130,195 | ) | $ | 208,620 | ||||||||||||||
| Acquisition of treasury stock |
216 | (2,988 | ) | (2,988 | ) | ||||||||||||||||||||||||||
| Stock-based compensation expense |
11,694 | 11,694 | |||||||||||||||||||||||||||||
| Issuance of restricted stock |
427 | 1 | 104 | 105 | |||||||||||||||||||||||||||
| Employee stock purchases |
53 | 678 | 678 | ||||||||||||||||||||||||||||
| Exercise of stock options |
417 | 2,268 | 2,268 | ||||||||||||||||||||||||||||
| Excess tax benefits of stock compensation |
1,388 | 1,388 | |||||||||||||||||||||||||||||
| Cumulative effect adjustment from adoption of new accounting for income taxes (Note 9) |
(1,132 | ) | (1,132 | ) | |||||||||||||||||||||||||||
| Adoption of new accounting for convertible debt (Note 1) |
36,545 | 36,545 | |||||||||||||||||||||||||||||
| Net income |
39,075 | 39,075 | $ | 39,075 | |||||||||||||||||||||||||||
| Foreign currency translation |
1,015 | 1,015 | 1,015 | ||||||||||||||||||||||||||||
| Balance at December 31, 2007, as adjusted |
59,707 | 60 | 403,282 | 1,119 | (13,883 | ) | 61 | (92,252 | ) | 297,268 | $ | 40,090 | |||||||||||||||||||
| Acquisition of treasury stock |
437 | (4,575 | ) | (4,575 | ) | ||||||||||||||||||||||||||
| Stock-based compensation expense |
7,045 | 7,045 | |||||||||||||||||||||||||||||
| Stock-based compensation expense included in restructuring expense |
1,265 | 1,265 | |||||||||||||||||||||||||||||
| Issuance of restricted stock |
1,281 | 1 | (1 | ) | — | ||||||||||||||||||||||||||
| Employee stock purchases |
68 | 561 | 561 | ||||||||||||||||||||||||||||
| Exercise of stock options |
394 | 1,597 | 1,597 | ||||||||||||||||||||||||||||
| Excess tax benefits of stock compensation |
400 | 400 | |||||||||||||||||||||||||||||
| Net loss |
(3,451 | ) | (3,451 | ) | $ | (3,451 | ) | ||||||||||||||||||||||||
| Foreign currency translation |
(4,554 | ) | (4,554 | ) | (4,554 | ) | |||||||||||||||||||||||||
| Net unrealized loss on derivative financial instruments, net of tax |
(326 | ) | (326 | ) | (326 | ) | |||||||||||||||||||||||||
| Net unrealized gain on pension plan liabilities, net of tax |
725 | 725 | 725 | ||||||||||||||||||||||||||||
| Balance at December 31, 2008, as adjusted |
61,450 | 61 | 414,149 | 1,556 | (18,458 | ) | (4,094 | ) | (95,703 | ) | 295,955 | $ | (7,606 | ) | |||||||||||||||||
| Acquisition of treasury stock |
413 | (2,212 | ) | (2,212 | ) | ||||||||||||||||||||||||||
| Stock-based compensation expense |
8,108 | 8,108 | |||||||||||||||||||||||||||||
| Stock-based compensation expense included in restructuring expense |
183 | 183 | |||||||||||||||||||||||||||||
| Issuance of restricted stock |
1,485 | 2 | (2 | ) | — | ||||||||||||||||||||||||||
| Employee stock purchases |
112 | 474 | 474 | ||||||||||||||||||||||||||||
| Exercise of stock options |
74 | 207 | 207 | ||||||||||||||||||||||||||||
| Excess tax benefits of stock compensation |
(659 | ) | (659 | ) | |||||||||||||||||||||||||||
| Net loss |
(1,238 | ) | (1,238 | ) | $ | (1,238 | ) | ||||||||||||||||||||||||
| Foreign currency translation |
(154 | ) | (154 | ) | (154 | ) | |||||||||||||||||||||||||
| Net realized loss on derivative financial instruments, net of tax |
326 | 326 | 326 | ||||||||||||||||||||||||||||
| Net unrealized loss on pension plan liabilities, net of tax |
(903 | ) | (903 | ) | (903 | ) | |||||||||||||||||||||||||
| Balance December 31, 2009 |
63,121 | $ | 63 | $ | 422,460 | 1,969 | $ | (20,670 | ) | $ | (4,825 | ) | $ | (96,941 | ) | $ | 300,087 | $ | (1,969 | ) | |||||||||||
See accompanying notes to consolidated financial statements.
63
Table of Contents
CONSOLIDATED STATEMENTS OF CASH FLOWS
(in thousands)
| Year Ended December 31, | ||||||||||||
| 2009 | 2008 | 2007 | ||||||||||
| As Adjusted (Note 1) |
As Adjusted (Note 1) |
|||||||||||
| Operating activities |
||||||||||||
| Net income (loss) |
$ | (1,238 | ) | $ | (3,451 | ) | $ | 39,075 | ||||
| Adjustments to reconcile net income (loss) to net cash provided by operating activities: |
||||||||||||
| Depreciation and amortization |
38,698 | 41,110 | 23,908 | |||||||||
| Stock-based compensation expense |
8,108 | 7,045 | 11,694 | |||||||||
| Provision for doubtful accounts |
4,287 | 3,288 | 3,882 | |||||||||
| Provision for excess and obsolete inventory |
341 | 422 | 78 | |||||||||
| Amortization and write-off of debt issuance fees |
4,437 | 1,757 | 1,419 | |||||||||
| Amortization of long-term debt discount |
7,907 | 7,356 | 4,347 | |||||||||
| Gain on sale of non-strategic asset |
— | — | (1,579 | ) | ||||||||
| Restructuring charges |
2,187 | 9,143 | 909 | |||||||||
| Change in fair value of interest rate swaps |
504 | — | — | |||||||||
| Excess tax benefits from share-based payment arrangements |
(636 | ) | (847 | ) | (1,690 | ) | ||||||
| In-process research and development charge |
— | 200 | — | |||||||||
| Changes in operating assets and liabilities, net of effects of acquisitions and dispositions: |
||||||||||||
| Accounts receivable |
(925 | ) | 15,900 | (16,881 | ) | |||||||
| Inventory |
2,909 | 244 | 269 | |||||||||
| Prepaid expenses and other current assets |
(2,999 | ) | 1,820 | (589 | ) | |||||||
| Other assets |
(106 | ) | 1,271 | (783 | ) | |||||||
| Income taxes |
(8,146 | ) | (5,853 | ) | (5,452 | ) | ||||||
| Accounts payable |
(235 | ) | (6,933 | ) | (149 | ) | ||||||
| Accrued expenses |
(166 | ) | (7,371 | ) | 3,867 | |||||||
| Accrued restructuring costs |
(5,905 | ) | (10,019 | ) | (1,245 | ) | ||||||
| Deferred revenue |
841 | 9,349 | — | |||||||||
| Other long-term liabilities |
1,721 | (12 | ) | 4,208 | ||||||||
| Net cash provided by operating activities |
51,584 | 64,419 | 65,288 | |||||||||
| Investing activities |
||||||||||||
| Purchases of property and equipment |
(4,093 | ) | (9,946 | ) | (7,926 | ) | ||||||
| Cash paid for business combinations, net of cash acquired |
(973 | ) | (285,945 | ) | (16,814 | ) | ||||||
| Proceeds from sale of non-strategic asset |
— | — | 2,500 | |||||||||
| Sale of short-term investment |
— | 1,371 | (1,371 | ) | ||||||||
| Cash designated for acquisition |
— | 161,000 | (161,000 | ) | ||||||||
| Net cash used in investing activities |
(5,066 | ) | (133,520 | ) | (184,611 | ) | ||||||
| Financing activities |
||||||||||||
| Proceeds from long-term debt |
72,500 | 160,000 | 230,000 | |||||||||
| Principal payments on long-term debt |
(100,196 | ) | (62,357 | ) | (99,417 | ) | ||||||
| Debt issuance fees |
(1,021 | ) | (6,021 | ) | (8,175 | ) | ||||||
| Proceeds from exercise of stock options |
207 | 1,597 | 2,268 | |||||||||
| Proceeds from employee stock purchase plan |
474 | 561 | 678 | |||||||||
| Excess tax benefits from share-based payment arrangements |
636 | 847 | 1,690 | |||||||||
| Purchase of treasury stock |
(2,212 | ) | (4,575 | ) | (2,988 | ) | ||||||
| Issuance of restricted stock |
— | — | 1 | |||||||||
| Net cash provided by (used in) financing activities |
(29,612 | ) | 90,052 | 124,057 | ||||||||
| Effect of exchange rate changes on cash |
191 | (6,345 | ) | 246 | ||||||||
| Net increase in cash and cash equivalents |
17,097 | 14,606 | 4,980 | |||||||||
| Cash and cash equivalents at beginning of period |
89,764 | 75,158 | 70,178 | |||||||||
| Cash and cash equivalents at end of period |
$ | 106,861 | $ | 89,764 | $ | 75,158 | ||||||
See accompanying notes to consolidated financial statements.
64
Table of Contents
NOTES TO CONSOLIDATED FINANCIAL STATEMENTS
Note 1. Nature of Operations and Summary of Significant Accounting Policies
Nature of Operations and Basis of Presentation
Epicor Software Corporation, a Delaware corporation, and its subsidiaries (Epicor or the Company) design, develop, market and support integrated enterprise business software solutions for use by mid-size businesses as well as divisions and subsidiaries of larger corporations worldwide. The Company also offers support, consulting and education services in support of its customers’ use of its software products. The consolidated financial statements include the accounts of the Company and its subsidiaries. Intercompany balances and transactions have been eliminated in consolidation. The financial statements are prepared in conformity with accounting principles generally accepted in the United States of America.
Change in Accounting Principle
Effective January 1, 2009, the Company changed its method of accounting for its convertible debt (Note 6). In May 2008, the Financial Accounting Standards Board (FASB) issued new accounting guidance related to the accounting for convertible debt instruments that may be settled in cash upon conversion. This guidance requires the Company to account separately for the liability and equity components of our convertible notes in a manner that reflects our nonconvertible debt borrowing rate when interest cost is recognized in subsequent periods. This guidance requires bifurcation of a component of the debt, classification of that component in equity, and then accretion of the resulting discount on the debt as part of interest expense being reflected in the Consolidated Statement of Operations. The guidance requires retrospective application to all periods presented and is effective for fiscal years beginning after December 15, 2008. Accordingly, the Company’s Consolidated Balance Sheet as of December 31, 2008 and Statements of Operations for the years ended December 31, 2008 and 2007 have been restated.
The accounting change impacted the carrying amount of our convertible debt (debt discount), required the Company to record additional interest expense related to the amortization of the debt discount and resulted in reclassification of debt issuance costs, deferred tax liabilities and additional paid-in capital, as discussed in more detail in Note 6.
The effect of adoption on the Company’s Consolidated Balance Sheets is as follows (in thousands):
| Increased/(Decreased): |
December 31, 2009 |
December 31, 2008 |
||||||
| Other assets |
$ | (964 | ) | $ | (1,357 | ) | ||
| Deferred income taxes |
(16,028 | ) | (18,820 | ) | ||||
| Long-term debt, less current portion |
(42,143 | ) | (50,048 | ) | ||||
| Additional paid-in capital |
36,545 | 36,545 | ||||||
| Accumulated deficit |
11,394 | 6,674 | ||||||
The effect of adoption on the Company’s Consolidated Statements of Operations is as follows (in thousands, except per share amounts):
| Year Ended December 31, | ||||||||||||
| 2009 | 2008 | 2007 | ||||||||||
| Increase of interest expense |
$ | 7,512 | $ | 6,909 | $ | 3,995 | ||||||
| Increase of income tax (benefit) |
(2,792 | ) | (2,437 | ) | (1,793 | ) | ||||||
| Decrease of net income (loss) |
4,720 | 4,472 | 2,202 | |||||||||
| Decrease of net income (loss) per share - basic |
$ | 0.08 | $ | 0.08 | $ | 0.04 | ||||||
| Decrease of net income (loss) per share - diluted |
$ | 0.08 | $ | 0.08 | $ | 0.04 | ||||||
Adoption had no impact on cash flows from operating, investing or financing activities.
65
Table of Contents
Use of Estimates
The preparation of financial statements in conformity with United States of America generally accepted accounting principles (GAAP) requires management to make estimates and assumptions that affect the amounts reported in the financial statements and accompanying notes. Actual amounts could differ from these estimates. Significant estimates made in preparing the consolidated financial statements include the allowance for doubtful accounts, cash flows used to evaluate the recoverability of the Company’s long-lived assets, valuation allowances for deferred tax assets, estimation of uncertain tax positions, lives of intangible assets, property, plant and equipment, post retirement benefits, interest rate for nonconvertible debt and certain accrued liabilities related to restructuring activities.
Cash and Cash Equivalents
The Company considers all highly liquid investments purchased with an original maturity of three months or less to be cash equivalents.
Fair Value of Financial Instruments
The Company’s financial instruments consist of cash and cash equivalents, trade receivables and payables, its credit facilities (Note 6), convertible senior notes (Note 6), interest rate swap agreements (Note 7) and foreign currency option contracts related to the acquisition of NSB Retail Systems PLC (NSB). The carrying amounts of cash and cash equivalents and trade receivables and payables approximate fair value because of their short-term maturities. The interest rate swap agreements are reported at fair value as of December 31, 2009 and 2008. The fair value of the $230,000,000 convertible senior notes at December 31, 2009 and 2008 was $196,650,000 and $106,559,000, respectively, as determined based upon quoted market prices.
Inventory
Inventories, which are comprised solely of finished goods, are stated at the lower of cost (first-in, first-out or “FIFO”) or market. Probable losses from obsolete and slow moving inventories are recorded when identified. For the years ended December 31, 2009, 2008 and 2007, the Company recorded $341,000, $422,000 and $78,000, respectively, in provisions for obsolete and slow-moving inventories. As of December 31, 2009 and 2008, the Company maintained related reserves of $168,000 and $298,000, respectively.
Revenue Recognition
The Company recognizes revenue in accordance with accounting principles generally accepted in the United States of America, specifically, the Company recognizes revenue in accordance with software industry specific GAAP.
The Company enters into contractual arrangements with end-users of its products to sell software licenses, maintenance services and consulting services, either separately or in various combinations thereof. For each arrangement, revenues are recognized when persuasive evidence of an arrangement exists, the fees to be paid by the customer are fixed or determinable, collection of the fees is probable, delivery of the product has occurred, vendor-specific objective evidence (VSOE) of the fair value of any undelivered elements exists and no other significant obligations on the part of the Company remain.
For multiple-element software arrangements, the Company accounts for the software license component using the residual method. The residual method generally requires recognition of software license revenue in a multiple-element arrangement once all software products have been delivered and accepted by the customer and the only undelivered elements are maintenance services and/or consulting services. The fair value of the maintenance services is determined based on VSOE of fair value and is deferred and recorded ratably over the maintenance service period. Fair value for any related consulting services is determined by VSOE of fair value and generally recognized as the services are performed. After any required fair value allocations to the undelivered maintenance and/or consulting services elements, the residual contractual consideration is allocated to the license element associated with the software products sold as part of the transaction. The Company’s maintenance services VSOE of fair value is determined by reference to the price the Company’s customers are required to pay for the services when sold-separately (i.e. the maintenance service fees paid by the Company’s customers upon renewal). VSOE of fair value for consulting services is determined by reference to the price the Company’s customers are required to pay for such services when sold separately, or when sold independent of any of the Company’s other product or service offerings.
66
Table of Contents
In certain instances, the Company enters into arrangements that include two or more non-software products or services such as hardware and related services. Such arrangements are divided into separate units of accounting provided that the delivered item has stand-alone value and there is objective and reliable evidence of the fair value of the undelivered items. The total arrangement fee is allocated to the undelivered elements based on their fair values and to the initial delivered elements using the residual method. Revenue is recognized separately, and in accordance with the Company’s revenue recognition policy, for each element. Sales taxes collected from customers are recorded on a net basis.
License Revenues: Amounts allocated to software license revenues sold directly by the Company are recognized at the time of shipment of the software when fair value for all undelivered elements exists and all the other revenue recognition criteria discussed above have been met.
Revenues on sales made to the Company’s resellers are recognized upon shipment of the Company’s software to the reseller when the reseller has an identified end-user and all other revenue recognition criteria noted above are met. Under limited arrangements with certain distributors, all the revenue recognition criteria have been met upon delivery of the product to the distributor and, accordingly, revenues are recognized at that time. The Company does not offer a right of return on its products.
Consulting Service Revenues: Consulting service revenues are comprised of consulting and implementation services and, to a limited extent, other services such as training, software hosting, applications management and software as a service (“SaaS”). Consulting services are sold on a fixed fee and time-and-materials basis and can include services ranging from software installation to data conversion and building non-complex interfaces to allow the software to operate in integrated environments. Consulting engagements can last anywhere from one day to several months and are based strictly on the customer’s requirements and complexities and are independent of the functionality of the Company’s software. The Company’s software, as delivered, can generally be used by the customer for the customer’s purpose upon installation. Further, implementation and integration services provided are generally not essential to the functionality of the software, as delivered, and do not result in any material changes to the underlying software code. Services are generally separable from the other elements under the same arrangement since the performance of the services are not essential to the functionality of the other elements of the transaction, the services are described in the contract such that the total price of the arrangement would be expected to vary as the result of the inclusion or exclusion of the services, and VSOE of fair value exists for the services based on sold-separately data. For services performed on a time-and-materials basis, revenue is recognized when the services are performed and billed. On occasion, the Company enters into fixed fee arrangements or arrangements in which customer payments are tied to achievement of specific milestones. In fixed fee arrangements, revenue is recognized as services are performed as measured by hours incurred to date, as compared to total estimated hours to be incurred to complete the work. In milestone achievement arrangements, the Company recognizes revenue as the respective milestones are achieved. If, in the services element of the arrangement the Company performs significant production, modification or customization of its software, the Company accounts for the entire arrangement, inclusive of the software license revenue, using contract accounting as the software and services do not meet the criteria for separation. In such instances, the software license revenue is recognized as the services are performed utilizing the same methodology applied to fixed fee arrangements.
Hosting, outsourcing and applications management revenues consist primarily of recurring fees for remote management, monitoring, data processing, updating or administrative support of applications software, servers, operating systems and other automation tools. SaaS revenues are comprised of recurring fees for licensing access to and the use of the Company’s application software as a service, on a subscription or on-demand basis over a contractual term. Related recurring fees are recognized as the services are provided. Related one time set up fees are recognized on a straight-line basis over the longer of the contractual term or the expected life of the relationship.
The Company has recorded unbilled consulting revenues totaling $2,602,000 and $1,933,000 at December 31, 2009 and 2008, respectively. These unbilled revenues represent consulting services performed during the last few business days of the quarter but not billed until the following month. The Company cuts off consulting billing prior to the end of each month. Unbilled consulting revenue is recorded in accounts receivable in the accompanying Consolidated Balance Sheets.
67
Table of Contents
Maintenance and Support Service Revenues: Maintenance and support service revenues consist primarily of fees for providing unspecified software upgrades on a when-and-if-available basis and technical support over a specified term, which is typically twelve months. Maintenance revenues are typically paid in advance and are recognized on a straight-line basis over the term of the contract.
Hardware Revenues: In some cases, the Company resells third party hardware systems and related peripherals as part of an end-to-end solution requested by its customers. Hardware revenue is recognized when persuasive evidence of an arrangement exists, delivery has occurred, the fee is fixed or determinable and collection is considered probable. The Company considers delivery to occur when the product is shipped and title and risk of loss have passed to the customer.
Software License Indemnification: The Company’s standard software license agreements contain an infringement indemnity clause under which the Company agrees to defend, indemnify and hold harmless our customers and business partners against liability and damages arising from third party claims that the Company’s products violate or infringe the intellectual property rights of others. These clauses constitute a form of guarantee that is subject to disclosure requirements, but not to initial recognition or measurement provisions. The Company has never lost a third party infringement claim, and, to date, the Company’s costs to defend such claims and/or lawsuits have been insignificant. Although it is possible that in the future third parties may claim that the Company’s current or future software solutions infringe upon their intellectual property, a maximum obligation arising out of these types of agreements is not explicitly stated and, therefore, the overall maximum amount of these obligations cannot be reasonably estimated.
Allowance for Doubtful Accounts
The Company’s accounts receivable go through a collection process that is based on the age of the invoice and requires attempted contacts with customers at specified intervals and assistance from other personnel within the Company who have a relationship with the customer. The Company writes off accounts to its allowance when the Company has determined that collection is not likely. The Company believes no significant concentrations of credit risk existed at December 31, 2009. Receivables from customers are generally unsecured.
The Company maintains an allowance for doubtful accounts based on historical collections performance and specific collection issues. If actual bad debts differ from the reserves calculated, the Company records an adjustment to bad debt expense in the period in which the difference occurs.
Activity for the allowance for doubtful accounts is as follows (in thousands):
| Balance at Beginning of Period |
Provision for Doubtful Accounts |
Amounts Written Off and Other Adjustments |
Balance at End of Period | ||||||||||
| For the Year Ended December 31, 2007 |
$ | 6,378 | $ | 3,882 | $ | (2,252 | ) | $ | 8,008 | ||||
| For the Year Ended December 31, 2008 |
$ | 8,008 | $ | 3,288 | $ | (3,610 | ) | $ | 7,686 | ||||
| For the Year Ended December 31, 2009 |
$ | 7,686 | $ | 4,287 | $ | (3,416 | ) | $ | 8,557 | ||||
Property and Equipment
Land, buildings, equipment, furniture, fixtures and leasehold improvements are recorded at cost. The Company does not depreciate land and depreciates buildings using the straight-line method over forty years. Equipment, furniture and fixtures are depreciated using the straight-line method over the estimated useful lives of the assets, which are generally two to seven years. Leasehold improvements are amortized over the lesser of their estimated useful life or the remaining term of the lease.
Long-Lived Assets
Long-lived assets, such as property, plant and equipment and purchased intangible assets with finite lives are evaluated for impairment when events or changes in circumstances occur that indicate that their carrying value may not be recoverable from future cash flows. Based on the Company’s most recent analysis, the Company has concluded there is no indication of impairment at December 31, 2009.
68
Table of Contents
Software Development Costs
Software development costs consist primarily of compensation of development personnel, related overhead incurred to develop new products and upgrade and enhance the Company’s current products and fees paid to outside consultants. Software development costs incurred subsequent to the determination of technological feasibility and marketability of a software product are capitalized. Capitalization of costs ceases and amortization of capitalized software development costs commences when the products are available for general release. For the years ended December 31, 2009, 2008 and 2007, no software development costs were capitalized because the time period and cost incurred between technological feasibility and general release for all software product releases was insignificant.
Intangible Assets
The Company’s intangible assets are comprised of acquired technology, customer base and trademarks. These intangible assets are amortized over the estimated economic life of the asset. The Company periodically evaluates the recoverability of the intangible assets and considers any events or changes in circumstances that would indicate that the carrying amount of an asset may not be recoverable. Any material changes in circumstances, such as large decreases in revenue or the discontinuation of a particular product line could require future write-downs in the Company’s intangible assets and could have a material adverse impact on the Company’s operating results for the periods in which such write-downs occur.
Goodwill
The Company’s goodwill was recorded as a result of the Company’s acquisitions. The Company has recorded these acquisitions using the acquisition method and purchase method of accounting. The Company annually performs an impairment review of its recorded goodwill, and in 2009 determined that no impairment of goodwill existed because the estimated fair value of each reporting unit exceeded its carrying amount. The Company tests its recorded goodwill for impairment on an annual basis, or more often if indicators of potential impairment exist, by determining if the carrying value of each reporting unit exceeds its estimated fair value. Factors that could trigger an interim impairment test include, but are not limited to, underperformance relative to historical or projected future operating results, significant changes in the manner of use of the acquired assets or the Company’s overall business, significant negative industry or economic trends and a sustained period where market capitalization, plus an appropriate control premium, is less than stockholders’ equity. Future impairment reviews may require write-downs in the Company’s goodwill and could have a material adverse impact on the Company’s operating results for the periods in which such write-downs occur.
Advertising Costs
The Company expenses advertising costs as incurred. Advertising expense totaled $1,026,000, $1,748,000 and $1,399,000 for the years ended December 31, 2009, 2008 and 2007, respectively.
Foreign Currency
The functional currency of the Company’s foreign entities is generally the respective local country’s currency. Assets and liabilities of such foreign entities are translated into the reporting currency using the exchange rates on the balance sheet dates. Revenues and expenses are translated into the reporting currency using the average exchange rates prevailing during the reporting period. Translation adjustments are included in accumulated other comprehensive income (loss) within stockholders’ equity in the consolidated balance sheets. For the years ended December 31, 2009, 2008 and 2007, the Company recorded translation gains (losses) of $(154,000), $(4,554,000) and $1,015,000, respectively, in other comprehensive income (loss). Certain entities maintain accounting records in a currency other than the entities’ functional currency, in which case financial information is remeasured to the entity’s functional currency whereby monetary assets and liabilities are translated at the exchange rates on the balance sheet dates, non-monetary assets and liabilities are translated at historical exchange rates, and revenues and expenses are translated using the average exchange rates prevailing during the reporting period. Foreign currency transaction gains and losses resulting from remeasurement are included in “interest and other income, net” in the Consolidated Statements of Operations. Additionally, the Company enters into certain foreign currency transactions whereby changes in exchange rates between an entity’s functional currency and the currency in which a transaction is denominated results in foreign currency transaction gains and losses, which are also included in “interest and other income, net” in the Consolidated Statements of Operations. For the years ended December 31, 2009, 2008 and 2007, the Company recorded realized and unrealized transaction losses of $544,000, $2,552,000 and $695,000, respectively, in “interest and other income, net.”
69
Table of Contents
The Company conducts limited operations in Venezuela (e.g., revenue derived from Venezuelan operations represented less than 0.02% of the Company’s consolidated revenue for the year ended December 31, 2009). In January 2010, the government of Venezuela devalued its bolivar currency from 2.15 to 4.30 bolivares per United States dollar.
On December 14, 2007 the Company purchased three call options with aggregate notional value of £160 million maturing March 31, 2008 for $4,114,000 to hedge its exposure to negative fluctuations in the pound sterling denominated purchase consideration related to the NSB acquisition (Note 3). The options were adjusted to fair value on December 31, 2007 to $1,802,000, which resulted in an unrealized loss of $2,312,000. The unrealized loss was recorded as foreign currency transaction loss and is included in “interest and other income, net,” in the Consolidated Statements of Operations for the year ended December 31, 2007. The call options are not considered cash flow hedges, therefore they were adjusted to fair value through earnings.
On February 11, 2008, the Company sold the foreign currency call options back to the issuing institutions for $192,000, resulting in net foreign currency transaction loss of $1,610,000. The loss resulted from depreciation of pounds sterling against the U.S. dollar. The net loss is included in “interest and other income, net,” in the Consolidated Statements of Operations for the year ended December 31, 2008.
The Company’s Board of Directors has approved a foreign currency risk policy that allows the Company to enter into forward contracts and purchase option agreements to hedge foreign currency risks. The Company has an on-going program to evaluate its foreign currency risk and to minimize these risks whenever possible through leading and lagging accounts payables and accounts receivables, centralized cash management and other forms of natural hedging. The Company also uses forward contracts or purchased options to hedge some of its foreign currency transaction exposure. Gains and losses resulting from these transactions are included in “interest and other income, net.” As of December 31, 2009 and 2008, the Company had no open forward contracts or purchase options.
Concentration of Credit Risks
The Company sells its products directly to end-users generally requiring an up-front payment and remaining terms appropriate for the creditworthiness of the customer. The Company also sells its products to value added resellers (VARs) and other software distributors generally under terms appropriate for the creditworthiness of the VAR or distributor. The Company believes no significant concentrations of credit risk existed as of December 31, 2009 or 2008, respectively. Receivables from VARs, software distributors and end users are typically unsecured.
The Company places its investments with high credit quality issuers and, by policy, limits the amount of credit exposure to any one issuer. Deposits with its U.S. issuers may exceed the amounts of federal deposit insurance provided on such deposits and deposits held outside the U.S. are not afforded such protection. The Company is averse to principal loss and ensures the safety and preservation of its invested funds by limiting default risk, market risk and reinvestment risk. The Company mitigates default risk by investing in only the safest and highest credit quality securities and by constantly positioning its portfolio to respond appropriately to a significant reduction in a credit rating of any investment issuer or guarantor. The Company has not experienced any losses on deposits of cash or cash equivalents.
Derivative Instruments
The Company uses derivative instruments, primarily forwards and swaps, to hedge certain foreign currency and interest rate cash flow risks. The Company also uses other derivative instruments not designated as hedges such as forwards to hedge foreign currency balance sheet fair value risks. The Company does not use derivatives for speculative purposes.
The Company recognizes all derivatives as either assets or liabilities in its Consolidated Balance Sheets and measures those instruments at fair value. In addition, gains and losses from measurement of fair value of its derivatives that do not qualify for hedge accounting treatment are recorded in “other income, net” in its Consolidated Statement of Operations. See Note 7 of Notes to Consolidated Financial Statements for a full description of the Company’s derivative financial instrument activities and related accounting policies.
70
Table of Contents
Basic and Diluted Net Income (Loss) per Share
Basic net income (loss) per share is computed by dividing the net income (loss) for the period by the weighted average number of common shares outstanding during the period, excluding shares of unvested restricted stock. Diluted net income (loss) per share is computed by dividing the net income (loss) for the period by the weighted average number of common and potential common shares outstanding during the period if their effect is dilutive.
For the years ended December 31, 2009, 2008 and 2007, options to purchase 902,000, 927,000 and 484,000 shares of common stock, respectively, with weighted average exercise prices of $12.17, $12.42 and $14.45, respectively, were outstanding but not included in the computation of diluted common shares outstanding because the effect would be anti-dilutive. Additionally, shares of common stock contingently issuable upon conversion of the convertible senior notes (Note 6) have not been included in the computation of diluted common shares outstanding because the conversion value did not exceed the principal amount of the notes.
The following table computes basic and diluted net income (loss) per share (in thousands, except per share amounts):
| Year Ended December 31, | ||||||||||||
| 2009 | 2008 | 2007 | ||||||||||
| As Adjusted | As Adjusted | |||||||||||
| Net income (loss) applicable to common stockholders |
$ | (1,238 | ) | $ | (3,451 | ) | $ | 39,075 | ||||
| Basic: |
||||||||||||
| Weighted average common shares outstanding |
61,087 | 60,847 | 59,460 | |||||||||
| Weighted average common shares of unvested restricted stock |
(3,198 | ) | (2,496 | ) | (2,348 | ) | ||||||
| Shares used in the computation of basic net income (loss) per share |
57,889 | 58,351 | 57,112 | |||||||||
| Net income (loss) per share applicable to common stockholders – basic |
$ | (0.02 | ) | $ | (0.06 | ) | $ | 0.68 | ||||
| Diluted: |
||||||||||||
| Shares used in the computation of basic net income (loss) per share |
57,889 | 58,351 | 57,112 | |||||||||
| Stock options and employee stock purchase plan (ESPP) shares |
— | — | 694 | |||||||||
| Unvested restricted stock |
— | — | 197 | |||||||||
| Shares used in the computation of diluted net income (loss) per share |
57,889 | 58,351 | 58,003 | |||||||||
| Net income (loss) per share applicable to common stockholders – diluted |
$ | (0.02 | ) | $ | (0.06 | ) | $ | 0.67 | ||||
Income Taxes
The Company provides for income taxes based on the estimated effective income tax rate for the complete fiscal year. The income tax provision (benefit) is computed on the pretax income (loss) of the consolidated entities located within each taxing jurisdiction based on current tax law. Deferred tax assets and liabilities are recognized for the future tax consequences attributable to temporary differences between the financial statement carrying amounts of existing assets and liabilities and their respective tax bases and operating loss and tax credit carryforwards. Deferred tax assets and liabilities are measured using enacted tax rates expected to apply to taxable income in the years in which those temporary differences are expected to be recovered or settled. The effect on deferred tax assets and liabilities of a change in tax rates is recognized in income in the period that includes the enactment date.
The Company regularly reviews the deferred tax assets for recoverability and has established a valuation allowance when it is more likely than not that some portion, or all, of the deferred tax assets will not be realized. The Company assesses the recoverability of the deferred tax assets and the need for a valuation allowance on an ongoing basis. In making this assessment, the Company is required to consider all available positive and negative evidence to determine whether, based on such evidence, it is more likely than not that some portion, or all, of the net deferred assets will be realized in future periods.
71
Table of Contents
The Company is subject to income taxes in the United States and numerous foreign jurisdictions. Significant judgment is required in evaluating our uncertain tax positions and determining our provision for income taxes. The Company applies a two-step approach to recognizing and measuring uncertain tax positions. The first step is to evaluate the tax position for recognition by determining if the weight of available evidence indicates that it is more likely than not that the position will be sustained on audit, including resolution of related appeals or litigation processes, if any. The second step is to measure the tax benefit as the largest amount that is more than 50% likely of being realized upon settlement.
Although the Company believes it has adequately reserved for its uncertain tax positions, no assurance can be given that the final tax outcome of these matters will not be different. The Company adjusts these reserves in light of changing facts and circumstances, such as the closing of a tax audit or the refinement of an estimate. To the extent that the final tax outcome of these matters is different than the amounts recorded, such differences will impact the provision for income taxes in the period in which such determination is made. The provision for income taxes includes the impact of reserve provisions and changes to reserves that are considered appropriate, as well as the related net interest.
During the ordinary course of business, there are many transactions and calculations for which the ultimate tax determination is uncertain. As a result, the Company recognizes tax liabilities based on estimates of whether additional taxes and interest will be due. These tax liabilities are recognized when, despite the Company’s belief that its tax return positions are supportable, the Company believes that certain positions may not be fully sustained upon review by tax authorities. The Company believes that its accruals for tax liabilities are adequate for all open audit years based on its assessment of many factors including past experience and interpretations of tax law. To the extent that the final tax outcome of these matters is different than the amounts recorded, such differences will impact income tax expense in the period in which such determination is made.
United States income taxes were not provided for on unremitted earnings from certain non-United States subsidiaries. Those unremitted earnings are considered to be indefinitely reinvested.
Stock-Based Compensation
Under the fair value recognition provisions, stock-based compensation expense is measured at the grant date and is expensed ratably over the vesting period. Determining the fair value of stock options at the grant date requires judgment, including estimating expected dividends, volatility, terms and estimating the amount of share-based awards that are expected to be forfeited. If actual forfeiture rates differ significantly from the estimate, stock-based compensation expense and the Company’s results of operations could be materially impacted. Beginning in 2006, the Company changed its previous practice of predominantly granting stock options to employees, and began granting primarily performance-based and time-based restricted stock as an alternative. Compensation expense for restricted stock is based on the fair market value of the restricted stock on its grant date, and is expensed ratably over the vesting period.
Performance-based restricted stock vests upon the attainment of specific performance targets. The measurement date of restricted stock containing performance-based vesting is the date the restricted stock grant is authorized and the specific performance goals are communicated. Compensation expense is recognized based on the probability that the performance criteria will be met. The recognition of compensation expense associated with performance-based vesting requires judgment in assessing the probability of meeting the performance goals, as well as defined criteria for assessing achievement of the performance-related goals. The continued assessment of probability may result in additional expense recognition or expense reversal depending on the level of achievement of the performance goals.
Comprehensive Income (Loss)
Total comprehensive income (loss) represents the net change in stockholders’ equity during a period from sources other than transactions with stockholders and, as such, includes net income (loss) and other specified components, which, for the Company, includes changes in the cumulative foreign currency translation adjustments, changes in value of interest rate swap derivatives (Note 7) and unrealized changes in the value of pension obligations (Note 13).
The following table summarizes, as of each balance sheet date, the components of the Company’s accumulated other comprehensive income, net of income taxes (in thousands):
| December 31, 2009 |
December 31, 2008 |
|||||||
| Accumulated foreign currency translation adjustments |
$ | (4,647 | ) | $ | (4,493 | ) | ||
| Unrealized gains/(losses) on defined benefit pension obligations |
(178 | ) | 725 | |||||
| Unrealized loss on derivative financial instruments |
— | (326 | ) | |||||
| Total |
$ | (4,825 | ) | $ | (4,094 | ) | ||
72
Table of Contents
New Accounting Pronouncements
In January 2010, the FASB issued an update to existing accounting standards to improve disclosures regarding fair value measurements and, thus, increase the transparency in financial reporting. The update provides that a reporting entity should disclose separately the amounts of significant transfers in and out of Level 1 and Level 2 fair value measurements and describe the reasons for the transfers; and in the reconciliation for fair value measurements using significant unobservable inputs, a reporting entity should present separately information about purchases, sales, issuances, and settlements. In addition, the update clarifies the requirements of the existing disclosures as follows: (1) For purposes of reporting fair value measurement for each class of assets and liabilities, a reporting entity needs to use judgment in determining the appropriate classes of assets and liabilities; and (2) A reporting entity should provide disclosures about the valuation techniques and inputs used to measure fair value for both recurring and nonrecurring fair value measurements. The update is effective for interim and annual reporting periods beginning after December 15, 2009, except for the disclosures about purchases, sales, issuances, and settlements in the roll forward of activity in Level 3 fair value measurements. Those disclosures are effective for fiscal years beginning after December 15, 2010, and for interim periods within those fiscal years. The Company will adopt these provisions and the adoption is not expected to have an impact on the consolidated financial statements.
In October 2009, the FASB issued new accounting guidance for revenue recognition with multiple-deliverable revenue arrangements. The objective of this guidance is to address the accounting for multiple-deliverable arrangements to enable vendors to account for products or services (deliverables) separately rather than as a combined unit as well as eliminate the use of the residual method for use in allocating contractual consideration and replace it with the relative selling price method. Vendors often provide multiple products or services to their customers. Those deliverables often are provided at different points in time or over different time periods. This update provides amendments to the criteria in Subtopic 605-25 for separating consideration in multiple-deliverable arrangements. The amendments in this update establish a selling price hierarchy for determining the selling price of a deliverable. The selling price used for each deliverable will be based on vendor-specific objective evidence if available, third-party evidence if vendor-specific objective evidence is not available, or estimated selling price if neither vendor-specific objective evidence nor third-party evidence is available. The amendments in this update also will replace the term fair value in the revenue allocation guidance with selling price to clarify that the allocation of revenue is based on entity-specific assumptions rather than assumptions of a marketplace participant. Additionally, the new guidance is only applicable to non-software related deliverables sold as part of a multiple-deliverable arrangement. In the instance an arrangement includes software deliverables as well as non-software related deliverables, the provisions of Topic 985 would apply to the software deliverables. This update is effective for fiscal years beginning on or after June 15, 2010; however, early adoption is permitted. The Company is currently evaluating the impact, if any, of this new accounting update on its consolidated financial statements.
In June 2009, the FASB issued the FASB Accounting Standards Codification (the Codification or ASC), which identifies the sources of accounting principles and the framework for selecting the principles used in the preparation of financial statements of nongovernmental entities that are presented in conformity with GAAP in the United States (the GAAP hierarchy). The Company adopted this standard as of September 30, 2009. The adoption of this standard changed how the Company references various elements of GAAP when preparing its financial statement disclosures, but had no impact on the Company’s financial position, results of operations or cash flows.
In May 2009, the FASB issued new accounting guidance on subsequent events. The objective is to establish general standards of accounting for and disclosure of events that occur after the balance sheet date but before financial statements are issued or are available to be issued. It is effective for interim and annual financial periods ending after June 15, 2009. The impact of adoption had no financial effect on the accompanying consolidated financial statements.
In May 2008, the FASB issued accounting guidance related to the accounting for convertible debt instruments that may be settled in cash upon conversion. This guidance requires the Company to account separately for the
73
Table of Contents
liability and equity components of our convertible notes in a manner that reflects our nonconvertible debt borrowing rate when interest cost is recognized in subsequent periods. This guidance requires bifurcation of a component of the debt, classification of that component in equity, and then accretion of the resulting discount on the debt as part of interest expense being reflected in the income statement. The guidance requires retrospective application to all periods presented and is effective for fiscal years beginning after December 15, 2008 and was adopted by the Company on January 1, 2009. The results of the adoption have been disclosed above and in Note 6.
In April 2008, the FASB issued accounting guidance to improve the consistency between the useful life of a recognized intangible asset and the period of expected cash flows used to measure the fair value of the asset in a business combination. This guidance is effective for financial statements issued for fiscal years beginning after December 15, 2008, and interim periods within those fiscal years. The adoption of this standard did not have a material effect on the accompanying consolidated financial statements.
In March 2008, the FASB issued accounting guidance for disclosures about derivative instruments and hedging activities. The guidance requires companies to provide enhanced disclosures regarding derivative instruments and hedging activities. It requires companies to better convey the purpose of derivative use in terms of the risks that such company is intending to manage. Disclosures about (a) how and why an entity uses derivative instruments, (b) how derivative instruments and related hedged items are accounted for, and (c) how derivative instruments and related hedged items affect a company's financial position, financial performance, and cash flows are required. This Statement is effective for fiscal years and interim periods beginning after November 15, 2008. The adoption of this standard had no financial effect on the accompanying consolidated financial statements.
In December 2007, the FASB issued accounting guidance for business combinations, which provides greater consistency in the accounting and financial reporting of business combinations. It requires the acquiring entity in a business combination to recognize all assets acquired and liabilities assumed in the transaction, establishes the acquisition-date fair value as the measurement objective for all assets acquired and liabilities assumed, and requires the acquirer to disclose the nature and financial effect of the business combination. It is effective for acquisitions in fiscal years beginning after December 15, 2008, or January 1, 2009, for the Company. The guidance also provides that any subsequent reduction to the deferred tax asset valuation allowance established in purchase accounting is to be accounted for as a reduction in income tax expense.
In February 2007, the FASB issued guidance on the fair value option for financial assets and financial liabilities. Under this guidance, the Company may elect to report financial instruments and certain other items at fair value on an investment-by-investment basis with changes in value reported in earnings. This election is irrevocable. It provides an opportunity to mitigate volatility in reported earnings that is caused by measuring hedged assets and liabilities that were previously required to use a different accounting method than the related hedging contracts when the complex provisions of accounting for derivative instruments and hedging activities are not met. The guidance is effective for years beginning after November 15, 2007. The Company did not elect to apply the alternative treatment of this standard; therefore, this standard had no financial effect on the accompanying consolidated financial statements.
In September 2006, the FASB issued a standard on fair value measurements, which clarified the definition of fair value whenever another standard requires or permits assets or liabilities to be measured at fair value. Specifically, the standard clarifies that fair value should be based on the assumptions market participants would use when pricing the asset or liability, and establishes a fair value hierarchy that prioritizes the information used to develop those assumptions. This standard does not expand the use of fair value to any new circumstances, and must be applied on a prospective basis except in certain cases. The standard also requires expanded financial statement disclosures about fair value measurements, including disclosure of the methods used and the effect on earnings.
In February 2008, accounting guidance was issued to defer the effective date of fair value measurements to fiscal years beginning after December 15, 2008, and interim periods within those fiscal years, for all nonfinancial assets and liabilities, except those that are recognized or disclosed at fair value in the financial statements on a recurring basis (at least annually). The partial adoption on January 1, 2008, with respect to financial assets and financial liabilities recognized or disclosed at fair value in the financial statements on a recurring basis did not have a material effect on consolidated results of operations and financial condition. The adoption of this full standard did not have a material effect on the accompanying consolidated financial statements.
Note 2. Composition of Certain Financial Statement Captions and Supplemental Cash Flow Information
The following summarizes the components of property and equipment (in thousands):
| December 31, | ||||||||
| 2009 | 2008 | |||||||
| Land |
$ | 5,112 | $ | 5,112 | ||||
| Building |
10,299 | 10,276 | ||||||
| Computer equipment |
35,144 | 32,104 | ||||||
| Furniture, fixtures and equipment |
7,995 | 8,588 | ||||||
| Leasehold improvements |
13,786 | 14,634 | ||||||
| 72,336 | 70,714 | |||||||
| Less accumulated depreciation |
(43,825 | ) | (38,727 | ) | ||||
| $ | 28,511 | $ | 31,987 | |||||
74
Table of Contents
Depreciation expense for the years ended December 31, 2009, 2008 and 2007 was $7,926,000, $8,214,000 and $6,294,000, respectively.
The following summarizes the components of deferred revenue (in thousands):
| December 31, | ||||||||
| 2009 | 2008 | |||||||
| Deferred license |
$ | 2,169 | $ | 1,296 | ||||
| Deferred maintenance |
87,224 | 83,500 | ||||||
| Deferred consulting |
7,039 | 7,884 | ||||||
| 96,432 | 92,680 | |||||||
| Less current portion |
(96,040 | ) | (92,361 | ) | ||||
| Total long-term deferred revenue |
$ | 392 | $ | 319 | ||||
Software license fees are deferred when one or more of the revenue recognition criteria have not been met. Once these criteria have been fully met, the revenue will be recognized. Deferred maintenance represents fees paid in advance and advance billings for maintenance service agreements which are recognized on a straight-line basis over the term of the contract. Deferred consulting services represent prepaid and unearned consulting, implementation and training services. Revenue for these services will be recognized as the services are performed. Long-term deferred revenue relates to amounts deferred for maintenance services expected to be provided beyond 2010.
Supplemental cash flow information is as follows (in thousands):
| Year Ended December 31, | |||||||||
| 2009 | 2008 | 2007 | |||||||
| Cash paid during the year for: |
|||||||||
| Interest |
$ | 9,494 | $ | 13,514 | $ | 7,405 | |||
| Income taxes |
$ | 2,455 | $ | 5,132 | $ | 4,728 | |||
| Non-cash investing and financing activities: |
|||||||||
| Purchase of property and equipment through capital lease |
$ | 82 | $ | — | $ | 656 | |||
Note 3. Acquisition
Acquisitions which occurred prior to January 1, 2009, have been accounted for under the purchase method of accounting. Any acquisition made after January 1, 2009, will be accounted for under the acquisition method in accordance with Accounting Standards Codification (ASC) 805 “Business Combinations.” Management is responsible for determining the fair value of the assets acquired and liabilities assumed. The fair value of the assets acquired and liabilities assumed represent management’s estimates of fair value. The Company conducts an active mergers and acquisitions program. Acquisition candidates are determined to be viable if they meet the Company's stringent criteria which include, but are not limited to, product and technology fit, culture, geography, revenue synergies and financial contribution. Because the software industry is consolidating, the acquisition environment is competitive. Valuations are determined through a combination of earnings per share accretion models which assume certain cost synergies, internal rate of return calculations, discounted cash flow models, outside valuations and appraisals and market conditions. The results of the acquisitions are included in the accompanying Consolidated Statements of Operations from the respective acquisition dates forward.
75
Table of Contents
NSB Retail Systems PLC
On February 7, 2008, the Company completed its acquisition of NSB Retail Systems PLC (NSB). NSB designs, develops, markets and supports store and merchandising solutions to retailers of apparel, footwear and specialty merchandise. The acquisition of NSB provided an expanded portfolio of products and services for large and mid-sized specialty retailers and department stores, as well as a fully hosted, managed service offering designed for smaller retailers who are interested in rapid implementation via an on-demand versus on-premise offering.
Pursuant to the terms of the acquisition agreement, shareholders of NSB received £0.38 in cash for each NSB ordinary share. The value of the fully diluted share capital of NSB was approximately $311,845,000, not including transaction costs, based on the exchange rates in effect at the time the United States dollars were converted to pounds sterling for purposes of the transaction. The consideration payable under the agreement was funded by the Company with approximately $161,000,000 in existing cash balances, with the balance of the consideration being funded by drawing from funds available pursuant to the 2007 credit facility (Note 6).
The total purchase price for NSB is shown below (in thousands):
| Cash |
$ | 311,845 | |
| Transaction costs |
6,449 | ||
| Total purchase price |
$ | 318,294 | |
The acquisition of NSB was accounted for as a purchase business combination. Under the purchase method of accounting, the purchase price was allocated to NSB’s tangible and intangible assets acquired and liabilities assumed based on their estimated fair values as of February 7, 2008, with any excess being ascribed to goodwill. Management is primarily responsible for determining the fair values of these assets. The fair value of the assets acquired and liabilities assumed represent management’s estimate of fair values. See Note 4 for a discussion of goodwill and intangibles acquired.
The following table summarizes the allocation of the purchase price (in thousands):
| Fair value of tangible assets acquired: |
||||
| Cash and cash equivalents |
$ | 33,181 | ||
| Accounts receivable |
18,274 | |||
| Inventory |
1,196 | |||
| Property and equipment |
16,038 | |||
| Prepaid and other assets |
4,720 | |||
| Deferred tax assets |
2,047 | |||
| Total tangible assets acquired |
75,456 | |||
| Acquired technology |
58,700 | |||
| Acquired in-process research and development |
200 | |||
| Customer base |
39,300 | |||
| Trade name |
3,500 | |||
| Goodwill |
198,240 | |||
| Accounts payable and accrued expenses |
(24,221 | ) | ||
| Deferred revenue |
(17,328 | ) | ||
| Other long-term liabilities |
(2,264 | ) | ||
| Deferred tax liabilities |
(13,289 | ) | ||
| Net assets acquired |
$ | 318,294 | ||
In connection with the acquisition, the Company formulated a restructuring plan for the NSB operations. As a result, the Company recorded a liability of $4,524,000 for the costs related to involuntary employee terminations. This liability was included in the allocation of the purchase, as was appropriate under GAAP at the time of the acquisition. Execution of the restructuring plan was completed as of December 31, 2008. NSB had previously recognized restructuring charges related to certain of its leased facilities and prior employee severance. Included in assumed accounts payable and accrued expenses is $7,734,000 of prior restructuring obligations.
Included in the Company’s operating results for the year ended December 31, 2008, is a charge of $200,000 for the acquired in-process research and development projects related to the NSB acquisition. The in-process research and development projects arose from new products that were under development at the date of the acquisition and were expected to eventually lead to new products but had not yet established technological feasibility and for which no future alternative use was identified. The valuation of the in-process research and development projects was based upon the discounted expected future cash flows of the products over the products’ expected life, reflecting the estimated stage of completion of the projects and the estimate of the costs to complete the projects.
76
Table of Contents
Goodwill is amortizable for tax purposes when determining foreign earnings subject to tax in the United States. A portion of the goodwill is amortizable for tax in the foreign jurisdiction.
Pro Forma Information
Actual results of operations of NSB are included in the consolidated financial statements from the acquisition date of February 7, 2008. The unaudited pro forma statement of operations data of the Company set forth below gives effect to the acquisition by Epicor of NSB using the purchase method as if it occurred on January 1, 2007, and includes amortization of identified intangibles, interest expense on debt incurred to finance the acquisitions, elimination of amortization related to NSB intangibles not assumed in the acquisition, and the in-process research and development charge. This pro forma information is presented for illustrative purposes only and is not necessarily indicative of the combined financial results of operations for future periods or the financial results of operations that actually would have been realized had the acquisition occurred at that time (in thousands, except per share data).
| (Unaudited) | |||||||
| Year Ended December 31, | |||||||
| 2008 | 2007 | ||||||
| Pro Forma | Pro Forma | ||||||
| Total revenues |
$ | 493,348 | $ | 511,503 | |||
| Net income (loss) |
$ | (7,375 | ) | $ | 23,009 | ||
| Net income (loss) per share: |
|||||||
| Basic |
$ | (0.13 | ) | $ | 0.40 | ||
| Diluted |
$ | (0.13 | ) | $ | 0.40 | ||
Note 4. Goodwill and Intangible Assets
In acquisitions accounted for using the purchase method, goodwill was recorded for the difference, if any, between the aggregate consideration paid for an acquisition and the fair value of the net assets acquired. In acquisitions accounted for using the acquisition method, goodwill is recorded as the excess, if any, of the consideration transferred plus the fair value of any non-controlling interest in the acquiree over the fair value of the identifiable net assets acquired. An annual review of goodwill and indefinite-lived intangibles is required for possible impairment. The Company performed its annual impairment review of its recorded goodwill in 2009, and determined that no impairment of goodwill existed at that time because the estimated fair value of each reporting unit exceeded its carrying amount. The Company monitors the indicators for goodwill impairment testing between annual tests. Certain adverse business conditions impacting one or more of the Company’s reporting units would cause the Company to test goodwill for impairment. No such events occurred during the year ended December 31, 2009.
The following table represents the balance and changes in goodwill by reporting unit as of and for the years ended December 31, 2009 and 2008 (in thousands):
| License | Consulting | Maintenance | Total | |||||||||||||
| Balance as of December 31, 2007 |
$ | 51,670 | $ | 39,471 | $ | 78,126 | $ | 169,267 | ||||||||
| NSB acquisition |
87,762 | 30,852 | 78,055 | 196,669 | ||||||||||||
| Additional Scala acquisition |
207 | 143 | 452 | 802 | ||||||||||||
| Foreign currency translation |
(703 | ) | (1,631 | ) | (815 | ) | (3,149 | ) | ||||||||
| Balance as of December 31, 2008 |
138,936 | 68,835 | 155,818 | 363,589 | ||||||||||||
| NSB purchase price allocation adjustment |
701 | 246 | 624 | 1,571 | ||||||||||||
| Adjustment of tax liabilities assumed in a business combination |
(114 | ) | (76 | ) | (191 | ) | (381 | ) | ||||||||
| Scala acquisition purchase price adjustment |
74 | 63 | 403 | 540 | ||||||||||||
| Other |
36 | 24 | 61 | 121 | ||||||||||||
| Foreign currency translation |
601 | 1,675 | 620 | 2,896 | ||||||||||||
| Balance as of December 31, 2009 |
$ | 140,234 | $ | 70,767 | $ | 157,335 | $ | 368,336 | ||||||||
The average amortization period for intangible assets are as follows:
| Average Amortization Periods | ||
| Acquired technology |
5 years | |
| Customer base |
7 years | |
| Trademark |
5 years | |
| Covenants not to compete |
1-2 years |
77
Table of Contents
The following represents the change in the gross carrying amount of intangible assets recorded during 2009 (in thousands):
| Foreign Currency Translation |
Other | Total | |||||||||
| Acquired technology |
$ | (21 | ) | $ | 334 | $ | 313 | ||||
| Customer base |
1,767 | — | 1,767 | ||||||||
| Trademark |
(6 | ) | — | (6 | ) | ||||||
| Covenant not to compete |
16 | — | 16 | ||||||||
| Total |
$ | 1,756 | $ | 334 | $ | 2,090 | |||||
Intangible assets are amortized over the estimated economic life of the assets. As of December 31, 2009, the Company has not identified any indicators of impairment associated with intangible assets.
The following table summarizes the components of intangible assets (in thousands):
| As of December 31, 2009 | As of December 31, 2008 | |||||||||||||||||
| Gross Carrying Amount |
Accumulated Amortization |
Net | Gross Carrying Amount |
Accumulated Amortization |
Net | |||||||||||||
| Acquired technology |
$ | 137,703 | $ | 95,400 | $ | 42,303 | $ | 137,390 | $ | 75,788 | $ | 61,602 | ||||||
| Customer base |
76,167 | 37,076 | 39,091 | 74,400 | 26,995 | 47,405 | ||||||||||||
| Trademark |
13,790 | 11,077 | 2,713 | 13,796 | 9,247 | 4,549 | ||||||||||||
| Covenant not to compete |
2,163 | 2,163 | — | 2,147 | 2,147 | — | ||||||||||||
| Total |
$ | 229,823 | $ | 145,716 | $ | 84,107 | $ | 227,733 | $ | 114,177 | $ | 113,556 | ||||||
Amortization expense of the Company’s intangible assets included in cost of revenues for the years ended December 31, 2009, 2008 and 2007 was $30,772,000, $32,896,000 and $17,419,000, respectively. Amortization expense of the Company’s intangible assets included in general and administrative expense for the years ended December 31, 2009, 2008 and 2007 was $0, $0 and $196,000, respectively. Estimated amortization expense for 2010, 2011, 2012, 2013, 2014 and thereafter is approximately $27,906,000, $21,608,000, $20,111,000, $7,932,000, $5,973,000 and $577,000, respectively.
Note 5. Restructuring and Other
Restructuring
For the year ended December 31, 2009, the Company recorded restructuring and other charges of $2,210,000. These charges include $2,186,000 of severance related costs associated with the cost reduction initiatives taken during the year, management severance and reductions primarily from the elimination of redundancies in the Company’s retail business resulting from the NSB acquisition. The Company recorded a net credit of $141,000 related to changes in estimates on subleased facilities and charges related to closing facilities used in its retail business. The Company also recorded $142,000 in asset impairments related to leasehold improvements and facilities redundancies in the Company’s retail business resulting from the NSB acquisition. In connection with these restructuring activities, the Company terminated 61 employees or approximately 3% of the Company’s workforce during 2009 primarily from professional services and sales functions. As of December 31, 2009, all of these terminations had been completed or the employees have been notified. The facilities obligations are expected to be paid through 2016 and the Company believes these obligations will be funded from existing cash reserves and cash generated from continuing operations. During the year ended December 31, 2009, the Company made $5,905,000 in cash and share-based payments against reserves associated with its restructuring activities. The liability was further increased by $492,000 of foreign currency translation and other charges.
78
Table of Contents
For the year ended December 31, 2008, the Company recorded restructuring charges of $9,143,000. These charges represent $7,009,000 of severance related costs. The severance costs are associated with the cost reduction initiatives taken in the fourth quarter, management severance and cost reductions primarily from the elimination of redundancies in the Company’s retail business resulting from the NSB acquisition. The Company also had $2,134,000 of facilities charges related primarily to changes in estimates on subleasing facilities. In connection with these restructuring activities, the Company terminated 362 employees or approximately 12% of the Company’s workforce during the year from all functional areas. As of December 31, 2008, all of these terminations had been completed. The facilities obligations are expected to be paid through 2016 and the Company believes these obligations will be funded from existing cash reserves and cash generated from continuing operations.
In connection with the Company’s acquisition of NSB, the Company formulated a restructuring plan for the NSB operations. In connection with this plan, the Company recorded a liability in purchase accounting of $4,524,000 for the separation costs associated with the NSB reduction in workforce. The Company terminated 91 NSB employees, or 17% of the NSB workforce. At December 31, 2008, all of these terminations have been completed.
During the year ended December 31, 2008, the Company made $13,324,000 in cash payments, share-based payments and currency translation adjustments against reserves associated with its restructuring activities.
During 2007, the Company recorded restructuring charges of $909,000. This includes severance costs of $850,000 and facility charges of $59,000. The facility charges are due to terminating a lease to an office in Europe and the related leasehold improvements on the facility. During the year ended December 31, 2007, the Company made $1,609,000 in cash payments or otherwise settled against reserves associated with its restructuring activities.
Other
During the year ended December 31, 2007, the Company incurred $662,000 in due diligence costs associated with a potential acquisition. These costs were charged to results of operations in connection with the decision not to proceed with the acquisition.
79
Table of Contents
Note 6. Long-Term Debt
Long-term debt consists of the following (in thousands):
| December 31, | ||||||||
| 2009 | 2008 | |||||||
| As Adjusted | ||||||||
| Convertible senior notes |
$ | 230,000 | $ | 230,000 | ||||
| Debt discount |
(42,143 | ) | (50,048 | ) | ||||
| Credit facilities |
67,500 | 95,000 | ||||||
| Other; including capital leases |
380 | 474 | ||||||
| 255,737 | 275,426 | |||||||
| Less current portion |
(202 | ) | (10,169 | ) | ||||
| Total long-term debt |
$ | 255,535 | $ | 265,257 | ||||
Convertible Senior Notes
On May 8, 2007, the Company closed an offering of $230 million aggregate principal amount of 2.375% convertible senior notes due in 2027 (convertible senior notes). The convertible senior notes are unsecured and pay interest semiannually at a rate of 2.375% per annum until May 15, 2027. The convertible senior notes are convertible into cash or, at the Company’s option, cash and shares of the Company’s common stock, at an initial conversion rate of 55.2608 shares of common stock per $1,000 principal amount of the convertible senior notes, which is equivalent to an initial conversion price of approximately $18.10 per share. Pursuant to the terms of the convertible senior notes, the principal amount of the convertible senior notes may be settled in cash and only the amount of conversion value, as defined, in excess of the principal amount of the convertible senior notes may be settled in cash or shares. The initial conversion price represents a 30% premium over the last reported sale price of the Company’s common stock prior to the offering that began on May 2, 2007, which was $13.92 per share.
As of January 1, 2009, new accounting guidance related to the accounting for convertible debt instruments that may be settled in cash upon conversion became effective. This guidance requires us to account separately for the liability and equity components of our convertible senior notes in a manner that reflects our nonconvertible debt borrowing rate when interest cost is recognized in subsequent periods. This standard requires the Company to change the previous accounting method for its $230,000,000 convertible senior notes. Accordingly, the Company recorded a $61,752,000 debt discount as additional paid-in capital, as of the senior convertible notes’ issuance date of May 15, 2007. At December 31, 2009, the unamortized debt discount was $42,143,000. The Company has $230,000,000 in principal due under the convertible debt, for a net carrying amount of $187,857,000. In connection with adoption of the new accounting standard, the Company also reclassified $2,155,000 of previously capitalized debt issuance fees attributable to the equity portion of the convertible debt as additional paid-in capital. The Company also recorded a deferred tax liability of $23,049,000 as additional paid-in capital related to the debt discount and reclassified debt issuance fees.
The Company is amortizing the debt discount through the date at which the Company can begin to redeem the notes, which is May 15, 2014. The effective interest rate used to measure the fair value of the debt was 7.35%, which was based on market conditions for nonconvertible debt at the time the debt was entered into. The Company recognized interest expense of $13,369,000 and $12,818,000 related to the convertible debt for the years ended December 31, 2009 and 2008, respectively, of which $5,462,000 is based on the coupon rate.
Credit Facilities
On December 16, 2007, the Company entered into a syndicated credit facility (the 2007 credit facility) for up to $250 million in term loan and revolving facilities, consisting of a $100 million term loan and a $150 million in revolving loan facility (after giving effect to an accordion feature). The Company pledged all of its assets as collateral, subject to certain exceptions.
On September 30, 2009, the Company amended the 2007 credit facility to, among other things (i) amend the financial covenants by eliminating the total leverage and fixed charge coverage ratios, lowering the maximum senior secured leverage ratio and adding a minimum EBITDA covenant and a minimum liquidity ratio, (ii) amend the maturity date from February 19, 2013 to September 30, 2012, and (iii) increase the applicable interest rates and commitment fees payable under the facility. The Company paid amendment fees to the lenders and an arrangement fee to secure the amendment.
80
Table of Contents
During 2009, but prior to September 30, 2009, the Company made mandatory principal payments of $5,000,000 and voluntary payments of $11,000,000 against the term loan in the 2007 credit facility from discretionary funds. Upon entering into the amendment on September 30, 2009, the Company was required to pay in full the outstanding term loan, which had an outstanding principal balance of $79,000,000 at that time. The Company paid the outstanding term loan balance by drawing $72,500,000 under the revolving facility and paying $6,500,000 from discretionary funds. On December 31, 2009, the Company made a voluntary payment of $5,000,000 against the revolving facility. As a result, at December 31, 2009, the Company had $67,500,000 outstanding on the revolving facility and unused borrowing capacity of $32,500,000 under the revolving facility.
At December 31, 2009, the Company was in compliance with all covenants included in the terms of the 2007 credit facility, and the weighted average interest rate applicable to the 2007 credit facility was 5.17%.
The 2007 credit facility is subject to interest rate swap agreements to convert a portion of the Company’s interest rate variability to a fixed rate basis as required under the 2007 credit facility (Note 7).
As a result of repaying the term loan, the Company is no longer obligated to make mandatory quarterly interest payments under the 2007 credit facility. All the outstanding principal and accrued interest on the revolving loan facility is due September 30, 2012, upon expiration of the facility. Accordingly, the outstanding balance of the facility at December 31, 2009 was classified as long-term debt.
Note 7. Derivative Instruments
The Company is exposed to certain risks relating to its ongoing business operations. The primary risks managed by using derivative instruments are interest rate risk and foreign currency risk. Interest rate swaps are entered into to manage interest rate risk associated with the Company’s variable rate borrowings. Foreign currency forward contracts are entered into to manage foreign currency exchange rate risk associated with intercompany receivable and payable balances. The Company does not use derivative instruments for trading purposes.
Interest rate swaps were initially designated and qualified as cash flow hedges, whereby the effective portion of the gain or loss on the derivative was reported as a component of other comprehensive income and reclassified into earnings in the same period during which the hedged transaction affected earnings. If the Company had experienced gains or losses on the derivatives representing either hedge ineffectiveness or hedge components excluded from the assessment of effectiveness, they would have been recognized in current earnings.
On September 30, 2009, the Company paid in full the balance outstanding on its term loan by borrowing on the revolving line of credit under the 2007 credit facility (Note 6). Both the term loan and the revolving credit facility incur a variable interest rate. Because the interest rate swaps were designated as hedging the interest rate variability on the term loan, repayment of the term loan resulted in the de-designation of this hedging relationship. Accordingly, subsequent to September 30, 2009, the interest rate swaps are no longer designated in a hedging relationship. For the year ended December 31, 2009, a charge for the fair value of the interest rate swaps of $504,000 was recognized in “interest and other income, net” in the accompanying Consolidated Statements of Operations.
Foreign currency contracts are not designated and do not qualify as hedging instruments, and gains and losses resulting from these transactions are included in “interest and other income, net” in the accompanying Consolidated Statements of Operations. As of December 31, 2009, the Company had no open foreign currency forward contracts.
Interest Rate Swaps
On April 18, 2008, March 11, 2009 and March 12, 2009, the Company entered into interest rate swap agreements to convert a portion of the Company’s interest rate variability to a fixed rate basis as required under the 2007 credit facility. As of December 31, 2009, the interest rate swaps are not designated and do not qualify for hedge accounting.
As of December 31, 2009, the fair value of the interest rate swaps is included on the Company’s Consolidated Balance Sheets. The differential to be paid or received on the interest rate swap agreements is accrued and recognized as an adjustment to interest expense as interest rates change. Following is a summary of the interest rate swaps (rates for expired contracts are exclusive of an interest rate margin and rates for active contracts are inclusive of the interest rate margin of 4.00% applicable at December 31, 2009 under the 2007 credit facility):
| Contract Date |
Notional Amount | Interest Period Covered |
Rate | |||||
| 04/18/08 |
$ | 20 million | 06/30/08 – 03/31/09 | 3.170 | % | |||
| 04/18/08 |
$ | 15 million | 06/30/08 – 09/30/09 | 3.195 | % | |||
| 04/18/08 |
$ | 15 million | 06/30/08 – 09/30/09 | 3.150 | % | |||
| 03/11/09 |
$ | 20 million | 03/31/09 – 03/31/11 | 5.690 | % | |||
| 03/12/09 |
$ | 15 million | 09/30/09 – 03/31/11 | 5.890 | % | |||
| 03/12/09 |
$ | 5 million | 09/30/09 – 09/30/10 | 6.050 | % | |||
81
Table of Contents
At December 31, 2009 the effective interest rate for the notional amounts covered by the swap agreements as of such date was 5.81% (inclusive of 4.00% interest rate margin applicable at December 31, 2009 under the 2007 credit facility).
The Company does not hold or issue interest rate swap agreements for trading purposes. In the event that a counter-party fails to meet the terms of the interest rate swap agreement, the Company’s exposure is limited to the interest rate differential. The Company manages the credit risk of counterparties by dealing only with institutions that the Company considers financially sound. The Company considers the risk of non-performance to be remote.
Foreign Currency Contracts
The Company uses foreign currency forward contracts to manage its market risk exposure associated with foreign currency exchange rate fluctuations for certain intercompany balances denominated in currencies other than an entity’s functional currency. These derivative instruments are not designated and do not qualify as hedging instruments. Accordingly, the gains or losses on these derivative instruments are recognized in “interest and other income, net” in the accompanying Consolidated Statements of Operations and are designed generally to offset the gains and losses resulting from remeasurement of intercompany balances recognized in the same line item. The Company reported a net foreign currency loss of $544,000 for the year ended December 31, 2009, which is inclusive of financial instruments and non-financial assets and liabilities to which the instruments relate.
Quantitative Disclosures About Derivative Instruments
Fair value of derivative instruments are as follows (in thousands):
| As of December 31, 2009 Liability Derivatives | |||||
| Balance Sheet Location |
Fair Value | ||||
| Derivatives not designated as hedging instruments: |
|||||
| Interest rate swaps |
Other accrued expenses | $ | 61 | ||
| Interest rate swaps |
Other long-term liabilities | 443 | |||
| Total |
$ | 504 | |||
The effects of derivative instruments on the Consolidated Statements of Operations and Comprehensive Income (Loss) on a pre-tax basis are as follows (in thousands):
| Amounts of Gain (Loss) Reclassified from Accumulated OCI into Income |
||||
| Year Ended December 31, 2009 |
||||
| Derivatives in cash flow hedging relationship: |
||||
| Interest rate swaps |
$ | (696 | ) | |
| Interest rate swaps de-designated |
(559 | ) | ||
| Total |
$ | (1,255 | ) | |
The following table represents the amount of derivative instruments not designated as hedges recognized in the Company’s Consolidated Statements of Operations and Comprehensive Income (Loss) (in thousands):
| Amount of Gain or (Loss) Recognized in Income on Derivatives |
||||||
| Year Ended December 31, 2009 |
||||||
| Derivatives not designated as hedging instruments: |
Location of gain (loss) recognized in income on derivatives: |
|||||
| Interest rate swaps |
Interest expense | $ | (160 | ) | ||
| Foreign currency contracts |
Interest and other income, net |
(1,956 | ) | |||
| Total |
$ | (2,116 | ) | |||
82
Table of Contents
GAAP requires a three-tier hierarchy for fair value measurements, which prioritizes the inputs used in measuring fair value as follows:
| • | Level 1—observable inputs such as quoted prices for identical instruments in active markets. |
| • | Level 2—inputs other than quoted prices in active markets that are observable either directly or indirectly through corroboration with observable market data. |
| • | Level 3—unobservable inputs in which there is little or no market data, which would require the Company to develop its own assumptions. |
The Company’s interest rate swaps are required to be measured at fair value on a recurring basis. The fair value of the interest rate swaps are determined based on inputs that are readily available in public markets or can be derived from information available in publicly quoted markets. Therefore, the Company has categorized the interest rate swaps as Level 2. The following tables present the Company’s financial liabilities as of December 31, 2009 and 2008, measured at fair value on a recurring basis (in thousands):
| Fair value measurements using | |||||||||
| Level 1 | Level 2 | Level 3 | |||||||
| Interest rate swap liability as of December 31, 2009 |
$ | — | $ | 504 | $ | — | |||
| Interest rate swap liability as of December 31, 2008 |
— | 531 | — | ||||||
Note 8. Commitments and Contingencies
Leases
The Company leases certain of its operating facilities and equipment under operating leases with terms expiring through 2019. In addition to minimum lease payments, the facility leases require payment of a proportionate share of real estate taxes and building operating expenses. Certain lease agreements include escalation clauses. The total amount of base rentals over the term of its leases is charged to expense on a straight-line method with the amount of the rental expense in excess of lease payments recorded as a deferred rent liability. The Company also leases certain equipment under capital leases, with terms expiring through 2012, for which the term of the agreement is greater than 75% of useful life of the asset leased. The cost of equipment under capital leases is included in the accompanying Consolidated Balance Sheets as property, plant and equipment and was $1,096,000 and $949,000 at December 31, 2009 and 2008, respectively. Accumulated amortization of the leased equipment at December 31, 2009 and 2008 was $674,000 and $470,000, respectively. Amortization of assets under capital leases is included with depreciation expense.
The following is a schedule of future minimum lease payments under capital leases, operating leases and future noncancellable sublease income (in thousands):
| Years Ending December 31, |
Future Minimum Capital Lease Payments |
Future Minimum Operating Lease Payments |
Future Noncancellable Sublease Income |
Net Future Minimum Lease Payments |
||||||||||
| 2010 |
$ | 213 | $ | 12,476 | $ | 769 | $ | 11,920 | ||||||
| 2011 |
142 | 9,873 | 1,308 | 8,707 | ||||||||||
| 2012 |
25 | 6,814 | 1,215 | 5,624 | ||||||||||
| 2013 |
— | 4,953 | 511 | 4,442 | ||||||||||
| 2014 |
— | 4,453 | 487 | 3,966 | ||||||||||
| Thereafter |
— | 7,175 | 731 | 6,444 | ||||||||||
| Total |
380 | 45,744 | 5,021 | 41,103 | ||||||||||
| Less amount representing interest |
(24 | ) | — | — | (24 | ) | ||||||||
| $ | 356 | $ | 45,744 | $ | 5,021 | $ | 41,079 | |||||||
83
Table of Contents
Rental expense under operating leases, net of sublease income, for 2009, 2008 and 2007 was $12,914,000, $13,695,000 and $12,354,000, respectively.
Litigation
The Company is subject to legal proceedings and claims in the normal course of business. The Company is currently defending these proceedings and claims, and anticipates that it will be able to resolve these matters in a manner that will not have a material adverse effect on the Company’s consolidated financial position, results of operations or cash flows.
Guarantees
The Company from time to time enters into certain types of contracts that contingently require the Company to indemnify parties against third-party claims. These contracts primarily relate to: (i) divestiture and acquisition agreements, under which the Company may provide customary indemnifications to either (a) purchasers of the Company’s businesses or assets; or (b) entities from whom the Company is acquiring assets or businesses; (ii) certain real estate leases, under which the Company may be required to indemnify property owners for environmental and other liabilities and other claims arising from the Company’s use of the applicable premises; (iii) certain agreements with the Company’s officers, directors and employees, under which the Company may be required to indemnify such persons for liabilities arising out of their relationship with the Company; and (iv) Company license and consulting agreements with its customers, under which the Company may be required to indemnify such customers for intellectual property infringement claims and other claims arising from the Company’s provision of services to such customers.
84
Table of Contents
Note 9. Income Taxes
The income before income taxes is allocated between U.S. federal and foreign jurisdictions as follows (in thousands):
| Year Ended December 31, | |||||||||||
| 2009 | 2008 | 2007 | |||||||||
| As Adjusted | As Adjusted | ||||||||||
| U.S. |
$ | (12,244 | ) | $ | (5,658 | ) | $ | 21,591 | |||
| Foreign |
7,663 | 1,612 | 16,948 | ||||||||
| Total |
$ | (4,581 | ) | $ | (4,046 | ) | $ | 38,539 | |||
The income tax benefit is comprised of the following (in thousands):
| Year Ended December 31, | ||||||||||||
| 2009 | 2008 | 2007 | ||||||||||
| As Adjusted | As Adjusted | |||||||||||
| Current: |
||||||||||||
| Federal |
$ | 1,160 | $ | 829 | $ | 625 | ||||||
| State |
25 | 235 | 1,314 | |||||||||
| Foreign |
(288 | ) | 480 | 4,772 | ||||||||
| Total |
$ | 897 | $ | 1,544 | $ | 6,711 | ||||||
| Deferred: |
||||||||||||
| Federal |
$ | (3,613 | ) | $ | (1,398 | ) | $ | 8,009 | ||||
| State |
(1,036 | ) | (685 | ) | 52 | |||||||
| Foreign |
5,852 | (348 | ) | (880 | ) | |||||||
| Valuation allowance |
(5,443 | ) | 292 | (14,428 | ) | |||||||
| Total |
$ | (4,240 | ) | $ | (2,139 | ) | $ | (7,247 | ) | |||
| Total |
$ | (3,343 | ) | $ | (595 | ) | $ | (536 | ) | |||
The reported income tax benefit differs from the amount computed by applying the statutory U.S. federal income tax rate of 35% to the income before income taxes as follows:
| Year Ended December 31, | |||||||||
| 2009 | 2008 | 2007 | |||||||
| As Adjusted | As Adjusted | ||||||||
| Provision computed at statutory rates |
35.0 | % | 35.0 | % | 35.0 | % | |||
| Increase (reduction) resulting from: |
|||||||||
| Earnings in jurisdictions taxed at rates different from the statutory U.S. federal rate |
(11.7 | %) | (11.7 | %) | (5.6 | %) | |||
| State and local taxes, net of federal benefit |
20.9 | % | 17.8 | % | 2.7 | % | |||
| Write-off of In-Process R&D |
— | (1.7 | %) | — | |||||
| Officers compensation |
(11.1 | %) | (7.0 | %) | 1.5 | % | |||
| Interest income |
— | (3.2 | %) | 0.6 | % | ||||
| Other foreign earnings |
(67.3 | %) | (9.3 | %) | 0.9 | % | |||
| Uncertain tax positions |
16.3 | % | 21.1 | % | 0.3 | % | |||
| Other nondeductible permanent items |
(8.7 | %) | (21.1 | %) | 2.0 | % | |||
| Credits |
7.1 | % | 3.1 | % | (0.4 | %) | |||
| Other |
(26.3 | %) | (1.1 | %) | — | ||||
| Valuation allowance |
118.8 | % | (7.2 | %) | (38.4 | %) | |||
| Total |
73.0 | % | 14.7 | % | (1.4 | %) | |||
85
Table of Contents
The tax effects of temporary differences and carryforwards that give rise to the Company’s deferred income taxes assets and liabilities consist of the following (in thousands):
| December 31, | ||||||||
| 2009 | 2008 | |||||||
| As Adjusted | ||||||||
| Net operating loss carryforwards |
$ | 42,968 | $ | 51,668 | ||||
| Research credit carryforward |
1,775 | 1,414 | ||||||
| Other credit carryforwards |
2,959 | 2,737 | ||||||
| Accrued expenses |
4,784 | 4,348 | ||||||
| Deferred revenue |
606 | 330 | ||||||
| Allowance for doubtful accounts |
1,754 | 1,603 | ||||||
| Accrued restructuring costs |
2,372 | 2,718 | ||||||
| Depreciation |
1,419 | 1,705 | ||||||
| Stock-based compensation |
2,796 | 2,557 | ||||||
| Purchased intangibles |
(11,216 | ) | (14,968 | ) | ||||
| Convertible debt |
(16,028 | ) | (18,820 | ) | ||||
| Valuation allowance |
(13,181 | ) | (16,191 | ) | ||||
| Total |
$ | 21,008 | $ | 19,101 | ||||
Activity for the valuation allowance is as follows (in thousands):
| Balance at Beginning of Period |
Charged to Tax Expense |
Charged to Other Accounts |
Balance at Ending of Period | |||||||||||
| For the Year Ended 12/31/2007 |
$ | 36,568 | $ | (14,428 | ) | $ | (16,976 | ) | $ | 5,164 | ||||
| For the Year Ended 12/31/2008 |
5,164 | 292 | 10,735 | 16,191 | ||||||||||
| For the Year Ended 12/31/2009 |
16,191 | (5,443 | ) | 2,433 | 13,181 | |||||||||
Amounts charged to other accounts represent adjustments to goodwill, deferred tax assets and unrecognized tax benefits.
The benefit for income taxes consists of federal, state and foreign income taxes. The Company operates in an international environment with significant operations in various locations outside the United States. Accordingly, the consolidated income tax rate is a composite rate reflecting the earnings in the various locations and the applicable rates.
The Company recorded income tax benefits of $3,343,000, $595,000 and $536,000 for the years ended December 31, 2009, 2008 and 2007, respectively. The effective income tax rates were 73.0%, 14.7% and (1.4%) for the years ended December 31, 2009, 2008 and 2007, respectively.
The 2009 effective tax rate differs from the statutory U.S. federal income tax rate of 35% due to earnings in foreign jurisdictions taxed at different rates, state taxes, permanent differences between GAAP pre-tax income and taxable income, changes in valuation allowances established for deferred tax assets and releases of reserves for uncertain tax positions primarily related to statute closures and expected audit settlements in foreign jurisdictions. The 2008 effective tax rate differs from the statutory U.S. federal income tax rate of 35% due to earnings in foreign jurisdictions taxed at different rates, state taxes, permanent differences between GAAP pre-tax income and taxable income, and changes in valuation allowances primarily in foreign jurisdictions. The increase in the 2008 effective tax rate was partially offset by recognition of an uncertain tax position relating to settlement of a foreign audit and certain statutes closing. The 2007 effective tax rate differs from the statutory U.S. federal income tax rate primarily due to a non-cash income tax benefit resulting from the release of certain foreign valuation allowances.
During the year ended December 31, 2009, the Company determined, primarily based on operating income during recent years as well as anticipated operating income and cash flows for future periods, that it is more likely than not that certain domestic deferred tax assets will be realized in the future. Accordingly, the Company released a $2,488,000 valuation allowance recorded against those deferred tax assets.
During the year ended December 31, 2008, the Company recorded a $11,027,000 increase to its valuation allowance, which primarily consists of a $10,735,000 increase in valuation allowance relating to the purchase of
86
Table of Contents
NSB, an increase of $834,000 for the establishment of a valuation allowance on a portion of the deferred tax assets in the Netherlands as a result of lower projected taxable income in that jurisdiction, and a $468,000 reduction of valuation allowance previously recorded on the US R&D credits. Effective January 1, 2009, any reduction to the valuation allowance established in purchase accounting is to be accounted for as a reduction in income tax expense.
During the year ended December 31, 2007, the Company determined, primarily based on operating income during recent years, and anticipated operating income and cash flows for future periods that it is more likely than not that certain foreign deferred tax assets will be realized in the future and accordingly, it was appropriate to release the valuation allowance recorded against those deferred tax assets. As a result, the Company released certain valuation allowances related to the United Kingdom, the Netherlands, Germany, Canada, Singapore, Hong Kong and other foreign jurisdictions, resulting in a non-cash income tax benefit to net income, as well as a credit to goodwill as it related to deferred tax assets existing at the date of Scala’s acquisition.
The Company has U.S. federal, state and foreign net operating loss (NOL) carryforwards as of December 31, 2009, of approximately $63,972,000, $20,670,000 and $68,317,000, respectively. The federal and state losses expire in the years 2010 through 2023. Approximately $39,000,000 of the U.S. federal NOL is subject to annual limitations on utilization equal to approximately $12,100,000 pursuant to section 382 of the Internal Revenue Code. The foreign losses generally have no expiration date. In addition, the Company has approximately $7,147,000 of federal and state research and development credit tax carryforwards that expire in the years 2010 through 2026. The Company also has approximately $2,959,000 in alternative minimum tax credits which do not expire.
U.S. income taxes were not provided for on unremitted earnings from non-U.S. subsidiaries. Those unremitted earnings are considered to be indefinitely reinvested.
At December 31, 2009, the Company had $17,503,000 of gross unrecognized tax benefits, of which $12,910,000 would reduce the effective tax rate if recognized. The Company’s continuing practice is to recognize interest and/or penalties related to income tax matters in income tax expense. The Company has accrued interest and penalties related to uncertain tax positions as follows:
| Balance at December 31, 2007 |
$ | 233,000 | |
| Balance at December 31, 2008 |
$ | 153,000 | |
| Balance at December 31, 2009 |
$ | 996,000 |
The following table is the reconciliation of gross unrecognized tax benefits (in thousands):
| Year Ended December 31, | ||||||||||||
| 2009 | 2008 | 2007 | ||||||||||
| Balance at Beginning of Period |
$ | 29,350 | $ | 26,065 | $ | 26,580 | ||||||
| Increases - tax positions taken in prior years |
123 | 6,211 | 149 | |||||||||
| Decreases - tax positions taken in prior years |
(7,593 | ) | (1,643 | ) | (727 | ) | ||||||
| Current year tax positions |
67 | 60 | 63 | |||||||||
| Settlements |
(2,880 | ) | (589 | ) | — | |||||||
| Lapse of statute of limitations |
(2,560 | ) | (754 | ) | — | |||||||
| Balance at End of Period |
$ | 16,507 | $ | 29,350 | $ | 26,065 | ||||||
The tax years 1997 to 2009 remain open to examination by federal and state taxing jurisdictions and the tax years 2003 to 2009 remain open to examination by foreign jurisdictions. The Company is currently under examination in various foreign locations. The Company anticipates effectively settling the uncertain tax positions relating to certain foreign jurisdictions in the next twelve months. The Company does not believe the amount settled will materially differ from the unrecognized tax benefit as of December 31, 2009. The unrecognized tax benefits related to the foreign examinations would reduce the effective tax rate if recognized.
The Company believes it has adequately provided for income tax issues not yet resolved with federal, state and foreign tax authorities. Although not probable, the most adverse resolution of these issues could result in additional charges to earnings in future periods.
Note 10. Stock-Based Compensation
The Company has in effect stock incentive plans under which restricted stock and stock options have been granted to employees and non-employee members of the Board of Directors. The Company also has an employee stock purchase plan for eligible employees. The Company recognizes share-based payments to employees, including grants of employee restricted stock and stock options, in the financial statements based upon their respective grant date fair values.
87
Table of Contents
The following table sets forth the total stock-based compensation expense resulting from restricted stock awards and stock options included in the Company’s Consolidated Statements of Operations (in thousands):
| Year Ended December 31, | |||||||||
| 2009 | 2008 | 2007 | |||||||
| Cost of consulting revenues |
$ | 1,031 | $ | 408 | $ | 1,234 | |||
| Cost of maintenance revenues |
433 | 359 | 514 | ||||||
| Sales and marketing |
1,736 | 2,430 | 3,909 | ||||||
| Software development |
728 | 591 | 856 | ||||||
| General and administrative |
4,180 | 3,257 | 5,181 | ||||||
| Total stock-based compensation expense |
$ | 8,108 | $ | 7,045 | $ | 11,694 | |||
Net cash proceeds from the exercise of stock options were $207,000, $1,597,000 and $2,268,000 for the years ended December 31, 2009, 2008 and 2007, respectively. For the years ended December 31, 2009, 2008 and 2007 net cash provided by operating activities decreased by, and financing activities increased by $636,000, $847,000 and $1,690,000, respectively, related to excess tax benefits from exercise of stock-based awards. The tax benefit recognized in the statement of operations related to stock-based compensation for the years ended December 31, 2009, 2008 and 2007 was $2,335,000, $2,421,000 and $3,718,000, respectively. No share-based compensation was capitalized for the years ended December 31, 2009, 2008 and 2007.
The following table sets forth share-based compensation related to service-based restricted stock, final achievement of performance-based restricted stock and stock options (in thousands):
| Year Ended December 31, | ||||||||||
| 2009 | 2008 | 2007 | ||||||||
| Service-based restricted stock |
$ | 4,709 | $ | 3,536 | $ | 1,688 | ||||
| Performance-based restricted stock |
3,479 | 3,093 | 8,048 | |||||||
| Stock options |
(80 | ) | 416 | 1,958 | ||||||
| Total |
$ | 8,108 | $ | 7,045 | $ | 11,694 | ||||
In addition to the above, included in the Company’s Consolidated Statements of Operations for the year ended December 31, 2009 are restructuring charges for stock options, service-based restricted stock and performance-based restricted stock of $22,000, $66,000 and $95,000, respectively, for share-based payments included in certain severance arrangements associated with restructuring activities which occurred during the year ended December 31, 2009. Included in the Company’s Consolidated Statements of Operations for the year ended December 31, 2008 are restructuring charges for stock options, service-based restricted stock and performance-based restricted stock of $184,000, $372,000 and $709,000, respectively, for share-based payments included in certain severance arrangements associated with restructuring activities which occurred during the year ended December 31, 2008.
During 2009, the Company granted to various members of management and the Board of Directors the right to receive 1,138,000 shares of restricted stock for a purchase price equal to the par value of such stock. The shares to management vest on various schedules, such as annually or 50% annually over 2 years. The shares to the Board of Directors vest upon granting.
During 2009, the Company granted 1,540,000 shares of performance-based restricted stock to employees for annual promotions and new hires for the 2009 and 2010 performance plan years under the terms of the Company’s Performance Based Restricted Stock Plan (“PBRSP”). In December 2008, the Company’s Board of Directors approved extending the PBRSP to 2010. In January of 2010, the Company’s Board of Directors approved expanding the Company’s performance-based restricted stock program for 2010 to replace the Company’s prior cash based management bonus plan. In January of 2010, the Company’s Board of Directors also approved extending the PBRSP to 2011. All existing participants in the PBRSP were granted the same number of shares for the 2010 and 2011 plan years as they had in the 2009 plan year. In expanding the equity program, an additional 1,172,000 performance-based restricted shares were granted for the 2010 year. All performance-based restricted shares are subject to a vesting schedule and were granted pursuant to the terms of the Company’s performance-based restricted stock plan. The recipients will vest in the restricted stock, or a portion thereof, in two equal, annual installments depending upon achievement of targets with respect to the
88
Table of Contents
Company’s annual revenue and adjusted earnings before interest, taxes, depreciation and amortization (EBITDA) for 2010 and additionally, for PBRSP participants, for 2011. Restricted stock is held in escrow, and the Company’s reacquisition right will not lapse until the shares are fully vested. Upon an employee’s termination of service with the Company, shares that have not vested will be forfeited and automatically transferred to and reacquired by the Company. In addition, restricted shares that do not vest as a result of the Company’s non-achievement with respect to annual revenue and adjusted EBITDA performance conditions for either performance year will be forfeited and automatically transferred to and reacquired by the Company.
The performance conditions for each year are independent of the performance conditions for the preceding years. Although compensation expense for all years will be measured based on the grant date fair value of the shares, the related compensation expense will be recognized separately in each year related only to the shares potentially earned in each year, assuming that it is considered to be probable that the shares will be earned each year. In addition, the compensation expense for each year is estimated and a pro rata amount is accrued on a quarterly basis. Compensation expense may include a cumulative adjustment resulting from changes in the estimated number of shares expected to be earned during that plan year.
The Company withholds, at the employee’s election, a portion of the vested shares as consideration for the Company’s payment of applicable employee income taxes. In conjunction with the periodic vesting of the restricted stock and the annual vesting of performance-based restricted stock, the following treasury stock acquisitions were made during the years ended December 31, 2009 and 2008:
| Year Ending |
Shares acquired |
Value of Shares | |||
| December 31, 2009 |
413,000 | $ | 2,212,000 | ||
| December 31, 2008 |
275,000 | $ | 3,274,000 | ||
At December 31, 2009, there was approximately $5,433,000 and $2,427,000 of total unrecognized compensation expense related to performance-based restricted stock and service-based restricted stock grants, respectively. These costs are expected to be recognized over a weighted-average period of approximately one year. The compensation cost related to the performance-based restricted stock depends on the estimated number of shares that will vest, based on the probable outcome of the performance conditions. Therefore, the recognized compensation could vary significantly, depending on the outcome of those conditions.
At December 31, 2009, there was approximately $22,000 of total unrecognized compensation expense related to unvested stock options. This cost is expected to be recognized over a weighted-average period of approximately two years.
The following table is a rollforward of service-based restricted stock activity for the year ended December 31, 2009:
| Number of Shares |
Weighted Average Grant Date Fair Value | |||||
| Service-based restricted stock, beginning of period |
681,141 | $ | 8.50 | |||
| Granted |
1,137,904 | 4.12 | ||||
| Vested |
(1,076,327 | ) | 5.38 | |||
| Forfeited |
(107,906 | ) | 6.35 | |||
| Service-based restricted stock, end of period |
634,812 | $ | 6.26 | |||
The fair value of service-based restricted stock that vested during the years ended December 31, 2009, 2008 and 2007 was $5,785,000, $1,897,000 and $1,879,000, respectively.
89
Table of Contents
The following table is a rollforward of performance-based restricted stock activity for the year ended December 31, 2009:
| Number of Shares |
Weighted Average Grant Date Fair Value | |||||
| Performance-based restricted stock, beginning of period |
2,040,826 | $ | 11.53 | |||
| Granted |
1,539,660 | 4.39 | ||||
| Vested |
(313,584 | ) | 11.68 | |||
| Forfeited |
(1,085,079 | ) | 10.99 | |||
| Performance-based restricted stock, end of period |
2,181,823 | $ | 6.73 | |||
The fair value of performance-based restricted stock that vested during the years ended December 31, 2009, 2008 and 2007 was $3,663,000, $8,217,000 and $3,771,000, respectively.
On February 12, 2010, the Company’s reacquisition right lapsed on 562,758 shares related to the performance-based restricted stock plan for the 2009 performance year. These shares are included in restricted stock at December 31, 2009 in the table above. The lapse occurred following the Company’s determination of its achievement of 2009 performance year performance conditions. The compensation expense related to these shares was included in the Consolidated Statements of Operations for the year ended December 31, 2009.
The following is a summary of activity under the stock option plans as of December 31, 2009:
| Options | Weighted Average Exercise Price |
Weighted Average Remaining Contractual Term |
Aggregate Intrinsic Value | |||||||
| Outstanding, beginning of period |
1,792,473 | $ | 7.93 | |||||||
| Granted |
15,000 | 3.50 | ||||||||
| Exercised |
(74,400 | ) | 2.79 | |||||||
| Expired or canceled |
(312,004 | ) | 9.55 | |||||||
| Outstanding, end of period |
1,421,069 | $ | 7.79 | 3.8 | 3,520,000 | |||||
| Vested and expected to vest |
1,420,415 | $ | 7.79 | 3.8 | 3,517,000 | |||||
| Options exercisable |
1,406,069 | $ | 7.84 | 3.7 | 3,458,000 | |||||
Total intrinsic value of options exercised during the years ended December 31, 2009, 2008 and 2007 was $290,000, $2,494,000 and $3,550,000, respectively. The Company issues new shares to satisfy stock option exercises and stock purchases under the Company’s share-based plans. The aggregate intrinsic value above represents the total pretax intrinsic value (the difference between the Company’s closing stock price on the last trading day of the quarter and the exercise price) multiplied by the number of shares that would have been received by the option holders had all option holders exercised their options on December 31, 2009. This amount changes based on the fair market value of the Company’s stock.
Stock options are granted with an exercise price equal to the fair market value on the date of grant, generally vest over four years and expire ten years from the date of grant. The Company granted 15,000 and 300,000 options during the years ended December 31, 2009 and 2008, respectively. The weighted-average grant date fair value of options granted in fiscal 2009 and 2008 were $1.96 and $2.15 per option, respectively. The Company estimates the fair value of each option grant on the date of grant using the Black-Scholes option-pricing model. The Black-Scholes option-pricing model was developed for use in estimating the value of traded options that have no vesting restrictions and are fully transferable, while the options issued by the Company are subject to both vesting and restrictions on transfer. In addition, option-pricing models require input of highly subjective assumptions including expected stock price volatility. The Company uses historical volatility data for expected volatility and estimates the expected life of its stock options based on the historical life of the Company’s options. As there were no options granted for the year ended December 31, 2007, no data is provided for stock option plans with respect to the weighted average assumptions used to value the option grants and the stock purchase plan rights. The grant date fair value of options granted was estimated using the following weighted average assumptions:
| Year Ended December 31, |
||||||
| 2009 | 2008 | |||||
| Expected life (years) |
4.0 | 3.0 | ||||
| Risk-free interest rate |
1.3 | % | 2.2 | % | ||
| Volatility |
75.5 | % | 40.5 | % | ||
| Dividend rate |
0.0 | % | 0.0 | % | ||
90
Table of Contents
The Company has a total of twelve stock option plans and has available a total of 6,352,000 shares of its common stock for issuance pursuant to incentive and non-qualified stock option plans and stock purchase rights that may be granted to officers, key employees and directors of the Company as of December 31, 2009. The Company issues new shares to satisfy stock option exercises and stock purchases under the Company’s share-based plans. The Company however only makes new common stock or option grants out of its shareholder approved 2007 Stock Incentive Plan.
The Company has an employee stock purchase plan authorizing the issuance of up to 1,250,000 shares of common stock to participating employees. The plan permits employees to purchase common stock at a price equal to 95% of the fair market value at the end of a six-month offering period. As of December 31, 2009, 944,000 shares have been issued under this plan.
Note 11. Stock Repurchase Plan
On November 1, 2007, the Company announced that the Board of Directors authorized the Company to institute a stock repurchase program whereby up to $50 million of its common stock may be repurchased from time to time. The duration of the repurchase program is open-ended. Under the program, the Company is able to purchase shares of common stock through open market transactions at prices deemed appropriate by management. The timing and amount of repurchase transactions under this program will depend on market conditions and corporate and regulatory considerations. The program may be discontinued at any time by the Board of Directors. Through December 31, 2009, the Company repurchased 162,000 shares of its common stock at a weighted average price of $8.03 per share under this program.
Note 12. Shareholder Rights Plan
On March 9, 1994, the Board of Directors adopted a Shareholder Rights Plan (the Plan), which was amended and restated on October 27, 2004 and amended on February 24, 2009. The Plan is intended to protect stockholders from unfair takeover practices. Under the Plan, each share of common stock carries a right to obtain additional stock according to terms provided in the Plan. The rights will not be exercisable or separable from the common stock until a third-party acquires at least 15% of the Company’s then outstanding common stock or commences a tender offer for at least 15% of the Company’s then outstanding common stock. In the event the Company is acquired in a merger or other business combination transaction in which the Company is not the surviving corporation or 50% or more of the Company’s consolidated assets or earning power are sold or transferred, each right will entitle its holder to receive, at the then current exercise price, common stock of the acquiring company having a market value equal to two times the exercise price of the right. If a person or entity were to acquire 15% or more of the outstanding shares of the Company’s common stock, or if the Company is not the surviving corporation in a merger and its common stock is not changed or exchanged, each right will entitle the holder to receive at the then current exercise price common stock having a market value equal to two times the exercise price of the right. Until a right is exercised, the holder of a right, as such, will have no rights as a stockholder of the Company, including, without limitation, the rights to vote as a stockholder or receive dividends.
Note 13. Employee Benefit Plan
Defined Contribution Plans
The Company has a 401(k) salary deferral plan (the 401(k) Plan), which is funded based on employee contributions. Terms of the 401(k) Plan provide for the Company to make contributions to the 401(k) Plan on behalf of each eligible employee (as defined) in an amount equal to 50% on the first 4% of the eligible employee’s deferred compensation contribution (as defined). The Company’s contributions to the 401(k) Plan were approximately $1,238,000, $1,439,000 and $1,342,000, respectively, for the years ended December 31, 2009, 2008 and 2007.
91
Table of Contents
The Company has a deferred compensation plan which permits certain eligible U.S. executives to defer a portion of their compensation. Benefit payments under the plan are funded by contributions from the participants. There is no Company match. At December 31, 2009 and 2008, the Company had $1,685,000 and $1,470,000, respectively, of deferred compensation included in accrued expenses in the accompanying Consolidated Balance Sheets. Such amounts are unsecured obligations of the Company.
Postretirement Life Insurance Plan
Additionally, the Company is obligated under a postretirement benefit plan to maintain life insurance policies on former employees from an acquired business. The obligation is recorded at the actuarial value of the cost of insurance. At December 31, 2009, the fair value of the postretirement obligation was $1,386,000, which was recorded in “Other long-term liabilities” in the Consolidated Balance Sheets, of which $98,000 was recognized in other comprehensive loss related to the actuarial valuation.
Defined Benefit Pension Plan
As part of the NSB acquisition (Note 3), the Company assumed a liability for a defined benefit pension scheme that provides pension benefits for certain NSB employees in the United Kingdom upon retirement. The plan is maintained in British pound sterling. The plan was closed to new entrants prior to the acquisition, and the plan participants are no longer employed by the Company.
Net Periodic Pension Cost
The net periodic pension cost of the Company’s defined benefit pension plan included the following components (in thousands):
| Year Ended December 31, 2009 |
Year Ended December 31, 2008 |
|||||||
| Interest cost on projected benefit obligation |
$ | 329 | $ | 371 | ||||
| Expected return on plan assets |
(228 | ) | (246 | ) | ||||
| Net periodic pension cost |
$ | 101 | $ | 125 | ||||
Obligations and Funded Status
Change in benefit obligation (in thousands):
| 2009 | 2008 | |||||||
| Projected benefit obligation at December 31, |
$ | 4,589 | $ | — | ||||
| Acquired projected benefit obligation assumed in business combination (NSB) |
— | 7,458 | ||||||
| Service cost |
— | — | ||||||
| Interest cost |
329 | 371 | ||||||
| Benefits paid |
(12 | ) | (6 | ) | ||||
| Actuarial (gain)/loss on liabilities |
1,045 | (1,530 | ) | |||||
| Foreign currency exchange rate changes |
489 | (1,704 | ) | |||||
| Projected benefit obligation at December 31, |
$ | 6,440 | $ | 4,589 | ||||
92
Table of Contents
Change in plan assets (in thousands):
| 2009 | 2008 | |||||||
| Fair value of assets at December 31 |
$ | 3,769 | $ | — | ||||
| Pension plan assets acquired in business combination (NSB) |
— | 5,194 | ||||||
| Actual return on assets |
415 | (332 | ) | |||||
| Contributions |
233 | 251 | ||||||
| Benefits paid |
(12 | ) | (6 | ) | ||||
| Foreign currency exchange rate changes |
389 | (1,338 | ) | |||||
| Fair value of assets at December 31 |
$ | 4,794 | $ | 3,769 | ||||
| Funded Status |
$ | (1,646 | ) | $ | (820 | ) | ||
At December 31, 2009, the accrued benefit obligation is equal to the projected benefit obligation of $6,440,000. The net funded status is in other long-term liabilities on the Consolidated Balance Sheets. There are no current liabilities or noncurrent assets with respect to the plan in the Consolidated Balance Sheets.
Amounts recognized in accumulated other comprehensive income (loss) (in thousands):
| As of December 31, 2009 |
As of December 31, 2008 |
||||||
| Transition obligation |
$ | — | $ | — | |||
| Prior service cost |
— | — | |||||
| Net (gain)/loss |
80 | (725 | ) | ||||
| Total |
$ | 80 | $ | (725 | ) | ||
Approximately $3,000 of the accumulated other comprehensive loss is expected to be recognized as net periodic pension costs in 2010.
Assumptions
The following assumptions were used to determine the benefit obligations and net periodic pension costs:
| December 31, 2009 | December 31, 2008 | |||
| Discount rate |
5.7% per annum | 6.7% per annum | ||
| Expected long term return on plan assets |
5.6% per annum | 5.5% per annum | ||
| Rate of future salary increases |
N/A | N/A | ||
The expected long-term rate of return on assets assumption is chosen based on the facts and circumstances that existed at the measurement date and the mix of assets held at that date.
93
Table of Contents
Plan Assets
The Company’s investment policy is determined by the trustees of the plan after consulting the Company and includes a periodic review of the pension plan’s investment in the various asset classes. The Company’s asset allocations by asset category are as follows:
| Fair Value Measurement Using | |||||||||||||||
| Asset Category |
Fair Value of Plan Assets at December 31, 2009 |
Level 1 | Level 2 | Level 3 | Percentage of Fair Value of Plan Assets |
||||||||||
| Cash |
$ | 768 | $ | 768 | $ | — | $ | — | 16.0 | % | |||||
| Pooled Funds: |
|||||||||||||||
| UK equities (a) |
750 | 750 | — | — | 15.7 | % | |||||||||
| European equities (b) |
302 | 302 | — | — | 6.3 | % | |||||||||
| North American equities (c) |
204 | 204 | — | — | 4.3 | % | |||||||||
| Property (d) |
443 | 443 | — | — | 9.2 | % | |||||||||
| Government bonds (e) |
473 | 473 | — | — | 9.9 | % | |||||||||
| Corporate bonds (f) |
1,430 | 1,430 | — | — | 29.8 | % | |||||||||
| Index linked bonds (g) |
424 | 424 | — | — | 8.8 | % | |||||||||
| Total |
$ | 4,794 | $ | 4,794 | $ | — | $ | — | 100.0 | % | |||||
| (a) | This consists of two pooled pension funds, with 36% invested in a fund predominantly invested in UK Blue Chip stocks and the balance invested in a fund whose aim is to benefit from UK recovery stocks. |
| (b) | This is a pooled pension fund holding European equities. |
| (c) | This is a pooled pension fund holding North American equities. |
| (d) | This is a pooled pension fund holding UK property. |
| (e) | This consists of two pooled pension funds, with 78% held in a UK long dated fixed interest bond fund and the balance held in a fund predominantly invested in UK Gilts. |
| (f) | This is a pooled pension fund holding a variety of corporate bonds. |
| (g) | This is a pooled pension fund holding UK long dated index linked bonds. |
| Fair Value of Plan Assets at December 31, 2008 |
Percentage of Fair Value of Plan Assets |
|||||
| Equity securities |
$ | 885 | 23.5 | % | ||
| Property |
391 | 10.4 | % | |||
| Bonds |
2,002 | 53.1 | % | |||
| Cash |
491 | 13.0 | % | |||
| Total |
$ | 3,769 | 100.0 | % | ||
In determining the mix of assets, the trustees of the plan have taken into account the plan liabilities. In particular, the significant bond holding is intended to reduce the volatility of the financial position. Net cash flow is currently being held in cash pending a review of the investment strategy. The assets are diversified and are managed in accordance with applicable laws, and with the goal of maximizing the plan’s return within acceptable risk parameters. The pension plan’s assets did not include any of the Company’s stock at December 31, 2009 or 2008.
94
Table of Contents
Estimated Future Benefit Payments
The schedule below shows the estimated future benefit payments for the defined benefit pension plan and the postretirement life insurance plan for each of the years 2010 through 2014 and the aggregate of the next five years (in thousands):
| Year Ending December 31: |
|||
| 2010 |
$ | 118 | |
| 2011 |
149 | ||
| 2012 |
284 | ||
| 2013 |
309 | ||
| 2014 |
333 | ||
| 2015 thru 2019 |
1,856 | ||
| Total |
$ | 3,049 | |
There is no further accrual of benefits because plan participants include only terminated employees so the only contributions required are those needed to fund the shortfall in the plan. During 2010, the Company is currently committed to contribute approximately $399,000 to the plan to cover the shortfall. Administrative costs of the plan are paid directly by the Company.
Note 14. Segment and Geographic Information
The Company has prepared operating segment information to report components that are evaluated regularly by the Company’s chief operating decision maker in deciding how to allocate resources and in assessing performance.
The Company’s reportable operating segments include software licenses, consulting, maintenance and hardware and other. Currently, the Company does not separately allocate amortization of intangible assets or operating expenses to these segments, nor does it allocate specific assets to these segments. Therefore, the segment information reported includes only revenues, cost of segment revenues and segment gross profit. Excluded from the table below is amortization of intangible assets for the years ended December 31, 2009, 2008 and 2007 of $30,772,000, $32,896,000 and $17,419,000, respectively.
Operating segment data for the years ended December 31, 2009, 2008 and 2007 is as follows (in thousands):
| License | Consulting | Maintenance | Hardware and Other |
Total | |||||||||||
| Year ended December 31, 2009: |
|||||||||||||||
| Revenues |
$ | 70,235 | $ | 128,413 | $ | 190,943 | $ | 20,033 | $ | 409,624 | |||||
| Cost of segment revenues |
14,646 | 104,307 | 44,009 | 17,587 | 180,549 | ||||||||||
| Segment gross profit |
$ | 55,589 | $ | 24,106 | $ | 146,934 | $ | 2,446 | $ | 229,075 | |||||
| Year ended December 31, 2008: |
|||||||||||||||
| Revenues |
$ | 90,416 | $ | 152,153 | $ | 192,308 | $ | 53,002 | $ | 487,879 | |||||
| Cost of segment revenues |
18,215 | 125,747 | 48,110 | 47,840 | 239,912 | ||||||||||
| Segment gross profit |
$ | 72,201 | $ | 26,406 | $ | 144,198 | $ | 5,162 | $ | 247,967 | |||||
| Year ended December 31, 2007: |
|||||||||||||||
| Revenues |
$ | 109,443 | $ | 134,722 | $ | 160,278 | $ | 25,389 | $ | 429,832 | |||||
| Cost of segment revenues |
23,748 | 110,668 | 34,956 | 22,506 | 191,878 | ||||||||||
| Segment gross profit |
$ | 85,695 | $ | 24,054 | $ | 125,322 | $ | 2,883 | $ | 237,954 | |||||
95
Table of Contents
The following schedule presents the Company’s operations by geographic area for the years ended December 31, 2009, 2008 and 2007 (in thousands):
| United States | Europe | Australia and New Zealand |
Asia | Other | Consolidated | |||||||||||||
| Year ended December 31, 2009: |
||||||||||||||||||
| Revenues |
$ | 280,765 | $ | 80,079 | $ | 16,643 | $ | 15,160 | $ | 16,977 | $ | 409,624 | ||||||
| Property and equipment, net |
21,180 | 1,391 | 1,613 | 706 | 3,621 | 28,511 | ||||||||||||
| Year ended December 31, 2008: |
||||||||||||||||||
| Revenues |
$ | 328,760 | $ | 98,197 | $ | 18,783 | $ | 18,037 | $ | 24,102 | $ | 487,879 | ||||||
| Property and equipment, net |
22,995 | 1,910 | 886 | 1,368 | 4,828 | 31,987 | ||||||||||||
| Year ended December 31, 2007: |
||||||||||||||||||
| Revenues |
$ | 258,973 | $ | 109,307 | $ | 16,974 | $ | 22,541 | $ | 22,037 | $ | 429,832 | ||||||
| Property and equipment, net |
8,609 | 2,391 | 1,222 | 1,284 | 1,256 | 14,762 | ||||||||||||
Revenues are attributed to geographic areas based on the location of the Company’s subsidiary that entered into the related contract. No single customer accounts for greater than 10% of revenues.
Note 15. Selected Quarterly Information (Unaudited)
The following table sets forth selected unaudited quarterly information for the Company’s four fiscal quarters in 2009 and 2008. The Company believes that all necessary adjustments (which consisted only of normal recurring adjustments) have been included in the amounts stated below to present fairly the results of such periods when read in conjunction with the annual financial statements and related notes (in thousands, except per share data):
| Year 2009 Quarter Ended | ||||||||||||||
| December 31 | September 30 | June 30 | March 31 | |||||||||||
| Total revenues |
$ | 111,908 | $ | 98,576 | $ | 100,447 | $ | 98,693 | ||||||
| Gross profit |
$ | 57,044 | $ | 48,938 | $ | 48,217 | $ | 44,104 | ||||||
| Operating income (loss) |
$ | 10,962 | $ | 4,598 | $ | 3,805 | $ | (1,994 | ) | |||||
| Net income (loss) |
$ | 6,714 | $ | 356 | $ | (6,680 | ) | $ | (1,628 | ) | ||||
| Earnings (loss) per share – diluted |
$ | 0.11 | $ | 0.01 | $ | (0.11 | ) | $ | (0.03 | ) | ||||
| Shares outstanding – diluted |
59,344 | 60,305 | 59,486 | 58,985 | ||||||||||
| Year 2008 Quarter Ended | ||||||||||||||
| December 31 | September 30 | June 30 | March 31 | |||||||||||
| As Adjusted | As Adjusted | As Adjusted | As Adjusted | |||||||||||
| Total revenues |
$ | 121,948 | $ | 135,762 | $ | 127,945 | $ | 102,224 | ||||||
| Gross profit |
$ | 59,674 | $ | 59,069 | $ | 54,715 | $ | 41,613 | ||||||
| Operating income (loss) |
$ | 11,265 | $ | 10,413 | $ | 5,521 | $ | (9,026 | ) | |||||
| Net income (loss) |
$ | 1,547 | $ | 2,748 | $ | 279 | $ | (8,025 | ) | |||||
| Earnings (loss) per share – diluted |
$ | 0.03 | $ | 0.05 | $ | 0.00 | $ | (0.14 | ) | |||||
| Shares outstanding – diluted |
59,082 | 59,186 | 58,862 | 57,898 | ||||||||||
96
Table of Contents
| Item 9. | CHANGES IN AND DISAGREEMENTS WITH ACCOUNTANTS ON ACCOUNTING AND FINANCIAL DISCLOSURE |
None.
| Item 9A. | CONTROLS AND PROCEDURES |
(a) Evaluation of disclosure controls and procedures
The Company’s management evaluated, with the participation of the Chief Executive Officer and the Chief Financial Officer, the effectiveness of the Company’s disclosure controls and procedures as of the end of the period covered by this Annual Report on Form 10-K. Based on this evaluation, the Company’s principal executive officer and principal financial officer have concluded that the Company’s disclosure controls and procedures (as defined in Rules 13a-15(e) and 15d-15(e) under the Securities Exchange Act of 1934) (the Exchange Act) are effective to ensure that information required to be disclosed by the Company in reports that it files or submits under the Exchange Act is accumulated and communicated to the Company’s management, including the Chief Executive Officer and Chief Financial Officer, as appropriate to allow timely decisions regarding required disclosure, and that such information is recorded, processed, summarized and reported within the time periods specified in Securities and Exchange Commission rules and forms.
(b) Management’s Report on Internal Control Over Financial Reporting
Epicor’s management is responsible for establishing and maintaining adequate internal control over the Company’s financial reporting as such term is defined in Exchange Act Rule 13a-15(f). The Company’s internal control over financial reporting is a process designed under the supervision of the Company’s principal executive and principal financial officers to provide reasonable assurance regarding the reliability of financial reporting and the preparation of the Company’s financial statements for external purposes in accordance with U.S. generally accepted accounting principles.
There are inherent limitations in the effectiveness of any internal control, including the possibility of human error and the circumvention or overriding of controls. Accordingly, even effective internal controls can provide only reasonable assurances with respect to financial statement preparation. Further, because of changes in conditions, the effectiveness of internal controls may vary over time.
The Company’s management assessed the effectiveness of its internal control over financial reporting as of December 31, 2009. In making this assessment, management used the criteria set forth by the Committee of Sponsoring Organizations of the Treadway Commission (COSO) in its report entitled Internal Control – Integrated Framework.
Based on its assessment using those criteria, management (including our Chief Executive Officer and our Chief Financial Officer) has concluded that, as of December 31, 2009, the Company’s internal control over financial reporting was effective at the reasonable assurance level.
The effectiveness of the Company’s internal control over financial reporting as of December 31, 2009, has been audited by McGladrey & Pullen, LLP, the independent registered public accounting firm that audits the Company’s consolidated financial statements, as stated in their report included in this report, which expresses an unqualified opinion on the effectiveness of the Company’s internal control over financial reporting as of December 31, 2009.
(c) Changes in Internal Control over Financial Reporting
None.
97
Table of Contents
REPORT OF INDEPENDENT REGISTERED PUBLIC ACCOUNTING FIRM
To the Board of Directors and Stockholders
Epicor Software Corporation
We have audited Epicor Software Corporation’s and subsidiaries’ internal control over financial reporting as of December 31, 2009, based on criteria established in Internal Control—Integrated Framework issued by the Committee of Sponsoring Organizations of the Treadway Commission. Epicor Software Corporation’s management is responsible for maintaining effective internal control over financial reporting and for its assessment of the effectiveness of internal control over financial reporting included in the accompanying Management’s Report on Internal Control Over Financial Reporting in the Annual Report on Form 10-K of Epicor Software Corporation for the year ended December 31, 2009. Our responsibility is to express an opinion on the company’s internal control over financial reporting based on our audit.
We conducted our audit in accordance with the standards of the Public Company Accounting Oversight Board (United States). Those standards require that we plan and perform the audit to obtain reasonable assurance about whether effective internal control over financial reporting was maintained in all material respects. Our audit included obtaining an understanding of internal control over financial reporting, assessing the risk that a material weakness exists, and testing and evaluating the design and operating effectiveness of internal control based on the assessed risk. Our audit also included performing such other procedures as we considered necessary in the circumstances. We believe that our audit provides a reasonable basis for our opinion.
A company’s internal control over financial reporting is a process designed to provide reasonable assurance regarding the reliability of financial reporting and the preparation of financial statements for external purposes in accordance with generally accepted accounting principles. A company’s internal control over financial reporting includes those policies and procedures that (a) pertain to the maintenance of records that, in reasonable detail, accurately and fairly reflect the transactions and dispositions of the assets of the company; (b) provide reasonable assurance that transactions are recorded as necessary to permit preparation of financial statements in accordance with generally accepted accounting principles, and that receipts and expenditures of the company are being made only in accordance with authorizations of management and directors of the company; and (c) provide reasonable assurance regarding prevention or timely detection of unauthorized acquisition, use, or disposition of the company’s assets that could have a material effect on the financial statements.
Because of its inherent limitations, internal control over financial reporting may not prevent or detect misstatements. Also, projections of any evaluation of effectiveness to future periods are subject to the risk that controls may become inadequate because of changes in conditions, or that the degree of compliance with the policies or procedures may deteriorate.
In our opinion, Epicor Software Corporation and subsidiaries maintained, in all material respects, effective internal control over financial reporting as of December 31, 2009, based on criteria established in Internal Control—Integrated Framework issued by the Committee of Sponsoring Organizations of the Treadway Commission.
We have also audited, in accordance with the standards of the Public Company Accounting Oversight Board (United States), the consolidated balance sheets of Epicor Software Corporation and subsidiaries as of December 31, 2009 and 2008, and the related consolidated statements of operations, stockholders' equity and comprehensive income (loss), and cash flows for each of the three years in the period ended December 31, 2009, and our report dated March 12, 2010 expressed an unqualified opinion.
/s/ McGladrey & Pullen, LLP
Irvine, California
March 12, 2010
98
Table of Contents
| Item 9B. | OTHER INFORMATION |
There was no other information required to be reported on a Form 8-K during the fourth quarter of 2009 which was not reported.
PART III
| Item 10. | DIRECTORS, EXECUTIVE OFFICERS AND CORPORATE GOVERNANCE |
The information required hereunder is incorporated by reference from the sections of the Company’s Proxy Statement filed in connection with its 2010 Annual Meeting of Stockholders entitled “Proposal One: Election of Directors – Nominees,” “Executive Officers,” “Section 16(a) Beneficial Ownership Reporting Compliance,” “Board of Directors Meetings and Committees – Code of Ethics” and the first paragraph under the section entitled “Board of Directors Meetings and Committees – Audit Committee.”
| Item 11. | EXECUTIVE COMPENSATION |
The information required hereunder is incorporated by reference from the sections of the Company’s Proxy Statement filed in connection with its 2010 Annual Meeting of Stockholders entitled “Executive Compensation and Other Matters,” including the section entitled “Executive Compensation and Other Matters – Compensation Committee Report,” and “Board of Directors Meetings and Committees – Compensation Committee Interlocks and Insider Participation.”
| Item 12. | SECURITY OWNERSHIP OF CERTAIN BENEFICIAL OWNERS AND MANAGEMENT AND RELATED STOCKHOLDER MATTERS |
The information required hereunder is incorporated by reference from the sections of the Company’s Proxy Statement filed in connection with its 2010 Annual Meeting of Stockholders entitled “Security Ownership of Certain Beneficial Owners and Management.”
Equity Compensation Plan Information
The following table sets forth certain information, as of December 31, 2009, concerning shares of common stock authorized for issuance under the Company’s existing equity compensation plans. The table does not include information with respect to shares subject to outstanding options granted under equity compensation plans assumed by the Company in connection with mergers and acquisitions of the companies, which originally granted those options. No additional options may be granted under those assumed plans.
| Plan Category |
Number of Securities to be Issued upon Exercise of Outstanding Options (a) |
Weighted Average Exercise Price of Outstanding Options (b) |
Number of Securities Remaining Available for Future Issuance under Equity Compensation Plans (excluding securities reflected in column (a)) (c) |
|||||
| Equity compensation plans approved by shareholders (1) |
2,113,843 | $ | 7.69 | 6,046,677 | (3) | |||
| Equity compensation plans not approved by shareholders (2) |
251,490 | $ | 3.43 | — | (4) | |||
| Total |
2,365,333 | $ | 7.24 | 6,046,677 | ||||
| (1) | Consists of the Platinum Software Corporation Incentive Stock Option, Nonqualified Stock Option and Restricted Stock Purchase Plan – 1990 (the 1990 Plan), 1994 Incentive Stock Option, Non-qualified Stock Option and Restricted Stock Purchase Plan (the 1994 Plan), 1999 Nonstatutory Stock Option Plan (the 1999 Plan), 2002 Employee Stock Purchase Plan (the Purchase Plan), 2005 Stock Incentive Plan (the 2005 Plan) and 2007 Stock Incentive Plan (the 2007 Plan). |
99
Table of Contents
| (2) | Consists of the 1993 Nonqualified Stock Option Plan, 1996 Nonqualified Stock Option Plan, 1997 Nonqualified Stock Option Plan, 1998 Nonqualified Stock Option Plan, 1999 Merger Transition Nonstatutory Stock Option Plan and the 2003 CFO Option Plan (hereinafter collectively referred to as the “Non-Shareholder Approved Plans”). |
| (3) | This number includes 305,736 shares of common stock reserved for issuance under the Purchase Plan, 0 shares available for issuance under the 1994 Plan, 0 shares available for issuance under the 1999 Plan and 2005 Plan, respectively, and 6,046,677 shares available for issuance under the 2007 Plan. It does not include shares under the 1990 Plan. No new options can be granted under the 1990 Plan. On March 30, 2007, the Board of Directors approved the 2007 Plan, subject to stockholder approval at the Annual Meeting, which approval was ultimately received on May 22, 2007. Under the terms of those approvals and the terms of the 2007 Plan, any remaining available shares for issuance under the 1999 Plan and the 2005 Plan rolled into the 2007 Plan. Thus, 0 shares remain available for issuance under those two plans. |
| (4) | On March 18, 2003, the Compensation Committee of the Board of Directors approved an amendment to the Company's 1999 Nonstatutory Stock Option Plan to increase the authorized shares of common stock under the Plan by 4,000,000 to a total of 6,000,000 shares of common stock authorized under the 1999 Plan. In addition, the Board of Directors resolved that if the 4,000,000 share increase to the 1999 Plan was approved, the Board would cease making grants under the Non-Shareholder Approved Plans. Because the share increase to the 1999 Plan was approved, the Company will no longer make additional grants under those Non-Shareholder Approved Plans. |
1993 Nonqualified Stock Option Plan
In July 1993, the Board of Directors approved the 1993 Nonqualified Stock Option Plan (the 1993 Plan). The 1993 Plan provides for the grant of nonqualified stock options to officers and other key employees, consultants, business associates and others with important business relationships with us at the fair market value of our common stock as of the date of grant. The plan administrator determines, on a grant-by-grant basis, when options granted under the 1993 Plan may be exercised. The 1993 Plan provides that vested options may be exercised for 3 months after termination of employment other than due to death or disability and for 1 year after termination of employment as a result of death or disability. The 1993 Plan permits options to be exercised with cash, check, certain other shares of our common stock, promissory notes, cancellation of indebtedness, waiver of compensation due or consideration received by us under “cashless exercise” programs. In the event that we merge with or into another corporation, or sell substantially all of our assets, the 1993 Plan provides that each outstanding option will fully vest and become exercisable unless provision is made in writing in connection with the transaction for options to be assumed or substituted for by the successor corporation. There are 30,000 shares of common stock reserved under the 1993 Plan and no more options may be granted under the 1993 Plan per note 5 above.
1996 Nonqualified Stock Option Plan
In February 1996, the Board of Directors approved the 1996 Nonqualified Stock Option Plan (the 1996 Plan). The 1996 Plan provides for the grant of nonqualified stock options to non-executive officers and other key employees, consultants, business associates and others with important business relationships with us at the fair market value of our common stock as of the date of grant. The plan administrator determines, on a grant-by-grant basis, when options granted under the 1996 Plan may be exercised. The 1996 Plan permits options to be exercised with cash, check, certain other shares of our common stock, promissory notes, cancellation of indebtedness, waiver of compensation due or consideration received by us under “cashless exercise” programs. In the event of our change of control (including our merger with or into another corporation, or our sale of substantially all of our assets), the 1996 Plan provides that each optionee may exercise his or her option with respect to any or all of the shares subject to the option (including shares that were unvested prior to the change of control) and may, depending on the nature of the change of control, exchange the option for a cash payment determined by multiplying the number of vested shares by the excess of any per share merger consideration over the per share exercise price. There are 38,575 shares of common stock reserved under the 1996 Plan and no more options may be granted under the 1996 Plan per note 5 above.
1997 Nonqualified Stock Option Plan
In July 1997, the Board of Directors approved the 1997 Nonqualified Stock Option Plan (the 1997 Plan). The 1997 Plan provides for the grant of nonqualified stock options to employees, consultants, business associates and others with important business relationships with us at the fair market value of our common stock as of the date of grant. The plan administrator determines, on a grant-by-grant basis, when options granted under the 1997 Plan may be exercised. The 1997 Plan permits options to be exercised with cash, check, certain other shares of our
100
Table of Contents
common stock, promissory notes, cancellation of indebtedness, waiver of compensation due or consideration received by us under “cashless exercise” programs. In the event of our change of control (including our merger with or into another corporation, or our sale of substantially all of our assets), the 1997 Plan provides that each optionee may exercise his or her option with respect to any or all of the shares subject to the option (including shares that were unvested prior to the change of control) and may, depending on the nature of the change of control, exchange the option for a cash payment determined by multiplying the number of vested shares by the excess of any per share merger consideration over the per share exercise price. There are 30,625 shares of common stock reserved under the 1997 Plan and no more options may be granted under the 1997 Plan per note 5 above.
1998 Nonqualified Stock Option Plan
In April 1998, the Board of Directors approved the 1998 Nonqualified Stock Option Plan (the 1998 Plan). The Board of Directors subsequently amended the 1998 Plan in July 1998 to increase the number of authorized shares. The 1998 Plan provides for the grant of nonqualified stock options to officers and employees, members of our Board of Directors, consultants, business associates and others with important business relationships with us at the fair market value of our common stock as of the date of grant. The plan administrator determines, on a grant-by-grant basis, when options granted under the 1998 Plan may be exercised. The 1998 Plan permits options to be exercised with cash, check, certain other shares of our common stock, promissory notes, cancellation of indebtedness, waiver of compensation due or consideration received by us under “cashless exercise” programs. In the event of our change of control (including our merger with or into another corporation, or our sale of substantially all of our assets), the 1998 Plan provides that each optionee may exercise his or her option with respect to any or all of the shares subject to the option (including shares that were unvested prior to the change of control) and may, depending on the nature of the change of control, exchange the option for a cash payment determined by multiplying the number of vested shares by the excess of any per share merger consideration over the per share exercise price. There are 107,250 shares of common stock reserved under the 1998 Plan and no more options may be granted under the 1998 Plan per note 5 above.
1999 Merger Transition Nonstatutory Stock Option Plan
In February 1999, the Board of Directors approved the 1999 Merger Transition Nonqualified Stock Option Plan (the Transition Plan). The Transition Plan provides for the grant of nonqualified stock options to officers, employees, directors and consultants at the fair market value of our common stock as of the date of grant. However, option grants to individuals at the level of vice-president or higher are limited to former DataWorks employees as an essential inducement to their entering into an employment agreement with us. The plan administrator determines, on a grant-by-grant basis, when options granted under the Transition Plan may be exercised. The Transition Plan provides that vested options may generally be exercised for 3 months after termination of employment and for 12 months after termination of employment as a result of death or disability. The Transition Plan generally permits options to be exercised with cash, check, certain other shares of our common stock, promissory notes, cancellation of indebtedness or consideration received by us under a “cashless exercise” program. In the event of our change in control (including our merger with or into another corporation, or our sale of substantially all of our assets), the Transition Plan provides that each outstanding option will fully vest and become exercisable. There are no shares of common stock reserved under the Transition Plan and no more options may be granted under the 1999 Plan per note 5 above.
2003 CFO Option Plan
On May 20, 2003, the Board of Directors approved the 2003 CFO Option Plan (the “CFO Plan”). The CFO Plan provides for the one-time option grant of 250,000 shares of common stock to the Company’s then CFO, Michael A. Piraino, as an essential inducement for his accepting the CFO position with Epicor in May 2003. The options are valued as of the date Mr. Piraino began his employment with the Company. Under the terms of the CFO Plan, 25% of the grant vests on the first anniversary date of the grant with the remaining 75% vesting quarterly over the next three year period such that the entire grant is vested in four years. The CFO Plan permits options to be exercised with cash, check, certain other shares of our common stock, waiver of compensation due or consideration received by us under “cashless exercise” programs. In the event of our change of control (including our merger with or into another corporation, or our sale of substantially all of our assets), the CFO Plan provides that Mr. Piraino may exercise his option with respect to any or all of the shares subject to the option (including shares that were unvested prior to the change of control) and may, depending on the nature of the change of control, exchange the option for a cash payment determined by multiplying the number of vested shares by the excess of any per share merger consideration over the per share exercise price. There are 0 shares of common stock reserved under the CFO Plan and no more options may be granted under the CFO Plan.
101
Table of Contents
| Item 13. | CERTAIN RELATIONSHIPS AND RELATED TRANSACTIONS, AND DIRECTOR INDEPENDENCE |
The information required hereunder is incorporated by reference from the sections of the Company’s Proxy Statement filed in connection with its 2010 Annual Meeting of Stockholders entitled “Certain Relationships and Related Person Transactions” and “Board of Directors Meetings and Committees—Board Independence.”
| Item 14. | PRINCIPAL ACCOUNTANT FEES AND SERVICES |
The information required hereunder is incorporated by reference from the section of the Company’s Proxy Statement filed in connection with its 2010 Annual Meeting of Stockholders entitled “Fees Billed by McGladrey & Pullen, LLP During Last Two Fiscal Years.”
102
Table of Contents
PART IV
| Item 15. | EXHIBITS AND FINANCIAL STATEMENT SCHEDULES |
| (a) | The following documents are filed as part of this Report on 10-K: |
| 1. | Financial Statements |
See Index to Consolidated Financial Statements at Item 8 on page 59 of this Report.
| 2. | Financial Statement Schedules |
See Index to Consolidated Financial Statements at Item 8 on page 59 of this Report.
| 3. | Exhibits |
Index to Exhibits
Exhibits Index
| Exhibit No. |
Description |
Location | |||
| 1.1 | Underwriting Agreement, dated as of May 2, 2007 between the Company, UBS Securities LLC and Lehman Brothers Inc. | (46 | ) | ||
| 2.1 | Agreement and Plan of Reorganization and Merger dated as of June 27, 1997 among the Company, CSI Acquisition Corp., Clientele Software, Inc., Dale E. Yocum, Pamela J. Yocum, William L. Mulert. (Schedules not included pursuant to Rule 601(b)(2) of Reg. S-K). | (9 | ) | ||
| 2.2 | Agreement and Plan of Reorganization dated as of November 4, 1997 by and among the Company, FS Acquisition Corp., FocusSoft, Inc., John Lococo, Michael Zimmerman and Joseph Brumleve. (Schedules not included pursuant to Rule 601(b)(2) of Reg. S-K). | (11 | ) | ||
| 2.3 | Agreement and Plan of Reorganization by and among the Company, Zoo Acquisition Corp. and DataWorks Corporation (“Dataworks”), dated as of October 13, 1998, as amended as of October 30, 1998. (Schedules not included pursuant to Rule 601(b)(2) of Reg. S-K). | (14 | ) | ||
| 2.4 | Merger Protocol by and between the Company and Scala Business Solutions N.V. dated as of November 14, 2003. | (40 | ) | ||
| 2.5 | Stock Purchase Agreement dated as of December 6, 2005 by and among the Company, Cougar Acquisition Corporation, CRS Retail Technology Group, Inc., certain principal stockholders of CRS Retail Technology Group, Inc., and certain other parties. | (43 | ) | ||
| 3.1 | Second Restated Certificate of Incorporation of the Company. | (1 | ) | ||
| 3.2 | Certificate of Amendment to Second Restated Certificate of Incorporation. | (10 | ) | ||
| 3.3 | Certificate of Amendment to Second Restated Certificate of Incorporation. | (22 | ) | ||
| 3.4 | Amended and Restated Bylaws of the Company, as currently in effect. | ||||
| 3.5 | Specimen Certificate of Common Stock. | (2 | ) | ||
| 3.6 | Certificate of Designation of Rights, Preferences and Privileges of Series A Junior Participating Preferred Stock. | (4 | ) | ||
| 3.7 | Certificate of Designation of Preferences of Series C Preferred Stock. | (6 | ) | ||
| 3.8 | Certificate of Designation of Preferences of Series D Preferred Stock. | (17 | ) | ||
| 4.1 | Amended and Restated Preferred Stock Rights Agreement, dated as of October 27, 2004, between the Company and Mellon Investor Services LLC, as Rights Agent. | (54 | ) | ||
| 4.2 | Amendment No. 1 to the Amended and Restated Preferred Rights Stock Agreement, dated as of February 24, 2009, by and between the Company and Mellon Investor Services LLC, as Rights Agent. | (55 | ) | ||
| 4.3 | First Supplemental Indenture between the Company and U.S. Bank National Association as trustee dated May 8, 2007. | (47 | ) | ||
| 10.1* | Platinum Software Corporation 1990 Incentive Stock Option, Nonqualified Stock Option and Restricted Stock Purchase Plan (the “1990 Plan”). | (2 | ) | ||
| 10.2* | Form of Incentive Option Agreement pertaining to the 1990 Plan. | (2 | ) | ||
| 10.3* | Form of Nonqualified Stock Option Agreement pertaining to the 1990 Plan. | (2 | ) | ||
| 10.4* | Form of Restricted Share Agreement pertaining to the 1990 Plan. | (2 | ) | ||
| 10.5 | Form of Indemnification Agreement for Officers and Directors of the Company. | (2 | ) | ||
103
Table of Contents
| 10.6* |
Platinum Software Corporation Employee Stock Purchase Plan, as amended. | (2) | ||
| 10.10* |
1993 Nonqualified Stock Option Plan. | (3) | ||
| 10.11* |
Form of Nonqualified Stock Option Agreement pertaining to the 1993 Nonqualified Stock Option Plan. | (3) | ||
| 10.12* |
1994 Incentive Stock Option, Non-qualified Stock Option and Restricted Stock Purchase Plan. | (31) | ||
| 10.13* |
Form of Non-qualified Stock Option Agreement pertaining to the 1994 Plan. | (31) | ||
| 10.28 |
Stock Purchase Agreement dated September 22, 1994 between the Company and the Series B Preferred Stock Investors. | (6) | ||
| 10.29 |
Registration Rights Agreement dated September 22, 1994 between the Company and the Series B Preferred Stock Investors. | (6) | ||
| 10.30 |
Amendment to Stock Purchase Agreement dated May 26, 1995 between the Company and the Series C Preferred Stock Investors. | (6) | ||
| 10.31 |
Amendment to Registration Rights Agreement dated May 26, 1995 between the Company and the Series C Preferred Stock Investors. | (6) | ||
| 10.33* |
Employment Offer Letter with L. George Klaus dated February 7, 1996. | (7) | ||
| 10.34* |
Restricted Stock Purchase Agreement between the Company and L. George Klaus dated as of February 7, 1996. | (7) | ||
| 10.44* |
1996 Nonqualified Stock Option Plan and Form of Nonqualified Option Agreement. | (8) | ||
| 10.45* |
Platinum Software Corporation Clientele Incentive Stock Plan. | (8) | ||
| 10.47* |
1997 Nonqualified Stock Option Plan. | (12) | ||
| 10.48* |
Amended and Restated 1998 Nonqualified Stock Option Plan. | (15) | ||
| 10.49 |
Software Distribution License Agreement with FRx Software Corporation, as amended to date. | (15) | ||
| 10.52* |
DataWorks 1995 Equity Incentive Plan, as amended. | (18) | ||
| 10.54* |
DataWorks 1995 Non-Employee Directors’ Stock Option Plan, as amended. | (18) | ||
| 10.55 |
Sublease Agreement dated November 22, 1991 between DataWorks and Titan Corporation (“Sublease”). | (16) | ||
| 10.56 |
First Amendment to Sublease dated December 1, 1994. | (16) | ||
| 10.57 |
Lease Agreement dated January 16, 1997 between DataWorks and Whiop Real Estate Limited Partnership. | (18) | ||
| 10.58* |
Interactive Group, Inc. (“Interactive”) 1995 Stock Option Plan, as amended (the “Interactive Option Plan”). | (19) | ||
| 10.59* |
Form of Incentive Stock Option Plan under the Interactive Option Plan. | (20) | ||
| 10.61 |
Lease between James S. Hekiman and William Finard, as Trustees of the Burlington Woods Office Trust No. 11 under a declaration of trust dated September 10, 1980 and Interactive dated September 23, 1991. | (20) | ||
| 10.62* |
1997 Nonstatutory Stock Plan of Interactive. | (21) | ||
| 10.63 |
Single Tenant lease between ADI Research Partners, LP and DataWorks, dated as of August 14, 1998. | (23) | ||
| 10.64 |
1999 Merger Transition Nonstatutory Stock Option Plan. | (24) | ||
| 10.65 |
Trademark License Agreement between the Company and Platinum Technology, Inc. dated as of January 14, 1999. | (29) | ||
| 10.66 |
Value Added Reseller Agreement with Ardent Software, dated January 1, 1999. | (29) | ||
| 10.67* |
Amended and Restated 1999 Nonstatutory Stock Option Plan. | (25) | ||
| 10.68 |
Bracknell Lease Agreement dated May 19, 1999. | (26) | ||
| 10.70* |
Nonstatutory Stock Option Agreement with Richard L. Roll dated November 16, 1999. | (37) | ||
| 10.71* |
Nonstatutory Stock Option Agreement with Richard L. Roll dated November 16, 1999. | (37) | ||
| 10.72 |
Loan and Security Agreement by and among the Company as borrower and Foothill Capital Corporation as lender dated as of July 26, 2000. | (27) | ||
| 10.73 |
Amendment to Loan and Security Agreement dated November 20, 2000. | (28) | ||
| 10.74 |
Amendment to Loan and Security Agreement dated May 21, 2001. | (30) | ||
| 10.75* |
Amendment to Note Secured by Stock Pledge Agreement dated February 7, 2001 by and between the Company and L. George Klaus. | (32) | ||
| 10.76* |
Amendment to Unsecured Note dated February 7, 2001 by and between the Company and L. George Klaus. | (32) | ||
| 10.77* |
Amended Management Retention Agreement dated as of March 1, 2007 by and between the Company and L. George Klaus. | (38) | ||
| 10.78 |
Amendment to Loan and Security Agreement dated June 25, 2002. | (33) | ||
104
Table of Contents
| 10.79* |
2002 Employee Stock Purchase Plan. | (35) | ||
| 10.80 |
Series D Preferred Stock Purchase Agreement dated as of February 11, 2003 by and among the Company and certain Purchasers. | (17) | ||
| 10.81* |
Employment Offer Letter with Michael A. Piraino dated April 30, 2003. | (39) | ||
| 10.82 |
Lease Agreement dated October 14, 2003 between the Company and Koll Center Irvine Number Two, L.L.C. | (40) | ||
| 10.83* |
Compromise Agreement with Andreas Kemi effective August 13, 2005. | (13) | ||
| 10.84* |
Final Statement of Account under Employment Agreement with Andreas Kemi dated September 6, 2004. | (13) | ||
| 10.85* |
Consulting Agreement dated October 18, 2004 between the Company and CHB Management GmbH, a Swiss Corporation. | (13) | ||
| 10.86 |
Credit Agreement by and among the Company, the Lenders party thereto, and KeyBank National Association, as Administrative Agent, dated March 29, 2005. | (41) | ||
| 10.87* |
2005 Stock Incentive Plan. | (42) | ||
| 10.88* |
Deferred Compensation Plan. | (42) | ||
| 10.89 |
Credit Agreement by and among the Company, the Lenders party thereto, and KeyBank National Association, as Administrative Agent, dated March 30, 2006 (the “2006 Credit Agreement”). | (44) | ||
| 10.91* |
Management Retention Agreement, dated May 26, 2006 between the Company and L. George Klaus. | (45) | ||
| 10.92* |
Form of Notice of Restricted Stock Award and Restricted Stock Purchase Agreement. | (45) | ||
| 10.93* |
Amended Management Retention Agreement, dated March 1, 2007, between the Company and L. George Klaus. | (48) | ||
| 10.94 |
First Amendment to the 2006 Credit Agreement, dated as of May 1, 2007, among the Company, the Lenders party thereto, and KeyBank National Association, as Administrative Agent. | (46) | ||
| 10.95* |
Amended and Restated 2007 Stock Incentive Plan (the “2007 Plan”). | (5) | ||
| 10.96* |
Form of Time-Based Restricted Stock Agreement under the 2007 Plan. | (49) | ||
| 10.97* |
Form of Performance-Based Restricted Stock Agreement under the 2007 Plan. | (49) | ||
| 10.98 |
Implementation Agreement between NSB Retail Systems Plc and the Company, dated December 17, 2007. | (50) | ||
| 10.99 |
Recommended Proposals for the Cash Acquisition of NSB Retail Systems Plc by the Company, dated December 17, 2007. | (50) | ||
| 10.100 |
Credit Agreement dated December 16, 2007 by and among the Company, the Guarantors identified therein, the Lenders identified therein and Bank of America, N.A., as Administrative Agent (the “2007 Credit Agreement”). | (51) | ||
| 10.101 |
Security and Pledge Agreement dated December 16, 2007 by and between the Company, the Obligors identified therein and Bank of America, N.A., as Administrative Agent. | (51) | ||
| 10.102 |
First Amendment to the 2007 Credit Agreement, dated February 11, 2008, by and among the Company, the Guarantors identified therein, the Lenders identified therein and Bank of America, N.A., as Administrative Agent. | (51) | ||
| 10.103 |
Notice of Increase of Aggregate Revolving Commitment, dated February 11, 2008, pursuant to 2007 Credit Agreement. | (51) | ||
| 10.104* |
Management Retention Agreement between the Company and Thomas Kelly, dated February 19, 2008. | (52) | ||
| 10.105* |
Letter Agreement between the Company and Mark Duffell, dated February 19, 2008. | (52) | ||
| 10.106 |
Second Amendment dated April 11, 2008, to the 2007 Credit Agreement, by and among the Company, the Guarantors identified therein, the Lenders identified therein and Bank of America, N.A., as Administrative Agent. | (36) | ||
| 10.107* |
Form of Stock Option Agreement under the 2007 Plan. | (5) | ||
| 10.108 |
Third Amendment dated December 30, 2008, to the 2007 Credit Agreement, by and among the Company, the Guarantors identified therein, the Lenders identified therein and Bank of America, N.A., as Administrative Agent. | (53) | ||
| 10.109* |
Management Retention Agreement between the Company and L. George Klaus, dated January 19, 2009. | (56) | ||
| 10.110 |
Agreement, dated as of February 24, 2009, by and among the Company and Elliott Associates, L.P., and its wholly-owned subsidiaries, Elliott International, L.P. and Elliott International Capital Advisers Inc. | (57) | ||
105
Table of Contents
| 10.111* |
Management Retention Agreement between the Company and Michael Pietrini, dated April 15, 2009. | (58) | ||
| 10.112* |
Letter Agreement between the Company and Thomas F. Kelly dated February 24, 2009. | (59) | ||
| 10.113 |
Fourth Amendment dated September 30, 2009, to the 2007 Credit Agreement, by and among the Company, the Guarantors identified therein, the Lenders identified therein and Bank of America, N.A., as Administrative Agent. | (60) | ||
| 12.1 |
Computation of Ratio of Earnings to Fixed Charges. | |||
| 21.1 |
Subsidiaries of the Company | |||
| 23.1 |
Consent of Independent Registered Public Accounting Firm – McGladrey & Pullen LLP. | |||
| 31.1 |
Certification by Chief Executive Officer Pursuant to Section 302 of the Sarbanes-Oxley Act of 2002. | |||
| 31.2 |
Certification by Chief Financial Officer Pursuant to Section 302 of the Sarbanes-Oxley Act of 2002. | |||
| 32.1 |
Certification by the Chief Executive Officer and Chief Financial Officer pursuant to 18 U.S.C. Section 1350, as adopted pursuant to Section 906 of the Sarbanes-Oxley Act of 2002. | |||
| * | Management contract or compensatory plan or arrangement. |
| (1) | Incorporated by reference to the Company’s Registration Statement on Form S-1, Reg. No. 33-57294. |
| (2) | Incorporated by reference to the Company’s Registration Statement on Form S-1, Reg. No. 33-51566. |
| (3) | Incorporated by reference to the Company’s Annual Report on Form 10-K for the year ended June 30, 1993. |
| (4) | Incorporated by reference to the Company’s Registration Statement on Form 8-A, dated April 14, 1994. |
| (5) | Incorporated by reference to the Company’s Current Report on Form 8-K filed on June 10, 2009. |
| (6) | Incorporated by reference to the Company’s Annual Report on Form 10-K for the year ended June 30, 1995. |
| (7) | Incorporated by reference to the Company’s Quarterly Report on Form 10-Q for the quarter ended March 31, 1996. |
| (8) | Incorporated by reference to the Company’s Annual Report on Form 10-K for the year ended June 30, 1997. |
| (9) | Incorporated by reference to the Company’s Current Report on Form 8-K filed on July 11, 1997. |
| (10) | Incorporated by reference to the Company’s Quarterly Report on Form 10-Q for the quarter ended December 31, 1996. |
| (11) | Incorporated by reference to the Company’s Current Report on Form 8-K filed on November 26, 1997. |
| (12) | Incorporated by reference to the Company’s Quarterly Report on Form 10-Q for the quarter ended September 30, 1997. |
| (13) | Incorporated by reference to the Company’s Annual Report on Form 10-K for the year ended December 31, 2004. |
| (14) | Incorporated by reference to the DataWorks Schedule 13D and Schedule 13D/A filed on October 23, 1998 and November 6, 1998, respectively. |
| (15) | Incorporated by reference to the Company’s Annual Report on Form 10-K for the year ended June 30, 1998. |
| (16) | Incorporated by reference to the DataWorks Registration Statement on Form S B-2 (No. 33-97022LA) or amendments thereto. |
106
Table of Contents
| (17) | Incorporated by reference to the Company’s Current Report on Form 8-K dated February 18, 2003. |
| (18) | Incorporated by reference to the DataWorks Annual Report on Form 10-K for the year ended December 31, 1996. |
| (19) | Incorporated by reference to the Interactive Group, Inc. Annual Report on Form 10-K for the year ended December 31, 1996. |
| (20) | Incorporated by reference to the Interactive Group, Inc. Registration Statement on Form S-1, Registration No. 33-90816. |
| (21) | Incorporated by reference to the Interactive Group, Inc. Registration Statement on Form S-8, Registration No. 333-30259. |
| (22) | Incorporated by reference to the Company’s Quarterly Report on Form 10-Q for the quarter ended September 30, 2004. |
| (23) | Incorporated by reference to the Company’s Annual Transition Report on Form 10-KT for the period ended December 31, 1998. |
| (24) | Incorporated by reference to the Company’s Registration Statement on Form S-8, Registration No. 333-85105. |
| (25) | Incorporated by reference to the Company’s Registration Statement on Form S-8, Registration No. 333-107738. |
| (26) | Incorporated by reference to the Company’s Quarterly Report on Form 10-Q for the quarter ended June 30, 1999. |
| (27) | Incorporated by reference to the Company’s Quarterly Report on Form 10-Q for the quarter ended September 30, 2000. |
| (28) | Incorporated by reference to the Company’s Annual Report on Form 10-K for the year ended December 31, 2000. |
| (29) | Incorporated by reference to the Company’s Quarterly Report on Form 10-Q for the quarter ended March 31, 1999. |
| (30) | Incorporated by reference to the Company’s Quarterly Report on Form 10-Q for the quarter ended June 30, 2001. |
| (31) | Incorporated by reference to the Company’s Annual Report on Form 10-K for the year ended June 30, 1994. |
| (32) | Incorporated by reference to the Company’s Annual Report on Form 10-K for the year ended December 31, 2001. |
| (33) | Incorporated by to the Company’s Quarterly Report on Form 10-Q for the quarter ended June 30, 2002. |
| (34) | Omitted. |
| (35) | Incorporated by reference to the Company’s Registration Statement on Form S-8, Registration No. 333-97063. |
| (36) | Incorporated by reference to the Company’s Quarterly Report on Form 10-Q for the quarter ended March 31, 2008. |
| (37) | Incorporated by reference to the Company’s Annual Report on Form 10-K for the year ended December 31, 1999. |
| (38) | Incorporated by reference to the Company’s Quarterly Report on Form 10-Q for the quarter ended March 31, 2007. |
107
Table of Contents
| (39) | Incorporated by reference to the Company’s Quarterly Report on Form 10-Q for the quarter ended June 30, 2003. |
| (40) | Incorporated by reference to the Company’s Annual Report on Form 10-K for the year ended December 31, 2003. |
| (41) | Incorporated by reference to the Company’s Current Report on Form 8-K filed on April 4, 2005. |
| (42) | Incorporated by reference to the Company’s Registration Statement on Form S-8, Registration No. 333-127163. |
| (43) | Incorporated by reference to the Company’s Current Report on Form 8-K filed on December 12, 2005. |
| (44) | Incorporated by reference to the Company’s Quarterly Report on Form 10-Q for the quarter ended March 31, 2006. |
| (45) | Incorporated by reference to the Company’s Quarterly Report on Form 10-Q for the quarter ended June 30, 2006. |
| (46) | Incorporated by reference to the Company’s Current Report on Form 8-K/A filed on May 8, 2007. |
| (47) | Incorporated by reference to the Company’s Current Report on Form 8-K filed on May 14, 2007. |
| (48) | Incorporated by reference to the Company’s Quarterly Report on Form 10-Q for the quarter ended March 31, 2007. |
| (49) | Incorporated by reference to the Company’s Registration Statement on Form S-8, Registration No. 333-143820. |
| (50) | Incorporated by reference to the Company’s Current Report on Form 8-K filed on February 13, 2008. |
| (51) | Incorporated by reference to the Company’s Current Report on Form 10-K for the year ended December 31, 2007. |
| (52) | Incorporated by reference to the Company’s Current Report on Form 8-K filed on February 22, 2008. |
| (53) | Incorporated by reference to the Company’s Registration Statement on Form 8-A/A, filed on November 1, 2004. |
| (54) | Incorporated by reference to the Company’s Registration Statement on Form 8-A/A, filed on March 2, 2009. |
| (55) | Incorporated by reference to the Company’s Current Report on Form 8-K filed on January 5, 2009. |
| (56) | Incorporated by reference to the Company’s Current Report on Form 8-K filed on February 6, 2009. |
| (57) | Incorporated by reference to the Company’s Current Report on Form 8-K filed on March 2, 2009. |
| (58) | Incorporated by reference to the Company’s Current Report on Form 8-K filed on April 21, 2009. |
| (59) | Incorporated by reference to the Company’s Quarterly Report on Form 10-Q for the quarter ended March 31, 2009. |
| (60) | Incorporated by reference to the Company’s Current Report on Form 8-K filed on October 6, 2009. |
Epicor, e by Epicor, Enterprise, Vantage, Avanté, Vista, Clientele, Scala, iScala, NSB and CRS are trademarks or registered trademarks of the Company and may be mentioned in the foregoing Annual Report on Form 10-K. Platinum is a registered trademark of Computer Associates International, Inc. All other product names are trademarks or registered trademarks of their respective companies and are acknowledged.
108
Table of Contents
SIGNATURES
Pursuant to the requirements of Section 13 or 15(d) of the Securities Exchange Act of 1934, the Registrant has duly caused this report to be signed on its behalf by the undersigned thereunto duly authorized, in the City of Irvine, State of California, on March 12, 2010.
| EPICOR SOFTWARE CORPORATION | ||
| By: | /s/ L. George Klaus | |
| L. George Klaus | ||
| Chairman, President and Chief Executive Officer (Principal Executive Officer) | ||
| By: | /s/ Michael Pietrini | |
| Michael Pietrini | ||
| Chief Financial Officer, Executive Vice President Finance and Administration (Principal Financial Officer) | ||
| By: | /s/ Russell Clark | |
| Russell Clark | ||
| Sr. Vice President, Finance (Principal Accounting Officer) | ||
POWER OF ATTORNEY
We, the undersigned directors and officers of Epicor Software Corporation, do hereby constitute and appoint L. George Klaus our true and lawful attorney and agent, with full power of substitution to do any and all acts and things in our name and behalf in our capacities as directors and officers and to execute any and all instruments for us and in our names in the capacities indicated below, which said attorney and agent may deem necessary or advisable to enable said corporation to comply with the Securities Exchange Act of 1934, as amended, and any rules, regulations and requirements of the Securities and Exchange Commission, in connection with this Annual Report on Form 10-K, including specifically but without limitation, power and authority to sign for us or any of us in our names in the capacities indicated below, any and all amendments (including post-effective amendments) hereto; and we do hereby ratify and confirm all that said attorney and agent, shall do or cause to be done by virtue hereof.
Pursuant to the requirements of the Securities Exchange Act of 1934, this report has been signed below by the following persons on behalf of the Registrant and in the capacities and on the dates indicated.
| Signature |
Title |
Date | ||
| /s/ L. George Klaus |
Chairman, President and Chief Executive Officer | March 12, 2010 | ||
| L. George Klaus | (Principal Executive Officer) | |||
| /s/ Robert H. Smith |
Director | March 12, 2010 | ||
| Robert H. Smith | ||||
| /s/ Michael Kelly |
Director | March 12, 2010 | ||
| Michael Kelly | ||||
| /s/ Michael Hackworth |
Director | March 12, 2010 | ||
| Michael Hackworth | ||||
| /s/ Richard H. Pickup |
Director | March 12, 2010 | ||
| Richard H. Pickup | ||||
| /s/ John M. Dillon |
Director | March 12, 2010 | ||
| John M. Dillon | ||||
| /s/ James Richardson |
Director | March 12, 2010 | ||
| James Richardson | ||||
| /s/ W. Douglas Hajjar |
Director | March 12, 2010 | ||
| W. Douglas Hajjar | ||||
109