Attached files
| file | filename |
|---|---|
| EX-31.01 - EXHIBIT 31.01 - Double-Take Software, Inc. | ex31-01.htm |
| EX-32.01 - EXHIBIT 32.01 - Double-Take Software, Inc. | ex32-01.htm |
| EX-31.01 - EXHIBIT 31.02 - Double-Take Software, Inc. | ex31-02.htm |
| EX-21.01 - EXHIBIT 21.01 - Double-Take Software, Inc. | ex21-01.htm |
| EX-23.01 - EXHIBIT 23.01 - Double-Take Software, Inc. | ex23-01.htm |
| EX-10.46 - EXHIBIT 10.46 - Double-Take Software, Inc. | ex10-46.htm |
UNITED STATES SECURITIES AND EXCHANGE COMMISSION
Washington, D.C. 20549
Form 10-K
ANNUAL REPORT
PURSUANT TO SECTIONS 13 OR 15(d)
OF THE SECURITIES EXCHANGE ACT OF 1934
|
(Mark One)
|
||
|
þ
|
ANNUAL REPORT PURSUANT TO SECTION 13 OR 15(d) OF THE SECURITIES EXCHANGE ACT OF 1934
|
|
|
For the fiscal year ended December 31, 2009
|
||
|
OR
|
||
|
o
|
TRANSITION REPORT PURSUANT TO SECTION 13 OR 15(d) OF THE SECURITIES EXCHANGE ACT OF 1934
|
|
|
For the transition period from to
|
||
Commission file number: 001-33184
Double-Take Software, Inc.
(Exact name of registrant as specified in its charter)
|
Delaware
|
20-0230046
|
|
|
(State or other jurisdiction of
|
(I.R.S. Employer
|
|
|
Incorporation or organization)
|
Identification No.)
|
|
|
257 Turnpike Road, Suite 210
|
01772
|
|
|
Southborough, Massachusetts
|
(Zip Code)
|
|
|
(Address of principal executive offices)
|
(877) 335-5674
(Registrant’s telephone number, including area code)
Securities registered pursuant to Section 12(b) of the Act:
|
Title of Each Class
|
Name of Each Exchange on Which Registered
|
|
|
Common Stock, $0.001 par value
|
The NASDAQ Stock Exchange
|
Securities registered pursuant to Section 12(g) of the Act: None
Indicate by check mark if the registrant is a well-known seasoned issuer, as defined in Rule 405 of the Securities Act. YES o NO þ
Indicate by check mark if the registrant is not required to file reports pursuant to Section 13 or Section 15(d) of the Act. YES o NO þ
Indicate by check mark whether the registrant: (1) has filed all reports required to be filed by Section 13 or 15(d) of the Securities Exchange Act of 1934 during the preceding 12 months (or for such shorter period that the registrant was required to file such reports), and (2) has been subject to such filing requirements for the past 90 days. YES þ NO o
Indicate by check mark whether the registrant has submitted electronically and posted on its corporate Web site, if any, every Interactive Data File required to be submitted and posted pursuant to Rule 405 of Regulation S-T during the preceding 12 months (or for such shorter period that the registrant was required to submit and post such files). YES o NO o
Indicate by check mark if disclosure of delinquent filers pursuant to Item 405 of Regulation S-K is not contained herein, and will not be contained, to the best of registrant’s knowledge, in definitive proxy or information statements incorporated by reference in Part III of this Form 10-K or any amendment to this Form 10-K. þ
Indicate by check mark whether the registrant is a large accelerated filer, an accelerated filer, a non-accelerated filer, or a smaller reporting company. See the definitions of “large accelerated filer,” “accelerated filer” and “smaller reporting company” in Rule 12b-2 of the Exchange Act. (Check one):
|
Large accelerated filer o
|
Accelerated filer þ
|
Non-accelerated filer o
(Do not check if a smaller reporting company)
|
Smaller reporting Company o
|
Indicate by check mark whether the registrant is a shell company (as defined in Rule 12b-2 of the Exchange Act) YES o NO þ
As of June 30, 2009, the last business day of the Registrant’s most recently completed second fiscal quarter, the aggregate market value of the Registrant’s Common Stock held by nonaffiliates was approximately $190.8 million.
The number of shares of Registrant’s Common Stock outstanding as of February 26, 2010 was 21,493,422.
DOCUMENTS INCORPORATED BY REFERENCE
Part III of this Form 10-K incorporates by reference certain portions of the Registrant’s proxy statement for its 2010 Annual Meeting of Shareholders to be filed with the Commission not later than 120 days after the end of the fiscal year covered by this report.
Statements contained in this Form 10-K that are not historical facts may be forward-looking statements within the meaning of Section 21E of the Securities Exchange Act of 1934 (the “Exchange Act”). We intend such forward-looking statements to be covered by the safe harbor provisions for forward-looking statements contained in Section 21E of the Exchange Act. Readers are cautioned not to place undue reliance on these forward-looking statements, which speak only as of the date this Form 10-K is filed with the Securities and Exchange Commission (“SEC”).
We may, in some cases, use words such as “project,” “believe,” “anticipate,” “plan,” “expect,” “estimate,” “intend,” “should,” “would,” “could,” “potentially,” “will,” or “may,” or other words that convey uncertainty of future events or outcomes to identify these forward-looking statements. Forward-looking statements in this annual report include statements about:
|
•
|
competition and competitive factors in the markets in which we operate;
|
|
|
•
|
the impact of macro-economic trends on our business;
|
|
|
•
|
demand for our software;
|
|
|
•
|
our ability to transition to a broader focus on software to move, protect and recover workloads;
|
|
|
•
|
the advantages of our technology as compared to others;
|
|
|
•
|
changes in customer preferences and our ability to adapt our product and services offerings;
|
|
|
•
|
our ability to obtain and maintain distribution partners and the terms of these arrangements;
|
|
|
•
|
our plans for future product development;
|
|
|
•
|
the integration of emBoot, Inc. (“emBoot”) and its products into our business;
|
|
|
•
|
our ability to develop and maintain positive relationships with our customers;
|
|
|
•
|
our ability to maintain and establish intellectual property rights;
|
|
|
•
|
our ability to retain and hire necessary employees and appropriately staff our development, marketing, sales and distribution efforts;
|
|
|
•
|
our ability to scale our support efforts;
|
|
|
•
|
our cash needs and expectations regarding cash flow from operations;
|
|
|
•
|
our ability to manage and grow our business and execution of our business strategy;
|
|
|
•
|
our expectations for future revenue; and
|
|
|
•
|
our financial performance.
|
|
The forward-looking statements are based on our beliefs, assumptions and expectations of our future performance, taking into account all information currently available to us. These beliefs, assumptions and expectations can change as a result of many possible events or factors, not all of which are known to us or are within our control. If a change occurs, our business, financial condition and results of operations may vary materially from those expressed in our forward-looking statements. There are a number of important factors that could cause actual results to differ materially from the results anticipated by these forward-looking statements. These important factors include those that we discuss in “Risk Factors,” Management’s Discussion and Analysis of Financial Condition and Results of Operations,” Business and elsewhere in this annual report. You should read these factors and the other cautionary statements made in this annual report as being applicable to all related forward-looking statements wherever they appear in this annual report. If one or more of these factors materialize, or if any underlying assumptions prove incorrect, our actual results, performance or achievements may vary materially from any future results, performance or achievements expressed or implied by these forward-looking statements. We undertake no obligation to publicly update any forward-looking statements, whether as a result of new information, future events or otherwise, except as required by law.
PART I
|
Business.
|
Overview
Double-Take Software develops, sells and supports affordable software that allows IT organizations of all sizes to move, manage, protect and recover workloads across any distance and any combination of physical and virtual server environments. As enterprise IT systems evolve the ability to manage information freely, intelligently and securely becomes critical. Our hardware- and application-independent software benefits these infrastructures by efficiently protecting, moving and recovering data created by any application on almost any type or brand of disk storage on any brand of server running on Microsoft Windows operating systems as well many versions of the Linux operating system. Our newly released Double-Take Cloud product extends these benefits to a broader range of customers by allowing them to provision off-site disaster recovery resources easily in a cost-effective manner. In addition our Double-Take Flex technology offers an alternative to Virtual Desktop Infrastructure, making desktop administration and provisioning easy, and reducing drastically the desktop total cost of ownership. Double-Take Flex enables multiple desktops to run from a centralized shared image stored on any iSCSI storage.
We believe that we are the leading supplier of replication software for Microsoft server environments and that our business is distinguished by our focus on software license and recurring maintenance sales, our productive distribution network and our efficient services infrastructure.
Our success has been driven in large part by our flagship “Double-Take” software technology, which was first released in 1995 and has been enhanced by years of customer feedback and is now called Double-Take Availability. Double-Take Availability, among other things, continuously replicates software and data changes made on a primary operating server to a duplicate server at a different location. Because the duplicate server can commence operating in place of the primary server at almost any time, Double-Take Availability facilitates rapid failover and application recovery in the event of a disaster or other service interruption. During 2009, in addition to Double-Take Availability, we integrated our software offerings under the Double-Take brand by releasing Double-Take Backup, which includes the TimeData, Livewire and Cargo products, Double-Take Flex, which includes the emBoot products and enables multiple desktops to run from a centralized shared image stored on any iSCSI storage, and Double-Take Move, which includes our migration product.
The disaster recovery market has been our primary historical focus, but as a result of acquisitions and internal development, we are expanding into adjacent markets for system migrations, back-up and network booting. With our acquisition of TimeSpring Software Corporation in December 2007, now known as Double-Take Canada, and its TimeData products, now included in Double-Take Backup, we can also recover data from almost any point in time from a repository located on- or off-site. In July 2008, we acquired emBoot, Inc. which is now a part of Double-Take Canada, and which specializes in network booting technology. The technology acquired with emBoot, now included in Double-Take Flex, allows organizations to easily assign and re-assign computing workloads to any available Windows or Linux physical servers or desktops or any virtual machine in their environment. IT organizations can now move those workloads around in a matter of minutes, whether because a disaster has occurred, a data center is moving, the company has decided to virtualize its infrastructure or an application needs more capacity. Double-Take Move, released in April 2009, is a server migration product that can migrate live server workloads across physical and virtual platforms.
We sell our software through multiple channels, including a global distribution network that is supported by an experienced direct sales force. Our distribution partners include leading server manufacturers, such as Dell Computer Corporation and Hewlett-Packard Company, leading distributors, such as Bell Microproducts Inc. and Tech Data Corporation, and over 900 value-added resellers that we believe are generally well-connected with small- and medium-sized enterprises. Our direct sales force augments the revenue generated by our distribution partners and actively supports them in their third-party sales efforts. We have also begun to make some of our products available via on-line purchase, including Double-Take Move and Double-Take Cloud.
Our broad distribution network, coupled with affordable price points, feature-rich proven software, modest implementation costs and dependable support, makes our software accessible and scalable from small enterprises of 20 people to Fortune 500 companies. As of December 31, 2009, our customer base of about 22,000 organizations includes a large number of law firms, financial institutions, hospitals, school districts and government entities. We believe that we have a highly satisfied customer base. Many of our customers provide references that help us to generate new sales opportunities and to shorten sales cycles. Our sales personnel often enlist the assistance of satisfied customers to recommend our software to potential customers in similar industries or that have similar applications or server configurations. The breadth and diversity of our customers frequently allows us to refer to a similar configuration when making a new sale. The satisfaction of our customer base also contributes to reduced support costs.
We expect that future growth in our market will be driven by a number of factors, including the following:
|
•
|
an increased focus on protecting a growing number of business-critical applications, such as email applications, particularly in service-oriented industries;
|
|
|
•
|
a heightened awareness of the potential for natural and man-made disasters;
|
|
|
•
|
a need to move information rapidly within an IT infrastructure for efficiency, virtualization, data center changes, hardware and software upgrades;
|
|
|
•
|
the rapid growth in digital data, driven by increased usage of automated systems;
|
|
|
•
|
the increased acceptance of and reliance on cloud computing for reducing the cost and complexity of managing IT systems;
|
|
|
•
|
government and industry regulations, such as the Health Insurance Portability and Accountability Act of 1996 and the Sarbanes-Oxley Act of 2002, which require data protection and recovery; and
|
|
|
•
|
general improvement of global economic conditions and related increases in information technology spending.
|
|
The matters discussed in this “Business” section should be read in conjunction with the Consolidated Financial Statements found under Item 8 of Part II of this annual report, which include additional financial information about our total assets, revenue and measures of profits and loss and financial information about geographic areas.
Organization; Principal Executive Offices
We were organized as a New Jersey corporation in 1991, and we reincorporated in Delaware in 2003. In July 2006 we changed our name to Double-Take Software, Inc. from NSI Software, Inc. Our principal executive offices are located at 257 Turnpike Road, Suite 210, Southborough, Massachusetts 01772, and our main telephone number at that address is (877) 335-5674. We maintain our general corporate website at www.doubletake.com. The contents of our website, however, are not a part of this annual report.
Our Strategy
Our goal is to provide affordable software that will enable our customers to move, manage, protect and recover workloads across any distance and any combination of physical and virtual server environments. We are also continuing to build on our historical goal of reducing our customers’ downtime for business-critical systems to as close to zero as possible and offering effective protection and recovery for less critical systems. We are pursuing the following key initiatives:
|
•
|
Continue to Innovate. We plan to continue to focus on enhancing our existing software and to develop new, innovative software, in line with our shift from our historical offerings of products focused on the disaster recovery market to our current offerings of products that help customers protect, recover, move their business critical workloads, and provision desktops. For example, in 2007 we introduced new software products and features that protect the full system state of a server, including operating system and application configuration, in 2008 we introduced new software products to provision virtual machines and in 2010 we introduced Double-Take Cloud which is a real-time recovery platform. We believe that software innovations will also help us to expand our addressable market, and we have software in the development pipeline that we expect will help us to scale up to serve larger entities and to scale down to serve even smaller enterprises.
|
|
|
•
|
Expand our Customer Base within our Current Markets. We plan to gain additional customers in the markets we currently serve by expanding our distribution network to reach more customers and by leveraging our existing customer base. We believe our customers are very satisfied and will continue to provide references across multiple industries, multiple configurations and multiple applications. In addition, we plan to continue to offer enhancements to our current software to broaden its appeal. For example, our Double-Take Cloud product (launched in February 2010), provides cost-effective off-site protection and recovery for customers who in the past may not have been able to afford a disaster recovery solution.
|
|
•
|
Cross-sell Existing and New Software to our Customer Base. We plan to sell software for additional applications to our current customers and believe that many of our existing customers will acquire more licenses to the software that they are already using. We also believe that a large number of our customers will renew maintenance in the future because of their need for product upgrades and customer support. We plan to offer new software that complements our existing software and applications and achieves additional customer objectives. We expect that our new offerings will be developed internally, or we may in some instances hire third-party developers to develop software on our behalf or acquire new offerings through strategic transactions. For example, in December 2007 we acquired Montreal-based TimeSpring Software, and in July of 2008 we acquired Toronto based emBoot, now both known as Double-Take Software Canada. Through these acquisitions we obtained elements of our Double-Take Backup and our Double-Take Flex product offerings.
|
|
•
|
Enter New Markets. We plan to enter into new markets and grow our presence in markets where we currently have a small presence. We expect to do this through expansion of our channel by creating or expanding relationships with partners that serve different markets. We also plan to continue to grow our presence in the larger enterprise market by leveraging our supportive customer base. We believe that small- and medium-sized enterprises frequently lead in the adoption of cost effective technology solutions out of necessity and that large institutions follow by replacing more expensive solutions with cost effective solutions. We have seen organizations in the larger enterprise market adopt our software, and we expect this trend to continue. We have developed and acquired new products that we believe will allow us to enter new markets. For example, Double-Take Backup, which includes the combination of our Livewire product (released in late 2008), our Timedata product and our Cargo tiered recovery product, allows us to compete more effectively in the backup market.
|
|
|
•
|
Expand Globally. We believe that the market potential outside the United States is at least as large as the market within and offers us significant growth potential. We plan to extend our global reach though the expansion of our direct and channel sales efforts and through strategic acquisitions. For example, in May 2006 we acquired our main European distributor, now known as Double-Take Software S.A.S., or Double-Take EMEA, with offices in France, the United Kingdom and Germany. We also work closely with Hewlett-Packard, which has a strong international presence and is our largest OEM, and we plan to continue our increased focus and sales support on international sales. In August 2006, we established a full time presence in Asia and now have a presence in Singapore and China, including Hong Kong and Shanghai. Additionally, we opened an office in Dubai, United Arab Emirates in the fourth quarter of 2008.
|
|
|
•
|
Expand our Distribution Capabilities. We will make our products easier to buy and more accessible to both our end users and trusted partners. This will allow us to expand the reach of our sales force in a cost-effective way. For example, our Double-Take Move product (released in March 2009), and our Double-Take Cloud product (released in February 2010) are both available for on-line purchase.
|
|
Our Software and Services
In 2008 and 2009, all of our software revenue came from sales of our software applications, compared to 98% of our total software revenue in 2007. Similarly, we derive substantially all of our maintenance and professional services revenue from associated maintenance and customer support of our applications. During 2009, in addition to Double-Take Availability, we integrated our software offerings under the Double-Take brand by releasing Double-Take Backup which includes the TimeData, Livewire and Cargo products, Double-Take Flex, which includes the emBoot products and enables multiple desktops to run from a centralized shared image stored on any iSCSI storage, and Double-Take Move, which includes our migration product.
Our product offerings are:
Double-Take Availability. Our flagship software provides continuous protection of data to reduce or eliminate data loss, as well as the ability to recover rapidly the application and server needed to utilize that data through automatic or manually initiated failover. This combination of data protection with high availability failover provides significantly higher levels of availability than solutions that address only data protection or that provide local failover clustering but that do not provide data redundancy or protection across multiple locations.
Double-Take Availability is easily installed on each protected “source” server as well as on each “target” server that will store copies of the protected data and be prepared to take over for the protected server and its applications. This software-based approach provides several important features and benefits:
|
•
|
Real-time Byte Level Change Capture. Our file system filtering technology monitors all file input and output (I/O) to files selected for protection and captures changes as they occur, without the overhead of additional disk reads to compare file content. This approach captures only the bytes written to the file system, rather than full files or disk blocks, and allows Double-Take Availability to replicate any application data, including open files such as databases, messaging systems or other transactional applications. As a result, data can be protected continuously with very little system impact or overhead.
|
|
|
•
|
Storage Architecture Independence. Double-Take Availability can replicate to or from almost any storage type supported by the host operating system. Not only can replication occur between storage types such as Fibre Channel or iSCSI Storage Area Networks and directly attached disks, but source and target disks that have completely different geometries or multiple source volumes can be consolidated onto a single large capacity target volume. As a result, customers can use their existing storage systems and even replicate between storage systems of different types. Only solutions that run along with the applications and replicate logical file system structures can provide this level of flexibility and performance.
|
|
|
•
|
Integrated Application and Server Availability. Software replicating between servers can easily monitor and failover other functions such as server name, IP addresses or integrated applications between servers. As a result, not only is data protected, but the operating system and applications that use that data to provide services to users can be replicated and activated quickly and automatically, even on different hardware or virtual servers. Double-Take provides application managers for a variety of the business-critical applications that companies rely on to run their businesses.
|
|
|
•
|
Standards-Based IP Networking Support. Double-Take Availability utilizes standard IP networking for data replication, monitoring and failover, allowing data to be protected and servers to be managed remotely over great distances. In addition to capturing the smallest byte level changes possible, our software is optimized for long-distance, wide-area network communications providing built-in data compression and flow control capabilities, as well as leveraging advanced functionality such as encryption, wide area network optimizations and quality of service controls provided by existing IP infrastructure.
|
|
Double-Take Availability Features and Benefits
|
Feature
|
Description
|
Customer Benefit
|
||
|
Continuous, Real-time Data Replication
|
File system changes are captured as they are made on the source server(s) and transmitted immediately according to system policies.
|
Potential for data loss is reduced and sometimes eliminated.
|
||
|
Delta File Replication
|
Only file changes or “deltas” are captured and transmitted across the network.
|
The amount of network bandwidth required to keep a secondary copy of data synchronized is minimized, and data can be replicated to a remote target server across any IP connection.
|
||
|
Replicates Open Files
|
Even open files can be mirrored and changes replicated almost immediately.
|
Applications can be protected while they are in use providing increased availability and reducing potential for data loss.
|
||
|
Many to One Replication
|
Data from many source servers may be replicated to a single target server.
|
Shares the cost of a target server among many source machines, and allows centralized data protection.
|
||
|
Automatic Failover
|
Can stand in for multiple servers simultaneously; the target server assumes the IP addresses and names of failed servers and restarts applications.
|
Users can automatically access data on the target server, reducing down-time associated with a source (production) server failure.
|
||
|
Hardware Independent Failover and Recovery
|
Failover and recovery of entire systems can be done between dissimilar hardware.
|
Enables flexible failover and recovery, without the need for similar hardware.
|
||
|
Virtual Server Provisioning
|
Can automatically provision virtual machines on popular virtualization platforms, for the purpose of failover, recovery and migration.
|
Allows users to easily leverage virtualization for high availability and disaster recovery purposes. Also allows users to migrate from physical to virtual platforms in real-time, with minimal downtime.
|
||
|
Virtual Server Protection
|
Allows protection of entire virtual machines on various platforms, regardless of the guest operating system.
|
Allows users to easily leverage virtualization for high availability and disaster recovery purposes. Also allows users to migrate from physical to virtual platforms in real-time, with minimal downtime.
|
|
System State Recovery
|
Replicates changes, such as patches to operating systems and applications.
|
Enables full server recovery to most recent state, including files, operating systems and applications.
|
||
|
File Selection
|
Users can define which files are to be replicated at a volume, directory, file and wildcard level. The location of data on the target can also be specified.
|
Allows exact control of which files are replicated and where they are stored for maximum flexibility.
|
||
|
Flow Control
|
Automatically queues transactions on the source server if network resources are not available or are restricted by policy.
|
Runs reliably in spite of network disruptions or peak loads, without severely affecting the performance of the source server.
|
||
|
Transmission Limiting
|
The amount of bandwidth available for replication, as well as start and stop conditions, may be defined by the network administrator.
|
Allows replication to share a network link with other applications, preserving bandwidth for other applications.
|
||
|
Data Compression
|
Data transmitted between the source and target may be compressed, using various industry-standard algorithms.
|
Allows user to minimize the amount of network bandwidth used to protect data, especially in wide area network configurations.
|
||
|
Centralized Enterprise Management
|
A graphical management interface is provided which can be run from anywhere on the network and allows the user to control all of the servers running our software in their environment.
|
Allows user to monitor a large number of servers running our software from a single central location, minimizing management costs.
|
||
|
Geographically dispersed clustering
|
An extension to Microsoft Clustering support which allows clusters to be extended to multiple geographic locations.
|
Provides remote clustering and the elimination of shared storage as a single point of failure within a cluster.
|
||
|
Extensive Reporting/ Verification
|
An extensive collection of events, alerts and statistics are made available through standard mechanisms, including SNMP, Log Files and Windows NT/ 2000 Event Viewer/ Performance Monitor.
|
Prevents silent failures by confirming that your data protection systems are working properly.
|
||
|
Application Awareness
|
Setup of protection for key applications such as Exchange, SQL, Share Point and Blackberry Enterprise Server are automated for the user.
|
Eases the process of configuring protection for critical application, and minimizes configuration errors.
|
Double-Take Backup. In December 2007, we completed the acquisition of TimeSpring Software Corporation, now Double-Take Canada, which was a Montreal-based software company with software that provided the ability to recover copies of protected data from any point-in-time. The product acquired was “TimeData”, which allows customers to recover from operational problems such as files or e-mails that were erroneously deleted, file corruption due to viruses or other malfunctions, or malicious attacks on data files. In the second quarter of 2008 we began to market this software under the Double-Take company name to our new and existing customers. In the fourth quarter of 2009 the TimeData product, our Livewire product and our Cargo tiered recovery product were included in the product offering we call Double-Take Backup.
Double-Take Backup Features and Benefits
|
Feature
|
Description
|
Customer Benefit
|
||
|
Continuous, Real-time Data Protection
|
File system changes are captured as they are made on the data server(s) and transmitted immediately according to system policies.
|
Potential for data loss is reduced and sometimes eliminated.
|
||
|
Delta File Replication
|
Only file changes or “deltas” are captured and transmitted across the network.
|
The amount of network bandwidth required to keep a secondary copy of data synchronized is minimized.
|
||
|
Replicates Open Files
|
Even open files can be mirrored and changes replicated almost immediately.
|
Applications can be protected while they are in use providing increased availability and reducing potential for data loss.
|
||
|
Many to One Replication
|
Data from many source servers may be replicated to a single target server.
|
Shares the cost of a target server among many source machines, and allows centralized data protection.
|
||
|
Any point-in-time Recovery
|
File changes are maintained in time sequence order, and can be replayed on the repository server to give the user a view of any file at any point-in-time.
|
Users can rollback to previous versions of files in the event of an operational error such as a deleted file, virus, or other file system error.
|
||
|
Consistency Points
|
Software detects when protected data is in a good state, and allows users to select those points in time when recovering data.
|
Allows user to easily recover to a point-in-time at which the protected data is in a known, good state.
|
||
Double-Take Flex. In July 2008, through Double-Take Canada, we completed the acquisition of emBoot Inc., a Toronto, Ontario -based software company. The technology acquired provides the ability to boot servers, workstations and virtual machines from iSCSI storage using standard Ethernet technologies. The software product acquired was netBoot/i which enables organizations to utilize their iSCSI based storage area networks, or SANs, by enabling IT administrators to affordably provision, centralize and maintain virtual desktop infrastructures that are secure and easy to manage.. In the first quarter of 2009, the emBoot product was included in the product offering Double-Take Flex.
Double-Take Flex Features and Benefits
|
Feature
|
Description
|
Customer Benefit
|
||
|
Hardware Independent
|
The same iSCSI OS boot image can be booted from any x86/64 systems, physical or virtual servers, and virtually any storage hardware.
|
There are fewer images to maintain, and it allows for the flexible use of infrastructure.
|
||
|
Enterprise Management Console
|
One console allows you to centrally and easily manage network boot configurations for machines throughout an enterprise. You can also easily browse the network and add new boot from SAN clients.
|
Managing operating system boot images is simpler and users have centralized administration and control of workloads and hardware infrastructure.
|
||
|
Rapid Provisioning
|
Client and iSCSI Target configurations can be cloned for rapid setup of similar client configurations.
|
Allows users to quickly re-purpose existing infrastructure and optimize workloads.
|
||
|
Shared Boot Images
|
Single boot images can be shared among multiple clients, in read-only
or read/write states.
|
Ensures standard environment, avoid storing duplicate boot image data.
|
||
|
Software-based iSCSI Target
|
Turns any Windows-based server into an iSCSI storage host.
|
Provides iSCSI storage and boot image storage using existing hardware. Minimizes cost and complexity to implement a Flex network-boot configuration.
|
||
Double-Take Move. This software product provides real-time data movement and hardware-independent conversion technology that make workloads simple for administrators to move – and minimizes the impact on user productivity. Operating systems, applications and data are easily moved from one make, model and server configuration to another. Because Double-Take Move is hardware independent, it can also be used for any combination of virtual or physical servers. Double-Take Move continuously captures byte-level changes to a server's OS, applications and data and replicates those changes to new physical or virtual hardware at any location, locally or globally. By moving only the bytes that change, the software uses the minimum bandwidth required.
Double-Take Move Features and Benefits
|
Feature
|
Description
|
Customer Benefit
|
||
|
Low-impact Migration
|
Mirrors data from the source machine to the new target, even if they are separated by a low-bandwidth WAN.
|
Data can be compressed for transmission and bandwidth usage can be defined to ensure quality of service during migration.
|
||
|
Push Install
|
The migration console pushes the product to the new server, if necessary.
|
Eliminates the need to have the software pre-installed on the new server thus saving time.
|
||
|
Seamless Switchover
|
Switching to the new server can be executed manually or set up to be fully automated.
|
Allows the user to choose the best switchover method for their system.
|
||
|
Support for Hyper-V and ESX Server
|
Virtualize servers to VMware ESX or Microsoft Hyper-V platforms and automatically provision new virtual machines as needed.
|
Allows users to easily convert physical machines to virtual machines; or to convert virtual machines from one format to another.
|
||
|
X2X Migration
|
The entire system can be migrated. Migration can happen from physical serer to virtual server or a virtual machine from one virtualization platform to another.
|
Allows flexibility for users.
|
||
Double-Take Cloud. Double-Take Cloud was released in February 2010 and leverages Amazon Elastic Compute Cloud (Amazon EC2), a product offered by Amazon Web Service, LLC, to create a real-time workload recovery platform. Double-Take Cloud uses Double-Take Software’s system state replication engine, allowing customers to recover their data, applications, and operating systems, and rapidly recover a workload into an automatically provisioned Amazon virtual machine.
Double-Take Cloud Features and Benefits
|
Feature
|
Description
|
Customer Benefit
|
||
|
Low Startup Costs
|
Customers can provision new image servers on the fly, without purchasing expense hardware or securing an off-site recovery location.
|
Customer does not have to incur large capital expenses to establish an effective off-site recovery plan.
|
||
|
Rapid Deployment
|
Protection and recovery of a production server can be completed within a matter of minutes from signing up for the service.
|
Customer can be up and running with off-site protection and recovery with extensive planning and investment.
|
||
|
Pay-as-you-go Resources
|
Customers pay for Double-Take and Amazon services on a monthly basis, and no long-term commitment is required.
|
Customer is not locked in to a long-term commitment, thereby reducing risk and cost.
|
||
|
Recover to the Cloud
|
Production servers can be recovered to the cloud so they can be accessed from anywhere in the event of a disaster.
|
Production servers can be recovered quickly, without copying recovery data from the cloud to a local production facility.
|
|
Local Recovery
|
Production servers can be recovered to their original location, as well as to other recovery facilities.
|
Customer has flexibility in where they recover their production data. After a site failure, they can resume running workloads in a local environment.
|
||
|
Unlimited Scalability
|
Additional repository servers and storage capacity can be added easily without infrastructure changes.
|
Customer does not have to buy excess capacity or infrastructure up front in order to account for future growth. As storage and compute requirements grow, the solution will scale with them.
|
||
|
Real-time System State Protection
|
The entire state of a production server is protected, including the operating system, applications and user data.
|
Customer can recover an entire production server easily, without going through the process of reloading and configuring applications, applying patches, etc…
|
||
|
Lower Management Costs
|
Ongoing costs such as power, cooling and general server management are significantly reduced.
|
Customer can focus IT management resources on other areas.
|
Software Editions. Our product offerings have the features and benefits that are described above and are offered in versions that are aligned to operating system capabilities. Additional versions of our product offerings include those that have been specifically crafted to run within virtual systems and to perform replication only. Some versions are also available from OEM partners under different brand names.
Customer Support Services. We provide comprehensive customer support, which we consider to be both a critical asset and a source of competitive advantage. We have developed our support organization to be a key differentiator for our company and our customers. Unlike the increasing number of software companies that seek to cut costs attributable to customer support, we have chosen to invest in the customer support experience and take pride in our personal interaction with our customers. We view our customer support function as a means to drive renewals, increase licenses with existing customers and acquire new customers. As part of our focus on customer support, we staff our front line support team with senior technicians with the goal of solving customer issues within the first call. We aim to provide an exceptional post-sales product experience for each customer. We believe this support effort will be scalable as our customer base continues to grow.
Product support is offered on an annual basis and can be either purchased in advance or at annual renewal points based on the date of initial software purchase. We have support centers in Bracknell, United Kingdom, Worcester, United Kingdom, and Indianapolis, Indiana. In addition to our support organization, primary product support for channel and OEM customers is sometimes provided directly by our partners, and we provide escalated engineering support for those partners when needed.
Deployment Services. We have a professional services organization to help our customers with deployments. These offerings give our customers access to our best-practices and knowledge of the surrounding infrastructure to ensure a clean implementation. However, we do not consider our professional services to be strategic to our overall direction, and we try to design and build our software with the idea that it should be simple to install and operate without the need for extensive training or associated services. For those clients that meet the scale and complexity requirements, our professional services offerings consist of assessment and design services and implementation and deployment services.
Training. We provide a series of training courses. Training is provided both on-site and off-site to fit the wide variety of needs of our customers and partners. The training courses include both instructor-led as well as computer-based class formats.
Our Customers
As of December 31, 2009, we had about 22,000 customers in a variety of industries, including a large number of law firms, financial institutions, hospitals, school districts and government entities. Our customers use our software for a variety of purposes in terms of the applications they protect and the configuration of their servers. Our customers deploy our software in installations ranging from two servers to several hundred servers.
Our Technology
The Double-Take Availability software is based on flexible and efficient file system replication technology and advanced server and application failover technology. Most server applications have not been designed to provide for data redundancy or application failover to a different server or a different geographic location. Consequently, we had to develop solutions outside of standard application frameworks, utilizing different approaches to ensure that business-critical applications can be moved and restarted in different locations in a way that is as fast and transparent to users as possible. Many years of experience across a large installed base have given us a mature base of data protection and availability technologies that we believe represent a significant competitive advantage.
The software’s functionality is built into the user-mode components (source and target) of the software, which remain largely consistent across operating systems. The driver component is responsible for intercepting file system modifications, determining if the modifications are selected for replication and passing this information to the source component. The driver has been optimized to produce high-throughput with minimal resource requirements and to minimize file system latency to the end user.
The source component packages these transactions and transmits them to one or more target machines. The source component queues transactions when the target server or network is either slow or unavailable and uses patented compression techniques to minimize the system overhead required for this queuing. The source component also controls transmission and initial mirroring, as well as verification, replication set maintenance and connection management.
File system transactions are transmitted to the target machine using standard networking mechanisms to provide high-throughput. The target component then receives replication transactions from the source component and applies these transactions to the target file system. The target component is multi-threaded to handle efficiently simultaneous transactions from multiple source servers to multiple target files. The target component also monitors the source server’s health and performs server failover (via name, network address and share/mount point aliasing) when the source is unavailable.
Our full server failover technology applies the system state from a protected system to the backup system during the failover process, allowing the backup system to take over the full identity of the protected system. This includes operating system and application configuration, which is maintained on the backup system in real-time as changes are made on the protected system. This failover process takes into account hardware differences between the protected and backup systems, and allows failover to occur even if the systems have different processors, network interface cards, memory, or other hardware.
Management of our software is supported through various client interfaces, including graphical interfaces, a COM based application programming interface (API), and a command-line interface. All client platforms are based on the same set of common application interface commands, and these functions are available to third-party developers. Our cluster capabilities combines our core replication technology with the application failover capabilities of Microsoft Cluster Services (MSCS). Our cluster capabilities eliminate the need for clustered nodes to share access to the same physical disk, providing data redundancy and allowing cluster nodes to be placed at different locations, providing geographic redundancy for the cluster nodes as well as the data. With cluster capabilities, business critical data is stored on each cluster node’s local drives and then replicated to the other nodes in the cluster using our real-time replication. Our cluster capabilities can also provide quorum capability, acting as an arbitrator for the cluster in the event that the cluster nodes are running but cannot communicate.
Our Double-Take Backup product is a combination of our former products TimeData, Livewire and Cargo, along with several other technologies. This product continuously replicates changes to data, applications, and the operating system, protecting one or more production servers to a centralized repository server. At the time of recovery, Double-Take Backup allows the end user to configure and perform full-server recovery quickly to physically dissimilar hardware or virtual servers, with added validation steps. Validation compares the image of the source server to the actual recovery server then alerts the end user of potential problems. Double-Take Backup can also be used to migrate a server to different hardware, allowing the end user to use licenses for disaster recovery. When recovering to a virtual platform, Double-Take Backup automatically provisions virtual machines to match the original source machine.
In addition to maintaining a live copy of each production server’s data, Double-Take Backup also maintains a history of changes to the production server’s data so it can be recovered at any point in time. Our Double-Take Backup product captures file system changes that are replicated to the repository server, and stores those in a database in time sequence. A target file system interface allows Double-Take Backup and other applications to access the protected file system data at various points in time by presenting a view of the file system at that time.
Management of the Double-Take Backup technology is done via a management console that can be run from any computer within the customer’s network that has connectivity to the source and repository servers. This console is designed to allow centralized management of a customer’s environment from one convenient location.
Our Double-Take Cloud product leverages the Double-Take real-time replication engine to protect customer’s servers to the cloud. This product currently leverages Amazon’s Web Services (AWS) to provide off-site compute and storage resources, though it is planned that this offering will be extended to other cloud vendors in the future. The Double-Take Cloud product is bundled in an Amazon Machine Image (AMI), which can be deployed by any customer subscribing to the Double-Take Cloud service, which allows them easily provision a new repository server to host protected data. We also provide AMIs for the recovery process, which allows customers to quickly and easily provision and recover their workloads in the cloud in the event of a local disaster. In addition, customer’s can use Double-Take cloud to recover their protected data back to their original production site, or to a new location. Virtual Private Networking (VPN) software is provided to secure communication between a customer’s production site and the cloud, both for protection and recovery.
Our Double-Take Flex technology leverages the iSCSI storage standard and standard Ethernet network interface cards that support PXE (Preboot Execution Environment) to allow physical and virtual servers and workstations to boot directly from iSCSI storage systems. In addition, Double-Take Flex allows the assignment of boot images to physical and virtual systems to be centrally controlled and changed in order to simplify provisioning, migration and system re-purposing. To allow the greatest flexibility, Double-Take Flex makes the boot images for most current operating systems hardware independent, allowing a workload to be moved from one brand of server hardware to another or between physical and virtual systems and back. For customers that do not have existing iSCSI storage, Double-Take Flex also provides software-based iSCSI target functionality, which allows any Windows-based server to be used as an iSCSI storage device.
Our Double-Take Move product allows operating systems, applications and data to be easily moved from one make, model and server configuration to another. Because Double-Take Move is hardware independent, it can also be used for any combination of virtual or physical servers. Double-Take Move does not require servers to be offline during migration; data is mirrored from the old server to the new server without interruption to users. Changes that users make during migration are captured and replicated to the new server in real time. When the mirror is complete and all changes are replicated to the new server, cutover can occur with little to no downtime. Double-Take Move continuously captures byte-level changes to a server's OS, applications and data and replicates those changes to new physical or virtual hardware at any location, locally or globally. By moving only the bytes that change, Double-Take Move uses the minimum bandwidth required.
Marketing and Sales
We market and sell our software primarily to or through distributors, value-added resellers and OEMs, supported by an inside and field-based direct sales force located in the United States, Asia and Europe. Our selling model is based on building a strong distribution network through which customers can purchase the software. To date, we believe that this selling model has created an advantage for us. We currently have about 900 selling partners within our distribution and value-added reseller program, and we are adding more to this group to meet regional and technology related needs. To support our partners in our sales channels, our sales group has been organized in an overlay format so that our sales teams are working with our partners to pursue sales jointly.
In addition, our marketing partners complement our sales campaigns through seminars, trade shows and joint advertising. We leverage our customers and partners to provide references and recommendations that we use in our various promotional and sales activities. These partners include Dell Computer Corporation, Microsoft Corporation, Hewlett-Packard Company and VMware, Inc.
The goal of our marketing effort is to develop sales opportunities by increasing the awareness of our software’s functionality and business need within our target markets and segments. We plan to continue to invest in building greater Double-Take brand recognition in the United States and internationally through expansion of the use of our brand, public relations programs, interactions with industry analysts, trade shows, web search optimization, regional seminars and speaking engagements.
In 2009, we received approximately 17% of our total sales from sales of software and services to Dell Computer Corporation, which is the largest reseller of our software and services and approximately 10% of our total sales from sales of software and services through Sunbelt Software, Inc. (formerly Sunbelt Software Distribution, Inc.), which is a reseller of our software and services. No other resellers or distributors and no customer accounted for 10% or more of our total sales in 2009.
Our software revenue generally experiences some seasonality. Many organizations make the bulk of their information technology purchases, including software in the third and fourth quarters of the year. We believe this generally has resulted in higher revenue generated by software sales during these quarters. In 2009, software revenue increased from the first quarter to the second quarter. Software revenue decreased from the second quarter to the third quarter and then increased from the third quarter to the fourth quarter. Due to the effects of the current economic downturn, our quarterly revenue predictability has decreased significantly. As a result, future quarterly revenue may trend differently than it has historically. While the economic downturn continues to make predicting the quarterly revenue trending difficult, we believe that in line with our historical seasonality, the first quarter of 2010 should be the weakest quarter of the year.
Competition
The markets in which we compete are competitive and rapidly changing. Our primary competitors for Double-Take Availability include EMC (Legato), Neverfail, Symantec (Veritas) and CA, Inc. (XOsoft). All of our competitors offer a variety of data protection and recovery solutions, some of which may offer features that we do not offer or have more attractive pricing. Our primary competitors for Double-Take Backup include Symantec (Backup Exec), EMC (Avamar), Commvault (Simpana Backup and Recovery), Acronis (Acronis Backup and Recovery), and Microsoft Data Protection Manager. Our primary competitors for Double-Take Flex include Citrix (Citrix Provisioning Server) and Virtual Desktop Infrastructure (VDI) solutions from vendors such as VMWware. Our primary competitors for Double-Take Move are Platespin (Migrate), VMWare (VMWare Converter), Visoncore (vConverter) and Microsoft (Virtual Machine Manager).
The principal competitive factors in our industry include:
|
•
|
technology;
|
|
|
•
|
price;
|
|
|
•
|
product functionality and effectiveness;
|
|
|
•
|
product reliability;
|
|
|
•
|
product integration;
|
|
|
•
|
sales support;
|
|
|
•
|
scope and quality of customer support;
|
|
|
•
|
relationships with OEMs; and
|
|
|
•
|
reputation.
|
|
Our Double-Take software products also compete with alternative approaches for data protection and recovery. Alternative approaches include the following technologies:
|
•
|
Tape Backup. Tape backup solutions run on a scheduled basis, usually nightly or weekly, backing up all files to tape or scanning for files that have changed since the last backup and copying those files to tape. Full recovery from tape usually requires that the operating system and recovery software first be re-installed and re-configured on identical hardware before the data recovery component can begin. Examples of companies and products in this category include Symantec NetBackup and Backup Exec, IBM Tivoli Storage Manager, CA Brightstor Enterprise Backup, Legato Networker and CommVault Galaxy.
|
|
|
•
|
Snapshots. Hardware array based and operating system provided snapshots are tools that can reduce the time for recovering data, applications and servers. Snapshots operate on a disk volume basis by copying disk blocks that are about to be overwritten by changes before allowing new blocks to be written to disk. Because many snapshots are just differences from one point in time to another and not full copies of the volume, they are dependent on the survival of the original volume and exist in the same geographic location as the original volume. Therefore snapshots alone do not provide a complete solution, but can be used in conjunction with continuous data replication solutions like Double-Take to address many of the above limitations. Snapshot functionality is usually specific to a particular operating system volume manager or disk storage array. Examples of companies and products in this category include Microsoft Volume Shadow Copy Service, EMC TimeFinder and Snapview.
|
|
|
•
|
Clustering. Server clustering can improve the availability of data by providing one or more additional servers to resume processing in the event of a hardware or software failure. These systems are expensive, requiring matched server hardware and certified shared disk subsystems. In addition, server clusters are generally restricted to very short distances, making offsite disaster protection difficult. Shared disk clustering systems continue to have a single point of failure in the shared disk subsystem. Examples of companies and products in this category include Microsoft Cluster Service, Symantec Cluster Server, Steeleye LifeKeeper and Legato AutoStart.
|
|
|
•
|
Remote Disk Mirroring. Disk mirroring is typically implemented as software within a proprietary storage array or as a software driver or appliance between the server and the primary data storage. Changes are captured at the disk block level, with entire blocks of data being mirrored for any size change and any physical changes to the disk such as temporary files or defragmentation causing replication traffic. Typically, an operating system must boot and then “mount” the remotely mirrored drive in order to make the data accessible, which requires the operating system and applications to be installed and correctly configured to use the replicated volume, as well as extensive integrity checks. Examples of companies and products in this category include EMC SRDF and Mirrorview, Symantec Volume Replicator, FalconStorIPStor, DataCore SANmelody and Hitachi TrueCopy.
|
|
|
•
|
On-line Backup. On-line Backup solutions provide periodic backup of a user’s user data to an off-site location via a network connection. These solutions allow users to store copies of their data at a different location without purchasing or managing storage hardware. This data can be recovered back to the user’s site (or another site) in the event of a disaster. These systems generally do not provide real-time protection, and only protect user and application data vs. the entire contents of a server. While these types of systems are usually inexpensive, they do not allow users to recover their data directly at the off-site location and access it immediately. A lengthy recovery process is typically required to recover data. Examples of companies and products in this area include: ZManda Cloud Backup, Carbonite Pro, Mozy Pro, Commvault Simpana, Symantec Protection Network for servers and Computer Associates Instant Recovery On-Demand.
|
|
Some of our competitors have greater financial, technical, sales, marketing and other resources than we do, as well as greater name recognition and a larger overall customer base for their products. Additionally, some of these competitors have research and development capabilities that may allow them to develop new or improved products that may compete with our software. As this market continues to develop, a number of companies with greater resources than ours could attempt to enter the market or increase their presence in this market by acquiring or forming strategic alliances with our competitors or business partners or by introducing their own competing products.
Our success will depend on our ability to adapt to these competing forces, to develop more advanced products more rapidly and less expensively than our competitors, to continue to develop a global sales and support network and to educate potential customers about the benefits of using our software rather than our competitors’ products. Our competitors could introduce products with superior features, scalability and functionality at lower prices than our software. In addition, some of our customers and potential customers may buy other software or services from our competitors, and to the extent that they prefer to consolidate their software purchasing from fewer vendors, may choose not to continue to purchase our software and support services.
We expect additional competition from other established and emerging companies. Increased competition could result in price reductions, reduced gross margins and loss of market share, any of which could harm our business.
Research and Development
We have made a significant investment in developing and improving our software. Our research and development expenditures were $11.9 million, or approximately 14% of our total revenue, for 2007, $16.5 million, or approximately 17% of our total revenue, for 2008 and $15.3 million, or approximately 18%, for 2009. Our development team has specific core competencies in Windows development including drivers, file systems, storage, clustering, networking and applications such as Exchange, SQL Server, Oracle Database and SharePoint server. Our engineering organization, located in Indianapolis, Montreal, and Toronto is responsible for product development, quality assurance, product management and documentation.
Intellectual Property
Our success as a company depends upon our ability to protect our core technology and intellectual property. To accomplish this, we rely on a combination of intellectual property rights, including patents, trade secrets, copyrights and trademarks, as well as customary contractual protections.
We have been granted two United States patents relating to our Real Time Backup System which is a component of all of our Double-Take products. The granted United States patents will expire in October 2015. As part of our acquisition of TimeSpring, we acquired seven United States patents which will expire at various dates from 2015 to 2020. These patents and, to the extent any future patents are issued, may be contested, circumvented or invalidated over the course of our business, and we may not be able to prevent third-parties from infringing these patents. Therefore, the exact effect of having patents cannot be predicted with certainty.
Furthermore, we have registered Double-Take®, Double-Take Flex®, Double-Take Move®, Double-Take for Virtual Systems®, TimeData®, and netBoot/i® product trademarks in the United States and have applied for registration for a variety of other trademarks including Double-Take Availability tm, Double-Take Backup tm and Double-Take Cloud tm. A third party may contest the registration of our trademark applications or may bring a claim for infringement of any of our registered or non-registered trademarks.
Employees
As of February 26, 2010, we had 387 employees in offices across the United States, Europe, Canada and Asia. None of our employees are represented by labor unions, and we consider our current employee relations to be good.
The following table sets forth information with respect to our executive officers:
|
Name
|
Age
|
Position
|
||||
|
Dean Goodermote
|
56
|
President, Chief Executive Officer and Chairman of the Board of Directors
|
||||
|
Robert L. Beeler
|
44
|
Vice President of Engineering
|
||||
|
David J. Demlow
|
42
|
Chief Technology Officer
|
||||
|
S. Craig Huke
|
48
|
Chief Financial Officer
|
||||
|
Daniel M. Jones
|
42
|
Vice President of Worldwide Sales
|
||||
|
Michael Lesh
|
65
|
Vice President of Professional Services and Support
|
||||
|
Jo Murciano
|
58
|
Vice President of EMEA; President of Double-Take EMEA
|
Dean Goodermote joined Double-Take Software in March 2005 as President, Chief Executive Officer and Chairman of the board of directors. Since July 2004 he has also served as Chief Executive Officer of Grid-Analytics LLC, a concept-stage company he founded focused on aggregated research. From September 2001 to March 2005, Mr. Goodermote served as a Venture Partner of ABS Capital Partners. From September 2000 to August 2001, Mr. Goodermote was Chairman and Chief Executive Officer of Clinsoft Corporation, a developer of software for clinical research. From 1997 to August 2001, Mr. Goodermote was Chairman and President of Domain Solutions Corporation, a software developer for enterprise applications and the parent of Clinsoft. From May 2000 until December 2001, Mr. Goodermote founded and was Chief Executive Officer and then the Chairman of IPWorks, Inc., a developer of internet address management software. From August 1996 to May 2000, Mr. Goodermote was Chief Executive Officer and President of Process Software Corporation, a developer of Internetworking software. From August 1986 to February 1997, Mr. Goodermote served in various positions, including eventually President and Chairman, of Project Software and Development Corporation, later known as MRO Software, Inc., a provider of software-based asset and service management solutions.
Robert L. Beeler joined Double-Take Software in July 1995 as Vice President of Engineering. From 1996 to 2001, Mr. Beeler served as a member of our board of directors. From July 1991 to July 1995, Mr. Beeler served as Project Manager, Project Engineer and System/Software Engineer at the Naval Air Warfare Center, where he supervised and provided technical leadership to a development team in support of the Navy Airborne Electronic Warfare Platform. From 1988 to 1991, Mr. Beeler served as a Software Developer for National Field Service Inc.
David J. Demlow joined Double-Take Software in 1997 as Vice President of Product Management and, since January 2005, has served as our Chief Technology Officer. From 1991 to 1997, Mr. Demlow held the following positions at Seagate Software: 1994 to 1997, Senior Product Manager, Enterprise Storage Management; 1993 to 1994, Systems Engineer, Sales and Channel Support; 1991 to 1993, Account Rep, Direct and Channel Sales. From 1990 to 1991, Mr. Demlow served as a Sales Manager at Business Technology Associates, Inc.
S. Craig Huke joined Double-Take Software in June 2003 as Chief Financial Officer. From May 2001 to May 2003, Mr. Huke served as Chief Financial Officer for Apogee Networks Systems and Consulting LLC, Inc., a privately held software company specializing in network cost visibility and containment. From April 1999 to May 2001, Mr. Huke served as Chief Financial Officer at Bluestone Software, Inc., an Internet infrastructure software company. From
April 1998 to April 1999, Mr. Huke served as Vice President, Finance at Metronet Communications Corp., a communications company. From November 1994 to April 1998, Mr. Huke held the following positions at Seer Technologies, Inc., a software development company: September 1997 to April 1998, Vice President & Corporate Controller; November 1996 to September 1997, Corporate Controller; November 1995 to November 1996, Director of Financial Reporting and Analysis; and November 1994 to November 1995, Manager of Financial Reporting and Analysis.
Daniel M. Jones joined Double-Take Software in October 2001 as Eastern Region Sales Director and, since May 2005, has served as our Vice President of Sales and Marketing. In January 2010 Mr. Jones became our Vice President of Worldwide Sales. From January 2000 to October 2001, Mr. Jones served as National Director of Sales at StorageNetworks, a provider of data storage software services to major and global businesses. From January 1998 to January 2000, Mr. Jones served as Vice President of North American Sales of Net-tel Inc., a provider of internet protocol data and voice services. From June 1996 to December 1997, Mr. Jones served as Director of Sales at MidCom Communications Inc., a facility-based telecommunications company. From February 1991 to June 1996, Mr. Jones held the following positions at ALLNET/Frontier Communications: May 1993 to June 1996, Area Manager, July 1992 to May 1993, District Manager; and July 1991 to July 1992, Sales Representative.
Michael Lesh joined Double-Take Software in June 2001 as Vice President of Professional Services and Support. From October 2000 to June 2001, Mr. Lesh served as Director, Professional Services at Openpages, Inc., a provider of enterprise compliance management software. From February 1973 to October 2000, Mr. Lesh held the following positions at Data General, a division of EMC Corporation: January 1998 to October 2000, Director, Professional Services; February 1996 to January 1998, Director, Eastern Operations Professional Services; March 1995 to February 1996, Director, Technology Deployment Services; March 1990 to March 1995, Manager, Northeast Professional Services; and May 1984 to March 1990, Manager, Regional Systems Engineering.
Jo Murciano joined Double-Take Software in May 2006 as Vice President of EMEA and President of Double-Take EMEA, and from January 2008 through December 2009 served as our Vice President of International. Mr. Murciano is also Chief Executive Officer and a director of Sunbelt Software, Inc. (formerly Sunbelt Software Distribution, Inc.), one of our resellers, which he joined in 1994. From October 1983 to May 2006, Mr. Murciano served as Chairman of Sunbelt System Software S.A.S., a software distributor that he founded in 1983 and which we acquired in May 2006. From September 1982 to October 2000, Mr. Murciano served as Chief Executive Officer of RMH Group, a provider of development and communication tools for the IBM AS/400 market that Mr. Murciano founded in 1982.
Available Information
For more information about us, visit our web site at www.doubletake.com. Our electronic filings with the SEC (including our annual report on Form 10-K, quarterly reports on Form 10-Q and current reports on Form 8-K, and any amendments to these reports) are available free of charge through our web site as soon as reasonably practicable after we electronically file with or furnish them to the SEC.
|
Risk Factors.
|
An investment in our stock involves a high degree of risk. You should carefully consider the following risks and all of the other information set forth in this annual report before deciding to invest in shares of our common stock. If any of the events or developments described below occur, our business, financial condition or results of operations could be negatively affected. In that case, the trading price of our common stock could decline, and you could lose all or part of your investment in our common stock.
Risks Related to Our Business
A continued downturn in the global economy could adversely impact our continued growth, results of operations and our ability to forecast future business.
Beginning in 2008 and continuing through 2009, there has been a downturn in the global economy, resulting in slower economic activity, decreased consumer confidence, reduced corporate profits and capital spending, adverse business conditions and liquidity concerns. There has also been increased volatility in foreign exchange markets. We believe that our sales and results of operations were impacted by these economic factors. These factors make it difficult for our customers, our vendors and us to accurately forecast and plan future business activities, and they could cause customers to slow or defer spending on our products, which would delay and lengthen sales cycles, hurt our growth and negatively affect our results of operations. We cannot predict the timing or duration of any economic slowdown or the timing or strength of a subsequent economic recovery, worldwide or in our industry.
Intense competition in our industry may hinder our ability to generate revenue and may adversely affect our margins.
The market for our software is intensely competitive. Our primary competitors for Double-Take Availability include EMC Corporation (Legato), Neverfail Group, Ltd., Symantec Corporation (Veritas) and CA, Inc. (XOsoft Inc.). In addition to direct competitors, other technologies such as SAN-based replication are available that solve some of the same problems that our software solves. These technologies may be viewed as a competitive alternative to our products by customers. We also have competitors for our other products. Some of the companies we have identified and many of our other current and potential competitors have longer operating histories and substantially greater financial, technical, sales, marketing and other resources than we do, as well as larger installed customer bases and greater name recognition. Our competitors may be able to devote greater resources to the development, marketing, distribution, sale and support of their products than we can and some may have the ability to bundle their data replication offerings with their other products. The extensive relationships that these competitors have with existing customers may make it increasingly difficult for us to increase our market share. The resources of these competitors also may enable them to respond more rapidly to new or emerging technologies and changes in customer requirements and to reduce prices to win new customers.
As this market continues to develop, a number of other companies with greater resources than ours, including Microsoft and VMware, could attempt to enter the market or increase their presence by acquiring or forming strategic alliances with our competitors or business partners or by introducing their own competing products. As our market grows new or existing smaller competitors could emerge as significant competitive threats.
Our success will depend on our ability to adapt to these competitive forces, to develop more advanced products more rapidly and less expensively than our competitors, to continue to develop a global sales and support network, and to educate potential customers about the benefits of using our software rather than our competitors’ products. Existing or new competitors could introduce products with superior features, scalability and functionality at lower prices. This could dramatically affect our ability to sell our software. In addition, some of our customers and potential customers may buy other software, other competing products and related services from our competitors, and to the extent that they prefer to consolidate their software purchasing from fewer vendors, they may choose not to continue to purchase our software and support services.
We expect additional competition from other established and emerging companies. Increased competition could result in reduced revenue, price reductions, reduced gross margins and loss of market share, any of which would harm our results of operations.
Because a large majority of our sales are made to or through distributors, value-added resellers and original equipment manufacturers, none of which have any obligation to sell our software applications, the failure of this distribution network to sell our software effectively could materially adversely affect our revenue and results of operations.
We rely on distributors, value-added resellers and original equipment manufacturers, or OEMs, together with our inside and field-based direct sales force, to sell our products. These distributors, resellers and OEMs sell our software applications and, in some cases, incorporate our software into systems that they sell. We expect that these arrangements will continue to generate a large majority of our total revenue. Sales to or through our distributors, resellers and OEMs accounted for approximately 89% and 90% of our sales for the year ended December 31, 2009 and 2008, respectively. Sales to or through our top five distributors, resellers and OEMs accounted for approximately 48% of our sales for 2009 and 50% of our sales for 2008.
We have limited control over the amount of software that these businesses purchase from us or sell on our behalf, we do not have long term contracts with any of them, and they have limited obligations to recommend, offer or sell our software applications. Thus there is no guarantee that this source of revenue will continue at the same level as it has in the past. Any material decrease in the volume of sales generated by our larger distributors, resellers and OEMs could materially adversely affect our revenue and results of operations in future periods.
We depend on growth in the storage replication market, and lack of growth or contraction in this market could materially adversely affect our sales and financial condition.
Demand for data replication software is driven by several factors, including an increased focus on protecting business-critical applications, government and industry regulations requiring data protection and recovery, a heightened awareness of the potential for natural and man-made disasters and the growth in stored data from the increased use of automated systems. Segments of the computer and software industry have in the past experienced significant economic downturns and decreases in demand as a result of changing market factors. A change in the market factors that are driving demand for data replication software could adversely affect our sales, profitability and financial condition.
Our transition to a broader suite of products focusing on moving, protecting and recovering workloads may not be successful, which could hamper our growth prospects and over time could lead to a decline in revenues.
We have historically focused on the disaster recovery market, but as a result of our acquisitions in 2007 and 2008 and internal development, we are expanding into adjacent markets for system migrations, back-up and network booting. We believe that over time the focus on the ability to move, protect and recover workloads will be necessary to maintain and grow our revenue and business, particularly as it becomes more critical for customers to have the ability to move information freely, intelligently and securely. If we are not able to successfully manage the transition to software and marketing that addresses this focus, we may not be able to grow our revenues and business and over time our revenues may decline.
Our current products are primarily designed for the Microsoft and VMware server environments, which expose us to risks if Microsoft or VMware products are not compatible with our software or if Microsoft, VMware or other open source vendors choose to compete more substantially with us in the future.
We currently depend primarily on customers that deploy Microsoft products within their organizations. Microsoft could make changes to its software that render our software incompatible or less effective. Furthermore, Microsoft may choose to focus increased resources on applications that compete with our applications, including competing applications that Microsoft bundles with its operating platform. These actions could materially adversely affect our ability to generate revenue and maintain acceptable profit margins. We have less dependence on VMware deployments, but similar VMware and open source vendor’s actions could also materially adversely affect our ability to generate revenue and maintain acceptable profit margins.
We may not be able to respond to technological changes with new software applications, which could materially adversely affect our sales and profitability.
The markets for our software applications are characterized by rapid technological changes, changing customer needs, frequent introduction of new software applications and evolving industry standards. The introduction of software applications that embody new technologies or the emergence of new industry standards could make our software applications obsolete or otherwise unmarketable. As a result, we may not be able to accurately predict the lifecycle of our software applications, which may become obsolete before we receive any revenue or the amount of revenue that we anticipate from them. If any of the foregoing events were to occur, our ability to retain or increase market share in the storage replication market could be materially adversely affected.
To be successful, we need to anticipate, develop and introduce new software applications on a timely and cost-effective basis that keep pace with technological developments and emerging industry standards and that address the increasingly sophisticated needs of our customers and their budgets. We may fail to develop or sell software applications that respond to technological changes or evolving industry standards, experience difficulties that could delay or prevent the successful development, introduction or sale of these applications or fail to develop applications that adequately meet the requirements of the marketplace or achieve market acceptance. Our failure to develop and market such applications and services on a timely basis, or at all, could materially adversely affect our sales and profitability.
The development and adoption of cloud computing, or the lack of success of our cloud computing product, could lead to declines in the demand for our software and services.
Many of the world’s leading technology companies are continuing to develop a new generation of enterprise computing in which substantial components of information technology infrastructure are provisioned and delivered over the Internet on an outsourced basis. This new computing paradigm is sometimes referred to as “cloud computing,” and may result in companies requiring fewer of their own servers and computer systems or backing up their own servers and systems through cloud computing providers. The adoption of the cloud computing paradigm by our customers or potential customers could result in a decline for demand of our software and services, and our cloud computing product may not be sufficient to counterbalance those effects. If our cloud computing product is not successful and we are unable to adapt our other software, services and business model to the cloud computing paradigm, the demand for our software and services could decline, which would negatively impact our results of operations.
Our failure to offer high quality customer support services could harm our reputation and could materially adversely affect our sales of software applications and results of operations.
Our customers depend on us, and, to some extent, our distribution partners, to resolve implementation, technical or other issues relating to our software. A high level of service is critical for the successful marketing and sale of our software. If we or our distribution partners do not succeed in helping our customers quickly resolve post-deployment issues, our reputation could be harmed and our ability to make new sales or increase sales to existing customers could be damaged.
Defects or errors in our software could adversely affect our reputation, result in significant costs to us and impair our ability to sell our software.
If our software is determined to contain defects or errors our reputation could be materially adversely affected, which could result in significant costs to us and impair our ability to sell our software in the future. The costs we would incur to correct product defects or errors may be substantial and would adversely affect our operating results. After the release of our software, defects or errors have been identified from time to time by our internal team and by our clients. Such defects or errors may occur in the future. Any defects that cause interruptions to the data recovery functions of our applications, or that cause other applications on the operating system to malfunction or fail, could result in:
|
·
|
lost or delayed market acceptance and sales of our software;
|
|
·
|
loss of clients;
|
|
·
|
product liability suits against us;
|
|
·
|
diversion of development resources;
|
|
·
|
injury to our reputation; and
|
|
·
|
increased maintenance and warranty costs.
|
We may not receive significant revenue from our research and development efforts for several years, if at all.
We have made a significant investment in developing and improving our software. Our research and development expenditures were $11.9 million, or approximately 14% of our total revenue, for 2007 $16.5 million, or approximately 17% of our total revenue, for 2008, and $15.3 million, or approximately 18%, for 2009. We believe that we must continue to dedicate a significant amount of our resources to our research and development efforts to maintain our competitive position, and we plan to do so. However, we may not receive significant revenue from these investments for several years following each investment, if ever.
We may engage in future acquisitions or investments that present many risks, and we may not realize the anticipated financial and strategic goals for any of these transactions.
We do not have significant experience acquiring companies. Since our inception, we have acquired three entities: Double-Take EMEA, Double-Take Canada, which includes both TimeSpring Software Corporation and emBoot, Inc. We may acquire or make investments in additional companies. Acquisitions and investments involve a number of difficulties that present risks to our business, including the following:
|
·
|
we may be unable to achieve the anticipated benefits from the acquisition or investment;
|
|
·
|
we may have difficulty integrating the operations and personnel of the acquired business, and may have difficulty retaining the key personnel of the acquired business;
|
|
·
|
we may have difficulty incorporating the acquired technologies or products with our existing software and technology;
|
|
·
|
our ongoing business and management’s attention may be disrupted or diverted by transition or integration issues and the complexity of managing geographically and culturally diverse locations;
|
|
·
|
we may have difficulty maintaining uniform standards, controls, procedures and policies across locations; and
|
|
·
|
we may experience significant problems or liabilities associated with product quality, technology and legal contingencies.
|
These factors could materially adversely affect our business, results of operations and financial condition or cash flow, particularly in the case of a larger acquisition or multiple acquisitions in a short period of time. From time to time, we may enter into negotiations for acquisitions or investments that are not ultimately consummated. These negotiations could result in significant diversion of management time, as well as expense.
The consideration paid for an investment or acquisition may also affect our financial results. If we were to proceed with one or more significant acquisitions in which the consideration included cash, we could be required to use a substantial portion of our available cash. To the extent we issue shares of our capital stock or other rights to purchase shares of our capital stock as consideration for the acquisitions, including options or other rights, our existing stockholders may be diluted, and our earnings per share may decrease. In addition, acquisitions may result in the incurrence of debt, write-offs and restructuring charges. They may also result in goodwill and other intangible assets that are subject to an impairment test, which could result in future impairment charges.
The loss of key personnel or the failure to attract and retain highly qualified personnel could adversely affect our business.
Our future performance depends on the continued service of our key technical, sales, services and management personnel. We rely on our executive officers and senior management to execute our existing business plans and to identify and pursue new opportunities. The loss of key employees could result in significant disruptions to our business, and the integration of replacement personnel could be time consuming, cause additional disruptions to our business and be unsuccessful. We do not carry key person life insurance covering any of our employees.
Our future success also depends on our continued ability to attract and retain highly qualified technical, services and management personnel. Competition for such personnel is intense, and we may fail to retain our key technical, services and management employees or attract or retain other highly qualified technical, services and management personnel in the future. Conversely, if we fail to manage employee performance or reduce staffing levels when required by market conditions, our personnel costs would be excessive and our business and profitability could be adversely affected.
We will not be able to grow our sales if we do not retain or attract and train qualified sales personnel.
A portion of our revenue is generated by our direct sales force, and our future success will depend in part upon its continued productivity and expansion, as necessary. To the extent we experience attrition in our direct sales force, we will need to hire replacements. We face intense competition for sales personnel in the software industry, and we may not be successful in retaining, hiring or training our sales personnel in accordance with our plans. If we fail to retain the experienced members of our sales force, or maintain and expand our sales force as needed, our future sales and profitability could be adversely affected.
Changes in the regulatory environment and general economic condition and other factors in countries in which we have international sales and operations could adversely affect our operations.
We derived approximately 38% of our revenue from sales outside the United States in 2007, approximately 36% of our revenue from sales outside the United Stated in 2008 and approximately 35% of our revenue from sales outside the United States in 2009. We anticipate that we will increase the percentage of our revenue generated from sales outside the United States in future periods. Our international operations are subject to risks related to the differing legal, political, social and regulatory requirements and economic conditions of many countries, including:
|
·
|
difficulties in staffing and managing our international operations;
|
|
·
|
costs and delays in downsizing non-United States workforces, if necessary, as a result of applicable non-United States employment and other laws;
|
|
·
|
the adoption or imposition by foreign countries of additional withholding taxes, other taxes on our income, or tariffs or other restrictions on foreign trade or investment, including currency exchange controls;
|
|
·
|
general economic conditions in the countries in which we operate could adversely affect our earnings from operations in those countries;
|
|
·
|
imposition of, or unexpected adverse changes in, foreign laws or regulatory requirements may occur, including those pertaining to export duties and quota, trade and employment restrictions;
|
|
·
|
longer payment cycles for sales in foreign countries and difficulties in collecting accounts receivables;
|
|
·
|
competition from local suppliers; and
|
|
·
|
political unrest, war or acts of terrorism.
|
Each of the foregoing risks could reduce our revenue or increase our expenses.
We are exposed to currency exchange rate fluctuations that could harm our reported revenue and results of operations.
Historically, our international sales were generally denominated in the United States dollar. We have international sales and expenses that are denominated in foreign currencies, and these revenue and expenses could be materially affected by currency exchange rate fluctuations. Our primary exposures are to fluctuations in exchange rates for the United States dollar versus the Euro and Canadian dollar, as well as the Euro versus the British Pound. Changes in currency exchange rates could adversely affect our reported revenue and expenses and could require us to reduce our prices to remain competitive in foreign markets, which could also materially adversely affect our results of operations. We have not historically hedged exposure to changes in foreign currency exchange rates and, as a result, we could incur unanticipated gains or losses.
Protection of our intellectual property is limited, and any misuse of our intellectual property by others could materially adversely affect our sales and results of operations.
Proprietary technology in our software is important to our success. To protect our proprietary rights, we rely on a combination of patents, copyrights, trademarks, trade secrets, confidentiality procedures and contractual provisions. While we own nine issued patents, seven of which were acquired through our purchase of TimeSpring, we have not emphasized patents as a source of significant competitive advantage and have also sought to protect our proprietary technology under laws affording protection for trade secrets, copyright and trademark protection of our software, products and developments where available and appropriate. In addition, our issued patents may not provide us with any competitive advantages or may be challenged by third parties, and the patents of others may seriously impede our ability to conduct our business. Further, any patents issued to us may not be timely or broad enough to protect our proprietary rights.
We also have nineteen registered trademarks in the U.S., including the Double-Take mark. Although we attempt to monitor use of and take steps to prevent third parties from using our trademarks without permission, policing the unauthorized use of our trademarks is difficult. If we fail to take steps to enforce our trademark rights, our competitive position and brand recognition may be diminished.
We protect our software, trade secrets and proprietary information, in part, by requiring all of our employees to enter into agreements providing for the maintenance of confidentiality and the assignment of rights to inventions made by them while employed by us. We also enter into non-disclosure agreements with our consultants to protect our confidential and proprietary information. There can be no assurance that our confidentiality agreements with our employees, consultants and other third parties will not be breached, that we will be able to effectively enforce these agreements, have adequate remedies for any breach, or that our trade secrets and other proprietary information will not be disclosed or otherwise be protected. Furthermore, there also can be no assurance that others will not independently develop technologies that are similar or superior to our technology or reverse engineer our products.
Protection of trade secret and other intellectual property rights in the markets in which we operate and compete is highly uncertain and may involve complex legal and scientific questions. The laws of countries in which we operate may afford little or no protection to our trade secrets and other intellectual property rights. Policing unauthorized use of our trade secret technologies and proving misappropriation of our technologies is particularly difficult, and we expect software piracy to continue to be a persistent problem. Piracy of our products represents a loss of revenue to us. Furthermore, any changes in, or unexpected interpretations of, the trade secret and other intellectual property laws in any country in which we operate may adversely affect our ability to enforce our trade secret and intellectual property rights. Costly and time-consuming litigation could be necessary to enforce and determine the scope of our confidential information and trade secret protection. If we are unable to protect our proprietary rights or if third-parties independently develop or gain access to our or similar technologies, our competitive position and revenue could suffer.
Claims that we misuse the intellectual property of others could subject us to significant liability and disrupt our business, which could materially adversely affect our results of operations and financial condition.
Because of the nature of our business, we may become subject to material claims of infringement by competitors and other third-parties with respect to current or future software applications, trademarks or other proprietary rights. Further, we may not be aware of all of the patents and other intellectual property rights owned by third-parties that may be potentially adverse to our interests. Intellectual property litigation can be complex, costly and protracted. As a result, any intellectual property litigation to which we are subject could disrupt our business operations, require us to incur substantial costs and subject us to significant liabilities, each of which could severely harm our business.
In December 2005, we agreed to terms for settlement of a legal proceeding with a provider of information storage systems that involved claims regarding some of the intellectual property components of our software. Pursuant to a settlement agreement, in January 2006 we paid $3.8 million to the other company. We also agreed to make future payments of $0.5 million in each of January 2007, 2008, 2009 and 2010, which we collateralized by a $2.0 million letter of credit to that company. The settlement provided that our obligations would be reduced on a dollar-for-dollar basis to the extent that we purchased or resold the other company’s products. As of December 31, 2009, we purchased $2.0 million of computer equipment and fulfilled this obligation. In 2009 the letter of credit was terminated.
Any intellectual property litigation commenced against us could force us to take actions that could be harmful to our business, including the following:
|
·
|
stop selling our products or using the technology that contains the allegedly infringing intellectual property;
|
|
·
|
attempt to obtain a license to use the relevant intellectual property, which may not be available on reasonable terms or at all; and
|
|
·
|
attempt to redesign the products that allegedly infringed upon the intellectual property.
|
In addition, plaintiffs in intellectual property cases often seek injunctive relief. If we are forced to take any of the foregoing actions, our business, financial position and operating results could be harmed. We may not be able to develop, license or acquire non-infringing technology under reasonable terms, if at all. These developments would result in an inability to compete for customers and would adversely affect our ability to increase our revenue. The measure of damages in intellectual property litigation can be complex, and is often subjective or uncertain. If we were to be found liable for the infringement of a third party’s proprietary rights, the amount of damages we might have to pay could be substantial and would be difficult to predict.
We cannot predict our future capital needs and we may be unable to obtain additional financing to fund acquisitions, which could materially adversely affect our business, results of operations and financial condition.
We may need to raise additional funds in the future in order to acquire complementary businesses, technologies, products or services. Any required additional financing may not be available on terms acceptable to us, or at all. If we raise additional funds by issuing equity securities, you may experience significant dilution of your ownership interest, and the newly-issued securities may have rights senior to those of the holders of our common stock. If we raise additional funds by obtaining loans from third parties, the terms of those financing arrangements may include negative covenants or other restrictions on our business that could impair our operational flexibility, and would also require us to fund additional interest expense. If additional financing is not available when required or is not available on acceptable terms, we may be unable to successfully develop or enhance our software and services through acquisitions in order to take advantage of business opportunities or respond to competitive pressures, which could materially adversely affect our software and services offerings, revenue, results of operations and financial condition. We have no current plans, nor are we currently considering any proposals or arrangements, written or otherwise, to acquire a material business, technology, product or service.
Risks Related to Our Common Stock
We may experience a decline in revenue or volatility in our operating results, which may adversely affect the market price of our common stock.
We cannot predict our future revenue with certainty because of many factors outside of our control, including the economic downturn that began in 2008 and continued during 2009. A significant revenue or profit decline, lowered forecasts or volatility in our operating results could cause the market price of our common stock to decline substantially. Factors that could affect our revenue and operating results include the following:
|
·
|
the possibility that our customers may cancel, defer or limit purchases as a result of reduced information technology budgets;
|
|
·
|
the possibility that our customers may defer purchases of our software applications in anticipation of new software applications or updates from us or our competitors;
|
|
·
|
the ability of our distributors, value-added resellers and OEMs to meet their sales objectives;
|
|
·
|
market acceptance of our new applications and enhancements;
|
|
·
|
our ability to control expenses;
|
|
·
|
changes in our pricing and distribution terms or those of our competitors;
|
|
·
|
the demands on our management, sales force and services infrastructure as a result of the introduction of new software applications or updates; and
|
|
·
|
the possibility that our business will be adversely affected as a result of the threat of terrorism or military actions taken by the United States or its allies.
|
Our expense levels are relatively fixed and are based, in part, on our expectations of our future revenue. If revenue levels fall below our expectations, our net income would decrease because only a small portion of our expenses varies with our revenue. Therefore, any significant decline in revenue for any period could have an immediate adverse impact on our results of operations for the period. We believe that period-to-period comparisons of our results of operations should not be relied upon as an indication of future performance. In addition, our results of operations could be below expectations of public market analysts and investors in future periods, which would likely cause the market price of our common stock to decline.
If securities analysts do not publish research or reports about our business or if they publish negative evaluations of our stock, the price of our stock could decline.
The trading market for our common stock relies in part on the research and reports that industry or financial analysts publish about us or our business. If one or more of the analysts covering us downgrade their evaluations of our stock, the price of our stock could decline. If one or more of these analysts cease coverage of our company, we could lose visibility in the market for our stock, which in turn could cause our stock price to decline.
We do not anticipate paying any dividends on our common stock.
We do not anticipate paying any cash dividends on our common stock in the foreseeable future. If we do not pay cash dividends, you could only receive a return on your investment in our common stock if the market price of our common stock increases before you sell your shares. In addition, the terms of our loan and security agreement restrict our ability to pay dividends.
Provisions in our organizational documents and in the Delaware General Corporation Law may prevent takeover attempts that could be beneficial to our stockholders.
Provisions in our charter and bylaws and in the Delaware General Corporation Law may make it difficult and expensive for a third party to pursue a takeover attempt we oppose even if a change in control of our company would be beneficial to the interests of our stockholders. Our board of directors has the authority to issue up to 20,000,000 shares of preferred stock in one or more series and to fix the powers, preferences and rights of each series without stockholder approval. The ability to issue preferred stock could discourage unsolicited acquisition proposals or make it more difficult for a third party to gain control of our company, or otherwise could adversely affect the market price of our common stock. Further, as a Delaware corporation, we are subject to Section 203 of the Delaware General Corporation Law. This section generally prohibits us from engaging in mergers and other business combinations with stockholders that beneficially own 15% or more of our voting stock, or with their affiliates, unless our directors or stockholders approve the business combination in the prescribed manner. However, because funds affiliated with ABS Capital Partners acquired their shares prior to our initial public offering, Section 203 is currently inapplicable to any business combination or transaction with it or its affiliates.
|
Unresolved Staff Comments.
|
Not applicable.
|
Properties.
|
We maintain our most significant leased office space in Indianapolis, Indiana. Our Indianapolis facility includes our main development operation, principal call center, sales support, and other corporate functions. In addition to our space in Indianapolis, we also maintain other offices, all of which are much smaller and we believe more easily replaceable, and none of which have significant customized features. We also maintain leased office space in Montreal and Toronto, Canada as part of our development organization. Our Southborough, Massachusetts and Hoboken, New Jersey offices generally provide corporate support for the organization. Our office located in Paris, France is our main sales and services office for our Europe, Africa and Middle East region. Our offices in Worcester, United Kingdom, Frankfurt, Germany, Singapore, Shanghai, China, Hong Kong, China and Dubai, United Arab Emirates generally serve our sales and services organization.
We have 45,429 square feet of office space in Indianapolis pursuant to a lease that was to expire in 2010. Effective October 2009, we signed a new lease agreement which replaced the previous agreement. The current lease agreement expires in 2017. We believe that all of our current facilities are suitable and adequate to meet our near term needs and could be replaced if necessary.
|
Legal Proceedings.
|
We currently have no material legal proceedings pending.
|
Reserved
|
PART II
|
Market for Registrant’s Common Equity, Related Stockholder Matters and Issuer Purchases of Equity Securities.
|
Since December 15, 2006, our common stock has traded on the NASDAQ Global Market under the symbol “DBTK.” Effective January 4, 2010, we began trading on the NASDAQ Global Select Market. Prior to trading on the NASDAQ Global Market on December 15, 2006 our common stock was not listed or quoted on any national exchange or market system.
The following table sets forth, for the periods indicated, the high and low sale price for our common stock as reported on the NASDAQ Global Market.
|
High
|
Low
|
|||||||
|
Year ended December 31, 2009
|
||||||||
|
1st Quarter (January 1 through March 31)
|
$ | 9.15 | $ | 5.56 | ||||
|
2nd Quarter (April 1 through June 30)
|
$ | 9.46 | $ | 6.70 | ||||
|
3rd Quarter (July 1 through September 30)
|
$ | 10.35 | $ | 8.12 | ||||
|
4th Quarter (October 1 through December 31)
|
$ | 10.49 | $ | 8.80 | ||||
|
Year ended December 31, 2008
|
||||||||
|
1st Quarter (January 1 through March 31)
|
$ | 21.80 | $ | 10.15 | ||||
|
2nd Quarter (April 1 through June 30)
|
$ | 14.91 | $ | 10.28 | ||||
|
3rd Quarter (July 1 through September 30)
|
$ | 13.79 | $ | 9.75 | ||||
|
4th Quarter (October 1 through December 31)
|
$ | 9.59 | $ | 6.22 | ||||
On February 26, 2010, the last sale price reported on the NASDAQ Global Select Market for our common stock was $8.87.
Stockholders
As of February 26, 2010, there were 149 holders of record of our common stock.
Dividends
We did not pay cash dividends on our common stock in 2009 or 2008 and we do not anticipate that we will pay cash dividends on our common stock in the foreseeable future. Future declaration and payment of dividends, if any, on our common stock will be determined by our board of directors in light of factors the board of directors deems relevant, including our earnings, operations, capital requirements and financial condition and restrictions in our financing agreements. In addition, the terms of our loan and security agreement with Silicon Valley Bank restrict our ability to pay dividends.
Securities Authorized for Issuance under Equity Compensation Plans
Information regarding securities authorized for issuance under our equity compensation plans is included in Item 12 of this annual report.
Performance Graph
The graph set forth below compares the cumulative total stockholder return on our common stock between December 15, 2006 (the date our common stock initially began trading on the NASDAQ Global Market) and December 31, 2009, with the cumulative total return of (i) the NASDAQ Composite Index and (ii) the NASDAQ Technology Index, over the same period. This graph assumes the investment of $100,000 on December 15, 2006 in our common stock, the NASDAQ Composite Index and the NASDAQ Technology Index, and assumes the reinvestment of dividends, if any. The graph assumes the initial value of our common stock on December 15, 2006 was the closing price of $12.66 per share. The comparisons shown in the graph below are based upon historical data. We caution that the stock price performance shown in the graph below is not necessarily indicative of, nor is it intended to forecast, the potential future performance of our common stock.
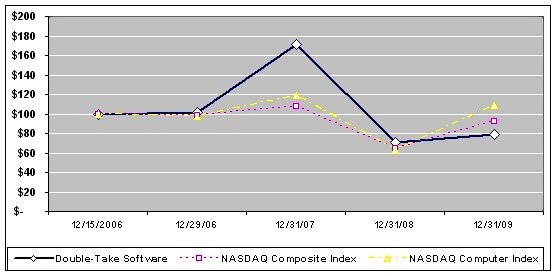
|
12/15/2006
|
12/29/2006
|
12/31/2007
|
12/31/2008
|
12/31/2009
|
||||||||||||||||
|
Double-Take Software
|
$ | 100.0 | $ | 101.7 | $ | 171.6 | $ | 70.9 | $ | 78.9 | ||||||||||
|
NASDAQ Composite Index
|
$ | 100.0 | $ | 98.3 | $ | 107.6 | $ | 64.2 | $ | 92.3 | ||||||||||
|
NASDAQ Technology Index
|
$ | 100.0 | $ | 97.0 | $ | 119.0 | $ | 63.4 | $ | 108.4 | ||||||||||
Issuer Purchases of Equity Securities
None.
|
Selected Financial Data.
|
The following selected consolidated financial data should be read in conjunction with our audited consolidated financial statements and related notes thereto and with Management’s Discussion and Analysis of Financial Condition and Results of Operations, which are included elsewhere in this annual report. The consolidated income statement data for the years ended December 31, 2009, 2008 and 2007, and the selected consolidated balance sheet data as of December 31, 2009 and 2008 are derived from, and are qualified by reference to, the audited consolidated financial statements included in the annual report. The consolidated statement of operations data for the years ended December 31, 2006 and 2005, and the consolidated balance sheet data as of December 31, 2007, 2006, and 2005 are derived from audited consolidated financial statements which are not included in the Annual Report.
|
Year Ended December 31,
|
|||||||||||||||||||
|
(in thousands)
|
|||||||||||||||||||
|
2009
|
2008
|
2007
|
2006
|
2005
|
|||||||||||||||
|
Statement of Operations Data:
|
|||||||||||||||||||
|
Revenue:
|
|||||||||||||||||||
|
Software licenses
|
$
|
40,100
|
$
|
52,923
|
$
|
49,169
|
$
|
38,418
|
$
|
26,222
|
|||||||||
|
Maintenance and professional services
|
43,137
|
43,380
|
33,599
|
22,422
|
14,488
|
||||||||||||||
|
Total revenue
|
83,237
|
96,303
|
82,768
|
60,840
|
40,710
|
||||||||||||||
|
Cost of revenue:
|
|||||||||||||||||||
|
Software licenses
|
462
|
589
|
411
|
1,355
|
38
|
||||||||||||||
|
Maintenance and professional services
|
8,445
|
9,622
|
7,827
|
6,193
|
4,357
|
||||||||||||||
|
Total cost of revenue
|
8,907
|
10,211
|
8,238
|
7,548
|
4,395
|
||||||||||||||
|
Gross profit
|
74,330
|
86,092
|
74,530
|
53,292
|
36,315
|
||||||||||||||
|
Operating expenses:
|
|||||||||||||||||||
|
Sales and marketing
|
32,371
|
34,928
|
28,872
|
22,211
|
17,191
|
||||||||||||||
|
Research and development
|
15,275
|
16,540
|
11,896
|
10,679
|
9,748
|
||||||||||||||
|
General and administrative
|
12,547
|
13,419
|
14,863
|
11,824
|
6,730
|
||||||||||||||
|
Depreciation and amortization
|
3,986
|
3,638
|
2,346
|
1,613
|
805
|
||||||||||||||
|
Legal fees and settlement costs
|
—
|
—
|
—
|
—
|
5,671
|
||||||||||||||
|
Total operating expenses
|
64,179
|
68,525
|
57,977
|
46,327
|
40,145
|
||||||||||||||
|
Operating income (loss)
|
10,151
|
17,567
|
16,553
|
6,965
|
(3,830
|
)
|
|||||||||||||
|
Interest income
|
327
|
1,695
|
3,019
|
319
|
83
|
||||||||||||||
|
Interest expense
|
(11
|
)
|
(29
|
)
|
(49
|
)
|
(91
|
)
|
(36
|
)
|
|||||||||
|
Foreign exchange (loss) gain
|
(135
|
)
|
(864
|
)
|
(234
|
)
|
56
|
—
|
|||||||||||
|
Income (loss) before income taxes
|
10,332
|
18,369
|
19,289
|
7,249
|
(3,783
|
)
|
|||||||||||||
|
Income tax expense (benefit)
|
(3,127
|
)
|
724
|
(789
|
)
|
494
|
—
|
||||||||||||
|
Net income (loss)
|
13,459
|
17,645
|
20,078
|
6,755
|
(3,783
|
)
|
|||||||||||||
|
Less:
|
|||||||||||||||||||
|
Accretion of preferred stock
|
—
|
—
|
—
|
(4,496
|
)
|
(5,332
|
)
|
||||||||||||
|
Dividends on preferred stock
|
—
|
—
|
—
|
(2,830
|
)
|
(2,686
|
)
|
||||||||||||
|
Net income (loss) attributable to common stockholders
|
$
|
13,459
|
$
|
17,645
|
$
|
20,078
|
$
|
(571
|
)
|
$
|
(11,801
|
)
|
|||||||
|
Net income (loss) per share attributable to common stockholders:
|
|||||||||||||||||||
|
Basic
|
$
|
0.60
|
$
|
0.80
|
$
|
0.94
|
$
|
(0.13
|
)
|
$
|
(3.11
|
)
|
|||||||
|
Diluted
|
$
|
0.58
|
$
|
0.76
|
$
|
0.87
|
$
|
(0.13
|
)
|
$
|
(3.11
|
)
|
|||||||
|
Weighted-average number of shares used in per share amounts:
|
|||||||||||||||||||
|
Basic
|
22,325
|
21,971
|
21,332
|
4,306
|
3,789
|
||||||||||||||
|
Diluted
|
23,284
|
23,173
|
23,027
|
4,306
|
3,789
|
||||||||||||||
|
December 31,
|
||||||||||||||||||||
|
(in thousands)
|
||||||||||||||||||||
|
2009
|
2008
|
2007
|
2006
|
2005
|
||||||||||||||||
|
Balance Sheet Data:
|
||||||||||||||||||||
|
Current assets:
|
||||||||||||||||||||
|
Cash and cash equivalents
|
$
|
57,974
|
$
|
40,659
|
$
|
25,748
|
$
|
55,170
|
$
|
8,341
|
||||||||||
|
Short term investments
|
38,246
|
32,524
|
38,977
|
—
|
—
|
|||||||||||||||
|
Working Capital
|
86,624
|
70,945
|
56,807
|
42,674
|
(2,256
|
)
|
||||||||||||||
|
Total Assets
|
151,931
|
131,431
|
114,606
|
77,026
|
18,590
|
|||||||||||||||
|
Deferred revenue
|
25,977
|
26,469
|
24,162
|
16,744
|
10,562
|
|||||||||||||||
|
Long-term deferred revenue
|
4,726
|
4,614
|
4,485
|
3,977
|
2,887
|
|||||||||||||||
|
Long-term deferred rent
|
144
|
117
|
272
|
406
|
518
|
|||||||||||||||
|
Long-term capital lease obligations
|
—
|
9
|
13
|
17
|
7
|
|||||||||||||||
|
Redeemable convertible preferred stock
|
—
|
—
|
—
|
—
|
50,561
|
|||||||||||||||
|
Total stockholders’ equity (deficit)
|
$
|
114,071
|
$
|
93,410
|
$
|
75,544
|
$
|
45,230
|
$
|
(54,307
|
)
|
|||||||||
|
Management’s Discussion and Analysis of Financial Condition and Results of Operations.
|
You should read the following discussion and analysis together with our historical financial statements and the related notes included elsewhere in this annual report.
Overview
Double-Take Software develops, sells and supports affordable software that allows IT organizations of all sizes to move, manage, protect and recover workloads across any distance and any combination of physical and virtual server environments As enterprise IT systems evolve the ability to manage information freely, intelligently and securely becomes critical. Our hardware- and application-independent software benefits these infrastructures by efficiently protecting, moving and recovering data created by any application on almost any type or brand of disk storage on any brand of server running on Microsoft Windows operating systems as well many versions of the Linux operating system. In addition we offer an alternative to Virtual Desktop Infrastructure solutions, making desktop administration and provisioning easy, and reducing drastically the desktop total cost of ownership.
We believe that we are the leading supplier of replication software for Microsoft server environments and that our business is distinguished by our focus on software license and recurring maintenance sales, our productive distribution network and our efficient services infrastructure.
Our success has been driven in large part by our flagship “Double-Take” software technology, which was first released in 1995 and has been enhanced by years of customer feedback and is now called Double-Take Availability. Double-Take Availability, among other things, continuously replicates software and data changes made on a primary operating server to a duplicate server at a different location. Because the duplicate server can commence operating in place of the primary server at almost any time, Double-Take Availability facilitates rapid failover and application recovery in the event of a disaster or other service interruption.
The disaster recovery market has been our primary historical focus, but as a result of acquisitions and internal development, we are expanding into adjacent markets for system migrations, back-up and network booting. With our acquisition of TimeSpring Software Corporation in December 2007, now known as Double-Take Canada, and its TimeData products, now included in Double-Take Backup, we can also recover data from almost any point in time from a repository located on- or off-site. In July 2008, we acquired emBoot, Inc. which is now a part of Double-Take Canada, and which specializes in network booting technology. The technology acquired with emBoot, now included in Double-Take Flex, allows organizations to easily assign and re-assign computing workloads to any available Windows or Linux physical servers or desktops or any virtual machine in their environment. IT organizations can now move those workloads around in a matter of minutes, whether it is because a disaster has occurred, a data center is moving, the company has decided to virtualize its infrastructure or an application needs more capacity. Double-Take Move, released in April 2009, is a server migration product that can migrate live server workloads across physical and virtual platforms. Double-Take Cloud, released in February 2010, allows for the recovery of data, applications, and operating systems, and rapid recovery of workloads into an automatically provisioned Amazon virtual machine.
Effect of Recent Market Conditions and Uncertain Economic Environment on our Business
In 2009, for the first time since 2004, we experienced decreased revenue in a fiscal year as compared to the prior year. Additionally, 2009 was the second consecutive year we have experienced decreased net income as compared to the prior year. Total revenue decreased by $13.1 million or 14% as compared to 2008. Our 2009 operating profit decreased $4.3 million or 6% as compared to 2008. Our 2009 net income decreased $4.2 million or 24% as compared to 2008. This decrease is primarily related to the decline in revenue during 2009, which we believe is primarily due to the economic downturn. During 2009 we continued to experience the effects of worsening economic conditions that began in the second half of 2008, which continued to be further exacerbated by customer-specific challenges and significant disruptions in the financial and credit markets globally. We experienced order delays, lengthening sales cycles and slowing deployments worldwide, which resulted in decreased total revenue as compared to 2008.
Significant uncertainty around current macroeconomic and industry conditions persists, particularly the effect these conditions and any sustained lack of liquidity in the capital markets may have upon the capital spending of our customers. Moreover, we are uncertain of the impact of any near-term change of enterprise and consumer spending and behavior, in response to these market conditions, may have on the spending or financial position of our customers. The level of competition we face during periods of economic weakness can be expected to increase. We cannot be certain how long these conditions will continue and the magnitude of their effects on our business and results of operations. Consequently, these conditions have negatively affected visibility of our business and made our forecasting and planning more difficult.
While we expect the near term market conditions to continue to be challenging, we continue to believe in our ability to execute our business plan in the near term and our longer term market opportunities. We believe the need for organizations to protect, recover and maintain their data, applications and operating systems and affordable software that enables companies to move, protect and recover workloads will require our current customers as well as new customers to continue to invest in their infrastructure. As a result, we intend to continue to prudently invest in our business, through continued product development and sales and marketing efforts. While the company's sales pipelines are as robust as they have ever been and support generating revenue and net income in 2010, the predictability of closure on those pipelines is uncertain. Therefore financial performance for 2010 is difficult to predict, including the predictability of the extent of any revenue growth and the extent of net income.
Some Important Aspects of Our Operations
We license our software under perpetual licenses to end-user customers directly and to a network of distributors, value-added resellers and original equipment manufacturers, or OEMs. Our distributors primarily sell our software to our resellers. Our resellers bundle or sell our software together with their own products and also sell our software independently. Our OEMs market, sell and support our software and services on a stand-alone basis and incorporate our software into their own hardware and software products.
Software sales made to or through our distributors, value-added resellers and OEMs generated approximately 91% of total software sales in 2009. Of the software sales made to or through our indirect sources, approximately 18% were made to our distributors for sale to value-added resellers, approximately 66% of which were made directly through resellers and approximately 7% were made through OEMs, primarily Hewlett-Packard Co. During 2009, approximately 9% of our software sales were made solely by our direct sales force. We believe that we will need to continue to maintain close relationships with our partners to continue to generate sales. We have no current plans to focus future sales concentration on one distribution channel versus another. We believe our direct sales force complements our indirect distribution network.
In 2009, the median price of sales of Double-Take software licenses to customers was approximately $3,800 compared to $5,900 in 2008 and $5,000 in 2007. The decrease in median price of sales was primarily a result of the mix of products sold in 2009 as compared to prior years. The average sales cycle was approximately three to five months compared to an average sales cycle of less than three months in 2007 and 2006. The pricing of our product did not materially change from 2003 through 2006. On May 1, 2007 and December 1, 2007, we implemented a nominal price increase across all of our products except in a few international markets where the price was already commensurate with the nominal price increase implemented in the United States. We believe that our pricing and sales cycles have contributed to more balanced sales throughout the year. We believe that the affordability of our software is a competitive advantage.
Double-Take EMEA has continued to provide us with a direct presence in the European, Middle Eastern and African markets, as well as provide the opportunity to further our strategic initiative to increase revenue generated outside of the United States. Our acquisition of Double-Take Canada, which included TimeSpring and emBoot, helped broaden the development efforts of our products. As a result, in the first quarter of 2009 we released Double-Take Flex which includes the technology acquired with the emBoot acquisition and in the fourth quarter of 2009, we released Double-Take Backup which includes the technology acquired with the TimeSpring acquisition. We expect substantially all of the on-going expenses of Double-Take Canada will be related to research and development and to a lesser extent depreciation and amortization.
Revenue
We derive revenue from sales of perpetual licenses for our software and from maintenance and professional services.
Software Licenses. We derive the majority of our revenue from sales of perpetual licenses of our software applications, which allow our customers to use the software indefinitely. We do not customize our software for a specific end user customer. We recognize revenue from sales of perpetual licenses generally upon shipment of the software. Our software revenue is reported net of rebates and discounts because we do not receive an identifiable benefit in exchange for the rebate or discount.
Our software revenue generated approximately 48%, 55% and 59% of our total revenue in 2009, 2008 and 2007, respectively. Our software revenue generally experiences some seasonality. We believe that many organizations do not make the bulk of their information technology purchases, including software, in the first quarter of any year. We believe that this historically has generally resulted in lower revenue generated by software sales in our first quarter of any year. Historically, we have also experienced lower revenue in the summer months. Due to the economic downturn that started in the second half of 2008 and continued through 2009, our quarterly revenue predictability has decreased significantly. As a result, future quarterly revenue may trend differently than it has historically. Currently predicting the quarterly revenue trending remains challenging, but we believe that in line with our historical seasonality the first quarter of 2010 should be the weakest quarter of the year.
Maintenance and Professional Services. We also generate revenue by providing our customers with maintenance comprised of software updates and product support. We generally include our maintenance for a designated period in the price of the software at the time of sale. In addition, some of our customers enter into a maintenance agreement for periods longer than a year. These agreements entitle our customers to software updates on a when-and-if-available basis and product support for an annual fee based on the licenses purchased and the level of service subscribed. Almost all of our customers that purchase maintenance pay the entire amount payable under the agreement in advance, although we recognize maintenance revenue ratably over the term of the agreement.
In some cases, most often in connection with the licensing of our software, we provide professional services to assist our customers in strategic planning for disaster recovery and high availability application, the installation of our software and the training of their employees to use our software. We provide most of our professional services on a fixed price basis and we generally recognize the revenue for professional services once we complete the engagement. For any paid professional services, including training, that have not been performed within three years of the original invoice date, we recognize the services as revenue in the quarter that is three years after original invoice date.
Of total maintenance and professional services revenue, maintenance revenue represented 93%, 90% and 87% in 2009, 2008 and 2007, respectively. Professional services generated the remainder of our total maintenance and professional services revenue in these periods.
Of our total revenue, maintenance revenue represented 48%, 41% and 35% in 2009, 2008 and 2007, respectively. Professional services accounted for 4%, 4% and 6% of our total revenue 2009, 2008 and 2007, respectively. Our maintenance and professional services revenue historically has generated lower gross margins than our software revenue. The gross margin generated by our maintenance and professional services revenue was 80%, 78% and 77% in 2009, 2008 and 2007, respectively. We have focused on increasing our maintenance revenue and we believe it has increased more rapidly than license revenue due to maintenance price increases and increased renewal rates attributable to focused sales efforts and the inclusion of significant new functionality in the product at no charge for licenses on which maintenance has been purchased. As the percentage of total revenue attributable to maintenance increases, our overall gross margins will be adversely affected. Additionally, as a result of the current economic downturn, companies may decide not to renew their annual maintenance. Should this happen, maintenance and professional services revenue may decrease.
Cost of Revenue
Our cost of revenue primarily consists of the following:
Cost of Software Revenue. Cost of software revenue consists primarily of media, manual, translation and distribution costs, and royalties to third-party software developers for technology embedded within our software. Because our development initiatives have resulted in insignificant time and costs incurred between technological feasibility and the point at which the software is ready for general release, we do not capitalize any of our internally-developed software.
Cost of Services Revenue. Cost of services revenue consists primarily of salary and other personnel-related costs incurred in connection with our provision of maintenance and professional services. Cost of services revenue also includes other allocated overhead expenses for our professional services and product support personnel, as well as travel-related expenses for our staff to perform work at a customer’s site.
Operating Expenses
We classify our operating expenses as follows:
Sales and Marketing. Sales and marketing expenses primarily consist of the following:
· personnel and related costs for employees engaged in sales, corporate marketing, product marketing and product management with partners in our distribution network, including salaries, commissions and other incentive compensation, including equity-based compensation, related employee benefit costs and allocated overhead expenses;
· travel related expenses to meet with existing and potential customers, and for other sales and marketing related purposes; and
· sales promotion expenses, public relations expenses and costs for marketing materials and other marketing events, including trade shows, industry conventions and advertising, and marketing development funds for our distribution partners.
Research and Development. Research and development expenses primarily represent the expense of developing new software and modifying existing software. These expenses primarily consist of the following:
· personnel and related costs, including salaries, employee benefits, equity and other incentive compensation and allocated overhead expenses, for research and development personnel, including software engineers, software quality assurance engineers and systems engineers; and
· contract labor expense and consulting fees paid to independent consultants and others who provide software engineering services to us, as well as other expenses associated with the design and testing of our software.
To date, our research and development efforts have been primarily devoted to increases in features and functionality of our existing software. We expect research and development expense to increase in the future as we continue to develop new solutions for our customers. We expect research and development expense to increase as a percentage of revenue in 2010 as we continue to invest in product development efforts.
General and Administrative. General and administrative expenses represent the costs and expenses of managing and supporting our operations. General and administrative expenses consist primarily of the following:
· personnel and related costs including salaries, employee benefits, equity and other incentive compensation and allocated overhead expenses, for our executives, finance, human resources, corporate information technology systems, strategic business, corporate quality, corporate training and other administrative personnel;
· legal and accounting professional fees;
· recruiting and training costs;
· travel related expenses for executives and other administrative personnel; and
· computer maintenance and support for our internal information technology system.
We generally expect general and administrative expenses to remain substantially similar or slightly decrease as a percentage of revenue for the foreseeable future.
Depreciation and Amortization. Depreciation and amortization expense consists of depreciation expense primarily for computer equipment we use for information services and in our development and test labs, and amortization of intangible assets acquired.
Legal Fees and Settlement Costs. In December 2005, we agreed to terms for settlement of a legal proceeding with a provider of information storage systems that involved claims regarding some of the intellectual property used in our software. Pursuant to a settlement agreement entered into in January 2006, we paid $3.8 million in January 2006, which represented our initial settlement payment in connection with the resolution of this matter, and we agreed to pay the other company an additional $0.5 million in each of January 2007, 2008, 2009 and 2010. The settlement provided that our obligation to make these future payments would be reduced on a dollar-for-dollar basis to the extent that we purchased or resold the other company’s products. We satisfied our obligation to make the payments through the purchase of computer equipment in the amount of $2.0 million through December 31, 2009. As a result, our obligation was fulfilled as of December 31, 2009. Our obligation to make these payments was collateralized by a letter of credit from Silicon Valley Bank, which was subsequently cancelled in 2009 when our obligation was fulfilled.
The following table sets forth our revenue, costs of revenue and other selected financial data for the specified periods and as a percentage of our total revenue for those periods.
|
Year Ended December 31,
|
||||||||||||
|
2009
|
2008
|
2007
|
||||||||||
|
(In thousands)
|
||||||||||||
|
Revenue:
|
||||||||||||
|
Software licenses
|
$ |
40,100
|
$
|
52,923
|
$
|
49,169
|
||||||
|
Maintenance and professional services
|
43,137
|
43,380
|
33,599
|
|||||||||
|
Total revenue
|
83,237
|
96,303
|
82,768
|
|||||||||
|
Cost of revenue:
|
||||||||||||
|
Software licenses
|
462
|
589
|
411
|
|||||||||
|
Maintenance and professional services
|
8,445
|
9,622
|
7,827
|
|||||||||
|
Total cost of revenue
|
8,907
|
10,211
|
8,238
|
|||||||||
|
Gross profit
|
74,330
|
86,092
|
74,530
|
|||||||||
|
Operating expenses:
|
||||||||||||
|
Sales and marketing
|
32,371
|
34,928
|
28,872
|
|||||||||
|
Research and development
|
15,275
|
16,540
|
11,896
|
|||||||||
|
General and administrative
|
12,547
|
13,419
|
14,863
|
|||||||||
|
Depreciation and amortization
|
3,986
|
3,638
|
2,346
|
|||||||||
|
Total operating expenses
|
64,179
|
68,525
|
57,977
|
|||||||||
|
Income from operations
|
10,151
|
17,567
|
16,553
|
|||||||||
|
Interest income
|
327
|
1,695
|
3,019
|
|||||||||
|
Interest expense
|
(11
|
)
|
(29
|
)
|
(49
|
)
|
||||||
|
Foreign exchange gain (loss)
|
(135
|
)
|
(864
|
)
|
(234
|
)
|
||||||
|
Income before income taxes
|
10,332
|
18,369
|
19,289
|
|||||||||
|
Income tax expense (benefit)
|
(3,127
|
)
|
724
|
(789
|
)
|
|||||||
|
Net income (loss)
|
$ |
13,459
|
$
|
17,645
|
$
|
20,078
|
||||||
|
Year Ended December 31,
|
||||||||||||
|
2009
|
2008
|
2007
|
||||||||||
|
Revenue:
|
||||||||||||
|
Software licenses
|
48
|
%
|
55
|
%
|
59
|
%
|
||||||
|
Maintenance and professional services
|
52
|
%
|
45
|
%
|
41
|
%
|
||||||
|
Total revenue
|
100
|
%
|
100
|
%
|
100
|
%
|
||||||
|
Cost of revenue:
|
||||||||||||
|
Software licenses
|
1
|
%
|
1
|
%
|
—
|
|||||||
|
Maintenance and professional services
|
10
|
%
|
10
|
%
|
10
|
%
|
||||||
|
Total cost of revenue
|
11
|
%
|
11
|
%
|
10
|
%
|
||||||
|
Gross profit
|
89
|
%
|
89
|
%
|
90
|
%
|
||||||
|
Operating expenses:
|
||||||||||||
|
Sales and marketing
|
39
|
%
|
36
|
%
|
35
|
%
|
||||||
|
Research and development
|
18
|
%
|
17
|
%
|
14
|
%
|
||||||
|
General and administrative
|
15
|
%
|
14
|
%
|
18
|
%
|
||||||
|
Depreciation and amortization
|
5
|
%
|
4
|
%
|
3
|
%
|
||||||
|
Total operating expenses
|
77
|
%
|
71
|
%
|
70
|
%
|
||||||
|
Income from operations
|
12
|
%
|
18
|
%
|
20
|
%
|
||||||
|
Interest income
|
—
|
%
|
2
|
%
|
3
|
%
|
||||||
|
Interest expense
|
—
|
—
|
—
|
|||||||||
|
Foreign exchange (loss) gain
|
—
|
%
|
(1
|
)%
|
—
|
|||||||
|
Income before income taxes
|
12
|
%
|
19
|
%
|
23
|
%
|
||||||
|
Income tax expense (benefit)
|
(4
|
)%
|
1
|
%
|
(1
|
)%
|
||||||
|
Net income
|
16
|
%
|
18
|
%
|
24
|
%
|
||||||
2009 Compared to 2008
Revenue
We derive our revenue from sales of our products and support and services. Revenue decreased 14% to $83.2 million in 2009 from $96.3 million in 2008. The decrease in revenue is a direct result of the economic downturn which began in the second half of 2008 and continued through 2009. Companies reduced their IT spending partly in response to the disruption in the financial and credit markets globally and as a means to conserve their own cash.
Effect of Changing Foreign Currency Exchange Rates on Revenue. During the year ended December 31, 2009 as compared to the year ended December 31, 2008, the United States dollar was stronger than the euro, the pound sterling and the Canadian dollar. As a result, revenue decreased by approximately 3% during the year ended December 31, 2009 from what it would have during the time period had foreign currency exchange rates remained constant from the year ended December 31, 2008. The overall fluctuation in revenue, which includes the effect of foreign currency exchange rates, is described below.
Software License Revenue. Software revenue decreased $12.8 million, or 24%, from $52.9 million in 2008 to $40.1 million in 2009. The decrease in software revenue was primarily related to less IT spending directly related to the economic downturn. Even though total software revenue decreased, approximately $1.1 million of sales were associated with new products in 2009 including Double-Take Flex and Double-Take Move.
Maintenance and Professional Services Revenue. Maintenance and professional services revenue decreased $0.2 million, or 1%, from $43.4 million in 2008 to $43.1 million in 2009. Maintenance and professional services revenue represented 52% of our total revenue in 2009 and 45% of our total revenue in 2008. Maintenance revenue increased $0.7 million, or 2%, from $39.2 million in 2008 to $39.9 million in 2009. The increase in maintenance revenue was attributable to sales to our expanding base of customers and continued maintenance revenue from our existing customers. Professional services revenue decreased $1.0 million, or 24%, from $4.2 million in 2008 to $3.2 million in 2009. The decrease in professional services revenue was due to fewer professional service deliveries due to fewer professional services being sold as well as due to the timing of scheduling of the service.
Cost of Revenue and Gross Profit
Total cost of revenue decreased $1.3 million, or 13%, from $10.2 million in 2008 to $8.9 million in 2009. Total cost of revenue represented 11% of our total revenue in 2009 and 2008.
Cost of software revenue decreased $0.1 million, or 22%, from $0.6 million in 2008 to $0.5 million in 2009. The decrease was a result of decreased royalties paid to third parties related to software included in our product primarily as a result of our decreased sales. Cost of software revenue was 1% of total revenue in 2009 and 2008.
Cost of services revenue decreased $1.2 million, or 12%, from $9.6 million in 2008 to $8.4 million in 2009. The decrease was primarily related to a decrease of approximately $0.7 million of personnel expenses directly related to a temporary salary decrease of approximately 10% effective for three months during 2009, decreased bonus expense directly related to reduced revenue and profitability and the discontinued employer match to the 401(k) plan, as well as the effects of foreign currency (see Effect of Changing Foreign Currency Rates on Expenses below). This decrease was partially offset by increased health insurance benefits of approximately $0.2 million. Additionally as a result of our continued cost control efforts, travel and consulting expense decreased by approximately $0.5 million. Cost of services revenue represented 20% of our services revenue in 2009 and 22% of our services revenue in 2008.
Gross profit decreased $11.8 million, or 14%, from $86.1 million in 2008 to $74.3 million in 2009. The decrease is due primarily to the drop in revenue during 2009. Gross margin remained constant at 89% in 2009 as compared to 2008.
Operating Expenses
Effect of Changing Foreign Currency Exchange Rates on Expenses. During the year ended December 31, 2009 as compared to the year ended December 31, 2008, the United States dollar was stronger than the euro, the pound sterling and the Canadian dollar. As a result, operating expenses decreased by approximately 2% during the year ended December 31, 2009 from what they would have been during the time period had foreign currency exchange rates remained constant from the year ended December 31, 2008. The overall fluctuation in operating expenses, which includes the effect of foreign currency exchange rates, is described below.
Sales and Marketing. Sales and marketing expenses decreased $2.6 million, or 7%, from $34.9 million in 2008 to $32.4 million in 2009. The decrease was substantially due to decreased bonus and commission expense of approximately $2.0 million directly related to decreased revenue and profitability. As a result of our continued cost control efforts, travel expense decreased by approximately $0.5 million and outside marketing and consulting expense decreased by approximately $0.6 million. As a further cost control measure, the employer match to the 401(k) plan was discontinued which resulted in an expense decrease of approximately $0.2 million. The decreased expenses were partially offset by increased compensation expense, including stock based compensation expense, and medical benefits of approximately $0.7 million primarily resulting from increased headcount during 2009. The increase in compensation was offset by a temporary salary reduction of approximately 10% effective for three months during 2009.
Research and Development. Research and development expenses decreased $1.3 million, or 8%, from $16.5 million in 2008 to $15.3 million in 2009. The decrease in expenses is a result of decreased bonus expense of approximately $0.4 million directly related to decreased revenue and profitability. As a result of our continued cost control efforts, third party development expense and travel expense decreased by approximately $0.7 million. As a further cost control measure, the employer match to the 401(k) plan was discontinued which resulted in an expense decrease of approximately $0.2 million. Compensation expense, including stock based compensation, increased approximately $0.1 million. The increase was a result of compensation expense related to emBoot of approximately $0.3 million. The increase in compensation expense was offset by a temporary salary decrease of approximately 10% effective for three months during 2009.
General and Administrative. General and administrative expenses decreased $0.9 million, or 7%, from $13.4 million in 2008 to $12.5 million in 2009. Personnel expenses decreased by approximately $0.5 million due to decreased headcount and a temporary salary reduction of approximately 10% effective for three months during 2009, partially offset by an increase in medical benefits of $0.1 million and stock based compensation expense of $0.1 million. Additionally, bonus expense decreased by $0.3 million directly related to decreased revenue and profitability. As a result of our continued cost control efforts, third party consulting expense and travel expense decreased by approximately $0.4 million. As a result of our collection efforts, bad debt expense decreased by $0.3 million. The expense decreases were partially offset by an increase of approximately $0.2 million legal and accounting fees.
Depreciation and Amortization. Depreciation and amortization expense increased $0.4 million, or 10%, from $3.6 million in 2008 to $4.0 million in 2009. The increase was attributable to increased depreciation expense of $0.1 million associated with increased capital expenditures, which were primarily for product development and other computer-related equipment, as well as increased amortization expense of $0.3 million related to amortization of the intangible assets acquired as part of the Double-Take Canada and emBoot acquisitions.
Interest Income
Interest income decreased $1.4 million from $1.7 million in 2008 to $0.3 million in 2009. While our cash and short term investments increased $23.0 million from December 31, 2008 to December 31, 2009, our interest income decreased. The decrease was a result of lower returns on our cash and short term investments that matured in 2009 and were reinvested at lower rates than in 2008. The cash and short term investments were reinvested substantially in cash management funds, United States treasury notes and bonds and corporate notes. During 2010, should interest rates continue to remain at lower or even similar levels than those experienced in 2009, we expect our interest income to remain at the lower amounts attained in during 2009.
Foreign Exchange gains (losses)
Foreign currency losses decreased to $0.2million in 2009 from a $0.9 million loss in 2008. The foreign currency fluctuations are substantially related to Double-Take EMEA. During 2009, the loss occurred on assets we had which were denominated in pounds sterling in Europe. These assets were converted to Euros and then subsequently to US dollars for financial statement reporting purposes. In the fourth quarter of 2008, we had a reorganization of the legal entity structure of Double-Take EMEA. The reorganization of the entities reduced the amount of Double-Take EMEA assets denominated in pounds sterling therefore reducing our exposure to currency fluctuations between the pound sterling and the euro. We may from time to time have assets which are denominated in currencies other than the functional currency of the Double-Take EMEA entity. As a result, we do still have exposure to currency exchange rate fluctuations.
Income Tax Expense (benefit)
Income tax expense was $0.7 million in 2008 and a benefit of $3.1 million in 2009. During 2008, we recorded a current tax expense of $9.3 million, excluding the benefit of net operating loss carryforwards, related to income generated during the period using an effective tax rate for the full year. During the fourth quarter of 2008, based upon newly available information, we re-evaluated our ability to utilize the benefit from our net operating loss carryforwards. We concluded that we would be able to utilize our net operating loss carryforwards more quickly than originally anticipated. As a result, in 2008 we fully utilized the deferred tax asset recorded in 2007. As a result of our ability to utilize an increased amount of our net operating loss carryforwards in 2008, we reversed the valuation allowance on $3.6 million of deferred tax assets that was substantially utilized in 2008. At December 31, 2008, we evaluated whether we believed it was more likely than not that we would generate sufficient taxable income to further use the net operating loss carryforwards eligible to be utilized in 2009 and beyond. As a result, in the fourth quarter of 2008 we reversed an additional $5.0 million of the valuation allowance of the deferred tax assets. During 2009, we recorded a current tax expense of $5.6 million, excluding the benefit of net operating loss carryforwards, related to income generated during the period using the effective tax rate for the full year. During 2009, we concluded based upon profitability over the prior three years and evaluation of the 2010 expected taxable income, that it was more likely than not that net operating loss carryforwards and various deferred tax assets would be able to be utilized. As a result, an additional $8.7 million of the valuation allowance was reversed. The remaining valuation allowance of $6.1 million is primarily related to net operating loss carryforwards related to Canada and some state net operating loss carryforwards where we believe it currently is not more likely than not that these net operating loss carryforwards will be utilized. When further positive evidence exists that we will be able to utilize the available net operating loss carryforwards, we will reverse additional valuation allowance on the deferred tax assets.
In determining future taxable income, assumptions are made to forecast federal, state and international operating income, the reversal of temporary timing differences, and the implementation of any feasible and prudent tax planning strategies. The assumptions require significant judgment regarding the forecasts of future taxable income, and are consistent with forecasts used to manage the business. As of December 31, 2009, the valuation allowance against net deferred tax assets, which are primarily comprised of state net operating loss carryforwards resulting from operating losses incurred since inception and resulting from our acquisition of Double-Take Canada is approximately $6.1 million. Realization of deferred tax assets is dependent upon future earnings, if any, the timing of which is uncertain. Accordingly, the remaining net deferred tax assets are offset by the valuation allowance. If not utilized, the federal and state net operating loss and tax credit carryforwards will expire between 2017 and 2026. Utilization of these net operating losses and credit carryforwards are subject to annual limitations due to provisions of the Internal Revenue Code of 1986, as amended, that are applicable due to “ownership changes” that have occurred. The valuation allowance as of December 31, 2009 will be maintained until sufficient further positive evidence exists to support a reversal of, or decrease in, the valuation.
Net Income
Net income decreased $4.2 million from a net income of $17.6 million in 2008 to net income of $13.5 million in 2009. This decrease is primarily related to decreased revenue which resulted from the current economic downturn. Net income would have decreased at a rate greater than 24% in 2009 absent our continued focus on expense control and the income tax benefit recognized in 2009 due to the reversal of the valuation allowance on our deferred tax asset. Our operating expenses decreased 6% in 2009 as compared to an 18% increase in 2008. The focus on expense control was offset by lower returns on our cash and short term investments.
2008 Compared to 2007
Revenue
We derive our revenue from sales of our products and support and services. Revenue increased 16% to $96.3 million in 2008 from $82.8 million in 2007. Revenue in 2008 includes a full year of revenue from the acquisition of Double-Take Canada and revenue from the date of the acquisition of emBoot, which was July 28, 2008. Neither Double-Take Canada or emBoot had significant revenue in 2008.
Software License Revenue. Software revenue increased $3.8 million, or 8%, from $49.2 million in 2007 to $52.9 million in 2008. The increase in software revenue was primarily due to increased volume of $2.3 million attributable to broader demand for, and acceptance of, our software, $1.2 million from new products available during 2008 and $0.3 million from sales of the TimeData and emBoot products.
Maintenance and Professional Services Revenue. Maintenance and professional services revenue increased $9.8 million, or 29%, from $33.6 million in 2007 to $43.4 million in 2008. Maintenance and professional services revenue represented 45% of our total revenue in 2008 and 41% of our total revenue in 2007. Maintenance revenue increased $10.3 million, or 36%, from $28.9 million in 2007 to $39.2 million in 2008. The increase in maintenance revenue was attributable to higher sales to our expanding base of customers and continued maintenance revenue from our existing customers. Professional services revenue decreased $0.5 million, or 11%, from $4.7 million in 2007 to $4.2 million in 2008. The slight decrease in professional services revenue was due to fewer professional service deliveries due to fewer professional services being sold as well as due to the timing of scheduling of the service.
Cost of Revenue and Gross Profit
Total cost of revenue increased $2.0 million, or 24%, from $8.2 million in 2007 to $10.2 million in 2008. Total cost of revenue represented 11% of our total revenue in 2008 and 10% of our total revenue in 2007.
Cost of software revenue increased $0.2 million, or 43%, from $0.4 million in 2007 to $0.6 million in 2008. The increase was a result of increased royalties paid to third parties related to software included in our product. Cost of software revenue was 1% of total revenue in 2008 and nominal as a percent of total revenue in 2007.
Cost of services revenue increased $1.8 million, or 23%, from $7.8 million in 2007 to $9.6 million in 2008. The increase was primarily a result of an increase in personnel and stock based compensation expense of $1.6 million due to increased headcount and increased travel expense of $0.2 million. Cost of services revenue represented 22% of our services revenue in 2008 and 23% of our services revenue in 2007.
Gross profit increased $11.6 million, or 16%, from $74.5 million in 2007 to $86.1 million in 2008. Gross margin effectively remained constant at 89% in 2008 as compared to 90% in 2007. The slight decrease to gross profit is primarily a result of increased personnel costs in maintenance and professional services and less revenue growth than in prior years.
Operating Expenses
Sales and Marketing. Sales and marketing expenses increased $6.1 million, or 21%, from $28.9 million in 2007 to $34.9 million in 2008. The increase was substantially due to the combined increase of compensation expense and stock based compensation expense of $3.4 million and travel expense of $0.8 million related to an increase in personnel which included the reallocation of certain Double-Take EMEA resources from general and administrative because they are more directly related to the sales efforts in 2008. Additionally, marketing and advertising expense increased by $1.3 million as a result of efforts related to creating Double-Take brand awareness and the expanding customer base, third party consulting fees increased by $0.5 million and $0.1 million of the overall increase related to expenses from Double-Take Canada.
Research and Development. Research and development expenses increased $4.6 million, or 39%, from $11.9 million in 2007 to $16.5 million in 2008. The increase primarily resulted from higher compensation expense and stock based compensation expense of $1.7 million due to an increase in personnel, $0.5 million from outsourced development projects, and $2.3 million related to our acquisitions of Double-Take Canada on December 24, 2007 and emBoot on July 28, 2008.
General and Administrative. General and administrative expenses decreased $1.4 million, or 10%, from $14.9 million in 2007 to $13.4 million in 2008. The decrease resulted from a decrease of $0.8 million in compensation expense and stock based compensation expense primarily as a result of a reallocation of certain Double-Take EMEA resources to sales and marketing because they are more directly related to the sales efforts in 2008. The decrease in compensation expense was partially offset by increased personnel costs related to increased headcount. Additionally, the decrease in general and administrative expenses also resulted from the decreased costs related to the compliance with the Sarbanes-Oxley Act of 2002 and costs for being a public company by $1.1 million. As 2007 was the first year we needed to be compliant with the Sarbanes-Oxley Act of 2002, our costs decreased from 2007 to 2008. The decreases in expenses were partially offset by an increase of $0.1 million related to bad debt expense substantially related to our EMEA receivables, $0.1 million related to on-going maintenance renewals on software and infrastructure equipment and miscellaneous expenses, and $0.1 million related to Double-Take Canada.
Depreciation and Amortization. Depreciation and amortization expense increased $1.3 million, or 55%, from $2.3 million in 2007 to $3.6 million in 2008. The increase was attributable to increased depreciation expense of $0.7 million associated with increased capital expenditures, which were primarily for product development and other computer-related equipment, as well as increased amortization expense of $0.6 million related to amortization of the intangible assets acquired as part of the Double-Take Canada and emBoot acquisitions.
Interest Income
Interest income decreased $1.3 million from $3.0 million in 2007 to $1.7 million in 2008. While our cash and short term investments increased $8.5 million from December 31, 2007 to December 31, 2008, our interest income decreased. The decrease was a result of lower returns on our cash and short term investments which matured in 2008 and were reinvested at lower rates than in 2007.
Foreign Exchange gains (losses)
Foreign currency losses increased to $0.9million in 2008 from a $0.2 million loss in 2007 due to foreign currency fluctuations related to Double-Take EMEA. The loss occurred on assets we had that were denominated in British Pounds in Europe. These assets are converted to Euros and then subsequently to US dollars for financial statement reporting purposes. Because the UK Pound weakened significantly during 2008 against the Euro, the translation to Euros and then subsequently to US dollars produced the loss. This was the first time since our acquisition of Double-Take EMEA in May 2006 that we have recorded a significant foreign currency gain or loss related to our UK Pound denominated assets.
Income Tax Expense (benefit)
Income tax expense was $0.7 million in 2008 and a benefit of $0.8 million in 2007. During 2007, we recorded a current tax expense of $8.2 million, excluding the benefit of net operating loss carryforwards, related to income generated during the period using an effective tax rate for the full year. Because we had delivered consistent profitability during 2006 and 2007, we concluded that it was more likely than not that we would generate sufficient taxable income to utilize the benefit from our net operating loss carryforwards eligible to be used in 2007, 2008 and 2009. As a result, we reversed the valuation allowance on $9.0 million of deferred tax assets resulting in a net benefit of $0.8 million in 2007. During 2008, we recorded a current tax expense of $9.3 million, excluding the benefit of net operating loss carryforwards, related to income generated during the period using an effective tax rate for the full year. The increase in 2008 current tax expense was substantially a result of increased taxable income generated from operations in the United States and increased stock option expense that is not deductible for tax purposes. During the fourth quarter of 2008, based upon newly available information, we re-evaluated our ability to utilize the benefit from our net operating loss carryforwards. We concluded that we were able to utilize our net operating loss carryforwards more quickly than originally anticipated. As a result, in 2008 we fully utilized the deferred tax asset recorded in 2007. As a result of our ability to utilize an increased amount of our net operating loss carryforwards in 2008, we reversed the valuation allowance on $3.6 million of deferred tax assets that was substantially utilized in 2008. In the fourth quarter of 2008 we reversed an additional $5.0 million of the valuation allowance of the deferred tax assets, based on our evaluation that it would be more likely than not that we would generate sufficient taxable income to utilize at least a portion of our net operating loss carryforwards available to be used in 2009 and beyond.
Net Income
Net income decreased $2.4 million from a net income of $20.1 million in 2007 to net income of $17.6 million in 2008. This decrease is primarily related to revenue growing at a slower rate than expenses in 2008 as well as lower interest income and increased income tax expense. Net income would have decreased at a rate greater than 12% in 2008 absent our continued focus on expense control. Our operating expenses increased 18% in 2008 as compared to a 25% increase in 2007. The focus on expense control was offset by lower returns on our cash and short term investments as well a decrease in the reversal of the valuation allowance on our deferred tax assets in 2008 as compared to 2007.
Critical Accounting Policies
In presenting our financial statements in conformity with accounting principles generally accepted in the United States, we are required to make estimates and judgments that affect the amounts reported in our financial statements. Some of the estimates and assumptions we are required to make relate to matters that are inherently uncertain as they pertain to future events. We formulate these estimates and assumptions based on historical experience and on various other matters that we believe to be reasonable and appropriate. Actual results may differ significantly from these estimates. Of our significant accounting policies described in Note A to the historical financial statements included elsewhere in this annual report, we believe that the following policies may involve a higher degree of judgment and complexity.
Revenue Recognition
Our revenue is reported net of rebates and discounts because there is no identifiable benefit in exchange for the rebate or discount. We derive revenues from two primary sources or elements: software licenses and services. Services include customer support, consulting, installation services and training. A typical sales arrangement includes both of these elements.
For software arrangements involving multiple elements, we recognize revenue using the residual method. Under the residual method, we allocate and defer revenue for the undelivered elements based on relative fair value and recognize the difference between the total arrangement fee and the amount deferred for the undelivered elements as revenue. The determination of fair value of the undelivered elements in multiple element arrangements is based on the price charged when such elements are sold separately, which is commonly referred to as vendor-specific objective-evidence (“VSOE”).
Our software licenses typically provide for a perpetual right to use our software and are sold on a per-copy basis. We recognize software revenue through direct sales channels and resellers upon receipt of a purchase order or other persuasive evidence and when all other basic revenue recognition criteria are met as described below. Revenue from software licenses sold through an OEM partner is recognized upon the receipt of a royalty report evidencing sales.
Services revenue includes revenue from customer support and other professional services. Customer support includes software updates (including unspecified product upgrades and enhancements) on a when-and-if-available basis, telephone support and bug fixes or patches. Customer support revenue is recognized ratably over the term of the customer support agreement, which is typically one year. To determine the price for the customer support element when sold separately, we use actual rates at which we have previously sold support as established VSOE.
Other professional services such as consulting and installation services provided by us are not essential to the functionality of the software and can also be performed by the customer or a third party. Revenues from consulting and installation services are recognized when the services are completed. Training fees are recognized after the training course has been provided. Any paid professional services, including training, that have not been performed within three years of the original invoice date are recognized as revenue in the quarter that is three years after the original invoice date. Based on our analysis of such other professional services transactions sold on a stand-alone basis, we have concluded we have established VSOE for such other professional services when sold in connection with a multiple-element software arrangement. The price for other professional services has not materially changed for the periods presented.
We have analyzed all of the undelivered elements included in our multiple-element arrangements and determined that VSOE of fair value exists to allocate revenues to services. Accordingly, assuming all basic revenue recognition criteria are met, software revenue is recognized upon delivery of the software license using the residual method.
We consider the four basic revenue recognition criteria for each of the elements as follows:
Persuasive evidence of an arrangement with the customer exists. Our customary practice is to require a purchase order and, in some cases, a written contract signed by both the customer and us prior to recognizing revenue with respect to an arrangement.
Delivery or performance has occurred. Our software applications are usually physically delivered to customers with standard transfer terms such as FOB shipping point and/or delivered by email. Software and/or software license keys for add-on orders or software updates are typically delivered via email. We recognize software revenue upon shipment to resellers and distributors because there is no right of return or refund and generally no price protection agreements. In situations where multiple copies of licenses are purchased, all copies are delivered to the customer in one shipment and revenue is recognized upon shipment. Occasionally, we enter into a site license with a customer that allows the customer to use a specified number of licenses within the organization. When a site license is sold, we deliver a master disk to the customer that allows the product to be installed on multiple servers. We have no further obligation to provide additional copies of the software or user manuals. Revenue on site licenses is recognized upon shipment of the master disk to the customer. Sales made by our Original Equipment Manufacturer (“OEM”) partners are recognized as revenue in the month the product is shipped. We estimate the revenue from a preliminary report received from the OEM shortly after the end of the month. Once the final report is received, the revenue is adjusted to that based on the final report, usually in the following month. Services revenue is recognized when the services are completed, except for customer support, which is recognized ratably over the term of the customer support agreement, which is typically one year.
Fee is fixed or determinable. The fee customers pay for software applications, customer support and other professional services is negotiated at the outset of an arrangement. The fees are therefore considered to be fixed or determinable at the inception of the arrangement.
Collection is probable. Probability of collection is assessed on a customer-by-customer basis. Each new customer undergoes a credit review process to evaluate its financial position and ability to pay. If we determine from the outset of an arrangement that collection is not probable based upon the review process, revenue is recognized on a cash-collected basis.
Our arrangements do not generally include acceptance clauses. However, if an arrangement does include an acceptance clause, revenue for such an arrangement is deferred and recognized upon acceptance. Acceptance occurs upon the earliest of receipt of a written customer acceptance, waiver of customer acceptance or expiration of the acceptance period.
Stock-Based Compensation
We recognize stock option expense using the fair value recognition method. We apply the fair value recognition method only to awards granted, modified, repurchased or cancelled after January 1, 2006. Stock-based compensation expense is recognized based on the grant-date fair value of stock option awards granted or modified after January 1, 2006. As we had used the minimum value method for valuing our stock options, all unmodified options granted prior to January 1, 2006 continue to be accounted using the minimum value method.
We account for stock-based compensation expense related to restricted stock units using the fair value of the nonvested stock on the grant date. The fair value is measured as the market price of a share of nonrestricted stock on the grant date.
We account for stock awards to non-employees by recognizing the fair value of these instruments as an expense over the period in which the related services are rendered.
Deferred tax assets and liabilities are determined based on differences between financial reporting and tax bases of assets and liabilities, and are measured using the enacted laws and tax rates that are expected to be in effect when the differences are expected to reverse. The measurement of deferred tax assets is reduced, if necessary, by a valuation allowance for any tax benefits not expected to be realized. The effect on deferred tax assets and liabilities of a change in tax rates is recognized in the period that such tax rate changes are enacted.
We analyze any uncertain tax positions through the application of a two-step process that separates recognition from measurement. During the year ended December 31, 2009 and 2008, the Company did not recognize any increase or decrease to reserves for uncertain tax positions.
We are subject to income taxes in the U.S. federal jurisdiction, and various states and foreign jurisdictions. Tax regulations within each jurisdiction are subject to the interpretation of the related tax laws and regulations and require significant judgment to apply. With few exceptions, the Company is no longer subject to U.S. federal, state and local, or non-U.S. income tax assessments by tax authorities for the years before 2004.
We have elected to record interest and penalties in the financial statements as income taxes. Any subsequent change in classification of interest and penalties will be treated as a change in accounting principle.
Software Development Costs
Generally Accepted Accounting Principles requires capitalization of certain software development costs subsequent to the establishment of technological feasibility. Our current process for developing software is essentially completed concurrently with the establishment of technological feasibility and therefore no software development costs have been capitalized for the years ended December 31, 2009, 2008 and 2007. Costs incurred to develop software programs prior to the achievement of technological feasibility are expensed as incurred.
Liquidity and Capital Resources
Overview
During the development stages of our business, we incurred significant losses from operating activities. Since the three months ended June 30, 2005, however, our operations have generated sufficient cash flow to meet substantially all of the cash requirements of our business, including our operating, capital and other cash requirements. Our ability to sustain a level of positive cash flow from operations that is sufficient to continue to meet all of our future operating, capital and other cash requirements is subject to the risks associated with our business, including those described under “Risk Factors” in this annual report, and to changes in our business plan, capital structure and other events.
From the start of our operations in 1991 until the three months ended June 30, 2005, we financed our operations primarily through the issuance of preferred stock and common stock. Since the three months ended June 30, 2005, we have primarily financed our operations through internally generated cash flows. In December 2006, we received $47.5 million in net proceeds from our initial public offering and $1.0 million in net proceeds from our secondary offering in August 2007. As of December 31, 2009, we had cash and cash equivalents and short term investments of $96.2 million and accounts receivable of $16.7 million.
In January 2006, in connection with the settlement of an intellectual property dispute reached in December 2005, we paid $3.8 million to another company. We also agreed to make future payments of $0.5 million in each of January 2007, 2008, 2009 and 2010, which we collateralized by a $2.0 million letter of credit to that company. The letter of credit was drawn down automatically in increments of $0.5 million at the time of each payment requirement. The settlement provided that our obligations were reduced on a dollar-for-dollar basis to the extent that we purchased or resold the other company’s products. As of December 31, 2009, we had purchased $2.0 million of computer equipment that fulfilled this obligation. In 2009, the letter of credit was cancelled as the obligation was fulfilled.
In December 2007, we acquired all of the issued and outstanding shares of TimeSpring Software Corporation, now known as Double-Take Canada, for a cash purchase price of approximately $8.3 million plus transaction costs and subject to certain customary post-closing working capital adjustments. Approximately $1.4 million of the purchase price was placed into escrow to secure certain indemnification obligations of the Sellers. In February 2009, approximately $0.2 million of the escrow was released. In December 2009, the remaining amount of escrow was released.
In June 2009, we entered into an amendment to the credit facility with Silicon Valley Bank that extended the term of the facility to April 28, 2010. Under the terms of the facility, our maximum borrowings are $2 million less the aggregate amounts of all outstanding letters of credit, foreign exchange contracts, or any other accommodations issued or incurred, or caused to be issued or incurred by the bank. Up to $0.5 million of the facility is available for foreign exchange contracts. The rate of interest for this amendment is 0.75% above the prime rate. This facility is collateralized by all of our assets, excluding intellectual property. This amendment modified the need for the consent for an acquisition of 100 percent of an entity’s stock or assets.
In July 2008 Double-Take Software, Inc. and Double-Take Canada acquired all of the issued and outstanding shares of emBoot, Inc., a Canadian corporation for a cash purchase price of approximately $9.6 million plus transaction costs and subject to certain customary post-closing working capital adjustments. Approximately $1.6 million of the purchase price was placed into escrow to secure certain indemnification obligations of the sellers. As of December 31, 2009, no amounts have been released from escrow.
Sources and Uses of Cash
For 2009, cash generated from operating activities was $23.6 million. We used cash in investing activities in the amount of $6.8 million. We generated cash from financing activities in the amount of $0.2 million. Our net increase in cash and cash equivalents from December 31, 2008 to December 31, 2009 was $17.3 million. The increase in cash and cash equivalents was primarily a result of cash generated from operations. We are investing excess funds substantially in investments that are considered cash and cash equivalents. As of December 31, 2009 we had $38.2 million of short term securities. With the current economic downturn affecting our ability to generate revenue and subsequently generate cash, we are uncertain we will continue to experience significant positive cash flow from operations in future periods. As of December 31, 2009, we have $96.2 million in cash and cash equivalents and short term investments. We believe this is sufficient cash to meet our operating obligations should we not generate the amount of cash from operations as we have generated historically.
The following table sets forth cash flow data for the periods indicated:
|
Year Ended December 31,
|
||||||||||||
|
2009
|
2008
|
2007
|
||||||||||
|
(In thousands)
|
||||||||||||
|
Cash flow data:
|
||||||||||||
|
Net cash provided by operating activities
|
$
|
23,586
|
$
|
21,507
|
$
|
20,513
|
||||||
|
Cash used by investing activities
|
(6,824
|
)
|
(6,467
|
)
|
(57,306
|
)
|
||||||
|
Net cash provided by financing activities
|
173
|
233
|
7,593
|
|||||||||
|
Effect of exchange rate changes on cash and cash equivalents
|
380
|
(362
|
)
|
(222
|
)
|
|||||||
|
Net increase (decrease) in cash and equivalents
|
17,315
|
14,911
|
(29,422
|
)
|
||||||||
|
Cash and cash equivalents, beginning of period
|
40,659
|
25,748
|
55,170
|
|||||||||
|
Cash and equivalents, end of period
|
$
|
57,974
|
$
|
40,659
|
$
|
25,748
|
||||||
Cash Flows from Operating Activities
Cash provided by operating activities was $23.6 million in 2009 as compared to $21.5 million in 2008. Our positive cash flow from operations in 2009 was primarily a result of $13.5 million of net income in 2009. A decrease in accounts receivable provided $3.1 million of operating cash flows which were primarily a result of our collection efforts, but partially offset by lower sales during 2009. The decrease in prepaid expenses and other current assets also provided $4.9 million of operating cash flows. Stock based compensation expense of $4.4 million and $4.0 million related to depreciation and amortization are additional add backs to cash flow from operations. These increases in cash flows from operations have been partially offset by the increase in our deferred tax asset and decrease in deferred revenue. The deferred tax asset increased by $8.7million due to the reduction of the deferred tax asset valuation allowance in 2009. The increase of the deferred tax asset was offset by the utilization in 2009 of $3.1 million of deferred tax assets recorded in 2008. Primarily due to the economic downturn, deferred revenue decreased and we do not anticipate significant growth in deferred revenue in the near term. Likely any growth in deferred revenue in the near term will be offset by growth in accounts receivable balances due to sales and slower collections from customers. Additionally, the utilization of the deferred tax asset recorded in 2009 in future years will cause increases to our operating cash flows.
Cash provided by operating activities was $21.5 million in 2008 as compared to $20.5 million in 2007. Our positive cash flow from operations in 2008 was primarily a result of $17.6 million of net income in 2008. Our continued growth of deferred revenue of $3.5 million, which was a result of our increase in software license sales and maintenance renewals, was partially offset by a $1.4 million increase in accounts receivable. Stock based compensation expense of $3.9 million and $3.6 million related to depreciation and amortization are additional add backs to cash flow from operations. These increases in cash flows from operations have been partially offset by the change in prepaid expenses and other current assets and accounts payable and accrued expenses. The deferred tax asset decreased by $0.5 million as a result of the utilization in 2008 of the deferred tax assets recorded in 2007. The decrease was partially offset by the 2008 reduction of the deferred tax asset valuation allowance. During 2008, the utilization of Double-Take Canada and emBoot as part of our research and development organization and the integration of the TimeData and emBoot products decreased our operating cash flow.
Cash Flows from Investing Activities
Cash used in investing activities was $6.8 million in 2009 as compared to $6.5 million in 2008. The increase in the cash used was primarily related to the increase in purchases of short term investments offset by the sales and maturities of short term investments. Additionally, the cash used in acquisitions decreased as there were no acquisitions in 2009. Purchases of equipment were $1.2 million which is a decrease of $1.3 million from 2008. The purchases in 2009 were primarily for research and development equipment. As a result of the continued economic downturn, we plan to be very cautious with our spending, but we expect to continue to invest in our research and development equipment as needed in the future. As a result, unless we make another acquisition, we expect net cash used in investing activities in 2010 to be similar to 2009.
Cash used in investing activities decreased in 2008 by $50.8 million as compared to 2007 primarily due to the maturities of short term investments slightly offset by the purchases of short term investments. Additionally, the cash used in acquisitions decreased. In 2008 we purchased emBoot while in 2007 we purchased TimeSpring as well as made our earn-out payments related to the acquisition of Double-Take EMEA, with the exception of the final earn out payment made in the first quarter of 2008. While our purchases of equipment only increased slightly during 2008, the purchases were primarily for research and development equipment.
Cash Flows from Financing Activities
Cash provided by financing activities was $0.2 million in each of 2009 and 2008. During 2009 we had $0.1 million of proceeds from stock option exercises and $0.1 million of excess tax benefits from stock based compensation.
Cash provided by financing activities decreased $7.4 million in 2008 compared to 2007. During 2007, we received $2.7 million of proceeds from a secondary offering and stock option exercises and $4.9 million as excess tax benefits from stock based compensation. In 2008, we did not have a secondary offering and due to our lower stock price there were only limited stock option exercises as well as minimal excess tax benefits from stock based compensation.
Cash Requirements
We have various contractual obligations and commercial commitments. The following table sets forth our future contractual obligations and commercial commitments as of December 31, 2009:
|
Payments Due by Period
|
||||||||||||||||||||
|
Less Than
|
1 to 3
|
3 to 5
|
||||||||||||||||||
|
Total
|
1 Year
|
Years
|
Years
|
5+ Years
|
||||||||||||||||
|
(In thousands)
|
||||||||||||||||||||
|
Contractual obligations
|
||||||||||||||||||||
|
As of December 31, 2009
|
||||||||||||||||||||
|
Operating lease obligations
|
$ | 11,562 | $ | 1,722 | $ | 4,628 | $ | 2,654 | $ | 2,558 | ||||||||||
|
Total
|
$ | 11,562 | $ | 1,722 | $ | 4,628 | $ | 2,654 | $ | 2,558 | ||||||||||
We have entered into various non-cancelable operating lease agreements, with expiration dates through 2018, for office space. Some of these leases have free or escalating rent payment provisions. We recognize rent expense under these leases on a straight-line basis. The foregoing table does not reflect any contractual obligations and commercial commitments that we entered into after December 31, 2009.
As of December 31, 2009, we have $96.2 million in cash and cash equivalents and short term investments. Given our current cash and cash equivalents, our short term investments, our accounts receivable, our continued revenue stream related to on-going maintenance renewals, available borrowings under our revolving loan agreement and our expectation of some continued positive cash flow from operations, we believe that we will have sufficient liquidity to fund our business and meet our contractual obligations over a period beyond the next 12 months. We may need to raise additional funds in the future, including for acquisitions or investments in complementary businesses or technologies or if we experience operating losses. In the event that additional financing is required, we may not be able to obtain it on acceptable terms or at all. Additional sources may include equity and debt financing and other financing arrangements. If we raise additional funds through the issuance of equity or convertible securities, our stockholders may experience dilution. We may not be able to generate sufficient cash flow from operations according to our planned schedule, or to obtain any additional financing arrangements we may require or seek on terms acceptable to us. Any inability by us to generate or obtain the sufficient funds that we may require could limit our ability to generate revenue or to continue or enhance our profitability.
Off-Balance Sheet Arrangements
As of December 31, 2009, other than our operating leases described under “— Liquidity and Capital Resources — Cash Requirements” above, we do not have off-balance sheet financing arrangements, including any relationships with unconsolidated entities or financial partnerships, such as entities often referred to as structured finance or special purpose entities.
Quarterly Results of Operations
The following table sets forth our unaudited quarterly consolidated statement of operations data for each of the eight quarters ended December 31, 2009. The data has been prepared on the same basis as the audited consolidated financial statements included in this annual report and reflects all necessary adjustments, consisting only of normal recurring adjustments, necessary for a fair presentation of this data. The results of historical periods are not necessarily indicative of the results of operations for a full year or any future period.
|
For the Three Months Ended
|
||||||||||||||||||||||||||||||||||||||
|
2009
|
2008
|
|||||||||||||||||||||||||||||||||||||
|
Dec. 31
|
Sep. 30
|
Jun. 30
|
Mar. 31
|
Dec. 31
|
Sep. 30
|
Jun. 30
|
Dec. 31
|
|||||||||||||||||||||||||||||||
|
Revenue:
|
||||||||||||||||||||||||||||||||||||||
|
Software licenses
|
$
|
11,729
|
$
|
10,214
|
$
|
10,435
|
$
|
7,722
|
$
|
14,068
|
$
|
12,819
|
$
|
13,620
|
$
|
12,416
|
||||||||||||||||||||||
|
Maintenance and professional services
|
11,048
|
11,066
|
10,579
|
10,444
|
10,888
|
11,132
|
10,784
|
10,576
|
||||||||||||||||||||||||||||||
|
Total revenue
|
22,777
|
21,280
|
21,014
|
18,166
|
24,956
|
23,951
|
24,404
|
22,992
|
||||||||||||||||||||||||||||||
|
Cost of revenue:
|
||||||||||||||||||||||||||||||||||||||
|
Software licenses
|
117
|
128
|
135
|
82
|
192
|
156
|
121
|
120
|
||||||||||||||||||||||||||||||
|
Maintenance and professional services
|
2,190
|
2,144
|
2,054
|
2,057
|
2,424
|
2,342
|
2,517
|
2,339
|
||||||||||||||||||||||||||||||
|
Total cost of revenue
|
2,307
|
2,272
|
2,189
|
2,139
|
2,616
|
2,498
|
2,638
|
2,459
|
||||||||||||||||||||||||||||||
|
Gross profit
|
20,470
|
19,008
|
18,825
|
16,027
|
20,340
|
21,453
|
21,766
|
20,533
|
||||||||||||||||||||||||||||||
|
Operating expenses
|
||||||||||||||||||||||||||||||||||||||
|
Sales and marketing
|
8,705
|
7,702
|
7,725
|
8,239
|
8,635
|
8,393
|
8,879
|
9,021
|
||||||||||||||||||||||||||||||
|
Research and development
|
3,732
|
3,659
|
3,981
|
3,903
|
4,061
|
4,331
|
4,129
|
4,019
|
||||||||||||||||||||||||||||||
|
General and administrative
|
3,087
|
3,212
|
3,191
|
3,057
|
3,374
|
3,371
|
3,507
|
3,167
|
||||||||||||||||||||||||||||||
|
Depreciation and amortization
|
979
|
1,005
|
1,012
|
990
|
996
|
974
|
863
|
805
|
||||||||||||||||||||||||||||||
|
Total operating expenses
|
16,503
|
15,578
|
15,909
|
16,189
|
17,066
|
17,069
|
17,378
|
17,012
|
||||||||||||||||||||||||||||||
|
Operating income (loss)
|
3,967
|
3,430
|
2,916
|
(162
|
)
|
5,274
|
4,384
|
4,388
|
3,521
|
|||||||||||||||||||||||||||||
|
Interest income
|
79
|
52
|
64
|
132
|
220
|
396
|
470
|
609
|
||||||||||||||||||||||||||||||
|
Interest expense
|
(2
|
)
|
(4
|
)
|
(2
|
)
|
(3
|
)
|
(6
|
)
|
(9
|
)
|
(7
|
)
|
(7
|
)
|
||||||||||||||||||||||
|
Foreign exchange (loss) gain
|
(1
|
)
|
(8
|
)
|
(63
|
)
|
(63
|
)
|
(399
|
)
|
(79
|
)
|
(41
|
)
|
(345
|
)
|
||||||||||||||||||||||
|
Income (loss) before income taxes
|
4,043
|
3,470
|
2,915
|
(96
|
)
|
5,089
|
4,692
|
4,810
|
3,778
|
|||||||||||||||||||||||||||||
|
Income tax expense (benefit)
|
(6,533
|
)
|
1,907
|
1,550
|
(51
|
)
|
(5,127
|
)
|
2,070
|
2,156
|
1,625
|
|||||||||||||||||||||||||||
|
Net income (loss)
|
$
|
10,576
|
$ |
1,563
|
$ |
1,365
|
$ |
(45
|
)
|
$
|
10,216
|
$
|
2,622
|
$
|
2,654
|
$
|
2,153
|
|||||||||||||||||||||
|
Net income per share, basic
|
$
|
0.47
|
$
|
0.07
|
$
|
0.06
|
$
|
0.00
|
$
|
0.46
|
$
|
0.12
|
$
|
0.12
|
$
|
0.10
|
||||||||||||||||||||||
|
Net income per share, diluted
|
$
|
0.45
|
$
|
0.07
|
$
|
0.06
|
$
|
0.00
|
$
|
0.44
|
$
|
0.11
|
$
|
0.11
|
$
|
0.09
|
||||||||||||||||||||||
|
Stock-based compensation expense included in above
|
$
|
1,099
|
$
|
1,137
|
$
|
1,101
|
$
|
1,092
|
$
|
989
|
$
|
995
|
$
|
1,077
|
$
|
886
|
||||||||||||||||||||||
Our operating results may fluctuate due to a variety of factors, many of which are outside of our control. As a result, comparing our operating results on a period-to-period basis may not be meaningful. You should not rely on our past results as an indication of our future performance.
| Item 7A. | Quantitative and Qualitative Disclosures About Market Risk. |
We do not engage in trading activities involving non-exchange traded contracts. As such, we are not materially exposed to any financing, liquidity, market or credit risk that could arise if we had engaged in these relationships.
Historically, our exposure to foreign currency exchange rates was limited as our international sales were denominated in the United States dollar. As a result of our acquisition of Double-Take EMEA in May 2006, Double-Take Canada in December 2007, and emBoot in July 2008, we now have international sales that are denominated in foreign currencies, and we face exposure to adverse movements in foreign currency exchange rates. Depending on the amount of our revenue generated from Double-Take EMEA and Double-Take Canada (including emBoot), adverse movement in foreign currency exchange rates could have a material adverse impact on our financial results. Our primary exposures are to fluctuations in exchange rates for the United States dollar versus the Euro and Canadian dollar, as well as the Euro versus the British Pound. See “Foreign exchange gains (losses)” in Management’s Discussion and Analysis of Financial Condition and Results of Operations above. Changes in currency exchange rates could adversely affect our reported revenue and could require us to reduce our prices to remain competitive in foreign markets, which could also materially adversely affect our results of operations. We have not historically hedged exposure to changes in foreign currency exchange rates and, as a result, we could incur unanticipated gains or losses.
Item 8. Financial Statements and Supplementary Data.
|
Page
|
|
|
Double-Take Software, Inc.:
|
|
|
Consolidated Historical Financial Statements:
|
|
| 44 | |
| 45 | |
| 46 | |
| 47 | |
| 48 | |
| 49 | |
| 69 | |
Board of Directors and Stockholders
Double-Take Software, Inc.
We have audited the accompanying consolidated balance sheets of Double-Take Software, Inc. and subsidiaries (the “Company”) as of December 31, 2009 and 2008, and the related consolidated statements of operations, changes in stockholders’ equity and cash flows and Schedule II for each of the years in the three-year period ended December 31, 2009. These financial statements and schedule are the responsibility of the Company’s management. Our responsibility is to express an opinion on these financial statements and schedule based on our audits.
We conducted our audits in accordance with the standards of the Public Company Accounting Oversight Board (United States). Those standards require that we plan and perform the audit to obtain reasonable assurance about whether the financial statements and Schedule II are free of material misstatement. An audit includes examining, on a test basis, evidence supporting the amounts and disclosures in the financial statements. An audit also includes assessing the accounting principles used and significant estimates made by management, as well as evaluating the overall financial statement presentation. We believe that our audits provide a reasonable basis for our opinion.
In our opinion, the financial statements referred to above present fairly, in all material respects, the consolidated financial position of Double-Take Software, Inc. as of December 31, 2009 and 2008, and the consolidated results of their operations and their consolidated cash flows for each of the years in the three-year period ended December 31, 2009, in conformity with accounting principles generally accepted in the United States of America. Also in our opinion, Schedule II referred to above, when considered in relation to the financial statements taken as a whole, presents fairly, in all material respects, the information set forth therein.
We also have audited, in accordance with the standards of the Public Company Accounting Oversight Board (United States), Double-Take Software Inc.’s internal control over financial reporting as of December 31, 2009, based on criteria established in Internal Control – Integrated Framework issued by the Committee of Sponsoring Organizations of the Treadway Commission (COSO), and our report dated March 10, 2010 expressed an unqualified opinion thereon.
/s/ Eisner LLP
New York, New York
March 10, 2010
Consolidated Balance Sheets
(in thousands, except share and per share amounts)
|
December 31,
|
||||||||
|
2009
|
2008
|
|||||||
|
Assets
|
||||||||
|
Current assets:
|
||||||||
|
Cash and cash equivalents
|
$ | 57,974 | $ | 40,659 | ||||
|
Short term investments
|
38,246 | 32,524 | ||||||
|
Accounts receivable, net of allowance for doubtful accounts of $696 and $765 at December 31, 2009 and 2008, respectively
|
16,676 | 19,593 | ||||||
|
Prepaid expenses and other current assets
|
1,153 | 6,012 | ||||||
|
Deferred tax assets
|
5,565 | 5,438 | ||||||
|
Total current assets
|
119,614 | 104,226 | ||||||
|
Property and equipment — at cost, net of accumulated depreciation of $9,149 and $6,687 at December 31, 2009 and 2008, respectively
|
3,074 | 4,236 | ||||||
|
Customer relationships, net of accumulated amortization of $1,634 and $1,181 at December 31, 2009 and 2008, respectively
|
633 | 1,086 | ||||||
|
Marketing relationships, net of accumulated amortization of $897 and $648 at December 31, 2009 and 2008, respectively
|
1,095 | 1,344 | ||||||
|
Technology related intangibles, net of accumulated amortization of $1,409 and $533 at December 31, 2009 and 2008, respectively
|
3,170 | 3,533 | ||||||
|
Goodwill
|
18,099 | 16,267 | ||||||
|
Other assets
|
786 | 739 | ||||||
|
Long-term deferred tax assets
|
5,460 | — | ||||||
|
Total assets
|
$ | 151,931 | $ | 131,431 | ||||
|
Liabilities
|
||||||||
|
Current liabilities:
|
||||||||
|
Accounts payable
|
$ | 1,624 | $ | 1,280 | ||||
|
Accrued expenses
|
4,724 | 5,142 | ||||||
|
Other liabilities
|
665 | 390 | ||||||
|
Deferred revenue
|
25,977 | 26,469 | ||||||
|
Total current liabilities
|
32,990 | 33,281 | ||||||
|
Long-term deferred revenue
|
4,726 | 4,614 | ||||||
|
Long-term deferred rent
|
144 | 117 | ||||||
|
Long-term capital lease obligations
|
— | 9 | ||||||
|
Total long-term liabilities
|
4,870 | 4,740 | ||||||
|
Total liabilities
|
37,860 | 38,021 | ||||||
|
Stockholders’ equity
|
||||||||
|
Preferred Stock, $.01 par value per share; 20,000,000 shares authorized; 0 shares issued and outstanding at December 31, 2009 and 2008
|
— | — | ||||||
|
Common stock, $.001 par value per share; 130,000,000 shares authorized; 22,091,555 and 22,013,608 shares issued and outstanding at December 31, 2009 and 2008, respectively
|
22 | 22 | ||||||
|
Additional paid-in capital
|
157,480 | 152,853 | ||||||
|
Accumulated deficit
|
(42,135 | ) | (55,594 | ) | ||||
|
Accumulated other comprehensive income
|
||||||||
|
Unrealized gain (loss) on short term investments
|
(5 | ) | 47 | |||||
|
Cumulative foreign currency translation adjustment
|
(1,291 | ) | (3,918 | ) | ||||
|
Total stockholders’ equity
|
114,071 | 93,410 | ||||||
|
Total liabilities and stockholders’ equity
|
$ | 151,931 | $ | 131,431 | ||||
See notes to financial statements
Consolidated Income Statements
(in thousands, except per share amounts)
|
Year ended December 31,
|
||||||||||||
|
|
2009
|
2008
|
2007
|
|||||||||
|
Revenue:
|
||||||||||||
|
Software licenses
|
$ | 40,100 | $ | 52,923 | $ | 49,169 | ||||||
|
Maintenance and professional services
|
43,137 | 43,380 | 33,599 | |||||||||
|
Total revenue
|
83,237 | 96,303 | 82,768 | |||||||||
|
Cost of revenue:
|
||||||||||||
|
Software licenses
|
462 | 589 | 411 | |||||||||
|
Maintenance and professional services
|
8,445 | 9,622 | 7,827 | |||||||||
|
Total cost of revenue
|
8,907 | 10,211 | 8,238 | |||||||||
|
Gross profit
|
74,330 | 86,092 | 74,530 | |||||||||
|
Operating expenses:
|
||||||||||||
|
Sales and marketing
|
32,371 | 34,928 | 28,872 | |||||||||
|
Research and development
|
15,275 | 16,540 | 11,896 | |||||||||
|
General and administrative
|
12,547 | 13,419 | 14,863 | |||||||||
|
Depreciation and amortization
|
3,986 | 3,638 | 2,346 | |||||||||
|
Total operating expenses
|
64,179 | 68,525 | 57,977 | |||||||||
|
Income from operations
|
10,151 | 17,567 | 16,553 | |||||||||
|
Interest income
|
327 | 1,695 | 3,019 | |||||||||
|
Interest expense
|
(11 | ) | (29 | ) | (49 | ) | ||||||
|
Foreign exchange (loss) gains
|
(135 | ) | (864 | ) | (234 | ) | ||||||
|
Income before income taxes
|
10,332 | 18,369 | 19,289 | |||||||||
|
Income tax expense (benefit)
|
(3,127 | ) | 724 | (789 | ) | |||||||
|
Net income
|
$ | 13,459 | $ | 17,645 | $ | 20,078 | ||||||
|
Net income per share:
|
||||||||||||
|
Basic
|
$ | 0.60 | $ | 0.80 | $ | 0.94 | ||||||
|
Diluted
|
$ | 0.58 | $ | 0.76 | $ | 0.87 | ||||||
|
Weighted-average number of shares used in per share amounts:
|
||||||||||||
|
Basic
|
22,325 | 21,971 | 21,332 | |||||||||
|
Diluted
|
23,284 | 23,173 | 23,027 | |||||||||
See notes to financial statements
Consolidated Statements of Changes in Stockholders’ Equity
(in thousands, except share and per share amounts)
|
Accumulated
|
||||||||||||||||||||||||||||
|
Additional
|
Other
|
|||||||||||||||||||||||||||
|
Common Stock
|
Paid in
|
Accumulated
|
Comprehensive
|
Comprehensive
|
||||||||||||||||||||||||
|
Shares
|
Amount
|
Capital
|
Deficit
|
Income
|
Income
|
Total
|
||||||||||||||||||||||
|
Balance – January 1, 2007
|
20,726,589 | $ | 21 | $ | 138,398 | $ | (93,317 | ) | $ | 128 | $ | 45,230 | ||||||||||||||||
|
Net income for the year
|
— | — | — | 20,078 | 20,078 | — | 20,078 | |||||||||||||||||||||
|
Foreign currency translation adjustment
|
— | — | — | — | (9 | ) | (9 | ) | (9 | ) | ||||||||||||||||||
|
Unrealized gain on short term investments
|
— | — | — | — | 14 | 14 | 14 | |||||||||||||||||||||
|
Total comprehensive income
|
$ | 20,083 | ||||||||||||||||||||||||||
|
Stock based compensation
|
— | — | 2,621 | — | — | 2,621 | ||||||||||||||||||||||
|
Exercise of stock options
|
1,018,407 | 1 | 1,588 | — | — | 1,589 | ||||||||||||||||||||||
|
Exercise of warrants
|
67,918 | — | — | — | — | — | ||||||||||||||||||||||
|
Excess tax benefits on stock based compensation
|
— | — | 4,895 | — | — | 4,895 | ||||||||||||||||||||||
|
Proceeds from public offering, net of expenses
|
115,750 | — | 1,126 | — | — | 1,126 | ||||||||||||||||||||||
|
Balance - December 31, 2007
|
21,928,664 | $ | 22 | $ | 148,628 | $ | (73,239 | ) | $ | 133 | $ | 75,544 | ||||||||||||||||
|
Net income for the year
|
— | — | — | 17,645 | 17,645 | — | 17,645 | |||||||||||||||||||||
|
Foreign currency translation adjustment
|
— | — | — | — | (4,037 | ) | (4,037 | ) | (4,037 | ) | ||||||||||||||||||
|
Unrealized gain on short term investments
|
— | — | — | — | 33 | 33 | 33 | |||||||||||||||||||||
|
Total comprehensive income
|
$ | 13,641 | ||||||||||||||||||||||||||
|
Stock based compensation
|
— | — | 3,948 | — | — | 3,948 | ||||||||||||||||||||||
|
Exercise of stock options
|
84,944 | — | 114 | — | — | 114 | ||||||||||||||||||||||
|
Excess tax benefits on stock based compensation
|
— | — | 163 | — | — | 163 | ||||||||||||||||||||||
|
Balance – December 31, 2008
|
22,013,608 | $ | 22 | $ | 152,853 | $ | (55,594 | ) | $ | (3,871 | ) | $ | 93,410 | |||||||||||||||
|
Net income for the year
|
13,459 | 13,459 | 13,459 | |||||||||||||||||||||||||
|
Foreign currency translation adjustment
|
— | — | — | — | 2,627 | 2,627 | 2,627 | |||||||||||||||||||||
|
Unrealized loss on short term investments
|
— | — | — | — | (52 | ) | (52 | ) | (52 | ) | ||||||||||||||||||
|
Total comprehensive income
|
$ | 16,034 | ||||||||||||||||||||||||||
|
Stock based compensation
|
— | — | 4,429 | — | — | 4,429 | ||||||||||||||||||||||
|
Exercise of stock options
|
77,947 | — | 122 | — | — | 122 | ||||||||||||||||||||||
|
Excess tax benefits on stock based compensation
|
76 | 76 | ||||||||||||||||||||||||||
|
Balance – December 31, 2009
|
22,091,555 | $ | 22 | $ | 157,480 | $ | (42,135 | ) | $ | (1,296 | ) | $ | 114,071 | |||||||||||||||
See notes to financial statements
Consolidated Statements of Cash Flows
(in thousands, except share and per share amounts)
|
|
Year Ended December 31,
|
|||||||||||
|
|
2009
|
2008
|
2007
|
|||||||||
|
Cash flows from operating activities:
|
||||||||||||
|
Net income
|
$ | 13,459 | $ | 17,645 | $ | 20,078 | ||||||
|
Adjustments to reconcile net income to net cash provided by operating activities:
|
||||||||||||
|
Depreciation
|
2,408 | 2,348 | 1,636 | |||||||||
|
Amortization of intangible assets
|
1,578 | 1,290 | 710 | |||||||||
|
Provision for (recovery of) doubtful accounts
|
(100 | ) | (174 | ) | 19 | |||||||
|
Stock based compensation
|
4,429 | 3,948 | 2,621 | |||||||||
|
Deferred income tax expense (benefit)
|
(5,587 | ) | 451 | (5,889 | ) | |||||||
|
Excess tax benefits from stock based compensation
|
(76 | ) | (163 | ) | (4,895 | ) | ||||||
|
Changes in:
|
||||||||||||
|
Accounts receivable
|
3,134 | (1,413 | ) | (4,840 | ) | |||||||
|
Prepaid expenses and other assets
|
4,934 | (1,258 | ) | (1,128 | ) | |||||||
|
Inventory
|
— | — | 14 | |||||||||
|
Other assets
|
(14 | ) | (579 | ) | (20 | ) | ||||||
|
Accounts payable and accrued expenses
|
(259 | ) | (3,113 | ) | 4,546 | |||||||
|
Other liabilities
|
333 | (324 | ) | 582 | ||||||||
|
Deferred revenue
|
(653 | ) | 2,849 | 7,079 | ||||||||
|
Net cash provided by operating activities
|
23,586 | 21,507 | 20,513 | |||||||||
|
Cash flows from investing activities:
|
||||||||||||
|
Purchase of property and equipment
|
(1,186 | ) | (2,458 | ) | (2,340 | ) | ||||||
|
Purchase of short term investments
|
(73,493 | ) | (67,226 | ) | (65,179 | ) | ||||||
|
Sales of short term investments
|
67,855 | 73,492 | 26,445 | |||||||||
|
Acquisitions, net of cash acquired
|
— | (10,275 | ) | (16,232 | ) | |||||||
|
Net cash used in investing activities
|
(6,824 | ) | (6,467 | ) | (57,306 | ) | ||||||
|
Cash flows from financing activities:
|
||||||||||||
|
Proceeds from public offering, net of expenses
|
— | — | 1,126 | |||||||||
|
Proceeds from exercise of stock options
|
122 | 114 | 1,589 | |||||||||
|
Excess tax benefits from stock based compensation
|
76 | 163 | 4,895 | |||||||||
|
Payment on capital lease obligation
|
(25 | ) | (44 | ) | (17 | ) | ||||||
|
Net cash provided by financing activities
|
173 | 233 | 7,593 | |||||||||
|
Effect of exchange rate changes on cash
|
380 | (362 | ) | (222 | ) | |||||||
|
Net increase (decrease) in cash and cash equivalents
|
16,935 | 15,273 | (29,200 | ) | ||||||||
|
Cash and cash equivalents — beginning of year
|
40,659 | 25,748 | 55,170 | |||||||||
|
Cash and cash equivalents — end of year
|
$ | 57,974 | $ | 40,659 | $ | 25,748 | ||||||
|
Supplemental disclosures of cash flow information:
|
||||||||||||
|
Cash paid (received) during the period for:
|
||||||||||||
|
Interest
|
$ | 3 | $ | 5 | $ | — | ||||||
|
Income taxes
|
$ | (1,019 | ) | $ | 2,729 | $ | 1,852 | |||||
|
Supplemental disclosures of noncash investing and financing activities:
|
||||||||||||
|
Issuance of common stock upon cashless exercise of warrants
|
$ | — | $ | — | $ | 201 | ||||||
See notes to financial statements
Notes to Consolidated Financial Statements
December 31, 2009, 2008 and 2007
(in thousands, except for share and per share amounts)
Note A — Organization and Significant Accounting Policies
[1] The Company:
Double-Take Software, Inc. (the “Company”), a Delaware corporation, develops, sells and supports affordable software that allows IT organizations of all sizes to move, manage, protect and recover workloads across any distance and any combination of physical and virtual server environments. The Company operates in one reportable segment and its revenues are mainly derived from sales of software and related services. Software is licensed by the Company primarily to distributors, value added resellers (“VARS”) and original equipment manufacturers (“OEMS”), located worldwide.
The Company completed an initial public offering of its common stock in December 2006 and a secondary offering of its common stock in August 2007.
Principles of Consolidation
The consolidated financial statements include all subsidiaries including Double-Take Software Canada, Inc. (“Double-Take Canada”) and Double-Take Software S.A.S. (“Double-Take EMEA”). All inter-company transactions and balances have been eliminated. Double-Take Canada, a Canadian corporation and wholly-owned subsidiary of the Company, entered into a share purchase agreement with TimeSpring Software Corporation (“TimeSpring”) on December 24, 2007 and a share purchase agreement with emBoot, Inc (“emBoot”) on July 28, 2008 to acquire 100 percent of both entities, respectively. The consolidated financial statements include the financial results and activities related to Double-Take Canada’s acquisition of TimeSpring and emBoot from the dates of each acquisition.
[2] Acquisition of emBoot, Inc.:
On July 28, 2008, the Company and Double-Take Canada entered into a share purchase agreement (the “emBoot Purchase Agreement”) with emBoot, a Canadian corporation (a company specializing in network booting technology), and the shareholders of emBoot (the “emBoot Sellers”). Pursuant to the terms of the emBoot Purchase Agreement, Double-Take Canada acquired from the emBoot Sellers all of the issued and outstanding shares of emBoot for a cash purchase price of approximately $9.6 million plus transaction costs and subject to certain customary post-closing working capital adjustments. Approximately $1.6 million of the purchase price was placed into escrow for twenty four months after the date of acquisition to secure certain indemnification obligations of the emBoot Sellers.
The acquisition of emBoot was accounted for using the purchase method of accounting and the assets acquired and liabilities assumed were accounted for at their fair values at the acquisition date based on a management review. The amounts were based on currently available information and certain assumptions and estimates that management believed reasonable. Operating results of the Double-Take Canada acquisition of emBoot are included in the consolidated financial statements from its date of acquisition.
The details of the initial purchase price are as follows:
|
Cash purchase price
|
$ | 9,573 | |
|
Working capital adjustments
|
40 | ||
|
Transaction costs
|
280 | ||
|
Total initial purchase price
|
$ | 9,893 | |
The following table summarizes the estimated fair values of the assets acquired and the liabilities assumed at the date of acquisition:
|
Life
|
|||||
|
Cash and cash equivalents
|
$ | 89 | |||
|
Accounts receivable
|
119 | ||||
|
Prepaid expenses
|
34 | ||||
|
Accounts payable
|
(1 | ) | |||
|
Accrued expenses
|
(173 | ) | |||
|
Deferred revenue
|
(20 | ) | |||
|
Property plant equipment
|
35 |
3 years
|
|||
|
Technology related intangible
|
3,000 |
5 years
|
|||
|
Goodwill
|
6,810 | ||||
|
Net assets acquired
|
$ | 9,893 | |||
[3] Acquisition of TimeSpring Software Corporation:
On December 24, 2007, the Company and Double-Take Canada, a Canadian corporation and wholly-owned subsidiary of the Company, entered into a share purchase agreement (the “TimeSpring Purchase Agreement”) with TimeSpring Software Corporation, a Canadian corporation, and the shareholders of TimeSpring (the “TimeSpring Sellers”) for the acquisition of TimeSpring. Pursuant to the terms of the TimeSpring Purchase Agreement, Double-Take Canada acquired from the TimeSpring Sellers all of the issued and outstanding shares of TimeSpring for a cash purchase price of approximately $8.3 million plus transaction costs and subject to certain customary post-closing working capital adjustments. Approximately $1.4 million of the purchase price was placed into escrow to secure certain indemnification obligations of the TimeSpring Sellers. In February 2009 approximately $0.2 million of the purchase price was released from escrow to the former owners of TimeSpring. In November 2009 approximately $0.1 million of the purchase prices was released from escrow to the Company. In December 2009 the remaining $1.1 million of the purchase price was released from escrow to the former owners of TimeSpring.
The acquisition of TimeSpring, now called Double-Take Canada, was accounted for using the purchase method of accounting and the assets acquired and liabilities assumed were accounted for at their fair values at the acquisition date based on a management review. The amounts were based on currently available information and certain assumptions and estimates that management believed reasonable. Operating results of the Double-Take Canada acquisition of TimeSpring are included in the consolidated financial statements from its date of acquisition. The operating results from December 24, 2007 through December 31, 2007 for Double-Take Canada were de minimus.
The details of the initial purchase price are as follows (in thousands):
|
Cash purchase price
|
$ | 8,339 | ||
|
Working capital adjustments
|
818 | |||
|
Transaction costs
|
620 | |||
|
Total initial purchase price
|
$ | 9,777 | ||
The following table summarizes the estimated fair values of the assets acquired and the liabilities assumed at the date of acquisition:
|
|
|
Life
|
|||
|
Bank overdraft
|
$ | (149 | ) | ||
|
Accounts receivable
|
60 | ||||
|
Prepaid expenses and other current assets
|
1,215 | ||||
|
Account payable
|
(25 | ) | |||
|
Accrued expenses
|
(113 | ) | |||
|
Other liabilities
|
(92 | ) | |||
|
Deferred revenue
|
(36 | ) | |||
|
Properties and equipment
|
453 |
3-5 years
|
|||
|
Technology related intangible
|
1,936 |
5 years
|
|||
|
Goodwill
|
6,528 | ||||
|
Net assets acquired
|
$ | 9,777 | |||
In accordance with the TimeSpring Purchase Agreement between TimeSpring and Double-Take Canada, the Company made post-closing working capital adjustments to the purchase price allocation of $134. These post-closing adjustments increased the goodwill related to this acquisition to $6,662.
The following unaudited pro forma information represents the Company’s condensed consolidated results of operations as if the acquisition of Double-Take Canada had occurred as of the beginning of the year ended December 31, 2007. The pro forma amounts of net income includes amortization of the amounts ascribed to intangible assets acquired in the acquisition.
|
Year ended
|
||||
|
|
December 31, 2007
|
|||
|
Total Revenue
|
$ | 83,142 | ||
|
Net income
|
$ | 15,461 | ||
|
Basic net income per share
|
$ | 0.72 | ||
|
Diluted net income per share
|
$ | 0.67 | ||
|
Weighted average shares outstanding – basic
|
21,332 | |||
|
Weighted average shares outstanding – diluted
|
23,027 | |||
[4] Acquisition of Double-Take EMEA:
On May 23, 2006, the Company acquired all of the issued and outstanding shares of Sunbelt System Software S.A.S. which is now known as Double-Take Software S.A.S., or Double-Take EMEA. From 1998 through the acquisition date, Double-Take EMEA was the principal or exclusive distributor of the Company’s software in the European, Middle Eastern and African market and a certified Double-Take training organization. An initial payment of $1.1 million was made to the former stockholders of Double-Take EMEA for the acquisition, which represented earn-out payments for the period January 1, 2006 through April 30, 2006. Subsequent payments totaling $9.2 million were made through December 31, 2008 concluding the earn-out obligation. Earn-out payments in excess of the initial amount recorded as the liability have been recorded as additional purchase price and goodwill. Of the aggregate earn-out payments, $5.2 million was recorded as goodwill. A portion of the earn-out payments were held in escrow. The escrow account was established to hold 20% of the initial $1.1 million payment and 20% of each earn-out payment to satisfy claims against the selling shareholders that we may have from time to time as a result of breaches of representations, warranties or covenants. No claims against the escrow were made and the escrow was released to the former owners of Double-Take EMEA in 2008.
[5] Cash and cash equivalents:
Cash and cash equivalents consist primarily of highly liquid investments in time deposits held at major banks, and other money market securities with original maturities at date of purchase of 90 days or less.
[6] Short term investments and fair value
Short term investments, which are carried at fair value, generally consist of commercial paper and corporate notes with original maturities of one year or less with Standard and Poor’s ratings ranging from A to AA, certificates of deposit and United States Treasury obligations with original maturities of one year or less. The Company classifies these securities as available-for-sale. Management determines the appropriate classification of its investments at the time of purchase and at each balance sheet date. Available-for-sale securities are carried at fair value with unrealized gains and losses reported in accumulated other comprehensive income. Interest received on these securities is included in interest income. Realized gains or losses upon disposition of available-for-sale securities are included in other income.
Fair value is defined as the exchange price that would be received for an asset or paid to transfer a liability (an exit price) in the principal or most advantageous market for the asset or liability in an orderly transaction between market participants on the measurement date. A fair value hierarchy has been established which requires an entity to maximize the use of observable inputs and minimize the use of unobservable inputs when measuring fair value. The following three levels of inputs may be used to measure fair value:
|
·
|
Level 1 - Unadjusted quoted prices in active markets that are accessible at the measurement date for identical, unrestricted assets or liabilities.
|
|
·
|
Level 2 - Observable inputs other than Level 1 prices such as quoted prices for similar assets or liabilities; quoted prices in markets that are not active; or other inputs that are observable or can be corroborated by observable market data for substantially the full term of the assets or liabilities.
|
|
·
|
Level 3 - Unobservable inputs that are supported by little or no market activity and that are significant to the fair value of the assets or liabilities.
|
The Company’s assets that are measured at fair value on a recurring basis are generally classified within Level 1 or Level 2 of the fair value hierarchy. The types of instruments valued based on quoted market prices in active markets generally include most money market securities and equity investments and can include certain corporate notes, United States treasury obligations and some federal notes and bonds. Such instruments are generally classified within Level 1 of the fair value hierarchy. The Company invests in money market funds that are traded daily and does not adjust the quoted price for such instruments. The types of instruments valued based on quoted prices in less active markets, broker or dealer quotations, or alternative pricing sources with reasonable levels of price transparency generally include the Company’s commercial paper and can include certain federal notes and bonds. Such instruments are generally classified within Level 2 of the fair value hierarchy. The Company uses consensus pricing, which is based on multiple pricing sources, to value its cash equivalents and short term investments.
[7] Accounts receivable and allowance for doubtful accounts:
Financial instruments that potentially subject the Company to significant concentration of credit risk consist primarily of accounts receivable. The Company performs ongoing credit evaluations of its customers and maintains allowances for potential credit issues based on historical trends.
[8] Fair value other than investments:
At December 31, 2009 and 2008, the Company’s financial instruments other than investments consist primarily of accounts receivable, accounts payable. The carrying values of accounts receivable and accounts payable approximate their fair value, because of their short-term nature.
[9] Revenue recognition:
The Company’s revenue is reported net of rebates and discounts because there is no identifiable benefit in exchange for the rebate or discount. The Company derives revenues from two primary sources or elements: software licenses and services. Services include customer support, consulting, installation services and training. A typical sales arrangement includes both of these elements.
For software arrangements involving multiple elements, the Company recognizes revenue using the residual method. Under the residual method, the Company allocates and defers revenue for the undelivered elements based on relative fair value and recognizes the difference between the total arrangement fee and the amount deferred for the undelivered elements as revenue. The determination of fair value of the undelivered elements in multiple element arrangements is based on the price charged when such elements are sold separately, which is commonly referred to as vendor-specific objective-evidence (“VSOE”).
The Company’s software licenses typically provide for a perpetual right to use the Company’s software and are sold on a per-copy basis. The Company recognizes software revenue through direct sales channels and resellers upon receipt of a purchase order or other persuasive evidence and when all other basic revenue recognition criteria are met as described below. Revenue from software licenses sold through an original equipment manufacturer partner is recognized upon the receipt of a royalty report evidencing sales.
Services revenue includes revenue from customer support and other professional services. Customer support includes software updates (including unspecified product upgrades and enhancements) on a when-and-if-available basis, telephone support and bug fixes or patches. Customer support revenue is recognized ratably over the term of the customer support agreement, which is typically one year. To determine the price for the customer support element when sold separately, the Company uses actual rates at which it has previously sold support as established VSOE.
Other professional services such as consulting and installation services provided by the Company are not essential to the functionality of the software and can also be performed by the customer or a third party. Revenues from consulting and installation services are recognized when the services are completed. Training fees are recognized after the training course has been provided. Any paid professional services, including training, that have not been performed within three years of the original invoice date are recognized as revenue in the quarter that is three years after the original invoice date. Based on the Company’s analysis of such other professional services transactions sold on a stand-alone basis, the Company has concluded it has established VSOE for such other professional services when sold in connection with a multiple-element software arrangement. The price for other professional services has not materially changed for the periods presented.
The Company has analyzed all of the undelivered elements included in its multiple-element arrangements and determined that VSOE of fair value exists to allocate revenues to services. Accordingly, assuming all basic revenue recognition criteria are met, software revenue is recognized upon delivery of the software license using the residual method.
The Company considers the four basic revenue recognition criteria for each of the elements as follows:
Persuasive evidence of an arrangement with the customer exists. The Company’s customary practice is to require a purchase order and, in some cases, a written contract signed by both the customer and the Company prior to recognizing revenue with respect to an arrangement.
Delivery or performance has occurred. The Company’s software applications are usually physically delivered to customers with standard transfer terms such as FOB shipping point and/or delivered via email. Software and/or software license keys for add-on orders or software updates are typically delivered via email. The Company recognizes software revenue upon shipment to resellers and distributors because there is no right of return or refund and generally no price protection agreements. In situations where multiple copies of licenses are purchased, all copies are delivered to the customer in one shipment and revenue is recognized upon shipment. Occasionally, the Company enters into a site license with a customer that allows the customer to use a specified number of licenses within the organization. When a site license is sold, the Company delivers a master disk to the customer that allows the product to be installed on multiple servers. The Company has no further obligation to provide additional copies of the software or user manuals. Revenue on site licenses is recognized upon shipment of the master disk to the customer. Sales made by the Company’s Original Equipment Manufacturer (OEM) partners are recognized as revenue in the month the product is shipped. The Company estimates the revenue from a preliminary report received from the OEM shortly after the end of the month. Once the final report is received, the revenue is adjusted to that based on the final report, usually in the following month. Services revenue is recognized when the services are completed, except for customer support, which is recognized ratably over the term of the customer support agreement, which is typically one year.
Fee is fixed or determinable. The fee customers pay for software applications, customer support and other professional services is negotiated at the outset of an arrangement. The fees are therefore considered to be fixed or determinable at the inception of the arrangement.
Collection is probable. Probability of collection is assessed on a customer-by-customer basis. Each new customer undergoes a credit review process to evaluate its financial position and ability to pay. If the Company determines from the outset of an arrangement that collection is not probable based upon the review process, revenue is recognized on a cash-collected basis.
The Company’s arrangements do not generally include acceptance clauses. However, if an arrangement does include an acceptance clause, revenue for such an arrangement is deferred and recognized upon acceptance. Acceptance occurs upon the earliest of receipt of a written customer acceptance, waiver of customer acceptance or expiration of the acceptance period.
[10] Cost of revenue:
Cost of Software Revenue. Cost of software revenue consists primarily of media, manual, translation and distribution costs, and royalties to third-party software developers for technology embedded within our software. Because our development initiatives have resulted in insignificant time and costs incurred between technological feasibility and the point at which the software is ready for general release, we do not capitalize any of our internally-developed software.
Cost of Services Revenue. Cost of services revenue consists primarily of salary and other personnel-related costs incurred in connection with our provision of maintenance and professional services. Cost of services revenue also includes other allocated overhead expenses for our professional services and product support personnel, as well as travel-related expenses for our staff to perform work at a customer’s site.
[11] Property, plant and equipment:
Furniture, equipment and computer hardware are depreciated using the straight-line method over their estimated useful lives of up to three years. Leasehold improvements are amortized by the straight-line method over the shorter of the remaining initial terms of the respective leases or economic useful life.
[12] Software development costs:
Capitalization of certain software development costs subsequent to the establishment of technological feasibility is required by Generally Accepted Accounting Principles (“GAAP”). The Company’s current process for developing software is essentially completed concurrently with the establishment of technological feasibility and therefore no software development costs have been capitalized for the years ended December 31, 2009 and 2008. Costs incurred to develop software programs prior to the achievement of technological feasibility are expensed as incurred.
[13] Goodwill:
Goodwill with indefinite lives is not amortized but reviewed for impairment if impairment indicators arise and, at a minimum, annually. During 2009, there were no impairment indicators that arose, therefore, the impairment test was completed only annually. A two-step impairment test is required with the first step comparing the fair value of the reporting unit with its carrying amount. The second step of the impairment test is comparing the implied fair value of the reporting unit’s goodwill with the carrying amount of that goodwill. If in the first step of the impairment test the fair value of the reporting unit exceeds the carrying amount of the reporting unit, then the second step of the impairment test is unnecessary. During 2009 the fair value of the reporting unit exceeded the carrying value, therefore, goodwill was not impaired as of December 31, 2009.
[14] Intangible assets:
Intangible assets are amortized using the straight-line method over their estimated useful lives. Customer relationships and technology related intangibles have an estimated useful life of 5 years and marketing relationships have an estimated useful life of 8 years.
[15] Impairment of long-lived assets:
The Company records impairment losses on long-lived assets used in operations or expected to be disposed of when indicators of impairment exist and the cash flows expected to be derived from those assets are less than carrying amounts of those assets. The Company has not recorded any impairment charge for the years ended December 31, 2009, 2008 and 2007.
[16] Advertising expense:
Advertising costs, which include reimbursements to resellers and distributors of $3,062, $2,868 and $2,772 for the years ended December 31, 2009, 2008 and 2007, respectively, are expensed as incurred. Advertising costs are included in sales and marketing costs.
[17] Income taxes:
The Company records income tax expense related to income generated during the periods using an effective tax rate expected to be in effect for the full year. Deferred tax assets and liabilities are determined based on differences between financial reporting and tax bases of assets and liabilities, and are measured using the enacted laws and tax rates that are expected to be in effect when the differences are expected to reverse. The measurement of deferred tax assets is reduced, if necessary, by a valuation allowance for any tax benefits not expected to be realized. The effect on deferred tax assets and liabilities of a change in tax rates is recognized in the period that such tax rate changes are enacted.
The Company accounts for any uncertainty in income taxes using a two-step process that separates recognition from measurement. During the year ended December 31, 2009, the Company did not recognize any increase or decrease to reserves for uncertain tax positions.
[18] Sales tax:
The Company records sales tax collected from its customers on a net basis.
[19] Accounting estimates:
The preparation of financial statements in conformity with accounting principles generally accepted in the United States of America requires management to make estimates and assumptions that affect the reported amounts of assets and liabilities and disclosure of contingent assets and liabilities at the date of the financial statements and the reported amounts of revenue, costs and expenses during the periods presented. Based on historical experience and current account information, estimates are made regarding provisions for allowances for doubtful accounts receivable, sales discounts and other allowances, depreciation, amortization, asset valuations and stock based compensation. Actual results could differ from those estimates.
[20] Concentration of credit risk:
The Company grants credit to customers in a wide variety of industries and geographic locations.
The Company’s cash and cash equivalents and short term investments are carried at their fair value, and at times, may exceed federally insured limits.
[21] Foreign Currency Translation
The functional currency of the Company’s foreign operations are the local country’s currency, the Euro, British Pound and Canadian Dollar. The assets and liabilities of the Company’s international subsidiaries are translated at their respective period-end exchange rates, and revenues and expenses are translated at average currency exchange rates for the period. The resulting balance sheet translation adjustments are included in “Other comprehensive income (loss)” and are reflected as a separate component of stockholders’ equity (deficit). Foreign currency transaction gains and losses are included in results of operations. Through December 31, 2009, the Company has not entered into any transactions to hedge its exposure to changes in foreign currency exchange rates.
[22] Comprehensive Income (Loss)
Comprehensive income (loss), presented in the statement of changes in stockholders’ equity (deficit), includes other comprehensive income and net income or loss. Other comprehensive income includes certain changes in equity that are excluded from net income (loss). Specifically, cumulative foreign currency translation adjustments and unrealized gains (losses) on marketable securities are included in accumulated other comprehensive income.
[23] Stock-based compensation:
The Company recognizes stock option expense using the fair value recognition method. The Company applies the fair value recognition method only to awards granted, modified, repurchased or cancelled after January 1, 2006. Stock-based compensation expense is recognized based on the grant-date fair value of stock option awards granted or modified after January 1, 2006. As the Company had used the minimum value method for valuing its stock options prior to January 1, 2006, all unmodified options granted prior to January 1, 2006 continue to be accounted for under using the minimum value method.
The Company accounts for stock-based compensation expense related to restricted stock units using the fair value of the nonvested stock on the grant date. The fair value is measured as the market price of a share of nonrestricted stock on the grant date.
The Company accounts for stock awards to non-employees by recognizing the fair value of these instruments as an expense over the period in which the related services are rendered.
[24] Net income per share:
Basic net income per share is calculated by dividing the net income by the weighted-average number of common shares outstanding during the period. Diluted net income per share is calculated by dividing net income by the weighted-average number of common shares outstanding, adjusted for the dilutive effect, if any, of potential common shares.
The following potential common shares were excluded from the computation of diluted net income per share because they had an anti-dilutive impact:
|
|
Year Ended December 31,
|
|||||||||||
|
|
2009
|
2008
|
2007
|
|||||||||
|
Stock options
|
1,616 | 1,507 | 727 | |||||||||
[25] Reclassifications
Certain reclassifications have been made to prior year amounts to conform to the current period presentation.
[26] Recent accounting pronouncements:
Effective July 1, 2009, the FASB Accounting Standards Codification (“Codification”) became the single source of authoritative nongovernmental U.S. generally accepted accounting principles. Rules and interpretive releases of the SEC under authority of federal securities laws are also sources of authoritative GAAP for SEC registrants. The Codification is effective for interim and annual periods ended after September 15, 2009. All existing accounting standards are superseded and the Codification became the only level of authoritative GAAP. All other accounting literature not included in the Codification is nonauthoritative. Our accounting policies were not affected by the conversion to the Codification, but any references to specific accounting standards in our footnotes to our consolidated financial statements have been changed to refer to the appropriate section of the Codification.
In March 2008, the FASB issued guidance intended to improve financial reporting about derivative instruments and hedging activities by requiring enhanced disclosures to enable investors to better understand their effects on an entity’s financial position, financial performance, and cash flows. The guidance also improves transparency about the location and amounts of derivative instruments in an entity’s financial statements; how derivative instruments and related hedged items are accounted for; and how derivative instruments and related hedged items affect its financial position, financial performance, and cash flows. The guidance is effective for financial statements issued for fiscal years and interim periods beginning after November 15, 2008, with early application encouraged. The Company adopted this guidance effective January 1, 2009 and the implementation of this standard did not have an impact on the Company’s consolidated financial position and results of operations.
In December 2007, the FASB issued guidance for business combinations which establishes principles and requirements for how an acquirer recognizes and measures in its financial statements the identifiable assets acquired, including goodwill, the liabilities assumed and any non-controlling interest in the acquiree. The guidance also establishes disclosure requirements to enable users of the financial statements to evaluate the nature and financial effects of the business combination. The guidance is effective for business combinations for which the acquisition date is on or after the beginning of the first annual reporting period beginning on or after December 15, 2008. In April 2009, the FASB issued guidance which amended certain previous guidance related to the recognition, measurement, and disclosure of assets acquired and liabilities assumed in a business combination that arise from contingencies. This guidance became effective in the first quarter of 2009. There have been no business combinations during 2009. As a result the implementation of this standard did not have an impact on the Company’s consolidated financial position and results of operations. Any future impact related to these standards will be dependent on the future business combinations that the Company may pursue.
In December 2007, the FASB issued guidance which establishes accounting and reporting standards for the noncontrolling interest in a subsidiary and for the deconsolidation of a subsidiary. The guidance was effective as of the beginning of the Company’s fiscal year beginning after December 15, 2008. The Company adopted this standard effective January 1, 2009 and the implementation of this standard did not have an impact on the Company’s consolidated financial position and results of operations.
In April 2008, the FASB issued guidance which amends the factors that should be considered in developing renewal or extension assumptions used to determine the useful life of a recognized intangible asset. The intent of the guidance is to improve the consistency between the useful life of a recognized intangible asset under and the period of expected cash flows used to measure the fair value of the asset. This standard is effective for financial statements issued for fiscal years beginning after December 15, 2008, and interim periods within those fiscal years. Early adoption is prohibited. The Company adopted this standard effective January 1, 2009 and the implementation of this standard did not have an impact on the Company’s consolidated financial position and results of operations.
In April 2009, the FASB issued additional guidance related to fair value accounting. This guidance addresses the impact on fair value when market activity has decreased, when other-than-temporary impairment of assets has occurred and interim fair value disclosures for financial instruments. This guidance impacts certain aspects of fair value measurement and related disclosures. These standards are effective for interim periods beginning after June 15, 2009. The Company adopted these standards effective the interim period ending June 30, 2009 and the implementation did not have an impact on the Company's consolidated financial position and results of operations.
In May 2009, the FASB issued new guidance which establishes general standards of accounting for and disclosure of events that occur after the balance sheet date but before financial statements are issued or are available to be issued. The guidance sets forth (1) the period after the balance sheet date during which management of a reporting entity should evaluate events or transactions that may occur for potential recognition or disclosure in the financial statements, (2) the circumstances under which an entity should recognize events or transactions occurring after the balance sheet date in its financial statements and (3) the disclosures that an entity should make about events or transactions that occurred after the balance sheet date. The standard is effective for interim or annual financial periods ending after June 15, 2009. The Company adopted this standard effective the interim period ending June 30, 2009 and the implementation of this standard did not have an impact on the Company’s consolidated results of operations or financial position.
In June 2009, the FASB issued new guidance which improves the relevance, representational faithfulness, and comparability of the information that a reporting entity provides in its financial statements about a transfer of financial assets; the effects of a transfer on its financial position, financial performance, and cash flows; and a transferor’s continuing involvement, if any, in transferred financial assets. This standard is effective as of the beginning of each reporting entity’s first annual reporting period that begins after November 15, 2009, for interim periods within that first annual reporting period and for interim and annual reporting periods thereafter. The Company is currently evaluating the impact on its consolidated results of operations and financial position of adopting this pronouncement.
In June 2009, the FASB issued guidance to amend previous guidance related to determining whether an enterprise has a controlling financial interest in a variable interest entity. This determination identifies the primary beneficiary of a variable interest entity as the enterprise that has both the power to direct the activities of a variable interest entity that most significantly impacts the entity’s economic performance, and the obligation to absorb losses or the right to receive benefits of the entity that could potentially be significant to the variable interest entity. The guidance also requires ongoing reassessments of whether an enterprise is the primary beneficiary and eliminates the quantitative approach previously required for determining the primary beneficiary. The standard is effective January 1, 2010. The Company is currently evaluating the impact on its consolidated results of operations and financial position of adopting this pronouncement, but the Company does not expect this pronouncement to have a significant impact on the Company’s consolidated results of operations or financial position.
In October 2009, the FASB issued new guidance which provides principles for allocation of consideration among its multiple-elements, allowing more flexibility in identifying and accounting for separate deliverables under an arrangement. The guidance introduces an estimated selling price method for valuing the elements of a bundled arrangement if vendor-specific objective evidence or third-party evidence of selling price is not available, and significantly expands related disclosure requirements. This standard is effective on a prospective basis for revenue arrangements entered into or materially modified in fiscal years beginning on or after June 15, 2010. Alternatively, adoption may be on a retrospective basis, and early application is permitted. The Company is currently evaluating the impact on its consolidated results of operations and financial position of adopting this pronouncement.
In October 2009, the FASB issued new guidance which clarifies which guidance should be used in allocating and measuring revenue arrangements which include both tangible products and software. In particular, tangible products containing software components and nonsoftware components that function together to deliver the tangible product's essential functionality will no longer be within the scope of the software revenue guidance. This guidance also significantly expands related disclosure requirements. This standard is effective on a prospective basis for revenue arrangements entered into or materially modified in fiscal years beginning on or after June 15, 2010. Alternatively, adoption may be on a retrospective basis, and early application is permitted. The Company must adopt this standard in the same period using the same transition method as it uses for the adoption of the guidance related to multiple element arrangements previously discussed. The Company is currently evaluating the impact on its consolidated results of operations and financial position of adopting this pronouncement.
In February 2010, the FASB issued new guidance which states that an entity that is an SEC filer is not required to disclose the date through which subsequent events have been evaluated. This pronouncement was effective upon issuance. The Company adopted this pronouncement and the implementation of this pronouncement did not have an impact on the Company’s consolidated results of operations or financial position.
Note B — Revolving Line of Credit
In October 2003, the Company entered into a 12- month revolving line of credit agreement with Silicon Valley Bank. In May 2007, the Company entered into an amendment to the credit facility (the “Amended Facility”) that extended the term of the facility to April 29, 2008. Under the terms of the Amended Facility, the Company’s maximum borrowings are $2,000 less the aggregate amounts undrawn on all outstanding letters of credit, foreign exchange contracts, or any other accommodations issued or incurred, or caused to be issued or incurred by the bank. Up to $500 of the facility is available for foreign exchange contracts. The rate of interest for the Amended Facility is 0.75% above the prime rate. The facility is collateralized by all of the Company’s assets, excluding intellectual property.
The Amended Facility contains a number of restrictions that limit the Company’s ability, among other things, to do the following: borrow money; enter into transactions outside the ordinary course of business; pledge accounts receivable, inventory, intellectual property and most other assets as security in other borrowings or transactions; pay dividends on stock, redeem or acquire any of our securities; sell certain assets; make certain investments; guaranty obligations of third-parties; undergo a merger or consolidation; or engage in any business other than the business in which we are currently engaged or business that is reasonably related to that business. As required under the Amended Facility, Silicon Valley Bank issued a consent for the acquisition of TimeSpring.
In May 2008, the Company entered into another amendment to the credit facility (the “Second Amended Facility”) that extended the term of the facility to April 29, 2009. Under the terms of the amended credit facility, the Company’s maximum borrowings, amount available for foreign exchange contracts and the rate of interest remained the same as the Amended Facility. The Second Amended Facility modified the need for the consent for an acquisition of 100 percent of an entity’s stock or assets. The facility continues to be collateralized by all of the Company’s assets, excluding the Company’s intellectual property.
In June 2009, the Company entered into another amendment to the credit facility (the “Third Amended Facility”) that extended the term of the facility to April 28, 2010. Under the terms of the amended credit facility, the Company’s maximum borrowings, amount available for foreign exchange contracts and the rate of interest remained the same as the Second Amended Facility.
At December 31, 2009, 2008 and 2007, there were no borrowings under this line of credit. At December 31, 2009, 2008, and 2007 there was a letter of credit outstanding in the amount of $0, $1,000 and $1,500, respectively. In July 2009, the letter of credit related to the settled legal proceeding (see Note G [2]) was cancelled.
Note C — CASH, CASH EQUIVALENTS, SHORT TERM INVESTMENTS AND FAIR VALUE
Short term investments, which are carried at fair value, generally consist of commercial paper and corporate notes with original maturities of one year or less with Standard and Poor’s ratings ranging from A to AA, certificates of deposit and United States Treasury obligations with original maturities of one year or less. The Company classifies these securities as available-for-sale. Short term investments are $38,246 as of December 31, 2009 and $32,524 as of December 31, 2008. The Company has recorded $5 of unrealized losses in other comprehensive income as of December 31, 2009 and $47 of unrealized gains in other comprehensive income as of December 31, 2008. During 2009 and 2008, there were no realized gains or losses due to disposition of available-for-sale securities.
Interest income as of December 31, 2009, 2008 and 2007 was $327, $1,695, and $3,019, respectively.
The following table sets forth a summary of the Company’s financial assets, classified as cash and cash equivalents and short-term investments on its consolidated balance sheet, measured at fair value on a recurring basis as of December 31, 2009:
|
Description
|
Total
|
Quoted Prices in Active Markets for Identical Assets (Level 1)
|
Significant Other Observable Inputs
(Level 2)
|
Significant unobservable
Inputs
(Level 3)
|
||||||||||||
|
Cash & cash equivalents
|
||||||||||||||||
|
Cash Management Funds
|
$ | 25,370 | $ | 25,370 | $ | - | $ | - | ||||||||
|
Total
|
$ | 25,370 | $ | 25,370 | - | - | ||||||||||
|
Short-term Investments
|
||||||||||||||||
|
Certificate of Deposit
|
5,300 | 5,300 | - | - | ||||||||||||
|
Commercial Paper
|
11,586 | - | 11,586 | - | ||||||||||||
|
Corporate Notes
|
9,290 | 9,290 | - | - | ||||||||||||
|
United States Treasury Bills
|
12,070 | 12,070 | - | - | ||||||||||||
|
Total
|
$ | 38,246 | $ | 26,660 | $ | 11,586 | $ | - | ||||||||
Note D — Property and Equipment
Property and equipment consists of the following:
|
December 31,
|
||||||||||
|
2009
|
2008
|
|||||||||
|
Equipment
|
$ | 216 | $ | 188 | ||||||
|
Furniture and fixtures
|
546 | 508 | ||||||||
|
Motor Vehicles
|
102 | 109 | ||||||||
|
Computer hardware
|
10,517 | 9,406 | ||||||||
|
Leasehold improvements
|
842 | 712 | ||||||||
| 12,223 | 10,923 | |||||||||
|
Less accumulated depreciation and amortization
|
9,149 | 6,687 | ||||||||
| $ | 3,074 | $ | 4,236 | |||||||
Property and equipment under capital leases as of December 31, 2009 and 2008 are $0 and $145, respectively.
During the years ended December 31, 2009, 2008 and 2007, the Company recorded depreciation expense of $2,408, $2,348 and $1,636, respectively.
Note e — INTANGIBLE ASSETS
During the years ended December 31, 2009, 2008 and 2007, the Company recorded amortization of intangible assets of $1,578, $1,290 and $710, respectively. These amounts are included in depreciation and amortization on the consolidated income statements.
Intangible assets consist of the following:
|
December 31,
|
||||||||
|
2009
|
2008
|
|||||||
|
Customer relationships
|
$ | 2,267 | $ | 2,267 | ||||
|
Less accumulated amortization
|
(1,634 | ) | (1,181 | ) | ||||
| $ | 633 | $ | 1,086 | |||||
|
December 31,
|
||||||||
|
2009
|
2008
|
|||||||
|
Marketing relationships
|
$ | 1,992 | $ | 1,992 | ||||
|
Less accumulated amortization
|
(897 | ) | (648 | ) | ||||
| $ | 1,095 | $ | 1,344 | |||||
|
December 31,
|
||||||||
|
2009
|
2008
|
|||||||
|
Technology related intangibles
|
$ | 4,936 | $ | 4,936 | ||||
|
Foreign currency translation
|
(357 | ) | (870 | ) | ||||
|
Less accumulated amortization
|
(1,409 | ) | (533 | ) | ||||
| $ | 3,170 | $ | 3,533 | |||||
Future amortization of intangible assets is estimated as follows:
|
Year Ending December 31,
|
||||
|
2010
|
$ | 1,640 | ||
|
2011
|
1,367 | |||
|
2012
|
1,157 | |||
|
2013
|
635 | |||
|
2014
|
99 | |||
|
Thereafter
|
- | |||
|
Total
|
$ | 4,898 | ||
Note F — Provision for Income Taxes
The Company’s net income (loss) before income taxes is as follows:
|
Year Ended December 31,
|
||||||||||||
|
|
2009
|
2008
|
2007
|
|||||||||
|
Domestic
|
$ | 8,715 | $ | 17,598 | $ | 15,979 | ||||||
|
Foreign
|
1,617 | 771 | 3,310 | |||||||||
|
Total
|
$ | 10,332 | $ | 18,369 | $ | 19,289 | ||||||
The Company’s income tax provision (benefit) is as follows:
| Year Ended December 31, | ||||||||||||
|
|
2009
|
2008
|
2007
|
|||||||||
|
Current
|
||||||||||||
|
Federal
|
$ | 1,660 | $ | 6 | $ | 2,986 | ||||||
|
State and Local
|
450 | — | 1,093 | |||||||||
|
Foreign
|
350 | 267 | 1,021 | |||||||||
|
Deferred
|
||||||||||||
|
Federal
|
(4,744 | ) | 372 | (4,959 | ) | |||||||
|
State and Local
|
(843 | ) | 79 | (930 | ) | |||||||
|
Foreign
|
— | — | — | |||||||||
|
Total
|
$ | (3,127 | ) | $ | 724 | $ | (789 | ) | ||||
The variances between the Company’s effective income tax rate and the Federal statutory rate are as follows:
|
|
Year Ended December 31,
|
|||||||||||
|
|
2009
|
2008
|
2007
|
|||||||||
|
Statutory federal income tax expense rate
|
35 | % | 35 | % | 34 | % | ||||||
|
Decrease in valuation allowance
|
(84 | )% | (48 | )% | (46 | )% | ||||||
|
State taxes (benefit)
|
(2 | )% | 4 | % | 5 | % | ||||||
|
Impact of permanent difference
|
15 | % | 9 | % | 3 | % | ||||||
|
Foreign taxes
|
3 | % | 2 | % | 0 | % | ||||||
|
Other
|
3 | % | 2 | % | 0 | % | ||||||
|
Effective income tax expense (benefit) rate
|
(30 | )% | 4 | % | (4 | )% | ||||||
The Company has deferred tax assets related to temporary differences and operating loss carryforwards as follows:
|
December 31,
|
||||||||
|
|
2009
|
2008
|
||||||
|
Deferred tax assets:
|
||||||||
|
Current:
|
||||||||
|
Allowance for doubtful accounts
|
$ | 126 | $ | 184 | ||||
|
Deferred revenue
|
695 | 1,224 | ||||||
|
Accrued bonus
|
4 | 103 | ||||||
|
Foreign tax credit
|
- | 240 | ||||||
|
Net operating loss carryforward
|
5,062 | 5,438 | ||||||
|
Total current deferred tax assets
|
5,887 | 7,189 | ||||||
|
Non-current:
|
||||||||
|
Fixed assets
|
315 | 111 | ||||||
|
Straight-line rent
|
60 | 106 | ||||||
|
Foreign tax credit
|
560 | — | ||||||
|
Net operating loss carryforward
|
9,554 | 15,742 | ||||||
|
Deferred revenue
|
841 | 593 | ||||||
|
Intangibles
|
568 | 420 | ||||||
|
Other
|
744 | 300 | ||||||
|
Total non-current deferred tax assets
|
12,642 | 17,272 | ||||||
|
Total deferred tax assets
|
18,529 | 24,461 | ||||||
|
Valuation allowance
|
(6,101 | ) | (17,354 | ) | ||||
|
Deferred liability:
|
||||||||
|
Prepaid expenses
|
(354 | ) | (744 | ) | ||||
|
Intangible assets
|
(1,049 | ) | (925 | ) | ||||
|
Total deferred liability
|
(1,403 | ) | (1,669 | ) | ||||
|
Net deferred tax assets
|
$ | 11,025 | $ | 5,438 | ||||
At December 31, 2009 and 2008, the Company has available state net operating loss carryforwards in certain states ranging from approximately $7,000 to $21,000 and $25,000 to $37,000, respectively, depending upon the state, expiring in various amounts through 2025. The Company also has available Federal net operating loss carryforwards of approximately $22,000 and $36,000 at December 31, 2009 and 2008, respectively, expiring 2017 through 2026. The utilization of these operating loss carryforwards are limited each year based upon changes in ownership as defined in Section 382 of the Internal Revenue Code. In 2007, based upon information available at the time, the Company determined the utilization of the net operating loss carryforwards was limited to $7.1 million per year. During the fourth quarter of 2008, based upon newly available information, the Company re-evaluated its ability to utilize the benefit from the net operating loss carryforwards. The Company concluded the net operating loss carryforwards were limited to $15.2 million per year, thus allowing the net operating loss carryforwards to be utilized more quickly than originally anticipated in 2007.
In 2007, the Company determined that based upon a number of factors, including the Company’s cumulative taxable income over the past two years and expected profitability in future years that certain of its deferred tax assets were more-likely-than-not realizable through future earnings. Accordingly, the Company reversed $5,698 in the second quarter of 2007 and $3,262 in the fourth quarter of 2007 of its deferred income tax valuation allowance and recorded a corresponding tax benefit of $8,960. As a result of the acquisition of TimeSpring, the Company acquired approximately $18,186 of Canadian federal net operating loss carryforwards, $16,558 of Canadian provincial (Quebec) net operating loss carryforwards, and $279 of investment tax credits all of which expire in various amounts through 2026. Additionally, approximately $11,620 of research and development loss carryforwards were acquired, which are available for use indefinitely. Due to the uncertainty of the realization of these Canadian carryforwards through future operating results, the deferred tax assets attributed to these carryforwards are fully reserved in the valuation allowance. As of December 31, 2007, the Company’s valuation allowance for deferred tax assets and liabilities was $26,030 due to uncertainty of realization through future operating results.
In 2008, as a result of the increased limit on the utilization of net operating loss carryforwards, the Company concluded it is able to utilize the net operating loss carryforwards more quickly than originally anticipated. As a result, the Company fully utilized the deferred tax asset recorded in 2007. Due to the increased net operating loss carryforward limitation available in 2008, the Company reversed the valuation allowance on $3,612 of deferred tax assets and recorded a corresponding tax benefit. This deferred tax asset was substantially utilized in 2008. Additionally the Company reversed and utilized $300 of the available Canadian net operating loss carryforwards in 2008. In addition in 2009, as a result of the increased net operating loss carryforward limitation, the Company received various refunds of income taxes paid in 2008. In 2008, the Company evaluated whether it was more likely than not that it would generate sufficient taxable income to further use the net operating loss carryforwards eligible to be utilized in 2009 and beyond. Based upon profitability over the prior two years and evaluation of the 2009 expected taxable income, the Company concluded it was more likely than not it would generate sufficient taxable income to utilize at least a portion of the net operating loss carryforwards available to be used in 2009 and beyond. As a result, an additional $5,000 of the valuation allowance on the deferred tax assets was reversed and a net tax benefit and a deferred tax asset were recorded in 2008.
During 2009, the Company concluded based upon profitability over the past three years and evaluation of the 2010 expected taxable income, it is more likely than not net operating loss carryforwards and various deferred tax assets will be able to be utilized. As a result, an additional $8,706 of the valuation allowance was reversed. The remaining valuation allowance of $6,101 is primarily related to net operating loss carryforwards related to Canada and some state net operating loss carryforwards where the Company believes it currently is not more likely than not that these net operating loss carryforwards will be utilized. When further positive evidence exists that the Company will be able to utilize the available net operating loss carryforwards, the Company will reverse additional valuation allowance on the deferred tax assets.
Excess tax benefits related to share based payments are credited to equity. When determining this excess tax benefit, the Company elected to follow the tax law approach. As a result, the Company’s excess tax benefit which was recorded to equity was approximately $76 and $163 for the year ended December 31, 2009 and 2008, respectively.
The Company accounts for any uncertainty in income taxes using a two-step process that separates recognition from measurement. During the year ended December 31, 2009, the Company did not recognize any increase or decrease to reserves for uncertain tax positions.
The Company is subject to income taxes in the U.S. federal jurisdiction, and various states and foreign jurisdictions. Tax regulations within each jurisdiction are subject to the interpretation of the related tax laws and regulations and require significant judgment to apply. With few exceptions, the Company is no longer subject to U.S. federal, state and local, or non-U.S. income tax assessments by tax authorities for the years before 2004.
The Company has elected to record interest and penalties recognized in the financial statements as income taxes. Any subsequent change in classification of interest and penalties will be treated as a change in accounting principle.
In 2009, the valuation allowance decreased by $11,253 substantially due to the release of the valuation allowance related to the net operating loss carryforwards and deferred tax assets described above. In 2008, the valuation allowance decreased by $8,676 substantially due to the release of the valuation allowance related to the net operating loss carryforwards described above. The valuation allowance increased in 2007 by a net amount of $995 due to the acquisition of the tax carryforwards from TimeSpring offset by the release of the valuation allowance and operating income.
Note G — Commitments and Contingencies
[1] Leases:
The Company has a lease agreement for its offices in New Jersey which expires in 2011 and a lease for its office in Indiana that expires in 2010. In 2009, the Company entered into a new lease agreement for its current office in Indiana. The new lease replaces the previous lease in effect for that office location and expires in 2017. The Company has a sublease agreement for an office in Massachusetts that expired in 2006. The lease has been extended each year for additional one year terms and currently expires in February 2011. The Company also has leases for its offices in Paris, France that expires in 2016 for its offices in Worcester, United Kingdom that expired in 2009. In 2009, the Company entered into a new lease for its offices in Worcester, United Kingdom which expires in 2018 with the Company having the option to terminate in 2012.
Future minimum annual payments are as follows:
|
Year Ending December 31,
|
||||
|
2010
|
$ | 1,722 | ||
|
2011
|
$ | 1,740 | ||
|
2012
|
$ | 1,466 | ||
|
2013
|
$ | 1,422 | ||
|
2014
|
$ | 1,314 | ||
|
Thereafter
|
$ | 3,898 | ||
| $ | 11,562 | |||
Rent expense under operating leases amounted to approximately $2,224, $2,174 and $1,878 for the years ended 2009, 2008 and 2007, respectively.
Rent expense is calculated by amortizing total rental payments (net of any rental abatements, allowances and other rental concessions), on a straight-line basis, over the lease term. Accordingly, rent expense charged to operations differs from rent paid resulting in the Company recording deferred rent.
[2] Litigation:
In May 2003, a provider of information storage systems (“Plaintiff”), filed a complaint in the State of California alleging that the Company infringed certain of its patents. In December 2005 the Company and Plaintiff entered into a settlement agreement (the “Settlement Agreement”) wherein all claims and counterclaims were dismissed with prejudice. Under the terms of the Settlement Agreement, the Company made an initial payment to Plaintiff of $3,760 in January 2006 and further agreed to make additional minimum payments aggregating $2,000 which the Company can use towards the purchase or resale of Plaintiff’s products over 4 years. This annual payment obligation is collateralized by a letter of credit. As the Company has the ability and intent to acquire inventory or fixed assets for the $2,000, no accrual of this amount was made at settlement. In 2006 Company acquired $500 worth of computer equipment from the plaintiff which was subsequently paid in January 2007. In 2007 the Company acquired $500 worth of computer equipment. In 2008, $750 of computer equipment was acquired from the plaintiff. The remaining $250 of computer equipment was acquired in 2009. In July 2009 the letter of credit was cancelled as the entire obligation to the plaintiff was completed.
In the normal course of its business, the Company may be involved in various claims, negotiations and legal actions; however, at December 31, 2009, the Company is not party to any litigation that is expected to have a material effect on the Company’s financial position, results of operations or cash flows.
Note H — Concentration
The Company sells its products primarily to or through Distributors, VARS and OEMS who in turn sell to end-users of the Company’s products. The Company believes that the loss of any of these reseller/distributors would require the Company to develop other channels to sell its products to end-users.
During the years ended December 31, 2009, 2008 and 2007, one domestic reseller accounted for approximately 17%, 17% and 18%, respectively, of total sales. During 2009, 2008 and 2007, there were no foreign resellers which accounted for a significant percent of total revenue. The domestic reseller accounted for approximately 20% and 17% of accounts receivable at December 31, 2009 and 2008, respectively.
Note I— Employment Agreements
The employment terms for the Company’s Chief Executive Officer (“CEO”), as revised in August 2006, provide for annual compensation of $340,000, annual vacation, medical insurance, life and long-term disability insurance, eligibility for discretionary performance bonus and reimbursement for reasonable business expenses. On November 9, 2007 the Company entered into a letter agreement with the CEO. The letter agreement provides for severance payments, in the event the CEO’s employment with the Company is terminated without cause, in the amount of one times the CEO’s annual salary, which amounts will be paid in accordance with the Company’s regular payroll periods, and provide for the continuation of certain health care benefits for a 12-month period following the CEO’s termination. The payments and benefits under the letter agreements are subject to the CEO executing and not revoking a release of claims shortly after termination and compliance with the terms of a non-disclosure agreement between the Company and the CEO.
In addition, the Company entered into severance agreements with certain key employees which generally provide for severance if the employees are terminated without cause. On November 9, 2007, the Company entered into letter agreements or an amended/restated employment agreement with certain key employees. In general upon termination without cause, these agreements provide for severance payments equivalent to one times annual salary and continued health benefits for a 12-month period following termination. The payments and benefits under these agreements are subject to the person executing and not revoking a release of claims shortly after termination and compliance with the terms of a non-disclosure agreement between the Company and the person. Additionally, on December 2, 2008, the Company entered into a severance letter agreement as well as non-disclosure confidentiality and intellectual property assignment agreement with an additional key employee. The letter Agreement and non-disclosure agreements were entered into to provide this key employee with severance and other arrangements similar to those provided to the other key employees in 2007.
Note J — Stockholders’ Equity
[1] Warrants:
As a result of the Company’s 2006 IPO and the conversion of the Series B Preferred shares to common shares, warrants previously issued for purchase of Series B Preferred were converted into warrants to purchase 45,918 shares of common stock at $2.94 per share. These warrants were outstanding at December 31, 2006. In addition, 35,714 warrants were also outstanding to purchase common stock exercisable at $1.84 per share at December 31, 2006. All warrants have a cashless exercise provision and expire either in 2007 or 2013. In 2007, the Company issued 67,918 shares of common stock upon the exercise of warrants to purchase shares of common stock. The warrants were exercisable for up to 81,632 shares of common stock; however, pursuant to the terms of the warrant agreements, the holders of the warrants performed cashless exercises in which the Company issued fewer shares in lieu of receiving cash proceeds of $201. As of December 31, 2009 and 2008, there were no outstanding warrants.
[2] Stock option plans:
In November 1996, the Company adopted the Non-Executive Director Stock Option Plan (the “Directors Plan”), which was amended in 2003. The Directors Plan, as amended, allows the Company to issue up to 61,224 options to non-executive directors of the Company. The Plan provides that commencing June 30, 2004, all non-executive directors on the Board of Directors will initially be granted options to purchase 10,204 shares of common stock at the fair market value at the date of grant and that annually thereafter, each non-executive director will be granted an option to purchase 5,102 shares of common stock at the fair market value at the date of grant. Options are no longer being granted from this plan.
In November 1996, the Company adopted a stock option plan (the “1996 Option Plan”), which was amended in 2000. The 1996 Option Plan, as amended, allows the Company to issue up to 1,020,408 options to employees of the Company under incentive and nonstatutory stock option grants. The options generally become exercisable over a period of 3 years commencing at the date of grant and expire in 4-10 years from the date of grant. The exercise price of options granted pursuant to the 1996 Option Plan shall be no less than one hundred percent (100%) of the fair market value at the date of grant for incentive stock options, and eighty-five percent (85%) of the fair market value at the date of the grant for other options. Options are no longer being granted from this plan.
In September 2003, the Company adopted the 2003 Employees Stock Option Plan (the “2003 Option Plan”). The 2003 Option Plan allows the Company to issue up to 2,244,897 options to employees of the Company under incentive and nonstatutory stock option grants. In March 2006, the Plan was amended to allow the Company to issue 3,367,346 options. The options generally vest over a period of 3-4 years commencing at the date of grant and expire in 10 years. In 2003, the Company issued 1,721,565 options to purchase shares of common stock at $0.94 per share, which was the fair market value on the date of the grant. In 2005, the Company issued options to purchase 832,011 shares of common stock exercisable at $1.52 per share, which equaled fair market value on the dates of grant, to employees. Options are no longer being granted from this plan.
In September 2006, the Company adopted the 2006 Omnibus Incentive Plan (the “2006 Plan”). The 2006 Plan allows the Company to issue stock options, restricted stock, restricted stock units, stock appreciation rights, unrestricted stock, cash based awards or any combination of the foregoing. Any of the foregoing awards may be made subject to attainment of performance goals over a performance period of up to one or more years. The 2006 Plan allows the Company to issue up to 224,490 shares of common stock subject to awards pursuant to the 2006 Plan. The vesting period of the options granted is at the discretion of the Board of Directors and the options expire in 10 years. The exercise price of options granted shall be no less than one hundred percent (100%) of the fair market value at the date of grant or one hundred-ten percent (110%) if the option is granted to a ten percent stockholder. In November 2006, the number of shares eligible for issuance was increased to 2,653,061. In May 2009, the number of shares eligible for issuance was increased to 4,533,061.
In 2007, the Company issued options to purchase 612,603 shares of common stock, with a weighted average exercise price of $17.66 per share, which is based on exercise prices equal to the fair market value per share on the dates of grant to employees.
In 2008, the Company issued options to purchase 791,920 shares of common stock, with a weighted average exercise price of $12.17 per share, which is based on exercise prices equal to the fair market value per share on the dates of grant to employees.
In 2009, the Company issued options to purchase 257,240 shares of common stock, with a weighted average exercise price of $7.67 per share, which is based on exercise prices equal to the fair market value per share on the dates of grant to employees.
A summary of the Company’s stock option activity for the years ended December 31, 2009, 2008 and 2007, respectively, is presented below:
|
Shares
|
Weighted
Average Exercise
Price
|
Weighted Average Remaining Contractual Term
|
Aggregate Intrinsic
Value
|
|||||||||||||
|
Outstanding as of December 31, 2008
|
2,982,349 | $ | 8.15 | |||||||||||||
|
Options granted
|
257,240 | $ | 7.67 | |||||||||||||
|
Options cancelled
|
(83,207 | ) | $ | 12.61 | ||||||||||||
|
Options exercised (cash received $122),
|
(77,947 | ) | $ | 1.56 | ||||||||||||
|
Outstanding as of December 31, 2009
|
3,078,435 | $ | 8.15 | 6.59 | $ | 12,200 | ||||||||||
|
Options exercisable as of December 31, 2009
|
2,271,152 | $ | 6.80 | 6.00 | $ | 11,466 | ||||||||||
|
Options expected to vest as of December 31, 2009
|
700,389 | $ | 11.94 | 8.20 | $ | 664 | ||||||||||
|
Shares
|
Weighted
Average Exercise
Price
|
Weighted Average Remaining Contractual Term
|
Aggregate Intrinsic
Value
|
|||||||||||||
|
Outstanding as of December 31, 2007
|
2,423,495 | $ | 7.15 | |||||||||||||
|
Options granted
|
791,920 | $ | 12.17 | |||||||||||||
|
Options cancelled
|
(148,121 | ) | $ | 17.28 | ||||||||||||
|
Options exercised (cash received $114),
|
(84,945 | ) | $ | 1.34 | ||||||||||||
|
Outstanding as of December 31, 2008
|
2,982,349 | $ | 8.15 | 7.33 | $ | 10,718 | ||||||||||
|
Options exercisable as of December 31, 2008
|
1,805,711 | $ | 5.24 | 6.41 | $ | 9,796 | ||||||||||
|
Options expected to vest as of December 31, 2008
|
972,284 | $ | 12.38 | 8.69 | $ | 865 | ||||||||||
|
Shares
|
Weighted
Average Exercise
Price
|
Weighted Average Remaining Contractual Term
|
Aggregate Intrinsic
Value
|
|||||||||||||
|
Outstanding as of December 31, 2006
|
2,929,081 | $ | 3.12 | |||||||||||||
|
Options granted
|
612,603 | $ | 17.66 | |||||||||||||
|
Options cancelled
|
(99,782 | ) | $ | 10.31 | ||||||||||||
|
Options exercised (cash received $1,589),
|
(1,018,407 | ) | $ | 1.55 | ||||||||||||
|
Outstanding as of December 31, 2007
|
2,423,495 | $ | 7.15 | 5.99 | $ | 35,422 | ||||||||||
|
Options exercisable as of December 31, 2007
|
1,566,352 | $ | 4.43 | 5.83 | $ | 27,204 | ||||||||||
|
Options expected to vest as of December 31, 2007
|
481,460 | $ | 7.34 | 6.40 | $ | 6,494 | ||||||||||
|
Year Ended December 31, 2009
|
||||||||
|
|
Shares
|
Weighted
Average Grant Date Fair Value
|
||||||
|
Nonvested options at beginning of year
|
1,176,638 | $ | 8.35 | |||||
|
Options granted
|
257,240 | $ | 3.85 | |||||
|
Options vested
|
(568,721 | ) | $ | 7.60 | ||||
|
Options cancelled
|
(57,874 | ) | $ | 7.72 | ||||
|
Nonvested options at end of year
|
807,283 | $ | 7.48 | |||||
The Company’s policy is to issue new shares upon exercise of options as the Company does not hold shares in treasury.
The following tables summarize information about stock options outstanding at December 31, 2009 and 2008:
|
December 31, 2009
|
||||||||||||||
|
Exercise Price
|
Number
of Shares
Outstanding
|
Number
of Shares
Exercisable
|
Weighted Average
Remaining Contractual
Life of Shares Exercisable
(in years)
|
|||||||||||
| $ | 0.94 | 322,910 | 322,910 | 3.54 | ||||||||||
| $ | 1.52 | 686,727 | 686,727 | 5.16 | ||||||||||
| $ | 1.96 | 300,599 | 275,110 | 6.22 | ||||||||||
| $ | 6.65 | 26,800 | 3,647 | 9.11 | ||||||||||
| $ | 7.03 | 125,340 | 26,113 | 9.13 | ||||||||||
| $ | 7.06 | 152,834 | 140,944 | 6.71 | ||||||||||
| $ | 7.40 | 3,267 | 833 | 8.83 | ||||||||||
| $ | 8.48 | 6,000 | 708 | 9.33 | ||||||||||
| $ | 8.70 | 91,500 | 9,118 | 9.58 | ||||||||||
| $ | 9.27 | 4,300 | - | - | ||||||||||
| $ | 11.00 | 28,677 | 26,838 | 6.95 | ||||||||||
| $ | 11.14 | 85,000 | 46,270 | 8.58 | ||||||||||
| $ | 12.01 | 431,621 | 199,422 | 8.14 | ||||||||||
| $ | 12.65 | 138,100 | 38,500 | 8.39 | ||||||||||
| $ | 12.85 | 38,500 | 11,840 | 8.33 | ||||||||||
| $ | 14.66 | 26,817 | 13,986 | 7.12 | ||||||||||
| $ | 14.90 | 19,334 | 247,856 | 7.33 | ||||||||||
| $ | 16.77 | 370,393 | 8,610 | 7.57 | ||||||||||
| $ | 17.20 | 14,100 | 37,500 | 7.35 | ||||||||||
| $ | 17.42 | 37,500 | 40,816 | 0.25 | ||||||||||
| $ | 19.60 | 40,816 | 50,362 | 7.98 | ||||||||||
| $ | 21.27 | 100,750 | 10,053 | 7.83 | ||||||||||
| $ | 21.58 | 17,900 | 1,000 | 7.94 | ||||||||||
| $ | 24.94 | 1,000 | 7,650 | 0.51 | ||||||||||
| $ | 37.29 | 7,650 | 322,910 | 3.54 | ||||||||||
| 3,078,435 | 2,271,152 | |||||||||||||
|
December 31, 2008
|
||||||||||||||
|
Exercise Price
|
Number
of Shares
Outstanding
|
Number
of Shares
Exercisable
|
Weighted Average
Remaining Contractual
Life of Shares Exercisable
(in years)
|
|||||||||||
| $ | 0.94 | 357,873 | 357,873 | 4.55 | ||||||||||
| $ | 1.52 | 708,026 | 682,235 | 6.16 | ||||||||||
| $ | 1.96 | 321,707 | 228,409 | 7.22 | ||||||||||
| $ | 7.06 | 161,471 | 124,749 | 7.71 | ||||||||||
| $ | 7.40 | 3,600 | 83 | 9.83 | ||||||||||
| $ | 11.00 | 28,677 | 24,518 | 7.95 | ||||||||||
| $ | 11.14 | 103,500 | — | — | ||||||||||
| $ | 12.01 | 443,645 | 80,054 | 9.14 | ||||||||||
| $ | 12.61 | 5,000 | 5,000 | 0.11 | ||||||||||
| $ | 12.65 | 150,400 | 10,311 | 9.11 | ||||||||||
| $ | 12.85 | 38,500 | — | — | ||||||||||
| $ | 14.66 | 29,900 | — | — | ||||||||||
| $ | 14.90 | 20,054 | 9,370 | 8.12 | ||||||||||
| $ | 16.77 | 384,680 | 158,422 | 8.33 | ||||||||||
| $ | 17.20 | 16,400 | 5,996 | 8.57 | ||||||||||
| $ | 17.42 | 37,500 | 37,500 | 8.35 | ||||||||||
| $ | 19.60 | 40,816 | 40,816 | 1.25 | ||||||||||
| $ | 21.27 | 100,750 | 25,186 | 8.98 | ||||||||||
| $ | 21.58 | 21,200 | 6,539 | 8.83 | ||||||||||
| $ | 24.94 | 1,000 | 1,000 | 8.94 | ||||||||||
| $ | 37.29 | 7,650 | 7,650 | 1.51 | ||||||||||
| 2,982,349 | 1,805,711 | |||||||||||||
All options granted are equity awards and the Company has not granted any liability awards. The Company expects to recognize future compensation costs aggregating $5,784 for options granted but not vested as of December 31, 2009. Such amount will be recognized over the weighted average requisite service period, which is expected to be approximately 2 years.
The Company has reserved shares of common stock for issuance upon the exercise of options and vesting of restricted stock units as follows:
| December 31, | ||||||||
|
|
2009
|
2008
|
||||||
|
Shares reserved for:
|
||||||||
|
The Directors Plan
|
- | 5,102 | ||||||
|
1996 Option Plan
|
48,466 | 48,466 | ||||||
|
2003 Option Plan
|
1,322,862 | 1,396,989 | ||||||
|
2006 Plan
|
4,560,822 | 2,629,975 | ||||||
| 5,932,150 | 4,080,532 | |||||||
The Company selected the Black-Scholes option pricing model as the most appropriate model for determining the estimated fair value for stock-based awards. The fair value of stock option awards subsequent to January 1, 2006 is amortized on a straight-line basis over the requisite service period of the awards, which is generally the vesting period. Expected volatility was calculated based on reported data for a peer group of publicly traded companies for which historical information was available. The Company will continue to use peer group volatility information until historical volatility of the Company is relevant to measure expected volatility for future option grants. The average expected life was determined according to the “SEC shortcut approach” which is the mid-point between the vesting date and the end of the contractual term. The risk-free interest rate is determined by reference to U.S. Treasury yield curve rates with a remaining term equal to the expected life assumed at the date of grant. Forfeitures are estimated based on the Company’s historical analysis of actual stock option forfeitures. Prior to 2006, the Company used the minimum value method for disclosing the pro forma effects of stock options as permitted for private companies. The assumptions used in the Black-Scholes option-pricing model are as follows:
|
|
Year Ended December 31,
|
||
|
|
2009
|
2008
|
2007
|
|
Expected Term
|
7 years
|
7 years
|
7 years
|
|
Volatility
|
42.27% - 49.42%
|
41.3% - 46.31%
|
77.46% - 80.0%
|
|
Risk free rate
|
2.23% - 3.14
|
3.29% - 3.54%
|
4.12%-4.82%
|
|
Dividend Yield
|
—
|
—
|
—
|
The following table presents the stock-based compensation expense for the years ended December 31, 2009, 2008 and 2007.
|
Year Ended December 31,
|
||||||||||||
|
2009
|
2008
|
2007
|
||||||||||
|
Cost of revenue, maintenance and professional services
|
$ | 421 | $ | 369 | $ | 190 | ||||||
|
Sales and marketing
|
974 | 827 | 451 | |||||||||
|
Research and development
|
1,216 | 1,066 | 280 | |||||||||
|
General and administrative
|
1,818 | 1,686 | 1,700 | |||||||||
| $ | 4,429 | $ | 3,948 | $ | 2,621 | |||||||
[3] Restricted Stock Units:
During 2009 the Company issued 329,804 restricted stock units with a weighted average grant date fair value of $7.21. During 2009, 12,114 restricted stock units were cancelled leaving 317,690 restricted stock units outstanding as of December 31, 2009. Except for the restricted stock units granted to the French employees and board of directors, the restricted stock units vest annually in four equal installments from the grant date. The restricted stock units granted to the French employees vest in two equal installments on the second and fourth anniversaries from the grant date. The restricted stock units granted to the board of directors vest at the earlier of the 2010 Annual Meeting or May 14, 2010. Upon each vesting, the restricted stock units become unrestricted shares of common stock. For the year ended December 31, 2009, the Company recognized compensation expense of $643 relating to the restricted stock units, which is included in the stock based compensation expense in the table above. The remaining $1,648 will be recognized over the remaining vesting period which is approximately 2.92 years.
Note k — Profit Sharing Plan
Effective March 1, 1996, the Company adopted a defined contribution plan (the “Plan”), which, as amended, qualifies under Section 401(k) of the Internal Revenue Code. The Plan covers all employees who meet eligibility requirements. Employer contributions are discretionary. The Company made discretionary contributions to the Plan of $0, $495, and $258 for the years ended December 31, 2009, 2008 and 2007, respectively.
Note l — Segment Information
The Company operates in one reportable segment.
The Company operates in three geographic regions: The Americas, Europe, Middle East & Africa and Asia-Pacific. All transfers between geographic regions have been eliminated from consolidated revenues. Revenue, property and equipment and intangible assets by geographic region are as follows:
|
|
Year Ended December 31,
|
|||||||||||
|
|
2009
|
2008
|
2007
|
|||||||||
|
Revenue:
|
||||||||||||
|
The Americas
|
$ | 53,699 | $ | 61,433 | $ | 51,468 | ||||||
|
Europe, Middle East & Africa
|
23,977 | 29,668 | 27,265 | |||||||||
|
Asia-Pacific
|
5,561 | 5,202 | 4,035 | |||||||||
| $ | 83,237 | $ | 96,303 | $ | 82,768 | |||||||
| December 31, | ||||||||
| 2009 | 2008 | |||||||
| Property and equipment: | ||||||||
| North America | $ | 2,778 | $ | 3,998 | ||||
| Europe, Middle East & Africa | 296 | 238 | ||||||
| Asia-Pacific | — | — | ||||||
| $ | 3,074 | $ | 4,236 | |||||
|
December 31,
|
||||||||
|
2009
|
2008
|
|||||||
|
Intangible assets:
|
||||||||
|
North America
|
$ | 3,170 | $ | 3,533 | ||||
|
Europe, Middle East & Africa
|
1,728 | 2,430 | ||||||
|
Asia-Pacific
|
— | — | ||||||
| $ | 4,898 | $ | 5,963 | |||||
Note m — Related Party Transactions
After the acquisition of Double-Take EMEA, the Company has had transactions with Sunbelt Software, Inc., or Sunbelt Software. An officer of Double-Take Software Inc. is the director and chief executive officer of Sunbelt Software. The balances and transactions with Sunbelt Software are described below:
|
|
December 31,
|
|||||||
|
2009
|
2008
|
|||||||
|
Trade Receivable
|
$ | 1,218 | $ | 2,334 | ||||
|
Trade Payable
|
$ | 15 | $ | 25 | ||||
|
Year ended December 31,
|
||||||||||||
|
2009
|
2008
|
2007
|
||||||||||
|
Sales to Sunbelt Software
|
$ | 8,593 | $ | 11,522 | $ | 10,865 | ||||||
|
Purchases from Sunbelt Software
|
$ | 241 | $ | 304 | $ | 233 | ||||||
Note N — Subsequent Events
In February 2010, the Company’s Board of Directors approved a stock repurchase program for its common stock under which the Company may purchase up to a maximum aggregate purchase price of $15,000 through December 31, 2010. Repurchases may be made from time to time in the open market at prevailing market prices or in privately negotiated transactions from time to time based on business and market conditions. The stock repurchase program may be suspended or discontinued at any time, and will be funded using the Company's available cash.
| Balance at Beginning | Additions Charged to | Balance at End | ||||||||||||||
| of Period | Cost and Expense | Deductions (1) | of Period | |||||||||||||
| ( in thousands, except for share and per share amount) | ||||||||||||||||
|
Year ended December 31, 2007:
|
||||||||||||||||
|
Allowance for doubtful accounts
|
$ | 570 | $ | 43 | $ | 14 | $ | 599 | ||||||||
|
Valuation allowance on deferred tax assets
|
$ | 25,035 | $ | 9,955 | (3) | $ | 8,960 | (2) | $ | 26,030 | ||||||
|
Year ended December 31, 2008:
|
||||||||||||||||
|
Allowance for doubtful accounts
|
$ | 599 | $ | 166 | $ | - | $ | 765 | ||||||||
|
Valuation allowance on deferred tax assets
|
$ | 26,030 | $ | (64 | ) | $ | 8,612 | (2) | $ | 17,354 | ||||||
|
Year ended December 31, 2009:
|
||||||||||||||||
|
Allowance for doubtful accounts
|
$ | 765 | $ | - | $ | 69 | $ | 696 | ||||||||
|
Valuation allowance on deferred tax assets
|
$ | 17,354 | $ | - | $ | 11,253 | (4) | $ | 6,101 | |||||||
| (1) Deductions from provisions represent losses or expenses for which the respective provisions were created. In the case of the provision for doubtful accounts, such deductions are reduced by recoveries of amounts previously written off. | ||||||||||||||||
| (2) Adjustments associated with the Company's assessment of its deferred tax assets (principally related to federal and state net operating loss carryforwards). | ||||||||||||||||
| (3) Includes a valuation allowance of $6,425 representing 100% of the deferred tax asset of Double-Take Software Canada, Inc. acquired in December 2007. | ||||||||||||||||
| (4) Includes reduction to valuation allowance of $8,706 related to deferred tax assets able to be utilized in 2010 and beyond. | ||||||||||||||||
| Item 9. | Changes in and Disagreements With Accountants on Accounting and Financial Disclosure. |
None
| Item 9A. | Controls and Procedures. |
Disclosure Controls and Procedures
We maintain disclosure controls and procedures, which are designed to ensure that information required to be disclosed in the reports we file or submit under the Securities Exchange Act of 1934, as amended, is recorded, processed, summarized and reported within the time periods specified in the Securities and Exchange Commissions rules and forms, and that such information is accumulated and communicated to our management, including our chief executive officer and chief financial officer as appropriate to allow timely decisions regarding required disclosure.
Under the supervision and with the participation of our management, including our Chief Executive Officer and Chief Financial Officer, an evaluation was performed on the effectiveness of the design and operation of our disclosure controls and procedures as of the end of the period covered by this annual report. Based on that evaluation, our management, including our Chief Executive Officer and Chief Financial Officer, concluded that our disclosure controls and procedures were effective as of December 31, 2009.
Changes in Internal Controls and Procedures
There were no changes in the Company’s internal controls over financial reporting during the fourth quarter of 2009 that have materially affected or are reasonably likely to materially affect the Company’s internal control over financial reporting.
Management’s Annual Report on Internal Control Over Financial Reporting
Management of Double-Take Software, Inc. is responsible for establishing and maintaining adequate internal control over financial reporting (as defined in Rule 13a-15(f) of the Securities Exchange Act of 1934).
Our internal control over financial reporting is a process designed to provide reasonable assurance regarding the reliability of financial reporting and the preparation of financial statements for external purpose in accordance with U.S. generally accepted accounting principles. Our internal control over financial reporting includes those policies and procedures that (1) pertain to maintenance of records that, in reasonable detail, accurately and fairly reflect the transactions and dispositions of our assets; (2) provide reasonable assurance that transactions are recorded as necessary to permit preparation of financial statements in accordance with U.S. generally accepted accounting principles, and that our receipts and expenditures are being made only in accordance with authorizations of management and directors; and (3) provide reasonable assurance regarding prevention or timely detection of unauthorized acquisition, use, or disposition of our assets that could have a material effect on the financial statements.
Because of its inherent limitations, internal control over financial reporting may not prevent or detect misstatements. Also, projections of any evaluation of effectiveness to future periods are subject to the risk that controls may become inadequate because of changes in conditions, or that the degree of compliance with the policies or procedures may deteriorate.
Under the supervision of and with the participation of the Chief Executive Officer and the Chief Financial Officer, our management conducted an assessment of the effectiveness of our internal control over financial reporting based on the framework and criteria established in Internal Control — Integrated Framework, issued by the Committee of Sponsoring Organizations of the Treadway Commission. Based on this assessment our management has concluded that, as of December 31, 2009, our internal control over financial reporting was effective.
Our Independent Registered Public Accounting Firm, Eisner LLP, has audited and issued a report on our internal control over financial reporting. The report of Eisner LLP appears below:
REPORT OF INDEPENDENT REGISTERED PUBLIC ACCOUNTING FIRM
Board of Directors and Stockholders
Double-Take Software, Inc.
We have audited Double-Take Software, Inc’s (the "Company") internal control over financial reporting as of December 31, 2009, based on criteria established in Internal Control - Integrated Framework issued by the Committee of Sponsoring Organizations of the Treadway Commission ("COSO"). The Company's management is responsible for maintaining effective internal control over financial reporting and for its assessment of the effectiveness of internal control over financial reporting, included in the accompanying Management's Annual Report on Internal Control over Financial Reporting. Our responsibility is to express an opinion on the Company's internal control over financial reporting based on our audit.
We conducted our audit in accordance with the standards of the Public Company Accounting Oversight Board (United States). Those standards require that we plan and perform the audit to obtain reasonable assurance about whether effective internal control over financial reporting was maintained in all material respects. Our audit included obtaining an understanding of internal control over financial reporting, assessing the risk that a material weakness exists, and testing and evaluating the design and operating effectiveness of internal control based on the assessed risk. Our audit also included performing such other procedures as we considered necessary in the circumstances. We believe that our audit provides a reasonable basis for our opinion.
A company's internal control over financial reporting is a process designed to provide reasonable assurance regarding the reliability of financial reporting and the preparation of financial statements for external purposes in accordance with generally accepted accounting principles. A company's internal control over financial reporting includes those policies and procedures that (i) pertain to the maintenance of records that, in reasonable detail, accurately and fairly reflect the transactions and dispositions of the assets of the company; (ii) provide reasonable assurance that transactions are recorded as necessary to permit preparation of financial statements in accordance with generally accepted accounting principles, and that receipts and expenditures of the company are being made only in accordance with authorizations of management and directors of the company; and (iii) provide reasonable assurance regarding prevention or timely detection of unauthorized acquisition, use, or disposition of the company's assets that could have a material effect on the financial statements.
Because of its inherent limitations, internal control over financial reporting may not prevent or detect misstatements. Also, projections of any evaluation of effectiveness to future periods are subject to the risk that controls may become inadequate because of changes in conditions, or that the degree of compliance with the policies or procedures may deteriorate.
In our opinion, Double-Take Software, Inc. maintained, in all material respects, effective internal control over financial reporting as of December 31, 2009, based on criteria established in Internal Control-Integrated Framework issued by COSO.
We also have audited, in accordance with the standards of the Public Company Accounting Oversight Board (United States), the consolidated balance sheets of Double-Take Software, Inc. as of December 31, 2009 and 2008, and the related consolidated statements of operations, changes in stockholders' equity, and cash flows for each of the years in the three-year period ended December 31, 2009, and our report dated March 10, 2010 expressed an unqualified opinion on those consolidated financial statements.
/s/ Eisner LLP
New York, New York
March 10, 2010
|
Other Information.
|
None.
PART III
| Item 10. | Directors, Executive Officers and Corporate Governance. |
Executive Officers
Pursuant to General Instruction G(3) of Form 10-K, information regarding our executive officers is set forth in Part I of this annual report under the caption Item 1. “Executive Officers of Double-Take Software”.
Code of Ethics
As part of our system of corporate governance, our board of directors has adopted a Code of Business Conduct and Ethics that is applicable to all of our employees, and also contains provisions only applicable to our Chief Executive Officer and senior financial officers. Our Code of Business Conduct and Ethics is available on the Investor Relations — Corporate Governance page of our web site at http://www.doubletake.com. We intend to satisfy any disclosure requirement under Item 5.05 of Form 8-K regarding an amendment to, or waiver from, a provision of the Code of Business Conduct and Ethics that applies to our Chief Executive Officer or senior financial officers, by posting such information on our web site at the address above.
Additional Information
Additional information regarding directors, executive officers and corporate governance is incorporated herein by reference to our 2010 Proxy Statement to be filed with the SEC within 120 days after the end of the fiscal year covered by this annual report with respect to our Annual Meeting of Stockholders to be held on May 13, 2010.
| Item 11. | Executive Compensation. |
Information responsive to this item is incorporated herein by reference to our 2010 Proxy Statement to be filed with the SEC within 120 days after the end of the fiscal year covered by this annual report with respect to our Annual Meeting of Stockholders to be held on May 13, 2010.
| Item 12. | Security Ownership of Certain Beneficial Owners and Management and Related Stockholder Matters. | |
Securities Authorized for Issuance under Equity Compensation Plans
The following table sets forth information about securities available for issuance under our equity compensation plans as of December 31, 2009:
Equity Compensation Plan Information
| Number of Securities | ||||||||||||
| Remaining | ||||||||||||
| Available for Future | ||||||||||||
| Number of Securities | Issuance Under | |||||||||||
| to be Issued Upon | Weighted Average | Equity Compensation | ||||||||||
| Exercise of | Exercise Price of | Plan (Excluding | ||||||||||
| Outstanding Options, | Outstanding Options, | Securities Reflected | ||||||||||
| Warrants and Rights | Warrants and Rights | in Column (a) | ||||||||||
|
Plan Category:
|
(a) |
(b)
|
(c) | |||||||||
|
Equity compensation plans approved by security holders(1)
|
3,396,125 | $ | 8.15 | 2,536,025 | ||||||||
|
Equity compensation plans not approved by security holders
|
0 | $ | 0.00 | 0 | ||||||||
|
Total
|
3,396,125 | $ | 8.15 | 2,536,025 | ||||||||
|
(1)
|
Consists of shares of common stock to be issued upon exercise of outstanding options granted and restricted stock units vesting under our Non-Executive Director Stock Option Plan, 2003 Employees Stock Option Plan and 2006 Omnibus Incentive Plan. Of these plans, the only plan under which options or restricted stock units may be granted in the future is the 2006 Omnibus Incentive Plan.
|
Security Ownership of Certain Beneficial Owners and Management
Information responsive to this item is incorporated herein by reference to our 2010 Proxy Statement to be filed with the SEC within 120 days after the fiscal year covered by this annual report with respect to our Annual Meeting of Stockholders to be held on May 13, 2010.
|
Certain Relationships and Related Transactions, and Director Independence.
|
Information responsive to this item is incorporated herein by reference to our 2010 Proxy Statement to be filed with the SEC within 120 days after the fiscal year covered by this annual report with respect to our Annual Meeting of Stockholders to be held on May 13, 2010.
|
Principal Accountant Fees and Services.
|
Information responsive to this item is incorporated herein by reference to our 2010 Proxy Statement to be filed with the SEC within 120 days after the fiscal year covered by this annual report with respect to our Annual Meeting of Stockholders to be held on May 13, 2010.
PART IV
|
Exhibits, Financial Statement Schedules.
|
(a) (1) The information required by this item is included in item 8 of Part II of this annual report.
(2) The information required by this item is included in Item 8 of Part II of this annual report.
(3) Exhibits: See Index to Exhibits. The Exhibits listed in the accompanying Index to Exhibits are filed or incorporated by reference as part of this annual report.
(b) Exhibits: See Index to Exhibits. The Exhibits listed in the accompanying Index to Exhibits are filed or incorporated by reference as part of this annual report.
(c) Not applicable
Pursuant to the requirements of Section 13 or 15(d) of the Securities Exchange Act of 1934, the registrant has duly caused this report to be signed on its behalf by the undersigned, thereunto duly authorized, in the City of Southborough, Commonwealth of Massachusetts, on March 11, 2010.
DOUBLE-TAKE SOFTWARE, INC.
|
By:
|
/s/ Dean Goodermote
|
Dean Goodermote
President, Chief Executive Officer and
Chairman of the Board of Directors
(Duly Authorized Officer)
Pursuant to the requirements of the Securities Exchange Act of 1934, this report has been signed by the following persons in the capacities and on the dates indicated.
|
Name
|
Title
|
Date
|
||
|
/s/ Dean Goodermote
Dean Goodermote
|
President, Chief Executive Officer, and Chairman of the Board of Directors (Principal Executive Officer)
|
March 11, 2010
|
||
|
/s/ S. Craig Huke
S. Craig Huke
|
Chief Financial Officer (Principal Financial Officer and Principal Accounting Officer)
|
March 11, 2010
|
||
|
/s/ Deborah M. Besemer
Deborah M. Besemer
|
Director
|
March 11, 2010
|
||
|
/s/ Paul D. Birch
Paul D. Birch
|
Director
|
March 11, 2010
|
||
|
/s/ Ashoke (Bobby) Goswami
Ashoke (Bobby) Goswami
|
Director
|
March 11, 2010
|
||
|
/s/ John B. Landry
John B. Landry
|
Director
|
March 11, 2010
|
||
|
/s/ John W. Young
John W. Young
|
Director
|
March 11, 2010
|
|
Exhibit Number
|
Exhibit Description
|
||||
|
3
|
.01(1)
|
Second Amended and Restated Certificate of Incorporation of the Company.
|
|||
|
3
|
.02(7)
|
Second Amended and Restated Bylaws of the Company.
|
|||
|
3
|
.03(8)
|
Certificate of Designation, Preference and Rights of Series A Junior Participating Preferred Stock.
|
|||
|
4
|
.01(1)
|
Form of certificate representing the Common Stock, par value $.001 per share, of the Company.
|
|||
|
4
|
.02(9)
|
Rights Agreement, dated as of November 19, 2008, between the Company and Continental Stock Transfer and Trust Company, as Rights Agent.
|
|||
|
10
|
.01*(1)
|
1996 Employees Stock Option Plan.
|
|||
|
10
|
.02*(1)
|
Form of Incentive Stock Award pursuant to the 1996 Employees Stock Option Plan.
|
|||
|
10
|
.03*(1)
|
Non-Executive Director Stock Option Plan.
|
|||
|
10
|
.04*(1)
|
Form of Non-Qualified Incentive Stock Option Award pursuant to the Non-Executive Director Stock Option Plan.
|
|||
|
10
|
.05*(1)
|
2003 Employees Stock Option Plan.
|
|||
|
10
|
.06*(1)
|
Form of Incentive Stock Award pursuant to the 2003 Employees Stock Option Plan.
|
|||
|
10
|
.07*(18)
|
Amended and Restated Double-Take Software 2006 Omnibus Incentive Plan.
|
|||
|
10
|
.08A*(1)
|
Form of Incentive Stock Option Agreement pursuant to the Double-Take Software 2006 Omnibus Incentive Plan.
|
|||
|
10
|
.08B*(1)
|
Form of Nonqualified Stock Option Agreement pursuant to the Double-Take Software 2006 Omnibus Incentive Plan.
|
|||
|
10
|
.08C*(1)
|
Form of Director Nonqualified Stock Option Agreement pursuant to the Double-Take Software 2006 Omnibus Incentive Plan.
|
|||
|
10
|
.09*(1)
|
Form of Double-Take Software, Inc. Indemnification Agreement.
|
|||
|
10
|
.11(1)
|
Amended and Restated Registration Rights Agreement dated as of October 6, 2004, among the Company and the Holders Named Therein (the “Registration Rights Agreement”).
|
|||
|
10
|
.12(1)
|
Amendment and Joinder to the Registration Rights Agreement dated as of July 31, 2006.
|
|||
|
10
|
.13(17)
|
Lease Agreement, dated October 21, 2009 between Sun Life Assurance Company of Canada and the Company.
|
|||
|
10
|
.15(1)
|
Loan and Security Agreement dated as of October 16, 2003, among the Company and Silicon Valley Bank.
|
|||
|
10
|
.16(1)
|
Loan Modification Agreement, dated as of April 26, 2004, by and between Silicon Valley Bank and the Company.
|
|||
|
10
|
.17(1)
|
Third Loan Modification Agreement, by and between Silicon Valley Bank and the Company.
|
|||
|
10
|
.18(1)
|
Fifth Loan Modification Agreement, by and between Silicon Valley Bank and the Company.
|
|||
|
10
|
.19(1)
|
Seventh Loan Modification Agreement, by and between Silicon Valley Bank and the Company.
|
|||
|
10
|
.20(1)
|
Eighth Loan Modification Agreement, between Silicon Valley Bank and the Company.
|
|||
|
10
|
.21(1)
|
Ninth Loan Modification Agreement, between Silicon Valley Bank and the Company.
|
|||
|
10
|
.22*(1)
|
Employment Letter, dated August 7, 2006, between Double-Take Software, Inc. and Dean Goodermote.
|
|||
|
10
|
.23*(1)
|
Employment Letter, dated October 31, 2006, between Double-Take Software, Inc. and S. Craig Huke.
|
|||
|
10
|
.24*(1)
|
Employment Letter, dated October 31, 2006, between Double-Take Software, Inc. and Daniel M. Jones.
|
|||
| 10 | 25+(14) | Products License and Distribution Agreement, dated as of November 16, 2001, by and between the Company and Dell Products L.P. by and on behalf of itself and Dell Computer Corporation. | |||
| 10 | 26(1) | Amendment 3 to Products License and Distribution Agreement, dated as of December 2, 2003, between the Company and Dell Computer Corporation. | |||
|
10
|
.27+(1)
|
Amendment 4 to Products License and Distribution Agreement, effective as of July 25, 2003, between the Company and Dell Computer Corporation.
|
||
|
10
|
.28+(1)
|
Amendment 5 to Products License and Distribution Agreement, dated as of December 2, 2003, between the Company and Dell Computer Corporation.
|
||
|
10
|
.29(1)
|
Amendment 6 to Products License and Distribution Agreement, effective as of February 26, 2004, between the Company and Dell Computer Corporation.
|
||
|
10
|
.30(1)
|
Amendment 7 to Products License and Distribution Agreement, effective as of February 18, 2005, between the Company and Dell Computer Corporation.
|
||
|
10
|
.31+(1)
|
Amendment to Products License and Distribution Agreement, effective as of January 31, 2006, between the Company and Dell Computer Corporation.
|
||
|
10
|
.31A(3)
|
Amendment to the products License and Distribution Agreement, effective as of June 13, 2007, between the Company and Dell Computer Corporation
|
||
|
10
|
.32(1)
|
Restated Xcelerate! Distributor Agreement, dated as of August 28, 2006, between Double-Take Software, Inc. and Sunbelt International.
|
||
|
10
|
.33(1)
|
Xcelerate! Partner Agreement, dated August 2, 2001, between the Company and Sunbelt Software Distribution Inc.
|
||
|
10
|
.34(1)
|
Addendum 1 to Xcelerate Partner Agreement, dated August 2, 2001, between the Company and Sunbelt Software Distribution Inc.
|
||
|
10
|
.35(1)
|
Addendum 3 to Xcelerate Partner Agreement, dated November 27, 2001, between the Company and Sunbelt Software Distribution Inc.
|
||
|
10
|
.36(1)
|
Addendum 4 to Xcelerate Partner Agreement, dated May 31, 2002, between the Company and Sunbelt Software Distribution Inc.
|
||
|
10
|
.37(1)
|
Addendum 4 to Xcelerate Partner Agreement, dated August 27, 2002, between the Company and Sunbelt Software Distribution Inc.
|
||
|
10
|
.38(1)
|
Amendment 5 to Xcelerate Partner Agreement, dated February 13, 2004, between the Company and Sunbelt Software Distribution Inc.
|
||
|
10
|
.39(1)
|
Amendment 6 to Xcelerate Partner Agreement, dated February 14, 2004, between the Company and Sunbelt Software Distribution Inc.
|
||
|
10
|
.40(1)
|
Amendment 7 to Xcelerate Partner Agreement, dated March 22, 2005, between the Company and Sunbelt Software Distribution Inc.
|
||
|
10
|
.41(1)
|
Amendment 8 to Xcelerate Partner Agreement, dated April 1, 2005, between the Company and Sunbelt Software Distribution Inc.
|
||
|
10
|
.42(1)
|
Amendment 9 to Xcelerate Partner Agreement, dated February 15, 2006, between the Company and Sunbelt Software Distribution Inc.
|
||
|
10
|
.43(10)
|
Amendment 10 to Xcelerate Partner Agreement, dated January 1, 2007 between the Company and Sunbelt Software Distribution, Inc.
|
||
|
10
|
.44(11)
|
Amendment 11 to Xcelerate Partner Agreement, dated January 1, 2008 between the Company and Sunbelt Software Distribution, Inc.
|
||
|
10
|
.45 (15)
|
Amendment 12 to Xcelerate Partner Agreement, dated January 1, 2009, between the Company and Sunbelt Software Distribution Inc.
|
||
|
10
|
.46
|
Amendment 13 to Xcelerate Partner Agreement, dated January 1, 2010, between the Company and Sunbelt Software Distribution Inc.
|
||
|
10
|
.48*(1)
|
Form of Non-Disclosure Confidentiality Agreement.
|
||
|
10
|
.49(2)
|
Loan Modification Agreement dated May 9, 2007 between Silicon Valley Bank and Double-Take Software, Inc.
|
||
|
10
|
.50*(4)
|
Form of Change in Control Severance Agreement between Double-Take Software, Inc. and Dean Goodermote, S. Craig, Huke, Daniel M. Jones and Michael Lesh.
|
||
|
10
|
.51*(5)
|
Amended and Restated Employment/Severance Agreement, dated November 9, 2007, between Double-Take Software, Inc. and Robert L. Beeler.
|
||
|
10
|
.52*(6)
|
Amended and Restated Employment/Severance Agreement, dated November 9, 2007, between Double-Take Software, Inc. and David J. Demlow.
|
||
|
10
|
.53*(12)
|
Letter Agreement, dated December 2, 2008, between Double-Take Software, Inc. and Jo Murciano.
|
||
|
10
|
.55(13)
|
Eleventh Loan Modification dated May 1, 2008 between Silicon Valley Bank and Double-Take Software, Inc.
|
||
|
10
|
.56 (16)
|
Twelfth Loan Modification Agreement dated June 30, 2009 between Silicon Valley Bank and Double-Take Software, Inc.
|
|
21
|
.01
|
Subsidiaries of the Company.
|
||
|
23
|
.01
|
Consent of Eisner LLP.
|
||
|
31
|
.01
|
Certification of Chief Executive Officer and pursuant to Rule 13a-14(a) under the Securities Exchange Act of 1934 as adopted pursuant to Section 302 of the Sarbanes-Oxley Act of 2002.
|
||
|
31
|
.02
|
Certification of Chief Financial Officer and pursuant to Rule 13a-14(a) under the Securities Exchange Act of 1934 as adopted pursuant to Section 302 of the Sarbanes-Oxley Act of 2002.
|
||
|
32
|
.01
|
Certification of Chief Executive Officer and Chief Financial Officer pursuant to 18 U.S.C. Section 1350 as adopted pursuant to Section 906 of the Sarbanes-Oxley Act of 2002.
|
|
*
|
Represents a management contract or compensatory plan or arrangement.
|
|
|
+
|
Confidential treatment has been requested for certain portions of these agreements, and the confidential portions were filed separately with the SEC.
|
|
|
(1)
|
The copy of this exhibit filed as the same exhibit number to the Company’s Registration Statement on Form S-1 (File No. 333-136499) is incorporated herein by reference.
|
|
|
(2)
|
The copy of this exhibit filed as Exhibit 10.1 to the Company’s Quarterly Report on Form 10-Q (File No. 001-33184) for the quarter ended March 31, 2007 is incorporated herein by reference.
|
|
|
(3)
|
The copy of this exhibit filed as the same exhibit number to the Company’s Current Report on Form 8-K/A (File No. 001-33184) filed on July 23, 2007 is incorporated herein by reference.
|
|
|
(4)
|
The copy of this exhibit filed as the Exhibit 10.48 to the Company’s Quarterly Report on Form 10-Q (File No. 001-33184) for the quarter ended September 30, 2007 is incorporated herein by reference.
|
|
|
(5)
|
The copy of this exhibit filed as the Exhibit 10.49 to the Company’s Quarterly Report on Form 10-Q (File No. 001-33184) for the quarter ended September 30, 2007 is incorporated herein by reference.
|
|
|
(6)
|
The copy of this exhibit filed as the Exhibit 10.50 to the Company’s Quarterly Report on Form 10-Q (File No. 001-33184) for the quarter ended September 30, 2007 is incorporated herein by reference.
|
|
|
(7)
|
The copy of this exhibit filed as exhibit number 3.1 to the Company’s Current Report on From 8-K (File No. 001-33184) filed on November 19, 2008 is incorporated herein by reference.
|
|
|
(8)
|
The copy of this exhibit filed as exhibit number 3.2 to the Company’s Current Report on From 8-K (File No. 001-33184) filed on November 19, 2008 is incorporated herein by reference.
|
|
|
(9)
|
The copy of this exhibit filed as exhibit number 4.1 to the Company’s Current Report on From 8-K (File No. 001-33184) filed on November 19, 2008 is incorporated herein by reference.
|
|
|
(10)
|
The copy of this exhibit filed as Exhibit 10.53 to the Company’s Quarterly Report on Form 10-Q (File No. 001-33184) for the quarter ended March 31, 2008 is incorporated herein by reference.
|
|
|
(11)
|
The copy of this exhibit filed as Exhibit 10.54 to the Company’s Quarterly Report on Form 10-Q (File No. 001-33184) for the quarter ended March 31, 2008 is incorporated herein by reference.
|
|
|
(12)
|
The copy of this exhibit filed as the same exhibit number to the Company’s Current Report on From 8-K (File No. 001-33184) filed on December 8, 2008 is incorporated herein by reference.
|
|
|
(13)
|
The copy of this exhibit filed as the same exhibit number to the Company’s Quarterly Report on Form 10-Q (File No. 001-33184) for the quarter ended June 30, 2008 is incorporated herein by reference.
|
|
|
(14)
|
The copy of this exhibit filed as the same exhibit number to the Company’s Annual Report on Form 10-K (File No. 001-33184) for the year ended December 31, 2007 is incorporated herein by reference.
|
|
|
(15)
|
The copy of this exhibit filed as the same exhibit number to the Company’s Annual Report on Form 10-K (File No. 001-33184) for the year ended December 31, 2008 is incorporated herein by reference.
|
|
|
(16)
|
The copy of this exhibit filed as the same exhibit number to the Company’s Quarterly Report on Form 10-Q (File No. 001-33184) for the quarter ended June 30, 2009 is incorporated herein by reference.
|
|
|
(17)
|
The copy of this exhibit filed as the same exhibit number to the Company’s Quarterly Report on Form 10-Q (File No. 001-33184) for the quarter ended September 30, 2009 is incorporated herein by reference.
|
|
|
(18)
|
The copy of this exhibit filed as the same exhibit number to the Company’s Current Report on From 8-K (File No. 001-33184) filed on May 14, 2009 is incorporated herein by reference.
|
|