Attached files
Table of Contents
UNITED STATES
SECURITIES AND EXCHANGE COMMISSION
Washington, D.C. 20549
FORM 10-K
(Mark One)
| x | ANNUAL REPORT PURSUANT TO SECTION 13 OR 15(d) OF THE SECURITIES EXCHANGE ACT OF 1934 |
For the fiscal year ended January 30, 2010
OR
| ¨ | TRANSITION REPORT PURSUANT TO SECTION 13 OR 15(d) OF THE SECURITIES EXCHANGE ACT OF 1934 |
Commission File No. 1-10738
For the transition period from to
ANNTAYLOR STORES CORPORATION
(Exact name of registrant as specified in its charter)
| DELAWARE | 13-3499319 | |
| (State or other jurisdiction of incorporation or organization) |
(I.R.S. Employer Identification Number) | |
| 7 Times Square, New York, NY | 10036 | |
| (Address of principal executive offices) | (Zip Code) | |
(212) 541-3300
(Registrant’s telephone number, including area code)
Securities registered pursuant to Section 12(b) of the Act:
| Title of Each Class |
Name of each exchange on which registered | |
| Common Stock, $.0068 Par Value | The New York Stock Exchange |
Securities registered pursuant to Section 12(g) of the Act: None.
Indicate by check mark if the registrant is a well-known seasoned issuer, as defined in Rule 405 of the Securities Act. Yes x No ¨.
Indicate by check mark if the registrant is not required to file reports pursuant to Section 13 or Section 15(d) of the Act. Yes ¨ No x.
Indicate by check mark whether registrant (1) has filed all reports required to be filed by Section 13 or 15(d) of the Securities Exchange Act of 1934 during the preceding 12 months (or for such shorter period that the registrant was required to file such reports) and (2) has been subject to such filing requirements for the past 90 days. Yes x No ¨.
Indicate by check mark whether the registrant has submitted electronically and posted on its corporate Website, if any, every Interactive Data File required to be submitted and posted pursuant to Rule 405 of Regulation S-T during the preceding 12 months (or for such shorter period that the registrant was required to submit and post such files). Yes ¨ No ¨.
Indicate by check mark if disclosure of delinquent filers pursuant to Item 405 of Regulation S-K is not contained herein, and will not be contained, to the best of registrant’s knowledge, in definitive proxy or information statements incorporated by reference in Part III of this Form 10-K or any amendment to this Form 10-K. x .
Indicate by check mark whether the registrant is a large accelerated filer, an accelerated filer, a non-accelerated filer or a smaller reporting company. See definition of “large accelerated filer”, “accelerated filer” and “smaller reporting company” in Rule 12b-2 of the Exchange Act. (Check one):
| Large accelerated filer x |
Accelerated filer ¨ | Non-accelerated filer ¨ | Smaller reporting company ¨ |
Indicate by check mark whether the registrant is a shell company (as defined in Rule 12b-2 of the Exchange Act). Yes ¨ No x.
The aggregate market value of the registrant’s voting stock held by non-affiliates of the registrant as of July 31, 2009 was $686,937,593.
The number of shares of the registrant’s common stock outstanding as of February 26, 2010 was 58,774,071.
Documents Incorporated by Reference:
Portions of the Registrant’s Proxy Statement for the Registrant’s 2010 Annual Meeting of Stockholders to be held on May 19, 2010 are incorporated by reference into Part III.
Table of Contents
ANNUAL REPORT ON FORM 10-K INDEX
| Page No. | ||||
| PART I. | ||||
| ITEM 1. | 2 | |||
| ITEM 1A. | 8 | |||
| ITEM 1B. | 13 | |||
| ITEM 2. | 14 | |||
| ITEM 3. | 14 | |||
| ITEM 4. | 14 | |||
| PART II. | ||||
| ITEM 5. | 15 | |||
| ITEM 6. | 17 | |||
| ITEM 7. | Management’s Discussion and Analysis of Financial Condition and Results of Operations |
19 | ||
| ITEM 7A. | 38 | |||
| ITEM 8. | 39 | |||
| ITEM 9. | Changes in and Disagreements with Accountants on Accounting and Financial Disclosure |
40 | ||
| ITEM 9A. | 40 | |||
| ITEM 9B. | 40 | |||
| PART III. | ||||
| ITEM 10. | 41 | |||
| ITEM 11. | 41 | |||
| ITEM 12. | Security Ownership of Certain Beneficial Owners and Management and Related Stockholder Matters |
41 | ||
| ITEM 13. | Certain Relationships and Related Transactions, and Director Independence |
41 | ||
| ITEM 14. | 41 | |||
| PART IV. | ||||
| ITEM 15. | 42 | |||
| SIGNATURES | 43 | |||
| CONSOLIDATED FINANCIAL STATEMENTS | 44 | |||
| EXHIBIT INDEX | 81 | |||
Table of Contents
Statement Regarding Forward-Looking Disclosures
This Annual Report on Form 10-K (this “Report”) includes, and incorporates by reference, certain forward-looking statements made pursuant to the safe harbor provisions of the Private Securities Litigation Reform Act of 1995. The forward-looking statements may use the words “expect”, “anticipate”, “plan”, “intend”, “project”, “may”, “believe” and similar expressions. These forward-looking statements reflect the current expectations of AnnTaylor Stores Corporation concerning future events and actual results may differ materially from current expectations or historical results. Any such forward-looking statements are subject to various risks and uncertainties, including without limitation those discussed in the sections of this Report entitled “Business”, “Risk Factors” and “Management’s Discussion and Analysis of Financial Condition and Results of Operations”. AnnTaylor Stores Corporation does not assume any obligation to publicly update or revise any forward-looking statements at any time for any reason.
| ITEM 1. | Business. |
General
AnnTaylor Stores Corporation, through its wholly-owned subsidiaries, is a leading national specialty retailer of women’s apparel, shoes and accessories sold primarily under the “Ann Taylor” and “LOFT” brands. As used in this report, all references to “we”, “our”, “us” and “the Company” refer to AnnTaylor Stores Corporation and its wholly-owned subsidiaries.
We believe that “Ann Taylor” and “LOFT” are highly recognized national brands with distinct fashion points of view, though both are equally committed to providing clients with feminine, fashionable, high quality merchandise that is highly relevant to all aspects of her lifestyle. Ann Taylor defines what it means to be chic, smart and sophisticated. Relevant and stylish, Ann Taylor offers timeless wear-now and wear-to-work fashion with impeccable quality and irresistible prices. LOFT is the ultimate casual, fashionable and stylish retail destination for women, providing versatile and effortless pieces at surprising prices.
Our Ann Taylor and LOFT stores offer a full range of career and casual separates, dresses, tops, weekend wear, shoes and accessories, coordinated as part of a strategy to provide modern styles that are versatile across all occasions and needs. Our Ann Taylor Factory and LOFT Outlet stores offer past season best sellers from the Ann Taylor and LOFT merchandise collections, respectively, and are extensions of those brands in the outlet environment.
As of January 30, 2010, we operated 907 retail stores in 46 states, the District of Columbia and Puerto Rico, of which 291 were Ann Taylor stores, 506 were LOFT stores, 92 were Ann Taylor Factory stores and 18 were LOFT Outlet stores. See “Stores and Expansion” for further discussion. Our clients can also shop online at www.anntaylor.com and www.LOFTonline.com or by phone at 1-800-DIAL-ANN.
We are dedicated to maintaining the right merchandise mix in our stores and plan the timing of our product offerings to address clients’ needs, anticipating fabric and yarn preferences on a regional and seasonal basis. Our direct marketing efforts are planned to support this merchandising strategy. Our merchandise, marketing and distribution strategies are reinforced by an emphasis on client service, as our sales associates are trained to assist clients in merchandise selection and coordination.
Merchandise Design and Production
Substantially all of our merchandise is developed by our in-house product design and development teams, which design merchandise exclusively for us. Our merchandising groups determine inventory needs for the upcoming season, edit the assortments developed by the design teams, plan monthly merchandise flows and arrange for the production of merchandise by independent manufacturers, primarily through our sourcing group or through private label specialists. A small percentage of our merchandise is purchased through branded vendors, which is selected to complement our in-house assortment.
2
Table of Contents
Our production management and quality assurance departments establish the technical specifications for all merchandise, inspect factories in which the merchandise is produced, including periodic in-line inspections while goods are in production to identify potential problems prior to shipment, and, upon receipt, inspect merchandise on a test basis for uniformity of size and color, as well as for conformity with specifications and overall quality of manufacturing.
In Fiscal 2009, we sourced merchandise from approximately 180 manufacturers and vendors in 18 countries, and no single supplier accounted for more than 7% of our merchandise purchases. Approximately 50% of our merchandise purchases originated in China, 13% in the Philippines, 12% in Indonesia, 10% in India, and 6% in Vietnam. Any event causing a sudden disruption of manufacturing or imports from any of these countries, including the imposition of additional import restrictions, could have a material adverse effect on our operations. Our foreign purchases are negotiated and paid for in U.S. dollars.
We have a social compliance program that requires our suppliers, factories and subcontractors to comply with our Global Supplier Principles and Guidelines as well as the local laws and regulations in the country of manufacture. We also conduct unannounced third-party audits to confirm manufacturer compliance with our compliance standards. We are also a certified and validated member of the United States Customs and Border Protection’s Custom Trade Partnership against Terrorism (“C-TPAT”) program and expect all of our suppliers shipping to the United States to adhere to our C-TPAT requirements. These include standards relating to facility security, procedural security, personnel security, cargo security and the overall protection of the supply chain. Audits are conducted to confirm supplier compliance with our compliance standards.
We generally do not maintain any long-term or exclusive commitments or arrangements to purchase merchandise from any single supplier. We believe we have solid relationships with our suppliers and that, subject to the discussion in “Statement Regarding Forward-Looking Disclosures”, “Risk Factors” and “Management’s Discussion and Analysis of Financial Condition and Results of Operations – Liquidity and Capital Resources”, we will continue to have adequate sources to produce a sufficient supply of quality goods in a timely manner and on satisfactory economic terms.
Inventory Control and Merchandise Allocation
Our planning department analyzes relevant historical product demand data by size and store location, as well as margins, sales and inventory history of store clusters to assist it in determining the quantity of merchandise to be purchased for, and the allocation of merchandise to, our stores. Merchandise is allocated to achieve an emphasis that is suited to each store’s client base. Merchandise typically is sold at its original marked price for several weeks, with the length of time varying by individual style or color choice and dependent on client acceptance. We review inventory levels on an ongoing basis to identify slow-moving merchandise styles and broken assortments (items no longer in stock in a sufficient range of sizes) and use markdowns to clear this merchandise. Markdowns may also be used if inventory exceeds client demand for reasons of design, seasonal adaptation or changes in client preference, or if it is determined that the inventory will not sell at its currently marked price. We also use planned promotions to attract customers, particularly in a challenging retail environment. Most inventory is cleared in-store, however any residual inventory is liquidated to unaffiliated third parties.
Our core merchandising system is the central repository for inventory data and related business activities that affect inventory levels such as purchasing, receiving, allocation and distribution.
We use a centralized distribution system under which nearly all merchandise is distributed to our stores through our distribution center, located in Louisville, Kentucky. See “Properties” for further discussion of our Louisville distribution center. Merchandise is shipped by the distribution center to our stores several times each week.
3
Table of Contents
Stores and Expansion
Our business strategy includes a real estate expansion program designed to reach new clients through the opening of new stores. We open new stores in markets that we believe have a sufficient concentration of our target clients. We also add stores, or expand the size of existing stores, in markets where we already have a presence, as market conditions warrant and sites become available. In addition, we reinvest in our current store fleet to elevate and modernize the in-store experience we are providing our clients. Store locations are determined on the basis of various factors, including geographic location, demographic studies, anchor tenants in a mall location, other specialty stores in a mall or specialty center location or in the vicinity of a village location and the proximity to professional offices in a downtown or village location. We open our Ann Taylor Factory and LOFT Outlet stores in outlet centers with co-tenants that generally include a significant number of outlet or discount stores operated under nationally recognized upscale brand names. Store size is determined on the basis of various factors, including merchandise needs, geographic location, demographic studies and space availability.
In response to the challenging economic times, we have significantly slowed our new store growth and have aggressively pursued renegotiating or extending existing leases at more favorable occupancy rates. We also completed a study of the top 50 U.S. metropolitan areas for Ann Taylor and LOFT, which has enabled us to develop a store fleet optimization plan in these markets to maximize store productivity. Our store fleet optimization plan has also enabled us to plan our real estate strategy for future growth. In January 2008, we initiated a multi-year, strategic, restructuring program. This program provides for the closing of approximately 225 underperforming stores, of which 102 have closed through January 30, 2010. See “Management’s Discussion and Analysis of Financial Condition and Results of Operations – Liquidity and Capital Resources” for further discussion of our restructuring program.
As of January 30, 2010, we operated 907 retail stores throughout the United States, the District of Columbia and Puerto Rico, of which 291 were Ann Taylor stores, 506 were LOFT stores, 92 were Ann Taylor Factory stores and 18 were LOFT Outlet stores.
An average Ann Taylor store is approximately 5,300 square feet in size. We also have two Ann Taylor flagship stores, one located in New York City and one located in Chicago, both of which offer the largest assortment of Ann Taylor merchandise. In Fiscal 2009, we did not open any new Ann Taylor stores, and we do not plan to open any new Ann Taylor stores in Fiscal 2010.
LOFT stores average approximately 5,900 square feet. We also have one LOFT flagship store on the ground floor of 7 Times Square, our corporate headquarters, in New York City. In Fiscal 2009, we opened nine LOFT stores that averaged approximately 5,600 square feet and converted 11 Ann Taylor stores to LOFT stores that averaged 5,000 square feet. In Fiscal 2010, we plan to open approximately 10 LOFT stores, which are expected to average approximately 5,200 square feet and convert 7 additional Ann Taylor stores to LOFT stores, which are expected to average 4,800 square feet.
Our Ann Taylor Factory stores average approximately 7,300 square feet. In Fiscal 2009, we opened 1 Ann Taylor Factory store that is approximately 6,500 square feet. In Fiscal 2010, we do not plan to open any Ann Taylor Factory stores.
Our LOFT Outlet stores average approximately 6,800 square feet. In Fiscal 2009, we continued to grow our fleet of LOFT Outlet stores by opening four additional stores, which average approximately 6,600 square feet. In Fiscal 2010, we plan to open 20 LOFT Outlet stores, which are expected to average 6,500 square feet.
Our stores typically have approximately 25% of their total square footage allocated to stockroom and other non-selling space.
We believe that our existing store base is a significant strategic asset of our business. We have invested approximately $443 million in our store base since the beginning of Fiscal 2005; approximately 63% of our stores are either new, expanded or have been remodeled or refurbished in the last five years. Our stores are located in some of the most productive retail centers in the United States.
4
Table of Contents
The following table sets forth certain information regarding store openings, expansions and closings for Ann Taylor stores (“ATS”), LOFT stores (“LOFT”), Ann Taylor Factory stores (“ATF”) and LOFT Outlet stores (“LOS”) over the past five years:
| Fiscal Year |
Total Stores Open at Beginning of Fiscal Year |
No. Stores Opened During Fiscal Year |
No. Stores Closed During Fiscal Year |
No. Stores Converted During Fiscal Year |
No. Stores Open at End of Fiscal Year |
No. Stores Expanded During Fiscal Year | |||||||||||||||||||||||||||
| ATS | LOFT | ATF | LOS | ATS | LOFT | ATF | ATS | LOFT | ATS | LOFT | ATF | LOS | Total | ||||||||||||||||||||
| 2005 |
738 | 9 | 73 | 15 | — | 11 | — | — | — | — | 357 | 416 | 51 | — | 824 | 12 | |||||||||||||||||
| 2006 |
824 | 11 | 52 | 7 | — | 20 | 4 | 1 | — | — | 348 | 464 | 57 | — | 869 | 16 | |||||||||||||||||
| 2007 |
869 | 14 | 52 | 11 | — | 13 | 4 | — | — | — | 349 | 512 | 68 | — | 929 | 14 | |||||||||||||||||
| 2008 |
929 | 4 | 25 | 23 | 14 | 33 | 27 | — | — | — | 320 | 510 | 91 | 14 | 935 | 8 | |||||||||||||||||
| 2009 |
935 | — | 9 | 1 | 4 | 18 | 24 | — | (11 | ) | 11 | 291 | 506 | 92 | 18 | 907 | 1 | ||||||||||||||||
In Fiscal 2009, our real estate plan resulted in an increase in our total square footage of approximately 83,000 square feet, or approximately 2%. This was offset by a decrease in total square footage of approximately 227,000 square feet, or approximately 4%, due to store closings as part of our restructuring program. Overall, total store square footage decreased approximately 144,000 square feet, or approximately 3%, from approximately 5.5 million square feet at the end of Fiscal 2008 to approximately 5.3 million square feet at the end of Fiscal 2009. During Fiscal 2010, we plan to open approximately 30 stores and close approximately 72 stores, for a net reduction in total square footage of approximately 220,000 square feet, or approximately 4%.
Capital expenditures for our Fiscal 2009 store expansion totaled approximately $8 million and expenditures for store remodeling and refurbishment totaled approximately $5 million. We expect that capital expenditures for our Fiscal 2010 store expansion program will be approximately $25 million and expenditures for store renovations and refurbishing will be approximately $20 million.
Our store expansion and refurbishment plans are dependent upon, among other things, general economic and business conditions affecting consumer confidence and spending, the availability of desirable locations and the negotiation of acceptable lease terms. See “Risk Factors” and “Management’s Discussion and Analysis of Financial Condition and Results of Operations – Liquidity and Capital Resources”.
Information Systems
During Fiscal 2009, we continued our investment in information services and technology, enhancing the systems we use to support our online, merchandise sourcing, back office and in-store management functions. These enhancements are generally aimed at driving online sales and operational efficiencies while providing speed, flexibility and cost reduction in our supply chain.
Brand Building and Marketing
We believe that our Ann Taylor and LOFT brands are among our most important assets and that these brands and their relationship with our clients are key to our competitive advantage. We continuously evolve these brands to appeal to the changing needs of our target clients and stay competitive in the market.
We control all aspects of brand development for our retail concepts, including product design, store merchandising and design, channels of distribution and marketing and advertising. We continue to invest in the development of these brands through, among other things, client research, advertising, in-store and direct marketing and our online sites and online marketing initiatives. We also make investments to enhance the overall client experience through the opening of new stores, the expansion and remodeling of existing stores and a focus on client service.
We believe it is strategically important to communicate on a regular basis directly with our current client base and with potential clients, through national and regional advertising, as well as through direct mail marketing and in-store presentation. Marketing expenditures as a percentage of sales were 3.3% in Fiscal 2009, 2.8% in Fiscal 2008 and 2.6% in Fiscal 2007.
5
Table of Contents
Trademarks and Service Marks
The “AnnTaylor®”, “Loft®” and “AnnTaylor Loft®” trademarks are registered with the United States Patent and Trademark Office and with the trademark registries of many foreign countries. Our rights in these marks are a significant part of our business, as we believe they are famous and well-known in the women’s apparel industry. Accordingly, we intend to maintain our trademarks and related registrations and vigorously protect them against infringement.
In July 2009, we acquired the registered trademark in the People’s Republic of China (“PRC”) for the “Ann Taylor” mark in the apparel and footwear class (the “Mark”) pursuant to a Trademark Assignment Agreement (the “Assignment Agreement”). This assignment of the Mark is subject to approval by the PRC Trademark Office, and until that approval is received, our existing trademark license agreement (which expires on June 30, 2015) permitting our use of the Mark remains in effect. The Assignment Agreement provides that if the PRC Trademark Office does not approve the assignment, we will have a perpetual, exclusive, royalty-free license to use the Mark. We believe the Assignment Agreement secures our rights in the Mark and protects our ability to source merchandise from the PRC. See “Statement Regarding Forward-Looking Disclosures” and “Risk Factors”.
Competition
The women’s retail apparel industry is highly competitive. Our stores compete with certain departments in international, national and local department stores and with other specialty stores, catalog and internet businesses that offer similar categories of merchandise. We believe that our focused merchandise selection, exclusive fashions and service distinguish us from other apparel retailers. Our competitors range from smaller, growing companies to considerably larger players with substantially greater financial, marketing and other resources. There is no assurance that we will be able to compete successfully with them in the future. See “Risk Factors” and “Statement Regarding Forward-Looking Disclosures”.
Client Loyalty Programs
In October 2008, we launched an enhanced credit card program, which offers eligible clients the choice of a private label or a co-branded credit card. Both cards can be used at any Ann Taylor or LOFT store location, including Ann Taylor Factory and LOFT Outlet, as well as at anntaylor.com and LOFTonline.com. The co-branded credit card can also be used at any other business where the card is accepted. Both cards are offered in an Ann Taylor version and a LOFT version, depending upon where a client enrolls in the program; however the benefits offered to clients are the same for each.
To encourage clients to apply for the credit card, we provide a discount to approved cardholders on all purchases they make with their new card in any of our stores on the day of application acceptance. All new cardholders are automatically enrolled in our exclusive rewards program, which is designed to recognize and promote client loyalty. These benefits have also been extended to those valued clients who held our private label card prior to the October 2008 re-launch. Under the new Style Rewards program, points are earned on purchases made with the credit card at any of our brands through any of our channels. Co-branded cardholders also earn points on purchases made at other businesses where our card is accepted. Cardholders who accumulate the requisite number of points are issued a Style Rewards Certificate redeemable toward a future purchase at Ann Taylor, LOFT, Ann Taylor Factory, LOFT Outlet or online. In addition to earning points, all participants in the credit card program receive exclusive offers throughout the year. These offers include a Birthday Bonus, special incentives, invitations to shopping events and periodic opportunities to earn bonus points.
Employees
As of January 30, 2010, we had approximately 18,800 employees, of which approximately 1,600 were full-time salaried employees, 1,800 were full-time hourly employees and 15,400 were part-time hourly employees working less than 30 hours per week. None of our employees are represented by a labor union. We believe that our relationship with our employees is good.
6
Table of Contents
Available Information
We make available free of charge on our website, http://investor.anntaylor.com, copies of our annual report on Form 10-K, quarterly reports on Form 10-Q, current reports on Form 8-K and amendments to those reports filed or furnished pursuant to Sections 13(a) or 15(d) of the Securities Exchange Act of 1934, as amended, as soon as reasonably practicable after such reports are filed electronically with, or otherwise furnished to, the United States Securities and Exchange Commission (the “SEC”). Copies of the charters of each of our Audit Committee, Compensation Committee and Nominating and Corporate Governance Committee, as well as our Corporate Governance Guidelines and Business Conduct Guidelines, are also available on our website.
7
Table of Contents
| ITEM 1A. | Risk Factors. |
The following risk factors should be considered carefully in evaluating our business and the forward-looking information in this document. Please also see “Statement Regarding Forward-Looking Disclosures” in the section immediately preceding Item 1 of this Report. The risks described below are not the only risks our business faces. We may also be adversely affected by additional risks not presently known to us or that we currently deem immaterial.
Our ability to maintain the value of our brands
Our success depends on the value of our Ann Taylor and LOFT brands. The Ann Taylor and LOFT names are integral to our business as well as to the implementation of our strategies for expanding our business. Maintaining, promoting and positioning our brands will depend largely on the success of our design, merchandising, and marketing efforts and our ability to provide a consistent, high quality client experience. Our brands could be adversely affected if we fail to achieve these objectives for one or both of these brands and our public image and reputation could be tarnished by negative publicity. Any of these events could negatively impact sales.
Our ability to anticipate and respond to changing client preferences and fashion trends in a timely manner
Our success largely depends on our ability to consistently gauge fashion trends and provide merchandise that satisfies client demands for each of our brands in a timely manner. Any missteps may affect inventory levels, since we enter into agreements to manufacture and purchase our merchandise well in advance of the applicable selling season. Our failure to anticipate, identify or react appropriately in a timely manner to changes in fashion trends and economic conditions could lead to lower sales, missed opportunities, excess inventories and more frequent markdowns, which could have a material adverse impact on our business. Merchandise misjudgments could also negatively impact our image with our clients and result in diminished brand loyalty.
Our ability to execute brand extensions and new concepts
Part of our business strategy is to grow our existing brands and identify and develop new growth opportunities. Our success with new merchandise offerings or concepts requires significant capital expenditures and management attention. Any such plan is subject to risks such as client acceptance, competition, product differentiation, challenges to economies of scale in merchandise sourcing and the ability to attract and retain qualified associates, including management and designers. There is no assurance that these merchandise offerings or concepts will be successful or that our overall profitability will increase as a result. Our failure to successfully execute our growth strategies may adversely impact our financial condition and results of operations.
Our ability to manage inventory levels and changes in merchandise mix
The long lead time usually required for a substantial portion of our merchandise makes client demand difficult to predict and responding to changes quickly challenging. We must enter into contracts for the purchase and manufacture of merchandise well in advance of the applicable selling season. Our financial condition could be materially adversely affected if we are unable to manage inventory levels and respond to short-term shifts in client demand patterns. Inventory levels in excess of client demand may result in excessive markdowns and, therefore, lower than planned margins. If we underestimate demand for our merchandise, on the other hand, we may experience inventory shortages resulting in missed sales and lost revenues. Either of these events could significantly harm our operating results and brand image. In addition, our margins may be impacted by changes in our merchandise mix and a shift toward merchandise with lower selling prices. These changes could have a material adverse effect on our results of operations.
The effect of competitive pressures from other retailers
The specialty retail industry is highly competitive. We compete with national, international and local department stores, specialty and discount stores, catalogs and internet businesses offering similar categories of merchandise. Many of our competitors are companies with substantially greater financial, marketing and other resources. There is no assurance that we can compete successfully with them in the future. In addition to competing for sales, we compete for favorable store locations, lease terms and qualified associates. Increased competition could reduce our sales and margins and adversely affect our results of operations.
8
Table of Contents
Our reliance on key management and our ability to attract and retain qualified associates
Our success depends to a significant extent both upon the continued services of our current executive and senior management team, as well as our ability to attract, hire, motivate and retain additional qualified management in the future. Competition for key executives in the retail industry is intense, and our operations could be adversely affected if we cannot attract and retain these key individuals.
Our performance also depends in large part on the talents and contributions of skilled associates in all areas of our organization. If we are unable to identify, hire, develop, motivate and retain talented individuals, we may be unable to compete effectively and our business could be adversely impacted.
Our ability to grow through new store openings and existing store remodels and expansions and manage the profitability of our existing fleet of stores
Our continued growth and success depends in part on our ability to open and operate new stores, expand and remodel existing stores on a timely and profitable basis, and optimize store performance by closing under-performing stores. Accomplishing our store expansion goals, which continue to involve opening fewer stores in Fiscal 2010 than in years prior to the economic crisis, depends upon a number of factors, including locating suitable sites and negotiating favorable lease terms. We must also be able to effectively renew and re-negotiate terms in existing store leases. Hiring and training qualified associates, particularly at the store management level, and maintaining overall good relations with our associates, is also important to our store operations. There is no assurance that we will achieve our store expansion goals, manage our growth effectively or operate our stores profitably.
Our reliance on third party manufacturers
We do not own or operate any manufacturing facilities and depend on independent third parties to manufacture our merchandise. We cannot be certain that we will not experience operational difficulties with our manufacturers, such as reductions in the availability of production capacity, errors in complying with merchandise specifications, insufficient quality control and failures to meet production deadlines or increases in manufacturing costs. In addition, world-wide economic conditions are continuing to have a significant negative impact on businesses around the world, and the impact of those conditions on our major suppliers cannot be predicted. Our suppliers may be unable to obtain adequate credit or access liquidity to finance their operations. A manufacturer’s failure to ship merchandise to us on a timely basis or to meet the required product safety and quality standards could cause supply shortages, failure to meet client expectations and damage to our brands, which could adversely impact our sales and operating results.
Our reliance on foreign sources of production
We purchase a significant portion of our merchandise from foreign suppliers. As a result, we are subject to the various risks of doing business in foreign markets and importing merchandise from abroad, such as:
| • | imposition of new legislation relating to import quotas or other restrictions that may limit the quantity of our merchandise that may be imported into the United States from countries in regions where we do business; |
| • | significant delays in the delivery of cargo due to port security considerations; |
| • | imposition of duties, taxes, and other charges on imports; |
| • | imposition of anti-dumping or countervailing duties in response to an investigation as to whether a particular product being sold in the United States at less than fair value may cause (or threaten to cause) material injury to the relevant domestic industry; |
| • | financial or political instability in any of the countries in which our merchandise is manufactured; |
| • | impact of natural disasters and public health concerns on our foreign sourcing offices and vendor manufacturing operations; |
| • | fluctuation in the value of the U.S. dollar against foreign currencies or restrictions on the transfer of funds; |
| • | potential recalls for any merchandise that does not meet our quality standards; and |
| • | disruption of imports by labor disputes and local business practices. |
9
Table of Contents
We cannot predict whether any of the foreign countries in which our merchandise is manufactured, or in which our merchandise may be manufactured in the future, will be subject to import restrictions by the U.S. government. Any sudden disruption of manufacturing or imposition of trade restrictions, such as increased tariffs or more restrictive quotas on apparel or other items we sell could affect the import of such merchandise and could increase the cost or reduce the supply of merchandise available to us and adversely affect our business, financial condition, results of operations and liquidity.
In addition, the raw materials used to manufacture our merchandise are subject to availability constraints and price volatility caused by high demand for fabrics, currency fluctuations, weather conditions, supply conditions, government regulations, labor conditions, transportation or freight costs, economic climate and other unpredictable factors. Increases in the demand for, or the price of, raw materials used to manufacture our merchandise could have a material adverse effect on our cost of sales or our ability to meet our clients’ needs. We may not be able to pass all or a portion of such higher raw material costs onto our clients, which could negatively impact our profitability.
Our ability to successfully upgrade and maintain our information systems to support the needs of the organization
We rely heavily on information systems to manage our operations, including a full range of retail, financial, sourcing and merchandising systems, and regularly make investments to upgrade, enhance or replace these systems. The reliability and capacity of our information systems is critical. Despite our preventative efforts, our systems are vulnerable from time to time to damage or interruption from, among other things, security breaches, computer viruses, power outages and other technical malfunctions. Any disruptions affecting our information systems, or any delays or difficulties in transitioning to new systems or in integrating them with current systems, could have a material adverse impact on our business. Any failure to maintain adequate system security controls to protect our computer assets and sensitive data, including client data, from unauthorized access, disclosure or use could also damage our reputation with our clients.
In addition, our ability to continue to operate our business without significant interruption in the event of a disaster or other disruption depends in part on the ability of our information systems to operate in accordance with our disaster recovery and business continuity plans.
Our dependence on a single distribution facility and third-party transportation companies
We handle merchandise distribution for all of our stores from a single facility in Louisville, Kentucky. Independent third party transportation companies deliver our merchandise to our stores and our clients. Any significant interruption in the operation of the distribution facility or the domestic transportation infrastructure due to natural disasters, accidents, inclement weather, system failures, work stoppages, slowdowns or strikes by employees of the transportation companies, or other unforeseen causes could delay or impair our ability to distribute merchandise to our stores, which could result in lower sales, a loss of loyalty to our brands and excess inventory.
Risks associated with Internet sales
We sell merchandise over the Internet through our websites, www.anntaylor.com and www.LOFTonline.com. Our Internet operations are subject to numerous risks, including:
| • | reliance on third-party computer hardware/software; |
| • | reliance on third-party order fulfillment providers; |
| • | rapid technological change and the implementation of new systems and platforms; |
| • | diversion of sales from our stores; |
| • | liability for online content; |
| • | violations of state or federal laws, including those relating to online privacy; |
| • | credit card fraud; |
| • | the failure of the computer systems that operate our websites and their related support systems, including computer viruses; and |
| • | telecommunications failures and electronic break-ins and similar disruptions. |
There is no assurance that our Internet operations will continue to achieve sales and profitability growth.
10
Table of Contents
The effect of general economic conditions and the recent financial crisis
The Company’s performance is subject to world-wide economic conditions and their impact on levels of consumer spending, which may remain depressed for the foreseeable future. Some of the factors impacting discretionary consumer spending include general economic conditions, wages and employment, consumer debt, reductions in net worth based on recent severe market declines, residential real estate and mortgage markets, taxation, fuel and energy prices, interest rates, consumer confidence and other macroeconomic factors.
Although the recent global financial crisis has eased somewhat from the unprecedented levels reached during Fiscal 2008 and Fiscal 2009, world-wide economic conditions remain troubled and consumer spending remains significantly depressed as compared to pre-crisis levels. Consumer purchases of discretionary items, including our merchandise, generally decline during recessionary periods and other periods where disposable income is adversely affected. The downturn in the economy may continue to affect consumer purchases of our merchandise and adversely impact our results of operations and continued growth. It is difficult to predict how long the current economic, capital and credit market conditions will continue, whether such conditions will further deteriorate and what impact those factors might have on our business.
Fluctuation in our level of sales and earnings growth and stock price
A variety of factors has historically affected, and will continue to affect, our comparable store sales results and profit margins. These factors include fashion trends and client preferences, changes in our merchandise mix, competition, economic conditions, weather, effective inventory management and new store openings. There is no assurance that we will achieve positive levels of sales and earnings growth, and any decline in our future growth or performance could have a material adverse effect on the market price of our common stock.
Our stock price has experienced, and could continue to experience in the future, substantial volatility as a result of many factors, including recent global economic conditions, broad market fluctuations, our operating performance and public perception of the prospects for the women’s apparel industry. Failure to meet market expectations, particularly with respect to comparable store sales, net revenues, operating margins and earnings per share, would likely result in a decline in the market price of our stock.
Failure to comply with legal and regulatory requirements
Our policies, procedures and internal controls are designed to comply with all applicable laws and regulations, including those imposed by the U.S. Securities and Exchange Commission and the New York Stock Exchange, as well as applicable employment laws. Any changes in regulations, the imposition of additional regulations or the enactment of any new legislation, in response to current economic conditions or otherwise, may increase the complexity of the regulatory environment in which we operate and the related cost of compliance. Failure to comply with such laws and regulations may result in damage to our reputation, financial condition and market price of our stock.
Uncertain global economic conditions could have a material adverse effect on the Company’s liquidity and capital resources
The distress in the financial markets has resulted in extreme volatility in security prices and diminished liquidity and credit availability, and there can be no assurance that our liquidity will not be affected by changes in the financial markets and the global economy or that our capital resources will at all times be sufficient to satisfy our liquidity needs. Although we believe that our existing cash and cash equivalents, cash provided by operations and available borrowing capacity under our $250 million Third Amended and Restated Credit Agreement (the “Credit Facility”) will be adequate to satisfy our capital needs for the foreseeable future, any renewed tightening of the credit markets could make it more difficult for us to access funds, enter into agreements for new indebtedness or obtain funding through the issuance of our securities. Our Credit Facility also has financial covenants which, if not met, may further impede our ability to access funds under the Credit Facility.
We have significant amounts of cash and cash equivalents invested in money market funds that are backed by U.S. Treasury Securities or in deposit accounts at FDIC-insured banks. All of our deposit account balances are currently FDIC insured as a result of the government’s Temporary Liquidity Guarantee Program (the “TLGP”). The TLGP currently expires on June 30, 2010. If the TLGP is not renewed, we would consider moving funds from deposit accounts into money market funds backed by U.S. Treasury Securities. With the current financial environment and the instability of financial institutions, we cannot be assured that we will not experience losses on our deposits.
11
Table of Contents
Manufacturer compliance with our social compliance program requirements
We require our independent manufacturers to comply with the Ann Taylor Global Supplier Principles and Guidelines that cover many areas including labor, health and safety and environmental standards. We monitor their compliance with these Guidelines using third-party monitoring firms. Although we have an active program to provide training for our independent manufacturers and monitor their compliance with these standards, we do not control the manufacturers or their practices. Any failure of our independent manufacturers to comply with our Global Supplier Principles and Guidelines or local laws in the country of manufacture could disrupt the shipment of merchandise to us, force us to locate alternative manufacturing sources, reduce demand for our merchandise or damage our reputation.
Our ability to secure and protect trademarks and other intellectual property rights
We believe that our “AnnTaylor”, “AnnTaylor Loft” and “LOFT” trademarks are important to our success. Even though we register and protect our trademarks and other intellectual property rights, there is no assurance that our actions will protect us from the prior registration by others or prevent others from infringing our trademarks and proprietary rights or seeking to block sales of our products as infringements of their trademarks and proprietary rights. Further, the laws of foreign countries may not protect proprietary rights to the same extent as do the laws of the United States. Because we have not registered all of our trademarks in all categories, or in all foreign countries in which we currently manufacture merchandise or may manufacture or sell merchandise in the future, our international expansion and sourcing of merchandise could be limited.
Effects of war, terrorism, public health concerns or other catastrophes
Threat of terrorist attacks or actual terrorist events in the United States and world-wide could cause damage or disruption to international commerce and the global economy, disrupt the production, shipment or receipt of our merchandise or lead to lower client traffic in regional shopping centers. Natural disasters and public health concerns, including severe infectious diseases, could also impact our ability to open and run our stores in affected areas and negatively impact our foreign sourcing offices and the manufacturing operations of our vendors. Lower client traffic due to security concerns, war or the threat of war, natural disasters and public health concerns could result in decreased sales that would have a material adverse impact on our business, financial condition and results of operations.
Our ability to achieve the results of our restructuring program
Our multi-year, strategic, restructuring program is designed to enhance profitability and improve overall operating effectiveness. The key elements of this program include optimization of our store portfolio, organizational streamlining and a broad-based productivity initiative. The anticipated benefits associated with our restructuring program are based on forecasts, which may vary materially based on various factors, including the timing in execution of our restructuring program; outcome of negotiations with landlords and other third parties; and changes in management’s assumptions and projections. As a result of these events and circumstances, delays and unexpected costs may occur, which could result in our not realizing all of the anticipated benefits of our restructuring program or in such benefits taking longer to achieve than expected. Further, to the extent we are unable to improve our financial performance, further restructuring measures may be required in the future. In addition, as part of our store fleet optimization plan, we have, and may continue to, sublease certain closing store locations to third parties. If our sub-lessees default in their rent payment obligations under the sublease agreements, we may be adversely impacted.
Our ability to realize deferred tax assets
If our businesses do not perform well, we may be required to establish a valuation allowance against our deferred income tax assets, which could have a material adverse effect on our results of operations and financial condition. Deferred income tax represents the tax effect of the differences between the book and tax basis of assets and liabilities. Deferred tax assets are assessed periodically by management to determine if they are realizable. Factors in management’s determination include the performance of the business, including the ability to generate taxable income from operations, and tax planning strategies. If, based on available information, it is more likely than not that a deferred tax asset will not be realized, then a valuation allowance would be required with a corresponding charge to income tax expense, thereby reducing net income.
12
Table of Contents
The effect of external economic factors on our Pension Plan
Our future funding obligations with respect to our defined benefit Pension Plan, which was frozen in 2007, will depend upon the future performance of assets set aside for this Pension Plan, interest rates used to determine funding levels, actuarial data and experience and any changes in government laws and regulations. Our Pension Plan holds mutual funds which invest in equity securities. If the market values of these securities decline, our pension expense would increase and, as a result, could materially adversely affect our business. Decreases in interest rates or asset returns could also increase our obligations under the Pension Plan. Although no additional benefits have been earned under the Pension Plan since it was frozen, depending on the pension plan’s funded status there may be ongoing contribution obligations and those contribution obligations could be material.
Our dependence on shopping malls and other retail centers to attract customers to our stores
Many of our stores are located in shopping malls and other retail centers. Sales at these stores benefit from the ability of “anchor” retail tenants, generally large department stores, and other attractions to generate sufficient levels of consumer traffic in the vicinity of our stores. As a result of current economic conditions, overall mall traffic has declined and a number of “anchor” department stores have closed. Further declines in consumer spending and in the volume of consumer traffic at shopping centers may result in reduced sales at our stores and leave us with excess inventory. We may respond by increasing markdowns or initiating marketing promotions to reduce excess inventory, which could materially adversely impact our margins and operating results.
The bankruptcy or significant deterioration of large commercial and retail landlords could have a material adverse affect on our sales and overall retail strategy
The current economic downturn has had a significant negative impact on the commercial real estate sector, including large commercial and retail landlords, such as one of our major national landlords, General Growth Properties, Inc. (“GGP”) and many of its affiliates (collectively “GGP Debtors”), which filed petitions for reorganization relief under Chapter 11 of the U.S. Bankruptcy Code. If the current macro-economic conditions continue or deteriorate further, additional commercial landlords may be similarly impacted which in turn could materially adversely impact our sales and operating results.
| ITEM 1B. | Unresolved Staff Comments. |
None.
13
Table of Contents
| ITEM 2. | Properties. |
As of January 30, 2010, we operated 907 retail stores in 46 states, the District of Columbia and Puerto Rico, all of which were leased. Store leases typically provide for initial terms of ten years, although some leases have shorter or longer initial periods. Some of the leases grant us the right to extend the term for one or two additional five-year periods. Some leases also contain early termination options, which can be exercised by us under specific conditions. Most of the store leases require us to pay a specified minimum rent, plus a contingent rent based on a percentage of the store's net sales in excess of a specified threshold. Most of the leases also require us to pay real estate taxes, insurance and certain common area and maintenance costs. The current terms of our leases expire as follows:
| Fiscal Years Lease Terms Expire |
Number of Stores | |
| 2010 - 2012 |
347 | |
| 2013 - 2015 |
285 | |
| 2016 - 2018 |
258 | |
| 2019 and later |
17 |
We lease our corporate offices at 7 Times Square in New York City (approximately 297,000 square feet) under a lease expiring in 2020. In addition, in Milford, Connecticut, we maintain 42,000 square feet of office space under a lease which expires in 2019 and an additional 15,000 square feet of office space under a lease which expires in March 2010.
The Company’s wholly owned subsidiary, AnnTaylor Distribution Services, Inc., owns our 256,000 square foot distribution center located in Louisville, Kentucky. The distribution center is located on approximately 27 acres, which could accommodate possible future expansion of the facility. Nearly all our merchandise is distributed to stores through this facility.
| ITEM 3. | Legal Proceedings. |
We are subject to various legal proceedings and claims that arise in the ordinary course of our business. Although the amount of any liability that could arise with respect to these actions cannot be determined with certainty, in our opinion, any such liability will not have a material adverse effect on our consolidated financial position, consolidated results of operations or liquidity.
| ITEM 4. | (Removed and Reserved). |
14
Table of Contents
| ITEM 5. | Market for the Registrant’s Common Equity, Related Stockholder Matters and Issuer Purchases of Equity Securities. |
Our common stock is listed and traded on the New York Stock Exchange under the symbol “ANN”. The number of holders of record of common stock at February 26, 2010 was 607. The following table sets forth the high and low sale prices per share of the common stock on the New York Stock Exchange for the periods indicated:
| Market Price | ||||||
| High | Low | |||||
| Fiscal Year 2009 |
||||||
| Fourth quarter |
$ | 16.26 | $ | 11.59 | ||
| Third quarter |
17.50 | 11.41 | ||||
| Second quarter |
12.26 | 6.33 | ||||
| First quarter |
7.58 | 2.41 | ||||
| Fiscal Year 2008 |
||||||
| Fourth quarter |
$ | 12.88 | $ | 3.74 | ||
| Third quarter |
27.55 | 11.45 | ||||
| Second quarter |
29.23 | 20.13 | ||||
| First quarter |
26.56 | 20.98 | ||||
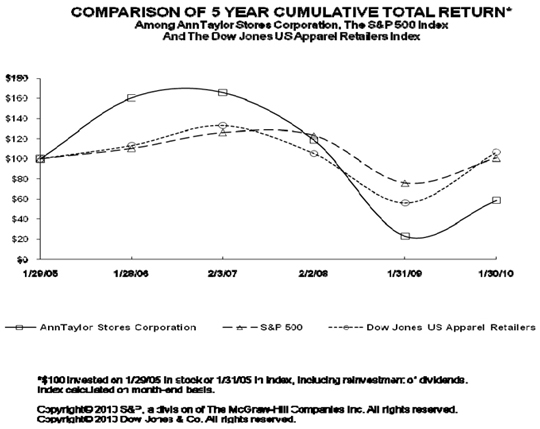
STOCK PERFORMANCE GRAPH
The following graph compares the percentage changes in the cumulative total stockholder return on the Company’s Common Stock for the five-year period ended January 30, 2010, with the cumulative total return on the Standard & Poor’s 500 Stock Index (“S&P 500”) and the Dow Jones U.S. Retailers, Apparel Index for the same period. In accordance with the rules of the SEC, the returns are indexed to a value of $100 at January 28, 2005 and assume that all dividends, if any, were reinvested. This performance graph shall not be deemed “filed” for purposes of Section 18 of the Securities Exchange Act of 1934, as amended, or otherwise subject to the liabilities under that Section, and shall not be deemed to be incorporated by reference into any filing of the Company under the Securities Act of 1933, as amended, or the Exchange Act.
15
Table of Contents
We have never paid cash dividends on our common stock. Any determination to pay cash dividends is at the discretion of our Board of Directors, which considers it on a periodic basis. In addition, as a holding company, our ability to pay dividends is dependent upon the receipt of dividends or other payments from our subsidiaries, including our wholly owned subsidiary AnnTaylor, Inc. The payment of dividends by AnnTaylor, Inc. to us is subject to certain restrictions under its $250 million Third Amended and Restated Credit Agreement (the “Credit Facility”). We are also subject to certain restrictions contained in the Credit Facility on the payment of cash dividends on our common stock. See “Management’s Discussion and Analysis of Financial Condition and Results of Operations - Liquidity and Capital Resources”.
The following table sets forth information concerning purchases of our common stock for the periods indicated which upon repurchase are classified as treasury shares available for general corporate purposes:
| Total Number of Shares Purchased (1) |
Average Price Paid Per Share |
Total Number of Shares Purchased as Part of Publicly Announced Program (2) |
Approximate Dollar Value of Shares that May Yet Be Purchased Under Publicly Announced Program | |||||||
| (in thousands) | ||||||||||
| November 1, 2009 to November 28, 2009 |
7,599 | $ | 13.89 | — | $ | 159,083 | ||||
| November 29, 2009 to January 2, 2010 |
914 | 14.34 | — | 159,083 | ||||||
| January 3, 2010 to January 30, 2010 |
1,208 | 13.06 | — | 159,083 | ||||||
| 9,721 | — | |||||||||
| (1) | These shares represent restricted stock repurchased in connection with employee tax withholding obligations under employee compensation plans, which are not purchases under our publicly announced program. |
| (2) | The $300 million securities repurchase program approved by our Board of Directors on August 23, 2007 will expire when the Company has repurchased all securities authorized for repurchase thereunder, unless terminated earlier by resolution of the Board of Directors. There were no shares purchased under this program during the fourth quarter of Fiscal 2009. |
16
Table of Contents
| ITEM 6. | Selected Financial Data. |
The following historical Consolidated Statements of Operations and Consolidated Balance Sheet information has been derived from our audited consolidated financial statements. The information set forth below should be read in conjunction with “Management’s Discussion and Analysis of Financial Condition and Results of Operations” and the consolidated financial statements and notes thereto included elsewhere in this document. All references to years are to our fiscal year, which ends on the Saturday nearest January 31 in the following calendar year. All fiscal years for which financial information is set forth below contain 52 weeks, except for the fiscal year ended February 3, 2007, which includes 53 weeks.
| Fiscal Years Ended | ||||||||||||||||||||
| January 30, 2010 |
January 31, 2009 |
February 2, 2008 |
February 3, 2007 |
January 28, 2006 |
||||||||||||||||
| (in thousands, except per share, per square foot and number of stores data) | ||||||||||||||||||||
| Consolidated Statements of Operations Information: |
||||||||||||||||||||
| Net sales |
$ | 1,828,523 | $ | 2,194,559 | $ | 2,396,510 | $ | 2,342,907 | $ | 2,073,146 | ||||||||||
| Cost of sales |
834,188 | 1,139,753 | 1,145,246 | 1,085,897 | 1,017,122 | |||||||||||||||
| Gross margin |
994,335 | 1,054,806 | 1,251,264 | 1,257,010 | 1,056,024 | |||||||||||||||
| Selling, general and administrative expenses |
966,603 | 1,050,560 | 1,061,869 | 1,031,341 | 924,998 | |||||||||||||||
| Restructuring charges |
36,368 | 59,714 | 32,255 | — | — | |||||||||||||||
| Asset impairment charges |
15,318 | 29,590 | 1,754 | 1,832 | — | |||||||||||||||
| Goodwill impairment charge |
— | 286,579 | — | — | — | |||||||||||||||
| Operating (loss)/income |
(23,954 | ) | (371,637 | ) | 155,386 | 223,837 | 131,026 | |||||||||||||
| Interest income |
935 | 1,677 | 7,826 | 17,174 | 9,318 | |||||||||||||||
| Interest expense (1) |
3,091 | 1,462 | 2,172 | 2,230 | 2,083 | |||||||||||||||
| (Loss)/income before income taxes |
(26,110 | ) | (371,422 | ) | 161,040 | 238,781 | 138,261 | |||||||||||||
| Income tax (benefit)/provision |
(7,902 | ) | (37,516 | ) | 63,805 | 95,799 | 56,389 | |||||||||||||
| Net (loss)/income |
$ | (18,208 | ) | $ | (333,906 | ) | $ | 97,235 | $ | 142,982 | $ | 81,872 | ||||||||
| Basic (loss)/earnings per share (2) |
$ | (0.32 | ) | $ | (5.82 | ) | $ | 1.52 | $ | 1.98 | $ | 1.13 | ||||||||
| Diluted (loss)/earnings per share (2) |
$ | (0.32 | ) | $ | (5.82 | ) | $ | 1.51 | $ | 1.96 | $ | 1.12 | ||||||||
| Weighted average shares outstanding |
56,782 | 57,366 | 62,753 | 70,993 | 71,554 | |||||||||||||||
| Weighted average shares outstanding, assuming dilution |
56,782 | 57,366 | 63,212 | 71,721 | 71,991 | |||||||||||||||
| Consolidated Operating Information: |
||||||||||||||||||||
| Percentage (decrease)/increase in comparable store sales (3) |
(17.8 | )% | (14.8 | )% | (3.3 | )% | 2.8 | % | 0.1 | % | ||||||||||
| Net sales per square foot (4) |
$ | 337 | $ | 402 | $ | 457 | $ | 474 | $ | 461 | ||||||||||
| Number of stores: |
||||||||||||||||||||
| Open at beginning of period |
935 | 929 | 869 | 824 | 738 | |||||||||||||||
| Opened during the period |
14 | 66 | 77 | 70 | 97 | |||||||||||||||
| Closed during the period |
42 | 60 | 17 | 25 | 11 | |||||||||||||||
| Open at the end of the period |
907 | 935 | 929 | 869 | 824 | |||||||||||||||
| Expanded during the period |
1 | 8 | 14 | 16 | 12 | |||||||||||||||
| Total store square footage at end of period |
5,348 | 5,492 | 5,410 | 5,079 | 4,801 | |||||||||||||||
| Capital expenditures (5) |
$ | 35,736 | $ | 100,195 | $ | 145,852 | $ | 165,129 | $ | 174,895 | ||||||||||
| Depreciation and amortization |
$ | 104,351 | $ | 122,222 | $ | 116,804 | $ | 105,890 | $ | 93,786 | ||||||||||
| Working capital turnover (6) |
10.5 | x | 14.0 | x | 8.2 | x | 5.8 | x | 5.4 | x | ||||||||||
| Inventory turnover (7) |
4.9 | x | 5.4 | x | 4.7 | x | 5.0 | x | 4.7 | x | ||||||||||
| Consolidated Balance Sheet Information: |
||||||||||||||||||||
| Working capital |
$ | 229,521 | $ | 118,013 | $ | 195,015 | $ | 391,187 | $ | 418,626 | ||||||||||
| Goodwill, net |
— | — | 286,579 | 286,579 | 286,579 | |||||||||||||||
| Total assets |
902,141 | 960,439 | 1,393,755 | 1,568,503 | 1,492,906 | |||||||||||||||
| Total debt |
2,642 | 7,039 | — | — | — | |||||||||||||||
| Total stockholders’ equity |
417,186 | 416,512 | 839,484 | 1,049,911 | 1,034,482 | |||||||||||||||
(Footnotes on following page)
17
Table of Contents
(Footnotes for preceding page)
| (1) | Includes non-cash interest expense of approximately $0.4 million, $0.4 million, $0.4 million, $0.5 million and $0.8 million, in Fiscal 2009, 2008, 2007, 2006 and 2005, respectively, primarily from amortization of deferred financing costs. See “Management’s Discussion and Analysis of Financial Condition and Results of Operations – Liquidity and Capital Resources”. |
| (2) | The Company adopted amendments to Accounting Standards Codification (“ASC”) 260-10 on February 1, 2009, which impacted the determination and reporting of earnings per share by requiring the inclusion of restricted stock and performance restricted stock as participating securities, since they have the right to share in dividends, if declared, equally with common shareholders. During periods of net income, participating securities are allocated a proportional share of net income determined by dividing total weighted average participating securities by the sum of total weighted average common shares and participating securities (“the two-class method”). During periods of net loss, no effect is given to the participating securities because they do not share in the losses of the Company. Including these shares in the Company’s earnings per share calculation during periods of net income has the effect of diluting both basic and diluted earnings per share. As a result of adopting the amendments to ASC 260-10, prior period basic and diluted shares outstanding, as well as the related per share amounts presented in the preceding table, have been adjusted retroactively. |
The retroactive application of the two-class method resulted in a change to previously reported basic earnings per share for Fiscal 2007, Fiscal 2006, and Fiscal 2005, from $1.55 to $1.52, $2.01 to $1.98, and $1.14 to $1.13, respectively. There was no change to previously reported basic earnings per share for Fiscal 2008 due to the net loss for the period.
The retroactive application of the two-class method resulted in a change to previously reported diluted earnings per share for Fiscal 2007, Fiscal 2006, and Fiscal 2005, from $1.53 to $1.51, $1.98 to $1.96, and $1.13 to $1.12, respectively. There was no change to previously reported diluted earnings per share for Fiscal 2008 due to the net loss for the period.
| (3) | A store is included in comparable store sales in its thirteenth month of operation. A store with a square footage change of more than 15% is treated as a new store for the first year following its reopening. In addition, in a year with 53 weeks, sales in the last week of that year are excluded from comparable store sales. |
| (4) | Net sales per square foot is determined by dividing net sales for the period by the average of the total store square footage at the beginning and end of each period. Unless otherwise indicated, references herein to square footage are to gross square feet, rather than net selling space. |
| (5) | Capital expenditures are accounted for on the accrual basis and include net non-cash transactions totaling $(2.8) million, $(10.1) million, $5.9 million, $(0.8) million and $(14.3) million in Fiscal 2009, 2008, 2007, 2006 and 2005, respectively. The non-cash transactions are primarily related to the purchase of property and equipment on account. |
| (6) | Working capital turnover is determined by dividing net sales by the average of the amount of working capital at the beginning and end of the period. |
| (7) | Inventory turnover is determined by dividing cost of sales by the average of the cost of inventory at the beginning and end of the period. |
18
Table of Contents
| ITEM 7. | Management’s Discussion and Analysis of Financial Condition and Results of Operations. |
The following discussion and analysis should be read together with our consolidated financial statements and related notes thereto included elsewhere in this Annual Report on Form 10-K.
Management Overview
Fiscal 2009 remained challenging from a macroeconomic perspective for the overall retail industry and for our business. The impact of the recession that began in late 2007 continued through most of 2009, resulting in record unemployment and a soft consumer spending environment throughout the year. In anticipation of continued pressure on the economy, we entered Fiscal 2009 with a clear and decisive strategy to re-energize our brands, maximize gross margin performance, maintain a healthy balance sheet and cash position, and further reduce our cost structure through continued execution of our multi-year strategic restructuring program. As a result, our performance over the course of the year improved as these strategies gained traction, underscoring that we had planned appropriately. We ended Fiscal 2009 with a more compelling and relevant product assortment at both brands and a more efficient and streamlined operation with the ability to better leverage sales in Fiscal 2010 and beyond.
Our 2009 focus on maximizing gross margin performance was enabled by a conservative and disciplined approach to inventory management as well as promotional activity that was more focused than the prior year. Our promotional strategy was further supported by more effective product planning for the Fall season, which allowed us to be more selective in the timing and breadth of promotions as compared with Fall 2008. We successfully managed our inventory levels throughout the year, and ended Fiscal 2009 with total inventory per square foot flat versus year-end Fiscal 2008, which was down 32% from the end of Fiscal 2007.
We continued to make progress on our multi-year strategic restructuring program, which was first announced in January 2008, and under which we expect to generate approximately $125 million in ongoing annualized cost savings by the end of Fiscal 2010. In Fiscal 2009, we realized approximately $65 million in incremental restructuring program savings at a cost of approximately $36 million. We were also focused on preserving cash, and ended the year with approximately $204 million in cash and cash equivalents. Early in Fiscal 2009, we borrowed $125 million from our Credit Facility as a precaution against potential disruption in the credit markets, which we paid down in full by the end of the third quarter. We ended the year with no borrowings under our Credit Facility.
We experienced a net loss of $18.2 million in Fiscal 2009. Excluding $25.3 million in after-tax restructuring costs and an additional $10.7 million in after-tax store asset impairment charges, we achieved net income of $17.8 million. We believe that adjusted net income is a better representation of our ongoing business operations, since it removes the impact of restructuring program costs and other non-cash impairment charges.
Business conditions at the Ann Taylor division at the beginning of Fiscal 2009 were challenging, but improved significantly in the latter half of the year. From a product perspective, the Spring 2009 merchandise assortment did not yet reflect the modern look and versatility that our clients desired. Following the introduction of the “new” Ann Taylor product in the Fall 2009 season combined with a more expansive marketing plan, comparable store sales trends improved notably as the season progressed, particularly in the fourth quarter. For the year, net sales declined 33.8%, with comparable store sales down 30.0%. Ann Taylor delivered solid gross margin performance for the year, due to a lean inventory position and the introduction of better product in the back half of Fiscal 2009, both of which supported lower promotional levels in 2009 versus 2008. Although Ann Taylor ended the year with total inventory per square foot up approximately 13%, this was reflective of earlier delivery of Spring product compared with the prior year. Looking ahead, Ann Taylor is expected to continue to evolve and build on the progress made in 2009 to enhance its brand positioning as a modern, chic and sophisticated destination for women.
At LOFT, the brand was increasingly successful as the year progressed, with merchandise assortments that featured compelling fashion that was casual, feminine and stylish, all at surprising prices. Net sales for Fiscal 2009 declined 13.6% versus Fiscal 2008, reflecting a 12.7% decline in comparable store sales. Sales trends improved each quarter throughout the year, and LOFT ended the year with a 2.1% increase in comparable store sales in the fourth quarter of Fiscal 2009, which reflected better product and the impact of enhanced marketing plans. Gross margin was strong for the year, supported by lower inventory levels and lower levels of promotional activity compared with Fiscal 2008. LOFT’s year-end 2009 inventory per square foot increased approximately 6%, reflecting the earlier delivery of Spring goods and following a 37% decrease in inventory per square foot at the end of Fiscal 2008.
19
Table of Contents
Sales in the online and factory channels during the fourth quarter were constrained by light inventories. Despite this, these businesses delivered successfully against our Fiscal 2009 strategy, and generated strong gross margin performance. We increased online and Factory inventory levels at the beginning of Fiscal 2010 as part of our strategy to support top-line growth.
Looking ahead to Fiscal 2010, we are pursuing a strategy for sales growth by: continuing the progress being made at the Ann Taylor brand; investing in our LOFT brand through store growth for both LOFT and LOFT Outlet; growing our online businesses by committing greater resources to both brands; and continuing to elevate the client experience across all of our brands and channels. In addition, we expect to continue to execute against our strategic restructuring program, apply a disciplined approach to inventory, and ensure that our balance sheet and cash position remain strong.
20
Table of Contents
Key Performance Indicators
In evaluating our performance, senior management reviews certain key performance indicators, including:
| • | Comparable store sales – Comparable store sales provide a measure of existing store sales performance. A store is included in comparable store sales in its thirteenth month of operation. A store with a square footage change of more than 15% is treated as a new store for the first year following its reopening. |
| • | Gross margin – Gross margin measures our ability to control the direct costs of merchandise sold during the period. Gross margin is the difference between net sales and cost of sales, which is comprised of direct inventory costs for merchandise sold, including all costs to transport merchandise from third-party suppliers to our distribution center. Buying and occupancy costs are excluded from cost of sales. |
| • | Operating income – Because retailers do not uniformly record supply chain costs as a component of cost of sales or selling, general and administrative expenses, operating income allows us to benchmark our performance relative to other retailers. Operating income represents earnings before interest and income taxes and measures our earnings power from ongoing operations. |
| • | Store productivity – Store productivity, including sales per square foot, average unit retail price (AUR), units per transaction (UPT), dollars per transaction (DPT), traffic and conversion, is evaluated by management in assessing our operating performance. |
| • | Inventory turnover – Inventory turnover measures our ability to sell our merchandise and how many times it is replaced over time. This ratio is important in determining the need for markdowns, planning future inventory levels and assessing client response to our merchandise. |
| • | Quality of merchandise offerings – To monitor and maintain client acceptance of our merchandise offerings, we monitor sell-through levels, inventory turnover, gross margin, returns and markdown rates at a class and style level. This analysis helps identify merchandise issues at an early date and helps us plan future product development and buying. |
Results of Operations
The following table sets forth data from our Consolidated Statements of Operations expressed as a percentage of net sales. All fiscal years presented contain 52 weeks:
| Fiscal Years Ended | |||||||||
| January 30, 2010 |
January 31, 2009 |
February 2, 2008 |
|||||||
| Net sales |
100.0 | % | 100.0 | % | 100.0 | % | |||
| Cost of sales |
45.6 | 51.9 | 47.8 | ||||||
| Gross margin |
54.4 | 48.1 | 52.2 | ||||||
| Selling, general and administrative expenses |
52.9 | 47.8 | 44.3 | ||||||
| Restructuring |
2.0 | 2.7 | 1.3 | ||||||
| Asset impairment charges |
0.8 | 1.4 | 0.1 | ||||||
| Goodwill impairment charge |
0.0 | 13.1 | 0.0 | ||||||
| Operating (loss)/income |
(1.3 | ) | (16.9 | ) | 6.5 | ||||
| Interest income |
0.1 | 0.1 | 0.3 | ||||||
| Interest expense |
0.2 | 0.1 | 0.1 | ||||||
| (Loss)/income before income taxes |
(1.4 | ) | (16.9 | ) | 6.7 | ||||
| Income tax (benefit)/provision |
(0.4 | ) | (1.7 | ) | 2.6 | ||||
| Net (loss)/income |
(1.0 | )% | (15.2 | )% | 4.1 | % | |||
21
Table of Contents
The following table sets forth selected data from our Consolidated Statements of Operations expressed as a percentage change from the prior period. All fiscal years presented contain 52 weeks:
| Fiscal Years Ended | |||||||||
| January 30, 2010 |
January 31, 2009 |
February 2, 2008 |
|||||||
| increase (decrease) | |||||||||
| Net sales |
(16.7 | )% | (8.4 | )% | 2.3 | % | |||
| Operating (loss)/income |
(93.6 | )% | (339.2 | )% | (30.6 | )% | |||
| Net (loss)/income |
(94.5 | )% | (443.4 | )% | (32.0 | )% | |||
Sales and Store Data
The following table sets forth certain sales and store data for Fiscal 2009, 2008 and 2007. All fiscal years presented contain 52 weeks:
| Fiscal Years Ended | ||||||||||||
| January 30, 2010 |
January 31, 2009 |
February 2, 2008 |
||||||||||
| Net sales (in thousands) |
||||||||||||
| Total Company |
$ | 1,828,523 | $ | 2,194,559 | $ | 2,396,510 | ||||||
| Ann Taylor |
456,579 | 689,183 | 866,555 | |||||||||
| LOFT |
939,909 | 1,088,376 | 1,174,401 | |||||||||
| Comparable store sales percentage (decrease)/increase (1) |
||||||||||||
| Total Company |
(17.8 | )% | (14.8 | )% | (3.3 | )% | ||||||
| Ann Taylor |
(30.0 | )% | (19.9 | )% | (3.7 | )% | ||||||
| LOFT |
(12.7 | )% | (11.4 | )% | (5.4 | )% | ||||||
| Average dollars per transaction |
||||||||||||
| Total Company |
$ | 65.09 | $ | 69.03 | $ | 75.28 | ||||||
| Ann Taylor |
71.82 | 79.39 | 90.03 | |||||||||
| LOFT |
59.28 | 61.93 | 67.49 | |||||||||
| Average units per transaction |
||||||||||||
| Total Company |
2.36 | 2.39 | 2.34 | |||||||||
| Ann Taylor |
1.88 | 2.08 | 2.02 | |||||||||
| LOFT |
2.40 | 2.41 | 2.41 | |||||||||
| Average unit retail sold |
||||||||||||
| Total Company |
$ | 27.58 | $ | 28.88 | $ | 32.17 | ||||||
| Ann Taylor |
38.20 | 38.17 | 44.57 | |||||||||
| LOFT |
24.70 | 25.70 | 28.00 | |||||||||
| Net sales per average gross square foot (2) |
||||||||||||
| Total Company |
$ | 337 | $ | 402 | $ | 457 | ||||||
| Ann Taylor |
276 | 384 | 465 | |||||||||
| LOFT |
314 | 360 | 406 | |||||||||
22
Table of Contents
Sales and Store Data (Continued)
| Fiscal Years Ended | ||||||
| January 30, 2010 |
January 31, 2009 |
February 2, 2008 | ||||
| Total store square footage at end of period (in thousands) (2) |
||||||
| Total Company |
5,348 | 5,492 | 5,410 | |||
| Ann Taylor |
1,581 | 1,724 | 1,866 | |||
| LOFT |
2,976 | 3,010 | 3,030 | |||
| Ann Taylor Factory/LOFT Outlet |
791 | 758 | 514 | |||
| Number of: |
||||||
| Stores open at beginning of period |
935 | 929 | 869 | |||
| New stores |
14 | 66 | 77 | |||
| Closed stores |
42 | 60 | 17 | |||
| Stores open at end of period |
907 | 935 | 929 | |||
| Expanded stores |
1 | 8 | 14 | |||
| Converted stores (3) |
11 | — | — | |||
|
|
||||||
| (1) | A store is included in comparable store sales in its thirteenth month of operation. A store with a square footage change of more than 15% is treated as a new store for the first year following its reopening. |
| (2) | Net sales per average gross square foot is determined by dividing net sales for the period by the average of the gross square feet at the beginning and end of each period. Unless otherwise indicated, references herein to square feet are to gross square feet, rather than net selling space. |
| (3) | During Fiscal 2009, we converted 11 Ann Taylor stores to LOFT stores. |
Net sales decreased approximately $366.0 million, or 16.7%, in Fiscal 2009 as compared to Fiscal 2008. The decrease in net sales was primarily due to lower traffic and fewer stores due to store closings under our strategic restructuring program, combined with lower DPTs across both brands as well as lower AURs at LOFT. These results reflect the continued effect of the recessionary environment and its impact on discretionary retail spending, particularly for women’s specialty retailers, as well as product misses at Ann Taylor during the spring season. The decrease in net sales was also consistent with the decrease in comparable store sales in Fiscal 2009 as compared to Fiscal 2008. By division, net sales at Ann Taylor decreased 33.8% to $456.6 million in Fiscal 2009 as compared to net sales of $689.2 million in Fiscal 2008. At LOFT, net sales decreased 13.6% to $939.9 million in Fiscal 2009, as compared to net sales of $1,088.4 million in Fiscal 2008.
Net sales decreased approximately $201.9 million, or 8.4%, in Fiscal 2008 as compared to Fiscal 2007. Although UPTs rose slightly overall, DPTs decreased primarily due to lower AURs resulting from higher discounting, particularly in the fourth quarter, as compared to the prior year. Comparable store sales were also negatively impacted by lower AURs, due to the continued promotional stance we took during Fiscal 2008. These decreases were consistent with both lower traffic and with the impact of the recessionary environment, which was particularly evident in the fourth quarter across all divisions. By division, net sales at Ann Taylor decreased 20.5% to $689.2 million in Fiscal 2008 as compared to net sales of $866.6 million in Fiscal 2007. At LOFT, net sales decreased 7.3% to $1,088.4 million in Fiscal 2008, as compared to net sales of $1,174.4 million in Fiscal 2007.
Our net sales do not show significant seasonal variation. As a result, we have not had significant overhead and other costs generally associated with large seasonal variations.
Cost of Sales and Gross Margin
Because retailers do not uniformly record supply chain costs as cost of sales or selling, general and administrative expenses, our gross margin and selling, general and administrative expenses as a percentage of net sales may not be comparable to certain other retailers. For additional information regarding costs classified in cost of sales and selling, general and administrative expenses, refer to Note 1, “Summary of Significant Accounting Policies”, in the Notes to Consolidated Financial Statements.
23
Table of Contents
The following table presents cost of sales and gross margin in dollars and the related gross margin percentages for Fiscal 2009, 2008 and 2007. All fiscal years presented contain 52 weeks:
| Fiscal Years Ended | ||||||||||||
| January 30, 2010 |
January 31, 2009 |
February 2, 2008 |
||||||||||
| (dollars in thousands) | ||||||||||||
| Cost of sales |
$ | 834,188 | $ | 1,139,753 | $ | 1,145,246 | ||||||
| Gross margin |
$ | 994,335 | $ | 1,054,806 | $ | 1,251,264 | ||||||
| Percentage of net sales |
54.4 | % | 48.1 | % | 52.2 | % | ||||||
The increase in gross margin as a percentage of net sales in Fiscal 2009 as compared to Fiscal 2008 primarily reflected higher full price sales as a percentage of total sales and higher margin rates achieved, particularly on full price sales, due to the impact of lower planned inventory levels and less promotional activity as compared to Fiscal 2008, particularly during the fall season.
The decline in gross margin as a percentage of net sales in Fiscal 2008 as compared to Fiscal 2007 was due to lower merchandise margins, particularly on non-full price sales in the fourth quarter, primarily due to more extensive markdowns than anticipated in an effort to clear through inventories.
Selling, General and Administrative Expenses
The following table presents selling, general and administrative expenses in dollars and as a percentage of net sales for Fiscal 2009, 2008 and, 2007:
| Fiscal Years Ended | ||||||||||||
| January 30, 2010 |
January 31, 2009 |
February 2, 2008 |
||||||||||
| (dollars in thousands) | ||||||||||||
| Selling, general and administrative expenses |
$ | 966,603 | $ | 1,050,560 | $ | 1,061,869 | ||||||
| Percentage of net sales |
52.9 | % | 47.8 | % | 44.3 | % | ||||||
Selling, general and administrative expenses in Fiscal 2009 decreased approximately $84 million compared to Fiscal 2008, primarily reflecting the benefit of our restructuring program and cost savings initiatives, with the majority of the savings being payroll and tenancy related, partially offset by an increase in performance-based compensation expense. The increase in selling, general and administrative expenses as a percentage of net sales in Fiscal 2009 compared to Fiscal 2008 was primarily due to the impact of fixed cost deleveraging resulting from lower net sales, as well as an increase in performance-based compensation expense, partially offset by tenancy cost savings associated with store closings under our strategic restructuring program.
The increase in selling, general and administrative expenses as a percentage of net sales in Fiscal 2008 compared to Fiscal 2007 was primarily due to the impact of fixed cost deleveraging resulting from lower net sales as well as higher performance-based compensation costs incurred in the first half of the year, which offset the benefits of our restructuring cost savings on a percent of net sales basis.
We adopted amendments to ASC 718-10, Compensation – Stock Compensation, in Fiscal 2006 and have since recorded stock-based compensation expense under the fair value method. For the fiscal years ended January 30, 2010, January 31, 2009 and February 2, 2008, we recorded $16.1 million, $12.6 million and $19.0 million, respectively, of stock-based compensation expense. Stock-based compensation in Fiscal 2009 increased compared to Fiscal 2008 due to the impact of a shorter vesting period for Fiscal 2009 grants compared to Fiscal 2008 grants, and due to the achievement of Fiscal 2009 performance targets related to performance restricted stock awards, whereas such performance targets were not achieved in Fiscal 2008. This stock-based compensation expense is included on the same income statement line as the cash compensation paid to the recipient of the stock-based award. See Note 8, “Equity and Stock Incentive Plans” in the Notes to Consolidated Financial Statements for further discussion.
24
Table of Contents
Restructuring Charges
The following table presents the restructuring charges in dollars and as a percentage of net sales for Fiscal 2009, 2008 and 2007:
| Fiscal Years Ended | ||||||||||||
| January 30, 2010 |
January 31, 2009 |
February 2, 2008 |
||||||||||
| (dollars in thousands) | ||||||||||||
| Restructuring charges |
$ | 36,368 | $ | 59,714 | $ | 32,255 | ||||||
| Percentage of net sales |
2.0 | % | 2.7 | % | 1.3 | % | ||||||
In Fiscal 2009 and Fiscal 2008 we announced additional actions related to the multi-year, strategic, restructuring program we initiated in Fiscal 2007, which were designed to further enhance profitability and improve overall operating effectiveness. In Fiscal 2009, Fiscal 2008 and Fiscal 2007, we recorded $36.4 million, $59.7 million and $32.3 million, respectively, in restructuring charges. We expect total pre-tax charges associated with our restructuring program to be in the range of $130 to $140 million. See “Liquidity and Capital Resources” for further discussion.
Asset Impairment Charges
The following table presents asset impairment charges in dollars and as a percentage of net sales for Fiscal 2009, 2008 and 2007:
| Fiscal Years Ended | ||||||||||||
| January 30, 2010 |
January 31, 2009 |
February 2, 2008 |
||||||||||
| (dollars in thousands) | ||||||||||||
| Asset impairment charges |
$ | 15,318 | $ | 29,590 | $ | 1,754 | ||||||
| Percentage of net sales |
0.8 | % | 1.4 | % | 0.1 | % | ||||||
In Fiscal 2009, we recorded $15.3 million in non-cash store asset impairment charges related to stores that we expect to continue operating, based on our projected undiscounted future cash flows. These non-cash store asset impairment charges related to the impairment of assets at 65 stores, and were calculated using certain assumptions, including estimates related to future comparable store sales and gross margin rates. A 5% increase or decrease in projected comparable store sales combined with a respective 2% increase or decrease in projected gross margin rates, and the resulting impact to future period projected profitability, would result in an increase or decrease in the asset impairment charges of approximately $4.0 million.
25
Table of Contents
Goodwill Impairment Charge
The following table reflects goodwill impairment charges in dollars and as a percentage of net sales for Fiscal 2009, 2008 and 2007:
| Fiscal Years Ended | ||||||||||||
| January 30, 2010 |
January 31, 2009 |
February 2, 2008 |
||||||||||
| (dollars in thousands) | ||||||||||||
| Goodwill impairment charge |
$ | — | $ | 286,579 | $ | — | ||||||
| Percentage of net sales |
— | % | 13.1 | % | — | % | ||||||
We have three reporting units, as defined under ASC 350-10, Intangibles – Goodwill and Other, including Ann Taylor, LOFT and Ann Taylor Factory/LOFT Outlet stores. A reporting unit is defined as an operating segment or one level below an operating segment. Our reporting units are equivalent to our operating segments, as only limited discrete financial information is available for the separate components of the segment, and all of the components of the segments have similar economic characteristics. Although we have three operating segments, they have been aggregated into a single operating segment for segment reporting purposes, in accordance with ASC 280-10, Segment Reporting. The $286.6 million in recorded goodwill during Fiscal 2008 resided under our Ann Taylor reporting unit. The deterioration in the financial and credit markets significantly impacted our Fiscal 2008 fourth quarter business, and caused us to revise our forward-looking business projections downward. These updated projections were used to perform our annual test for goodwill impairment during the fourth quarter of Fiscal 2008, and, as a result, the full amount of recorded goodwill was written off at that time.
Depreciation and Amortization
The following table presents depreciation and amortization expense in dollars and as a percentage of net sales for Fiscal 2009, 2008 and 2007:
| Fiscal Years Ended | ||||||||||||
| January 30, 2010 |
January 31, 2009 |
February 2, 2008 |
||||||||||
| (dollars in thousands) | ||||||||||||
| Depreciation and amortization |
$ | 104,351 | $ | 122,222 | $ | 116,804 | ||||||
| Percentage of net sales |
5.7 | % | 5.6 | % | 4.9 | % | ||||||
The decrease in depreciation and amortization expense in Fiscal 2009 as compared to Fiscal 2008 was due to lower average capital balances in Fiscal 2009 as compared to Fiscal 2008, driven by a reduction in average store count year over year, an approximate $64 million decrease in capital spending year over year, the acceleration of depreciation in Fiscal 2008 relating to our restructuring program store closings, and the impact on depreciation expense of store asset impairment charges in both fiscal years.
The increase in depreciation and amortization expense in Fiscal 2008 as compared to Fiscal 2007 was primarily due to capital expenditures related to new, remodeled and expanded stores and accelerated depreciation relating to our restructuring program store closings.
26
Table of Contents
Interest Income
The following table presents interest income in dollars and as a percentage of net sales for Fiscal 2009, 2008 and 2007:
| Fiscal Years Ended | ||||||||||||
| January 30, 2010 |
January 31, 2009 |
February 2, 2008 |
||||||||||
| (dollars in thousands) | ||||||||||||
| Interest income |
$ | 935 | $ | 1,677 | $ | 7,826 | ||||||
| Percentage of net sales |
0.1 | % | 0.1 | % | 0.3 | % | ||||||
Interest income decreased in Fiscal 2009 as compared to Fiscal 2008 due to lower interest rates over the past year, partially offset by higher average cash balances largely due to our borrowings under our Credit Facility.
Interest income decreased in Fiscal 2008 as compared to Fiscal 2007 due primarily to lower cash balances as a result of our stock repurchase activity, less cash provided by operating activities and lower interest rates in Fiscal 2008 compared to Fiscal 2007.
Interest Expense
The following table presents interest expense in dollars and as a percentage of net sales for Fiscal 2009, 2008 and 2007:
| Fiscal Years Ended | ||||||||||||
| January 30, 2010 |
January 31, 2009 |
February 2, 2008 |
||||||||||
| (dollars in thousands) | ||||||||||||
| Interest expense |
$ | 3,091 | $ | 1,462 | $ | 2,172 | ||||||
| Percentage of net sales |
0.2 | % | 0.1 | % | 0.1 | % | ||||||
Interest expense includes various charges, the largest of which are interest and fees related to our Credit Facility. In March 2009, we accessed $125 million from our Credit Facility as a precaution against potential disruption in the credit markets, in the event we would need access to cash to meet seasonal working capital requirements. In July 2009, we repaid $50 million of these revolver borrowings, and subsequently repaid the remaining $75 million in October 2009. The increase in interest expense in Fiscal 2009 compared to Fiscal 2008 is mainly driven by interest on borrowings under our Credit Facility from March 2009 to October 2009, as there were no borrowings under the Credit Facility during Fiscal 2008. See “Liquidity and Capital Resources” and Note 5, “Debt and Capital Leases” in the Notes to Consolidated Financial Statements for further discussion of our Credit Facility.
Income Taxes
The following table presents our effective income tax rate for Fiscal 2009, 2008 and 2007:
| Fiscal Years Ended | |||||||||
| January 30, 2010 |
January 31, 2009 |
February 2, 2008 |
|||||||
| (dollars in thousands) | |||||||||
| Effective income tax rate |
30.3 | % | 10.1 | % | 39.6 | % | |||
Our effective income tax rate increased in Fiscal 2009 as compared to Fiscal 2008 primarily due to the impact that goodwill impairment had on our Fiscal 2008 effective tax rate, since the majority of the goodwill impairment charge was not deductible for tax purposes. Excluding the effect this had on the Fiscal 2008 effective tax rate, our effective tax rate in Fiscal 2009 would have been comparatively higher than Fiscal 2008 due to a decrease in non-deductible executive compensation expense in Fiscal 2009 as compared to Fiscal 2008.
The decrease in our effective income tax rate in Fiscal 2008 as compared to Fiscal 2007 was primarily due to the impact of goodwill impairment, the majority of which is not deductible for tax purposes, and to a lesser extent, state income tax refunds and settlements and the reversal of a reserve recorded in the fourth quarter of Fiscal 2007 for non-deductible executive compensation resulting from an IRS ruling in the first quarter of Fiscal 2008. See Note 9, “Income Taxes” in the Notes to Consolidated Financial Statements for further disclosure.
27
Table of Contents
Liquidity and Capital Resources
Our primary source of working capital is cash flow from operations. Our primary ongoing cash requirements relate to the purchase of inventory, which is typically higher in the first and third quarters.
The following table sets forth material measures of our liquidity:
| Fiscal Years Ended | |||||||||
| January 30, 2010 |
January 31, 2009 |
February 2, 2008 | |||||||
| (dollars in thousands) | |||||||||
| Cash provided by operating activity |
$ | 133,703 | $ | 172,818 | $ | 257,197 | |||
| Working capital |
$ | 229,521 | $ | 118,013 | $ | 195,015 | |||
| Current ratio |
1.83:1 | 1.39:1 | 1.62:1 | ||||||
Operating Activities
The decrease in cash provided by operating activities for Fiscal 2009 compared with Fiscal 2008 was due to a reduction in the benefit to operating cash flows of lower inventory levels, which decreased by $77 million in Fiscal 2008 as compared to $4 million in Fiscal 2009, combined with a decrease in accounts payable and accrued expenses. These decreases were partially offset by a lower current year net loss, net of non-cash items, a reduction in prepaid expenses and the receipt of $36 million in income tax refunds during Fiscal 2009 the majority of which were recorded as refundable income taxes at January 31, 2009.
Merchandise inventories decreased approximately $4.3 million, or 2.5%, in Fiscal 2009 from Fiscal 2008. Merchandise inventory on a per-square-foot basis was approximately $32 at the end of both Fiscal 2009 and Fiscal 2008. Inventory turned 4.9 times in Fiscal 2009 compared to 5.4 times in Fiscal 2008.
Investing Activities
Cash used for investing activities was $38.9 million in Fiscal 2009, compared with $102.1 million in Fiscal 2008 and $156.4 million in Fiscal 2007. The decrease in cash used for investing activities in Fiscal 2009 compared with Fiscal 2008 was primarily due to a decrease in capital expenditures resulting from our scaled-back store opening plans offset by the impact of liquidating $9.1 million in auction rate securities during the prior year period. During Fiscal 2009, we opened 14 new stores, as compared to 66 new stores in Fiscal 2008.
In Fiscal 2009, we used cash for the construction of new retail locations, other store projects, including relocations and refurbishment, and investments in information systems. The primary purposes of these cash investment activities was to enhance the systems we use to support our online, merchandise sourcing, back office and in-store management functions, support our store and infrastructure expansion plans and improve operational efficiency.
The following table sets forth our capital expenditures:
| Fiscal Years Ended | |||||||||
| January 30, 2010 |
January 31, 2009 |
February 2, 2008 | |||||||
| (dollars in thousands) | |||||||||
| New store construction |
$ | 8,472 | $ | 52,169 | $ | 99,649 | |||
| Store renovation/refurbishment |
4,920 | 10,766 | 22,970 | ||||||
| Information systems |
21,253 | 31,449 | 14,900 | ||||||
| Corporate offices/distribution center |
898 | 5,423 | 7,642 | ||||||
| Other |
193 | 388 | 691 | ||||||
| Total |
$ | 35,736 | $ | 100,195 | $ | 145,852 | |||
28
Table of Contents
We expect our total capital expenditure requirements in Fiscal 2010 will be approximately $70 million. Approximately $25 million will be spent on new store construction, store expansion and relocation, for a planned opening of approximately 30 stores, representing an increase in store square footage of approximately 188,000 square feet, or 3.5%. Approximately $20 million is planned for store renovation and refurbishment programs. Approximately $22 million will be spent to support continued investments in information systems and technology and approximately $3 million is planned for corporate office and distribution center initiatives and other general corporate purposes. The actual amount of our capital expenditures will depend in part on the number of stores opened, expanded and refurbished. To finance our capital requirements, we expect to use internally generated funds. See “Business-Stores and Expansion”.
At both January 30, 2010 and January 31, 2009, we had $6.0 million invested in auction rate securities, with a fair market value of $5.6 million and $5.8 million, respectively. The approximate net carrying value of $5.6 million and $5.8 million at January 30, 2010 and January 31, 2009, respectively, represents our best estimate of the fair value of these investments based on available information on those dates.
We liquidated $9.1 million in auction rate securities in February and March 2008; however, auctions for our remaining $6.0 million investment have since failed. While we do not believe that the underlying securities or collateral have been affected, unsuccessful auctions limit the short-term liquidity of these investments; therefore, we classified the net carrying value of our remaining investment in auction rate securities as long-term, included in other assets on our Consolidated Balance Sheets at January 31, 2009.
On November 14, 2008, we entered into a settlement agreement with UBS AG (“UBS”), one of our investment providers, related to our $6.0 million investment in auction rate securities purchased from UBS. Under the terms of the settlement agreement, we received auction rate security rights that enable us to sell our auction rate securities back to UBS at par value anytime during the two year period beginning June 30, 2010. We recorded these auction rate security rights as a put option. The auction rate securities will continue to accrue and pay interest until such time as we exercise our rights. If we do not exercise our rights by July 2, 2012, they will expire and UBS will have no further obligation to us. Under the terms of the settlement agreement, we released UBS from all claims related to these securities except consequential damages, and agreed not to serve as a class action representative or receive benefits under any class action settlement or investor fund. UBS has the right to purchase the auction rate securities at par value from us at any time after November 14, 2008 without prior notice. No such purchases were made as of the date of this report.
Since we intend to exercise our auction rate security rights as soon as practicably possible, as of January 30, 2010, we reclassified the net carrying value of our remaining investment in auction rate securities to short-term, included in short-term investments on our Consolidated Balance Sheets. We do not believe that the carrying value of our remaining investment in auction rate securities, which are rated A or higher by Standard & Poor’s and backed by student loans, has been impaired.
In addition, as a result of the settlement agreement with UBS, we reclassified these auction rate securities from available-for-sale to trading securities. Due to this reclassification, all previously recorded temporary impairment charges included in accumulated other comprehensive loss were charged to earnings in accordance with ASC 320-10, Investments – Debt and Equity Securities and included in interest income on our Consolidated Statements of Operations for the fiscal year ended January 31, 2009. During Fiscal 2009 and Fiscal 2008, we recorded total net unrealized losses of approximately $0.1 million and $0.2 million respectively, which is included in interest income on our Consolidated Statements of Operations.
Financing Activities
Cash used for financing activities was $2.6 million in Fiscal 2009, compared with $92.4 million in Fiscal 2008 and $327.3 million in Fiscal 2007. The decrease in cash used for financing activities in Fiscal 2009 compared with Fiscal 2008 was due primarily to a decrease in stock repurchase activity in Fiscal 2009 compared to Fiscal 2008. During Fiscal 2009, we did not repurchase any of our common stock under the securities repurchase programs discussed below, compared with $100.8 million and $340.1 million in Fiscal 2008 and Fiscal 2007, respectively.
29
Table of Contents
On April 23, 2008, our wholly owned subsidiary, AnnTaylor, Inc., and certain of its subsidiaries, entered into a Third Amended and Restated $250 million senior secured revolving credit facility with Bank of America N.A. and a syndicate of lenders (the “Credit Facility”), which amended its then existing $175 million senior secured revolving credit facility, which was due to expire in November 2008. The Credit Facility provides for an increase in the total facility and the aggregate commitments thereunder up to $350 million, subject to the lenders’ agreement to increase their commitment for the requested amount. The Credit Facility expires on April 23, 2013 and may be used for working capital, letters of credit and other general corporate purposes. The Credit Facility contains an acceleration clause which, upon the occurrence of a Material Adverse Effect, as defined in the Credit Facility, may cause any borrowings outstanding to become immediately due and payable.
The maximum availability for loans and letters of credit under the Credit Facility is governed by a monthly borrowing base, determined by the application of specified advance rates against certain eligible assets. Commercial and standby letters of credit outstanding under the Credit Facility totaled approximately $13.8 million, $33.8 million and $111.1 million as of January 30, 2010, January 31, 2009 and February 2, 2008, respectively, leaving a remaining available balance for loans and letters of credit of $112.9 million, $115.0 million and $63.9 million as of January 30, 2010, January 31, 2009 and February 2, 2008, respectively. There were no borrowings outstanding under the Credit Facility at January 30, 2010, January 31, 2009, or as of the date of this filing. In March 2009, we accessed $125 million from our Credit Facility as a precaution against potential disruption in the credit markets, in the event we would need access to cash to meet seasonal working capital requirements. In July 2009, we repaid $50 million of these revolver borrowings, and subsequently repaid the remaining $75 million in October 2009.
The Credit Facility permits us to pay cash dividends (and permits dividends by AnnTaylor, Inc. to fund such cash dividends) subject to certain Liquidity requirements (as defined in the Credit Facility) and other conditions as set forth in the Credit Facility. Certain of our subsidiaries are also permitted to: pay dividends to us to fund certain taxes owed by us; fund ordinary operating expenses not in excess of $500,000 in any fiscal year; repurchase common stock held by employees not in excess of $100,000 in any fiscal year (with certain stated exceptions); and for certain other stated purposes (subject to certain exceptions). See Note 5, “Debt and Capital Leases”, in the Notes to Consolidated Financial Statements for further discussion of the Credit Facility.
On August 23, 2007, our Board of Directors approved a $300 million securities repurchase program (the “August 2007 Program”). The August 2007 Program will expire when we have repurchased all securities authorized for repurchase pursuant to the program, unless terminated earlier by resolution of our Board of Directors. Purchases of shares of common stock may be made from time to time, subject to market conditions and at prevailing market prices, through open market purchases or in privately negotiated transactions. Repurchased shares of common stock increase treasury shares available for general corporate purposes. During Fiscal 2009, no shares were repurchased under the August 2007 program. During Fiscal 2008, we repurchased 4,108,183 shares of our common stock under the August 2007 Program at a cost of approximately $100.8 million. During Fiscal 2007, we repurchased 9,301,633 shares of our common stock at a cost of approximately $340.1 million. Of this total, 1,347,286 shares at a cost of approximately $40.0 million, 7,952,879 shares at a cost of approximately $300.0 million and 1,468 shares at a cost of approximately $0.1 million were repurchased under the August 2007 Program, and programs previously approved in March 2007 and August 2006, respectively. As of January 30, 2010, approximately $159.1 million remained under the August 2007 program. We will continue to evaluate our options under the securities repurchase program in Fiscal 2010.
In Fiscal 2000, our Board of Directors adopted a Stockholder Rights Plan (“Rights Plan”). Rights under the Rights Plan (“Rights”) were distributed as a dividend at the rate of one Right for each share of common stock held by stockholders of record as of the close of business on May 30, 2000. As a result of 3-for-2 stock splits that occurred in Fiscal 2004 and Fiscal 2002, each share of common stock now represents four-ninths of a Right. Each Right entitles stockholders to buy one unit of a share of a new series of preferred stock for $125. Under certain circumstances, if a person or group acquires beneficial ownership of 15% or more of the voting power of the Company as represented by our common stock, or commences a tender or exchange offer upon consummation of which such person or group would beneficially own 15% or more of the voting power of the Company as represented by our common stock, holders of the Rights, other than the person or group triggering their exercise, will be able to purchase, in exchange for the $125 exercise price, shares of our common stock or of any company into which we have merged having a value of $250. No Rights were exercised under the Rights Plan in Fiscal 2009. The Rights Plan will expire on May 18, 2010, and our Board of Directors does not currently intend to extend its expiration date.
30
Table of Contents
Other
The distress in the financial markets has caused declines in consumer confidence and spending, extreme volatility in securities prices, diminished liquidity and credit availability and declining valuations of certain investments. We have assessed the implications of these factors on our business and have responded with expansion of our strategic restructuring program, scaled back planned capital expenditures and have adopted a conservative approach to discretionary spending, including our stock repurchase program. If the national, or global, economies or credit market conditions in general were to deteriorate further in the future, it is possible that such deterioration could put additional negative pressure on consumer spending and negatively affect our cash flows. Although we have available borrowing capacity under our Credit Facility, tightening of the credit markets could also make it more difficult for us to access these funds, enter into agreements for new indebtedness or obtain funding through the issuance of our securities. The effects of these changes could also require us to make additional changes to our current plans and strategy. Additionally, although our levels of net cash provided by operating activities may be negatively affected by general economic conditions, we believe that we will continue to generate positive cash flow from operations, which, along with our available cash and borrowing capacity under our Credit Facility, will provide the means needed to fund our operations for the foreseeable future. At January 30, 2010, substantially all of our cash was invested in money market funds backed by U.S. Treasury Securities or in deposit accounts at FDIC-insured banks. All of our deposit account balances are currently FDIC-insured as a result of the government’s Temporary Liquidity Guarantee Program (the “TLGP”). The TLGP currently expires on June 30, 2010. If the TLGP is not renewed, we would consider moving funds from deposit account balances into money market funds backed by U.S. Treasury Securities.
On January 30, 2008, we initiated a multi-year strategic restructuring program (the “Restructuring Program”) designed to enhance profitability and improve overall operating effectiveness. This program was subsequently expanded during the third quarter of Fiscal 2008 and again during the second quarter of Fiscal 2009. The three key elements of our Restructuring Program include: (1) closing underperforming stores; (2) an organizational streamlining that reduced our corporate and field staffing levels; and (3) a broad-based productivity initiative that included, among other things, centralized procurement of non-merchandise goods and services, outsourcing certain activities and optimizing store productivity and effectiveness. As a result of our Restructuring Program, we expect total ongoing annualized savings of approximately $125 million by Fiscal 2010, and realized approximately $40 million in Restructuring Program savings in Fiscal 2008 and an incremental $65 million in Fiscal 2009.
In connection with the store closing component of our Restructuring Program, we initially identified 117 stores for closure over the Fiscal 2008 to Fiscal 2010 period. In connection with the subsequent expansion of our restructuring program, we identified an additional 108 stores for closure, and now expect to close approximately 225 stores under our Restructuring Program, with a total of approximately 174 of these stores expected to close over the original Fiscal 2008 to Fiscal 2010 period and the balance expected to close in Fiscal 2011 and beyond. Through January 30, 2010, we have closed a total of 102 stores under our Restructuring Program, with 42 of these stores closed during Fiscal 2009. By division, we closed 33 Ann Taylor stores and 27 LOFT stores during Fiscal 2008, and 18 Ann Taylor stores and 24 LOFT stores during Fiscal 2009.
As part of the organizational streamlining component of our Restructuring Program, we eliminated approximately 600 positions over the Fiscal 2007 to Fiscal 2009 period, of which 180 positions were eliminated in Fiscal 2007, 260 positions were eliminated in Fiscal 2008, and 160 positions were eliminated in Fiscal 2009.
We expect total pre-tax expenses associated with our restructuring initiatives to be in the range of $130 to $140 million, of which approximately $85 million are non-cash expenses, primarily associated with the write-down of assets related to store closures, and approximately $45 to $55 million are cash charges for severance and various other costs. In Fiscal 2009, Fiscal 2008 and Fiscal 2007, we recorded $36.4 million, $59.7 million and $32.3 million, respectively, in restructuring charges. The balance of $2 to $12 million is expected to be incurred in Fiscal 2010. The above estimated costs and charges, to the extent they have not already been incurred, are preliminary and may vary materially based on various factors, including, among other things, timing in execution of the restructuring program, outcome of negotiations with landlords and other third parties and changes in our assumptions and projections. See “Risk Factors” for further discussion.
31
Table of Contents
In October 2008, we launched an enhanced credit card program, which offers eligible clients the choice of a private label or a co-branded credit card. All new cardholders are automatically enrolled in our exclusive rewards program, which is designed to recognize and promote client loyalty. As part of the program, we received an upfront signing bonus from the sponsoring bank. We also receive ongoing bounties for new accounts activated, as well as a share of finance charges collected by the sponsoring bank. These revenue streams are accounted for as a single unit of accounting under ASC 605-25, Revenue Recognition, and accordingly will be recognized into revenue ratably based on the total projected revenues over the term of the agreement. During Fiscal 2009 and Fiscal 2008, we recognized approximately $14.4 million and $3.3 million, respectively, of revenue related to the credit card program. At January 30, 2010 and January 31, 2009, approximately $7.2 million and $8.5 million, respectively, of deferred credit card income is included in accrued expenses and other current liabilities on our Consolidated Balance Sheets. Partially offsetting the income from the credit card program are costs related to the customer loyalty program. These costs are included in either cost of sales or in net sales as a sales discount, as appropriate. The cost of sales impact was approximately $5.6 million and $1.6 million and the sales discount impact was approximately $2.1 million and $0.1 million for Fiscal 2009 and Fiscal 2008, respectively.
On April 16, 2009, General Growth Properties, Inc. (“GGP”) and many of its affiliates (collectively “GGP Debtors”) filed for protection under Chapter 11 of the United States Bankruptcy Code. We currently operate 105 stores that the GGP Debtors and certain of their non-debtor affiliates own, manage, or control. Based on the information currently available, we do not anticipate that the GGP Debtors’ bankruptcy will have a material adverse effect on our operations or financial results.
On October 1, 2007, we froze our noncontributory defined benefit Pension Plan (the “Pension Plan”). As a result of the freeze, only those associates who were eligible under the Pension Plan on or before September 30, 2007 (substantially all associates of the Company who completed 1,000 hours of service during a consecutive 12 month period prior to that date) are eligible to receive benefits from the Pension Plan once they have completed the five years of service required to become fully vested. No associate may become a participant in the Pension Plan on or after October 1, 2007. No additional benefits are earned under the Pension Plan on or after October 1, 2007.
Our funding obligations and liability under the terms of the Pension Plan are determined using certain actuarial assumptions, including a discount rate and an expected long-term rate of return on Pension Plan assets. The discount rate enables us to state expected future cash payments for pension benefits as a present value on the measurement date. A lower discount rate increases the present value of the benefit obligations and increases pension expense. The discount rate selected was based on a yield curve which uses expected cash flows from the Pension Plan and then discounts those cash flows with the bond rate for that period. This resulted in a discount rate of 6.15%. A one percent decrease in the assumed discount rate would increase total net periodic pension expense for Fiscal 2010 by $1.4 million and would increase the liability for pension benefits at January 30, 2010 by $9.4 million. A one percent increase in the assumed discount rate would decrease total net periodic pension expense for Fiscal 2010 by $0.7 million and would decrease the liability for pension benefits at January 30, 2010 by $7.0 million.
Pension Plan assets as of January 30, 2010 were allocated 38% in equities, 61% in bond-related funds and 1% in short-term investments. For the purposes of developing long-term rates of return, it was assumed that the short-term investments were reallocated to equities and bond-related funds, yielding assumed long-term rates of return of 8.4% and 4.7%, respectively. To develop the expected long-term rate of return on Pension Plan assets, we considered the historical returns and the future expectations for returns for each asset class, as well as the target asset allocation of the pension portfolio. A lower expected rate of return on Pension Plan assets would increase pension expense. Our expected long-term rate of return on Pension Plan assets was 6.25% for both Fiscal 2009 and Fiscal 2008. A one percent change in the long-term rate of return assumption would impact Fiscal 2010 pension expense by approximately $0.3 million.
As a result of losses experienced in global equity markets, our Pension Plan assets experienced negative returns for Fiscal 2008 which, in turn, increased pension costs in Fiscal 2009. Since Pension Plan assets experienced gains in Fiscal 2009, pension expense for Fiscal 2010, excluding any potential settlement charges, is projected to be approximately $0.7 million, or $0.8 million lower than pension expense, excluding settlement charges, for Fiscal 2009. Our Pension Plan is invested in readily-liquid investments, primarily equity and debt securities. Although we were not required to make a contribution to the Pension Plan in Fiscal 2009 or Fiscal 2008, depending on the Pension Plan’s funded status, we may be required to make a contribution to our Pension Plan in Fiscal 2010.
32
Table of Contents
During Fiscal 2009 and Fiscal 2008, the total amount of lump sum payments made to plan participants exceeded the interest cost for those respective fiscal periods. As a result, non-cash settlement charges of $1.2 million and $1.8 million, respectively, were recorded and are included in selling, general and administrative expenses in our Consolidated Statements of Operations.
We are self-insured for expenses related to our employee point of service medical plan, our workers’ compensation plan and for short-term disability, up to certain thresholds. Claims filed, as well as claims incurred but not reported, are accrued based on management’s estimates, using information received from plan administrators, third party actuaries, historical analysis and other relevant data. We believe we have taken reasonable steps to ensure that we are adequately accrued for incurred costs related to these programs at January 30, 2010.
Off Balance Sheet Arrangements
The Company has no off balance sheet arrangements as defined by Item 303 (a) (4) of Regulation S-K.
Contractual Obligations
The Company has various contractual obligations which are recorded as liabilities in our Consolidated Financial Statements. Other items, such as purchase obligations, include certain commitments and contracts that are not recognized as liabilities in our Consolidated Financial Statements but are required to be disclosed in the Notes to Consolidated Financial Statements. Purchase obligations do not include those commitments or contracts that are cancelable without penalty.
The following table sets forth our significant contractual obligations as of January 30, 2010:
| Payments Due by Fiscal Year | |||||||||||||||
| Total | 2010 | 2011-2012 | 2013-2014 | 2015 And After | |||||||||||
| (in thousands) | |||||||||||||||
| Capital lease (1) |
$ | 1,096 | $ | 424 | $ | 672 | $ | — | $ | — | |||||
| Operating leases (2) |
1,109,075 | 180,532 | 311,027 | 261,199 | 356,317 | ||||||||||
| Purchase obligations: |
|||||||||||||||
| Merchandise (3) |
163,452 | 163,452 | — | — | — | ||||||||||
| Information systems (4) |
17,778 | 9,727 | 7,670 | 381 | — | ||||||||||
| Other (5) |
20,989 | 15,999 | 4,490 | 500 | — | ||||||||||
| Total |
$ | 1,312,390 | $ | 370,134 | $ | 323,859 | $ | 262,080 | $ | 356,317 | |||||
| (1) | Represents a capital lease with a four year term relating to certain computer equipment included in our Consolidated Balance Sheet. |
| (2) | Represents future minimum lease payments under non-cancelable operating leases in effect as of January 30, 2010. The minimum lease payments above do not include common area maintenance (CAM) charges or real estate taxes, which are also required contractual obligations under our store and office operating leases but are generally not fixed and can fluctuate from year to year. Total CAM charges and real estate taxes for Fiscal 2009, Fiscal 2008 and Fiscal 2007 were $76.8, $81.6 million and $76.2 million, respectively. |
| (3) | Represents open purchase orders with vendors for merchandise not yet received or recorded on our Consolidated Balance Sheet. |
| (4) | Represents consulting, maintenance and license agreements for services to be provided and/or software not yet received or recorded on our Consolidated Balance Sheet. |
| (5) | Represents contractual commitments or open purchase orders for non-merchandise goods or services not received or recorded on our Consolidated Balance Sheet. |
The table above excludes Long-term Debt, as there were no borrowings outstanding under the Credit Facility as of January 30, 2010. The Credit Facility contains a provision for commitment fees related to the unused revolving loan commitment and outstanding letters of credit, which are not included in the table because these charges are not fixed and can fluctuate from year to year due to various circumstances. Total commitment fees for Fiscal 2009, Fiscal 2008 and Fiscal 2007 were $1.0 million, $0.9 million and $1.3 million, respectively.
The table above also excludes $3.1 million of tax reserves under ASC 740-10, Income Taxes, as we are unable to reasonably estimate the ultimate amount or timing of any settlement. See Note 9, “Income Taxes”, in the Notes to Consolidated Financial Statements for further discussion. In addition, as discussed in Note 10, “Retirement Plans” in the Notes to Consolidated Financial Statements, we have a long-term liability for our Pension Plan. Minimum pension funding requirements are not included in the table above as such amounts are not determinable.
33
Table of Contents
Recent Accounting Pronouncements
Recently Issued Standards
In October 2009, the Financial Accounting Standards Board (“FASB”) issued Accounting Standards Update (“ASU”) 2009-13, Multiple Deliverable Revenue Arrangements. ASU 2009-13 amends ASC 605-10, Revenue Recognition, and addresses accounting for multiple-deliverable arrangements to enable vendors to account for products or services (deliverables) separately rather than as a combined unit, and provides guidance on how to measure and allocate arrangement consideration to one or more units of accounting. ASU 2009-13 is effective for revenue arrangements entered into or materially modified in fiscal years beginning on or after June 15, 2010. Early adoption is permitted, but certain requirements must be met. We may elect, but are not required, to adopt ASU 2009-13 retrospectively for all prior periods upon adoption. We are in the process of evaluating ASU 2009-13 and do not expect it will have a significant impact on our Consolidated Financial Statements.
In June 2009, the FASB issued ASU 2009-16, Transfers and Servicing, which seeks to improve financial reporting by providing a short-term solution to address inconsistencies in practice, such as eliminating the exceptions for qualifying special-purpose entities from the consolidation guidance. ASU 2009-16 is effective for annual financial periods beginning after November 15, 2009, and interim periods within that initial annual period and thereafter, and shall be applied prospectively. Early adoption is prohibited. We are in the process of evaluating ASU 2009-16 and do not expect it will have a significant impact on our Consolidated Financial Statements.
In June 2009, the FASB issued ASU 2009-17, Consolidations, which seeks to improve financial reporting by requiring that entities perform an analysis to determine whether any variable interest or interests that they have give them a controlling financial interest in a variable interest entity. ASU 2009-17 is effective for annual financial periods beginning after November 15, 2009, and interim periods within that initial annual period and thereafter, and shall be applied prospectively. Early adoption is prohibited. We are in the process of evaluating ASU 2009-17 and do not expect it will have a significant impact on our Consolidated Financial Statements.
Recently Adopted Standards
In February 2010, the FASB issued ASU 2010-09, Subsequent Events. ASU 2010-09 amends certain provisions of ASC 855-10, Subsequent Events, by removing the requirement for SEC filers to disclose the date through which subsequent events have been evaluated. We adopted ASU 2010-09 immediately upon its issuance in February 2010, and its provisions are reflected in our Consolidated Financial Statements for Fiscal 2009. Except for the removal of the date subsequent events were evaluated through in Note 1, “Summary of Significant Accounting Policies”, in the Notes to Consolidated Financial Statements, the adoption of ASU 2010-09 did not have any impact on our Consolidated Financial Statements.
In May 2009, the FASB issued amendments to ASC 855-10, Subsequent Events, which establish general standards of accounting for and disclosure of events that occur after the balance sheet date but before financial statements are issued or are available to be issued. The amendments to ASC 855-10 introduce the concept of financial statements being available to be issued, and required the disclosure of the date through which an entity has evaluated subsequent events and the basis for that date, that is, whether that date represents the date the financial statements were issued or were available to be issued. We adopted the amendments to ASC 855-10 during the second quarter of Fiscal 2009, but our adoption of ASU 2010-09, discussed above, eliminated any impact that these amendments to ASC 855-10 had on our Consolidated Financial Statements.
In January 2010, the FASB issued ASU 2010-06, Fair Value Measurements and Disclosures. ASU 2010-06 amends ASC 820-10, Fair Value Measurements and Disclosures, and requires new disclosures surrounding certain fair value measurements. ASU 2010-06 is effective for the first interim or annual reporting period beginning on or after December 15, 2009, except for certain disclosures about purchases, sales, issuances, and settlements in the rollforward of activity in Level 3 fair value measurements, which are effective for the first interim and annual reporting periods beginning on or after December 15, 2010. We have chosen to early adopt the disclosure requirements of ASU 2010-06, except for the disclosures that are required to be adopted for the first interim and annual reporting periods beginning on or after December 15, 2010, which we intend to adopt when required. The adoption of ASU 2010-06 did not have a material impact on our Consolidated Financial Statements. See Note 10, “Retirement Plans”, in the Notes to Consolidated Financial Statements, for the additional disclosures required under these amendments to ASC 2010-06.
34
Table of Contents
In January 2010, the FASB issued ASU 2010-02, Accounting and Reporting for Decreases in Ownership of a Subsidiary – a Scope Clarification. ASU 2010-02 amends ASC 810-10, Consolidation, and addresses the accounting for non-controlling interests and changes in ownership interests of a subsidiary. ASU 2010-02 is effective for the first interim or annual reporting period ending on or after December 15, 2009, and must be retrospectively applied to interim or annual reporting periods beginning on or after December 15, 2008. We adopted ASU 2010-02 during the fourth quarter of Fiscal 2009. The adoption of ASU 2010-02 did not have any impact on our Consolidated Financial Statements.
In August 2009, the FASB issued ASU 2009-05, Measuring Liabilities at Fair Value. ASU 2009-05 amends ASC 820-10, Fair Value Measurements and Disclosures, as it relates to the fair value measurement of liabilities, and provides clarification of the accounting for circumstances in which a quoted price in an active market for an identical liability is not available. ASU 2009-05 is effective for the first reporting period (including interim periods) after its issuance. We adopted ASU 2009-05 during the third quarter of Fiscal 2009. The adoption of ASU 2009-05 did not have a material impact on our Consolidated Financial Statements.
In June 2009, the FASB issued ASC 105-10, Generally Accepted Accounting Principles, which became the source of authoritative generally accepted accounting principles in the United States, superseding all then-existing non-SEC accounting and reporting standards. All other non-grandfathered, non-SEC accounting literature not included in the ASC became non-authoritative. We adopted ASC 105-10 during the third quarter of Fiscal 2009. The adoption of ASC 105-10 impacted our disclosures by eliminating all references to pre-Codification standards, but otherwise had no impact on our Consolidated Financial Statements.
In June 2009, the Securities and Exchange Commission (“SEC”) issued Staff Accounting Bulletin (“SAB”) No. 111, Other Than Temporary Impairment of Certain Investments in Debt and Equity Securities. SAB No. 111 clarifies the SEC’s position related to other-than-temporary impairments of debt and equity securities and was issued in order to make the relevant interpretive SEC guidance consistent with current authoritative accounting and auditing guidance and SEC rules and regulations. We adopted SAB No. 111 on June 4, 2009, the date of its issuance. The adoption of SAB No. 111 did not have any impact on our Consolidated Financial Statements.
In April 2009, the FASB issued amendments to ASC 825-10, Financial Instruments, which require disclosures about the fair value of financial instruments for interim reporting periods of publicly traded companies as well as in annual financial statements. The amendments to ASC 825-10 also require those disclosures in summarized financial information at interim reporting periods. The amendments to ASC 825-10 are effective for interim reporting periods ending after June 15, 2009 and do not require disclosures for earlier periods presented for comparative purposes at initial adoption. In periods after initial adoption, comparative disclosures are only required for periods ending after initial adoption. We adopted the amendments to ASC 825-10 during the second quarter of Fiscal 2009. See Note 3, “Investments”, in the Notes to Consolidated Financial Statements for the additional disclosures required under these amendments to ASC 825-10.
In April 2009, the FASB issued amendments to ASC 320-10, Investments – Debt and Equity Securities, which impact the other-than-temporary impairment guidance in U.S. generally accepted accounting principles (“GAAP”) for debt securities to make the guidance more operational and improve the presentation and disclosure of other-than-temporary impairment on debt and equity securities in the financial statements. The amendments to ASC 320-10 do not affect existing recognition and measurement guidance related to other-than-temporary impairment of equity securities. The amendments to ASC 320-10 are effective for interim reporting periods ending after June 15, 2009 and do not require disclosures for earlier periods presented for comparative purposes at initial adoption. In periods after initial adoption, comparative disclosures are only required for periods ending after initial adoption. We adopted the amendments to ASC 320-10 during the second quarter of Fiscal 2009. The adoption of the amendments to ASC 320-10 did not have any impact on our Consolidated Financial Statements.
In April 2009, the FASB issued amendments to ASC 820-10, Fair Value Measurements and Disclosures, which provide guidance for estimating fair value when the volume and level of activity for an asset or liability have significantly decreased and identify circumstances that indicate when a transaction is not orderly. The amendments to ASC 820-10 are effective for interim reporting periods ending after June 15, 2009 and do not require disclosures for earlier periods presented for comparative purposes at initial adoption. In periods after initial adoption, comparative disclosures are only required for periods ending after initial adoption. We adopted the amendments to ASC 820-10 during the second quarter of Fiscal 2009. See Note 3, “Investments”, in the Notes to Consolidated Financial Statements for required disclosure.
35
Table of Contents
In December 2008, the FASB issued amendments to ASC 715-20, Compensation – Retirement Benefits, which require additional detailed disclosures about the assets of a defined benefit pension or other postretirement plan. The amendments to ASC 715-20 are effective for fiscal years ending after December 15, 2009. We adopted the amendments to ASC 715-20 during the fourth quarter of Fiscal 2009. See Note 10, “Retirement Plans”, in the Notes to Consolidated Financial Statements, for the additional disclosures required under these amendments to ASC 715-20.
In June 2008, the FASB issued amendments to ASC 260-10, Earnings Per Share, which require that unvested share-based payment awards that contain rights to receive nonforfeitable dividends (whether paid or unpaid) be considered participating securities and included in the two-class method of computing earnings per share. The amendments to ASC 260-10 are effective for fiscal years beginning after December 15, 2008, and interim periods within those years. We adopted the amendments to ASC 260-10 on February 1, 2009. The adoption of the amendments to ASC 260-10 impacted the determination and reporting of earnings per share by requiring the inclusion of unvested restricted stock and performance restricted stock as participating securities, since they have the right to share in dividends, if declared, equally with common shareholders. The amendments to ASC 260-10 also require retroactive application to previously reported earnings per share amounts. Including these shares in our earnings per share calculation during periods of net income has the effect of diluting both basic and diluted earnings per share. However, in periods of net loss, no effect is given to the participating securities, since they do not have an obligation to share in the losses of the Company. See Note 7, “Net (Loss)/Income Per Share”, in the Notes to Consolidated Financial Statements for further discussion.
In September 2006, the FASB issued amendments to ASC 820-10, Fair Value Measurements and Disclosures. Subsequently, in February 2008, the portion of these amendments related to non-financial assets and non-financial liabilities that are recognized or disclosed at fair value in the financial statements on a non-recurring basis was deferred by the FASB for one year. We adopted the partially deferred portion of the amendments to ASC 820-10 on February 1, 2009. See Note 3, “Investments”, in the Notes to Consolidated Financial Statements for additional disclosures required under these amendments to ASC 820-10.
Critical Accounting Policies
Management’s Discussion and Analysis of Financial Condition and Results of Operations is based upon our Consolidated Financial Statements, which have been prepared in accordance with accounting principles generally accepted in the United States of America. Our significant accounting policies are more fully described in Note 1, “Summary of Significant Accounting Policies”, in the Notes to Consolidated Financial Statements. The preparation of these Consolidated Financial Statements requires us to make estimates and assumptions that affect the reported amounts of assets, liabilities, revenues and expenses. Actual results could differ from these estimates.
Based on the above, we have determined that our most critical accounting policies are those related to merchandise inventory valuation, asset impairment, income taxes and stock-based compensation. These policies are also discussed in the Notes to Consolidated Financial Statements and in relevant sections of this discussion and analysis.
Merchandise Inventory Valuation
Merchandise inventories are valued at the lower of average cost or market, at the individual item level. Market is determined based on the estimated net realizable value, which is generally the merchandise selling price. Merchandise inventory levels are monitored to identify slow-moving items and broken assortments (items no longer in stock in a sufficient range of sizes) and markdowns are used to clear such merchandise. Merchandise inventory value is reduced if the selling price is marked below cost. Physical inventory counts are performed annually in January and estimates are made for any shortage between the date of the physical inventory count and the balance sheet date.
36
Table of Contents
Asset Impairment
Long-lived tangible assets are accounted for under ASC 360-10, Property, Plant, and Equipment. Management estimates future pre-tax cash flows (undiscounted and without interest charges) based on historical experience, knowledge and market data. Estimates of future cash flows require management to make assumptions and to apply judgment, including forecasting future sales and expenses and estimating useful lives of the assets. These estimates can be affected by factors such as future store results, real estate demand, and economic conditions that can be difficult to predict, as well as other factors such as those outlined in “Risk Factors”. If the expected future cash flows related to the long-lived assets are less than the assets’ carrying value, an impairment loss would be recognized for the difference between estimated fair value and carrying value.
Income Taxes
Income Taxes are accounted for under ASC 740-10, Income Taxes, which requires the use of the asset and liability method. Deferred tax assets and liabilities are recognized based on the differences between the financial statement carrying value of existing assets and liabilities and their respective tax bases. Inherent in the measurement of these deferred balances are certain judgments and interpretations of existing tax law and other published guidance as applied to our operations. No valuation allowance has been provided for deferred tax assets, since management anticipates that the full amount of these assets should be realized in the future. In determining the need for a valuation allowance, management is required to make assumptions and to apply judgment, including forecasting future earnings, taxable income, and the mix of earnings in the jurisdictions in which we operate. See “Risk Factors”. Our effective tax rate considers management’s judgment of expected tax liabilities in the various taxing jurisdictions within which we are subject to tax. We are currently involved in federal, state and local tax audits. Further, at any given time, many tax years are subject to audit by various taxing authorities. The recorded amounts of income tax are subject to adjustment upon audit, changes in interpretation and changes in judgment utilized in determining estimates. While no adjustments to recorded amounts are anticipated, a 1% variance in our effective tax rate would affect net loss after taxes by approximately $0.3 million in Fiscal 2009.
Stock-based Compensation
Effective January 29, 2006, we adopted amendments to ASC 718-10, Compensation – Stock Compensation, using the modified prospective method. The calculation of stock-based compensation expense requires the input of highly subjective assumptions, including the expected term of the stock-based awards, stock price volatility and pre-vesting forfeitures. We estimate the expected life of shares granted in connection with stock-based awards using historical exercise patterns, which we believe are representative of future behavior. We estimate the volatility of our common stock at the date of grant based on an average of our historical volatility and the implied volatility of publicly traded options on our common stock. The assumptions used in calculating the fair value of stock-based awards represent our best estimates, but these estimates involve inherent uncertainties and the application of management judgment. As a result, if factors change and we were to use different assumptions, our stock-based compensation expense could be materially different in the future. In addition, we are required to estimate the expected forfeiture rate and only recognize expense for those shares expected to vest. We estimate forfeitures based on our historical experience of stock-based awards granted, exercised and cancelled, as well as considering future expected behavior. If the actual forfeiture rate is materially different from our estimate, stock-based compensation expense could be different from what we have recorded in the current period. See Note 8, “Equity and Stock Incentive Plans”, in the Notes to Consolidated Financial Statements for additional information.
37
Table of Contents
| ITEM 7A. | Quantitative and Qualitative Disclosures About Market Risk. |
We have significant amounts of cash and cash equivalents (money market funds) at financial institutions that are in excess of federally insured limits. With the current financial environment and the instability of financial institutions, we cannot be assured that we will not experience losses on our deposits. At January 30, 2010, substantially all of our cash was invested in money market funds backed by U.S. Treasury Securities or in deposit accounts at FDIC-insured banks. All of our deposit account balances are currently FDIC-insured as a result of the government’s Temporary Liquidity Guarantee Program (the “TLGP”). The TLGP currently expires on June 30, 2010. If the TLGP is not renewed, we would consider moving funds from deposit account balances into money market funds backed by U.S. Treasury Securities.
AnnTaylor Inc.’s Third Amended and Restated $250 million senior secured revolving credit facility allows for investments in financial instruments with original maturity dates of up to 360 days. Generally, less than 20% of these financial instruments have a fixed rate of return and are therefore subject to interest rate risk. However, as of January 30, 2010, we did not hold any investments with a fixed rate of return and no investments beyond the auction rate securities discussed below, which have a variable rate of return. Any fixed rate investments, such as auction rate securities, will decline in value if interest rates increase. Due to the short duration of these financial instruments and the percentage of our investment portfolio they comprise, a change of 100 basis points in interest rates would not have a material effect on the Company’s financial condition.
At both January 30, 2010 and January 31, 2009, we had $6.0 million invested in auction rate securities with a fair market value of $5.6 million and $5.8 million, respectively. The approximate net carrying value of $5.6 million and $5.8 million at January 30, 2010 and January 31, 2009, respectively, represents our best estimate of the fair value of these investments based on available information on those dates.
We liquidated $9.1 million in auction rate securities in February and March 2008; however, auctions for our remaining $6.0 million investment have since failed. While we do not believe that the underlying securities or collateral have been affected, unsuccessful auctions limit the short-term liquidity of these investments; therefore, we classified the net carrying value of our remaining investment in auction rate securities as long-term, included in other assets on our Consolidated Balance Sheets at January 31, 2009.
On November 14, 2008, we entered into a settlement agreement with UBS AG (“UBS”), one of our investment providers, related to our $6.0 million investment in auction rate securities purchased from UBS. Under the terms of the settlement agreement, we received auction rate security rights that enable us to sell our auction rate securities back to UBS at par value anytime during the two year period beginning June 30, 2010. We recorded these auction rate security rights as a put option. The auction rate securities will continue to accrue and pay interest until such time as we exercise our rights. If we do not exercise our rights by July 2, 2012 they will expire and UBS will have no further obligation to us. Under the terms of the settlement agreement, we released UBS from all claims related to these securities except consequential damages, and agreed not to serve as a class action representative or receive benefits under any class action settlement or investor fund. UBS has the right to purchase the auction rate securities at par value from us at any time after November 14, 2008 without prior notice. No such purchases were made as of the date of this report.
Since we intend to exercise our auction rate security rights as soon as practicably possible, as of January 30, 2010, we reclassified the net carrying value of our remaining investment in auction rate securities to short-term, included in short-term investments on our Consolidated Balance Sheets. We do not believe that the carrying value of our remaining investment in auction rate securities, which are rated A or higher by Standard & Poor’s and backed by student loans, has been impaired.
In addition, as a result of the settlement agreement with UBS, we reclassified these auction rate securities from available-for-sale to trading securities. Due to this reclassification, all previously recorded temporary impairment charges included in accumulated other comprehensive loss were charged to earnings in accordance with ASC 320-10, Investments – Debt and Equity Securities and included in interest income on our Consolidated Statements of Operations for the fiscal year ended January 31, 2009. During Fiscal 2009 and Fiscal 2008, we recorded total net unrealized loss of approximately $0.1 million and $0.2 million, respectively, which is included in interest income on our Consolidated Statements of Operations. See Note 3, “Investments” in the Notes to Consolidated Financial Statements for further discussion.
38
Table of Contents
| ITEM 8. | Financial Statements and Supplementary Data. |
The following Consolidated Financial Statements of the Company for the years ended January 30, 2010, January 31, 2009 and February 2, 2008 are included as part of this Report (See Item 15):
Consolidated Statements of Operations for the Fiscal Years Ended January 30, 2010, January 31, 2009, and February 2, 2008.
Consolidated Balance Sheets as of January 30, 2010 and January 31, 2009.
Consolidated Statements of Stockholders’ Equity for the Fiscal Years Ended January 30, 2010, January 31, 2009, and February 2, 2008.
Consolidated Statements of Cash Flows for the Fiscal Years Ended January 30, 2010, January 31, 2009, and February 2, 2008.
Notes to Consolidated Financial Statements.
39
Table of Contents
| ITEM 9. | Changes in and Disagreements with Accountants on Accounting and Financial Disclosure. |
None.
| ITEM 9A. | Controls and Procedures. |
Disclosure Controls and Procedures
The Company conducted an evaluation, under the supervision and with the participation of management, including the Chief Executive Officer and Chief Financial Officer, of the effectiveness of the design and operation of its disclosure controls and procedures (as such term is defined in Rules 13a-15(e) and 15d-15(e) under the Securities Exchange Act of 1934, as amended (the “Exchange Act”)) as of the end of the period covered by this report. There are inherent limitations to the effectiveness of any system of disclosure controls and procedures, including the possibility of human error and the circumvention or overriding of the controls and procedures. Accordingly, even effective disclosure controls and procedures can only provide reasonable assurance of achieving their control objectives. Based on such evaluation, the Chief Executive Officer and Chief Financial Officer concluded that the Company’s disclosure controls and procedures were effective as of the end of the period covered by this report in alerting them on a timely basis to material information relating to the Company (including its consolidated subsidiaries) required to be included in its reports filed or submitted under the Exchange Act.
Management’s Report on Internal Control over Financial Reporting
The management of AnnTaylor Stores Corporation is responsible for establishing and maintaining adequate internal control over financial reporting as defined in Rules 13a-15(f) and 15d-15(f) under the Exchange Act. The Company’s internal controls are designed to provide reasonable assurance regarding the reliability of financial reporting and the preparation of financial statements for external purposes in accordance with generally accepted accounting principles.
Because of inherent limitations, internal control over financial reporting may not prevent or detect misstatements. Also, projections of any evaluation of effectiveness to future periods are subject to the risk that controls may become inadequate because of changes in conditions, or that the degree of compliance with the policies or procedures may deteriorate. Accordingly, even an effective system of internal control over financial reporting will provide only reasonable assurance with respect to financial statement preparation.
Management has assessed the effectiveness of the Company’s internal control over financial reporting as of January 30, 2010. In making this assessment, management used the criteria established in Internal Control – Integrated Framework issued by the Committee of Sponsoring Organizations of the Treadway Commission (COSO). Based on the assessment and those criteria, management believes that the Company maintained effective internal control over financial reporting as of January 30, 2010.
The Company’s Independent Registered Public Accounting Firm, Deloitte & Touche LLP, issued a report on the Company’s internal control over financial reporting, which is included in the Report of Independent Registered Public Accounting Firm, on page 45.
Changes in Internal Control over Financial Reporting
During the Company’s fourth fiscal quarter, there were no changes in the Company’s internal control over financial reporting that materially affected, or are reasonably likely to materially affect, the Company’s internal control over financial reporting.
| ITEM 9B. | Other Information. |
None.
40
Table of Contents
| ITEM 10. | Directors, Executive Officers and Corporate Governance. |
The information required by this item is incorporated herein by reference to the Sections entitled “Election of Class I Directors”, “Executive Officers”, “Corporate Governance”, “Stockholder Proposals for the 2011 Annual Meeting” and “Section 16(a) Beneficial Ownership Reporting Compliance” in the Company’s Proxy Statement for its 2010 Annual Meeting of Stockholders.
The Company has Business Conduct Guidelines that apply to all its associates, including its chief executive officer, chief financial officer/principal accounting officer and controller, as well as members of the Company’s Board of Directors. The Business Conduct Guidelines are available on the Company’s website at http://investor.anntaylor.com. Any updates or amendments to the Business Conduct Guidelines, as well as any waiver from the Business Conduct Guidelines granted to an executive officer (including the Company’s chief executive officer, chief financial officer/principal accounting officer or controller), will also be posted on the website.
| ITEM 11. | Executive Compensation. |
The information required by this item is incorporated herein by reference to the Sections entitled “Executive Compensation”, “Director Compensation”, “Compensation Committee Interlocks and Insider Participation” and “Compensation Committee Report” in the Company’s Proxy Statement for its 2010 Annual Meeting of Stockholders.
| ITEM 12. | Security Ownership of Certain Beneficial Owners and Management and Related Stockholder Matters. |
The information required by this item is incorporated herein by reference to the Sections entitled “Beneficial Ownership of Common Stock” and “Equity Compensation Plans” in the Company’s Proxy Statement for its 2010 Annual Meeting of Stockholders.
| ITEM 13. | Certain Relationships and Related Transactions, and Director Independence. |
The information required by this item is incorporated herein by reference to the Sections entitled “Related Person Transactions”, “Related Person Transactions Policy and Procedures” and “Corporate Governance” in the Company’s Proxy Statement for its 2010 Annual Meeting of Stockholders.
| ITEM 14. | Principal Accounting Fees and Services. |
The information required by this item is incorporated herein by reference to the Section entitled “Ratification of the Appointment of Independent Registered Public Accounting Firm” in the Company’s Proxy Statement for its 2010 Annual Meeting of Stockholders.
41
Table of Contents
| ITEM 15. | Exhibits and Financial Statement Schedules. |
| (a) | List of documents filed as part of this Annual Report: |
| 1. | The following Consolidated Financial Statements of the Company are filed as part of this Annual Report: |
Report of Independent Registered Public Accounting Firm;
Consolidated Statements of Operations for the Fiscal Years Ended January 30, 2010, January 31, 2009, and February 2, 2008;
Consolidated Balance Sheets as of January 30, 2010 and January 31, 2009;
Consolidated Statements of Stockholders’ Equity for the Fiscal Years Ended January 30, 2010, January 31, 2009, and February 2, 2008;
Consolidated Statements of Cash Flows for the Fiscal Years Ended January 30, 2010, January 31, 2009, and February 2, 2008;
Notes to Consolidated Financial Statements.
| 2. | Schedules other than the above have been omitted because they are not applicable. |
| 3. | The exhibits filed as a part of this Annual Report are listed in the Exhibit Index. |
| (b) | The exhibits listed in the Exhibit Index attached hereto are filed as part of this Annual Report and incorporated herein by reference. |
| (c) | Not applicable. |
42
Table of Contents
Pursuant to the requirements of Section 13 or 15(d) of the Securities Exchange Act of 1934, the registrant has duly caused this report to be signed on its behalf by the undersigned, thereunto duly authorized.
| ANNTAYLOR STORES CORPORATION | ||
| By: | /s/ Kay Krill | |
| Kay Krill | ||
| President and Chief Executive Officer | ||
Date: March 12, 2010
Pursuant to the requirements of the Securities Exchange Act of 1934, this report has been signed below by the following persons on behalf of the registrant and in the capacities and on the dates indicated.
| /s/ Kay Krill Kay Krill |
President, Chief Executive Officer and Director (Principal Executive Officer) |
March 12, 2010 Date | ||||||
| /s/ Michael J Nicholson Michael J. Nicholson |
Executive Vice President, Chief Financial Officer and Treasurer (Principal Financial Officer and Principal Accounting Officer) |
March 12, 2010 Date | ||||||
| /s/ Ronald W. Hovsepian Ronald W. Hovsepian |
Non-Executive Chairman of the Board and Director |
March 12, 2010 Date | ||||||
| /s/ James J. Burke, Jr. James J. Burke, Jr. |
Director |
March 12, 2010 Date | ||||||
| /s/ Michelle Gass Michelle Gass |
Director |
March 12, 2010 Date | ||||||
| /s/ Dale W. Hilpert Dale W. Hilpert |
Director |
March 12, 2010 Date | ||||||
| /s/ Linda A. Huett Linda A. Huett |
Director |
March 12, 2010 Date | ||||||
| /s/ Michael W. Trapp Michael W. Trapp |
Director |
March 12, 2010 Date | ||||||
| /s/ Danial W. Yih Daniel W. Yih |
Director |
March 12, 2010 Date | ||||||
43
Table of Contents
INDEX TO CONSOLIDATED FINANCIAL STATEMENTS
| Page No. | ||
| 45 | ||
| Consolidated Financial Statements: |
||
| 46 | ||
| Consolidated Balance Sheets as of January 30, 2010 and January 31, 2009 |
47 | |
| 48 | ||
| 49 | ||
| 50 | ||
44
Table of Contents
REPORT OF INDEPENDENT REGISTERED PUBLIC ACCOUNTING FIRM
To the Board of Directors and Stockholders of
AnnTaylor Stores Corporation
New York, NY
We have audited the accompanying consolidated balance sheets of AnnTaylor Stores Corporation and its subsidiaries (the “Company”) as of January 30, 2010 and January 31, 2009, and the related consolidated statements of operations, changes in stockholders’ equity, and cash flows for each of the three years in the period ended January 30, 2010. We also have audited the Company’s internal control over financial reporting as of January 30, 2010, based on criteria established in Internal Control — Integrated Framework issued by the Committee of Sponsoring Organizations of the Treadway Commission. The Company’s management is responsible for these financial statements, for maintaining effective internal control over financial reporting, and for its assessment of the effectiveness of internal control over financial reporting, included in the accompanying Management’s Report on Internal Control over Financial Reporting. Our responsibility is to express an opinion on these financial statements and an opinion on the Company’s internal control over financial reporting based on our audits.
We conducted our audits in accordance with the standards of the Public Company Accounting Oversight Board (United States). Those standards require that we plan and perform the audit to obtain reasonable assurance about whether the financial statements are free of material misstatement and whether effective internal control over financial reporting was maintained in all material respects. Our audits of the financial statements included examining, on a test basis, evidence supporting the amounts and disclosures in the financial statements, assessing the accounting principles used and significant estimates made by management, and evaluating the overall financial statement presentation. Our audit of internal control over financial reporting included obtaining an understanding of internal control over financial reporting, assessing the risk that a material weakness exists, and testing and evaluating the design and operating effectiveness of internal control based on the assessed risk. Our audits also included performing such other procedures as we considered necessary in the circumstances. We believe that our audits provide a reasonable basis for our opinions.
A company’s internal control over financial reporting is a process designed by, or under the supervision of, the company’s principal executive and principal financial officers, or persons performing similar functions, and effected by the company’s board of directors, management, and other personnel to provide reasonable assurance regarding the reliability of financial reporting and the preparation of financial statements for external purposes in accordance with generally accepted accounting principles. A company’s internal control over financial reporting includes those policies and procedures that (1) pertain to the maintenance of records that, in reasonable detail, accurately and fairly reflect the transactions and dispositions of the assets of the company; (2) provide reasonable assurance that transactions are recorded as necessary to permit preparation of financial statements in accordance with generally accepted accounting principles, and that receipts and expenditures of the company are being made only in accordance with authorizations of management and directors of the company; and (3) provide reasonable assurance regarding prevention or timely detection of unauthorized acquisition, use, or disposition of the company’s assets that could have a material effect on the financial statements.
Because of the inherent limitations of internal control over financial reporting, including the possibility of collusion or improper management override of controls, material misstatements due to error or fraud may not be prevented or detected on a timely basis. Also, projections of any evaluation of the effectiveness of the internal control over financial reporting to future periods are subject to the risk that the controls may become inadequate because of changes in conditions, or that the degree of compliance with the policies or procedures may deteriorate.
In our opinion, the consolidated financial statements referred to above present fairly, in all material respects, the financial position of AnnTaylor Stores Corporation and its subsidiaries as of January 30, 2010 and January 31, 2009, and the results of their operations and their cash flows for each of the three years in the period ended January 30, 2010, in conformity with accounting principles generally accepted in the United States of America. Also, in our opinion, the Company maintained, in all material respects, effective internal control over financial reporting as of January 30, 2010, based on the criteria established in Internal Control — Integrated Framework issued by the Committee of Sponsoring Organizations of the Treadway Commission.
/s/ DELOITTE & TOUCHE LLP
New York, New York
March 12, 2010
45
Table of Contents
CONSOLIDATED STATEMENTS OF OPERATIONS
For Fiscal Years Ended January 30, 2010, January 31, 2009 and February 2, 2008
| Fiscal Years Ended | |||||||||||
| January 30, 2010 |
January 31, 2009 |
February 2, 2008 | |||||||||
| (in thousands, except per share amounts) | |||||||||||
| Net sales |
$ | 1,828,523 | $ | 2,194,559 | $ | 2,396,510 | |||||
| Cost of sales |
834,188 | 1,139,753 | 1,145,246 | ||||||||
| Gross margin |
994,335 | 1,054,806 | 1,251,264 | ||||||||
| Selling, general and administrative expenses |
966,603 | 1,050,560 | 1,061,869 | ||||||||
| Restructuring charges |
36,368 | 59,714 | 32,255 | ||||||||
| Asset impairment charges |
15,318 | 29,590 | 1,754 | ||||||||
| Goodwill impairment charge |
— | 286,579 | — | ||||||||
| Operating (loss)/income |
(23,954 | ) | (371,637 | ) | 155,386 | ||||||
| Interest income |
935 | 1,677 | 7,826 | ||||||||
| Interest expense |
3,091 | 1,462 | 2,172 | ||||||||
| (Loss)/income before income taxes |
(26,110 | ) | (371,422 | ) | 161,040 | ||||||
| Income tax (benefit)/provision |
(7,902 | ) | (37,516 | ) | 63,805 | ||||||
| Net (loss)/income |
$ | (18,208 | ) | $ | (333,906 | ) | $ | 97,235 | |||
| Basic (loss)/earnings per share |
$ | (0.32 | ) | $ | (5.82 | ) | $ | 1.52 | |||
| Weighted average shares outstanding |
56,782 | 57,366 | 62,753 | ||||||||
| Diluted (loss)/earnings per share |
$ | (0.32 | ) | $ | (5.82 | ) | $ | 1.51 | |||
| Weighted average shares outstanding, assuming dilution |
56,782 | 57,366 | 63,212 | ||||||||
See accompanying Notes to Consolidated Financial Statements.
46
Table of Contents
CONSOLIDATED BALANCE SHEETS
January 30, 2010 and January 31, 2009
| January 30, 2010 |
January 31, 2009 |
|||||||
| (in thousands, except share amounts) | ||||||||
| Assets | ||||||||
| Current assets |
||||||||
| Cash and cash equivalents |
$ | 204,491 | $ | 112,320 | ||||
| Short-term investments |
5,655 | — | ||||||
| Accounts receivable |
19,267 | 14,081 | ||||||
| Merchandise inventories |
169,141 | 173,447 | ||||||
| Refundable income taxes |
24,929 | 35,270 | ||||||
| Deferred income taxes |
35,799 | 25,422 | ||||||
| Prepaid expenses and other current assets |
45,613 | 63,056 | ||||||
| Total current assets |
504,895 | 423,596 | ||||||
| Property and equipment, net |
365,934 | 469,687 | ||||||
| Deferred financing costs, net |
973 | 1,275 | ||||||
| Deferred income taxes |
23,683 | 53,253 | ||||||
| Other assets |
6,656 | 12,628 | ||||||
| Total assets |
$ | 902,141 | $ | 960,439 | ||||
| Liabilities and Stockholders’ Equity | ||||||||
| Current liabilities |
||||||||
| Accounts payable |
$ | 76,969 | $ | 109,205 | ||||
| Accrued salaries and bonus |
32,168 | 23,883 | ||||||
| Accrued tenancy |
44,878 | 42,710 | ||||||
| Gift certificates and merchandise credits redeemable |
47,555 | 45,582 | ||||||
| Accrued expenses and other current liabilities |
73,804 | 84,203 | ||||||
| Total current liabilities |
275,374 | 305,583 | ||||||
| Deferred lease costs |
183,917 | 217,614 | ||||||
| Deferred income taxes |
1,584 | 1,898 | ||||||
| Other liabilities |
24,080 | 18,832 | ||||||
| Commitments and contingencies (see note 6) |
||||||||
| Stockholders’ equity |
||||||||
| Common stock, $.0068 par value; 200,000,000 shares authorized; 82,476,328 and 82,476,328 shares issued, respectively |
561 | 561 | ||||||
| Additional paid-in capital |
777,786 | 791,852 | ||||||
| Retained earnings |
414,294 | 432,502 | ||||||
| Accumulated other comprehensive loss |
(4,158 | ) | (7,702 | ) | ||||
| 1,188,483 | 1,217,213 | |||||||
| Treasury stock, 23,701,800 and 25,220,809 shares, respectively, at cost |
(771,297 | ) | (800,701 | ) | ||||
| Total stockholders’ equity |
417,186 | 416,512 | ||||||
| Total liabilities and stockholders’ equity |
$ | 902,141 | $ | 960,439 | ||||
See accompanying Notes to Consolidated Financial Statements.
47
Table of Contents
CONSOLIDATED STATEMENTS OF STOCKHOLDERS’ EQUITY
For the Fiscal Years Ended January 30, 2010, January 31, 2009 and February 2, 2008
(In thousands)
| Additional Paid-in Capital |
Retained Earnings |
Accumulated Other Comprehensive Loss |
||||||||||||||||||||||||||
| Common Stock | Treasury | |||||||||||||||||||||||||||
| Shares | Amount | Shares | Amount | Total | ||||||||||||||||||||||||
| Balance at February 3, 2007 |
82,156 | $ | 559 | $ | 753,030 | $ | 670,307 | $ | (5,373 | ) | 12,783 | $ | (368,612 | ) | $ | 1,049,911 | ||||||||||||
| Net income |
— | — | — | 97,235 | — | — | — | 97,235 | ||||||||||||||||||||
| Other comprehensive income, net of tax: |
||||||||||||||||||||||||||||
| Defined benefit pension plan adjustments, net of taxes of $1,787 (See Note 10) |
— | — | — | — | 1,913 | — | — | 1,913 | ||||||||||||||||||||
| Total comprehensive income |
99,148 | |||||||||||||||||||||||||||
| Adjustment for the adoption of ASC 740-10 |
— | — | — | (1,134 | ) | — | — | — | (1,134 | ) | ||||||||||||||||||
| Exercise of stock options, related tax benefit and tax effect of expirations |
— | — | 7,926 | — | — | (606 | ) | 7,683 | 15,609 | |||||||||||||||||||
| Amortization of stock awards |
— | — | 19,019 | — | — | — | — | 19,019 | ||||||||||||||||||||
| Issuance of restricted stock, net of forfeitures and related tax benefit |
— | — | (2,501 | ) | — | — | (280 | ) | 3,432 | 931 | ||||||||||||||||||
| Repurchase of common and restricted stock |
— | — | — | — | — | 9,512 | (347,575 | ) | (347,575 | ) | ||||||||||||||||||
| Issuance of common stock pursuant to Associate Discount Stock Purchase Plan and related tax benefit of disqualifying dispositions. |
133 | 1 | 3,574 | — | — | — | — | 3,575 | ||||||||||||||||||||
| Balance at February 2, 2008 |
82,289 | 560 | 781,048 | 766,408 | (3,460 | ) | 21,409 | (705,072 | ) | 839,484 | ||||||||||||||||||
| Net loss |
— | — | — | (333,906 | ) | — | — | — | (333,906 | ) | ||||||||||||||||||
| Other comprehensive loss, net of tax: |
||||||||||||||||||||||||||||
| Defined benefit pension plan adjustments, net of taxes of $4,713 (See Note 10) |
— | — | — | — | (4,242 | ) | — | — | (4,242 | ) | ||||||||||||||||||
| Total comprehensive loss |
(338,148 | ) | ||||||||||||||||||||||||||
| Exercise of stock options, related tax benefit and tax effect of expirations |
77 | — | 2,103 | — | — | (141 | ) | 1,975 | 4,078 | |||||||||||||||||||
| Amortization of stock awards |
— | — | 12,628 | — | — | — | — | 12,628 | ||||||||||||||||||||
| Issuance of restricted stock, net of forfeitures and related tax deficiency |
— | — | (6,028 | ) | — | — | (170 | ) | 5,229 | (799 | ) | |||||||||||||||||
| Repurchase of common and restricted stock |
— | — | — | — | — | 4,223 | (103,281 | ) | (103,281 | ) | ||||||||||||||||||
| Issuance of common stock pursuant to Associate Discount Stock Purchase Plan and related tax benefit of disqualifying dispositions. |
110 | 1 | 2,101 | — | — | (100 | ) | 448 | 2,550 | |||||||||||||||||||
| Balance at January 31, 2009 |
82,476 | 561 | 791,852 | 432,502 | (7,702 | ) | 25,221 | (800,701 | ) | 416,512 | ||||||||||||||||||
| Net loss |
— | — | — | (18,208 | ) | — | — | — | (18,208 | ) | ||||||||||||||||||
| Other comprehensive income/(loss), net of tax: |
||||||||||||||||||||||||||||
| Defined benefit pension plan adjustments, net of taxes of $2,145 (See Note 10) |
— | — | — | — | 3,544 | — | — | 3,544 | ||||||||||||||||||||
| Total comprehensive loss |
(14,664 | ) | ||||||||||||||||||||||||||
| Exercise of stock options, related tax deficiency and tax effect of expirations |
— | (1,003 | ) | — | — | (12 | ) | 111 | (892 | ) | ||||||||||||||||||
| Amortization of stock awards |
— | — | 16,088 | — | — | — | — | 16,088 | ||||||||||||||||||||
| Issuance of restricted stock, net of forfeitures and related tax deficiency |
— | — | (29,235 | ) | — | — | (1,214 | ) | 27,750 | (1,485 | ) | |||||||||||||||||
| Repurchase of restricted stock |
— | — | — | — | — | 74 | (502 | ) | (502 | ) | ||||||||||||||||||
| Issuance of common stock pursuant to Associate Discount Stock Purchase Plan and related tax benefit of disqualifying dispositions. |
— | — | 84 | — | — | (367 | ) | 2,045 | 2,129 | |||||||||||||||||||
| Balance at January 30, 2010 |
82,476 | $ | 561 | $ | 777,786 | $ | 414,294 | $ | (4,158 | ) | 23,702 | $ | (771,297 | ) | $ | 417,186 | ||||||||||||
See accompanying Notes to Consolidated Financial Statements.
48
Table of Contents
CONSOLIDATED STATEMENTS OF CASH FLOWS
For the Fiscal Years Ended January 30, 2010, January 31, 2009 and February 2, 2008
| Fiscal Years Ended | ||||||||||||
| January 30, 2010 |
January 31, 2009 |
February 2, 2008 |
||||||||||
| (in thousands) | ||||||||||||
| Operating activities: |
||||||||||||
| Net (loss)/income |
$ | (18,208 | ) | $ | (333,906 | ) | $ | 97,235 | ||||
| Adjustments to reconcile net (loss)/income to net cash provided by operating activities: |
||||||||||||
| Goodwill impairment charge |
— | 286,579 | — | |||||||||
| Deferred income taxes |
16,734 | (23,690 | ) | (9,361 | ) | |||||||
| Depreciation and amortization |
104,351 | 122,222 | 116,804 | |||||||||
| Loss on disposal and write-down of property and equipment |
16,473 | 29,581 | 6,736 | |||||||||
| Non-cash compensation expense |
16,088 | 12,829 | 19,019 | |||||||||
| Non-cash interest and other non-cash items |
2,814 | 2,506 | 1,039 | |||||||||
| Non-cash restructuring charges |
18,665 | 39,775 | 29,876 | |||||||||
| Tax (deficiency)/benefit from exercise/vesting of stock awards |
(2,403 | ) | (580 | ) | 2,180 | |||||||
| Changes in assets and liabilities: |
||||||||||||
| Accounts receivable |
(5,186 | ) | 2,863 | (455 | ) | |||||||
| Merchandise inventories |
4,306 | 77,250 | (17,091 | ) | ||||||||
| Prepaid expenses and other current assets |
17,752 | 4,899 | (13,599 | ) | ||||||||
| Refundable income taxes |
10,341 | (35,270 | ) | — | ||||||||
| Other non-current assets and liabilities, net |
(21,965 | ) | (12,610 | ) | 24,264 | |||||||
| Trade notes, accounts payable and accrued expenses |
(26,059 | ) | 370 | 550 | ||||||||
| Net cash provided by operating activities |
133,703 | 172,818 | 257,197 | |||||||||
| Investing activities: |
||||||||||||
| Purchases of marketable securities |
(563 | ) | (1,180 | ) | (70,947 | ) | ||||||
| Sales of marketable securities |
804 | 9,407 | 54,525 | |||||||||
| Restricted cash received for sublease |
(617 | ) | — | — | ||||||||
| Purchases of property and equipment |
(38,573 | ) | (110,342 | ) | (139,998 | ) | ||||||
| Net cash used for investing activities |
(38,949 | ) | (102,115 | ) | (156,420 | ) | ||||||
| Financing activities: |
||||||||||||
| Proceeds from draw down of credit facility |
125,000 | — | — | |||||||||
| Repayments of credit facility |
(125,000 | ) | — | — | ||||||||
| Proceeds from the issuance of common stock pursuant to Associate Discount Stock Purchase Plan |
2,045 | 2,544 | 3,526 | |||||||||
| Proceeds from exercise of stock options |
111 | 3,864 | 14,409 | |||||||||
| Excess tax benefits from stock-based compensation |
320 | 366 | 2,328 | |||||||||
| Repurchases of common and restricted stock |
(502 | ) | (103,281 | ) | (347,575 | ) | ||||||
| Proceeds from fixed asset financing |
— | 7,578 | — | |||||||||
| Repayments of fixed assets financing and capital lease obligations |
(4,557 | ) | (2,176 | ) | — | |||||||
| Payments of deferred financing cost |
— | (1,303 | ) | — | ||||||||
| Net cash used for financing activities |
(2,583 | ) | (92,408 | ) | (327,312 | ) | ||||||
| Net increase/(decrease) in cash |
92,171 | (21,705 | ) | (226,535 | ) | |||||||
| Cash and cash equivalents, beginning of year |
112,320 | 134,025 | 360,560 | |||||||||
| Cash and cash equivalents, end of year |
$ | 204,491 | $ | 112,320 | $ | 134,025 | ||||||
| Supplemental disclosures of cash flow information: |
||||||||||||
| Cash paid during the year for: |
||||||||||||
| Interest |
$ | 2,914 | $ | 1,063 | $ | 1,723 | ||||||
| Income taxes |
$ | 5,825 | $ | 20,370 | $ | 77,355 | ||||||
| Accrual for purchases of property and equipment |
$ | 9,229 | $ | 12,066 | $ | 22,213 | ||||||
See accompanying Notes to Consolidated Financial Statements.
49
Table of Contents
NOTES TO CONSOLIDATED FINANCIAL STATEMENTS
1. Summary of Significant Accounting Policies
AnnTaylor Stores Corporation (the “Company”) is a leading national specialty retailer of women’s apparel, shoes and accessories sold primarily under the “Ann Taylor” and “LOFT” brands. Its principal market consists of the United States. The Company sells its products through traditional retail stores and on the Internet at www.anntaylor.com and www.LOFTonline.com (together, the “Online Stores”) or by phone at 1-800-DIAL-ANN.
Basis of Presentation
The Consolidated Financial Statements include the accounts of the Company and its subsidiaries, including AnnTaylor, Inc. The Company has no material assets other than the common stock of AnnTaylor, Inc. and conducts no business other than the management of AnnTaylor, Inc. All intercompany accounts have been eliminated in consolidation.
Reclassification
Tax effects related to stock activity previously included in “Exercise of stock options, related tax benefit/deficiency and tax effect of expirations” on the Consolidated Statements of Stockholders’ Equity in Fiscal 2008 and Fiscal 2007 were reclassified to “Issuance of restricted stock, net of forfeitures and related tax benefit/deficiency” and “Issuance of common stock pursuant to associate discount stock purchase plan and related tax benefit of disqualifying dispositions”, accordingly, to conform to the Fiscal 2009 presentation.
In addition, the value of gift certificates escheated, which was previously included in “Accrued expenses and other current liabilities” on the Consolidated Balance Sheets was reclassified to “Gift certificates and merchandise credits redeemable” to conform to the Fiscal 2009 presentation.
Fiscal Year
The Company follows the standard fiscal year of the retail industry, which is a 52- or 53-week period ending on the Saturday closest to January 31. All fiscal years presented in these Consolidated Financial Statements include 52 weeks.
Use of Estimates
The preparation of financial statements in conformity with accounting principles generally accepted in the United States of America requires management to make estimates and assumptions that affect the reported amount of assets and liabilities and disclosures of contingent assets and liabilities at the date of the financial statements and the reported amounts of revenue and expenses during the reporting period. Actual results could differ from these estimates.
Revenue Recognition
The Company records revenue as merchandise is sold to clients. The Company’s policy with respect to gift certificates and gift cards is to record revenue as they are redeemed for merchandise. Prior to their redemption, these gift certificates and gift cards are recorded as a liability. While the Company will continue to honor all gift certificates and gift cards presented for payment, management reviews unclaimed property laws to determine gift certificate and gift card balances required for escheatment to the appropriate government agency. Amounts related to shipping and handling billed to clients in a sales transaction are classified as revenue and the costs related to shipping product to clients (billed and unbilled) are classified as cost of sales. A reserve for estimated returns is established when sales are recorded. The Company excludes sales taxes collected from clients from net sales in its Consolidated Statements of Operations.
50
Table of Contents
ANNTAYLOR STORES CORPORATION
NOTES TO CONSOLIDATED FINANCIAL STATEMENTS—(Continued)
1. Summary of Significant Accounting Policies (Continued)
Revenue Recognition (Continued)
In October 2008, the Company launched an enhanced credit card program, which offers eligible clients the choice of a private label or a co-branded credit card. All new cardholders are automatically enrolled in the Company’s exclusive rewards program, which is designed to recognize and promote client loyalty. As part of the program, the Company received an upfront signing bonus from the sponsoring bank. The Company also receives ongoing bounties for new accounts activated, as well as a share of finance charges collected by the sponsoring bank. These revenue streams are accounted for as a single unit of accounting under Accounting Standards Codification (“ASC”) 605-25, Revenue Recognition, and accordingly will be recognized into revenue ratably based on the total projected revenues over the term of the agreement. During Fiscal 2009 and Fiscal 2008, the Company recognized approximately $14.4 million and $3.3 million, respectively, of revenue related to the credit card program. Partially offsetting the income from the credit card program are costs related to the customer loyalty program. These costs are included in either cost of sales or in net sales as a sales discount, as appropriate. The cost of sales impact was approximately $5.6 million and $1.6 million and the sales discount impact was approximately $2.1 million and $0.1 million for Fiscal 2009 and Fiscal 2008, respectively.
Cash and Cash Equivalents
Cash and short-term highly liquid investments with original maturity dates of 3 months or less are considered cash or cash equivalents. The Company invests primarily in money market funds or in deposit accounts at FDIC-insured banks. The money market funds invest substantially all of their assets in U.S. Treasury Securities, and all deposit account balances are FDIC insured as a result of the government’s Temporary Liquidity Guarantee Program as of January 30, 2010.
Merchandise Inventories
Merchandise inventories are valued at the lower of average cost or market, at the individual item level. Merchandise inventory value is reduced if the selling price is marked below cost. Physical inventory counts are performed annually in January and estimates are made for any shortage between the date of the physical inventory count and the balance sheet date.
Cost of Sales and Selling, General and Administrative Expenses
The following table illustrates the primary costs classified in each major expense category:
| Cost of Sales |
Selling, General and Administrative Expenses | |
| • Cost of merchandise sold;
• Costs associated with the Company’s sourcing operations;
• Freight costs associated with moving merchandise from suppliers to the Company’s distribution center;
• Costs associated with the movement of merchandise through customs;
• Costs associated with the fulfillment of online client orders;
• Depreciation related to merchandise management systems;
• Sample development costs;
• Costs of the credit card client loyalty program;
• Merchandise shortage; and
• Client shipping costs. |
• Payroll, bonus and benefit costs for retail and corporate associates;
• Design and merchandising costs;
• Occupancy costs for retail and corporate facilities;
• Depreciation related to retail and corporate assets;
• Advertising and marketing costs;
• Occupancy and other costs associated with operating the Company’s distribution center;
• Freight expenses associated with moving merchandise from the distribution center to the Company’s retail stores; and
• Legal, finance, information systems and other corporate overhead costs. |
51
Table of Contents
ANNTAYLOR STORES CORPORATION
NOTES TO CONSOLIDATED FINANCIAL STATEMENTS—(Continued)
1. Summary of Significant Accounting Policies (Continued)
Property and Equipment
Property and equipment are recorded at cost. Depreciation and amortization are computed on a straight-line basis over the following estimated useful lives:
| Building | 40 years | |
| Leasehold improvements | 10 years or term of lease, if shorter | |
| Furniture, fixtures and equipment | 2-10 years | |
| Software | 5 years |
When assets are sold or retired, the related cost and accumulated depreciation are removed from their respective accounts and any resulting gain or loss is recorded to selling, general and administrative expenses, unless the amounts are associated with the Company’s restructuring program, in which case they are included in restructuring charges. Expenditures for maintenance and repairs which do not improve or extend the useful lives of the respective assets are expensed as incurred.
Store Pre-Opening Costs
Non-capital expenditures, such as rent, advertising and payroll costs incurred prior to the opening of a new store are charged to expense in the period they are incurred.
Internal-Use Software Development Costs
As required by ASC 350-40, Internal-Use Software, the Company capitalizes certain external and internal computer software and software development costs incurred during the application development stage. The application development stage generally includes software design and configuration, coding, testing and installation activities. Training and maintenance costs are expensed as incurred, while upgrades and enhancements are capitalized if it is probable that such expenditures will result in additional functionality. Capitalized software costs are depreciated over the estimated useful life of the underlying project on a straight-line basis, generally not exceeding five years.
Deferred Rent Obligations
Rent expense under non-cancelable operating leases with scheduled rent increases or free rent periods is accounted for on a straight-line basis over the initial lease term beginning on the date of initial possession, which is generally when the Company enters the space and begins construction build-out. Any reasonably assured renewals are considered. The amount of the excess of straight-line rent expense over scheduled payments is recorded as a deferred liability. Construction allowances and other such lease incentives are recorded as deferred credits and are amortized on a straight-line basis as a reduction of rent expense beginning in the period they are deemed to be earned, which often is subsequent to the date of initial possession and generally coincides with the store opening date. The current portion of unamortized deferred lease costs and construction allowances is included in “Accrued tenancy” and the long-term portion is included in “Deferred lease costs” on the Company’s Consolidated Balance Sheets.
Lease Termination Costs
Contractual penalties associated with lease terminations are accounted for in accordance with the requirements of ASC 840-20, Leases – Operating Leases, which requires that the amount of the penalty be recognized on either an undiscounted or discounted basis, with consistent application. The Company recognizes such penalties on an undiscounted basis at the time notification to terminate the lease is provided to the lessor.
Deferred Financing Costs
Deferred financing costs are amortized using the interest method over the term of the related debt. Accumulated amortization at January 30, 2010 and January 31, 2009 was approximately $6.2 million and $5.9 million, respectively. Amortization expense recognized was approximately $302,000, $316,000, and $365,000 in Fiscal 2009, Fiscal 2008 and Fiscal 2007, respectively.
52
Table of Contents
ANNTAYLOR STORES CORPORATION
NOTES TO CONSOLIDATED FINANCIAL STATEMENTS—(Continued)
1. Summary of Significant Accounting Policies (Continued)
Long-Lived Assets
The Company accounts for long-lived tangible assets under ASC 360-10, Property, Plant, and Equipment. Assessment for possible impairment is based on the Company’s ability to recover the carrying value of the long-lived asset from the expected future pre-tax cash flows (undiscounted and without interest charges). The expected future pre-tax cash flows are estimated based on historical experience, knowledge and market data. Estimates of future cash flows require the Company to make assumptions and to apply judgment, including forecasting future sales and expenses and estimating useful lives of the assets. These estimates can be affected by factors such as, but not necessarily limited to, future store results, real estate demand, and economic conditions that can be difficult to predict. If the expected future cash flows related to the long-lived assets are less than the assets’ carrying value, an impairment loss is recognized for the difference between estimated fair value and carrying value.
In Fiscal 2009, Fiscal 2008 and Fiscal 2007, the Company recorded store asset impairment charges of $27.3 million, $66.8 million and $26.9 million, respectively of which approximately $15.3 million, $29.6 million and $1.8 million, respectively related to assets in stores that will remain open, with the balance in each fiscal year associated with stores closing in connection with the Company’s restructuring program. See Note 2, “Restructuring Charges”, for further discussion.
Goodwill
The Company adopted amendments to ASC 350-10, Intangibles – Goodwill and Other, on February 3, 2002. ASC 350-10 requires that goodwill and other indefinite-lived intangible assets be tested for impairment at least on an annual basis. The Company has three reporting units, as defined under ASC 350-10, including Ann Taylor, LOFT and Ann Taylor Factory/LOFT Outlet stores. The $286.6 million in recorded goodwill resided under the Company’s Ann Taylor reporting unit.
Through Fiscal 2007, the Company performed annual impairment testing during the fourth quarter. The deterioration in the financial and housing markets and resulting effect on consumer confidence and discretionary spending that occurred during the second half of Fiscal 2008 had a significant impact on the retail industry, particularly for women’s specialty apparel retailers. As a result, the Company considered the impact this had on its business as an indicator under ASC 350-10 that a reduction in its goodwill fair value may have occurred. Accordingly, the Company performed an interim test for goodwill impairment during the third quarter of Fiscal 2008 following the two step process defined in ASC 350-10, and concluded that the recorded goodwill value was not impaired as of November 1, 2008.
During the fourth quarter of Fiscal 2008, there was further deterioration in the financial and credit markets, which continued to weigh on consumer confidence and resulted in additional declines in discretionary retail spending. This impacted the Company’s Fiscal 2008 fourth quarter business in a significant way, which caused management to revise its forward-looking business projections downward. These updated projections were used to perform the Company’s annual test for goodwill impairment during the fourth quarter. Based on this testing, management determined that the fair value of the Ann Taylor reporting unit was less than its carrying value. Accordingly, management performed an analysis to determine the extent of the goodwill impairment and concluded that the carrying value of the goodwill of the Ann Taylor reporting unit was fully impaired. This resulted in a non-cash goodwill impairment charge of $286.6 million in the fourth quarter of Fiscal 2008.
Advertising
Costs associated with the production of advertising, such as printing and other costs, as well as costs associated with communicating advertising that has been produced, such as magazine ads, are expensed when the advertising first appears in print. Costs of direct mail catalogs and postcards are fully expensed when the advertising is scheduled to first arrive in clients’ homes. Advertising costs were approximately $60.8 million, $60.7 million and $63.4 million in Fiscal 2009, Fiscal 2008 and Fiscal 2007, respectively.
53
Table of Contents
ANNTAYLOR STORES CORPORATION
NOTES TO CONSOLIDATED FINANCIAL STATEMENTS—(Continued)
1. Summary of Significant Accounting Policies (Continued)
Stock-based Awards
The Company accounts for stock-based awards in accordance with ASC 718-10, Compensation – Stock Compensation. ASC 718-10 requires the Company to calculate the grant-date fair value and recognize that calculated value as compensation expense over the vesting period, adjusted for estimated forfeitures.
Income Taxes
The Company accounts for income taxes in accordance with ASC 740-10, Income Taxes, which requires the use of the asset and liability method. Under the asset and liability method, deferred tax assets and liabilities are recognized and income or expense is recorded, for the estimated future tax consequences attributable to differences between the financial statement carrying value of existing assets and liabilities and their respective tax bases. No valuation allowance has been provided for deferred tax assets, since management anticipates that the full amount of these assets will be realized in the future. In determining the need for a valuation allowance, management is required to make assumptions and to apply judgment, including forecasting future earnings, taxable income, and the mix of earnings in the jurisdictions in which the Company operates.
The Company and its domestic subsidiaries file a consolidated Federal income tax return, while the Company’s foreign subsidiaries file in their respective local jurisdictions.
In July 2006, the Financial Accounting Standards Board (“FASB”) issued amendments to ASC 740-10, which clarified the accounting for income taxes in the financial statements by prescribing a minimum probability recognition threshold and measurement process for recording uncertain tax positions taken or expected to be taken in a tax return. Additionally, these amendments to ASC 740-10 provided guidance on derecognition, classification, accounting and disclosure requirements. The Company adopted these amendments to ASC 740-10 on February 4, 2007, which resulted in a cumulative effect reduction to opening retained earnings of $1.1 million.
Segments
The Company has aggregated its Ann Taylor and LOFT brands, and its retail, outlet and internet channels of distribution, (collectively “the Company’s brands”) based on the aggregation criteria outlined in ASC 280-10, which states that two or more operating segments may be aggregated into a single operating segment if aggregation is consistent with the objective and basic principles of the Statement, if the segments have similar economic characteristics, similar product, similar production processes, similar clients and similar methods of distribution.
The Company’s brands have similar economic characteristics and similar operating, financial and competitive risks. They are similar in nature of product, as they all offer women’s apparel, shoes and accessories. Merchandise inventory for the Company’s brands is sourced from the same countries and some of the same vendors, using similar production processes. Clients of the Company’s brands have similar characteristics. Merchandise for the Company’s brands is distributed to retail stores in a similar manner through the Company’s Louisville Distribution Center and is subsequently distributed to clients in a similar manner, through its retail and outlet stores. The Company also sells Ann Taylor and LOFT merchandise through its Online Stores.
Comprehensive Income
Comprehensive income consists of two components, net income/(loss) and other comprehensive income/(loss). Other comprehensive income/(loss) refers to gains and losses that under generally accepted accounting principles are recorded as an element of stockholders’ equity but are excluded from net income/(loss). During Fiscal 2009, the only impact to the Company’s accumulated other comprehensive income/(loss) related to the Company’s defined benefit pension plan, the accounting for which is in accordance with ASC 715-20, Compensation – Retirement Benefits. See Note 10, “Retirement Plans”, for further discussion.
54
Table of Contents
ANNTAYLOR STORES CORPORATION
NOTES TO CONSOLIDATED FINANCIAL STATEMENTS—(Continued)
1. Summary of Significant Accounting Policies (Continued)
Fair Value of Financial Instruments
ASC 825-10, Financial Instruments, requires management to disclose the estimated fair value of certain assets and liabilities defined by ASC 825-10 as financial instruments. At January 30, 2010 and January 31, 2009, management believes that the carrying value of cash and cash equivalents, short-term investments, receivables and payables approximates fair value, due to the short maturity of these financial instruments.
Self Insurance
The Company is self-insured for certain losses related to its employee point of service medical plan, its workers’ compensation plan and for short-term disability up to certain thresholds. Costs for self-insurance claims filed, as well as claims incurred but not reported, are accrued based on management’s estimates, using information received from plan administrators, third party actuaries, historical analysis and other relevant data. Management believes that it has adequately reserved for its self-insurance liability, which is capped through the use of stop loss contracts with insurance companies. However, any significant variation from historical trends in claims incurred but not paid could cause actual expense to differ from the accrued liability.
Recent Accounting Pronouncements
Recently Issued Standards
In October 2009, the FASB issued Accounting Standards Update (“ASU”) 2009-13, Multiple Deliverable Revenue Arrangements. ASU 2009-13 amends ASC 605-10, Revenue Recognition, and addresses accounting for multiple-deliverable arrangements to enable vendors to account for products or services (deliverables) separately rather than as a combined unit, and provides guidance on how to measure and allocate arrangement consideration to one or more units of accounting. ASU 2009-13 is effective for revenue arrangements entered into or materially modified in fiscal years beginning on or after June 15, 2010. Early adoption is permitted, but certain requirements must be met. The Company may elect, but is not required, to adopt ASU 2009-13 retrospectively for all prior periods upon adoption. The Company is in the process of evaluating ASU 2009-13 and does not expect it will have a significant impact on its Consolidated Financial Statements.
In June 2009, the FASB issued ASU 2009-16, Transfers and Servicing, which seeks to improve financial reporting by providing a short-term solution to address inconsistencies in practice, such as eliminating the exceptions for qualifying special-purpose entities from the consolidation guidance. ASU 2009-16 is effective for annual financial periods beginning after November 15, 2009, and interim periods within that initial annual period and thereafter, and shall be applied prospectively. Early adoption is prohibited. The Company is in the process of evaluating ASU 2009-16 and does not expect it will have a significant impact on its Consolidated Financial Statements.
In June 2009, the FASB issued ASU 2009-17, Consolidations, which seeks to improve financial reporting by requiring that entities perform an analysis to determine whether any variable interest or interests that they have give them a controlling financial interest in a variable interest entity. ASU 2009-17 is effective for annual financial periods beginning after November 15, 2009, and interim periods within that initial annual period and thereafter, and shall be applied prospectively. Early adoption is prohibited. The Company is in the process of evaluating ASU 2009-17 and does not expect it will have a significant impact on its Consolidated Financial Statements.
Recently Adopted Standards
In February 2010, the FASB issued ASU 2010-09, Subsequent Events. ASU 2010-09 amends ASC 855-10, Subsequent Events, by removing the requirement for SEC filers to disclose the date through which subsequent events have been evaluated. The Company adopted ASU 2010-09 immediately upon its issuance in February 2010, and its provisions are reflected in the Company’s Consolidated Financial Statements for Fiscal 2009. Except for the removal of the date subsequent events were evaluated through in Note 1, “Summary of Significant Accounting Policies”, the adoption of ASU 2010-09 did not have any impact on the Company’s Consolidated Financial Statements.
55
Table of Contents
ANNTAYLOR STORES CORPORATION
NOTES TO CONSOLIDATED FINANCIAL STATEMENTS—(Continued)
1. Summary of Significant Accounting Policies (Continued)
Recent Accounting Pronouncements (Continued)
Recently Adopted Standards (Continued)
In May 2009, the FASB issued amendments to ASC 855-10, Subsequent Events, which establish general standards of accounting for and disclosure of events that occur after the balance sheet date but before financial statements are issued or are available to be issued. The amendments to ASC 855-10 introduce the concept of financial statements being available to be issued, and required the disclosure of the date through which an entity has evaluated subsequent events and the basis for that date, that is, whether that date represents the date the financial statements were issued or were available to be issued. The Company adopted the amendments to ASC 855-10 during the second quarter of Fiscal 2009, but the Company’s adoption of ASU 2010-09, discussed above, eliminated any impact that these amendments to ASC 855-10 had on the Company’s Consolidated Financial Statements.
In January 2010, the FASB issued ASU 2010-06, Fair Value Measurements and Disclosures. ASU 2010-06 amends ASC 820-10, Fair Value Measurements and Disclosures, and requires new disclosures surrounding certain fair value measurements. ASU 2010-06 is effective for the first interim or annual reporting period beginning on or after December 15, 2009, except for certain disclosures about purchases, sales, issuances, and settlements in the rollforward of activity in Level 3 fair value measurements, which are effective for the first interim and annual reporting periods beginning on or after December 15, 2010. The Company has chosen to early adopt the disclosure requirements of ASU 2010-06, except for the disclosures that are required to be adopted for the first interim and annual reporting periods beginning on or after December 15, 2010, which the Company intends to adopt when required. The adoption of ASU 2010-06 did not have a material impact on the Company’s Consolidated Financial Statements. See Note 10, “Retirement Plans”, for the additional disclosures required under these amendments to ASC 2010-06.
In January 2010, the FASB issued ASU 2010-02, Accounting and Reporting for Decreases in Ownership of a Subsidiary – a Scope Clarification. ASU 2010-02 amends ASC 810-10, Consolidation, and addresses the accounting for non-controlling interests and changes in ownership interests of a subsidiary. ASU 2010-02 is effective for the first interim or annual reporting period ending on or after December 15, 2009, and must be retrospectively applied to interim or annual reporting periods beginning on or after December 15, 2008. The Company adopted ASU 2010-02 during the fourth quarter of Fiscal 2009. The adoption of ASU 2010-02 did not have any impact on its Consolidated Financial Statements.
In August 2009, the FASB issued ASU 2009-05, Measuring Liabilities at Fair Value. ASU 2009-05 amends ASC 820-10, Fair Value Measurements and Disclosures, as it relates to the fair value measurement of liabilities, and provides clarification of the accounting for circumstances in which a quoted price in an active market for an identical liability is not available. ASU 2009-05 is effective for the first reporting period (including interim periods) after its issuance. The Company adopted ASU 2009-05 during the third quarter of Fiscal 2009. The adoption of ASU 2009-05 did not have a material impact on the Company’s Consolidated Financial Statements.
In June 2009, the FASB issued ASC 105-10, Generally Accepted Accounting Principles, which became the source of authoritative generally accepted accounting principles in the United States, superseding all then-existing non-SEC accounting and reporting standards. All other non-grandfathered, non-SEC accounting literature not included in the ASC became non-authoritative. The Company adopted ASC 105-10 during the third quarter of Fiscal 2009. The adoption of ASC 105-10 impacted the Company’s disclosures by eliminating all references to pre-Codification standards, but did not otherwise impact the Company’s Consolidated Financial Statements.
In June 2009, the Securities and Exchange Commission (“SEC”) issued Staff Accounting Bulletin (“SAB”) No. 111, Other Than Temporary Impairment of Certain Investments in Debt and Equity Securities. SAB No. 111 clarifies the SEC’s position related to other-than-temporary impairments of debt and equity securities and was issued in order to make the relevant interpretive SEC guidance consistent with current authoritative accounting and auditing guidance and SEC rules and regulations. The Company adopted SAB No. 111 on June 4, 2009, the date of its issuance. The adoption of SAB No. 111 did not have any impact on the Company’s Consolidated Financial Statements.
56
Table of Contents
ANNTAYLOR STORES CORPORATION
NOTES TO CONSOLIDATED FINANCIAL STATEMENTS—(Continued)
1. Summary of Significant Accounting Policies (Continued)
Recent Accounting Pronouncements (Continued)
Recently Adopted Standards (Continued)
In April 2009, the FASB issued amendments to ASC 825-10, Financial Instruments, which require disclosures about the fair value of financial instruments for interim reporting periods of publicly traded companies as well as in annual financial statements. The amendments to ASC 825-10 also require those disclosures in summarized financial information at interim reporting periods. The amendments to ASC 825-10 are effective for interim reporting periods ending after June 15, 2009 and do not require disclosures for earlier periods presented for comparative purposes at initial adoption. In periods after initial adoption, comparative disclosures are only required for periods ending after initial adoption. The Company adopted the amendments to ASC 825-10 during the second quarter of Fiscal 2009. See Note 3, “Investments”, for the additional disclosures required under these amendments to ASC 825-10.
In April 2009, the FASB issued amendments to ASC 320-10, Investments – Debt and Equity Securities, which impact the other-than-temporary impairment guidance in U.S. generally accepted accounting principles (“GAAP”) for debt securities to make the guidance more operational and improve the presentation and disclosure of other-than-temporary impairment on debt and equity securities in the financial statements. The amendments to ASC 320-10 do not affect existing recognition and measurement guidance related to other-than-temporary impairment of equity securities. The amendments to ASC 320-10 are effective for interim reporting periods ending after June 15, 2009 and do not require disclosures for earlier periods presented for comparative purposes at initial adoption. In periods after initial adoption, comparative disclosures are only required for periods ending after initial adoption. The Company adopted the amendments to ASC 320-10 during the second quarter of Fiscal 2009. The adoption of the amendments to ASC 320-10 did not have any impact on its Consolidated Financial Statements.
In April 2009, the FASB issued amendments to ASC 820-10, Fair Value Measurements and Disclosures, which provide guidance for estimating fair value when the volume and level of activity for an asset or liability have significantly decreased and identify circumstances that indicate when a transaction is not orderly. The amendments to ASC 820-10 are effective for interim reporting periods ending after June 15, 2009, and do not require disclosures for earlier periods presented for comparative purposes at initial adoption. In periods after initial adoption, comparative disclosures are only required for periods ending after initial adoption. The Company adopted the amendments to ASC 820-10 during the second quarter of Fiscal 2009. See Note 3, “Investments”, for required disclosure.
In December 2008, the FASB issued amendments to ASC 715-20, Compensation – Retirement Benefits, which require additional detailed disclosures about the assets of a defined benefit pension or other postretirement plan. The amendments to ASC 715-20 are effective for fiscal years ending after December 15, 2009. The Company adopted the amendments to ASC 715-20 during the fourth quarter of Fiscal 2009. See Note 10, “Retirement Plans”, for the additional disclosures required under these amendments to ASC 715-20.
In June 2008, the FASB issued amendments to ASC 260-10, Earnings Per Share, which require that unvested share-based payment awards that contain rights to receive nonforfeitable dividends (whether paid or unpaid) be considered participating securities and included in the two-class method of computing earnings per share. The amendments to ASC 260-10 are effective for fiscal years beginning after December 15, 2008, and interim periods within those years. The Company adopted the amendments to ASC 260-10 on February 1, 2009. The adoption of the amendments to ASC 260-10 impacted the determination and reporting of earnings per share by requiring the inclusion of unvested restricted stock and performance restricted stock as participating securities, since they have the right to share in dividends, if declared, equally with common shareholders. The amendments to ASC 260-10 also require retroactive application to previously reported earnings per share amounts. Including these shares in the Company’s earnings per share calculation during periods of net income has the effect of diluting both its basic and diluted earnings per share. However, in periods of net loss, no effect is given to the participating securities, since they do not have an obligation to share in the losses of the Company. See Note 7, “Net (Loss)/Income Per Share”, for further discussion.
57
Table of Contents
ANNTAYLOR STORES CORPORATION
NOTES TO CONSOLIDATED FINANCIAL STATEMENTS—(Continued)
1. Summary of Significant Accounting Policies (Continued)
Recent Accounting Pronouncements (Continued)
Recently Adopted Standards (Continued)
In September 2006, the FASB issued amendments to ASC 820-10, Fair Value Measurements and Disclosures. Subsequently, in February 2008, the portion of these amendments related to non-financial assets and non-financial liabilities that are recognized or disclosed at fair value in the financial statements on a non-recurring basis was deferred by the FASB for one year. The Company adopted the partially deferred portion of the amendments to ASC 820-10 on February 1, 2009. See Note 3, “Investments”, for additional disclosures required under these amendments to ASC 820-10.
2. Restructuring Charges
On January 30, 2008, the Company initiated a multi-year strategic restructuring program (the “Restructuring Program”) designed to enhance profitability and improve overall operating effectiveness. This program was subsequently expanded during the third quarter of Fiscal 2008 and again during the second quarter of Fiscal 2009. The three key elements of the Company’s Restructuring Program include: (1) closing underperforming stores; (2) an organizational streamlining that reduced the Company’s corporate and field staffing levels; and (3) a broad-based productivity initiative that included, among other things, centralized procurement of non-merchandise goods and services, outsourcing certain activities and optimizing store productivity and effectiveness.
In connection with the store closing component of the Company’s Restructuring Program, the Company initially identified 117 stores for closure over the Fiscal 2008 to Fiscal 2010 period. In connection with the subsequent expansion of the Company’s restructuring program, the Company identified an additional 108 stores for closure, and now expect to close approximately 225 stores under its Restructuring Program, with a total of approximately 174 of these stores expected to close over the original Fiscal 2008 to Fiscal 2010 period and the balance expected to close in Fiscal 2011 and beyond. Through January 30, 2010, the Company has closed a total of 102 stores under its Restructuring Program, with 42 of these stores closed during Fiscal 2009. By division, the Company closed 33 Ann Taylor stores and 27 LOFT stores during Fiscal 2008, and 18 Ann Taylor stores and 24 LOFT stores during Fiscal 2009.
As part of the organizational streamlining component of its Restructuring Program, the Company eliminated approximately 600 positions over the Fiscal 2007 to Fiscal 2009 period, of which 180 positions were eliminated in Fiscal 2007, 260 positions were eliminated in Fiscal 2008, and 160 positions were eliminated in Fiscal 2009.
The Company expects total pre-tax expenses associated with its restructuring initiatives to be in the range of $130 to $140 million, of which approximately $85 million are non-cash expenses, primarily associated with the write-down of assets related to store closures, and approximately $45 to $55 million are cash charges for severance and various other costs. In Fiscal 2009, Fiscal 2008 and Fiscal 2007, the Company recorded $36.4 million, $59.7 million and $32.3 million, respectively, in restructuring charges. The balance of $2 to $12 million is expected to be incurred in Fiscal 2010. The above estimated costs and charges, to the extent they have not already been incurred, are preliminary and may vary materially based on various factors, including, among other things, timing in execution of the restructuring program, outcome of negotiations with landlords and other third parties and changes in the Company’s assumptions and projections.
58
Table of Contents
ANNTAYLOR STORES CORPORATION
NOTES TO CONSOLIDATED FINANCIAL STATEMENTS—(Continued)
2. Restructuring Charges (Continued)
The following table details information related to restructuring charges recorded during Fiscal 2009, Fiscal 2008 and Fiscal 2007:
| Severance and Related Costs |
Asset Impairment (1) |
Other Restructuring Costs |
Total | |||||||||||||
| (in thousands) | ||||||||||||||||
| Balance at February 3, 2007 |
$ | — | $ | — | $ | — | $ | — | ||||||||
| Restructuring provision net current year charges |
(4,227 | ) | (25,150 | ) | (2,878 | ) | (32,255 | ) | ||||||||
| Cash payments |
— | — | 2,800 | 2,800 | ||||||||||||
| Non-cash adjustments |
— | 25,150 | (422 | ) | 24,728 | |||||||||||
| Balance at February 2, 2008 |
$ | (4,227 | ) | $ | — | $ | (500 | ) | $ | (4,727 | ) | |||||
| Restructuring provision net current year charges |
(14,792 | ) | (37,255 | ) | (7,667 | ) | (59,714 | ) | ||||||||
| Cash payments |
9,276 | — | 4,085 | 13,361 | ||||||||||||
| Non-cash adjustments |
— | 37,255 | 2,520 | 39,775 | ||||||||||||
| Balance at January 31, 2009 |
$ | (9,743 | ) | $ | — | $ | (1,562 | ) | $ | (11,305 | ) | |||||
| Restructuring provision net current year charges (2) |
(7,821 | ) | (12,012 | ) | (16,535 | ) | (36,368 | ) | ||||||||
| Cash payments |
15,182 | — | 7,043 | 22,225 | ||||||||||||
| Non-cash adjustments |
— | 12,012 | 6,653 | 18,665 | ||||||||||||
| Balance at January 30, 2010 |
$ | (2,382 | ) | $ | — | $ | (4,401 | ) | $ | (6,783 | ) | |||||
| (1) | Asset impairment charges represent the write-down of store assets to their estimated fair value for those store locations identified for closure under the Company’s restructuring program. See Note 1, “Long-Lived Assets”, for information related to store asset impairment charges not related to the Company’s restructuring program. |
| (2) | Other restructuring charges include the write-down of corporate assets disposed of in connection with the sublet of the Company’s excess corporate office space in New York City, as well as the estimated loss, net of sublet income, associated with that same sublet of excess office space in New York City. |
3. Investments
At both January 30, 2010 and January 31, 2009, the Company had $6.0 million invested in auction rate securities, with a fair market value of $5.6 million and $5.8 million, respectively. The approximate net carrying value of $5.6 million and $5.8 million at January 30, 2010 and January 31, 2009, respectively, represents the Company’s best estimate of the fair value of these investments based on available information on those dates. As of January 30, 2010, there was insufficient observable auction rate security market information available to determine the fair value of the auction rate securities or the right obtained in the Company’s settlement with UBS, as discussed below. As such, the auction rate securities and the right obtained in the Company’s settlement with UBS were deemed to require valuation using Level 3 inputs. Consistent with ASC 820-10, the Company valued the auction rate securities using analyses and pricing models similar to those used by market participants (i.e., buyers, sellers, and the broker-dealers responsible for execution of the Dutch auction pricing mechanism by which each issue’s interest rate was set).
The Company liquidated $9.1 million in auction rate securities in February and March 2008; however, auctions for its remaining $6.0 million investment have since failed. While the Company does not believe that the underlying securities or collateral have been affected, unsuccessful auctions limit the short-term liquidity of these investments; therefore, the Company classified the net carrying value of its remaining investment in auction rate securities as long-term, included in other assets on its Consolidated Balance Sheets at January 31, 2009.
59
Table of Contents
ANNTAYLOR STORES CORPORATION
NOTES TO CONSOLIDATED FINANCIAL STATEMENTS—(Continued)
3. Investments (Continued)
On November 14, 2008, the Company entered into a settlement agreement with UBS AG (“UBS”), one of its investment providers, related to its $6.0 million investment in auction rate securities purchased from UBS. Under the terms of the settlement agreement, the Company received auction rate security rights that enable it to sell its auction rate securities back to UBS at par value anytime during the two year period beginning June 30, 2010. The Company recorded these auction rate security rights as a put option. The auction rate securities will continue to accrue and pay interest until such time as the Company exercises its rights. If the Company does not exercise its rights by July 2, 2012, they will expire and UBS will have no further obligation to the Company. Under the terms of the settlement agreement, the Company released UBS from all claims related to these securities except consequential damages, and agreed not to serve as a class action representative or receive benefits under any class action settlement or investor fund. UBS has the right to purchase the auction rate securities at par value from the Company at any time after November 14, 2008 without prior notice. No such purchases were made as of the date of this report.
Since the Company intends to exercise its auction rate security rights as soon as practicably possible, as of January 30, 2010, the Company reclassified the net carrying value of its remaining investment in auction rate securities as short-term, included in short-term investments on its Consolidated Balance Sheets. The Company does not believe that the carrying value of its remaining investment in auction rate securities, which are rated A or higher by Standard & Poor’s and backed by student loans, has been impaired.
In addition, as a result of the settlement agreement with UBS, the Company reclassified these auction rate securities from available-for-sale to trading securities. Due to this reclassification, all previously recorded temporary impairment charges of approximately $0.8 million included in accumulated other comprehensive loss as of November 13, 2008 were charged to earnings in accordance with ASC 320-10, Investments – Debt and Equity Securities and included in interest income on our Consolidated Statements of Operations for the fiscal year ended January 31, 2009. For Fiscal 2009 and Fiscal 2008, the Company recorded total net unrealized losses of approximately $0.1 million and $0.2 million, respectively, which is included in interest income on the Company’s Consolidated Statements of Operations.
The Company elected the fair value option under ASC 825-10 in accounting for the put option, which requires that the instrument be recorded at fair value, with changes in fair value recorded in earnings. As of January 30, 2010 and January 31, 2009, the put option is recorded in “Prepaid expenses and other current assets” and “Other assets” on the Company’s Consolidated Balance Sheets, with an estimated fair value of approximately $0.3 million and $0.2 million, respectively. Approximately $0.1 million and $0.2 million of gains related to this instrument are included in interest income on the Company’s Consolidated Statements of Operations for Fiscal 2009 and Fiscal 2008, respectively.
The estimated fair value of the put option was determined by taking the par value of the auction rate securities less the fair value of those securities and discounting that difference via a discount factor. The discount factor was determined using a combination of the UBS Credit Default Spread and LIBOR. Had the Company not chosen to elect the fair value option under ASC 825-10 in accounting for the put option acquired, the instrument would have been initially recorded at fair value, but would have been recorded at cost subsequent to initial recognition. This, however, would not have allowed the Company to effectively offset any gains or losses associated with the auction rate securities themselves, and was felt to be a less accurate economic reflection of the transaction.
The settlement agreement with UBS also contains a “no net cost” loan provision, which, if elected by the Company, would cause UBS to loan the Company cash up to the par value of the auction rate securities, with interest payable by the Company equal to the interest earned on the underlying auction rate securities. As of January 30, 2010, the Company had no borrowings against its investment in auction rate securities.
At January 30, 2010, the Company had $1.8 million invested in a self-directed Non-Qualified Deferred Compensation Plan (the “Deferred Compensation Plan”) for certain executives and other highly compensated employees, which is structured as a rabbi trust. These investments are classified as trading securities and are recorded as a long-term asset, included in other assets, on the Company’s Consolidated Balance Sheets. The investments are valued using quoted market prices multiplied by the number of shares held in the Deferred Compensation Plan. Unrealized holding gains and losses on trading securities are included in interest income on the Company’s Consolidated Statements of Operations. See Note 10, “Retirement Plans”, for further discussion of the Deferred Compensation Plan.
60
Table of Contents
ANNTAYLOR STORES CORPORATION
NOTES TO CONSOLIDATED FINANCIAL STATEMENTS—(Continued)
3. Investments (Continued)
ASC 820-10 establishes a three-level fair value hierarchy that prioritizes the inputs used to measure fair value. This hierarchy requires entities to maximize the use of observable inputs and minimize the use of unobservable inputs. The three levels of inputs used to measure fair value are as follows:
| • | Level 1 — Quoted prices in active markets for identical assets or liabilities. |
| • | Level 2 — Observable inputs other than quoted prices included in Level 1, such as quoted prices for markets that are not active; or other inputs that are observable or can be corroborated by observable market data. |
| • | Level 3 — Unobservable inputs that are supported by little or no market activity and that are significant to the fair value of the assets or liabilities. This includes certain pricing models, discounted cash flow methodologies and similar techniques that use significant unobservable inputs. |
The following tables segregate all financial assets and liabilities as of January 30, 2010 and January 31, 2009 that are measured at fair value on a recurring basis (at least annually) categorized into the most appropriate level within the fair value hierarchy based on the inputs used to determine the fair value at the measurement date:
| January 30, 2010 |
Quoted Prices in Active Markets for Identical Assets (Level 1) |
Significant Other Observable Inputs (Level 2) |
Significant Unobservable Inputs (Level 3) | |||||||||
| (in thousands) | ||||||||||||
| Non-qualified deferred compensation plan assets (1) |
$ | 1,762 | $ | 1,762 | $ | — | $ | — | ||||
| Auction rate securities (2) |
5,649 | — | — | 5,649 | ||||||||
| Put option on auction rate securities (3) |
349 | — | — | 349 | ||||||||
| Total assets |
$ | 7,760 | $ | 1,762 | $ | — | $ | 5,998 | ||||
| January 31, 2009 |
Quoted Prices in Active Markets for Identical Assets (Level 1) |
Significant Other Observable Inputs (Level 2) |
Significant Unobservable Inputs (Level 3) | |||||||||
| (in thousands) | ||||||||||||
| Non-qualified deferred compensation plan assets (1) |
$ | 1,687 | $ | 1,687 | $ | — | $ | — | ||||
| Auction rate securities (2) |
5,779 | — | — | 5,779 | ||||||||
| Put option on auction rate securities (3) |
208 | — | — | 208 | ||||||||
| Total assets |
$ | 7,674 | $ | 1,687 | $ | — | $ | 5,987 | ||||
| (1) | The Company maintains a self-directed, non-qualified deferred compensation plan structured as a rabbi trust for certain executives and other highly compensated employees. The investment assets of the rabbi trust are valued using quoted market prices multiplied by the number of shares held in the trust. |
| (2) | Auction rate securities are valued using an income-approach model (discounted cash-flow analysis). The model considers factors that reflect assumptions market participants would use in pricing, including, among others: the collateralization underlying the investments; the creditworthiness of the counterparty; expected future cash flows, including the next time the security is expected to have a successful auction; and risks associated with the uncertainties in the current market. The amounts presented exclude accrued interest as of January 30, 2010 and January 31, 2009. Additionally, the Company received certain auction rate security rights from UBS under the terms of its settlement agreement with UBS dated November 14, 2008. |
| (3) | The put option on auction rate securities is valued using a discounted cash-flow analysis. |
61
Table of Contents
ANNTAYLOR STORES CORPORATION
NOTES TO CONSOLIDATED FINANCIAL STATEMENTS—(Continued)
3. Investments (Continued)
The following tables provide a reconciliation of the beginning and ending balances for the Company’s investment in auction rate securities and the related put option for Fiscal 2009 and Fiscal 2008, as these assets are measured at fair value using significant unobservable inputs (Level 3):
| Fiscal period ending | |||||||
| January 30, 2010 |
January 31, 2009 |
||||||
| (in thousands) | |||||||
| Balance as of beginning of period |
$ | 5,987 | $ | — | |||
| Transfers in and/or (out) of Level 3 (1) |
— | 6,000 | |||||
| Total unrealized gains/(losses) included in interest income |
11 | (221 | ) | ||||
| Purchases, sales, acquisitions and settlements, net |
— | 208 | |||||
| Balance as of end of period |
$ | 5,998 | $ | 5,987 | |||
|
|
|||||||
| (1) | Based on the deteriorated market conditions affecting the Company’s investment in auction-rate securities, the Company changed its fair value measurement methodology from quoted prices in active markets to a discounted cash flow model during the first quarter of Fiscal 2008. Accordingly, these securities were valued using Level 3 inputs. |
4. Property and Equipment
Property and equipment consists of the following:
| January 30, 2010 |
January 31, 2009 | |||||
| (in thousands) | ||||||
| Land and building |
$ | 14,260 | $ | 12,491 | ||
| Leasehold improvements |
507,081 | 532,759 | ||||
| Furniture, fixtures, equipment and software |
479,478 | 482,197 | ||||
| Construction in progress |
5,943 | 31,521 | ||||
| 1,006,762 | 1,058,968 | |||||
| Less accumulated depreciation and amortization |
640,828 | 589,281 | ||||
| Net property and equipment |
$ | 365,934 | $ | 469,687 | ||
Depreciation and amortization expense was approximately $104.4 million, $122.2 million and $116.8 million in Fiscal 2009, 2008 and 2007, respectively.
62
Table of Contents
ANNTAYLOR STORES CORPORATION
NOTES TO CONSOLIDATED FINANCIAL STATEMENTS—(Continued)
4. Property and Equipment (Continued)
In accordance with ASC 820-10, the following table segregates all non-financial assets and liabilities that are measured at fair value on a nonrecurring basis in periods subsequent to initial recognition into the most appropriate level within the fair value hierarchy based on the inputs used to determine fair value at the measurement date:
| Total January 30, 2010 |
Quoted Prices in Active Markets for Identical Assets (Level 1) |
Significant Other Observable Inputs (Level 2) |
Significant Unobservable Inputs (Level 3) |
Total Gains (Losses) |
||||||||||||
| (in thousands) | ||||||||||||||||
| Long-lived assets held and used (1) |
$ | 5,272 | $ | — | $ | — | $ | 5,272 | $ | (27,330 | ) | |||||
| Total assets |
$ | 5,272 | $ | — | $ | — | $ | 5,272 | $ | (27,330 | ) | |||||
| (1) | The Company performs impairment tests under the guidance of ASC 360-10, Property, Plant, and Equipment, whenever there are indicators of impairment. These tests typically consider which assets are impaired at a store level. The Company would recognize an impairment loss only if the carrying value of a long-lived asset or group of assets is not recoverable from undiscounted cash flows, and would measure an impairment loss as the difference between the carrying value and fair value of the assets based on discounted cash flows projections. Upon the adoption of ASC 820-10, the Company considered all relevant valuation techniques (e.g., market, income, and cost approaches) that could be obtained without undue cost and effort, and concluded that the discounted cash flow approach continued to provide the most relevant and reliable means by which to determine fair value in this circumstance. The range of discount rates utilized in determining fair value for this purpose was 5.75-12.50%, based upon the corresponding benchmark interest rate associated with the period of remaining cash flows for the individual stores. |
During the fiscal year ended January 30, 2010, long-lived assets held and used with a carrying value of $32.6 million were written down to their fair value, resulting in asset impairment charges of $27.3 million. Of these amounts, approximately $12.0 million and $15.3 million were included in restructuring charges and asset impairment charges, respectively, in the Company’s Consolidated Statements of Operations for Fiscal 2009.
63
Table of Contents
ANNTAYLOR STORES CORPORATION
NOTES TO CONSOLIDATED FINANCIAL STATEMENTS—(Continued)
5. Debt and Capital Leases
Credit Facility
On April 23, 2008, the Company’s wholly owned subsidiary, AnnTaylor, Inc., and certain of its subsidiaries, entered into a Third Amended and Restated $250 million senior secured revolving credit facility with Bank of America N.A. and a syndicate of lenders (the “Credit Facility”), which amended its then existing $175 million senior secured revolving credit facility, which was due to expire in November 2008. The Credit Facility provides for an increase in the total facility and the aggregate commitments thereunder up to $350 million, subject to the lenders’ agreement to increase their commitment for the requested amount. The Credit Facility expires on April 23, 2013 and may be used for working capital, letters of credit and other general corporate purposes. The Credit Facility contains an acceleration clause which, upon the occurrence of a Material Adverse Effect, as defined in the Credit Facility, may cause any borrowings outstanding to become immediately due and payable.
The maximum availability for loans and letters of credit under the Credit Facility is governed by a monthly borrowing base, determined by the application of specified advance rates against certain eligible assets. Commercial and standby letters of credit outstanding under the Credit Facility totaled approximately $13.8 million and $33.8 million as of January 30, 2010 and January 31, 2009, respectively, leaving a remaining available balance for loans and letters of credit of $112.9 million and $115.0 million as of January 30, 2010 and January 31, 2009, respectively. There were no borrowings outstanding under the Credit Facility at January 30, 2010, January 31, 2009, or as of the date of this filing. In March 2009, the Company accessed $125 million from the Credit Facility as a precaution against potential disruption in the credit markets, in the event the Company would need access to cash to meet seasonal working capital requirements. In July 2009, the Company repaid $50 million of these revolver borrowings, and subsequently repaid the remaining $75 million in October 2009.
Amounts outstanding under the Credit Facility bear interest at a rate equal to, at the option of AnnTaylor, Inc., 1) the Base Rate, defined as the higher of the federal funds rate plus a margin of 0.25% or the Bank of America Prime Rate, or 2) the LIBOR Rate, plus a margin of 1.25% to 1.75%, depending on the average daily availability as defined in the Credit Facility. In addition, AnnTaylor, Inc. is required to pay the lenders a monthly commitment fee on the unused revolving loan commitment at a rate ranging from 0.325% to 0.375% per annum. Fees for outstanding commercial and standby letters of credit range from 0.50% to 0.75% and from 1.25% to 1.75%, respectively. The Credit Facility contains financial and other covenants, including limitations on indebtedness and liens, and a fixed charge coverage ratio covenant that is triggered if certain liquidity thresholds are not met.
The Credit Facility permits the Company to pay cash dividends (and permits dividends by AnnTaylor, Inc. to fund such cash dividends) subject to certain Liquidity requirements (as defined in the Credit Facility) and other conditions as set forth in the Credit Facility. Certain subsidiaries of the Company are also permitted to: pay dividends to the Company to fund certain taxes owed by the Company; fund ordinary operating expenses of the Company not in excess of $500,000 in any fiscal year; repurchase common stock held by employees not in excess of $100,000 in any fiscal year (with certain stated exceptions); and for certain other stated purposes (subject to certain exceptions).
The lenders have been granted a pledge of the common stock of AnnTaylor, Inc. and certain of its subsidiaries, and a security interest in substantially all real and personal property (other than leasehold interests) and other assets of AnnTaylor, Inc. and certain of its subsidiaries, as collateral for its obligations under the Credit Facility.
64
Table of Contents
ANNTAYLOR STORES CORPORATION
NOTES TO CONSOLIDATED FINANCIAL STATEMENTS—(Continued)
5. Debt and Capital Leases (Continued)
Capital Lease
In August 2008, the Company entered into a capital lease relating to certain computer equipment with a four year term. The computer equipment was placed in service in February 2009. The following table presents leased assets by major class:
| January 30, 2010 |
January 31, 2009 | ||||||
| (in thousands) | |||||||
| Computer equipment |
$ | 1,638 | $ | 1,638 | |||
| Less accumulated depreciation and amortization |
(328 | ) | — | ||||
| Net property and equipment |
$ | 1,310 | $ | 1,638 | |||
Future minimum lease payments under the capital lease as of January 30, 2010 are as follows:
| Fiscal Year |
(in thousands) | ||
| 2010 |
$ | 424 | |
| 2011 |
424 | ||
| 2012 |
248 | ||
| 2013 |
— | ||
| 2014 |
— | ||
| Thereafter |
— | ||
| Total capital lease obligation |
1,096 | ||
| Less weighted average interest rate of 1.8% on capital lease |
26 | ||
| Total principal, excluding interest |
1,070 | ||
| Less current portion |
408 | ||
| Total long-term obligation, net of current portion |
$ | 662 | |
Other
There was $0.6 million and $2.2 million included in accrued expenses and other current liabilities and $1.0 million and $3.4 million included in other liabilities on the Company’s Consolidated Balance Sheets at January 30, 2010 and January 31, 2009, respectively, related to borrowings for the purchase of fixed assets. In addition, in connection with the sublease of excess corporate office space in New York City, the Company received a $0.6 million deposit, held as restricted cash, which is included in other assets with an offsetting long-term liability included in other liabilities on the Company’s Consolidated Balance Sheet at January 30, 2010.
65
Table of Contents
ANNTAYLOR STORES CORPORATION
NOTES TO CONSOLIDATED FINANCIAL STATEMENTS—(Continued)
6. Commitments and Contingencies
Operating Leases
The Company occupies its retail stores and administrative facilities under operating leases, most of which are non-cancelable. Some of the store leases grant the Company the right to extend the term for one or two additional five-year periods under substantially the same terms and conditions as the original leases. Some store leases also contain early termination options, which can be exercised by the Company under specific conditions. Most of the store leases require payment of a specified minimum rent, plus a contingent rent based on a percentage of the store’s net sales in excess of a specified threshold. In addition, most of the leases require payment of real estate taxes, insurance and certain common area maintenance (“CAM”) costs in addition to the future minimum lease payments. The Company also leases certain office equipment for its corporate offices and store locations under non-cancelable operating leases which generally have 3-year terms.
Future minimum lease payments under non-cancelable operating leases as of January 30, 2010 are as follows:
| Fiscal Year |
(in thousands) | ||
| 2010 |
$ | 180,532 | |
| 2011 |
164,053 | ||
| 2012 |
146,974 | ||
| 2013 |
136,527 | ||
| 2014 |
124,672 | ||
| Thereafter |
356,317 | ||
| Total |
1,109,075 | ||
| Sublease rentals |
20,916 | ||
| Net rentals |
$ | 1,088,159 | |
The minimum lease payments above do not include CAM charges or real estate taxes, which are also required contractual obligations under the Company’s store and office operating leases, but are generally not fixed and can fluctuate from year to year. Total CAM charges and real estate taxes for Fiscal 2009, Fiscal 2008 and Fiscal 2007 were $76.8 million, $81.6 million and $76.2 million, respectively.
Rent expense for the fiscal years ended January 30, 2010, January 31, 2009 and February 2, 2008 was as follows:
| Fiscal Years Ended | |||||||||
| January 30, 2010 |
January 31, 2009 |
February 2, 2008 | |||||||
| (in thousands) | |||||||||
| Minimum rent |
$ | 203,427 | $ | 203,734 | $ | 206,058 | |||
| Percentage rent |
462 | 441 | 3,506 | ||||||
| Total |
$ | 203,889 | $ | 204,175 | $ | 209,564 | |||
Legal Proceedings
The Company is subject to various legal proceedings and claims that arise in the ordinary course of its business. Although the amount of any liability that could arise with respect to these actions cannot be determined with certainty, in the Company’s opinion, any such liability will not have a material adverse effect on its consolidated financial position, consolidated results of operations or liquidity.
66
Table of Contents
ANNTAYLOR STORES CORPORATION
NOTES TO CONSOLIDATED FINANCIAL STATEMENTS—(Continued)
7. Net (Loss)/Income per Share
Basic (loss)/earnings per share is calculated by dividing net (loss)/income associated with common stockholders by the weighted-average number of common shares outstanding during the period. Diluted earnings per share assumes the issuance of additional shares of common stock by the Company upon exercise of all outstanding stock options and contingently issuable securities if the effect is dilutive, in accordance with the treasury stock method discussed in ASC 260-10, Earnings Per Share.
On February 1, 2009, the Company adopted amendments to ASC 260-10, which impacted the determination and reporting of earnings per share by requiring the inclusion of restricted stock and performance restricted stock as participating securities, since they have the right to share in dividends, if declared, equally with common shareholders. During periods of net income, participating securities are allocated a proportional share of net income determined by dividing total weighted average participating securities by the sum of total weighted average common shares and participating securities (“the two-class method”). During periods of net loss, no effect is given to participating securities since they do not share in the losses of the Company. Participating securities have the effect of diluting both basic and diluted earnings per share during periods of net income. The retroactive application of the two-class method resulted in a change to previously reported basic and diluted earnings per share, from $1.55 to $1.52 and from $1.53 to $1.51, respectively, for Fiscal 2007, but did not result in a change to previously reported basic and diluted earnings per share for Fiscal 2008 due to the net loss for the period.
| Fiscal Years Ended | ||||||||||||||||||||||||||||
| January 30, 2010 | January 31, 2009 | February 2, 2008 | ||||||||||||||||||||||||||
| (in thousands, except per share amounts) | ||||||||||||||||||||||||||||
| Basic Earnings per Share |
Net Loss |
Shares | Per Share Amount |
Net Loss |
Shares | Per Share Amount |
Net Income |
Shares | Per Share Amount | |||||||||||||||||||
| Net (loss)/income |
$ | (18,208 | ) | $ | (333,906 | ) | $ | 97,235 | ||||||||||||||||||||
| Less net income associated with participating securities |
— | — | 1,709 | |||||||||||||||||||||||||
| Basic (loss)/earnings per Share |
$ | (18,208 | ) | 56,782 | $ | (0.32 | ) | $ | (333,906 | ) | 57,366 | $ | (5.82 | ) | $ | 95,526 | 62,753 | $ | 1.52 | |||||||||
| Diluted Earnings per Share |
||||||||||||||||||||||||||||
| Net (loss)/income |
$ | (18,208 | ) | $ | (333,906 | ) | $ | 97,235 | ||||||||||||||||||||
| Less net income associated with participating securities |
— | — | 1,696 | |||||||||||||||||||||||||
| Effect of dilutive securities |
— | — | 459 | |||||||||||||||||||||||||
| Basic (loss)/earnings per Share |
$ | (18,208 | ) | 56,782 | $ | (0.32 | ) | $ | (333,906 | ) | 57,366 | $ | (5.82 | ) | $ | 95,539 | 63,212 | $ | 1.51 | |||||||||
Non-participating securities (options and contingently issuable securities) representing 5,231,343 shares of common stock were excluded from the above computations of weighted average shares for diluted loss per share for Fiscal 2009 due to the net loss for the period. Non-participating securities (options) representing 3,772,766 shares of common stock were excluded from the above computations of weighted average shares for diluted loss per share for Fiscal 2008 due to the net loss for the period. Non-participating securities (options) representing 1,012,406 shares of common stock were excluded from the above computations of weighted average shares for diluted earnings per share for Fiscal 2007 due to the antidilutive effect of the securities’ exercise prices as compared to the average market price of the common shares during those periods.
67
Table of Contents
ANNTAYLOR STORES CORPORATION
NOTES TO CONSOLIDATED FINANCIAL STATEMENTS—(Continued)
8. Equity and Stock Incentive Plans
Preferred Stock
At January 30, 2010, January 31, 2009 and February 2, 2008, there were 2 million shares of preferred stock, par value $0.01, authorized and unissued.
Stockholder Rights Plan
In Fiscal 2000, the Company’s Board of Directors adopted a Stockholder Rights Plan (“Rights Plan”). Rights under the Rights Plan (“Rights”) were distributed as a dividend at the rate of one Right for each share of common stock held by stockholders of record as of the close of business on May 30, 2000. As a result of 3-for-2 stock splits of the Company’s common stock that occurred in Fiscal 2004 and Fiscal 2002, each share of common stock now represents four-ninths of a Right. Each Right entitles stockholders to buy one unit of a share of a new series of preferred stock for $125. Under certain circumstances, if a person or group acquires beneficial ownership of 15% or more of the voting power of the Company as represented by the Company’s common stock, or commences a tender or exchange offer upon consummation of which such person or group would beneficially own 15% or more of the voting power of the Company as represented by the Company’s common stock, holders of the Rights, other than the person or group triggering their exercise, will be able to purchase, in exchange for the $125 exercise price, shares of the Company’s common stock or of any company into which the Company is merged having a value of $250. No Rights were exercised under the Rights Plan in Fiscal 2009. The Rights Plan will expire on May 18, 2010, and the Company’s Board of Directors does not currently intend to extend its expiration date.
Repurchase Program
On August 23, 2007, the Company’s Board of Directors approved a $300 million securities repurchase program (the “August 2007 Program”). The August 2007 Program will expire when the Company has repurchased all securities authorized for repurchase pursuant to the program, unless terminated earlier by resolution of the Board of Directors. Purchases of shares of the Company’s common stock may be made from time to time, subject to market conditions and at prevailing market prices, through open market purchases or in privately negotiated transactions. Repurchased shares of common stock increase treasury shares available for general corporate purposes. During Fiscal 2009, no shares were repurchased under the August 2007 program. During Fiscal 2008, the Company repurchased 4,108,183 shares of its common stock at a cost of approximately $100.8 million under the August 2007 Program. During Fiscal 2007, the Company repurchased 9,301,633 shares of its common stock at a cost of approximately $340.1 million. Of this total, 1,347,286 shares at a cost of approximately $40.0 million were repurchased under the August 2007 Program, with 7,952,879 shares at a cost of approximately $300.0 million and 1,468 shares at a cost of approximately $0.1 million repurchased under programs approved in March 2007 and August 2006, respectively. As of January 30, 2010, approximately $159.1 million remained under the August 2007 program.
Associate Discount Stock Purchase Plan
In Fiscal 1999, the Company established an Associate Discount Stock Purchase Plan (the “Stock Purchase Plan”). Under the terms of the Stock Purchase Plan, as amended, eligible employees may purchase shares of the Company’s common stock quarterly, at a price equal to 85% of the lower of the closing price of the Company’s common stock at the beginning or end of each quarterly stock purchase period. Participating employees pay for their stock purchases under the Stock Purchase Plan by authorizing limited payroll deductions of up to a maximum of 15% of their compensation. On May 15, 2008, the Company’s stockholders approved an increase in the number of shares available for purchase under the Stock Purchase Plan by 650,000 shares. During Fiscal 2009, 367,156 shares were issued pursuant to the Stock Purchase Plan, at an average discount of $0.98 per share. At January 30, 2010, there were 263,454 shares available for future issuance under the Stock Purchase Plan. The Company recorded approximately $0.9 million, $1.2 million and $1.0 million in compensation expense related to the Stock Purchase Plan during Fiscal 2009, Fiscal 2008 and Fiscal 2007, respectively.
68
Table of Contents
ANNTAYLOR STORES CORPORATION
NOTES TO CONSOLIDATED FINANCIAL STATEMENTS—(Continued)
8. Equity and Stock Incentive Plans (Continued)
Stock Incentive Plans
The Company has established four stock incentive plans (the “Plans”), which are summarized below:
| Year |
Defined |
Plan Name |
Shares Reserved | Shares Reserved for Issuance at January 30, 2010 |
Shares Available for Future Grant | |||||||
| Restricted Stock (1) |
Total Authorized |
|||||||||||
| 1992 |
1992 Plan | 1992 Stock Option and Restricted Stock and Unit Award Plan |
713,250 | 7,200,000 | 87,188 | — | ||||||
| 2000 |
2000 Plan | 2000 Stock Option and Restricted Stock Award Plan |
562,500 | 2,250,000 | 52,988 | 27,520 | ||||||
| 2001 |
2002 Plan | 2002 Stock Option and Restricted Stock and Unit Award Plan |
787,500 | 4,500,000 | 1,074,500 | 185,283 | ||||||
| 2003 |
2003 Plan | 2003 Equity Incentive Plan |
2,760,000 | 8,750,000 | 5,231,238 | 1,076,883 | ||||||
| (1) | Included in the number of total authorized shares. The Company may issue restricted stock grants up to the levels provided under each plan, however shares not used for this purpose are available for issuance as stock option grants, except for 150,750 shares under the 1992 Plan. |
On May 15, 2008, the Company’s stockholders approved certain amendments to its 2003 Plan, including increasing the total authorized shares reserved for issuance from 5.5 million to 8.75 million shares.
Stock option awards outstanding under the Company’s Plans have been granted at exercise prices which are equal to the market value of the Company’s common stock on the grant date (determined in accordance with the applicable Plan), generally vest over three or four years and expire no later than ten years after the grant date. Each of the Plans also includes an acceleration clause by which all options not exercisable by their terms will, upon the occurrence of certain contingent events, become exercisable. Shares underlying stock award grants are generally issued out of treasury stock. All the Plans allow for restricted stock awards, and the 2002 Plan and 2003 Plan also include restricted unit awards. A restricted unit represents the right to receive a share of common stock and/or the cash value of a share of common stock on the date the restrictions on the restricted unit lapse. The restrictions on restricted stock or restricted unit grants generally lapse over a three or four-year period from the date of the grant. Certain executives also receive performance-based restricted stock grants, which generally vest over three years if certain pre-established goals are met. In the event a grantee terminates employment with the Company, any unvested stock options and any restricted stock or restricted units still subject to restrictions are generally forfeited.
Stock Options
In accordance with amendments to ASC 718-10, Compensation – Stock Compensation, that were adopted in Fiscal 2006, the Company began recognizing stock option expense on a straight-line basis over the vesting period, net of estimated forfeitures. As of January 30, 2010, there was $10.9 million of unrecognized compensation cost related to unvested options, which is expected to be recognized over a remaining weighted-average vesting period of 2.2 years. The total intrinsic value of options exercised during Fiscal 2009 was immaterial. The total intrinsic value of options exercised during Fiscal 2008 and Fiscal 2007 was approximately $2.1 million and $7.7 million, respectively.
69
Table of Contents
ANNTAYLOR STORES CORPORATION
NOTES TO CONSOLIDATED FINANCIAL STATEMENTS—(Continued)
8. Equity and Stock Incentive Plans (Continued)
Stock Options (Continued)
The following table summarizes stock option activity for the fiscal year ended January 30, 2010:
| Shares | Weighted - Average Exercise Price | |||||
| Options outstanding at January 31, 2009 |
3,475,926 | $ | 26.90 | |||
| Granted (1) |
2,372,500 | 6.73 | ||||
| Forfeited or expired |
(680,651 | ) | 24.80 | |||
| Exercised |
(11,547 | ) | 9.65 | |||
| Options outstanding at January 30, 2010 |
5,156,228 | $ | 17.94 | |||
| Vested and exercisable at January 30, 2010 |
2,035,624 | $ | 26.53 | |||
| Options expected to vest at January 30, 2010 |
2,125,170 | $ | 11.11 | |||
|
(1) Options granted during Fiscal 2009 vest annually over a three year period, and expire ten years after the grant date, except for one option grant of 20,000 shares granted during the second quarter of Fiscal 2009, which vests annually over a four year period. | ||||||
The weighted-average fair value of options granted during the fiscal years ended January 30, 2010, January 31, 2009 and February 2, 2008, estimated as of the grant date using the Black-Scholes option pricing model, was $3.49, $8.30 and $12.00 per share, respectively. The weighted-average remaining contractual term for options outstanding at January 30, 2010 and January 31, 2009 was 7.4 and 7.0 years, respectively. The weighted-average remaining contractual term for options vested and exercisable at January 30, 2010 was 5.2 years. The weighted-average remaining contractual term for options expected to vest at January 30, 2010 was 9.0 years. At January 30, 2010, the aggregate intrinsic value of options outstanding, options vested and exercisable and options expected to vest was $14.3 million, $0.1 million, and $10.2 million, respectively.
Option valuation models require the input of highly subjective assumptions, including the expected stock price volatility. The Black-Scholes option pricing model was developed for use in estimating the fair value of traded options, which have no vesting restrictions and are fully transferable. The fair value of options granted under the Company’s Plans was estimated on the date of grant using the Black-Scholes option pricing model with the following assumptions:
| Fiscal Years Ended | |||||||||
| January 30, 2010 |
January 31, 2009 |
February 2, 2008 |
|||||||
| Expected volatility |
63.1 | % | 42.7 | % | 33.1 | % | |||
| Risk-free interest rate |
2.2 | % | 2.5 | % | 4.4 | % | |||
| Expected life (years) |
4.2 | 4.2 | 4.4 | ||||||
| Dividend yield |
— | — | — | ||||||
70
Table of Contents
ANNTAYLOR STORES CORPORATION
NOTES TO CONSOLIDATED FINANCIAL STATEMENTS—(Continued)
8. Equity and Stock Incentive Plans (Continued)
Stock Options (Continued)
The risk-free rate is based on a zero-coupon U.S. Treasury rate in effect at the time of grant with maturity dates that coincide with the expected life of the options. The expected life of the options is based on a calculation of the Company’s historical exercise patterns to estimate future exercise patterns. The expected volatility for grants made subsequent to the adoption of amendments to ASC 718-10 in Fiscal 2006 is based on a simple average of (i) historical volatility of stock price returns using daily closing prices and (ii) the volatility implied by exchange-traded call options to purchase the Company’s common stock, to the extent sufficient data points for the latter are available. Historical volatility was calculated as of the grant date using stock price data over periods of time equal in duration to the expected life of the options granted. In assessing implied volatility data, the Company analyzed call option market activity during the three month period preceding the grant date. The Company also considered the volume of market activity of the underlying shares and traded options, the similarity of the exercise prices of traded options to the exercise price of employee stock options during the period and traded options whose terms are close to the expected term of the employee stock options.
Restricted Stock
In accordance with ASC 718-10, the fair value of restricted stock awards is based on the market price of the Company’s stock on the date of grant (determined in accordance with the applicable Plan) and is amortized to compensation expense on a straight-line basis over the related vesting period, net of estimated forfeitures. As of January 30, 2010, there was $6.2 million of unrecognized compensation cost related to unvested restricted stock awards, which is expected to be recognized over a remaining weighted-average vesting period of 1.2 years. The weighted-average grant date fair value of restricted stock awards granted during the fiscal years ended January 30, 2010, January 31, 2009, and February 2, 2008 was $3.29, $21.39, and $35.02, respectively. The total fair value of restricted stock awards vested during the fiscal years ended January 30, 2010, January 31, 2009 and February 2, 2008 was $1.5 million, $6.9 million and $17.5 million, respectively.
The following table summarizes restricted stock activity for the fiscal year ended January 30, 2010:
| Time - Based | Performance - Based | |||||||||||
| Number of Shares |
Weighted - Average Grant Date Fair Value |
Number of Shares |
Weighted - Average Grant Date Fair Value | |||||||||
| Restricted stock awards at January 31, 2009 |
609,323 | $ | 25.72 | 193,334 | $ | 27.39 | ||||||
| Granted |
1,078,500 | (1) | 3.25 | 352,500 | (2) | 3.43 | ||||||
| Vested |
(215,441 | ) | 27.90 | (5,000 | ) | 23.22 | ||||||
| Forfeited |
(112,205 | ) | 17.90 | (104,332 | ) | 28.48 | ||||||
| Restricted stock awards at January 30, 2010 |
1,360,177 | $ | 8.20 | 436,502 | $ | 7.83 | ||||||
|
|
||||||||||||
| (1) | Of this amount, 610,500 shares vest annually over a three year period, 15,000 shares vest annually over a four year period, and the remaining 453,000 shares vest over a one year period. |
| (2) | These shares vest over a three year period based on achievement of performance targets set bi-annually for each tranche of the grant. Based on Company performance, grantees may earn 75% to 125% of the shares granted with respect to each tranche. If the Company does not achieve the minimum threshold goal associated with such shares, grantees will not earn any shares with respect to that tranche. |
71
Table of Contents
ANNTAYLOR STORES CORPORATION
NOTES TO CONSOLIDATED FINANCIAL STATEMENTS—(Continued)
8. Equity and Stock Incentive Plans (Continued)
General
ASC 718-10 requires forfeitures to be estimated at the time of grant and revised, if necessary, in subsequent periods if actual forfeitures differ from initial estimates. In Fiscal 2009, Fiscal 2008 and Fiscal 2007, stock-based compensation expense was recorded net of estimated forfeitures, such that expense was recorded only for those stock-based awards that are expected to vest.
ASC 718-10 also requires that cash flows resulting from tax deductions in excess of the cumulative compensation cost recognized for stock-based compensation arrangements (“excess tax benefits”) be classified as financing cash flows. For the fiscal year ended January 30, 2010, excess tax benefits realized from stock-based compensation arrangements were $0.3 million. The Company received $0.1 million, $3.9 million and $14.4 million in cash from the exercise of stock options during the fiscal years ended January 30, 2010, January 31, 2009 and February 2, 2008, respectively.
During the fiscal years ended January 30, 2010, January 31, 2009 and February 2, 2008, the Company recognized approximately $16.1 million, $12.6 million and $19.0 million, respectively, in total share-based compensation expense. The total tax benefit recognized in the Consolidated Statements of Operations for the fiscal years ended January 30, 2010, January 31, 2009 and February 2, 2008 was approximately $4.6 million, $3.5 million and $6.1 million, respectively.
9. Income Taxes
The (benefit)/provision for income taxes for the fiscal years ended January 30, 2010, January 31, 2009 and February 2, 2008 consists of the following:
| Fiscal Years Ended | ||||||||||||
| January 30, 2010 |
January 31, 2009 |
February 2, 2008 |
||||||||||
| (in thousands) | ||||||||||||
| Federal: |
||||||||||||
| Current |
$ | (3,397 | ) | $ | (19,252 | ) | $ | 56,109 | ||||
| Deferred |
(6,953 | ) | (17,615 | ) | (7,286 | ) | ||||||
| Total federal |
(10,350 | ) | (36,867 | ) | 48,823 | |||||||
| State and local: |
||||||||||||
| Current |
(12 | ) | 3,880 | 11,279 | ||||||||
| Deferred |
1,960 | (7,222 | ) | (707 | ) | |||||||
| Total state and local |
1,948 | (3,342 | ) | 10,572 | ||||||||
| Foreign: |
||||||||||||
| Current |
579 | 1,545 | 5,778 | |||||||||
| Deferred |
(79 | ) | 1,148 | (1,368 | ) | |||||||
| Total foreign |
500 | 2,693 | 4,410 | |||||||||
| Total |
$ | (7,902 | ) | $ | (37,516 | ) | $ | 63,805 | ||||
72
Table of Contents
ANNTAYLOR STORES CORPORATION
NOTES TO CONSOLIDATED FINANCIAL STATEMENTS—(Continued)
9. Income Taxes (Continued)
The reconciliation between the (benefit)/provision for income taxes and the (benefit)/provision for income taxes at the federal statutory rate for the fiscal years ended January 30, 2010, January 31, 2009 and February 2, 2008 is as follows:
| Fiscal Years Ended | ||||||||||||
| January 30, 2010 |
January 31, 2009 |
February 2, 2008 |
||||||||||
| (dollars in thousands) | ||||||||||||
| (Loss)/income before income taxes |
$ | (26,110 | ) | $ | (371,422 | ) | $ | 161,040 | ||||
| Federal statutory rate |
35 | % | 35 | % | 35 | % | ||||||
| (Benefit)/provision for income taxes at federal statutory rate |
(9,139 | ) | (129,998 | ) | 56,364 | |||||||
| State and local income taxes, net of federal income tax benefit |
685 | (1,468 | ) | 6,872 | ||||||||
| Goodwill impairment charge |
— | 93,412 | — | |||||||||
| Prior year tax credits |
— | 2,391 | — | |||||||||
| Other |
552 | (1,853 | ) | 569 | ||||||||
| (Benefit)/provision for income taxes |
$ | (7,902 | ) | $ | (37,516 | ) | $ | 63,805 | ||||
The tax effects of significant items comprising the Company’s deferred tax assets/(liabilities) as of January 30, 2010 and January 31, 2009 are as follows:
| January 30, 2010 |
January 31, 2009 |
|||||||
| (in thousands) | ||||||||
| Current: |
||||||||
| Inventory |
$ | 7,278 | $ | 3,497 | ||||
| Accrued expenses and other |
12,325 | 14,648 | ||||||
| Real estate |
16,196 | 7,276 | ||||||
| Total current |
$ | 35,799 | $ | 25,421 | ||||
| Non-current: |
||||||||
| Accrued expenses |
$ | 743 | $ | 692 | ||||
| Depreciation and amortization |
(69,827 | ) | (50,799 | ) | ||||
| Rent expense |
74,514 | 86,477 | ||||||
| Other |
14,102 | 10,272 | ||||||
| Amounts included in accumulated other comprehensive loss |
2,567 | 4,713 | ||||||
| Total non-current |
$ | 22,099 | $ | 51,355 | ||||
The income tax (benefit)/provision reflects the current and deferred tax consequences of events that have been recognized in the Company’s Consolidated Financial Statements or tax returns. U.S. federal income taxes are provided on unremitted foreign earnings, except those that are considered permanently reinvested, which at January 30, 2010 amounted to approximately $6.6 million. However, if these earnings were not considered permanently reinvested, under current law, the incremental tax on such undistributed earnings would be approximately $0.7 million.
The Company files income tax returns in the U.S. federal jurisdiction and various state and local jurisdictions and generally remains open to income tax examinations by relevant tax authorities for tax years beginning with Fiscal 2004. The Company also files in foreign jurisdictions and generally remains open to income tax examinations for tax years beginning with Fiscal 2003.
73
Table of Contents
ANNTAYLOR STORES CORPORATION
NOTES TO CONSOLIDATED FINANCIAL STATEMENTS—(Continued)
9. Income Taxes (Continued)
A reconciliation of the beginning and ending amounts of unrecognized tax benefits is as follows:
| (in thousands) | ||||
| Balance at February 4, 2007 |
$ | 5,789 | ||
| Additions based on tax positions related to the current year |
1,002 | |||
| Additions for tax positions of prior years |
817 | |||
| Reductions for tax positions of prior years |
(1,672 | ) | ||
| Lapses in statutes of limitation |
(490 | ) | ||
| Balance at February 2, 2008 |
5,446 | |||
| Additions based on tax positions related to the current year |
355 | |||
| Additions for tax positions of prior years |
223 | |||
| Reductions for tax positions of prior years |
(1,352 | ) | ||
| Settlements |
(1,280 | ) | ||
| Lapses in statutes of limitation |
(320 | ) | ||
| Balance at January 31, 2009 |
3,072 | |||
| Additions based on tax positions related to the current year |
95 | |||
| Additions for tax positions of prior years |
89 | |||
| Settlements |
(152 | ) | ||
| Lapses in statutes of limitation |
(34 | ) | ||
| Balance at January 30, 2010 |
$ | 3,070 | ||
To the extent these unrecognized tax benefits are ultimately recognized, approximately $2.2 million will impact the Company’s effective tax rate in a future period. The Company anticipates that the amount of unrecognized tax benefits may change in the next twelve months. However, it does not expect the change to have a significant impact on its consolidated financial statements.
The Company recognizes accrued interest and penalties related to unrecognized tax benefits in its (benefit)/provision for income taxes. During the fiscal years ended January 30, 2010, January 31, 2009 and February 2, 2008, the Company recognized an immaterial amount of interest and penalties. The Company had approximately $2.0 million and $1.9 million for the payment of interest and penalties accrued at January 30, 2010 and January 31, 2009, respectively.
At January 30, 2010, the Company had net operating loss carryforwards for various state jurisdictions of approximately $30 million, which expire in various years from 2014 through 2029.
The Company is subject to periodic audits of its various tax returns by government agencies, which could result in possible income tax liabilities. Although the outcome of these matters cannot currently be determined, the Company believes adequate provision has been made for any potential unfavorable financial statement impact.
74
Table of Contents
ANNTAYLOR STORES CORPORATION
NOTES TO CONSOLIDATED FINANCIAL STATEMENTS—(Continued)
10. Retirement Plans
Non-Qualified Deferred Compensation Plan
Under the Company’s Deferred Compensation Plan, certain executives, including the named executive officers, may defer up to 50% of their salary as well as up to 100% of cash-based performance compensation earned during the calendar year. Beginning on the anniversary of the executive’s date of hire, the Company will match the amount of the base and bonus compensation deferred by the executive during the Plan year minus the Internal Revenue Code Section 401(a)(17) qualified plan compensation limit as indexed on an annual basis (“Eligible Compensation”). If an executive elects to defer up to 3% of his or her Eligible Compensation, the Company matches 100% of the deferral. If an executive elects to defer more than 3% of his or her Eligible Compensation, the Company matches amounts deferred over 3% and up to 6% of Eligible Compensation at a rate of 50%. Effective January 1, 2010, the Company suspended the match on amounts earned under the plan on or after that date. The amounts deferred by the executive and credited under the executive’s deferred compensation account are at all times fully vested. The Company’s matching deferral credited to an executive’s deferred compensation account vests upon the second anniversary of the executive’s date of hire, or earlier upon a change in control (as defined under the Deferred Compensation Plan).
The Deferred Compensation Plan became effective January 1, 2008 and replaces an earlier non-qualified deferred compensation plan which did not provide for matching employer contributions and under which executives could defer only up to 25% of base salary and 100% of bonus awards, with interest earned on the amounts deferred.
Savings Plan and Pension Plan
In June 2007, the Company’s Board of Directors authorized management to freeze its non-contributory defined benefit Pension Plan (the “Pension Plan”) and enhance its defined contribution 401(k) savings plan (the “401(k) Plan”). These plan changes became effective on October 1, 2007.
Savings Plan
Substantially all employees of the Company and its subsidiaries who work at least 30 hours per week or who work 1,000 hours during a consecutive 12 month period are eligible to participate in the Company’s 401(k) Plan. Prior to October 1, 2007, participants could contribute to the 401(k) Plan an aggregate of up to 75% of their annual earnings in any combination of pre-tax and after-tax contributions, subject to certain limitations. The Company made a matching contribution of 50% with respect to the first 3% of each participant’s contributions to the 401(k) Plan prior to October 1, 2007. Beginning October 1, 2007, the Company match was increased to 100% with respect to the first 3% and 50% with respect to the second 3% of each participant’s contributions to the 401(k) Plan made on or after October 1, 2007. Effective January 1, 2010, the Company suspended its matching contributions under the 401(k) Plan. The Company’s contributions to the 401(k) Plan for Fiscal 2009, Fiscal 2008 and Fiscal 2007 were approximately $5.2 million, $5.6 million and $2.6 million, respectively.
Pension Plan
Substantially all employees of the Company who began employment prior to October 1, 2007, and completed 1,000 hours of service during a consecutive 12 month period prior to that date are eligible for benefits under the Company’s Pension Plan. The Pension Plan calculates benefits based on a career average formula. Only those associates who were eligible under the Pension Plan on or before September 30, 2007 are eligible to receive benefits from the Pension Plan once they have completed the five years of service required to become fully vested. As a result of the Pension Plan freeze, no associate may become a participant in the Pension Plan on or after October 1, 2007, and no additional benefits will be earned under the Pension Plan on or after October 1, 2007.
In connection with the Pension Plan freeze, the Company remeasured its accumulated benefit obligation under the Pension Plan as of October 1, 2007. As a result of the remeasurement, the Pension Plan’s funded status increased and the Company recognized a curtailment gain of $0.9 million.
75
Table of Contents
ANNTAYLOR STORES CORPORATION
NOTES TO CONSOLIDATED FINANCIAL STATEMENTS—(Continued)
10. Retirement Plans (Continued)
Pension Plan (Continued)
On February 3, 2007, the Company began recognizing the funded status of its Pension Plan in accordance with certain amendments to ASC 715-10, Compensation – Retirement Benefits, which require Company plan sponsors to record the net over- or under-funded position of a defined benefit postretirement plan as an asset or liability, with any unrecognized prior service costs, transition obligations or actuarial gains/losses reported as a component of accumulated other comprehensive income in stockholders’ equity. Prior to adopting these amendments to ASC 715-10 on February 3, 2007, the funded status of the Company’s Pension Plan was not reflected in its Consolidated Balance Sheets.
The following table provides information for the Pension Plan at January 30, 2010 and January 31, 2009:
| Fiscal Years Ended | ||||||||
| January 30, 2010 |
January 31, 2009 |
|||||||
| (in thousands) | ||||||||
| Change in benefit obligation: |
||||||||
| Projected benefit obligation at beginning of year |
$ | 34,322 | $ | 38,128 | ||||
| Interest cost |
2,106 | 1,977 | ||||||
| Actuarial loss/(gain) |
1,326 | (678 | ) | |||||
| Benefits paid |
(5,320 | ) | (5,105 | ) | ||||
| Projected benefit obligation at end of year |
32,434 | 34,322 | ||||||
| Change in plan assets: |
||||||||
| Fair value of plan assets at beginning of year |
27,655 | 39,816 | ||||||
| Actual return on plan assets |
6,338 | (7,056 | ) | |||||
| Benefits paid |
(5,320 | ) | (5,105 | ) | ||||
| Fair value of plan assets at end of year |
28,673 | 27,655 | ||||||
| Funded status at end of year |
(3,761 | ) | (6,667 | ) | ||||
| Net amount included in other liabilities |
$ | (3,761 | ) | $ | (6,667 | ) | ||
Amounts recognized in the Company’s Consolidated Balance Sheets consist of:
| January 30, 2010 |
January 31, 2009 |
|||||||
| (in thousands) | ||||||||
| Non-current liabilities |
$ | (3,761 | ) | $ | (6,667 | ) | ||
| Total |
$ | (3,761 | ) | $ | (6,667 | ) | ||
The accumulated benefit obligation for the Company’s Pension Plan was approximately $32.4 million and $34.3 million at January 30, 2010 and January 31, 2009, respectively. As a result of the Pension Plan freeze, the accumulated benefit obligation equals the projected benefit obligation.
76
Table of Contents
ANNTAYLOR STORES CORPORATION
NOTES TO CONSOLIDATED FINANCIAL STATEMENTS—(Continued)
10. Retirement Plans (Continued)
Pension Plan (Continued)
The following table summarizes the components of Net Periodic Benefit Cost and other amounts recognized in accumulated other comprehensive loss:
| Fiscal Years Ended | ||||||||||||
| January 30, 2010 |
January 31, 2009 |
February 2, 2008 |
||||||||||
| (in thousands) | ||||||||||||
| Net periodic benefit cost: | ||||||||||||
| Service cost |
$ | — | $ | — | $ | 4,063 | ||||||
| Interest cost |
2,106 | 1,977 | 2,086 | |||||||||
| Expected return on plan assets |
(1,601 | ) | (2,315 | ) | (2,864 | ) | ||||||
| Amortization of prior service cost |
— | — | 57 | |||||||||
| Amortization of net loss |
1,029 | 50 | 265 | |||||||||
| Settlement loss/curtailment (gain) recognized |
1,249 | 1,829 | (857 | ) | ||||||||
| Net periodic benefit cost |
2,783 | 1,541 | 2,750 | |||||||||
| Other changes in plan assets and benefit obligations recognized in other comprehensive loss: |
||||||||||||
| Net (gain)/loss arising during the year |
(3,411 | ) | 8,693 | (99 | ) | |||||||
| Curtailment gain |
— | — | (3,279 | ) | ||||||||
| Settlement charge |
(1,249 | ) | (1,829 | ) | — | |||||||
| Amortization of net gain |
(1,029 | ) | (50 | ) | (322 | ) | ||||||
| Total recognized in other comprehensive (income)/loss |
(5,689 | ) | 6,814 | (3,700 | ) | |||||||
| Total recognized in net periodic benefit cost and other comprehensive (income)/loss |
$ | (2,906 | ) | $ | 8,355 | $ | (950 | ) | ||||
As a result of the Pension Plan freeze, the Company has no remaining prior service cost that will be amortized from accumulated other comprehensive loss into net periodic benefit cost. For the fiscal years ended January 30, 2010 and January 31, 2009, the total amount of lump sum payments made to plan participants exceeded the interest cost for the year. As a result, in Fiscal 2009 and Fiscal 2008, non-cash settlement charges of $1.2 million and $1.8 million, respectively, were recorded and included in selling, general and administrative expenses in the Company’s Consolidated Statements of Operations. There was no such charge in Fiscal 2007.
Amounts recognized in accumulated other comprehensive loss consist of:
| Fiscal Years Ended | ||||||
| January 30, 2010 |
January 31, 2009 | |||||
| (in thousands) | ||||||
| Net actuarial loss |
$ | 6,726 | $ | 12,415 | ||
| Total |
$ | 6,726 | $ | 12,415 | ||
77
Table of Contents
ANNTAYLOR STORES CORPORATION
NOTES TO CONSOLIDATED FINANCIAL STATEMENTS—(Continued)
10. Retirement Plans (Continued)
Pension Plan (Continued)
For the fiscal years ended January 30, 2010 and January 31, 2009 the following weighted-average assumptions were used to determine benefit obligations at the end of the fiscal years:
| Fiscal Years Ended | ||||||
| January 30, 2010 |
January 31, 2009 |
|||||
| Discount rate |
6.15 | % | 6.75 | % | ||
| Rate of increase in future compensation |
n/a | n/a | ||||
For the fiscal years ended January 30, 2010, January 31, 2009 and February 2, 2008 the following weighted-average assumptions were used to determine net periodic benefit cost for the fiscal years shown:
| Fiscal Years Ended | |||||||||
| January 30, 2010 |
January 31, 2009 |
February 2, 2008 |
|||||||
| Discount rate |
6.75 | % | 5.80 | % | 5.80 | % | |||
| Long-term rate of return on assets |
6.25 | % | 6.25 | % | 7.25 | % | |||
| Rate of increase in future compensation |
n/a | n/a | 4.00 | % | |||||
To develop the expected long-term rate of return on Pension Plan assets, the Company considered the historical returns and the future expectations for returns for each asset class, as well as the target asset allocation of the pension portfolio. The Company assumes that all employees will take lump-sum payouts based on the historical payout trends. The discount rate is developed using the Mercer Yield Curve which consists of spot interest rates for each of the next 30 years and is developed based on pricing and yield information for high quality corporate bonds, whose cash flows mirror the anticipated timing of benefit payments. The yields on these high quality corporate bonds have increased over the past year, resulting in the Company’s discount rate increase.
Since the Pension Plan was frozen in October 2007, its goal is to provide all plan benefits and expenses through growth and income of the Pension Plan’s assets, with such employer contributions as may be required in accordance with applicable rules and regulations. Accordingly, in Fiscal 2008, the Company’s investment policy was revised to meet these objectives and specifies a minimum investment of 50% but not more than 70% in debt securities, a minimum investment of 30% but not more than 50% in equity securities and up to 20% in cash and cash equivalents. Pension Plan assets consist primarily of equity and fixed income funds or cash and equivalents. The equity securities do not include any of the Company’s common stock. The Pension Plan prohibits transactions investing in direct real estate, venture capital, private placements and purchasing securities on margin or short selling securities. Principal investment objectives are: to exceed the policy target index net of fees; to have the equity and fixed income portfolios exceed the Standard & Poor’s 500 Index and the Barclays Capital Aggregate Index, respectively, after fees; and to maintain total portfolio risk equal or less than that of the Pension Plan’s policy target allocation. The Pension Plan’s investment performance guidelines are set and measured against appropriate portfolio benchmarks. The Pension Plan goals, objectives, asset allocation policies and funding forecasts are reviewed periodically within any given plan year, or when significant changes have occurred in Pension Plan benefits, participant demographics or funded status.
78
Table of Contents
ANNTAYLOR STORES CORPORATION
NOTES TO CONSOLIDATED FINANCIAL STATEMENTS—(Continued)
10. Retirement Plans (Continued)
Pension Plan (Continued)
As discussed in Note 3, “Investments”, ASC 820-10 establishes a three-level fair value hierarchy that prioritizes the inputs used to measure fair value. This hierarchy requires entities to maximize the use of observable inputs and minimize the use of unobservable inputs. The investments held by the Company’s Pension Plan and their associated level within the fair value hierarchy are shown below:
| • | Level 1 — Quoted prices in active markets for identical assets or liabilities. |
Mutual funds:
These investments are public investment securities valued using the Net Asset Value (“NAV”), a quoted price in an active market.
| • | Level 2 — Observable inputs other than quoted prices included in Level 1, such as quoted prices for markets that are not active; or other inputs that are observable or can be corroborated by observable market data. |
Money market funds and common collective trusts:
These investments are valued using the NAV provided by the administrators of the funds. The NAV is based on the value of the underlying assets owned by the fund or trust, minus its liabilities, and then divided by the number of shares outstanding. The unit price of this investment is not quoted in an active market. However, the unit price is based on underlying investments which are either traded in an active market or are valued based on observable inputs such as market interest rates and quoted prices for similar securities.
| • | Level 3 — Unobservable inputs that are supported by little or no market activity and that are significant to the fair value of the assets or liabilities. This includes certain pricing models, discounted cash flow methodologies and similar techniques that use significant unobservable inputs. No investments held by the Company’s Pension Plan as of January 30, 2010 required valuation using Level 3 inputs. |
The following table segregates all financial assets and liabilities held by the Company’s Pension Plan as of January 30, 2010 that are measured at fair value on a recurring basis (at least annually) into the most appropriate level within the fair value hierarchy, based on the inputs used to determine fair value at the measurement date:
| January 30, 2010 |
Quoted Prices in Active Markets for Identical Assets (Level 1) |
Significant Other Observable Inputs (Level 2) |
Significant Unobservable Inputs (Level 3) | |||||||||
| (in thousands) | ||||||||||||
| Fixed income mutual funds |
$ | 10,385 | $ | 10,385 | $ | — | $ | — | ||||
| Large cap stock mutual funds |
7,233 | 7,233 | — | — | ||||||||
| Fixed income common collective trusts |
6,977 | — | 6,977 | — | ||||||||
| International stock mutual funds |
2,030 | 2,030 | — | — | ||||||||
| Small cap stock mutual funds |
803 | 803 | — | — | ||||||||
| Real estate mutual funds |
774 | 774 | — | — | ||||||||
| Money market funds |
471 | — | 471 | — | ||||||||
| Total assets |
$ | 28,673 | $ | 21,225 | $ | 7,448 | $ | — | ||||
79
Table of Contents
ANNTAYLOR STORES CORPORATION
NOTES TO CONSOLIDATED FINANCIAL STATEMENTS—(Continued)
10. Retirement Plans (Continued)
Pension Plan (Continued)
The benefits expected to be paid under the Pension Plan as of January 30, 2010 are as follows:
| Fiscal Year |
(in thousands) | ||
| 2010 |
$ | 4,850 | |
| 2011 |
4,195 | ||
| 2012 |
3,398 | ||
| 2013 |
3,228 | ||
| 2014 |
2,845 | ||
| 2015-2019 |
10,830 | ||
The Company made no contributions to the Pension Plan in Fiscal 2009, Fiscal 2008 or Fiscal 2007. Although the Company was not required to make a contribution to the Pension Plan during these periods, depending on the Pension Plan’s funded status, the Company may be required to make a contribution to its Pension Plan in Fiscal 2010.
11. Selected Quarterly Financial Data - Unaudited
| Quarter | ||||||||||||||||
| Fiscal 2009 | First | Second | Third | Fourth | ||||||||||||
| (in thousands, except per share amounts) | ||||||||||||||||
| Net sales |
$ | 426,747 | $ | 470,229 | $ | 462,410 | $ | 469,137 | ||||||||
| Gross margin |
$ | 236,858 | $ | 246,173 | $ | 264,855 | $ | 246,449 | ||||||||
| Net income/(loss) (1) (3) |
$ | (2,314 | ) | $ | (18,004 | ) | $ | 2,069 | $ | 41 | ||||||
| Basic earnings/(loss) per share (4) |
$ | (0.04 | ) | $ | (0.32 | ) | $ | 0.04 | $ | — | ||||||
| Diluted earnings/(loss) per share (4) |
$ | (0.04 | ) | $ | (0.32 | ) | $ | 0.03 | $ | — | ||||||
| Quarter | ||||||||||||||||
| Fiscal 2008 | First | Second | Third | Fourth | ||||||||||||
| (in thousands, except per share amounts) | ||||||||||||||||
| Net sales |
$ | 591,663 | $ | 592,315 | $ | 527,216 | $ | 483,365 | ||||||||
| Gross margin |
$ | 314,925 | $ | 310,202 | $ | 257,156 | $ | 172,523 | ||||||||
| Net income/(loss) (1) (2) (3) |
$ | 25,897 | $ | 29,250 | $ | (13,447 | ) | $ | (375,606 | ) | ||||||
| Basic earnings/(loss) per share (4) |
$ | 0.43 | $ | 0.50 | $ | (0.24 | ) | $ | (6.66 | ) | ||||||
| Diluted earnings/(loss) per share (4) |
$ | 0.43 | $ | 0.50 | $ | (0.24 | ) | $ | (6.66 | ) | ||||||
|
|
||||||||||||||||
| (1) | Includes pre-tax charges related to the Company’s restructuring program of approximately $1.0 million, $31.1 million, $0.6 million, and $3.7 million during the first, second, third, and fourth quarter, respectively, of Fiscal 2009, and $3.7 million, $3.1 million, $19.9 million and $33.0 million during the first, second, third and fourth quarter, respectively, of Fiscal 2008. See Note 2, “Restructuring Charges”, for further discussion. |
| (2) | Includes a pre-tax goodwill impairment charge of approximately $286.6 million during the fourth quarter of Fiscal 2008. See Note 1, “Summary of Significant Accounting Policies”, for further discussion. |
| (3) | Includes pre-tax asset impairment charges of approximately $15.3 million during the third quarter of Fiscal 2009, and $2.8 million and $26.8 million during the third and fourth quarters, respectively, of Fiscal 2008. See Note 1, “Summary of Significant Accounting Policies”, for further discussion. |
| (4) | The sum of the quarterly per share data may not equal the annual amounts due to quarterly changes in the weighted average shares and share equivalents outstanding. |
80
Table of Contents
EXHIBIT INDEX
| Exhibit No. |
Document | |
| 3.1 |
Restated Certificate of Incorporation of the Company (as amended through April 27, 2006). Incorporated by reference to Exhibit 3.1 to the Form 10-Q of the Company for the Quarter ended April 29, 2006 filed on June 7, 2006. | |
| 3.2 |
Bylaws of the Company (as amended through January 27, 2009). Incorporated by reference to Exhibit 3.2 to the Form 8-K of the Company filed on January 30, 2009. | |
| 4.1 |
Amended and Restated Rights Agreement, dated as of May 1, 2001, between the Company and Mellon Investor Services LLC. Incorporated by reference to Exhibit 1 of Form 8-A/A No. 1 of the Company filed on May 24, 2001. | |
| 10.1 |
Third Amended and Restated Credit Agreement, dated as of April 23, 2008 (the “Credit Agreement”), by and among AnnTaylor, Inc., Annco, Inc., AnnTaylor Distribution Services, Inc., AnnTaylor Retail, Inc., the financial institutions from time to time parties thereto, Bank of America, N.A., as Administrative and Collateral Agent, and JPMorgan Chase Bank, N.A., Wachovia Bank, National Association and RBS Citizens, N.A., as Syndication Agents. Incorporated by reference to Exhibit 10.1 to the Form 8-K of the Company filed on April 29, 2008. | |
| 10.2 |
Third Amended and Restated Pledge and Security Agreement, dated as of April 23, 2008, by AnnTaylor, Inc., AnnTaylor Stores Corporation, Annco, Inc., AnnTaylor Distribution Services, Inc., and AnnTaylor Retail, Inc. in favor of Bank of America, N.A., in its capacity as administrative agent for each of the lenders party to the Credit Agreement. Incorporated by reference to Exhibit 10.2 to the Form 8-K of the Company filed on April 29, 2008. | |
| 10.3 |
Third Amended and Restated Parent Guaranty, dated as of April 23, 2008, made by AnnTaylor Stores Corporation in favor of Bank of America, N.A., in its capacity as administrative agent for each of the lenders party to the Credit Agreement. Incorporated by reference to Exhibit 10.3 to the Form 8-K of the Company filed on April 29, 2008. | |
| 10.4 |
Trademark Security Agreement, dated as of April 23, 2008, made by Annco, Inc., in favor of Bank of America, N.A., in its capacity as administrative agent for each of the lenders party to the Credit Agreement. Incorporated by reference to Exhibit 10.4 to the Form 8-K of the Company filed on April 29, 2008. | |
| 10.5.1 |
Trademark License Agreement, dated August 2, 2005, between AnnTaylor, Inc. and Guangzhou Pan Yu San Yuet Fashion Manufactory Ltd. (“San Yuet”). Incorporated by reference to Exhibit 10.1 to the Form 8-K of the Company filed on August 8, 2005. | |
| 10.5.2 |
Trademark Assignment Agreement, dated July 15, 2009, between AnnTaylor Sourcing Far East Limited, Annco, Inc. and San Yuet. Incorporated by reference to Exhibit 10.1 to the Form 10-Q of the Company for the Quarter ended August 1, 2009 filed on August 21, 2009. | |
| 10.6 |
Agreement of Lease, dated as of August 3, 2004, between the Company and No. 1 Times Square Development LLC. Incorporated by reference to Exhibit 10.5 to the Form 10-Q of the Company for the Quarter ended July 31, 2004 filed on September 8, 2004. | |
| 10.7 |
Amended and Restated Tax Sharing Agreement, dated as of November 10, 2003, between the Company and Ann Taylor. Incorporated by reference to Exhibit 10.2 to the Form 10-K of the Company filed on March 25, 2004. | |
| †10.8 |
The AnnTaylor Stores Corporation 1992 Stock Option and Restricted Stock and Unit Award Plan, Amended and Restated as of February 23, 1994 (the “1992 Plan”). Incorporated by reference to Exhibit 10.15 to the Form 10-K of the Company filed on May 1, 1997. | |
| †10.8.1 |
First Amendment to the 1992 Plan, amended as of February 20, 1997. Incorporated by reference to Exhibit 10.15.1 to the Form 10-Q of the Company for the Quarter ended August 2, 1997 filed on September 12, 1997. | |
| †10.8.2 |
January 16, 1998 Amendment to the 1992 Plan, as amended. Incorporated by reference to Exhibit 10 to the Form 8-K of the Company filed on March 13, 1998. | |
81
Table of Contents
ANNTAYLOR STORES CORPORATION
EXHIBIT INDEX
| †10.8.3 |
May 12, 1998 Amendment to the 1992 Plan, as amended. Incorporated by reference to Exhibit 10.16.3 to the Form 10-Q of the Company for the Quarter ended May 2, 1998 filed on June 16, 1998. | |
| †10.8.4 |
Amendment to the 1992 Plan, effective as of March 10, 2000. Incorporated by reference to Exhibit 10.8.4 to the Form 10-K of the Company filed on April 18, 2000. | |
| †10.8.5 |
Second Restated Amendment to the 1992 Plan, effective as of March 9, 2004. Incorporated by reference to Exhibit 10.1 to the Form 10-Q of the Company for the Quarter ended July 31, 2004 filed on September 8, 2004. | |
| †10.8.6 |
Amendment to the 1992 Plan, effective as of January 26, 2006. Incorporated by reference to Exhibit 10.4.8 to the Form 10-K of the Company filed on March 23, 2006. | |
| †10.9 |
The AnnTaylor Stores Corporation 2000 Stock Option and Restricted Stock Award Plan (the “2000 Plan”). Incorporated by reference to Exhibit 10.4 to the Form 10-K of the Company filed on April 1, 2003. | |
| †10.9.1 |
First Amendment to the 2000 Plan, effective as of January 29, 2002. Incorporated by reference to Exhibit 10.18.1 to the Form 10-K of the Company filed on April 4, 2002. | |
| †10.9.2 |
Second Restated Second Amendment to the 2000 Plan, effective as of March 9, 2004. Incorporated by reference to Exhibit 10.2 to the Form 10-Q of the Company for the Quarter ended July 31, 2004 filed on September 8, 2004. | |
| †10.9.3 |
Third Amendment to the 2000 Plan, effective as of January 26, 2006. Incorporated by reference to Exhibit 10.5.5 to the Form 10-K of the Company filed on March 23, 2006. | |
| †10.9.4 |
Fourth Amendment to the 2000 Plan, effective as of March 13, 2008. Incorporated by reference to Exhibit 10.8 to the Form 10-Q of the Company for the Quarter ended May 3, 2008 filed on May 29, 2008. | |
| †10.10 |
The AnnTaylor Stores Corporation 2002 Stock Option and Restricted Stock and Unit Award Plan (the “2002 Plan”). Incorporated by reference to Exhibit 10.9 to the Form 10-K of the Company filed on April 4, 2002. | |
| †10.10.1 |
First Amendment to the 2002 Plan, effective as of March 11, 2003. Incorporated by reference to Exhibit 10.1 to the Form 10-Q of the Company for the Quarter ended May 3, 2003 filed on June 13, 2003. | |
| †10.10.2 |
Second Restated Second Amendment to the 2002 Plan, effective as of March 9, 2004. Incorporated by reference to Exhibit 10.3 to the Form 10-Q of the Company for the Quarter ended July 31, 2004 filed on September 8, 2004. | |
| †10.10.3 |
Third Amendment to the 2002 Plan, effective as of January 26, 2006. Incorporated by reference to Exhibit 10.6.5 to the Form 10-K of the Company filed on March 23, 2006. | |
| †10.10.4 |
Fourth Amendment to the 2002 Plan, effective as of March 13, 2008. Incorporated by reference to Exhibit 10.9 to the Form 10-Q of the Company for the Quarter ended May 3, 2008 filed on May 29, 2008. | |
| †10.11 |
The AnnTaylor Stores Corporation 2003 Equity Incentive Plan (the “2003 Plan”), as amended through August 21, 2008. Incorporated by reference to Exhibit 10.7 to the Form 10-Q of the Company for the Quarter ended August 2, 2008 filed on August 22, 2008. | |
| †10.12 |
Amended and Restated AnnTaylor Stores Corporation Management Performance Compensation Plan (the “ATIP”). Incorporated by reference to Exhibit 10.1 to the Form 8-K filed on May 18, 2007. | |
| †10.12.1 |
Amendment to the ATIP, effective as of March 13, 2008. Incorporated by reference to Exhibit 10.7 to the Form 10-Q of the Company for the Quarter ended May 3, 2008 filed on May 29, 2008. | |
| †10.12.2 |
Second Amendment to the ATIP, effective as of March 5, 2009. Incorporated by reference to Exhibit 10.12.2 to the Form 10-K of the Company filed on March 9, 2009. | |
82
Table of Contents
ANNTAYLOR STORES CORPORATION
EXHIBIT INDEX
| †10.13 |
AnnTaylor Stores Corporation Deferred Compensation Plan, as amended through August 18, 2005. Incorporated by reference to Exhibit 10.1 to the Form 8-K of the Company filed on August 24, 2005. | |
| †10.14 |
AnnTaylor Stores Corporation Non-Qualified Deferred Compensation Plan, effective as of January 1, 2008 (the “2008 Deferred Compensation Plan”). Incorporated by reference to Exhibit 10.42 to the Form 10-K of the Company filed on March 20, 2008. | |
| *†10.14.1 |
Amendment to the 2008 Deferred Compensation Plan, effective as of January 1, 2010. | |
| †10.15 |
AnnTaylor Stores Corporation 2004 Long-Term Cash Incentive Plan (the “LTCIP”). Incorporated by reference to Exhibit B to the Proxy Statement of the Company filed on March 25, 2004. | |
| †10.15.1 |
Amendment to the LTCIP, effective as of March 13, 2008. Incorporated by reference to Exhibit 10.10 to the Form 10-Q of the Company for the Quarter ended May 3, 2008 filed on May 29, 2008. | |
| †10.16 |
AnnTaylor Stores Corporation Special Severance Plan, as amended through August 21, 2008. Incorporated by reference to Exhibit 10.4 to the Form 10-Q of the Company for the Quarter ended November 1, 2008 filed on November 21, 2008. | |
| †10.17 |
Form of 2002 Plan Non-Qualified Stock Option Agreement (Time-Vesting Options for Directors). Incorporated by reference to Exhibit 10.1 to the Form 8-K of the Company filed on October 29, 2004. | |
| †10.18 |
Form of 2003 Plan Non-Statutory Stock Option Agreement (Time-Vesting Options for Directors). Incorporated by reference to Exhibit 10.2 to the Form 8-K of the Company filed on October 29, 2004. | |
| †10.19 |
Form of 2003 Plan Restricted Stock Award Agreement for Non-Employee Directors (Time-Vesting Restricted Stock). Incorporated by reference to Exhibit 10.3 to the Form 8-K of the Company filed on May 16, 2006. | |
| †10.20 |
Form of 2000 Plan Non-Qualified Stock Option Agreement (Time-Vesting Options). Incorporated by reference to Exhibit 10.5 to the Form 10-Q of the Company for the Quarter ended May 5, 2007 filed on June 8, 2007. | |
| †10.21 |
Form of 2002 Plan Non-Qualified Stock Option Agreement (Time-Vesting Options). Incorporated by reference to Exhibit 10.6 to the Form 10-Q of the Company for the Quarter ended May 5, 2007 filed on June 8, 2007. | |
| †10.22 |
Form of 2003 Plan Non-Statutory Stock Option Agreement (Time-Vesting Options). Incorporated by reference to Exhibit 10.1 to the Form 8-K of the Company filed on May 16, 2006. | |
| †10.23 |
Form of 2000 Plan Restricted Stock Award Agreement (Time-Vesting Restricted Stock). Incorporated by reference to Exhibit 10.9 to the Form 10-Q of the Company for the Quarter ended April 29, 2006 filed on June 7, 2006. | |
| †10.24 |
Form of 2002 Plan Restricted Stock Award Agreement (Time-Vesting Restricted Stock). Incorporated by reference to Exhibit 10.7 to the Form 10-Q of the Company for the Quarter ended April 29, 2006 filed on June 7, 2006. | |
| †10.25 |
Form of 2003 Plan Restricted Stock Award Agreement (Time-Vesting Restricted Stock). Incorporated by reference to Exhibit 10.2 to the Form 8-K of the Company filed on May 16, 2006. | |
| †10.26 |
Form of 2002 Plan Restricted Stock Award Agreement (Performance-Vesting Restricted Stock). Incorporated by reference to Exhibit 10.29 to the Form 10-K of the Company filed on April 1, 2005. | |
| †10.27 |
Form of 2003 Plan Restricted Stock Award Agreement (Performance-Vesting Restricted Stock). Incorporated by reference to Exhibit 10.30 to the Form 10-K of the Company filed on April 1, 2005. | |
| †10.28 |
Form of Indemnification Agreement. Incorporated by reference to Exhibit 10.2 to the Form 8-K of the Company filed on August 24, 2005. | |
83
Table of Contents
ANNTAYLOR STORES CORPORATION
EXHIBIT INDEX
| †10.29 |
Summary of Compensation Arrangements for Non-Employee Directors. Incorporated by reference to Exhibit 10.6 to the Form 10-Q of the Company for the Quarter ended May 3, 2008 filed on May 29, 2008. | |
| †10.30 |
Employment Agreement, effective as of October 1, 2005, between the Company and Katherine Lawther Krill. Incorporated by reference to Exhibit 10 to the Form 8-K of the Company filed on November 23, 2005. | |
| †10.30.1 |
Amendment to Employment Agreement, effective as of December 19, 2008, between the Company and Katherine Lawther Krill. Incorporated by reference to Exhibit 10.32.1 to the Form 10-K of the Company filed on March 9, 2009. | |
| †10.31 |
Letter Agreement, executed August 7, 2008, between the Company and Christine Beauchamp. Incorporated by reference to Exhibit 10.1 to the Form 10-Q of the Company for the Quarter ended August 2, 2008 filed on August 22, 2008. | |
| †10.32 |
Letter Agreement, executed November 1, 2008, between the Company and Gary Muto. Incorporated by reference to Exhibit 10.2 to the Form 10-Q of the Company for the Quarter ended November 1, 2008 filed on November 21, 2008. | |
| †10.33 |
Letter Agreement, executed September 10, 2007, between the Company and Michael J. Nicholson. Incorporated by reference to Exhibit 10.1 to the Form 8-K of the Company filed on September 17, 2007. | |
| †10.34 |
Confidentiality, Non-solicitation of Associates and Non-competition Agreement, dated August 7, 2008, between the Company and Christine Beauchamp. Incorporated by reference to Exhibit 10.2 to the Form 10-Q of the Company for the Quarter ended August 2, 2008 filed on August 22, 2008. | |
| †10.35 |
Confidentiality, Non-solicitation of Associates and Non-competition Agreement, dated November 6, 2008, between the Company and Gary Muto. Incorporated by reference to Exhibit 10.1 to the Form 10-Q of the Company for the Quarter ended November 1, 2008 filed on November 21, 2008. | |
| †10.35.1 |
Amendment to Confidentiality, Non-solicitation of Associates and Non-competition Agreement between the Company and Gary Muto, effective November 24, 2008. Incorporated by reference to Exhibit 10.37.1 to the Form 10-K of the Company filed on March 9, 2009. | |
| †10.36 |
Confidentiality, Non-solicitation of Associates and Non-competition Agreement, dated June 9, 2008, between the Company and Brian Lynch. Incorporated by reference to Exhibit 10.5 to the Form 10-Q of the Company for the Quarter ended August 2, 2008 filed on August 22, 2008. | |
| †10.36.1 |
Amendment to Confidentiality, Non-solicitation of Associates and Non-competition Agreement between the Company and Brian Lynch, effective December 18, 2008. Incorporated by reference to Exhibit 10.38.1 to the Form 10-K of the Company filed on March 9, 2009. | |
| †10.37 |
Confidentiality, Non-solicitation of Associates and Non-competition Agreement, dated June 9, 2008, between the Company and Barbara Eisenberg. Incorporated by reference to Exhibit 10.3 to the Form 10-Q of the Company for the Quarter ended August 2, 2008 filed on August 22, 2008. | |
| †10.38 |
Confidentiality, Non-solicitation of Associates and Non-competition Agreement, dated June 9, 2008, between the Company and Michael Nicholson. Incorporated by reference to Exhibit 10.6 to the Form 10-Q of the Company for the Quarter ended August 2, 2008 filed on August 22, 2008. | |
| †10.39 |
Confidentiality, Non-solicitation of Associates and Non-competition Agreement, dated June 9, 2008, between the Company and Adrienne Lazarus. Incorporated by reference to Exhibit 10.4 to the Form 10-Q of the Company for the Quarter ended August 2, 2008 filed on August 22, 2008. | |
| †10.40 |
Letter Agreement, executed October 23, 2008, between the Company and Adrienne Lazarus. Incorporated by reference to Exhibit 10.3 to the Form 10-Q of the Company for the Quarter ended November 1, 2008 filed on November 21, 2008. | |
| *†10.41 |
Form of 2003 Plan Restricted Unit Award Agreement (Time-Vesting Restricted Units). | |
84
Table of Contents
ANNTAYLOR STORES CORPORATION
EXHIBIT INDEX
| *†10.42 |
Form of 2003 Plan Restricted Unit Award Agreement (Performance-Vesting Restricted Units) | |
| 21 |
Subsidiaries of the Company. Incorporated by reference to Exhibit 21 to the Form 10-K of the Company filed on April 1, 2003. | |
| *23 |
Consent of Independent Registered Public Accounting Firm. | |
| *31.1 |
Certification of chief executive officer pursuant to Section 302 of the Sarbanes-Oxley Act of 2002. | |
| *31.2 |
Certification of chief financial officer pursuant to Section 302 of the Sarbanes-Oxley Act of 2002. | |
| *32.1 |
Certification of chief executive officer and chief financial officer pursuant to Section 906 of the Sarbanes-Oxley Act of 2002. | |
| * | Filed electronically herewith. |
| † | Management contract or compensatory plan or arrangement. |
85