Attached files
UNITED STATES SECURITIES AND EXCHANGE COMMISSION
Washington, D.C. 20549
FORM 10-K
ANNUAL REPORT PURSUANT TO SECTION 13 OR 15(d)
OF THE SECURITIES EXCHANGE ACT OF 1934
For the fiscal year ended December 31, 2009
Commission file number 0-12820
AMERICAN NATIONAL BANKSHARES INC.
(Exact name of registrant as specified in its charter)
|
Virginia
|
54-1284688
|
|
|
(State of incorporation)
|
(I.R.S. Employer Identification No.)
|
|
|
628 Main Street, Danville, VA
|
24541
|
|
|
(Address of principal executive offices)
|
(Zip Code)
|
434-792-5111
Registrant’s telephone number, including area code
Securities registered pursuant to Section 12(b) of the Act:
|
Title of Each Class
|
Name of Exchange on Which Registered
|
|
|
Common Stock, $1 par value
|
The Nasdaq Stock Market LLC
|
|
Securities registered pursuant to section 12(g) of the Act: None
Indicate by check mark if the registrant is a well-known seasoned issuer, as defined in Rule 405 of the Securities Act. Yes o No þ
Indicate by check mark if the registrant is not required to file reports pursuant to Section 13 or Section 15(d) of the Act. Yes o No þ
Indicate by check mark whether the registrant (1) has filed all reports required to be filed by section 13 or 15(d) of the Securities Exchange Act of 1934 during the preceding 12 months (or for such shorter period that the registrant was required to file such reports), and (2) has been subject to such filing requirements for the past 90 days. Yes þ No o
Indicate by check mark whether the registrant has submitted electronically and posted on its corporate Website, if any, every Interactive Data File required to be submitted and posted pursuant to Rule 405 of Regulation S-T (§ 232.405 of this chapter) during the preceding 12 months (or for such shorter period that the registrant was required to submit and post such files). Yes o No o
Indicate by check mark if disclosure of delinquent filers pursuant to Item 405 of Regulation S-K (§ 229.405 of this chapter) is not contained herein, and will not be contained, to the best of registrant’s knowledge, in definitive proxy or information statements incorporated by reference in Part III of this Form 10-K or any amendment to this Form 10-K. £
Indicate by check mark whether the registrant is a large accelerated filer, an accelerated filer, a non-accelerated filer, or a smaller reporting company. See definitions of “large accelerated filer,” “accelerated filer,” and “smaller reporting company” in Rule 12b-2 of the Exchange Act. (Check one):
Large accelerated filer o Accelerated filer þ Non-accelerated filer o Smaller reporting company o
Indicate by check mark whether the registrant is a shell company (as defined in Rule 12b-2 of the Act.) Yes o No þ
The aggregate market value of the voting stock held by non-affiliates of the registrant at June 30, 2009, based on the closing price, was $102,460,170.
The number of shares of the registrant’s common stock outstanding on March 12, 2010 was 6,123,275.
DOCUMENTS INCORPORATED BY REFERENCE
Portions of the Proxy Statement of the Registrant for the Annual Meeting of Shareholders to be held on May 18, 2010, are incorporated by reference in Part III of this report.
|
PAGE
|
||
|
ITEM 1
|
3
|
|
|
ITEM 1A
|
8
|
|
|
ITEM 1B
|
Unresolved Staff Comments
|
None
|
|
ITEM 2
|
12
|
|
|
ITEM 3
|
12
|
|
|
ITEM 4
|
12
|
|
|
|
||
|
ITEM 5
|
13
|
|
|
ITEM 6
|
16
|
|
|
ITEM 7
|
17
|
|
|
ITEM 7A
|
22
|
|
|
ITEM 8
|
Financial Statements and Supplementary Data
|
|
|
35
|
||
|
36
|
||
|
37
|
||
|
40
|
||
|
41
|
||
|
42
|
||
|
43
|
||
|
44
|
||
|
ITEM 9
|
Changes in and Disagreements With Accountants on Accounting and Financial Disclosure
|
None
|
|
ITEM 9A
|
36
|
|
|
ITEM 9B
|
Other Information
|
None
|
|
PART III
|
||
|
ITEM 10
|
Directors, Executive Officers and Corporate Governance
|
*
|
|
ITEM 11
|
Executive Compensation
|
*
|
|
ITEM 12
|
Security Ownership of Certain Beneficial Owners and Management and Related Stockholder Matters
|
*
|
|
ITEM 13
|
Certain Relationships and Related Transactions, and Director Independence
|
*
|
|
ITEM 14
|
Principal Accounting Fees and Services
|
*
|
|
|
||
|
ITEM 15
|
73
|
|
_______________________________
*Certain information required by Item 10 is incorporated herein by reference to the information that appears under the headings “Election of Directors,” “Election of Directors – Board Members Serving on Other Publicly Traded Company Boards of Directors,” “Election of Directors – Board of Directors and Committees - The Audit and Compliance Committee,” “Section 16(a) Beneficial Ownership Reporting Compliance,” “Report of the Audit and Compliance Committee,” and “Code of Conduct” in the Registrant’s Proxy Statement for the 2010 Annual Meeting of Shareholders. The information required by Item 401 of regulation S-K on executive officers is disclosed herein.
The information required by Item 11 is incorporated herein by reference to the information that appears under the headings “Compensation Discussion and Analysis,” “Compensation Committee Interlocks and Insider Participation,” and “Compensation Committee Report” in the Registrant’s Proxy Statement for the 2010 Annual Meeting of Shareholders.
The information required by Item 12 is incorporated herein by reference to the information that appears under the heading “Security Ownership” in the Registrant’s Proxy Statement for the 2010 Annual Meeting of Shareholders. The information required by Item 201(d) of Regulation S-K is disclosed herein. See Item 5, “Market for Registrant’s Common Equity, Related Stockholder Matters and Issuer Purchases of Equity Securities.”
The information required by Item 13 is incorporated herein by reference to the information that appears under the headings “Related Party Transactions” and “Election of Directors – Board Independence” in the Registrant’s Proxy Statement for the 2010 Annual Meeting of Shareholders.
The information required by Item 14 is incorporated herein by reference to the information that appears under the heading “Independent Public Accountants” in the Registrant’s Proxy Statement for the 2010 Annual Meeting of Shareholders.
Forward-Looking Statements
This report contains forward-looking statements with respect to the financial condition, results of operations and business of American National Bankshares Inc. and its wholly owned subsidiary, American National Bank and Trust Company (collectively referred to as the “Company”). These forward-looking statements involve risks and uncertainties and are based on the beliefs and assumptions of management of the Company and on information available to management at the time these statements and disclosures were prepared. Forward-looking statements are subject to numerous assumptions, estimates, risks, and uncertainties that could cause actual conditions, events, or results to differ materially from those stated or implied by such forward-looking statements.
A variety of factors, some of which are discussed in more detail in Item 1A – Risk Factors, may affect the operations, performance, business strategy, and results of the Company. Those factors include but are not limited to the following:
|
·
|
Financial market volatility including the level of interest rates could affect the values of financial instruments and the amount of net interest income earned;
|
|
·
|
General economic or business conditions, either nationally or in the market areas in which the Company does business, may be less favorable than expected, resulting in deteriorating credit quality, reduced demand for credit, or a weakened ability to generate deposits;
|
|
·
|
Competition among financial institutions may increase and competitors may have greater financial resources and develop products and technology that enable those competitors to compete more successfully than the Company;
|
|
·
|
Businesses that the Company is engaged in may be adversely affected by legislative or regulatory changes, including changes in accounting standards;
|
|
·
|
The ability to retain key personnel; and
|
|
·
|
The failure of assumptions underlying the allowance for loan losses.
|
American National Bankshares Inc. is a one-bank holding company organized under the laws of the Commonwealth of Virginia in 1984. On September 1, 1984, American National Bankshares Inc. acquired all of the outstanding capital stock of American National Bank and Trust Company, a national banking association chartered in 1909 under the laws of the United States. American National Bank and Trust Company is the only banking subsidiary of American National Bankshares Inc. In April 2006, AMNB Statutory Trust I, a Delaware statutory trust (the “Trust”) and a wholly owned subsidiary of American National Bankshares Inc., was formed for the purpose of issuing preferred securities (the “Trust Preferred Securities”) in a private placement pursuant to an applicable exemption from registration. Proceeds from the securities were used to fund the acquisition of Community First Financial Corporation (“Community First”). In April 2006, the Company finalized the acquisition of Community First and acquired 100% of its preferred and common stock through a merger transaction. Community First was a bank holding company headquartered in Lynchburg, Virginia, and through its subsidiary, Community First Bank, operated four banking offices serving the city of Lynchburg and Bedford, Nelson, and Amherst Counties. The Company entered into the merger agreement with Community First because it believed the merger to be consistent with its expansion strategy to target entry into strong markets that logically extend its existing footprint. The Company had previously opened a full service banking office in the Lynchburg area and was considering opening additional offices in that area.
The operations of the Company are conducted at eighteen banking offices and two loan production offices serving Southern and Central Virginia and the northern portion of Central North Carolina. American National Bank and Trust Company provides a full array of financial products and services, including commercial, mortgage, and consumer banking; trust and investment services; and insurance. Services are also provided through twenty-five ATMs, “AmeriLink” Internet banking, and 24-hour “Access American” telephone banking.
Competition and Markets
Vigorous competition exists in the Company’s service area. The Company competes not only with national, regional, and community banks, but also with many other types of financial institutions, including without limitation, savings banks, finance companies, mutual and money market fund providers, brokerage firms, insurance companies, credit unions, and mortgage companies. The Company has the largest deposit market share in the City of Danville, as well as in the City of Danville and Pittsylvania County, combined.
The Southern Virginia market, in which the Company has a significant presence, is under economic pressure. The region’s economic base has historically been weighted toward the manufacturing sector. Increased global competition has negatively impacted the textile industry and several manufacturers have closed plants due to competitive pressures or the relocation of some operations to foreign countries. Other important industries include farming, tobacco processing and sales, food processing, furniture manufacturing and sales, specialty glass manufacturing, and packaging tape production. Companies within these industries, especially furniture manufacturing, have also closed plants for reasons similar to those noted above. Additional declines in manufacturing production and unemployment could negatively impact the ability of certain borrowers to repay loans. Also, the current economic and credit crisis, which is resulting in rising unemployment and increasing bankruptcies, foreclosures and bank failures nationally, may further intensify the economic pressure in our markets.
Supervision and Regulation
The Company is extensively regulated under both federal and state law. The following information describes certain aspects of that regulation applicable to the Company and does not purport to be complete. Proposals to change the laws and regulations governing the banking industry are frequently raised in Congress, in state legislatures, and before the various bank regulatory agencies. The likelihood and timing of any changes and the impact such changes might have on the Company are impossible to determine with any certainty. A change in applicable laws or regulations, or a change in the way such laws or regulations are interpreted by regulatory agencies or courts, may have a material impact on the business, operations, and earnings of the Company.
American National Bankshares Inc.
American National Bankshares Inc. is qualified as a bank holding company (“BHC”) within the meaning of the Bank Holding Company Act of 1956, as amended (the “BHC Act”), and is registered as such with the Board of Governors of the Federal Reserve System (the “FRB”). As a bank holding company, American National Bankshares Inc. is required to file various reports and additional information with the FRB and is also subject to examinations by the FRB.
The BHC Act prohibits, with certain exceptions, a BHC from acquiring beneficial ownership or control of more than 5% of the voting shares of any company, including a bank, without the FRB’s prior approval and from engaging in any activity other than those of banking, managing or controlling banks or other subsidiaries authorized under the BHC Act, or furnishing services to or performing services for its subsidiaries. Among the permitted activities is the ownership of shares of any company the activities of which the FRB determines to be so closely related to banking or managing or controlling banks as to be proper incident thereto.
Under FRB policy, a BHC is expected to serve as a source of financial and managerial strength to its subsidiary banks and to commit resources to support those banks. This support may be required at times when the BHC may not have the resources to provide it. Under this policy, a BHC is expected to stand ready to use available resources to provide adequate capital funds to its subsidiary banks during periods of financial adversity and to maintain the financial flexibility and capital-raising capacity to obtain additional resources for assisting its subsidiary banks.
Under the Gramm-Leach-Bliley Act, a BHC may elect to become a financial holding company and thereby engage in a broader range of financial and other activities than are permissible for traditional BHC’s. In order to qualify for the election, all of the depository institution subsidiaries of the BHC must be well capitalized, well managed, and have achieved a rating of “satisfactory” or better under the Community Reinvestment Act (the “CRA”). Financial holding companies are permitted to engage in activities that are “financial in nature” or incidental or complementary thereto as determined by the FRB. The Gramm-Leach-Bliley Act identifies several activities as “financial in nature,” including insurance underwriting and sales, investment advisory services, merchant banking and underwriting, and dealing or making a market in securities. American National Bankshares Inc. has not elected to become a financial holding company.
American National Bank and Trust Company
American National Bank and Trust Company is a federally chartered national bank and is a member of the Federal Reserve System. It is subject to federal regulation by the Office of the Comptroller of the Currency (the “OCC”), the FRB, and the Federal Deposit Insurance Corporation (“FDIC”).
Depository institutions, including American National Bank and Trust Company, are subject to extensive federal and state regulations that significantly affect their business and activities. Regulatory bodies have broad authority to implement standards and initiate proceedings designed to prohibit deposit institutions from engaging in unsafe and unsound banking practices. The standards relate generally to operations and management, asset quality, interest rate exposure, and capital. The agencies are authorized to take action against institutions that fail to meet such standards.
As with other financial institutions, the earnings of American National Bank and Trust Company are affected by general economic conditions and by the monetary policies of the FRB. The FRB exerts a substantial influence on interest rates and credit conditions, primarily through open market operations in U.S. Government securities, setting the reserve requirements of member banks, and establishing the discount rate on member bank borrowings. The policies of the FRB have a direct impact on loan and deposit growth and the interest rates charged and paid thereon. They also impact the source and cost of funds and the rates of return on investments. Changes in the FRB’s monetary policies have had a significant impact on the operating results of American National Bank and Trust Company and other financial institutions and are expected to continue to do so in the future; however, the exact impact of such conditions and policies upon the future business and earnings cannot accurately be predicted.
Dividend Restrictions and Capital Requirements
For information regarding the limitation on bank dividends and risk-based capital requirements, refer to Note 20 of the consolidated financial statements. Additional information may be found in the Shareholder’s Equity section of Management’s Discussion and Analysis of Financial Condition and Results of Operations.
FDIC Insurance
American National Bank and Trust Company’s deposits are currently insured up to the following amounts per insured depositor by the Deposit Insurance Fund of the FDIC:
|
·
|
$250,000 for accounts other than retirement accounts and noninterest-bearing transaction accounts;
|
|
·
|
$250,000 for retirement accounts; and
|
|
·
|
Unlimited coverage for noninterest-bearing transaction accounts, which applies to deposits in institutions such as American National Bank and Trust Company that are participating in the FDIC’s Temporary Liquidity Guarantee Program. For FDIC coverage purposes, interest-bearing checking accounts with an interest rate of 0.50% or less are included in the definition of noninterest-bearing transaction accounts.
|
The standard insurance amount of $250,000 per depositor is in effect through December 31, 2013. On January 1, 2014, the standard insurance amount will return to $100,000 per depositor for all account categories except IRAs and other certain retirement accounts, which will remain at $250,000 per depositor.
The FDIC’s temporary Transaction Account Guarantee Program provides depositors with unlimited coverage for noninterest-bearing transaction accounts at participating FDIC-insured institutions. Noninterest-bearing checking accounts include Demand Deposit Accounts (DDAs) and any transaction account that has unlimited withdrawals and that cannot earn interest. Also included are low-interest NOW accounts (NOW accounts that cannot earn more than 0.5% interest) and IOLTA accounts. This unlimited insurance coverage is temporary and will remain in effect through June 30, 2010.
Under federal law, deposits and certain claims for administrative expenses and employee compensation against insured depository institutions are afforded a priority over other general unsecured claims against such an institution, including federal funds and letters of credit, in the liquidation or other resolution of such an institution by any receiver appointed by regulatory authorities. Such priority creditors would include the FDIC.
Under the risk-based deposit premium assessment system of the FDIC, the assessment rates for an insured depository institution vary according to the level of risk incurred in its activities. To arrive at an assessment rate for a banking institution, the FDIC places it in one of four risk categories (referred to as Risk Categories I, II, III and IV) determined by reference to its capital levels and supervisory ratings. The assessment rates in 2008 ranged, on an annual basis, from 5 to 43 basis points, depending on the insured institution’s risk category as described above. In late 2008, the FDIC took action to raise assessment rates by 7 basis points in each risk category beginning the first quarter of 2009. Further, for institutions such as American National Bank and Trust Company that have elected to provide unlimited FDIC coverage for noninterest-bearing transaction accounts, an additional assessment at the annual rate of 10 basis points is due in 2010 for the amount of balances in non-interest bearing transaction accounts that exceed the existing coverage limit of $250,000 for deposit accounts other than retirement accounts and noninterest-bearing transaction accounts.
Under a revised assessment schedule effective April 1, 2009, the FDIC set new initial base assessment rates that range, on an annual basis, from 12 to 45 basis points per $100 of assessable deposits, depending on the insured institution’s risk category as described above. These initial base assessment rates are subject to possible adjustments, including (1) for all risk categories, a potential increase for unsecured liabilities and potential decrease for long-term unsecured debt and (2) for all risk categories, other than Risk Category I, a potential increase for brokered deposits.
In February 2009, the FDIC proposed that an emergency special assessment up to 20 basis points per $100 of deposits be collected from all insured institutions in September 2009, and in May 2009 further proposed that additional special assessments of up to 5 basis points each be collected as considered necessary thereafter to maintain public confidence in federal deposit insurance. The Bank paid a special assessment to the FDIC in the second quarter of 2009 of approximately $360,000. On November 12, 2009, the FDIC issued a rule that required all insured depository institutions, with limited exceptions, to prepay their estimated quarterly risk-based assessments for the fourth quarter of 2009 and for all of 2010, 2011, and 2012. The FDIC also adopted a uniform three-basis point increase in assessment rates effective on January 1, 2011. In December 2009, the Bank prepaid an estimated three years deposit insurance premium, totaling approximately $2.9 million, pursuant to an FDIC mandate. These prepayments were required from all insured depository institutions.
The level of FDIC insurance premium assessments in 2007 and 2008 for American National Bank and Trust Company was reduced by a cumulative total of $499,000 though application of a one-time premium assessment credit that resulted from the provisions of the Federal Deposit Insurance Reform Act of 2005.
The Federal Deposit Insurance Corporation Improvement Act
Under the Federal Deposit Insurance Corporation Improvement Act of 1991 (“FDICIA”), the federal banking agencies possess broad powers to take prompt corrective action to resolve problems of insured depository institutions. The extent of these powers depends upon whether the institution is “well capitalized,” “adequately capitalized,” “undercapitalized,” “significantly undercapitalized,” or “critically undercapitalized,” as defined by the law. Under regulations established by the federal banking agencies a “well capitalized” institution must have a Tier 1 capital ratio of at least 6%, a total capital ratio of at least 10%, and a leverage ratio of at least 5%, and not be subject to a capital directive order. An “adequately capitalized” institution must have a Tier 1 capital ratio of a least 4%, a total capital ratio of at least 8%, and a leverage ratio of at least 4%, or 3% in some cases. Management believes, as of December 31, 2009 and 2008, that the Company met the requirements for being classified as “well capitalized.”
As required by FDICIA, the federal banking agencies also have adopted guidelines prescribing safety and soundness standards relating to, among other things, internal controls and information systems, internal audit systems, loan documentation, credit underwriting, and interest rate exposure. In general, the guidelines require appropriate systems and practices to identify and manage the risks and exposures specified in the guidelines. In addition, the agencies adopted regulations that authorize, but do not require, an institution which has been notified that it is not in compliance with safety and soundness standard to submit a compliance plan. If, after being so notified, an institution fails to submit an acceptable compliance plan, the agency must issue an order directing action to correct the deficiency and may issue an order directing other actions of the types to which an undercapitalized institution is subject under the prompt corrective action provisions described above.
Community Reinvestment and Consumer Protection Laws
In connection with its lending activities, the Company is subject to a number of federal laws designed to protect borrowers and promote lending to various sectors of the economy and population. These include the Equal Credit Opportunity Act, the Truth-in-Lending Act, the Home Mortgage Disclosure Act, the Real Estate Settlement Procedures Act, and the Community Reinvestment Act.
The CRA requires the appropriate federal banking agency, in connection with its examination of a bank, to assess the bank’s record in meeting the credit needs of the communities served by the bank, including low and moderate income neighborhoods. Furthermore, such assessment is also required of banks that have applied, among other things, to merge or consolidate with or acquire the assets or assume the liabilities of an insured depository institution, or to open or relocate a branch. In the case of a BHC applying for approval to acquire a bank or BHC, the record of each subsidiary bank of the applicant BHC is subject to assessment in considering the application. Under the CRA, institutions are assigned a rating of “outstanding,” “satisfactory,” “needs to improve,” or “substantial non-compliance.” The Company was rated “outstanding” in its most recent CRA evaluation.
Anti-Money Laundering Legislation
The Company is subject to the Bank Secrecy Act and other anti-money laundering laws and regulations, including the USA Patriot Act of 2001. Among other things, these laws and regulations require the Company to take steps to prevent the use of the Company for facilitating the flow of illegal or illicit money, to report large currency transactions, and to file suspicious activity reports. The Company is also required to carry out a comprehensive anti-money laundering compliance program. Violations can result in substantial civil and criminal sanctions. In addition, provisions of the USA Patriot Act require the federal financial institution regulatory agencies to consider the effectiveness of a financial institution’s anti-money laundering activities when reviewing bank mergers and BHC acquisitions.
Emergency Economic Stabilization Act of 2008
In accordance with its stated purpose of restoring liquidity and stability to the financial system of the United States, the Emergency Economic Stabilization Act of 2008 established the Troubled Asset Relief Program (“TARP”), under which the United States Department of the Treasury (“UST”) is authorized to purchase preferred stock from qualified financial institutions. The Company meets the requirements to be considered a qualified financial institution. Under TARP, for organizations like the Company, the federal government’s purchase limitation is generally defined as 3% of risk-weighted assets, or about $18 million for the Company. The terms of the preferred stock generally provide that:
|
·
|
Cumulative dividends will be paid at a rate of 5% for the first five years and 9% thereafter;
|
|
·
|
Any increase in the dividend rate paid on common stock during the first three years will require the consent of the UST;
|
|
·
|
Any repurchase of common stock will require the consent of the UST;
|
|
·
|
Conditions and limitations will be placed on executive compensation; and
|
|
·
|
UST will receive warrants, with a term of 10 years, to purchase a number of shares of common stock having an aggregate market price equal to 15% of the preferred stock amount on the day of investment.
|
After considering the appropriateness of applying under UST’s capital purchase program under TARP, the Company elected not to participate. The Company believes its current and projected capital position is sufficient to meet the growth plans and credit needs of the communities it serves without government support.
Employees
At December 31, 2009, the Company employed 238 full-time equivalent persons. The relationship with employees is considered to be good.
Internet Access to Company Documents
The Company provides access to its Securities and Exchange Commission (the “SEC”) filings through a link on the Investor Relations page of the Company’s website at www.amnb.com. Reports available include the annual report on Form 10-K, quarterly reports on Form 10-Q, current reports on Form 8-K, and all amendments to those reports as soon as reasonably practicable after the reports are filed electronically with the SEC. The information on the Company’s website is not incorporated into this Annual Report on Form 10-K. The SEC maintains an Internet site that contains reports, proxy and information statements, and other information regarding issuers that file electronically with the SEC at www.sec.gov.
Executive Officers of the Registrant
The following lists, as of December 31, 2009, the named executive officers of the registrant, their ages, and their positions.
Name Age Position
|
|
Charles H. Majors
|
64
|
President and Chief Executive Officer of the Company.
|
|
|
William W. Traynham
|
54
|
Senior Vice President, Chief Financial Officer, Treasurer and Secretary of American National Bankshares Inc. since April 2009; Executive Vice President, Chief Financial Officer, and Cashier of American National Bank and Trust Company since April 2009; prior thereto, President and Chief Financial Officer of Community Bankshares Inc. and Chief Financial Officer of Community Resource Bank, NA from 1992 until the sale of the company in 2008.
|
|
|
Jeffrey V. Haley
|
49
|
Senior Vice President of American National Bankshares Inc.; President of Trust and Financial Services and Executive Vice President of American National Bank and Trust Company since July 2008; prior thereto, Executive Vice President and Chief Operating Officer of American National Bank and Trust Company since November 2005; prior thereto, Senior Vice President and Chief Administrative Officer of American National Bank and Trust Company.
|
|
|
R. Helm Dobbins
|
58
|
Senior Vice President of American National Bankshares Inc.; Executive Vice President and Chief Credit Officer of American National Bank and Trust Company since November 2005; prior thereto, Senior Vice President and Chief Credit Officer of American National Bank and Trust Company since June 2003.
|
|
|
S. Cabell Dudley, Jr.
|
64
|
Senior Vice President of American National Bankshares Inc. since December 2008; Executive Vice President and Chief Lending Officer of American National Bank and Trust Company since July 2008; prior thereto, Senior Vice President and Commercial Relationship Manager since March 2006; prior thereto, Senior Vice President of Wachovia Bank.
|
|
|
Dabney T. P. Gilliam, Jr.
|
55
|
Senior Vice President of American National Bankshares Inc. since December 2008; Executive Vice President and Chief Administrative Officer of American National Bank and Trust Company since July 2008; prior thereto, Senior Vice President of American National Bank and Trust Company since February 2007; prior thereto, Chief Financial Officer of RACO, Inc. from January 2006 to February 2007; prior thereto, Senior Vice President, Senior Loan Officer and Chief Banking Officer of American National Bank and Trust Company.
|
The Company’s business is subject to interest rate risk and variations in interest rates may negatively affect financial performance.
Changes in the interest rate environment may reduce the Company’s profits. It is expected that the Company will continue to realize income from the differential or “spread” between the interest earned on loans, securities, and other interest earning assets, and interest paid on deposits, borrowings and other interest bearing liabilities. Net interest spreads are affected by the difference between the maturities and repricing characteristics of interest earning assets and interest bearing liabilities. In addition, loan volume and yields are affected by market interest rates on loans, and rising interest rates generally are associated with a lower volume of loan originations. Management cannot ensure that it can minimize the Company’s interest rate risk. While an increase in the general level of interest rates may increase the loan yield and the net interest margin, it may adversely affect the ability of certain borrowers with variable rate loans to pay the interest and principal of their obligations. Accordingly, changes in levels of market interest rates could materially and adversely affect the net interest spread, asset quality, loan origination volume, and overall profitability of the Company.
The Company faces strong competition from financial services companies and other companies that offer banking services which could negatively affect the Company’s business.
Increased competition may result in reduced business for the Company. Ultimately, the Company may not be able to compete successfully against current and future competitors. Many competitors offer the same banking services that the Company offers in its service area. These competitors include national, regional, and community banks. The Company also faces competition from many other types of financial institutions, including without limitation, savings banks, finance companies, mutual and money market fund providers, brokerage firms, insurance companies, credit unions, and mortgage companies. In particular, competitors include several major financial companies whose greater resources may afford them a marketplace advantage by enabling them to maintain numerous banking locations and ATMs and conduct extensive promotional and advertising campaigns.
Additionally, banks and other financial institutions with larger capitalization and financial intermediaries not subject to bank regulatory restrictions have larger lending limits and are thereby able to serve the credit needs of larger customers. Areas of competition include interest rates for loans and deposits, efforts to obtain loans and deposits, and range and quality of products and services provided, including new technology-driven products and services. Technological innovation continues to contribute to greater competition in domestic and international financial services markets as technological advances enable more companies to provide financial services. If the Company is unable to attract and retain banking customers, it may be unable to continue to grow loan and deposit portfolios and its results of operations and financial condition may otherwise be adversely affected.
Changes in economic conditions could materially and negatively affect the Company’s business.
The Company’s business is directly impacted by factors such as economic, political, and market conditions, broad trends in industry and finance, legislative and regulatory changes, changes in government monetary and fiscal policies, and inflation, all of which are beyond the Company’s control. A deterioration in economic conditions, whether caused by national or local concerns, especially within the Company’s market area, could result in the following consequences, any of which could hurt business materially: loan delinquencies may increase; problem assets and foreclosures may increase; demand for products and services may decrease; low cost or noninterest bearing deposits may decrease; and collateral for loans, especially real estate, may decline in value, in turn reducing customers’ borrowing power, and reducing the value of assets and collateral associated with existing loans.
Trust and Investment Services fee revenue is largely dependent on the fair market value of assets under management and on trading volumes in the brokerage business. General economic conditions and their subsequent effect on the securities markets tend to act in correlation. When general economic conditions deteriorate, consumer and corporate confidence in securities markets erodes, and Trust and Investment Service revenues are negatively impacted as asset values and trading volumes decrease.
A downturn in the real estate market could materially and negatively affect the Company’s business.
A downturn in the real estate market could negatively affect the Company’s business because significant portions of its loans are secured by real estate (approximately 82% as of December 31, 2009). The ability to recover on defaulted loans by selling the real estate collateral could then be diminished and the Company would be more likely to suffer losses.
Substantially all of the Company’s real property collateral is located in its market area. If there is a significant decline in real estate values, especially in our market area, the collateral for loans would provide significantly less security. Real estate values could be affected by, among other things, a continued economic slowdown and an increase in interest rates.
The Company is dependent on key personnel and the loss of one or more of those key personnel may materially and adversely affect the Company’s prospects.
The Company currently depends heavily on the services of a number of key management personnel. The loss of key personnel could materially and adversely affect the results of operations and financial condition. The Company’s success also depends in part on the ability to attract and retain additional qualified management personnel. Competition for such personnel is strong in the banking industry and the Company may not be successful in attracting or retaining the personnel it requires.
The Company is subject to extensive regulation which could adversely affect its business.
The Company’s operations are subject to extensive regulation by federal, state, and local governmental authorities and are subject to various laws and judicial and administrative decisions imposing requirements and restrictions on part or all of the Company’s operations. Because the Company’s business is highly regulated, the laws, rules, and regulations applicable to it are subject to regular change. There are currently proposed laws, rules, and regulations that, if adopted, would impact the Company’s operations. There can be no assurance that these proposed laws, rules, and regulations, or any other laws, rules, or regulations, will not be adopted in the future, which could (i) make compliance much more difficult and expensive, (ii) restrict the ability to originate, broker or sell loans, or accept certain deposits, (iii) further limit or restrict the amount of commissions, interest, or other charges earned on loans originated by the Company, or (iv) otherwise adversely affect the Company’s business or prospects for business.
The primary source of the Company’s income from which it pays cash dividends is the receipt of dividends from its subsidiary bank.
The availability of dividends from the Company is limited by various statutes and regulations. It is possible, depending upon the financial condition of the subsidiary bank and other factors, that the Office of the Comptroller of the Currency could assert that payment of dividends or other payments is an unsafe or unsound practice. In the event American National Bank & Trust Company was unable to pay dividends to American National Bankshares Inc., the holding company would likely have to reduce or stop paying common stock dividends. The Company’s failure to pay dividends on its common stock could have a material adverse effect on the market price of the common stock.
A limited trading market exists for the Company’s common stock which could lead to price volatility.
The Company’s common stock is approved for quotation on the NASDAQ Global Select Market, but the trading volume has generally been modest. The limited trading market for the common stock may cause fluctuations in the stock’s market value to be exaggerated, leading to price volatility in excess of that which would occur in a more active trading market. In addition, even if a more active market in the Company’s common stock develops, management cannot ensure that such a market will continue or that shareholders will be able to sell their shares.
The allowance for loan losses may not be adequate to cover actual losses.
In accordance with accounting principles generally accepted in the United States, an allowance for loan losses is maintained to provide for loan losses. The allowance for loan losses may not be adequate to cover actual credit losses, and future provisions for credit losses could materially and adversely affect operating results. The allowance for loan losses is based on prior experience, as well as an evaluation of the risks in the current portfolio. The amount of future losses is susceptible to changes in economic, operating, and other conditions, including changes in interest rates, all of which are beyond the Company’s control; and these losses may exceed current estimates. Federal regulatory agencies, as an integral part of their examination process, review the Company’s loans and allowance for loan losses. While management believes that the allowance for loan losses is adequate to cover current losses, it cannot make assurances that it will not further increase the allowance for loan losses or that regulators will not require it to increase this allowance. Either of these occurrences could adversely affect earnings.
The allowance for loan losses requires management to make significant estimates that affect the financial statements. Due to the inherent nature of this estimate, management cannot provide assurance that it will not significantly increase the allowance for loan losses which could materially and adversely affect earnings.
The Company is exposed to operational risk.
The Company is exposed to many types of operational risks, including reputation, legal, and compliance risk, the risk of fraud or theft by employees or outsiders, unauthorized transactions by employees or operational errors, clerical or record-keeping errors, and errors resulting from faulty or disabled computer or telecommunications systems.
Negative public opinion can result from the actual or alleged conduct in any number of activities, including lending practices, corporate governance, and acquisitions, and from actions taken by government regulators and community organizations in response to those activities. Negative public opinion can adversely affect the Company’s ability to attract and retain customers and can expose it to litigation and regulatory action.
Certain errors may be repeated or compounded before they are discovered and successfully rectified. The Company’s necessary dependence upon automated systems to record and process its transactions may further increase the risk that technical system flaws or employee tampering or manipulation of those systems will result in losses that are difficult to detect. The Company may also be subject to disruptions of its operating systems arising from events that are wholly or partially beyond its control (for example, computer viruses or electrical or telecommunications outages), which may give rise to disruption of service to customers and to financial loss or liability. The Company is further exposed to the risk that its external vendors may be unable to fulfill their contractual obligations (or will be subject to the same risk of fraud or operational errors by their respective employees as is the Company) and to the risk that the Company’s (or its vendors’) business continuity and data security systems prove to be inadequate.
Changes in accounting standards could impact reported earnings.
From time to time there are changes in the financial accounting and reporting standards that govern the preparation of the Company’s financial statements. These changes can materially impact how the Company records and reports its financial condition and results of operations. In some instances, the Company could be required to apply a new or revised standard retroactively, resulting in the restatement of prior period financial statements.
The Company’s information systems may experience an interruption or breach in security.
The Company relies heavily on communications and information systems to conduct business. Any failure, interruption, or breach in security of these systems could result in failures or disruptions in the Company’s relationship management, general ledger, deposit, loan, and other systems. While the Company has policies and procedures designed to prevent or limit the effect of such failure, interruption, or security breach, there can be no assurance that they will not occur or, if they do occur, that they will be adequately addressed. Any such occurrences could damage the Company’s reputation, result in a loss of customer business, subject the Company to additional regulatory scrutiny, or expose the company to civil litigation and possible financial liability, any of which could have a material adverse affect on the Company’s financial condition and results of operations.
Recent Negative Developments in the Financial Industry and Credit Markets May Adversely Affect the Company’s Operations and Results.
Negative developments in 2007 and 2008 in the credit markets have resulted in uncertainty in the financial markets in general and an economic downturn during 2009 which is continuing into early 2010. Loan portfolio quality has deteriorated at many institutions, and the Company also has experienced some deterioration. In addition, the value of real estate collateral supporting many home mortgages, including mortgages held by the Company, has declined and may continue to decline. Bank and bank holding company stock prices have been negatively affected, as has the ability of banks and bank holding companies to raise capital or borrow in the debt markets. As a result, the potential exists for new federal or state laws and regulations regarding lending and funding practices and liquidity standards, and bank regulatory agencies are expected to be active in responding to concerns and trends identified in examinations. Negative developments in the financial industry and credit markets, and the impact of new legislation in response to those developments, may negatively impact the Company’s operations by restricting its business operations, including its ability to originate or sell loans, and adversely impact its financial performance. In addition, these risks could affect the value of the Company’s loan portfolio as well as the value of its investment portfolio, which would also negatively affect its financial performance.
Increase in FDIC insurance premiums may adversely affect our earnings.
During 2008 and 2009, higher levels of bank failures have dramatically increased resolution costs of the FDIC and depleted the DIF. In addition, the FDIC instituted two temporary programs to further insure customer deposits at FDIC insured banks: deposit accounts are currently insured up to $250,000 per customer (up from $100,000) and non-interest bearing transactional accounts at institutions , such as American National Bank & Trust Company, participating in the Transaction Account Guarantee Program are currently fully insured (unlimited coverage). These programs have placed additional stress on the DIF.
In order to maintain a strong funding position and restore reserve ratios of the Deposit Insurance Fund, the FDIC has increased assessment rates of insured institutions. In addition, on November 12, 2009, the FDIC adopted a rule requiring banks to prepay three years’ worth of premiums to replenish the Deposit Insurance Fund.
The Company may be required to pay even higher FDIC premiums than the recently increased levels. Further, on January 12, 2010, the FDIC requested comments on a proposed rule tying assessment rates of FDIC-insured institutions to the institution’s employee compensation programs. The exact requirements of such a rule are not yet known, but such a rule could have a negative impact on our earnings. The Company must pay for the FDIC insurance and these announced increases and any future increases or required prepayments of FDIC insurance premiums may adversely impact our earnings.
The Company relies on other companies to provide key components of our business infrastructure.
Third parties provide key component of our business operations such as data processing, recording and monitoring transactions, online banking interfaces and services, Internet connections and network access. While we have selected these third party vendors carefully, we do not control their actions. Any problem caused by these third parties, including those resulting from disruptions in communication services proved by a vendor, failure of a vendor to handle current or higher volumes, failures of a vendor to provide services for any reason or poor performance of services, could adversely affect our ability to deliver products and services to our customers and otherwise conduct our business. Financial or operational difficulties of a third party vendor could also hurt our operations if those difficulties interface with the vendor’s ability to serve us. Replacing these third party vendors could also create significant delay and expense. Accordingly, use of such third parties creates an unavoidable inherent risk to our business operations.
As of December 31, 2009, the Company maintained eighteen banking offices located in Danville, Pittsylvania County, Martinsville, Henry County, Halifax County, Lynchburg, Bedford County, Campbell County, and Nelson County in Virginia and Caswell County in North Carolina. The Company also operates two loan production offices.
The principal executive offices of the Company are located at 628 Main Street in the business district of Danville, Virginia. This building, owned by the Company, was originally constructed in 1973 and has three floors totaling approximately 27,000 square feet.
The Company owns a building located at 103 Tower Drive in Danville, Virginia. This three-story facility serves as an operations center for data processing and deposit operations.
The Company has an office at 445 Mount Cross Road in Danville, Virginia where it consolidated two banking offices in January 2009 and gained additional administrative space.
The Company owns ten other retail offices and two closed offices, for a total of fifteen owned buildings. There are no mortgages or liens against any of the properties owned by the Company. The Company operates twenty-five Automated Teller Machines (“ATMs”) on owned or leased facilities. The Company leases six of the retail office locations and a storage warehouse.
There are no material pending legal proceedings to which the Company is a party or to which the property of the Company is subject.
No matters were submitted during the fourth quarter of the fiscal year covered by this report to a vote of security holders of the Company through a solicitation of proxies or otherwise.
The Company’s common stock is traded on the NASDAQ Global Select Market under the symbol “AMNB.” At December 31, 2009, the Company had 1,611 shareholders of record. The following table presents the high and low closing sales prices for the Company’s common stock and dividends declared for the past two years.
|
Market Price of the Company’s Common Stock
|
||||||||||||
|
Closing Price
|
Dividends
|
|||||||||||
|
2009
|
High
|
Low
|
Per Share
|
|||||||||
|
4th quarter
|
$ | 22.76 | $ | 19.79 | $ | 0.23 | ||||||
|
3rd quarter
|
23.50 | 19.67 | 0.23 | |||||||||
|
2nd quarter
|
21.42 | 15.11 | 0.23 | |||||||||
|
1st quarter
|
17.58 | 14.61 | 0.23 | |||||||||
| $ | 0.92 | |||||||||||
|
Closing Price
|
Dividends
|
|||||||||||
|
2008
|
High
|
Low
|
Per Share
|
|||||||||
|
4th quarter
|
$ | 18.25 | $ | 14.01 | $ | 0.23 | ||||||
|
3rd quarter
|
18.20 | 15.80 | 0.23 | |||||||||
|
2nd quarter
|
22.00 | 17.45 | 0.23 | |||||||||
|
1st quarter
|
22.64 | 18.65 | 0.23 | |||||||||
| $ | 0.92 | |||||||||||
Stock Compensation Plans
The Company maintains the 2008 Stock Incentive Plan (“2008 Plan”), which is designed to attract and retain qualified personnel in key positions, provide employees with an equity interest in the Company as an incentive to contribute to the success of the Company, and reward employees for outstanding performance and the attainment of targeted goals. The 2008 Plan was adopted by the Board of Directors of the Company on February 19, 2008 and approved by the stockholders on April 22, 2008 at the Company’s 2008 Annual Meeting. The 2008 Plan provides for the granting of restricted stock awards and incentive and non-statutory options to employees and directors on a periodic basis, at the discretion of the Board or a Board designated committee. The 2008 Plan authorized the issuance of up to 500,000 shares of common stock.
The 2008 Plan is administered by a committee of the Board of Directors of the Company comprised of independent directors. Under the 2008 Plan, the committee determines which employees will be granted restricted stock awards and options, whether such options will be incentive or non-statutory options, the number of shares subject to each option, whether such options may be exercised by delivering other shares of common stock, and when such options become exercisable. In general, the per share exercise price of an incentive stock option must be at least equal to the fair market value of a share of common stock on the date the option is granted. Restricted stock would be granted under terms and conditions established by the committee.
Stock options become vested and exercisable in the manner specified by the committee. Each stock option or portion thereof shall be exercisable at any time on or after it vests and is exercisable until ten years after its date of grant. As of December 31, 2009, 104,353 shares remain exercisable under the 1997 Option Plan and 27,750 shares are vested and exercisable under the 2008 Plan. There were 6,000 stock options awarded in 2009. Options granted in 2009 vest one third each year at December 31, 2009, 2010, and 2011.
The December 31, 2009 position of the Company’s equity investment compensation plan is summarized below:
|
December 31, 2009
|
||||||||||||
|
Number of Shares
to be Issued Upon Exercise
of Outstanding Options
|
Weighted-Average Per Share Exercise Price of Outstanding Options
|
Number of Shares Remaining Available for Future Issuance Under
Stock Compensation Plans
|
||||||||||
|
Equity compensation plans approved by shareholders
|
162,603 | $ | 21.39 | 441,000 | ||||||||
|
Equity compensation plans not approved by shareholders
|
- | - | - | |||||||||
|
Total
|
162,603 | $ | 21.39 | 441,000 | ||||||||
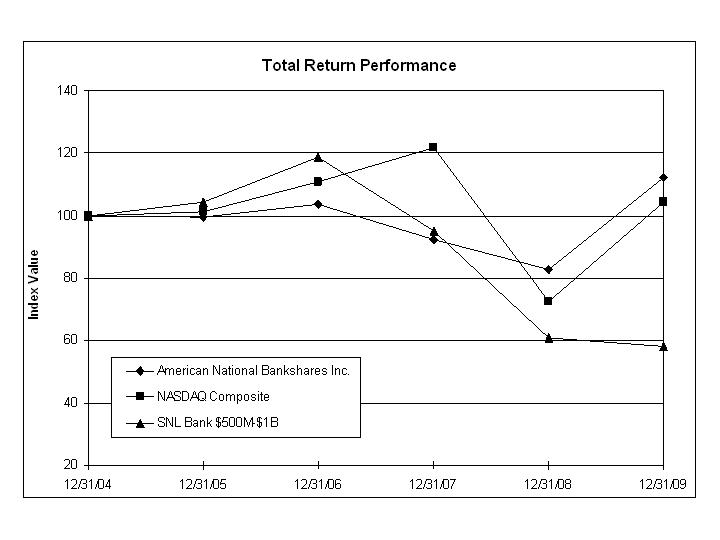
Comparative Stock Performance
The following graph compares the Company’s cumulative total return to its shareholders with the returns of two indexes for the five-year period ended December 31, 2009. The cumulative total return was calculated taking into consideration changes in stock price, cash dividends, stock dividends, and stock splits since December 31, 2004. The indexes are the NASDAQ Composite Index; the SNL Bank $500 Million-$1Billlion Index, which includes bank holding companies with assets of $500 million to $1 billion and is published by SNL Financial, LC.
American National Bankshares Inc.
|
Period Ending
|
||||||||||||||||||||||||
|
Index
|
12/31/04
|
12/31/05
|
12/31/06
|
12/31/07
|
12/31/08
|
12/31/09
|
||||||||||||||||||
|
American National Bankshares Inc.
|
100.00 | 99.46 | 103.53 | 92.43 | 82.84 | 112.16 | ||||||||||||||||||
|
NASDAQ Composite
|
100.00 | 101.37 | 111.03 | 121.92 | 72.49 | 104.31 | ||||||||||||||||||
|
SNL Bank $500M-$1B
|
100.00 | 104.29 | 118.61 | 95.04 | 60.90 | 58.00 | ||||||||||||||||||
Russell 2000
The Company was added to the Russell 3000 Index and the Russell 2000 Index on June 29, 2009 when Russell Investments reconstituted its comprehensive set of U. S. and Global equity indexes. The Russell indexes are widely used by investment managers as index funds and performance benchmarks for investment strategies. The indexes are reconstituted annually in late May and are comprised of the 3,000 largest U. S. stocks by market capitalization. The largest 1,000 companies comprise the Russell 1000 and the next 2,000 companies comprise the Russell 2000.
The following table sets forth selected financial data for the Company for the last five years:
|
(in thousands, except per share amounts and ratios)
|
||||||||||||||||||||
|
2009
|
2008
|
2007
|
2006
|
2005
|
||||||||||||||||
|
Results of Operations:
|
||||||||||||||||||||
|
Interest income
|
$ | 38,061 | $ | 42,872 | $ | 48,597 | $ | 45,070 | $ | 32,479 | ||||||||||
|
Interest expense
|
10,789 | 15,839 | 19,370 | 16,661 | 8,740 | |||||||||||||||
|
Net interest income
|
27,272 | 27,033 | 29,227 | 28,409 | 23,739 | |||||||||||||||
|
Provision for loan losses
|
1,662 | 1,620 | 403 | 58 | 465 | |||||||||||||||
|
Noninterest income
|
7,043 | 7,913 | 8,822 | 8,458 | 7,896 | |||||||||||||||
|
Noninterest expense
|
23,318 | 22,124 | 21,326 | 20,264 | 17,079 | |||||||||||||||
|
Income before income tax provision
|
9,335 | 11,202 | 16,320 | 16,545 | 14,091 | |||||||||||||||
|
Income tax provision
|
2,525 | 3,181 | 4,876 | 5,119 | 4,097 | |||||||||||||||
|
Net income
|
$ | 6,810 | $ | 8,021 | $ | 11,444 | $ | 11,426 | $ | 9,994 | ||||||||||
|
Period-end Balances:
|
||||||||||||||||||||
|
Securities
|
$ | 199,686 | $ | 140,816 | $ | 157,149 | $ | 162,621 | $ | 165,629 | ||||||||||
|
Loans, net of unearned income
|
527,991 | 571,110 | 551,391 | 542,228 | 417,087 | |||||||||||||||
|
Deposits
|
604,273 | 589,138 | 581,221 | 608,528 | 491,651 | |||||||||||||||
|
Assets
|
808,973 | 789,184 | 772,288 | 777,720 | 623,503 | |||||||||||||||
|
Shareholders' equity
|
106,389 | 102,300 | 101,511 | 94,992 | 73,419 | |||||||||||||||
|
Shareholders' equity - tangible (a)
|
82,223 | 77,757 | 76,591 | 69,695 | 73,287 | |||||||||||||||
|
Per Share Information:
|
||||||||||||||||||||
|
Earnings - basic
|
$ | 1.12 | $ | 1.32 | $ | 1.86 | $ | 1.91 | $ | 1.83 | ||||||||||
|
Earnings - diluted
|
1.12 | 1.31 | 1.86 | 1.90 | 1.81 | |||||||||||||||
|
Dividends
|
0.92 | 0.92 | 0.91 | 0.87 | 0.83 | |||||||||||||||
|
Book value
|
17.41 | 16.81 | 16.59 | 15.42 | 13.49 | |||||||||||||||
|
Book value - tangible (a)
|
13.46 | 12.78 | 12.52 | 11.31 | 13.47 | |||||||||||||||
|
Ratios:
|
||||||||||||||||||||
|
Return on average assets
|
0.84 | % | 1.02 | % | 1.48 | % | 1.51 | % | 1.61 | % | ||||||||||
|
Return on average shareholders' equity
|
6.57 | 7.79 | 11.69 | 12.72 | 13.95 | |||||||||||||||
|
Return on average tangible equity (b)
|
8.94 | 10.60 | 16.09 | 16.60 | 14.35 | |||||||||||||||
|
Net interest margin - taxable equivalent
|
3.81 | 3.87 | 4.24 | 4.20 | 4.17 | |||||||||||||||
|
Average shareholders' equity / average assets
|
12.79 | 13.10 | 12.65 | 11.85 | 11.57 | |||||||||||||||
|
Dividend payout ratio
|
82.40 | 69.89 | 48.82 | 45.58 | 45.39 | |||||||||||||||
|
Net charge-offs to average loans
|
0.24 | 0.21 | 0.05 | 0.10 | 0.56 | |||||||||||||||
|
Allowance for loan losses to period-end loans
|
1.55 | 1.37 | 1.34 | 1.34 | 1.46 | |||||||||||||||
|
Nonperforming assets to total assets
|
0.87 | 0.91 | 0.42 | 0.45 | 0.72 | |||||||||||||||
|
(a) - Excludes goodwill and other intangible assets.
|
||||||||||||||||||||
|
(b) - Excludes amortization expense, net of tax, of intangible assets.
|
||||||||||||||||||||
The purpose of this discussion is to focus on significant changes in the financial condition and results of operations of the Company during the past three years. The discussion and analysis are intended to supplement and highlight information contained in the accompanying Consolidated Financial Statements and the selected financial data presented elsewhere in this Annual Report on Form 10-K.
RECLASSIFICATION
In certain circumstances, reclassifications have been made to prior period information to conform to the 2009 presentation.
CRITICAL ACCOUNTING POLICIES
The accounting and reporting policies followed by the Company conform with U.S. generally accepted accounting principles (“GAAP”) and they conform to general practices within the banking industry. The Company’s critical accounting policies, which are summarized below, relate to (1) the allowance for loan losses and (2) goodwill impairment. A summary of the Company’s significant accounting policies is set forth in Note 1 to the Consolidated Financial Statements.
The financial information contained within the Company’s financial statements is, to a significant extent, financial information that is based on measures of the financial effects of transactions and events that have already occurred. A variety of factors could affect the ultimate value that is obtained when earning income, recognizing an expense, recovering an asset, or relieving a liability. In addition, GAAP itself may change from one previously acceptable method to another method.
Allowance for Loan Losses
The allowance for loan losses is an estimate of the losses inherent in the loan portfolio at the balance sheet date. The allowance is based on two basic principles of accounting: (i) the requirement that losses be accrued when they are probable of occurring and estimable and (ii) and the requirement that losses on impaired loans be accrued based on the differences between the value of collateral, present value of future cash flows, or values observable in the secondary market, and the loan balance.
The Company’s allowance for loan losses has two basic components: the formula allowance and the specific allowance. Each of these components is determined based upon estimates that can and do change. The formula allowance uses a historical loss view as an indicator of future losses along with various qualitative factors, including levels and trends in delinquencies, nonaccrual loans, charge-offs and recoveries; trends in volume and terms of loans; effects of changes in underwriting standards; experience of lending staff and local, regional and national economic conditions; and portfolio concentrations. In the formula allowance, the historical loss rate is combined with the qualitative factors, resulting in an adjusted loss factor for each risk-grade category of loans. Allowance calculations for consumer loans are calculated on a product basis rather than by risk grade. The adjusted loss factor is multiplied by the period-end balances for each risk-grade category. The formula allowance is calculated for a range of outcomes. The specific allowance uses various techniques to arrive at an estimate of loss for specifically identified impaired loans. The use of these values is inherently subjective and actual losses could be greater or less than the estimates.
Goodwill Impairment
The Company tests goodwill on an annual basis or more frequently if events or circumstances indicate that there may have been impairment. If the carrying amount of goodwill exceeds its implied fair value, the Company would recognize an impairment loss in an amount equal to that excess. The goodwill impairment test requires management to make judgments in determining the assumptions used in the calculations. The goodwill impairment testing conducted by the Company in 2009 indicated that goodwill is not impaired and is properly recorded in the financial statements.
NON-GAAP PRESENTATIONS
The analysis of net interest income in this document is performed on a taxable equivalent basis to facilitate performance comparisons among various taxable and tax-exempt assets.
EXECUTIVE OVERVIEW
American National Bankshares Inc. is the holding company of American National Bank and Trust Company, a community bank serving Southern and Central Virginia and the northern portion of Central North Carolina with eighteen banking offices and two loan production offices
American National Bank and Trust Company provides a full array of financial products and services, including commercial, mortgage, and consumer banking; trust and investment services; and insurance. Services are also provided through twenty-five ATMs, “AmeriLink” Internet banking, and 24-hour “Access American” telephone banking.
Additional information is available on the Company’s website at www.amnb.com. The information on the Company’s website is not incorporated into this Annual Report on Form 10-K. The shares of American National Bankshares Inc. are traded on the NASDAQ Global Select Market under the symbol “AMNB.”
RESULTS OF OPERATIONS
Net Interest Income
Net interest income is the difference between interest income on earning assets, primarily loans and securities, and interest expense on interest bearing liabilities, primarily deposits. Fluctuations in interest rates as well as volume and mix changes in earning assets and interest bearing liabilities can materially impact net interest income. The following discussion of net interest income is presented on a taxable equivalent basis to facilitate performance comparisons among various taxable and tax-exempt assets, such as certain state and municipal securities. A tax rate of 35% was used in adjusting interest on tax-exempt assets to a fully taxable equivalent basis. Net interest income divided by average earning assets is referred to as the net interest margin. The net interest spread represents the difference between the average rate earned on earning assets and the average rate paid on interest bearing liabilities.
Net interest income on a taxable equivalent basis increased $313,000 or 1.1% in 2009 from 2008, following a $2,226,000 or 7.4% decrease in 2008 from 2007. The increase in net interest income in 2009 was primarily due to a 0.88% reduction in interest rates paid on deposits. The decrease in net interest income in 2008 was primarily due to 1.21% decrease in the yield on loans, the largest component of earnings assets. The net interest margin was 3.81% for 2009, 3.87% for 2008, and 4.24% for 2007. During 2008, the Federal Open Market Committee of the FRB reduced the intended federal funds rate seven times from 4.25% to 0.25%, where it remained for the duration of 2009 and into early 2010. This historically low rate environment has had a dramatic effect on the Company’s net interest margin.
The following presentation is an analysis of net interest income and related yields and rates, on a taxable equivalent basis, for the last three years. Nonaccrual loans are included in average balances. Interest income on nonaccrual loans, if recognized, is recorded on a cash basis or when the loan returns to accrual status.
|
Table 1 - Net Interest Income Analysis
|
||||||||||||||||||||||||||||||||||||
|
(in thousands, except yields and rates)
|
||||||||||||||||||||||||||||||||||||
|
Average Balance
|
Interest Income/Expense
|
Average Yield/Rate
|
||||||||||||||||||||||||||||||||||
|
2009
|
2008
|
2007
|
2009
|
2008
|
2007
|
2009
|
2008
|
2007
|
||||||||||||||||||||||||||||
|
Loans:
|
||||||||||||||||||||||||||||||||||||
|
Commercial
|
$ | 88,551 | $ | 91,117 | $ | 89,673 | $ | 4,213 | $ | 5,515 | $ | 6,980 | 4.76 | % | 6.05 | % | 7.78 | % | ||||||||||||||||||
|
Real Estate
|
463,093 | 467,508 | 449,683 | 26,294 | 29,712 | 33,621 | 5.68 | 6.36 | 7.48 | |||||||||||||||||||||||||||
|
Consumer
|
7,623 | 8,774 | 10,420 | 659 | 795 | 975 | 8.64 | 9.06 | 9.36 | |||||||||||||||||||||||||||
|
Total loans
|
559,267 | 567,399 | 549,776 | 31,166 | 36,022 | 41,576 | 5.57 | 6.35 | 7.56 | |||||||||||||||||||||||||||
|
Securities:
|
||||||||||||||||||||||||||||||||||||
|
Federal agencies
|
52,694 | 45,660 | 68,521 | 2,139 | 2,215 | 3,032 | 4.06 | 4.85 | 4.42 | |||||||||||||||||||||||||||
|
Mortgage-backed
|
40,363 | 47,997 | 25,406 | 2,100 | 2,433 | 1,255 | 5.20 | 5.07 | 4.94 | |||||||||||||||||||||||||||
|
State and municipal
|
52,687 | 45,573 | 46,069 | 2,972 | 2,505 | 2,530 | 5.64 | 5.50 | 5.49 | |||||||||||||||||||||||||||
|
Other
|
7,493 | 6,141 | 7,484 | 261 | 277 | 438 | 3.48 | 4.51 | 5.85 | |||||||||||||||||||||||||||
|
Total securities
|
153,237 | 145,371 | 147,480 | 7,472 | 7,430 | 7,255 | 4.88 | 5.11 | 4.92 | |||||||||||||||||||||||||||
|
Deposits in other banks
|
28,804 | 9,239 | 13,431 | 378 | 301 | 679 | 1.31 | 3.26 | 5.06 | |||||||||||||||||||||||||||
|
Total interest earning assets
|
741,308 | 722,009 | 710,687 | 39,016 | 43,753 | 49,510 | 5.26 | 6.06 | 6.97 | |||||||||||||||||||||||||||
|
Nonearning assets
|
68,832 | 63,859 | 62,952 | |||||||||||||||||||||||||||||||||
|
Total assets
|
$ | 810,140 | $ | 785,868 | $ | 773,639 | ||||||||||||||||||||||||||||||
|
Deposits:
|
||||||||||||||||||||||||||||||||||||
|
Demand
|
$ | 98,576 | $ | 109,492 | $ | 107,834 | 290 | 803 | 1,550 | 0.29 | 0.73 | 1.44 | ||||||||||||||||||||||||
|
Money market
|
72,918 | 53,659 | 52,843 | 527 | 1,011 | 1,429 | 0.72 | 1.88 | 2.70 | |||||||||||||||||||||||||||
|
Savings
|
62,219 | 61,620 | 66,246 | 148 | 331 | 845 | 0.24 | 0.54 | 1.28 | |||||||||||||||||||||||||||
|
Time
|
273,301 | 258,773 | 261,286 | 7,434 | 10,135 | 11,711 | 2.72 | 3.92 | 4.48 | |||||||||||||||||||||||||||
|
Total deposits
|
507,014 | 483,544 | 488,209 | 8,399 | 12,280 | 15,535 | 1.66 | 2.54 | 3.18 | |||||||||||||||||||||||||||
|
Customer repurchase
|
||||||||||||||||||||||||||||||||||||
|
agreements
|
63,115 | 52,264 | 48,088 | 670 | 1,377 | 1,841 | 1.06 | 2.63 | 3.83 | |||||||||||||||||||||||||||
|
Other short-term borrowings
|
1,037 | 9,818 | 346 | 5 | 252 | 19 | 0.48 | 2.57 | 5.49 | |||||||||||||||||||||||||||
|
Long-term borrowings
|
30,849 | 34,235 | 32,245 | 1,715 | 1,930 | 1,975 | 5.56 | 5.64 | 6.12 | |||||||||||||||||||||||||||
|
Total interest bearing
|
||||||||||||||||||||||||||||||||||||
|
liabilities
|
602,015 | 579,861 | 568,888 | 10,789 | 15,839 | 19,370 | 1.79 | 2.73 | 3.40 | |||||||||||||||||||||||||||
|
Noninterest bearing
|
||||||||||||||||||||||||||||||||||||
|
demand deposits
|
99,686 | 98,157 | 102,003 | |||||||||||||||||||||||||||||||||
|
Other liabilities
|
4,814 | 4,933 | 4,894 | |||||||||||||||||||||||||||||||||
|
Shareholders' equity
|
103,625 | 102,917 | 97,854 | |||||||||||||||||||||||||||||||||
|
Total liabilities and
|
||||||||||||||||||||||||||||||||||||
|
shareholders' equity
|
$ | 810,140 | $ | 785,868 | $ | 773,639 | ||||||||||||||||||||||||||||||
|
Interest rate spread
|
3.47 | % | 3.33 | % | 3.57 | % | ||||||||||||||||||||||||||||||
|
Net interest margin
|
3.81 | % | 3.87 | % | 4.24 | % | ||||||||||||||||||||||||||||||
|
Net interest income (taxable equivalent basis)
|
28,227 | 27,914 | 30,140 | |||||||||||||||||||||||||||||||||
|
Less: Taxable equivalent adjustment
|
955 | 881 | 913 | |||||||||||||||||||||||||||||||||
|
Net interest income
|
$ | 27,272 | $ | 27,033 | $ | 29,227 | ||||||||||||||||||||||||||||||
Table 2 presents the dollar amount of changes in interest income and interest expense, and distinguishes between changes resulting from fluctuations in average balances of interest earning assets and interest bearing liabilities (volume), and changes resulting from fluctuations in average interest rates on such assets and liabilities (rate). Changes attributable to both volume and rate have been allocated proportionately.
|
Table 2 - Changes in Net Interest Income (Rate / Volume Analysis)
|
||||||||||||||||||||||||
|
(in thousands)
|
||||||||||||||||||||||||
|
2009 vs. 2008
|
2008 vs. 2007
|
|||||||||||||||||||||||
|
Change
|
Change
|
|||||||||||||||||||||||
|
Increase
|
Attributable to
|
Increase
|
Attributable to
|
|||||||||||||||||||||
|
Interest income
|
(Decrease)
|
Rate
|
Volume
|
(Decrease)
|
Rate
|
Volume
|
||||||||||||||||||
|
Loans:
|
||||||||||||||||||||||||
|
Commercial
|
$ | (1,302 | ) | $ | (1,151 | ) | $ | (151 | ) | $ | (1,465 | ) | $ | (1,576 | ) | $ | 111 | |||||||
|
Real Estate
|
(3,418 | ) | (3,140 | ) | (278 | ) | (3,909 | ) | (5,200 | ) | 1,291 | |||||||||||||
|
Consumer
|
(136 | ) | (35 | ) | (101 | ) | (180 | ) | (30 | ) | (150 | ) | ||||||||||||
|
Total loans
|
(4,856 | ) | (4,326 | ) | (530 | ) | (5,554 | ) | (6,806 | ) | 1,252 | |||||||||||||
|
Securities:
|
||||||||||||||||||||||||
|
Federal agencies
|
(76 | ) | (390 | ) | 314 | (817 | ) | 270 | (1,087 | ) | ||||||||||||||
|
Mortgage-backed
|
(333 | ) | 63 | (396 | ) | 1,178 | 34 | 1,144 | ||||||||||||||||
|
State and municipal
|
467 | 67 | 400 | (25 | ) | 2 | (27 | ) | ||||||||||||||||
|
Other securities
|
(16 | ) | (70 | ) | 54 | (161 | ) | (90 | ) | (71 | ) | |||||||||||||
|
Total securities
|
42 | (330 | ) | 372 | 175 | 216 | (41 | ) | ||||||||||||||||
|
Deposits in other banks
|
77 | (263 | ) | 340 | (378 | ) | (201 | ) | (177 | ) | ||||||||||||||
|
Total interest income
|
(4,737 | ) | (4,919 | ) | 182 | (5,757 | ) | (6,791 | ) | 1,034 | ||||||||||||||
|
Interest expense
|
||||||||||||||||||||||||
|
Deposits:
|
||||||||||||||||||||||||
|
Demand
|
(513 | ) | (440 | ) | (73 | ) | (747 | ) | (770 | ) | 23 | |||||||||||||
|
Money market
|
(484 | ) | (765 | ) | 281 | (418 | ) | (440 | ) | 22 | ||||||||||||||
|
Savings
|
(183 | ) | (186 | ) | 3 | (514 | ) | (459 | ) | (55 | ) | |||||||||||||
|
Time
|
(2,701 | ) | (3,243 | ) | 542 | (1,576 | ) | (1,464 | ) | (112 | ) | |||||||||||||
|
Total deposits
|
(3,881 | ) | (4,634 | ) | 753 | (3,255 | ) | (3,133 | ) | (122 | ) | |||||||||||||
|
Customer repurchase
|
||||||||||||||||||||||||
|
agreements
|
(707 | ) | (949 | ) | 242 | (464 | ) | (613 | ) | 149 | ||||||||||||||
|
Other borrowings
|
(462 | ) | 181 | (643 | ) | 188 | (427 | ) | 615 | |||||||||||||||
|
Total interest expense
|
(5,050 | ) | (5,402 | ) | 352 | (3,531 | ) | (4,173 | ) | 642 | ||||||||||||||
|
Net interest income
|
$ | 313 | $ | 483 | $ | (170 | ) | $ | (2,226 | ) | $ | (2,618 | ) | $ | 392 | |||||||||
Noninterest Income
Noninterest income is generated from a variety of sources, including fee-based deposit services, trust and investment services, mortgage banking, and retail brokerage. Noninterest income also includes net gains or losses on sales, calls, or impairment of investment securities. It also includes net gains or losses related to foreclosed real estate.
2009 compared to 2008
Noninterest income was $7,043,000 in 2009, down $807,000 or 11% from 2008, resulting primarily from $1,475,000 in write downs associated with foreclosed real estate. Of that amount, approximately $1.2 million was related to a single real estate development and acquisition relationship. The major source of noninterest income was trust fees, which totaled $3,153,000 for 2009, down 9.1% from 2008, resulting mostly from declines in the stock market. The level of the stock market is a primary driver in trust fee income. The second major source of noninterest income was service charges on deposit accounts, which totaled $2,085,000 for 2009, down 10.3% from 2008, mostly related to declining volumes of returned check fees. Mortgage banking income totaled $1,605,000 for 2009, up 104% from 2008, related to historically low interest rates and a recently enacted homebuyers’ tax credit.
2008 compared to 2007
Noninterest income was $7,913,000 in 2008, down 10.3% from 2007, resulting from decreases in most revenue sources and losses of $450,000 on securities. Trust fees, which totaled $3,467,000 for 2008, were down 3.1% from 2007. Service charges on deposit accounts, which totaled $2,324,000 for 2008, were down 8.2% from 2007, mostly related to declining volumes of returned check fees. Mortgage banking income totaled $788,000 for 2008, was down 17.4% from 2007. Securities losses in 2008 and impairment of securities in 2007 were primarily related to the impairment and subsequent sale of shares the Company held in Federal National Mortgage Association (“FNMA”) and Federal Home Loan Mortgage Corporation (“FHLMC”) preferred stock.
Noninterest Expense
2009 compared to 2008
Noninterest expense was $23,318,000 in 2009, up $1,194,000 or 5.4% over 2008. The increase in FDIC insurance expense accounted for $1,006,000 or 84.3% of this increase.
Salaries expense totaled $10,048,000 for 2009, up 2.6% from 2008. This increase resulted from small salary increases, increased incentive payments, and increased commission payments related to the higher volume of secondary market mortgage loans sold. It was mitigated by a mid-year reduction in force that impacted less than five percent of the Company’s employees.
Benefits expense totaled $3,201,000 for 2009, up 6.7% from 2008. This increase resulted primarily from an increase in costs associated with the Company’s defined benefit program. At year-end 2009 the Company converted its existing defined benefit program to a cash balance program. Management expects the conversion will save significant costs in the future.
Occupancy and equipment expense totaled $2,927,000 for 2009, up 5% from 2008.This increase resulted primarily from an increase in depreciation and premises expense related to the mid-year opening of a newly constructed branch in Martinsville.
FDIC insurance totaled $1,186,000 for 2009, up 559% or $1,006,000 from 2008. The increase resulted from the aggregate impact of premium increases driven by overall market conditions, the expiration of premium credits in 2008, and the imposition of special assessment in the second quarter of 2009 of approximately $360,000. In December 2009 the Company paid, at the mandate of the FDIC, an estimated three-year deposit premium of $2.9 million which will be amortized to expense over the upcoming three fiscal years.
2008 compared to 2007
Noninterest expense was $22,124,000 in 2008, up 3.7% over 2007, due primarily to increased health insurance costs and provision for unfunded lending commitments.
Salaries expense totaled $9,792,000 for 2008, up 1.1% from 2007. This increase resulted from very limited salary increases, but was mitigated by decreased incentive payments and decreased commission payments related to the lower volumes of secondary market mortgage loans sold.
Benefits expense totaled $3,001,000 for 2008, up 9.2% from 2007. This increase resulted primarily from an increase in costs associated with the Company’s group insurance program.
Occupancy and equipment expense totaled $2,788,000 for 2008, down 6.5% from 2007.This decrease resulted primarily from declining depreciation and repairs expense.
Other expense totaled $5,292,000 for 2008, up 10.7% from 2007. This increase resulted primarily from an increase in provision for off-balance sheet credit risk of $296,000.
Income Taxes
Income taxes on 2009 earnings amounted to $2,525,000, resulting in an effective tax rate of 27.0%, compared to 28.4% in 2008 and 29.9% in 2007. The Company was subject to a statutory, blended, Federal tax rate of 34.0% in 2009, 34.1% in 2008, and 34.4% in 2007. The major difference between the statutory rate and the effective rate results from income that is not taxable for Federal income tax purposes. The primary non-taxable income is that of state and municipal securities and industrial revenue bonds or loans.
Impact of Inflation and Changing Prices
The majority of assets and liabilities of a financial institution are monetary in nature and therefore differ greatly from most commercial and industrial companies that have significant investments in fixed assets or inventories. The most significant effect of inflation is on noninterest expenses that tend to rise during periods of inflation. Changes in interest rates have a greater impact on a financial institution’s profitability than do the effects of higher costs for goods and services. Through its balance sheet management practices, the Company has the ability to react to those changes and measure and monitor its interest rate and liquidity risk.
Effectively managing market risk is essential to achieving the Company’s financial objectives. Market risk reflects the risk of economic loss resulting from changes in interest rates and market prices. The Company is generally not subject to currency exchange risk or commodity price risk. The Company’s primary market risk exposure is interest rate risk; however, market risk also includes liquidity risk. Both are discussed below.
Interest Rate Risk Management
Interest rate risk and its impact on net interest income is a primary market risk exposure. The Company manages its exposure to fluctuations in interest rates through policies approved by its Asset/Liability Investment Committee (“ALCO”) and Board of Directors, both of which receive and review periodic reports of the Company’s interest rate risk position.
The Company uses simulation analysis to measure the sensitivity of projected earnings to changes in interest rates. Simulation takes into account current balance sheet volumes and the scheduled repricing dates and maturities of assets and liabilities. It incorporates numerous assumptions including growth, changes in the mix of assets and liabilities, prepayments, and average rates earned and paid. Based on this information, management uses the model to project net interest income under multiple interest rate scenarios.
A balance sheet is considered asset sensitive when its earning assets (loans and securities) reprice faster or to a greater extent than its liabilities (deposits and borrowings). An asset sensitive balance sheet will produce more net interest income when interest rates rise and less net interest income when they decline. Based on the Company’s simulation analysis, management believes the Company’s interest sensitivity position at December 31, 2009 is asset sensitive.
The interest rate sensitivity position at December 31, 2009 is illustrated in the following table. The carrying amounts of assets and liabilities are presented in the periods they are expected to reprice or mature.
|
Table 3 - Interest Rate Sensitivity Gap Analysis
|
||||||||||||||||||||
|
December 31, 2009
|
||||||||||||||||||||
|
(dollars in thousands)
|
||||||||||||||||||||
|
Within
|
> 1 Year
|
> 3 Year
|
||||||||||||||||||
|
1 Year
|
to 3 Years
|
to 5 Years
|
> 5 Years
|
Total
|
||||||||||||||||
|
Interest sensitive assets:
|
||||||||||||||||||||
|
Interest bearing deposits
|
||||||||||||||||||||
|
with other banks
|
$ | 2,405 | $ | 8,288 | $ | - | $ | - | $ | 10,693 | ||||||||||
|
Securities
|
41,217 | 38,643 | 30,172 | 89,654 | 199,686 | |||||||||||||||
|
Loans (1)
|
322,558 | 81,753 | 80,826 | 45,344 | 530,481 | |||||||||||||||
|
Total interest
|
||||||||||||||||||||
|
sensitive assets
|
366,180 | 128,684 | 110,998 | 134,998 | 740,860 | |||||||||||||||
|
Interest sensitive liabilities:
|
||||||||||||||||||||
|
Checking and savings deposits
|
158,898 | - | - | - | 158,898 | |||||||||||||||
|
Money market deposits
|
75,554 | - | - | - | 75,554 | |||||||||||||||
|
Time deposits
|
177,818 | 62,222 | 27,905 | 141 | 268,086 | |||||||||||||||
|
Customer repurchase agreements
|
65,929 | - | - | - | 65,929 | |||||||||||||||
|
Federal Home Loan Bank advances
|
- | 8,000 | 638 | - | 8,638 | |||||||||||||||
|
Trust preferred capital notes
|
- | 20,619 | - | - | 20,619 | |||||||||||||||
|
Total interest
|
||||||||||||||||||||
|
sensitive liabilities
|
478,199 | 90,841 | 28,543 | 141 | 597,724 | |||||||||||||||
|
Interest sensitivity gap
|
$ | (112,019 | ) | $ | 37,843 | $ | 82,455 | $ | 134,857 | $ | 143,136 | |||||||||
|
Cumulative interest sensitivity gap
|
$ | (112,019 | ) | $ | (74,176 | ) | $ | 8,279 | $ | 143,136 | ||||||||||
|
Percentage cumulative gap
|
||||||||||||||||||||
|
to total interest sensitive assets
|
(15.1 | ) % | (10.0 | ) % | 1.1 | % | 19.3 | % | ||||||||||||
|
(1) Loans include loans held for sale and are net of unearned income.
|
||||||||||||||||||||
Table 4 shows the estimated impact of changes in interest rates on net interest income as of December 31, 2009, assuming gradual and parallel changes in interest rates, and consistent levels of assets and liabilities. Net interest income for the following twelve months is projected to increase when interest rates are higher than current rates. Due to the current low interest rate environment, no measurement was considered necessary for a further decline in interest rates.
|
Table 4 - Estimated Changes in Net Interest Income
|
||||||||
|
(dollars in thousands)
|
||||||||
|
December 31, 2009
|
||||||||
|
Change in
|
Changes in
|
|||||||
|
Interest
|
Net interest Income (1)
|
|||||||
|
Rates
|
Amount
|
Percent
|
||||||
|
Up 4.0%
|
$ | 4,982 | 16.4 | % | ||||
|
Up 3.0%
|
3,615 | 11.9 | ||||||
|
Up 2.0%
|
2,307 | 7.6 | ||||||
|
Up 1.0%
|
934 | 3.1 | ||||||
|
No change
|
- | - | ||||||
|
(1) Represents the difference between estimated net interest income for the next 12 months in the new interest rate environment and the current interest rate environment.
|
||||||||
Management cannot predict future interest rates or their exact effect on net interest income. Computations of future effects of hypothetical interest rate changes are based on numerous assumptions and should not be relied upon as indicative of actual results. Certain limitations are inherent in such computations. Assets and liabilities may react differently than projected to changes in market interest rates. The interest rates on certain types of assets and liabilities may fluctuate in advance of changes in market interest rates, while rates on other types of assets and liabilities may lag changes in market interest rates. Interest rate shifts may not be parallel.
Changes in interest rates can cause substantial changes in the amount of prepayments of loans and mortgage-backed securities, which may in turn affect the Company’s interest rate sensitivity position. Additionally, credit risk may rise if an interest rate increase adversely affects the ability of borrowers to service their debt.
Liquidity Risk Management
Liquidity is the ability of the Company to convert assets into cash or cash equivalents without significant loss and to raise additional funds by increasing liabilities. Liquidity management involves maintaining the Company’s ability to meet the daily cash flow requirements of its customers, whether they are borrowers requiring funds to meet their credit needs or depositors desiring to withdraw funds. Additionally, the parent company requires cash for various operating needs including dividends to shareholders, stock repurchases, the servicing of debt, and the payment of general corporate expenses. The Company manages its exposure to fluctuations in interest rates through policies approved by the ALCO and Board of Directors, both of which receive periodic reports of the Company’s interest rate risk position. The Company uses a simulation and budget model to assist in the management of the future liquidity needs of the Company.
Liquidity sources include cash and amounts due from banks, deposits in other banks, loan repayments, increases in deposits, lines of credit from the Federal Home Loan Bank of Atlanta (“FHLB”), federal funds lines of credit from two correspondent banks, access to the Federal Reserve Bank of Richmond’s discount window, and maturities and sales of securities. Management believes that these sources provide sufficient and timely liquidity.
The Company has a line of credit with the FHLB, equal to 30% of the Company’s assets, subject to the amount of collateral pledged. Under the terms of its collateral agreement with the FHLB, the Company provides a blanket lien covering all of its residential first mortgage loans and home equity lines of credit. In addition, the Company pledges as collateral its capital stock in and deposits with the FHLB. Borrowings under the line were $8,638,000 at December 31, 2009 and $21,637,000 at December 31, 2008. In addition, the Company had outstanding against this line $40 million in FHLB letters of credit used to provide collateral for public deposits in Virginia.
The Company had fixed-rate term borrowing contracts with the FHLB as of December 31, 2009, with the following final maturities:
|
Amount
|
Expiration Date
|
|||||
| $ | 8,000,000 | 2011 | ||||
| 638,000 | 2014 | |||||
The Company has federal funds lines of credit established with two other banks in the amounts of $15,000,000 and $5,000,000, and has access to the Federal Reserve Bank’s discount window. There were no balances outstanding under these facilities at December 31, 2009 or 2008.
BALANCE SHEET ANALYSIS
Securities
The securities portfolio generates income, plays a strategic role in the management of interest rate sensitivity, provides a source of liquidity, and is used to meet collateral requirements. The securities portfolio consists primarily of high quality investments. Federal agency, mortgage-backed, and state and municipal securities comprise the majority of the portfolio.
During 2008, the Company sold all its remaining preferred shares in FNMA and FHLMC.
The following table presents information on the amortized cost, maturities, and taxable equivalent yields of securities at the end of the last three years.
|
Table 5 - Securities Portfolio
|
|||||||||||||||||
|
(in thousands, except yields)
|
|||||||||||||||||
|
December 31,
|
|||||||||||||||||
|
2009
|
2008
|
2007
|
|||||||||||||||
|
Taxable
|
Taxable
|
Taxable
|
|||||||||||||||
|
Amortized
|
Equivalent
|
Amortized
|
Equivalent
|
Amortized
|
Equivalent
|
||||||||||||
|
Cost
|
Yield
|
Cost
|
Yield
|
Cost
|
Yield
|
||||||||||||
|
Federal Agencies:
|
|||||||||||||||||
|
Within 1 year
|
$ | 32,498 | 1.76 | % | $ | 8,240 | 4.58 | % | $ | 4,000 | 3.46 | % | |||||
|
1 to 5 years
|
42,404 | 3.13 | 29,719 | 4.95 | 45,170 | 4.79 | |||||||||||
|
5 to 10 years
|
6,377 | 4.58 | 5,372 | 5.15 | 6,180 | 5.46 | |||||||||||
|
Total
|
81,279 | 2.70 | 43,331 | 4.91 | 55,350 | 4.77 | |||||||||||
|
Mortgage-backed:
|
|||||||||||||||||
|
Within 1 year
|
393 | 3.66 | 746 | 3.91 | 108 | 3.43 | |||||||||||
|
1 to 5 years
|
4,081 | 4.89 | 3,435 | 4.95 | 3,461 | 4.33 | |||||||||||
|
5 to 10 years
|
14,014 | 4.97 | 12,730 | 4.81 | 14,411 | 4.85 | |||||||||||
|
Over 10 years
|
23,076 | 4.78 | 28,482 | 5.08 | 27,674 | 5.34 | |||||||||||
|
Total
|
41,564 | 4.84 | 45,393 | 4.97 | 45,654 | 5.10 | |||||||||||
|
State and Municipal:
|
|||||||||||||||||
|
Within 1 year
|
5,958 | 4.95 | 4,549 | 5.04 | 4,025 | 5.60 | |||||||||||
|
1 to 5 years
|
18,449 | 5.06 | 23,127 | 4.99 | 24,443 | 4.97 | |||||||||||
|
5 to 10 years
|
22,794 | 5.23 | 9,302 | 5.99 | 11,679 | 5.63 | |||||||||||
|
Over 10 years
|
17,164 | 5.61 | 6,615 | 6.19 | 7,878 | 5.73 | |||||||||||
|
Total
|
64,365 | 5.26 | 43,593 | 5.39 | 48,025 | 5.31 | |||||||||||
|
Other Securities:
|
|||||||||||||||||
|
Within 1 year
|
2,003 |
|
4.23 | 1,485 |
|
3.32 | - |
|
- | ||||||||
|
1 to 5 years
|
1,959 | 6.28 | - | - | 1,485 | 3.32 | |||||||||||
|
Total
|
3,962 | 5.24 | 1,485 | 3.32 | 1,485 | 3.32 | |||||||||||
|
Total portfolio
|
$ | 191,170 | 4.08 | % | $ | 133,802 | 5.07 | % | $ | 150,514 | 5.03 | % | |||||
Loans
The loan portfolio consists primarily of commercial and residential real estate loans, commercial loans to small and medium-sized businesses, construction and land development loans, and home equity loans. Average loans increased $8,132,000, or 1.4%, from 2008 to 2009. Average loans increased $17,623,000, or 3.2%, from 2007 to 2008.
At December 31, 2009 total loans were $527,991,000, a decrease of $43,119,000 or 7.6% from the prior year. The decrease resulted mostly from economic conditions and business and consumer deleveraging.
Loans held for sale totaled $2,490,000 at December 31, 2009, and $1,764,000 at December 31, 2008.
The following table provides loan balance information by geographic regions. In some circumstances, loans may be originated in one region for borrowers located in other regions.
|
Table 6 - Loans by Geographic Region
|
||||||||||||
|
December 31, 2009
|
||||||||||||
|
(dollars in thousands)
|
Balance
|
Percentage
of Portfolio
|
Percentage Change
in Balance Since
December 31, 2008
|
|||||||||
|
Danville region
|
$ | 200,212 | 37.9 | % | (8.3 | ) % | ||||||
|
Central region
|
146,639 | 27.8 | (9.4 | ) | ||||||||
|
Southside region
|
181,140 | 34.3 | (5.1 | ) | ||||||||
|
Total loans
|
$ | 527,991 | 100.0 | % | ||||||||
The Danville region consists of offices in Danville and Yanceyville, North Carolina. The Central region consists of offices in Bedford, Lynchburg, and the counties of Bedford, Campbell, and Nelson. The Southside region consists of offices in Martinsville, the counties of Halifax, Henry, and Pittsylvania, and Greensboro, North Carolina.
The Company does not participate in or have any highly leveraged lending transactions, as defined by bank regulations. The Company has no foreign loans. While there were no concentrations of loans to any individual, group of individuals, business, or industry that exceeded 10% of total loans at December 31, 2009 or 2008, loans to lessors of nonresidential buildings represented 13.9% of total loans at December 31, 2009 and 13.7% at December 31, 2008; the lessees and lessors are engaged in a variety of industries.
The following table provides information on loan types.
|
Table 7 - Loans
|
||||||||||||||||||||
|
December 31,
|
||||||||||||||||||||
|
(in thousands)
|
2009
|
2008
|
2007
|
2006
|
2005
|
|||||||||||||||
|
Real estate:
|
||||||||||||||||||||
|
Construction and land development
|
$ | 40,371 | $ | 63,361 | $ | 69,803 | $ | 69,404 | $ | 50,092 | ||||||||||
|
Commercial real estate
|
208,066 | 207,160 | 198,332 | 186,639 | 142,968 | |||||||||||||||
|
Residential real estate
|
121,639 | 136,480 | 133,899 | 131,126 | 94,405 | |||||||||||||||
|
Home equity
|
64,678 | 57,170 | 48,313 | 52,531 | 42,178 | |||||||||||||||
|
Total real estate
|
434,754 | 464,171 | 450,347 | 439,700 | 329,643 | |||||||||||||||
|
Commercial and industrial
|
86,312 | 98,546 | 91,028 | 91,511 | 76,735 | |||||||||||||||
|
Consumer
|
6,925 | 8,393 | 10,016 | 11,017 | 10,709 | |||||||||||||||
|
Total loans
|
$ | 527,991 | $ | 571,110 | $ | 551,391 | $ | 542,228 | $ | 417,087 | ||||||||||
The following table presents the maturity schedule of selected loan types.
|
Table 8 - Maturities of Selected Loan Types
|
||||||||||||
|
December 31, 2009
|
||||||||||||
|
Commercial
|
||||||||||||
|
and
|
Real Estate
|
|||||||||||
|
(in thousands)
|
Industrial (1)
|
Construction
|
Total
|
|||||||||
|
1 year or less
|
$ | 38,901 | $ | 20,005 | $ | 58,906 | ||||||
|
1 to 5 years (2)
|
45,407 | 16,261 | 61,668 | |||||||||
|
After 5 years (2)
|
2,004 | 4,105 | 6,109 | |||||||||
|
Total
|
$ | 86,312 | $ | 40,371 | $ | 126,683 | ||||||
|
(1) includes agricultural loans.
|
||||||||||||
|
(2) Of the loans due after one year, $63,338 have predetermined interest rates and $4,439
|
||||||||||||
|
have floating or adjustable interest rates.
|
||||||||||||
Allowance for Loan Losses, Asset Quality, Provision for Loan Losses, and Credit Risk Management
The purpose of the allowance for loan losses is to provide for probable losses in the loan portfolio. The allowance is increased by the provision for loan losses and by recoveries of previously charged-off loans. Loan charge-offs decrease the allowance.
The Company uses certain practices to manage its credit risk. These practices include (a) appropriate lending limits for loan officers, (b) a loan approval process, (c) careful underwriting of loan requests, including analysis of borrowers, collateral, and market risks, (d) regular monitoring of the portfolio, including diversification by type and geography, (e) review of loans by a Loan Review department, which operates independently of loan production, (f) regular meetings of a Credit Committee to discuss portfolio and policy changes and make decisions on large or unusual loan requests, and (g) regular meetings of an Asset Quality Committee which reviews the status of individual loans.
The Company’s lenders are responsible for assigning risk ratings to loans using the parameters set forth in the Company’s Credit Policy. The risk ratings are reviewed for accuracy, on a sample basis, by the Company’s Loan Review department. These risk ratings are used in calculating the level of the allowance for loan losses.
Calculations of the allowance for loan losses are prepared quarterly by the Loan Review department. The Company’s Credit Committee, Audit Committee, and Board of Directors review the allowance for adequacy. In determining the adequacy of the allowance factors which are considered include historical loss experience, the size and composition of the loan portfolio, loan risk ratings, nonperforming loans, impaired loans, other problem credits, the value and adequacy of collateral and guarantors, and national and local economic conditions.
The Company’s allowance for loan losses has two basic components: the formula allowance and the specific allowance. Each of these components is determined based upon estimates. The formula allowance uses historical loss experience as an indicator of future losses, along with various qualitative factors, including levels and trends in delinquencies, nonaccrual loans, charge-offs and recoveries, trends in volume and terms of loans, effects of changes in underwriting standards, experience of lending staff, economic conditions, and portfolio concentrations. In the formula allowance, the historical loss rate is combined with the qualitative factors, resulting in an adjusted loss factor for each risk-grade category of loans. Allowance calculations for consumer loans are calculated on a product basis rather than a risk grade. The period-end balances for each loan risk-grade category are multiplied by the adjusted loss factor. The formula allowance is calculated for a range of outcomes. The specific allowance uses various techniques to arrive at an estimate of loss for specifically identified impaired loans. The use of these computed values is inherently subjective and actual losses could be greater or less than the estimates.
No single statistic, formula, or measurement determines the adequacy of the allowance. Management makes subjective and complex judgments about matters that are inherently uncertain, and different amounts would be reported under different conditions or using different assumptions. For analytical purposes, management allocates a portion of the allowance to specific loan categories and specific loans (the allocated allowance). The entire allowance is used to absorb credit losses inherent in the loan portfolio, including identified and unidentified losses.
The relationships and ratios used in calculating the allowance, including the qualitative factors, may change from period to period. Furthermore, management cannot provide assurance that, in any particular period, the Company will not have sizeable credit losses in relation to the amount reserved. Management may find it necessary to significantly adjust the allowance, considering current factors at the time, including economic conditions, industry trends, and ongoing internal and external examination processes. The allowance is subject to regulatory examinations and determinations as to adequacy, which may take into account such factors as the methodology used to calculate the allowance and the size of the allowance in comparison to peer banks.
The Southern Virginia market, in which the Company has a significant presence, is currently and has been under economic pressure. The region’s economic base has historically been weighted toward the manufacturing sector. Increased global competition has negatively impacted the textile industry and several manufacturers have closed plants due to competitive pressures or the relocation of some operations to foreign countries. Other important industries include farming, tobacco processing and sales, food processing, furniture manufacturing and sales, specialty glass manufacturing, and packaging tape production. Companies within these industries, especially furniture manufacturing, have also closed plants for reasons similar to those noted above. Additional declines in manufacturing production and unemployment could negatively impact the ability of certain borrowers to repay loans. Also, the current local and national economic condition, which is resulting in significant unemployment and bankruptcies, foreclosures and bank failures, may further intensify the economic pressure in our markets.
For the years ended December 31, 2009, 2008, and 2007 the allowance for loan losses was $8,166,000, $7,824,000 and $7,395,000, respectively. The allowance for loan losses as a percentage of loans at each of those dates was 1.55%, 1.37%, and 1.34%, respectively. The allowance for loan losses increased during 2009 by 4.4% and during the same period the loan portfolio contracted by 7.6%. Even though these indicators are directionally inconsistent, management believes that the growth of the allowance is appropriate in light of expectations regarding levels of foreclosure in residential and commercial real estate, continuing levels of high unemployment, a growing number of bankruptcies, continued economic uncertainty and weak real estate prices.
The provision for loan losses for the same years was $1,662,000, $1,620,000, and $403,000, respectively.
Net loans charge-offs totaled $1,320,000 in 2009, $1,191,000 in 2008, and $272,000 in 2007. Seven relationships accounted for $1,010,000 of the charge offs in 2009; these were primarily residential real estate related, but also included commercial real estate. One residential construction and development loan, secured by undeveloped and partially developed land in the Triad area of North Carolina, accounted for $575,000 of the net charge-offs in 2008. Net charge offs to average loans during the same periods totaled 0.24%, 0.21%, and 0.05%, respectively. Table 12 presents the Company’s loan loss and recovery experience for the past five years.
The allowance for loan losses is allocated to loan types based upon historical loss factors, risk grades on individual loans, portfolio analyses of smaller balance, homogenous loans, and qualitative factors. Qualitative factors include trends in delinquencies, nonaccrual loans, and loss rates; trends in volume and terms of loans, effects of changes in risk selection, underwriting standards, and lending policies; experience of lending officers and other lending staff; national and local economic trends and conditions; and concentrations of credit. Table 10 summarizes the allocation of the allowance for loan losses for the past five years.
A loan is considered impaired when, based on current information and events, it is probable that the Company will be unable to collect the scheduled payments of principal or interest when due according to the contractual terms of the loan agreement. The following table shows loans that were considered impaired as of year-end.
|
Table 9 - Impaired Loans
|
||||||||||||||||||||
|
December 31,
|
||||||||||||||||||||
|
(in thousands)
|
2009
|
2008
|
2007
|
2006
|
2005
|
|||||||||||||||
|
Not on nonaccrual status
|
$ | 2,067 | $ | 1,921 | $ | 2,255 | $ | 262 | $ | 537 | ||||||||||
|
On nonaccrual status
|
1,757 | 1,271 | 1,310 | 1,114 | 2,995 | |||||||||||||||
|
Total impaired loans
|
$ | 3,824 | $ | 3,192 | $ | 3,565 | $ | 1,376 | $ | 3,532 | ||||||||||
|
Table 10 - Allocation of Allowance for Loan Losses
|
|||||||||||||||||||||||||||||||||||
|
(dollars in thousands)
|
|||||||||||||||||||||||||||||||||||
|
December 31,
|
|||||||||||||||||||||||||||||||||||
|
2009
|
2008
|
2007
|
2006
|
2005
|
|||||||||||||||||||||||||||||||
| Amount | % | Amount | % | Amount | % | Amount | % |
Amount
|
% | ||||||||||||||||||||||||||
|
|
|||||||||||||||||||||||||||||||||||
|
Commercial (including
|
|||||||||||||||||||||||||||||||||||
|
commercial real estate)
|
$ | 5,024 | 60 | % | $ | 5,163 | 62 | % | $ | 5,056 | 62 | % | $ | 4,467 | 61 | % | $ | 3,897 | 64 | % | |||||||||||||||
|
Residential real estate
|
3,000 | 39 | 2,335 | 37 | 1,852 | 36 | 2,119 | 37 | 1,462 | 33 | |||||||||||||||||||||||||
|
Consumer
|
142 | 1 | 326 | 1 | 443 | 2 | 521 | 2 | 653 | 3 | |||||||||||||||||||||||||
|
Unallocated
|
- | - | - | - | 44 | - | 157 | - | 97 | - | |||||||||||||||||||||||||
|
Total
|
$ | 8,166 | 100 | % | $ | 7,824 | 100 | % | $ | 7,395 | 100 | % | $ | 7,264 | 100 | % | $ | 6,109 | 100 | % | |||||||||||||||
|
% - represents the percentage of loans in each category to total loans.
|
|||||||||||||||||||||||||||||||||||
|
Table 11 - Asset Quality Ratios
|
||||||||||||||||||||
|
As of or for the Years Ended December 31,
|
||||||||||||||||||||
|
2009
|
2008
|
2007
|
2006
|
2005
|
||||||||||||||||
|
Allowance to loans*
|
1.55 | % | 1.37 | % | 1.34 | % | 1.34 | % | 1.46 | % | ||||||||||
|
Net charge-offs to year-end allowance
|
16.16 | 15.22 | 3.68 | 6.90 | 38.27 | |||||||||||||||
|
Net charge-offs to average loans
|
0.24 | 0.21 | 0.05 | 0.10 | 0.56 | |||||||||||||||
|
Nonperforming assets to total assets*
|
0.87 | 0.91 | 0.42 | 0.45 | 0.72 | |||||||||||||||
|
Nonperforming loans to loans*
|
0.69 | 0.50 | 0.48 | 0.63 | 1.02 | |||||||||||||||
|
Provision to net charge-offs
|
125.91 | 136.02 | 148.16 | 11.58 | 19.89 | |||||||||||||||
|
Provision to average loans
|
0.30 | 0.29 | 0.07 | 0.01 | 0.11 | |||||||||||||||
|
Allowance to nonperforming loans*
|
224.22 | 275.01 | 280.22 | 212.09 | 142.97 | |||||||||||||||
|
* - at year end
|
||||||||||||||||||||
|
Table 12 - Summary of Loan Loss Experience
|
||||||||||||||||||||
|
(in thousands)
|
||||||||||||||||||||
|
Year Ended December 31,
|
||||||||||||||||||||
|
2009
|
2008
|
2007
|
2006
|
2005
|
||||||||||||||||
|
Balance at beginning of period
|
$ | 7,824 | $ | 7,395 | $ | 7,264 | $ | 6,109 | $ | 7,982 | ||||||||||
|
Allowance from acquisition
|
- | - | - | 1,598 | - | |||||||||||||||
|
Charge-offs:
|
||||||||||||||||||||
|
Construction and land development
|
130 | 1,007 | - | 1 | - | |||||||||||||||
|
Commercial real estate
|
303 | 61 | 54 | 136 | 2,249 | |||||||||||||||
|
Residential real estate
|
609 | 196 | 140 | 163 | 35 | |||||||||||||||
|
Home equity
|
245 | 62 | 19 | - | - | |||||||||||||||
|
Total real estate
|
1,287 | 1,326 | 213 | 300 | 2,284 | |||||||||||||||
|
Commercial and industrial
|
163 | 63 | 103 | 354 | 76 | |||||||||||||||
|
Consumer
|
151 | 175 | 199 | 259 | 217 | |||||||||||||||
|
Total charge-offs
|
1,601 | 1,564 | 515 | 913 | 2,577 | |||||||||||||||
|
Recoveries:
|
||||||||||||||||||||
|
Construction and land development
|
2 | 71 | - | 1 | - | |||||||||||||||
|
Commercial real estate
|
15 | 101 | 15 | 98 | 46 | |||||||||||||||
|
Residential real estate
|
5 | 3 | 3 | 11 | 3 | |||||||||||||||
|
Home equity
|
1 | - | 1 | 1 | - | |||||||||||||||
|
Total real estate
|
23 | 175 | 19 | 111 | 49 | |||||||||||||||
|
Commercial and industrial
|
165 | 18 | 50 | 108 | 11 | |||||||||||||||
|
Consumer
|
93 | 180 | 174 | 193 | 179 | |||||||||||||||
|
Total recoveries
|
281 | 373 | 243 | 412 | 239 | |||||||||||||||
|
Net charge-offs
|
1,320 | 1,191 | 272 | 501 | 2,338 | |||||||||||||||
|
Provision for loan losses
|
1,662 | 1,620 | 403 | 58 | 465 | |||||||||||||||
|
Balance at end of period
|
$ | 8,166 | $ | 7,824 | $ | 7,395 | $ | 7,264 | $ | 6,109 | ||||||||||
Nonperforming loans include loans on which interest is no longer accrued; accruing loans that are contractually past due 90 days or more as to principal and interest payments, and any loans classified as troubled debt restructurings. Nonperforming loans to total loans were 0.69% at December 31, 2009 compared to 0.50% at December 31, 2008. Nonperforming assets include nonperforming loans and foreclosed real estate. Nonperforming assets represented 0.87% of total assets at December 31, 2009, down from 0.91% at December 31, 2008. There were no troubled debt restructurings at the end of any of the years presented in the table.
|
Table 13 - Nonperforming Assets
|
||||||||||||||||||||
|
(in thousands)
|
||||||||||||||||||||
|
December 31,
|
||||||||||||||||||||
|
2009
|
2008
|
2007
|
2006
|
2005
|
||||||||||||||||
|
Nonaccrual loans:
|
||||||||||||||||||||
|
Real estate
|
$ | 3,138 | $ | 2,730 | $ | 2,488 | $ | 3,195 | $ | 4,098 | ||||||||||
|
Commercial
|
463 | 73 | 107 | 151 | 12 | |||||||||||||||
|
Agricultural
|
- | - | - | - | - | |||||||||||||||
|
Consumer
|
41 | 42 | 44 | 79 | 107 | |||||||||||||||
|
Total nonaccrual loans
|
3,642 | 2,845 | 2,639 | 3,425 | 4,217 | |||||||||||||||
|
Restructured loans
|
- | - | - | - | - | |||||||||||||||
|
Loans past due 90 days
|
||||||||||||||||||||
|
and accruing interest:
|
||||||||||||||||||||
|
Real estate
|
- | - | - | - | 46 | |||||||||||||||
|
Commercial
|
- | - | - | - | 10 | |||||||||||||||
|
Agricultural
|
- | - | - | - | - | |||||||||||||||
|
Consumer
|
- | - | - | - | - | |||||||||||||||
|
Total past due loans
|
- | - | - | - | 56 | |||||||||||||||
|
Total nonperforming loans
|
3,642 | 2,845 | 2,639 | 3,425 | 4,273 | |||||||||||||||
|
Foreclosed real estate
|
3,414 | 4,311 | 632 | 99 | 188 | |||||||||||||||
|
Total nonperforming assets
|
$ | 7,056 | $ | 7,156 | $ | 3,271 | $ | 3,524 | $ | 4,461 | ||||||||||
Foreclosed Assets
Foreclosed assets were carried on the consolidated balance sheets at $3,414,000 and $4,311,000 as of December 31, 2009 and 2008. Foreclosed assets are initially recorded at fair value, less estimated costs to sell, at the date of foreclosure. Loan losses resulting from foreclosure are charged against the allowance for loan losses at that time. Subsequent to foreclosure, valuations are periodically performed by management and the assets are carried at the lower of the new cost basis or fair value, less estimated costs to sell. For significant amounts, these valuations are typically outside annual appraisals.
Of the $3,414,000 balance at year-end 2009, approximately 60% is a single land development project in North Carolina, 22% are commercial real estate properties, 13% are undeveloped land properties and the remainder, less than 5%, are one to four family residential properties.
Deposits
The Company’s deposits consist primarily of checking, money market, savings, and consumer time deposits. Average deposits increased $24,999,000 or 4.3% in 2009 after decreasing $8,511,000 or 1.4% in 2008. Period-end deposits increased $15,135,000 or 2.6% from December 31, 2008 to December 31, 2009. The increase in period-end deposits is attributed primarily to growth in time deposits.
During 2009, demand deposits decreased $13,075,000 or 6.2%, while money market deposits increased $18,939,000 or 33.5%, savings deposits increased $2,249,000 or 3.8%, and certificates of deposit increased $7,022,000 or 2.7%,
|
Table 14 - Deposits
|
||||||||||||||||||||||||
|
(in thousands, except rates)
|
||||||||||||||||||||||||
|
December 31,
|
||||||||||||||||||||||||
|
2009
|
2008
|
2007
|
||||||||||||||||||||||
|
Average
|
Average
|
Average
|
||||||||||||||||||||||
|
Balance
|
Rate
|
Balance
|
Rate
|
Balance
|
Rate
|
|||||||||||||||||||
|
Demand deposits -
|
||||||||||||||||||||||||
|
noninterest bearing
|
$ | 99,686 | - | % | $ | 98,157 | - | % | $ | 102,003 | - | % | ||||||||||||
|
Demand deposit -
|
||||||||||||||||||||||||
|
interest bearing
|
98,576 | 0.29 | 109,492 | 0.73 | 107,834 | 1.44 | ||||||||||||||||||
|
Money market
|
72,918 | 0.72 | 53,659 | 1.88 | 52,843 | 2.70 | ||||||||||||||||||
|
Savings
|
62,219 | 0.24 | 61,620 | 0.54 | 66,246 | 1.28 | ||||||||||||||||||
|
Time
|
273,301 | 2.72 | 258,773 | 3.92 | 261,286 | 4.48 | ||||||||||||||||||
| $ | 606,700 | 1.38 | % | $ | 581,701 | 2.11 | % | $ | 590,212 | 2.63 | % | |||||||||||||
|
Table 15 - Certificates of Deposit of $100,000 or More
|
||||
|
(in thousands)
|
||||
|
Certificates of deposit at December 31, 2009 in amounts of $100,000 or more were classified by maturity as follows:
|
||||
|
3 months or less
|
$ |
22,071
|
||
|
Over 3 through 6 months
|
20,843
|
|||
|
Over 6 through 12 months
|
26,236
|
|||
|
Over 12 months
|
48,146
|
|||
| $ |
117,296
|
|||
Borrowed Funds
In addition to internal deposit generation, the Company also relies on borrowed funds as a supplemental source of funding. Borrowed funds consist of customer repurchase agreements, overnight borrowings from the Federal Home Loan Bank of Atlanta and longer-term FHLB advances, and trust preferred capital notes. Customer repurchase agreements are borrowings collateralized by securities of the U.S. Government or its agencies and mature daily. The Company considers these accounts to be stable sources of funds. The securities underlying these agreements remain under the Company’s control.
The following table presents information pertaining to the Company’s short-term borrowed funds.
|
Table 16 - Short-Term Borrowings
|
||||||||
|
(dollars in thousands)
|
||||||||
|
December 31,
|
||||||||
|
2009
|
2008
|
|||||||
|
Customer repurchase agreements
|
$ | 65,929 | $ | 51,741 | ||||
|
FHLB overnight borrowings
|
- | 7,850 | ||||||
|
Total
|
$ | 65,929 | $ | 59,591 | ||||
|
Weighted interest rate
|
0.69 | % | 1.75 | % | ||||
|
Average for the year ended:
|
||||||||
|
Outstanding
|
$ | 64,152 | $ | 62,082 | ||||
|
Interest rate
|
1.05 | % | 2.62 | % | ||||
|
Maximum month-end outstanding
|
$ | 75,339 | $ | 81,598 | ||||
In the regular course of conducting its business, the Company takes deposits from political subdivisions of the state of Virginia and North Carolina. At December 31, 2009, the Bank’s public deposits totaled $60,041,000. The Company is required to provide collateral to secure the deposits that exceed the insurance coverage provided by the FDIC. This collateral can be provided in the form of certain types of government or agency bonds or letters of credit from the FHLB. At year-end 2009, the Company had $40 million in letters of credit with the FHLB outstanding to provide collateral for such deposits.
Shareholders’ Equity
The Company’s goal with capital management is to be classified as “well capitalized” under regulatory capital ratios and to support growth, while generating acceptable returns on equity and paying a high rate of dividends.
Shareholders’ equity was $106,389,000 at December 31, 2009 and $102,300,000 at December 31, 2008. This increase was largely the result of net income and comprehensive income. These increases were partially offset by dividends and stock repurchases.
Shareholders’ equity was $102,300,000 at December 31, 2008 and $101,511,000 at December 31, 2007. This increase was largely the result of net income but was partially offset by dividends, stock repurchases and the effect of changes in unfunded pension liability.
The Company declared and paid quarterly dividends totaling $0.92, $0.92, and $0.91 per share of common stock in 2009, 2008, and 2007, respectively. Cash dividends in 2009 totaled $5,612,000 and represented an 82.4% payout of 2009 net income, compared to 69.9% in 2008 and 48.8% in 2007.
One measure of a financial institution’s capital level is the ratio of shareholders’ equity to assets. Shareholders’ equity was 13.15% of assets at December 31, 2009 and 12.96% at December 31, 2008. In addition, banking regulators have defined minimum regulatory capital ratios that the Company and its banking subsidiary are required to maintain. These ratios take into account risk factors identified by those regulatory authorities associated with the assets and off-balance sheet activities of financial institutions. The guidelines require percentages, or “risk weights,” be applied to those assets and off-balance sheet assets in relation to their perceived risk. Under the guidelines capital strength is measured in two tiers. Tier I capital consists primarily of shareholder’s equity and trust preferred capital notes, while Tier II capital consists of qualifying allowance for loan losses. “Total” capital is the sum of Tier I and Tier II capital. Another regulatory indicator of capital adequacy is the leverage ratio, which is computed by dividing Tier I capital by average quarterly assets less intangible assets.
The regulatory guidelines require that minimum total capital (Tier I plus Tier II) of 8% be held against total risk-adjusted assets, at least half of which must be Tier I capital. At December 31, 2009, the Company’s Tier I ratio was 17.56% and its total capital ratio was 18.82%. At December 31, 2008, these ratios were 16.67% and 17.92%, respectively. The ratios for both years exceeded the regulatory requirements. The Company’s leverage ratios were 12.81% and 13.04% at December 31, 2009 and 2008, respectively. The leverage ratio has a regulatory minimum of 4%, with most institutions required to maintain a ratio of 4-5%, depending upon risk profiles and other factors.
As mandated by bank regulations, the following five capital categories are identified for insured depository institutions: “well capitalized,” “adequately capitalized,” “undercapitalized,” “significantly undercapitalized,” and “critically undercapitalized.” These regulations require the federal banking regulators to take prompt corrective action with respect to insured depository institutions that do not meet minimum capital requirements. Under the regulations, well capitalized institutions must have Tier I risk-based capital ratios of at least 6%, total risk-based capital ratios of at least 10%, leverage ratios of at least 5%, and not be subject to capital directive orders. Management believes, as of December 31, 2009 and 2008, that the Company met the requirements to be considered “well capitalized.”
CONTRACTUAL OBLIGATIONS
The following items are contractual obligations of the Company as of December 31, 2009 (in thousands):
|
Payments Due By Period
|
||||||||||||||||||||
|
Total
|
Under 1 Year
|
1-3 Years
|
3-5 Years
|
More than
5 years
|
||||||||||||||||
|
Time deposits
|
$ | 268,086 | $ | 177,818 | $ | 62,222 | $ | 27,905 | $ | 141 | ||||||||||
|
FHLB borrowings
|
8,638 | - | 8,000 | - | 638 | |||||||||||||||
|
Repurchase agreements
|
65,929 | 65,289 | - | - | - | |||||||||||||||
|
Operating leases
|
587 | 267 | 246 | 74 | - | |||||||||||||||
|
Trust preferred capital notes
|
20,619 | - | - | - | 20,619 | |||||||||||||||
OFF-BALANCE SHEET ACTIVITIES
The Company enters into certain financial transactions in the ordinary course of performing traditional banking services that result in off-balance sheet transactions. Other than AMNB Statutory Trust I, formed in 2006 to issue Trust Preferred Securities, the Company does not have any off-balance sheet subsidiaries. Refer to Note 12 of the Consolidated Financial Statements for a discussion of AMNB Statutory Trust I. Off-balance sheet transactions were as follows (in thousands):
|
December 31,
|
||||||||
|
Off-Balance Sheet Transactions
|
2009
|
2008
|
||||||
|
Commitments to extend credit
|
$ | 133,692 | $ | 146,399 | ||||
|
Standby letters of credit
|
2,624 | 2,858 | ||||||
|
Mortgage loan rate-lock commitments
|
2,054 | 2,031 | ||||||
Commitments to extend credit to customers represent legally binding agreements with fixed expiration dates or other termination clauses. Since many of the commitments are expected to expire without being funded, the total commitment amounts do not necessarily represent future funding requirements. Standby letters of credit are conditional commitments issued by the Company guaranteeing the performance of a customer to a third party. Those guarantees are primarily issued to support public and private borrowing arrangements.
|
Table 17 - Quarterly Financial Results
|
||||||||||||||||
|
(in thousands, except per share amounts)
|
||||||||||||||||
|
Fourth
|
Third
|
Second
|
First
|
|||||||||||||
|
2009
|
Quarter
|
Quarter
|
Quarter
|
Quarter
|
||||||||||||
|
Interest income
|
$ | 9,257 | $ | 9,464 | $ | 9,690 | $ | 9,650 | ||||||||
|
Interest expense
|
2,307 | 2,464 | 2,781 | 3,237 | ||||||||||||
|
Net interest income
|
6,950 | 7,000 | 6,909 | 6,413 | ||||||||||||
|
Provision for loan losses
|
328 | 492 | 492 | 350 | ||||||||||||
|
Net interest income after provision
for loan losses
|
6,622 | 6,508 | 6,417 | 6,063 | ||||||||||||
|
Noninterest income
|
1,937 | 2,119 | 2,253 | 734 | ||||||||||||
|
Noninterest expense
|
5,524 | 5,598 | 6,321 | 5,875 | ||||||||||||
|
Income before income taxes
|
3,035 | 3,029 | 2,349 | 922 | ||||||||||||
|
Income taxes
|
866 | 862 | 643 | 154 | ||||||||||||
|
Net income
|
$ | 2,169 | $ | 2,167 | $ | 1,706 | $ | 768 | ||||||||
|
Per common share:
|
||||||||||||||||
|
Net income - basic
|
$ | 0.36 | $ | 0.36 | $ | 0.28 | $ | 0.13 | ||||||||
|
Net income - diluted
|
0.35 | 0.35 | 0.28 | 0.13 | ||||||||||||
|
Cash dividends
|
0.23 | 0.23 | 0.23 | 0.23 | ||||||||||||
|
Fourth
|
Third
|
Second
|
First
|
|||||||||||||
|
2008
|
Quarter
|
Quarter
|
Quarter
|
Quarter
|
||||||||||||
|
Interest income
|
$ | 10,225 | $ | 10,599 | $ | 10,788 | $ | 11,260 | ||||||||
|
Interest expense
|
3,503 | 3,743 | 4,058 | 4,535 | ||||||||||||
|
Net interest income
|
6,722 | 6,856 | 6,730 | 6,725 | ||||||||||||
|
Provision for loan losses
|
600 | 280 | 600 | 140 | ||||||||||||
|
Net interest income after provision
for loan losses
|
6,122 | 6,576 | 6,130 | 6,585 | ||||||||||||
|
Noninterest income
|
1,875 | 2,062 | 1,841 | 2,135 | ||||||||||||
|
Noninterest expense
|
5,547 | 5,485 | 5,643 | 5,449 | ||||||||||||
|
Income before income taxes
|
2,450 | 3,153 | 2,328 | 3,271 | ||||||||||||
|
Income taxes
|
767 | 929 | 519 | 966 | ||||||||||||
|
Net income
|
$ | 1,683 | $ | 2,224 | $ | 1,809 | $ | 2,305 | ||||||||
|
Per common share:
|
||||||||||||||||
|
Net income - basic
|
$ | 0.28 | $ | 0.36 | $ | 0.30 | $ | 0.38 | ||||||||
|
Net income - diluted
|
0.28 | 0.36 | 0.30 | 0.38 | ||||||||||||
|
Cash dividends
|
0.23 | 0.23 | 0.23 | 0.23 | ||||||||||||
Disclosure Controls and Procedures
The Company’s management, including the Chief Executive Officer and Chief Financial Officer, evaluated the Company’s disclosure controls and procedures (as defined in Rule 13a-15(e) under the Securities Exchange Act of 1934), as amended (the “Exchange Act”) as of December 31, 2009. Based on this evaluation, the Chief Executive Officer and Chief Financial Officer concluded that the Company’s disclosure controls and procedures are effective to ensure that the information required to be disclosed by the Company in the reports that it files or submits under the Exchange Act is recorded, processed, summarized, and reported within the time periods specified in SEC rules and forms. There were no significant changes in the Company’s internal controls over financial reporting that occurred during the quarter ended December 31, 2009 that have materially affected or are reasonably likely to materially affect the Company’s internal control over financial reporting.
Management of the Company is responsible for establishing and maintaining adequate internal control over financial reporting. Internal control is designed to provide reasonable assurance regarding the reliability of financial reporting and the preparation of financial statements for external purposes in accordance with accounting principles generally accepted in the United States of America. Management regularly monitors its internal control over financial reporting, and actions are taken to correct deficiencies as they are identified.
Under the supervision and with the participation of management, including the principal executive officer and principal financial officer, the Company conducted an evaluation of the effectiveness of internal control over financial reporting. This assessment was based on the framework in Internal Control – Integrated Framework issued by the Committee of Sponsoring Organizations of the Treadway Commission. Based on this evaluation under the framework in Internal Control – Integrated Framework, management concluded that the Company maintained effective internal control over financial reporting as of December 31, 2009, as such term is defined in Exchange Act Rules 13a-15(f).
Because of its inherent limitations, internal control over financial reporting may not prevent or detect misstatements. Further, because of changes in conditions, internal control effectiveness may vary over time.
The Company’s independent registered public accounting firm, Yount, Hyde and Barbour, P.C., has audited the Company’s internal control over financial reporting as of December 31, 2009, as stated in their report included herein. Yount, Hyde and Barbour, P.C. also audited the Company’s consolidated financial statements as of and for the year ended December 31, 2009.
/s/ Charles H. Majors
Charles H. Majors
President and Chief Executive Officer
/s/ William W. Traynham
William W. Traynham
Senior Vice President and
Chief Financial Officer
March 12, 2010
To the Board of Directors and Shareholders
American National Bankshares Inc. and Subsidiaries
Danville, Virginia
We have audited the accompanying consolidated balance sheets of American National Bankshares Inc. and Subsidiaries as of December 31, 2009 and 2008, and the related consolidated statements of income, changes in shareholders' equity, and cash flows for the years ended December 31, 2009, 2008 and 2007. These financial statements are the responsibility of the Company’s management. Our responsibility is to express an opinion on these financial statements based on our audits.
We conducted our audits in accordance with the standards of the Public Company Accounting Oversight Board (United States). Those standards require that we plan and perform the audit to obtain reasonable assurance about whether the financial statements are free of material misstatement. An audit includes examining, on a test basis, evidence supporting the amounts and disclosures in the financial statements. An audit also includes assessing the accounting principles used and significant estimates made by management, as well as evaluating the overall financial statement presentation. We believe that our audits provide a reasonable basis for our opinion.
In our opinion, the consolidated financial statements referred to above present fairly, in all material respects, the financial position of American National Bankshares Inc. and Subsidiaries as of December 31, 2009 and 2008, and the results of their operations and their cash flows for the years ended December 31, 2009, 2008 and 2007, in conformity with U.S. generally accepted accounting principles.
We have also audited, in accordance with the standards of the Public Company Accounting Oversight Board (United States), American National Bankshares Inc. and Subsidiaries’ internal control over financial reporting as of December 31, 2009, based on criteria established in Internal Control — Integrated Framework issued by the Committee of Sponsoring Organizations of the Treadway Commission, and our report dated March 11, 2010 expressed an unqualified opinion on the effectiveness of American National Bankshares Inc. and Subsidiaries’ internal control over financial reporting.

Winchester, Virginia
March 11, 2010
REPORT OF INDEPENDENT REGISTERED PUBLIC ACCOUNTING FIRM
To the Board of Directors and Shareholders
American National Bankshares Inc. and Subsidiaries
Danville, Virginia
We have audited American National Bankshares Inc. and Subsidiaries’ internal control over financial reporting as of December 31, 2009, based on criteria established in Internal Control — Integrated Framework issued by the Committee of Sponsoring Organizations of the Treadway Commission. American National Bankshares Inc. and Subsidiaries’ management is responsible for maintaining effective internal control over financial reporting and for its assessment of the effectiveness of internal control over financial reporting included in the accompanying Management’s Report on Internal Control over Financial Reporting. Our responsibility is to express an opinion on the Company’s internal control over financial reporting based on our audit.
We conducted our audit in accordance with the standards of the Public Company Accounting Oversight Board (United States). Those standards require that we plan and perform the audit to obtain reasonable assurance about whether effective internal control over financial reporting was maintained in all material respects. Our audit included obtaining an understanding of internal control over financial reporting, assessing the risk that a material weakness exists, and testing and evaluating the design and operating effectiveness of internal control based on the assessed risk. Our audit also included performing such other procedures as we considered necessary in the circumstances. We believe that our audit provides a reasonable basis for our opinion.
A company’s internal control over financial reporting is a process designed to provide reasonable assurance regarding the reliability of financial reporting and the preparation of financial statements for external purposes in accordance with generally accepted accounting principles. A company’s internal control over financial reporting includes those policies and procedures that (a) pertain to the maintenance of records that, in reasonable detail, accurately and fairly reflect the transactions and dispositions of the assets of the company; (b) provide reasonable assurance that transactions are recorded as necessary to permit preparation of financial statements in accordance with generally accepted accounting principles, and that receipts and expenditures of the company are being made only in accordance with authorizations of management and directors of the company; and (c) provide reasonable assurance regarding prevention or timely detection of unauthorized acquisition, use, or disposition of the company’s assets that could have a material effect on the financial statements.
Because of its inherent limitations, internal control over financial reporting may not prevent or detect misstatements. Also, projections of any evaluation of effectiveness to future periods are subject to the risk that controls may become inadequate because of changes in conditions, or that the degree of compliance with the policies or procedures may deteriorate.
In our opinion, American National Bankshares Inc. and Subsidiaries maintained, in all material respects, effective internal control over financial reporting as of December 31, 2009, based on criteria established in Internal Control — Integrated Framework issued by the Committee of Sponsoring Organizations of the Treadway Commission.
We have also audited, in accordance with the standards of the Public Company Accounting Oversight Board (United States), the consolidated balance sheets and the related consolidated statements of income, changes in shareholders’ equity and cash flows of American National Bankshares Inc. and Subsidiaries and our report dated March 11, 2010 expressed an unqualified opinion.
Winchester, Virginia
March 11, 2010
|
American National Bankshares Inc. and Subsidiaries
|
||||||||
|
Consolidated Balance Sheets
|
||||||||
|
December 31, 2009 and 2008
|
||||||||
|
(Dollars in thousands, except share and per share data)
|
||||||||
|
ASSETS
|
2009
|
2008
|
||||||
|
Cash and due from banks
|
$ | 13,250 | $ | 14,986 | ||||
|
Interest-bearing deposits in other banks
|
10,693 | 9,112 | ||||||
|
Securities available for sale, at fair value
|
188,795 | 129,796 | ||||||
|
Securities held to maturity (fair value of $6,763
|
||||||||
|
in 2009 and $7,391 in 2008)
|
6,529 | 7,121 | ||||||
|
Total securities
|
195,324 | 136,917 | ||||||
|
Restricted stock, at cost
|
4,362 | 3,899 | ||||||
|
Loans held for sale
|
2,490 | 1,764 | ||||||
|
Loans, net of unearned income
|
527,991 | 571,110 | ||||||
|
Less allowance for loan losses
|
(8,166 | ) | (7,824 | ) | ||||
|
Net loans
|
519,825 | 563,286 | ||||||
|
Premises and equipment, net
|
19,195 | 17,129 | ||||||
|
Other real estate owned, net of valuation allowance
|
||||||||
|
of $1,284 in 2009 and $70 in 2008
|
3,414 | 4,311 | ||||||
|
Goodwill
|
22,468 | 22,468 | ||||||
|
Core deposit intangibles, net
|
1,698 | 2,075 | ||||||
|
Accrued interest receivable and other assets
|
16,254 | 13,237 | ||||||
|
Total assets
|
$ | 808,973 | $ | 789,184 | ||||
|
LIABILITIES and SHAREHOLDERS' EQUITY
|
||||||||
|
Liabilities:
|
||||||||
|
Demand deposits -- noninterest bearing
|
$ | 101,735 | $ | 95,703 | ||||
|
Demand deposits -- interest bearing
|
97,025 | 116,132 | ||||||
|
Money market deposits
|
75,554 | 56,615 | ||||||
|
Savings deposits
|
61,873 | 59,624 | ||||||
|
Time deposits
|
268,086 | 261,064 | ||||||
|
Total deposits
|
604,273 | 589,138 | ||||||
|
Short-term borrowings:
|
||||||||
|
Customer repurchase agreements
|
65,929 | 51,741 | ||||||
|
Other short-term borrowings
|
- | 7,850 | ||||||
|
Long-term borrowings
|
8,638 | 13,787 | ||||||
|
Trust preferred capital notes
|
20,619 | 20,619 | ||||||
|
Accrued interest payable and other liabilities
|
3,125 | 3,749 | ||||||
|
Total liabilities
|
702,584 | 686,884 | ||||||
|
Shareholders' equity:
|
||||||||
|
Preferred stock, $5 par, 200,000 shares authorized,
|
||||||||
|
none outstanding
|
- | - | ||||||
|
Common stock, $1 par, 10,000,000 shares authorized,
|
||||||||
|
6,110,335 shares outstanding at December 31, 2009 and
|
||||||||
|
6,085,628 shares outstanding at December 31, 2008
|
6,110 | 6,086 | ||||||
|
Capital in excess of par value
|
26,962 | 26,491 | ||||||
|
Retained earnings
|
72,208 | 71,090 | ||||||
|
Accumulated other comprehensive income (loss), net
|
1,109 | (1,367 | ) | |||||
|
Total shareholders' equity
|
106,389 | 102,300 | ||||||
|
Total liabilities and shareholders' equity
|
$ | 808,973 | $ | 789,184 | ||||
|
The accompanying notes are an integral part of the consolidated financial statements.
|
||||||||
|
American National Bankshares Inc. and Subsidiaries
|
||||||||||||
|
Consolidated Statements of Income
|
||||||||||||
|
For the Years Ended December 31, 2009, 2008, and 2007
|
||||||||||||
|
(Dollars in thousands, except share and per share data)
|
||||||||||||
|
2009
|
2008
|
2007
|
||||||||||
|
Interest and Dividend Income:
|
||||||||||||
|
Interest and fees on loans
|
$ | 31,062 | $ | 35,941 | $ | 41,499 | ||||||
|
Interest and dividends on securities:
|
||||||||||||
|
Taxable
|
4,853 | 4,795 | 4,409 | |||||||||
|
Tax-exempt
|
1,673 | 1,621 | 1,690 | |||||||||
|
Dividends
|
95 | 214 | 320 | |||||||||
|
Other interest income
|
378 | 301 | 679 | |||||||||
|
Total interest and dividend income
|
38,061 | 42,872 | 48,597 | |||||||||
|
Interest Expense:
|
||||||||||||
|
Interest on deposits
|
8,399 | 12,280 | 15,535 | |||||||||
|
Interest on short-term borrowings
|
675 | 1,629 | 1,860 | |||||||||
|
Interest on long-term borrowings
|
342 | 557 | 602 | |||||||||
|
Interest on trust preferred capital notes
|
1,373 | 1,373 | 1,373 | |||||||||
|
Total interest expense
|
10,789 | 15,839 | 19,370 | |||||||||
|
Net Interest Income
|
27,272 | 27,033 | 29,227 | |||||||||
|
Provision for Loan Losses
|
1,662 | 1,620 | 403 | |||||||||
|
Net Interest Income after Provision for Loan Losses
|
25,610 | 25,413 | 28,824 | |||||||||
|
Noninterest Income:
|
||||||||||||
|
Trust fees
|
3,153 | 3,467 | 3,578 | |||||||||
|
Service charges on deposit accounts
|
2,085 | 2,324 | 2,531 | |||||||||
|
Other fees and commissions
|
1,014 | 857 | 786 | |||||||||
|
Mortgage banking income
|
1,605 | 788 | 954 | |||||||||
|
Brokerage fees
|
185 | 431 | 550 | |||||||||
|
Securities gains (losses), net
|
3 | (450 | ) | 135 | ||||||||
|
Impairment of securities
|
- | - | (362 | ) | ||||||||
|
Foreclosed real estate gains (losses), net
|
(1,475 | ) | (89 | ) | 6 | |||||||
|
Other
|
473 | 585 | 644 | |||||||||
|
Total noninterest income
|
7,043 | 7,913 | 8,822 | |||||||||
|
Noninterest Expense:
|
||||||||||||
|
Salaries
|
10,048 | 9,792 | 9,688 | |||||||||
|
Employee benefits
|
3,201 | 3,001 | 2,749 | |||||||||
|
Occupancy and equipment
|
2,927 | 2,788 | 2,982 | |||||||||
|
FDIC assessment
|
1,186 | 180 | 87 | |||||||||
|
Bank franchise tax
|
642 | 694 | 663 | |||||||||
|
Core deposit intangible amortization
|
377 | 377 | 377 | |||||||||
|
Other
|
4,937 | 5,292 | 4,780 | |||||||||
|
Total noninterest expense
|
23,318 | 22,124 | 21,326 | |||||||||
|
Income Before Income Taxes
|
9,335 | 11,202 | 16,320 | |||||||||
|
Income Taxes
|
2,525 | 3,181 | 4,876 | |||||||||
|
Net Income
|
$ | 6,810 | $ | 8,021 | $ | 11,444 | ||||||
|
Net Income Per Common Share:
|
||||||||||||
|
Basic
|
$ | 1.12 | $ | 1.32 | $ | 1.86 | ||||||
|
Diluted
|
$ | 1.12 | $ | 1.31 | $ | 1.86 | ||||||
|
Average Common Shares Outstanding:
|
||||||||||||
|
Basic
|
6,097,810 | 6,096,649 | 6,139,095 | |||||||||
|
Diluted
|
6,102,895 | 6,105,154 | 6,161,825 | |||||||||
|
The accompanying notes are an integral part of the consolidated financial statements.
|
||||||||||||
41
|
American National Bankshares Inc. and Subsidiaries
|
||||||||||||||||||||||||
|
Consolidated Statements of Changes in Shareholders' Equity
|
||||||||||||||||||||||||
|
For the Years Ended December 31, 2009, 2008, and 2007
|
||||||||||||||||||||||||
|
(Dollars in thousands)
|
||||||||||||||||||||||||
|
Accumulated
|
||||||||||||||||||||||||
|
Common Stock
|
Capital in
|
Other
|
Total
|
|||||||||||||||||||||
|
Excess of
|
Retained
|
Comprehensive
|
Shareholders'
|
|||||||||||||||||||||
|
Shares
|
Amount
|
Par Value
|
Earnings
|
Income (Loss)
|
Equity
|
|||||||||||||||||||
|
Balance, December 31, 2006
|
6,161,865 | $ | 6,162 | $ | 26,414 | $ | 64,584 | $ | (2,168 | ) | $ | 94,992 | ||||||||||||
|
Net income
|
- | - | - | 11,444 | - | 11,444 | ||||||||||||||||||
|
Change in unrealized gains on securities
|
||||||||||||||||||||||||
|
available for sale, net of tax, $874
|
- | - | - | - | 1,622 | |||||||||||||||||||
|
Add: Reclassification adjustment for losses
|
||||||||||||||||||||||||
|
on impairment of securities, net of tax, $127
|
- | - | - | - | 235 | |||||||||||||||||||
|
Less: Reclassification adjustment for gains
|
||||||||||||||||||||||||
|
on securities available for sale, net of
|
||||||||||||||||||||||||
|
tax, $(47)
|
- | - | - | - | (88 | ) | ||||||||||||||||||
|
Change in unfunded pension liability,
|
||||||||||||||||||||||||
|
net of tax, $(23)
|
- | - | - | - | (43 | ) | ||||||||||||||||||
|
Other comprehensive income
|
1,726 | 1,726 | ||||||||||||||||||||||
|
Total comprehensive income
|
13,170 | |||||||||||||||||||||||
|
Stock repurchased and retired
|
(61,900 | ) | (62 | ) | (265 | ) | (1,032 | ) | - | (1,359 | ) | |||||||||||||
|
Stock options exercised
|
18,752 | 19 | 276 | - | - | 295 | ||||||||||||||||||
|
Cash dividends declared, $0.91 per share
|
- | - | - | (5,587 | ) | - | (5,587 | ) | ||||||||||||||||
|
Balance, December 31, 2007
|
6,118,717 | 6,119 | 26,425 | 69,409 | (442 | ) | 101,511 | |||||||||||||||||
|
Net income
|
- | - | - | 8,021 | - | 8,021 | ||||||||||||||||||
|
Change in unrealized gains on securities
|
||||||||||||||||||||||||
|
available for sale, net of tax, $359
|
- | - | - | - | 665 | |||||||||||||||||||
|
Add: Reclassification adjustment for losses
|
||||||||||||||||||||||||
|
on securities available for sale, net of
|
||||||||||||||||||||||||
|
tax, $157
|
- | - | - | - | 293 | |||||||||||||||||||
|
Change in unfunded pension liability,
|
||||||||||||||||||||||||
|
net of tax, $(1,015)
|
- | - | - | - | (1,883 | ) | ||||||||||||||||||
|
Other comprehensive loss
|
(925 | ) | (925 | ) | ||||||||||||||||||||
|
Total comprehensive income
|
7,096 | |||||||||||||||||||||||
|
Change in pension plan measurement date,
|
||||||||||||||||||||||||
|
net of tax, $(40)
|
- | - | - | (75 | ) | - | (75 | ) | ||||||||||||||||
|
Stock repurchased and retired
|
(46,150 | ) | (46 | ) | (199 | ) | (659 | ) | - | (904 | ) | |||||||||||||
|
Stock options exercised
|
13,061 | 13 | 206 | - | - | 219 | ||||||||||||||||||
|
Stock compensation expense
|
- | - | 59 | - | - | 59 | ||||||||||||||||||
|
Cash dividends declared, $0.92 per share
|
- | - | - | (5,606 | ) | - | (5,606 | ) | ||||||||||||||||
|
Balance, December 31, 2008
|
6,085,628 | 6,086 | 26,491 | 71,090 | (1,367 | ) | 102,300 | |||||||||||||||||
|
Net income
|
- | - | - | 6,810 | - | 6,810 | ||||||||||||||||||
|
Change in unrealized gains on securities
|
||||||||||||||||||||||||
|
available for sale, net of tax, $366
|
- | - | - | - | 676 | |||||||||||||||||||
|
Add: Reclassification adjustment for gains
|
||||||||||||||||||||||||
|
on securities available for sale, net of
|
||||||||||||||||||||||||
|
tax, $(1)
|
- | - | - | - | (2 | ) | ||||||||||||||||||
|
Change in unfunded pension liability,
|
||||||||||||||||||||||||
|
net of tax, $968
|
- | - | - | - | 1,802 | |||||||||||||||||||
|
Other comprehensive loss
|
2,476 | 2,476 | ||||||||||||||||||||||
|
Total comprehensive income
|
9,286 | |||||||||||||||||||||||
|
Stock repurchased and retired
|
(7,600 | ) | (8 | ) | (33 | ) | (80 | ) | - | (121 | ) | |||||||||||||
|
Stock options exercised
|
32,307 | 32 | 442 | - | - | 474 | ||||||||||||||||||
|
Stock compensation expense
|
- | - | 62 | - | - | 62 | ||||||||||||||||||
|
Cash dividends declared, $0.92 per share
|
- | - | - | (5,612 | ) | - | (5,612 | ) | ||||||||||||||||
|
Balance, December 31, 2009
|
6,110,335 | $ | 6,110 | $ | 26,962 | $ | 72,208 | $ | 1,109 | $ | 106,389 | |||||||||||||
|
The accompanying notes are an integral part of the consolidated financial statements.
|
||||||||||||||||||||||||
|
American National Bankshares Inc. and Subsidiaries
|
||||||||||||
|
Consolidated Statements of Cash Flows
|
||||||||||||
|
For the Years Ended December 31, 2009, 2008, and 2007
|
||||||||||||
|
(Dollars in thousands)
|
||||||||||||
|
2009
|
2008
|
2007
|
||||||||||
|
Cash Flows from Operating Activities:
|
||||||||||||
|
Net income
|
$ | 6,810 | $ | 8,021 | $ | 11,444 | ||||||
|
Adjustments to reconcile net income to net
|
||||||||||||
|
cash provided by operating activities:
|
||||||||||||
|
Provision for loan losses
|
1,662 | 1,620 | 403 | |||||||||
|
Depreciation
|
1,201 | 1,086 | 1,178 | |||||||||
|
Core deposit intangible amortization
|
377 | 377 | 377 | |||||||||
|
Net amortization (accretion) of bond premiums and discounts
|
(193 | ) | (253 | ) | (188 | ) | ||||||
|
Net loss (gain) on sale or call of securities
|
(3 | ) | 450 | (135 | ) | |||||||
|
Impairment of securities
|
- | - | 362 | |||||||||
|
Gain on sale of loans held for sale
|
(1,426 | ) | (669 | ) | (733 | ) | ||||||
|
Proceeds from sales of loans held for sale
|
69,802 | 29,642 | 31,451 | |||||||||
|
Originations of loans held for sale
|
(69,102 | ) | (29,369 | ) | (30,424 | ) | ||||||
|
Net loss (gain) on sale of foreclosed real estate
|
168 | 19 | (6 | ) | ||||||||
|
Net change in valuation allowance on foreclosed real estate
|
1,307 | 70 | - | |||||||||
|
Net (gain) loss on sale of premises and equipment
|
(30 | ) | 7 | (8 | ) | |||||||
|
Stock-based compensation expense
|
62 | 59 | - | |||||||||
|
Deferred income tax (benefit) expense
|
132 | 691 | (67 | ) | ||||||||
|
Net change in interest receivable
|
(147 | ) | 398 | 316 | ||||||||
|
Net change in other assets
|
(2,444 | ) | (3,580 | ) | 699 | |||||||
|
Net change in interest payable
|
(356 | ) | (373 | ) | 39 | |||||||
|
Net change in other liabilities
|
610 | (862 | ) | (257 | ) | |||||||
|
Net cash provided by operating activities
|
8,430 | 7,334 | 14,451 | |||||||||
|
Cash Flows from Investing Activities:
|
||||||||||||
|
Proceeds from sales of securities available for sale
|
- | 1,098 | 1,070 | |||||||||
|
Proceeds from maturities and calls of securities available for sale
|
89,337 | 40,255 | 54,965 | |||||||||
|
Proceeds from maturities and calls of securities held to maturity
|
596 | 4,893 | 1,884 | |||||||||
|
Purchases of securities available for sale
|
(147,567 | ) | (28,636 | ) | (49,763 | ) | ||||||
|
Net decrease (increase) in loans
|
40,107 | (24,970 | ) | (9,933 | ) | |||||||
|
Proceeds from sale of premises and equipment
|
125 | - | 25 | |||||||||
|
Purchases of premises and equipment
|
(3,362 | ) | (5,448 | ) | (2,105 | ) | ||||||
|
Proceeds from sales of other real estate owned
|
1,354 | 318 | 30 | |||||||||
|
Increase in other real estate owned
|
(240 | ) | (26 | ) | (59 | ) | ||||||
|
Net cash used in investing activities
|
(19,650 | ) | (12,516 | ) | (3,886 | ) | ||||||
|
Cash Flows from Financing Activities:
|
||||||||||||
|
Net change in demand, money market,
|
||||||||||||
|
and savings deposits
|
8,113 | 11,438 | (17,884 | ) | ||||||||
|
Net change in time deposits
|
7,022 | (3,521 | ) | (9,423 | ) | |||||||
|
Net change in customer repurchase agreements
|
14,188 | 3,850 | 14,523 | |||||||||
|
Net change in other short-term borrowings
|
(7,850 | ) | 650 | 7,200 | ||||||||
|
Net change in long-term borrowings
|
(5,149 | ) | 4,850 | (6,150 | ) | |||||||
|
Cash dividends paid
|
(5,612 | ) | (5,606 | ) | (5,587 | ) | ||||||
|
Repurchase of stock
|
(121 | ) | (904 | ) | (1,359 | ) | ||||||
|
Proceeds from exercise of stock options
|
474 | 219 | 295 | |||||||||
|
Net cash provided by (used in) financing activities
|
11,065 | 10,976 | (18,385 | ) | ||||||||
|
Net (Decrease) Increase in Cash and Cash Equivalents
|
(155 | ) | 5,794 | (7,820 | ) | |||||||
|
Cash and Cash Equivalents at Beginning of Period
|
24,098 | 18,304 | 26,124 | |||||||||
|
Cash and Cash Equivalents at End of Period
|
$ | 23,943 | $ | 24,098 | $ | 18,304 | ||||||
|
The accompanying notes are an integral part of the consolidated financial statements.
|
||||||||||||
American National Bankshares Inc. and Subsidiaries
December 31, 2009, 2008, and 2007
Note 1 – Summary of Significant Accounting Policies
Nature of Operations and Consolidation
The consolidated financial statements include the accounts of American National Bankshares Inc. and its wholly owned subsidiary, American National Bank and Trust Company (collectively referred to as the “Company”). American National Bank and Trust Company (the “Bank”) offers a wide variety of retail, commercial, secondary market mortgage lending, and trust and investment services, which also include non-deposit products such as mutual funds and insurance policies.
The preparation of consolidated financial statements in conformity with accounting principles generally accepted in the United States of America requires management to make estimates and assumptions that affect the reported amounts of assets and liabilities and disclosure of contingent assets and liabilities at the date of the financial statements and the reported amounts of revenues and expenses during the reporting period. Actual results could differ from those estimates. Material estimates that are particularly susceptible to significant change in the near term relate to the determination of the allowance for loan losses, valuation of foreclosed real estate, deferred taxes, other than temporary impairment of investments, and fair value estimates.
In April 2006, AMNB Statutory Trust I, a Delaware statutory trust (the “Trust”) and a wholly owned subsidiary of the Company was formed for the purpose of issuing preferred securities (the “Trust Preferred Securities”) in a private placement pursuant to an applicable exemption from registration. Proceeds from the securities were used to fund the acquisition of Community First Financial Corporation that occurred in April 2006. Refer to Note 12 for further details concerning this variable interest entity.
All significant inter-company transactions and accounts are eliminated in consolidation, with the exception of the Trust, as detailed in Note 12.
Cash and Cash Equivalents
Cash includes cash on hand and cash with correspondent banks. Cash equivalents are short-term, highly liquid investments that are readily convertible to cash with original maturities of three months or less and are subject to an insignificant risk of change in value. Cash and cash equivalents are carried at cost.
Securities
Certain debt securities that management has the positive intent and ability to hold to maturity are classified as “held to maturity” and recorded at amortized cost. Trading securities are recorded at fair value with changes in fair value included in earnings, though the Company has not and currently does not maintain a trading portfolio. Securities not classified as held to maturity or trading, including equity securities with readily determinable fair values, are classified as “available for sale” and recorded at fair value, with unrealized gains and losses excluded from earnings and reported in other comprehensive income. Purchase premiums and discounts are recognized in interest income using the interest method over the terms of the securities. Gains and losses on the sale of securities are recorded on the trade date and are determined using the specific identification method.
Prior to the adoption of the recent accounting guidance on April 1, 2009, management considered, in determining whether other-than-temporary impairment existed, (1) the length of time and the extent to which the fair value had been less than cost, (2) the financial condition and near-term prospects of the issuer, and (3) the intent and ability of the Company to retain its investment in the issuer for a period of time sufficient to allow for any anticipated recovery in fair value.
Effective April 1, 2009, the Company adopted new accounting guidance related to recognition and presentation of other-than-temporary impairment. This recent accounting guidance amends the recognition guidance for other-than-temporary impairments of debt securities and expands the financial statement disclosures for other-than-temporary impairment losses on debt and equity securities. The recent guidance replaced the “intent and ability” indication in prior guidance by specifying that (1) if a company does not have the intent to sell a debt security prior to recovery and (2) it is more likely than not that it will not have to sell the debt security prior to recovery, the security would not be considered other-than-temporarily impaired unless there is a credit loss. When an entity does not intend to sell the security and it is more likely than not, the entity will not have to sell the security before recovery of its cost basis, it will recognize the credit component of an other-than-temporary impairment of a debt security in earnings and the remaining portion in other comprehensive income. For held-to-maturity debt securities, the amount of an other-than-temporary impairment recorded in other comprehensive income for the noncredit portion of a previous other-than-temporary impairment should be amortized prospectively over the remaining life of the security on the basis of the timing of future estimated cash flows of the security.
For equity securities, when the Company has decided to sell an impaired available-for-sale security and the entity does not expect the fair value of the security to fully recover before the expected time of sale, the security is deemed other-than-temporarily impaired in the period in which the decision to sell is made. The Company recognizes an impairment loss when the impairment is deemed other than temporary even if a decision to sell has not been made.
Due to the nature and restrictions placed on the Company’s investment in common stock of the Federal Home Loan Bank of Atlanta (“FHLB”) and the Federal Reserve Bank of Richmond, these securities have been classified as restricted equity securities and carried at cost.
Loans Held for Sale
Secondary market mortgage loans are designated as held for sale at the time of their origination. These loans are pre-sold with servicing released and the Company does not retain any interest after the loans are sold. These loans consist primarily of fixed-rate, single-family residential mortgage loans which meet the underwriting characteristics of certain government-sponsored enterprises (conforming loans). In addition, the Company requires a firm purchase commitment from a permanent investor before a loan can be committed, thus limiting interest rate risk. Loans held for sale are carried at the lower of cost or fair value. Gains on sales of loans are recognized at the loan closing date and are included in noninterest income.
Derivative Loan Commitments
The Company enters into mortgage loan commitments whereby the interest rate on the loan is determined prior to funding (rate lock commitments). Mortgage loan commitments are referred to as derivative loan commitments if the loan that will result from exercise of the commitment will be held for sale upon funding. Loan commitments that are derivatives are recognized at fair value on the consolidated balance sheets with net changes in their fair values recorded in other expenses. Derivative loan commitments resulted in $3,000 in expense for 2009, $9,000 in income for 2008, and $21,000 in expense for 2007.
The period of time between issuance of a loan commitment and sale of the loan generally ranges from 30 to 60 days. The Company protects itself from changes in interest rates through the use of best efforts forward delivery contracts, by committing to sell a loan at the time the borrower commits to an interest rate with the intent that the buyer has assumed the interest rate risk on the loan. As a result, the Company is not generally exposed to significant losses nor will it realize significant gains related to its rate lock commitments due to changes in interest rates. The correlation between the rate lock commitments and the best efforts contracts is very high due to their similarity.
The market value of rate lock commitments and best efforts contracts is not readily ascertainable with precision because rate lock commitments and best efforts contracts are not actively traded in stand-alone markets. The Company determines the fair value of rate lock commitments and best efforts contracts by measuring the change in the estimated value of the underlying assets while taking into consideration the probability that the loan will be funded.
Loans
The Company makes mortgage, commercial, and consumer loans. A substantial portion of the loan portfolio is secured by real estate. The ability of the Company’s debtors to honor their contracts is dependent upon the real estate and general economic conditions in the Company’s market area.
Loans that management has the intent and ability to hold for the foreseeable future or until maturity or pay-off generally are reported at their outstanding unpaid principal balance adjusted for the allowance for loan losses, and any deferred fees or costs. Interest income is accrued on the unpaid principal balance. Loan origination fees, net of certain direct origination costs, are deferred and recognized as an adjustment of the related loan yield using the interest method.
The accrual of interest on loans is generally discontinued at the time the loan is 90 days delinquent unless the credit is well-secured and in process of collection. Loans are typically charged off when the loan is 120 days past due, unless secured and in process of collection. Loans are placed on nonaccrual status or charged-off at an earlier date if collection of principal or interest is considered doubtful.
Interest accrued but not collected for loans that are placed on nonaccrual status or charged-off is reversed against interest income. The interest on these loans is accounted for on the cash basis or cost recovery method, until qualifying for return to accrual status. Loans are returned to accrual status when all the principal and interest amounts contractually due are brought current and future payments are reasonably assured.
Substandard and doubtful risk graded commercial, commercial real estate, and construction loans equal to or greater than $100,000 on an unsecured basis, and equal to or greater than $250,000 on a secured basis are reviewed for impairment. A loan is considered impaired when, based on current information and events, it is probable that the Company will be unable to collect the scheduled payments of principal or interest when due according to the contractual terms of the loan agreement. Factors considered by management in determining impairment and establishing a specific allowance include payment status, collateral value, and the probability of collecting scheduled principal and interest payments when due. Loans that experience insignificant payment delays and payment shortfalls generally are not classified as impaired. Management determines the significance of payment delays and payment shortfalls on a case-by-case basis, taking into consideration all of the circumstances surrounding the loan and the borrower, including the length of the delay, the reasons for the delay, the borrower’s prior payment record, and the amount of the shortfall in relation to the principal and interest owed. Impairment is measured on a loan-by-loan basis for commercial, commercial real estate, and construction loans by either the present value of expected future cash flows discounted at the loan’s effective interest rate, the loan’s obtainable market price, or the fair value of the collateral if the loan is collateral dependent.
Generally, large groups of smaller balance homogeneous loans are collectively evaluated for impairment. The Company’s policy for recognizing interest income on impaired loans is consistent with its nonaccrual policy.
Accounting for Certain Loans or Debt Securities Acquired in a Transfer
The Financial Accounting Standards Board (“FASB”) Accounting Standards Codification (“ASC”) requires acquired loans to be recorded at fair value and prohibits carrying over valuation allowances in the initial accounting for acquired impaired loans. Loans carried at fair value, mortgage loans held for sale, and loans to borrowers in good standing under revolving credit agreements are excluded from the accounting guidance. The yield that may be accreted is limited to the excess of the undiscounted expected cash flows over the investor’s initial investment in the loan. The excess of the contractual cash flows over expected cash flows may not be recognized as an adjustment of yield. Subsequent increases in cash flows expected to be collected are recognized prospectively through an adjustment of the loan’s yield over its remaining life. Decreases in expected cash flows are recognized as impairments. Refer to Note 5 for required disclosures.
Allowance for Loan Losses
The allowance for loan losses is management’s estimate of probable credit losses that are inherent in the loan portfolio at the balance sheet date. Increases to the allowance are made by charges to the provision for loan losses, which is reflected in the Consolidated Statements of Income. Loan balances deemed to be uncollectible are charged-off against the allowance. Recoveries of previously charged-off amounts are credited to the allowance.
The allowance for loan losses is evaluated on a regular basis by management and is based upon management’s periodic review of the loan portfolio in light of historical charge-off experience, the nature and volume of the loan portfolio, and adverse situations that may affect the borrower’s ability to repay, estimated value of any underlying collateral, and prevailing economic conditions. The allowance for loan losses has two basic components: the formula allowance and the specific allowance. Each of these components is determined based upon estimates that can and do change when the actual events occur. The formula allowance uses a historical loss view as an indicator of future losses along with various economic factors and, as a result, could differ from the loss incurred in the future. Allowance calculations for consumer loans are calculated on a product basis rather than by risk grade. The specific allowance uses various techniques to arrive at an estimate of loss for specifically identified impaired loans. This evaluation is inherently subjective, as it requires estimates that are susceptible to significant revision as more information becomes available. Actual losses could be greater or less than the estimates.
Premises and Equipment
Land is carried at cost. Premises and equipment are stated at cost, less accumulated depreciation and amortization. Premises and equipment are depreciated over their estimated useful lives ranging from three years to thirty-nine years; leasehold improvements are amortized over the lives of the respective leases or the estimated useful lives of the improvements, whichever is less. Software is generally amortized over three years. Depreciation and amortization are recorded on the straight-line method.
Costs of maintenance and repairs are charged to expense as incurred. Costs of replacing structural parts of major units are considered individually and are expensed or capitalized as the facts dictate. Gains and losses on routine dispositions are reflected in current operations.
Goodwill and Intangible Assets
In accordance with current accounting guidance, goodwill is no longer subject to amortization over its estimated useful life, but is subject to at least an annual assessment for impairment by applying a fair value based test. Additionally, acquired intangible assets (such as core deposit intangibles) are separately recognized if the benefit of the assets can be sold, transferred, licensed, rented, or exchanged, and amortized over their useful lives. Intangible assets related to branch transactions continued to amortize. The cost of purchased deposit relationships and other intangible assets, based on independent valuation, are being amortized over their estimated lives ranging from 8.25 years to 10 years.
Trust Assets
Securities and other property held by the trust and investment services segment in a fiduciary or agency capacity are not assets of the Company and are not included in the accompanying consolidated financial statements.
Foreclosed Real Estate
Foreclosed real estate represents real estate that has been acquired through loan foreclosures or deeds received in lieu of loan payments. Generally, such properties are appraised at the time acquired, and are recorded at the lower of cost or fair value less estimated selling costs. Subsequent to foreclosure, valuations are periodically performed by management and the assets are carried at the lower of carrying amount or fair value less cost to sell. Revenue and expenses from operations and changes in the valuation allowance are included in net expenses from foreclosed assets.
Income Taxes
The Company uses the balance sheet method to account for deferred income tax assets and liabilities. Under this method, the net deferred tax asset or liability is determined based on the tax effects of the temporary differences between the book and tax bases of the various balance sheet assets and liabilities and gives current recognition to changes in tax rates and laws.
When tax returns are filed, it is highly certain that some positions taken would be sustained upon examination by the taxing authorities, while others are subject to uncertainty about the merits of the position taken or the amount of the position that would be ultimately sustained. The benefit of a tax position is recognized in the financial statements in the period during which, based on all available evidence, management believes it is more likely than not that the position will be sustained upon examination, including the resolution of appeals or litigation processes, if any. Tax positions taken are not offset or aggregated with other positions. Tax positions that meet the more-likely-than-not recognition threshold are measured as the largest amount of tax benefit that is more than 50 percent likely of being realized upon settlement with the applicable taxing authority. The portion of the benefits associated with tax positions taken that exceeds the amount measured as described above is reflected as a liability for unrecognized tax benefits in the accompanying balance sheet along with any associated interest and penalties that would be payable to the taxing authorities upon examination.
Stock-Based Compensation
The accounting guidance requires companies to recognize compensation expense related to stock-based compensation awards, such as stock options and restricted stock, in their income statements over the period during which an employee is required to provide service in exchange for such award.
Earnings Per Share
Basic earnings per share represent income available to common shareholders divided by the weighted-average number of common shares outstanding during the period. Diluted earnings per share reflect the impact of additional common shares that would have been outstanding if dilutive potential common shares had been issued, as well as any adjustment to income that would result from the assumed issuance. Potential common shares that may be issued by the Company consist solely of outstanding stock options, and are determined using the treasury method.
Comprehensive Income
Accounting principles generally require that recognized revenue, expenses, gains, and losses be included in net income, although certain changes in assets and liabilities, such as unrealized gains and losses on available for sale securities and changes in the funded status of a defined benefit postretirement plan, are reported as a separate component of the equity section of the balance sheet. Such items, along with net income, are components of comprehensive income. The components of accumulated other comprehensive income (loss), net of tax, included in the equity section of the balance sheets are as follows (in thousands):
|
December 31,
|
||||||||
|
2009
|
2008
|
|||||||
|
Unrealized gains on securities available for sale
|
$ | 2,700 | $ | 2,024 | ||||
|
Unfunded pension liability
|
(1,591 | ) | (3,391 | ) | ||||
|
Total accumulated other comprehensive income (loss)
|
$ | 1,109 | $ | (1,367 | ) | |||
Advertising and Marketing Costs
Advertising and marketing costs are expensed as incurred, and were $139,000, $203,000, and $300,000 in 2009, 2008, and 2007, respectively.
Reclassifications
Certain reclassifications have been made in prior years financial statements to conform to classifications used in the current year.
Recent Accounting Pronouncements
Effective July 1, 2009, the Company adopted new accounting guidance related to U.S. Generally Accepted Accounting Principles (“GAAP”) (FASB ASC 105). This guidance establishes Financial Accounting Standards Board (“FASB”) Accounting Standards Codification (“ASC”) as the source of authoritative U.S GAAP recognized by FASB to be applied by nongovernmental entities. Rules and interpretive releases of the SEC under authority of federal securities laws are also sources of authoritative U.S. GAAP for SEC registrants. FASB ASC supersedes all existing non-SEC accounting and reporting standards. All other nongrandfathered, non-SEC accounting literature not included in FASB ASC has become nonauthoritative. FASB will no longer issue new standards in the form of Statements, FASB Staff Positions or Emerging Issues Task Force Abstracts. Instead, it will issue Accounting Standards Updates (ASUs), which will serve to update FASB ASC, provide background information about the guidance and provide the basis for conclusions on the changes to FASB ASC. FASB ASC is not intended to change U.S. GAAP or any requirements of the SEC. This guidance is effective for the Company as of December 31, 2009.
The Company adopted new guidance impacting FASB Topic 805: Business Combinations (Topic 805) on January 1, 2009. This guidance requires the acquiring entity in a business combination to recognize the full fair value of assets acquired and liabilities assumed in the transaction (whether a full or partial acquisition); establishes the acquisition-date fair value as the measurement objective for all assets acquired and liabilities assumed; requires expensing of most transaction and restructuring costs; and requires the acquirer to disclose to investors and other users all of the information needed to evaluate and understand the nature and financial effect of the business combination. The adoption of the new guidance did not have a material impact on the Company’s consolidated financial statements.
In April 2009, the FASB issued new guidance impacting FASB Topic 805. This guidance addresses application issues raised by preparers, auditors, and members of the legal profession on initial recognition and measurement, subsequent measurement and accounting, and disclosure of assets and liabilities arising from contingencies in a business combination. This guidance was effective for business combinations entered into on or after January 1, 2009. This guidance did not have a material impact on the Company’s consolidated financial statements.
In December 2008, the FASB issued new guidance impacting FASB Topic 715-20: Compensation Retirement Benefits – Defined Benefit Plans – General. The objectives of this guidance are to provide users of the financial statements with more detailed information related to the major categories of plan assets, the inputs and valuation techniques used to measure the fair value of plan assets and the effect of fair value measurements using significant unobservable inputs (Level 3) on changes in plan assets for the period, as well as how investment allocation decisions are made, including the factors that are pertinent to an understanding of investment policies and strategies. The disclosures about plan assets required by this guidance are included in Note 18 of the Company’s consolidated financial statements.
In April 2009, the FASB issued new guidance impacting FASB Topic 820: Fair Value Measurements and Disclosures (Topic 820). This interpretation provides additional guidance for estimating fair value when the volume and level of activity for the asset or liability have significantly decreased. This also includes guidance on identifying circumstances that indicate a transaction is not orderly and requires additional disclosures of valuation inputs and techniques in interim periods and defines the major security types that are required to be disclosed. This guidance was effective for interim and annual periods ending after June 15, 2009, and should be applied prospectively. The adoption of the standard did not have a material impact on the Company’s consolidated financial statements.
In April 2009, the FASB issued new guidance impacting FASB Topic 320-10: Investments – Debt and Equity Securities. This guidance amends GAAP for debt securities to make the guidance more operational and to improve the presentation and disclosure of other-than-temporary impairments on debt and equity securities in the financial statements. This guidance was effective for interim and annual periods ending after June 15, 2009, with earlier adoption permitted for periods ending after March 15, 2009. The Company did not have any cumulative effect adjustment related to the adoption of this guidance.
In May 2009, the FASB issued new guidance impacting FASB Topic 855: Subsequent Events. This update provides guidance on management’s assessment of subsequent events that occur after the balance sheet date through the date that the financial statements are issued. This guidance is generally consistent with current accounting practice. In addition, it requires certain additional disclosures. This guidance was effective for periods ending after June 15, 2009 and had no impact on the Company’s consolidated financial statements.
In August 2009, the FASB issued new guidance impacting FASB Topic 820. This guidance is intended to reduce ambiguity in financial reporting when measuring the fair value of liabilities. This guidance was effective for the first reporting period (including interim periods) after issuance and had no impact on the Company’s consolidated financial statements.
In September 2009, the FASB issued new guidance impacting Topic 820. This creates a practical expedient to measure the fair value of an alternative investment that does not have a readily determinable fair value. This guidance also requires certain additional disclosures. This guidance is effective for interim and annual periods ending after December 15, 2009. The adoption of the new guidance did not have a material impact on its consolidated financial statements.
Accounting Standards Not Yet Effective
In June 2009, the FASB issued new guidance relating to the accounting for transfers of financial assets. The new guidance, which was issued as Statement of Financial Accounting Standards (“SFAS”) No. 166, Accounting for Transfers of Financial Assets, an amendment to SFAS No. 140, was adopted into Codification in December 2009 through the issuance of Accounting Standards Update (“ASU”) 2009-16. The new standard provides guidance to improve the relevance, representational faithfulness, and comparability of the information that an entity provides in its financial statements about a transfer of financial assets; the effects of a transfer on its financial position, financial performance, and cash flows; and a transferor’s continuing involvement, if any, in transferred financial assets. The Company will adopt the new guidance in 2010 and is evaluating the impact it will have, if any, on its consolidated financial statements.
In June 2009, the FASB issued new guidance relating to the variable interest entities. The new guidance, which was issued as SFAS No. 167, Amendments to FASB Interpretation No. 46(R), was adopted into Codification in December 2009. The objective of the guidance is to improve financial reporting by enterprises involved with variable interest entities and to provide more relevant and reliable information to users of financial statements. SFAS No. 167 is effective as of January 1, 2010. The Company does not expect the adoption of the new guidance to have a material impact on its consolidated financial statements.
In October 2009, the FASB issued ASU 2009-15, Accounting for Own-Share Lending Arrangements in Contemplation of Convertible Debt Issuance or Other Financing. ASU 2009-15 amends Subtopic 470-20 to expand accounting and reporting guidance for own-share lending arrangements issued in contemplation of convertible debt issuance. ASU 2009-15 is effective for fiscal years beginning on or after December 15, 2009 and interim periods within those fiscal years for arrangements outstanding as of the beginning of those fiscal years. The Company does not expect the adoption of ASU 2009-15 to have a material impact on its consolidated financial statements.
49
In January 2010, the FASB issued ASU 2010-01, Equity (Topic 505): Accounting for Distributions to Shareholders with Components of Stock and Cash – a consensus of the FASB Emerging Issues Task Force. ASU 2010-01 clarifies that the stock portion of a distribution to shareholders that allows them to elect to receive cash or stock with a potential limitation on the total amount of cash that all shareholders can elect to receive in the aggregate is considered a share issuance that is reflected in earnings per share (‘EPS”) prospectively and is not a stock dividend. ASU 2010-01 is effective for interim and annual periods ending on or after December 15, 2009 and should be applied on a retrospective basis. The Company does not expect the adoption of ASU 2010-01 to have a material impact on its consolidated financial statements.
In January 2010, the FASB issued ASU 2010-02, Consolidation (Topic 810): Accounting and reporting for Decreases in Ownership of a Subsidiary – a Scope Clarification. ASU 2010-02 amends Subtopic 810-10 to address implementation issues related to changes in ownership provisions including clarifying the scope of the decrease in ownership and additional disclosures. ASU 2010-02 is effective beginning in the period that an entity adopts Statement 160. If an entity has previously adopted Statement 160, ASU 2010-02 is effective beginning in the first interim or annual reporting period ending on or after December 15, 2009 and should be applied retrospectively to the first period Statement 160 was adopted. The Company does not expect the adoption of ASU 2010-02 to have a material impact on its consolidated financial statements.
In January 2010, the FASB issued ASU 2010-04, Accounting for Various Topics – Technical Corrections to SEC Paragraphs. ASU 2010-04 makes technical corrections to existing SEC guidance including the following topics: accounting for subsequent investments, termination of an interest rate swap, issuance of financial statements - subsequent events, use of residential method to value acquired assets other than goodwill, adjustments in assets and liabilities for holding gains and losses, and selections of discount rate used for measuring defined benefit obligation. The Company does not expect the adoption of ASU 2010-04 to have a material impact on its consolidated financial statements.
In January 2010, the FASB issued ASU 2010-05, Compensation – Stock Compensation (Topic 718): Escrowed Share Arrangements and the Presumption of Compensation. ASU 2010-05 updates existing guidance to address the SEC staff’s views on overcoming the presumption that for certain shareholders escrowed share arrangements represent compensation. The Company does not expect the adoption of ASU 2010-05 to have a material impact on its consolidated financial statements.
In January 2010, the FASB issued ASU No. 2010-06, Fair Value Measurements and Disclosures (Topic 820): Improving Disclosures about Fair Value Measurements. ASU 2010-06 amends Subtopic 820-10 to clarify existing disclosures, require new disclosures, and includes conforming amendments to guidance on employers’ disclosures about postretirement benefit plan assets. ASU 2010-06 is effective for interim and annual periods beginning after December 15, 2009, except for disclosures about purchases, sales, issuances, and settlements in the roll forward of activity in Level 3 fair value measurements. Those disclosures are effective for fiscal years beginning after December 15, 2010 and for interim periods within those fiscal years. The Company does not expect the adoption of ASU 2010-06 to have a material impact on its consolidated financial statements.
In February 2010, the FASB issued ASU 2010-08, Technical Corrections to Various Topics. ASU 2010-08 clarifies guidance on embedded derivatives and hedging. ASU 2010-08 is effective for interim and annual periods beginning after December 15, 2009. The Company does not expect the adoption of ASU 2010-08 to have a material impact on its consolidated financial statements.
Note 2 – Restrictions on Cash and Amounts Due From Banks
The Company is a member of the Federal Reserve System and is required to maintain certain levels of its cash and cash equivalents as reserves based on regulatory requirements. This reserve requirement was approximately $6,937,000 at December 31, 2009 and $7,795,000 at December 31, 2008.
The Company maintains cash accounts in other commercial banks. The amount on deposit with correspondent institutions at December 31, 2009 did not exceed the insurance limits of the Federal Deposit Insurance Corporation.
Note 3 - Securities
The amortized cost and estimated fair value of investments in debt securities at December 31, 2009 and 2008 were as follows:
|
|
December 31, 2009
|
|||||||||||||||
|
(in thousands)
|
Amortized
|
Unrealized
|
Unrealized
|
Estimated
|
||||||||||||
|
Cost
|
Gains
|
Losses
|
Fair Value
|
|||||||||||||
|
Securities available for sale:
|
||||||||||||||||
|
Federal agencies & GSE
|
$ | 81,279 | $ | 1,474 | $ | 7 | $ | 82,746 | ||||||||
|
Mortgage-backed
|
41,365 | 1,535 | 310 | 42,590 | ||||||||||||
|
State and municipal
|
58,035 | 1,442 | 181 | 59,296 | ||||||||||||
|
Corporate
|
3,962 | 201 | - | 4,163 | ||||||||||||
|
Total securities available for sale
|
184,641 | 4,652 | 498 | 188,795 | ||||||||||||
|
Securities held to maturity:
|
||||||||||||||||
|
Mortgage-backed
|
199 | 14 | - | 213 | ||||||||||||
|
State and municipal
|
6,330 | 220 | - | 6,550 | ||||||||||||
|
Total securities held to maturity
|
6,529 | 234 | - | 6,763 | ||||||||||||
|
Total securities
|
$ | 191,170 | $ | 4,886 | $ | 498 | $ | 195,558 | ||||||||
|
|
December 31, 2008
|
|||||||||||||||
|
(in thousands)
|
Amortized
|
Unrealized
|
Unrealized
|
Estimated
|
||||||||||||
|
Cost
|
Gains
|
Losses
|
Fair Value
|
|||||||||||||
|
Securities available for sale:
|
||||||||||||||||
|
Federal agencies & GSE
|
$ | 43,331 | $ | 2,093 | $ | 8 | $ | 45,416 | ||||||||
|
Mortgage-backed
|
45,139 | 1,040 | 496 | 45,683 | ||||||||||||
|
State and municipal
|
36,726 | 653 | 74 | 37,305 | ||||||||||||
|
Corporate
|
1,485 | 3 | 96 | 1,392 | ||||||||||||
|
Total securities available for sale
|
126,681 | 3,789 | 674 | 129,796 | ||||||||||||
|
Securities held to maturity:
|
||||||||||||||||
|
Mortgage-backed
|
254 | 10 | - | 264 | ||||||||||||
|
State and municipal
|
6,867 | 261 | 1 | 7,127 | ||||||||||||
|
Total securities held to maturity
|
7,121 | 271 | 1 | 7,391 | ||||||||||||
|
Total securities
|
$ | 133,802 | $ | 4,060 | $ | 675 | $ | 137,187 | ||||||||
The amortized cost and estimated fair value of investments in securities at December 31, 2009, by contractual maturity, are shown in the following table. Expected maturities will differ from contractual maturities because borrowers may have the right to call or prepay obligations with or without call or prepayment penalties. Because mortgage-backed securities have both known principal repayment terms as well as unknown principal repayments due to potential borrower pre-payments, it is difficult to accurately predict the final maturity of these investments. Mortgage-backed securities are shown separately.
|
Available for Sale
|
Held to Maturity
|
|||||||||||||||
|
Amortized
|
Estimated
|
Amortized
|
Estimated
|
|||||||||||||
|
(in thousands)
|
Cost
|
Fair Value
|
Cost
|
Fair Value
|
||||||||||||
|
Due in one year or less
|
$ | 39,053 | $ | 39,417 | $ | 1,406 | $ | 1,417 | ||||||||
|
Due after on year through five years
|
61,364 | 63,158 | 1,448 | 1,500 | ||||||||||||
|
Due after five years through ten years
|
25,695 | 26,279 | 3,476 | 3,633 | ||||||||||||
|
Due after ten years
|
17,164 | 17,351 | - | - | ||||||||||||
|
Mortgage-backed securities
|
41,365 | 42,590 | 199 | 213 | ||||||||||||
| $ | 184,641 | $ | 188,795 | $ | 6,529 | $ | 6,763 | |||||||||
Gross realized gains and losses from the call of certain securities or the sale of securities available for sale were as follows (in thousands):
|
For the Years Ended December 31,
|
||||||||||||
|
2009
|
2008
|
2007
|
||||||||||
|
Realized gains
|
$ | 3 | $ | 51 | $ | 135 | ||||||
|
Realized losses
|
- | (501 | ) | - | ||||||||
Securities with a carrying value of approximately $115,444,000 and $90,683,000, at December 31, 2009 and 2008, respectively, were pledged to secure public deposits, repurchase agreements, and for other purposes as required by law.
Corporate bonds consist of investment grade debt securities, primarily issued by financial services companies.
Temporarily Impaired Securities
The following table shows estimated fair value and gross unrealized losses, aggregated by investment category and length of time that individual securities have been in a continuous unrealized loss position, at December 31, 2009. The reference point for determining when securities are in an unrealized loss position is month-end. Therefore, it is possible that a security’s market value exceeded its amortized cost on other days during the past twelve-month period.
Available for sale and held to maturity securities that have been in a continuous unrealized loss position are as follows:
|
Total
|
Less than 12 Months
|
12 Months or More
|
||||||||||||||||||||||
|
(in thousands)
|
Estimated
Fair
Value
|
Unrealized
Loss
|
Estimated
Fair
Value
|
Unrealized
Loss
|
Estimated
Fair
Value
|
Unrealized
Loss
|
||||||||||||||||||
|
GSE debt securities
|
$ | 28,918 | $ | 7 | $ | 28,918 | $ | 7 | $ | - | $ | - | ||||||||||||
|
Mortgage-backed
|
7,294 | 95 | 7,294 | 95 | - | - | ||||||||||||||||||
|
Private label CMO’s
|
2,151 | 215 | - | - | 2,151 | 215 | ||||||||||||||||||
|
State and municipal
|
7,420 | 181 | 6,991 | 145 | 429 | 36 | ||||||||||||||||||
|
Total
|
$ | 45,783 | $ | 498 | $ | 43,203 | $ | 247 | $ | 2,580 | $ | 251 | ||||||||||||
GSE debt securities. The unrealized losses on the five investments in GSEs (“government sponsored entities”) were caused by interest rate increases. The contractual terms of those investments do not permit the issuer to settle the securities at a price less than the amortized cost bases of the investments. Because the Company does not intend to sell the investments and it is not more likely than not that the Company will be required to sell the investments before recovery of their amortized cost bases, which may be maturity, the Company does not consider those investments to be other-than-temporarily impaired at December 31, 2009.
GSE residential mortgage-backed securities. The unrealized losses on the Company's investment in five GSE mortgage-backed securities were caused by interest rate increases. The Company purchased those investments at a discount relative to their face amount, and the contractual cash flows of those investments are guaranteed by an agency of the U.S. Government. Accordingly, it is expected that the securities would not be settled at a price less than the amortized cost bases of the Company’s investments. Because the decline in market value is attributable to changes in interest rates and not credit quality, and because the Company does not intend to sell the investments and it is not more likely than not that the Company will be required to sell the investments before recovery of their amortized cost bases, which may be maturity, the Company does not consider those investments to be other-than-temporarily impaired at December 31, 2009.
Private-Label Residential Mortgage-Backed Securities: The unrealized losses associated with four private residential collateralized mortgage obligations (“CMOs”) are primarily driven by higher projected collateral losses, wider credit spreads and changes in interest rates. We assess for credit impairment using a cash flow model. Based upon our assessment of the expected credit losses of the security given the performance of the underlying collateral compared to our credit enhancement, we expect to recover the entire amortized cost basis of these securities.
State and municipal securities: The unrealized losses on the 12 investments in state and municipal securities were caused by interest rate increases. The contractual terms of those investments do not permit the issuer to settle the securities at a price less than the amortized cost bases of the investments. Because the Company does not intend to sell the investments and it is not more likely than not that the Company will be required to sell the investments before recovery of their amortized cost bases, which may be maturity, the Company does not consider those investments to be other-than-temporarily impaired at December 31, 2009.
The Company’s investment in Federal Home Loan Bank (“FHLB”) stock totaled $2,812,000 at December 31, 2009. FHLB stock is generally viewed as a long-term investment and as a restricted investment security, which is carried at cost, because there is no market for the stock, other than the FHLBs or member institutions. Therefore, when evaluating FHLB stock for impairment, its value is based on the ultimate recoverability of the par value rather than by recognizing temporary declines in value. Despite the FHLB’s temporary suspension of repurchases of excess capital stock in 2009, the Company does not consider this investment to be other-than-temporarily impaired at December 31, 2009 and no impairment has been recognized. FHLB stock is shown in restricted stock on the balance sheet and is not a part of the available for sale securities portfolio.
The table below shows gross unrealized losses and fair value, aggregated by investment category and length of time that individual securities had been in a continuous unrealized loss position, at December 31, 2008.
|
Total
|
Less than 12 Months
|
12 Months or More
|
||||||||||||||||||||||
|
(in thousands)
|
Estimated
Fair
Value
|
Unrealized
Loss
|
Estimated
Fair
Value
|
Unrealized
Loss
|
Estimated
Fair
Value
|
Unrealized
Loss
|
||||||||||||||||||
|
GSE debt securities
|
$ | 1,583 | $ | 8 | $ | 1,583 | $ | 8 | $ | - | $ | - | ||||||||||||
|
Mortgage-backed
|
1,751 | 28 | 735 | 4 | 1,016 | 24 | ||||||||||||||||||
|
Private label CMO’s
|
2,733 | 468 | 2,733 | 468 | - | - | ||||||||||||||||||
|
State and municipal
|
3,581 | 75 | 3,581 | 75 | - | - | ||||||||||||||||||
|
Corporate
|
389 | 96 | - | - | 389 | 96 | ||||||||||||||||||
|
Total
|
$ | 10,037 | $ | 675 | $ | 8,632 | $ | 555 | $ | 1,405 | $ | 120 | ||||||||||||
Note 4 – Loans
Loans, excluding loans held for sale, were comprised of the following:
|
December 31,
|
||||||||
|
(in thousands)
|
2009
|
2008
|
||||||
|
Construction and land development
|
$ | 40,371 | $ | 63,361 | ||||
|
Commercial real estate
|
208,066 | 207,160 | ||||||
|
Residential real estate
|
121,639 | 136,480 | ||||||
|
Home equity
|
64,678 | 57,170 | ||||||
|
Total real estate
|
434,754 | 464,171 | ||||||
|
Commercial and industrial
|
86,312 | 98,546 | ||||||
|
Consumer
|
6,925 | 8,393 | ||||||
|
Total loans
|
$ | 527,991 | $ | 571,110 | ||||
Net deferred loan costs included in the above loan categories are $177,000 for 2009 and $244,000 for 2008.
Overdraft deposits were reclassified to consumer loans in the amount of $62,000 and $109,000 for 2009 and 2008, respectively.
The following is a summary of information pertaining to impaired and nonaccrual loans:
|
December 31,
|
||||||||
|
(in thousands)
|
2009
|
2008
|
||||||
|
Impaired loans with a valuation allowance
|
$ | 1,284 | $ | 2,545 | ||||
|
Impaired loans without a valuation allowance
|
2,540 | 647 | ||||||
|
Total impaired loans
|
$ | 3,824 | $ | 3,192 | ||||
|
Allowance provided for impaired loans,
|
||||||||
|
included in the allowance for loan losses
|
$ | 796 | $ | 1,164 | ||||
|
Nonaccrual loans excluded from the
|
||||||||
|
impaired loan disclosure
|
$ | 1,885 | $ | 1,574 | ||||
|
Years Ended December 31,
|
||||||||||||
|
(in thousands)
|
2009
|
2008
|
2007
|
|||||||||
|
Average balance in impaired loans
|
$ | 3,211 | $ | 4,829 | $ | 2,540 | ||||||
|
Interest income recognized on impaired loans
|
$ | 124 | $ | 152 | $ | 262 | ||||||
|
Interest income recognized on nonaccrual loans
|
$ | - | $ | - | $ | - | ||||||
|
Loans past due 90 days and still accruing interest
|
$ | - | $ | - | $ | - | ||||||
No additional funds are committed to be advanced in connection with impaired loans.
Note 5 – Accounting for Certain Loans Acquired in a Transfer
The Company acquired loans pursuant to the acquisition of Community First Financial Corporation (“Community First”) in April 2006. In accordance with accounting guidance, at acquisition the Company reviewed each loan to determine whether there was evidence of deterioration of credit quality since origination and if it was probable that it would be unable to collect all amounts due according to the loan’s contractual terms. When both conditions existed, the Company accounted for each loan individually, considered expected payments, and estimated the amount and timing of undiscounted expected principal, interest, and other cash flows (expected at acquisition) for each loan. The Company determined the excess of the loan’s scheduled contractual principal and contractual interest payments over all cash flows expected at acquisition as an amount that should not be accreted into interest income (nonaccretable difference). The remaining amount, representing the excess of the loan’s cash flows expected to be collected over the amount paid, is accreted into interest income over the remaining life of the loan (accretable yield).
Over the life of the loan, the Company continues to estimate cash flows expected to be collected. The Company evaluates at the balance sheet date whether the present value of its loans determined using the effective interest rates has decreased and if so, establishes a valuation allowance for the loan. Valuation allowances for acquired loans subject to FASB ASC 310-30-3 reflect only those losses incurred after acquisition – that is, the present value of cash flows expected at acquisition that are not expected to be collected. Valuation allowances are established only subsequent to acquisition of the loans. For loans that are not accounted for as debt securities, the present value of any subsequent increase in the loan’s or pool’s actual cash flows or cash flows expected to be collected is used first to reverse any existing valuation allowance for that loan. For any remaining increases in cash flows expected to be collected, the Company adjusts the amount of accretable yield recognized on a prospective basis over the loan’s remaining life. The Company does not have any such loans that were accounted for as debt securities.
Loans that were acquired in the Community First acquisition, for which there was evidence of deterioration of credit quality since origination and for which it was probable that all contractually required payments would not be made, had an outstanding balance of $539,000 and a carrying amount $198,000 at December 31, 2009 and an outstanding balance of $665,000 and a carrying amount of $344,000 at December 31, 2008.
The carrying amount of these loans is included in the balance sheet amount of loans receivable at December 31, 2009 and 2008. These loans are not included in the impaired loan amounts disclosed in Note 4.
|
(in thousands)
|
Accretable
Yield
|
|||
|
Balance at December 31, 2007
|
$ | 111 | ||
|
Accretion
|
(20 | ) | ||
|
Disposals
|
(46 | ) | ||
|
Balance at December 31, 2008
|
45 | |||
|
Accretion
|
(14 | ) | ||
|
Balance at December 31, 2009
|
$ | 31 | ||
Note 6 – Allowance for Loan Losses and Reserve for Unfunded Lending Commitments
Changes in the allowance for loan losses and the reserve for unfunded lending commitments for each of the years in the three-year period ended December 31, 2009, are presented below:
|
Years Ended December 31,
|
||||||||||||
|
(in thousands)
|
2009
|
2008
|
2007
|
|||||||||
|
Allowance for Loan Losses
|
||||||||||||
|
Balance, beginning of year
|
$ | 7,824 | $ | 7,395 | $ | 7,264 | ||||||
|
Provision for loan losses
|
1,662 | 1,620 | 403 | |||||||||
|
Charge-offs
|
(1,601 | ) | (1,564 | ) | (515 | ) | ||||||
|
Recoveries
|
281 | 373 | 243 | |||||||||
|
Balance, end of year
|
$ | 8,166 | $ | 7,824 | $ | 7,395 | ||||||
|
Years Ended December 31,
|
||||||||||||
| 2009 | 2008 | 2007 | ||||||||||
|
Reserve for Unfunded Lending Commitments
|
||||||||||||
|
Balance, beginning of year
|
$ | 475 | $ | 151 | $ | 123 | ||||||
|
Provision for unfunded commitments
|
- | 324 | 28 | |||||||||
|
Charge-offs
|
215 | - | - | |||||||||
|
Balance, end of year
|
$ | 260 | $ | 475 | $ | 151 | ||||||
The reserve for unfunded loan commitments is included in other liabilities.
Note 7 – Premises and Equipment
Major classifications of premises and equipment are summarized as follows:
|
(in thousands)
|
December 31,
|
|||||||
|
2009
|
2008
|
|||||||
|
Land
|
$ | 4,455 | $ | 3,977 | ||||
|
Buildings
|
17,399 | 15,686 | ||||||
|
Leasehold improvements
|
558 | 535 | ||||||
|
Furniture and equipment
|
13,524 | 12,497 | ||||||
| 35,936 | 32,695 | |||||||
|
Accumulated depreciation
|
(16,741 | ) | (15,566 | ) | ||||
|
Premises and equipment, net
|
$ | 19,195 | $ | 17,129 | ||||
Depreciation expense for the years ended December 31, 2009, 2008, and 2007 was $1,201,000, $1,086,000 and $1,178,000, respectively.
The Company has entered into operating leases for several of its branch and ATM facilities. The minimum annual rental payments under these leases at December 31, 2009 are as follows:
|
(in thousands)
|
Minimum Lease
|
|||
|
Year
|
Payments
|
|||
|
2010
|
$ | 267 | ||
|
2011
|
139 | |||
|
2012
|
107 | |||
|
2013
|
68 | |||
|
2014 and after
|
6 | |||
| $ | 587 | |||
Rent expense for the years ended December 31, 2009, 2008, and 2007 was $325,000, $329,000, and 353,000, respectively.
Note 8– Goodwill and Other Intangible Assets
In accordance with accounting guidance, goodwill is no longer subject to amortization, but is subject to at least an annual assessment for impairment by applying a fair value test. An annual fair value-based test was performed in 2009 that determined the market value of the Company’s shares exceeded the consolidated carrying value, including goodwill; therefore, there has been no impairment recognized in the value of goodwill.
The changes in the carrying amount of goodwill for the year ended December 31, 2009, are as follows (in thousands):
|
Amount
|
||||
|
Balance as of January 1, 2009
|
$ | 22,468 | ||
|
Goodwill recorded during year
|
- | |||
|
Impairment losses
|
- | |||
|
Balance as of December 31, 2009
|
$ | 22,468 | ||
Core deposit intangibles resulting from the Community First acquisition in April 2006 were $3,112,000 and are being amortized over 99 months.
Goodwill and intangible assets are as follow (in thousands):
|
Gross Carrying Value
|
Accumulated Amortization
|
Net Carrying Value
|
||||||||||
|
December 31, 2009
|
||||||||||||
|
Core deposit intangibles
|
$ | 3,112 | $ | 1,414 | $ | 1,698 | ||||||
|
Goodwill
|
22,468 | - | 22,468 | |||||||||
|
December 31, 2008
|
||||||||||||
|
Core deposit intangibles
|
$ | 3,112 | $ | 1,037 | $ | 2,075 | ||||||
|
Goodwill
|
22,468 | - | 22,468 | |||||||||
Amortization expense of core deposit intangibles for each of the years ended December 31, 2009, 2008, and 2007 totaled $377,000. As of December 31, 2009, the estimated future amortization expense of core deposit intangibles is as follows (in thousands):
|
Year
|
Amount
|
|||
|
2010
|
$ | 377 | ||
|
2011
|
377 | |||
|
2012
|
377 | |||
|
2013
|
377 | |||
|
2014
|
190 | |||
Note 9 - Deposits
The aggregate amount of time deposits in denominations of $100,000 or more at December 31, 2009 and 2008 was $117,296,000 and $107,186,000, respectively.
At December 31, 2009, the scheduled maturities of certificates of deposits (included in “time” deposits on the Consolidated Balance Sheet) were as follows (in thousands):
|
Year
|
Amount
|
|||
|
2010
|
$ | 177,818 | ||
|
2011
|
46,351 | |||
|
2012
|
15,871 | |||
|
2013
|
23,154 | |||
|
2014
|
4,751 | |||
|
2015
|
141 | |||
| $ | 268,086 | |||
Note 10 – Short-term Borrowings
Short-term borrowings consist of customer repurchase agreements, overnight borrowings from the FHLB, and Federal Funds purchased. Customer repurchase agreements are collateralized by securities of the U.S. Government or its agencies. They mature daily. The interest rates are generally fixed but may be changed at the discretion of the Company. The securities underlying these agreements remain under the Company’s control. FHLB overnight borrowings contain floating interest rates that may change daily at the discretion of the FHLB. Federal Funds purchased are unsecured overnight borrowings from other financial institutions. Short-term borrowings consisted of the following as of December 31, 2009 and 2008 (in thousands):
|
2009
|
2008
|
|||||||
|
|
|
|||||||
|
Customer repurchase agreements
|
$ | 65,929 | $ | 51,741 | ||||
|
FHLB overnight borrowings
|
- | 7,850 | ||||||
| $ | 65,929 | $ | 59,591 | |||||
Note 11 – Long-term Borrowings
Under the terms of its collateral agreement with the FHLB, the Company provides a blanket lien covering all of its residential first mortgage loans, second mortgage loans and home equity lines of credit. In addition, the Company pledges as collateral its capital stock in the FHLB and deposits with the FHLB. The Company has a line of credit with the FHLB equal to 30% of the Company’s assets, subject to the amount of collateral pledged. As of December 31, 2009, $92,789,000 in 1-4 family residential mortgage loans and $59,761,000 in home equity lines of credit were pledged under the blanket floating lien agreement which covers both short-term and long-term borrowings. Long-term borrowings consisted of the following fixed rate, long term advances as of December 31, 2009 and 2008 (in thousands):
|
Due by
December 31
|
2009
Advance Amount
|
Weighted
Average
Rate
|
Due by
December 31
|
2008
Advance Amount
|
Weighted
Average
Rate
|
|||||||||||||||
|
2011
|
$ | 8,000 | 2.93 | 2009 | $ | 5,000 | 5.26 | % | ||||||||||||
|
2014
|
638 | 3.78 | 2011 | 8,000 | 2.93 | |||||||||||||||
| $ | 8,638 | 2.99 | % | 2014 | 787 | 3.78 | ||||||||||||||
| $ | 13,787 | 3.82 | % | |||||||||||||||||
In the regular course of conducting its business, the Company takes deposits from political subdivisions of the Commonwealth of Virginia. At December 31, 2009, the Bank’s public deposits totaled $60,041,000. The Company is required to provide collateral to secure the deposits that exceed the insurance coverage provided by the Federal Deposit Insurance Corporation. This collateral can be provided in the form of certain types of government or agency bonds or letters of credit from the FHLB. At year-end 2009, the Company had $40 million in letters of credit with the FHLB outstanding to provide collateral for such deposits.
Note 12 – Trust Preferred Capital Notes
On April 7, 2006, AMNB Statutory Trust I, a Delaware statutory trust and a newly formed, wholly owned subsidiary of the Company, issued $20,000,000 of preferred securities in a private placement pursuant to an applicable exemption from registration. The Trust Preferred Securities mature on June 30, 2036, but may be redeemed at the Company’s option beginning on June 30, 2011. The securities require quarterly distributions by the Trust to the holder of the Trust Preferred Securities at a fixed rate of 6.66%. Effective June 30, 2011, the rate will reset quarterly at the three-month LIBOR plus 1.35%. Distributions are cumulative and will accrue from the date of original issuance, but may be deferred by the Company from time to time for up to twenty consecutive quarterly periods. The Company has guaranteed the payment of all required distributions on the Trust Preferred Securities.
The proceeds of the Trust Preferred Securities received by the Trust, along with proceeds of $619,000 received by the Trust from the issuance of common securities by the Trust to the Company, were used to purchase $20,619,000 of the Company’s junior subordinated debt securities (the “Trust Preferred Capital Notes”), issued pursuant to a Junior Subordinated Indenture entered into between the Company and Wilmington Trust Company, as trustee. The proceeds of the Trust Preferred Capital Notes were used to fund the cash portion of the merger consideration to the former shareholders of Community First in connection with the Company’s acquisition of that company, and for general corporate purposes. In accordance with FASB ASC 810-10-15-14, the Corporation did not eliminate through consolidation the Corporation’s $619,000 equity investment in AMNB Statutory Trust I. Instead, the Corporation reflected this equity investment in the “Accrued interest receivable and other assets” line item in the consolidated balance sheets.
Note 13 – Stock-Based Compensation
The Company’s 1997 Stock Option Plan (“1997 Option Plan”) provided for the granting of incentive and non-statutory options to employees on a periodic basis, at the discretion of the Board or a Board designated committee. The 1997 Option Plan authorized the issuance of up to 300,000 shares of common stock. There were no options granted since 2004, and, effective December 31, 2006, no further options may be granted under this plan.
The 2008 Stock Incentive Plan (“2008 Option Plan”) was adopted by the Board of Directors of the Company on February 19, 2008 and approved by the stockholders on April 22, 2008. The 2008 Option Plan provides for the granting of restricted stock awards and incentive and non-statutory options to employees and directors on a periodic basis, at the discretion of the Board or a Board designated committee. The 2008 Option Plan authorizes the issuance of up to 500,000 shares of common stock. Accounting guidance requires that compensation cost relating to share-based payment transactions be recognized in the financial statements with measurement based upon the fair value of the equity or liability instruments issued.
A summary of stock option transactions is as follows:
|
Option
Shares
|
Weighted
Average
Exercise
Price
|
Weighted Average Remaining Contractual Term
|
Aggregate
Intrinsic
Value
($000)
|
||||||||||
|
Outstanding at December 31, 2008
|
218,610 | $ | 20.31 | ||||||||||
|
Granted
|
6,000 | 16.00 | |||||||||||
|
Exercised
|
(32,307 | ) | 14.66 | ||||||||||
|
Forfeited
|
(29,700 | ) | 19.67 | ||||||||||
|
Outstanding at December 31, 2009
|
162,603 | $ | 21.39 |
5.7 years
|
$ | 361 | |||||||
|
Exercisable at December 31, 2009
|
132,103 | $ | 22.43 |
4.9 years
|
$ | 208 | |||||||
The aggregate intrinsic value of stock options in the table above represents the total pre-tax intrinsic value (the amount by which the current market value of the underlying stock exceeds the exercise price of the option) that would have been received by the option holders had all option holders exercised their options on December 31, 2009. This amount changes based on changes in the market value of the Company’s stock.
The total proceeds of the in-the-money options exercised during the year ended December 31, 2009, 2008, and 2007 was $474,000, $219,000 and $295,000, respectively. Total intrinsic value of options exercised during years ended December 31, 2009, 2008, and 2007 was $105,000, $51,000, and $110,000, respectively.
As of December 31, 2009 and 2008, there was $127,000 and $176,000, respectively, in unrecognized compensation expense. There was no unrecognized compensation expense as of December 31, 2007. Compensation expense related to stock options was $62,000 in 2009, $59,000 in 2008, and $0 in 2007.
The following table summarizes information related to stock options outstanding on December 31, 2009:
|
Options Outstanding
|
Options Exercisable
|
|||||||||||||||||||
|
Range of
Exercise Prices
|
Number of
Outstanding Options
|
Weighted-Average
Remaining
Contractual Life
|
Weighted-Average
Exercise
Price
|
Number of
Options
Exercisable
|
Weighted Average
Exercise Price
|
|||||||||||||||
|
16.00 to 20.00
|
79,776 |
7.1 yrs
|
$ | 17.37 | 49,276 | $ | 17.68 | |||||||||||||
|
20.01 to 25.00
|
44,200 | 4.8 | 24.45 | 44,200 | 24.45 | |||||||||||||||
|
25.01 to 26.20
|
38,627 | 3.8 | 26.18 | 38,627 | 26.18 | |||||||||||||||
| 162,603 |
5.7 yrs
|
$ | 21.39 | 132,103 | $ | 22.43 | ||||||||||||||
The fair value of each stock option granted in 2009 and 2008 was estimated on the date of grant using the Black-Scholes option valuation model that uses the assumptions noted in the following table:
|
2009
|
2008
|
|||||||
|
Dividend yield
|
5.75 | % | 5.41 | % | ||||
|
Expected life in years
|
6.6 | 6.6 | ||||||
|
Expected volatility
|
17.90 | % | 18.10 | % | ||||
|
Risk-free interest rate
|
3.61 | % | 1.77 | % | ||||
|
Weighted average fair value per option granted
|
$ | 4.63 | $ | 3.98 | ||||
The expected volatility is based on historical volatility. The risk-free interest rates for periods within the contractual life of the awards are based on the U.S. Treasury yield curve in effect at the time of the grant. The expected life is based on historical exercise experience. The dividend yield assumption is based on the Company’s history and expectation of dividend payouts.
Note 14 – Income Taxes
The Company files income tax returns in the U.S. federal jurisdiction and the states of Virginia and North Carolina. With few exceptions, the Company is no longer subject to U.S. federal, state, and local income tax examinations by tax authorities for years prior to 2006.
The components of the Company’s net deferred tax assets (liabilities) were as follows:
|
(in thousands)
|
December 31,
|
|||||||
|
2009
|
2008
|
|||||||
|
Deferred tax assets:
|
||||||||
|
Allowance for loan losses
|
$ | 2,858 | $ | 2,675 | ||||
|
Nonaccrual loan interest
|
149 | 165 | ||||||
|
OREO valuation allowance
|
449 | 26 | ||||||
|
Deferred compensation
|
203 | 211 | ||||||
|
Allowance for off balance sheet items
|
91 | 166 | ||||||
|
Loans
|
177 | 373 | ||||||
|
Other
|
48 | 24 | ||||||
|
Total deferred tax assets
|
3,975 | 3,640 | ||||||
|
Deferred tax liabilities:
|
||||||||
|
Depreciation
|
799 | 1,005 | ||||||
|
Accretion of discounts on securities
|
43 | 33 | ||||||
|
Core deposit intangibles
|
594 | 508 | ||||||
|
Deferred loan fees
|
62 | 86 | ||||||
|
Net unrealized gains on securities
|
1,454 | 1,090 | ||||||
|
Prepaid pension expense
|
841 | 240 | ||||||
|
Pension liability
|
857 | 1,826 | ||||||
|
Other
|
52 | 52 | ||||||
|
Total deferred tax liabilities
|
4,702 | 4,840 | ||||||
|
Net deferred tax assets (liabilities)
|
$ | (727 | ) | $ | (1,200 | ) | ||
The provision for income taxes consists of the following:
|
(in thousands)
|
Years Ended December 31,
|
|||||||||||
|
2009
|
2008
|
2007
|
||||||||||
|
Taxes currently payable
|
$ | 2,393 | $ | 2,490 | $ | 4,943 | ||||||
|
Deferred tax expense (benefit)
|
132 | 691 | (67 | ) | ||||||||
| $ | 2,525 | $ | 3,181 | $ | 4,876 | |||||||
The effective tax rates differ from the statutory federal income tax rates due to the following items:
|
Years Ended December 31,
|
||||||||||||
|
2009
|
2008
|
2007
|
||||||||||
|
Federal statutory rate
|
34.0 | % | 34.1 | % | 34.4 | % | ||||||
|
Nontaxable interest income
|
(6.3 | ) | (4.9 | ) | (3.5 | ) | ||||||
|
Other
|
(0.7 | ) | (0.8 | ) | (1.0 | ) | ||||||
|
Effective rate
|
27.0 | % | 28.4 | % | 29.9 | % | ||||||
Note 15 – Earnings Per Share
The following shows the weighted average number of shares used in computing earnings per share and the effect on weighted average number of shares of potentially dilutive common stock. Potentially dilutive common stock had no effect on income available to common shareholders.
|
Years Ended December 31,
|
||||||||||||||||||||||||
|
2009
|
2008
|
2007
|
||||||||||||||||||||||
|
Shares
|
Per Share
Amount
|
Shares
|
Per Share
Amount
|
Shares
|
Per Share
Amount
|
|||||||||||||||||||
|
Basic earnings per share
|
6,097,810 | $ | 1.12 | 6,096,649 | $ | 1.32 | 6,139,095 | $ | 1.86 | |||||||||||||||
|
Effect of dilutive securities -
stock options
|
5,085 | - | 8,505 | (.01 | ) | 22,730 | - | |||||||||||||||||
|
Diluted earnings per share
|
6,102,895 | $ | 1.12 | 6,105,154 | $ | 1.31 | 6,161,825 | $ | 1.86 | |||||||||||||||
Stock options on common stock which were not included in computing diluted EPS in 2009, 2008, and 2007, because their effects were antidilutive averaged 102,669 shares, 118,640 shares, and 89,277 shares, respectively.
Note 16 – Off-Balance Sheet Activities
The Company is party to credit-related financial instruments with off-balance sheet risk in the normal course of business to meet the financing needs of its customers. These financial instruments include commitments to extend credit and standby letters of credit. Such commitments involve, to varying degrees, elements of credit and interest rate risk in excess of the amount recognized in the Consolidated Balance Sheets. The Company evaluates each customer's credit worthiness on a case-by-case basis. The amount of collateral obtained, if applicable, is based on management's credit evaluation of the customer.
The Company's exposure to credit loss is represented by the contractual amount of these commitments. The Company follows the same credit policies in making commitments as it does for on-balance sheet instruments.
The following off-balance sheet financial instruments were outstanding whose contract amounts represent credit risk:
|
December 31,
|
||||||||
|
(in thousands)
|
2009
|
2008
|
||||||
|
Commitments to extend credit
|
$ | 133,692 | $ | 146,399 | ||||
|
Standby letters of credit
|
2,624 | 2,858 | ||||||
|
Mortgage loan rate lock commitments
|
2,054 | 2,031 | ||||||
Commitments to extend credit are agreements to lend to a customer as long as there is no violation of any condition established in the contract. These commitments generally consist of unused portions of lines of credit issued to customers. Commitments generally have fixed expiration dates or other termination clauses and may require payment of a fee. Since some of the commitments are expected to expire without being drawn upon, the total commitment amounts do not necessarily represent future cash requirements.
Standby letters of credit are conditional commitments issued by the Company to guarantee the performance of a customer to a third party. Those letters of credit are primarily issued to support public and private borrowing arrangements. The credit risk involved in issuing letters of credit is essentially the same as that involved in extending loans to customers.
At December 31, 2009, the Company had entered into commitments, on a best-effort basis, to sell loans of approximately $4,544,000. These commitments include mortgage loan commitments and loans held for sale. Risks arise from the possible inability of counterparties to meet the terms of their contracts.
Note 17 – Related Party Loans
In the ordinary course of business, loans are granted to executive officers, directors, and their related entities. Management believes that all such loans are made on substantially the same terms, including interest rates and collateral, as those prevailing at the time for comparable loans to similar, unrelated borrowers, and do not involve more than a normal risk of collectability or present other unfavorable features. As of December 31, 2009, none of these loans were restructured, past due, or on nonaccrual status.
An analysis of these loans for 2009 is as follows (in thousands):
|
Balance at December 31, 2008
|
$ | 19,795 | ||
|
Additions
|
6,900 | |||
|
Repayments
|
(8,152 | ) | ||
|
Balance at December 31, 2009
|
$ | 18,543 |
Note 18 – Employee Benefit Plans
Defined Benefit Plan
Until December 31, 2009, the Company maintained a non-contributory defined benefit pension plan which covered substantially all employees who were 21 years of age or older and who had at least one year of service. The Company froze its pension plan to new participants and converted its pension plan to a cash balance plan effective December 31, 2009. Each year existing participants will receive, with some adjustments, income based on the yield of the ten year U.S. Treasury Note in December of the preceding year.
Previously, advanced funding was accomplished by using the actuarial cost method known as the collective aggregate cost method. Prior to 2008, the Company used October 31 as a measurement date to determine postretirement benefit obligations. The requirement to measure plan assets and benefit obligations as of the date of the employers’ fiscal year-end statement of financial position is effective for fiscal years ending after December 15, 2008.
Information pertaining to the activity in the plan is as follows:
|
(in thousands)
|
As of and for the Years Ended December 31,
|
|||||||||||
|
2009
|
2008
|
2007
|
||||||||||
|
Change in Benefit Obligation:
|
||||||||||||
|
Projected benefit obligation at beginning of year
|
$ | 9,582 | $ | 8,923 | $ | 7,038 | ||||||
|
Service cost
|
737 | 843 | 656 | |||||||||
|
Interest cost
|
585 | 600 | 418 | |||||||||
|
Actuarial loss (gain)
|
1,004 | (627 | ) | 987 | ||||||||
|
Benefits paid
|
(2,130 | ) | (157 | ) | (176 | ) | ||||||
|
Decrease in obligations due to curtailment
|
(964 | ) | - | - | ||||||||
|
Projected benefit obligation at end of year
|
8,814 | 9,582 | 8,923 | |||||||||
|
Change in Plan Assets:
|
||||||||||||
|
Fair value of plan assets at beginning of year
|
10,184 | 8,230 | 7,070 | |||||||||
|
Actual return on plan assets
|
1,998 | (2,888 | ) | 1,336 | ||||||||
|
Employer contributions
|
- | 5,000 | - | |||||||||
|
Benefits paid
|
(964 | ) | (158 | ) | (176 | ) | ||||||
|
Fair value of plan assets at end of year
|
11,218 | 10,184 | 8,230 | |||||||||
|
Funded Status at End of Year
|
$ | 2,404 | $ | 602 | $ | (693 | ) | |||||
|
Amounts Recognized in the Consolidated Balance Sheets
|
||||||||||||
|
Other assets (liabilities)
|
$ | 2,404 | $ | 602 | $ | (693 | ) | |||||
|
Amounts Recognized in Accumulated Other Comprehensive Income
|
||||||||||||
|
Net actuarial loss
|
$ | 2,448 | $ | 5,205 | $ | 2,308 | ||||||
|
Prior service cost
|
- | 13 | 12 | |||||||||
|
Deferred income tax benefit
|
(857 | ) | (1,827 | ) | (812 | ) | ||||||
|
Amount recognized
|
$ | 1,591 | $ | 3,391 | $ | 1,508 | ||||||
|
Components of Net Periodic Benefit Cost
|
||||||||||||
|
Service cost
|
$ | 737 | $ | 723 | $ | 656 | ||||||
|
Interest cost
|
585 | 515 | 418 | |||||||||
|
Expected return on plan assets
|
(812 | ) | (657 | ) | (564 | ) | ||||||
|
Amortization of prior service cost
|
13 | (1 | ) | (1 | ) | |||||||
|
Recognized net actuarial loss
|
445 | 112 | 150 | |||||||||
|
Net periodic benefit cost
|
$ | 968 | $ | 692 | $ | 659 | ||||||
|
A Adjustment to Retained Earnings Due to Change in Measurement Date
|
||||||||||||
|
Service cost
|
N/A | $ | 121 | N/A | ||||||||
|
Interest cost
|
N/A | 86 | N/A | |||||||||
|
Expected return on plan assets
|
N/A | (110 | ) | N/A | ||||||||
|
Recognized net actuarial loss
|
N/A | 18 | N/A | |||||||||
|
Net periodic benefit cost
|
N/A | $ | 115 | N/A | ||||||||
|
As of and for the Years Ended December 31,
|
||||||||||||
|
2009
|
2008
|
2007
|
||||||||||
|
Other Changes in Plan Assets and Benefit Obligations Recognized in Other Comprehensive Income
|
||||||||||||
|
Net actuarial loss
|
$ | (2,757 | ) | $ | 2,897 | $ | 65 | |||||
|
Amortization of prior service cost
|
(13 | ) | 1 | 1 | ||||||||
|
Total recognized in other comprehensive income
|
$ | (2,770 | ) | $ | 2,898 | $ | 66 | |||||
|
Total Recognized in Net Periodic Benefit Cost,
Retained Earnings and Other Comprehensive Income
|
$ | (1,802 | ) | $ | 3,705 | $ | 725 | |||||
|
Weighted-Average Assumptions at End of Year
|
||||||||||||
|
Discount rate used for net periodic pension cost
|
6.00 | % | 6.00 | % | 6.00 | % | ||||||
|
Discount rate used for disclosure
|
5.00 | % | 6.00 | % | 6.00 | % | ||||||
|
Expected return on plan assets
|
8.00 | % | 8.00 | % | 8.00 | % | ||||||
|
Rate of compensation increase
|
4.00 | % | 4.00 | % | 4.00 | % | ||||||
|
N/A – not applicable
|
||||||||||||
The accumulated benefit obligation as of December 31, 2009, 2008, and 2007 was $8,814,000, $6,942,000, and $6,499,000, respectively.
The plan sponsor selected the expected long-term rate-of-return-on-assets assumption in consultation with their investment advisors and actuary. This rate was intended to reflect the average rate of earnings expected to be earned on the funds invested or to be invested to provide plan benefits. Historical performance is reviewed, especially with respect to real rates of return (net of inflation), for the major asset classes held or anticipated to be held by the trust, and for the trust itself. Undue weight is not given to recent experience that may not continue over the measurement period, with higher significance placed on current forecasts of future long-term economic conditions.
Because assets are held in a qualified trust, anticipated returns are not reduced for taxes. Further, solely for this purpose, the plan is assumed to continue in force and not terminate during the period in which assets are invested. However, consideration is given to the potential impact of current and future investment policy, cash flow into and out of the trust, and expenses (both investment and non-investment) typically paid from plan assets (to the extent such expenses are not explicitly estimated within periodic cost).
Below is a description of the plan’s assets. The plan’s weighted-average asset allocations by asset category are as follows:
|
Asset Category
|
December 31,
2009
|
December 31, 2008
|
||||||
|
Fixed Income
|
33.2 | % | 24.8 | % | ||||
|
Equity
|
47.5 | 34.0 | ||||||
|
Mutual Funds
|
6.5 | 5.5 | ||||||
|
Cash and Accrued Income
|
12.8 | 35.7 | ||||||
|
Total
|
100.0 | % | 100.0 | % | ||||
The investment policy and strategy for plan assets can best be described as a growth and income strategy. Diversification is accomplished by limiting the holding of any one equity issuer to no more than 5% of total equities. Exchange traded funds are used to provide diversified exposure to the small capitalization and international equity markets. All fixed income investments are rated as investment grade, with the majority of these assets invested in corporate issues. The assets are managed by the Company’s Trust and Investment Services Division. No derivatives are used to manage the assets. Equity securities do not include holdings in the Company.
The fair value of the Company’s pension plan assets at December 31, 2009, by asset category, are as follows (in thousands):
|
Fair Value Measurements at December 31, 2009 Using
|
||||||||||||||||
|
Balance as of December 31,
|
Quoted Prices in Active Markets for Identical Assets
|
Significant Other Observable Inputs
|
Significant Unobservable Inputs
|
|||||||||||||
|
Asset Category
|
2009
|
Level 1
|
Level 2
|
Level 3
|
||||||||||||
|
Cash
|
$ | 1,406 | $ | 1,406 | $ | - | $ | - | ||||||||
|
Fixed income securities
|
||||||||||||||||
|
Government sponsored entities
|
1,342 | - | 1,342 | - | ||||||||||||
|
Corporate bonds & notes
|
2,090 | - | 2,090 | - | ||||||||||||
|
Bank certificates of deposit
|
297 | 297 | - | - | ||||||||||||
|
Mutual funds
|
713 | - | 713 | |||||||||||||
|
Equity securities
|
||||||||||||||||
|
U.S. companies
|
5,075 | 5,075 | - | - | ||||||||||||
|
Foreign companies
|
253 | 253 | - | - | ||||||||||||
|
Exchange traded funds
|
10 | - | 10 | - | ||||||||||||
|
Accrued interest and dividends
|
32 | 32 | - | - | ||||||||||||
| $ | 11,218 | $ | 7,063 | $ | 4,155 | $ | - | |||||||||
Projected benefit payments for the years 2010 to 2019 are as follows (in thousands):
|
Year
|
Amount
|
|||
|
2010
|
$ | 892 | ||
|
2011
|
1,793 | |||
|
2012
|
679 | |||
|
2013
|
676 | |||
|
2014
|
1,182 | |||
|
2015-2019
|
2,525 | |||
401(k) Plan
The Company maintains a 401(k) savings plan that covers substantially all full-time employees of the Company. The Company matches a portion of the contribution made by employee participants after at least one year of service. The Company contributed $258,000, $263,000, and $273,000 to the 401(k) plan in 2009, 2008, and 2007, respectively. These amounts are included employee benefits expense for the respective years.
Deferred Compensation Arrangements
The Company maintains deferred compensation agreements with certain current and former employees providing for annual payments to each ranging from $25,000 to $50,000 per year for ten years upon their retirement. The liabilities under these agreements are being accrued over the officers’ remaining periods of employment so that, on the date of their retirement, the then-present value of the annual payments would have been accrued. The expense for these agreements was $33,000, $33,000, and $55,000 for years 2009, 2008, and 2007, respectively.
Profit Sharing and Incentive Arrangements
The Company maintains a cash profit sharing plan for full-time employees based on the Company’s performance and a cash incentive compensation plan for officers based on the Company’s performance and individual officer goals. The total amount charged to salary expense for these plans was $176,000, $0, and $287,000 for the years 2009, 2008, and 2007, respectively.
Note 19 – Fair Value Measurements
Determination of Fair Value
The Company uses fair value measurements to record fair value adjustments to certain assets and liabilities and to determine fair value disclosures. In accordance with the Fair Value Measurements and Disclosures topic of FASB ASC, the fair value of a financial instrument is the price that would be received to sell an asset or paid to transfer a liability in an orderly transaction between market participants at the measurement date. Fair value is best determined based upon quoted market prices. However, in many instances, there are no quoted market prices for the Company’s various financial instruments. In cases where quoted market prices are not available, fair values are based on estimates using present value or other valuation techniques. Those techniques are significantly affected by the assumptions used, including the discount rate and estimates of future cash flows. Accordingly, the fair value estimates may not be realized in an immediate settlement of the instrument.
The recent fair value guidance provides a consistent definition of fair value, which focuses on exit price in an orderly transaction (that is, not a forced liquidation or distressed sale) between market participants at the measurement date under current market conditions. If there has been a significant decrease in the volume and level of activity for the asset or liability, a change in valuation technique or the use of multiple valuation techniques may be appropriate. In such instances, determining the price at which willing market participants would transact at the measurement date under current market conditions depends on the facts and circumstances and requires the use of significant judgment. The fair value is a reasonable point within the range that is most representative of fair value under current market conditions.
Fair Value Hierarchy
In accordance with this guidance, the Company groups its financial assets and financial liabilities generally measured at fair value in three levels, based on the markets in which the assets and liabilities are traded and the reliability of the assumptions used to determine fair value.
|
Level 1 –
|
Valuation is based on quoted prices in active markets for identical assets and liabilities.
|
||
|
Level 2 –
|
Valuation is based on observable inputs including quoted prices in active markets for similar assets and liabilities, quoted prices for identical or similar assets and liabilities in less active markets, and model-based valuation techniques for which significant assumptions can be derived primarily from or corroborated by observable data in the market.
|
||
|
Level 3 –
|
Valuation is based on model-based techniques that use one or more significant inputs or assumptions that are unobservable in the market.
|
The following describes the valuation techniques used by the Company to measure certain financial assets and liabilities recorded at fair value on a recurring basis in the financial statements:
Securities available for sale: Securities available for sale are recorded at fair value on a recurring basis. Fair value measurement is based upon quoted market prices, when available (Level 1). If quoted market prices are not available, fair values are measured utilizing independent valuation techniques of identical or similar securities for which significant assumptions are derived primarily from or corroborated by observable market data. Third party vendors compile prices from various sources and may determine the fair value of identical or similar securities by using pricing models that consider observable market data (Level 2). Federal Reserve Bank of Richmond and Federal Home Loan Bank stocks are carried at cost since no ready market exists and there is no quoted market value. The Company is required to own stock in these entities as long as it is a member. Therefore, they have been excluded from the table below.
The following table presents the balances of financial assets and liabilities measured at fair value on a recurring basis as of December 31, 2009 (in thousands):
|
Fair Value Measurements at December 31, 2009 Using
|
||||||||||||||||
|
Balance as of December 31,
|
Quoted Prices in Active Markets for Identical Assets
|
Significant Other Observable Inputs
|
Significant Unobservable Inputs
|
|||||||||||||
|
Description
|
2009
|
Level 1
|
Level 2
|
Level 3
|
||||||||||||
|
Assets:
|
||||||||||||||||
|
Securities available for sale
|
$ | 188,795 | $ | - | $ | 188,795 | $ | - | ||||||||
|
Fair Value Measurements at December 31, 2008 Using
|
||||||||||||||||
|
Balance as of December 31,
|
Quoted Prices in Active Markets for Identical Assets
|
Significant Other Observable Inputs
|
Significant Unobservable Inputs
|
|||||||||||||
|
Description
|
2008
|
Level 1
|
Level 2
|
Level 3
|
||||||||||||
|
Assets:
|
||||||||||||||||
|
Securities available for sale
|
$ | 129,796 | $ | - | $ | 129,796 | $ | - | ||||||||
Certain assets are measured at fair value on a nonrecurring basis in accordance with GAAP. Adjustments to the fair value of these assets usually result from the application of lower-of-cost-or-market accounting or write-downs of individual assets.
The following describes the valuation techniques used by the Company to measure certain assets recorded at fair value on a nonrecurring basis in the financial statements:
Loans held for sale: Loans held for sale are carried at estimated fair value. These loans currently consist of one-to-four family residential loans originated for sale in the secondary market. Fair value is based on the price secondary markets are currently offering for similar loans using observable market data which is not materially different than cost due to the short duration between origination and sale (Level 2). As such, the Company records any fair value adjustments on a nonrecurring basis. No nonrecurring fair value adjustments were recorded on loans held for sale during the year ended December 31, 2009. Gains and losses on the sale of loans are recorded within income from mortgage banking on the Consolidated Statements of Income.
Impaired loans: Loans are designated as impaired when, in the judgment of management based on current information and events, it is probable that all amounts due according to the contractual terms of the loan agreement will not be collected. The measurement of loss associated with impaired loans can be based on either the observable market price of the loan or the fair value of the collateral. Fair value is measured based on the value of the collateral securing the loans. Collateral may be in the form of real estate or business assets including equipment, inventory, and accounts receivable. The vast majority of the collateral is real estate. The value of real estate collateral is determined utilizing an income or market valuation approach based on an appraisal conducted by an independent, licensed appraiser outside of the Company using observable market data (Level 2). However, if the collateral is a house or building in the process of construction or if an appraisal of the real estate property is over two years old, then the fair value is considered Level 3. The value of business equipment is based upon an outside appraisal if deemed significant, or the net book value on the applicable business’s financial statements if not considered significant using observable market data. Likewise, values for inventory and accounts receivables collateral are based on financial statement balances or aging reports (Level 3). Impaired loans allocated to the Allowance for Loan Losses are measured at fair value on a nonrecurring basis. Any fair value adjustments are recorded in the period incurred as provision for loan losses on the Consolidated Statements of Income.
Other real estate owned: Certain assets such as other real estate owned (“OREO”) are measured at fair value less cost to sell. We believe that the fair value component in our valuation of OREO follows the provisions of accounting standards.
The following table summarizes the Company’s assets that were measured at fair value on a nonrecurring basis during the period (in thousands):
|
Fair Value Measurements at December 31, 2009 Using
|
||||||||||||||||
|
Balance as of December 31,
|
Quoted Prices in Active Markets for Identical Assets
|
Significant Other Observable Inputs
|
Significant Unobservable Inputs
|
|||||||||||||
|
Description
|
2009
|
Level 1
|
Level 2
|
Level 3
|
||||||||||||
|
Assets
|
||||||||||||||||
|
Loans held for sale
|
$ | 2,490 | $ | - | $ | 2,490 | $ | - | ||||||||
|
Impaired loans, net of valuation allowance
|
488 | - | 488 | - | ||||||||||||
|
Other real estate owned
|
3,414 | - | 3,414 | - | ||||||||||||
|
Fair Value Measurements at December 31, 2008 Using
|
||||||||||||||||
|
Balance as of December 31,
|
Quoted Prices in Active Markets for Identical Assets
|
Significant Other Observable Inputs
|
Significant Unobservable Inputs
|
|||||||||||||
|
Description
|
2008
|
Level 1
|
Level 2
|
Level 3
|
||||||||||||
|
Assets
|
||||||||||||||||
|
Loans held for sale
|
$ | 1,764 | $ | - | $ | 1,764 | $ | - | ||||||||
|
Impaired loans, net of valuation allowance
|
1,381 | - | 600 | 781 | ||||||||||||
|
Other real estate owned
|
4,311 | - | 4,311 | - | ||||||||||||
The estimated fair values, and related carrying or notional amounts, of the Company’s financial instruments are as follows:
|
December 31, 2009
|
December 31, 2008
|
|||||||||||||||
|
(in thousands)
|
Carrying
|
Estimated
Fair
|
Carrying
|
Estimated
Fair
|
||||||||||||
|
Amount
|
Value
|
Amount
|
Value
|
|||||||||||||
|
Financial assets:
|
||||||||||||||||
|
Cash and due from banks
|
$ | 23,943 | $ | 23,943 | $ | 24,098 | $ | 24,098 | ||||||||
|
Securities available for sale *
|
188,795 | 188,795 | 129,796 | 129,796 | ||||||||||||
|
Securities held to maturity
|
6,529 | 6,673 | 7,121 | 7,391 | ||||||||||||
|
Loans held for sale
|
2,490 | 2,490 | 1,764 | 1,764 | ||||||||||||
|
Loans, net of allowance
|
519,825 | 528,631 | 563,286 | 575,970 | ||||||||||||
|
Accrued interest receivable
|
3,268 | 3,268 | 3,110 | 3,110 | ||||||||||||
|
Financial liabilities:
|
||||||||||||||||
|
Deposits
|
$ | 604,273 | $ | 607,015 | $ | 589,138 | $ | 591,159 | ||||||||
|
Repurchase agreements
|
65,929 | 65,929 | 51,741 | 51,741 | ||||||||||||
|
Other borrowings
|
8,638 | 8,620 | 21,637 | 21,630 | ||||||||||||
|
Trust preferred capital notes
|
20,619 | 20,640 | 20,619 | 18,258 | ||||||||||||
|
Accrued interest payable
|
899 | 899 | 1,272 | 1,272 | ||||||||||||
|
* - Excludes restricted stock
|
||||||||||||||||
The following methods and assumptions were used by the Company in estimating fair value disclosures for financial instruments:
Cash and cash equivalents. The carrying amount is a reasonable estimate of fair value.
Securities. Fair values are based on quoted market prices or dealer quotes.
Loans held for sale. The carrying amount is a reasonable estimate of fair value.
Loans. For variable-rate loans that reprice frequently and with no significant change in credit risk, fair values are based on carrying values. Fair values for fixed-rate loans are estimated based upon discounted cash flow analyses, using interest rates currently being offered for loans with similar terms to borrowers of similar credit quality. Fair values for nonperforming loans are estimated using discounted cash flow analyses or underlying collateral values, where applicable.
Accrued interest receivable. The carrying amount is a reasonable estimate of fair value.
Deposits. The fair value of demand deposits, savings deposits, and money market deposits equals the carrying value. The fair value of fixed-rate certificates of deposit is estimated by discounting the future cash flows using the current rates at which similar deposit instruments would be offered to depositors for the same remaining maturities.
Repurchase agreements. The carrying amount is a reasonable estimate of fair value.
Other borrowings. The fair values of long-term borrowings are estimated using discounted cash flow analyses based on the interest rates for similar types of borrowing arrangements.
Trust preferred capital notes. Fair value is calculated by discounting the future cash flows using the estimated current interest rates at which similar securities would be issued.
Accrued interest payable. The carrying amount is a reasonable estimate of fair value.
Off-balance sheet instruments. The fair value of letters of credit is based on fees currently charged for similar agreements or on the estimated cost to terminate them or otherwise settle the obligations with the counterparties at the reporting date. At December 31, 2009 and 2008, the fair value of off balance sheet instruments was deemed immaterial, and therefore was not included in the table above. The various off-balance sheet instruments were discussed in Note 16.
The Company assumes interest rate risk (the risk that interest rates will change) in its normal operations. As a result, the fair values of the Company’s financial instruments will change when interest rates change and that change may be either favorable or unfavorable to the Company.
Note 20 – Dividend Restrictions and Regulatory Capital
The approval of the Comptroller of the Currency is required if the total of all dividends declared by a national bank in any calendar year exceeds the bank's net income, as defined, for that year combined with its retained net income for the preceding two calendar years. Under this formula, the Bank can distribute as dividends to Company, without the approval of the Comptroller of the Currency, $3,540,000 as of December 31, 2009.
The Company (on a consolidated basis) and the Bank are subject to various regulatory capital requirements administered by the federal banking agencies. Failure to meet minimum capital requirements can initiate certain mandatory and possibly additional discretionary actions by regulators that, if undertaken, could have a direct material effect on the Company’s and the Bank’s financial statements. Under capital adequacy guidelines and the regulatory framework for prompt corrective action, the Company and the Bank must meet specific capital guidelines that involve quantitative measures of their assets, liabilities, and certain off-balance sheet items as calculated under regulatory accounting practices. The capital amounts and classification are subject to qualitative judgments by the regulators concerning components, risk weighting, and other factors. Prompt corrective action provisions are not applicable to bank holding companies.
Under the guidelines, total capital is defined as core (“Tier I”) capital and supplementary (“Tier II”) capital. The Company’s Tier I capital consists primarily of shareholders' equity and trust preferred capital notes less intangibles, while Tier II capital also includes the allowance for loan losses subject to certain limits. The definition of assets has been modified to include items on and off the balance sheet, with each item being assigned a "risk-weight" for the determination of the ratio of capital to risk-adjusted assets. Management believes, as of December 31, 2009 and 2008, that the Company met the requirements to be considered “well capitalized.” As of September 30, 2009, the most recent notification from the Federal Deposit Insurance Corporation categorized the Company as well capitalized under the regulatory framework for prompt corrective action.
The following table provides summary information regarding regulatory capital:
|
To Be Well
|
||||||||||||||||||
|
Minimum
|
Capitalized Under
|
|||||||||||||||||
|
Capital
|
Prompt Corrective
|
|||||||||||||||||
|
(in thousands)
|
Actual
|
Requirement
|
Action Provisions
|
|||||||||||||||
|
Amount
|
Ratio
|
Amount
|
Ratio
|
Amount
|
Ratio
|
|||||||||||||
|
December 31, 2009
|
||||||||||||||||||
|
Total Capital
|
||||||||||||||||||
|
Company
|
$ | 108,325 | 18.82 | % | $ | 46,053 |
>8.0%
|
|||||||||||
|
Bank
|
97,860 | 17.00 | 46,051 |
>8.0
|
$ | 57,564 |
>10.0%
|
|||||||||||
|
Tier I Capital
|
||||||||||||||||||
|
Company
|
101,114 | 17.56 | 23,026 |
>4.0
|
||||||||||||||
|
Bank
|
91,572 | 15.91 | 23,025 |
>4.0
|
34,538 |
>6.0
|
||||||||||||
|
Leverage Capital
|
||||||||||||||||||
|
Company
|
101,114 | 12.81 | 31,584 |
>4.0
|
||||||||||||||
|
Bank
|
91,572 | 11.61 | 31,536 |
>4.0
|
39,420 |
>5.0
|
||||||||||||
|
December 31, 2008
|
||||||||||||||||||
|
Total Capital
|
||||||||||||||||||
|
Company
|
$ | 106,573 | 17.92 | % | $ | 47,576 |
>8.0%
|
|||||||||||
|
Bank
|
91,686 | 15.42 | 47,565 |
>8.0
|
$ | 59,457 |
>10.0%
|
|||||||||||
|
Tier I Capital
|
||||||||||||||||||
|
Company
|
99,124 | 16.67 | 23,788 |
>4.0
|
||||||||||||||
|
Bank
|
85,144 | 14.32 | 23,783 |
>4.0
|
35,674 |
>6.0
|
||||||||||||
|
Leverage Capital
|
||||||||||||||||||
|
Company
|
99,124 | 13.04 | 30,408 |
>4.0
|
||||||||||||||
|
Bank
|
85,144 | 11.23 | 30,333 |
>4.0
|
37,916 |
>5.0
|
||||||||||||
Note 21 – Segment and Related Information
The Company has two reportable segments, community banking and trust and investment services.
Community banking involves making loans to and generating deposits from individuals and businesses. All assets and liabilities of the Company are allocated to community banking. Investment income from securities is also allocated to the community banking segment. Loan fee income, service charges from deposit accounts, and non-deposit fees such as automated teller machine fees and insurance commissions generate additional income for community banking.
Trust and investment services include estate planning, trust account administration, investment management, and retail brokerage. Investment management services include purchasing equity, fixed income, and mutual fund investments for customer accounts. The trust and investment services division receives fees for investment and administrative services.
Amounts shown in the “Other” column includes activities of American National Bankshares Inc. which are primarily debt service on trust preferred securities and corporate items. Intersegment eliminations primarily consist of American National Bankshares Inc.’s interest income on deposits held by its banking subsidiary.
The accounting policies of the segments are the same as those described in the summary of significant accounting policies.
Segment information as of and for the years ended December 31, 2009, 2008, and 2007, is shown in the following table:
| 2009 | ||||||||||||||||||||
|
(in thousands)
|
Trust and
|
|||||||||||||||||||
|
Community
|
Investment
|
Intersegment
|
||||||||||||||||||
|
Banking
|
Services
|
Other
|
Eliminations
|
Total
|
||||||||||||||||
|
Interest income
|
$ | 38,061 | $ | - | $ | 260 | $ | (260 | ) | $ | 38,061 | |||||||||
|
Interest expense
|
9,676 | - | 1,373 | (260 | ) | 10,789 | ||||||||||||||
|
Noninterest income
|
3,614 | 3,338 | 91 | - | 7,043 | |||||||||||||||
|
Operating income before income taxes
|
8,504 | 2,179 | (1,348 | ) | - | 9,335 | ||||||||||||||
|
Depreciation and amortization
|
1,560 | 16 | 2 | - | 1,578 | |||||||||||||||
|
Total assets
|
808,331 | - | 642 | - | 808,973 | |||||||||||||||
|
Capital expenditures
|
3,336 | 26 | - | - | 3,362 | |||||||||||||||
| 2008 | ||||||||||||||||||||
|
Trust and
|
||||||||||||||||||||
|
Community
|
Investment
|
Intersegment
|
||||||||||||||||||
|
Banking
|
Services
|
Other
|
Eliminations
|
Total
|
||||||||||||||||
|
Interest income
|
$ | 42,836 | $ | - | $ | 129 | $ | (93 | ) | $ | 42,872 | |||||||||
|
Interest expense
|
14,559 | - | 1,373 | (93 | ) | 15,839 | ||||||||||||||
|
Noninterest income
|
3,957 | 3,899 | 57 | - | 7,913 | |||||||||||||||
|
Operating income before income taxes
|
10,172 | 2,570 | (1,540 | ) | - | 11,202 | ||||||||||||||
|
Depreciation and amortization
|
1,448 | 13 | 2 | - | 1,463 | |||||||||||||||
|
Total assets
|
788,435 | - | 749 | - | 789,184 | |||||||||||||||
|
Capital expenditures
|
5,423 | 25 | - | - | 5,448 | |||||||||||||||
| 2007 | ||||||||||||||||||||
|
Trust and
|
||||||||||||||||||||
|
Community
|
Investment
|
Intersegment
|
||||||||||||||||||
|
Banking
|
Services
|
Other
|
Eliminations
|
Total
|
||||||||||||||||
|
Interest income
|
$ | 48,597 | $ | - | $ | - | $ | - | $ | 48,597 | ||||||||||
|
Interest expense
|
17,997 | - | 1,373 | - | 19,370 | |||||||||||||||
|
Noninterest income
|
4,623 | 4,128 | 71 | - | 8,822 | |||||||||||||||
|
Operating income before income taxes
|
15,115 | 2,734 | (1,529 | ) | - | 16,320 | ||||||||||||||
|
Depreciation and amortization
|
1,541 | 12 | 2 | - | 1,555 | |||||||||||||||
|
Total assets
|
771,518 | - | 770 | - | 772,288 | |||||||||||||||
|
Capital expenditures
|
2,087 | 18 | - | - | 2,105 | |||||||||||||||
Note 22 – Parent Company Financial Information
Condensed Parent Company financial information is as follows (in thousands):
|
December 31,
|
||||||||
|
Condensed Balance Sheets
|
2009
|
2008 | ||||||
|
Cash
|
$ | 9,094 | $ | 13,356 | ||||
|
Investment in subsidiaries
|
116,847 | 108,320 | ||||||
|
Other assets
|
1,128 | 1,311 | ||||||
|
Total Assets
|
$ | 127,069 | $ | 122,987 | ||||
|
Trust preferred capital notes
|
$ | 20,619 | $ | 20,619 | ||||
|
Other liabilities
|
61 | 68 | ||||||
|
Shareholders’ equity
|
106,389 | 102,300 | ||||||
|
Total Liabilities and Shareholders’ Equity
|
$ | 127,069 | $ | 122,987 | ||||
|
Years Ended December 31,
|
||||||||||||
|
Condensed Statements of Income
|
2009
|
2008
|
2007
|
|||||||||
|
Dividends from subsidiary
|
$ | 1,650 | $ | 12,000 | $ | 12,000 | ||||||
|
Other income
|
351 | 150 | 86 | |||||||||
|
Expenses
|
1,699 | 1,689 | 1,615 | |||||||||
|
Income taxes (benefit)
|
(458 | ) | (523 | ) | (520 | ) | ||||||
|
Income before equity in undistributed
|
||||||||||||
|
earnings of subsidiary
|
760 | 10,984 | 10,991 | |||||||||
|
Equity (deficit) in undistributed earnings of subsidiary
|
6,050 | (2,963 | ) | 453 | ||||||||
|
Net Income
|
$ | 6,810 | $ | 8,021 | $ | 11,444 | ||||||
|
Years Ended December 31,
|
||||||||||||
|
Condensed Statements of Cash Flows
|
2009 | 2008 | 2007 | |||||||||
|
Cash provided by dividends received
|
||||||||||||
|
from subsidiary
|
$ | 1,650 | $ | 12,000 | $ | 12,000 | ||||||
|
Cash used for payment of dividends
|
(5,612 | ) | (5,606 | ) | (5,587 | ) | ||||||
|
Cash used for repurchase of stock
|
(121 | ) | (904 | ) | (1,359 | ) | ||||||
|
Proceeds from exercise of options and stock
|
||||||||||||
|
compensation
|
536 | 219 | 295 | |||||||||
|
Other
|
(715 | ) | (972 | ) | (1,182 | ) | ||||||
|
Net increase (decrease) in cash
|
$ | ( 4,262 | ) | $ | 4,737 | $ | 4,167 | |||||
Note 23 – Concentrations of Credit Risk
Substantially all the Company’s loans are made within its market area, which includes Southern and Central Virginia and the northern portion of Central North Carolina. The ultimate collectability of the Company’s loan portfolio and the ability to realize the value of any underlying collateral, if necessary, are impacted by the economic conditions of the market area.
Loans secured by real estate were $434,754,000, or 82% of the loan portfolio, at December 31, 2009, and $464,171,000, or 81% of the loan portfolio, at December 31, 2008. Loans secured by commercial real estate represented the largest portion of loans at $208,066,000 at December 31, 2009, and $207,160,000 at December 31, 2008, 39% and 36%, respectively of total loans. While there were no concentrations of loans to any individual, group of individuals, business, or industry that exceeded 10% of total loans at December 31, 2009 or 2008, loans to lessors of nonresidential buildings represented 13.9% of total loans at December 31, 2009 and 13.7% at December 31, 2008; the lessees and lessors are engaged in a variety of industries.
Note 24 – Supplemental Cash Flow Information
|
(in thousands)
|
For the Years ended December 31,
|
|||||||||||
|
2009
|
2008
|
2007
|
||||||||||
|
Supplemental Schedule of Cash and Cash Equivalents:
|
||||||||||||
|
Cash and due from banks
|
$ | 13,250 | $ | 14,986 | $ | 18,155 | ||||||
|
Interest-bearing deposits in other banks
|
10,693 | 9,112 | 149 | |||||||||
| $ | 23,943 | $ | 24,098 | $ | 18,304 | |||||||
|
Supplemental Disclosure of Cash Flow Information:
|
||||||||||||
|
Cash paid for:
|
||||||||||||
|
Interest on deposits and borrowed funds
|
$ | 11,162 | $ | 16,289 | $ | 19,332 | ||||||
|
Income taxes
|
2,835 | 2,936 | 3,790 | |||||||||
|
Noncash investing and financing activities:
|
||||||||||||
|
Transfer of loans to other real estate owned
|
1,692 | 4,060 | 498 | |||||||||
|
Unrealized gain (loss) on securities available for sale
|
1,039 | 1,474 | 2,723 | |||||||||
|
Change in unfunded pension liability
|
(2,770 | ) | 2,898 | 66 | ||||||||
Note 25 – Subsequent Events
In preparing these financial statements, the Company has evaluated events and transactions for potential recognition or disclosure through the date the financial statements were issued.
ITEM 15 – EXHIBITS AND FINANCIAL STATEMENT SCHEDULES
|
(a) (1)
|
Financial Statements. See Item 8 for reference. |
| (a) (2) | Financial Statement Schedules. All applicable financial statement schedules required under Regulation S-X have been included in the Notes to the Consolidated Financial Statements. |
|
(a) (3)
|
Exhibits. The exhibits required by Item 601 of Regulation S-K are listed below.
|
|
EXHIBIT INDEX
|
||
|
Exhibit #
|
Location
|
|
|
3.1
|
Amended and Restated Articles of Incorporation
Dated August 20, 1997
|
Exhibit 4.1 on Form S-3
filed August 20, 1997
|
|
3.2
|
Amended Bylaws dated November 18, 2008
|
Exhibit 3.2 on Form 8-K
filed November 19, 2008
|
|
10.1
|
Deferred Compensation Agreement between American National Bank
and Trust Company, and Charles H. Majors dated December 31, 2008
|
Exhibit 10.1 on Form 10-K filed March 16, 2009
|
|
10.2
|
Executive Severance Agreement between American National Bankshares Inc., American National Bank and Trust Company, and Charles H. Majors dated December 31, 2008
|
Exhibit 10.2 on Form 10-K filed March 16, 2009
|
|
10.3
|
Executive Severance Agreement between American National Bankshares Inc., American National Bank and Trust Company, and Jeffrey V. Haley dated December 31, 2008
|
Exhibit 10.3 on Form 10-K filed March 16, 2009
|
|
10.4
|
Executive Severance Agreement between American National Bankshares Inc., American National Bank and Trust Company, and R. Helm Dobbins dated December 31, 2008
|
Exhibit 10.4 on Form 10-K filed March 16, 2009
|
|
10.5
|
Executive Severance Agreement between American National Bankshares Inc., American National Bank and Trust Company, and Dabney T. P. Gilliam, Jr. dated December 31, 2008
|
Exhibit 10.5 on Form 10-K filed March 16, 2009
|
|
10.6
|
Executive Severance Agreement between American National Bankshares Inc., American National Bank and Trust Company, and S. Cabell Dudley, Jr. dated December 31, 2008
|
Exhibit 10.6 on Form 10-K filed March 16, 2009
|
|
10.7
|
Executive Severance Agreement between American National Bankshares Inc., American National Bank and Trust Company, and William W. Traynham dated April 21, 2009
|
Exhibit 10.1 on Form 10-Q filed August 7, 2009
|
|
10.8
|
American National Bankshares Inc. 2008 Stock Incentive Plan
|
Exhibit 99.0 to Form S-8
filed on May 30, 2008
|
|
11.1
|
Refer to EPS calculation in the Notes to Financial Statements
|
Filed herewith
|
|
21.1
|
Subsidiaries of the registrant
|
Filed herewith
|
|
31.1
|
Section 302 Certification of Charles H. Majors, President and CEO
|
Filed herewith
|
|
31.2
|
Section 302 Certification of William W. Traynham, Senior Vice President and Chief Financial Officer
|
Filed herewith
|
|
32.1
|
Section 906 Certification of Charles H. Majors, President and CEO
|
Filed herewith
|
| 32.2 | Section 906 Certification of William W. Traynham, Senior Vice President and Chief Financial Officer | Filed herewith |
SIGNATURES
Pursuant to the requirements of Section 13 or 15(d) of the Securities Exchange Act of 1934, the registrant has duly caused this report to be signed on its behalf by the undersigned, thereunto duly authorized.
|
March 12, 2010
|
AMERICAN NATIONAL BANKSHARES INC.
|
By: /s/ Charles H. Majors
President and
Chief Executive Officer
Pursuant to the requirements of the Securities Exchange Act of 1934, this report has been signed below by the following persons on behalf of the registrant and in the capacities indicated on March 12, 2010.
|
/s/ Charles H. Majors
|
President and
|
|
|
Charles H. Majors
|
Chief Executive Officer
(principal executive officer)
|
|
|
/s/ Fred A. Blair
|
Director
|
|
|
Fred A. Blair
|
||
|
/s/ Frank C. Crist, Jr.
|
Director
|
|
|
Frank C. Crist, Jr., D.D.S.
|
||
|
/s/ Ben J. Davenport, Jr.
|
Director
|
|
|
Ben J. Davenport, Jr.
|
||
|
/s/ H. Dan Davis
|
Director
|
|
|
H. Dan Davis
|
||
|
/s/ Michael P. Haley
|
Director
|
|
|
Michael P. Haley
|
||
|
/s/ Charles S. Harris
|
Director
|
|
|
Charles S. Harris
|
||
|
/s/ Lester A. Hudson, Jr.
|
Director
|
|
|
Lester A. Hudson, Jr., Ph.D.
|
||
|
/s/ E. Budge Kent, Jr.
|
Director
|
|
|
E. Budge Kent, Jr.
|
||
|
/s/ Fred B. Leggett, Jr.
|
Director
|
|
|
Fred B. Leggett, Jr.
|
||
|
/s/ Franklin W. Maddux
|
Director
|
|
|
Franklin W. Maddux, M.D.
|
||
|
/s/ Martha W. Medley
|
Director
|
|
|
Martha W. Medley
|
||
|
/s/ Claude B. Owen, Jr.
|
Director
|
|
|
Claude B. Owen, Jr.
|
||
|
/s/ William W. Traynham
|
Senior Vice President and
|
|
|
William W. Traynham
|
Chief Financial Officer
(principal accounting officer)
|
74