Attached files
| file | filename |
|---|---|
| EX-21 - SUBSIDIARIES - PRIMEDIA INC | dex21.htm |
| EX-23 - DELOITTE & TOUCHE LLP CONSENT - PRIMEDIA INC | dex23.htm |
| EX-32.1 - CEO 906 CERTIFICATIONS - PRIMEDIA INC | dex321.htm |
| EX-32.2 - CFO 906 CERTIFICATIONS - PRIMEDIA INC | dex322.htm |
| EX-31.2 - CFO 302 CERTIFICATIONS - PRIMEDIA INC | dex312.htm |
| EX-31.1 - CEO 302 CERTIFICATIONS - PRIMEDIA INC | dex311.htm |
Table of Contents
Index to Financial Statements
UNITED STATES
SECURITIES AND EXCHANGE COMMISSION
Washington, D.C. 20549
FORM 10-K
| x | ANNUAL REPORT PURSUANT TO SECTION 13 OR 15(d) OF THE SECURITIES EXCHANGE ACT OF 1934 |
For the Fiscal Year Ended: December 31, 2009
OR
| ¨ | TRANSITION REPORT PURSUANT TO SECTION 13 OR 15(d) OF THE SECURITIES EXCHANGE ACT OF 1934 |
Commission File number: 1-11106

PRIMEDIA Inc.
(Exact name of registrant as specified in its charter)
| Delaware | 13-3647573 | |
| (State or other jurisdiction of incorporation or organization) |
(I.R.S. Employer Identification No.) | |
| 3585 Engineering Drive, Norcross, Georgia | 30092 | |
| (Address of principal executive offices) | (Zip Code) |
(678) 421-3000
(Registrant’s telephone number, including area code)
Securities registered pursuant to Section 12(b) of the Act:
| Title of Each Class |
Name of Each Exchange on Which Registered | |
| Common Stock, par value $0.01 per share | New York Stock Exchange |
Securities registered pursuant to Section 12(g) of the Act:
None
Indicate by check mark if the registrant is a well-known seasoned issuer, as defined in Rule 405 of the Securities Act. Yes ¨ No x
Indicate by check mark if the registrant is not required to file reports pursuant to Section 13 or Section 15(d) of the Act. Yes ¨ No x
Indicate by check mark whether the registrant (1) has filed all reports required to be filed by Section 13 or 15(d) of the Securities Exchange Act of 1934 during the preceding 12 months (or for such shorter period that the registrant was required to file such reports), and (2) has been subject to such filing requirements for the past 90 days. Yes x No ¨
Indicate by check mark whether the registrant has submitted electronically and posted on its corporate Web site, if any, every Interactive Data File required to be submitted and posted pursuant to Rule 405 of Regulation S-T (§232.405 of this chapter) during the preceding 12 months (or for such shorter period that the registrant was required to submit and post such files). Yes ¨ No ¨
Indicate by check mark if disclosure of delinquent filers pursuant to Item 405 of Regulation S-K is not contained herein, and will not be contained, to the best of registrant’s knowledge, in definitive proxy or information statements incorporated by reference in Part III of this Form 10-K or any amendment to this Form 10-K. x
Indicate by check mark whether the registrant is a large accelerated filer, an accelerated filer, a non-accelerated filer or a smaller reporting company (as defined in Exchange Act Rule 12b-2).
Large accelerated filer ¨ Accelerated filer ¨ Non-accelerated filer ¨ Smaller reporting company x
Indicate by check mark whether the registrant is a shell company Yes ¨ No x
The aggregate market value of the voting common equity of PRIMEDIA Inc. (“PRIMEDIA”) which is held by non-affiliates of PRIMEDIA, computed by reference to the closing price as of the last business day of the registrant’s most recently completed second fiscal quarter, June 30, 2009, was approximately $34.9 million. The registrant has no non-voting common stock.
As of March 1, 2010, 44,146,959 shares of PRIMEDIA’s Common Stock were outstanding.
The following documents are incorporated into this Form 10-K by reference: Part III of this Report on Form 10-K incorporates information by reference from the registrant’s Proxy Statement for its 2010 Annual Meeting of Stockholders to be held on May 19, 2010. The definitive Proxy Statement will be filed within 120 days of the end of the fiscal year ended December 31, 2009.
Table of Contents
Index to Financial Statements
Annual Report on Form 10-K
December 31, 2009
Table of Contents
We include cross references to captions elsewhere in this Annual Report on Form 10-K, which we refer to as this “Report,” where you can find related additional information. The following table of contents tells you where to find these captions.
| Page | ||||
| 1 | ||||
| PART I | ||||
| Item 1. |
1 | |||
| Item 1A. |
7 | |||
| Item 1B. |
12 | |||
| Item 2. |
12 | |||
| Item 3. |
12 | |||
| Item 4. |
12 | |||
| PART II | ||||
| Item 5. |
14 | |||
| Item 6. |
15 | |||
| Item 7. |
Management’s Discussion and Analysis of Financial Condition and Results of Operations |
17 | ||
| Item 7A. |
44 | |||
| Item 8. |
45 | |||
| Item 9. |
Changes in and Disagreements with Accountants on Accounting and Financial Disclosure |
92 | ||
| Item 9A. |
92 | |||
| Item 9B. |
96 | |||
| PART III | ||||
| Item 10. |
96 | |||
| Item 11. |
96 | |||
| Item 12. |
Security Ownership of Certain Beneficial Owners and Management and Related Stockholder Matters |
96 | ||
| Item 13. |
Certain Relationships and Related Transactions and Director Independence |
96 | ||
| Item 14. |
96 | |||
| PART IV | ||||
| Item 15. |
97 | |||
| 98 | ||||
| S-1 | ||||
| E-1 | ||||
i
Table of Contents
Index to Financial Statements
IMPORTANT INFORMATION ABOUT THIS REPORT
In this Report, the words “PRIMEDIA,” “Company,” “we,” “us” and “our” mean PRIMEDIA Inc., including its subsidiaries, unless the context otherwise specifies or requires.
This document contains “forward-looking statements”—that is, statements related to future, not past, events. In this context, forward-looking statements often address our expected future business and financial performance and often contain words such as “expects,” “anticipates,” “intends,” “plans,” “believes,” “seeks” or “will.” Forward-looking statements by their nature address matters that are, to different degrees, uncertain. For us, particular uncertainties which could adversely or positively affect our future results include, among others: general economic trends and conditions and, in particular, trends and conditions in the apartment and other rental property and new home sales sectors of the residential real estate industry; changes in technology and competition; implementation and results of our ongoing strategic initiatives; demand by customers for our services; expenses or adverse results of litigation; changes in U.S. federal tax laws; and numerous other matters of national, regional and local market scale, including those of a political, economic, business, competitive and regulatory nature. These uncertainties may cause our actual future results to be materially different than those expressed in our forward-looking statements. We do not undertake to update our forward-looking statements.
| ITEM 1. | BUSINESS |
General
We are a targeted media company that provides consumers with tools and information they need to find a place to live. Our consumer directories are targeted primarily for the apartment and other rental property sectors of the residential real estate industry and are provided free to consumers through online, print and mobile platforms. We derive advertising revenue by providing our advertiser clients – property management companies, private owner/landlords, new home builders and real estate professionals – with products and services that generate measurable results in the form of cost-effective, quality leads.
Our principal digital assets include ApartmentGuide.com, Rentals.com, RentalHouses.com, NewHomeGuide.com and AmericanHomeGuides.com. According to comScore Media Metrix, unique visitors to our websites reached 3.3 million in January 2010, compared with 3.1 million in January 2009. The total number of leads we produce for our advertisers has grown year over year, and leads derived from our online and mobile services now represent more than 75% of the total leads we deliver to our advertiser clients.
We produce printed directories for 75 markets and distribute them through display rack programs, many of which are on an exclusive basis, with large national and regional retail chains, including grocery, drug, convenience, video, fitness and mass merchandise retailers. In 2009, we distributed approximately 14.9 million printed directories to approximately 17,000 advertiser client locations and 28,000 retail and other locations.
Over the past several years, we have aggressively divested assets no longer part of our core businesses. Our continuing operations are currently comprised solely of what we have described historically as our Consumer Guides segment.
Apartments
Our Apartments division comprised approximately 91.7% of our advertising revenue for 2009 and 93.1% of our advertising revenue for fourth quarter 2009.
Apartment Guide
Thirty-five years old, Apartment Guide, our flagship brand and largest business, delivers apartment and apartment community rental information to consumers through a combination of Internet, print and mobile
1
Table of Contents
Index to Financial Statements
products and services. ApartmentGuide.com and RentRentar.com, our Spanish-language edition of ApartmentGuide.com, offer many premium features not available through our printed directories, including flexible search functionality, detailed photos and floorplans, virtual tours, as well as detailed information on metro areas and neighborhoods. Our ApartmentGuide.com mobile platform continues to expand through launches of iPhone and Android applications, which together have generated over 541,000 downloads through January 2010.
We currently produce 77 Apartment Guide printed directories in 75 markets, averaging over 17,000 apartment community listings in print – over 40% more listings than our nearest print competitor within these markets – with a 2009 distribution of approximately 12.0 million copies. Most of our Apartment Guide printed directories are published monthly, though we expect to move to bi-monthly publishing schedules for some of our markets.
We continued to reinforce our commitment to industry-leading innovation in 2009 with the launch of My.ApartmentGuide.com. Feedback from our advertiser clients has confirmed our view that My.ApartmentGuide.com is a valuable, unique ROI-based management tool that enables our clients to measure the cost-effectiveness and other performance metrics of the rental search and lead-generation process. We also released version 2.0 of our iPhone application and launched our initial Android application in 2009.
Apartment Guide advertising revenue is generated primarily from property management companies that manage larger apartment communities (generally in excess of 50 units) that experience ongoing vacancies. A majority of our 2009 revenue was derived from contracts at least 12 months in duration, and a majority of these contracts were renewed when they expired. Most of our property management company clients purchase integrated media packages that include online, mobile and print advertising. However, as we continue to pursue enhancements to our product portfolio and market segment expansion to grow our customer count, we are providing more flexibility to clients, based on specific markets and market segments, to purchase more customized mixes of products, product features and services on a stand-alone or package basis.
Apartment Guide’s national competitors include Rent.com (owned by eBay), Apartments.com (owned by Classified Media Ventures), For Rent (published by Dominion Enterprises), Apartment Finder (published by Network Communications Inc.) and, to a lesser extent, Move.com (owned by Move, Inc.) and craigslist.org (owned by craigslist, Inc.).
Rentals.com
Rentals.com is a comprehensive real estate rental site with one of the largest collections of single-unit rental property listings on the Internet. The Rentals.com Network of Sites, which includes Rentals.com and RentalHouses.com, averaging more than 33,000 listings, including approximately 28,000 distribution partner listings, of single-family homes, townhomes, condos and smaller apartment communities, as well as select inventory of apartments from ApartmentGuide.com. Our advertiser clients use Rentals.com and RentalHouses.com to list their rental vacancies, including through the self-provisioning feature of the website we call the “Ad Store,” and peruse the expert advice and tips on managing their rental properties offered on our websites. A majority of our customers are derived from the Ad Store, while a majority of our listings are derived from property management companies.
Advertising revenue is generated primarily from private owner/landlords, investors and property managers that own or manage single-unit rental properties or smaller apartment communities (generally less than 50 units) that experience vacancies intermittently. Listings on the Rentals.com and RentalHouses.com Network of Sites are generally purchased on a monthly basis, though longer-term packages are available for property management company clients. In some of its markets, advertisers purchase basic and premium listings. In all other markets, basic listings are provided free of charge, with premium upgrades available for charges that vary by category and market.
2
Table of Contents
Index to Financial Statements
Competitors of Rentals.com and RentalHouses.com include craigslist.org (owned by craigslist, Inc.), HomeRentals.net (owned by RealEIS, LLC), RentalHomesPlus.com (owned by Classified Ventures LLC), Move.com (owned by Move, Inc.) and, to a lesser extent, traditional newspapers.
New Homes
Our New Homes division, comprising approximately 8.3% of our advertising revenue for 2009 and 6.9% of our advertising revenue for fourth quarter 2009, provides display and classified advertising for new home builders to showcase product and inventory on a national and local basis through a network of home-related websites, including NewHomeGuide.com, AmericanHomeGuides.com, NewHomeDirectory.com, FloridaGuide.com, and many others specific to states and metropolitan areas with significant home building activity. In addition, as of December 31, 2009, New Homes produced 21 printed directories, averaging over 2,100 new home community listings in print, with a combined 2009 distribution of approximately 3.0 million copies. New Homes printed directories generally are published bi-monthly.
New Homes advertising revenue is generated primarily from new home builders and advertising agencies representing new home builders. Most of our clients purchase integrated media packages that include online, mobile and print advertising. However, our products and services are offered nationwide on a stand-alone or package basis.
Our New Homes division competes primarily with national competitors such as Move.com (owned by Move, Inc.), New Home Finder (published by Network Communications, Inc.), Housing Guide of America (owned by a consortium of local and regional magazine publishers), newhomesource.com (owned by Builder Homesite, Inc.) and the iNest real estate brokerage (owned by Lending Tree, LLC).
Distribution
In 2009, our distribution function, DistribuTech, distributed free publications, including PRIMEDIA’s directories and over 1,800 third-party titles, flyers and special piece advertising materials, to more than 28,000 retail locations and 17,000 PRIMEDIA advertiser client locations in 39 states and Washington, D.C. DistribuTech maintains display rack programs, many of which are on an exclusive basis, which we refer to as retail display allowances, or RDAs, with several large national and regional retail chains. The free directories are typically displayed in free-standing, multi-pocket racks located in high-visibility, high-traffic locations at the entrance or exit of these locations.
The primary function of DistribuTech is to ensure priority placement for PRIMEDIA’s directories through RDAs and to reduce our overall distribution costs through revenue from third-party customers who pay DistribuTech for distribution services. Historically, we have paid substantial premiums for the exclusive nature of many of our RDAs, which has contributed to relatively high fixed costs within this function. In addition, over the past three years, we have experienced substantial declines in revenue from third-party DistribuTech customers that have scaled back or ceased operations or are providing an Internet-only product.
Beginning in 2008, we undertook strategic initiatives to significantly reduce the cost structure of our distribution function, including the relatively high costs of RDAs. During 2009, we implemented a plan to further reduce our ongoing distribution costs arising from RDAs that were underperforming, and as a result, our distribution costs decreased from $85.2 million in 2008 to $60.9 million in 2009. We intend to continue aggressively reducing our distribution cost structure.
Our overall distribution strategy is to reduce our print distribution costs as we devote greater resources to opportunities for growth that digital media present and eliminate less effective locations, while focusing our efforts on retaining and servicing locations that produce the best results for PRIMEDIA’s advertisers in terms of leads. We intend to move to a smaller, more efficient distribution model that primarily relies on third-party distribution services, in combination with more limited internal resources, to deliver our directories.
3
Table of Contents
Index to Financial Statements
Technology
We use technology to improve our operations by increasing productivity, improving effectiveness and minimizing costs. With the introduction of mobile technologies, such as wireless data networks and laptop/handheld technologies, the use of technology has expanded within our organization to include customer relationship management activities and business workflow functionality.
We back up critical website data at various times throughout the day and retain it at certified third-party facilities. We have firewalls and switchgear designed to help ensure network security. We rely increasingly on hosted providers for many of our corporate applications. These applications are provided over our network to us and configured to meet our needs, although the software itself is not installed at our locations.
Production and Fulfillment
We provide most of the content for our websites, but we outsource some technology, production and content. All of our printed directories are printed and bound by independent printers. The principal raw material used in our printed directories is paper, which is purchased from merchants. In 2009, paper prices declined as the year progressed. We expect paper costs to increase slightly in 2010, and we expect to offset these costs through adjustment of our production metrics. In the future, our results could be adversely affected by increases in paper prices.
Sales and Marketing
Because our directories are free to users, we compete for audience on the basis of the relevance and usefulness of our search results and the features, availability and ease of use of our tools and information. Our websites are marketed to end users through our printed directories and through search engine optimization, e-mail marketing and online advertising, which we purchase on a non-exclusive basis with companies such as Google, MSN, Yahoo!, Advertising.com and others. We monetize visits to our websites through various advertising revenue formats, such as cost per impression, cost per click, cost per action and flat fees, which comprise the substantial majority of our advertising revenue.
We sell our advertising products and services to our advertiser clients through our direct sales force. Our sales force is comprised currently of approximately 460 sales people. The sales force is generally organized vertically, focusing on specific categories and product lines, and by market. Generally, sales people are responsible for developing new accounts and servicing existing customers. Most of our sales people live in the market they serve. We also maintain an in-house telemarketing sales force, supplemented by local and regional support in the field, which focuses on specific customer segments within markets.
Our marketing personnel conduct a variety of marketing programs designed to raise the general awareness of our businesses, generate leads for the sales organization and promote our various product lines. These programs include participation in trade shows and industry trade groups, public relations, digital/online promotion, advertising and production of collateral literature.
In 2009, more than 74% of our Internet audience was generated through non-paid sources, such as repeat visitation, word-of-mouth, natural search and public relations. We selectively utilize paid-marketing sources, such as search engine marketing, affiliate relationships and co-branded partner deployments.
One of our individual advertisers comprised 1.5% of our total revenue in 2009, while another comprised 1.3%. All of our other individual advertisers comprised less than 1.0% of our total revenue in 2009.
Employees
During 2009, our overall headcount declined by approximately 9.0%, primarily due to the elimination of certain administrative and support positions as a result of automation and consolidation of functions. Our sales force
4
Table of Contents
Index to Financial Statements
headcount also declined by 7.9%. As of December 31, 2009, we had approximately 900 employees, of which approximately 20 were part-time, compared to approximately 1,000 employees at the end of 2008, of which approximately 20 were part-time. Our employees are not represented by any collective bargaining agreements. We consider our relations with our employees to be good.
Intellectual Property
We own various registered trademarks, including Apartment Guide, and have service mark applications pending for others. We also have the right to use a number of unregistered service marks in connection with our businesses. So long as these marks remain in continuous use in connection with similar goods and services, their terms can be perpetual, subject, with respect to registered trademarks, to the timely renewal of such registrations in the United States Patent and Trademark Office. Most of our content and databases are copyrighted, as are certain of our software and user manuals. The absence of a registration does not waive copyright protection.
5
Table of Contents
Index to Financial Statements
Discontinued Operations
Over the past several years, we have aggressively sought to divest assets no longer part of our current core businesses. Details about our divestitures during the years ended December 31, 2008 and 2007 are as follows:
| Consideration |
Pre-tax Gain or Loss on Disposition Recognized During the Years Ended December 31, |
|||||||||||||||||
| Segment, Group or Division |
Year of |
Basis for |
Year of |
Form |
Amount | 2008 | 2007(1) | |||||||||||
| (Dollars in thousands) | ||||||||||||||||||
| Outdoors group (part of Enthusiast Media (“PEM”) segment), primarily hunting, fishing and shooting titles |
2006 | Agreement to sell | 2007 | Cash | $ | 170,000 | $ | — | $ | 57,547 | ||||||||
| Channel One (part of Education segment), proprietary network for secondary schools |
2006 | Announcement of intent to sell segment | 2007 | Assumption by the acquirer of net liabilities | 8,600 | — | (7,050 | ) | ||||||||||
| Films Media Group (part of Education segment), a source of educational video |
2006 | Announcement of active pursuit of sale of segment | 2007 | Cash | 11,000 | — | 170 | |||||||||||
| PRIMEDIA Healthcare (part of Education segment), a medical education business(2) |
2006 | Announcement of active pursuit of sale of segment | 2008 | Cash | 200 | 132 | — | |||||||||||
| Enthusiast Media segment(3)(4) |
2007 | Sale of segment | 2007 | Cash | 1,177,900 | — | 460,988 | |||||||||||
| Auto Guides division(5) |
2007 | Announcement of intent to sell or shut down operations of division | 2008 | Cash | 2,100 | 42 | — | |||||||||||
| (1) | Loss related to final adjustments for disposition in previous years was approximately $0.7 million in 2007. |
| (2) | Remaining operations were shut down, resulting in a loss of approximately $0.4 million. |
| (3) | Proceeds were used to pay down debt |
| (4) | Gain related to final adjustments was approximately $0.7 million in 2008 and resulted in payment of approximately $4.4 million to acquirer. |
| (5) | Remaining operations were shut down, resulting in a loss of approximately $0.8 million. |
6
Table of Contents
Index to Financial Statements
There was no pre-tax gain or loss on disposition recognized during the year ended December 31, 2009.
As of December 31, 2009 and 2008, there were no assets or liabilities of businesses held for sale.
The financial results for all divestitures are reported as discontinued operations in the consolidated statement of operations for all periods presented and are more fully discussed in Item 7—“Management’s Discussion and Analysis of Financial Condition and Results of Operations,” of this Report.
Company Organization
PRIMEDIA Inc. was incorporated on November 22, 1991 in the State of Delaware as K-III Communications Corporation, and in 1997, we changed our name to PRIMEDIA Inc. Our principal executive offices are located at 3585 Engineering Drive, Norcross, Georgia 30092, and our telephone number is (678) 421-3000.
Available Information
We maintain a website located at www.primedia.com on which, among other things, we make available, free of charge, various corporate governance materials and reports that we file or furnish to the United States Securities and Exchange Commission (“SEC”). Our Corporate Governance Guidelines, Code of Ethics, and charters for each of the Audit Committee, Compensation Committee and Nominating and Corporate Governance Committee, are all provided on this website. We will post any waivers of our Code of Ethics granted to any of our directors or executive officers on the “Investor Relations” portion of this website. Our reports and other filings, including, without limitation, our annual reports on Form 10-K, quarterly reports on Form 10-Q, current reports on Form 8-K, proxy statements and all other documents, including amendments thereto, filed with or furnished to the SEC, are made available as soon as practicable after their receipt by the SEC. We are not incorporating the information on our website into this Report, and our website and the information appearing on our website are not included in, and are not part of, this Report.
| ITEM 1A. | RISK FACTORS |
Below, we have described our present view of certain important risk factors. This discussion of risk factors contains “forward-looking statements,” as discussed on page 1 of this Report. These risk factors may be important to understanding any statement in this Report or elsewhere. The following information should be read in conjunction with Management’s Discussion and Analysis of Financial Condition and Results of Operations and the consolidated financial statements and related notes contained elsewhere in this Report.
Deterioration in general economic conditions, and in the specific industries in which we operate, have adversely affected and are expected to continue to adversely affect advertising revenue.
National and local market economic conditions affect the overall levels of advertising revenue. Negative economic conditions, including a U.S. recession and the nationwide and local downturn in the housing markets, have adversely affected and are expected to continue to adversely affect our overall level of advertising revenue, and a failure of economic conditions to improve in our markets could adversely affect our future business, financial condition and results of operations.
We depend on large property management companies in the apartment leasing sector of the residential real estate industry for a majority of our revenue, and any economic or industry developments that adversely affect the number and value of leasing transactions generated could adversely impact our financial results.
The return on investment for our large property management company advertisers depends upon the comparison of how many leases we are generating for the managed communities in a particular local market, and the value of such leases, to the amount charged for our advertising. Many of the factors affecting the number and value of lease transactions are beyond our control. In markets where occupancy levels are extraordinarily high or
7
Table of Contents
Index to Financial Statements
extraordinarily low, the management company’s return on investment can be adversely affected, and the management company may choose to decrease the level of advertising, which could adversely affect our revenue. The effects of occupancy rates can be mitigated or exacerbated by effective rent levels, which are essentially average rent amounts after giving effect to free months of rent and other incentives.
Our new home directories and related websites depend on the new home sales sector of the residential real estate industry, which is cyclical.
Approximately 8.3% of our 2009 advertising revenue was generated from sales of advertising products to new home builders in the residential real estate industry. This sector, which is cyclical, directly affects the success of our New Homes division. The return on investment for our new home builder advertisers depends on the success rate of actual sales that are closed in comparison to the advertising expenses paid. If our advertisers experience lower return on investment because actual sales decline for reasons beyond our control, they tend to decrease their advertising budget, which adversely affects our revenue.
The United States economy is currently experiencing its worst downturn in the residential real estate industry in over 50 years. The duration of this downturn, as is true of most trends in the real estate industry, is unpredictable, and as a result, our prospects in this area are also unpredictable. An economic recession, unfavorable taxation laws and regulations, higher credit standards, unavailability of mortgage loans, increased interest rates, increased unemployment, lower consumer confidence or lower wages can cause consumers to reduce their activity in the residential real estate industry, thus negatively impacting local new home sales markets.
The market for our products and services is highly competitive.
The markets for our products and services are disbursed throughout the United States. Generally, other online and print apartment and new home-targeted resources for the consumer represent our main competitors. To a lesser extent, we also compete with traditional newspapers and yellow pages.
Competition for advertising is generally based on audience or traffic levels and demographics, price, service and advertising results. Competition from all relevant media and services affects our ability to attract and retain consumers and advertisers and to maintain or increase our advertising rates. This competition has intensified as a result of the continued developments of digital media technologies. Distribution of advertising over the Internet, as well as through mobile phones and other devices, continues to increase in popularity. As a result, a shift from print advertising to online alternatives has contributed to significant declines in print advertising.
The majority of our current product offerings are built upon integrated media packages that feature online, mobile and print components. However, we are continuing to aggressively develop and market our online products and services, and we could experience a decline in advertising revenue if we are unable to migrate print advertising to our website offerings in volumes or at rates sufficient to offset declines in print advertising.
If we are not successful in growing our digital products and services, our business, financial condition and prospects will be adversely affected.
Our growth depends, to a significant degree, upon the development of our digital products and services. Accordingly, our ability to grow and succeed over the long term depends on various factors, including, among other things:
| • | increasing our online traffic and attracting and retaining visitors to our websites, which may be adversely affected by search engines (including Google, the primary search engine directing traffic to our websites) changing the algorithms responsible for directing search queries to web pages; |
| • | attracting advertisers to our websites, which depends partly on our ability to generate online traffic and partly on the rate at which users engage in lease or sale transactions with advertisers using our websites; |
8
Table of Contents
Index to Financial Statements
| • | maintaining or increasing advertising rates on our websites, which will depend, in part, on the market position of our brands; |
| • | exploiting new and existing technologies to distinguish our products and services from those of our competitors and developing new content, products and services, which may move in unanticipated directions due to the development of competitive alternatives, rapid technological change, regulatory changes and shifting market preferences; |
| • | investing funds and resources in online opportunities, in which some of our existing competitors and possible additional entrants may have greater operational, financial and other resources than we do or may be better positioned to compete for certain opportunities; and |
| • | attracting and retaining talent for critical positions. |
Even if we continue to develop our digital products and services, we may not be successful in generating or increasing revenue from these products or services due to increasing competition and economic conditions. If we are not successful in maintaining or growing revenue from our digital products and services to offset current and anticipated declines in revenue from print products, our business, financial condition and prospects will be adversely affected.
If we are unable to meet rapid changes in technology, our services and technology and systems may become obsolete.
The Internet and e-commerce are constantly changing. Due to the costs and management time required to introduce new services and enhancements, we may not be able to respond in a timely manner to competitive innovations. To remain competitive, we must continue to enhance and improve the functionality and features of our online businesses. Further, to remain competitive, we must meet the challenges of the introduction by our competitors of new services using new technologies or the introduction of new industry standards and practices. In addition, the vendors we use to support our technology may not provide the level of service we expect or may not continue to provide their product or services on commercially reasonable terms or at all. If we fail to meet any of these potential changes, or our vendors fail to provide the necessary support to our technology, our results of operations and financial condition could be negatively impacted.
Our success and growth depend, to a significant degree, upon the protection of our intellectual property rights.
As a media company, we have a significant intellectual property portfolio, especially copyrights and trademarks, and have allocated considerable resources toward intellectual property maintenance, prosecution and enforcement. For example, we hold and maintain or have pending applications for numerous copyrights and trademarks in connection with our various products and services, such as Apartment Guide. In addition, we also continuously develop and create proprietary software to enhance our ability to effectively and efficiently update the listings in our online and print directories. We may be unable to deter infringement or misappropriation of our data and other proprietary information, detect unauthorized use or take appropriate steps to enforce our intellectual property rights. Any unauthorized use of our intellectual property could make it more expensive for us to do business and consequently harm our business.
Kohlberg Kravis Roberts & Co. L.P. (“KKR”) has control of a majority of our outstanding common stock and has the power to elect all the members of our Board of Directors and to approve any action requiring stockholder approval.
As of March 1, 2010, approximately 58.9% of the outstanding shares of our common stock were held by investment partnerships of which KKR Associates, L.P. and KKR GP 1996 LLC are the general partners. KKR Associates and KKR GP 1996 have sole voting and investment power with respect to these shares.
Consequently, KKR Associates, L.P. and KKR GP 1996 LLC and their respective general partners and members, two of whom are also on our Board of Directors, control us and have the power to elect all of our directors and
9
Table of Contents
Index to Financial Statements
approve any action requiring stockholder approval, including adopting amendments to our certificate of incorporation and approving mergers or sales of all or substantially all of our assets. KKR Associates, L.P. and KKR GP 1996 LLC will also be able to prevent or cause a change of control at any time.
Our stock price is volatile.
Our common stock price has experienced substantial volatility in the past and may remain volatile in the future. Volatility can arise as a result of a number of the factors discussed in this “Risk Factors” section, as well as divergence between our actual or anticipated financial results and published expectations of analysts; announcements that we, our competitors or our customers may make; and the relatively small portion of our outstanding shares that is in the hands of public investors, as opposed to our officers, directors and controlling-interest investors.
We may be unable to realize the benefits of our net operating loss carryforwards (“NOLs”), and, as a result, lose our future tax savings, which could have a negative impact on our liquidity and financial position.
NOLs may be utilized to offset federal and state taxable income in future years and reduce income taxes otherwise payable on such taxable income, subject to certain adjustments. The Internal Revenue Service (“IRS”) or state taxing authorities could challenge the amount of the NOLs, which could result in increases in future income tax liabilities. Based on current federal and state corporate income tax rates, our NOLs could provide a benefit to us, if fully utilized, of significant future tax savings. However, if we do not have sufficient taxable income in future years to use the tax benefits before they expire, we will lose the benefit of these NOLs permanently. Our inability to utilize available NOLs, if any, could require us to pay substantial additional federal and state taxes and interest, which may adversely affect our liquidity and financial position.
Future legislation may result in our inability to realize the tax benefits of our NOLs.
It is possible that legislation or regulations will be adopted that would limit our ability to use the tax benefits associated with our NOLs. However, we are not currently aware of any proposed changes in the tax laws or regulations that would materially and adversely impact our ability to use available NOLs, if any.
Our use of NOL carryforwards could be limited by ownership changes.
In addition to the general limitations on the carryback and carryforward of NOLs under Section 172 of the Internal Revenue Code (the “Code”), Section 382 of the Code imposes further limitations on the utilization of NOLs by a corporation following various types of ownership changes, generally resulting in more than a 50 percentage point change in ownership of a corporation within a three year period. Therefore, the future utilization of our NOLs may be subject to limitation for regular federal income tax purposes.
We cannot be certain that the limitations of Section 382 will not limit or deny in full our future utilization of available NOLs, if any. Such limitation or denial could require us to pay substantial additional federal and state taxes and interest. Moreover, we cannot be certain that future ownership changes will not limit or deny in full our future utilization of all available NOLs. If we cannot utilize available NOLs, if any, we may be required to pay substantial additional federal and state taxes and interest. Such tax and interest liabilities may adversely affect our liquidity and financial position.
If we are unable to meet continued listing requirements of the New York Stock Exchange, Inc. (“NYSE”), the NYSE may delist our common stock, which could negatively affect the price of the common stock and your ability to sell the common stock.
In November 2008, the NYSE notified us that we were considered “below criteria” specifically because our average total market capitalization was less than $75 million over a consecutive 30 trading-day period. This
10
Table of Contents
Index to Financial Statements
required us to submit a plan that demonstrated our ability to achieve compliance with the continued listing standards within 18 months of receipt of the notice. In February 2009, the NYSE notified us that it had accepted our proposed plan for continued listing on the NYSE, subject to quarterly reviews by the NYSE’s Listing and Compliance Committee to ensure progress against the plan. In June 2009, the NYSE lowered its minimum total market capitalization requirement to $50 million and subsequently notified us that we were considered in compliance and that no quarterly reviews would be required.
In the future, we may not be able to meet the continued listing requirements of the NYSE. If we are unable to satisfy the NYSE criteria for continued listing, our common stock would be subject to delisting. Trading, if any, in our common stock would thereafter be conducted on another exchange or quotation system. As a consequence of any such delisting, a stockholder would likely find it more difficult to dispose of, or to obtain accurate quotations as to the prices for our common stock.
The soundness of financial institutions could adversely affect us.
We have relationships with several financial institutions as lenders under our credit facility and engage in transactions with other counterparties in the financial services industry. Defaults by, or even rumors or questions about, financial institutions or the financial services industry generally, could result in losses or defaults by these institutions. As a result of Lehman Brothers, Inc. ceasing to be a participating lender in our credit facility, the total capacity under our revolving credit facility was reduced by $12.0 million to $88.0 million. In the event that the volatility of the financial markets further adversely affects financial institutions that are lenders under our credit facility, we may be unable to access our credit facility or complete financing transactions as intended, which could adversely affect our revenue and results of operations.
Our credit agreement limits our business flexibility by imposing operating and financial restrictions on our operations.
Our credit agreement imposes specific operating and financial restrictions on us. These restrictions impose conditions or limitations on our ability to, among other things: change the nature of our business; incur additional indebtedness; create liens on our assets; sell assets; issue stock; engage in mergers, consolidations or transactions with our affiliates; make investments in or loans to specific subsidiaries; make guarantees or specific restricted payments; and declare or make dividend payments on our common stock.
Our failure to comply with the terms and covenants in our credit agreement could lead to a default under the terms of such agreement, which would entitle the lenders to accelerate the indebtedness and declare all amounts owed due and payable. If that occurred, we might not be able to refinance or otherwise satisfy our debt obligations, which could have a substantial adverse effect on our ability to continue as a going concern. We may not be able to comply with these restrictions in the future, or, in order to comply with these restrictions, we may have to forego opportunities that might otherwise be beneficial to us.
Our accounting policies and methods are key to how we report our financial condition and results of operations and may require management to make estimates about matters that are uncertain.
Accounting policies and methods are fundamental to how we record and report our financial condition and results of operations. Management must exercise judgment in selecting and applying many of these accounting policies and methods so they comply with accounting principles generally accepted in the United States of America (“GAAP”).
Management has identified certain accounting policies and estimates as being critical because they require management’s judgment to ascertain the valuations of assets, liabilities, commitments and contingencies. A variety of factors could affect the ultimate value that is obtained either when earning income, recognizing an expense, recovering an asset or reducing a liability. We have established detailed policies and control procedures
11
Table of Contents
Index to Financial Statements
that are intended to ensure these critical accounting estimates and judgments are well controlled and applied consistently. In addition, the policies and procedures are intended to ensure that the process for changing methodologies occurs in an appropriate manner. Because of the uncertainty of estimates about these matters, we cannot guarantee that we will not be required to adjust accounting policies or restate prior period financial statements. See Item 7—“Management’s Discussion and Analysis of Financial Condition and Results of Operations—Critical Accounting Policies and Estimates” and Note 2, “Summary of Significant Accounting Policies,” to the consolidated financial statements contained elsewhere in this Report for more information.
| ITEM 1B. | UNRESOLVED STAFF COMMENTS |
None.
| ITEM 2. | PROPERTIES |
The following table sets forth certain information with respect to our principal locations as of December 31, 2009. These properties were leased by us initially for use in our operations, but as a result of divestitures and consolidations, certain of these properties are now subleased to third-party tenants; only the Norcross location is used in our current operations. Of the total of approximately 1.1 million rentable square feet currently under lease, approximately 0.3 million rentable square feet are fully subleased to third parties. We consider the locations presently used by us for our operations to be adequate for our present needs. If we are forced for any reason to vacate any of our facilities due to lease expirations or any other reasons, we believe that equally suitable alternative locations are available on equally favorable terms in all of the locations where we do business.
| Principal Locations |
Principal Use |
Approximate Rentable Square Feet (“RSF”) |
Type of Ownership Expiration Date of Lease | |||
| Norcross, GA 3585 Engineering Drive |
Executive and administrative offices | 86,600 | Lease expires in 2016 | |||
| Carrollton, TX 4101 International Parkway |
Sublease | 201,180 | Lease expires in 2014; 62,825 RSF sublet as of December 31, 2009 | |||
| New York, NY 1440 Broadway |
Sublease | 170,700 | Lease expires in 2015; fully sublet as of December 31, 2009 | |||
| New York, NY 261 Madison |
Sublease | 72,100 | Lease expires in 2017; 47,333 RSF sublet as of December 31, 2009 | |||
| ITEM 3. | LEGAL PROCEEDINGS |
As is more fully discussed in Note 20, “Commitments and Contingencies,” to the consolidated financial statements contained elsewhere in the Report, we are involved in lawsuits and claims, both actual and potential, including some that we have asserted against others, in which substantial monetary damages are sought. Although the result of any future litigation of such lawsuits and claims is inherently unpredictable, management believes that, in the aggregate, the outcome of all such lawsuits and claims will not have a material effect on our long-term consolidated financial position or liquidity; however, any such outcome could be material to the results of operations of any particular period in which costs, if any, are recognized.
| ITEM 4. | RESERVED |
12
Table of Contents
Index to Financial Statements
EXECUTIVE OFFICERS OF THE REGISTRANT
Our current executive officers are:
| Corporate Officers | ||
| Dean B. Nelson Chairman of the Board Age: 51 |
Mr. Nelson became Chairman of the Board in April 2003 and also served as President and Chief Executive Officer from October 2005 to September 2007. He has served as the Chief Executive Officer of Capstone Consulting LLC, a strategic consulting firm, since March 2000. | |
| Charles J. Stubbs President and Chief Executive Officer Age: 37 |
Mr. Stubbs has served as President and Chief Executive Officer since May 2008. From November 2004 to May 2008, he was the President and CEO of YellowPages.com. Prior to that time, Mr. Stubbs served as President of BellSouth IntelliVentures, the electronic media division of BellSouth Advertising and Publishing Group. Before joining BellSouth, Mr. Stubbs was Executive Vice President of Infospace, a Bellevue, Washington-based entity that develops and markets Internet and wireless solutions for wireless operators and content sites. | |
| Kim R. Payne Senior Vice President and Chief Financial Officer Age: 41 |
Ms. Payne has served as Chief Financial Officer since August 2007. Previously, she had served as Chief Financial Officer of our operating subsidiary since August 2006. She joined us as an accountant in 1991 and during her tenure has served in various finance management roles at our operating subsidiary, including Financial Analyst, Director of Analysis and Planning, and Vice President of Finance. | |
| J. Michael Barber Senior Vice President and Chief Accounting Officer Age: 43 |
Mr. Barber has served as Chief Accounting Officer since May 2008. Prior to joining us in October 2007, Mr. Barber served as Executive Vice President and Chief Accounting Officer of HomeBanc Corp. from September 2004 through October 2007. From 2001 to August 2004, he served as Senior Vice President/Manager of Accounting Policy and Reporting with Union Planters Corp., a bank holding company. Prior to 2001, Mr. Barber worked with PricewaterhouseCoopers LLP, where he was a Senior Manager in that organization’s banking practice. Mr. Barber is a certified public accountant. | |
| Arlene Mayfield Senior Vice President and President, Apartment Guide and New Home Guide Age: 47 |
Ms. Mayfield has served as Senior Vice President since December 2007 and President of the Apartment Guide and New Home Guide businesses since October 2005 and November 2008, respectively. Previously, she had served as Vice President of the New Home Guide from September 2003 through October 2005. She began her career with us in 1993 as the Publisher of the Albuquerque Apartment Guide. Ms. Mayfield was promoted to Publisher of the Orlando Apartment Guide in 1997 and subsequently to Regional Director for the Eastern Region in 1999. | |
| Keith L. Belknap, Jr. Senior Vice President, General Counsel and Secretary Age: 52 |
Mr. Belknap has served as Senior Vice President, General Counsel and Secretary since September 2007 and of our operating subsidiary since March 2007. Mr. Belknap is responsible for oversight of our legal and corporate and business development functions. From February 2006 to March 2007, he served as Assistant General Counsel of PPG Industries, Inc. From April 2003 to February 2006, he served as a Principal Counsel to Georgia-Pacific Corporation. Prior to April 2003, Mr. Belknap was Counsel at Skadden, Arps, Slate, Meagher & Flom LLP. | |
| Business Executive | ||
| Jamison M. Clymer President, Rentals.com Age: 35 |
Mr. Clymer has served as President of Rentals.com since January 2008. Prior to joining us, Mr. Clymer served as Vice President and General Manager of Homes.com at Dominion Enterprises from January 2005 through December 2007. From October 2003 through December 2004, he served as General Manager of Employmentguide.com at Dominion, and from July 2001 through September 2003 he served as District Manager of Employmentguide.com. | |
13
Table of Contents
Index to Financial Statements
| ITEM 5. | MARKET FOR REGISTRANT’S COMMON EQUITY, RELATED STOCKHOLDER MATTERS AND ISSUER PURCHASES OF EQUITY SECURITIES |
Market Information
Our common stock is listed on the NYSE under the ticker symbol “PRM.” As of March 1, 2010, there were 636 holders of record of our common stock. The following table sets forth, for the quarterly periods indicated, the high, low and closing sales prices per share of our common stock as quoted on the NYSE at the end of regular trading, as well as the cash dividends declared per share of common stock:
| Stock Prices | Cash Dividends Declared per Share | |||||||||||
| 2009 Quarters Ended |
High | Low | Close | |||||||||
| March 31 |
$ | 3.00 | $ | 1.60 | $ | 2.47 | $ | 0.07 | ||||
| June 30 |
4.05 | 1.80 | 2.01 | 0.07 | ||||||||
| September 30 |
3.25 | 1.72 | 2.52 | 0.07 | ||||||||
| December 31 |
4.29 | 2.36 | 3.61 | 0.07 | ||||||||
| Stock Prices | Cash Dividends Declared per Share | |||||||||||
| 2008 Quarters Ended |
High | Low | Close | |||||||||
| March 31 |
$ | 9.18 | $ | 5.69 | $ | 7.35 | $ | 0.07 | ||||
| June 30 |
7.54 | 4.65 | 4.66 | 0.07 | ||||||||
| September 30 |
4.74 | 2.20 | 2.43 | 0.07 | ||||||||
| December 31 |
2.51 | 0.69 | 2.17 | 0.07 | ||||||||
Dividends
Our bank credit facilities impose certain limitations on the amount of dividends permitted to be paid on our common stock. See Item 7, “Management’s Discussion and Analysis of Financial Condition and Results of Operations—Liquidity, Capital and Other Resources—Financing Arrangements.”
We announced on March 4, 2010 that our Board of Directors had authorized a regular quarterly cash dividend of $0.07 per share of common stock, payable on or about March 24, 2010, to stockholders of record on March 15, 2010. We currently expect that we will continue to pay a regular quarterly dividend, at the discretion of our Board of Directors.
Equity Compensation Plan Information
Information required by this item with respect to our equity compensation plans is incorporated by reference to our Proxy Statement for our 2010 Annual Meeting of Stockholders. The definitive Proxy Statement will be filed within 120 days of the end of the fiscal year ended December 31, 2009.
Recent Sales of Unregistered Securities
There have been no recent sales of unregistered securities.
Issuer Purchases of Equity Securities
Our Board of Directors has authorized a program (the “Repurchase Program”) to repurchase up to $5.0 million of our common stock through December 31, 2010. Under the terms of the Repurchase Program, we may repurchase shares in open market purchases or through privately negotiated transactions. We expect to use cash on hand to fund any repurchases of our common stock. As of December 31, 2008, we had not repurchased any shares under the Repurchase Program. During the three months ended March 31, 2009, we repurchased 0.2 million shares of our common stock for approximately $0.4 million at a weighted-average price (including brokerage commissions) of $1.79 per share. We did not repurchase any additional shares of our common stock during the year ended December 31, 2009 beyond those discussed above. The reacquired shares have been designated as treasury shares. As of December 31, 2009, we had $4.6 million available under the Repurchase Program for further share repurchases, which we may make.
14
Table of Contents
Index to Financial Statements
Performance Graph
The stock performance graph is not and shall not be deemed incorporated by reference by any general statement incorporating by reference this Report into any filing under the Securities Act of 1933 or the Securities Exchange Act of 1934, (collectively, the “Acts”) except to the extent that we specifically incorporate this information by reference, and shall not otherwise be deemed filed under such Acts.
The graph below compares the cumulative total stockholder return of our Common Stock with the cumulative total return of the S&P 500 Index and two different customized peer groups, the “Old Peer Group” and the “New Peer Group,” for the period commencing December 31, 2004 and ending December 31, 2009. The Old Peer Group is comprised of Autobytel Inc., Martha Stewart Living Omnimedia, Inc., Meredith Corp. and Move, Inc. The New Peer Group is comprised of Move, Inc., Martha Stewart Living Omnimedia, Inc., The Knot, Inc. and Market Leader, Inc. We elected to change our peer group because we believe the companies reflected in the New Peer Group provide a more relevant comparison to our business model and industry than the Old Peer Group. The graph assumes that $100 was invested in our Common Stock, in the index and in each of the peer groups on December 31, 2004 and that all dividends were reinvested on a quarterly basis.
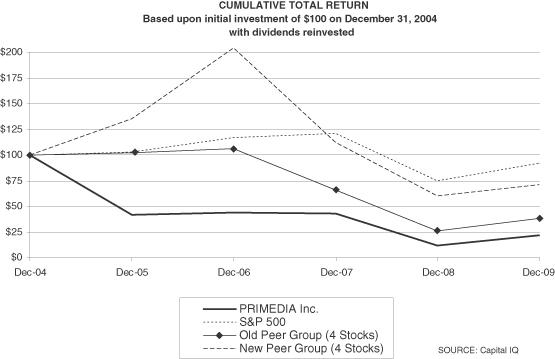
| Dec-04 | Dec-05 | Dec-06 | Dec-07 | Dec-08 | Dec-09 | |||||||||||||
| PRIMEDIA Inc. |
$ | 100 | $ | 42 | $ | 44 | $ | 43 | $ | 12 | $ | 22 | ||||||
| S&P © 500 |
100 | 103 | 117 | 121 | 75 | 92 | ||||||||||||
| Old Peer Group (4 Stocks) |
100 | 102 | 106 | 66 | 26 | 38 | ||||||||||||
| New Peer Group (4 Stocks) |
100 | 135 | 204 | 112 | 60 | 71 | ||||||||||||
| ITEM 6. | SELECTED FINANCIAL DATA |
The selected consolidated financial data were derived from the audited consolidated financial statements. The data should be read in conjunction with “Management’s Discussion and Analysis of Financial Condition and Results of Operations” and the consolidated financial statements and the related notes thereto included elsewhere in this Report.
15
Table of Contents
Index to Financial Statements
PRIMEDIA INC. AND SUBSIDIARIES
| As of and for the Years Ended December 31, | |||||||||||||||||||
| 2009 | 2008 | 2007 | 2006 | 2005 | |||||||||||||||
| (Dollars in thousands, except per share amounts) | |||||||||||||||||||
| Operating Data: |
|||||||||||||||||||
| Revenue, net |
$ | 257,931 | $ | 304,105 | $ | 314,800 | $ | 307,929 | $ | 307,187 | |||||||||
| Depreciation and amortization of property and equipment |
13,256 | 14,475 | 12,612 | 11,501 | 10,410 | ||||||||||||||
| Amortization of intangible assets |
2,970 | 2,870 | 3,492 | 3,286 | 3,140 | ||||||||||||||
| Interest expense |
15,670 | 19,338 | 77,660 | 126,940 | 128,980 | ||||||||||||||
| Income (loss) from continuing operations |
$ | 4,540 | $ | 49,027 | $ | (55,678 | ) | $ | (65,114 | ) | $ | (101,306 | ) | ||||||
| Discontinued operations, net of tax |
(1,052 | ) | 10,441 | 547,123 | 103,344 | 665,924 | |||||||||||||
| Cumulative effect of change in accounting principle, net of tax(1) |
— | — | — | 22 | — | ||||||||||||||
| Net income |
3,488 | 59,468 | 491,445 | 38,252 | 564,618 | ||||||||||||||
| Income applicable to common stockholders |
$ | 3,488 | $ | 59,468 | $ | 491,445 | $ | 38,252 | $ | 564,618 | |||||||||
| Basic and diluted income (loss) applicable to common stockholders per common share(2): |
|||||||||||||||||||
| Income (loss) from continuing operations |
$ | 0.10 | $ | 1.11 | $ | (1.26 | ) | $ | (1.48 | ) | $ | (2.31 | ) | ||||||
| Discontinued operations |
(0.02 | ) | 0.24 | 12.40 | 2.35 | 15.19 | |||||||||||||
| Cumulative effect of change in accounting principle(1) |
— | — | — | 0.00 | — | ||||||||||||||
| Income applicable to common stockholders |
$ | 0.08 | $ | 1.35 | $ | 11.14 | $ | 0.87 | $ | 12.88 | |||||||||
| Dividends declared per share of common stock |
$ | 0.28 | $ | 0.28 | $ | 2.15 | $ | — | $ | — | |||||||||
| Basic common shares outstanding (weighted-average)(2) |
44,124,538 | 44,176,398 | 44,118,943 | 43,997,665 | 43,838,591 | ||||||||||||||
| Diluted common shares outstanding (weighted-average)(2) |
44,214,003 | 44,197,590 | 44,118,943 | 43,997,665 | 43,838,591 | ||||||||||||||
| Balance Sheet Data: |
|||||||||||||||||||
| Goodwill and intangible assets, net |
$ | 149,972 | $ | 152,942 | $ | 155,712 | $ | 862,025 | $ | 994,581 | |||||||||
| Total assets |
239,729 | 286,154 | 256,864 | 1,254,329 | 1,389,468 | ||||||||||||||
| Long-term debt(3) |
222,349 | 245,531 | 247,575 | 1,316,959 | 1,456,770 | ||||||||||||||
Notes to Selected Financial Data
| (1) | Effective January 1, 2006, we adopted GAAP related to the accounting for share-based payments, using the modified prospective method. Prior to the adoption of this statement, we expensed the fair value of stock-based compensation for all grants, modifications or settlements made on or after January 1, 2003 in accordance with GAAP, which was adopted on January 1, 2003 using the prospective method. Upon adoption, we were also required to expense the fair value of any awards that were granted prior to January 1, 2003 and that were not fully vested as of January 1, 2006. The cumulative effect of adopting this change in accounting principle was less than $0.1 million, which is included in the results of operations for the year ended December 31, 2006. |
| (2) | Income (loss) per common share has been determined based on income (loss) applicable to common stockholders, divided by the weighted-average number of common shares outstanding for all years presented. |
16
Table of Contents
Index to Financial Statements
The securities that could potentially dilute basic earnings per share in the future consist of 1.6 million warrants at December 31, 2009, 2008, 2007, 2006 and 2005; and an aggregate of 2.1 million, 3.1 million, 3.2 million, 3.4 million and 3.6 million stock options and shares of restricted stock as of December 31, 2009, 2008, 2007, 2006 and 2005, respectively. For the year ended December 31, 2009, potentially dilutive securities, including 2.5 million stock options and 1.6 million warrants to purchase common stock, were not included in the weighted-average number of common shares outstanding used in the computation of diluted income per common share because their strike price was greater than the average market price of our common stock during the period, and their inclusion would be anti-dilutive. An additional 0.4 million shares of restricted stock were excluded from the weighted-average number of common shares outstanding used in the computation of diluted earnings per share for the year ended December 31, 2009 because either they did not vest and were forfeited or the calculation under the treasury stock method resulted in no additional dilutive shares.
For the year ended December 31, 2008, potentially dilutive securities, including 2.7 million stock options and 1.6 million warrants to purchase common stock, were not included in the weighted-average number of common shares outstanding used in the computation of diluted income per common share because their strike price was greater than the average market price of our common stock during the period, and their inclusion would be anti-dilutive. An additional 0.4 million shares of restricted stock were excluded from the weighted-average number of common shares outstanding used in the computation of diluted earnings per share for the year ended December 31, 2008 because either the performance goals were not met at the end of the period or the calculation under the treasury stock method resulted in no additional dilutive shares.
For the years ended December 31, 2007, 2006 and 2005, potentially dilutive securities were not included in the weighted-average number of common shares outstanding used in the computation of diluted income (loss) per common share because the effect of their inclusion, as measured against loss from continuing operations, would be anti-dilutive.
| (3) | Excludes current maturities of long-term debt. |
| Item 7. | MANAGEMENT’S DISCUSSION AND ANALYSIS OF FINANCIAL CONDITION AND RESULTS OF OPERATIONS |
Introduction
The following discussion and analysis summarizes our financial condition and operating performance and should be read in conjunction with our historical consolidated financial statements and notes thereto included elsewhere in this Report.
Executive Summary
Our Company
We are a targeted media company that provides consumers with tools and information they need to find a place to live. Our consumer directories are targeted primarily for the apartment and other rental property sectors of the residential real estate industry and are provided free to consumers through a combination of online, print and mobile platforms. We derive advertising revenue by providing our advertiser clients – property management companies, private owner/landlords, new home builders and real estate professionals – with products and services that generate measurable results in the form of cost-effective, quality leads.
Our principal digital assets include ApartmentGuide.com, Rentals.com, RentalHouses.com, NewHomeGuide.com and AmericanHomeGuides.com. According to comScore Media Metrix, unique visitors to our websites reached 3.3 million in January 2010, compared with 3.1 million in January 2009. The total number of leads we produce for our advertisers has grown year over year, and leads derived from our online and mobile services now represent more than 75% of the total leads we deliver to our advertiser clients.
17
Table of Contents
Index to Financial Statements
We produce printed directories for 75 markets and distribute them through display rack programs, many of which are on an exclusive basis, with large national and regional retail chains, including grocery, drug, convenience, video, fitness and mass merchandise retailers. In 2009, we distributed approximately 14.9 million printed directories to approximately 17,000 advertiser client locations and 28,000 retail and other locations.
Fiscal 2009 Fourth Quarter Results
| Fourth Quarters Ended December 31, |
$ Change Favorable/ (Unfavorable) |
% Change Favorable/ (Unfavorable) |
|||||||||||||
| 2009 | 2008 | ||||||||||||||
| (Dollars in thousands) | |||||||||||||||
| Revenues, net |
$ | 61,253 | $ | 73,409 | $ | (12,156 | ) | (16.6 | )% | ||||||
| (Provision) benefit for income taxes |
(3,535 | ) | 29,401 | (32,936 | ) | (112.0 | ) | ||||||||
| Income from continuing operations |
$ | 7,469 | $ | 34,691 | $ | (27,222 | ) | (78.5 | )% | ||||||
| Discontinued operations, net of tax |
3,679 | (2,710 | ) | 6,389 | 235.8 | ||||||||||
| Net income |
$ | 11,148 | $ | 31,981 | $ | (20,833 | ) | (65.1 | ) | ||||||
The decrease in revenue, net was primarily attributable to a decrease in New Homes advertising revenue and distribution revenue. The decrease in New Homes advertising revenue was due to a 39.1% decrease in revenue per community served driven by the continued weaknesses in the new home sales sector and a 21.2% decrease in new home communities served. The decrease in distribution revenue was due to a 23.6% decrease in the average revenue per pocket due to softness in demand and a 24.2% decrease in the number of pockets sold in our display racks due largely to the reduction in retail locations serviced.
Income from continuing operations decreased primarily due to lower revenue of $12.2 million and the release in 2008 of $29.3 million in deferred tax asset valuation allowance, partially offset by decreases in 2009 in distribution and circulation of $8.2 million, cost of goods sold of $2.2 million, and general and administrative of $2.0 million.
Net income decreased due to the factors above, partially offset by a $6.4 million increase in income from discontinued operations, net of tax, which was the result of a benefit recorded from our estimated liability for certain tax-related contingencies of approximately $6.0 million, primarily due to the lapsing of the statutes of limitations.
2009 Summary Consolidated Results
In 2009, revenue was $257.9 million, down 15.2% as compared to $304.1 million in 2008. In 2009, costs and expenses were $251.3 million, down 10.9% compared to $282.1 million in 2008.
In 2009, income from continuing operations was $4.5 million, compared to $49.0 million in 2008.
Net income was $3.5 million in 2009 compared to $59.5 million in 2008, which included gain on sale of businesses, net of tax, of $2.0 million.
Business Trends and Outlook
The continuing and deepening deterioration in the economy generally and in the conditions in the residential real estate industry in particular have resulted in relatively low occupancy and effective rent levels on a national basis. Though local market conditions vary, our advertisers generally have responded to these conditions with shifts in marketing strategies and budget cuts, which have depressed and may continue to depress our advertising
18
Table of Contents
Index to Financial Statements
revenue. As we look ahead, we believe advertisers will continue to be cautious with their budgets, focusing more on total advertising spend than on ROI, and advertising revenue is likely to continue to be challenged in 2010.
Also contributing to shifts in marketing strategies of our advertisers is the continuing increase in popularity of online advertising, including through mobile phones and other devices. The broad shift from print advertising to online alternatives has contributed to significant declines in print advertising across traditional media products and services. Most of our current offerings are built upon integrated media packages that include online, print and mobile components. However, we have seen the effects of this trend in revenue declines attributable to our premium print products, as well as increasing advertiser focus on our online and mobile offerings.
The targeted nature of our ROI-based print products is why they continue to deliver substantial value to our advertisers, even though the greater portion of the value we now deliver (in the form of leads) on a national basis has shifted to our digital products and services. The mix of advertising results, and therefore value, as between our digital and print products and services is highly market-specific, with consumers in some markets favoring print products, while those in other markets favor our Internet or mobile services.
Overall, we expect our advertisers to increasingly favor digital media choices in their advertising budgets, and we are continuing to aggressively develop and market our online and mobile offerings. However, at least in the shorter term, we anticipate continuing decreases in revenue per community served as we increase apartment communities served. We believe that our growth will depend, to a significant degree, upon the value of our online products and services and our ability to monetize this value.
During 2010, we intend to continue to grow our client count and market share in our largest business, Apartment Guide, and pursue enhancements to our product portfolio and market and market segment expansion. We also intend to grow our Rentals.com business by focusing on improving site engineering and performance, while increasing traffic, primarily through search engine optimization. Our visibility around 2010 revenue for Apartments is extremely limited, given general economic and market conditions, though we currently expect to see a 5% to 6% year-over-year decline in first quarter 2010 Apartments revenue, similar to the percentage decline experienced in fourth quarter 2009.
We anticipate continued pressure on our New Homes business during 2010, and we remain focused on managing costs for this business in accordance with anticipated levels of revenue and managing our client relationships to best position us for opportunities as macroeconomic conditions improve. We currently expect a 40% to 50% year-over-year decline in New Homes revenue in first quarter 2010.
We anticipate that DistribuTech will continue to be impacted by lower revenue from customers that publish free publications and are scaling back or ceasing operations or providing an Internet-only product and by further reductions in retail locations serviced. Since 2008, we have undertaken strategic initiatives to substantially reduce the cost structure of our distribution function. As a result, distribution costs decreased from $85.2 million in 2008 to $60.9 million in 2009. We intend to continue aggressively reducing our distribution cost structure and expect to incur restructuring charges related to our RDAs of between $5.0 million and $7.0 million in 2010. We currently expect a 35% to 40% year-over-year decline in DistribuTech revenue in first quarter 2010.
Our overall distribution strategy is to reduce our overall print distribution costs as we devote greater resources to opportunities for growth that digital media present and eliminate less effective locations, while focusing our efforts on retaining and servicing locations that produce the best results for PRIMEDIA advertisers in terms of leads. We intend to move to a smaller, more efficient distribution model that primarily relies on third-party distribution services, in combination with more limited internal resources, to deliver our directories.
Transition Plan
We have relocated our corporate headquarters from New York to Norcross, Georgia. We continued to utilize certain of our New York-based functions through the first half of 2008 and to incur their associated costs.
19
Table of Contents
Index to Financial Statements
Critical Accounting Policies and Estimates
Management’s discussion and analysis of our financial condition and results of operations is based upon the amounts reported in our consolidated financial statements, which have been prepared in accordance with GAAP. The preparation of these financial statements requires the use of estimates, judgments and assumptions that affect the reported amounts. The significant accounting policies, outlined in Note 2, “Summary of Significant Accounting Policies,” to the consolidated financial statements contained elsewhere in this Report, are integral to an understanding of management’s discussion and analysis. The accounting policies and estimates that we believe are the most critical to an understanding of the results of operations and financial condition are those that require complex management judgment regarding matters that are highly uncertain at the time policies were applied and estimates were made. These accounting policies and estimates are discussed below. We base some of our estimates on historical experience and on various other assumptions that we believe are reasonable under the circumstances. Additionally, GAAP allows or requires many assets and liabilities to be accounted for at fair value, which is defined to be the price that would be received to sell an asset or paid to transfer a liability in an orderly transaction between market participants at the measurement date. GAAP also requires that certain assets be assessed for impairment based on fair value. In cases where active markets do not exist, as discussed below, modeling or other techniques may be required to estimate fair value. Different estimates reasonably could have been used in the current period that would have had a material effect on these financial statements, and changes in these estimates are likely to occur from period to period in the future.
We have discussed the development and selection of these critical accounting policies and estimates with the Audit Committee of the Board of Directors, and the Audit Committee has reviewed our disclosures relating to them in this Management’s Discussion and Analysis.
Goodwill Impairment Testing. Goodwill is deemed to have an indefinite life and is not amortized but is subject to an impairment test, at least annually. Goodwill represents the excess of the cost of an acquired entity over the net of the amounts assigned to assets acquired and liabilities assumed in business combinations. The value of goodwill is ultimately derived from an entity’s ability to generate net earnings after the acquisition. A decline in net earnings could be indicative of a decline in the fair value of goodwill and result in impairment. For that reason, we test, at a reporting unit level, goodwill for impairment and have established October 31 as the annual impairment testing date. A reporting unit is an operating segment or one level below an operating segment for which discrete financial information is available and reviewed regularly by management. Our assets and liabilities are assigned to reporting units to the extent that they are employed in or are considered a liability related to the operations of the reporting units and are considered in determining the fair value of the reporting units. We presently have only one reporting unit. The goodwill impairment test is conducted by calculating the fair value of the reporting unit, which begins with management’s expectations of cash flows in the next five years plus an expected residual value. A discount factor, approximating our weighted-average cost of capital (13% for 2009 and 2008), is then applied to the forecasted cash flows to determine the present value. The resulting fair value is compared to the carrying value of the reporting unit. As long as the present value is greater, there is no impairment to goodwill.
While we believe all assumptions utilized in our assessment of goodwill for impairment are reasonable and appropriate, changes in actual earnings, the growth rate of future earnings, the effective tax rate (38% for 2009 and 2008) and our weighted-average cost of capital could all cause different results for the calculation of the present value of future cash flows. In management’s estimation, most sensitive of these assumptions is cash flows from future earnings.
Over the past six years, our actual revenue and earnings before interest, taxes, depreciation and amortization, and other (“EBITDA”) have generally been within a range of 7% higher to 7% lower than our forecasted amounts. In our annual impairment testing for 2009, we determined that the estimated fair value of our reporting unit substantially exceeded its carrying value. We have also performed a sensitivity analysis of our calculated fair value by assuming our cash flows from future earnings to be 20% lower than our forecast. The results indicated that such declines would not result in an indicated goodwill impairment.
20
Table of Contents
Index to Financial Statements
Long-Lived Assets. We review our long-lived assets for impairment whenever events and circumstances indicate assets might be impaired. Those events and circumstances include, but are not limited to, a significant change in the extent to which an asset is utilized (e.g., when a decision is made to dispose of an asset and certain other criteria are met), a significant decrease in the market price of an asset and a significant adverse change in the business climate that could affect the value of an asset, and operating or cash flow losses associated with the use of an asset. When such a review is conducted, we use an estimate of undiscounted cash flows, which are derived from our historical experience and long-term business plans, over the remaining lives of the assets to measure recoverability. If the estimated cash flows are less than the carrying value of an asset, the loss is measured as the amount by which the carrying value of the asset exceeds fair value.
During the fourth quarter of 2009, factors were identified indicating that the carrying value of certain of our advertiser lists might not be recoverable. We determined that the expected undiscounted cash flows associated with one advertiser list were less than the carrying value and, as a result, recorded an impairment charge of approximately $0.5 million, which is included in amortization of intangible assets in the consolidated statement of operations. We also determined that the decline in the value of these assets was occurring faster than the expense being recognized using the straight-line method of amortization. To better match the deterioration in the value of the assets, we also concluded that an accelerated method of amortization over a shorter estimated life would be appropriate and made this change in estimate effective January 1, 2010.
Income Taxes and Tax-Related Liabilities. Our income tax expense is affected by judgments we must make about the realizability of our net deferred tax assets and our reserves for uncertain tax positions. Our net income is also impacted by our judgments about our tax-related contingent liabilities.
Valuation Allowances for Deferred Tax Assets. Deferred tax assets and liabilities arise from temporary differences (i.e., amounts that are recognized as income or deducted as expenses at different times for GAAP and tax purposes). Deferred tax assets also arise from benefits recorded from NOLs (i.e., amounts representing losses for tax purposes that may be utilized in future years to offset taxable income). A net deferred tax asset must be reduced by a valuation allowance if, based on the weight of available evidence, it is more likely than not (a likelihood of more than 50%) that some portion or all of the deferred tax asset will not be realized. The valuation allowance must be sufficient to reduce the net deferred tax asset to the amount that is more likely than not to be realized. Changes in the valuation allowance are recorded as increases or decreases in income tax expense. Future realization of the tax benefit of an existing deductible temporary difference or carryforward ultimately depends on the existence of sufficient taxable income of the appropriate character (e.g., ordinary income or capital gain) within the carryback or carryforward period available under the tax law. There are four possible sources of taxable income that may be available under the tax law to realize a tax benefit for deductible temporary differences and carryforwards:
| • | Future reversals of existing taxable temporary differences; |
| • | Future taxable income exclusive of reversing temporary differences and carryforwards; |
| • | Taxable income in prior carryback year(s) if carryback is permitted under the tax law; and |
| • | Tax-planning strategies that would, if necessary, be implemented to, for example: |
| ¡ | Accelerate taxable amounts to utilize expiring carryforwards; or |
| ¡ | Change the character of taxable or deductible amounts from ordinary income or loss to capital gain or loss. |
Evidence available about each of those possible sources of taxable income will vary for different tax jurisdictions and, possibly, from year to year. To the extent evidence about one or more sources of taxable income is sufficient to support a conclusion that a valuation allowance is not necessary, other sources need not be considered. Consideration of each source is required, however, to determine the amount of the valuation allowance that is recognized for deferred tax assets. After consideration of the available evidence, a valuation allowance, if warranted, is established to reduce the deferred tax asset to the amount that is more likely than not to be realized.
21
Table of Contents
Index to Financial Statements
In evaluating the ability to realize deferred tax assets, including NOLs, and any need for a valuation allowance, it is necessary to first consider the recognition threshold for uncertain tax positions and reduce the deferred tax assets by any required reserve for uncertain tax positions.
As of December 31, 2009, we had aggregate federal NOLs of approximately $452.4 million, which are available to reduce future taxable income, and the substantial majority expire between 2020 and 2024. In addition, we have state and local NOLs in various jurisdictions in which we and/or our subsidiaries file income tax returns. These state and local NOLs expire over various periods based on applicable state and local regulations.
The federal, state and local NOLs are the single largest component of our net deferred tax asset. Additionally, since amortization of tax-deductible goodwill and trademarks ceased for GAAP purposes on January 1, 2002, we expect that deferred tax liabilities will arise each quarter because the taxable temporary differences related to the amortization of these assets are not expected to reverse prior to the expiration period of our deductible temporary differences unless the related assets are sold or an impairment of the assets is recorded. Consequently, we may record a valuation allowance in excess of our net deferred tax assets to the extent the difference between the book and tax basis of indefinite-lived intangible assets is not expected to reverse during the NOL period.
Based on the weight of objectively verifiable available positive and negative evidence, at December 31, 2009, we have recorded a valuation allowance against all but $26.3 million of our net deferred tax asset because we believe only this portion is more likely than not to be realized. We will need to generate approximately $75.1 million in pre-tax income for financial reporting purposes to realize this asset.
Elements of positive evidence about the realizability of our asset included:
| • | remaining lives of the NOLs; |
| • | historical income when results are normalized to remove the impact of discontinued operations and to reflect the completion of the Company’s relocation from New York to Norcross; and |
| • | forecasted income, utilizing the same forecast as for goodwill impairment testing in future periods. |
Elements of negative evidence about the realizability of our asset included:
| • | historical losses and |
| • | uncertainty as to the timing and exact amount of future earnings as a result of current economic conditions, the U.S. residential real estate industry, as well as the uncertainty of the effectiveness of the steps we have taken, and will take, to mitigate the adverse impact on our businesses. |
Our assessment in 2009 is consistent with our view in 2008.
As of December 31, 2009, we maintained a partial valuation allowance against our net deferred income tax assets. We may release additional valuation allowance in future periods when we can conclude that a greater portion of the net deferred tax assets is more likely than not to be realized. To the extent we report taxable income in future periods, we intend to use NOLs, to the extent allowable, to offset that taxable income and reduce cash outflows for income taxes. Our ability to use our federal and state NOLs and federal and state tax credit carryforwards may be subject to restrictions attributable to equity transactions in the future resulting from changes in ownership as defined under the Internal Revenue Code.
Uncertain Tax Positions. GAAP for the accounting for uncertainty in income taxes prescribes a recognition threshold and measurement attribute for the financial statement recognition and measurement of a tax position taken or expected to be taken in a tax return. Uncertainty can arise because:
| • | a tax position is not more likely than not to be sustained upon examination by the taxing authority; |
| • | the tax position is more likely than not to be sustained, but for a lesser amount; or |
| • | the tax position is more likely than not to be sustained, but not in the financial period in which the tax position was originally taken. |
22
Table of Contents
Index to Financial Statements
Under GAAP, in order to be recognized, tax benefits from a tax position must be more likely than not to be sustained upon examination by taxing authorities. The amount recognized is measured as the largest amount of benefit that is greater than 50% likely of being realized upon ultimate settlement. We must adjust our reserves for uncertain tax positions, including any impact on the related interest and penalties, in light of changing facts and circumstances, such as the progress of an examination.
Currently, we are under audit by the Internal Revenue Service (“IRS”) for our 2005 and 2006 federal consolidated income tax filings and other material state taxing jurisdictions for income for filings for the tax years 2005 through 2007. We reported NOLs from tax years back to 1992 on federal and state tax returns currently under, or open to, examination. We believe that our accrual for tax liabilities is adequate for all open audit years based on our assessment of many factors, including past experience and interpretations of tax law. This assessment relies on estimates and assumptions and involves a series of complex judgments about future events.
At December 31, 2009, we had total unrecognized tax benefits of $82.2 million and a recorded liability for uncertain tax positions of $28.3 million. A number of years may elapse before a particular matter for which we have established a reserve is examined and finally resolved, and due to the uncertainty regarding the timing of the completion of income tax examinations, it is difficult to assess when changes in our estimated liability will occur. However, the statutes of limitations in certain state and local jurisdictions are expected to lapse within the next twelve months and may result in a decrease of unrecognized tax benefits and accrued interest of approximately $1.2 million.
Tax-related Contingent Liabilities. In connection with the sale of assets and the divestiture of businesses, we may agree to indemnify the buyer and related parties for certain losses or liabilities incurred by the buyer with respect to liabilities related to the pre-closing operations of the assets sold, including tax liabilities not assumed by the buyer in the transaction.
As with any liability, we have accrued for those tax-related contingent obligations that are considered probable and reasonably estimable. Over time, circumstances could change that might increase the likelihood of payment related to a specific indemnity for which no reserve has been established. Additionally, our estimate about the amount due under to a specific indemnity could change. Either of these situations will result in a change in our net income.
During the year ended December 31, 2009, we reduced certain tax-related contingent liability obligations, while the statutes of limitations for others ultimately lapsed, and resulted in the reduction of a significant portion of the recorded liability, which resulted in a $6.6 million benefit to earnings in discontinued operations.
23
Table of Contents
Index to Financial Statements
Stock-Based Compensation. Under the fair value recognition provisions of GAAP, stock-based compensation cost is measured at the grant date based on the fair value of the award and is recognized as expense over the requisite service period, which is the vesting period. Awards of performance-based restricted stock also require estimates about whether and to what extent applicable performance thresholds are likely to be achieved, which results in vesting of the award according to a predetermined formula. The most commonly granted form of stock-based compensation has been stock options. The fair value of stock options is determined using an option-pricing model that takes into account certain assumptions, including the exercise price, which is typically the stock price at the grant date, the expected life of the grant, the volatility of the underlying stock, the expected dividends on the stock and the risk-free interest rate over the expected life of the grant. The fair value of a stock option estimated at the grant date is not subsequently adjusted for changes in the price of the underlying stock or its volatility, the life of the grant, dividends on the stock or the risk-free interest rate. Generally, changes in the assumptions will have the following impact on the fair value of stock option awards:
| Assumption |
Impact on Fair Value | |
| Exercise price: | ||
| Increased price |
Lower fair value | |
| Decreased price |
Higher fair value | |
| Expected life of grant: | ||
| Increased life |
Higher fair value | |
| Decreased life |
Lower fair value | |
| Volatility of underlying stock: | ||
| Increased volatility |
Higher fair value | |
| Decreased volatility |
Lower fair value | |
| Expected dividends: | ||
| Higher dividends |
Lower fair value | |
| Lower dividends |
Higher fair value | |
| Risk-free interest rate: | ||
| Higher rate |
Lower fair value | |
| Lower rate |
Higher fair value | |
Allowance for Doubtful Accounts. The allowance for doubtful accounts represents our estimate of losses in our accounts receivable resulting from our customers’ failure to make required payments. We continually monitor collections from customers and the age of outstanding balances. Each of our businesses provides for estimated credit losses based on historical analysis of the propensity of their customer base to make required payments.
The following is operational information related to our accounts receivable and related allowance for doubtful accounts:
| As of and for the Years Ended December 31, |
|||||||||
| 2009 | 2008 | 2007 | |||||||
| Bad debt expense as a percentage of total revenue, net |
1.6 | % | 1.3 | % | 0.6 | % | |||
| Write-offs of uncollectable accounts as a percentage of total revenues, net |
2.1 | 1.5 | 0.9 | ||||||
| Allowance for doubtful accounts as a percentage of gross accounts receivable |
4.7 | 5.2 | 4.4 | ||||||
We aggressively pursue collection efforts on overdue accounts and, upon collection of any amounts previously written off, reverse the write-off. If future payments by our customers were to differ from our estimates, we may
24
Table of Contents
Index to Financial Statements
need to increase or decrease our allowance for doubtful accounts. We do not believe those increases or decreases would have a material impact on our long-term consolidated financial position or liquidity, although they could be material to the results of operations of any particular period in which they are recognized.
Provision for Restructuring Costs. Reserves for restructuring costs are estimated costs resulting from our plans and actions to integrate the Company and consolidate certain back office functions. Examples include employee-related termination costs, the cost of terminating or foregoing our rights under our RDAs and the cost of the termination of real estate leases, net of anticipated sublease income, if applicable, and the related write-off of leasehold improvements. Many of these costs are estimated using a discounted cash flow model. The most sensitive inputs into this model are the discount rate, which is based on current rates that would be offered to us for debt with a remaining maturity equivalent to the cash flows, and estimates of sublease income. If the future payments of these costs or amounts of sublease income were to differ from our estimates, we may need to increase or decrease our reserves.
Results of Operations
2009 Compared to 2008
Consolidated Results
Revenue, Net
| Years Ended December 31, |
$ Change Favorable/ (Unfavorable) |
% Change Favorable/ (Unfavorable) |
|||||||||||
| Revenue Component |
2009 | 2008 | |||||||||||
| (Dollars in thousands) | |||||||||||||
| Apartments |
$ | 206,041 | $ | 211,367 | $ | (5,326 | ) | (2.5 | )% | ||||
| New Homes |
18,530 | 39,337 | (20,807 | ) | (52.9 | ) | |||||||
| Total advertising revenue |
224,571 | 250,704 | (26,133 | ) | (10.4 | ) | |||||||
| Distribution |
33,360 | 53,401 | (20,041 | ) | (37.5 | ) | |||||||
| Total revenue, net |
$ | 257,931 | $ | 304,105 | $ | (46,174 | ) | (15.2 | ) | ||||
Apartments
Apartment Guide, ApartmentGuide.com, Rentals.com and RentalHouses.com, representing approximately 91.7% of advertising revenue during the year ended December 31, 2009, decreased 2.5% compared to the same period in 2008. The decrease in revenue was primarily due to a 9.3% decrease in revenue per apartment community served in our Apartment Guide business, which was partially offset by a 7.8% increase in communities served.
Generally, advertising spend by property management company advertisers is driven by local market factors outside our control, including occupancy rates and effective rent levels, which are essentially average rent amounts after giving effect to free months of rent and other incentives. Our historical experience has been that as occupancy rates increase beyond 95%, apartment communities tend to reduce their advertising spend because they require fewer prospective tenants. As occupancy rates fall below 90%, apartment communities tend to cut back on all discretionary spending, including advertising. For these reasons, occupancy rates in excess of 95% or below 90% ordinarily result in a decrease in revenue per community served.
As of December 31, 2009, occupancy rates in Apartment Guide markets ranged from 86% to 97%, with an average of 92% in 2009, compared to 93% in 2008, and with the majority of markets experiencing occupancy levels between 90% and 94%.
During 2009, approximately 1% of revenue from Apartment Guide was derived from markets that had occupancy rates of 95% or higher, which compares to 17% in 2008. Also during 2009, approximately 16% of revenue from Apartment Guide was derived from markets that had occupancy rates below 90%, which compares to 1% in 2008.
25
Table of Contents
Index to Financial Statements
The effects of occupancy rates are mitigated or exacerbated by effective rent levels. In the markets in which we print a directory, effective rents were down 4.5% for 2009 compared to 2008, which served to compound the impact on the revenue of markets with occupancy rates above 90%.
New Homes
The New Home Guide, NewHomeGuide.com and AmericanHomeGuides.com businesses, representing approximately 8.3% of advertising revenue during the year ended December 31, 2009, decreased 52.9% compared to the same period in 2008. The decrease in revenue was due to a 35.0% decrease in revenue per new home community served and a 27.8% decrease in communities served. The decrease in revenue per community served resulted from a decline in standard advertising spending of 50.4% and a decline in premium advertising spending of 66.5% by new home builders, driven by continued weakness in the new home sales sector.
The difficult conditions for new home builders persisted in 2009. We believe pressure in this business will continue over the near term and remain challenging for the foreseeable future. Since June 30, 2008, we have suspended 11 print directories that were considered less effective, and, as of December 31, 2009, we published New Home Guides in 21 markets. We may suspend additional New Home Guide print directories, which could adversely impact our revenue. We continue to focus on online offerings across all markets.
Distribution Revenue
Distribution revenue, which relates to our distribution arm, DistribuTech, decreased by 37.5% during the year ended December 31, 2009 compared to the same period in 2008. The decrease in revenue was due to a 20.5% decrease in the average revenue per pocket due to softness in demand and a 21.4% decrease in the number of pockets sold in our display racks. Our distribution revenue reflects the impact of the reduction in retail locations serviced, and it continues to be adversely impacted by the loss of business from publishers within the resale home, automobile sales and employment classifieds sectors scaling back or ceasing operations or providing an Internet-only product.
As part of our distribution function, we have entered into RDAs with various retail chains, including grocery, drug, convenience, video, fitness and mass merchandise retailers for exclusive rights for distribution related to us and third-party free publications. Since the third quarter of 2008, we have implemented a plan to further reduce our ongoing distribution costs through actions related to RDAs that were underperforming. These actions included renegotiating existing RDAs at more favorable rates and/or for a shorter duration; declining to renew certain RDAs when they expired; and, most significantly during 2009, by recording a restructuring charge of $20.7 million as a result of:
| • | terminating our distribution rights for some or all locations covered by certain RDAs at a negotiated price; |
| • | discontinuing service for and vacating some locations covered by certain RDAs; and |
| • | determining to forego distribution rights for certain locations that are not currently being serviced. |
26
Table of Contents
Index to Financial Statements
Costs and Expenses
| Years Ended December 31, |
$ Change (Favorable)/ Unfavorable |
% Change (Favorable)/ Unfavorable |
|||||||||||||
| Costs and Expenses Component |
2009 | 2008 | |||||||||||||
| (Dollars in thousands) | |||||||||||||||
| Cost of goods sold (exclusive of depreciation and amortization of property and equipment) |
$ | 23,369 | $ | 32,420 | $ | (9,051 | ) | (27.9 | )% | ||||||
| Marketing and selling |
77,635 | 75,722 | 1,913 | 2.5 | |||||||||||
| Distribution and circulation |
60,931 | 85,218 | (24,287 | ) | (28.5 | ) | |||||||||
| General and administrative expenses |
37,906 | 48,700 | (10,794 | ) | (22.2 | ) | |||||||||
| Depreciation and amortization of property and equipment |
13,256 | 14,475 | (1,219 | ) | (8.4 | ) | |||||||||
| Amortization of intangible assets |
2,970 | 2,870 | 100 | 3.5 | |||||||||||
| Provision for restructuring costs |
25,627 | 5,238 | 20,389 | 389.3 | |||||||||||
| Interest expense |
15,670 | 19,338 | (3,668 | ) | (19.0 | ) | |||||||||
| Amortization of deferred financing costs |
915 | 922 | (7 | ) | (0.8 | ) | |||||||||
| Other income, net |
(6,986 | ) | (2,821 | ) | (4,165 | ) | (147.6 | ) | |||||||
| Total cost and expenses |
$ | 251,293 | $ | 282,082 | $ | (30,789 | ) | (10.9 | ) | ||||||
The decrease in cost of goods sold was due to a decrease in the cost of paper, reformatting of our printed directories, including reductions in both paper size and weight, as well as printing fewer directories.
The increase in marketing and selling was primarily due to increased spending related to search engine marketing.
Our distribution and circulation costs decreased as a result of ongoing action with certain of our RDAs since the third quarter of 2008. As is more fully discussed under Distribution Revenue above and in Note 16, “Provision for Restructuring Costs,” to the consolidated financial statements contained elsewhere in this Report, other of our RDAs are part of a restructuring charge we incurred during 2009 related to actions we took to reduce our ongoing distribution costs.
General and administrative expenses declined, primarily due to decreases in corporate overhead and position eliminations of $1.4 million, resulting from the relocation of our headquarters from New York to Norcross in 2008; a $2.2 million reduction in costs associated with the hiring of a new CEO in 2008; a decrease of $0.8 million in stock-based compensation; $6.4 million resulting from insurance premium reductions and lower facilities costs attributable to our cost-cutting initiatives; and a decrease of $0.4 million in professional fees and legal expenses. These decreases were partially offset by an increase of $0.4 million in bad debt expense.
Depreciation and amortization of property and equipment decreased primarily as a result of certain internal-use software becoming fully depreciated during the past twelve months, partially offset by new internal-use software being placed in service during that same period.
As is more fully discussed in Note 7, “Goodwill and Other Intangible Assets,” to the consolidated financial statements contained elsewhere in this Report, we recorded an impairment charge of approximately $0.5 million in 2009 related to one of our advertiser lists. The expected undiscounted cash flows associated with these assets were less than the carrying value, resulting in impairment.
The provision for restructuring costs increased primarily due to a $20.7 million charge for certain of our RDAs that were underperforming. The charge included costs associated with the termination or modification of the agreements; discontinuing service to and vacating some locations covered; and determining to forego distribution rights in certain locations that are not currently being serviced. The 2009 restructuring charge also includes $1.1 million related to office space vacated during 2009 as part of our 2009 restructuring plan. It also includes $2.8
27
Table of Contents
Index to Financial Statements
million related to office space vacated during 2009 as part of the continuation of our 2008 restructuring plan. As a result, there was a $1.3 million increase in charges related to vacated office space in 2009 compared to 2008. The increases resulting from RDAs and vacated office space were partially offset by lower severance of $1.6 million.
Interest expense decreased primarily due to lower average debt levels, as during the second quarter of 2009, we repurchased and retired $14.0 million in principal of our Term Loan B Facility, and during the fourth quarter of 2009, we repurchased and retired another $6.3 million of our Term Loan B Facility. The decrease is also attributable to a lower weighted-average interest rate during 2009 and the redemption of the remaining $2.6 million in 8% Senior Notes outstanding during 2008. The decrease in interest expense was partially offset by an increase in interest related to borrowings against our Revolving Facility. See the discussion under “Liquidity, Capital and Other Resources.”
Other income, net increased due to a gain on debt repurchases during 2009 of $5.0 million, which includes the write off of approximately $0.4 million in deferred financing fees. The corresponding loss in 2008 was approximately $0.1 million. In addition, we recognized a gain on sale of cost-method investments of $2.3 million during 2009. The increase was partially offset by an increase in other-than-temporary impairment charge of $1.5 million in 2009 related to a cost-method investment, compared to $0.9 million in 2008. The 2008 amount also reflects the reversal of a $2.6 million annuity obligation to one of our former CEOs due to his death in 2008, which relieved us of any further obligation to him.
Income Taxes
During 2009, we recorded an income tax expense related to continuing operations of $(2.1) million, compared to a benefit of $27.0 million in 2008, reflecting an effective rate of 31.6% in 2009, compared to (122.6)% in 2008. The variance is primarily due to a 2008 valuation allowance release of approximately $29.3 million on deferred tax assets, which is more fully discussed under “Critical Accounting Policies and Estimates – Income Taxes and Tax-Related Liabilities” above and in Note 11, “Income Taxes,” to the consolidated financial statements contained elsewhere in this Report.
Discontinued Operations
In accordance with GAAP, we have classified the results of our divested entities as discontinued operations in the consolidated statement of operations for all periods presented.
Additional details about our divestitures are included in Note 3, “Discontinued Operations,” to our consolidated financial statements contained elsewhere in this Report.
28
Table of Contents
Index to Financial Statements
The components of discontinued operations included in the consolidated statement of operations are as follows:
| Years Ended December 31, |
$ Change Favorable/ (Unfavorable) |
% Change Favorable/ (Unfavorable) |
|||||||||||||
| 2009 | 2008 | ||||||||||||||
| (Dollars in thousands) | |||||||||||||||
| Total revenue, net |
$ | — | $ | 3,353 | $ | (3,353 | ) | (100.0 | )% | ||||||
| Income (loss) from operations: |
|||||||||||||||
| PRIMEDIA Healthcare |
$ | — | $ | 132 | $ | (132 | ) | (100.0 | )% | ||||||
| Auto Guides division |
— | (1,668 | ) | 1,668 | 100.0 | ||||||||||
| Provision for litigation reserves and settlements |
(3,250 | ) | (6,000 | ) | 2,750 | 45.8 | |||||||||
| Professional fees |
(1,825 | ) | (2,287 | ) | 462 | 20.2 | |||||||||
| Adjustments to accrued operating lease liabilities |
(2,770 | ) | 2,123 | (4,893 | ) | (230.5 | ) | ||||||||
| Insurance-related expenses |
(397 | ) | (1,488 | ) | 1,091 | 73.3 | |||||||||
| Write-off of receivables and other assets |
(259 | ) | (1,164 | ) | 905 | 77.7 | |||||||||
| Tax-related contingencies |
6,638 | 462 | 6,176 | 1,336.8 | |||||||||||
| Other |
(249 | ) | (960 | ) | 711 | 74.1 | |||||||||
| Loss from operations before benefit (provision) for income taxes |
(2,112 | ) | (10,850 | ) | 8,738 | 80.5 | |||||||||
| Gain on sale of businesses: |
|||||||||||||||
| PEM segment |
— | 651 | (651 | ) | (100.0 | ) | |||||||||
| PRIMEDIA Healthcare |
— | 132 | (132 | ) | (100.0 | ) | |||||||||
| Auto Guides division |
— | 42 | (42 | ) | (100.0 | ) | |||||||||
| Benefit for income taxes |
1,060 | 20,466 | (19,406 | ) | (94.8 | ) | |||||||||
| Discontinued operations, net of tax (including gain on sale of businesses) |
$ | (1,052 | ) | $ | 10,441 | $ | (11,493 | ) | (110.1 | ) | |||||
The components of the benefit for income taxes included in discontinued operations are as follows:
| Years Ended December 31, |
$ Change Favorable/ (Unfavorable) |
% Change Favorable/ (Unfavorable) |
|||||||||||||
| 2009 | 2008 | ||||||||||||||
| (Dollars in thousands) | |||||||||||||||
| Provision for tax benefit on pre-tax loss |
$ | (1,779 | ) | $ | 15,046 | $ | (16,825 | ) | (111.8 | )% | |||||
| Benefit for 2008 extended NOL carryback |
9,347 | — | 9,347 | N/A | |||||||||||
| Provision for tax benefit on gain on sale of businesses |
— | 1,227 | (1,227 | ) | (100.0 | ) | |||||||||
| Change in liability for uncertain tax positions |
(6,687 | ) | (1,347 | ) | (5,340 | ) | (396.4 | ) | |||||||
| Changes in estimates included in prior year tax provision |
179 | 5,540 | (5,361 | ) | (96.8 | ) | |||||||||
| Total benefit for income taxes |
$ | 1,060 | $ | 20,466 | $ | (19,406 | ) | (94.8 | ) | ||||||
During the year ended December 31, 2008, we recorded a charge of $4.5 million in discontinued operations related to settlement of the CK Media litigation and $0.5 million related to the settlement of an unrelated case. We paid the total settlements of $5.0 million in March 2009. During the year ended December 31, 2009, the Company recorded an increase in reserves for litigation-related losses of $3.3 million, which is included in discontinued operations, and paid an additional $0.5 million. As of December 31, 2009 and December 31, 2008, the Company had established reserves for litigation-related losses of $5.8 million and $8.0 million, respectively. See Note 20, “Commitments and Contingencies,” to our consolidated financial statements contained elsewhere in this Report for more information.
As is more fully discussed in Note 20, “Commitments and Contingencies,” to our consolidated financial statements contained elsewhere in this Report, in 2005, we sold substantially all of the assets of Workplace Learning for the assumption of ongoing liabilities, while retaining a secondary liability as the assignor of the
29
Table of Contents
Index to Financial Statements
building and satellite time leases. During the fourth quarter of 2009, we reassumed the building lease on behalf of Workplace Learning and entered into a sublease with the current tenant for a portion of the space for a period of 51 months, with an early termination option, which would reduce the term of the sublease to 17 months. The sublease provides for a monthly rent payment and a set reimbursement percentage for operating expenses. We are currently undertaking efforts to sublease additional vacant space in the building to further offset our obligations under the lease. This transaction did not have a material impact on our recorded liability. Historically, each month, our liability has been reduced either by fulfilling our liability as lessee under the building lease or due to a sub-lessee’s or successor-in-interest’s performance under the terms of the sublease, which results in income for us. During the years ended December 31, 2009 and 2008, as a result of the assignee’s or successor in interest’s performance, we recorded $0.3 million and $3.0 million in income, respectively, which is included in adjustments to accrued operating lease liabilities in the table above.
In the third quarter of 2007, we sold our PEM segment. In connection with the sale, we entered into a sublease agreement with the buyer for office space where PEM was headquartered. On April 27, 2009, the buyer filed a petition for reorganization under Chapter 11 of the U.S. Bankruptcy Code in the United States Bankruptcy Court for the District of Delaware. In the bankruptcy proceedings, the sublease was rejected, a new sublease was entered into with the buyer at a reduced rate, and the buyer put certain of the space back to us. As a result, during the second quarter of 2009, we recorded a charge of $2.7 million, which is included in adjustments to accrued operating lease liabilities in the table above, to adjust our remaining liability under our lease for all of the office space, to record brokerage fees related to the new sublease and to write off certain amounts receivable from the buyer.
Insurance-related expenses decreased because during 2009, we experienced a reduction in the cost of settlements for general liability and workers’ compensation claims, primarily for PEM.
The decrease in write-off of receivables and other assets is due to the write-offs, primarily related to PEM, PRIMEDIA Healthcare and the Auto Guides division, during 2008.
There was an increase in tax-related contingencies in 2009 due to a reduction of our estimated liability for tax-related contingencies of $6.6 million during 2009, compared to $0.5 million during 2008, primarily as a result of the lapsing of the statutes of limitations.
From December 31, 2008 to December 31, 2009, there was a total decrease in total benefit for income taxes of $19.4 million. There was a change in pre-tax income on discontinued operation as discussed above that increased the provision for income taxes by $16.8 million year over year. We recorded a tax benefit of $9.3 million related to the elected extended carryback of the 2008 tax loss under the “Workers, Homeownership, and Business Assistance Act of 2009” (the “Assistance Act”). We also recorded an increase to our uncertain tax positions liability related to this extended carryback of the 2008 tax loss decreasing the benefit for income taxes year over year by $5.3 million. Additionally, the recorded changes in estimates included in prior year tax provision compared to filed tax returns decreased by $5.4 million year over year.
During the year ended December 31, 2009, we recognized a tax benefit in discontinued operations of $1.1 million. We recognized $9.3 million tax benefit as a result of our ability, under the Assistance Act, to elect to carryback our 2008 federal NOLs to recover income taxes previously paid. This tax benefit was partially offset by the 2009 tax expense of $(1.7) million and a $(6.6) million expense for uncertain tax positions on certain temporary items.
During the year ended December 31, 2008, we recognized a tax benefit of $16.3 million in discontinued operations, primarily as a result of our ability to carry back a projected 2008 NOL against taxes paid on a portion of the 2007 gain on divestitures of certain subsidiaries. The current year NOL arises primarily from the reversal of differences between the carrying value and tax basis in a group of PRIMEDIA Healthcare intangible assets triggered by the sale of those assets during 2008. We also recognized a tax benefit of $4.2 million in discontinued operations during the year ended December 31, 2008, primarily as a result of changes in our estimate of our ability to utilize certain NOLs to offset 2007 taxable income.
30
Table of Contents
Index to Financial Statements
2008 Compared to 2007
Consolidated Results
Revenue, Net
| Years Ended December 31, |
$ Change Favorable/ (Unfavorable) |
% Change Favorable/ (Unfavorable) |
|||||||||||
| Revenue Component |
2008 | 2007 | |||||||||||
| (Dollars in thousands) | |||||||||||||
| Apartments |
$ | 211,367 | $ | 206,424 | $ | 4,943 | 2.4 | % | |||||
| New Homes |
39,337 | 50,740 | (11,403 | ) | (22.5 | ) | |||||||
| Total advertising revenue |
250,704 | 257,164 | (6,460 | ) | (2.5 | ) | |||||||
| Distribution |
53,401 | 57,636 | (4,235 | ) | (7.3 | ) | |||||||
| Total revenue, net |
$ | 304,105 | $ | 314,800 | $ | (10,695 | ) | (3.4 | ) | ||||
Apartments
Apartment Guide, ApartmentGuide.com, Rentals.com and RentalHouses.com, representing approximately 84.3% of advertising revenue during the year ended December 31, 2008, increased 2.4% compared to the same period in 2007. The increase in revenue was primarily due to a 3.3% increase in Apartment Guide communities served, partially offset by a 0.7% decrease in revenue per community. The increase in apartment communities served and the decrease in revenue per community served were both a result of special customer incentives and promotional offerings designed to attract additional apartment communities. Apartment Guide also benefited from the opening of the Greenville, South Carolina Apartment Guide in March 2008, which contributed approximately $0.5 million in revenue in 2008.
Approximately 17% of the 2008 revenue from Apartment Guide was derived from markets that had high occupancy rates, which we consider to be 95% or higher. This compares to 28% in 2007. As of December 31, 2008, occupancy rates in Apartment Guide markets ranged from 85% to 97%, with an average of 93.0% in 2008, compared to 93.6% in 2007, and with the majority of markets experiencing occupancy levels between 90% and 95%.
Generally, premium print advertising spending by property management company advertisers is driven by local market factors outside our control, including occupancy rates and effective rent levels. For example, as occupancy rates increase beyond 95%, apartment communities tend to reduce their advertising spend because they require fewer prospective tenants. As occupancy rates fall below 90%, apartment communities tend to cut back on all discretionary spending, including advertising. For these reasons, occupancy rates in excess of 95% or below 90% ordinarily result in a decrease in revenue per community served. However, the effects of occupancy rates can be mitigated or exacerbated by effective rent levels, which are essentially average rent amounts after giving effect to free months of rent and other incentives.
New Homes
The New Home Guide, NewHomeGuide.com and AmericanHomeGuides.com businesses, representing approximately 15.7% of advertising revenue during the year ended December 31, 2008, decreased 22.5% compared to the same period in 2007. The decrease in revenue was primarily due to a 19.4% decrease in new home communities served and a 4.0% decrease in revenue per community served. These resulted from a decline in standard advertising spending of 19% and a decline in premium advertising spending of 32% by new home builders, driven by continued weakness in the new home sales sector.
The difficult conditions for new home builders caused pressure throughout 2008, as the challenging mortgage environment and declining home prices worsened.
31
Table of Contents
Index to Financial Statements
Distribution Revenue
Distribution revenue, which relates to our distribution function, DistribuTech, decreased by 7.3% during the year ended December 31, 2008 compared to the same period in 2007. There was a 0.9% increase in the number of pockets sold in our display racks during 2008; however, this growth was more than offset by an 8.2% decrease in the average revenue per pocket due to softness in demand. Our distribution revenue continues to be adversely impacted by the loss of business from publishers within the resale home, automobile sales and employment classifieds sectors scaling back or ceasing operations or providing an Internet-only product.
Costs and Expenses
| Years Ended December 31, |
$ Change (Favorable)/ Unfavorable |
% Change (Favorable)/ Unfavorable |
||||||||||||
| Costs and Expenses Component |
2008 | 2007 | ||||||||||||
| (Dollars in thousands) | ||||||||||||||
| Cost of goods sold (exclusive of depreciation and amortization of property and equipment) |
$ | 32,420 | $ | 34,655 | $ | (2,235 | ) | (6.4 | )% | |||||
| Marketing and selling |
75,722 | 81,064 | (5,342 | ) | (6.6 | ) | ||||||||
| Distribution and circulation |
85,218 | 83,561 | 1,657 | 2.0 | ||||||||||
| General and administrative expenses |
48,700 | 57,747 | (9,047 | ) | (15.7 | ) | ||||||||
| Depreciation and amortization of property and equipment |
14,475 | 12,612 | 1,863 | 14.8 | ||||||||||
| Amortization of intangible assets |
2,870 | 3,492 | (622 | ) | (17.8 | ) | ||||||||
| Provision for restructuring costs |
5,238 | 10,496 | (5,258 | ) | (50.1 | ) | ||||||||
| Interest expense |
19,338 | 77,660 | (58,322 | ) | (75.1 | ) | ||||||||
| Amortization of deferred financing costs |
922 | 1,743 | (821 | ) | (47.1 | ) | ||||||||
| Other (income) expense, net |
(2,821 | ) | 40,176 | (42,997 | ) | (107.0 | ) | |||||||
| Total cost and expenses |
$ | 282,082 | $ | 403,206 | $ | (121,124 | ) | (30.0 | ) | |||||
The decrease in cost of goods sold was due to the reformatting of our printed directories, including reductions in both paper size and weight, as well as printing fewer directories, partially offset by the increased cost of paper.
The decrease in marketing and selling expenses was primarily due to a reduction of approximately 60 employees compared to the prior year, resulting in a $4.0 million reduction in expense. In addition, other marketing-related activities declined $1.2 million.
General and administrative expenses declined, primarily due to decreases in corporate overhead of $18.1 million, resulting from the completion of the relocation of our headquarters from New York to Norcross, audit and other professional fees of $2.6 million, and recovery, under our primary directors and officers liability insurance, of approximately $1.0 million of certain costs incurred prior to 2008 in connection with a derivative lawsuit that is described in Note 20, “Commitments and Contingencies,” to the consolidated financial statements contained elsewhere in this Report. These declines were partially offset by increases in compensation-related expense for our former and new CEOs of approximately $2.4 million, $5.2 million in costs incurred in the movement of our headquarters, $1.1 million in additional stock-based compensation expense, $1.9 million in bad debt expense and $1.9 million in additional legal expense, primarily to defend ourselves against the derivative lawsuit.
Depreciation and amortization of property and equipment increased primarily as a result of internal-use software being placed in service.
The provision for restructuring costs was lower due to a decrease of $5.5 million in severance expense for positions that were eliminated. This was offset by an increase of $0.2 million in lease-related expenses, consisting of an additional $0.8 million for office closures offset by a $0.6 million benefit in 2008 arising from revised estimates of future rent expense and sublease income from offices closed in 2007 and prior.
32
Table of Contents
Index to Financial Statements
Interest expense decreased primarily due to lower average debt levels, as during the third quarter of 2007, we repaid all $492.5 million in principal of our term loan, redeemed all $410.0 million in principal of our 8 7/8% Senior Notes due 2011, redeemed $292.2 million in principal of our 8% Senior Notes due 2013 (the “8% Senior Notes”) and redeemed all $122.5 million in principal of our Senior Floating Rate Notes due 2010. The decrease is also attributable to the redemption of the remaining $2.6 million in 8% Senior Notes outstanding during 2008. The decrease in interest expense was partially offset by an increase in interest related to borrowings against our Revolving Facility. See the discussion under “Liquidity, Capital and Other Resources.”
Other (income) expense, net increased due to a loss on debt redemptions, during 2007, on the debt instruments mentioned above of $44.3 million. The corresponding loss in 2008 was approximately $0.1 million. The 2008 amount also reflects the reversal of a $2.6 million annuity obligation to one of our former CEOs due to his death in 2008, which relieved us of any further obligation to him.
Income Taxes
During 2008, we recorded a benefit from income taxes related to continuing operations of $27.0 million, compared to $32.7 million in 2007, reflecting an effective rate of (122.6)% in 2008, compared to (37.0)% in 2007. The variance is primarily due to 2008 valuation allowance release of approximately $29.3 million on deferred tax assets. See the discussion under “Critical Accounting Policies and Estimates – Income Taxes and Tax-Related Liabilities.”
33
Table of Contents
Index to Financial Statements
Discontinued Operations
In accordance with GAAP, we have classified the results of our divested entities as discontinued operations in the consolidated statement of operations for all periods presented.
The components of discontinued operations included in the consolidated statement of operations are as follows:
| Years Ended December 31, |
$ Change Favorable/ (Unfavorable) |
% Change Favorable/ (Unfavorable) |
|||||||||||||
| 2008 | 2007 | ||||||||||||||
| (Dollars in thousands) | |||||||||||||||
| Total revenue, net |
$ | 3,353 | $ | 358,794 | $ | (355,441 | ) | (99.1 | )% | ||||||
| Income (loss) from operations: |
|||||||||||||||
| PEM segment |
$ | — | $ | 69,683 | $ | (69,683 | ) | (100.0 | )% | ||||||
| Channel One |
— | (4,104 | ) | 4,104 | 100.0 | ||||||||||
| Films Media Group |
— | 622 | (622 | ) | (100.0 | ) | |||||||||
| PRIMEDIA Healthcare |
132 | 446 | (314 | ) | (70.4 | ) | |||||||||
| Auto Guides division |
(1,668 | ) | (8,006 | ) | 6,338 | 79.2 | |||||||||
| Provision for litigation reserves and settlements |
(6,000 | ) | (2,000 | ) | (4,000 | ) | (200.0 | ) | |||||||
| Professional fees |
(2,287 | ) | (768 | ) | (1,519 | ) | (197.8 | ) | |||||||
| Adjustments to accrued operating lease liabilities |
2,123 | 1,030 | 1,093 | 106.1 | |||||||||||
| Insurance-related expenses |
(1,488 | ) | (742 | ) | (746 | ) | (100.5 | ) | |||||||
| Write-off of receivables and other assets |
(1,164 | ) | (1,091 | ) | (73 | ) | (6.7 | ) | |||||||
| Deal and other costs related to the divesture of PEM segment |
— | (3,675 | ) | 3,675 | 100.0 | ||||||||||
| Tax-related contingencies |
462 | (481 | ) | 943 | 196.0 | ||||||||||
| Other |
(960 | ) | 13 | (973 | ) | (7,484.6 | ) | ||||||||
| (Loss) income from operations before benefit (provision) for income taxes |
(10,850 | ) | 50,927 | (61,777 | ) | (121.3 | ) | ||||||||
| Gain (loss) on sale of businesses: |
|||||||||||||||
| Outdoors group |
— | 57,547 | (57,547 | ) | (100.0 | ) | |||||||||
| PEM segment |
651 | 460,988 | (460,337 | ) | (99.9 | ) | |||||||||
| Channel One |
— | (7,050 | ) | 7,050 | 100.0 | ||||||||||
| Films Media Group |
— | 170 | (170 | ) | (100.0 | ) | |||||||||
| PRIMEDIA Healthcare |
132 | — | 132 | N/A | |||||||||||
| Auto Guides division |
42 | — | 42 | N/A | |||||||||||
| Final adjustments for disposition in previous years |
— | (674 | ) | 674 | 100.0 | ||||||||||
| Benefit (provision) for income taxes |
20,466 | (14,785 | ) | 35,251 | 238.4 | ||||||||||
| Discontinued operations, net of tax (including gain (loss) on sale of businesses) |
$ | 10,441 | $ | 547,123 | $ | (536,682 | ) | (98.1 | ) | ||||||
The components of the benefit for income taxes included in discontinued operations are as follows:
| Years Ended December 31, |
$ Change Favorable/ (Unfavorable) |
% Change Favorable/ (Unfavorable) |
|||||||||||||
| 2008 | 2007 | ||||||||||||||
| (Dollars in thousands) | |||||||||||||||
| Provision for tax benefit on pre-tax income (loss) |
$ | 15,046 | $ | 28,937 | $ | (13,891 | ) | (48.0 | )% | ||||||
| Provision for tax benefit (expense) on gain (loss) on sale of businesses |
1,227 | (44,901 | ) | 46,128 | 102.7 | ||||||||||
| Change in liability for uncertain tax positions |
(1,347 | ) | (4,911 | ) | 3,564 | 72.6 | |||||||||
| Changes in estimates included in prior year tax provision |
5,540 | 6,090 | (550 | ) | (9.0 | ) | |||||||||
| Total benefit (expense) for income taxes |
$ | 20,466 | $ | (14,785 | ) | $ | 35,251 | 238.4 | |||||||
34
Table of Contents
Index to Financial Statements
During 2008, we had an increase in costs for professional fees, including legal fees. This increase was partially offset by a decrease in adjustments to accrued operating lease liabilities primarily related to Workplace Learning, as well as, a decrease in deal and other costs related to the divesture of PEM’s segment in 2007.
From December 31, 2007 to December 31, 2008, there was a total increase in total benefit for income taxes of $35.3 million. As a result of the gains on the sale of businesses during 2007, we recorded a provision of $44.9 million compared to a benefit of $1.2 million in 2008, creating a $46.1 million change year over year. We also recorded a decrease to our uncertain tax positions liability creating a decrease in the provision for income taxes year over year by $3.6 million. These favorable changes were partially offset by a change in pre-tax income (loss) on discontinued operation as discussed above that decreased the provision for tax benefit on pre-tax income (loss) by $13.9 million year over year due to a decrease in 2008 pre-tax loss and a decrease in deferred tax assets being utilized in 2008.
Additional details about our divestitures are included in Note 3, “Discontinued Operations,” to our consolidated financial statements contained elsewhere in this Report.
As is more fully discussed in Note 20, “Commitments and Contingencies,” to our consolidated financial statements contained elsewhere in this Report, in 2005, we sold substantially all of the assets of Workplace Learning for the assumption of ongoing liabilities, while retaining a secondary liability as the assignor of the building and satellite time leases. During the fourth quarter of 2009, we reassumed the building lease on behalf of Workplace Learning and entered into a sublease with the current tenant for a period of 51 months, with an early termination option, which would reduce the term of the sublease to 17 months. The sublease provides for a monthly rent payment and a set reimbursement percentage for operating expenses. We are currently undertaking efforts to sublease additional vacant space in the building to further offset our obligations under the lease. This transaction did not have a material impact on our recorded liability. Historically, each month, our liability has been reduced either by fulfilling our liability as lessee under the building lease or due to a sub-lessee’s or successor-in-interest’s performance under the terms of the sublease, which results in income for us. During the year ended December 31, 2009 and 2008, as a result of the assignee’s or successor in interest’s performance, we recorded $0.3 million and $3.0 million in income, respectively, which is included in discontinued operations.
During the year ended December 31, 2008, we recorded a charge of $4.5 million in discontinued operations related to settlement of the CK Media litigation and $0.5 million related to the settlement of an unrelated case. Additionally, during the years ended December 31, 2008 and 2007, we recorded charges of $1.0 million and $2.0 million in discontinued operations, respectively, for various other litigation-related losses. See Note 20, “Commitments and Contingencies,” to our consolidated financial statements contained elsewhere in this Report for more information.
During the year ended December 31, 2008, we recognized a tax benefit of $16.3 million in discontinued operations, primarily as a result of our ability to carry back a projected 2008 NOL against taxes paid on a portion of the 2007 gain on divestitures of certain subsidiaries. The 2008 NOL arose primarily from the reversal of differences between the carrying value and tax basis in a group of PRIMEDIA Healthcare intangible assets triggered by the sale of those assets during 2008. We also recognized a tax benefit of $4.2 million in discontinued operations during the year ended December 31, 2008, primarily as a result of changes in our estimate of our ability to utilize certain NOLs to offset 2007 taxable income.
35
Table of Contents
Index to Financial Statements
Liquidity, Capital and Other Resources
Highlights of our liquidity position are as follows:
| As of and for the Years Ended December 31, | ||||||||||||
| 2009 | 2008 | 2007 | ||||||||||
| (Dollars in thousands) | ||||||||||||
| Cash and cash equivalents |
$ | 9,472 | $ | 31,470 | $ | 14,709 | ||||||
| Current assets |
52,759 | 89,036 | 72,516 | |||||||||
| Current liabilities |
56,103 | 77,518 | 72,853 | |||||||||
| Working capital |
(3,344 | ) | 11,518 | (337 | ) | |||||||
| Current debt (current maturities of long-term debt and revolving credit facility) |
2,922 | 16,245 | 5,262 | |||||||||
| Long-term debt |
222,349 | 245,531 | 247,575 | |||||||||
| Net debt (current debt and long-term debt, less cash and cash equivalents) |
215,799 | 230,306 | 238,128 | |||||||||
| Cash flows from operating activities |
31,650 | 21,096 | (45,545 | ) | ||||||||
| Cash flows from investing activities |
(8,951 | ) | 468 | 1,261,589 | ||||||||
| Cash flows from financing activities |
(44,697 | ) | (4,803 | ) | (1,207,163 | ) | ||||||
| Additions to property and equipment |
11,211 | 12,977 | 20,352 | |||||||||
| Capital lease payments |
607 | 506 | 739 | |||||||||
| Free cash flow (net cash provided by operating activities adjusted for additions to property, equipment and other, net, exclusive of acquisitions, and capital lease payments) |
19,832 | 7,613 | (66,636 | ) | ||||||||
| Cash dividends paid |
12,347 | 12,359 | 95,010 | |||||||||
| Repayments of senior notes and borrowings under credit agreements |
30,631 | 5,179 | 1,388,535 | |||||||||
| Unused bank commitments |
85,174 | 70,966 | 91,715 | |||||||||
| Leverage ratio (as defined in bank credit facility) |
2.8 | 3.2 | 2.9 | |||||||||
Overview
Management believes that our cash flows from operating activities will generally be sufficient to support our business operations and service our debt. Our cash flows from operating activities are somewhat seasonal in nature, primarily due to the timing of payments made under the terms of our RDAs, which generally occur in the first half of the year. To the extent that our cash flows from operating activities are not sufficient to meet our liquidity needs, including funds for our capital expenditures, our payment of dividends to stockholders and our contractual obligations, we may, from time to time, utilize amounts available under our $88.0 million Revolving Facility, which is discussed in further detail under Financing Arrangements below.
Outlook
Over the next 12 months, our primary uses of cash are expected to represent expenditures related to:
| • | the ongoing operations of our business; |
| • | capital expenditures of $13.0 million to $17.0 million; |
| • | required principal payments of our outstanding debt, including capital leases, of $2.9 million; |
| • | interest on our outstanding debt; |
| • | obligations arising from RDA restructuring activities of $13.4 million; |
| • | obligations arising from other restructuring activities, including real estate leases of $10.3 million; |
| • | the payment of dividends to our stockholders; |
| • | the opportunistic repurchase of outstanding shares of our common stock, if any; and |
| • | the opportunistic repurchase of debt outstanding under our Term Loan B Facility, if any. |
36
Table of Contents
Index to Financial Statements
Working Capital
The decrease in working capital, representing current assets less current liabilities, in 2009 compared to 2008 was primarily due to the repayment, during 2009, of the $13.2 million outstanding under our Revolving Facility outstanding at December 31, 2008. The increase in 2008 compared to 2007 was primarily due to an increase in our current deferred tax assets resulting from the partial release of our deferred tax asset valuation allowance as well as the current deferred tax asset resulting from our 2008 NOL that we used to offset 2007 taxable income. The deferred tax assets were classified as current because we expected to realize the benefit within the following twelve months.
Net Debt
During 2009, we reduced our net debt by $14.5 million, primarily through the repurchase and retirement of $20.3 million in principal of our Term Loan B Facility and the repayment of $13.2 million outstanding under our Revolving Facility. During 2008, we reduced our net debt by $7.8 million, primarily through the $2.5 million scheduled repayment of principal under our Term Loan B Facility and the early redemption of the outstanding $2.6 million of our 8% Senior Notes.
Cash Flows from Operating Activities
Our cash flows from operating activities are summarized as follows:
| Years Ended December 31, |
$ Change From 2008 |
$ Change From 2007 |
||||||||||||||||||
| 2009 | 2008 | 2007 | ||||||||||||||||||
| (Dollars in thousands) | ||||||||||||||||||||
| Net income |
$ | 3,488 | $ | 59,468 | $ | 491,445 | $ | (55,980 | ) | $ | (431,977 | ) | ||||||||
| Adjustments to reconcile net (loss) income to net cash provided by (used in) operating activities: |
— | |||||||||||||||||||
| Depreciation and amortization |
17,141 | 18,407 | 19,692 | (1,266 | ) | (1,285 | ) | |||||||||||||
| Impairment of cost-method investment |
1,500 | 914 | — | 586 | 914 | |||||||||||||||
| Gain on sale of cost-method investments |
(2,260 | ) | — | — | (2,260 | ) | — | |||||||||||||
| Gain on sale of businesses, net |
— | (2,049 | ) | (459,135 | ) | 2,049 | 457,086 | |||||||||||||
| Accretion of acquisition obligation and other |
— | — | 3,240 | — | (3,240 | ) | ||||||||||||||
| (Gain) loss on repurchase and redemption of debt |
(4,967 | ) | 103 | 44,339 | (5,070 | ) | (44,236 | ) | ||||||||||||
| Stock-based compensation |
1,281 | 2,108 | 486 | (827 | ) | 1,622 | ||||||||||||||
| Deferred income taxes |
5,626 | (27,233 | ) | (59,796 | ) | 32,859 | 32,563 | |||||||||||||
| Bad debt expense |
4,100 | 3,817 | 3,282 | 283 | 535 | |||||||||||||||
| Loss on disposal of property and equipment |
18 | 1,251 | 5,963 | (1,233 | ) | (4,712 | ) | |||||||||||||
| (Increase) decrease in: |
||||||||||||||||||||
| Accounts receivable, net |
(919 | ) | (2,310 | ) | (7,226 | ) | 1,391 | 4,916 | ||||||||||||
| Inventories |
504 | (194 | ) | 2,868 | 698 | (3,062 | ) | |||||||||||||
| Prepaid expenses and other |
9,425 | (21,162 | ) | (351 | ) | 30,587 | (20,811 | ) | ||||||||||||
| (Decrease) increase in: |
||||||||||||||||||||
| Accounts payable |
(3,831 | ) | 2,690 | (4,870 | ) | (6,521 | ) | 7,560 | ||||||||||||
| Accrued expenses and other |
(2,347 | ) | (7,157 | ) | (87,392 | ) | 4,810 | 80,235 | ||||||||||||
| Deferred revenue |
(1,700 | ) | (1,652 | ) | (1,726 | ) | (48 | ) | 74 | |||||||||||
| Other non-current liabilities |
4,591 | (5,910 | ) | 442 | 10,501 | (6,352 | ) | |||||||||||||
| Other, net |
— | 5 | 3,194 | (5 | ) | (3,189 | ) | |||||||||||||
| Net cash provided by (used in) operating activities |
$ | 31,650 | $ | 21,096 | $ | (45,545 | ) | $ | 10,554 | $ | 66,641 | |||||||||
Net cash provided by operating activities increased in 2009 from 2008, primarily due to less cash paid for interest and taxes of $3.4 million and $27.9 million, respectively, offset by less cash flows provided by operating activities
37
Table of Contents
Index to Financial Statements
of businesses that were discontinued and sold in the first half of 2008. For purposes of calculating cash provided by or used in operating activities, discontinued operations are included until sold or shut down; therefore, these discontinued operations did not contribute to operating activities for the full year in which the sale occurred.
Net cash provided by operating activities increased in 2008 from 2007, primarily due to less cash paid for interest and taxes of $70.7 million and $34.0 million, respectively, offset by less cash flows provided by operating activities of businesses that were discontinued and sold in 2007 and the first half of 2008.
Cash Flows from Investing Activities
Our cash flows from investing activities are summarized as follows:
| Years Ended December 31, |
$ Change From 2008 |
$ Change From 2007 |
||||||||||||||||||
| 2009 | 2008 | 2007 | ||||||||||||||||||
| (Dollars in thousands) | ||||||||||||||||||||
| Purchase of available for sale securities |
$ | — | $ | — | $ | (247,426 | ) | $ | — | $ | 247,426 | |||||||||
| Proceeds from sales of available for sale securities |
— | 15,425 | 232,001 | (15,425 | ) | (216,576 | ) | |||||||||||||
| Payments for investments |
— | (14 | ) | — | 14 | (14 | ) | |||||||||||||
| Proceeds from sale of cost-method investments |
2,260 | — | 289 | 2,260 | (289 | ) | ||||||||||||||
| Additions to property and equipment |
(11,211 | ) | (12,977 | ) | (20,352 | ) | 1,766 | 7,375 | ||||||||||||
| Payments for businesses acquired, net of cash acquired |
— | — | (34,129 | ) | — | 34,129 | ||||||||||||||
| Payments related to the sale of businesses |
— | (4,355 | ) | (21,420 | ) | 4,355 | 17,065 | |||||||||||||
| Proceeds from sale of businesses |
— | 2,389 | 1,352,626 | (2,389 | ) | (1,350,237 | ) | |||||||||||||
| Net cash (used in) provided by investing activities |
$ | (8,951 | ) | $ | 468 | $ | 1,261,589 | $ | (9,419 | ) | $ | (1,261,121 | ) | |||||||
The decrease in net cash provided by investing activities in 2009 from 2008 was primarily due to the cash proceeds received from the sale of available for sale securities during 2008 and payments related to the sale of businesses in 2008.
The decrease in net cash provided by investing activities in 2008 from 2007 was primarily due to the cash proceeds received from the sale of businesses during 2007. Through the end of 2007, we used auction rate securities as an investment vehicle for our excess cash. We discontinued this practice in early 2008.
Cash Flows from Financing Activities
Our cash flows from financing activities are summarized as follows:
| Years Ended December 31, | $ Change From 2008 |
$ Change From 2007 |
||||||||||||||||||
| 2009 | 2008 | 2007 | ||||||||||||||||||
| (Dollars in thousands) | ||||||||||||||||||||
| Payment of dividends on common stock |
$ | (12,347 | ) | $ | (12,359 | ) | $ | (95,010 | ) | $ | 12 | $ | 82,651 | |||||||
| Net (repayments) borrowings under revolving credit facility |
(13,200 | ) | 13,200 | — | (26,400 | ) | 13,200 | |||||||||||||
| Payments for deferred and other financing fees |
(510 | ) | — | (6,287 | ) | (510 | ) | 6,287 | ||||||||||||
| Payments for repurchase and redemption of debt |
(14,931 | ) | (2,679 | ) | (859,735 | ) | (12,252 | ) | 857,056 | |||||||||||
| Borrowings under credit agreements |
— | — | 282,800 | — | (282,800 | ) | ||||||||||||||
| Repayments of borrowings under credit agreements |
(2,500 | ) | (2,500 | ) | (528,800 | ) | — | 526,300 | ||||||||||||
| Capital lease payments |
(607 | ) | (506 | ) | (739 | ) | (101 | ) | 233 | |||||||||||
| (Payments) proceeds related to issuances of common stock, net of value of shares withheld for employee taxes |
(175 | ) | 42 | 722 | (217 | ) | (680 | ) | ||||||||||||
| Repurchases of common stock |
(427 | ) | — | — | (427 | ) | — | |||||||||||||
| Other |
— | (1 | ) | (114 | ) | 1 | 113 | |||||||||||||
| Net cash used in financing activities |
$ | (44,697 | ) | $ | (4,803 | ) | $ | (1,207,163 | ) | $ | (39,894 | ) | $ | 1,202,360 | ||||||
38
Table of Contents
Index to Financial Statements
The increase in net cash used in financing activities in 2009 from 2008 was primarily due to net borrowings in 2008 of $7.5 million compared to net repayment of debt of approximately $31.2 million in 2009.
The decrease in net cash used in financing activities in 2008 from 2007 was primarily due to net borrowings in 2008 of $7.5 million compared to net repayment of debt of approximately $1,106.5 million in 2007, as well as a decrease in cash dividends paid on our common stock of $82.7 million.
Free Cash Flow
We believe that the use of free cash flow enables our chief operating decision maker, our President and CEO, to make decisions based on our cash resources. We also believe that free cash flow provides useful information to investors as it is considered to be an indicator of our liquidity, including our ability to reduce debt and make strategic investments.
Free cash flow is not intended to represent cash flows from operating activities as determined in conformity with GAAP. Free cash flow, as presented, may not be comparable to similarly titled measures reported by other companies since not all companies necessarily calculate free cash flow in an identical manner, and therefore, it is not necessarily an accurate measure of comparison between companies.
The following table presents our free cash flow:
| Years Ended December 31, | $ Change From 2008 |
$ Change From 2007 | |||||||||||||||||
| 2009 | 2008 | 2007 | |||||||||||||||||
| (Dollars in thousands) | |||||||||||||||||||
| Net cash provided by (used in) operating activities |
$ | 31,650 | $ | 21,096 | $ | (45,545 | ) | $ | 10,554 | $ | 66,641 | ||||||||
| Additions to property and equipment |
(11,211 | ) | (12,977 | ) | (20,352 | ) | 1,766 | 7,375 | |||||||||||
| Capital lease payments |
(607 | ) | (506 | ) | (739 | ) | (101 | ) | 233 | ||||||||||
| Free cash flow |
$ | 19,832 | $ | 7,613 | $ | (66,636 | ) | $ | 12,219 | $ | 74,249 | ||||||||
Our free cash flow improved in 2009, primarily due to the lower cash paid for income taxes, primarily related to divestitures, lower debt service, due to a lower average balance of debt outstanding, and lower additions to property and equipment. This was partially offset by the fact that, for purposes of calculating cash provided by or used in operating activities, discontinued operations are included until sold or shut down; therefore, these discontinued operations did not contribute to operating activities for the full year in which the sale occurred.
Our free cash flow improved in 2008, primarily due to the lower cash paid for income taxes, primarily related to divestitures, lower debt service, due to a lower average balance of debt outstanding, and lower additions to property and equipment. This was partially offset by the fact that, for purposes of calculating cash provided by or used in operating activities, discontinued operations are included until sold or shut down; therefore, these discontinued operations did not contribute to operating activities for the full year in which the sale occurred.
Financing Arrangements
Bank Credit Facilities
On August 1, 2007, we completed the financing for a $350.0 million senior secured bank credit facility. The new bank credit facility provides for two loan facilities: (1) a revolving credit facility with aggregate commitments of $100.0 million (the “Revolving Facility”), which matures on August 1, 2013, and (2) a Term Loan B credit facility in an aggregate principal amount of $250.0 million (the “Term Loan B Facility”), which matures on August 1, 2014 (the “Term Loan B Maturity Date”). We capitalized approximately $6.3 million of financing costs associated with the new credit facilities. Amounts borrowed under the Revolving Facility bear interest, at our option, at an annual rate of either the base rate plus an applicable margin ranging from 0.625% to 1.00% or
39
Table of Contents
Index to Financial Statements
the eurodollar rate plus an applicable margin ranging from 1.625% to 2.00%. The weighted-average interest rate on the Revolving Facility at December 31, 2009 was 1.98%. The Term Loan B Facility bears interest, at our option, at an annual rate of either the base rate plus an applicable margin ranging from 1.00% to 1.25% or the eurodollar rate plus an applicable margin ranging from 2.00% to 2.25%. The weighted-average interest rate on the Term Loan B Facility at December 31, 2009 was 2.50%.
On June 30, 2009, our bank credit facility was amended (the “Amendment”). Among other things, the Amendment gives us the right, subject to the conditions set forth therein, to prepay or otherwise acquire with or for cash, on either a pro rata or non-pro rata basis, principal outstanding under the Term Loan B Facility and held by lenders who consent to such prepayment or acquisition, at a discount to the par value of such principal at any time and from time to time on and after June 30, 2009 and on or prior to the second anniversary of such date; provided that the aggregate amounts we expend in connection with all such prepayments or acquisitions do not exceed $35.0 million. All such principal prepaid or acquired will be retired and extinguished and deemed paid effective upon such prepayment or acquisition.
The Amendment also memorializes the reduction of the Revolving Facility commitment of Lehman Commercial Paper Inc., a subsidiary of Lehman Brothers Inc. (“Lehman”) to $0.0 million, and, as a consequence thereof, the total capacity under the Revolving Facility has now been confirmed to have been reduced by $12.0 million to $88.0 million. We believed and previously disclosed that the total capacity under the Revolving Facility had been effectively reduced by $12.0 million as a result of bankruptcy proceedings related to Lehman Brothers Holdings Inc., the parent company of Lehman. The commitment under the Revolving Facility for each other lender remains unchanged from each such lender’s commitment immediately prior to such reduction. Additionally, effective June 30, 2009, Lehman ceased to be a co-documentation agent under the bank credit facility. We do not presently expect that any lender under our Revolving Facility will be unable to fund their portion of amounts we may borrow in the future.
In connection with the Amendment, we incurred approximately $0.5 million in modification fees, which were paid to the creditors and will be expensed over the remaining term of the loan.
There are no scheduled commitment reductions under the Revolving Facility. The loan under the Term Loan B Facility is subject to scheduled repayment in quarterly installments of approximately $0.6 million payable on March 31, June 30, September 30 and December 31 of each year, followed by a final repayment of $213.5 million on the Term Loan B Maturity Date. Additionally, through August 1, 2009, we were required to manage our interest rate risk arising from the Term Loan B Facility through the utilization of derivative financial instruments in a notional amount equal to at least 35% of the Term Loan B Facility principal outstanding. We had derivative financial instruments with a notional amount equal to 89.0% of the unpaid principal balance of the Term Loan B Facility in a designated hedging relationship at December 31, 2009.
The bank credit facilities consisted of the following as of December 31, 2009:
| Revolving Facility |
Term Loan B Facility |
Total | ||||||||||
| (Dollars in thousands) | ||||||||||||
| Bank credit facilities |
$ | 88,000 | $ | 224,700 | $ | 312,700 | ||||||
| Borrowings outstanding |
— | (224,700 | ) | (224,700 | ) | |||||||
| Letters of credit outstanding |
(2,826 | ) | — | (2,826 | ) | |||||||
| Unused bank commitments |
$ | 85,174 | $ | — | $ | 85,174 | ||||||
The use of our cash and unused credit facilities is subject to customary conditions contained in our debt agreement.
Under the new bank credit facilities agreement, we have agreed to pay commitment fees at a per annum rate of either 0.375%, 0.300% or 0.250%, depending on our debt to EBITDA ratio, as defined in the bank credit facilities agreement, on the daily average aggregate unutilized commitment under the revolving loan
40
Table of Contents
Index to Financial Statements
commitment. The weighted-average of our commitment fees under the new bank credit facilities agreement for 2009, 2008 and for the five months it was outstanding during 2007 was 0.33%, 0.32% and 0.36%, respectively. We also have agreed to pay certain fees with respect to the issuance of letters of credit and an annual administration fee. From time to time, we may pay amendment fees under our bank credit facilities agreement.
The bank credit facilities agreement, among other things, limits our ability to change the nature of our businesses, incur indebtedness, create liens, sell assets, engage in mergers, consolidations or transactions with affiliates, make investments in or loans to certain subsidiaries, issue guarantees and make certain restricted payments, including dividend payments on or repurchases of our common stock.
Term Loan B Facility Repurchases
During 2009, we repurchased and retired $20.3 million in principal of our Term Loan B Facility for $14.9 million. In connection with the repurchase, we also wrote off $0.4 million in deferred financing fees, resulting in a net gain of approximately $5.0 million, which is included in other (income) expense, net in the consolidated statement of operations.
Revolving Facility Borrowings
In June 2008, we borrowed $5.0 million against our Revolving Facility, which was repaid in July 2008. In September 2008, we borrowed $13.2 million against our Revolving Facility. We repaid $8.8 million of the outstanding balance in March 2009 and the remaining $4.4 million in June 2009. In early July 2009, we borrowed $5.0 million against our Revolving Facility and repaid the entire amount borrowed in late July 2009. In early February 2010, we borrowed $9.0 million against our Revolving Facility.
8% Senior Notes
On May 15, 2008, we redeemed all $2.6 million in outstanding 8% Senior Notes. The Notes were redeemed at a 4% premium of the aggregate outstanding principal amount, which was approximately $0.1 million and is included in other (income) expense, net in the consolidated statement of operations. We did not incur any early termination penalties in connection with the redemption of the 8% Senior Notes beyond the 4% redemption premium.
Interest Rate Swaps
As of December 31, 2009, we were party to three interest rates swaps with an aggregate notional amount of $200.0 million. All of the interest rate swaps were in designated hedging relationships to hedge the variability of future cash flows due to changes in the benchmark interest rate associated with our Term Loan B Facility. The following is a summary of our outstanding interest rate swaps at December 31, 2009 (dollars in thousands):
| Maturity Date |
Notional Amount | ||
| December 31, 2010 |
$ | 50,000 | |
| September 30, 2011 |
50,000 | ||
| December 31, 2011 |
100,000 | ||
As a result of these interest rate swaps, we expect the weighted-average cost of our Term Loan B Facility to be approximately 4.0% during the three months ended March 31, 2010.
41
Table of Contents
Index to Financial Statements
Contractual Obligations
Our contractual obligations as of December 31, 2009 are as follows:
| Contractual Obligations |
Total | Less than 1 Year |
1-3 Years | 4-5 Years | After 5 Years | ||||||||||
| (Dollars in thousands) | |||||||||||||||
| Long-term debt obligations, including current portion(1) |
$ | 224,700 | $ | 2,500 | $ | 5,000 | $ | 217,200 | $ | — | |||||
| Capital lease obligations, including current portion |
571 | 422 | 149 | — | — | ||||||||||
| Interest on capital lease obligations |
89 | 82 | 7 | — | — | ||||||||||
| Operating lease obligations(2) |
118,300 | 21,964 | 40,992 | 35,174 | 20,170 | ||||||||||
| Retail display allowances(3) |
26,256 | 23,704 | 2,552 | — | — | ||||||||||
| Total |
$ | 369,916 | $ | 48,672 | $ | 48,700 | $ | 252,374 | $ | 20,170 | |||||
| (1) | Interest related to our long-term debt obligations is variable in nature, and interest payments have been excluded from this table. The interest rate on these obligations resets quarterly and had a weighted-average rate of 2.50% at December 31, 2009. See the discussion above under Bank Credit Facilities. Liabilities for interest rate swaps designated in cash flow hedging relationships against changes in the benchmark interest rate of our long-term debt have also been excluded from this table because the quarterly fixed-rate payments due to the counterparty are settled net of the variable-rate payments due to us by the counterparty. |
| (2) | Future rental commitments for operating leases have not been reduced by minimum noncancelable sublease income aggregating $52.5 million as of December 31, 2009. Operating lease obligations include certain restructuring liabilities. |
| (3) | Retail display allowances include certain restructuring liabilities. |
The contractual obligations table above does not reflect any of our $82.2 million in unrecognized tax benefits at December 31, 2009, which resulted in a recorded liability of $28.3 million that has been accrued in accordance with GAAP related to accounting for uncertainty in income taxes, because we are unable to determine when, or if, payment of these amounts will be made.
The bank credit facilities rank senior in right of payment to all subordinated obligations which PRIMEDIA Inc. (a holding company) may incur.
We have no balance outstanding at December 31, 2009 under our Revolving Facility. In early February 2010, we borrowed $9.0 million against our Revolving Facility. We have other commitments in the form of letters of credit of $2.8 million aggregate face value, which expire on or before October 15, 2010.
A change in the rating of our debt instruments by outside rating agencies does not negatively impact our ability to use our available lines of credit or the borrowing rate under our bank credit facilities. As of June 2009, our senior debt ratings from Moody’s and Standard and Poor’s were Ba3 and B+, respectively.
We announced on March 4, 2010 that our Board of Directors had authorized a cash dividend of $0.07 per share of common stock, payable on or about March 24, 2010, to stockholders of record on March 15, 2010. We expect to pay this dividend out of our existing cash balance. Additionally, we currently expect that we will continue to pay a regular quarterly dividend for the foreseeable future, at the discretion of our Board of Directors, dependent on such factors, including but not limited to, available cash, anticipated cash needs, overall financial and market conditions, future prospects for cash flow and such other factors as are deemed relevant by our Board of Directors.
Off Balance Sheet Arrangements
We have no variable interest entities or off balance sheet obligations other than as related to operating leases in the ordinary course of business.
42
Table of Contents
Index to Financial Statements
Covenant Compliance
Under the most restrictive covenants contained in our bank credit facilities agreement, the maximum allowable total leverage ratio, as defined in the agreement, is 5.25 to 1.
Under our bank credit facilities agreement, we are allowed to designate certain businesses as unrestricted subsidiaries to the extent that the value of those businesses does not exceed the permitted amounts, as defined in these agreements. We have designated certain of our businesses as unrestricted (the “Unrestricted Group”), which represent primarily Internet businesses, trademark and content licensing and service companies, new launches (including traditional start-ups), other properties under evaluation for turnaround or shutdown, and foreign subsidiaries. Indebtedness under the bank credit facilities agreement is guaranteed by each of our domestic subsidiaries in the Restricted Group in accordance with the provisions and limitations of our bank credit facilities agreement. The guarantees are full, unconditional, and joint and several. The Unrestricted Group does not guarantee the bank credit facilities. For purposes of determining compliance with certain financial covenants under our bank credit facility, the Unrestricted Group’s results (positive or negative) are not reflected in the consolidated EBITDA of the Restricted Group which, as defined in the bank credit facilities agreement, excludes losses of the Unrestricted Group, non-cash charges and restructuring charges and is adjusted primarily for the trailing four quarters’ results of acquisitions and divestitures and estimated savings for acquired businesses.
The calculation of our leverage ratio, as required under the bank credit facilities agreement for covenant purposes, is defined as our consolidated debt divided by EBITDA of the Restricted Group. As of December 31, 2009, this leverage ratio was approximately 2.8 to 1, compared to 3.2 to 1 at December 31, 2008.
At December 31, 2009, we were in compliance with all of our debt covenants.
Contingencies and Other
We are involved in lawsuits and claims, both actual and potential, including some that we have asserted against others, in which substantial monetary damages are sought. See Note 20, “Commitments and Contingencies,” to our consolidated financial statements contained elsewhere in this Report for a description of certain of these lawsuits and payments made in settlement of certain lawsuits. Although the result of any future litigation of such lawsuits and claims is inherently unpredictable, management believes that, in the aggregate, the outcome of all such lawsuits and claims will not have a material effect on our consolidated financial position or liquidity; however, any such outcome could be material to the results of operations of any particular period in which costs, if any, are recognized.
Stock Repurchase Plan
Our Board of Directors has authorized the Repurchase Program to repurchase up to $5.0 million of our common stock through December 31, 2010. Under the terms of the Repurchase Program, we may repurchase shares in open market purchases or through privately negotiated transactions. We expect to use cash on hand to fund repurchases of our common stock. As of December 31, 2008, we had not repurchased any shares under the Repurchase Program. During the three months ended March 31, 2009, we repurchased 0.2 million shares of our common stock for approximately $0.4 million at a weighted-average price (including brokerage commissions) of $1.79 per share. We did not repurchase any shares of our common stock during the year ended December 31, 2009 beyond those discussed above. The reacquired shares have been designated as treasury shares. As of December 31, 2009, we had $4.6 million available under the Repurchase Program for further share repurchases, which we may make.
Recent Accounting Pronouncements
See Note 2, “Summary of Significant Accounting Policies—Recent Accounting Pronouncements,” to the consolidated financial statements contained elsewhere in this Report.
43
Table of Contents
Index to Financial Statements
Impact of Inflation and Other Costs
Our largest exposure to inflation relates to the cost of paper. The cost of paper decreased 21% when comparing the fourth quarter of 2009 to the fourth quarter of 2008. We presently anticipate moderate increases in paper prices in 2010.
Seasonality
Our operations are minimally seasonal in nature.
| • | The majority of our sales comprise contracts with a duration of 12 months or longer. |
| • | We experience modest seasonality in Rentals.com as that business declines in the winter months. This business represents a relatively small part of the total business. |
| • | Our cash flows from operating activities are somewhat seasonal in nature, primarily due to the timing of payments made under the terms of our RDAs, which generally occur in the first half of the year. |
| Item 7A. | QUANTITATIVE AND QUALITATIVE DISCLOSURES ABOUT MARKET RISK. |
Interest Rate Risk
We are exposed to the impact of changes in interest rates, primarily through our Term Loan B Facility, which is variable-rate debt that had an outstanding balance of $224.7 million as of December 31, 2009. As part of our management of interest rate risk, we have designated derivative financial instruments in hedging relationships against the variability in cash flows due to changes in the benchmark interest rate on our Term Loan B Facility. The table below shows the change in interest expense we estimate would occur over the next 12 months from 50 and 100 basis point increases and decreases in interest rates based upon our current Term Loan B Facility balance and derivative financial instrument positions as of December 31, 2009. Such potential increases or decreases are based on certain simplifying assumptions, including a constant level of debt and an immediate, across-the-board increase or decrease in the level of interest rates with no other subsequent changes for one year.
| Changes in Interest Expense |
||||||||
| Interest Rate Change (in Basis |
December 31, | |||||||
| Points) |
2009 | 2008 | ||||||
| (Dollars in thousands) | ||||||||
| +100 |
$ | 238 | $ | 466 | ||||
| +50 |
119 | 233 | ||||||
| -50 |
(119 | ) | (233 | ) | ||||
| -100 |
(238 | ) | (466 | ) | ||||
Credit Risk
Our hedging transactions using derivative financial instruments also involve certain additional risks, such as counterparty credit risk. The counterparties to our derivative financial instruments are major financial institutions and securities dealers, which we believe are well capitalized with investment grade credit ratings and with which we may have other financial relationships. While we do not anticipate nonperformance by any counterparty, we are exposed to potential credit losses in the event the counterparty fails to perform. Our exposure to credit risk in the event of default by a counterparty is the difference between the value of the contract and the current market price at the time of the default. There can be no assurance that we will be able to adequately protect against the foregoing risks and will ultimately realize an economic benefit that exceeds the related expenses incurred in connection with engaging in such hedging strategies.
44
Table of Contents
Index to Financial Statements
| ITEM 8. | FINANCIAL STATEMENTS AND SUPPLEMENTARY DATA |
Index to Consolidated Financial Statements
The following is selected unaudited consolidated financial data for the Company for the indicated periods:
| Year Ended December 31, 2009 | ||||||||||||||||||||
| First Quarter |
Second Quarter |
Third Quarter(1) |
Fourth Quarter |
Total | ||||||||||||||||
| (Unaudited) | ||||||||||||||||||||
| (Dollars in thousands, except per share data) | ||||||||||||||||||||
| Revenue, net |
$ | 68,458 | $ | 65,206 | $ | 63,014 | $ | 61,253 | $ | 257,931 | ||||||||||
| (Provision) benefit for income taxes |
(503 | ) | 4,043 | (2,103 | ) | (3,535 | ) | (2,098 | ) | |||||||||||
| (Loss) income from continuing operations(2)(3)(4) |
$ | (277 | ) | $ | (8,348 | ) | $ | 5,696 | $ | 7,469 | $ | 4,540 | ||||||||
| Discontinued operations, net of tax(5)(6) |
665 | (3,439 | ) | (1,957 | ) | 3,679 | (1,052 | ) | ||||||||||||
| Net income (loss) |
$ | 388 | $ | (11,787 | ) | $ | 3,739 | $ | 11,148 | $ | 3,488 | |||||||||
| Basic and diluted (loss) income per common share(7): |
||||||||||||||||||||
| Continuing operations |
$ | (0.01 | ) | $ | (0.19 | ) | $ | 0.13 | $ | 0.17 | $ | 0.10 | ||||||||
| Discontinued operations |
0.02 | (0.08 | ) | (0.05 | ) | 0.08 | (0.02 | ) | ||||||||||||
| Net income (loss) |
$ | 0.01 | $ | (0.27 | ) | $ | 0.08 | $ | 0.25 | $ | 0.08 | |||||||||
| Basic common shares outstanding (weighted-average) |
44,119,293 | 44,084,940 | 44,146,959 | 44,146,959 | 44,124,538 | |||||||||||||||
| Diluted common shares outstanding (weighted-average) |
44,119,293 | 44,084,940 | 44,167,675 | 44,207,002 | 44,214,003 | |||||||||||||||
| (1) | Includes an other-than-temporary impairment charge in continuing operations of approximately $1.5 million during the third quarter related to a cost-method investment. Cost-method investments are more fully discussed in Note 8, “Other Non-Current Assets,” to the Company’s consolidated financial statements. |
| (2) | Includes provision for restructuring costs of $4.3 million, $21.5 million, $(0.2) million and less than $(0.1) million during the first quarter, second quarter, third quarter and fourth quarter, respectively. Restructuring costs are more fully discussed in Note 16, “Provision for Restructuring Costs,” to the Company’s consolidated financial statements. |
| (3) | Includes gain on sale of cost-method investments of approximately $1.8 million and $0.5 million during the first quarter and second quarter, respectively. Gain on sale of cost-method investments is more fully discussed in Note 8, “Other Non-Current Assets,” to the Company’s consolidated financial statements. |
45
Table of Contents
Index to Financial Statements
| (4) | Includes a net gain related to repurchasing and retiring principal of the Company’s Term Loan B Facility of approximately $3.6 million and $1.3 million during the second quarter and fourth quarter, respectively. Repurchasing and retiring of the Company’s Term Loan B Facility is more fully discussed in Note 10, “Borrowings,” to the Company’s consolidated financial statements. |
| (5) | Includes provision for litigation reserves and settlements in discontinued operations of $1.5 million and $1.8 million during the third quarter and fourth quarter, respectively. Litigation reserves and settlements are more fully discussed in Note 20, “Commitments and Contingencies,” to the Company’s consolidated financial statements. |
| (6) | Includes income tax benefit related to discontinued operations of $0.2 million, $0.1 million, $0.3 million and $0.5 million for the first quarter, second quarter, third quarter and fourth quarter, respectively. Income taxes related to discontinued operations are more fully discussed in Note 11, “Income Taxes,” to the Company’s consolidated financial statements. |
| (7) | Basic and diluted income (loss) per common share amounts have been computed using the weighted-average number of shares indicated below and, in all cases, round to the amounts presented. |
| Year Ended December 31, 2008 | |||||||||||||||||||
| First Quarter |
Second Quarter |
Third Quarter |
Fourth Quarter (1)(2)(3)(4) |
Total | |||||||||||||||
| (Unaudited) | |||||||||||||||||||
| (Dollars in thousands, except per share data) | |||||||||||||||||||
| Revenue, net |
$ | 77,488 | $ | 76,794 | $ | 76,414 | $ | 73,409 | $ | 304,105 | |||||||||
| (Provision) benefit for income taxes |
(1,002 | ) | (1,267 | ) | (128 | ) | 29,401 | 27,004 | |||||||||||
| Income from continuing operations(5) |
$ | 2,214 | $ | 3,474 | $ | 8,648 | $ | 34,691 | $ | 49,027 | |||||||||
| Discontinued operations, net of tax(6)(7) |
11,383 | (1,544 | ) | 3,312 | (2,710 | ) | 10,441 | ||||||||||||
| Net income |
$ | 13,597 | $ | 1,930 | $ | 11,960 | $ | 31,981 | $ | 59,468 | |||||||||
| Basic and diluted income (loss) per common share(8): |
|||||||||||||||||||
| Continuing operations |
$ | 0.05 | $ | 0.08 | $ | 0.20 | $ | 0.78 | $ | 1.11 | |||||||||
| Discontinued operations |
0.26 | (0.04 | ) | 0.07 | (0.06 | ) | 0.24 | ||||||||||||
| Net income |
$ | 0.31 | $ | 0.04 | $ | 0.27 | $ | 0.72 | $ | 1.35 | |||||||||
| Basic common shares outstanding (weighted-average) |
44,171,917 | 44,174,533 | 44,175,009 | 44,184,134 | 44,176,398 | ||||||||||||||
| Diluted common shares outstanding (weighted-average) |
44,203,993 | 44,189,055 | 44,188,562 | 44,208,750 | 44,197,590 | ||||||||||||||
| (1) | During the fourth quarter of 2008, the Company released valuation allowance of approximately $29.3 million on net deferred tax assets. The release of valuation allowance is more fully discussed in Note 11, “Income Taxes,” to the Company’s consolidated financial statements. |
| (2) | Includes reduction of expense in continuing operations of $2.6 million related to a reversal of an annuity obligation due to the death of a former PRIMEDIA CEO during the fourth quarter. This reduction of expense is more fully discussed in Note 17, “Severance,” to the Company’s consolidated financial statements. |
| (3) | Includes provision for litigation reserves and settlements in discontinued operations of $6.0 million during the fourth quarter. Litigation reserves and settlements are more fully discussed in Note 20, “Commitments and Contingencies,” to the Company’s consolidated financial statements. |
| (4) | Includes an other-than-temporary impairment charge in continuing operations of approximately $0.9 million during the fourth quarter related to a cost-method investment. Cost-method investments are more fully discussed in Note 8, “Other Non-Current Assets,” to the Company’s consolidated financial statements. |
46
Table of Contents
Index to Financial Statements
| (5) | Includes provision for restructuring costs of $0.5 million, $1.2 million, $0.2 million and $3.3 million during the first quarter, second quarter, third quarter and fourth quarter, respectively. Restructuring costs are more fully discussed in Note 16, “Provision for Restructuring Costs,” to the Company’s consolidated financial statements. |
| (6) | Includes gain on sale of businesses before income taxes of $0.1 million, $0.1 million and $0.6 million for the first quarter, second quarter and third quarter, respectively. The gain on sale of businesses is more fully discussed in Note 3, “Discontinued Operations,” to the Company’s consolidated financial statements. |
| (7) | Includes income tax benefit related to discontinued operations, including income taxes related to the gain on sale of businesses, of $12.0 million, $0.5 million, $4.4 million and $3.6 million for the first quarter, second quarter, third quarter and fourth quarter, respectively. Income taxes related to discontinued operations are more fully discussed in Note 11, “Income Taxes,” to the Company’s consolidated financial statements. |
| (8) | Basic and diluted income (loss) per common share amounts have been computed using the weighted-average number of shares indicated below and, in all cases, round to the amounts presented. |
47
Table of Contents
Index to Financial Statements

REPORT OF INDEPENDENT REGISTERED PUBLIC ACCOUNTING FIRM
To the Stockholders and Board of Directors of
PRIMEDIA Inc.
Norcross, Georgia
We have audited the accompanying consolidated balance sheet of PRIMEDIA Inc. and subsidiaries (the “Company”) as of December 31, 2009 and 2008, and the related consolidated statements of operations, changes in stockholders’ deficiency and cash flows for each of the three years in the period ended December 31, 2009. Our audits also included the financial statement schedule listed in the Index at Item 15(a)2. These financial statements and financial statement schedule are the responsibility of the Company’s management. Our responsibility is to express an opinion on the financial statements and financial statement schedule based on our audits.
We conducted our audits in accordance with the standards of the Public Company Accounting Oversight Board (United States). Those standards require that we plan and perform the audit to obtain reasonable assurance about whether the financial statements are free of material misstatement. An audit includes examining, on a test basis, evidence supporting the amounts and disclosures in the financial statements. An audit also includes assessing the accounting principles used and significant estimates made by management, as well as evaluating the overall financial statement presentation. We believe that our audits provide a reasonable basis for our opinion.
In our opinion, such consolidated financial statements present fairly, in all material respects, the financial position of PRIMEDIA Inc. and subsidiaries as of December 31, 2009 and 2008, and the results of their operations and their cash flows for each of the three years in the period ended December 31, 2009, in conformity with accounting principles generally accepted in the United States of America. Also, in our opinion, such financial statement schedule, when considered in relation to the basic consolidated financial statements taken as a whole, presents fairly, in all material respects, the information set forth therein.
We have also audited, in accordance with the standards of the Public Company Accounting Oversight Board (United States), the Company’s internal control over financial reporting as of December 31, 2009, based on the criteria established in Internal Control—Integrated Framework issued by the Committee of Sponsoring Organizations of the Treadway Commission and our report dated March 10, 2010 expressed an unqualified opinion on the Company’s internal control over financial reporting.
/s/ DELOITTE & TOUCHE LLP
Atlanta, Georgia
March 10, 2010
48
Table of Contents
Index to Financial Statements
PRIMEDIA INC. AND SUBSIDIARIES
Consolidated Balance Sheet
| December 31, | ||||||||
| 2009 | 2008 | |||||||
| (Dollars in thousands, except per share data) |
||||||||
| Assets |
||||||||
| Current assets: |
||||||||
| Cash and cash equivalents |
$ | 9,472 | $ | 31,470 | ||||
| Accounts receivable (net of allowance for doubtful accounts of $1,217 and $1,528, respectively) |
24,802 | 27,983 | ||||||
| Inventories |
432 | 936 | ||||||
| Prepaid expenses and other |
16,583 | 26,545 | ||||||
| Deferred tax asset, net |
1,470 | 2,102 | ||||||
| Total current assets |
52,759 | 89,036 | ||||||
| Property and equipment (net of accumulated depreciation and amortization of $80,932 and $83,203, respectively) |
17,997 | 18,765 | ||||||
| Intangible assets, net |
20,667 | 23,637 | ||||||
| Goodwill |
129,305 | 129,305 | ||||||
| Deferred tax asset—non-current, net |
8,275 | 12,867 | ||||||
| Other non-current assets |
10,726 | 12,544 | ||||||
| Total assets |
$ | 239,729 | $ | 286,154 | ||||
| Liabilities and stockholders’ deficiency |
||||||||
| Current liabilities: |
||||||||
| Accounts payable |
$ | 11,788 | $ | 14,792 | ||||
| Accrued expenses and other |
39,294 | 44,491 | ||||||
| Deferred revenue |
2,099 | 1,990 | ||||||
| Revolving credit facility |
— | 13,200 | ||||||
| Current maturities of long-term debt and capital lease obligations |
2,922 | 3,045 | ||||||
| Total current liabilities |
56,103 | 77,518 | ||||||
| Long-term debt |
222,349 | 245,531 | ||||||
| Deferred revenue |
7,650 | 9,350 | ||||||
| Other non-current liabilities |
55,786 | 51,043 | ||||||
| Total liabilities |
341,888 | 383,442 | ||||||
| Commitments and contingencies (Note 20) |
||||||||
| Stockholders’ deficiency: |
||||||||
| Common stock—par value $0.01; 350,000,000 shares authorized; 45,793,697 and 45,595,618 shares issued, respectively; 44,146,959 and 44,188,550 shares outstanding, respectively |
457 | 455 | ||||||
| Additional paid-in capital (including warrants of $31,690 at December 31, 2009 and 2008) |
2,373,684 | 2,372,578 | ||||||
| Accumulated deficit |
(2,398,469 | ) | (2,389,610 | ) | ||||
| Common stock in treasury, at cost (1,646,738 and 1,407,068 shares, respectively) |
(76,304 | ) | (75,877 | ) | ||||
| Accumulated other comprehensive loss |
(1,527 | ) | (4,834 | ) | ||||
| Total stockholders’ deficiency |
(102,159 | ) | (97,288 | ) | ||||
| Total liabilities and stockholders’ deficiency |
$ | 239,729 | $ | 286,154 | ||||
The accompanying notes are an integral part of these consolidated financial statements.
49
Table of Contents
Index to Financial Statements
PRIMEDIA INC. AND SUBSIDIARIES
Consolidated Statement of Operations
| Years Ended December 31, | ||||||||||||
| 2009 | 2008 | 2007 | ||||||||||
| (Dollars in thousands, except per share data) | ||||||||||||
| Revenue, net: |
||||||||||||
| Advertising |
$ | 224,571 | $ | 250,704 | $ | 257,164 | ||||||
| Distribution |
33,360 | 53,401 | 57,636 | |||||||||
| Total revenue, net |
257,931 | 304,105 | 314,800 | |||||||||
| Costs and expenses: |
||||||||||||
| Cost of goods sold (exclusive of depreciation and amortization of property and equipment) |
23,369 | 32,420 | 34,655 | |||||||||
| Marketing and selling |
77,635 | 75,722 | 81,064 | |||||||||
| Distribution and circulation |
60,931 | 85,218 | 83,561 | |||||||||
| General and administrative expenses |
37,906 | 48,700 | 57,747 | |||||||||
| Depreciation and amortization of property and equipment |
13,256 | 14,475 | 12,612 | |||||||||
| Amortization of intangible assets |
2,970 | 2,870 | 3,492 | |||||||||
| Provision for restructuring costs |
25,627 | 5,238 | 10,496 | |||||||||
| Interest expense |
15,670 | 19,338 | 77,660 | |||||||||
| Amortization of deferred financing costs |
915 | 922 | 1,743 | |||||||||
| Other (income) expense, net |
(6,986 | ) | (2,821 | ) | 40,176 | |||||||
| Total costs and expenses |
251,293 | 282,082 | 403,206 | |||||||||
| Income (loss) from continuing operations before (provision) benefit for income taxes |
6,638 | 22,023 | (88,406 | ) | ||||||||
| (Provision) benefit for income taxes |
(2,098 | ) | 27,004 | 32,728 | ||||||||
| Income (loss) from continuing operations |
4,540 | 49,027 | (55,678 | ) | ||||||||
| Discontinued operations, net of tax (including gain on sale of businesses, net of tax, of $0, $2,049 and $459,135, respectively) |
(1,052 | ) | 10,441 | 547,123 | ||||||||
| Net income |
$ | 3,488 | $ | 59,468 | $ | 491,445 | ||||||
| Basic and diluted earnings (loss) per common share: |
||||||||||||
| Continuing operations |
$ | 0.10 | $ | 1.11 | $ | (1.26 | ) | |||||
| Discontinued operations |
(0.02 | ) | 0.24 | 12.40 | ||||||||
| Net income |
$ | 0.08 | $ | 1.35 | $ | 11.14 | ||||||
| Dividends declared per share of common stock outstanding |
$ | 0.28 | $ | 0.28 | $ | 2.15 | ||||||
| Weighted-average basic shares of common stock outstanding |
44,124,538 | 44,176,398 | 44,118,943 | |||||||||
| Weighted-average diluted shares of common stock outstanding |
44,214,003 | 44,197,590 | 44,118,943 | |||||||||
The accompanying notes are an integral part of these consolidated financial statements.
50
Table of Contents
Index to Financial Statements
PRIMEDIA INC. AND SUBSIDIARIES
Consolidated Statement of Changes in Stockholders’ Deficiency
| Shares | Par Value |
Additional Paid-in Capital |
Accumulated Deficit |
Common Stock in Treasury |
Accumulated Other Comprehensive Income (Loss) |
Total Stockholders’ Deficiency |
|||||||||||||||||||
| (Dollars in thousands, except per share data) | |||||||||||||||||||||||||
| Balance at January 1, 2007 |
45,475,527 | $ | 455 | $ | 2,369,220 | $ | (2,817,028 | ) | $ | (75,877 | ) | $ | — | $ | (523,230 | ) | |||||||||
| Comprehensive income (loss): |
|||||||||||||||||||||||||
| Net income |
— | — | — | 491,445 | — | — | 491,445 | ||||||||||||||||||
| Other comprehensive loss |
|||||||||||||||||||||||||
| Net unrealized losses on cash flow hedges |
— | — | — | — | — | (2,112 | ) | (2,112 | ) | ||||||||||||||||
| Total comprehensive income |
489,333 | ||||||||||||||||||||||||
| Cumulative effect of change in accounting principle |
(16,126 | ) | (16,126 | ) | |||||||||||||||||||||
| Non-cash charges for stock-based compensation |
— | — | 486 | — | — | — | 486 | ||||||||||||||||||
| Issuances of common stock, net |
96,991 | — | 722 | — | — | — | 722 | ||||||||||||||||||
| Cash dividends declared on common stock ($2.15 per share) |
— | — | — | (95,010 | ) | — | — | (95,010 | ) | ||||||||||||||||
| Balance at December 31, 2007 |
45,572,518 | 455 | 2,370,428 | (2,436,719 | ) | (75,877 | ) | (2,112 | ) | (143,825 | ) | ||||||||||||||
| Comprehensive income (loss): |
|||||||||||||||||||||||||
| Net income |
— | — | — | 59,468 | — | — | 59,468 | ||||||||||||||||||
| Other comprehensive loss, net of tax |
|||||||||||||||||||||||||
| Net unrealized losses on cash flow hedges |
— | — | — | — | — | (2,722 | ) | (2,722 | ) | ||||||||||||||||
| Total comprehensive income |
56,746 | ||||||||||||||||||||||||
| Non-cash charges for stock-based compensation |
— | — | 2,108 | — | — | — | 2,108 | ||||||||||||||||||
| Issuances of common stock, net |
23,100 | — | 42 | — | — | — | 42 | ||||||||||||||||||
| Cash dividends declared on common stock ($0.28 per share) |
— | — | — | (12,359 | ) | — | — | (12,359 | ) | ||||||||||||||||
| Balance at December 31, 2008 |
45,595,618 | 455 | 2,372,578 | (2,389,610 | ) | (75,877 | ) | (4,834 | ) | (97,288 | ) | ||||||||||||||
| Comprehensive income: |
|||||||||||||||||||||||||
| Net income |
— | — | — | 3,488 | — | — | 3,488 | ||||||||||||||||||
| Other comprehensive loss |
|||||||||||||||||||||||||
| Net unrealized gains on cash flow hedges |
— | — | — | — | — | 3,307 | 3,307 | ||||||||||||||||||
| Total comprehensive income |
6,795 | ||||||||||||||||||||||||
| Non-cash charges for stock-based compensation |
— | — | 1,281 | — | — | — | 1,281 | ||||||||||||||||||
| Issuances of common stock, net of shares withheld for employee taxes and other |
198,079 | 2 | (175 | ) | — | — | — | (173 | ) | ||||||||||||||||
| Repurchases of common stock |
— | — | — | — | (427 | ) | — | (427 | ) | ||||||||||||||||
| Cash dividends declared on common stock ($0.28 per share) |
— | — | — | (12,347 | ) | — | — | (12,347 | ) | ||||||||||||||||
| Balance at December 31, 2009 |
45,793,697 | $ | 457 | $ | 2,373,684 | $ | (2,398,469 | ) | $ | (76,304 | ) | $ | (1,527 | ) | $ | (102,159 | ) | ||||||||
The accompanying notes are an integral part of these consolidated financial statements.
51
Table of Contents
Index to Financial Statements
PRIMEDIA INC. AND SUBSIDIARIES
Consolidated Statement of Cash Flows
| Years Ended December 31, | ||||||||||||
| 2009 | 2008 | 2007 | ||||||||||
| (Dollars in thousands) | ||||||||||||
| Operating activities: |
||||||||||||
| Net income |
$ | 3,488 | $ | 59,468 | $ | 491,445 | ||||||
| Adjustments to reconcile net income to net cash provided by (used in) operating activities: |
||||||||||||
| Depreciation and amortization |
17,141 | 18,407 | 19,692 | |||||||||
| Impairment of cost-method investment |
1,500 | 914 | — | |||||||||
| Gain on sale of cost-method investments |
(2,260 | ) | — | — | ||||||||
| Gain on sale of businesses, net |
— | (2,049 | ) | (459,135 | ) | |||||||
| Accretion of acquisition obligation and other |
— | — | 3,240 | |||||||||
| (Gain) loss on repurchase and redemption of debt |
(4,967 | ) | 103 | 44,339 | ||||||||
| Stock-based compensation |
1,281 | 2,108 | 486 | |||||||||
| Deferred income taxes |
5,627 | (27,233 | ) | (59,796 | ) | |||||||
| Bad debt expense |
4,100 | 3,817 | 3,282 | |||||||||
| Loss on disposal of property and equipment |
18 | 1,251 | 5,963 | |||||||||
| (Increase) decrease in: |
||||||||||||
| Accounts receivable, net |
(919 | ) | (2,310 | ) | (7,226 | ) | ||||||
| Inventories |
504 | (194 | ) | 2,868 | ||||||||
| Prepaid expenses and other |
9,425 | (21,162 | ) | (351 | ) | |||||||
| (Decrease) increase in: |
||||||||||||
| Accounts payable |
(3,831 | ) | 2,690 | (4,870 | ) | |||||||
| Accrued expenses and other |
(2,348 | ) | (7,157 | ) | (87,392 | ) | ||||||
| Deferred revenue |
(1,700 | ) | (1,652 | ) | (1,726 | ) | ||||||
| Other non-current liabilities |
4,591 | (5,910 | ) | 442 | ||||||||
| Other, net |
— | 5 | 3,194 | |||||||||
| Net cash provided by (used in) operating activities |
31,650 | 21,096 | (45,545 | ) | ||||||||
| Investing activities: |
||||||||||||
| Purchase of available for sale securities |
— | — | (247,426 | ) | ||||||||
| Proceeds from sales of available for sale securities |
— | 15,425 | 232,001 | |||||||||
| Payments for investments |
— | (14 | ) | — | ||||||||
| Proceeds from sale of cost-method investments |
2,260 | — | 289 | |||||||||
| Additions to property and equipment |
(11,211 | ) | (12,977 | ) | (20,352 | ) | ||||||
| Payments for businesses acquired, net of cash acquired |
— | — | (34,129 | ) | ||||||||
| Payments related to the sale of businesses |
— | (4,355 | ) | (21,420 | ) | |||||||
| Proceeds from sale of businesses |
— | 2,389 | 1,352,626 | |||||||||
| Net cash (used in) provided by investing activities |
(8,951 | ) | 468 | 1,261,589 | ||||||||
| Financing activities: |
||||||||||||
| Payment of dividends on common stock |
(12,347 | ) | (12,359 | ) | (95,010 | ) | ||||||
| Net (repayments) borrowings under revolving credit facility |
(13,200 | ) | 13,200 | — | ||||||||
| Payments for deferred and other financing fees |
(510 | ) | — | (6,287 | ) | |||||||
| Payments for repurchase and redemption of debt |
(14,931 | ) | (2,679 | ) | (859,735 | ) | ||||||
| Borrowings under credit agreements |
— | — | 282,800 | |||||||||
| Repayments of borrowings under credit agreements |
(2,500 | ) | (2,500 | ) | (528,800 | ) | ||||||
| Capital lease payments |
(607 | ) | (506 | ) | (739 | ) | ||||||
| (Payments) proceeds related to issuances of common stock, net of value of shares withheld for employee taxes |
(175 | ) | 42 | 722 | ||||||||
| Repurchases of common stock |
(427 | ) | — | — | ||||||||
| Other |
— | (1 | ) | (114 | ) | |||||||
| Net cash used in financing activities |
(44,697 | ) | (4,803 | ) | (1,207,163 | ) | ||||||
| (Decrease) increase in cash and cash equivalents |
(21,998 | ) | 16,761 | 8,881 | ||||||||
| Cash and cash equivalents, beginning of period |
31,470 | 14,709 | 5,828 | |||||||||
| Cash and cash equivalents, end of period |
$ | 9,472 | $ | 31,470 | $ | 14,709 | ||||||
| Supplemental information: |
||||||||||||
| Cash paid for interest, including interest on capital leases and restructuring liabilities |
$ | 15,916 | $ | 19,323 | $ | 90,037 | ||||||
| Cash (refunded) paid for income taxes, net |
$ | (20,193 | ) | $ | 7,746 | $ | 41,755 | |||||
| Noncash investing and financing activities: |
||||||||||||
| Equipment acquisitions under capital leases |
$ | 102 | $ | 1,321 | $ | — | ||||||
| Businesses acquired: |
||||||||||||
| Fair value of assets acquired |
$ | — | $ | — | $ | 34,435 | ||||||
| (Liabilities assumed) net of deferred purchase price payments |
— | — | (306 | ) | ||||||||
| Payments for businesses acquired, net of cash acquired |
$ | — | $ | — | $ | 34,129 | ||||||
The accompanying notes are an integral part of these consolidated financial statements.
52
Table of Contents
Index to Financial Statements
PRIMEDIA INC. AND SUBSIDIARIES
Notes to Consolidated Financial Statements
Note 1. Description of Business
PRIMEDIA Inc., together with its subsidiaries, is herein referred to as either “PRIMEDIA” or the “Company,” unless the context implies otherwise. PRIMEDIA is a targeted media company that provides consumers with tools and information they need to find a place to live. The Company’s consumer directories are targeted primarily for the apartment and other rental property sectors of the residential real estate industry and are provided free to consumers through a combination of Internet, print and mobile platforms. The Company derives advertising revenue by providing its advertiser clients, principally property management companies, private owners/landlords, new home builders and real estate professionals, with products and services that generate measurable results in the form of cost-effective, quality leads.
The Company has traditionally managed its portfolio of media assets by opportunistically seeking to divest of assets no longer part of its overall strategy, including its Enthusiast Media (“PEM”), Education and Business Information segments and its Auto Guides division. As a result, the Company has one remaining segment, Consumer Guides, and one reporting unit.
Note 2. Summary of Significant Accounting Policies
Use of Estimates. The preparation of the consolidated financial statements in conformity with accounting principles generally accepted in the United States of America (“GAAP”) requires management to make estimates and assumptions that affect the amounts reported in the consolidated financial statements and accompanying notes. Actual results could differ from those estimates. Significant accounting estimates include the establishment of the allowance for doubtful accounts, the provision for restructuring costs, the cost of stock-based compensation, the valuation allowance for deferred tax assets, uncertain tax positions, and the recoverability and lives of long-lived assets, including goodwill.
Basis of Presentation. The consolidated financial statements include the accounts of PRIMEDIA and its subsidiaries. All significant intercompany accounts and transactions have been eliminated in consolidation.
Cash and Cash Equivalents. Management considers all highly liquid instruments purchased with an original maturity of 90 days or less to be cash equivalents. As of December 31, 2009, cash equivalents include money market accounts.
The Company’s banking arrangements allow it to fund outstanding checks drawn on zero-balance disbursement accounts when presented to the financial institution for payment, resulting in book overdrafts. Book overdrafts in the amount of $3.7 million and $2.9 million are recorded in accounts payable in the consolidated balance sheet as of December 31, 2009 and 2008, respectively, and are reflected as an operating activity in the consolidated statements of cash flows.
Investment Securities. Investment securities are classified according to management’s intent with respect to the securities. In accordance with GAAP, securities are classified as:
| • | Held to maturity if management has the positive intent and ability to hold them to maturity. These securities are carried at cost, adjusted for the amortization of premium and accretion of discount. |
| • | Trading if the securities are principally held for the purpose of selling them in the near term. These securities are carried at fair value, with unrealized gains and losses recognized in the statement of operations. |
| • | Available for sale if the securities are not classified as held to maturity or trading. These securities are carried at fair value, with net unrealized gains and losses reported as a component of accumulated other comprehensive income (loss) (“AOCI”). |
53
Table of Contents
Index to Financial Statements
Concentrations of Credit Risk. Substantially all of the Company’s trade receivables are from advertising customers located throughout the United States. The Company establishes its credit policies based on an ongoing evaluation of its customers’ credit worthiness and competitive market conditions and establishes its allowance for doubtful accounts based on an assessment of exposures to credit losses at each balance sheet date. The Company believes its allowance for doubtful accounts is sufficient based on the credit exposure outstanding as of December 31, 2009.
Inventories. Inventories, principally paper, are valued at the lower of cost or market, on a first-in, first-out basis.
Property and Equipment. Property and equipment are stated at cost, less accumulated depreciation and amortization. Depreciation of property and equipment, including the amortization of leasehold improvements, is provided at rates based on the estimated useful lives or lease terms, if shorter, using the straight-line method. Improvements which extend the lives of assets are capitalized, while maintenance and repairs are expensed as incurred.
Goodwill and Other Intangible Assets. Goodwill and other intangible assets are accounted for in accordance with GAAP. Consistent with GAAP, the Company does not amortize goodwill and indefinite-lived intangible assets, primarily trademarks, but subjects them to impairment tests, at least annually. All other intangible assets are amortized over their estimated useful lives, primarily on a straight-line basis. The Company’s annual impairment testing date for goodwill and indefinite-lived intangible assets is October 31. Testing is conducted using a fair value approach (at a reporting unit level for goodwill). A reporting unit is an operating segment or one level below an operating segment for which discrete financial information is available and reviewed regularly by management. Assets and liabilities of the Company are assigned to reporting units to the extent that they are employed in or are considered a liability related to the operations of the reporting units and are considered in determining the fair value of the reporting units. Fair value is determined by calculating the present value of management’s best estimate of future cash flows at the reporting unit or for the asset as applicable. The Company uses a discount rate that represents its weighted-average cost of capital (13% for both 2009 and 2008). The fair value is compared to the carrying value of the reporting unit, or of the asset, as applicable. As long as the fair value is greater, there is no impairment.
In addition to the annual impairment test, an assessment is also required whenever events or changes in circumstances indicate that the carrying amount of an asset may not be recoverable.
The Company’s impairment testing under GAAP did not result in any impairments of indefinite-lived intangible assets for any periods presented.
In April 2008, the Financial Accounting Standards Board (“FASB”) issued new GAAP on the determination of the useful life of intangible assets, which amends the factors that should be considered in developing renewal or extension assumptions used to determine the useful life of a recognized intangible asset with a finite useful life. Rather than considering legal, regulatory or contractual provisions that enable renewal or extension of the asset’s legal or contractual life without substantial cost, an entity is required to use, among other factors, its own historical experience in renewing or extending similar arrangements, regardless of whether those arrangements have explicit renewal or extension provisions, in determining the useful life of the asset. If an entity does not have its own historical experience, it should consider the assumptions that market participants would use about renewal or extension (consistent with the highest and best use of the asset by market participants), adjusted for any identified entity-specific factors.
The Company adopted the new GAAP effective January 1, 2009, and the adoption did not have a material impact on its financial condition, results of operations or cash flows.
Long-Lived Assets. Consistent with GAAP, the Company reviews long-lived assets for impairment whenever events and circumstances indicate assets might be impaired. When such reviews are conducted, the Company
54
Table of Contents
Index to Financial Statements
uses an estimate of undiscounted cash flows over the remaining lives of the assets to measure recoverability. If the estimated cash flows are less than the carrying value of an asset, the loss is measured as the amount by which the carrying value of the asset exceeds fair value.
As is more fully discussed in Notes 3 and 7, the Company assessed certain of its intangible assets for impairment during 2007 and 2009 due to events that arose indicating the carrying value of the assets might not be recoverable.
Income Taxes. Income taxes are accounted for in accordance with GAAP, which requires an asset and liability approach for the accounting and reporting of income taxes. The provision for income taxes is comprised of taxes that are currently payable and deferred taxes that relate to temporary differences between the book basis and tax basis of assets and liabilities that will result in deductible or taxable amounts in future years when such assets and liabilities are recovered or settled, respectively. Deferred tax assets and liabilities are measured using enacted tax rates expected to apply to taxable income in the years in which temporary differences are expected to be realized or settled. Recognition of certain deferred tax assets is based upon management’s belief that, based upon historical earnings and anticipated future earnings, normal operations or available tax planning strategies will generate sufficient future taxable income to realize these benefits. A significant portion of the Company’s deferred tax assets are net operating loss carryforwards (“NOLs”), which have lives of up to 20 years. When, in the opinion of management, it is “more likely than not” that deferred tax assets will be realized, no valuation allowance is established for those deferred tax assets.
In July 2006, the FASB issued new GAAP on the accounting for uncertainty in income taxes effective for fiscal years beginning after December 15, 2006, which prescribes a recognition threshold and measurement attribute for the financial statement recognition and measurement of a tax position taken or expected to be taken in a tax return. The new GAAP requires that, in order to be recognized, tax benefits must be more likely than not to be sustained upon examination by taxing authorities. The amount recognized is measured as the largest amount of benefit that is greater than 50% likely of being realized upon ultimate settlement. Differences between the amounts recognized in the balance sheet prior to the adoption of the new GAAP and the amounts reported after adoption were accounted for as a cumulative-effect adjustment recorded to the beginning balance of accumulated deficit. The new GAAP also provides guidance on de-recognition, classification, interest and penalties, accounting in interim periods, disclosure and transition.
The Company adopted the provisions of the new GAAP on January 1, 2007 and, as a result, recognized a liability for uncertain tax positions and related interest and penalties of $16.1 million, which was accounted for as an increase to the January 1, 2007 balance of accumulated deficit, net of any valuation allowance impact. The total amount of unrecognized tax benefits as of January 1, 2007 was $102.5 million. In addition to the unrecognized tax benefits, the Company had $3.7 million of interest and penalties accrued as of January 1, 2007. The liability for uncertain tax positions is included in other non-current liabilities in the consolidated balance sheet.
The Company’s policy is to recognize interest and penalties related to unrecognized tax benefits in the provision for income taxes.
Deferred Financing Costs. Deferred financing costs are amortized under the straight-line method over the terms of the related indebtedness, which approximates the effective interest method.
Stock-Based Compensation. The Company expenses the fair value of stock-based compensation for all grants, modifications or settlements. The cost of stock-based compensation is measured at the grant date based on the fair value of the award and is recognized as expense on a straight-line basis over the requisite service period, which is the vesting period, giving effect to anticipated forfeitures of awards.
The Company calculates the grant date fair value of employee stock options using the Black-Scholes pricing model. The Black-Scholes pricing model was developed for use in estimating the fair value of traded options that have no vesting restrictions and are fully transferable. In addition, option valuation models require the input of
55
Table of Contents
Index to Financial Statements
highly subjective assumptions, including the expected stock price volatility. The Company’s employee stock options have characteristics significantly different from those of traded options, and changes in the subjective input assumptions can materially affect the fair value estimate of its employee stock options.
The Company recognizes the cost of graded-vesting stock-based compensation awards expected to vest on a straight-line basis over the requisite service period.
Revenue Recognition. Advertising revenue is recognized ratably over the term of the contract with advertisers. Distribution revenue is recognized ratably over the term of the contract with third-party publishers. The Company’s revenue is presented net of sales allowances, which are not material.
Barter Transactions. The Company trades advertisements in its traditional and online properties in exchange for advertising in properties of other companies and distribution-related expenses. Revenue and related expenses from barter transactions are recorded at fair value in accordance with GAAP. Revenue from barter transactions was approximately $1.2 million, $1.8 million and $2.5 million for the years ended December 31, 2009, 2008 and 2007, respectively, with approximately equal related expense amounts in each year.
Cost of Goods Sold. Costs of goods sold is comprised of paper, printing and editorial costs, which include the cost of artwork, graphics, prepress and photography for new advertising, and which are expensed as incurred.
Internal-Use Software. In accordance with GAAP, the Company expenses costs incurred in the preliminary project stage and, thereafter, capitalizes costs incurred in developing or obtaining internal use software and includes them in property and equipment, net. Certain costs, such as maintenance and training, are expensed as incurred. Capitalized costs are amortized over a period of not more than three years using the straight-line method. In addition, in accordance with GAAP, direct internal and external costs associated with the development of the features and functionality of the Company’s websites incurred during the application and infrastructure development phase have been capitalized and are included in property and equipment, net in the consolidated balance sheet. Typical capitalized costs include, but are not limited to, acquisition and development of software tools required for the development and operation of the website, acquisition and registration costs for domain names, and costs incurred to develop graphics for the website. These capitalized costs are amortized over the estimated useful life of up to two years using the straight-line method. Capitalized software costs are subject to impairment evaluation in accordance with GAAP.
Derivative Financial Instruments. In March 2008, the FASB issued new GAAP intended to improve financial reporting about derivative financial instruments and hedging activities by requiring enhanced disclosures to enable investors to better understand their effects on an entity’s financial condition, results of operations and cash flows.
It amends existing disclosure requirements to provide users of financial statements with an enhanced understanding of:
| • | how and why an entity uses derivative financial instruments; |
| • | how derivative financial instruments and related hedged items are accounted for; and |
| • | how derivative financial instruments and related hedged items affect an entity’s financial position, financial performance and cash flows. |
To meet those objectives, the new GAAP requires qualitative disclosures about objectives and strategies for using derivative financial instruments, quantitative disclosures about fair value amounts of and gains and losses on derivative financial instruments, and disclosures about credit-risk-related contingent features in derivative agreements. Comparative disclosures are required only for periods subsequent to initial adoption.
The Company adopted the new GAAP effective January 1, 2009 (see Note 19).
56
Table of Contents
Index to Financial Statements
In accordance with GAAP, the Company records all derivative financial instruments in the consolidated balance sheet at their fair value in prepaid expenses and other or other non-current assets and in accrued expenses and other or other non-current liabilities. Changes in fair value are recorded each period in operations or AOCI, depending upon the purpose for using the derivative financial instrument and its qualification, designation and effectiveness as a hedging instrument. Under GAAP, the Company may designate a derivative financial instrument as a hedging instrument in either a cash flow or a fair value hedging relationship.
Derivative financial instruments designated in a hedging relationship to mitigate exposure to changes in the fair value of an asset, liability or firm commitment attributable to a particular risk, such as interest rate risk, are considered fair value hedges. To the extent that a hedging instrument is proven effective in mitigating exposure to the risk being hedged, changes in fair value of the hedged item are recorded within operations as an offset to amounts recorded with respect to fair value changes of the derivative financial instrument.
Derivative financial instruments that are designated to hedge the variability in expected future cash flows of forecasted transactions are considered cash flow hedges. The effective portion of the change in fair value of the derivative financial instrument is recorded in AOCI and reclassified into operations during the period in which the hedged transaction occurs. Any ineffectiveness in an effective hedging relationship is recorded in current period operations within the related revenue or expense line of the hedged item.
The Company must perform a prospective assessment at the inception of each hedging relationship and at least quarterly thereafter to determine whether the derivative financial instrument is expected to be highly effective in hedging the designated risk. If the derivative financial instrument is no longer expected to be highly effective in the hedging relationship, hedge accounting must be discontinued prospectively. Retrospective testing must also be performed quarterly to determine whether the derivative financial instrument has been highly effective in achieving risk management objectives. When a hedging relationship fails retrospective testing, hedge accounting is discontinued at the date when the hedge was last demonstrated to be effective.
Hedge accounting is discontinued prospectively in existing hedging relationships when: (1) any qualification criteria can no longer be met; (2) the hedging instrument has expired, been sold, terminated or exercised; (3) the hedged item has been sold, matured or terminated; (4) it is no longer deemed probable that a hedged forecasted transaction will occur; or (5) management determines that a hedge is no longer deemed appropriate and de-designates the hedging instrument.
In the case of fair value hedges, when: (1) hedging criteria are no longer met; (2) management de-designates the hedging instrument; or (3) the hedging instrument has expired, been sold, terminated or exercised, the Company discontinues recording changes in fair value of the hedged item and amortizes the existing basis adjustment to operations over the hedged item’s remaining expected life. For fair value hedges where the hedged item has been sold, matured or terminated, the difference between the carrying value of the hedged item and its fair value is recorded in current operations.
For cash flow hedges, when: (1) hedging criteria are no longer met; (2) management de-designates the hedging instrument; or (3) the hedging instrument has expired, been sold, terminated or exercised, changes in the value of the derivative financial instrument are recorded to current operations, while the net gain or loss previously recorded in AOCI continues to be reported there until the hedged forecasted transaction impacts operations. When the hedged forecasted transaction is deemed probable to not occur, the amount recorded in AOCI is immediately released into current operations.
Fair Value Measurements. In September 2006, the FASB issued new GAAP related to fair value measurements, which provided guidance on how companies should measure fair value when they are required to use a fair value measure for recognition or disclosure purposes under GAAP. This new GAAP created a common definition of fair value and prescribes methods for measuring fair value, which are intended to make the measurement of fair value more consistent and comparable across companies.
57
Table of Contents
Index to Financial Statements
The new GAAP established a three-tiered hierarchy to prioritize inputs used to measure fair value. Those tiers are defined as follows:
| • | Level 1 inputs are quoted prices (unadjusted) in active markets for identical assets or liabilities that the reporting entity has the ability to access at the measurement date. |
| • | Level 2 inputs are inputs, other than quoted prices included within Level 1, that are observable for the asset or liability, either directly or indirectly. If the asset or liability has a specified (contractual) term, a Level 2 input must be observable for substantially the full term of the asset or liability. |
| • | Level 3 inputs are unobservable inputs for the asset or liability. |
The highest priority in measuring assets and liabilities at fair value is placed on the use of Level 1 inputs, while the lowest priority is placed on the use of Level 3 inputs.
This new GAAP also expands the related disclosure requirements in an effort to provide greater transparency around fair value measures and was effective as of the beginning of fiscal years beginning after November 15, 2007.
In February 2008, the FASB issued new GAAP, which delayed the effective date of previously issued GAAP on fair value measurements to fiscal years beginning after November 15, 2008, and interim periods within those fiscal years, for all nonfinancial assets and nonfinancial liabilities, except those that are recognized or disclosed at fair value in the financial statements on a recurring basis (at least annually). Examples of items to which the deferral applied include, but were not limited to:
| • | nonfinancial assets and nonfinancial liabilities initially measured at fair value in a business combination or other new basis event, but not measured at fair value in subsequent periods (nonrecurring fair value measurements); |
| • | reporting units measured at fair value in the first step of a goodwill impairment test and nonfinancial assets and nonfinancial liabilities measured at fair value in the second step of a goodwill impairment test (measured at fair value on a recurring basis, but not necessarily recognized or disclosed in the financial statements at fair value); |
| • | indefinite-lived intangible assets measured at fair value for impairment assessment (measured at fair value on a recurring basis, but not necessarily recognized or disclosed in the financial statements at fair value); |
| • | long-lived assets (asset groups) measured at fair value for an impairment assessment (nonrecurring fair value measurements); and |
| • | liabilities for exit or disposal activities initially measured at fair value (nonrecurring fair value measurements). |
The Company adopted the new GAAP on January 1, 2008 for its financial assets and liabilities and on January 1, 2009 for its nonfinancial assets and liabilities, and the adoption did not have a material impact on the Company’s financial condition, results of operations or cash flows (see Note 19).
In February 2007, the FASB issued new GAAP that permits companies to choose, at specified election dates, to measure eligible items, which include most recognized financial assets and liabilities and firm commitments, at fair value with unrealized gains and losses on items for which the fair value option has been elected reported in earnings at each subsequent reporting date. Generally, the decision about whether to elect the fair value option must be:
| • | applied instrument by instrument; |
| • | irrevocable; and |
| • | applied only to an entire instrument and not to only specified risks, specific cash flows or portions of that instrument. |
58
Table of Contents
Index to Financial Statements
A company may decide whether to elect the fair value option for each eligible item on its election date. Alternatively, a company may elect the fair value option according to a preexisting policy for specified types of eligible items. A company may choose to elect the fair value option for an eligible item only on the date that certain events occur, including when:
| • | a company first recognizes the eligible item; |
| • | a company enters into an eligible firm commitment; |
| • | financial assets that have been reported at fair value with unrealized gains and losses included in earnings because of specialized accounting principles cease to qualify for that specialized accounting; or |
| • | the accounting treatment for an investment in another entity changes. |
This new GAAP became effective as of the beginning of fiscal years that begin after November 15, 2007. The Company did not elect the fair value option for any of its financial assets or liabilities upon adoption on January 1, 2008, resulting in no impact on its financial condition, results of operations or cash flows.
In April 2009, the FASB issued new GAAP enhancing consistency in financial reporting by increasing the frequency of fair value disclosures under the scope of GAAP on fair value measurements. This new GAAP is effective for interim and annual periods ending after June 15, 2009.
The Company adopted the new GAAP effective June 30, 2009 (see Note 19).
Recent Accounting Pronouncements
In June 2009, the FASB issued Statement of Financial Accounting Standards (“SFAS”) No. 168, The FASB Accounting Standards Codification and the Hierarchy of Generally Accepted Accounting Principles, a replacement of FASB Statement No. 162 (the “Codification”). The Codification, effective for financial statements issued for interim and annual periods ending after September 15, 2009, became the single source of authoritative GAAP, superseding various existing authoritative accounting pronouncements. The Codification eliminates the GAAP hierarchy contained in SFAS No. 162 and establishes one level of authoritative GAAP. All other literature is considered non-authoritative. The Company adopted the Codification in the third quarter of 2009, and the adoption had no impact on the Company’s consolidated financial statements other than changes in reference to various authoritative accounting pronouncements in the notes to the consolidated financial statements.
Business Combinations
In December 2007, the FASB established new GAAP and disclosure requirements pertaining to business combinations. Primary changes to existing accounting include requirements for the acquirer to recognize:
| • | assets acquired, liabilities assumed and any noncontrolling interest in the acquiree at the acquisition date, measured at their fair values as of that date; |
| • | identifiable assets and liabilities, as well as the noncontrolling interest in the acquiree, at the full amounts of their fair values, in a step acquisition; |
| • | assets acquired and liabilities assumed arising from contractual contingencies as of the acquisition date, measured at their acquisition-date fair values; |
| • | goodwill as of the acquisition date, measured as a residual, which in most types of business combinations will result in measuring goodwill as the excess of the consideration transferred plus the fair value of any noncontrolling interest in the acquiree at the acquisition date over the fair values of the identifiable net assets acquired; |
| • | contingent consideration at the acquisition date, measured at its fair value at that date; |
| • | the effect of a bargain purchase in earnings; and |
| • | changes in the amount of its deferred tax benefits that are recognizable because of a business combination either in income from continuing operations in the period of the combination or directly in contributed capital, depending on the circumstances. |
59
Table of Contents
Index to Financial Statements
In April 2009, the FASB issued additional GAAP requiring an asset or a liability arising from a contingency in a business combination to be recognized at fair value if fair value can be reasonably determined and provides additional guidance on how to make that determination. If the fair value of an asset or liability cannot be reasonably determined, the new GAAP requires that an asset or liability be recognized at the amount that would be recognized in accordance with other applicable GAAP for liabilities and at an amount using similar criteria for assets. The new GAAP also amends the subsequent measurement and accounting guidance and the disclosure requirements for assets and liabilities arising from contingencies in a business combination. This new GAAP is effective for assets or liabilities arising from contingencies in business combinations for which the acquisition date is on or after the beginning of the first annual reporting period beginning on or after December 15, 2008.
The Company adopted the new GAAP related to business combinations effective January 1, 2009, and the adoption did not have a material impact on its financial condition, results of operations or cash flows.
Noncontrolling Interests in Consolidated Financial Statements
In December 2007, the FASB also issued new related GAAP regarding noncontrolling interests in consolidated financial statements. This new GAAP requires:
| • | ownership interests in subsidiaries held by parties other than the parent to be clearly identified, labeled and presented in the consolidated balance sheet within equity, but separate from the parent’s equity; |
| • | the amount of consolidated net income attributable to the parent and to the noncontrolling interest to be clearly identified and presented on the face of the consolidated statement of operations; |
| • | changes in a parent’s ownership interest while the parent retains its controlling financial interest in its subsidiary to be accounted for consistently; |
| • | when a subsidiary is deconsolidated, any retained noncontrolling equity investment in the former subsidiary be initially measured at fair value; |
| • | gains or losses on the deconsolidation of a subsidiary to be measured using the fair value of any noncontrolling equity investment rather than the carrying amount of the retained investment; and |
| • | entities to provide sufficient disclosures that clearly identify and distinguish between the interests of the parent and the interests of the noncontrolling owners. |
The Company adopted the new GAAP effective January 1, 2009, and the adoption did not have a material impact on its financial condition, results of operations or cash flows.
60
Table of Contents
Index to Financial Statements
Note 3. Discontinued Operations
The Company has classified the results of divested entities as discontinued operations for all periods presented in accordance with GAAP.
Details about the Company’s divestitures during the years ended December 31, 2008 and 2007 are as follows:
| Consideration |
Pre-tax Gain or Loss on Disposition Recognized During the Years Ended December 31, |
|||||||||||||||||
| Segment, Group or Division |
Year of Inclusion in Discontinued Operations |
Basis for Inclusion in Discontinued Operations |
Year of Disposition |
Form |
Amount | 2008 | 2007(1) | |||||||||||
| (Dollars in thousands) |
||||||||||||||||||
| Outdoors group (part of PEM segment), primarily hunting, fishing and shooting titles |
2006 | Agreement to sell | 2007 | Cash | $ | 170,000 | $ | — | $ | 57,547 | ||||||||
| Channel One (part of Education segment), proprietary network for secondary schools |
2006 | Announcement of intent to sell segment | 2007 | Assumption by the acquirer of net liabilities | 8,600 | — | (7,050 | ) | ||||||||||
| Films Media Group (part of Education segment), a source of educational video |
2006 | Announcement of active pursuit of sale of segment | 2007 | Cash | 11,000 | — | 170 | |||||||||||
| PRIMEDIA Healthcare (part of Education segment), a medical education business(2) |
2006 | Announcement of active pursuit of sale of segment | 2008 | Cash | 200 | 132 | — | |||||||||||
| Enthusiast Media segment(3)(4) |
2007 | Sale of segment | 2007 | Cash | 1,177,900 | — | 460,988 | |||||||||||
| Auto Guides division(5) |
2007 | Announcement of intent to sell or shut down operations of division | 2008 | Cash | 2,100 | 42 | — | |||||||||||
| (1) | Loss related to final adjustments for disposition in previous years was approximately $0.7 million in 2007. |
| (2) | Remaining operations were shut down, resulting in a loss of approximately $0.4 million. |
| (3) | Proceeds were used to pay down debt. |
| (4) | Gain related to final adjustments was approximately $0.7 million in 2008 and resulted in payment of approximately $4.4 million to acquirer. |
| (5) | Remaining operations were shut down, resulting in a loss of approximately $0.8 million. |
There was no pre-tax gain or loss on disposition recognized during the year ended December 31, 2009.
61
Table of Contents
Index to Financial Statements
The operating results of all these operations have been classified as discontinued operations for all periods presented.
The components of discontinued operations included in the consolidated statement of operations are as follows:
| Years Ended December 31, | ||||||||||||
| 2009 | 2008 | 2007 | ||||||||||
| (Dollars in thousands) | ||||||||||||
| Total revenue, net |
$ | — | $ | 3,353 | $ | 358,794 | ||||||
| Income (loss) from operations: |
||||||||||||
| PEM segment |
$ | — | $ | — | $ | 69,683 | ||||||
| Channel One |
— | — | (4,104 | ) | ||||||||
| Films Media Group |
— | — | 622 | |||||||||
| PRIMEDIA Healthcare |
— | 132 | 446 | |||||||||
| Auto Guides division |
— | (1,668 | ) | (8,006 | ) | |||||||
| Provision for litigation reserves and settlements |
(3,250 | ) | (6,000 | ) | (2,000 | ) | ||||||
| Professional fees |
(1,825 | ) | (2,287 | ) | (768 | ) | ||||||
| Adjustments to accrued operating lease liabilities |
(2,770 | ) | 2,123 | 1,030 | ||||||||
| Insurance-related expenses |
(397 | ) | (1,488 | ) | (742 | ) | ||||||
| Write-off of receivables and other assets |
(259 | ) | (1,164 | ) | (1,091 | ) | ||||||
| Deal and other costs related to the divesture of PEM segment |
— | — | (3,675 | ) | ||||||||
| Tax-related contingencies |
6,638 | 462 | (481 | ) | ||||||||
| Other |
(249 | ) | (960 | ) | 13 | |||||||
| (Loss) income from operations before benefit (provision) for income taxes and gain (loss) on sale of businesses |
(2,112 | ) | (10,850 | ) | 50,927 | |||||||
| Gain (loss) on sale of businesses: |
||||||||||||
| Outdoors group |
— | — | 57,547 | |||||||||
| PEM segment |
— | 651 | 460,988 | |||||||||
| Channel One |
— | — | (7,050 | ) | ||||||||
| Films Media Group |
— | — | 170 | |||||||||
| PRIMEDIA Healthcare |
— | 132 | — | |||||||||
| Auto Guides division |
— | 42 | — | |||||||||
| Final adjustments for disposition in previous years |
— | — | (674 | ) | ||||||||
| Benefit (provision) for income taxes |
1,060 | 20,466 | (14,785 | ) | ||||||||
| Discontinued operations, net of tax (including gain (loss) on sale of businesses) |
$ | (1,052 | ) | $ | 10,441 | $ | 547,123 | |||||
The components of the benefit (provision) for income taxes included in discontinued operations in the consolidated statement of operations are as follows:
| Years Ended December 31, | ||||||||||||
| 2009 | 2008 | 2007 | ||||||||||
| (Dollars in thousands) | ||||||||||||
| Provision for tax benefit (expense) on pre-tax income (loss) |
$ | (1,779 | ) | $ | 15,046 | $ | 28,937 | |||||
| Benefit for 2008 extended NOL carryback |
9,347 | — | — | |||||||||
| Provision for tax benefit (expense) on gain (loss) on sale of businesses |
— | 1,227 | (44,901 | ) | ||||||||
| Change in liability for uncertain tax positions |
(6,687 | ) | (1,347 | ) | (4,911 | ) | ||||||
| Changes in estimates included in prior year tax provision |
179 | 5,540 | 6,090 | |||||||||
| Total benefit (expense) for income taxes |
$ | 1,060 | $ | 20,466 | $ | (14,785 | ) | |||||
62
Table of Contents
Index to Financial Statements
Amounts other than the income or loss from operations of the disposed businesses and gain or loss on sale of businesses primarily represent the impact of changes in contingent obligations the Company has related to the disposition of the businesses, including changes in sublease income assumptions related to operating leases for office space subleased or assigned to the buyer or another third party; legal and other professional fees incurred in defending the Company against litigation or in attempting to force performance by third parties under leasing arrangements; actual or expected losses from litigation for which the Company is liable; write off of uncollectable rent receivable under operating lease arrangements for real estate; insurance-related costs for events that occurred prior to the disposition; and other similar costs.
The gain on sale of businesses, net of tax, was $0.0 million, $2.0 million and $459.1 million for the years ended December 31, 2009, 2008 and 2007, respectively.
During the year ended December 31, 2009, the Company recognized $9.3 million tax benefit as a result of its ability, under the “Worker, Homeownership, and Business Assistance Act of 2009” (the “Assistance Act”), to elect an extended carryback period for NOLs. The Company elected to carryback its 2008 federal NOL to recover income taxes previously paid. This tax benefit was partially offset by the 2009 tax expense of $(1.7) million and a $(6.6) million expense for uncertain tax positions on certain temporary items.
During 2008, the Company recognized a tax benefit of $16.3 million in discontinued operations as a result of its ability to carry back a projected 2008 NOL against taxes paid on a portion of the 2007 gain on divestitures of certain subsidiaries. The 2008 NOL arose primarily from the reversal of differences between the carrying value and tax basis in a group of PRIMEDIA Healthcare intangible assets triggered by the sale of those assets during 2008. The Company also recognized a tax benefit of $4.2 million in discontinued operations during 2008, primarily as a result of changes in its estimate of its ability to utilize certain NOLs to offset 2007 taxable income.
Held for Sale
As of December 31, 2009 and 2008 there were no assets and liabilities of businesses held for sale.
Impairment
In accordance with GAAP related to accounting for goodwill and other intangible assets, the Company performs annual impairment testing on its goodwill and indefinite-lived intangible assets. In connection with the results of the GAAP impairment testing during 2007, factors indicated that the carrying value of certain finite-lived assets might not be recoverable. As a result, the Company recorded an impairment charge of $1.2 million related to the write-down of certain definite-lived intangibles of the Auto Guides division, which is included in income (loss) from operations Auto Guides division in the table above.
Note 4. Acquisitions
In February 2007, the Company acquired the assets of RentalHouses.com for approximately $9.0 million in cash plus post-closing adjustments. This acquisition did not have a material impact on the Company’s results of operations for the year ended December 31, 2007, nor were the operations of this acquisition material during 2007 prior to the acquisition.
In connection with the Company’s acquisition of 80% of the common stock of Automotive.com in 2005, PRIMEDIA and the minority shareholders of Automotive.com, including its Chief Executive Officer, entered into a forward agreement through which PRIMEDIA would purchase the remaining 20% of Automotive.com’s common stock in early 2009 or, if the forward agreement was extended, early 2010. The settlement price of the forward agreement was to be based on a measure of Automotive.com’s earnings in the fiscal year prior to settlement.
63
Table of Contents
Index to Financial Statements
Due to the ongoing relationship of the Chief Executive Officer of Automotive.com with the Company after the acquisition, for accounting purposes, the forward agreement was bifurcated into the components relating to him on the one hand and the other minority shareholders on the other. The component of the forward agreement relating to the other minority shareholders was recorded as a liability at fair value as of the transaction date and an adjustment to the purchase price. Automotive.com was part of the Company’s PEM segment, which was sold during 2007. The purchaser of the PEM segment assumed all of the Company’s obligations under the forward agreement. The change in the fair value of the liability during 2007 until the sale of the PEM segment resulted in an increase in interest expense of $2.1 million. Changes in the fair value of the component pertaining to Automotive.com’s Chief Executive Officer have been charged to compensation expense, including an immaterial amount during the year ended December 31, 2007.
In January 2007, the Company acquired Modified Automotive Group, publisher of Modified Magazine, Modified Luxury & Exotics Magazine, Modified Mustangs Magazine, and their related event partnerships and websites for approximately $15.0 million in cash, including acquisition related expenses. This acquisition was part of the PEM segment, which was sold during 2007.
In addition, during 2007, the Company made other payments relating to acquisitions of $10.1 million. The results of operations of these acquisitions did not have a material impact on the Company’s results of operations for the year ended December 31, 2007. The Company did not undertake any acquisitions during 2009 or 2008, but during 2008, it recorded adjustments to goodwill of less than $0.1 million related to previously completed acquisitions.
Note 5. Available for Sale Securities
During 2008, the Company sold all of its available for sale securities with no realized gain or loss. As of December 31, 2009 and 2008, the Company had no available for sale securities.
Note 6. Property and Equipment, Net
Property and equipment, net, including assets held under capital leases, consisted of the following:
| 2009 |
December 31, | |||||||
| Range of Lives (years) |
2009 | 2008 | ||||||
| (Dollars in thousands) | ||||||||
| Building improvements |
10 | $ | — | $ | 779 | |||
| Leasehold improvements |
Shorter of economic life or 5 years | 3,178 | 3,368 | |||||
| Furniture and fixtures |
7 | 4,247 | 4,619 | |||||
| Machinery and equipment |
3-5 | 14,608 | 13,778 | |||||
| Internal use software |
2-3 | 71,825 | 64,150 | |||||
| Display racks and other |
3 | 5,071 | 15,274 | |||||
| 98,929 | 101,968 | |||||||
| Less: Accumulated depreciation and amortization |
80,932 | 83,203 | ||||||
| $ | 17,997 | $ | 18,765 | |||||
64
Table of Contents
Index to Financial Statements
Included in property and equipment as of December 31, 2009 and 2008 are assets acquired under capital leases in the amount of $1.2 million and $2.1 million, respectively, with accumulated amortization of $0.7 million and $1.1 million, respectively (see Note 20).
Note 7. Goodwill and Other Intangible Assets
GAAP requires companies to assess goodwill and indefinite-lived intangible assets for impairment at least annually. The Company’s impairment testing under GAAP related to accounting for goodwill and indefinite-lived intangibles did not result in any impairment for any period presented.
Changes in the carrying amount of goodwill were as follows (dollars in thousands):
| Balance as of January 1, 2008 |
$ | 129,286 | |
| Goodwill related final purchase accounting adjustments for prior year acquisition of businesses |
19 | ||
| Balance as of December 31, 2008 |
129,305 | ||
| Other changes |
— | ||
| Balance as of December 31, 2009 |
$ | 129,305 | |
Intangible assets subject to amortization consisted of the following:
| Weighted- Average Amortization Period (Years) |
December 31, | |||||||||||||||||||
| 2009 | 2008 | |||||||||||||||||||
| Carrying Amount |
Accumulated Amortization |
Net | Carrying Amount |
Accumulated Amortization |
Net | |||||||||||||||
| (Dollars in thousands) | ||||||||||||||||||||
| Advertiser lists |
12 | $ | 93,953 | $ | 79,825 | $ | 14,128 | $ | 94,454 | $ | 77,767 | $ | 16,687 | |||||||
| Other |
6 | 5,742 | 5,481 | 261 | 5,905 | 5,233 | 672 | |||||||||||||
| $ | 99,695 | $ | 85,306 | $ | 14,389 | $ | 100,359 | $ | 83,000 | $ | 17,359 | |||||||||
Intangible assets not subject to amortization had a carrying value of $6.3 million as of December 31, 2009 and 2008 and consisted of trademarks. Amortization expense for intangible assets subject to amortization was $2.5 million, $2.9 million and $3.5 million for the years ended December 31, 2009, 2008 and 2007, respectively. As of December 31, 2009, estimated future amortization expense of intangible assets subject to amortization was approximately: $3.8 million, $2.9 million, $2.4 million, $2.2 million and $1.8 million for 2010, 2011, 2012, 2013 and 2014, respectively.
During the fourth quarter of 2009, factors were identified indicating that the carrying value of certain of the Company’s advertiser lists might not be recoverable. The Company determined that the expected undiscounted cash flows associated with one advertiser list were less than the carrying value and, as a result, recorded an impairment charge of approximately $0.5 million, which is included in amortization of intangible assets in the consolidated statement of operations. The Company also determined that the decline in the value of these assets was occurring faster than the expense being recognized using the straight-line method of amortization. To better match the deterioration in the value of the assets, the Company concluded that an accelerated method of amortization over a shorter estimated life would be appropriate and made this change in estimate effective January 1, 2010. The Company’s estimate above of future amortization expense of intangible assets subject to amortization includes the impact of this change in estimate, which will result in an increase in estimated future amortization expense of $1.6 million, $0.9 million, $0.4 million, $0.3 million and $0.3 million for 2010, 2011, 2012, 2013 and 2014, respectively, over what it would have been absent the change in estimate.
65
Table of Contents
Index to Financial Statements
Note 8. Other Non-Current Assets
Other non-current assets consisted of the following:
| December 31, | ||||||
| 2009 | 2008 | |||||
| (Dollars in thousands) | ||||||
| Deferred financing costs, net |
$ | 4,160 | $ | 5,014 | ||
| Cost-method investments |
1,000 | 2,500 | ||||
| Taxes |
5,034 | 4,330 | ||||
| Other |
532 | 700 | ||||
| $ | 10,726 | $ | 12,544 | |||
Deferred financing costs
The deferred financing costs are net of accumulated amortization of $2.2 million and $1.3 million as of December 31, 2009 and 2008, respectively. During 2009 and 2008, the Company charged-off $0.4 million and less than $0.1 million, respectively, of deferred financing costs resulting from debt redemptions and repurchases (see Note 10).
Cost-method investments
During the year ended December 31, 2009, the Company sold certain cost-method investments, which had previously been written down to their estimated fair value of $0.0 million, for cash and recorded a corresponding gain of $2.3 million to other (income) expense, net in the consolidated statement of operations.
As is more fully discussed in Note 19, the Company recorded impairment losses of approximately $1.5 million and $0.9 million during the years ended December 31, 2009 and 2008, respectively, related to its cost-method investments.
Note 9. Accrued Expenses and Other and Other Non-Current Liabilities
Accrued expenses and other current liabilities consisted of the following:
| December 31, | ||||||
| 2009 | 2008 | |||||
| (Dollars in thousands) | ||||||
| Payroll, commissions and related employee benefits |
$ | 7,319 | $ | 8,278 | ||
| Tax-related liabilities |
4,745 | 11,560 | ||||
| Derivative financial instrument liabilities |
880 | 4,253 | ||||
| Reserves for litigation |
5,750 | 8,000 | ||||
| Restructuring liabilities |
12,738 | 3,466 | ||||
| Other |
7,862 | 8,934 | ||||
| $ | 39,294 | $ | 44,491 | |||
Other non-current liabilities consisted of the following:
| December 31, | ||||||
| 2009 | 2008 | |||||
| (Dollars in thousands) | ||||||
| Tax-related liabilities |
$ | 28,365 | $ | 22,769 | ||
| Derivative financial instrument liabilities |
1,049 | 896 | ||||
| Restructuring liabilities |
17,619 | 18,187 | ||||
| Other |
8,753 | 9,191 | ||||
| $ | 55,786 | $ | 51,043 | |||
66
Table of Contents
Index to Financial Statements
At December 31, 2007, an approximate $5.1 million liability was recorded as a divesture reserve related to the sale of the PEM segment during the third quarter of 2007. The reserve was established as a working capital settlement at the time of the sale of the PEM segment. During 2008, the Company settled the working capital adjustment with the buyer and recognized an additional $0.7 million gain on sale of businesses before income taxes. The Company’s consolidated statement of cash flows discloses the payments made during 2008 of approximately $4.4 million related to the sale of businesses. The cash settlement of $4.4 million together with the additional gain on sale of $0.7 million resulted in a divesture reserve balance of $0.0 million at December 31, 2008 and 2009.
Note 10. Borrowings
Long-term debt consisted of the following:
| December 31, | ||||||
| 2009 | 2008 | |||||
| (Dollars in thousands) | ||||||
| Borrowings under bank credit facilities |
$ | 224,700 | $ | 247,500 | ||
| Obligations under capital leases (see Note 20) |
571 | 1,076 | ||||
| 225,271 | 248,576 | |||||
| Less: Current maturities of long-term debt |
2,922 | 3,045 | ||||
| $ | 222,349 | $ | 245,531 | |||
Bank Credit Facilities
On August 1, 2007, the Company completed the financing for a $350.0 million senior secured bank credit facility. The new bank credit facility provides for two loan facilities: (1) a revolving credit facility with aggregate commitments of $100.0 million (the “Revolving Facility”), which matures on August 1, 2013, and (2) a Term Loan B credit facility in an aggregate principal amount of $250.0 million (the “Term Loan B Facility”), which matures on August 1, 2014 (the “Term Loan B Maturity Date”). The Company capitalized approximately $6.3 million of financing costs associated with the new credit facilities.
Amounts borrowed under the Revolving Facility bear interest, at the Company’s option, at an annual rate of either the base rate plus an applicable margin ranging from 0.625% to 1.00% or the eurodollar rate plus an applicable margin ranging from 1.625% to 2.00%. The weighted-average interest rate on the Revolving Facility at December 31, 2009 was 1.98%. The Term Loan B Facility bears interest, at the Company’s option, at an annual rate of either the base rate plus an applicable margin ranging from 1.00% to 1.25% or the eurodollar rate plus an applicable margin ranging from 2.00% to 2.25%. The weighted-average interest rate on the Term Loan B Facility at December 31, 2009 was 2.50%. Additionally, through August 1, 2009, the Company was required to manage its interest rate risk arising from the Term Loan B Facility through the utilization of derivative financial instruments in a notional amount equal to at least 35% of the Term Loan B principal outstanding (see Note 18).
On June 30, 2009, the Company’s bank credit facility was amended (the “Amendment”). Among other things, the Amendment gives the Company the right, subject to the conditions set forth therein, to prepay or otherwise acquire with or for cash, on either a pro rata or non-pro rata basis, loans outstanding under the Term Loan B Facility and held by lenders who consent to such prepayment or acquisition, at a discount to the par value of such principal at any time and from time to time on and after June 30, 2009 and on or prior to June 30, 2011; provided that the aggregate amounts expended by the Company in connection with all such prepayments or acquisitions do not exceed $35.0 million. All such loans prepaid or acquired will be retired and extinguished and deemed paid effective upon such prepayment or acquisition.
67
Table of Contents
Index to Financial Statements
The Amendment also memorializes the reduction of the Revolving Facility commitment of Lehman Commercial Paper Inc., a subsidiary of Lehman Brothers Inc. (“Lehman”) to $0.0 million and, as a consequence thereof, the total capacity under the Revolving Facility has now been confirmed to have been reduced by $12.0 million to $88.0 million. The Company believed and previously disclosed that the total capacity under the Revolving Facility had been effectively reduced by $12.0 million as a result of bankruptcy proceedings related to Lehman Brothers Holdings Inc., the parent company of Lehman. The commitment under the Revolving Facility for each other lender remains unchanged from each such lender’s commitment immediately prior to such reduction. Additionally, effective June 30, 2009, Lehman ceased to be a co-documentation agent under the bank credit facility.
In connection with the Amendment, the Company incurred approximately $0.5 million in modification fees, which were paid to the creditors and will be expensed over the remaining term of the loan.
There are no scheduled commitment reductions under the Revolving Facility. The loans under the Term Loan B Facility are subject to scheduled repayment in quarterly installments of $0.6 million each payable on March 31, June 30, September 30 and December 31 of each year through June 30, 2014, followed by a final repayment on the Term Loan B Maturity Date of $213.5 million, which reflects the Term Loan B Facility repurchase discussed below.
Revolving Facility Borrowings
In September 2008, the Company borrowed $13.2 million against its Revolving Facility. In March 2009, the Company repaid $8.8 million of the amount outstanding and the remaining $4.4 million in June 2009. In early July 2009, the Company borrowed $5.0 million against its Revolving Facility and repaid the entire amount borrowed in late July 2009. In early February 2010, the Company borrowed $9.0 million against its Revolving Facility.
The bank credit facilities consisted of the following as of December 31, 2009:
| Revolving Facility |
Term LoanB Facility |
Total | ||||||||||
| (Dollars in thousands) | ||||||||||||
| Bank credit facilities |
$ | 88,000 | $ | 224,700 | $ | 312,700 | ||||||
| Borrowings outstanding |
— | (224,700 | ) | (224,700 | ) | |||||||
| Letters of credit outstanding |
(2,826 | ) | — | (2,826 | ) | |||||||
| Unused bank commitments |
$ | 85,174 | $ | — | $ | 85,174 | ||||||
Under the new bank credit facilities agreement, the Company has agreed to pay commitment fees at a per annum rate of either 0.375%, 0.300% or 0.250%, depending on its debt to earnings before interest, taxes, depreciation and amortization (“EBITDA”) ratio, as defined in the bank credit facilities agreement, on the daily average aggregate unutilized commitment under the revolving loan commitment. The weighted-average of its commitment fees under the new bank credit facilities for 2009, 2008 and for the five months it was outstanding during 2007 was 0.33%, 0.32% and 0.36%, respectively. The Company also has agreed to pay certain fees with respect to the issuance of letters of credit and an annual administration fee. From time to time, it may pay amendment fees under its bank credit facilities.
The bank credit facilities agreement, among other things, limits the Company’s ability to change the nature of its businesses, incur indebtedness, create liens, sell assets, engage in mergers, consolidations or transactions with affiliates, make investments in or loans to certain subsidiaries, issue guarantees and make certain restricted payments, including dividend payments on or repurchases of its common stock. The bank credit facilities are guaranteed by the common stock of substantially all of PRIMEDIA’s subsidiaries.
68
Table of Contents
Index to Financial Statements
8% Senior Notes
On May 15, 2008, the Company redeemed all $2.6 million of its outstanding 8% Senior Notes due 2013 (the “8% Senior Notes”). The Notes were redeemed at a 4% premium of the aggregate outstanding principal amount, which was approximately $0.1 million and is included in other (income) expense, net in the consolidated statement of operations. The Company did not incur any early termination penalties in connection with the redemption of the 8% Senior Notes beyond the 4% redemption premium.
Debt Redemptions and Repurchases
During 2007, the Company, with the amounts borrowed under the Term Loan B Facility, combined with the net proceeds received from the sale of PEM, repaid all $492.5 million in principal of its existing term loan at June 30, 2007, redeemed all $410.0 million in principal of its 8 7/8% Senior Notes, redeemed $292.2 million in principal of its 8% Senior Notes, redeemed all $122.5 million in principal of its Senior Floating Rate Notes and paid approximately $16.0 million of accrued interest on its 8% Senior Notes. The Company recorded a loss on debt redemptions of $44.3 million, included in other (income) expense, net in the consolidated statement of operations, for the year ended December 31, 2007, which was comprised of the following:
| Debt Instrument | |||||||||||||||
| 8 7/8% Senior Notes due 2011 |
8% Senior Notes due 2013 |
Senior Floating Rate Notes due 2010 |
Bank Credit Facilities |
Total | |||||||||||
| (Dollars in thousands) | |||||||||||||||
| Principal redeemed |
$ | 410,015 | $ | 292,214 | $ | 122,500 | $ | 492,500 | $ | 1,317,229 | |||||
| Redemption price |
422,340 | 309,121 | 126,175 | 492,500 | 1,350,136 | ||||||||||
| Premium paid |
12,325 | 16,907 | 3,675 | — | 32,907 | ||||||||||
| Write-off of deferred financing fees |
3,200 | 3,426 | 1,107 | 993 | 8,726 | ||||||||||
| Write-off of original issue discount |
2,706 | — | — | — | 2,706 | ||||||||||
| Total loss on redemption |
$ | 18,231 | $ | 20,333 | $ | 4,782 | $ | 993 | $ | 44,339 | |||||
During 2009, the Company repurchased and retired $20.3 million in principal of its Term Loan B Facility for $14.9 million. In connection with the repurchases, the Company also wrote off $0.4 million in deferred financing fees, resulting in a net gain of approximately $5.0 million, which is included in other (income) expense, net in the consolidated statement of operations.
The scheduled repayments of all debt outstanding, including capital leases, as of December 31, 2009, were as follows:
| Years Ending December 31, |
Debt | Capital Lease Obligations and Other |
Total | ||||||
| (Dollars in thousands) | |||||||||
| 2010 |
$ | 2,500 | $ | 422 | $ | 2,922 | |||
| 2011 |
2,500 | 138 | 2,638 | ||||||
| 2012 |
2,500 | 11 | 2,511 | ||||||
| 2013 |
2,500 | — | 2,500 | ||||||
| 2014 |
214,700 | — | 214,700 | ||||||
| Total |
$ | 224,700 | $ | 571 | $ | 225,271 | |||
Covenant Compliance
Under the most restrictive covenants contained in the bank credit facilities agreement, the maximum allowable total leverage ratio, as defined in the agreement, is 5.25 to 1. As of December 31, 2009, this leverage ratio was approximately 2.8 to 1.
69
Table of Contents
Index to Financial Statements
For purposes of the Company’s bank credit facilities, the provision for restructuring costs is excluded from the Company’s calculation of consolidated EBITDA, as defined in the bank credit facilities.
At December 31, 2009, the Company was in compliance with all of its debt convenants.
Note 11. Income Taxes
The components of the (provision) benefit for income taxes were as follows:
| Years Ended December 31, | ||||||||||||
| 2009 | 2008 | 2007 | ||||||||||
| (Dollars in thousands) | ||||||||||||
| Current: |
||||||||||||
| Federal |
$ | 2,940 | $ | 20,859 | $ | (39,181 | ) | |||||
| State and local |
587 | (622 | ) | (2,672 | ) | |||||||
| Total |
3,527 | 20,237 | (41,853 | ) | ||||||||
| Deferred: |
||||||||||||
| Federal |
(4,535 | ) | (1,928 | ) | (250,276 | ) | ||||||
| State and local |
(1,092 | ) | (164 | ) | (34,157 | ) | ||||||
| Total |
(5,627 | ) | (2,092 | ) | (284,433 | ) | ||||||
| Change in valuation allowance |
1,062 | 29,325 | 344,229 | |||||||||
| Total deferred (provision) benefit |
(4,565 | ) | 27,233 | 59,796 | ||||||||
| Total (provision) benefit for income taxes |
$ | (1,038 | ) | $ | 47,470 | $ | 17,943 | |||||
The (provision) benefit for income taxes included in the Company’s consolidated statement of operations and attributable to continuing and discontinued operations was as follows:
| Years Ended December 31, | |||||||||||
| 2009 | 2008 | 2007 | |||||||||
| (Dollars in thousands) | |||||||||||
| Continuing operations |
$ | (2,098 | ) | $ | 27,004 | $ | 32,728 | ||||
| Discontinued operations |
1,060 | 20,466 | (14,785 | ) | |||||||
| Total (provision) benefit for income taxes |
$ | (1,038 | ) | $ | 47,470 | $ | 17,943 | ||||
70
Table of Contents
Index to Financial Statements
A reconciliation of the income tax expected at the U.S. federal statutory income tax rate of 35% to the income taxes provided on the income (loss) from continuing operations is set forth below:
| Years Ended December 31, | ||||||||||||
| 2009 | 2008 | 2007 | ||||||||||
| (Dollars in thousands) | ||||||||||||
| Tax (provision) benefit at federal statutory rate |
$ | (2,323 | ) | $ | (7,708 | ) | $ | 30,943 | ||||
| Permanent Items |
(479 | ) | 134 | 1,233 | ||||||||
| State and local taxes, net of federal impact |
(941 | ) | (332 | ) | 2,747 | |||||||
| Change in uncertain tax positions |
1,070 | 347 | — | |||||||||
| Change in deferred compensation |
(370 | ) | — | — | ||||||||
| Change in valuation allowance |
1,062 | 37,014 | (1,466 | ) | ||||||||
| Change in deferred tax liability |
— | (2,092 | ) | (1,466 | ) | |||||||
| Other, net |
(117 | ) | (359 | ) | 737 | |||||||
| (Provision) benefit for income taxes |
$ | (2,098 | ) | $ | 27,004 | $ | 32,728 | |||||
The change in the valuation allowance during 2008 resulted from the utilization of net deferred tax assets to offset income from continuing operations during the year as well as the partial release discussed in further detail below.
71
Table of Contents
Index to Financial Statements
Deferred income taxes reflect the net tax effects of (i) temporary differences between the carrying amounts of assets and liabilities for financial reporting purposes and the amounts used for income tax purposes and (ii) operating and capital loss carryforwards. Net deferred tax assets are recorded to the extent the Company believes these assets will more likely than not be realized. The tax effects of significant items comprising the Company’s deferred income taxes are as follows:
| December 31, | ||||||||||||||||||||||||
| 2009 | 2008 | |||||||||||||||||||||||
| Federal | State and Local |
Total | Federal | State and Local |
Total | |||||||||||||||||||
| (Dollars in thousands) | ||||||||||||||||||||||||
| Deferred income tax assets: |
||||||||||||||||||||||||
| Current: |
||||||||||||||||||||||||
| Difference between carrying amount and tax basis of accrued expenses and other |
$ | 5,700 | $ | 882 | $ | 6,582 | $ | 10,412 | $ | 1,428 | $ | 11,840 | ||||||||||||
| Difference between carrying amount and tax basis of restructuring reserves |
4,753 | 736 | 5,489 | 1,217 | 167 | 1,384 | ||||||||||||||||||
| Difference between carrying amount and tax basis of deferred rent |
1,089 | 168 | 1,257 | 1,534 | 210 | 1,744 | ||||||||||||||||||
| Total current |
11,542 | 1,786 | 13,328 | 13,163 | 1,805 | 14,968 | ||||||||||||||||||
| Non-current: |
||||||||||||||||||||||||
| Difference between carrying amount and tax basis of accrued expenses and other |
349 | 54 | 403 | 299 | 41 | 340 | ||||||||||||||||||
| Difference between carrying amount and tax basis of advanced payments |
964 | 149 | 1,113 | — | — | — | ||||||||||||||||||
| Difference between carrying amount and tax basis of restructuring reserves |
6,385 | 988 | 7,373 | 6,528 | 895 | 7,423 | ||||||||||||||||||
| Difference between carrying amount and tax basis of deferred rent |
2,324 | 360 | 2,684 | 2,567 | 352 | 2,919 | ||||||||||||||||||
| Difference between carrying amount and tax basis of other intangible assets |
903 | 140 | 1,043 | 1,356 | 186 | 1,542 | ||||||||||||||||||
| Difference between carrying amount and tax basis of property and equipment |
(639 | ) | (99 | ) | (738 | ) | (481 | ) | (66 | ) | (547 | ) | ||||||||||||
| Difference between carrying amount and tax basis of liability for uncertain tax positions |
4,804 | 159 | 4,963 | 5,105 | 111 | 5,216 | ||||||||||||||||||
| Difference between carrying amount and tax basis of stock-based compensation |
912 | 141 | 1,053 | 1,142 | 157 | 1,299 | ||||||||||||||||||
| Operating loss carryforwards |
157,573 | 2,170 | 159,743 | 156,736 | 6,531 | 163,267 | ||||||||||||||||||
| Alternative minimum tax credit carryforwards |
— | — | — | 2,687 | — | 2,687 | ||||||||||||||||||
| Difference between carrying amount and tax basis of cost-method investments |
7,342 | 1,136 | 8,478 | 8,550 | 1,172 | 9,722 | ||||||||||||||||||
| Total non-current |
180,917 | 5,198 | 186,115 | 184,489 | 9,379 | 193,868 | ||||||||||||||||||
| Total deferred income tax assets |
192,459 | 6,984 | 199,443 | 197,652 | 11,184 | 208,836 | ||||||||||||||||||
| Deferred income tax liabilities: |
||||||||||||||||||||||||
| Non-current: |
||||||||||||||||||||||||
| Difference between carrying amount and tax basis of indefinite-lived intangible assets |
14,316 | 2,215 | 16,531 | 12,625 | 1,731 | 14,356 | ||||||||||||||||||
| Total deferred income tax liabilities |
14,316 | 2,215 | 16,531 | 12,625 | 1,731 | 14,356 | ||||||||||||||||||
| Net deferred income tax assets |
178,143 | 4,769 | 182,912 | 185,027 | 9,453 | 194,480 | ||||||||||||||||||
| Less: Valuation allowance |
(166,183 | ) | (6,984 | ) | (173,167 | ) | (168,327 | ) | (11,184 | ) | (179,511 | ) | ||||||||||||
| Net |
$ | 11,960 | $ | (2,215 | ) | $ | 9,745 | $ | 16,700 | $ | (1,731 | ) | $ | 14,969 | ||||||||||
72
Table of Contents
Index to Financial Statements
During 2008, the Company increased its net deferred tax asset and the associated valuation allowance by approximately $26.9 million as a result of its analysis of its cumulative deferred tax balances. This analysis had no effect on the consolidated statement of operations.
As of December 31, 2009, the Company had aggregate federal NOLs of approximately $452.4 million. During the year ended December 31, 2009, the Company recognized a tax benefit of $1.1 million and $9.3 million in continuing and discontinuing operations, respectively, as a result of its ability, under the Assistance Act, to elect to carryback its federal NOLs to recover income taxes previously paid. This tax benefit was offset by the 2009 tax expense in discontinued operations of $(7.2) million for uncertain tax positions on certain temporary items. The net income tax benefit recorded as a result of this carryback was $1.1 million and $2.1 million in continuing and discontinued operations, respectively. This expected carryback of $10.4 million is included in prepaid expenses and other in the consolidated balance sheet. The $452.4 million of federal NOLs remaining at December 31, 2009 are available to reduce future taxable income, and the substantial majority expire between 2020 and 2024. In addition, the Company has state and local NOLs in various jurisdictions in which the Company and/or its subsidiaries file income tax returns. These state and local NOLs expire over various periods based on applicable state and local statutes and regulations.
Based on the weight of objectively verifiable available positive and negative evidence as of December 31, 2008, the Company recorded a partial release of the valuation allowance against its net deferred tax assets of $29.3 million because it believed it more likely than not that this portion of the deferred tax assets would be realized. The Company would need to generate approximately $84.0 million in pre-tax income for financial reporting purposes to realize these assets.
Elements of positive evidence about the realizability of the assets included:
| • | the remaining lives of the NOLs; |
| • | historical income when results are normalized to remove the impact of discontinued operations and to reflect the completion of the Company’s relocation from New York to Norcross; and |
| • | forecasted income, utilizing the same forecast as for goodwill impairment testing, in future periods. |
Elements of negative evidence about the realizability of the assets included:
| • | historical losses and |
| • | uncertainty as to the timing and exact amount of future earnings as a result of current economic conditions, the U.S. residential real estate industry, as well as the uncertainty of the effectiveness of the steps the Company has taken, and will take, to mitigate the adverse impact on its businesses. |
The Company’s assessment in 2008 was different than it was in 2007, primarily due to the completion of the relocation of the Company from New York to Norcross, resulting in a significantly reduced cost structure, and almost a full year of operations of the Consumer Guides business supporting the entire PRIMEDIA cost structure, while maintaining profitability without the impact of divested entities. The Company’s assessment in 2009 is consistent with the 2008 assessment.
As of December 31, 2009, the Company maintained a partial valuation allowance against its net deferred income tax assets. The Company may release additional valuation allowance in future periods when it can conclude that a greater portion of the net deferred tax assets is more likely than not to be realized. To the extent the Company reports taxable income in future periods, it intends to use its NOLs, to the extent allowable, to offset that taxable income and reduce cash outflows for income taxes. The Company’s ability to use its federal and state NOLs and federal and state tax credit carryforwards may be subject to restrictions attributable to equity transactions in the future resulting from changes in ownership as defined under the Internal Revenue Code.
In accordance with GAAP related to accounting for goodwill and other intangibles, the Company no longer amortizes the indefinite-lived intangible assets but for financial reporting purposes continues to amortize these intangible assets for tax purposes. Therefore, the Company will have deferred tax liabilities that will arise each
73
Table of Contents
Index to Financial Statements
quarter because the temporary differences related to the amortization of these assets for tax purposes will not reverse prior to the expiration period of the Company’s deductible temporary differences unless the related assets are sold or an impairment of the assets is recorded. During 2009, 2008 and 2007, the Company recorded a provision (benefit) for deferred income taxes of $2.2 million, $2.1 million and $(59.8) million, respectively, related to the change in the Company’s net deferred tax liability for the tax effect of the net increase in the difference between the basis in the indefinite-lived intangible assets for financial reporting and tax purposes.
The following is a reconciliation of the total amount of unrecognized tax benefits:
| As of and for the Years Ended December 31, |
||||||||||||
| 2009 | 2008 | 2007 | ||||||||||
| (Dollars in thousands) | ||||||||||||
| Unrecognized tax benefit, beginning of period |
$ | 83,556 | $ | 92,684 | $ | 102,531 | ||||||
| Gross increase—tax positions in prior period |
21 | 1,103 | — | |||||||||
| Gross decrease—tax positions in prior period |
(38 | ) | (490 | ) | (20,618 | ) | ||||||
| Gross increase—tax positions in current period |
— | 7,219 | 19,684 | |||||||||
| Settlements |
— | (837 | ) | — | ||||||||
| Lapsing of statutes of limitations |
(1,373 | ) | (607 | ) | (924 | ) | ||||||
| Divestitures |
— | (15,516 | ) | (7,989 | ) | |||||||
| Unrecognized tax benefit, end of period |
$ | 82,166 | $ | 83,556 | $ | 92,684 | ||||||
Approximately $24.6 million of the $82.2 million total unrecognized tax benefits as of December 31, 2009 would, if recognized, have an impact on the effective income tax rate, while approximately $57.6 million would not. As of December 31, 2009, the Company’s recorded liability for uncertain tax positions was $28.3 million, which includes $3.7 million of interest and penalties.
Related to unrecognized tax benefits noted above, the Company recognized no net charges for penalties and charges for interest of $0.7 million during 2009, and cumulatively, as of December 31, 2009, had recognized a liability of $0.7 million for penalties and $3.0 million for interest. Through December 31, 2008, cumulatively, the Company had recognized a liability of $0.7 million for penalties and $2.4 million for interest.
The Company or one of its subsidiaries files income tax returns in the U.S. federal jurisdiction and various state and local jurisdictions, and the Company is routinely under audit by multiple tax authorities. The Company is currently under audit by the Internal Revenue Service (“IRS”) for its 2005 and 2006 federal consolidated income tax filings and other material state taxing jurisdictions for income for filings for the tax years 2005 through 2007. The Company reported NOLs from tax years back to 1992 on federal and state tax returns currently under, or open to, examination. The Company believes that its accrual for tax liabilities is adequate for all open audit years based on its assessment of many factors, including past experience and interpretations of tax law. This assessment relies on estimates and assumptions and involves a series of complex judgments about future events.
Due to the uncertainty regarding the timing of the completion of current or subsequent anticipated income tax examinations, the Company cannot conclude it is reasonably possible that, as a result of these examinations, there will be significant changes to the unrecognized tax benefit within twelve months of December 31, 2009. However, the statutes of limitations in certain state and local jurisdictions are expected to lapse within the next twelve months and may result in a decrease of unrecognized tax benefits and accrued interest of approximately $1.2 million.
In connection with the sale of PRIMEDIA Healthcare in 2008, the Company recorded a $15.5 million decrease in the uncertain tax positions related to the divestiture. Of this amount, a $0.8 million benefit was recorded in discontinued operations for the amount that impacted the effective income tax rate. The remaining decrease in the uncertain tax positions related to PRIMEDIA Healthcare of $14.7 million did not have an impact on the effective income tax rate due to the valuation allowance recorded against the NOLs.
74
Table of Contents
Index to Financial Statements
Note 12. Stockholders’ Equity
Reverse Stock Split
On August 1, 2007, the Company effected a one-for-six reverse split of its common stock. After the reverse stock split was effected, each PRIMEDIA stockholder received one new share of PRIMEDIA common stock in exchange for every six existing shares. For all periods presented, effect has been given to the impact of the reverse stock split on the amounts reported for shares, including warrants, stock options and restricted stock, stock prices, and earnings (loss) and dividends per share.
Warrants to Purchase Common Stock
In connection with the financing for an acquisition completed in 2001, the Company had outstanding, as of December 31, 2009 and 2008, warrants permitting the holders to purchase approximately 1.6 million additional shares of the Company’s common stock. The warrants expire upon the earlier of 2011 or upon a change of control, have exercise prices ranging from $42.00 to $54.00 per share, subject to adjustment, and may be net settled in shares of the Company’s common stock. The value of these warrants included in additional paid-in capital of $31.7 million was determined using the Black-Scholes pricing model.
Approximately 1.3 million of the warrants are held by KKR 1996 Fund L.P., an investment partnership created at the direction of Kohlberg Kravis Roberts & Co. L.P. (“KKR”). KKR is a related party to the Company (see Note 21).
Options to Purchase Common Stock
In 2001, the Company retained KKR Capstone (formerly known as Capstone Consulting LLC) to provide consulting services to the Company. In 2002, the Company granted 0.3 million options to purchase the Company’s common stock to Capstone for services received. These options were fully vested as of the grant date, have a ten year life and an exercise price of $10.80 per share. Related non-cash compensation of $1.0 million, determined using the Black-Scholes pricing model, was recorded for the year ended December 31, 2002. KKR Capstone is a related party to the Company (see Note 21). These options are not included in the employees stock option activity table (see Note 13).
Stock Repurchase Plan
The Company’s Board of Directors has authorized a program (the “Repurchase Program”) to repurchase up to $5.0 million of the Company’s common stock through December 31, 2010. Under the terms of the Repurchase Program, the Company may repurchase shares in open market purchases or through privately negotiated transactions. The Company has used cash on hand to fund repurchases of its common stock and expects to use cash on hand to fund any additional stock repurchases under the Repurchase Program. As of December 31, 2008, the Company had not repurchased any shares under the Repurchase Program. During the year ended December 31, 2009, the Company repurchased 0.2 million shares of its common stock for approximately $0.4 million at a weighted-average price (including brokerage commissions) of $1.79 per share. The reacquired shares have been designated as treasury shares. As of December 31, 2009, the Company had $4.6 million available for further share repurchases. The Company may make additional stock repurchases in 2010 pursuant to the Repurchase Program.
75
Table of Contents
Index to Financial Statements
Note 13. Employee Benefit Plans
Stock-Based Compensation
The PRIMEDIA Inc. 1992 Stock Purchase and Option Plan, as amended, (the “Stock Compensation Plan”) authorizes sales of shares of common stock and grants of incentive awards in various forms, including stock options, to key employees and other persons with a unique relationship with the Company. The Stock Compensation Plan has authorized grants of up to 7.5 million shares of the Company’s common stock or options to management personnel. At December 31, 2009, the Company had approximately 2.7 million shares of its common stock reserved for future grants in connection with the Stock Compensation Plan.
Restricted Stock
Performance Share Plan
During 2008 and 2009, the Compensation Committee of the Board of Directors (the “Compensation Committee”) approved awards of performance-based restricted stock for 2008, 2009 and 2010, to be granted under the Stock Compensation Plan, to certain employees of the Company. The extent to which an award vests is based on the Company’s level of performance during the year in which the grant is made. Under the terms of each grant, the restricted stock is forfeited if less than 90% of the applicable performance goal is achieved and fully vests if at least 100% of the applicable performance goal is achieved. If at least 90%, but less than 100%, of the applicable performance goal is achieved, a portion of the restricted stock vests pursuant to a predetermined formula. Restricted stock vests on the date of determination by the Compensation Committee of the extent to which the applicable performance goal is achieved, provided the grantee is employed by the Company at such time. At that time, restrictions on the vested portion of the award lapse, and the corresponding shares are distributed to the grantee. Restricted stock for 2008, targeted at 0.2 million shares, has vested or been forfeited based on the Company’s level of achievement of performance goals for the year ended December 31, 2008. Such vested shares were distributed during the first quarter of 2009.
The performance targets for the 2009 awards were set during the first quarter of 2009, at which time approximately 0.3 million shares were granted. The performance targets for the 2009 awards were not met, and the performance-based restricted shares were deemed forfeited as of December 31, 2009. As a result, no expense was recorded for 2009 related to these performance-based restricted shares.
It is expected that the performance targets for the 2010 awards will be set during the first quarter of 2010, at which time approximately 0.2 million shares will be considered granted. No expense for the 2010 awards will be recorded prior to the grant date. Performance-based restricted stock is expensed based on the probability of the Company achieving the applicable performance targets.
Service Plan
During 2008 and 2009, the Compensation Committee approved awards that totaled approximately 0.4 million shares of service-based restricted stock granted under the Stock Compensation Plan to the Company’s Chief Executive Officer (“CEO”). The restricted stock includes tandem dividend rights and will vest at 100% as long as the CEO remains employed with the Company through specified vesting dates in 2009, 2010 and 2012. During the year ended December 31, 2009, approximately 0.1 million of these shares vested and were distributed.
76
Table of Contents
Index to Financial Statements
A summary of the Company’s restricted stock award activity as of December 31, 2009 and 2008 and changes during the years then ended is presented below:
| 2009 | 2008 | |||||||||||
| Number of Shares |
Weighted- Average Grant- Date Fair Value |
Number of Shares |
Weighted- Average Grant- Date Fair Value | |||||||||
| Outstanding at beginning of year |
415,634 | $ | 5.49 | 19,763 | $ | 18.50 | ||||||
| Granted |
433,326 | 1.81 | 429,634 | 5.49 | ||||||||
| Vested and distributed |
(197,194 | ) | 5.49 | (16,633 | ) | 18.05 | ||||||
| Vested and surrendered(1) |
(84,135 | ) | 5.48 | (1,485 | ) | 20.88 | ||||||
| Forfeited |
(347,776 | ) | 2.19 | (15,645 | ) | 7.32 | ||||||
| Outstanding at end of year |
219,855 | 3.43 | 415,634 | 5.49 | ||||||||
| (1) | Shares of common stock were surrendered to the Company by certain employees to satisfy the employees’ tax withholding obligations upon the vesting of the restricted stock. |
No restricted stock awards were granted during 2007.
As of December 31, 2009, there was $0.4 million of total unrecognized compensation cost related to restricted stock. The cost is expected to be recognized over a weighted-average period of approximately one year. The total fair value of shares vested during the year ended December 31, 2009, 2008 and 2007 was $0.6 million, less than $0.1 million and $0.7 million, respectively.
Stock Options
Stock options are granted with exercise prices at or above quoted market value for the Company’s common stock at time of issuance. Most of the options are exercisable at the rate of 20%-33%, per year, commencing on the anniversary date of the grant. Most options granted pursuant to the Stock Compensation Plan expire no later than ten years from the date the option was granted.
A summary of the Company’s stock option award activity for the years ended December 31, 2009 and 2008 is as follows:
| 2009 | 2008 | |||||||||||||||||||||
| Options | Weighted- Average Exercise Price |
Weighted- Average Remaining Contractual Term (in years) |
Aggregate Intrinsic Value (dollars in thousands) |
Options | Weighted- Average Exercise Price |
Weighted- Average Remaining Contractual Term (in years) |
Aggregate Intrinsic Value (dollars in thousands) | |||||||||||||||
| Outstanding at beginning of year |
2,406,344 | $ | 37.67 | 2,892,865 | $ | 48.65 | ||||||||||||||||
| Granted |
16,000 | 2.11 | 840,000 | 6.42 | ||||||||||||||||||
| Exercised |
— | — | $ | 0 | — | — | $ | 0 | ||||||||||||||
| Expired |
(864,998 | ) | 71.93 | (1,105,709 | ) | 42.67 | ||||||||||||||||
| Forfeited |
(24,001 | ) | 6.42 | (220,812 | ) | 36.38 | ||||||||||||||||
| Outstanding at end of year |
1,533,345 | 18.47 | 3 | 24 | 2,406,344 | 37.67 | 3 | 0 | ||||||||||||||
| Vested or expected to vest at end of year |
1,533,345 | 18.47 | 3 | 24 | 2,385,785 | 37.94 | 3 | 0 | ||||||||||||||
| Exercisable at end of year |
1,143,980 | 19.60 | 3 | 0 | 1,886,790 | 46.27 | 2 | 0 | ||||||||||||||
The total intrinsic value of options exercised during 2007 was $0.1 million.
77
Table of Contents
Index to Financial Statements
The fair value of each option award was estimated at the date of grant using the Black-Scholes pricing model under the assumptions noted in the following table. Where certain inputs to the Black-Scholes model varied throughout the period, the ranges utilized for those assumptions are disclosed. Expected volatilities are based on historical volatilities of the Company’s common stock. The Company uses historical data to estimate option exercises and employee terminations within the valuation model. The expected term of options granted is derived from the historical exercise behavior of employees and represents the period of time that options granted are expected to be outstanding. The risk-free rate for the expected term of the option is based on the U.S. Treasury yield curve in effect at the time of grant. Details of stock option grants are as follows:
| Years Ended December 31, | ||||||
| 2009 | 2008 | 2007 | ||||
| Expected volatility |
109.52%-109.74% | 75.15%-83.78% | 61.03% | |||
| Weighted-average volatility |
109.60% | 75.30% | 61.03% | |||
| Expected dividend yield |
11.75%-14.32% | 4.31%-11.50% | — | |||
| Weighted-average dividend yield |
12.71% | 4.44% | — | |||
| Expected term (in years) |
5 | 4 | 3 | |||
| Risk-free rate |
2.80%-3.09% | 3.91%-4.57% | 4.73% | |||
| Weighted-average risk-free rate |
2.98% | 4.56% | 4.73% | |||
The weighted-average fair value per option for options granted during the years ended December 31, 2009, 2008 and 2007 was $1.22, $2.87 and $1.02, respectively. No cash was received from the exercise of stock options during the years ended December 31, 2009 and 2008. No options were settled in stock during the years ended December 31, 2009 and 2008.
As of December 31, 2009, there was $0.7 million of total unrecognized compensation cost related to unvested stock options. The cost is expected to be recognized over a weighted-average period of less than one year.
Employee Stock Purchase Plan (“ESPP”)
Effective December 31, 2007, the Company’s Board of Directors approved the termination of the ESPP. Subsequent to December 31, 2007, all of the ESPP’s net assets were used to purchase less than 0.1 million shares of the Company’s common stock, which were issued to participants. Additionally, the value of fractional shares (less applicable administrative expenses, if any) was paid directly to participants.
Stock-Based Compensation
Total recorded stock-based compensation expense was as follows:
| Years Ended December 31, | ||||||||||
| 2009 | 2008 | 2007 | ||||||||
| (Dollars in thousands) | ||||||||||
| Restricted stock |
$ | 568 | $ | 1,288 | $ | 591 | ||||
| Stock options |
713 | 820 | (105 | ) | ||||||
| Total |
$ | 1,281 | $ | 2,108 | $ | 486 | ||||
Stock-based compensation is included within costs of goods sold, marketing and selling, distribution and circulation, and general and administrative expenses in the consolidated statement of operations.
Retirement Plan
Substantially all of the Company’s employees are eligible to participate in a defined contribution plan after one year of employment. The expense recognized during the years ended December 31, 2009, 2008 and 2007, which primarily relates to matching contributions by the Company, was approximately $0.6 million, $0.7 million and $0.7 million, respectively.
78
Table of Contents
Index to Financial Statements
Note 14. Income (Loss) Per Common Share
Income (loss) per common share for the years ended December 31, 2009, 2008 and 2007 has been determined based on income (loss) applicable to common stockholders, divided by the weighted-average number of common shares outstanding for all years presented.
| Years Ended December 31, | |||||||||||
| 2009 | 2008 | 2007 | |||||||||
| (Dollars in thousands, except per share data) | |||||||||||
| Income (loss) from continuing operations |
$ | 4,540 | $ | 49,027 | $ | (55,678 | ) | ||||
| Discontinued operations, net of tax |
(1,052 | ) | 10,441 | 547,123 | |||||||
| Net income |
$ | 3,488 | $ | 59,468 | $ | 491,445 | |||||
| Shares of common stock and common stock equivalents |
|||||||||||
| Weighted-average shares used in basic computation |
44,124,538 | 44,176,398 | 44,118,943 | ||||||||
| Dilutive effect of: |
|||||||||||
| Restricted stock |
89,381 | 18,107 | — | ||||||||
| Warrants |
— | 3,085 | — | ||||||||
| Options |
84 | — | — | ||||||||
| Weighted-average shares used in diluted computation |
44,214,003 | 44,197,590 | 44,118,943 | ||||||||
| Basic and diluted earnings (loss) per common share: |
|||||||||||
| Continuing operations |
$ | 0.10 | $ | 1.11 | $ | (1.26 | ) | ||||
| Discontinued operations |
(0.02 | ) | 0.24 | 12.40 | |||||||
| Net income |
$ | 0.08 | $ | 1.35 | $ | 11.14 | |||||
The securities that could potentially dilute basic income per share in the future consist of approximately 1.6 million warrants as of December 31, 2009, 2008 and 2007 and approximately 2.1 million, 3.1 million and 3.2 million stock options and shares of restricted stock as of December 31, 2009, 2008 and 2007, respectively.
For the year ended December 31, 2009, potentially dilutive securities, including 2.5 million stock options and 1.6 million warrants to purchase common stock, were not included in the weighted-average number of common shares outstanding used in the computation of diluted income per common share because their strike price was greater than the average market price of the Company’s common stock during the period, and their inclusion would be anti-dilutive. An additional 0.4 million shares of restricted stock were excluded from the weighted-average number of common shares outstanding used in the computation of diluted earnings per share for the year ended December 31, 2009 because either the performance goals were not met at the end of the period or the calculation under the treasury stock method resulted in no additional dilutive shares.
For the year ended December 31, 2008, potentially dilutive securities, including 2.7 million stock options and 1.6 million warrants to purchase common stock, were not included in the weighted-average number of common shares outstanding used in the computation of diluted income per common share because their strike price was greater than the average market price of the Company’s common stock during the period, and their inclusion would be anti-dilutive. An additional 0.4 million shares of restricted stock were excluded from the weighted-average number of common shares outstanding used in the computation of diluted earnings per share for the year ended December 31, 2008 because either the performance goals were not met at the end of the period or the calculation under the treasury stock method resulted in no additional dilutive shares.
For the year ended December 31, 2007, potentially dilutive securities were not included in the weighted-average number of common shares outstanding used in the computation of diluted income per common share because the effect of their inclusion would be anti-dilutive due to the Company’s loss from continuing operations.
79
Table of Contents
Index to Financial Statements
Note 15. Other Comprehensive Income (Loss)
Other comprehensive income (loss) was represented by unrealized gains (losses) on cash flow hedges as follows:
| Before-Tax Amount |
Tax Benefit |
Net of Tax Amount |
|||||||||
| (Dollars in thousands) | |||||||||||
| Year Ended December 31, 2009 |
|||||||||||
| Net unrealized gains on cash flow hedges |
$ | 2,905 | $ | 402 | $ | 3,307 | |||||
| Other comprehensive income |
$ | 2,905 | $ | 402 | $ | 3,307 | |||||
| Before-Tax Amount |
Tax Benefit |
Net of Tax Amount |
|||||||||
| (Dollars in thousands) | |||||||||||
| Year Ended December 31, 2008 |
|||||||||||
| Net unrealized losses on cash flow hedges |
$ | (2,722 | ) | $ | — | $ | (2,722 | ) | |||
| Other comprehensive loss |
$ | (2,722 | ) | $ | — | $ | (2,722 | ) | |||
| Before-Tax Amount |
Tax Benefit |
Net of Tax Amount |
|||||||||
| (Dollars in thousands) | |||||||||||
| Year Ended December 31, 2007 |
|||||||||||
| Net unrealized losses on cash flow hedges |
$ | (2,112 | ) | $ | — | $ | (2,112 | ) | |||
| Other comprehensive loss |
$ | (2,112 | ) | $ | — | $ | (2,112 | ) | |||
Subsequent to the partial release of the valuation allowance against the Company’s net deferred tax asset at December 31, 2008, it became appropriate to include the deferred tax consequences of changes in unrealized gains and losses on the cash flow hedges in other comprehensive income (loss). Prior to the partial release of the valuation allowance against the Company’s net deferred tax asset at December 31, 2008, the net tax impact was $0.0 million for all periods because the tax benefit was offset by an adjustment to the deferred tax asset valuation allowance.
Note 16. Provision for Restructuring Costs
Provision for Restructuring Costs
During 2007, the Company’s management approved a plan to reduce its annual corporate overhead expenses to an amount appropriate to service its continuing Consumer Guides operations and relocate its corporate headquarters from New York to Norcross, Georgia, where its Consumer Guides business is located. The Company completed this plan during the second quarter of 2008. The total cost of the plan was $6.2 million. The final employee-related termination costs of $0.4 million were incurred and paid out in full during the six months ended June 30, 2008.
During 2008, the Company’s management implemented a plan to streamline its expense structure through the elimination of certain jobs, consolidation of office space and the vacating of certain leased properties and termination of certain other contracts. Charges for costs associated with the termination of certain contracts were paid in 2008. Charges under the plan also included employee-related termination costs paid through 2009 and the Company’s obligations for certain leased properties, which continue through 2015 and which have been reduced for anticipated sublease income. The total expected cost of the 2008 plan is expected to be between $8.3 million and $8.7 million, and through December 31, 2009, $8.2 million has been recorded. This plan resulted in a charge of approximately $2.8 million and $5.4 million for the years ended December 31, 2009 and 2008, respectively.
As part of its distribution business, the Company has entered into contracts with various retail chains, including grocery, drug, convenience, video, fitness and mass merchandise retailers for exclusive rights for distribution related to the Company’s and third-party free publications, which the Company refers to as RDAs. During 2009,
80
Table of Contents
Index to Financial Statements
the Company’s management implemented a plan to further reduce the Company’s ongoing cost structure. The most significant component of the 2009 plan involves the reduction of ongoing distribution costs arising from RDAs that are underperforming either through:
| • | terminating the Company’s distribution rights for some or all locations covered by certain RDAs at a negotiated price; |
| • | discontinuing service for and vacating some locations covered by certain RDAs; and |
| • | determining to forego distribution rights for certain locations that are not currently being serviced. |
In the last two cases, the timing and amount of the Company’s future cash obligations, most of which continue through 2011, are not impacted. The 2009 plan also includes further real estate consolidation, resulting in vacating certain leased office space, and the elimination of certain positions. The obligations associated with employee-related termination costs were paid through 2009, while the obligations for the termination of RDAs continue through 2011 and the obligations for the leased properties continue through 2015. This plan resulted in a charge of approximately $22.0 million for the year ended December 31, 2009. The total cost of the 2009 plan was originally expected to be between $24.0 million and $27.0 million. As a result of the Company’s ongoing efforts to reduce the costs associated with RDAs, it reached an agreement to modify the terms of previously restructured RDAs with certain retailers that resulted in a reduction of restructuring expense of $4.7 million. Consequently, the total cost of the 2009 plan is now expected to be between $22.0 million and $23.0 million. Details of all restructuring plans that have been implemented and the related payments during the years ended December 31, 2009, 2008 and 2007 are presented in the following tables:
| Liability as of January 1, 2009 |
Net Provision for the Year Ended December 31, 2009 |
Payments/Write- offs During the Year Ended December 31, 2009(1) |
Liability as of December 31, 2009 | ||||||||||
| (Dollars in thousands) | |||||||||||||
| Employee-related termination costs |
$ | 490 | $ | 239 | $ | (727 | ) | $ | 2 | ||||
| Termination or modification of existing RDA contracts |
— | 20,711 | (10,901 | ) | 9,810 | ||||||||
| Termination of leases related to office closures and other |
21,163 | 4,677 | (5,295 | ) | 20,545 | ||||||||
| Total |
$ | 21,653 | $ | 25,627 | $ | (16,923 | ) | $ | 30,357 | ||||
| Liability as of January 1, 2008 |
Net Provision for the Year Ended December 31, 2008 |
Payments/Write- offs During the Year Ended December 31, 2008 |
Liability as of December 31, 2008 | ||||||||||
| (Dollars in thousands) | |||||||||||||
| Employee-related termination costs |
$ | 4,905 | $ | 1,817 | $ | (6,232 | ) | $ | 490 | ||||
| Termination of leases related to office closures and other |
20,441 | 3,421 | (2,699 | ) | 21,163 | ||||||||
| Total |
$ | 25,346 | $ | 5,238 | $ | (8,931 | ) | $ | 21,653 | ||||
| Liability as of January 1, 2007 |
Net Provision for the Year Ended December 31, 2007 |
Payments/Write- offs During the Year Ended December 31, 2007 |
Liability as of December 31, 2007 | ||||||||||
| (Dollars in thousands) | |||||||||||||
| Employee-related termination costs |
$ | 9 | $ | 7,316 | $ | (2,420 | ) | $ | 4,905 | ||||
| Termination of leases related to office closures and other |
24,684 | 1,772 | (6,015 | ) | 20,441 | ||||||||
| Write-off of leasehold improvements, prepaid rent and lease-related liabilities |
— | 1,408 | (1,408 | ) | — | ||||||||
| Total |
$ | 24,693 | $ | 10,496 | $ | (9,843 | ) | $ | 25,346 | ||||
| (1) | Termination or modification of existing RDA contracts includes the write-off of $5.7 million of prepaid assets, most of which were paid during 2009 prior to the implementation of the 2009 plan. |
81
Table of Contents
Index to Financial Statements
In addition to the plans implemented in 2009, 2008 and 2007, the amounts in termination of leases related to office closures and other include the Company’s remaining liability, pertaining to various restructuring plans initiated in 2006 and prior, associated with real estate lease commitments for space that it no longer occupies. To reduce the lease-related costs, the Company has pursued subleases of its available office space. These leases have been recorded at their net present value amounts and are net of anticipated sublease income. The liability related to those plans is expected to be paid through 2015. The only remaining expenses related to those plans are the imputed interest related to the rental payments and changes in the amounts and timing of estimated cash flows, primarily anticipated sublease income. As a result of adjustments to future anticipated sublease income, the Company expensed $0.8 million during the year ended December 31, 2009, which is included in the provision for restructuring costs in the consolidated statement of operations.
During 2008, the Company recorded a benefit of $0.6 million, arising primarily from an adjustment to reserves related to revised estimates of future rent expense and sublease income for leased properties vacated in 2007 and prior, which is included in the provision for restructuring costs in the consolidated statement of operations.
Liabilities of $12.7 million and $3.5 million, representing the current portion of the provision for restructuring costs, are included in accrued expenses and other in the consolidated balance sheet as of December 31, 2009 and December 31, 2008, respectively. Liabilities of $17.6 million and $18.2 million, representing the non-current portion of the provision for restructuring costs, are included in other non-current liabilities in the consolidated balance sheet as of December 31, 2009 and December 31, 2008, respectively.
Interest expense related to the restructured liabilities was $2.1 million, $2.1 million and $2.4 million for the years ended December 31, 2009, 2008 and 2007, respectively. The Company includes imputed interest associated with restructuring liabilities in interest expense in the consolidated statement of operations.
The following table details the restructuring liability by plan:
| December 31, | ||||||
| 2009 | 2008 | |||||
| (Dollars in thousands) | ||||||
| 2009 plan |
$ | 10,690 | $ | — | ||
| 2008 plan |
2,585 | 3,762 | ||||
| 2006 plan and prior plans |
17,082 | 17,891 | ||||
| $ | 30,357 | $ | 21,653 | |||
Details about the Company’s recorded restructuring expense for the years ended December 31, 2009, 2008 and 2007 by expense type and restructuring plan are as follows:
| Year Ended December 31, 2009 | |||||||||||||||
| 2009 Plan |
2008 Plan |
2007 Plan |
2006 and Prior Plans |
Total | |||||||||||
| (Dollars in thousands) | |||||||||||||||
| Employee-related termination costs |
$ | 239 | $ | — | $ | — | $ | — | $ | 239 | |||||
| Termination or modification of existing RDA contracts |
20,711 | — | — | — | 20,711 | ||||||||||
| Termination of leases related to office closures and other |
1,080 | 2,787 | — | 810 | 4,677 | ||||||||||
| Total |
$ | 22,030 | $ | 2,787 | $ | — | $ | 810 | $ | 25,627 | |||||
| Year Ended December 31, 2008 | |||||||||||||
| 2008 Plan |
2007 Plan |
2006 and Prior Plans |
Total | ||||||||||
| (Dollars in thousands) | |||||||||||||
| Employee-related termination costs |
$ | 1,369 | $ | 448 | $ | — | $ | 1,817 | |||||
| Termination of leases related to office closures and other |
3,990 | — | (569 | ) | 3,421 | ||||||||
| Total |
$ | 5,359 | $ | 448 | $ | (569 | ) | $ | 5,238 | ||||
82
Table of Contents
Index to Financial Statements
| Year Ended December 31, 2007 | |||||||||
| 2007 Plan |
2006 and Prior Plans |
Total | |||||||
| (Dollars in thousands) | |||||||||
| Employee-related termination costs |
$ | 5,741 | $ | 1,575 | $ | 7,316 | |||
| Termination of leases related to office closures and other |
— | 1,772 | 1,772 | ||||||
| Write off of leasehold improvements, prepaid rent and lease-related liabilities |
— | 1,408 | 1,408 | ||||||
| Total |
$ | 5,741 | $ | 4,755 | $ | 10,496 | |||
Note 17. Severance
Effective April 25, 2008, the Company’s then President and CEO tendered his resignation. In connection with his resignation, the Company agreed to make severance payments to him consistent with amounts that would have been payable to him under his severance agreement had his employment been terminated without cause. The Company accrued compensation expense of $1.4 million in 2008 representing amounts payable to him through 2009.
As a result of the death of one of PRIMEDIA’s former CEOs in October 2008, the Company was relieved of any further annuity obligation due to him. As a result, the Company reversed its $2.6 million accrual for this obligation. The benefit is included in other (income) expense, net in the consolidated statement of operations for the year ended December 31, 2008.
Note 18. Derivative Financial Instruments
Risk Management Objective of Using Derivative Financial Instruments
The Company is exposed to certain risks arising from both its business operations and economic conditions. The Company principally manages its exposures to a wide variety of business and operational risks through management of its core business activities. The Company manages economic risks, including interest rate, liquidity and credit risk primarily by managing the amount, sources and duration of its debt funding and the use of derivative financial instruments. Specifically, the Company enters into derivative financial instruments to manage exposures that arise from business activities that result in the payment of future known and uncertain cash amounts, the value of which are determined by interest rates. The Company’s derivative financial instruments are used to manage differences in the amount, timing and duration of the Company’s known or expected cash payments related to its borrowings. The Company does not use derivative financial instruments for speculative purposes.
The Company’s objectives in using interest rate derivatives are to add stability to interest expense and to manage its exposure to interest rate movements. To accomplish this objective, the Company primarily uses interest rate swaps as part of its interest rate risk management strategy. Interest rate swaps designated as cash flow hedges involve the receipt of variable-rate amounts from a counterparty in exchange for the Company making fixed-rate payments over the life of the agreements without exchange of the underlying notional amount.
Cash Flow Hedges of Interest Rate Risk
The effective portion of changes in the fair value of derivative financial instruments that are designated in qualifying cash flow hedging relationships is recorded in AOCI in the consolidated balance sheet and is subsequently reclassified into earnings in the period that the hedged forecasted transaction affects earnings. During the year ending December 31, 2009, these derivative financial instruments were used to hedge the variability in cash flows arising from changes in the benchmark interest rate on the Company’s Term Loan B
83
Table of Contents
Index to Financial Statements
Facility. The ineffective portion of the change in fair value of the derivative financial instruments is recognized directly in earnings through interest expense. During the years ending December 31, 2009 and 2008, the Company recorded less than $0.1 million of hedge ineffectiveness in earnings attributable to off-market terms present in two of the Company’s interest rate swaps.
Amounts reported in AOCI related to derivative financial instruments in designated hedging relationships will be reclassified to interest expense as interest payments are made on the Company’s Term Loan B Facility. During the twelve months ending December 31, 2010, the Company estimates that $2.5 million will be reclassified from AOCI into earnings as an increase to interest expense.
As of December 31, 2009 and December 31, 2008, the Company had the following outstanding derivative financial instruments that were designated as cash flow hedges of interest rate risk:
| Notional Amount at December 31, | |||||||
| Interest Rate Derivatives |
2009 | 2008 | |||||
| (Dollars in thousands) | |||||||
| Interest rate swaps |
$ | 200,000 | (1) | $ | 225,000 | ||
| (1) | One interest rate swap with a notional amount of $50.0 million matures on December 31, 2010; one interest rate swap with a notional amount of $50.0 million matures on September 30, 2011; and one interest rate swap with a notional amount of $100.0 million matures on December 31, 2011. |
Tabular Disclosure of Fair Values of Derivative Financial Instruments on the Consolidated Balance Sheet
The following table presents the fair value of the Company’s derivative financial instruments as well as their classification in the consolidated balance sheet as of December 31, 2009:
| Derivative Assets |
Derivative Liabilities | |||||||||
| Balance Sheet Location |
Fair Value | Balance Sheet Location |
Fair Value | |||||||
| (Dollars in thousands) | ||||||||||
| Derivative financial instruments designated in hedging relationships |
||||||||||
| Interest rate swaps |
Prepaid expenses and other | $ | — | Accrued expenses and other | $ | 880 | ||||
| Interest rate swaps |
Other non-current assets | — | Other non-current liabilities | 1,049 | ||||||
| Total derivative financial instruments designated in hedging relationships |
$ | — | $ | 1,929 | ||||||
The following table presents the fair value of the Company’s derivative financial instruments as well as their classification in the consolidated balance sheet as of December 31, 2008:
| Derivative Assets |
Derivative Liabilities | |||||||||
| Balance Sheet Location |
Fair Value | Balance Sheet Location |
Fair Value | |||||||
| (Dollars in thousands) | ||||||||||
| Derivative financial instruments designated in hedging relationships |
||||||||||
| Interest rate swaps |
Prepaid expenses and other | $ | — | Accrued expenses and other | $ | 4,253 | ||||
| Interest rate swaps |
Other non-current assets | — | Other non-current liabilities | 896 | ||||||
| Total derivative financial instruments designated in hedging relationships |
$ | — | $ | 5,149 | ||||||
84
Table of Contents
Index to Financial Statements
Tabular Disclosure of the Effect of Derivative Financial Instruments on the Consolidated Statement of Operations
The following table presents the effect of the Company’s derivative financial instruments on the consolidated statement of operations for the year ended December 31, 2009 (dollars in thousands):
| Derivative Financial Instruments in Cash Flow Hedging Relationships |
Amount of Gain or (Loss) Recognized in Other Comprehensive Income on Derivative Financial Instruments (Effective Portion), Net of Tax |
Location of Gain or (Loss) Reclassified from AOCI into Income (Effective Portion) |
Amount of Gain or (Loss) Reclassified from AOCI into Income (Effective Portion) |
Location of Gain or (Loss) Recognized in Income on Derivative Financial Instruments (Ineffective Portion and Amount Excluded from Effectiveness Testing) |
Amount of Gain or (Loss) Recognized in Income on Derivative Financial Instruments (Ineffective Portion and Amount Excluded from Effectiveness Testing) | ||||||||
| Interest rate swaps |
$ | 3,307 | Interest expense |
$ | 1,024 | Interest expense |
$ | — | |||||
Credit-risk-related Contingent Features
The Company has agreements with each of its derivative financial instrument counterparties that contain a provision by which the Company could be declared in default on its derivative financial instrument obligations if repayment of the underlying indebtedness is accelerated by the lender due to the Company’s default on the indebtedness.
As of December 31, 2009, the termination value of derivative financial instruments in a net liability position, which includes accrued interest but excludes any adjustment for nonperformance risk, related to these agreements was $2.0 million. As of December 31, 2009, the Company has not posted any collateral related to these agreements. If the Company breached any of these provisions, it would be required to settle its obligations under the agreements at their termination value of $2.0 million.
Note 19. Fair Value
The table below presents the Company’s liabilities measured at fair value on a recurring basis as of December 31, 2009:
| Fair Value Measurements Using | ||||||||||||
| Liability Description |
Fair Value at December 31, 2009 |
Quoted Prices in Active Markets for Identical Assets (Level 1) |
Significant Other Observable Inputs (Level 2) |
Significant Unobservable Inputs (Level 3) | ||||||||
| (Dollars in thousands) | ||||||||||||
| Derivative financial instrument liabilities |
$ | 1,929 | $ | — | $ | 1,929 | $ | — | ||||
| $ | 1,929 | $ | — | $ | 1,929 | $ | — | |||||
The table below presents the Company’s liabilities measured at fair value on a recurring basis as of December 31, 2008:
| Fair Value Measurements Using | ||||||||||||
| Liability Description |
Fair Value at December 31, 2008 |
Quoted Prices in Active Markets for Identical Assets (Level 1) |
Significant Other Observable Inputs (Level 2) |
Significant Unobservable Inputs (Level 3) | ||||||||
| (Dollars in thousands) | ||||||||||||
| Derivative financial instrument liabilities |
$ | 5,149 | $ | — | $ | 5,149 | $ | — | ||||
| $ | 5,149 | $ | — | $ | 5,149 | $ | — | |||||
85
Table of Contents
Index to Financial Statements
The table below presents the Company’s assets measured at fair value on a non-recurring basis as of December 31, 2009:
| Fair Value Measurements Using | |||||||||||||||
| Asset Description |
Carrying Value at December 31, 2009 |
Quoted Prices in Active Markets for Identical Assets (Level 1) |
Significant Other Observable Inputs (Level 2) |
Significant Unobservable Inputs (Level 3) |
Total Losses | ||||||||||
| (Dollars in thousands) | |||||||||||||||
| Advertiser list(1) |
$ | 2,732 | $ | — | $ | — | $ | 2,732 | $ | 502 | |||||
| Cost-method investments(2) |
— | — | — | — | 1,500 | ||||||||||
| $ | 2,732 | $ | — | $ | — | $ | 2,732 | $ | 2,002 | ||||||
The table below presents the Company’s assets measured at fair value on a non-recurring basis as of December 31, 2008:
| Fair Value Measurements Using | |||||||||||||||
| Asset Description |
Carrying Value at December 31, 2008 |
Quoted Prices in Active Markets for Identical Assets (Level 1) |
Significant Other Observable Inputs (Level 2) |
Significant Unobservable Inputs (Level 3) |
Total Losses | ||||||||||
| (Dollars in thousands) | |||||||||||||||
| Cost-method investments(2) |
$ | 1,500 | $ | — | $ | — | $ | 1,500 | $ | 914 | |||||
| $ | 1,500 | $ | — | $ | — | $ | 1,500 | $ | 914 | ||||||
| (1) | One of the Company’s advertiser lists was measured at fair value as of December 31, 2009 because the Company identified factors indicating its carrying value might not be recoverable. Fair value was determined using the discount rate adjustment technique with a discount rate equal to current rates that would be offered to the Company for debt with a remaining maturity equal to the expected remaining life of the asset. The Company determined that the expected undiscounted cash flows associated with this asset were less than the carrying value and recorded an impairment charge of approximately $0.5 million. |
| (2) | The cost-method investments were measured at fair value as of December 31, 2008 because the Company identified events and changes in circumstances that had a potential significant adverse effect on the fair value of the investments. The Company estimated the fair value was less than the cost for one of its investments and recorded an other-than-temporary impairment charge of approximately $0.9 million during 2008. The fair value was determined using an internal model entailing a comparison of the investee to other similar companies on the basis of stock price and revenues. During 2009, that same investee was included in a bankruptcy petition filing, which the Company believed had a significant adverse effect on the fair value of the investment. As a result, the Company recorded an other-than-temporary impairment charge of approximately $1.5 million during 2009. |
The carrying values and fair values of the Company’s financial assets and liabilities are summarized as follows:
| December 31, | ||||||||||||
| 2009 | 2008 | |||||||||||
| Carrying Value |
Fair Value |
Carrying Value |
Fair Value | |||||||||
| (Dollars in thousands) | ||||||||||||
| Borrowings under bank credit facilities |
$ | 224,700 | $ | 191,557 | $ | 247,500 | $ | 155,925 | ||||
| Derivative financial instruments |
1,929 | 1,929 | 5,149 | 5,149 | ||||||||
The fair values of borrowings under bank credit facilities was determined based on recently completed market transactions and the current rates that would be offered to the Company for debt of the same remaining maturity.
The valuation of the derivative financial instruments, comprised of interest rate swaps, was determined using widely accepted valuation techniques, including discounted cash flow analysis on the expected cash flows of each derivative. This analysis reflects the contractual terms of the interest rate swaps, including the period to
86
Table of Contents
Index to Financial Statements
maturity, and uses observable market-based inputs, including interest rate curves. The fair values of interest rate swaps were determined using the market standard methodology of netting the discounted future fixed cash receipts (or payments) and the discounted expected variable cash payments (or receipts). The variable cash payments (or receipts) were based on an expectation of future interest rates (forward curves) derived from observable market interest rate curves.
The Company incorporates credit valuation adjustments to appropriately reflect both its own nonperformance risk and the respective counterparty’s nonperformance risk in the fair value measurements. In adjusting the fair value of its interest rate swap contracts for the effect of nonperformance risk, the Company has considered the impact of netting and any applicable credit enhancements, such as collateral postings, thresholds, mutual puts and guarantees.
Although the Company has determined that many of the inputs used to value its derivative financial instruments fall within Level 2 of the fair value hierarchy, the credit valuation adjustments associated with its derivative financial instruments utilize Level 3 inputs, such as estimates of current credit spreads, to evaluate the likelihood of default by itself and its counterparties. However, as of December 31, 2009 and 2008, the Company has assessed the significance of the impact of the credit valuation adjustments on the overall valuation of its derivative financial instrument positions and has determined that the credit valuation adjustments, which amount to less than $0.1 million at December 31, 2009 and 2008, are not significant to the overall valuation. As a result, the Company has classified its derivative financial instrument valuations, in their entirety, in Level 2 of the fair value hierarchy.
For certain assets and liabilities, including cash and cash equivalents, accounts receivable, accounts payable, accrued expenses and borrowings under the Company’s revolving credit facility, the carrying amount approximates fair value because of the short maturity of these instruments.
Note 20. Commitments and Contingencies
Commitments
Operating Leases
Total rent expense under operating leases was $8.4 million, $12.3 million and $13.9 million for the years ended December 31, 2009, 2008 and 2007, respectively. Certain leases are subject to escalation clauses, and certain leases contain renewal options. The Company expenses rent on all operating leases on a straight-line basis. The leases primarily relate to real estate and equipment. The following annual rental commitments include an aggregate of $55.9 million which has been reserved for as part of the provision for restructuring costs (see Note 16). Minimum rental commitments under noncancelable operating leases as of December 31, 2009, are as follows (dollars in thousands):
| Years Ending December 31, |
|||
| 2010 |
$ | 21,964 | |
| 2011 |
21,087 | ||
| 2012 |
19,905 | ||
| 2013 |
19,045 | ||
| 2014 |
16,129 | ||
| Thereafter |
20,170 | ||
| $ | 118,300 | ||
Future rental commitments for the above leases have not been reduced by minimum noncancelable sublease income aggregating $52.5 million as of December 31, 2009.
87
Table of Contents
Index to Financial Statements
Retail Display Allowances
As part of its distribution business, the Company has entered into RDA contracts, most of which have clauses that require payment adjustments based on changes in the number of retail locations. The following annual rental commitments include an aggregate of $10.0 million which has been reserved for as part of the provision for restructuring costs (see Note 16). The following table provides the commitments related to RDAs that the Company has as of December 31, 2009 (dollars in thousands):
| Years Ending December 31, |
|||
| 2010 |
$ | 23,704 | |
| 2011 |
2,381 | ||
| 2012 |
171 | ||
| 2013 |
— | ||
| 2014 |
— | ||
| Thereafter |
— | ||
| $ | 26,256 | ||
Capital Leases
Future minimum lease payments under capital leases (see Note 10) are as follows (dollars in thousands):
| Years Ending December 31, |
|||
| 2010 |
$ | 504 | |
| 2011 |
156 | ||
| 2012 |
— | ||
| 2013 |
— | ||
| 2014 |
— | ||
| Thereafter |
— | ||
| 660 | |||
| Less: Amount representing interest (at rates ranging from 8% to 36%) |
89 | ||
| Present value of net minimum lease payments and other |
571 | ||
| Less: Current portion |
422 | ||
| Long-term obligations (included in long-term debt) |
$ | 149 | |
Litigation-Related Matters
The Company is involved in lawsuits and claims, both actual and potential, including some that it has asserted against others, in which substantial monetary damages are sought. Although the result of any future litigation of such lawsuits and claims is inherently unpredictable, the Company believes that, in the aggregate, the outcome of all such lawsuits and claims will not have a material effect on its long-term consolidated financial position or liquidity; however, any such outcome could be material to the results of operations of any particular period in which costs, if any, are recognized.
During 2008, the Company recorded a charge of $4.5 million related to settlement of litigation involving the divestiture of the Company’s Crafts Group and $0.5 million related to the settlement of an unrelated case. The Company paid the total settlements of $5.0 million in March 2009. During the year ended December 31, 2009, the Company recorded an increase in reserves for litigation-related losses of $3.3 million, which is included in discontinued operations in the consolidated statement of operations, and made payments of $0.5 million associated with these losses. As of December 31, 2009 and December 31, 2008, the Company had established reserves for litigation-related losses of $5.8 million and $8.0 million, respectively.
88
Table of Contents
Index to Financial Statements
Derivative Litigation
The Company is named as a nominal defendant in a consolidated stockholder derivative action pending in the Court of Chancery of the State of Delaware under the caption In re PRIMEDIA Inc. Derivative Litigation, Consolidated C.A. No. 1808-N. Kohlberg Kravis Roberts & Co. L.P., and certain present and former members of the Company’s Board of Directors are also named as defendants. Plaintiffs allege that Kohlberg Kravis Roberts & Co. L.P. (“KKR”) and the Company’s Board of Directors breached their fiduciary duties to the Company in connection with PRIMEDIA’s redemption of certain shares of its preferred stock in 2004 and 2005. On November 15, 2006, the Court denied separate motions to dismiss filed by the director defendants and KKR, and, on January 18, 2007, all defendants answered the then operative complaint. On May 23, 2007, the Company’s Board of Directors formed a Special Litigation Committee (“SLC”) of independent, non-defendant directors with full and sole authority to investigate, review and take action with respect to the plaintiffs’ claims in the derivative litigation. On September 7, 2007, plaintiffs filed a Second Amended and Consolidated Derivative Complaint (“SAC”), which, in addition to the allegations discussed above, further alleges that KKR usurped a corporate opportunity of the Company in 2002 by purchasing shares of PRIMEDIA preferred stock at discounts on the open market while causing the Company to refrain from doing the same. On February 28, 2008, the SLC filed a motion to dismiss the SAC and, in support of the motion, its report (filed under seal) concluding that the pursuit of the claims asserted by plaintiffs does not make legal, practical or business sense. On November 6, 2009, plaintiffs filed a motion for leave to file a Third Amended and Consolidated Derivative Complaint (“Motion to Amend”), in which plaintiffs seek leave to assert that KKR was in possession of material, non-public information of the Company when it purchased shares of PRIMEDIA preferred stock on the open market in 2002. Briefing in connection with the SLC’s motion to dismiss the SAC was complete as of January 28, 2010. Briefing in connection with plaintiffs’ Motion to Amend is ongoing.
Workplace Learning
In 2005, the Company sold substantially all of the assets of its Workplace Learning segment for the assumption of ongoing liabilities, while retaining a secondary liability as the assignor of the building and satellite time leases. As of December 31, 2007, the satellite time lease had expired. The Company received a third-party guaranty of up to $10.0 million against those lease obligations to reimburse the Company for lease payments made (the “Guaranty”). During 2006, the Company made payments on behalf of Workplace Learning pursuant to its secondary liability and recorded a liability for the fair value of the lease payments, net of anticipated sublease income, related to its secondary liability on the lease payments. Furthermore, the Company determined that it was not probable that the third party would remit payment, as required under the Guaranty, and fully reserved the $10.0 million receivable from the third-party guarantor and commenced a lawsuit to collect on the Guaranty.
On October 19, 2008, the assignee of the building lease and a related entity filed petitions for reorganization under Chapter 11 of the U.S. Bankruptcy Code in the United States Bankruptcy Court for the Eastern District of Texas. Thereafter, the assignee stopped making payments under the building lease. On October 14, 2008, the Company’s motion for summary judgment against the third-party guarantor was granted unopposed. Thereafter, the Company obtained a judgment against the third-party guarantor and had been taking steps to enforce that judgment when, on April 21, 2009, the third-party guarantor filed a petition for reorganization under Chapter 11 of the U.S. Bankruptcy Code in the United States Bankruptcy Court for the Central District of California. The third-party guarantor has reported substantial liabilities and minimal unsecured assets in its bankruptcy filings. If those filings are accurate, then the Company may recover little or no money from the third-party guarantor on the Company’s judgment.
During the fourth quarter of 2009, the Company reassumed the building lease on behalf of Workplace Learning and entered into a sublease with the current tenant for a portion of the space for a period of 51 months, with an early termination option, which would reduce the term of the sublease to 17 months. The sublease provides for a monthly rent payment and a set reimbursement percentage for operating expenses. The Company is currently undertaking efforts to sublease additional vacant space in the building to further offset its obligations under the building lease. This transaction did not have a material impact on the Company’s recorded liability.
89
Table of Contents
Index to Financial Statements
As of December 31, 2009, the Company has recorded a total liability of $8.8 million, for the fair value of the future lease payments, net of estimated sublease income, in the consolidated balance sheet. Approximately $1.8 million of this liability is included within accrued expenses and other, and the remaining $7.0 million is included within other non-current liabilities in the consolidated balance sheet.
Further changes in the Company’s recorded liability and discontinued operations could result if it becomes necessary to change the Company’s assumptions about future sublease income. Historically, each month, the Company’s liability has been reduced either by fulfilling its liability as lessee under the building lease or due to a sublessee’s or successor-in-interest’s performance under the terms of the sublease, which results in income for the Company. During the years ended December 31, 2009 and 2008, the Company recorded $0.3 million and $3.0 million in income, respectively, which is included in discontinued operations.
About.com
Plaintiffs commenced this action in 2002 on behalf of a putative class of current and former “guides” for About.com, a former subsidiary of the Company. The plaintiffs asserted a variety of claims, primarily that guides were employees who were misclassified as independent contractors (and therefore were entitled to be paid minimum wage and overtime under federal and state wage laws), and that the guides were underpaid according to the terms of their contracts. In November 2005, the Company moved for summary judgment on the breach of contract claim and certain others. The basis of the motion was that About.com compensated the guides properly (i.e., it paid them the contractually required percentage of “net advertising revenues” generated by the About.com website, and in some years paid them more).
In August 2007, the Court denied the Company’s motion as to the contract claim, finding disputed issues of fact about the amounts, if any, owed to the guides. The Court granted the Company’s motion as to certain procedural issues. The Court also granted summary judgment to the plaintiffs on one issue, holding that all page-views must be counted equally for purposes of calculating any individual guide’s relative share of the guide revenue pool. In January 2008, plaintiffs moved for class certification with respect to the breach of contract claim. The Court granted that motion in April 2009, but it also indicated a willingness to reconsider its earlier grant of partial summary judgment on the page-view issue. In July 2009, plaintiffs moved for partial summary judgment with respect to the amount of damages allegedly owed under the contracts with respect to calendar year 2000. The Company opposed the motion, which is pending.
In December 2009, the parties reached an agreement in principle to settle the case in its entirety for $5.75 million. Counsel for the parties subsequently entered into a settlement agreement, and the parties expect to submit papers to the Court in March 2010 seeking approval of the settlement.
Indemnifications and Other Contingencies
The Company is a party to contracts in which it is common for it to agree to indemnify third parties for certain liabilities that arise out of or relate to the subject matter of the contract. In some cases, this indemnity extends to related liabilities arising from the negligence of the indemnified parties but usually excludes any liabilities caused by gross negligence or willful misconduct. The Company cannot estimate the potential amount of future payments under these indemnities until events arise that would trigger a liability under the indemnities.
Additionally, in connection with the sale of assets and the divestiture of businesses, the Company may agree to indemnify the buyer and related parties for certain losses or liabilities incurred by the buyer with respect to: (i) the representations and warranties made by the Company to the buyer in connection with the sale and (ii) liabilities related to the pre-closing operations of the assets sold. Indemnities related to pre-closing operations generally include tax liabilities and other liabilities not assumed by the buyer in the transaction.
Indemnities related to the pre-closing operations of sold assets normally do not represent additional liabilities to the Company but simply serve to protect the buyer from potential liability associated with the Company’s obligations existing at the time of the sale. As with any liability, the Company has previously accrued for those
90
Table of Contents
Index to Financial Statements
pre-closing obligations that are considered probable and reasonably estimable. Should circumstances change, increasing the likelihood of payments related to a specific indemnity, the Company will accrue a liability when future payment is probable and the amount is reasonably estimable.
The Company also has other contingent tax-related liabilities arising from positions taken with the filing of certain tax returns. The Company has recorded reserves, included in accrued expenses and other in the consolidated balance sheet, of $5.1 million, $12.8 million and $9.7 million at December 31, 2009, 2008 and 2007, respectively, for all of its tax-related contingencies. During the years ended December 31, 2009, 2008 and 2007, the Company recorded (income) expense for changes in its estimated liability for tax-related contingencies attributable to continuing operations of $(0.3) million, $(0.3) million and $0.3 million respectively, which is included in other (income) expense, net in the consolidated statement of operations.
During the years ended December 31, 2009, 2008 and 2007, the Company recorded (income) expense for changes in its estimated liability for tax-related contingencies attributable to discontinuing operations of $(6.6) million, $(0.5) million and $0.5 million respectively, which is included in other (income) expense, net in the consolidated statement of operations. During the year ended December 31, 2009, the Company reduced certain tax-related contingent liability obligations, while others ultimately lapsed due to the lapsing of the statutes of limitations, and resulted in the reduction of a significant portion of the recorded liability, which was recorded as a benefit to earnings in discontinued operations.
PRIMEDIA Enthusiast Media
In August 2007, the Company sold its PEM segment. In connection with the sale, the Company entered into a sublease agreement with the buyer for office space where PEM was headquartered. On April 27, 2009, the buyer filed a petition for reorganization under Chapter 11 of the U.S. Bankruptcy Code in the United States Bankruptcy Court for the District of Delaware. In the bankruptcy proceedings, the sublease was rejected, a new sublease was entered into with the buyer at a reduced rate, and the buyer put certain of the space back to the Company. As a result, during the second quarter of 2009, the Company recorded a charge of $2.7 million, which is included in discontinued operations in the consolidated statement of operations, to adjust its remaining liability under its lease for all of the office space, to record brokerage fees related to the new sublease and to write off certain amounts receivable from the buyer.
CK Media
On December 21, 2007, CK Media, LLC (“CK Media”) filed a complaint against PRIMEDIA Special Interest Publications, Inc. and PRIMEDIA Inc. in the Supreme Court of the State of New York alleging that PRIMEDIA misrepresented certain financial information and made inaccurate representations and warranties in connection with a June 8, 2006 Asset Purchase Agreement entered into between CK Media and PRIMEDIA for the sale of PRIMEDIA’s Crafts Group.
On January 30, 2009, the Company entered into a settlement agreement to settle the case in order to avoid the ongoing expense of this protracted case, as well as the risks and uncertainties associated with complex litigation involving jury trial. Pursuant to the settlement agreement, the Company paid $4.5 million, inclusive of attorneys’ fees and costs. The payment was recorded as a charge included in discontinued operations in the consolidated statement of operations for the year ended December 31, 2008.
Note 21. Related Party Transactions
As of March 1, 2010, approximately 58.9% of the outstanding shares of the Company’s common stock were held by investment partnerships, of which KKR Associates, L.P. and KKR GP 1996 LLC are the general partners. KKR Associates, L.P. and KKR GP 1996 LLC have sole voting and investment power with respect to these shares. Consequently, KKR Associates, L.P. and KKR GP 1996 LLC and their respective general partners and members, two of whom are also members of the Company’s Board of Directors, control the Company and have
91
Table of Contents
Index to Financial Statements
the power to elect all of its directors and approve any action requiring stockholder approval, including adopting amendments to the Company’s certificate of incorporation and approving mergers or sales of all or substantially all of the Company’s assets. KKR Associates, L.P. and KKR GP 1996 LLC will also be able to prevent or cause a change of control at any time.
For the years ended December 31, 2009, 2008 and 2007, the Company incurred and expensed management, consulting and financial services fees from KKR of $0.4 million, $0.8 million and $0.9 million, respectively. In addition, for the years ended December 31, 2009, 2008 and 2007, the Company incurred and expensed directors’ fees for certain partners of KKR aggregating $0.1 million per year.
During the first half of 2008, the Company entered into a short-term arrangement with KKR Capstone, a consulting company founded by the Chairman of the Company’s Board of Directors, pursuant to which it leased office space in New York and paid $0.1 million in rent. The lease ended in May 2008. In addition, the Company paid KKR Capstone $0.4 million for consulting and management services during 2008. No fees were paid to KKR Capstone during 2009 or 2007.
Beverly Chell, a current director of PRIMEDIA and former Vice Chairman and General Counsel of PRIMEDIA, provided consulting and management services to the Company in 2007 and 2008. As compensation for her services, Ms. Chell was paid a daily or hourly rate. During 2007, the Company paid Ms. Chell approximately $0.1 million for such consulting services. The amount paid to Ms. Chell in 2008 was not material, and no consulting fees were paid to Ms. Chell in 2009.
Note 22. Subsequent Events
On March 2, 2010, the Company’s Board of Directors declared a cash dividend of $0.07 per share of the Company’s common stock, payable on or about March 24, 2010, to stockholders of record on March 15, 2010.
| ITEM 9. | CHANGES IN AND DISAGREEMENTS WITH ACCOUNTANTS ON ACCOUNTING AND FINANCIAL DISCLOSURE |
None.
| ITEM 9A. | CONTROLS AND PROCEDURES |
Disclosure Controls and Procedures
Under the supervision and with the participation of our management, including our Chief Executive Officer and our Chief Financial Officer, we conducted an evaluation of our disclosure controls and procedures, as such term is defined under Securities and Exchange Act of 1934 Rules 13a-15(f). Based on this evaluation, our Chief Executive Officer and our Chief Financial Officer concluded that the Company’s disclosure controls and procedures were effective as of December 31, 2009.
Changes in Internal Control Over Financial Reporting
There have been no changes in the Company’s internal control over financial reporting during the three months ended December 31, 2009 that have materially affected, or are reasonably likely to materially affect, the Company’s internal control over financial reporting.
92
Table of Contents
Index to Financial Statements
Management’s Report on Internal Control over Financial Reporting
The management of PRIMEDIA is responsible for establishing and maintaining adequate internal control over financial reporting. Our internal control over financial reporting is a process designed to provide reasonable assurance regarding the reliability of our financial reporting and the preparation of financial statements for external purposes in accordance with generally accepted accounting principles. Our internal control over financial reporting includes those policies and procedures that (i) pertain to the maintenance of records that, in reasonable detail, accurately and fairly reflect the transactions and dispositions of the assets of the Company; (ii) provide reasonable assurance that transactions are recorded as necessary to permit preparation of financial statements in accordance with generally accepted accounting principles, and that receipts and expenditures of the Company are being made only in accordance with authorizations of management and directors of the Company; and (iii) provide reasonable assurance regarding prevention or timely detection of unauthorized acquisition, use or disposition of the Company’s assets that could have a material effect on the financial statements.
Because of its inherent limitations, internal control over financial reporting may not prevent or detect misstatements. Also, projections of any evaluation of effectiveness to future periods are subject to the risk that controls may become inadequate because of changes in conditions, or that the degree of compliance with the policies or procedures may deteriorate. Management assessed the effectiveness of the Company’s internal control over financial reporting as of December 31, 2009. In making this assessment, we used the criteria set forth by the Committee of Sponsoring Organizations of the Treadway Commission (COSO) in Internal Control — Integrated Framework. Based on our assessment we concluded that, as of December 31, 2009, the Company’s internal control over financial reporting was effective based on those criteria.
Deloitte & Touche LLP, the independent registered public accounting firm that audited the Company’s consolidated financial statements has also audited the effectiveness of our internal control over financial reporting as of December 31, 2009. The attestation report of Deloitte & Touche LLP follows this report.
93
Table of Contents
Index to Financial Statements
REPORT OF INDEPENDENT REGISTERED PUBLIC ACCOUNTING FIRM ON INTERNAL
CONTROL OVER FINANCIAL REPORTING
To the Stockholders and Board of Directors of
PRIMEDIA Inc.
Norcross, Georgia
We have audited the internal control over financial reporting of PRIMEDIA Inc. and subsidiaries’ (the “Company”) as of December 31, 2009, based on criteria established in Internal Control—Integrated Framework issued by the Committee of Sponsoring Organizations of the Treadway Commission. The Company’s management is responsible for maintaining effective internal control over financial reporting and for its assessment of the effectiveness of internal control over financial reporting, included in the accompanying Management’s Report on Internal Control over Financial Reporting. Our responsibility is to express an opinion on the Company’s internal control over financial reporting based on our audit.
We conducted our audit in accordance with the standards of the Public Company Accounting Oversight Board (United States). Those standards require that we plan and perform the audit to obtain reasonable assurance about whether effective internal control over financial reporting was maintained in all material respects. Our audit included obtaining an understanding of internal control over financial reporting, assessing the risk that a material weakness exists, testing and evaluating the design and operating effectiveness of internal control based on that risk, and performing such other procedures as we considered necessary in the circumstances. We believe that our audit provides a reasonable basis for our opinion.
A company’s internal control over financial reporting is a process designed by, or under the supervision of, the company’s principal executive and principal financial officers, or persons performing similar functions, and effected by the company’s board of directors, management, and other personnel to provide reasonable assurance regarding the reliability of financial reporting and the preparation of financial statements for external purposes in accordance with generally accepted accounting principles. A company’s internal control over financial reporting includes those policies and procedures that (1) pertain to the maintenance of records that, in reasonable detail, accurately and fairly reflect the transactions and dispositions of the assets of the company; (2) provide reasonable assurance that transactions are recorded as necessary to permit preparation of financial statements in accordance with generally accepted accounting principles, and that receipts and expenditures of the company are being made only in accordance with authorizations of management and directors of the company; and (3) provide reasonable assurance regarding prevention or timely detection of unauthorized acquisition, use, or disposition of the company’s assets that could have a material effect on the financial statements.
Because of the inherent limitations of internal control over financial reporting, including the possibility of collusion or improper management override of controls, material misstatements due to error or fraud may not be prevented or detected on a timely basis. Also, projections of any evaluation of the effectiveness of the internal control over financial reporting to future periods are subject to the risk that the controls may become inadequate because of changes in conditions, or that the degree of compliance with the policies or procedures may deteriorate.
In our opinion the Company has maintained, in all material respects, effective internal control over financial reporting as of December 31, 2009, based on the criteria established in Internal Control—Integrated Framework issued by the Committee of Sponsoring Organizations of the Treadway Commission.
94
Table of Contents
Index to Financial Statements
We have also audited, in accordance with the standards of the Public Company Accounting Oversight Board (United States), the consolidated financial statements and financial statement schedule as of and for the year ended December 31, 2009, of the Company and our report dated March 10, 2010 expressed an unqualified opinion on those financial statements and financial statement schedule.
/s/ DELOITTE & TOUCHE LLP
Atlanta, Georgia
March 10, 2010
95
Table of Contents
Index to Financial Statements
| ITEM 9B. | OTHER INFORMATION |
There was no information required to be disclosed in a report on Form 8-K during the fourth quarter of 2009 for which no Form 8-K was filed.
| ITEM 10. | DIRECTORS, EXECUTIVE OFFICERS AND CORPORATE GOVERNANCE |
Certain information relating to our directors is incorporated herein by reference to our Proxy Statement for the 2010 Annual Meeting of Stockholders, which will be filed with the SEC not later than 120 days after December 31, 2009. Certain other information relating to our executive officers appears in Part I of this Report under the heading “Executive Officers of the Registrant.”
The information appearing in the Proxy Statement under the caption “Section 16(a) Benefits/Ownership Reporting Compliance” is incorporated herein by reference.
PRIMEDIA Code of Ethics
We have a Code of Ethics, which is applicable to all of our officers, directors and employees, including the principal executive officer, the principal financial officer and the principal accounting officer. The Code is available free of charge on our website at www.primedia.com under the caption “Governance” and in print to any stockholder who requests it. Requests for copies may be directed to our Corporate Secretary at PRIMEDIA Inc., 3585 Engineering Drive, Norcross, GA 30092. We intend to disclose future amendments to, or waivers from, certain provisions of the Code on our website promptly following the date of such amendment or waiver (to the extent applicable to any of our directors, chief executive officer, chief financial officer or chief accounting officer).
NYSE Certification
On June 20, 2009, we timely submitted to the NYSE the Annual CEO Certification, pursuant to Section 303A.12 of the NYSE’s listing standards, whereby our CEO certified that he was not aware of any violation by us of the NYSE’s corporate governance listing standards as of the date of the certification.
| ITEM 11. | EXECUTIVE COMPENSATION |
The information required by this Item is incorporated herein by reference to our Proxy Statement for the 2010 Annual Meeting of Stockholders.
| ITEM 12. | SECURITY OWNERSHIP OF CERTAIN BENEFICIAL OWNERS AND MANAGEMENT AND RELATED STOCKHOLDER MATTERS |
The information required by this Item is incorporated herein by reference to our Proxy Statement for the 2010 Annual Meeting of Stockholders.
| ITEM 13. | CERTAIN RELATIONSHIPS AND RELATED TRANSACTIONS AND DIRECTOR INDEPENDENCE |
The information required by this Item is incorporated herein by reference to our Proxy Statement for the 2010 Annual Meeting of Stockholders.
| ITEM 14. | PRINCIPAL ACCOUNTANT FEES AND SERVICES |
The information required by this Item is incorporated herein by reference to our Proxy Statement for the 2010 Annual Meeting of Stockholders.
96
Table of Contents
Index to Financial Statements
| ITEM 15. | EXHIBITS AND FINANCIAL STATEMENT SCHEDULES |
| (a) | Documents filed as part of this Report: |
| 1. | Index to Financial Statements |
See Index to Consolidated Financial Statements included in Part II, Item 8 of this Report.
| 2. | Index to Financial Statement Schedule: |
| Page | ||
| S-1 | ||
| S-2 | ||
| S-3 |
All schedules, except those set forth above, have been omitted since the information required to be submitted has been included in the consolidated financial statements or notes thereto or has been omitted as not applicable or not required.
| 3. | Exhibits. |
| Refer to Exhibit Index on pages E-1 through E-10 which is incorporated herein by reference |
E-1 |
| (b) | Exhibits |
Exhibits listed in Item 15(a)(3) are incorporated herein by reference.
97
Table of Contents
Index to Financial Statements
Pursuant to the requirements of Section 13 or 15(d) of the Securities and Exchange Act of 1934, the registrant has duly caused this report to be signed on its behalf by the undersigned, thereunto duly authorized.
| PRIMEDIA INC. | ||||
| Date: March 10, 2010 | By: | /S/ CHARLES J. STUBBS | ||
| (Charles J. Stubbs) | ||||
| President and Chief Executive Officer | ||||
Pursuant to the requirements of the Securities and Exchange Act of 1934, this report has been signed below by the following persons in the capacities and on the dates indicated.
| Name |
Title |
Date | ||
| /S/ DEAN B. NELSON (Dean B. Nelson) |
Chairman and Director | March 10, 2010 | ||
| /S/ CHARLES J. STUBBS (Charles J. Stubbs) |
President, Chief Executive Officer and Director | March 10, 2010 | ||
| /S/ KIM R. PAYNE (Kim R. Payne) |
Senior Vice President, Chief Financial Officer (Principal Finance Officer) |
March 10, 2010 | ||
| /S/ J. MICHAEL BARBER (J. Michael Barber) |
Senior Vice President, Chief Accounting Officer (Principal Accounting Officer) |
March 10, 2010 | ||
| /S/ DAVID A. BELL (David A. Bell) |
Director | March 10, 2010 | ||
| /S/ BEVERLY C. CHELL (Beverly C. Chell) |
Director | March 10, 2010 | ||
| /S/ DANIEL T. CIPORIN (Daniel T. Ciporin) |
Director | March 10, 2010 | ||
| /S/ MEYER FELDBERG (Meyer Feldberg) |
Director | March 10, 2010 | ||
| /S/ PERRY GOLKIN (Perry Golkin) |
Director | March 10, 2010 | ||
| /S/ H. JOHN GREENIAUS (H. John Greeniaus) |
Director | March 10, 2010 | ||
| /S/ KEVIN J. SMITH (Kevin J. Smith) |
Director | March 10, 2010 | ||
| /S/ THOMAS C. UGER (Thomas C. Uger) |
Director | March 10, 2010 | ||
98
Table of Contents
Index to Financial Statements
PRIMEDIA INC. AND SUBSIDIARIES
Valuation and Qualifying Accounts
| Description |
Balance at Beginning of Period |
Charged to Costs and Expenses |
Charged to Other Accounts |
Deductions | Assets Held for Sale |
Balance at End of Period | |||||||||||||||
| (Dollars in thousands) | |||||||||||||||||||||
| Accounts receivable |
|||||||||||||||||||||
| Allowance for doubtful accounts |
$ | 1,528 | $ | 4,100 | $ | 1,319 | (1) | $ | (5,730 | )(2) | $ | — | $ | 1,217 | |||||||
| Accumulated amortization |
|||||||||||||||||||||
| Other intangible assets |
$ | 83,778 | $ | 2,468 | $ | — | $ | (162 | )(3) | $ | — | $ | 86,084 | ||||||||
| Deferred financing costs |
$ | 1,272 | $ | 915 | $ | — | $ | — | $ | — | $ | 2,187 | |||||||||
| Deferred tax asset valuation allowance |
$ | 179,511 | $ | (1,062 | ) | $ | (5,281 | )(4) | $ | — | $ | — | $ | 173,168 | |||||||
Notes:
| (1) | Increases in related valuation account result from the recovery of amounts previously written off. |
| (2) | Deductions from related valuation account result from write-offs related to accounts receivable. |
| (3) | Deductions from related accumulated amortization account result from write-offs related to intangible assets. |
| (4) | Includes primarily change in prior year estimates to actual returns filed and the impact of generally accepted accounting principles related to accounting for uncertainty in income taxes implementation on the net deferred tax assets and liabilities. |
S-1
Table of Contents
Index to Financial Statements
SCHEDULE II
PRIMEDIA INC. AND SUBSIDIARIES
Valuation and Qualifying Accounts
Year Ended December 31, 2008
| Description |
Balance at Beginning of Period |
Charged to Costs and Expenses(3) |
Charged to Other Accounts |
Deductions | Assets Held for Sale(4) |
Balance at End of Period | |||||||||||||||
| (Dollars in thousands) | |||||||||||||||||||||
| Accounts receivable |
|||||||||||||||||||||
| Allowance for doubtful accounts |
$ | 1,271 | $ | 3,817 | $ | 1,354 | (1) | $ | (4,914 | )(2) | $ | — | $ | 1,528 | |||||||
| Accumulated amortization |
|||||||||||||||||||||
| Other intangible assets |
$ | 81,288 | $ | 2,870 | $ | — | $ | (380 | )(4) | $ | — | $ | 83,778 | ||||||||
| Deferred financing costs |
$ | 14,336 | $ | 922 | $ | (13,986 | ) | $ | — | $ | — | $ | 1,272 | ||||||||
| Deferred tax asset valuation allowance |
$ | 204,950 | $ | (29,325 | ) | $ | 3,886 | (5) | $ | — | $ | — | $ | 179,511 | |||||||
Notes:
| (1) | Increases in related valuation account result from the recovery of amounts previously written off. |
| (2) | Deductions from related valuation account result from write-offs related to accounts receivable. |
| (3) | Includes operating results of discontinued operations. |
| (4) | Deductions from related accumulated amortization account result from write-offs related to intangible assets. |
| (5) | Impact of generally accepted accounting principles related to accounting for uncertainty in income taxes implementation on the net deferred tax assets and liabilities. |
S-2
Table of Contents
Index to Financial Statements
SCHEDULE II
PRIMEDIA INC. AND SUBSIDIARIES
Valuation and Qualifying Accounts
Year Ended December 31, 2007
| Description |
Balance at Beginning of Period |
Charged to Costs and Expenses(5) |
Charged to Other Accounts |
Deductions(2) | Assets Held for Sale(4) |
Balance at End of Period | ||||||||||||||||
| (Dollars in thousands) | ||||||||||||||||||||||
| Accounts receivable |
||||||||||||||||||||||
| Allowance for doubtful accounts |
$ | 7,368 | $ | 4,036 | $ | 3,362 | (1) | $ | (8,404 | ) | $ | (33 | ) | $ | 1,271 | |||||||
| $ | (5,058 | )(3) | ||||||||||||||||||||
| Allowance for returns and rebates |
$ | 2,136 | $ | 3,194 | $ | (1,354 | )(3) | $ | (3,976 | ) | $ | — | $ | — | ||||||||
| Inventory |
||||||||||||||||||||||
| Allowance for obsolescence |
$ | 705 | $ | (9 | ) | $ | (55 | ) | $ | (641 | ) | $ | — | $ | — | |||||||
| Accumulated amortization |
||||||||||||||||||||||
| Other intangible assets |
$ | 230,284 | $ | 4,692 | $ | (152,829 | )(3) | $ | — | $ | (859 | ) | $ | 81,288 | ||||||||
| Deferred financing costs |
$ | 19,563 | $ | 10,472 | (7) | $ | (15,699 | )(3) | $ | — | $ | — | $ | 14,336 | ||||||||
| Video mastering and programming costs |
$ | — | $ | 390 | $ | 147 | $ | (537 | ) | $ | — | $ | — | |||||||||
| Direct-response advertising costs |
$ | 5,051 | $ | 7,152 | $ | (4,526 | )(3) | $ | (7,677 | ) | $ | — | $ | — | ||||||||
| Deferred tax asset valuation allowance |
$ | 616,753 | $ | (344,229 | ) | $ | (67,574 | )(6) | $ | — | $ | — | $ | 204,950 | ||||||||
| Notes: |
| (1) | Increases in related valuation account result from the recovery of amounts previously written off. |
| (2) | Deductions from related valuation account result from write-offs and returns, as applicable, related to accounts receivable and inventory and write-offs of fully amortized amounts. |
| (3) | Represents adjustments for discontinued operations. |
| (4) | Represents assets held for sale for PRIMEDIA Healthcare. |
| (5) | Includes operating results of discontinued operations. |
| (6) | Impact of generally accepted accounting principles related to accounting for uncertainty in income taxes implementation on the net deferred tax assets and liabilities. Impact of Financial Accounting Standards Board Interpretation No. 48 implementation on the net deferred tax assets and liabilities. |
| (7) | Includes amortization of deferred financing costs related to debt redemptions. |
S-3
Table of Contents
Index to Financial Statements
| 2.1 |
— | Agreement and Plan of Merger among PRIMEDIA Inc., Abracadabra Acquisition Corporation and About.com, Inc. dated as of October 29, 2000. (Filed as Annex D to the Joint Proxy Statement – Solicitation Prospectus to the Company’s Registration Statement on Form S-4 as filed with the Commission on January 18, 2001, Commission File No. 333-51432, and incorporated herein by this reference thereto). | ||
| 2.2 |
— | Stock Purchase Agreement dated as of July 1, 2001, among Emap PLC, Emap America Partners, Emap Inc. and PRIMEDIA Inc. (Filed as Exhibit 2.2 to Amendment No. 1 to the Company’s Registration Statement on Form S-4, as filed with the Commission on September 10, 2001, Commission File No. 333-67804, and incorporated herein by this reference thereto). | ||
| 2.3 |
— | Stock Purchase Agreement among PRIMEDIA Companies Inc., PRIMEDIA Inc. and The New York Times Company, dated February 17, 2005. (Filed as Exhibit 99.3 to the Company’s Current Report on Form 8-K, dated March 18, 2005, as filed with the Commission on March 24, 2005, Commission File No. 001-11106, and incorporated herein by this reference thereto). | ||
| 2.4 |
— | Asset Purchase Agreement among PRIMEDIA Workplace Learning LP, PRIMEDIA Inc. and Bank Administration Institute, dated as of March 31, 2005. (Filed as Exhibit 99.4 to the Company’s Current Report on Form 8-K, dated March 31, 2005, as filed with the Commission on April 6, 2005, Commission File No. 001-11106, and incorporated herein by this reference thereto). | ||
| 2.5 |
— | Asset Purchase Agreement among PRIMEDIA Inc., PRIMEDIA Digital Video Holdings LLC, PRIMEDIA Workplace Learning LP, Trinity Learning Corporation and Trinity Workplace Learning Corporation, dated as of April 1, 2005. (Filed as Exhibit 99.5 to the Company’s Current Report on Form 8-K, dated March 31, 2005, as filed with the Commission on April 6, 2005, Commission File No. 001-11106, and incorporated herein by this reference thereto). | ||
| 2.6 |
— | Stock Purchase Agreement between PRIMEDIA Companies Inc. and PBI Media Holdings Inc., dated August 5, 2005. (Filed as Exhibit 99.3 to the Company’s Current Report on Form 8-K, dated September 30, 2005, as filed with the Commission on October 6, 2005, Commission File No. 001-11106, and incorporated herein by this reference thereto). | ||
| 2.7 |
— | Stock Purchase Agreement, dated as of November 15, 2005, between PRIMEDIA Inc., Automotive.com, Inc. and certain stockholders of Automotive.com, Inc. (Filed as Exhibit 10.1 to the Company’s Current Report on Form 8-K, dated November 15, 2005, as filed with the Commission on November 21, 2005, Commission File No. 001-11106, and incorporated herein by this reference thereto). | ||
| 2.8 |
— | Stock Purchase Agreement dated as of May 13, 2007, between PRIMEDIA Inc., Consumer Source Inc. and Source Interlink Companies, Inc. (Filed as Exhibit 99.1 to the Company’s Current Report on Form 8-K dated May 21, 2007, as filed with the Commission on May 21, 2007, Commission File No. 001-11106, and incorporated herein by this reference thereto). | ||
| 3.1(a) |
— | Certificate of Incorporation of K-III Communications Corporation. (Filed as Exhibit 3.1 to the Company’s Registration Statement on Form S-1, Commission File No. 33-96516, and incorporated herein by this reference thereto). | ||
| 3.1(b) |
— | Certificate of Amendment to Certificate of Incorporation of K-III (changing name from K-III Communications Corporation to PRIMEDIA Inc.). (Filed as Exhibit 3.2 to the Company’s Annual Report on Form 10-K for the fiscal year ended December 31, 1997, as filed with the Commission on March 20, 1998, Commission File No. 001-11106, and incorporated herein by this reference thereto). | ||
| 3.1(c) |
— | Certificate of Amendment to Certificate of Incorporation of PRIMEDIA Inc. (Filed as Exhibit 3.1 to the Company’s Quarterly Report on Form 10-Q for the quarter ended June 30, 2002, as filed with the Commission on August 14, 2002, Commission File No. 001-11106, and incorporated herein by this reference thereto). | ||
E-1
Table of Contents
Index to Financial Statements
| 3.1(d) |
— | Certificate of Amendment to Certificate of Incorporation of PRIMEDIA Inc. (Filed as Exhibit 3.1 to the Company’s Quarterly Report on Form 10-Q for the quarter ended September 30, 2007, as filed with the Commission on November 9, 2007, Commission File No. 001-11106, and incorporated herein by this reference thereto). | ||
| 3.1(e)(i) |
— | Certificate of Designations of the Series D Preferred Stock. (Filed as Exhibit 4.3 to the Company’s Registration Statement on Form S-4 as filed with the Commission on May 14, 1996, Commission File No. 333-03691, and incorporated herein by this reference thereto). | ||
| 3.1(e)(ii) |
— | Certificate of Designations of the Series F Preferred Stock. (Filed as Exhibit 4.2 to Amendment No. 1 to the Company’s Registration Statement on Form S-4 as filed with the Commission on December 16, 1997, Commission File No. 333-38451, and incorporated herein by this reference thereto). | ||
| 3.1(e)(iii) |
— | Certificate of Designations of the Series H Preferred Stock. (Filed as Exhibit 4.3 to the Company’s Registration Statement on Form S-4 as filed with the Commission on May 6, 1998, Commission File No. 333-51891, and incorporated herein by this reference thereto). | ||
| 3.1(e)(iv) |
— | Certificate of Designations of the Series K Preferred Stock. (Filed as Exhibit 3.6 to the Company’s Annual Report on Form 10-K for the fiscal year ended December 31, 2001, as filed with the Commission on April 1, 2002, Commission File No. 001-11106, and incorporated herein by this reference thereto). | ||
| 3.1(e)(v) |
— | Certificate of Designations of the Series J Preferred Stock. (Filed as Exhibit 3.7 to the Company’s Annual Report on Form 10-K for the fiscal year ended December 31, 2001, as filed with the Commission on April 1, 2002, Commission File No. 001-11106, and incorporated herein by this reference thereto). | ||
| 3.2 |
— | Amended and Restated By-laws of K-III Communications Corporation. (Filed as Exhibit 3.4 to the Company’s Registration Statement on Form S-1, Commission File No. 33-96516, and incorporated herein by this reference thereto). | ||
| 4.1 |
— | 10 1/4% Senior Note Indenture (including form of note and form of guarantee). (Filed as an Exhibit to the Company’s Annual Report on Form 10-K for the fiscal year ended December 31, 1994, Commission File No. 001-11106, and incorporated herein by this reference thereto). | ||
| 4.2 |
— | 8 1/2% Senior Note Indenture (including forms of note and guarantee). (Filed as an Exhibit to the Company’s Annual Report on Form 10-K for the fiscal year ended December 31, 1995, Commission File No. 001-11106, and incorporated herein by this reference thereto). | ||
| 4.3 |
— | Form of Class D Subordinated Debenture Indenture (including form of debenture). (Filed as Exhibit 4.2 to the Company’s Registration Statement on Form S-4 as filed with the Commission on May 14, 1996, Commission File No. 333-03691, and incorporated herein by this reference thereto). | ||
| 4.4 |
— | Form of 9.20% Subordinated Exchange Debentures due 2009 Indenture, Class E and Class F (including form of debenture). (Filed as Exhibit 4.1 to the Company’s Registration Statement on Form S-4 as filed with the Commission on October 22, 1997, Commission File No. 333-38451, and incorporated herein by this reference thereto). | ||
| 4.5 |
— | Form of Class H Subordinated Debenture Indenture (including form of debenture). (Filed as Exhibit 4.2 to the Company’s Registration Statement on Form S-4 as filed with the Commission on May 6, 1998, Commission File No. 333-51891, and incorporated herein by this reference thereto). | ||
| 4.6 |
— | 7 5/8% Senior Note due 2008 Indenture, Series A and Series B, dated as of February 17, 1998 (including form of note and form of guarantee). (Filed as Exhibit 4.1 to the Company’s Registration Statement on Form S-4 as filed with the Commission on May 6, 1998, Commission File No. 333-51891, and incorporated herein by this reference thereto). | ||
| 4.7(a) |
— | 8 7/8% Senior Note due 2011 Indenture, Series A and Series B, dated as of May 8, 2001 (including forms of note and guarantee). (Filed as Exhibit 4.7 to the Company’s Registration Statement on Form S-4, as filed with the Commission on August 17, 2001, Commission File No. 333-67804, and incorporated herein by this reference thereto). | ||
E-2
Table of Contents
Index to Financial Statements
| 4.7(b) |
— | Supplemental Indenture dated July 13, 2007, to the Indenture dated as of May 8, 2001 (as amended and supplemented to the date hereof, the “Indenture”), among PRIMEDIA Inc., the guarantors listed on the signature pages thereto and The Bank of New York, as trustee. (Filed as Exhibit 99.2 to the Company’s Current Report on Form 8-K/A, dated August 7, 2007, as filed with the Commission on August 7, 2007, Commission File No. 001-11106, and incorporated herein by this reference thereto). | ||
| 4.7(c) |
— | Registration Rights Agreement dated as of May 8, 2001, by and among PRIMEDIA Inc., The Guarantors listed therein and Salomon Smith Barney Inc., J.P. Morgan Securities Inc. and Banc of America Securities LLC. (Filed as Exhibit 4.9 to the Company’s Registration Statement on Form S-4, as filed with the Commission on August 17, 2001, Commission File No. 333-67804, and incorporated herein by this reference thereto). | ||
| 4.8(a) |
— | 8% Senior Note due 2013 Indenture, Series A and Series B, dated as of May 15, 2003 (including form of note and form of guarantee). (Filed as Exhibit 4 to the Company’s Quarterly Report on Form 10-Q for the quarter ended March 31, 2003, as filed with the Commission on May 15, 2003, Commission File No. 001-11106, and incorporated herein by this reference thereto). | ||
| 4.8(b) |
— | Supplemental Indenture dated July 13, 2007, to the Indenture dated as of May 15, 2003 (as amended and supplemented to the date hereof, the “Indenture”), among PRIMEDIA Inc., the guarantors listed on the signature pages thereto and The Bank of New York, as trustee. (Filed as Exhibit 99.1 to the Company’s Current Report on Form 8-K/A, dated August 7, 2007, as filed with the Commission on August 7, 2007, Commission File No. 001-11106, and incorporated herein by this reference thereto). | ||
| 4.9(a) |
— | Form of Senior Floating Rate Note due 2010. (Filed as Exhibit 4.9 to the Company’s Registration Statement on Form S-4, as filed with the Commission on November 1, 2004, Commission File No. 333-120138, and incorporated herein by this reference thereto). | ||
| 4.9(b) |
— | Senior Floating Rate Note Indenture, Series A and Series B, dated as of May 14, 2004 (including form of note and form of guarantee). (Filed as Exhibit 4.10 to the Company’s Registration Statement on Form S-4, as filed with the Commission on November 1, 2004, Commission File No. 333-120138, and incorporated herein by this reference thereto). | ||
| 4.9(c) |
— | Supplemental Indenture dated July 13, 2007, to the Indenture dated as of May 14, 2004 (as amended and supplemented to the date hereof, the “Indenture”), among PRIMEDIA Inc., the guarantors listed on the signature pages thereto and The Bank of New York, as trustee. (Filed as Exhibit 99.3 to the Company’s Current Report on Form 8-K/A, dated August 7, 2007, as filed with the Commission on August 7, 2007, Commission File No. 001-11106, and incorporated herein by this reference thereto). | ||
| 4.9(d) |
— | Registration Rights Agreement dated as of May 14, 2004, among PRIMEDIA Inc., certain of its subsidiaries and Banc of America Securities LLC, Citigroup Global Markets Inc., J.P. Morgan Securities Inc., Lehman Brothers Inc., BNY Capital Markets, Inc. and Scotia Capital (USA) Inc., as representative of the initial purchasers. (Filed as Exhibit 4.11 to the Company’s Registration Statement on Form S-4, as filed with the Commission on November 1, 2004, Commission File No. 333-120138, and incorporated herein by this reference thereto). | ||
| 4.10 |
— | Amended Registration Rights Agreement dated as of February 5, 1998, among PRIMEDIA Inc., KKR 1996 Fund L.P., MA Associates, L.P., FP Associates, L.P., Magazine Associates, L.P., Publishing Associates, L.P., Channel One Associates, L.P. and KKR Partners II, L.P. with respect to common stock of K-III. (Filed as Exhibit 10.15 to the Company’s Annual Report on Form 10-K for the fiscal year ended December 31, 1998, as filed with the Commission on March 25, 1999, Commission File No. 001-11106, and incorporated herein by this reference thereto). | ||
| 4.11 |
— | Stockholders Agreement, dated November 15, 2005, by and among PRIMEDIA Inc., Automotive.com, Inc. and certain holders of common stock and options of Automotive.com, Inc. (Filed as Exhibit 10.2 to the Company’s Current Report on Form 8-K, dated November 15, 2005, as filed with the Commission on November 21, 2005, Commission File No. 001-11106, and incorporated herein by this reference thereto). | ||
E-3
Table of Contents
Index to Financial Statements
| 4.12 |
— | Lockup Agreement, dated as of May 13, 2007, by and among Source Interlink Companies, Inc. and AEC Associates, LLC. (Filed as Exhibit 99.2 to the Company’s Current Report on Form 8-K dated May 21, 2007, as filed with the Commission on May 21, 2007, Commission File No. 001-11106, and incorporated herein by this reference thereto). | ||
| 10.1(a) |
— | Credit Agreement dated as of June 20, 2001, with The Chase Manhattan Bank, as administrative agent, Bank of America N.A., as syndication agent, and The Bank of New York and The Bank of Nova Scotia, as co-documentation agents (the “Chase Credit Agreement”). (Filed as Exhibit 10.1 to the Company’s Annual Report on Form 10-K for the fiscal year ended December 31, 2001, as filed with the Commission on April 1, 2002, Commission File No. 001-11106, and incorporated herein by this reference thereto). | ||
| 10.1(a)(i) |
— | Forms of Pledge Agreement, Subsidiary Guaranty and Contribution Agreement (with respect to Exhibit 10.1(a)). (Filed as Exhibit 10.2 to the Company’s Annual Report on Form 10-K for the fiscal year ended December 31, 2001, as filed with the Commission on April 1, 2002, Commission File No. 001-11106, and incorporated herein by this reference thereto). | ||
| 10.1(a)(ii) |
— | Consent Dated as of April 8, 2005 under the Credit Agreement dated as of June 10, 2001, as amended, among PRIMEDIA Inc., the Lenders thereunder, Bank of America, N.A., as Syndication Agent, The Bank of New York and the Bank of Nova Scotia, as Co-Documentation Agents, and JP Morgan Chase Bank, N.A., as Administrative Agent. (Filed as Exhibit 10.2 to the Company’s Quarterly Report on Form 10-Q for the quarter ended June 30, 2005, as filed with the Commission on August 9, 2005, Commission File No. 001-11106, and incorporated herein by this reference thereto). | ||
| 10.1(b) |
— | First Amendment to the Chase Credit Agreement, dated as of June 31, 2003, with JPMorgan Chase Bank (f/k/a The Chase Manhattan Bank), as administrative agent, Bank of America N.A., as syndication agent, and The Bank of New York and The Bank of Nova Scotia, as co-documentation agents. (Filed as Exhibit 10.1 to the Company’s Quarterly Report on Form 10-Q for the quarter ended June 30, 2003, as filed with the Commission on August 14, 2003, Commission File No. 001-11106, and incorporated herein by this reference thereto). | ||
| 10.1(c) |
— | Second Amendment to the Chase Credit Agreement, dated as of April 29, 2004, with JP Morgan Chase Bank (f/k/a The Chase Manhattan Bank), as administrative agent, Bank of America N.A., as syndication agent, and The Bank of New York and The Bank of Nova Scotia, as co-documentation agents. (Filed as Exhibit 10.4 to the Company’s Registration Statement on Form S-4, as filed with the Commission on November 1, 2004, Commission File No. 333-120138, and incorporated herein by this reference thereto). | ||
| 10.2(a) |
— | Credit Agreement, dated as of May 14, 2004, with Bank of America N.A., as syndication agent, Citicorp North America, Inc. as co-syndication agent and JPMorgan Chase Bank, as administrative agent (the “Bank of America Credit Agreement”). (Filed as Exhibit 10.5 to the Company’s Registration Statement on Form S-4, as filed with the Commission on November 1, 2004, Commission File No. 333-120138, and incorporated herein by this reference thereto). | ||
| 10.2(a)(i) |
— | Subsidiary Guarantee, dated as of May 14, 2004 (with respect to Exhibit 10.2(a)). (Filed as Exhibit 10.6 to the Company’s Registration Statement on Form S-4, as filed with the Commission on November 1, 2004, Commission File No. 333-120138, and incorporated herein by this reference thereto). | ||
| 10.2(a)(ii) |
— | Consent Dated as of April 8, 2005 under the Credit Agreement dated as of May 14, 2004 among PRIMEDIA Inc., the Lenders thereunder, Bank of America, N.A., as Syndication Agent, Citicorp North America, Inc., as Co-Syndication Agent, and JP Morgan Chase Bank, N.A., as Administrative Agent. (Filed as Exhibit 10.2 to the Company’s Quarterly Report on Form 10-Q for the quarter ended June 30, 2005, as filed with the Commission on August 9, 2005, Commission File No. 001-11106, and incorporated herein by this reference thereto). | ||
E-4
Table of Contents
Index to Financial Statements
| 10.3 |
— | Credit Agreement dated as of June 20, 2001 and amended and restated as of September 30, 2005, among PRIMEDIA Inc., the Lenders thereunder, Bank of America, N.A., as Syndication Agent, The Bank of New York, The Bank of Nova Scotia and Citibank, N.A., as Co-Documentation Agents, and JP Morgan Chase Bank, N.A. as Administrative Agent. (Filed as Exhibit 10.1 to the Company’s Quarterly Report on Form 10-Q for the quarter ended September 30, 2005, as filed with the Commission on November 9, 2005, Commission File No. 001-11106, and incorporated herein by this reference thereto). | ||
| 10.4(a) |
— | Credit Agreement dated as of August 1, 2007, among PRIMEDIA Inc., Various Lending Institutions, The Bank of New York, as Syndication Agent, Lehman Brothers Inc., as Co-Documentation Agent, Citibank, N.A., as Co-Documentation Agent, Fifth Third Bank, as Co-Documentation Agent, and Credit Suisse, Cayman Islands Branch, as Administrative Agent. (Filed as Exhibit 99.1 to the Company’s Current Report on Form 8-K/A, dated August 3, 2007, as filed with the Commission on August 3, 2007, Commission File No. 001-11106, and incorporated herein by this reference thereto). | ||
| 10.4(a)(i) |
— | Pledge Agreement dated as of August 1, 2007, made by PRIMEDIA Inc. and each of the Subsidiaries of the Company identified therein, in favor of Credit Suisse, Cayman Islands Branch, as Collateral Agent (the “Pledgee”) for the benefit of the Secured Creditors (as defined therein). (Filed as Exhibit 99.2 to the Company’s Current Report on Form 8-K/A, dated August 3, 2007, as filed with the Commission on August 3, 2007, Commission File No. 001-11106, and incorporated herein by this reference thereto). | ||
| 10.4(a)(ii) |
— | Contribution Agreement, dated as of August 1, 2007, among each of the Subsidiary Guarantors (as defined in the Exhibit 10.4(a) Credit Agreement) of PRIMEDIA Inc. and together with any other entity that becomes a party hereto pursuant to Section 11 hereof, the “Guarantors”). (Filed as Exhibit 99.3 to the Company’s Current Report on Form 8-K/A, dated August 3, 2007, as filed with the Commission on August 3, 2007, Commission File No. 001-11106, and incorporated herein by this reference thereto). | ||
| 10.4(b) |
— | Amendment No. 1 dated as of June 30, 2009 to the Credit Agreement dated as of August 1, 2007, amended and restated, modified or supplemented from time to time among PRIMEDIA Inc., various lending institutions party thereto, The Bank of New York, as Syndication Agent, Lehman Brothers Inc., as Co-Documentation Agent, Citibank, N.A., as Co-Documentation Agent, Fifth Third Bank, as Co-Documentation Agent and Credit Suisse, Cayman Islands Branch, as Administrative Agent. (Filed as Exhibit 10.1 to the Company’s Current Report on Form 8-K, dated June 30, 2009, as filed with the Commission on July 6, 2009, Commission File NO. 001-11106, and incorporated herein by this reference thereto). | ||
| †10.5(a) |
— | Form of Amended and Restated K-III 1992 Stock Purchase and Option Plan. (Filed as an Exhibit to the Company’s Registration Statement on Form S-1, Commission File No. 33-96516, and incorporated herein by this reference thereto). | ||
| †10.5(b) |
— | Amendment No. 1 to the 1992 Stock Purchase and Option Plan Amended and Restated as of March 5, 1997. (Filed as Exhibit 10.6 to the Company’s Annual Report on Form 10-K for the fiscal year ended December 31, 1996, as filed with the Commission on March 28, 2007, Commission File No. 001-11106, and incorporated herein by this reference thereto). | ||
| †10.5(c) |
— | Amendment No. 2 to the 1992 Stock Purchase and Option Plan, dated May 11, 2005. (Filed as Exhibit 10.12 to the Company’s Annual Report on Form 10-K for the fiscal year ended December 31, 2005, as filed with the Commission on March 14, 2006, Commission File No. 001-11106, and incorporated herein by this reference thereto). | ||
| †10.6(a) |
— | Form of Common Stock Purchase Agreement between K-III and senior management. (Filed as an Exhibit to the Company’s Registration Statement on Form S-1, Commission File No. 33-46116, and incorporated herein by this reference thereto). | ||
E-5
Table of Contents
Index to Financial Statements
| 10.6(b) |
— | Form of Common Stock Purchase Agreement between K-III and senior management. (Filed as an Exhibit to the Company’s Registration Statement on Form S-1, Commission File No. 33-46116, and incorporated herein by this reference thereto). | ||
| †10.6(c) |
— | Form of Common Stock Purchase Agreement between K-III and various purchasers. (Filed as an Exhibit to the Company’s Registration Statement on Form S-1, Commission File No. 33-46116, and incorporated herein by this reference thereto). | ||
| 10.6(d) |
— | Form of Common Stock Purchase Agreement between K-III and various purchasers. (Filed as an Exhibit to the Company’s Registration Statement on Form S-1, Commission File No. 33-46116, and incorporated herein by this reference thereto). | ||
| †10.7(a) |
— | Form of Non-Qualified Stock Option Agreement between K-III and various employees. (Filed as an Exhibit to the Company’s Registration Statement on Form S-1, Commission File No. 33-46116, and incorporated herein by this reference thereto). | ||
| †10.7(b) |
— | Form of Non-Qualified Stock Option Agreement between K-III and various employees. (Filed as an Exhibit to the Company’s Registration Statement on Form S-1, Commission File No. 33-46116, and incorporated herein by this reference thereto). | ||
| 10.8(a) |
— | Form of Securities Purchase Agreement between PRIMEDIA Inc. and KKR 1996 Fund L.P. (Filed as Exhibit 10.13 to the Company’s Annual Report on Form 10-K for the fiscal year ended December 31, 1998, as filed with the Commission on March 25, 1999, Commission File No. 001-11106, and incorporated herein by this reference thereto). | ||
| 10.8(b) |
— | Securities Purchase Agreement (Common) dated as of August 24, 2001, between PRIMEDIA Inc. and KKR 1996 Fund L.P. (Filed as Exhibit 10.13 to the Company’s Annual Report on Form 10-K for the fiscal year ended December 31, 2001, as filed with the Commission on April 1, 2002, Commission File No. 001-11106, and incorporated herein by this reference thereto). | ||
| 10.8(c) |
— | Securities Purchase Agreement (Preferred) dated as of August 24, 2001, between PRIMEDIA Inc. and KKR 1996 Fund L.P. (Filed as Exhibit 10.14 to the Company’s Annual Report on Form 10-K for the fiscal year ended December 31, 2001, as filed with the Commission on April 1, 2002, Commission File No. 001-11106, and incorporated herein by this reference thereto). | ||
| 10.9(a) |
— | Asset Purchase Agreement dated as of December 6, 2006, by and among PRIMEDIA Specialty Group Inc., a Delaware corporation (“PSG”), PRIMEDIA Enthusiast Publications, Inc. (“PEP”), PRIMEDIA Special Interest Publications Inc., (“PSIP”), PRIMEDIA Inc. (“PRIMEDIA”; and, together with PSG, PEP and PSIP, the “Sellers,” and each individually, a “Seller”) and Intermedia Outdoor, Inc. (Filed as Exhibit 99.2 to the Company’s Current Report on Form 8-K, dated February 6, 2007, as filed with the Commission on February 6, 2007, Commission File No. 001-11106, and incorporated herein by this reference thereto). | ||
| 10.9(b) |
— | Letter Agreement Amendment to Asset Purchase Agreement dated as of December 22, 2006, between PRIMEDIA Inc. (on behalf of the Sellers) and Intermedia Outdoor, Inc. (Filed as Exhibit 99.3 to the Company’s Current Report on Form 8-K, dated February 6, 2007, as filed with the Commission on February 6, 2007, Commission File No. 001-11106, and incorporated herein by this reference thereto). | ||
| †10.10 |
— | Form of Incentive and Performance Stock Option Agreement under the PRIMEDIA Inc. Stock Purchase and Options Plan. (Filed as Exhibit 10.1 to the Company’s Quarterly Report on Form 10-Q for the quarter ended June 30, 2002, as filed with the Commission on August 14, 2002, Commission File No. 001-11106, and incorporated herein by this reference thereto). | ||
| 10.11 |
— | Stock Option Agreement dated as of July 26, 2002, between PRIMEDIA Inc. and Capstone Consulting LLC. (Filed as Exhibit 10.16 to the Company’s Annual Report on Form 10-K for the fiscal year ended December 31, 2002, as filed with the Commission on March 31, 2003, Commission File No. 001-11106, and incorporated herein by this reference thereto). | ||
E-6
Table of Contents
Index to Financial Statements
| †10.12 |
— | Executive Incentive Compensation Plan. (Filed as an Exhibit to the Company’s Annual Report on Form 10-K for the fiscal year ended December 31, 1994, Commission File No. 001 11106, and incorporated herein by this reference thereto). | ||
| †10.13 |
— | 1995 Restoration Plan. (Filed as an Exhibit to the Company’s Annual Report on Form 10-K for the fiscal year ended December 31, 1994, Commission File No. 001 11106, and incorporated herein by this reference thereto). | ||
| †10.14 |
— | Termination of 1995 Restoration Plan. (Filed as Exhibit 10.27 to the Company’s Annual Report on Form 10-K for the fiscal year ended December 31, 2006, as filed with the Commission on March 13, 2007, Commission File No. 001-11106, and incorporated herein by this reference thereto). | ||
| †10.15 |
— | Form of Restricted Stock Award Agreement for Employees. (Filed as Exhibit 10.1 to the Company’s Current Report on Form 8-K, dated June 13, 2008, as filed with the Commission on June 19, 2008, Commission File No. 001-11106, and incorporated herein by this reference thereto). | ||
| †10.16 |
— | Form of Incentive Stock Option Agreement for Employees. (Filed as Exhibit 10.2 to the Company’s Current Report on Form 8-K, dated June 13, 2008, as filed with the Commission on June 19, 2008, Commission File No. 001-11106, and incorporated herein by this reference thereto). | ||
| †10.17 |
— | Form of Nonqualified Stock Option Agreement for Non-Employee Directors. (Filed as Exhibit 10.3 to the Company’s Current Report on Form 8-K, dated June 13, 2008, as filed with the Commission on June 19, 2008, Commission File No. 001-11106, and incorporated herein by this reference thereto). | ||
| †10.18(a) |
— | Employment Agreement, dated as of October 14, 2003, between PRIMEDIA Inc. and Kelly Conlin. (Filed as Exhibit 10.20 to the Company’s Annual Report on Form 10-K for the fiscal year ended December 31, 2003, as filed with the Commission on March 15, 2004, Commission File No. 001-11106, and incorporated herein by this reference thereto). | ||
| †10.18(b) |
— | Separation Agreement, dated as of December 30, 2005, between PRIMEDIA Inc. and Kelly Conlin. (Filed as Exhibit 10.28 to the Company’s Annual Report on Form 10-K for the fiscal year ended December 31, 2005, as filed with the Commission on March 14, 2006, Commission File No. 001-11106, and incorporated herein by this reference thereto). | ||
| †10.18(a) |
— | Employment Agreement, dated as of October 27, 1999, between PRIMEDIA Inc. and Thomas S. Rogers and Amendment I dated as of October 27, 1999. (Filed as Exhibit 10.20 to the Company’s Annual Report on Form 10-K for the fiscal year ended December 31, 1999, as filed with the Commission on March 29, 2000, Commission File No. 001-11106, and incorporated herein by this reference thereto). | ||
| †10.19(b) |
— | Stock Option Agreement dated December 3, 1999 between PRIMEDIA Inc. and Thomas Rogers. (Filed as Exhibit 10.29 to the Company’s Annual Report on Form 10-K for the fiscal year ended December 31, 2001, as filed with the Commission on April 1, 2002, Commission File No. 001-11106, and incorporated herein by this reference thereto). | ||
| †10.19(c) |
— | Separation and Release Agreement, dated as of March 8, 2004, between Thomas S. Rogers and PRIMEDIA Inc. (Filed as Exhibit 10.32 to the Company’s Annual Report on Form 10-K for the fiscal year ended December 31, 2003, as filed with the Commission on March 15, 2004, Commission File No. 001-11106, and incorporated herein by this reference thereto). | ||
| †10.20(a) |
— | Letter Agreement dated February 25, 2000 between PRIMEDIA Inc. and David Ferm. (Filed as Exhibit 10.25 to the Company’s Annual Report on Form 10-K for the fiscal year ended December 31, 2000, as filed with the Commission on April 2, 2001, Commission File No. 001-11106, and incorporated herein by this reference thereto). | ||
| †10.20(b) |
— | Second Amendment, dated as of June 20, 2002, to Employment Agreement between PRIMEDIA Inc. and David Ferm. (Filed as Exhibit 10.26 to the Company’s Annual Report on Form 10-K for the fiscal year ended December 31, 2002, as filed with the Commission on March 31, 2003, Commission File No. 001-11106, and incorporated herein by this reference thereto). | ||
E-7
Table of Contents
Index to Financial Statements
| †10.20(c) |
— | Incentive and Performance Stock Option Agreement under the 1992 PRIMEDIA Inc. Stock Purchase and Option Plan, as amended, dated July 1, 2002 between PRIMEDIA Inc. and David Ferm. (Filed as Exhibit 10.1 to the Company’s Quarterly Report on Form 10-Q for the quarter ended September 30, 2002, as filed with the Commission on November 14, 2002, Commission File No. 001-11106, and incorporated herein by this reference thereto). | ||
| †10.20(d) |
— | Separation and Release Agreement, dated as of December 31, 2003, by and between David Ferm and PRIMEDIA Inc. (Filed as Exhibit 10.26 to the Company’s Annual Report on Form 10-K for the fiscal year ended December 31, 2003, as filed with the Commission on March 15, 2004, Commission File No. 001-11106, and incorporated herein by this reference thereto). | ||
| †10.21(a) |
— | Agreement dated April 19, 2002, between PRIMEDIA Inc. and Charles McCurdy. (Filed as Exhibit 10.1 to the Company’s Quarterly Report on Form 10-Q for the quarter ended March 31, 2002, as filed with the Commission on May 15, 2002, Commission File No. 001-11106, and incorporated herein by this reference thereto). | ||
| †10.21(b) |
— | Option Extension Agreement dated April 7, 2001, between PRIMEDIA Inc. and Charles McCurdy. (Filed as Exhibit 10.30 to the Company’s Annual Report on Form 10-K for the fiscal year ended December 31, 2001, as filed with the Commission on April 1, 2002, Commission File No. 001-11106, and incorporated herein by this reference thereto). | ||
| †10.21(c) |
— | Separation Agreement dated as of December 2, 2003, between Charles G. McCurdy and PRIMEDIA Inc. (Filed as Exhibit 10.29 to the Company’s Annual Report on Form 10-K for the fiscal year ended December 31, 2003, as filed with the Commission on March 15, 2004, Commission File No. 001-11106, and incorporated herein by this reference thereto). | ||
| †10.22(a) |
— | Letter Agreement dated April 2, 2001, between PRIMEDIA Inc. and Beverly Chell. (Filed as Exhibit 10.31 to the Company’s Annual Report on Form 10-K for the fiscal year ended December 31, 2001, as filed with the Commission on April 1, 2002, Commission File No. 001-11106, and incorporated herein by this reference thereto). | ||
| †10.22(b) |
— | Option Extension Agreement dated April 7, 2001, between PRIMEDIA Inc. and Beverly Chell. (Filed as Exhibit 10.27 to the Company’s Annual Report on Form 10-K for the fiscal year ended December 31, 2001, as filed with the Commission on April 1, 2002, Commission File No. 001-11106, and incorporated herein by this reference thereto). | ||
| †10.22(c) |
— | Consulting Agreement, dated July 1, 2006, between PRIMEDIA Inc. and Beverly Chell. (Filed as Exhibit 99.2 to the Company’s Current Report on Form 8-K, dated May 31, 2006, as filed with the Commission on June 1, 2006, Commission File No. 001-11106, and incorporated herein by this reference thereto). | ||
| †10.22(d) |
— | Consulting Agreement, dated December 18, 2006, between PRIMEDIA Inc. and Beverly Chell. (Filed as Exhibit 99 to the Company’s Current Report on Form 8-K, dated December 19, 2006, as filed with the Commission on December 19, 2006, Commission File No. 001-11106, and incorporated herein by this reference thereto). | ||
| †10.23(a) |
— | Severance Agreement, dated April 1, 1998, between Robert Metz and Haas Publishing Companies, Inc. (Filed as Exhibit 10.33 to the Company’s Annual Report on Form 10-K for the fiscal year ended December 31, 2003, as filed with the Commission on March 15, 2004, Commission File No. 001-11106, and incorporated herein by this reference thereto). | ||
| †10.23(b) |
— | Severance Agreement, dated March 10, 2005, between Robert Metz and Haas Publishing Companies, Inc. (Filed as Exhibit 10.42 to the Company’s Annual Report on Form 10-K for the fiscal year ended December 31, 2005, as filed with the Commission on March 14, 2006, Commission File No. 001-11106, and incorporated herein by this reference thereto). | ||
| †10.23(c) |
— | Separation and Release Agreement, dated May 27, 2008, between Robert Metz and PRIMEDIA Inc. (Filed as Exhibit 10.4 to the Company’s Quarterly Report on Form 10-Q for the fiscal quarter ended June 30, 2008, as filed with the Commission on August 8, 2008, Commission File No. 001-11106, and incorporated herein by this reference thereto). | ||
E-8
Table of Contents
Index to Financial Statements
| †10.24 |
— | Severance Agreement, dated March 10, 2005, between David Crawford and Haas Publishing Companies, Inc. (Filed as Exhibit 10.43 to the Company’s Annual Report on Form 10-K for the fiscal year ended December 31, 2005, as filed with the Commission on March 14, 2006, Commission File No. 001-11106, and incorporated herein by this reference thereto). | ||
| †10.25(a) |
— | Severance Agreement, dated as of July 19, 1999, by and between PRIMEDIA Inc. and Robert Sforzo. (Filed as Exhibit 10.22(a) to the Company’s Annual Report on Form 10-K for the fiscal year ended December 31, 2007, as filed with the Commission on March 17, 2008, Commission File No. 001-11106, and incorporated herein by this reference thereto). | ||
| †10.25(b) |
— | Employment Agreement, dated as of November 1, 2005, by and between PRIMEDIA Inc. and Robert Sforzo. (Filed as Exhibit 10.22(b) to the Company’s Annual Report on Form 10-K for the fiscal year ended December 31, 2007, as filed with the Commission on March 17, 2008, Commission File No. 001-11106, and incorporated herein by this reference thereto). | ||
| †10.25(c) |
— | Letter Agreement, dated September 20, 2007, by and between PRIMEDIA Inc. and Robert Sforzo. (Filed as Exhibit 10.22(c) to the Company’s Annual Report on Form 10-K for the fiscal year ended December 31, 2007, as filed with the Commission on March 17, 2008, Commission File No. 001-11106, and incorporated herein by this reference thereto). | ||
| †10.25(d) |
— | Letter Agreement, dated January 4, 2008, by and between PRIMEDIA Inc. and Robert Sforzo. (Filed as Exhibit 10.22(d) to the Company’s Annual Report on Form 10-K for the fiscal year ended December 31, 2007, as filed with the Commission on March 17, 2008, Commission File No. 001-11106, and incorporated herein by this reference thereto). | ||
| †10.26(a) |
— | Employment Agreement, dated as of May 11, 2006, by and between PRIMEDIA Inc. and Carl Salas. (Filed as Exhibit 10.23(a) to the Company’s Annual Report on Form 10-K for the fiscal year ended December 31, 2007, as filed with the Commission on March 17, 2008, Commission File No. 001-11106, and incorporated herein by this reference thereto). | ||
| †10.26(b) |
— | Letter Agreement, dated September 20, 2007, by and between PRIMEDIA Inc. and Carl Salas. (Filed as Exhibit 10.23(b) to the Company’s Annual Report on Form 10-K for the fiscal year ended December 31, 2007, as filed with the Commission on March 17, 2008, Commission File No. 001-11106, and incorporated herein by this reference thereto). | ||
| †10.26(c) |
— | Letter Agreement, dated January 4, 2008, by and between PRIMEDIA Inc. and Carl Salas. (Filed as Exhibit 10.23(c) to the Company’s Annual Report on Form 10-K for the fiscal year ended December 31, 2007, as filed with the Commission on March 17, 2008, Commission File No. 001-11106, and incorporated herein by this reference thereto). | ||
| †10.27(a) |
— | Letter Agreement, dated March 22, 2004, between PRIMEDIA Magazines Inc. and Steven Parr. (Filed as Exhibit 10.44 to the Company’s Annual Report on Form 10-K for the fiscal year ended December 31, 2005, as filed with the Commission on March 14, 2006, Commission File No. 001-11106, and incorporated herein by this reference thereto). | ||
| †10.27(b) |
— | Employment Agreement, dated September 15, 2006, between PRIMEDIA Inc. and Steven Parr. (Filed as Exhibit 99 to the Company’s Current Report on Form 8-K, dated September 15, 2006, as filed with the Commission on September 15, 2006, Commission File No. 001-11106, and incorporated herein by this reference thereto). | ||
| †10.27(c) |
— | Letter Agreement, dated June 12, 2007 between PRIMEDIA Inc. and Steve Parr. (Filed as Exhibit 10.2 to the Company’s Quarterly Report on Form 10-Q for the quarter ended June 30, 2007, as filed with the Commission on August 7, 2007, Commission File No. 001-11106, and incorporated herein by this reference thereto). | ||
| †10.28(a) |
— | Letter Agreement, dated July 1, 2004, between PRIMEDIA Inc. and Steven Aster. (Filed as Exhibit 10.45 to the Company’s Annual Report on Form 10-K for the fiscal year ended December 31, 2005, as filed with the Commission on March 14, 2006, Commission File No. 001-11106, and incorporated herein by this reference thereto). | ||
E-9
Table of Contents
Index to Financial Statements
| †10.28(b) |
— | Letter Agreement, dated January 11, 2007, between PRIMEDIA Inc. and Steven Aster. (Filed as Exhibit 10.1 to the Company’s Quarterly Report on Form 10-Q for the quarter ended March 31, 2007, as filed with the Commission on May 10, 2007, Commission File No. 001-11106, and incorporated herein by this reference thereto). | ||
| †10.29(a) |
— | Employment Agreement, dated May 30, 2006, between PRIMEDIA Inc. and Kevin Neary. (Filed as Exhibit 99.3 to the Company’s Current Report on Form 8-K, dated May 31, 2006, as filed with the Commission on June 1, 2006, Commission File No. 001-11106, and incorporated herein by this reference thereto). | ||
| †10.29(b) |
— | Letter Agreement, dated June 12, 2007 between PRIMEDIA Inc. and Kevin Neary. (Filed as Exhibit 10.1 to the Company’s Quarterly Report on Form 10-Q for the quarter ended June 30, 2007, as filed with the Commission on August 7, 2007, Commission File No. 001-11106, and incorporated herein by this reference thereto). | ||
| †10.30 |
— | Letter Agreement, dated June 12, 2007 between PRIMEDIA Inc. and Dean Nelson. (Filed as Exhibit 10.3 to the Company’s Quarterly Report on Form 10-Q for the quarter ended June 30, 2007, as filed with the Commission on August 7, 2007, Commission File No. 001-11106, and incorporated herein by this reference thereto). | ||
| †10.31 |
— | Severance Agreement dated September 27, 2007 between Kim R. Payne and PRIMEDIA Inc. (Filed as Exhibit 10.5 to the Company’s Quarterly Report on Form 10-Q for the quarter ended September 30, 2007, as filed with the Commission on November 9, 2007, Commission File No. 001-11106, and incorporated herein by this reference thereto). | ||
| †10.32 |
— | Severance Agreement dated October 1, 2007 between Arlene Mayfield and PRIMEDIA Inc. (Filed as Exhibit 10.29 to the Company’s Annual Report on Form 10-K for the fiscal year ended December 31, 2007, as filed with the Commission on March 17, 2008, Commission File No. 001-11106, and incorporated herein by this reference thereto). | ||
| †10.33 |
— | Severance Agreement dated January 4, 2008 between Keith L. Belknap and PRIMEDIA Inc. (Filed as Exhibit 10.30 to the Company’s Annual Report on Form 10-K for the fiscal year ended December 31, 2007, as filed with the Commission on March 17, 2008, Commission File No. 001-11106, and incorporated herein by this reference thereto). | ||
| †10.34 |
— | Employment Agreement, dated April 21, 2008, between PRIMEDIA Inc. and Charles Stubbs. (Filed as Exhibit 99.2 to the Company’s Current Report on Form 8-K, dated April 21, 2008, as filed with the Commission on April 22, 2008, Commission File No. 001-11106, and incorporated herein by this reference thereto). | ||
| †10.35 |
— | PRIMEDIA Inc. 2001 Stock Incentive Plan. (Filed as Exhibit 4.4 to the Company’s Registration Statement on Form S-8 as filed with the Commission on February 28, 2001, Commission File No. 333-56300, and incorporated herein by this reference thereto). | ||
| †10.36 |
— | Haas Publishing Companies, Inc. 2005-2007 Long-Term Plan. (Filed as Exhibit 99.1 to the Company’s Current Report on Form 8-K, dated April 12, 2005, as filed with the Commission on April 12, 2005, Commission File No. 001-11106, and incorporated herein by this reference thereto). | ||
| †10.37 |
— | Auto and New Home Guide Launch Incentive Plan. (Filed as Exhibit 99.2 to the Company’s Current Report on Form 8-K, dated April 12, 2005, as filed with the Commission on April 12, 2005, Commission File No. 001-11106, and incorporated herein by this reference thereto). | ||
| 10.38 |
— | Contribution Agreement, dated as of November 15, 2005, by and between PRIMEDIA Inc., IntelliChoice, Inc., PRIMEDIA Specialty Group Inc., McMullen Argus Publishing Inc. and Automotive.com, Inc. (Filed as Exhibit 10.3 to the Company’s Current Report on Form 8-K, dated November 15, 2005, as filed with the Commission on November 21, 2005, Commission File No. 001-11106, and incorporated herein by this reference thereto). | ||
| 21 |
— | Subsidiaries of PRIMEDIA(*) | ||
E-10
Table of Contents
Index to Financial Statements
| 23 |
— | Consent of Independent Registered Public Accounting Firm(*) | ||
| 31.1 |
— | Certification of Charles J. Stubbs Pursuant to Section 302 of the Sarbanes-Oxley Act of 2002(*) | ||
| 31.2 |
— | Certification by Kim R. Payne Pursuant to Section 302 of the Sarbanes-Oxley Act of 2002(*) | ||
| 32.1 |
— | Certification by Charles J. Stubbs Pursuant to 18 U.S.C. Section 1350, as Adopted Pursuant to Section 906 of the Sarbanes-Oxley Act of 2002(*) | ||
| 32.2 |
— | Certification by Kim R. Payne Pursuant to 18 U.S.C. Section 1350, as Adopted Pursuant to Section 906 of the Sarbanes-Oxley Act of 2002(*) | ||
| † | Executive contract or compensation plan or arrangement. |
| (*) | Filed herewith. |
E-11