Attached files
| file | filename |
|---|---|
| EX-23 - CONSENT OF MOSS ADAMS - CASCADE FINANCIAL CORP | ex23-123109.htm |
| EX-32 - CONSENT OF CEO AND PFO - SECTION 906 - CASCADE FINANCIAL CORP | ex32-123109.htm |
| EX-21 - SUBSIDIARIES OF THE REGISTRANT - CASCADE FINANCIAL CORP | ex21-123109.htm |
| EX-31.1 - CONSENT OF CEO - SECTION 302 - CASCADE FINANCIAL CORP | ex311-123109.htm |
| EX-31.2 - CONSENT OF PFO - SECTION 302 - CASCADE FINANCIAL CORP | ex312-123109.htm |
UNITED STATES
SECURITIES AND EXCHANGE COMMISSION
Washington, D.C. 20549
FORM 10-K
þ ANNUAL REPORT PURSUANT TO SECTION 13 OR 15(d) OF THE SECURITIES EXCHANGE ACT OF 1934
For the fiscal year ended December 31, 2009.
OR
|
¨ |
TRANSITION REPORT PURSUANT TO SECTION 13 OR 15(d) OF THE SECURITIES EXCHANGE ACT OF 1934 |
Commission file number 0-25286
CASCADE FINANCIAL CORPORATION
(Exact name of registrant as specified in its charter)
|
Washington |
91-1661954 | |
|
(State or other jurisdiction of incorporation or organization) |
(I.R.S. Employer I.D. Number) | |
|
2828 Colby Avenue, Everett, Washington |
98201 | |
|
(Address of principal executive offices) |
(Zip Code) | |
|
Registrant’s telephone number, including area code: |
(425) 339-5500 | |
|
Securities registered pursuant to Section 12(b) of the Act: |
None | |
|
Securities registered pursuant to Section 12(g) of the Act: |
Common Stock, par value $0.01 per share |
Indicate by check mark if the registrant is a well-known seasoned issuer as defined in Rule 405 of the Securities Act.
YES ¨ NO þ
Indicate by check mark if the registrant is not required to file reports pursuant to Section 13 or Section 15(d) of the Act. YES ¨ NO þ
Indicate by check mark whether the registrant (1) has filed all reports required to be filed by Section 13 or 15(d) of the Securities Exchange Act of 1934 during the preceding twelve months (or for such shorter period that the registrant was required to file such reports), and (2) has been subject to such filing requirements for the past
ninety days. YES þ NO ¨
Indicate by check mark whether the registrant has submitted electronically and posted on its corporate Web site, if any, every Interactive Data File required to be submitted and posted pursuant to Rule 405 of Regulation S-T (§232.405 of this chapter) during the preceding twelve months (or for such shorter period that the registrant was
required to submit and post such files). YES þ NO ¨
Indicate by check mark if disclosure of delinquent filers pursuant to Item 405 of Regulation S-K (§229.405 of this chapter) is not contained herein, and will not be contained, to the best of registrant’s knowledge, in definitive proxy or information statements incorporated
by reference in Part III of this Form 10-K or any amendment to this Form 10-K. ¨
1
Indicate by check mark whether the registrant is a large accelerated filer, an accelerated filer, a non-accelerated filer or a smaller reporting company. See the definitions of “large accelerated filer,” “accelerated filer” and “smaller reporting company” in Rule 12b-2 of the Exchange Act. (Check one):
Large Accelerated Filer ¨ Accelerated Filer ¨ Non-Accelerated Filer þ Smaller
Reporting Company ¨
Indicate by check mark whether the registrant is a shell company (as defined in Rule 12b-2 of the Exchange Act).
YES ¨ NO þ
The aggregate market value of the voting and non-voting Common Stock held by non-affiliates computed by reference to the price at which the Common Stock was last sold, or the average bid and asked price of such Common Stock, as of the last business day of the registrant's most recently completed second fiscal quarter, was $26.2 million.
The aggregate market value of Common Stock held by non-affiliates of the registrant at March 10, 2010 was $23.6 million (based on the last reported sale on such date). The number of shares of the registrant’s Common Stock outstanding at March 10, 2010, was 12,171,529.
DOCUMENTS INCORPORATED BY REFERENCE
Portions of registrant’s Definitive Proxy Statement for the Annual Meeting of Stockholders (the Proxy Statement) (Part III).
2
|
|
Cascade Financial Corporation |
|
|
FORM 10-K |
|
|
December 31, 2009 |
|
|
TABLE OF CONTENTS |
|
PART I |
||
|
Page | ||
|
Item 1. |
Business |
5 |
|
Item 1A. |
Risk Factors |
13 |
|
Item 1B. |
Unresolved Staff Comments |
21 |
|
Item 2. |
Properties |
21 |
|
Item 3. |
Legal Proceedings |
21 |
|
PART II |
||
|
Item 5. |
Market for Registrant’s Common Equity, Related Stockholder Matters and Issuer Purchases of Equity Securities |
21 |
|
Item 6. |
Selected Financial Data |
23 |
|
Item 7. |
Management’s Discussion and Analysis of Financial Condition and Results of Operation |
24 |
|
Item 7A. |
Quantitative and Qualitative Disclosures About Market Risk |
48 |
|
Item 8. |
Financial Statements and Supplementary Data |
49 |
|
Item 9. |
Changes in and Disagreements with Accountants on Accounting and Financial Disclosure |
49 |
|
Item 9A. |
Controls and Procedures |
49 |
|
Item 9B. |
Other Information |
50 |
|
PART III |
||
|
Item 10. |
Directors, Executive Officers and Corporate Governance |
51 |
|
Item 11. |
Executive Compensation |
52 |
|
Item 12. |
Security Ownership of Certain Beneficial Owners and Management and Related Stockholder Matters |
52 |
|
Item 13. |
Certain Relationships and Related Transactions, and Director Independence |
52 |
|
Item 14. |
Principal Accountant Fees and Services |
52 |
|
PART IV |
||
|
Item 15. |
Exhibits and Financial Statement Schedules |
53 |
| Exhibit Index |
91 | |
|
Signatures |
92 |
3
PART I
FORWARD LOOKING STATEMENTS
This annual report on Form 10-K includes forward-looking statements, within the meaning of Section 27A of the Securities Act of 1933, as amended, and Section 21E of the Securities Exchange Act of 1934, as amended, and subject to the safe harbor created by the Private Securities Litigation Reform Act of 1995, that are
subject to risks and uncertainties that could cause actual results to differ materially from those projected. These statements may be identified by the use of forward-looking terminology such as “anticipate,” “believe,” “continue,” “could,” “estimate,” “expect,” “intend,” “may,” “might,” “plan,” “potential,” “predict,” “should” or “will”
or the negative thereof or other variations thereon or comparable terminology. We have based these forward-looking statements on our current expectations, assumptions, estimates and projections. While we believe these expectations, assumptions, estimates and projections are reasonable, such forward-looking statements are only predictions and involve known and unknown risks and uncertainties, many of which are beyond our control. These and other important factors, including those discussed below under the headings
“Risk Factors,” “Management’s Discussion and Analysis of Financial Condition and Results of Operations” and “Business,” may cause our actual results, performance or achievements to differ materially from any future results, performance or achievements expressed or implied by these forward-looking statements. Some of the key factors that could cause actual results to differ from our expectations are:
|
· |
management’s ability to effectively execute its business plan and strategy; |
|
· |
the credit risks of lending activities, including changes in the level and trend of loan delinquencies, collections and write-offs and changes in our allowance for loan losses and provision for loan losses that may be impacted by deterioration in the housing and commercial real estate markets; |
|
· |
changes in general economic conditions, either nationally or in our market areas; |
|
· |
the availability of and costs associated with sources of liquidity; |
|
· |
inflation, interest rates, market and monetary fluctuations; |
|
· |
legislative or regulatory changes or changes in accounting principles, policies or guidelines; |
|
· |
the possibility that we will be unable to comply with certain conditions imposed upon us in regulatory actions, which could result in the imposition of further restrictions on our operations, penalties or other regulatory actions; |
|
· |
the costs and effects of legal and regulatory developments, including the resolution of legal proceedings or regulatory or other governmental inquiries and the results of regulatory examinations or reviews; |
|
· |
our ability to attract and retain deposits; |
|
· |
further increases in premiums for deposit insurance; |
|
· |
the use of estimates in determining fair value of certain of our assets, which estimates may prove to be incorrect and result in significant declines in valuation; |
|
· |
the failure or security breach of computer systems on which we depend; |
|
· |
increased competitive pressures among financial services companies; |
|
· |
adverse changes in the securities markets; |
|
· |
technological changes; |
|
· |
the ability to increase market share and control expenses; |
|
· |
our success at managing the risks involved in the foregoing; and |
|
· |
other risks which may be described in Cascade’s future filings with the SEC under the Securities Exchange Act of 1934. |
Given these risks and uncertainties, you are cautioned not to place undue reliance on such forward-looking statements. The forward-looking statements included or incorporated by reference into this report are made only as of the date hereof. We do not undertake and specifically decline any obligation to update any such
statements or to publicly announce the results of any revisions to any such statements to reflect future events or developments. In addition, we may make certain statements in future Securities and Exchange Commission (SEC) filings, in press releases and in oral and written statements that are not statements of historical fact and may constitute forward-looking statements.
4
Item 1. Business
General
Cascade Financial Corporation (the Corporation) is a bank holding company incorporated in the state of Washington in 2003. At December 31, 2009, the Corporation’s wholly-owned subsidiaries were Cascade Bank (Cascade or the Bank), Colby Real Estate, LLC, a subsidiary opened by the Bank to hold real estate owned properties
and Cascade Capital Trust I, II, and III. The executive offices of the Corporation are located at 2828 Colby Avenue, Everett, Washington, 98201. The telephone number is (425) 339-5500 and the website is www.cascadebank.com. Information on the website is not part of this Report.
The Bank has been serving the Puget Sound region since 1916 when it was organized as a mutual savings and loan association. On September 15, 1992, the Bank completed its conversion from a federal mutual to a federal stock savings bank. In July 2001, the Bank converted from a federal stock savings bank to a Washington
state commercial bank.
The Corporation was organized on August 18, 1994, for the purpose of becoming the holding company for Cascade Bank. The reorganization was completed on November 30, 1994, on which date the Bank became the wholly-owned subsidiary of the Corporation, and the stockholders of the Bank became stockholders of the Corporation.
Subsequent to this date, the primary activity of the Corporation has been holding the stock of the Bank. Accordingly, the information set forth in this report, including financial statements and related data, relates primarily to the Bank.
In May of 2003, the Corporation transferred its state of domicile from Delaware, which it had maintained since its formation as a holding company in 1994, to Washington. Following this conversion, the Corporation changed its fiscal year end from June 30 to December 31 to align its reporting period with those of its commercial
bank peers.
In June of 2004, the Corporation completed the acquisition of Issaquah Bancshares (Issaquah). Issaquah Bank, the only operating subsidiary of Issaquah, was merged into Cascade Bank.
The Corporation conducts its business from its main office in Everett, Washington, and 21 other full-service offices in the greater Puget Sound region. At December 31, 2009, the Corporation had total assets of $1.7 billion, total deposits of $1.1 billion and total equity of $134.5 million.
The Bank, a full-service commercial bank, offers a wide range of products and services. The deposits of the Bank are insured by the Federal Deposit Insurance Corporation (FDIC), up to the limits specified by law.
Subsidiary Activity
The Corporation has four subsidiaries: Cascade Bank, Cascade Capital Trust I, II, and III. The activities of the Corporation are primarily conducted through the Bank. Accordingly, this Form 10-K principally discusses the Bank’s operations. The operations of the Bank include Colby Real Estate LLC, which
was formed to (a) acquire, improve, manage, lease, operate, sell, transfer, exchange, encumber, pledge or dispose of any real or personal property acquired by the Bank; and (b) to engage in such other lawful acts or activities for which limited liability companies may be formed under the Act.
Cascade Capital Trust I was formed for the exclusive purpose of issuing Trust Preferred Securities and common securities and using the proceeds to acquire junior subordinated debentures issued by the Corporation. The junior subordinated debentures total $10.3 million, have an interest rate of 11.00%, mature on March 1,
2030, and are the sole assets of Cascade Capital Trust I. The junior subordinated debentures are pre-payable, in whole or in part, at the Corporation’s option on or after March 1, 2010, at declining premiums to maturity. Proceeds totaling approximately $9.3 million from the issuance of the junior subordinated debentures were used to increase the capital level of the Bank.
Cascade Capital Trust II incorporates the same structure for the same purposes as Cascade Capital Trust I. The junior subordinated debentures issued under Cascade Capital Trust II equal $5.2 million and had a rate of 5.82% for the first five years of the security, and beginning January 7, 2010, floats at the
three-month LIBOR plus 190 basis points (bp) thereafter. The securities are callable at par on a quarterly basis beginning January 7, 2010.
Cascade Capital Trust III incorporates the same structure for the same purposes as Cascade Capital Trust I and II. The junior subordinated debentures issued under Cascade Capital Trust III equal $10.3 million and have a rate of 6.50% for the first five years of the security, and floats at the three-month LIBOR plus 140
bp thereafter. The securities are callable at par on a quarterly basis beginning June 15, 2011.
5
Personnel
At December 31, 2009, the Corporation had 222 full-time equivalent employees. The Corporation believes that employees play a vital role in the success of a service company and that the Corporation’s relationship with its employees is good. The employees are not represented by a collective bargaining unit.
Business Strategy
The Corporation’s mission is to enhance shareholder value by focusing on the customer, and its vision is to be the preferred community bank whose employees build relationships to deliver financial solutions with exceptional service. The Corporation’s business plan supports this mission and is focused on building an enduring, independent
community bank. The Corporation is pursuing the following strategies:
|
· |
Increasing the bank’s core deposits and building deposit market share through an enhanced branch network, customer service center, online banking and effective treasury management program; |
|
· |
Reducing nonperforming assets and improving credit quality; |
|
· |
Building a balanced loan portfolio with a greater emphasis on commercial and industrial loans, and reduced real estate loan concentrations; |
|
· |
Maintaining cost-effective operations by efficiently offering products and services; |
|
· |
Maintaining a capital position at or above the “well-capitalized” (as defined for regulatory purposes) level; |
|
· |
Exploring prudent means to grow the business internally and through acquisitions; and |
|
· |
Searching for additional sources of fee-based revenue. |
The primary objectives of these strategies are to enhance shareholder value measured through profitability, and to increase the opportunity for quality earning asset growth, deposit generation, and fee-based income activities. However, the shift in emphasis to commercial lending does inherently contain additional risks (see Item 1A –
Risk Factors below).
Market Area
Headquartered in Everett, Washington, the Corporation serves its customers from 22 full-service offices - 13 in Snohomish County, eight in King County, and one in Skagit County. The primary geographic market area for most Cascade business lines is in Snohomish, King, Pierce and Skagit Counties.
Our market area in King County includes the growing cities East of Seattle and Lake Washington. This area’s economy has been dominated by Microsoft and The Boeing Company, with other high technology companies also playing an important role.
Everett, the Snohomish County seat, is the homeport of the U.S. Navy’s carrier, the USS Abraham Lincoln. The contribution that the Navy makes to the economy is not as dependent on other trends. The economy in the Corporation’s market area has been enhanced by the growth of the health care and biotechnology industries. Snohomish
County and Northeast King County are home to numerous biotechnology companies.
As a gateway to Asia, the Bank’s market area has also benefited from the continued expansion of world trade. Economic weakness in either the United States or Asia could reduce that trade. Such slowdowns in the international flow of goods and services could prove detrimental to the economy of the market area and potentially the quality
of our loan portfolios.
Competition
The competitive landscape for banking has changed significantly in the past two years. Three Washington State banks were closed by the FDIC during 2009, and four were closed in January and February of 2010. Additionally, many banks in the state are operating under formal regulatory orders. Competition for loans has therefore decreased in
the community
6
The Bank’s primary focus for loans is small-to-medium sized businesses and consumers in the Puget Sound area. As noted above, major competitors for the Bank in these loan markets are national banks, large regional banks, community banks and credit unions. The large banks often compete on the basis of competitive pricing, while the community
banks and credit unions compete on the basis of local decision making, loan structuring flexibility, and promises of a higher level of service.
The Bank’s competitors for retail loans, which include residential real estate and consumer loans, are numerous, including banks, mortgage brokers, captive finance subsidiaries of automobile companies, etc. While not a major area of focus, Cascade provides consumer lending on a relationship basis to its retail customers and business
owners and their employees.
On the deposit side, geographic location is still the primary factor in choosing a bank for a checking account relationship. As a result, the Bank’s competition for checking deposits comes primarily from large institutions with a broad network of locations. Online banking continues to be an important convenience service to attract checking
customers from larger banks. Community banks and savings institutions, as well as other non-banking financial institutions, provide the greatest competition for the various savings vehicles such as money market deposit accounts and certificates of deposit.
In addition to competition from other banking institutions, the Bank continues to experience competition from non-banking companies such as credit unions, financial services companies and brokerage firms. Many credit unions, including a large one in Cascade’s market area, have expanded their eligible membership by amending their charters.
Regulation
Introduction/General
The following generally refers to certain statutes and regulations affecting the Corporation and the Bank. This provides only a brief summary of the regulations impacting the Corporation and is not complete. This discussion is qualified in its entirety by the full text of the statutes and regulations. In addition, some statutes and regulations
exist which impact the Corporation but are not referenced below.
The Corporation is subject to extensive regulation, supervision and examination. Such regulation and supervision govern the activities in which the institution can engage and are intended primarily for the protection of the insurance fund and depositors. Regulatory authorities have been granted extensive discretion in connection with their
supervisory and enforcement activities, which are intended to strengthen the financial condition of the banking industry, including the imposition of restrictions on the operation of an institution, the classification of assets by the institution and the adequacy of an institution’s allowance for loan losses. Any change in such regulation and oversight could have an adverse material impact on the Corporation, Cascade and their respective operations.
Regulatory Actions. In December 2009, Cascade Bank received the examination report of FDIC for the annual safety and soundness exam conducted by the regulators in May 2009. As previously announced, based on the examination report, on January 26, 2010 the board of directors
of the Bank entered into an informal agreement called a memorandum of understanding, with the regulators (the “FDIC Memorandum”). The FDIC Memorandum requires the Bank to take certain actions to correct deficiencies noted during the examination and to provide periodic reports to the regulators. These actions include performing a risk segmentation of the Bank’s loan portfolio; reducing concentrations of construction, lot development and other commercial real estate loans and levels of adversely
classified and delinquent loans; strengthening credit administration; increasing board oversight; reducing brokered deposits and other non-core funding and enhancing capital and strategic planning processes, and regulatory compliance policies.
The Board and management are committed to addressing and resolving these issues on a timely basis. Since completion of the regulatory examination, actions have already commenced to comply with many of these requirements, including working to improve our internal allowance for loan loss policies and procedures and refining our capital and
strategic planning efforts.
7
In light of the current challenging operating environment, along with our elevated level of nonperforming assets, delinquencies, and adversely classified assets, we may be subject to increased regulatory scrutiny, regulatory restrictions, and potential enforcement actions. Such enforcement actions could place additional limitations on our
business and adversely affect our ability to implement our business plans. Even though we remain “well-capitalized” based on our regulatory capital ratios, our regulators have the authority to restrict our operations to those consistent with adequately capitalized institutions and to require higher than normal capital levels to address current market, economic, loan portfolio and other risks. We may also be required to reduce our levels of construction and land development loans and classified or
nonperforming assets within specified time frames. These time frames might not necessarily result in maximizing the price which might otherwise be received for the underlying properties. In addition, if such restrictions were also imposed upon other institutions which operate in our market area, multiple institutions disposing of properties at the same time could further diminish the potential proceeds received from the sale of these properties. If any of these or similar additional restrictions are placed on
us, it would limit the resources currently available to us as a well-capitalized institution.
The Corporation
The Corporation is a bank holding company. The Bank Holding Company Act of 1956 (BHCA), as amended, subjects the Corporation and its subsidiaries to supervision and examination by the Federal Reserve Bank (FRB). The Corporation files quarterly and annual reports of operations with the FRB.
Bank Holding Company Regulation. In general, the BHCA limits bank holding company business to owning or controlling banks and engaging in other banking-related activities. Bank holding companies must obtain the FRB's approval before they: (1) acquire direct or indirect ownership
or control of any voting shares of any bank that results in total ownership or control, directly or indirectly, of more than five percent of the voting shares of such bank; (2) merge or consolidate with another bank holding company; or (3) acquire substantially all of the assets of any additional banks. Subject to certain state laws, such as age and contingency restrictions, a bank holding company that is adequately capitalized and adequately managed may acquire the assets of both in-state and out-of-state banks.
With certain exceptions, the BHCA prohibits bank holding companies from acquiring direct or indirect ownership or control of voting shares in any company that is not a bank or a bank holding company unless the FRB determines that the activities of such company are incidental or closely related to the business of banking. If a bank holding company is well-capitalized and meets certain criteria specified by the FRB, it may engage de novo in certain permissible non-banking activities without prior FRB approval.
The Change in the Bank Control Act of 1978, as amended, requires a person (or group of persons acting in concert) acquiring "control" of a bank holding company to provide the FRB with 60 days prior written notice of the proposed acquisition. Following receipt of this notice, the FRB has 60 days within which to issue a notice disapproving
the proposed acquisition, but the FRB may extend this time period for up to another 30 days. An acquisition may be completed before expiration of the disapproval period if the FRB issues written notice of its intent not to disapprove the transaction. In addition, any "company" must obtain the FRB's approval before acquiring 25% (5% if the "company" is a bank holding company) or more of the outstanding shares or otherwise obtaining control over a bank holding company.
Transactions with Affiliates. The Corporation and its subsidiaries are deemed affiliates within the meaning of the Federal Reserve Act, and transactions between affiliates are subject to certain restrictions. Accordingly, the Corporation and its subsidiaries must comply with
Sections 23A and 23B of the Federal Reserve Act (Reg W). Generally, Sections 23A and 23B (1) limit the extent to which a financial institution or its subsidiaries may engage in "covered transactions" with an affiliate, as defined, to an amount equal to 10% of such institution's capital and surplus and an aggregate limit on all such transactions with all affiliates to an amount equal to 20% of such capital and surplus, and (2) require all transactions with an affiliate, whether or not "covered transactions," to
be on terms substantially the same, or at least as favorable to the institution or subsidiary, as those provided to a non-affiliate. The term "covered transaction" includes the making of loans, purchase of assets, issuance of a guarantee and other similar types of transactions.
Tying Arrangements. The Corporation and its subsidiaries are prohibited from engaging in certain tying arrangements in connection with any extension of credit, sale or lease of property or furnishing of services. For example, with certain exceptions, neither the Corporation nor its
subsidiaries may condition an extension of credit on either a requirement that the customer obtain additional services provided by it or an agreement by the customer to refrain from obtaining other services from a competitor.
State Law Restrictions. As a Washington corporation, the Corporation is subject to certain limitations and restrictions as provided under applicable Washington corporate laws.
8
Securities Registration and Reporting. The Corporation’s common stock is registered as a class with the Securities Exchange Commission (SEC) under the Securities Exchange Act of 1934, as amended, and thus the Corporation is subject to the periodic reporting and proxy
solicitation requirements and the insider-trading restrictions of that Act. The periodic reports, proxy statement, and other information filed by the Corporation under that Act, can be inspected and copied at, or obtained from, the Washington, D.C. office of the SEC. In addition, the securities issued by the Corporation are subject to the registration requirements of the Securities Act of 1933, as amended, and applicable state securities laws unless exemptions are available.
The Corporation is listed on the NASDAQ/Global Select Market. As such, it is subject to the listing and reporting requirements of NASDAQ. Failure to meet these requirements could lead to a delisting of the Corporation’s stock.
Disclosure Controls and Procedures. The Sarbanes-Oxley Act of 2002 and related rulemaking by the SEC, which affect corporate disclosure and financial reporting reform, generally require public companies to focus on their disclosure controls and procedures. As a result, public
companies such as the Corporation now must have disclosure controls and procedures in place and make certain disclosures about them in their periodic SEC reports (i.e., Forms 10-K and 10-Q) and their chief executive and principal financial officers must certify in these filings that they are responsible for developing and evaluating disclosure controls and procedures and disclose the results of an evaluation conducted by them within the 90-day period preceding
the filing of the relevant report, among other things.
Dividends. The principal source of the Corporation's revenue is dividends received from Cascade Bank. The payment of dividends is subject to government regulation, in that regulatory authorities may prohibit banks and bank holding companies from paying dividends that would constitute
an unsafe or unsound banking practice. In addition, a bank may not pay cash dividends if that payment could reduce the amount of its capital below that necessary to meet minimum applicable regulatory capital requirements. While the Corporation is well capitalized by regulatory standards, in June 2009, the Corporation announced that it would temporarily suspend its regular quarterly cash dividend on common stock to preserve capital. In September 2009, the Bank received notice from the FDIC that it would be required
to obtain a non-objection from the FDIC and the State of Washington Department of Financial Institutions before paying any cash dividend or any other form of payment or distribution representing a reduction in the Bank’s capital.
The FRB has issued a policy statement on the payment of cash dividends by bank holding companies which expresses the FRB’s view that a bank holding company should pay cash dividends only to the extent that the Corporation’s net income for the past year is sufficient to cover both the cash dividend and a rate of retention consistent
with the Corporation’s capital needs. The FRB also indicated that it would be inappropriate for a company experiencing serious financial problems to borrow to pay dividends.
Capital Requirements. The FRB has established capital adequacy guidelines for bank holding companies that generally parallel the capital requirements the FDIC has for the Bank. The FRB regulations provided that capital standards will be applied on a consolidated basis in the case of
a bank holding company with more than $150 million in total consolidated assets. The Corporation’s total risk-based capital must equal 8% of risk-weighted assets and 4% must consist of Tier 1 capital.
Stock Repurchases. Bank holding companies, except for certain “well-capitalized” and highly rated companies, are required to give the FRB prior written notice of any purchase or redemption of its outstanding equity securities if the gross consideration for the purchase or
redemption is equal to or greater than 10% of consolidated net worth during the preceding twelve months. The FRB may disapprove any such purchase or redemption if it determines that the proposal would constitute an unsafe or unsound practice.
Capital Purchase Program Requirements. As an issuer of preferred stock to the U.S. Treasury under its Capital Purchase Program, which itself was a component of the Troubled Asset Relief Program, the Corporation agreed to certain terms and conditions. The issuance agreements established
limitations on executive pay, requirements that the Corporation’s incentive/bonus programs do not encourage senior executive officers to take unnecessary and excessive risk, and provides for a claw back of previously paid bonuses if such payments are found to be based on materially inaccurate financial statements. In addition, participation in the program required a modification of existing employment and/or change of control agreements with senior executive officers.
9
Cascade Bank
General. Applicable federal and state statutes and regulations governing a bank's operations relate, among other matters, to capital requirements, investments, loans, legal lending limits, mergers and consolidations, borrowings, issuance of securities, payment of dividends, establishment
of branches, and dealings with affiliated persons. The Federal Deposit Insurance Corporation (FDIC) has authority to prohibit banks under its supervision from engaging in what it considers to be unsafe or unsound practices in conducting their business. Cascade Bank is a state-charted commercial bank subject to extensive regulation and supervision by both the Washington Department of Financial Institutions (DFI) and the FDIC. The federal laws that apply to Cascade Bank regulate, among other things, the scope of
its business, its investments, the timing of the availability of deposited funds and the nature and amount of collateral for loans. The laws and regulations governing Cascade Bank generally have been promulgated to protect depositors and not to protect shareholders of such institutions or their holding companies.
CRA. The Community Reinvestment Act requires that, in connection with examinations of financial institutions within their jurisdiction, the FRB or the FDIC evaluates the record of the financial institutions in meeting the credit needs of their local communities, including low and moderate
income neighborhoods, consistent with the safe and sound operation of those banks. These factors are also considered in evaluating mergers, acquisitions, and applications to open a branch or facility. The four possible ratings of meeting community credit needs are outstanding, satisfactory, needs to improve and substantial noncompliance. Cascade Bank received a “satisfactory” CRA rating at the last examination.
Standards for Safety and Soundness. The federal banking regulatory agencies have prescribed, by regulation, standards for all insured depository institutions and depository institution holding companies relating to: (i) internal controls, information systems and internal
audit systems; (ii) loan documentation; (iii) credit underwriting; (iv) interest rate risk exposure; (v) asset growth; (vi) asset quality; (vii) earnings; and (viii) compensation, fees and benefits (Guidelines). The Guidelines set forth the safety and soundness standards that the federal banking agencies use to identify and address problems at insured depository institutions before capital becomes impaired. If a federal banking agency determines that a financial institution fails to meet
any standard prescribed by the Guidelines, the agency may require the bank to submit to the agency an acceptable plan to achieve compliance with the standard. Management is not aware of any conditions relating to these safety and soundness standards which would require the submission of a plan of compliance.
Insider Credit Transactions. Cascade Bank is also subject to certain restrictions imposed by the Federal Reserve Act on extensions of credit to executive officers, directors, principal shareholders, or any related interests of such persons. Extensions of credit (i) must be made on substantially
the same terms, including interest rates and collateral, and follow credit underwriting procedures that are not less stringent than those prevailing at the time for comparable transactions with persons not covered above and who are not employees; and (ii) must not involve more than the normal risk of repayment or present other unfavorable features. Cascade Bank is also subject to certain lending limits and restrictions on overdrafts to such persons. A violation of these restrictions may result in the assessment
of substantial civil monetary penalties on the affected bank or any officer, director, employee, agent, or other person participating in the conduct of the affairs of Cascade Bank, the imposition of a cease and desist order, and other regulatory sanctions.
FDICIA. Under the Federal Deposit Insurance Corporation Improvement Act of 1991 (the FDICIA), each federal banking agency has prescribed, by regulation, non-capital safety and soundness standards for institutions under its authority. These standards cover internal controls, information
systems, internal audit systems, loan documentation, credit underwriting, interest rate exposure, asset growth, compensation, fees and benefits, such other operational and managerial standards as the agency determines to be appropriate, and standards for asset quality, earnings and stock valuation. An institution that fails to meet these standards must develop a plan acceptable to the agency, specifying the steps that the institution will take to meet the standards. Failure to submit or implement such a plan
may subject the institution to regulatory sanctions. Management of the Corporation believes that Cascade Bank meets all such standards, and therefore, does not believe that these regulatory standards materially affect the Corporation's business operations currently.
Loans to One Borrower. Cascade Bank is subject to limitations on the aggregate amount of loans that it can make to any one borrower, including related entities. Applicable regulations generally limit loans to one borrower to 20% of unimpaired capital and surplus. At December
31, 2009, the Bank had no borrowers with balances in excess of the loans-to-one-borrower limit.
Interstate Banking and Branching. The Riegle-Neal Interstate Banking and Branching Efficiency Act of 1994 (the Interstate Act) permits nationwide interstate banking and branching under certain circumstances. This legislation generally authorizes interstate branching and relaxes federal
law restrictions on interstate banking. Currently, bank holding companies may purchase banks in any state, and states may not prohibit such purchases. Additionally, banks are permitted to merge with banks in other states as long as the home
10
Deposit Insurance. Effective until December 31, 2013, the limit on federal deposit insurance coverage provided by the FDIC was temporarily increased to $250,000 per depositor. On January 1, 2014, the limit will return to $100,000 per depositor and $250,000 for Individual Retirement
Accounts through the FDIC. In 2009, all insured banks were required to pay three years of deposit insurance premium assessments to the FDIC. The FDICIA included provisions to reform the Federal Deposit Insurance System, including the implementation of risk-based deposit insurance premiums. The FDICIA also permits the FDIC to make special assessments on insured depository institutions in amounts determined by the FDIC to be necessary to give it adequate assessment income to repay amounts borrowed from the U.S.
Treasury and other sources, or for any other purpose the FDIC deems necessary. The FDIC elected to make a special assessment in 2009. The FDIC has implemented a risk-based insurance premium system under which banks are assessed insurance premiums based on how much risk they present to the fund. Banks with higher levels of capital and a low degree of supervisory concern are assessed lower premiums than banks with lower levels of capital or a higher degree of supervisory concern.
Capital Adequacy. Federal bank regulatory agencies use capital adequacy guidelines in the examination and regulation of bank holding companies and banks. If capital falls below minimum guideline levels, the holding company or bank may be denied approval to acquire or establish
additional banks or non-bank businesses or to open new facilities. The FDIC and FRB use risk-based capital guidelines for banks and bank holding companies. These are designed to make such capital requirements more sensitive to differences in risk profiles among banks and bank holding companies, to account for off-balance sheet exposure and to minimize disincentives for holding liquid assets. Assets and off-balance sheet items are assigned to broad risk categories, each with appropriate weights. The resulting
capital ratios represent capital as a percentage of total risk-weighted assets and off-balance sheet items. The guidelines are minimums, and the FRB has noted that bank holding companies contemplating significant expansion programs should not allow expansion to diminish their capital ratios and should maintain ratios well in excess of the minimum. The current guidelines require all bank holding companies and federally-regulated banks to maintain a minimum risk-based total capital ratio equal to 8%, of which at
least 4% must be Tier I capital. Tier I capital for bank holding companies includes common shareholders' equity, certain qualifying perpetual preferred stock and minority interests in equity accounts of consolidated subsidiaries, less intangibles. At December 31, 2009, the Corporation had Tier 1 capital equal to $143.3 million or 8.62% of average total assets, which is $76.8 million above the minimum leverage requirement of 4% as in effect on that date.
The FDIC also employs a leverage ratio, which is Tier I capital as a percentage of total assets less intangibles, to be used as a supplement to risk-based guidelines. The principal objective of the leverage ratio is to constrain the maximum degree to which a bank holding company may leverage its equity capital base. The FDIC requires a minimum
leverage ratio of 4%. However, for all but the most highly rated bank holding companies and for bank holding companies seeking to expand, the FDIC expects an additional cushion of at least 1% to 2%.
FDICIA created a statutory framework of supervisory actions indexed to the capital level of the individual institution. Under regulations adopted by the FDIC, an institution is assigned to one of five capital categories depending on its total risk-based capital ratio, Tier I risk-based capital ratio, and leverage ratio, together with certain
subjective factors. Institutions which are deemed to be "undercapitalized" depending on the category to which they are assigned are subject to certain mandatory supervisory corrective actions. The Corporation does not believe that these regulations have any material effect on its operations currently.
Reference is made to Note 16 of the Notes to the Consolidated Financial Statements, which is listed in Item 15, for additional information concerning regulatory capital.
The FDIC risk-based requirement requires financial institutions to have total capital of at least 8% of risk-weighted assets. Total capital consists of Tier I capital and supplementary capital. Supplementary capital consists of certain permanent and maturing capital instruments that do not qualify as Tier I capital and general
valuation loan and lease loss allowances up to a maximum of 1.25% of risk-weighted assets. Supplementary capital may be used to satisfy the risk-based requirement only to the extent of Tier I capital.
11
In determining the amount of risk-weighted assets, all assets, including certain off-balance sheet items, are multiplied by a risk weight, ranging from 0% to 100%, based on the risk inherent in the type of asset. For example, prudently underwritten permanent one-to-four family first lien mortgage loans not more than 90 days delinquent
and having a loan-to-value ratio of not more than 80% at origination, unless insured to such ratio by an insurer approved by FNMA or FHLMC, have been assigned a risk weight of 50%.
On December 31, 2009, the Bank had total risk-based capital of approximately $153.8 million, including $138.2 million in Tier I capital and $15.6 million in qualifying supplementary capital (the allowance for loan losses), and risk-weighted assets of $1.24 billion, or total capital of 12.40% of risk-weighted assets. This amount was $54.6
million above the 8% requirement in effect on that date.
FDIC capital requirements are designated as the minimum acceptable standards for banks whose overall financial condition is fundamentally sound. The FDIC regulations state that if the FDIC determines that conditions so warrant, it may impose a greater capital standard on a particular institution.
Management believes that the Bank will continue to meet its minimum capital requirements in the foreseeable future. However, if circumstances were to materially and adversely impact the future earnings of the Bank, the ability of the Bank to meet its capital requirements could be impaired.
Prompt Corrective Action. Federal statutes establish a supervisory framework based on five capital categories: well capitalized, adequately capitalized, undercapitalized, significantly undercapitalized, and critically undercapitalized. An institution’s category depends upon where
its capital levels are in relation to relevant capital measures. In order to be adequately capitalized, an institution must have a total risk-based capital ratio of not less than 8%, a Tier 1 risk-based capital of not less than 4%, and a leverage ratio of not less than 4%. Any institution which fails to meet these levels will be considered undercapitalized.
Undercapitalized institutions are subject to certain prompt corrective action requirements, regulatory controls and restrictions, which become more extensive as an institution becomes more severely undercapitalized. Failure by an institution to comply with applicable capital requirements will result in restrictions on its activities
and lead to enforcement actions, including the issuance of a capital directive to ensure the maintenance of adequate capital levels. Banking regulators will take prompt corrective action with respect to depository institutions that do not meet minimum capital requirements.
At December 31, 2009, Cascade was a “well-capitalized” institution under the prompt corrective action regulations of the FDIC and the Federal Reserve Board.
Taxation
Federal Taxation
The Corporation reports its income on a fiscal year basis using the accrual method of accounting and is subject to federal income taxation in the same manner as other corporations with some exceptions, including particularly Cascade’s reserve for bad debts as discussed below. In 2001, the Corporation’s fiscal year was changed
to the calendar year. The following discussion of tax matters is intended only as a summary and does not purport to be a comprehensive description of the tax rules applicable to the Bank or the Corporation.
Tax Bad Debt Reserves
The reserve method of accounting for bad debt reserves was repealed for tax years beginning after December 31, 1995. As a result, the Bank is no longer able to calculate its deduction for bad debts using the percentage-of-taxable-income method. Instead, Cascade is required to compute its deduction based on specific charge-offs during the
taxable year.
Distributions
To the extent that the Bank makes “non-dividend distributions” to the Corporation that are considered as made (i) from the reserve for losses as of June 30, 1988, or (ii) from the supplemental reserve for losses on loans (Excess Distributions), then an amount based on the amount distributed will be included in Cascade’s
taxable income. Non-dividend distributions include distributions in excess of the Bank’s current and accumulated earnings and profits, distributions in redemption of stock, and distributions in partial or complete
12
Dividends-Received Deduction and Other Matters
The Corporation may exclude from its income 100% of dividends received from the Bank as a member of the same affiliated group of corporations. The corporate dividends-received deduction is generally 70% in the case of dividends received from unaffiliated corporations with which the Corporation and the Bank will not file a consolidated tax
return, except that if the Corporation or the Bank owns more than 20% of the stock of a corporation distributing a dividend, then 80% of any dividends received may be deducted.
Washington Tax
The Corporation is subject to a business and occupation tax which is imposed under Washington law at the rate of 1.5% of gross receipts; however, interest received on loans secured by mortgages or deeds of trust on residential properties and interest on obligations issued or guaranteed by the United States are not presently subject to the
tax.
Available Information
The Corporation’s annual report on Form 10-K, quarterly reports on Form 10-Q, current reports on Form 8-K, and all amendments to such reports filed pursuant to Section 13(a) or 15(d) of the Securities Exchange Act of 1934, are available free of charge on or through our website located at www.cascadebank.com as
soon as reasonably practicable after filing with the United States Securities and Exchange Commission. In addition, the 2009 Proxy Statement and Annual Report are available at http://bnymellon.mobular.net/bnymellon/CASB. These reports are also available to shareholders at no charge, upon written request to the Secretary of Cascade Financial Corporation at 2828 Colby Avenue, Everett, Washington 98201.
These documents are generally posted on the Bank’s website within 24 hours after the Corporation files these documents electronically with the Securities and Exchange Commission. The Corporation is also willing to provide electronic or paper copies of its filings to its shareholders upon reasonable request.
Additionally, the Board has adopted Standards of Conduct for employees, officers and directors, which include “code of ethics” as defined by Item 406 of the Regulation S-K. These Standards of Conduct apply to members of the Board of Directors and all of the Company’s employees, including the Company’s Principal Executive
Officer, Principal Financial Officer and Chief Accounting Officer. The Company will provide a copy of the Standards of Conduct to shareholders upon request.
Item 1A. Risk Factors
In the course of conducting our business operations, the Corporation and the Bank are exposed to a variety of risks that are inherent to the financial services industry. The following discusses some of the key inherent risk factors that could affect our business and operations as well as other risk factors, which are particularly relevant
to us in the current period of significant economic and market disruptions. Other factors, besides those discussed below or elsewhere in this report or other reports filed with or furnished to the SEC, also could adversely affect our business and operations, and these risk factors should not be considered a complete list of potential risks that may affect the Corporation and the Bank. These risk factors also serve to describe factors which may cause our results to differ materially from those described in forward-looking
statements included herein or in other documents or statements that make reference to this report. See “Forward-Looking Statements.”
13
Current levels of market volatility are unprecedented.
The capital and credit markets have been experiencing volatility and disruption for an extended period. Since 2008, the volatility and disruption has reached unprecedented levels. The markets have produced downward pressure on stock prices and credit availability for certain issuers without regard to those issuers’ underlying financial
strength. If current levels of market disruption and volatility continue or worsen, there can be no assurance that we will not experience an adverse effect, which may be material, on our ability to access capital and on our business, financial condition and results of operations.
Difficult market conditions have adversely affected and may continue to adversely impact our financial condition and results of operations.
Economic conditions in the state of Washington and the United States deteriorated significantly during the second half of 2008 and further eroded in 2009. Dramatic declines in the housing market, with falling home prices and increasing foreclosures, unemployment and underemployment, and more recently, increased vacancy rates and reduced rents
for offices and other commercial real estate, have negatively impacted the economy in general and the banking industry in particular. The resulting economic pressure on businesses and consumers and lack of confidence in the financial markets has and is expected to continue to adversely affect our business, financial condition, results of operations, liquidity and access to capital.
Many lending institutions, including us, have experienced substantial declines in the performance of their loans, including construction and land loans, multifamily loans, commercial loans and consumer loans. In addition, the values of real estate collateral supporting many construction and land, commercial and multifamily and other commercial
loans and home mortgages have declined and may continue to decline. These conditions may have a material adverse effect on our financial condition and results of operations. In addition, as a result of the foregoing factors, there is a potential for new federal or state laws and regulations regarding lending and funding practices and liquidity standards, and bank regulatory agencies are expected to be very aggressive in responding to concerns and trends identified in examinations, including the expected issuance
of formal enforcement orders. Negative developments in the financial industry and the impact of new legislation in response to those developments could restrict our business operations, including our ability to originate or sell loans, and adversely impact our results of operations and financial condition.
Recent legislative and regulatory initiatives to address difficult market and economic conditions may not stabilize the U.S. banking system.
On October 3, 2008, President Bush signed into law the Emergency Economic Stabilization Act of 2008 (EESA) in response to the crisis in the financial sector. The U.S. Department of the Treasury and banking regulators have and continue to implement a number of programs under this legislation to address capital and liquidity issues in the banking
system. On February 17, 2009, President Obama signed into law the American Recovery and Reinvestment Act (ARRA) which, among other things, amended the executive compensation provisions of EESA. There can be no assurance, however, as to the actual impact that the EESA will have on the financial markets, including volatility and limited credit availability currently being experienced. The failure of the EESA and other regulations and legislation to help stabilize the financial markets and a continuation or worsening
of current financial market conditions could materially and adversely affect Cascade’s business, financial condition, results of operations, access to credit or the value of Cascade’s securities.
Our loan portfolio mix, which has a concentration of loans secured by real estate, could result in increased credit risk in an economic recession. Continued deterioration in the real estate market would lead to additional losses, which could have a material adverse effect on our business, financial condition
and results of operations.
Our loan portfolio is concentrated in construction, commercial real estate and business loans. These types of loans generally are viewed as having more risk of default than residential real estate loans or certain other types of loans or investments. In fact, the FDIC has issued pronouncements alerting banks of its concern about heavy loan
concentrations. Because our loan portfolio contains a significant number of construction, business and commercial real estate loans, the deterioration of these loans may cause a significant increase in our nonperforming loans. An increase in nonperforming loans could result in a loss of earnings from these loans, an increase in the provision for loan losses, or an increase in loan charge-offs, which could have an adverse impact on our results of operations and financial condition.
14
A further downturn in the economies or real estate values in the markets we serve could have a material adverse effect on both borrowers’ ability to repay their loans and the value of the real property securing such loans. Our ability to recover on defaulted loans would then be diminished, and we would be more likely to suffer losses
on defaulted loans.
Nonperforming assets take significant time to resolve and adversely affect our results of operations and financial condition.
Our nonperforming assets adversely affect our net income in various ways. Until economic and market conditions improve, we expect to continue to incur additional losses relating to an increase in nonperforming loans. We do not record interest income on non-accrual loans, thereby adversely affecting our income, and increasing loan administration
costs. When we receive collateral through foreclosures and similar proceedings, we are required to mark the related loan to the then fair market value of the collateral, which may result in a loss. An increase in the level of nonperforming assets also increases our risk profile and may impact the capital levels our regulators believe is appropriate in light of such risks. We utilize various techniques such as loan sales, workouts, and restructurings to manage our problem assets. Decreases in the value of these
problem assets, the underlying collateral, or in the borrowers’ performance or financial condition, could adversely affect our business, results of operations and financial condition. In addition, the resolution of nonperforming assets requires significant commitments of time from management and staff, which can be detrimental to performance of their other responsibilities. There can be no assurance that we will not experience further increases in nonperforming loans in the future.
If our allowance for loan losses is not sufficient to cover actual loan losses or if we are required to increase our provision for loan losses, our results of operations and financial condition could be materially adversely affected.
When we loan money, commit to loan money or enter into a letter of credit or other contract with a borrower we incur the risk of losses if our borrowers do not repay their loans or fail to perform according to the terms of their contracts. We estimate and establish reserves for credit risks and potential credit losses inherent in our credit
exposure (including unfunded credit commitments). This process, which is critical to our financial results and condition, requires difficult, subjective and complex judgments, including forecasts of economic conditions and how these economic predictions might impair the ability of our borrowers to repay their loans. As is the case with any such assessments, there is always the chance that we will fail to identify the proper factors or that we will fail to accurately estimate the impacts of factors that we identify.
Our ability to assess the creditworthiness of our customers may be impaired if the models and assumptions we use become less predictive of future behaviors, valuations, or estimates.
We have been experiencing increasing loan delinquencies and credit losses and we increased our provision for loan losses in 2009, which adversely affected our results of operations. If current adverse conditions in the housing and real estate markets and the economy continue, we expect that we will continue to experience higher than normal
delinquencies and credit losses. Moreover, given current economic conditions, we expect we could experience further increases in delinquencies and credit losses. As a result, we may be required to make further increases in our provision for loan losses and to charge-off additional loans in the future, which could adversely affect our financial condition and results of operations.
In addition, bank regulators periodically review our allowance for loan losses and may require us to increase our provision for loan losses or recognize further loan charge-offs. Any increase in our allowance for loan losses or loan charge-offs as required by these regulatory authorities may have a material adverse effect on our financial
condition and results of operations.
Restrictions imposed by regulatory actions could have an adverse effect on us and failure to comply with these regulatory actions could result in further regulatory action or restrictions.
The businesses and operations of the Corporation and our subsidiary, Cascade Bank, are currently subject to regulatory actions, including the FDIC Memorandum, which, for example, generally prohibits us from paying dividends, repurchasing stock, retaining new directors or senior managers or changing the duties of senior management, paying
management or consulting fees or other funds to the Corporation, and extending additional credit with respect to nonperforming and adversely classified loans without prior approval, which management believes, complicates the workout of troubled loans. These and other regulatory actions are described in more detail in Item 1of this report captioned "Regulatory Actions." The FDIC identified deficiencies in the management and supervision of Cascade Bank that primarily relate to loan underwriting, procedures and
monitoring, excessive
15
Our profitability and the value of shareholders’ investments may suffer because of rapid and unpredictable changes in the highly regulated environment in which we operate.
We are subject to extensive supervision by several governmental regulatory agencies at the federal and state levels in the financial services area. Recently enacted, proposed and future legislation and regulations have had, and will continue to have, or may have a significant impact on the financial services industry. These regulations, which
are generally intended to protect depositors and not stockholders, and the interpretation and application of them by federal and state regulators, are beyond our control, may change rapidly and unpredictably and can be expected to influence earnings and growth. For example, the FDIC and the Federal Reserve recently issued joint Guidance on Concentrations in Commercial Real Estate Lending, Sound Risk Management Practices that sets forth supervisory criteria to assist bank examiners in identifying banks with potentially
significant commercial real estate loan concentrations that may warrant greater supervisory scrutiny. The Guidance applies to Cascade Bank, based on our current loan portfolio, and our management expects that our business and operations will be subject to enhanced regulatory review for the foreseeable future. Regulatory authorities have extensive discretion in their supervisory and enforcement activities, including the imposition of restrictions on operations, the classification of assets and determination of
the level of allowance for loan losses. Our success depends on our continued ability to maintain compliance with these regulations. Such additional regulation and supervision may increase our costs and limit our ability to pursue business opportunities.
Market and other constraints on our construction and development loan origination volume are expected to lead to decreases in our interest and fee income that are not expected to be fully offset by reductions in our noninterest expenses.
Due to existing conditions in housing markets in the areas where we operate, the recession and other factors, we project construction and development loan originations to be materially constrained in 2010 and beyond. Additionally, management’s revised business plan will de-emphasize the origination of construction loans. This will lower
interest income and fees generated from this part of our business. Unless this revenue decline is offset by other areas of operations, our total revenues may decline relative to our total noninterest expense. We expect that it will be difficult to find new revenue sources in the near term to completely offset expected declines in our interest income. In that regard, the adverse economic conditions that began in 2007 and that have continued in 2010 have significantly reduced our origination of all new loans, and
management cannot assure you that our total loans or assets will increase or not decline in 2010.
The Corporation’s issuance of securities to the United States Treasury may limit our ability to return capital to shareholders and is dilutive to the holders of our common stock.
In connection with our sale of Series A Preferred Stock to the U.S. Treasury, the Corporation also issued to the Treasury a warrant to purchase approximately 863,442 shares of our common stock. The terms of the transaction with the Treasury limits our ability to pay dividends and repurchase our shares. Until November 21, 2011 or until the
Treasury no longer holds any shares of the Series A Preferred Stock, the Corporation will not be able to increase dividends above current levels ($0.045 per share of common stock on a quarterly basis) nor repurchase any of our shares without Treasury approval, with limited exceptions, most significantly purchases in connection with benefit plans. In addition, we will not be able to pay any dividends at all on our common stock unless we are current on our dividend payments on the Series A Preferred Stock. These
restrictions, as well as the dilutive impact of the warrant, may have a negative effect on the market price of our common stock.
Unless the Corporation is able to redeem the Series A Preferred Stock prior to February 15, 2014, the cost of this capital will increase substantially on that date, from 5.00% (approximately $1.95 million annually) to 9.00% (approximately $3.16 million annually). Depending on our financial condition at the time, this increase in dividends
on the Series A Preferred Stock could have a negative effect on our liquidity.
16
Future offerings of debt, which would be senior to our common stock upon liquidation, and/or preferred equity securities which may be senior to our common stock for purposes of dividend distributions or upon liquidation, may adversely affect the market price of our common stock.
In the future, we may attempt to increase our capital resources or, if our or our banking subsidiary’s capital ratios fall below the required minimums, we or our banking subsidiary could be forced to raise additional capital by making additional offerings of debt, preferred equity securities, including medium-term notes, trust preferred
securities, senior or subordinated notes and preferred stock or common stock. Upon liquidation, holders of our debt securities and shares of preferred stock and lenders with respect to other borrowings will receive distributions of our available assets prior to the holders of our common stock. Additional equity offerings may dilute the holdings of our existing stockholders or reduce the market price of our common stock, or both. Holders of our common stock are not entitled to preemptive rights or other protections
against dilution.
Our ability to service our debt, pay dividends and otherwise pay our obligations as they come due is substantially dependent on capital distributions from Cascade Bank, and these distributions are subject to regulatory limits and other restrictions.
A substantial source of our income from which we service our debt, pay our obligations and from which we can pay dividends is the receipt of dividends from Cascade Bank. The availability of dividends from Cascade Bank is limited by various statutes and regulations, and under the FDIC Memorandum the Bank is currently prohibited from paying
cash dividends without the prior consent of the FDIC and the DFI. It is possible, depending upon the financial condition of Cascade Bank, and other factors, that the applicable regulatory authorities could assert that payment of dividends or other payments is an unsafe or unsound practice. If Cascade Bank is unable to pay dividends to us, we may not be able to service our debt, pay our obligations or pay dividends on our common stock. The inability to receive dividends from Cascade Bank would adversely affect
our business, financial condition, results of operations and prospects. Additional information regarding dividend restrictions is included in Item 1 of this report captioned “Regulation.”
During the fourth quarter, previously disclosed FDIC restrictions prohibited dividend payments from the Bank to the holding company, which in turn led us to defer the payment of interest on our Junior Subordinated Debentures and dividends on our preferred stock. We continue to accrue these payments and expect to resume cumulative payments
on these securities upon FDIC approval.
We may elect or be compelled to seek additional capital in the future, but that capital may not be available when it is needed.
We are required by federal and state regulatory authorities to maintain adequate levels of capital to support our operations. In addition, we may elect to raise additional capital to support our business or to finance acquisitions, if any, or we may otherwise elect to raise additional capital. In that regard, a number of financial institutions
have recently raised considerable amounts of capital as a result of a deterioration in their results of operations and financial condition arising from the turmoil in the mortgage loan market, deteriorating economic conditions, declines in real estate values and other factors. Should we be required by regulatory authorities to raise additional capital, we may seek to do so through the issuance of, among other things, our common stock or preferred stock.
Our ability to raise additional capital, if needed, will depend on conditions in the capital markets, economic conditions and a number of other factors, many of which are outside our control. Accordingly, we cannot assure you of our ability to raise additional capital if needed or on terms acceptable to us. If we cannot raise additional capital
when needed, it may have a material adverse effect on our financial condition, results of operations and prospects.
Any equity or debt financing, if available at all, may not be available on terms that are favorable to us. In the case of equity financings, dilution to our existing shareholders could result and, in any case, securities issued may have rights, preferences and privileges that are senior to those of our current shareholders. Debt financing
could also negatively affect future earnings due to interest charges.
Shareholders’ interests may be diluted by future equity offerings or transactions.
In the future, we may attempt to increase our capital resources or, if the Corporation’s or Cascade Bank’s capital ratios fall below the required minimums, we could be forced to raise additional capital by making additional offerings of common stock, debt or preferred equity securities, including medium-term notes, trust preferred
securities, senior or subordinated
17
You may not receive any dividends on Cascade common stock.
In June, 2009, in order to preserve capital we announced that we had suspended payment of cash dividends on our common stock and during the fourth quarter we exercised our right to defer regularly scheduled interest payments on our outstanding junior subordinated debentures related to trust preferred securities. We may not pay any cash dividends
on our common stock until we are current on interest payments on our outstanding junior subordinated debentures. In addition, cash dividends from the Bank are the primary source of funds for payment of cash dividends to our shareholders, and under the FDIC Memorandum the Bank is currently prohibited from paying cash dividends without the prior consent of the FDIC and the DFI. The terms of the Series A Preferred Stock limits our payment of dividends on common stock, as described above. This could adversely affect
the market price of our common stock.
Liquidity risk could impair our ability to fund operations and jeopardize our financial condition.
Liquidity is essential to our business. An inability to raise funds through deposits, borrowings, the sale of loans and other sources could have a substantial negative effect on our liquidity. Our access to funding sources in amounts adequate to finance our activities or the terms of which are acceptable to us could be impaired by factors
that affect us specifically or the financial services industry or economy in general. Factors that could detrimentally impact our access to liquidity sources include a decrease in the level of our business activity as a result of a downturn in the Western Washington market in which our loans are concentrated and adverse regulatory action against us. Our ability to borrow could also be impaired by factors that are not specific to us, such as a disruption in the financial markets or negative views and expectations
about the prospects for the financial services industry in light of the recent turmoil faced by banking organizations and the continued deterioration in credit markets.
Fluctuations in interest rates could reduce our profitability and affect the value of our assets.
Like other financial institutions, we are subject to interest rate risk, which is the primary market risk affecting our financial performance. Our primary source of income is net interest income, which is the difference between interest earned on loans and investments and the interest paid on deposits and borrowings. We expect that we will
periodically experience imbalances in the interest rate sensitivities of our assets and liabilities and the relationships of various interest rates to each other. Over any defined period of time, our interest-earning assets may be more sensitive to changes in market interest rates than our interest-bearing liabilities, or vice versa. In addition, the individual market interest rates underlying our loan and deposit products (e.g., prime) may not change to the same degree over a given time period. Loan volume and
quality and deposit volume and mix can be affected by market interest rates. Changes in levels of market interest rates could materially and adversely affect our net interest spread, asset quality, origination volume and overall profitability.
We principally manage interest rate risk by managing our volume and mix of our earning assets and funding liabilities. In a changing interest rate environment, we may not be able to manage this risk effectively. If we are unable to manage interest rate risk effectively, our business, financial condition and results of operations could be
materially harmed.
Changes in the level of interest rates also may negatively affect our ability to originate real estate loans, the value of our assets and our ability to realize gains from the sale of our assets, all of which ultimately affect our earnings.
Interest rate volatility and credit risk adjusted rate spreads may impact our financial assets and liabilities measured at fair value, particularly the fair value of our junior subordinated debentures.
The widening of market interest rate spreads on junior subordinated debentures to levels above the contractual spreads on our outstanding debentures combined with recent reductions in three month LIBOR rates has contributed to positive fair value adjustments in our junior subordinated debentures carried at fair value over the last three years.
Tightening of these spreads may result in recognizing fair value adjustments that negatively impact our earnings in the future.
18
Our investment portfolio includes securities that are sensitive to interest rates and variations in interest rates may adversely impact our profitability.
Our securities portfolio includes securities, which are insured or guaranteed by U.S. Government agencies or government-sponsored enterprises, and other securities, which are sensitive to interest rate fluctuations. The unrealized gains or losses in our available-for-sale portfolio are reported as a separate component of stockholders’
equity until realized upon sale. As a result, future interest rate fluctuations may impact stockholders’ equity, causing material fluctuations from quarter to quarter. Failure to hold our securities until maturity or until market conditions are favorable for a sale could adversely affect our financial condition, profitability and prospects.
The value of the securities in our investment securities portfolio may be negatively affected by continued disruptions in the securities markets. The market for some of the investment securities held in our portfolio has become extremely volatile over the past two years. Volatile market conditions or deteriorating financial performance of
the issuer or obligor may detrimentally affect the value of these securities. There can be no assurance that the declines in market value associated with these disruptions will not result in other-than-temporary or permanent impairments of these assets, which would lead to accounting charges that could have a material adverse effect on our net income and capital levels.
Further increases in Federal Deposit Insurance Corporation (“FDIC”) insurance premiums or special assessments could adversely impact our earnings.
Recent insured institution failures, as well as deterioration in banking and economic conditions, have significantly increased FDIC loss provisions, resulting in a decline in the designated reserve ratio to historical lows. The FDIC expects a higher rate of insured institution failures in the next few years compared to recent years; thus,
the reserve ratio may continue to decline.
On May 22, 2009, the FDIC adopted a final rule levying a five basis point special assessment on each insured depository institution’s assets minus Tier 1 capital as of June 30, 2009. We recorded an expense of $740,000 for the quarter ended June 30, 2009, to reflect the special assessment. In addition, the FDIC increased the general
assessment rate and, therefore, our FDIC general insurance premium expense will increase compared to prior periods.
On November 12, 2009, the FDIC adopted regulations that require insured depository institutions to prepay on December 30, 2009 their estimated assessments for the fourth calendar quarter of 2009, and for all of 2010, 2011 and 2012. The new regulations base the assessment rate for the fourth calendar quarter of 2009 and for 2010 on each institution’s
total base assessment rate for the third quarter of 2009, modified to assume that the assessment rate in effect on September 30, 2009 had been in effect for the entire third quarter, and the assessment rate for 2011 and 2012 on the modified third quarter assessment base, adjusted quarterly for an estimated 5% annual growth rate in the assessment base through the end of 2012. Under the prepaid assessment rule, we were required to make a payment of $7.3 million to the FDIC on December 31, 2009, and to record the
payment as a prepaid expense, which will be amortized to expense over three years.
The FDIC has indicated that with the proceeds of the prepayment, additional special assessments were not necessary in 2009; however, the prepayment requirement does not necessarily preclude the FDIC from imposing a special assessment, from changing assessment rates or from revising the risk-based assessment system, pursuant to the existing
notice-and-comment rulemaking framework. Should the FDIC find it necessary to impose any further special assessments or further increase assessment rates, our FDIC general insurance premium expense will further increase compared to prior periods.
A potential proxy contest for the election of directors at our annual meeting could distract our management, divert our resources, and adversely impact our financial condition.
On March 2, 2010, Craig Skotdal, Arthur Skotdal, Andrew Skotdal, Skotdal Quality Investments, L.L.C., Skotdal Enterprises, Inc. and Arthur and Marianne Skotdal Revocable Living Trust (together, the “Skotdals”) and Dwayne Lane, Thomas Rainville, Christian Sievers, and Arnold Hofmann filed a Schedule 13D with the Securities and
Exchange Commission that attaches as an exhibit a letter dated February 23, 2010 from the Skotdals’ legal counsel to the Corporation’s Board of Directors. The letter requests that the Board of Directors nominate Craig Skotdal, Thomas Rainville, Christian Sievers, and Arnold Hofmann as the Corporation’s slate of director nominees for election at the 2010 annual stockholders meeting. The letter
19
Cascade’s Controls and Procedures May Fail or be Circumvented.
Management regularly reviews and updates Cascade’s internal controls, disclosure controls and procedures, and corporate governance policies and procedures. Any system of controls, however well designed and operated, is based in part on certain assumptions and can provide only reasonable, not absolute, assurances that the objectives
of the system are met. Any failure or circumvention of Cascade’s controls and procedures or failure to comply with regulations related to controls and procedures could have a material adverse effect on Cascade’s financial condition and results of operations.
Cascade Continually Encounters Technological Change.
The financial services industry is continually undergoing rapid technological change with frequent introductions of new technology-driven products and services. The effective use of technology increases efficiency and enables financial institutions to better serve customers and to reduce costs. Cascade’s future success depends, in part,
upon its ability to address the needs of its customers by using technology to provide products and services that will satisfy customer demands, as well as to create additional efficiencies in Cascade’s operations. Many of Cascade’s competitors have substantially greater resources to invest in technological improvements. Cascade may not be able to effectively implement new technology-driven products and services or be successful in marketing these products and services to its customers. Failure to
successfully keep pace with technological change affecting the financial services industry could have a material adverse effect on Cascade’s financial condition and results of operations.
Our wholesale funding sources may prove insufficient to support an unexpected reduction in deposits.
We must maintain sufficient funds to respond to the needs of depositors and borrowers. As a part of our liquidity management, we utilize and maintain a number of funding sources in addition to core deposit growth and repayments and maturities of loans and investments. We may become more dependent on these sources, which include advances from
the Federal Home Loan Bank of Seattle and the Federal Reserve Bank of San Francisco, and securities sold under agreements to repurchase. Our financial flexibility will be severely constrained if we are unable to maintain our access to funding or if adequate financing is not available to accommodate future growth at acceptable interest rates. If we are required to rely more heavily on more expensive funding sources to support future growth, our revenues may not increase proportionately to cover our costs, and
our profitability would be adversely affected. Our use of brokered deposits and other non-core deposits is restricted by the FDIC Memorandum. See Item 1of this report captioned “Regulatory Actions.”
We may experience future goodwill impairment.
The Corporation’s common stock has been trading at a price below its book value, including goodwill and other intangible assets. The valuation of goodwill is determined using discounted cash flows of forecasted earnings, estimated sales price based on recent observable market transactions and market capitalization based on current stock
price. If impairment was deemed to exist, a write down of the asset would occur with a charge to earnings. In the second quarter of 2009, the Corporation recorded a goodwill impairment charge of $11.7 million based upon an impairment analysis. The non-cash charge represented the write-off of a portion of the goodwill recorded from a prior bank acquisition. The goodwill charge does not impact liquidity, operations, tangible capital or the Corporation’s regulatory capital ratios.
A deferred tax asset position comprises $5.0 million of our total assets at December 31, 2009, and we are required to assess the recoverability of this asset on an ongoing basis.
Deferred tax assets are evaluated on a quarterly basis to determine if they are expected to be recoverable in the future. Our evaluation considers positive and negative evidence to assess whether it is more likely than not that a portion of the asset will not be realized. The risk of a valuation allowance increases if continuing operating
losses are incurred. Future negative operating performance or other negative evidence may result in a valuation allowance being recorded against some, or all, of this amount. A valuation allowance on our deferred tax asset could have a material adverse impact on our results of operations.
20
Item 1B. Unresolved Staff Comments
None
Item 2. Properties
The Corporation owns nine full-service branch locations and leases 13 full-service locations. Owned offices range in size from 3,500 to 52,000 square feet and have a total net book value at December 31, 2009, including leasehold improvements, furniture and fixtures, of $14.5 million. The Corporation leases approximately 25% of its Marysville
office, and approximately 50% of its Issaquah office to non-affiliated parties. See Note 7 of the Notes to the Consolidated Financial Statements, which is listed in Item 15. The Corporation’s management believes that all facilities occupied by the Corporation are adequate for present requirements.
Item 3. Legal Proceedings
The Corporation is not engaged in any legal proceedings of a material nature at the present time. Periodically, there have been various claims and lawsuits involving the Corporation and the Bank, principally as a defendant, such as claims to enforce liens, condemnation proceedings on properties in which the Bank holds security interests,
claims involving the making and servicing of real property loans and other issues incident to the Corporation’s business. In the opinion of management and the Corporation’s legal counsel, no significant loss is expected from any of such pending claims or lawsuits.
PART II
Item 5. Market for Registrant’s Common Equity, Related Stockholder Matters and Issuer Purchases of Equity Securities
|
|
(a) |
Cascade Financial Corporation’s common stock is traded on the NASDAQ/Global Select Market under the symbol CASB. The table below indicates the high/low trading range of Cascade stock over the last eight quarters: |
|
Quarter Ended |
High |
Low |
||||||
|
March 31, 2008 |
$ | 14.36 | $ | 11.88 | ||||
|
June 30, 2008 |
12.18 | 6.51 | ||||||
|
September 30, 2008 |
9.62 | 5.62 | ||||||
|
December 31, 2008 |
7.98 | 4.89 | ||||||
|
March 31, 2009 |
$ | 5.13 | $ | 1.60 | ||||
|
June 30, 2009 |
4.35 | 2.15 | ||||||
|
September 30, 2009 |
2.30 | 1.60 | ||||||
|
December 31, 2009 |
2.75 | 1.54 | ||||||
|
(b) |
Cascade Financial Corporation has two classes of stock outstanding, which are preferred and common stock. On November 24, 2008, the Corporation completed its $39 million capital raise as a participant in the U.S. Treasury Department’s Capital Purchase Program (CPP). Under the terms of the transaction, the Corporation issued 38,970 shares of Series
A Fixed-Rate Cumulative Perpetual Preferred Stock, and a warrant to purchase 863,442 shares of the company’s common stock at an exercise price of $6.77 per share. The preferred shares issued under the CPP carry a 5% dividend for the first five years that increases to 9% thereafter. On November 5, 2009, the Board of Directors elected to defer the next dividend payments due on this preferred stock. Under the terms of the preferred stock, deferral of dividend payment is permitted without triggering an
event of default. |
|
(c) |
At December 31, 2009, there were 12,146,080 common shares outstanding, which were held by approximately 3,200 shareholders. |
|
(d) |
The Table below indicates the cash dividends paid on each share of its common stock for the periods noted: |
|
Quarter Ended |
Dividend Declared |
Record Date |
Payment Date | |||
|
December 2007 |
$ | 0.090 |
01/10/08 |
01/24/08 | ||
|
March 2008 |
0.090 |
04/09/08 |
04/23/08 | |||
|
June 2008 |
0.090 |
07/14/08 |
07/28/08 | |||
|
September 2008 |
0.045 |
10/15/08 |
10/29/08 | |||
21
|
Quarter Ended |
Dividend Declared |
Record Date |
Payment Date | |||
|
December 2008 |
$ | 0.045 |
01/06/09 |
01/20/09 | ||
|
March 2009 |
0.010 |
04/15/09 |
04/29/09 | |||
In June 2009, to preserve capital, the Corporation announced that it would temporarily suspend its regular quarterly cash dividend on common stock. Prior to that date, the Corporation had paid a quarterly dividend of $0.01 in April 2009 and $0.045 in January 2009. The Corporation entered into an agreement with the Treasury to participate
in the TARP Capital Purchase Program on November 21, 2008. The Corporation’s ability to increase its quarterly common dividend above $0.045 in future periods is restricted as long as the Corporation is a participant in the TARP Capital Purchase Program.
|
(e) |
In May 2008, the Corporation announced a new stock repurchase plan to purchase up to 300,000 shares of the Corporation’s stock. The Stock Repurchase Plan expired on May 31, 2009. There were no stock repurchases in the fourth quarter of 2009 or for the year ended December 31, 2009. Given the restrictions of the U.S. Treasury’s Capital Purchase
Program, which precludes share repurchases by participants, the program was not reauthorized. |
Shareholder Return Performance Graph
The following graph compares the Company's cumulative shareholder return on its common stock with the return on the NASDAQ Bank Index, the S&P Banking Index and the KBW Bank Index. Total return assumes (i) the reinvestment of all dividends and (ii) the value of the investment in the Company's common stock and each index was $100 at the
close of trading on December 31, 2004.
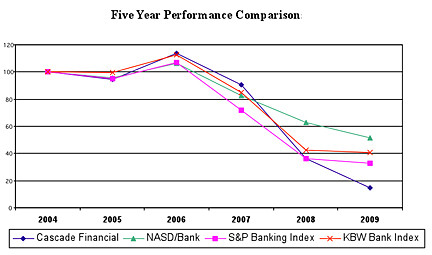
|
12/31/04 |
12/31/05 |
12/31/06 |
12/31/07 |
12/31/08 |
12/31/09 | |
|
Cascade Financial Corporation |
100.00 |
94.41 |
113.50 |
90.43 |
36.17 |
14.69 |
|
NASDAQ Bank Index |
100.00 |
95.67 |
106.20 |
82.76 |
62.96 |
51.31 |
|
S&P Banking Index |
100.00 |
95.24 |
106.93 |
72.13 |
36.11 |
32.91 |
|
KBW Bank Index |
100.00 |
99.74 |
112.88 |
85.10 |
42.57 |
41.02 |
22
Item 6. Selected Financial Data
|
AT DECEMBER 31, |
2009 |
2008 |
2007 |
2006 |
2005 |
|||||||||||||||
|
Assets |
$ | 1,704,628 | $ | 1,637,319 | $ | 1,417,588 | $ | 1,345,254 | $ | 1,211,784 | ||||||||||
|
Cash |
145,595 | 53,466 | 14,530 | 42,879 | 31,109 | |||||||||||||||
|
Securities |
275,902 | 256,192 | 232,018 | 239,422 | 247,638 | |||||||||||||||
|
Loans, net |
1,173,213 | 1,238,733 | 1,092,776 | 996,015 | 867,049 | |||||||||||||||
|
Deposits |
1,139,774 | 1,006,782 | 904,896 | 855,449 | 795,768 | |||||||||||||||
|
FHLB advances |
239,000 | 249,000 | 231,000 | 243,000 | 236,000 | |||||||||||||||
|
Other borrowings |
184,216 | 212,365 | 147,512 | 121,485 | 66,270 | |||||||||||||||
|
Preferred stock |
37,038 | 36,616 | - | - | - | |||||||||||||||
|
Total stockholders’ equity |
134,450 | 160,122 | 122,096 | 115,199 | 105,193 | |||||||||||||||
|
Nonperforming loans |
106,096 | 40,278 | 1,523 | 851 | 1,987 | |||||||||||||||
|
Real estate owned (REO) and other |
||||||||||||||||||||
|
repossessed assets |
18,842 | 1,446 | - | - | - | |||||||||||||||
|
FOR THE YEARS ENDED DECEMBER 31, |
2009 | 2008 | 2007 | 2006 | 2005 | |||||||||||||||
|
Interest income |
$ | 81,828 | $ | 92,571 | $ | 93,935 | $ | 82,658 | $ | 67,802 | ||||||||||
|
Interest expense |
38,540 | 46,686 | 50,540 | 43,268 | 31,276 | |||||||||||||||
|
Net interest income |
43,288 | 45,885 | 43,395 | 39,390 | 36,526 | |||||||||||||||
|
Provision for loan losses |
44,175 | 7,240 | 1,350 | 1,000 | 945 | |||||||||||||||
|
Net interest (loss) income after provision |
||||||||||||||||||||
|
for loan losses |
(887 | ) | 38,645 | 42,045 | 38,390 | 35,581 | ||||||||||||||
|
Other income |
16,696 | 8,887 | 7,566 | 6,026 | 6,333 | |||||||||||||||
|
Other expense |
34,329 | 28,543 | 26,682 | 24,586 | 22,606 | |||||||||||||||
|
Other-than-temporary impairment (OTTI) |
858 | 17,338 | - | - | - | |||||||||||||||
|
Goodwill impairment charge |
11,700 | - | - | - | - | |||||||||||||||
|
(Loss) income before provision for income taxes |
(31,078 | ) | 1,651 | 22,929 | 19,830 | 19,308 | ||||||||||||||
|
Net (loss) income |
(23,468 | ) | 2,090 | 15,546 | 13,355 | 13,046 | ||||||||||||||
|
Dividends on preferred stock |
1,943 | 216 | - | - | - | |||||||||||||||
|
Accretion of issuance discount on preferred stock |
422 | 35 | - | - | - | |||||||||||||||
|
Net (loss) income available for common stockholders |
(25,833 | ) | 1,839 | 15,546 | 13,355 | 13,046 | ||||||||||||||
|
(Loss) earnings per common share, basic (1) |
(2.13 | ) | 0.15 | 1.29 | 1.11 | 1.09 | ||||||||||||||
|
(Loss) earnings per common share, diluted (1) |
(2.13 | ) | 0.15 | 1.27 | 1.08 | 1.06 | ||||||||||||||
|
Book value per common share (1) |
8.02 | 10.23 | 10.15 | 9.53 | 8.76 | |||||||||||||||
|
FINANCIAL RATIOS |
||||||||||||||||||||
|
FOR THE YEARS ENDED DECEMBER 31, |
2009 | 2008 | 2007 | 2006 | 2005 | |||||||||||||||
|
Return on average assets |
(0.01 | ) | 0.00 | 0.01 | 0.01 | 0.01 | ||||||||||||||
|
Return on average equity |
(16.35 | ) | 1.62 | 13.23 | 12.24 | 13.13 | ||||||||||||||
|
Return on average common equity |
(24.21 | ) | 1.47 | 13.23 | 12.24 | 13.13 | ||||||||||||||
|
Return on average tangible common equity (2) |
(28.54 | ) | 1.83 | 16.88 | 16.08 | 17.82 | ||||||||||||||
|
Net interest margin |
2.96 | 3.20 | 3.34 | 3.26 | 3.35 | |||||||||||||||
|
Efficiency ratio |
78.17 | 83.77 | 52.36 | 54.14 | 52.75 | |||||||||||||||
|
Efficiency ratio (excluding OTTI and goodwill |
||||||||||||||||||||
|
impairment charges) (2) |
57.23 | 52.11 | 52.36 | 54.14 | 52.75 | |||||||||||||||
|
Dividend payout ratio |
- | 175.19 | 25.98 | 28.43 | 25.66 | |||||||||||||||
|
Average equity to average assets |
8.75 | 8.41 | 8.58 | 8.55 | 8.60 | |||||||||||||||
|
Average common equity to average assets |
6.51 | 8.17 | 8.58 | 8.55 | 8.60 | |||||||||||||||
|
Total risk-based capital to risk-weighted assets |
12.82 | 13.26 | 10.80 | 11.22 | 10.86 | |||||||||||||||
|
Tier 1 capital to average total assets |
8.62 | 10.30 | 8.90 | 8.99 | 8.23 | |||||||||||||||
(1) Per common share data is retroactively adjusted to reflect all stock splits and stock dividends. December 31, 2009 and December 31, 2008 are calculated using net income
available for common stockholders.
(2) These financial statements contain certain non-GAAP financial measures in addition to results presented in accordance with Generally Accepted Accounting Principles (GAAP). These
measures include average tangible common equity and efficiency ratio (excluding OTTI and goodwill impairment charges). These measures should not be construed as a substitute for GAAP measures; they should be read and used in conjunction with Cascade’s GAAP financial information. A reconciliation of the included non-GAAP financial measures to GAAP measures is included in these financial statements.
23
Item 7. Management’s Discussion and Analysis of Financial Condition and Results of Operations
The following discussion is provided for the consolidated operations of Cascade Financial Corporation (the Corporation) as of December 31, 2009 and 2008, and for the three years ending December 31, 2009, 2008 and 2007. The consolidated financial statements include the accounts of the Corporation and its wholly owned subsidiaries: Cascade
Bank (Cascade or the Bank) including Colby Real Estate LLC, which was formed to acquire, manage and sell REO properties. Cascade Capital Trust I, II, and III (the Trusts) were formed in 2000, 2004, and 2006, respectively, for the exclusive purpose of issuing trust preferred securities and using the proceeds from the issuance to acquire junior subordinated debentures issued by the Corporation. The Corporation used the proceeds from the issuance to fund
future asset growth. The Trusts are not consolidated by Cascade Financial Corporation.
The purpose of this discussion is to focus on significant factors concerning the Corporation’s financial condition and results of operations, and to provide a more comprehensive review of the Corporation’s operating results and financial condition than can be obtained from reading the consolidated financial statements alone. This
discussion should be read with the consolidated financial statements and the notes thereto.
FORWARD LOOKING STATEMENTS
This annual report on Form 10-K includes forward-looking statements, within the meaning of Section 27A of the Securities Act of 1933, as amended, and Section 21E of the Securities Exchange Act of 1934, as amended, and subject to the safe harbor created by the Private Securities Litigation Reform Act of 1995, that are subject to risks and
uncertainties that could cause actual results to differ materially from those projected. These statements may be identified by the use of forward-looking terminology such as “anticipate,” “believe,” “continue,” “could,” “estimate,” “expect,” “intend,” “may,” “might,” “plan,” “potential,” “predict,” “should” or “will” or the negative
thereof or other variations thereon or comparable terminology. We have based these forward-looking statements on our current expectations, assumptions, estimates and projections. While we believe these expectations, assumptions, estimates and projections are reasonable, such forward-looking statements are only predictions and involve known and unknown risks and uncertainties, many of which are beyond our control. These and other important factors, including those discussed below under the headings “Risk
Factors,” “Management’s Discussion and Analysis of Financial Condition and Results of Operations” and “Business,” may cause our actual results, performance or achievements to differ materially from any future results, performance or achievements expressed or implied by these forward-looking statements. Some of the key factors that could cause actual results to differ from our expectations are:
|
· |
management’s ability to effectively execute its business plan and strategy; |
|
· |
the credit risks of lending activities, including changes in the level and trend of loan delinquencies, collections and write-offs and changes in our allowance for loan losses and provision for loan losses that may be impacted by deterioration in the housing and commercial real estate markets; |
|
· |
changes in general economic conditions, either nationally or in our market areas; |
|
· |
the availability of and costs associated with sources of liquidity; |
|
· |
inflation, interest rates, market and monetary fluctuations; |
|
· |
legislative or regulatory changes or changes in accounting principles, policies or guidelines; |
|
· |
the possibility that we will be unable to comply with certain conditions imposed upon us in regulatory actions, which could result in the imposition of further restrictions on our operations, penalties or other regulatory actions; |
|
· |
the costs and effects of legal and regulatory developments, including the resolution of legal proceedings or regulatory or other governmental inquiries and the results of regulatory examinations or reviews; |
|
· |
our ability to attract and retain deposits; |
|
· |
further increases in premiums for deposit insurance; |
|
· |
the use of estimates in determining fair value of certain of our assets, which estimates may prove to be incorrect and result in significant declines in valuation; |
|
· |
the failure or security breach of computer systems on which we depend; |
|
· |
increased competitive pressures among financial services companies; |
|
· |
adverse changes in the securities markets; |
|
· |
technological changes; |
|
· |
the ability to increase market share and control expenses; |
|
· |
our success at managing the risks involved in the foregoing; and |
|
· |
other risks which may be described in Cascade’s future filings with the SEC under the Securities Exchange Act of 1934. |
24
Given these risks and uncertainties, you are cautioned not to place undue reliance on such forward-looking statements. The forward-looking statements included or incorporated by reference into this report are made only as of the date hereof. We do not undertake and specifically decline any obligation to update any such statements or to publicly
announce the results of any revisions to any such statements to reflect future events or developments. In addition, we may make certain statements in future Securities and Exchange Commission (SEC) filings, in press releases and in oral and written statements that are not statements of historical fact and may constitute forward-looking statements.
Critical Accounting Policies and Estimates
The Corporation’s significant accounting policies and estimates are essential to understanding Management's Discussion and Analysis of Financial Condition and Results of Operations. The preparation of financial statements in conformity with accounting principles generally accepted in the United States of America requires management
to make estimates and assumptions, which affect the reported amounts and disclosures. Actual results may differ from these estimates under different assumptions or conditions. The following policies involve a higher degree of judgment than do our other significant accounting policies detailed in Note 1 of the Notes to Consolidated Financial Statements listed in Item 15.
Investment Securities
The Bank classifies its investments as held-for-trading, available-for-sale, or held-to-maturity. Held-for-trading securities are marked to market with the change in value recognized in the income statement. Available-for-sale securities are reported at their fair value,
which is determined by obtaining quoted market prices. Unrealized gains and losses on available-for-sale securities are included in other comprehensive (loss) income and excluded from earnings. Realized gains and losses and declines in fair value judged to be other-than-temporary are included in earnings. Management reviews investment securities on an ongoing basis for the presence of other-than-temporary impairment (OTTI) or permanent impairment, taking into consideration current market conditions; fair
value in relationship to cost; extent and nature of the change in fair value; issuer rating changes and trends; whether management intends to sell a security or if it is likely that the Bank will be required to sell the security before recovery of the amortized cost basis of the investment, which may be upon maturity; and other factors. For debt securities, if management intends to sell the security or it is likely that the Bank will be required to sell the security before recovering its cost basis, the entire
impairment loss would be recognized in earnings as an OTTI. If management does not intend to sell the security and it is not likely that the Bank will be required to sell the security, but management does not expect to recover the entire amortized cost basis of the security, only the portion of the impairment loss representing credit losses would be recognized in earnings. The credit loss on a security is measured as the difference between the amortized cost basis and the present value of the cash flows expected
to be collected. Projected cash flows are discounted by the original or current effective interest rate depending on the nature of the security being measured for potential OTTI. The remaining impairment related to all other factors, i.e., the difference between the present value of the cash flows expected to be collected and fair value, is recognized as a charge to other comprehensive income. Impairment losses related to all other factors are presented
as separate categories within other comprehensive income. Gains and losses on the sale of securities are recorded on the trade date and are determined using the specific identification method. The fair value of financial instruments and fair value measurements are discussed in more detail in Note 19 of the Notes to Consolidated Financial Statements listed in Item 15.
Allowance for Loan Losses
The Bank reviews historical origination and charge-off relationships, charge-off experience factors, collection data, delinquency reports, estimates of the value of the underlying collateral, and other information in order to make the necessary judgments as to the appropriateness of the provision for loan losses and the allowance for loan
losses. The Bank also uses Qualitative (Q) Factors to analyze the adequacy of the loan loss allowance. Factors such as regional/local economic trends, the health of the real estate market, loan and collateral concentrations, size of borrowing relationships, trends in loan delinquencies and charge-offs and changes in loan classifications are included in the Bank’s analysis of the allowance for loan losses. Loan losses are charged-off against the allowance when management confirms the
uncollectibility of a loan balance or when the liquidation value of the collateral is less than the amount of the loan. The Bank believes that the allowance for loan losses is adequate to cover probable losses inherent in its loan portfolio. However, because the allowance for loan losses is based on estimates, there can be no assurance that the ultimate charge-off amount will not exceed the estimates.
25
Income Taxes
The calculation of the provision for federal income taxes is complex and requires the use of estimates and judgments. The Corporation has two accruals for income taxes: the income tax receivable represents the estimated amount currently due from the federal government, net of any reserve for potential audit issues, and is reported as a component
of “accrued interest receivable and other assets” in the consolidated balance sheet; the deferred federal income tax asset represents the estimated impact of temporary differences between how the Corporation recognizes its assets and liabilities, and how such assets and liabilities are recognized under the federal tax code. Taxes are discussed in more detail in Note 13 of the Notes to Consolidated Financial Statements listed in Item 15.
Fair Value
In April 2009, the FASB issued ASC Topic 820, Fair Value Measurements and Disclosures, related to determining fair value when the volume and level of activity for the asset or liability have significantly decreased and identifying transactions that are not orderly. This guidance emphasizes
that even if there has been a significant decrease in the volume and level of activity, the objective of a fair value measurement remains the same. Fair value is the price that would be received to sell an asset or paid to transfer a liability in an orderly transaction (that is, not a forced liquidation or distressed sale) between market participants. A number of factors are considered when evaluating whether there has been a significant decrease in the volume and level of activity for an asset or liability in
relation to normal market activity. In addition, when transactions or quoted prices are not considered orderly, adjustments to those prices based on the weight of available information may be needed to determine the appropriate fair value. This guidance requires increased disclosures and is effective for interim and annual reporting periods ending after June 15, 2009, and shall be applied prospectively. The adoption of ASC Topic 820 during the second quarter of 2009 did not have an impact on the Corporation’s
condensed consolidated financial statements. See Note 19 of the Notes to Consolidated Financial Statements listed in Item 15 for additional information about the level of pricing transparency associated with financial instruments carried at fair value.
Goodwill Impairment
Impairment analysis of the fair value of goodwill involves a substantial amount of judgment. Under ASC Topic 350, Intangibles – Goodwill and Other Intangibles, the Corporation engaged an independent valuation consultant to assist in determining whether, and to what extent, its
goodwill asset was impaired. A goodwill impairment test includes two steps. Step one, used to identify potential impairment, compares the estimated fair value of the Corporation with its carrying amount including goodwill. Step one inputs used to determine the implied fair value of the Corporation include the quoted market price of Cascade’s common stock, market prices of common stocks of other banking organizations, common stock trading multiples, discounted cash flows and inputs
from comparable transactions. If the estimated fair value exceeds its carrying amount, goodwill is considered not impaired. If the carrying amount exceeds its estimated fair value, the second step of the goodwill impairment test is performed to measure the amount of impairment loss, if any. Step two of the goodwill impairment test compares the implied estimated fair value of goodwill with the carrying amount of the currently recorded goodwill. If the carrying amount of goodwill exceeds the implied
fair value of the recorded goodwill, an impairment charge is taken in an amount equal to that excess.
Due to the ongoing uncertainty in market conditions, which may continue to negatively impact the performance of the Corporation as well as the market valuations of financial institutions, management will continue to monitor and evaluate the carrying value of goodwill. Goodwill impairment could be recorded in future periods and such impairment
could be material to the Corporation’s results of operations.
FINANCIAL CONDITION
Assets
The Corporation’s total assets at December 31, 2009, were $1.7 billion, compared to $1.6 billion at December 31, 2008, an increase of 4.1%. The increase in 2009 was primarily due to growth in cash and securities, which was partially offset by a decline in loans, net. The Corporation’s total assets at December
31, 2007, were $1.4 billion.
Investment Securities
Total securities increased by $19.7 million to $275.9 million as of December 31, 2009. Securities designated as available-for-sale increased to $227.8 million at December 31, 2009, versus $123.7 million at December 31, 2008. At December 31, 2008, securities available-for-sale also included $454,000 of Federal National Mortgage
Association (FNMA) and Federal
26
Home Loan Mortgage Corporation (FHLMC) preferred stock, which was sold in 2009. Securities designated as held-to-maturity decreased to $36.2 million at December 31, 2009, from $120.6 million a year earlier. The securities in both portfolios consist of notes issued by Government Sponsored Enterprises (GSE e.g. FHLB, FNMA) or mortgage-backed securities issued by either FNMA or FHLMC or a mortgage conduit. There were no investment
securities that were backed by subprime loans and all investments received the highest credit rating from at least one of the major rating agencies except for the FNMA and FHLMC preferred stock, which held the highest credit rating when purchased. For a discussion on the impact of FNMA and FHLMC preferred stock on the Corporation’s results, see the details of the Other-Than-Temporary Impairment (OTTI) of these securities under Results of Operations – Other Expenses in the Management Discussion and
Analysis and under Securities, Note 3 of the Notes to the Consolidated Financial Statements listed in Item 15.
The following table presents the amortized cost and fair value of available-for-sale and held-to-maturity securities at the dates indicated.
|
(Dollars in thousands) |
December 31, 2009 |
December 31, 2008 |
December 31, 2007 |
|||||||||||||||||||||
|
Amortized
Cost |
Fair
Value |
Amortized
Cost |
Fair
Value |
Amortized
Cost |
Fair
Value |
|||||||||||||||||||
|
Securities available-for-sale |
||||||||||||||||||||||||
|
Mortgage-backed securities |
$ | 40,997 | $ | 41,280 | $ | 42,250 | $ | 41,852 | $ | 26,286 | $ | 25,427 | ||||||||||||
|
Agency notes & bonds |
188,585 | 186,525 | 81,149 | 81,372 | 57,366 | 57,433 | ||||||||||||||||||
|
Corporate/other |
- | - | 1,294 | 454 | - | - | ||||||||||||||||||
|
Total |
$ | 229,582 | $ | 227,805 | $ | 124,693 | $ | 123,678 | $ | 83,652 | $ | 82,860 | ||||||||||||
| (Dollars in thousands) | December 31, 2009 | December 31, 2008 | December 31, 2007 | |||||||||||||||||||||
|
Amortized
Cost |
Fair
Value |
Amortized
Cost |
Fair
Value |
Amortized
Cost |
Fair
Value |
|||||||||||||||||||
|
Securities held-to-maturity |
||||||||||||||||||||||||
|
Mortgage-backed securities |
$ | 15,405 | $ | 15,909 | $ | 20,484 | $ | 20,545 | $ | 22,556 | $ | 21,941 | ||||||||||||
|
Agency notes & bonds |
19,997 | 19,810 | 99,335 | 99,381 | 113,907 | 113,579 | ||||||||||||||||||
|
Corporate/other |
775 | 775 | 775 | 775 | 775 | 775 | ||||||||||||||||||
|
Total |
$ | 36,177 | $ | 36,494 | $ | 120,594 | $ | 120,701 | $ | 137,238 | $ | 136,295 | ||||||||||||
Certain securities shown above currently have fair values less than amortized cost, and therefore, contain unrealized losses. In the opinion of management, these securities are considered only temporarily impaired due to changes in market interest rates and/or the widening of market spreads subsequent to the initial purchase of the securities
or to disruptions to credit markets. Since all these securities are rated AAA, this temporary impairment is not due to concerns regarding the underlying credit of the issuers or the underlying collateral.
Federal Home Loan Bank Stock. The Bank’s investment in Federal Home Loan Bank of Seattle (FHLB) stock is carried at par value ($100 per share), which reasonably approximates its fair value. As a member of the FHLB system, the Bank is required to maintain a minimum level of
investment in FHLB stock, based on specified percentages of its outstanding FHLB advances. The Bank may request redemption at par value of any stock in excess of the amount the Bank is required to hold. Stock redemptions are at the discretion of the FHLB.
At December 31, 2009, the Bank had 119,203 shares of FHLB stock. FHLB stock is carried at par and does not have a readily determinable fair value. Ownership of FHLB stock is restricted to FHLB member institutions and can only be purchased and redeemed at par. Due to ongoing turmoil in the capital and mortgage markets, the FHLB of Seattle
has a risk-based capital deficiency largely as a result of write-downs on its private label mortgage-backed securities portfolios.
The Bank evaluates FHLB stock for impairment. The determination of whether FHLB stock is impaired is based on an assessment of the ultimate recoverability of cost rather than by recognizing temporary declines in value. The determination of whether a decline affects the ultimate recoverability of cost is influenced by criteria such as: (1)
the significance of any decline in net assets of the FHLB as compared to the capital stock amount for the FHLB and the length of time this situation has persisted, (2) commitments by the FHLB to make payments required by law or regulation and the level of such payments in relation to the operating performance of the FHLB, (3) the impact of legislative and regulatory changes on institutions and, accordingly, the customer base of the FHLB and (4) the liquidity position of the FHLB.
27
Under Federal Housing Finance Agency regulations, a Federal Home Loan Bank that fails to meet any regulatory capital requirement may not declare a dividend or redeem or repurchase capital stock in excess of what is required for members’ current loans. Based upon an analysis by Standard and Poors regarding the Federal Home Loan Banks,
they stated that the FHLB System has a special public status (organized under the Federal Home Loan Bank Act of 1932) and because of the extraordinary support offered to it by the U.S. Treasury in a crisis, (though not used), the FHLB system can be considered an extension of the government. The U.S. government would almost certainly support the credit obligations of the FHLB System. The Bank has determined there is not an other-than-temporary impairment on the FHLB stock investment as of December 31, 2009.
For further information concerning the Bank’s securities portfolio, see Note 3 of the Notes to the Consolidated Financial Statements listed in Item 15.
Loans
The Bank originates business, real estate and consumer loans. Total loans, which are net of construction loans in process, equaled $1.20 billion at December 31, 2009. Total loans were adjusted by deferred loan fees and the allowance for loan losses for a net loan balance of $1.17 billion. At December 31, 2009, $469.2 million or 39.0%
of total loans consisted of business banking loans; $256.9 million or 21.4% were real estate construction loans; $183.3 million or 15.2% of loans consisted of commercial real estate; $82.4 million or 6.9% consisted of multifamily loans; $31.7 million or 2.6% were consumer loans; and $179.1 million or 14.9% of the Bank’s loans consisted of loans secured by one-to-four family residential properties. Total loans secured by first liens on residential real estate were $261.5 million or 21.7% of total loans.
The Bank typically sells its conforming 30 and 15-year fixed-rate loans in the secondary mortgage market, servicing released. The Bank had non-mandatory forward commitments totaling $479,000 and $127,000 to sell loans into the secondary market at December 31, 2009 and December 31, 2008, respectively.
| (Dollars in thousands) | At December 31, | |||||||||||||||||||||||
|
2009 |
2008 |
2007 |
||||||||||||||||||||||
|
Type of Loan |
Amount |
Percent |
Amount |
Percent |
Amount |
Percent |
||||||||||||||||||
|
Business |
$ | 469,196 | 39.01 | % | $ | 485,060 | 38.55 | % | $ | 468,453 | 42.28 | % | ||||||||||||
|
Construction (2) |
256,917 | 21.36 | 406,505 | 32.31 | 381,810 | 34.44 | ||||||||||||||||||
|
Commercial R/E |
183,286 | 15.24 | 122,951 | 9.77 | 120,421 | 10.87 | ||||||||||||||||||
|
Multifamily |
82,418 | 6.85 | 86,864 | 6.90 | 11,397 | 1.03 | ||||||||||||||||||
|
Consumer (3) |
31,738 | 2.64 | 30,772 | 2.45 | 27,688 | 2.50 | ||||||||||||||||||
|
Residential (1) |
179,133 | 14.90 | 126,089 | 10.02 | 98,384 | 8.88 | ||||||||||||||||||
|
Total loans |
$ | 1,202,688 | 100.00 | % | $ | 1,258,241 | 100.00 | % | $ | 1,108,153 | 100.00 | % | ||||||||||||
|
Less: |
||||||||||||||||||||||||
|
Deferred loan fees, net |
3,575 | 3,069 | 3,724 | |||||||||||||||||||||
|
Allowance for loan losses |
25,900 | 16,439 | 11,653 | |||||||||||||||||||||
|
Total loans, net |
$ | 1,173,213 | $ | 1,238,733 | $ | 1,092,776 | ||||||||||||||||||
(1) Includes construction loans converted to permanent loans
(2) Includes land loans
(3) Includes home equity loans and home equity lines of credit (HELOC)
28
| (Dollars in thousands) | At December 31, | |||||||||||||||||||||||
|
2009 |
2008 |
2007 |
||||||||||||||||||||||
|
Type of Collateral |
Amount |
Percent |
Amount |
Percent |
Amount |
Percent |
||||||||||||||||||
|
Real estate mortgage |
||||||||||||||||||||||||
|
One-to-four family (4) |
$ | 457,278 | 38.02 | % | $ | 553,353 | 43.98 | % | $ | 497,778 | 44.92 | % | ||||||||||||
|
Multifamily |
82,418 | 6.85 | 86,864 | 6.90 | 11,397 | 1.03 | ||||||||||||||||||
|
Commercial R/E |
183,286 | 15.24 | 122,951 | 9.77 | 120,421 | 10.87 | ||||||||||||||||||
|
Land loans |
4,108 | 0.34 | 4,407 | 0.35 | 3,984 | 0.36 | ||||||||||||||||||
|
Other |
475,598 | 39.55 | 490,666 | 39.00 | 474,573 | 42.82 | ||||||||||||||||||
|
Total loans |
$ | 1,202,688 | 100.00 | % | $ | 1,258,241 | 100.00 | % | $ | 1,108,153 | 100.00 | % | ||||||||||||
|
Less: |
||||||||||||||||||||||||
|
Deferred loan fees, net |
3,575 | 3,069 | 3,724 | |||||||||||||||||||||
|
Allowance for loan losses |
25,900 | 16,439 | 11,653 | |||||||||||||||||||||
|
Total loans, net |
$ | 1,173,213 | $ | 1,238,733 | $ | 1,092,776 | ||||||||||||||||||
(4) Includes residential home equity loans, HELOC’s and construction loans
|
(Dollars in thousands) |
At December 31, | |||||||||||||||
|
2006 |
2005 |
|||||||||||||||
|
Type of Loan |
Amount |
Percent |
Amount |
Percent |
||||||||||||
|
Business |
$ | 442,391 | 43.78 | % | $ | 394,034 | 44.75 | % | ||||||||
|
Construction (2) |
295,087 | 29.20 | 171,964 | 19.52 | ||||||||||||
|
Commercial R/E |
119,298 | 11.81 | 141,109 | 16.02 | ||||||||||||
|
Multifamily |
34,719 | 3.44 | 52,057 | 5.91 | ||||||||||||
|
Consumer (3) |
27,686 | 2.74 | 32,160 | 3.65 | ||||||||||||
|
Residential (1) |
91,256 | 9.03 | 89,422 | 10.15 | ||||||||||||
|
Total loans |
$ | 1,010,437 | 100.00 | % | $ | 880,746 | 100.00 | % | ||||||||
|
Less: |
||||||||||||||||
|
Deferred loan fees, net |
3,434 | 3,443 | ||||||||||||||
|
Allowance for loan losses |
10,988 | 10,254 | ||||||||||||||
|
Total loans, net |
$ | 996,015 | $ | 867,049 | ||||||||||||
|
Type of Collateral |
||||||||||||||||
|
Real estate mortgage |
||||||||||||||||
|
One-to-four family (4) |
$ | 402,415 | 39.83 | % | $ | 279,652 | 31.76 | % | ||||||||
|
Multifamily |
34,719 | 3.44 | 52,057 | 5.91 | ||||||||||||
|
Commercial R/E |
119,298 | 11.81 | 141,109 | 16.02 | ||||||||||||
|
Land loans |
5,094 | 0.50 | 6,007 | 0.68 | ||||||||||||
|
Other |
448,911 | 44.42 | 401,921 | 45.63 | ||||||||||||
|
Total loans |
$ | 1,010,437 | 100.00 | % | $ | 880,746 | 100.00 | % | ||||||||
|
Less: |
||||||||||||||||
|
Deferred loan fees, net |
3,434 | 3,443 | ||||||||||||||
|
Allowance for loan losses |
10,988 | 10,254 | ||||||||||||||
|
Total loans, net |
$ | 996,015 | $ | 867,049 | ||||||||||||
(1) Includes construction loans converted to permanent loans
(2) Includes land loans
(3) Includes home equity loans and home equity lines of credit (HELOC)
(4) Includes residential home equity loans, HELOC’s and construction loans
Business Loans. Business loans decreased from $485.1 million at December 31, 2008, to $469.2 million at December 31, 2009. Unsecured business banking loans totaled $25.9 million at December 31, 2009, compared
to $29.8 million as of December 31, 2008. The Bank’s business loan portfolio consists primarily of commercial business loans to small and medium sized businesses operating in Snohomish and King Counties. These loans are generally secured by real estate, receivables, equipment, other assets of the business, personal property
29
and the personal guarantee of the borrower. These loans typically have variable-rate terms or fixed-rates with maturities of up to five years. The Bank also offers secured and unsecured operating lines of credit. Business loans are underwritten by the Bank on the basis of the borrower's cash flow, ability to service debt from earnings, and the underlying
collateral value. The borrower is generally required to provide the Bank with financial statements, tax returns, current financial information on any and all guarantors, and other reports that show trends in their financial condition; and to update this information annually. Business loans also include owner occupied real estate loans with terms comparable to the Bank’s commercial real estate loans. In addition, as business banking activity increases, the Bank expects to expand its lower cost deposit franchise
through the growth of commercial checking as a source of funding.
Business loans are inherently sensitive to conditions in the economy. The collateral securing these loans may depreciate over time, may be difficult to appraise and may fluctuate in value based on the success of the business. In the case of loans secured by accounts receivable, the availability of funds for the repayment of such loans may
be substantially dependent on the ability of the borrower to collect amounts due from its customers. Accordingly, the repayment of a business loan depends primarily on the successful operation of the borrower's business and creditworthiness of the borrower (and any guarantors), while liquidation of collateral is a secondary and potentially insufficient source of repayment.
Construction Loans. The Bank originates construction loans to fund the building of one-to-four family homes either to borrowers as custom construction loans or to builders as speculative construction loans. Construction loans generally have maturities of 12-18 months. The
interest rates charged on construction loans are typically indexed to the prime rate and vary depending on the characteristics of the loan, particularly the credit risk inherent in the project and/or the financial strength of the borrower. All construction loans require approval by various levels of Bank personnel, depending on the size of the loan. At December 31, 2009 and December 31, 2008, the Corporation’s construction loans were $256.9 million or 21.4% of the total loan portfolio and $406.5 million
or 32.3% of the total loan portfolio, respectively. The construction loans are net of loans in process of $14.4 million at December 31, 2009, and $60.8 million at December 31, 2008. Of the total net construction loans, $252.4 million were to builders and developers, including $120.7 million for land acquisition and development. An additional $1.4 million were to individuals for custom home construction and $4.7 million were for lot purchases. The Bank’s largest construction loan outstanding totaled
$17.2 million at December 31, 2009.
Construction loans involve higher credit risks because loan funds are advanced upon the security of the project under construction that is of uncertain value before completion. The Bank’s risk of loss on a construction loan is dependent largely upon the accuracy of the initial estimate of the property’s value at completion of
construction or development and the estimated cost (including interest) of the construction. If the estimate of construction costs proves to be inaccurate, the Bank may be required to advance additional funds to complete the development. If upon completion of the project, the estimate of the marketability of the property is inaccurate, the borrower may be unable to sell the completed project in a timely manner or obtain adequate proceeds to repay the loan. Delays may arise from labor problems, material shortages
and other unpredictable contingencies in completing the project. Furthermore, if the estimate of value of a completed project is inaccurate, the Bank may be confronted with a project with a value that is insufficient to assure full repayment. As a result, these loans may involve the disbursement of substantial funds with repayment dependent, in part, on the success of the ultimate project rather than the ability of the borrower or guarantor to repay principal and interest.
Commercial Real Estate Loans. Commercial real estate loans totaled $183.3 million or 15.2% of the Bank’s total loans at December 31, 2009, compared to $123.0 million or 9.8% of the portfolio at December 31, 2008. All commercial real estate loans are secured by properties
in western Washington, mainly in the Puget Sound region. Improved property including office buildings and small commercial business properties, such as strip shopping centers, secure the Bank’s commercial real estate loans. These loans are primarily adjustable-rate with a maximum term until reset on the interest rate of five years. At December 31, 2009, the largest commercial real estate loan in the Bank’s portfolio was $21.1 million, which is performing according to its terms.
Commercial real estate loans are also sensitive to local economic conditions. An economic slowdown can lead to increased vacancies that would lower the borrower’s ability to service the debt. Commercial real estate loans also have a degree of interest rate risk in that if rates fall, borrowers may refinance, and if rates rise, the Bank
could experience a squeeze in its net interest margin if the Bank does not properly fund these loans, which often have a fixed rate for the initial five years of the loan.
Multifamily Loans. Multifamily loans totaled $82.4 million or 6.9% of the total loan portfolio at December 31, 2009, compared to $86.9 million or 6.9% of the total loan portfolio at December 31, 2008. The multifamily portfolio is principally comprised of small to medium-size
apartment projects with loan-to-value ratios usually up to 75%. All new loan originations are in the Puget Sound region and have adjustable interest rates.
30
Multifamily residential and commercial real estate lending affords the Bank an opportunity to receive interest at rates higher than those generally available from one-to-four family mortgage loans. However, loans secured by such properties usually are greater in amount and may involve a greater degree of risk than individual one-to-four family
residential
mortgage loans. Because payments on loans secured by multifamily residential and commercial properties are often dependent on the successful operation and management of the properties, repayment of such loans may be affected by adverse conditions in the real estate market or the economy.Consumer Loans. The Bank’s consumer loan activities take three forms: home equity loans or lines of credit, installment loans/lines of credit, and Visa card loans. Home equity loans are secured by a junior lien in priority on the borrower's home. Such loans may have
a combined loan-to-value ratio of up to 90% of the value of the home securing the loan. Home equity loans are fixed amount loans, which may have fixed or floating interest rates. Home equity lines of credit can be drawn upon at any time by the customer up to a specific amount. These loans are at a floating rate with a floor on that rate. The balance outstanding for both types of home equity loans slightly increased to $25.3 million at December 31, 2009, as compared to $25.2 million at December 31, 2008. At December
31, 2009 and December 31, 2008, the total amount of unused lines of credit were $17.9 million and $19.0 million, respectively. The second category of consumer loans are installment loans or lines of credit that are either secured by boats, automobiles, or recreational vehicles or are unsecured. This portfolio was $2.7 million at December 31, 2009, as compared to $2.6 million outstanding at December 31, 2008. Since many of the installment loans are secured by depreciating assets, any repossessed collateral for
a defaulted loan is unlikely to provide an adequate source of repayment of the outstanding loan balance. The remaining deficiency often does not warrant further substantial collection efforts against the borrower. Consumer loan collections are dependent on the borrower’s continuing financial ability, and are more likely to be adversely affected by job loss, divorce, illness or personal bankruptcy. Visa card loans totaled $3.7 million at December 31, 2009 compared to $3.0 million at December 31, 2008.
Residential Loans. At December 31, 2009, residential loans totaled $179.1 or 14.9% of the total loan portfolio compared to $126.1 million or 10.0% of the total loan portfolio at December 31, 2008. Residential lending consists primarily of first mortgage loans secured by single-family
residential properties located principally in Snohomish and King counties. The Bank originates both fixed-rate and adjustable-rate mortgages (ARMs) with maturities up to 30 years. ARM loans are generally held in the Bank’s portfolio. Newly originated ARMs have interest rates that adjust based on the One Year Constant Maturity Treasury Index after an initial fixed-rate period. Borrower demand for ARMs versus fixed-rate mortgage loans is a function of the level of interest rates, the shape of the yield curve,
and the differences between the interest rates and loan fees offered for fixed-rate mortgage loans and the rates and loan fees for ARMs.
Fixed-rate residential loans are generally sold and the servicing released to one of the Bank’s correspondents. The loans are sold on a “best efforts” basis. The Bank had $250,000 in conforming loans held for sale at December 31, 2009, and $1.2 million in loans held for sale at December 31, 2008. Loans held for sale are
not material and therefore the Bank does not include them as a separate line item on the balance sheet.
Beginning in 2009, the Bank has originated and holds loans generated under its Builder Loan program, which offers attractive terms to qualified buyers of houses from builders financed by the Bank. The Bank is required to discount these loans because of the special terms offered to the borrowers. Discounts associated with the program totaled
$1.2 million for the year ended December 31, 2009. The discount reduces the Bank’s allowance for loan losses. As of December 31, 2009, the Bank held $53.8 million of these loans.
The Bank’s conforming residential loans meet the Federal Home Loan Mortgage Corporation's underwriting standards with respect to credit, borrower debt ratios and documentation. The Bank’s nonconforming residential loans are those that do not conform to agency underwriting guidelines, due to the size of the loan, as a result of
credit histories, debt-to-income ratios, reliance on the borrower's stated income, non-owner occupied property, rural property, or other exceptions from agency guidelines. The Bank does not offer subprime loans.
The following table sets forth information at December 31, 2009 regarding the dollar amount of loans maturing in the Bank’s portfolio based on their contractual terms to maturity, but does not include scheduled payments or potential prepayments. Loan balances do not include deferred loan fees. Construction loans are net of loans in
process.
31
|
(Dollars in thousands)
|
Due in one
year or less |
Due in one
to five years |
Due after
five years |
Total |
With variable
or adjustable rate (for maturities
of more than
one year) |
With fixed
rate (for maturities
of more than
one year) |
||||||||||||||||||
|
Business |
$ | 115,530 | $ | 169,925 | $ | 183,741 | $ | 469,196 | $ | 162,382 | $ | 191,284 | ||||||||||||
|
Construction |
181,675 | 49,334 | 25,908 | 256,917 | 54,130 | 21,112 | ||||||||||||||||||
|
Commercial R/E |
26,016 | 97,043 | 60,227 | 183,286 | 135,885 | 21,385 | ||||||||||||||||||
|
Multifamily |
12,544 | 36,053 | 33,821 | 82,418 | 48,111 | 21,763 | ||||||||||||||||||
|
Consumer |
2,275 | 9,309 | 20,154 | 31,738 | 23,353 | 6,110 | ||||||||||||||||||
|
Residential |
12,461 | 1,145 | 165,527 | 179,133 | 108,440 | 58,232 | ||||||||||||||||||
Asset Quality
Banking regulations require that each insured institution review and classify its assets regularly. In addition, bank examiners have the authority to identify problem assets and, if appropriate, require them to be adversely classified. There are three classifications for problem assets: substandard, doubtful and loss. Substandard assets must
have one or more defined weaknesses and are characterized by the distinct possibility that the insured institution will sustain some loss if the deficiencies are not corrected. Doubtful assets have sufficient weaknesses that make collection or payment in full, based on currently existing facts, conditions and values, questionable. An asset classified loss is considered uncollectible and of such little value that its continuance as an asset of the institution is not warranted. Assets classified as substandard
or doubtful require the institution to establish allowances for loan losses. If an asset, or portion thereof, is classified loss, the insured institution must either establish specific allowances for loan losses in the amount of 100% of the portion of the asset classified loss or charge-off such amounts. The Bank uses two other asset classification categories for potential problem loans. They are watch and special mention. Borrowers with declining earnings, strained cash flow, increasing leverage and/or weakening
market fundamentals that indicate above average risk are classified as watch. Loans identified as special mention represent borrowers who exhibit potential credit weaknesses or trends deserving Bank management’s close attention.
In early 2008, in order to proactively address credit quality issues within its loan portfolios, Cascade began adding resources to its Credit Administration and Special Assets departments to address the increased volume of classified assets. When an asset becomes classified, the relationship is transferred to Cascade’s Special Assets
department. Cascade actively engages the borrower and guarantor to remedy the situation by requiring current financial information from the borrower(s) and guarantor(s) to determine a course of action. In addition, new collateral values are requested in order for Cascade’s management to perform evaluations for regulatory and decision making purposes and updated title information is obtained to determine the status of encumbrances on the collateral. When possible, Cascade requires the borrower to provide
additional collateral or capital. In conjunction with the receipt of additional collateral, Cascade will sometimes modify the terms of the loan. Often the new modified terms of the loan are consistent with terms that Cascade would offer a new borrower. If the modification of terms is considered concessionary, Cascade classifies the loan as a troubled debt restructuring.
Cascade also may consider allowing a borrower to sell the underlying collateral for less than the outstanding balance on the loan if the current collateral evaluation supports the offer price. In such situations, Cascade often requires the borrower to sign a new note for the resulting deficiency or bring cash to closing. In some situations,
Cascade releases the collateral only in a sale transaction, preserving its right to seek monetary judgments against the borrowers and guarantors and, in some situations, Cascade will accept a short sale and agree to no further action against the borrowers and guarantors.
If Cascade and a borrower are unable to achieve an acceptable resolution, Cascade may take a deed in lieu of foreclosure or initiate foreclosure on the underlying collateral. Under such circumstances, Cascade also simultaneously evaluates legal action for recovery against the borrowers and guarantors. After obtaining the collateral, Cascade
actively works to sell the collateral.
Delinquencies. A report containing delinquencies of all loans is reviewed monthly by the Asset Review Committee and periodically by the Board of Directors. Procedures taken with respect to delinquent loans differ depending on the particular circumstances of each loan. The
Bank’s general procedures provide that when a loan becomes delinquent, the borrower is contacted, usually by phone, within 30 days. When the loan is over 30 days delinquent, the borrower is typically contacted in writing. Generally, the Bank will initiate foreclosure or
32
other corrective action against the borrower when principal and interest become 90 days or more delinquent. In most cases, interest income is reduced by the full amount of accrued and uncollected interest on loans once they become 90 days delinquent, go into foreclosure or are otherwise determined to be uncollectible. Once interest has been
paid to date or management considers the loan fully collectable, it is returned to accrual status. An allowance for loss is established when, in the opinion of management, the fair value less sales costs of the property collateralizing the loan is less than the outstanding principal and the collectability of the loan’s principal becomes uncertain. It is intended that the Bank’s allowance for loan losses be adequate to cover known potential and reasonably estimated unknown losses. At December 31, 2009,
and December 31, 2008, the Bank had $106.1 million and $40.3 million, respectively, of loans held on a nonaccrual basis.
Total loans decreased by $55.6 million from December 31, 2008 to December 31, 2009, primarily due to charge-offs and transfers to REO. Within the portfolio, reclassifications totaling $74.7 million from the construction portfolio contributed to the decline in this category. Of the $74.7 million in reclassifications, $59.4 million was transferred
to commercial real estate, while $9.1 million and $6.2 million were transferred to multifamily and residential, respectively. Combined with charge-offs of $29.0 million, transfers of $20.0 million to REO, and payoffs of $25.9 million, reclassifications reduced the construction portfolio by $149.6 million. The reclassified loans were secured by projects that had been completed and achieved stabilized debt service coverage ratios adequate to support the reclassifications.
The following table presents the change in the Bank’s loan portfolio from December 31, 2008 to December 31, 2009.
|
(Dollars in thousands)
Loans |
Balance at December 31, 2009 |
Net New Loans - Payments |
Reclassifi-cations (2) |
Transfers to REO |
Charge-offs (1) |
Balance at December 31, 2008 |
Change |
|||||||||||||||||||||
|
Business |
$ | 469,196 | $ | (12,036 | ) | $ | - | $ | (200 | ) | $ | (3,628 | ) | $ | 485,060 | -3.3 | % | |||||||||||
|
Construction |
256,917 | (25,864 | ) | (74,743 | ) | (20,016 | ) | (28,965 | ) | 406,505 | -36.8 | |||||||||||||||||
|
Commercial R/E |
183,286 | (1,149 | ) | 61,718 | (234 | ) | - | 122,951 | 49.1 | |||||||||||||||||||
|
Multifamily |
82,418 | (9,157 | ) | 6,811 | (1,854 | ) | (246 | ) | 86,864 | -5.1 | ||||||||||||||||||
|
Home equity/consumer |
31,738 | 1,337 | - | (10 | ) | (361 | ) | 30,772 | 3.1 | |||||||||||||||||||
|
Residential |
179,133 | 48,691 | 6,214 | (1,494 | ) | (367 | ) | 126,089 | 42.1 | |||||||||||||||||||
|
Total loans |
$ | 1,202,688 | $ | 1,822 | $ | - | $ | (23,808 | ) | $ | (33,567 | ) | $ | 1,258,241 | -4.4 | |||||||||||||
|
Deferred loan fees |
(3,575 | ) | 665 | (1,171 | ) | - | - | (3,069 | ) | 16.5 | ||||||||||||||||||
|
Allowance for loan losses |
(25,900 | ) | (44,175 | ) | 1,147 | - | 33,567 | (16,439 | ) | 57.6 | ||||||||||||||||||
|
Loans, net |
$ | 1,173,213 | $ | (41,688 | ) | $ | (24 | ) | $ | (23,808 | ) | $ | - | $ | 1,238,733 | -5.3 | ||||||||||||
(1) Excludes negative NOW accounts/New Start charge-offs totaling $275,000 and total recoveries of $275,000.
(2) Transferred $24,000 to off-balance sheet general valuation allowance
Management provides for potential future loan losses by maintaining an allowance for loan losses. The allowance for loan losses reflects management’s best estimate of probable losses as of a particular balance sheet date. The allowance for loan losses is maintained at levels based on management’s assessment of various factors
affecting the loan portfolio, including analysis of adversely classified loans, delinquencies, trends in credit quality, local economic conditions, growth of the loan portfolio, past loss experience, and the portfolio’s composition. Increases in the allowance for loan losses made through provisions primarily reflect loan loss risks inherent in lending and the impact of the economic climate on the loan portfolio.
Management determines the amount of the allowance for loan losses by utilizing a loan quality grading system to determine risk in the loan portfolio. The allowance consists of general and specific components. When loans are originated, they are assigned a risk rating that is reassessed periodically during the term of the loan through
the Bank’s credit review process. The Bank’s loan quality grading methodology assigns a loan quality grade from 1 to 10, where a higher numerical rating represents higher risk. These loan quality rating categories are a primary factor in determining an appropriate amount for the allowance for loan losses. The loan portfolio is separated by risk rating and then by loan type. Loans of acceptable quality (loans graded “pass”) are evaluated as a group, by loan type, with a loss rate based
on average historical losses adjusted to reflect current economic conditions
33
At December 31, 2009, the allowance for loan losses was $25.9 million (2.15% of total loans) compared to $16.4 million (1.31% of total loans) at December 31, 2008, and $11.7 million (1.05% of total loans) at December 31, 2007. During 2009, the Corporation added $44.2 million to the allowance compared to $7.2 million in 2008 and $1.4 million
in 2007. In 2007, the Bank segregated a valuation reserve against off-balance sheet commitments, such as loans in process. As of December 31, 2009, that valuation reserve account was $69,000, as compared to $93,000 at December 31, 2008. The total allowance for loan losses, which includes the allowance for off-balance sheet commitments, was $26.0 million (2.16% of total loans) as of December 31, 2009 compared to $16.5 million (1.31% of total loans) as of December 31, 2008.
The increase in the allowance for loan losses during the year, in terms of dollars and percentage of total loans, was primarily the result of an increase in the provision for loan losses in excess of charge-offs. The increase in the provision for loan losses was largely due to an increase in nonperforming and adversely classified
loans and a weakening economy and its negative impact on local real estate, which serves as collateral for a majority of the Corporation’s loans. The increase in the allowance for credit losses for the year 2008 as compared to 2007 is attributable to higher nonperforming loans during the period, principally in the construction loan portfolios. Net loan charge-offs were $33.6 million in 2009 (or 2.70% of average loans outstanding) compared
to $2.5 million in 2008 (or 0.21% of average loans outstanding). Net charge-offs were $543,000 (or 0.05% of average loans outstanding) for the year ended December 31, 2007. The increase in net charge-offs was driven by the decline in real estate values, most notably land held for the development of residential building lots and/or houses. Management believes that the allowance for losses on loans is adequate to provide for losses that may
be incurred on loans; however, there is no guarantee that management’s estimate will be sufficient to cover actual loan losses.
The following table sets forth information concerning the Bank’s allocation of the allowance for loan losses and the percentage of loans in each category to total loans at the dates indicated.
|
December 31, |
||||||||||||||||||||||||
|
(Dollars in thousands) |
2009 |
2008 |
2007 |
|||||||||||||||||||||
|
Amount |
% |
Amount |
% |
Amount |
% |
|||||||||||||||||||
|
Business |
$ | 8,565 | 39.01 | % | $ | 6,285 | 38.55 | % | $ | 5,809 | 42.28 | % | ||||||||||||
|
Construction |
11,340 | 21.36 | 6,452 | 32.31 | 3,593 | 34.44 | ||||||||||||||||||
|
Commercial R/E |
2,845 | 15.24 | 1,397 | 9.77 | 1,123 | 10.87 | ||||||||||||||||||
|
Multifamily |
865 | 6.85 | 675 | 6.90 | 59 | 1.03 | ||||||||||||||||||
|
Consumer |
562 | 2.64 | 532 | 2.45 | 443 | 2.50 | ||||||||||||||||||
|
Residential |
1,708 | 14.90 | 1,098 | 10.02 | 626 | 8.88 | ||||||||||||||||||
|
Unallocated |
15 | — | — | — | — | — | ||||||||||||||||||
|
Total allowance for loan losses |
$ | 25,900 | 100.00 | % | $ | 16,439 | 100.00 | % | $ | 11,653 | 100.00 | % | ||||||||||||
Net loan charge-offs were $33.6 million in 2009 (or 2.70% of average loans outstanding) compared to $2.5 million in 2008 (or 0.21% of average loans outstanding). Net charge-offs were $543,000 (or 0.05% of average loans outstanding) for the year ended December 31, 2007. The increase in net charge-offs was driven by the decline in real estate
values, especially land held for the development of residential building lots and/or houses.
34
The following table sets forth information regarding changes in the Bank’s allowance for loan losses for the most recent three years.
|
Years Ended December 31, |
||||||||||||
|
(Dollars in thousands) |
2009 |
2008 |
2007 |
|||||||||
|
Balance at beginning of period |
$ | 16,439 | $ | 11,653 | $ | 10,988 | ||||||
|
Charge-Offs |
||||||||||||
|
Business |
(3,628 | ) | (1,212 | ) | (288 | ) | ||||||
|
Construction/land |
(28,964 | ) | (1,941 | ) | — | |||||||
|
Residential |
(367 | ) | — | — | ||||||||
|
Consumer and other |
(883 | ) | (632 | ) | (390 | ) | ||||||
|
Recoveries |
275 | 1,282 | 135 | |||||||||
|
Net (charge-offs) recoveries |
(33,567 | ) | (2,503 | ) | (543 | ) | ||||||
|
Provision for loan losses |
44,175 | 7,240 | 1,350 | |||||||||
|
Transfers to (from) off-balance commitments |
24 | 49 | (142 | ) | ||||||||
|
Builder loan program |
(1,171 | ) | — | — | ||||||||
|
Balance at end of period |
$ | 25,900 | $ | 16,439 | $ | 11,653 | ||||||
|
Average total loans outstanding |
$ | 1,242,588 | $ | 1,183,072 | $ | 1,046,093 | ||||||
|
Nonperforming loans |
106,096 | 40,278 | 1,523 | |||||||||
|
Ratio of net charge-offs during the period to average loans outstanding |
2.70 | % | 0.21 | % | 0.05 | % | ||||||
|
Ratio of allowance for loan losses to average loans outstanding |
2.08 | 1.39 | 1.11 | |||||||||
|
Ratio of allowance for loan losses to total loans outstanding |
2.15 | 1.31 | 1.05 | |||||||||
|
Coverage ratio |
24.00 | 41.00 | 765.00 | |||||||||
At December 31, 2009, the allowance for possible loan losses was 24.0% of total nonperforming loans (“coverage ratio”) compared to 41.0% and 765.0% at December 31, 2008 and 2007, respectively. The decrease since 2007 in the coverage ratio was mainly due to the fact that the increase in nonperforming loans was in portfolios
for which the Bank’s loan-to-value position was sufficient to cover potential collateral deficiencies. A significant portion of the nonperforming loans did not require a specific allowance given the adequacy of collateral coverage. As a consequence, the allowance for loan losses did not increase proportionately with the increase in nonperforming loans and the ratio of allowance for possible loan losses to total nonperforming loans decreased.
The Bank’s nonperforming assets at December 31, 2009, consisting of nonperforming (nonaccruing) loans and other real estate owned, totaled $124.9 million or 7.33% of total assets. This is an increase from $41.7 million or 2.55% of total assets at December 31, 2008, and an increase from $1.5 million or 0.11% of total assets at December
31, 2007.
The following table presents information with respect to the Bank’s nonperforming assets and restructured loans at the dates indicated.
35
|
(Dollars in thousands)
|
December 31, |
|||||||||||
|
Nonperforming assets: |
2009 |
2008 |
2007 |
|||||||||
|
Business |
$ | 6,988 | $ | 1,150 | $ | 1,522 | ||||||
|
Construction |
||||||||||||
|
Spec construction |
13,787 | 11,735 | - | |||||||||
|
Land acquisition and development |
54,740 | 22,799 | - | |||||||||
|
Land |
10,380 | 4,437 | - | |||||||||
|
Commercial R/E |
6,477 | - | - | |||||||||
|
Total construction |
85,384 | 38,971 | - | |||||||||
|
Commercial R/E |
12,581 | - | - | |||||||||
|
Consumer |
486 | 2 | 1 | |||||||||
|
Residential |
657 | 155 | - | |||||||||
|
Total nonperforming loans |
106,096 | 40,278 | 1,523 | |||||||||
|
Real estate owned and repossessed assets |
18,842 | 1,446 | - | |||||||||
|
Total nonperforming assets |
$ | 124,938 | $ | 41,724 | $ | 1,523 | ||||||
|
Performing restructured loans |
$ | 26,635 | $ | 910 | $ | 334 | ||||||
|
Total nonperforming loans to total loans |
8.82 | % | 3.20 | % | 0.14 | % | ||||||
|
Total nonperforming loans to total assets |
6.22 | 2.46 | 0.11 | |||||||||
|
Total nonperforming assets to total assets |
7.33 | 2.55 | 0.11 | |||||||||
Loans are generally placed on nonaccrual status when they become past due over 90 days or when the collection of interest or principal is considered unlikely. Loans past due over 90 days that are not on nonaccrual status must be well secured by tangible collateral and in the process of collection. The Bank does not return a loan to accrual
status until it is brought current with respect to both principal and interest and future principal and interest payments are no longer in doubt.
Nonperforming loans increased to $106.1 million at December 31, 2009, compared to $40.3 million at December 31, 2008, and $1.5 million at December 31, 2007. The increase in nonperforming loans from December 31, 2008 to December 31, 2009, was due to the overall deterioration in the real estate market in the Puget Sound region of Washington
State. Included in nonperforming loans as of December 31, 2009, is $13.8 million in residential spec construction loans, which is a net increase of $2.0 million. Additions for the year of $37.4 million were offset by $20.0 million in paydowns, $8.9 million in charge-offs and $6.4 million in transfers to REO. Nonperforming land acquisition and development loans increased by $31.9 million. Most of the additions to this category related to four loans added during the year totaling $49.0 million. At December
31, 2009, these same loans totaled $43.1 million due to charge-offs of $4.0 million and $1.9 million in principal reductions and were 41% of the Banks nonaccruing loans. These four loans are secured by mostly completed residential developed lots and each has been individually reviewed for impairment. As of December 31, 2009, our Special Assets department has determined that the loans are on the books at their fair value. These loans are detailed in the table below.
|
(Dollars in thousands) |
||||
|
Balance at
December 31, 2009 |
# of lots |
Comments | ||
| $ | 17,220 | 134 |
Title to these lots are expected in 2nd quarter 2010. The Bank is communicating with prospective buyers for blocks of lots. | |
| $ | 13,100 | 263 |
Title to these lots are expected in 1st quarter 2010. The Bank is communicating with prospective buyers for blocks of lots. | |
| $ | 6,678 | 88 |
Originally 109 lots. The Bank has provided financing for single-family construction and has sold/closed 21 houses. | |
| $ | 6,132 | 79 |
The Bank may provide construction financing. | |
The first two loans detailed above are each to different borrowers and the balance noted represents all of their borrowings with the Bank. The second two loans listed are to related parties. An additional loan totaling $1.0 million to the borrower for construction of the houses
was also outstanding as of December 31, 2009. The commitment on that loan is $4.7 million.
36
The increase in total land acquisition and development loans was offset by $7.1 million in paydowns, $8.0 million in charge-offs and $4.8 million in transfers to REO. All loans in this category are collateralized by the property which the loan was used to develop. Nonperforming land loans increased $6.0 million with $28.1 million
in additions and $12.0 million in charge-offs. One loan comprises the commercial real estate category.
The following table shows the migration of nonperforming loans (NPLs) through the portfolio in each category for the period December 31, 2008 compared to December 31, 2009:
|
On Loans Designated NPLs as of 12/31/09 |
||||||||||||||||||||||||||||
|
(Dollars in thousands)
Nonperforming loans |
# of Loans |
Balance at December 31, 2009 |
Additions |
Paydowns |
Charge-offs |
Transfers to REO |
Balance at December 31, 2008 |
|||||||||||||||||||||
|
Business |
7 | $ | 6,988 | $ | 9,909 | $ | (260 | ) | $ | (3,611 | ) | $ | (200 | ) | $ | 1,150 | ||||||||||||
|
Construction |
||||||||||||||||||||||||||||
|
Spec construction |
13 | 13,787 | 37,402 | (20,028 | ) | (8,904 | ) | (6,418 | ) | 11,735 | ||||||||||||||||||
|
Land acquisition and development |
9 | 54,740 | 51,865 | (7,072 | ) | (8,044 | ) | (4,808 | ) | 22,799 | ||||||||||||||||||
|
Land |
12 | 10,380 | 28,061 | (1,311 | ) | (12,017 | ) | (8,790 | ) | 4,437 | ||||||||||||||||||
|
Commercial R/E |
1 | 6,477 | 6,477 | - | - | - | - | |||||||||||||||||||||
|
Total construction |
35 | 85,384 | 123,805 | (28,411 | ) | (28,965 | ) | (20,016 | ) | 38,971 | ||||||||||||||||||
|
Commercial R/E |
1 | 12,581 | 12,969 | (154 | ) | - | (234 | ) | - | |||||||||||||||||||
|
Multifamily |
- | - | 2,100 | - | (246 | ) | (1,854 | ) | - | |||||||||||||||||||
|
Consumer |
7 | 486 | 858 | (3 | ) | (361 | ) | (10 | ) | 2 | ||||||||||||||||||
|
Residential |
4 | 657 | 2,616 | (253 | ) | (367 | ) | (1,494 | ) | 155 | ||||||||||||||||||
|
Total |
54 | $ | 106,096 | $ | 152,257 | $ | (29,081 | ) | $ | (33,550 | ) | $ | (23,808 | ) | $ | 40,278 | ||||||||||||
Most of the Bank’s nonperforming loans are individually analyzed for impairment. The Bank conducts an ongoing evaluation of its adversely classified credits including monthly loan reviews, monitoring sales activity and obtaining updated appraisals on the properties collateralizing these loans, reviews of the real estate market
in general, obtaining current financial statements from the borrowers and guarantors and assessing the general market trend. From this analysis, the Bank determines the amount of charge-offs or impairment for any particular loan. As of December 31, 2009, we have concluded that our level of loan loss analysis is adequate to support our level of adversely classified loans.
Of the total nonperforming loans as of December 31, 2009, 80.0% are real estate construction and 12% are commercial real estate. The other designated loan categories had no significant amounts of nonperforming loans compared to total loans outstanding in the respective categories.
The following table shows nonperforming loans versus total loans in each loan category:
|
(Dollars in thousands) |
||||||||||||
|
LOAN PORTFOLIO |
Balance at 12/31/2009 |
Nonperforming Loans (NPL) |
NPL as a % of Loans |
|||||||||
|
Business |
$ | 469,196 | $ | 6,988 | 1 | % | ||||||
|
Construction |
||||||||||||
|
Spec construction |
59,360 | 13,787 | 23 | % | ||||||||
|
Land acquisition and development |
120,712 | 54,740 | 45 | % | ||||||||
|
Land |
25,452 | 10,380 | 41 | % | ||||||||
|
Multifamily and custom construction |
18,923 | - | 0 | % | ||||||||
|
Commercial construction |
32,470 | 6,477 | 20 | % | ||||||||
|
Total construction |
256,917 | 85,384 | 33 | % | ||||||||
|
Commercial R/E |
183,286 | 12,581 | 7 | % | ||||||||
|
Multifamily |
82,418 | - | 0 | % | ||||||||
|
Home equity/consumer |
31,738 | 486 | 2 | % | ||||||||
|
Residential |
179,133 | 657 | 0 | % | ||||||||
|
Total |
$ | 1,202,688 | $ | 106,096 | 9 | % | ||||||
37
At December 31, 2009 and 2008, impaired loans totaled $183.7 million and $83.4 million, respectively. Impaired loans are those loans which are categorized as doubtful, nonaccrual, or loans which are analyzed for impairment. Additionally, troubled debt restructured loans, which had a modification of terms, are also considered impaired. At
December 31, 2009, loans totaling $176.1 million were subjected to individual impairment analysis. No impairment charges were taken and/or reserves established for $127.9 million of the individually analyzed loans. The allowance for loan losses allocated to these loans was approximately $6.4 million and $2.4 million at December 31, 2009 and 2008, respectively. Interest collected on impaired loans and included in income was $5.2 million for 2009, $4.5 million for 2008, and $1.8 million for 2007.
Loans are classified as restructured when a modification of terms is processed by the Bank, for economic or legal reasons related to the debtor’s financial difficulty, at terms and conditions that the Bank would not otherwise consider. In some cases, the Bank has extended the interest-only period of a loan or allowed a borrower to make
interest-only payments to assist the borrower while trying to sell the collateral securing the loan. Total restructured loans were $51.9 million, including $20.4 million in commercial real estate loans, $13.3 million in land acquisition and development loans, $11.8 million in spec construction loans, $3.6 million in business loans, $1.9 million in residential loans, and $867,000 in land loans at December 31, 2009 compared to $910,000, which included $863,000 in residential loans and $47,000 in business loans
at December 31, 2008. Of the $51.9 million in total restructured loans at December 31, 2009, $26.6 million were current in their payments and accruing interest and $25.3 million were nonaccruing. As of December 31, 2009, an additional $4.4 million was committed as additional funds on these restructured loans, primarily for the completion of residential construction.
Loans categorized as substandard or doubtful are considered to be adversely classified. At December 31, 2009, 2008, and 2007, loans totaling $208.1 million, $87.3 million, and $29.1 million were adversely classified. The average balances of adversely classified loans for the years ended December 31, 2009, 2008, and 2007, respectively, were
$203.1 million and $54.5 million, and $9.2 million; the Bank recognized $5.5 million, $2.2 million, and $561,000 of related interest income on such loans during the time they were adversely classified.
The Bank had one loan in the amount of $247,000 that was 90 days or more past due and still accruing interest at December 31, 2009. This loan was paid in full in January 2010.
Interest income that would have been recognized for the years ended December 31, 2009, December 31, 2008, and December 31, 2007, had non-accrual loans been current in accordance with their contractual terms, amounted to $7.5 million, $872,000, and $111,000, respectively. See Note
4 of the Notes to Consolidated Financial Statements listed in Item 15 for additional information about loans.
REO and Other Repossessed Assets
REO and other repossessed assets consist of property acquired by the Bank through foreclosure and are carried at the lower of the estimated fair value or the principal balance of the foreclosed loans. REO and other repossessed assets totaled $18.8 million at December 31, 2009, $1.4 million at December 31, 2008. There was no REO and other
repossessed assets at December 31, 2007. REO as of December 31, 2009 consisted of $13.1 million in construction/land development projects, $3.6 million in single-family residential condominiums, and $2.1 million in a multi-family condominium project.
The following table presents REO and other repossessed assets for the periods presented:
|
(Dollars in thousands) |
||||||||
|
REO and other repossessed assets |
December 31, 2009 |
December 31, 2008 |
||||||
|
Beginning balance |
$ | 1,446 | $ | - | ||||
|
Loans transferred to REO |
23,798 | 5,704 | ||||||
|
Loans transferred to other repossessed assets |
10 | 179 | ||||||
|
Capitalized improvements |
1,164 | - | ||||||
|
Sales |
(6,087 | ) | (4,434 | ) | ||||
|
Writedowns |
(1,256 | ) | - | |||||
|
Net loss on sales |
(233 | ) | (3 | ) | ||||
|
Ending balance |
$ | 18,842 | $ | 1,446 | ||||
38
Deposits
Deposit account balances totaled $1.1 billion at December 31, 2009, an increase of $133.0 million or 13.2% compared to $1.0 billion at December 31, 2008. Deposits totaled $904.9 million at December 31, 2007. Checking account balances grew $258.1 million to $444.9 million as of December 31, 2009, compared to $186.8 million for the prior year-end.
Continued marketing and sales management efforts directed at our High Performance Checking program resulted in dramatic growth in our checking account balances. Personal checking account balances grew by 188% or $192.1 million over the course of the year and business checking balances grew 78% or $66.0 million during the same time period. Money market deposit account balances decreased by 36.4% or $70.3 million. The reduction in money market account balances were primarily from the public sector and the
termination of a sweep account agreement with a money center bank. Certificates of deposit decreased 8.8% to $561.8 million. As business banking activity increases, management’s goal is to increase its noninterest-bearing or low interest accounts through the growth of commercial checking accounts.
The market for deposits has remained very competitive. It remains a key objective of the Bank to increase its demand deposit account balances and other low rate accounts.
The following table sets forth the average balances for each major category of deposits and the weighted average interest rate paid for deposits during the years ended December 31, 2009, 2008, and 2007.
|
(Dollars in thousands) |
December 31, 2009 |
December 31, 2008 |
December 31, 2007 |
|||||||||||||||||||||
|
Average Deposits by Type |
Amount |
Rate |
Amount |
Rate |
Amount |
Rate |
||||||||||||||||||
|
Noninterest-bearing demand deposits |
$ | 92,643 | — | % | $ | 88,185 | — | % | $ | 87,284 | — | % | ||||||||||||
|
Interest-bearing demand deposits |
200,671 | 1.32 | 72,817 | 1.65 | 51,021 | 1.46 | ||||||||||||||||||
|
Money market deposit |
133,005 | 0.98 | 297,312 | 2.46 | 284,843 | 4.32 | ||||||||||||||||||
|
Savings |
9,932 | 0.25 | 10,888 | 0.49 | 13,261 | 0.50 | ||||||||||||||||||
|
Time certificates |
581,097 | 2.25 | 497,114 | 3.75 | 444,726 | 4.97 | ||||||||||||||||||
|
Total |
$ | 1,017,348 | $ | 966,316 | $ | 881,135 | ||||||||||||||||||
See Note 9 of the Notes to Consolidated Financial Statements listed in Item 15 for additional information about deposits.
FHLB Advances
The Bank uses Federal Home Loan Bank of Seattle (FHLB) advances to provide intermediate and longer term funding, as well as to augment deposits. At December 31, 2009, the Bank had $239.0 million in FHLB advances compared to $249.0 million as of December 31, 2008. For 2009, FHLB advances averaged 14.9% of assets compared to 16.7% in 2008.
Subject to its line of credit with the FHLB, the availability of eligible collateral, and within the parameters of the Bank’s liquidity management policy, the Bank will continue to use FHLB advances as a funding source. See Note 10 of the Notes to Consolidated Financial Statements listed in Item 15 for additional information about FHLB advances.
Securities Sold Under Agreements to Repurchase and Lines of Credit
The Bank also uses repurchase agreements for funding. At December 31, 2009, the Bank had executed $145.4 million in repurchase agreements compared to $146.4 million a year earlier. The Bank participates in the Federal Reserve Term Auction Facility (TAF) and had an outstanding balance of $20.0 million at December 31, 2009. See Note 11 of the
Notes to Consolidated Financial Statements listed in Item 15 for additional information about securities sold under agreements to repurchase and lines of credit.
Junior Subordinated Debentures (Trust Preferred Securities)
In 2000, the Corporation issued $10.3 million in trust preferred securities, which are termed “junior subordinated debentures.” These junior subordinated debentures have a fixed rate of 11.0% and mature on March 1, 2030, but are callable at a premium beginning March 1, 2010. In December 2004, the Corporation issued an additional
$5.2 million in junior subordinated debentures. These debentures had a fixed rate of 5.82% for the first five years and as of January 7, 2010, float at the three-month LIBOR plus 1.90% for the remaining 25 years. The debentures are callable at par after the first five years. On March 30, 2006, the Corporation issued an additional $10.3 million in junior subordinated debentures. These debentures have an initial rate of 6.50% set for five years and then convert to a three-month LIBOR plus 1.40% for the remaining twenty-five
years. The debentures are callable at par
39
Stockholders’ Equity and Regulatory Matters
On November 21, 2008, Cascade completed its $39.0 million capital raise as a participant in the U.S. Treasury Department’s Capital Purchase Program. Under the terms of the transaction, the Corporation issued 38,970 shares of Series A Fixed-Rate Cumulative Perpetual Preferred Stock, and a warrant to purchase 863,442 shares of the Corporation’s
common stock at an exercise price of $6.77 per share.
Banking regulations require the Bank to maintain minimum levels of capital. As of December 31, 2009, the Bank remained a “well-capitalized” institution (the FDIC’s highest rating), under regulatory guidelines, with a Tier 1 capital-to-asset ratio of 8.32% and a risk-based capital-to-asset ratio of 12.40%. The Bank’s
regulatory capital ratios are discussed in more detail in Note 16 of the Notes to Consolidated Financial Statements listed in Item 15.
Federal Reserve guidelines require the Corporation, on a consolidated basis, to maintain minimum levels of capital as well. At December 31, 2009, the Corporation's total risk-based capital to risk-weighted assets was 12.82%, compared to 13.26% at December 31, 2008, and 10.80%
at December 31, 2007.
Although we remain “well-capitalized” based on our regulatory capital ratios, the FDIC Memorandum suggests, and recent conversations with the Bank’s regulators have confirmed, our need to raise additional capital, if and when available, to be able to address the potential risks of additional loan losses and current adverse
economic conditions and increase the Bank’s regulatory capital ratios. See Item 1 of this report captioned “Regulatory Actions.”
We continue to take steps to strengthen our capital position. Evaluation of the need to raise additional capital began in mid 2009, and in the fourth quarter of 2009, the Board of Directors retained an investment banking firm to assist in raising capital and deleveraging our balance sheet. Our ability to raise additional capital has
been adversely affected by unfavorable conditions in the capital markets and our financial performance, and we have not raised additional capital to date.
If the Bank or the Corporation were to engage in other unsafe and unsound banking practices, the regulators have various enforcement tools available to them including the issuance of capital directives, orders to cease engaging in certain business activities and the issuance of modified or additional orders or agreements.
The Corporation is committed to managing capital for maximum stockholder benefit and maintaining protection for depositors and creditors. The Corporation manages various capital levels at both the holding company and subsidiary bank level to attempt to maintain adequate capital ratios and levels in accordance with external regulations and
capital guidelines established by the Board of Directors. The Corporation had paid its shareholders a cash dividend on a quarterly basis since 2002. In June 2009, the Corporation announced that it would temporarily suspend its regular quarterly cash dividend on common stock to preserve capital.
Average shares outstanding, stock options, net income per share and book value per share for all periods presented have been retroactively adjusted to reflect stock splits.
RESULTS OF OPERATIONS
Net (Loss) Income
Cascade Financial Corporation had a net loss of $23.5 million for the year ended December 31, 2009, compared to net income of $2.1 million for the year ended December 31, 2008. After adjustments for preferred stock dividends and accretion of the issuance discount on preferred stock issued to the U.S. Treasury, net loss attributable to common
stockholders for the year ended December 31, 2009, was $25.8 million as compared to net income of $1.8 million for the year ended December 31, 2008. The primary factors contributing to the loss in 2009 were an $11.7 million goodwill impairment charge and a $44.2 million provision for loan losses. Net interest income decreased $2.6 million to $43.3 million in 2009 primarily due to higher levels of nonperforming loans. Other income increased $7.8 million to $16.7 million compared to $8.9 million for the year ended
December 31, 2008, primarily due to a fair value adjustment on financial instruments of $7.2 million for the year ended December 31, 2009, compared to $912,000 for the year ended December 31, 2008. The Corporation earned net income of $15.5 million for the fiscal year ended December 31, 2007.
40
Return on Average Equity and Return on Average Common Equity
Return on average equity for the year ended December 31, 2009, was (16.35)% compared to 1.62% for the same period in 2008. Return on average equity for the fiscal year ending December 31, 2007, was 13.23%. Return on average common equity (average equity excluding preferred stock) was (24.21)% for the year ended December 31, 2009 and 1.47%
for the year ended December 31, 2008. The decline in return on average equity from 2008 to 2009 was driven by the goodwill impairment charge and a substantial increase in the Corporation’s provision for loan losses.
Non-GAAP Financial Measure - Return on Average Tangible Common Equity
Return on average tangible common equity (average equity less average goodwill and preferred stock), was (28.54)% for the year ended December 31, 2009, compared to 1.83% in 2008 and 16.88% in 2007. The June 2004 acquisition of Issaquah Bancshares, Inc. (Issaquah) generated $26.3 million in goodwill and intangible assets and a like amount
of capital. Eliminating the average intangible asset and reducing the capital by the same amount produces average tangible equity.
Return on average tangible common equity is determined by methods other than those in accordance with accounting principles generally accepted in the United States of America (GAAP). This measure excludes the average balance of acquisition-related goodwill and intangibles and preferred stock in determining average tangible common shareholders’
equity. Management believes the presentation of this financial measure, excluding the impact of these items, provides useful supplemental information that is essential for a proper understanding of the financial results of Cascade Financial Corporation. This disclosure should not be viewed as a substitute for results determined to be in accordance with GAAP, nor is it necessarily comparable to non-GAAP performance measures that may be presented by other companies.
A summary of return on average tangible common equity follows:
|
(Dollars in thousands) |
Years Ended December 31, |
|||||||
|
2009 |
2008 |
|||||||
|
Net (loss) income |
$ | (23,468 | ) | $ | 2,090 | |||
|
Dividends on preferred stock |
1,943 | 216 | ||||||
|
Accretion of issuance discount on preferred stock |
422 | 35 | ||||||
|
Net (loss) income available for common stockholders |
$ | (25,833 | ) | $ | 1,839 | |||
|
Average total equity |
$ | 143,534 | $ | 129,083 | ||||
|
Average preferred stock |
36,818 | 3,683 | ||||||
|
Average common equity |
106,716 | 125,400 | ||||||
|
Average goodwill and intangibles |
16,193 | 25,149 | ||||||
|
Average tangible common equity |
$ | 90,523 | $ | 100,251 | ||||
|
Return on average tangible common equity |
(28.54 | )% | 1.83 | % | ||||
Net Interest Income
The largest component of the Corporation’s earnings is net interest income. Net interest income is the difference between interest-earning assets (primarily loans, interest-bearing deposits with banks, and investment securities) and the interest expense associated with interest-bearing liabilities (deposits and borrowings). Interest
earned and interest paid is affected by general economic conditions, including the demand for loans, cost of deposits, market rates of interest and government policies. The Corporation’s operations may be sensitive to changes in interest rates and the resulting impact on net interest income.
Net interest income for the year ended December 31, 2009, decreased by 5.7%, or $2.6 million, to $43.3 million from $45.9 million for the year ended December 31, 2008. The decrease was primarily due to higher levels of nonperforming loans. Net interest income for the fiscal year ended December 31, 2007, was $43.4 million.
Average earning assets increased 1.7% to $1.5 billion for the year ended December 31, 2009, from $1.4 billion for the year ended December 31, 2008. Average earning assets were $1.3 billion for the year ended December 31, 2007.
41
Net interest margin is net interest income expressed as a percent of average earning assets. The net interest margin for the year ended December 31, 2009, was 2.96%, compared to 3.20% for the year ended December 31, 2008. The decline in the net interest margin was largely due to the increase in nonperforming loans and an increase in low-yielding
cash to enhance balance sheet liquidity. The net interest margin was negatively impacted by the cost of building additional balance sheet liquidity. The yield on earning assets decreased 85 basis points to 5.60% in 2009. The cost of interest-bearing liabilities decreased 81 basis points to 2.76% for the year.
42
Average Balances and an Analysis of Average Rates Earned and Paid
The following table shows average balances and interest income or interest expense, with the resulting average yield or cost by category.
|
2009 |
2008 |
2007 |
|||||||||||||||||||||||||||||||
|
INTEREST |
INTEREST |
INTEREST |
|||||||||||||||||||||||||||||||
|
(Dollars in thousands) |
AVERAGE |
AND |
YIELD/ |
AVERAGE |
AND |
YIELD/ |
AVERAGE |
AND |
YIELD/ |
||||||||||||||||||||||||
|
BALANCE |
DIVIDEND |
COST |
BALANCE |
DIVIDEND |
COST |
BALANCE |
DIVIDEND |
COST |
|||||||||||||||||||||||||
|
ASSETS |
|||||||||||||||||||||||||||||||||
|
Interest-earning assets |
|||||||||||||||||||||||||||||||||
|
Residential loans |
$ | 145,970 | $ | 8,027.0 | 5.50 | % | $ | 107,912 | $ | 6,478 | 6.00 | % | $ | 94,608 | $ | 5,753 | 6.08 | % | |||||||||||||||
|
Multifamily loans |
89,399 | 5,783 | 6.47 | 48,272 | 3,367 | 6.98 | 18,467 | 1,416 | 7.67 | ||||||||||||||||||||||||
|
Commercial R/E loans |
169,029 | 10,872 | 6.43 | 117,510 | 7,857 | 6.69 | 117,952 | 8,259 | 7.00 | ||||||||||||||||||||||||
|
Construction loans |
244,129 | 12,105 | 4.96 | 384,410 | 25,427 | 6.61 | 332,467 | 30,094 | 9.05 | ||||||||||||||||||||||||
|
Consumer loans |
30,933 | 2,016 | 6.52 | 29,111 | 1,931 | 6.63 | 27,575 | 2,128 | 7.72 | ||||||||||||||||||||||||
|
Business loans |
469,156 | 31,036 | 6.62 | 475,716 | 32,881 | 6.91 | 455,024 | 33,908 | 7.45 | ||||||||||||||||||||||||
|
Total loans (1) |
1,148,616 | 69,839 | 6.08 | 1,162,931 | 77,941 | 6.70 | 1,046,093 | 81,558 | 7.80 | ||||||||||||||||||||||||
|
Securities available-for-sale |
209,736 | 9,137 | 4.36 | 123,177 | 6,280 | 5.10 | 102,613 | 4,828 | 4.71 | ||||||||||||||||||||||||
|
Securities held-to-maturity |
54,053 | 2,759 | 5.01 | 140,008 | 8,213 | 5.87 | 88,535 | 4,527 | 5.11 | ||||||||||||||||||||||||
|
Securities held-for-trading |
- | - | - | - | - | - | 38,614 | 1,884 | 4.88 | ||||||||||||||||||||||||
|
Interest-earning deposits in |
|||||||||||||||||||||||||||||||||
|
other institutions |
48,793 | 93 | 0.19 | 8,939 | 137 | 1.53 | 21,607 | 1,138 | 5.27 | ||||||||||||||||||||||||
|
Total securities and |
|||||||||||||||||||||||||||||||||
|
interest-earning |
|||||||||||||||||||||||||||||||||
|
deposits |
312,582 | 11,989 | 3.84 | 272,124 | 14,630 | 5.38 | 251,369 | 12,377 | 4.92 | ||||||||||||||||||||||||
|
Total interest-earning |
|||||||||||||||||||||||||||||||||
|
assets |
1,461,198 | 81,828 | 5.60 | 1,435,055 | 92,571 | 6.45 | 1,297,462 | 93,935 | 7.24 | ||||||||||||||||||||||||
|
Noninterest-earning assets |
|||||||||||||||||||||||||||||||||
|
Office properties and |
|||||||||||||||||||||||||||||||||
|
equipment, net |
15,223 | 15,420 | 13,744 | ||||||||||||||||||||||||||||||
|
REO and other repossessed |
|||||||||||||||||||||||||||||||||
|
assets, net |
6,556 | 1,090 | - | ||||||||||||||||||||||||||||||
|
Nonperforming loans |
93,972 | 20,141 | - | ||||||||||||||||||||||||||||||
|
Other noninterest- |
|||||||||||||||||||||||||||||||||
|
earning assets |
63,252 | 62,752 | 59,103 | ||||||||||||||||||||||||||||||
|
Total assets |
$ | 1,640,201 | $ | 1,534,458 | $ | 1,370,309 | |||||||||||||||||||||||||||
|
LIABILITIES AND EQUITY |
|||||||||||||||||||||||||||||||||
|
Interest-bearing liabilities |
|||||||||||||||||||||||||||||||||
|
Savings accounts |
$ | 9,932.0 | $ | 25 | 0.25 | % | $ | 10,888 | $ | 53 | 0.49 | % | $ | 13,261 | $ | 66 | 0.50 | % | |||||||||||||||
|
Checking accounts |
200,671 | 2,643 | 1.32 | 72,817 | 1,203 | 1.65 | 51,021 | 747 | 1.46 | ||||||||||||||||||||||||
|
Money market accounts |
133,005 | 1,308 | 0.98 | 297,312 | 7,311 | 2.46 | 284,843 | 12,314 | 4.32 | ||||||||||||||||||||||||
|
Certificates of deposit |
581,097 | 13,088 | 2.25 | 497,115 | 18,648 | 3.75 | 444,726 | 22,093 | 4.97 | ||||||||||||||||||||||||
|
Total interest-bearing |
|||||||||||||||||||||||||||||||||
|
deposits |
924,705 | 17,064 | 1.85 | 878,132 | 27,215 | 3.10 | 793,851 | 35,220 | 4.44 | ||||||||||||||||||||||||
|
Other interest-bearing liabilities |
|||||||||||||||||||||||||||||||||
|
FHLB advances |
243,904 | 10,584 | 4.34 | 256,898 | 10,955 | 4.26 | 225,723 | 10,240 | 4.53 | ||||||||||||||||||||||||
|
Securities sold under |
|||||||||||||||||||||||||||||||||
|
agreements to repurchase |
148,323 | 8,625 | 5.82 | 124,211 | 6,021 | 4.08 | 107,516 | 2,960 | 2.75 | ||||||||||||||||||||||||
|
Junior subordinated |
|||||||||||||||||||||||||||||||||
|
debentures payable |
24,512 | 2,114 | 8.62 | 26,431 | 2,120 | 8.02 | 27,295 | 2,120 | 7.77 | ||||||||||||||||||||||||
|
Other borrowings |
55,890 | 153 | 0.27 | 22,553 | 375 | 1.92 | - | - | - | ||||||||||||||||||||||||
|
Total interest-bearing |
|||||||||||||||||||||||||||||||||
|
liabilities |
1,397,334 | 38,540 | 2.76 | 1,308,225 | 46,686 | 3.57 | 1,154,385 | 50,540 | 4.38 | ||||||||||||||||||||||||
|
Other liabilities |
99,333 | 97,150 | 98,390 | ||||||||||||||||||||||||||||||
|
Total liabilities |
1,496,667 | 1,405,375 | 1,252,775 | ||||||||||||||||||||||||||||||
|
Stockholders’ equity |
143,534 | 129,083 | 117,534 | ||||||||||||||||||||||||||||||
|
Total liabilities and |
|||||||||||||||||||||||||||||||||
|
stockholders’ equity |
$ | 1,640,201 | $ | 1,534,458 | $ | 1,370,309 | |||||||||||||||||||||||||||
|
Net interest income (2) |
$ | 43,288 | $ | 45,885 | $ | 43,395 | |||||||||||||||||||||||||||
|
Interest rate spread (3) |
2.84 | % | 2.88 | % | 2.86 | % | |||||||||||||||||||||||||||
|
Net interest margin (4) |
2.96 | % | 3.20 | % | 3.34 | % | |||||||||||||||||||||||||||
|
Average interest-earning
assets to average interest-
bearing liabilities |
104.57 | % | 109.69 | % | 112.39 | % | |||||||||||||||||||||||||||
(1) Does not include interest or balances on loans 90 days or more past due that are classified as nonaccruing.
(2) Interest and dividends on total interest-earning assets less interest on total interest-bearing liabilities.
(3) Total interest-earning assets yield less total interest-bearing liabilities cost.
(4) Net interest income as a percentage of total interest-earning assets.
43
Rate/Volume Analysis
The following table sets forth the effects of changing rates and volumes on net interest income of the Corporation. Information is provided with respect to (i) effects on interest income attributable to changes in volume (changes in volume multiplied by prior rate); (ii) effects on interest income attributable to changes in rate (changes
in rate multiplied by prior volume); and (iii) changes in rate/volume mix (change in rate multiplied by change in volume).
|
Year Ended December 31, 2009 |
||||||||||||||||
|
(Dollars in thousands) |
Compared to Year Ended
December 31, 2008
Increase (Decrease) Due to |
|||||||||||||||
|
Interest-earning assets |
Rate |
Volume |
Mix |
Net |
||||||||||||
|
Residential loans |
$ | (544 | ) | $ | 2,285 | $ | (192 | ) | $ | 1,549 | ||||||
|
Multifamily loans |
(244 | ) | 2,869 | (209 | ) | 2,416 | ||||||||||
|
Commercial R/E loans |
(299 | ) | 3,445 | (131 | ) | 3,015 | ||||||||||
|
Construction loans |
(6,366 | ) | (9,279 | ) | 2,323 | (13,322 | ) | |||||||||
|
Consumer loans |
(34 | ) | 121 | (2 | ) | 85 | ||||||||||
|
Business loans |
(1,411 | ) | (453 | ) | 19 | (1,845 | ) | |||||||||
|
Total loans |
(8,898 | ) | (1,012 | ) | 1,808 | (8,102 | ) | |||||||||
|
Securities held-for-trading |
— | — | — | — | ||||||||||||
|
Securities available-for-sale |
(914 | ) | 4,413 | (642 | ) | 2,857 | ||||||||||
|
Securities held-to-maturity |
(1,067 | ) | (5,042 | ) | 655 | (5,454 | ) | |||||||||
|
Daily interest-earning deposits |
(120 | ) | 611 | (535 | ) | (44 | ) | |||||||||
|
Total net change in income on interest-earning assets |
$ | (10,999 | ) | $ | (1,030 | ) | $ | 1,286 | $ | (10,743 | ) | |||||
|
Interest-bearing liabilities |
||||||||||||||||
|
Interest-bearing deposits |
$ | (12,109 | ) | $ | 1,217 | $ | 741 | $ | (10,151 | ) | ||||||
|
FHLB advances |
193 | (554 | ) | (10 | ) | (371 | ) | |||||||||
|
Other borrowings |
1,049 | 1,644 | (317 | ) | 2,376 | |||||||||||
|
Total net change in expenses on interest-bearing liabilities |
$ | (10,867 | ) | $ | 2,307 | $ | 414 | $ | (8,146 | ) | ||||||
|
Net (decrease) in net interest income |
$ | (2,597 | ) | |||||||||||||
|
Year Ended December 31, 2008 |
||||||||||||||||
|
Compared to Year Ended
December 31, 2007
Increase (Decrease) Due to |
||||||||||||||||
|
Interest-earning assets |
Rate |
Volume |
Mix |
Net |
||||||||||||
|
Residential loans |
$ | (74 | ) | $ | 809 | $ | (10 | ) | $ | 725 | ||||||
|
Multifamily loans |
(128 | ) | 2,285 | (206 | ) | 1,951 | ||||||||||
|
Commercial R/E loans |
(372 | ) | (31 | ) | 1 | (402 | ) | |||||||||
|
Construction loans |
(8,103 | ) | 4,702 | (1,266 | ) | (4,667 | ) | |||||||||
|
Consumer loans |
(299 | ) | 119 | (17 | ) | (197 | ) | |||||||||
|
Business loans |
(2,457 | ) | 1,542 | (112 | ) | (1,027 | ) | |||||||||
|
Total loans |
(11,433 | ) | 9,426 | (1,610 | ) | (3,617 | ) | |||||||||
|
Securities held-for-trading |
— | (1,884 | ) | — | (1,884 | ) | ||||||||||
|
Securities available-for-sale |
333 | 1,047 | 72 | 1,452 | ||||||||||||
|
Securities held-to-maturity |
666 | 2,632 | 388 | 3,686 | ||||||||||||
|
Daily interest-earning deposits |
(806 | ) | (667 | ) | 472 | (1,001 | ) | |||||||||
|
Total net change in income on interest-earning assets |
$ | (11,240 | ) | $ | 10,554 | $ | (678 | ) | $ | (1,364 | ) | |||||
|
Interest-bearing liabilities |
||||||||||||||||
|
Interest-bearing deposits |
$ | (10,625 | ) | $ | 3,449 | $ | (829 | ) | $ | (8,005 | ) | |||||
|
FHLB advances |
(598 | ) | 1,394 | (81 | ) | 715 | ||||||||||
|
Other borrowings |
1,529 | 1,466 | 441 | 3,436 | ||||||||||||
|
Total net change in expenses on interest-bearing liabilities |
$ | (9,694 | ) | $ | 6,309 | $ | (469 | ) | $ | (3,854 | ) | |||||
|
Net increase in net interest income |
$ | 2,490 | ||||||||||||||
44
Other Income
Other income is derived from sources other than interest and fees on earning assets. The Corporation’s primary sources of other income are service charge fees on deposit accounts, other service fees, the accretion of cash surrender value of bank owned life insurance (BOLI), fair value gains on financial instruments, gains on the sale
of single-family residential and other loans, gains on the sale of securities, and rental income, primarily on space at the building that formerly served as the headquarters of Issaquah Bank. Other income for the year ended December 31, 2009, was $16.7 million compared to $8.9 million for the year ended December 31, 2008. The increase is largely due to the increase in the fair value adjustment on the Corporation’s $10.0 million par junior subordinated debentures, which was up $6.3 million in
2009. Other income for the year ended December 31, 2007, was $7.6 million.
Other Expenses
Other expense represents costs not associated with deposits and other interest-bearing liabilities. It includes expenses associated with personnel, premises and equipment, marketing, and other operations.
Other expenses, excluding the goodwill impairment charge of $11.7 million, decreased by $10.7 million to $35.2 million for the year ended December 31, 2009, from $45.9 million for the year ended December 31, 2008. Other expenses were $26.7 million for the year ended December 31, 2007. The Corporation owned preferred shares issued by FNMA
($10.2 million of original book value) and FHLMC ($8.4 million of original book value) with a combined original book value of approximately $18.6 million. Following the placement of these two government sponsored enterprises into conservatorship, and the decline in the market value of these securities, the Corporation recorded a pre-tax OTTI charge of $858,000 in the first quarter of 2009 when it sold these securities, following a $17.3 million charge in the third quarter of 2008. Salaries and employee benefits
decreased overall by $540,000 to $14.0 million during 2009 compared to the prior year, in spite of the expense of a full year of operation of the Burlington branch, opened in May 2008, and the new Edmonds branch, opened in May 2009. FDIC insurance premiums increased to $2.6 million, including a $732,000 FDIC special assessment. Writedowns/losses on REO increased to $1.5 million and real estate owned (REO) and real estate in acquisition (REA) expense increased to $1.8 million for the year ended December 31, 2009,
compared to the prior year. All other expenses increased $950,000 to $7.8 million for the year ended December 31, 2009, compared to $6.8 million for the year ended December 31, 2008. All other expenses for the year ended December 31, 2009 included an assessment of $368,000 from the Washington Public Deposit Protection Commission for public deposits arising from the failure of the Bank of Clark County. All other expenses were $6.6 million for the year ended December 31, 2007.
Efficiency Ratio
A standard measurement used to calculate the overhead costs of financial institutions is the efficiency ratio. The efficiency ratio is calculated by dividing other expense by total revenue, which generally indicates how much an institution spends to generate a dollar of revenue. The lower the efficiency ratio, the more efficient the institution.
Management continues to look for ways to improve the efficiency ratio by increasing other income and net interest income while diligently controlling costs and maintaining high standards of service. For the years ending December 31, 2009, 2008, and 2007, the Corporation’s efficiency ratio was 78.17%, 83.77%, and 52.36%, respectively.
Non-GAAP Financial Measure – Efficiency Ratio (Excluding OTTI and Goodwill Impairment Charges)
The efficiency ratio (excluding OTTI and goodwill impairment charges) is determined by methods other than those in accordance with accounting principles generally accepted in the United States of America (GAAP). For the years ending December 31, 2009, 2008, and 2007, the Corporation’s efficiency ratio (excluding OTTI and goodwill impairment
charges) was 57.23%, 52.11%, and 52.36%, respectively. This efficiency ratio calculation for the year ended December 31, 2009 excludes the OTTI charge of $858,000 and the goodwill impairment charge of $11.7 million. The efficiency ratio calculation for the year ended December 31, 2008 excludes the OTTI charge of $17.3 million. Management believes the presentation of this financial measure, excluding the impact of these items, provides useful supplemental information that is essential for a proper understanding
of the financial results of the Corporation. This disclosure should not be viewed as a substitute for results determined to be in accordance with GAAP, nor is it necessarily comparable to non-GAAP performance measures that may be presented by other companies.
45
A summary of the efficiency ratio (excluding OTTI and goodwill impairment charges) follows:
|
(Dollars in thousands) |
Years Ended December 31, |
|||||||||||
|
2009 |
2008 |
2007 |
||||||||||
|
Total other expenses |
$ | 46,887 | $ | 45,881 | $ | 26,682 | ||||||
|
Less OTTI |
858 | 17,338 | - | |||||||||
|
Less goodwill impairment charge |
11,700 | - | - | |||||||||
|
Total other expenses |
$ | 34,329 | $ | 28,543 | $ | 26,682 | ||||||
|
Net interest income |
$ | 43,288 | $ | 45,885 | $ | 43,395 | ||||||
|
Other income |
16,696 | 8,887 | 7,566 | |||||||||
|
Total income |
$ | 59,984 | $ | 54,772 | $ | 50,961 | ||||||
|
Efficiency ratio (excluding OTTI and goodwill impairment charge) |
57.23 | % | 52.11 | % | 52.36 | % | ||||||
Liquidity Management
Liquidity management focuses on the need to meet both short-term funding requirements and long-term strategies and goals on a timely and cost effective basis. The objective of liquidity management is to ensure the continuous availability of funds to meet the demands of depositors and creditors and to fund customers’ borrowing needs.
At December 31, 2009, 2008 and 2007, cash and cash equivalents totaled $145.6 million, $53.5 million, and $14.5 million, respectively. The purpose of the increase in 2009 was to meet the Bank’s objective of increasing balance sheet liquidity. The Bank’s primary sources of funds include deposits, the sale of securities under agreements to repurchase, advances from the FHLB of Seattle and the Federal Reserve Bank of San Francisco, repayments and prepayments of loans, proceeds from the sale of loans
and investment securities, and interest from loans and investment securities. While scheduled principal repayments on loans are a relatively predictable source of funds, deposit inflows and outflows, and loan prepayments are greatly influenced by interest rates, economic conditions and competition.
The primary source of borrowings are Federal Home Loan Bank of Seattle (FHLB-Seattle) advances, repurchase agreements and starting in 2008, the Term Auction Facility (TAF) from the Federal Reserve Bank (FRB). At December 31, 2009, $293.0 million of additional borrowing capacity remained under the Bank’s existing credit line from the
FHLB-Seattle, which is 35% of the Bank’s assets or up to approximately $597.0 million. The use of this line of credit is subject to the availability of eligible collateral, which includes residential mortgages, investment grade securities, and commercial real estate mortgages. At December 31, 2009, the Bank had unencumbered eligible collateral of approximately $76.8 million to pledge against the line. In addition, the Bank has the ability to borrow through repurchase agreements. Under these agreements,
borrowings are collateralized with mortgage-backed securities or other investment securities.
The Bank also has a $154.0 million line of credit with the Federal Reserve Bank of San Francisco collateralized by commercial and construction loans. As of December 31, 2009, $20.0 million in TAF borrowings were outstanding against this line.
Liquidity management is of critical importance to the Bank in that it relies upon on-balance sheet liquidity as well as wholesale sources of funds (e.g. FHLB-Seattle advances and Federal Reserve borrowings). While these wholesale sources have proven to be stable and reliable, an interruption in the availability of these sources could have
an adverse impact on the operations of the Corporation. As noted above, the Bank has increased its on-balance sheet sources of liquidity. Also see the Consolidated Statement of Cash Flows in the financial statement section of the Consolidated Financial Statements for further information regarding liquidity.
Interest Rate Risk Management
Management considers interest rate risk to be a market risk that could have a material effect on the Corporation’s financial condition and results of operations.
The Corporation has taken steps to balance its sensitivity to changes in interest rates by altering its asset and liability mix. The vast majority of fixed-rate loans have repricing periods with a maximum of five years. The mix of floating and fixed-rate assets is designed to mitigate the impact of rate changes on the Corporation’s
net interest income. Also, the
46
Interest rate risk is monitored using several methodologies, principally financial modeling. The earnings exposure to interest rate changes is evaluated in the context of certain upward and downward interest rate changes occurring instantaneously. At December 31, 2009, a 200 basis point increase in rates would increase forecasted net interest
income over a twelve-month period by approximately 0.6%. A 200 basis point decrease in rates would decrease interest income by 0.2% according to the model.
The changes in the fair value of assets and liabilities and the resulting impact on the fair value of equity are also modeled under different rate scenarios. In the 200 basis point increase scenario, the fair value of equity declines by $17.5 million or 13%, a 200 basis point decrease in rates would decrease the fair value of equity by $4.0
million or 2.9%. Both are within the guideline established by the Bank’s Asset/Liability Policy.
The Corporation has maintained a trading account for financial instruments in the past, however there was no activity during 2009. The Corporation is not subject to foreign currency exchange rate risk or commodity price risk.
The individual categories of assets and liabilities that are subject to interest rate sensitivity as of December 31, 2009, are shown in the following table.
|
INTEREST REPRICING ASSUMPTIONS |
||||||||||||||||||||||||||||
|
(Dollars in thousands)
|
<1 YEAR |
1-3
YEARS |
3-5
YEARS |
5-10 YEARS |
10 YEARS
AND UP |
TOTAL |
FAIR VALUE |
|||||||||||||||||||||
|
Interest-Sensitive Assets |
||||||||||||||||||||||||||||
|
Total loans* |
$ | 635,861 | $ | 182,916 | $ | 239,483 | $ | 29,704 | $ | 8,628 | $ | 1,096,592 | $ | 1,101,265 | ||||||||||||||
|
Investments and other interest-earning assets |
229,058 | 31,521 | 17,529 | 129,056 | 181 | 407,345 | 405,111 | |||||||||||||||||||||
|
Total |
$ | 864,919 | $ | 214,437 | $ | 257,012 | $ | 158,760 | $ | 8,809 | $ | 1,503,937 | $ | 1,506,376 | ||||||||||||||
|
Interest-Sensitive Liabilities |
||||||||||||||||||||||||||||
|
Checking accounts |
$ | 80,987 | $ | 79,126 | $ | 124,271 | $ | 55,356 | $ | 5,458 | $ | 345,198 | $ | 331,332 | ||||||||||||||
|
Money market accounts |
72,909 | 48,665 | 1,555 | - | - | 123,129 | 122,769 | |||||||||||||||||||||
|
Savings accounts |
3,201 | 3,600 | 3,200 | - | - | 10,001 | 9,798 | |||||||||||||||||||||
|
Certificates of deposit |
443,604 | 97,493 | 20,625 | - | - | 561,722 | 564,208 | |||||||||||||||||||||
|
Borrowings |
20,000 | 10,410 | 80,000 | 269,000 | 25,000 | 404,410 | 455,917 | |||||||||||||||||||||
|
Junior subordinated debentures payable |
5,155 | 10,310 | - | - | 10,310 | 25,775 | 18,806 | |||||||||||||||||||||
|
Total |
$ | 625,856 | $ | 249,604 | $ | 229,651 | $ | 324,356 | $ | 40,768 | $ | 1,470,235 | $ | 1,502,830 | ||||||||||||||
|
Rate gap |
$ | 239,063 | $ | (35,167 | ) | $ | 27,361 | $ | (165,596 | ) | $ | (31,959 | ) | $ | 33,702 | |||||||||||||
|
Cumulative rate gap |
239,063 | 203,896 | 231,257 | 65,661 | 33,702 | |||||||||||||||||||||||
|
Cumulative rate gap as a percentage of total interest-
earning assets |
15.89 | % | 13.56 | % | 15.38 | % | 4.37 | % | 2.24 | % | 2.24 | % | ||||||||||||||||
*Excludes nonaccruing loans
Off-Balance Sheet Arrangements: Credit Commitments
Commitments to extend credit are agreements to lend to a customer as long as there is no violation of any condition established in the contract. Commitments generally have fixed expiration dates or other termination clauses and may require payment of a fee. Since many of the commitments are expected to expire without being drawn upon, the
total commitment amounts do not necessarily represent future cash requirements.
The Bank underwrites its standby letters of credit using its policies and procedures applicable to loans in general. Standby letters of credit are made on an unsecured and secured basis. The Bank has not incurred any losses on its commitments in 2009 or 2008.
47
A summary of the notional amount of the Bank’s financial instruments with off-balance sheet risk at December 31, 2009 follows:
|
(Dollars in thousands) |
TOTAL |
|||
|
Commitments to extend credit |
$ | 133,859 | ||
|
Standby letters of credit and financial guarantees written |
1,695 | |||
|
Unused commitments on bankcards |
13,621 | |||
|
Total |
$ | 149,175 | ||
Contractual Obligations and Commitments
The following table sets forth the Corporation’s long-term contractual obligations:
|
(Dollars in thousands) |
PAYMENTS DUE PER PERIOD | |||||||||||||||||||
|
<1 YEAR |
1-3 YEARS |
3-5 YEARS |
THEREAFTER |
TOTAL |
||||||||||||||||
|
Certificates of deposit |
$ | 443,604 | $ | 101,767 | $ | 16,351 | $ | - | $ | 561,722 | ||||||||||
|
Federal Home Loan Bank advances |
- | 50,000 | 40,000 | 149,000 | 239,000 | |||||||||||||||
|
Securities sold under agreements to repurchase |
410 | - | - | 145,000 | 145,410 | |||||||||||||||
|
Operating leases |
868 | 1,693 | 1,614 | 7,727 | 11,902 | |||||||||||||||
|
Junior subordinated debentures |
- | - | - | 18,806 | 18,806 | |||||||||||||||
|
Total |
$ | 444,882 | $ | 153,460 | $ | 57,965 | $ | 320,533 | $ | 976,840 | ||||||||||
See additional discussion under Notes 9 through 12 and Note 20 to the Consolidated Financial Statements for the year ended December 31, 2009.
Significant Concentrations of Credit Risk
Concentration of credit risk is the risk associated with a lack of diversification, such as having substantial loan concentrations in a specific type of loan within our loan portfolio, thereby exposing us to greater risks resulting from adverse economic, political, regulatory, geographic, industrial or credit developments. At December
31, 2009, our most significant concentration of credit risk was in loans secured by real estate. Approximately 85% of Cascade’s loan portfolio is secured by real estate. Over the last two years, there has been deterioration in the residential development market which has led to an increase in nonperforming loans and the allowance for loan losses. See Note 4 of the Notes to Consolidated Financial Statements for additional information about loans.
At December 31, 2009, our most significant investment concentration of credit risk was with the U.S. Government, its agencies and Government Sponsored Enterprises. Our exposure, which results from positions in securities issued by the U.S. Government, and its agencies, and securities guaranteed by Government Sponsored Enterprises, was $258.5
million, or 94% of our total investment portfolio at December 31, 2009.
Item 7A. Quantitative and Qualitative Disclosures About Market Risk
Asset and Liability Management Activities
The Bank’s Asset/Liability Management Committee (ALCO) has the responsibility to measure and monitor interest rate risk, the liquidity position, and capital adequacy. The Bank uses a variety of tools to measure, monitor, and manage interest rate risk. The Finance Committee of the Board of Directors reviews the interest rate risk management
activities of the Bank on a regular basis and has established policies and guidelines on the amount of risk deemed acceptable. The impact on the Bank’s net interest income and the fair value of its capital are modeled under different interest rate scenarios. The Board, through the Asset/Liability Management Policy, has established guidelines for the maximum negative impact that changes in interest rates have on the Bank’s net interest income, the fair value of equity and adjusted capital/asset ratios
under certain interest rate shock scenarios. Cascade uses a simulation model to measure rate risk and the impact on net interest income, the fair value of equity, and the fair value capital/asset ratio. In general, the Bank seeks to manage its rate risk through its balance sheet. The Bank focuses on originating more interest rate sensitive assets, such as variable-rate loans, while reducing its long-term, fixed-rate assets through the sale of long-term residential mortgages in the secondary market. The vast majority
of the loans that the Bank keeps in its portfolio have rate repricing periods of five years or less. The Bank often uses FHLB advances to fund its intermediate term assets.
48
See the Interest Rate Risk Management section in the Management’s Discussion and Analysis of Financial Condition and Results of Operations included in Item 7 of this report.
Item 8. Financial Statements and Supplementary Data
The following consolidated financial statements are contained in Part IV, Item 14 of this report and are incorporated herein by reference.
Report of Independent Registered Public Accounting Firm
Consolidated Financial Statements
|
a) |
Consolidated Balance Sheets at December 31, 2009, and December 31, 2008. |
|
b) |
Consolidated Statements of Operations for the years ended December 31, 2009, 2008 and 2007. |
|
c) |
Consolidated Statements of Stockholders’ Equity and Comprehensive Income for the years ended December 31, 2009, 2008, and 2007. |
|
d) |
Consolidated Statements of Cash Flows for the years ended December 31, 2009, 2008, and 2007. |
|
e) |
Notes to Consolidated Financial Statements. |
Item 9. Changes in and Disagreements with Accountants on Accounting and Financial Disclosure
None.
Item 9A. Controls and Procedures
|
|
(a) |
Evaluation of Disclosure Controls and Procedures: An evaluation of the Corporation's disclosure controls and procedures (as defined in section 13(a) - 14(c) of the Securities Exchange Act of 1934 (the Act)) was carried out under the supervision and with the participation of the Corporation's Chief Executive Officer, principal financial officer and several other members of the Corporation's senior management
effective December 31, 2009. The Corporation's Chief Executive Officer and principal financial officer concluded that the Corporation's disclosure controls and procedures as currently in effect are effective in ensuring that the information required to be disclosed by the Corporation in the reports it files or submits under the Act is (i) accumulated and communicated to the Corporation's management (including the Chief Executive Officer and principal financial officer) in a timely manner, and (ii) recorded, processed,
summarized and reported within the time periods specified in the Security and Exchange Commission’s (the SEC’s) rules and forms. |
|
|
(b) |
Changes in Internal Controls: In the year ended December 31, 2009, the Corporation did not make any significant changes in, nor take any corrective actions regarding, its internal controls or other factors that could significantly affect these controls. |
Disclosure Controls and Internal Controls. Disclosure controls are procedures that are designed with the objective of ensuring that information required to be disclosed in the Corporation's reports filed under the Act is recorded, processed, summarized and reported within
the time periods specified in the SEC’s rules and forms. Disclosure controls are also designed with the objective of ensuring that such information is accumulated and communicated to our management, as appropriate to allow timely decisions regarding required disclosure. Internal controls are procedures which are designed with the objective of providing reasonable assurance that (1) transactions are properly authorized; (2) assets are safeguarded against unauthorized or improper use; and (3) transactions
are properly recorded and reported, all to permit the preparation of financial statements in conformity with generally accepted accounting principles.
Limitations on the Effectiveness of Controls. The Corporation's management does not expect that our disclosure controls or our internal controls will prevent all error and all fraud. A control system, no matter how well conceived and operated, can provide only reasonable,
not absolute, assurance that the objectives of the control system are met. Further, the design of the control system must reflect the fact that there are resource constraints, and the benefits of controls must be considered relative to their costs. Because of the inherent limitations in all control systems, no evaluation of controls can provide absolute assurance that all control issues and instances of fraud, if any, within the Corporation have been detected. These inherent limitations include the realities
that judgments in decision-making can be faulty, and that breakdowns can occur because of simple error or mistake. Additionally, controls can be circumvented by the individual acts of some persons, by collusion of
49
two or more people, or by management override of the control. The design of any system of controls also is based in part upon certain assumptions about the likelihood of future events, and there can be no assurance that any design will succeed in achieving its stated goals under all potential future conditions; over time, controls may become
inadequate because of changes in conditions, or the degree of compliance with the policies or procedures may deteriorate. Because of the inherent limitations in a cost-effective control system, misstatements due to error or fraud may occur and not be detected.
Management’s Report on Internal Control over Financial Reporting. Management of Cascade Financial Corporation is responsible for preparing the Corporation’s annual financial statements. Management is also responsible for establishing and maintaining effective internal
control over financial reporting presented in conformity with the accounting principles generally accepted in the United States of America and regulatory reporting in conformity with the Federal Financial Institutions Examination Council Instructions for Consolidated Reports of Condition and Income (call report instructions). The Corporation’s internal controls contain monitoring mechanisms and actions are taken to correct deficiencies identified.
There are inherent limitations in the effectiveness of any internal control, including the possibility of human error and the circumvention or overriding of controls. Accordingly, even effective internal control can provide only reasonable assurance with respect to financial statement preparation. Further, because of changes in conditions,
the effectiveness of internal control may vary over time.
It is also management’s responsibility to ensure satisfactory compliance with all designated laws and regulations, and in particular, those laws and regulations concerning loans to insiders and dividend restrictions.
Management assessed the Corporation’s internal control over financial reporting presented in conformity with both U.S. generally accepted accounting principles and call report instructions as of December 31, 2009. This assessment was based on criteria for effective internal control over financial reporting described in Internal
Control—Integrated Framework issued by the Committee of Sponsoring Organizations of the Treadway Commission. Based on this assessment, management believes that, as of December 31, 2009, the Corporation maintained effective internal control over financial reporting presented in conformity with both accounting principles generally accepted in the United States of America and call report instructions. Management also believes that there was satisfactory compliance during 2009 with the designated
laws and regulations.
The Corporation’s registered public accounting firm has audited the Corporation’s consolidated financial statements as of and for the year ended December 31, 2009 that are included in this annual report and issued their Report of Independent Registered Public Accounting Firm, listed in Item 15, which includes an attestation
report on the Corporation’s internal control over financial reporting. The attestation report expresses an unqualified opinion on the effectiveness of the Corporation’s internal controls over financial reporting as of December 31, 2009.
Item 9B. Other Information
None.
50
PART III
Item 10. Directors, Executive Officers and Corporate Governance
The information contained under the section captioned “Proposal I--Election of Directors” contained in the Corporation’s Definitive Proxy Statement for the Corporation’s Annual Meeting of Stockholders (the Proxy Statement), is incorporated herein by reference. Reference is made to the cover page of this report for
information regarding compliance with Section 16(a) of the Exchange Act, and to the section in the Proxy Statement captioned “COMPLIANCE WITH SECTION 16(A) OF THE EXCHANGE ACT”.
The following table sets forth information with respect to the executive officers of the Corporation and the Bank.
|
Name |
Age (a) |
Position |
|
Carol K. Nelson (b) |
54 |
President, Chief Executive Officer and Director of Cascade Bank and Cascade Financial Corporation |
|
Robert G. Disotell |
55 |
Executive Vice President, Chief Credit Officer |
|
Steven R. Erickson(b) |
54 |
Executive Vice President, Commercial Banking |
|
LeAnne M. Harrington |
40 |
Executive Vice President, Chief Administrative Officer |
|
Debbie E. McLeod |
44 |
Executive Vice President, Retail Banking |
|
Terry Stull |
55 |
Senior Vice President and Controller |
(a) At December 31, 2009.
(b) Officer of the Corporation and Bank.
The principal occupation of each executive officer of the Corporation and Bank is set forth in the Proxy Statement or below. There are no family relationships among or between the executive officers listed above.
CAROL K. NELSON was appointed Chief Executive Officer of the Corporation commencing May 1, 2002. She has served as President of the Corporation and President and Chief Executive Officer of the Bank since February 2001. She was previously Senior Vice President and Northern Region Executive of Bank of America from 1996
to 2001. Ms. Nelson holds a Bachelor’s degree in Business Finance and a Master’s degree in Business Administration from Seattle University. Ms. Nelson serves as a Director and past Chair of the Board of the Washington Bankers Association, the Washington Roundtable and Premera Blue Cross. She is a past member of the Boards of Directors of the Seattle Branch of the Federal Reserve Bank of San Francisco and the Washington State Major League Baseball Stadium Public Facilities
District. She also serves as a trustee for Seattle University. In 2007, Ms. Nelson was appointed to chair the Governor’s Task Force on Homeowner Security. Ms. Nelson serves as Vice Chair of the Corporation’s Executive Committee and as a member of the Bank’s Loan Committee. She is a resident of Edmonds, Washington.
ROBERT G. DISOTELL has been employed by Cascade Bank since 1977 and has served as Executive Vice President of the Credit Administration Division and Chief Credit Officer since February 2001. He is responsible for managing Credit Underwriting, Special Assets, Loan Servicing and Credit Operations including overseeing the credit quality of the
Bank’s loan portfolios. Mr. Disotell has managed a variety of business groups in his tenure at Cascade, including Mortgage Banking, Secondary Marketing, Retail Banking, and Community Reinvestment Act (CRA) activities. Mr. Disotell is a 1976 graduate of Washington State University with a degree in Communications and is a resident of Arlington, Washington.
STEVEN R. ERICKSON has served as the Executive Vice President and Commercial Banking Executive for the Bank since November 12, 2008. He is responsible for managing commercial and income property lending and serves as the Assistant Secretary for the Corporation. Mr. Erickson joined Cascade in 1978. He is a member of the Board for Big Brothers,
Big Sisters of Snohomish County, Advisory Board Member for Snohomish County’s Pre-Diversion Program, and past board member of the Boys & Girls Club of Snohomish County. He is a resident of Marysville, Washington.
51
LEANNE M. HARRINGTON has served as the Executive Vice President and Chief Administrative Officer for the Bank since February 16, 2001. She has 22 years of banking experience, starting with Rainier Bank and Bank of America, where she served as Vice President and Northern Region Service Manager. Ms. Harrington joined Cascade in February 2001.
She is a 2006 graduate of Pacific Coast Banking School and a member of the Board for the Snohomish County Red Cross. Ms. Harrington is a resident of Everett, Washington.
DEBBIE E. McLEOD has served as the Executive Vice President of Retail Banking for the Bank since February 26, 2001. Ms. McLeod joined Cascade Bank in February 2001. She has over 20 years of commercial banking experience and was previously Vice President and Northern Region Sales Manager for Bank of America. Ms. McLeod is the immediate past
Board Chair for United Way of Snohomish County and serves on the Board for United Way of Skagit County. Ms. McLeod is a 2009 graduate of Pacific Coast Banking School and a 1988 graduate of Pacific Lutheran University with a degree in Business Administration. She resides in Burlington, Washington.
TERRY STULL has served as Senior Vice President and Controller for the Bank since August 2004. Mr. Stull has worked for Cascade Bank for 23 years and has been in banking for 35 years. He is currently serving as the Chief Accounting Officer and Interim Principal Financial Officer. He is a graduate from the University of Washington with a degree
in Business Administration and Accounting. Mr. Stull is an active participant in many community youth sport programs. He resides in Mountlake Terrace, Washington.
Item 11. Executive Compensation
The information required by this Item as to the management of the Corporation is hereby incorporated by reference from the information appearing under the caption “Compensation Discussion and Analysis,” “Summary Compensation Table,” “Grants of Plan-Based Awards,” “Outstanding Equity Awards at Fiscal
Year-End,” “Option Exercises and Stock Vested,” “Pension Benefits,” “Nonqualified Deferred Compensation,” “Potential Payments Upon Termination,” “Director Compensation,” and “Compensation Committee Interlocks and Insider Participation,” in the Corporation’s definitive proxy statement is incorporated herein by reference.
Item 12. Security Ownership of Certain Beneficial Owners and Management
|
|
(a) |
Security Ownership of Certain Beneficial Owners |
Information required by this Item is incorporated herein by reference to the section captioned “Security Ownership of Certain Beneficial Owners and Management” in the Proxy Statement.
|
|
(b) |
Security Ownership of Management |
The information required by this Item is incorporated herein by reference to the section captioned “Security Ownership of Certain Beneficial Owners and Management” of the Proxy Statement.
|
|
(c) |
Changes in Control |
The Corporation is not aware of any arrangements, including any pledge by any person of securities of the Corporation, the operation of which may at a subsequent date result in a change in control of the Corporation.
Item 13. Certain Relationships and Related Transactions, and Director Independence
The information required by this Item is incorporated herein by reference to the section captioned “Transactions with Management and Others” of the Proxy Statement.
Item 14. Principal Accountant Fees and Services
The information required by this Item is incorporated herein by reference to the section captioned “INDEPENDENT REGISTERED PUBLIC ACCOUNTING FIRM” of the Proxy Statement.
52
PART IV
Item 15. Exhibits, Financial Statement Schedules
(a) The audited consolidated financial statements follow.
Report of Independent Registered Public Accounting Firm
The Board of Directors
|
Cascade Financial Corporation: |
We have audited the accompanying consolidated balance sheets of Cascade Financial Corporation and Subsidiaries (the Corporation) as of December 31, 2009, and 2008, and the related consolidated statements of operations, stockholders' equity and comprehensive (loss) income, and cash flows for each of the years in the three-year period ended
December 31, 2009. We also have audited the Corporation’s internal control over financial reporting as of December 31, 2009, based on criteria established in Internal Control - Integrated Framework issued by the Committee of Sponsoring Organizations of the Treadway Commission (COSO). The Corporation’s management is responsible for these financial statements, for maintaining effective internal control over financial reporting, and for its assessment of the effectiveness of internal control over financial
reporting included in the accompanying Report of Management on Internal Control over Financial Reporting. Our responsibility is to express an opinion on these financial statements and an opinion on the effectiveness of the Corporation's internal control over financial reporting based on our audits.
We conducted our audits in accordance with auditing standards of the Public Company Accounting Oversight Board (United States). Those standards require that we plan and perform the audits to obtain reasonable assurance about whether the financial statements are free of material misstatement and whether effective internal control over financial
reporting was maintained in all material respects. Our audits of the financial statements included examining, on a test basis, evidence supporting the amounts and disclosures in the financial statements, assessing the accounting principles used and significant estimates made by management, as well as evaluating the overall financial statement presentation. Our audit of internal control over financial reporting included obtaining an understanding of internal control over financial reporting, assessing the
risk that a material weakness exists, and testing and evaluating the design and operating effectiveness of internal control based on the assessed risks. Our audits also included performing such other procedures as we considered necessary in the circumstances. We believe that our audits provide a reasonable basis for our opinions.
A company's internal control over financial reporting is a process designed to provide reasonable assurance regarding the reliability of financial reporting and the preparation of financial statements for external purposes in accordance with generally accepted accounting principles. A company's internal control over financial reporting includes
those policies and procedures that (1) pertain to the maintenance of records that, in reasonable detail, accurately and fairly reflect the transactions and dispositions of the assets of the company; (2) provide reasonable assurance that transactions are recorded as necessary to permit preparation of financial statements in accordance with generally accepted accounting principles, and that receipts and expenditures of the company are being made only in accordance with authorizations of management and directors
of the company; and (3) provide reasonable assurance regarding prevention or timely detection of unauthorized acquisition, use, or disposition of the company's assets that could have a material effect on the financial statements.
Because of its inherent limitations, internal control over financial reporting may not prevent or detect misstatements. Also, projections of any evaluation of effectiveness to future periods are subject to the risk that controls may become inadequate because of changes in conditions, or that the degree of compliance with the policies or procedures
may deteriorate.
In our opinion, the consolidated financial statements referred to above present fairly, in all material respects, the consolidated financial position of Cascade Financial Corporation and Subsidiaries as of December 31, 2009 and 2008, and the results of their operations and their cash flows for each of the years in the three-year period ended
December 31, 2009, in conformity with accounting principles generally accepted in the United States of America. Also in our opinion, Cascade Financial Corporation maintained, in all material respects, effective internal control over financial reporting as of December 31, 2009, based on criteria established in Internal Control - Integrated Framework issued by the Committee of Sponsoring Organizations of the Treadway Commission (COSO).
/s/ Moss Adams LLP
Everett, Washington
March 10, 2010
53
CASCADE FINANCIAL CORPORATION AND SUBSIDIARIES
Consolidated Balance Sheets
December 31, 2009 and 2008
|
(Dollars in thousands, except share amounts) |
DECEMBER 31, | |||||||
|
|
2009 |
2008 |
||||||
|
ASSETS |
||||||||
|
Cash on hand and in banks |
$ | 4,008 | $ | 11,859 | ||||
|
Interest-bearing deposits in other financial institutions |
141,587 | 10,907 | ||||||
|
Fed funds sold |
- | 30,700 | ||||||
|
Securities available-for-sale, fair value |
227,805 | 123,678 | ||||||
|
Securities held-to-maturity, amortized cost |
36,177 | 120,594 | ||||||
|
Federal Home Loan Bank (FHLB) stock |
11,920 | 11,920 | ||||||
|
Loans, net |
1,173,213 | 1,238,733 | ||||||
|
Goodwill |
12,885 | 24,585 | ||||||
|
Core deposit intangible, net |
352 | 493 | ||||||
|
Premises and equipment, net |
14,526 | 15,463 | ||||||
|
Cash surrender value of bank owned life insurance (BOLI), net |
24,522 | 23,638 | ||||||
|
Real estate owned (REO) and other repossessed assets |
18,842 | 1,446 | ||||||
|
Accrued interest receivable and other assets |
38,791 | 23,303 | ||||||
|
Total assets |
$ | 1,704,628 | $ | 1,637,319 | ||||
|
LIABILITIES AND STOCKHOLDERS’ EQUITY |
||||||||
|
Liabilities: |
||||||||
|
Deposits |
$ | 1,139,774 | $ | 1,006,782 | ||||
|
FHLB advances |
239,000 | 249,000 | ||||||
|
Federal Reserve Bank (FRB) Term Auction Facility (TAF) |
20,000 | 40,000 | ||||||
|
Securities sold under agreements to repurchase |
145,410 | 146,390 | ||||||
|
Junior subordinated debentures |
15,465 | 15,465 | ||||||
|
Junior subordinated debentures, fair value |
3,341 | 10,510 | ||||||
|
Accrued interest payable, expenses, and other liabilities |
7,188 | 9,050 | ||||||
|
Total liabilities |
1,570,178 | 1,477,197 | ||||||
|
Commitments and contingencies (Note 20) |
||||||||
|
Stockholders’ equity: |
||||||||
|
Preferred stock, no par value. Authorized 38,970 shares; |
37,038 | 36,616 | ||||||
|
Series A (liquidation preference $1,000 per share); issued and outstanding 38,970 shares at December 31, 2009 and 2008 |
||||||||
|
Preferred stock, $.01 par value. Authorized 500,000 shares; |
||||||||
|
no shares issued or outstanding |
- | - | ||||||
|
Common stock, $.01 par value. Authorized 25,000,000 shares; |
||||||||
|
issued and outstanding 12,146,080 shares at December 31, 2009, and 12,071,032 shares at December 31, 2008 |
121 | 121 | ||||||
|
Additional paid-in capital |
43,649 | 43,293 | ||||||
|
Retained earnings, substantially restricted |
54,797 | 80,752 | ||||||
|
Accumulated other comprehensive loss |
(1,155 | ) | (660 | ) | ||||
|
Total stockholders’ equity |
134,450 | 160,122 | ||||||
|
Total liabilities and stockholders’ equity |
$ | 1,704,628 | $ | 1,637,319 | ||||
(See accompanying notes to consolidated financial statements.)
54
CASCADE FINANCIAL CORPORATION AND SUBSIDIARIES
Consolidated Statements of Operations
Years ended December 31, 2009, 2008, and 2007
| (Dollars in thousands, except share amounts) | YEARS ENDED DECEMBER 31, | |||||||||||
|
|
2009 |
2008 |
2007 |
|||||||||
|
Interest income: |
||||||||||||
|
Loans, including fees |
$ | 69,839 | $ | 77,941 | $ | 81,558 | ||||||
|
Securities held-for-trading |
- | - | 1,884 | |||||||||
|
Securities available-for-sale |
9,137 | 5,258 | 4,756 | |||||||||
|
Securities held-to-maturity |
2,759 | 8,213 | 4,527 | |||||||||
|
FHLB dividends |
- | 113 | 72 | |||||||||
|
Preferred stock dividends |
- | 909 | - | |||||||||
|
Interest-bearing deposits |
93 | 137 | 1,138 | |||||||||
|
Total interest income |
81,828 | 92,571 | 93,935 | |||||||||
|
Interest expense: |
||||||||||||
|
Deposits |
17,064 | 27,215 | 35,220 | |||||||||
|
FHLB advances |
10,584 | 10,955 | 10,240 | |||||||||
|
FRB TAF borrowings |
153 | 375 | - | |||||||||
|
Securities sold under agreements to repurchase |
8,625 | 6,021 | 2,960 | |||||||||
|
Junior subordinated debentures |
2,114 | 2,120 | 2,120 | |||||||||
|
Total interest expense |
38,540 | 46,686 | 50,540 | |||||||||
|
Net interest income |
43,288 | 45,885 | 43,395 | |||||||||
|
Provision for loan losses |
44,175 | 7,240 | 1,350 | |||||||||
|
Net interest (loss) income after provision for loan losses |
(887 | ) | 38,645 | 42,045 | ||||||||
|
Other income: |
||||||||||||
|
Checking service fees |
5,047 | 4,848 | 3,820 | |||||||||
|
Other service fees |
1,033 | 1,092 | 1,059 | |||||||||
|
Increase in cash surrender value of BOLI |
952 | 1,056 | 803 | |||||||||
|
Gain on sale of securities available-for-sale, net |
1,588 | 285 | 28 | |||||||||
|
Gain (loss) on calls of securities held-to-maturity, net |
257 | 113 | (463 | ) | ||||||||
|
Gain on sale of loans |
176 | 128 | 199 | |||||||||
|
Gain on fair value of financial instruments, net |
7,169 | 912 | 1,081 | |||||||||
|
Gain on FHLB advances, net |
- | - | 569 | |||||||||
|
Other |
474 | 453 | 470 | |||||||||
|
Total other income |
16,696 | 8,887 | 7,566 | |||||||||
|
Other expenses: |
||||||||||||
|
Salaries and employee benefits |
14,004 | 14,544 | 13,817 | |||||||||
|
Occupancy |
4,235 | 3,986 | 3,576 | |||||||||
|
FDIC insurance premiums |
2,649 | 735 | 102 | |||||||||
|
Real estate owned (REO) and real estate in acquisition (REA) |
1,829 | 60 | 13 | |||||||||
|
Writedown/loss on sales of REO and other repossessed assets, net |
1,489 | 3 | - | |||||||||
|
Marketing |
1,169 | 1,096 | 1,182 | |||||||||
|
B&O tax |
1,162 | 1,277 | 1,373 | |||||||||
|
Other |
7,792 | 6,842 | 6,619 | |||||||||
|
Other-than-temporary impairment (OTTI) |
858 | 17,338 | - | |||||||||
|
Goodwill impairment charge |
11,700 | - | - | |||||||||
|
Total other expenses |
46,887 | 45,881 | 26,682 | |||||||||
|
(Loss) income before (benefit) provision for income taxes |
(31,078 | ) | 1,651 | 22,929 | ||||||||
|
(Benefit) provision for income taxes |
(7,610 | ) | (439 | ) | 7,383 | |||||||
|
Net (loss) income |
(23,468 | ) | 2,090 | 15,546 | ||||||||
|
Dividends on preferred stock |
1,943 | 216 | - | |||||||||
|
Accretion of issuance discount on preferred stock |
422 | 35 | - | |||||||||
|
Net (loss) income available for common stockholders |
$ | (25,833 | ) | $ | 1,839 | $ | 15,546 | |||||
|
(Loss) income per common share, basic |
$ | (2.13 | ) | $ | 0.15 | $ | 1.29 | |||||
|
Weighted average number of common shares outstanding, basic |
12,121,113 | 12,053,084 | 12,047,792 | |||||||||
|
(Loss) income per common share, diluted |
$ | (2.13 | ) | $ | 0.15 | $ | 1.27 | |||||
|
Weighted average number of common shares outstanding, diluted |
12,121,113 | 12,159,174 | 12,284,854 | |||||||||
(See accompanying notes to consolidated financial statements.)
55
CASCADE FINANCIAL CORPORATION AND SUBSIDIARIES
Consolidated Statements of Stockholders’ Equity and Comprehensive Income
Years ended December 31, 2009, 2008, and 2007
|
ACCUMULATED |
TOTAL |
|||||||||||||||||||||||||||
|
|
COMMON |
ADDITIONAL |
|
OTHER |
STOCK- |
|||||||||||||||||||||||
|
(Dollars in thousands, except share mounts)
|
PREFERRED STOCK |
SHARES |
AMOUNT |
PAID-IN CAPITAL |
RETAINED EARNINGS |
COMPREHENSIVE LOSS, NET |
HOLDERS’ EQUITY |
|||||||||||||||||||||
|
Balances at December 31, 2006 |
$ | - | 12,093,699 | $ | 121 | $ | 39,430 | $ | 77,952 | $ | (2,304 | ) | $ | 115,199 | ||||||||||||||
|
Adoption of fair value option |
- | - | - | - | (4,532 | ) | - | (4,532 | ) | |||||||||||||||||||
|
Cash dividends declared ($0.34 per share) |
- | - | - | - | (4,094 | ) | - | (4,094 | ) | |||||||||||||||||||
|
Options exercised and stock award plan |
- | 108,818 | - | 582 | - | - | 582 | |||||||||||||||||||||
|
Tax benefit from stock-based compensation |
- | - | - | 231 | - | - | 231 | |||||||||||||||||||||
|
Stock compensation expense |
- | - | - | 213 | - | - | 213 | |||||||||||||||||||||
|
Net income |
- | - | - | - | 15,546 | - | 15,546 | |||||||||||||||||||||
|
Shares repurchased |
- | (178,832 | ) | (1 | ) | (134 | ) | (2,703 | ) | - | (2,838 | ) | ||||||||||||||||
|
Other comprehensive income, net of tax provision of $963 |
- | - | - | - | - | 1,789 | 1,789 | |||||||||||||||||||||
|
Balances at December 31, 2007 |
- | 12,023,685 | 120 | 40,322 | 82,169 | (515 | ) | 122,096 | ||||||||||||||||||||
|
Cash dividends declared |
||||||||||||||||||||||||||||
|
Common stock ($0.27 per share) |
- | - | - | - | (3,256 | ) | - | (3,256 | ) | |||||||||||||||||||
|
Preferred stock ($5.54 per share) |
- | - | - | - | (216 | ) | - | (216 | ) | |||||||||||||||||||
|
Options exercised and stock award plan |
- | 47,347 | 1 | 356 | - | - | 357 | |||||||||||||||||||||
|
Tax benefit from stock-based compensation |
- | - | - | 30 | - | - | 30 | |||||||||||||||||||||
|
Stock compensation expense |
- | - | - | 196 | - | - | 196 | |||||||||||||||||||||
|
Net income |
- | - | - | - | 2,090 | - | 2,090 | |||||||||||||||||||||
|
Issuance of preferred stock |
36,581 | - | - | - | - | - | 36,581 | |||||||||||||||||||||
|
Warrants on issuance of preferred stock |
- | - | - | 2,389 | - | - | 2,389 | |||||||||||||||||||||
|
Accretion of discount on preferred stock |
35 | - | - | - | (35 | ) | - | - | ||||||||||||||||||||
|
Other comprehensive loss, net of tax benefit of $(78) |
- | - | - | - | - | (145 | ) | (145 | ) | |||||||||||||||||||
|
Balances at December 31, 2008 |
36,616 | 12,071,032 | 121 | 43,293 | 80,752 | (660 | ) | 160,122 | ||||||||||||||||||||
|
Cash dividends declared |
||||||||||||||||||||||||||||
|
Common stock ($0.01 per share) |
- | - | - | - | (122 | ) | - | (122 | ) | |||||||||||||||||||
|
Preferred stock ($49.86 per share) |
- | - | - | - | (1,943 | ) | - | (1,943 | ) | |||||||||||||||||||
|
Stock award plan |
- | 75,048 | - | 209 | - | - | 209 | |||||||||||||||||||||
|
Tax benefit from stock-based compensation |
- | - | - | 4 | - | - | 4 | |||||||||||||||||||||
|
Stock compensation expense |
- | - | - | 143 | - | - | 143 | |||||||||||||||||||||
|
Net income |
- | - | - | - | (23,468 | ) | - | (23,468 | ) | |||||||||||||||||||
|
Accretion of discount on preferred stock |
422 | - | - | - | (422 | ) | - | - | ||||||||||||||||||||
|
Other comprehensive loss, net of tax benefit of $(266) |
- | - | - | - | - | (495 | ) | (495 | ) | |||||||||||||||||||
|
Balances at December 31, 2009 |
$ | 37,038 | 12,146,080 | $ | 121 | $ | 43,649 | $ | 54,797 | $ | (1 ,155 | ) | $ | 134,450 | ||||||||||||||
|
Consolidated Statement of Comprehensive (Loss) Income |
YEARS ENDED DECEMBER 31, |
|||||||||||
|
(Dollars in thousands, except share amounts) |
2009 |
2008 |
2007 |
|||||||||
|
Net (loss) income |
$ | (23,468 | ) | $ | 2,090 | $ | 15,546 | |||||
|
Unrealized (loss) gain on securities available-for-sale, net of tax
(benefit) provision of $(822), $(178), and $953 |
(1,527 | ) | (330 | ) | 1,771 | |||||||
|
Reclassification adjustment for gain on securities included |
||||||||||||
|
in net (loss) income, net of tax benefit of $(556), $(100), and $(10) |
(1,032 | ) | (185 | ) | (18 | ) | ||||||
|
Comprehensive (loss) income |
$ | (26,027 | ) | $ | 1,575 | $ | 17,299 | |||||
(See accompanying notes to consolidated financial statements.)
56
CASCADE FINANCIAL CORPORATION AND SUBSIDIARIES
Consolidated Statements of Cash Flows
Years ended December 31, 2009, 2008, and 2007
| (Dollars in thousands) | YEARS ENDED DECEMBER 31, | |||||||||||
|
|
2009 |
2008 |
2007 |
|||||||||
|
Cash flows from operating activities: |
||||||||||||
|
Net (loss) income |
$ | (23,468 | ) | $ | 2,090 | $ | 15,546 | |||||
|
Adjustments to reconcile net income to net cash provided by (used in) operating activities: |
||||||||||||
|
Depreciation and amortization of premises and equipment |
2,261 | 2,136 | 1,875 | |||||||||
|
Provision for losses on loans |
44,175 | 7,240 | 1,350 | |||||||||
|
REO write-downs |
1,256 | - | - | |||||||||
|
Goodwill impairment |
11,700 | - | - | |||||||||
|
Increase in cash surrender value of BOLI |
(884 | ) | (980 | ) | (684 | ) | ||||||
|
Amortization of retained servicing rights |
28 | 39 | 44 | |||||||||
|
Amortization of core deposit intangible |
141 | 141 | 141 | |||||||||
|
Deferred federal income taxes |
5,104 | (8,176 | ) | (1,982 | ) | |||||||
|
Deferred loan fees, net of amortization |
371 | (654 | ) | 290 | ||||||||
|
Gain on sale of loans |
(176 | ) | (128 | ) | (199 | ) | ||||||
|
Stock award plan compensation |
209 | 200 | 185 | |||||||||
|
Stock-based compensation |
143 | 196 | 213 | |||||||||
|
Excess tax benefits from stock-based compensation |
(4 | ) | (30 | ) | (231 | ) | ||||||
|
Net change in fair value of financial instruments |
(7,169 | ) | (912 | ) | (1,081 | ) | ||||||
|
Purchase of securities held-for-trading |
- | - | (46,413 | ) | ||||||||
|
Proceeds from sales/calls on securities held-for-trading |
- | - | 112,162 | |||||||||
|
Net gain on sales/calls of securities available-for-sale |
(1,588 | ) | (285 | ) | (28 | ) | ||||||
|
Net (gain) loss on calls of securities held-to-maturity |
(257 | ) | (113 | ) | 463 | |||||||
|
Net (gain) on FHLB advances |
- | - | (569 | ) | ||||||||
|
Net (gain) on sales of premises and equipment |
(2 | ) | (4 | ) | - | |||||||
|
Net loss on sales of REO and other repossessed assets |
233 | 3 | - | |||||||||
|
Other than temporary impairment on investments (OTTI) |
858 | 17,338 | - | |||||||||
|
Net change in accrued interest receivable and other assets |
(14,984 | ) | 1,308 | 3,732 | ||||||||
|
Net change in accrued interest payable, expenses and other liabilities |
(6,647 | ) | (797 | ) | (733 | ) | ||||||
|
Net cash provided by operating activities |
11,300 | 18,612 | 84,081 | |||||||||
|
Cash flows from investing activities: |
||||||||||||
|
Loans originated, net of principal repayments |
(2,682 | ) | (158,464 | ) | (98,060 | ) | ||||||
|
Purchases of securities available-for-sale |
(310,533 | ) | (149,022 | ) | (76,198 | ) | ||||||
|
Proceeds from sales of securities available-for-sale |
189,076 | 88,184 | 66,220 | |||||||||
|
Principal repayments on securities available-for-sale |
17,298 | 2,743 | 5,677 | |||||||||
|
Purchases of securities held-to-maturity |
(19,997 | ) | (81,866 | ) | (64,034 | ) | ||||||
|
Proceeds from sales/calls on securities held-to-maturity |
99,600 | 96,550 | 5,000 | |||||||||
|
Principal repayments on securities held-to-maturity |
5,072 | 2,074 | 2,658 | |||||||||
|
Net purchases of premises and equipment |
(1,324 | ) | (3,440 | ) | (4,047 | ) | ||||||
|
Proceeds from sales/retirements of premises and equipment |
2 | 6 | 15 | |||||||||
|
Proceeds from sales/retirements of REO |
6,087 | 4,434 | - | |||||||||
|
REO capital improvements |
(1,163 | ) | - | - | ||||||||
|
Change in CRA investment |
(604 | ) | (1,902 | ) | (1,890 | ) | ||||||
|
Purchase of BOLI |
- | - | (4,000 | ) | ||||||||
|
Net cash used in investing activities |
(19,168 | ) | (200,703 | ) | (168,659 | ) | ||||||
|
Subtotal, carried forward |
$ | (7,868 | ) | $ | (182,091 | ) | $ | (84,578 | ) | |||
(See accompanying notes to consolidated financial statements.)
57
Consolidated Statements of Cash Flows, Continued
Years ended December 31, 2009, 2008, and 2007
| YEARS ENDED DECEMBER 31, | ||||||||||||
|
(Dollars in thousands) |
2009 |
2008 |
2007 |
|||||||||
|
Subtotal, brought forward |
$ | (7,868 | ) | $ | (182,091 | ) | $ | (84,578 | ) | |||
|
Cash flows from financing activities: |
||||||||||||
|
Proceeds from stock options exercised |
- | 157 | 397 | |||||||||
|
Proceeds from issuance of preferred stock and warrants |
- | 38,970 | - | |||||||||
|
Dividends paid on common stock |
(664 | ) | (3,794 | ) | (3,978 | ) | ||||||
|
Dividends paid on preferred stock |
(1,429 | ) | - | - | ||||||||
|
Repurchase of common stock |
- | - | (2,838 | ) | ||||||||
|
Excess tax benefits from stock-based compensation |
4 | 30 | 231 | |||||||||
|
Net increase in deposits |
132,992 | 101,886 | 49,134 | |||||||||
|
Net increase (decrease) in FHLB advances |
(10,000 | ) | 18,000 | (11,431 | ) | |||||||
|
Net increase (decrease) in securities sold under agreements to repurchase |
(980 | ) | 25,765 | 24,915 | ||||||||
|
Net (decrease) increase in FRB TAF borrowing |
(20,000 | ) | 40,000 | - | ||||||||
|
Net increase (decrease) in advance payments by borrowers for taxes and insurance |
74 | 13 | (201 | ) | ||||||||
|
Net cash provided by financing activities |
99,997 | 221,027 | 56,229 | |||||||||
|
Net increase (decrease) in cash and cash equivalents |
92,129 | 38,936 | (28,349 | ) | ||||||||
|
Cash and cash equivalents at beginning of period |
53,466 | 14,530 | 42,879 | |||||||||
|
Cash and cash equivalents at end of period |
$ | 145,595 | $ | 53,466 | $ | 14,530 | ||||||
|
Supplemental disclosures of cash flow information: |
||||||||||||
|
Cash paid during the period for |
||||||||||||
|
Interest |
$ | 39,592 | $ | 47,494 | $ | 51,457 | ||||||
|
Income taxes |
50 | 7,150 | 5,600 | |||||||||
|
Supplemental schedule of non-cash investing activities: |
||||||||||||
|
Change in portion of reserve identified for undisbursed loans and reclassified as a liability |
24 | 49 | (142 | ) | ||||||||
|
Supplemental schedule of non-cash investing activities: |
||||||||||||
|
Mark-to-market on securities available-for-sale |
495 | 223 | (2,752 | ) | ||||||||
|
Retirement of common stock in retained earnings |
- | - | 171 | |||||||||
|
Dividends declared and unpaid on common stock |
- | 543 | 1,082 | |||||||||
|
Dividends declared and unpaid on preferred stock |
731 | 216 | - | |||||||||
|
Cumulative adjustment to equity for FASB ASC Topic 825 |
- | - | (3,162 | ) | ||||||||
|
Loans transferred to REO and other repossessed assets |
23,808 | 6,000 | - | |||||||||
(See accompanying notes to consolidated financial statements.)
58
CASCADE FINANCIAL CORPORATION AND SUBSIDIARIES
Notes to Consolidated Financial Statements
(Dollars in thousands, except share amounts)
Note 1 - Summary of Significant Accounting Policies
The accounting and financial reporting policies of Cascade Financial Corporation (Corporation) and its wholly owned subsidiaries, Cascade Bank (Cascade or the Bank), including Colby Real Estate LLC, which was formed to acquire, manage and sell REO properties, and Cascade Capital Trust I, II, and III, conform to accounting principles generally
accepted in the United States of America and to general practices within the financial institutions industry, where applicable. In preparing the consolidated financial statements, management makes estimates and assumptions that affect the reported amounts of assets and liabilities and disclosure of contingent assets and liabilities at the date of the financial statements and the reported amounts of income and expense. Actual results could differ from those estimates.
The following is a description of the more significant policies that the Corporation follows in preparing and presenting its consolidated financial statements.
(a) Basis of Presentation
The consolidated financial statements include the accounts of the Corporation and the Bank. All significant intercompany balances and transactions have been eliminated in the consolidation. The preparation of financial statements in conformity with accounting principles generally accepted in the United States of America requires management
to make estimates and assumptions that affect the reported amounts and disclosures. Actual results may differ from these estimates under different assumptions or conditions.
Cascade Capital Trust I, II, and III (the Trusts) were formed in 2000, 2004, and 2006, respectively, for the exclusive purpose of issuing trust preferred securities and using the proceeds from the issuance to acquire junior subordinated debentures issued by the Corporation. The Corporation used the proceeds from the issuance to fund future
asset growth. The Trusts are not consolidated by Cascade Financial Corporation.
(b) Cash and Cash Equivalents
The Corporation considers all cash on hand and in banks, fed funds sold and short-term highly liquid investment securities with an original maturity of three months or less to be cash equivalents.
(c) Interest-Bearing Deposits in Other Financial Institutions
Interest-bearing deposits with other financial institutions are carried at cost and include interest-bearing deposits at the Federal Home Loan Bank (FHLB) and the Federal Reserve Bank (FRB).
(d) Securities
Debt and equity securities, including mortgage-backed securities (MBS), may be classified as held-for-trading, available-for-sale, or held-to-maturity. Securities classified as held-for-trading are carried at fair value with unrealized gains and losses reported in earnings. Securities
available-for-sale are carried at fair value, with unrealized gains and losses reported as a component of other comprehensive (loss) income. Investment securities held-to-maturity are carried at amortized cost or principal balance, adjusted for amortization of premiums and accretion of discounts. Amortization of premiums and accretion of discounts are calculated using a method that approximates the level yield method. The Corporation has the ability, and it is management’s positive intention, to hold held-to-maturity
securities until maturity. Investments with fair values that are less than the amortized cost are considered impaired. Impairment may result from either a decline in the financial condition of the issuing entity or, in the case of fixed interest rate investments, from rising interest rates. Management reviews investment securities on an ongoing basis for the presence of other-than-temporary impairment (OTTI) or permanent impairment, taking
into consideration current market conditions; fair value in relationship to cost; extent and nature of the change in fair value; issuer rating changes and trends; whether management intends to sell a security or if it is likely that the Bank will be required to sell the security before recovery of the amortized cost basis of the investment, which may be upon maturity; and other factors. For debt securities, if management intends to sell the security or it is likely that the Bank will be required to sell the security
before recovering its cost basis, the entire impairment loss would be recognized in earnings as an OTTI. If management does not intend to sell the security and it is not likely that the Bank will be required to sell the security, but management does not expect to recover the entire amortized cost basis of the security, only the portion of the impairment loss representing credit losses would be recognized in earnings. The credit loss on a security is
59
CASCADE FINANCIAL CORPORATION AND SUBSIDIARIES
Notes to Consolidated Financial Statements
(Dollars in thousands, except share amounts)
measured as the difference between the amortized cost basis and the present value of the cash flows expected to be collected. Projected cash flows are discounted by the original or current effective interest rate depending on the nature of the security being measured for potential OTTI. The remaining impairment related to all other factors, i.e., the difference between the present value of the cash flows expected to be collected and fair value,
is recognized as a charge to other comprehensive income. Impairment losses related to all other factors are presented as separate categories within other comprehensive income. Gains and losses on the sale of securities are recorded on the trade date and are determined using the specific identification method.In January 2009, FASB amended FASB ASC 325-40, Investments—Other. This amendment addressed certain practice issues related to the recognition of interest income and impairment on purchased beneficial interests and beneficial interests that continue to be held by a transferor in
securitized financial assets, by making its other-than-temporary impairment (OTTI) assessment guidance consistent with FASB ASC 320, Investments—Debt and Equity Securities. The amendment removes the reference to the consideration of a market participant’s estimates of cash flows and instead requires an assessment of whether it is probable, based on current information
and events, that the holder of the security will be unable to collect all amounts due according to the contractual terms. If it is probable that there has been an adverse change in estimated cash flows, an OTTI is deemed to exist, and a corresponding loss shall be recognized in earnings equal to the entire difference between the investment’s carrying value and its fair value at the balance sheet date of the reporting period for which the assessment is made. This amendment became effective for interim and
annual reporting periods ending after December 15, 2008, and has been applied prospectively.
(e) Federal Home Loan Bank (FHLB) Stock
As a member of the FHLB system, the Bank is required to maintain a minimum level of investment in FHLB stock based on specified percentages of its outstanding FHLB advances. The Bank's investment in FHLB stock is carried at par value ($100 per share), which reasonably approximates its fair value. The Bank may request redemption at par value
of any stock in excess of the amount the Bank is required to hold. Stock redemptions are at the discretion of the FHLB. During 2002, the FHLB revised its capital structure from the issuance of one class of stock to two, B (1) and B (2) stock. Class B (1) stock can be sold back to the FHLB at cost, but is restricted as to purchase, sale and redemption. Class B (2) is not a required investment for institutions and is not restricted to purchase and sale, but has the same redemption restrictions as Class B (1) stock.
Included in the balance sheet as of December 31, 2009, and 2008, the Bank has $11.9 million of Class B (1) and no B (2) stock. The Bank evaluates FHLB stock for impairment based on its assessment of the ultimate recoverability of cost rather than by recognizing temporary declines in value. The determination of whether a decline affects the ultimate recoverability of cost is influenced by criteria such as: (1) the significance of any decline in net assets of the FHLB as compared to the capital stock amount for
the FHLB and the length of time this situation has persisted, (2) commitments by the FHLB to make payments required by law or regulation and the level of such payments in relation to the operating performance of the FHLB, (3) the impact of legislative and regulatory changes on institutions and, accordingly, the customer base of the FHLB and (4) the liquidity position of the FHLB.
(f) Transfer of Financial Assets
Transfers of financial assets are accounted for as sales when control over the assets has been surrendered. Control over transferred assets is deemed to be surrendered when (1) the assets have been isolated from the Corporation, (2) the transferee obtains the right (free of conditions that constrain it from taking advantage of that right)
to pledge or exchange the transferred assets, and (3) the Bank does not maintain effective control over the transferred assets through an agreement to repurchase them before their maturity.
(g) Loans
Loans that management has the intent and ability to hold for the foreseeable future or until maturity or pay-off generally are reported at their outstanding unpaid principal balances adjusted for charge-offs, the allowance for loan losses, and any deferred fees or costs on originated loans. Interest income is accrued on the unpaid principal
balance.
Approximately 85% of Cascade’s loan portfolio is secured by real estate and a significant decline in real estate market values may require an increase in the provision for loan losses. Over the last two years, there has been deterioration in the residential development market which has led to an increase in nonperforming
loans and the allowance for loan losses. A continued deterioration in this market, or deterioration in other segments of the loan portfolio, may lead to additional charges to the allowance for loan losses.
60
CASCADE FINANCIAL CORPORATION AND SUBSIDIARIES
Notes to Consolidated Financial Statements
(Dollars in thousands, except share amounts)
Interest IncomeInterest is accrued only if deemed collectible. Accrual of interest income is generally discontinued when a loan becomes 90 days past due or is otherwise determined to be uncollectible and accrued interest amounts are reversed against income. Past due status is based on the contractual terms of the note. Once interest has been paid to date
and management believes future payments are reasonably assured, the loan is returned to accrual status.
Loan origination fees and certain direct origination costs are deferred and amortized as an adjustment of the loan’s yield over the contractual life of the loan using the interest or straight-line method. In the event loans are sold, the remaining net deferred loan origination fees or costs are recognized as a component of the gains
or losses on the sale of loans. When portfolio loans pay off before their contractual maturity, the remaining deferred fees or costs are recognized as interest income or expense.
Impairment of Loans and Allowance for Loan Losses
The allowance for loan losses is established as losses are estimated to have occurred through a provision for loan losses charged to earnings. Loan losses are charged against the allowance when management believes the uncollectibility of a loan balance is confirmed. Subsequent recoveries, if any, are credited to the allowance.
The allowance for loan losses is evaluated on a regular basis by management and is based upon management’s periodic review of the collectibility of the loans in light of historical experience, the nature and volume of the loan portfolio, adverse situations that may affect the borrower’s ability to repay, estimated value of any
underlying collateral and prevailing economic conditions. This evaluation is inherently subjective as it requires estimates that are susceptible to significant revision as more information becomes available.
The allowance consists of specific and general components. The vast majority of loans classified as substandard or doubtful that are on nonaccrual are reviewed individually for impairment and a specific allowance is established when the discounted cash flows (or collateral value or observable market price) of the impaired loan is lower than
the carrying value of that loan. Other accruing classified loans are similarly reviewed either by relationship or pooled for smaller dollar homogeneous loans. The general component covers non-classified loans and is based on historical loss experience. The Bank also uses qualitative (‘Q’) factors in the general component of the allowance. The ‘Q’ factors consist of a review of market conditions, loan concentrations, and changes in the quality of the loan portfolio. Allocations
for ‘Q’ factors are based upon management’s review of each of the factors and are applied to all loans graded “pass.” The ‘Q’ factors augment the historical loss factors utilized in assessing the allowance to reflect the potential losses embedded in the loan portfolio.
A loan is considered impaired when, based on current information and events, it is probable that the Corporation will be unable to collect the scheduled payments of principal or interest when due according to the contractual terms of the loan agreement. Factors considered by management in determining impairment and impairment amount include
payment status, collateral value, and the probability of collecting scheduled principal and interest payments when due. Loans that experience insignificant payment delays and payment shortfalls generally are not classified as impaired. Management determines the significance of payment delays and payment shortfalls on a case-by-case basis, taking into consideration all of the circumstances surrounding the loan and the borrower, including the length of the delay, the reasons for the delay, the borrower’s
prior payment record, and the amount of the shortfall in relation to the principal and interest owed.
Impairment is measured on a loan-by-loan basis by either the present value of expected future cash flows discounted at the loan’s effective interest rate, the loan’s obtainable market price, or the fair value of the collateral if the loan is collateral dependent. Groups of smaller balance, homogeneous loans are collectively evaluated
for impairment. Accordingly, the Corporation does not separately identify individual consumer and residential loans for impairment, unless such loans are the subject of a restructuring agreement.
The allowance for loan losses is management’s best estimate of potential losses. While management uses available information to recognize losses on these assets, future additions to the allowance may be necessary based on changes in economic conditions, particularly in the Western Washington region. In addition, various regulatory agencies,
as an integral part of their examination process, periodically review the Corporation’s allowance for losses on loans. Such agencies may require the Corporation to recognize additions to the allowance, or change valuations, based on their judgments about information available to them at the time of their examinations.
61
CASCADE FINANCIAL CORPORATION AND SUBSIDIARIES
Notes to Consolidated Financial Statements
(Dollars in thousands, except share amounts)
(h) Mortgage Servicing RightsServicing assets are recognized when rights are acquired through the sale of mortgage loans or when the Bank originates and sells mortgage loans and retains the servicing. During the past three years all of the loans that the Bank has sold have been sold with servicing released and there has been no recognition of servicing rights. The
Bank is still, however, servicing loans originated in prior years. These loans serviced for others are not included in the accompanying consolidated balance sheet. Loans being serviced totaled $22.1 million and $23.1 million at December 31, 2009, and 2008, respectively.
Servicing fee income is based on a contractual percentage of the outstanding principal or a fixed amount of each loan serviced and is recognized as income when earned. The Bank had mortgage servicing rights totaling $63 and $91 at December 31, 2009 and 2008, respectively. Mortgage servicing rights are amortized over the expected servicing
period and offset against loan servicing fee income within the statement of operations.
(i) Loans Held for Sale
Loans held for sale include mortgage loans and are reported at the lower of cost or market value. Cost generally approximates market value, given the short duration of these assets. Gains or losses on the sale of loans that are held for sale are recognized at the time of the sale and determined by the difference between net sale proceeds
and the net book value of the loans. Gains and losses on loan sales are recorded in other income and direct loan origination costs and fees are deferred at origination and are recognized in other income upon sale of the loan. The Bank had $250 in loans held for sale at December 31, 2009, and $1.2 million in loans held for sale at December 31, 2008. Loans are sold without recourse on a best effort, servicing released basis.
(j) Goodwill and Other Intangible Assets
Net assets of companies acquired in purchase transactions are recorded at fair value at the date of acquisition. Identifiable intangibles are amortized on an accelerated basis over the period benefited. Goodwill is not amortized but is reviewed for potential impairment at least annually at the reporting unit level.
(k) Premises and Equipment
Straight-line depreciation is provided over the estimated useful lives of the respective asset, which range from two to forty years. Land is carried at cost. Buildings and equipment are stated at cost less accumulated depreciation. Leasehold improvements are amortized over the estimated useful lives of the improvements, or terms of the
related leases, whichever is shorter.
(l) Income Taxes
The calculation of our provision for federal income taxes is complex and requires the use of estimates and judgments. We have two accruals for income taxes: Our income tax receivable represents the estimated amount currently due from the federal government, net of any reserve for potential audit issues, and is reported as a component of “accrued
income and other assets” in our consolidated balance sheet; our deferred federal income tax asset or liability represents the estimated impact of temporary differences between how we recognize our assets and liabilities under GAAP, and how such assets and liabilities are recognized under the federal tax code.
In the ordinary course of business, we operate in various taxing jurisdictions and are subject to income and non-income taxes. The effective tax rate is based in part on our interpretation of the relevant current tax laws. We believe the aggregate liabilities related to taxes are appropriately reflected in the consolidated financial statements.
We review the appropriate tax treatment of all transactions taking into consideration statutory, judicial, and regulatory guidance in the context of our tax positions. In addition, we rely on various tax opinions, recent tax audits, and historical experience.
The Corporation accounts for income taxes as required by FASB ASC Topic 740, Accounting for Income Taxes, under the liability method, which requires recognition of deferred tax assets and liabilities for the expected future income tax consequences of transactions that have been included
in the Consolidated Financial Statements. Under this method, deferred tax assets and liabilities are determined based on the difference between the financial statement and tax basis of assets and liabilities using enacted tax rates in effect for the year in
62
CASCADE FINANCIAL CORPORATION AND SUBSIDIARIES
Notes to Consolidated Financial Statements
(Dollars in thousands, except share amounts)
which the differences are expected to reverse. A valuation allowance is required on deferred tax assets if it is “more likely than not” that the deferred tax asset will not be realized. The determination of the realization of the deferred tax assets is highly subjective and dependent upon judgment concerning management’s evaluation of both positive and negative evidence, including income and losses in recent years, the forecast of future income, applicable tax planning strategies,
and assessments of the current and future economic and business conditions. The Corporation considers both positive and negative evidence regarding the ultimate realization of deferred tax assets. The calculation of our provision for federal income taxes is complex and requires the use of estimates and significant judgments in arriving at the amount of tax benefits to be recognized in the financial statements for a given tax position. It is possible that the tax benefits realized upon the ultimate resolution
of a tax position may result in tax benefits that are significantly different from those estimated.(m) Real Estate Owned and Other Repossessed Assets
Real estate owned includes real estate acquired in settlement of loans. Real estate owned is recorded at the lower of cost or fair value, based upon the most recent appraisal, less estimated costs to sell. Development and improvements related to the property are capitalized. Any loss recorded at the time a foreclosure occurs is classified
as a charge-off against the allowance for loan losses. Losses that result from the ongoing periodic valuation of these properties are charged to expense in the period in which they are identified.
(n) Stock-Based Compensation
The Corporation accounts for stock-based compensation under FASB ASC Topic 718, Accounting for Stock-Based Compensation (formerly SFAS No. 123(R)) using the modified prospective method. ASC Topic 718 requires all share-based payments to employees, including grants of employee stock
options, to be recognized in the income statement based on their fair values. Under the modified prospective method, the Corporation records equity-based compensation expense for all awards granted over their vesting or performance condition period.
(o) Marketing Costs
The Bank expenses most marketing costs as they are incurred, but some marketing costs are capitalized and
amortized over the useful life of the expenditure. Marketing expense was $1.2 million, $1.1 million, and $1.2 million for the years ended December 31, 2009, 2008, and 2007, respectively.
(p) Comprehensive (Loss) Income
Comprehensive (loss) income is comprised of net (loss) income and other comprehensive (loss) income. Other comprehensive (loss) income includes items previously recorded directly to equity, such as unrealized gains and losses on securities available-for-sale. Comprehensive (loss) income is presented with the consolidated statements of stockholders’
equity.
(q) (Loss) Earnings per Common Share
The Corporation displays basic and diluted (loss) earnings per common share in the consolidated statements of operations. Basic (loss) earnings per common share is computed by dividing net (loss) income available for common stockholders, which is net (loss) income less dividends and accretion of the discount on preferred stock,
by the weighted average number of shares outstanding during the year. Diluted (loss) earnings per common share is computed by dividing net (loss) income available for common stockholders by diluted weighted average shares outstanding, which includes outstanding common stock equivalent shares, using the treasury stock method, unless such shares are anti-dilutive. Common stock equivalents include stock options and warrants.
(r) Off-Balance Sheet Credit Related Financial Instruments
In the ordinary course of business, the Corporation enters into commitments to extend credit, including commitments under lines of credit, bank cards, letters of credit, and standby letters of credit and guarantees. Such financial instruments are recorded when they are funded.
63
CASCADE FINANCIAL CORPORATION AND SUBSIDIARIES
Notes to Consolidated Financial Statements
(Dollars in thousands, except share amounts)
(s) ReclassificationsCertain 2008 and 2007 balances have been reclassified to conform with the 2009 presentation. These reclassifications have no effect on previously reported net (loss) income.
(t) Recent Accounting Pronouncements
In June 2009, FASB codified FASB ASC 105, Generally Accepted Accounting Principles, to establish the FASB ASC (the Codification). The Codification is not expected to change U.S. GAAP, but combines all authoritative standards into a comprehensive, topically organized online database.
Following this guidance, the Financial Accounting Standards Board will not issue new standards in the form of Statements, FASB Staff Positions, or Emerging Issues Task Force Abstracts. Instead, it will issue Accounting Standards Updates (ASU) to update the Codification. After the launch of the Codification on July 1, 2009 only one level of authoritative U.S. GAAP for non-governmental entities will exist, other than guidance issued by the Securities and Exchange Commission. This statement is effective for
interim and annual reporting periods ending after September 15, 2009. The adoption of the FASB ASC 105 did not have any impact on the Corporation’s consolidated financial statements, and only affects how the Corporation references authoritative accounting guidance going forward.
In June 2008, FASB amended FASB ASC 260, Earnings per Share. This amendment concluded that nonvested share-based payment awards that contain nonforfeitable rights to dividends or dividend equivalents are participating securities and shall be included in the computation of EPS pursuant
to the two-class method. This amendment is effective for fiscal years beginning after December 15, 2008, to be applied retrospectively. Certain of the Corporation’s nonvested restricted stock awards qualify as participating securities as described under this amendment. The adoption of this provision did not have an effect on basic or diluted earnings per common share.
In April 2009, the FASB issued ASC Topic 820, Fair Value Measurements and Disclosures, related to determining fair value when the volume and level of activity for the asset or liability have significantly decreased and identifying transactions that are not orderly. This guidance emphasizes
that even if there has been a significant decrease in the volume and level of activity, the objective of a fair value measurement remains the same. Fair value is the price that would be received to sell an asset or paid to transfer a liability in an orderly transaction (that is, not a forced liquidation or distressed sale) between market participants. A number of factors are considered when evaluating whether there has been a significant decrease in the volume and level of activity for an asset or liability in
relation to normal market activity. In addition, when transactions or quoted prices are not considered orderly, adjustments to those prices based on the weight of available information may be needed to determine the appropriate fair value. This guidance requires increased disclosures and is effective for interim and annual reporting periods ending after June 15, 2009, and shall be applied prospectively. The adoption of ASC Topic 820 during the second quarter of 2009 did not have an impact on the Corporation’s
condensed consolidated financial statements.
In April 2009, the FASB issued ASC Topic 825, Financial Instruments, which requires disclosures about fair value of financial instruments in interim reporting periods of publicly traded companies that were previously only required to be disclosed in annual financial statements. The
provisions of ASC Topic 825 were effective for the Corporation’s interim period ending on June 30, 2009. Adoption of this standard resulted in additional disclosures in the Corporation’s interim consolidated financial statements.
In April 2009, the FASB issued ASC Topic 320, Investments – Debt and Equity Securities, which amends the other-than-temporary impairment guidance in GAAP for debt
securities to make the guidance more operational and to improve the presentation and disclosure of other-than-temporary impairments on debt and equity securities in the financial statements. ASC Topic 320 does not amend existing recognition and measurement guidance related to other-than- temporary impairments of equity securities. The provisions of ASC Topic 320 were effective for the Corporation’s
interim period ending on June 30, 2009, and did not have an effect on the Corporation’s condensed consolidated financial statements.
In June 2009, the FASB issued new authoritative guidance under ASC Topic 860 Transfers and Servicing, to enhance reporting about transfers of financial assets, including securitizations, and where companies have continuing exposure to the
risks related to transferred financial assets. ASC Topic 860 eliminates the concept of a “qualifying special-
64
CASCADE FINANCIAL CORPORATION AND SUBSIDIARIES
Notes to Consolidated Financial Statements
(Dollars in thousands, except share amounts)
purpose entity” and changes the requirements for derecognizing financial assets. ASC Topic 860 also requires additional disclosures about all continuing involvements with transferred financial assets including information about gains and losses resulting from transfers during the period. The new authoritative guidance under ASC
Topic 860 were effective January 1, 2010 and are not expected to have a significant impact on the Corporation’s condensed consolidated financial statements.
In June 2009, the FASB issued new authoritative guidance under SFAS No. 167, “Amendments to FASB Interpretation No. 46(R)” (SFAS 167). Under FASB’s Codification at ASC 105-10-65-1-d, SFAS 167 will remain authoritative until integrated into the FASB Codification. SFAS 167 amends FIN 46 (Revised December 2003),
“Consolidation of Variable Interest Entities,” to change how a company determines when an entity that is insufficiently capitalized or is not controlled through voting (or similar rights) should be consolidated. The determination of whether a company is required to consolidate an entity is based on, among other things, an entity’s purpose and design and a company’s ability to direct the activities of the
entity that most significantly impact the entity’s economic performance. SFAS 167 requires additional disclosures about the reporting entity’s involvement with variable-interest entities and any significant changes in risk exposure due to that involvement as well as its affect on the entity’s financial statements. SFAS 167 will be effective January 1, 2010 and is not expected to have a significant impact
on the Corporation’s consolidated financial statements.
In August 2009, the FASB issued ASU No. 2009-05, Measuring Liabilities at Fair Value. This update amends FASB ASC 820, Fair Value Measurements and Disclosure, in regards to the fair value measurement of liabilities. FASB
ASC 820 clarifies that in circumstances in which a quoted price for an identical liability in an active market is not available, a reporting entity shall utilize one or more of the following techniques: i) the quoted price of the identical liability when traded as an asset, ii) the quoted price for a similar liability or a similar liability when traded as an asset, or iii) another valuation technique that is consistent with the principles of FASB ASC 820. In all instances a reporting entity shall utilize the
approach that maximizes the use of relevant observable inputs and minimizes the use of unobservable inputs. Also, when measuring the fair value of a liability a reporting entity shall not include a separate input or adjustment to other inputs relating to the existence of a restriction that prevents the transfer of the liability. This update is effective for the Corporation in the fourth quarter of 2009. The adoption of FASB ASU 2009-05 did not have an impact on the Corporation’s consolidated financial statements.
Note 2 - Restricted Assets
Federal Reserve Board regulations require that the Bank maintain certain minimum reserve balances as either cash on hand, in the vault or on deposit with the Federal Reserve Bank. No deposit was required to be held at the Federal Reserve as of December 31, 2009 and 2008, respectively.
Note 3 – Securities
The following table presents the amortized cost, unrealized gains, unrealized losses and fair value of available-for-sale and held-to-maturity securities at December 31, 2009, and December 31, 2008.
|
|
DECEMBER 31, 2009 |
|||||||||||||||
|
Amortized
Cost |
Gross
Unrealized
Gains |
Gross
Unrealized
Losses |
Fair
Value |
|||||||||||||
|
Securities available-for-sale |
||||||||||||||||
|
Mortgage-backed securities |
$ | 40,997 | $ | 729 | $ | (446 | ) | $ | 41,280 | |||||||
|
Agency notes & bonds |
188,585 | 88 | (2,148 | ) | 186,525 | |||||||||||
|
Total |
$ | 229,582 | $ | 817 | $ | (2,594 | ) | $ | 227,805 | |||||||
|
Securities held-to-maturity |
||||||||||||||||
|
Mortgage-backed securities |
$ | 15,405 | $ | 504 | $ | - | $ | 15,909 | ||||||||
|
Agency notes & bonds |
19,997 | - | (187 | ) | 19,810 | |||||||||||
|
Corporate/other |
775 | - | - | 775 | ||||||||||||
|
Total |
$ | 36,177 | $ | 504 | $ | (187 | ) | $ | 36,494 | |||||||
65
CASCADE FINANCIAL CORPORATION AND SUBSIDIARIES
Notes to Consolidated Financial Statements
(Dollars in thousands, except share amounts)
|
|
DECEMBER 31, 2008 |
|||||||||||||||
|
Amortized
Cost |
Gross
Unrealized
Gains |
Gross
Unrealized
Losses |
Fair
Value |
|||||||||||||
|
Securities available-for-sale |
||||||||||||||||
|
Mortgage-backed securities |
$ | 42,250 | $ | 288 | $ | (686 | ) | $ | 41,852 | |||||||
|
Agency notes & bonds |
81,149 | 368 | (145 | ) | 81,372 | |||||||||||
|
Corporate/other |
1,294 | - | (840 | ) | 454 | |||||||||||
|
Total |
$ | 124,693 | $ | 656 | $ | (1,671 | ) | $ | 123,678 | |||||||
|
Securities held-to-maturity |
||||||||||||||||
|
Mortgage-backed securities |
$ | 20,484 | $ | 209 | $ | (148 | ) | $ | 20,545 | |||||||
|
Agency notes & bonds |
99,335 | 442 | (396 | ) | 99,381 | |||||||||||
|
Corporate/other |
775 | - | - | 775 | ||||||||||||
|
Total |
$ | 120,594 | $ | 651 | $ | (544 | ) | $ | 120,701 | |||||||
The fair value of investment securities pledged to secure public deposits at December 31, 2009 was $29.6 million and a $65.0 million letter of credit with the FHLB. The fair value of investment securities pledged to secure public deposits at December 31, 2008 was $23.8 million. The fair value of investment securities pledged to the FHLB totaled
$15.7 million and $23.5 million at December 31, 2009 and 2008, respectively. The fair value of investment securities pledged to fund repurchase agreements was $199.2 million at December 31, 2009, and $193.8 million at December 31, 2008.
The following table shows the contractual or expected maturities of the Corporation’s securities at December 31, 2009:
| DECEMBER 31, 2009 | ||||||||||||
|
Amortized Cost |
Fair Value |
Yield |
||||||||||
|
Securities available-for-sale |
||||||||||||
|
Due after one through five years |
$ | 19,980 | $ | 19,481 | 3.69 | % | ||||||
|
Due after five through ten years |
168,557 | 166,996 | 4.28 | |||||||||
|
Due after ten years |
48 | 48 | - | |||||||||
|
Subtotal |
188,585 | 186,525 | 4.22 | |||||||||
|
Mortgage-backed securities |
40,997 | 41,280 | 4.87 | |||||||||
|
Total |
$ | 229,582 | $ | 227,805 | 4.34 | % | ||||||
|
Securities held-to-maturity |
||||||||||||
|
Due less than one year |
$ | 19,997 | $ | 19,810 | 3.76 | % | ||||||
|
Due after ten years |
775 | 775 | - | |||||||||
|
Subtotal |
20,772 | 20,585 | 3.76 | |||||||||
|
Mortgage-backed securities |
15,405 | 15,909 | 4.65 | |||||||||
|
Total |
$ | 36,177 | $ | 36,494 | 4.16 | % | ||||||
Securities are classified based upon contractual maturity dates. Actual maturities may differ from contractual maturities because the borrowers have the right to prepay their obligations.
66
CASCADE FINANCIAL CORPORATION AND SUBSIDIARIES
Notes to Consolidated Financial Statements
(Dollars in thousands, except share amounts)
The following table presents gross unrealized losses and the fair value of available-for-sale and held-to-maturity securities at December 31, 2009, and December 31, 2008.
| DECEMBER 31, 2009 | ||||||||||||||||||||||||
|
Gross |
Gross |
|||||||||||||||||||||||
|
Unrealized |
Unrealized |
|||||||||||||||||||||||
|
Losses |
Losses |
TOTAL |
||||||||||||||||||||||
|
Fair |
Less Than |
Fair |
More Than |
Fair |
Unrealized |
|||||||||||||||||||
|
Value |
1 Year |
Value |
1 Year |
Value |
Losses |
|||||||||||||||||||
|
Securities available-for-sale |
||||||||||||||||||||||||
|
Mortgage-backed securities |
$ | 16,828 | $ | (375 | ) | $ | 3,597 | $ | (71 | ) | $ | 20,425 | $ | (446 | ) | |||||||||
|
Agency notes & bonds |
140,981 | (2,148 | ) | - | - | 140,981 | (2,148 | ) | ||||||||||||||||
|
Total |
$ | 157,809 | (2,523 | ) | 3,597 | (71 | ) | 161,406 | $ | (2,594 | ) | |||||||||||||
|
Securities held-to-maturity |
||||||||||||||||||||||||
|
Agency notes & bonds |
$ | 19,810 | $ | (187 | ) | $ | - | $ | - | $ | 19,810 | $ | (187 | ) | ||||||||||
|
Total |
$ | 19,810 | $ | (187 | ) | $ | - | $ | - | $ | 19,810 | $ | (187 | ) | ||||||||||
| DECEMBER 31, 2008 | ||||||||||||||||||||||||
|
Gross |
Gross |
|||||||||||||||||||||||
|
Unrealized |
Unrealized |
|||||||||||||||||||||||
|
Losses |
Losses |
TOTAL |
||||||||||||||||||||||
|
Fair |
Less Than |
Fair |
More Than |
Fair |
Unrealized |
|||||||||||||||||||
|
Value |
1 Year |
Value |
1 Year |
Value |
Losses |
|||||||||||||||||||
|
Securities available-for-sale |
||||||||||||||||||||||||
|
Mortgage-backed securities |
$ | 9,492 | $ | (281 | ) | $ | 9,766 | $ | (405 | ) | $ | 19,258 | $ | (686 | ) | |||||||||
|
Agency notes & bonds |
19,846 | (145 | ) | - | - | 19,846 | (145 | ) | ||||||||||||||||
|
Corporate/other |
454 | (840 | ) | - | - | 454 | (840 | ) | ||||||||||||||||
|
Total |
$ | 29,792 | $ | (1,266 | ) | $ | 9,766 | $ | (405 | ) | $ | 39,558 | $ | (1,671 | ) | |||||||||
|
Securities held-to-maturity |
||||||||||||||||||||||||
|
Mortgage-backed securities |
$ | 7,426 | $ | (139 | ) | $ | 1,811 | $ | (9 | ) | $ | 9,237 | $ | (148 | ) | |||||||||
|
Agency notes & bonds |
27,997 | (396 | ) | - | - | 27,997 | (396 | ) | ||||||||||||||||
|
Total |
$ | 35,423 | $ | (535 | ) | $ | 1,811 | $ | (9 | ) | $ | 37,234 | $ | (544 | ) | |||||||||
At December 31, 2009, the Bank had five mortgage-backed securities in our available-for-sale portfolio with a fair value of $3.6 million that had an unrealized loss greater than one year of $71 and none in the held-to-maturity securities. As of December 31, 2008, the Bank had sixteen available-for-sale and eight held-to-maturity securities considered to be temporarily impaired due to being in a loss position more than twelve months. The temporary impairment was less than 3% of the total book value of investments. Temporarily impaired securities are the result of an increase in credit spreads and are expected to regain their value as the securities near maturity and/or market rates decline; other-than-temporarily impaired securities are the result of contractual failure by the issuer, are not expected to rebound and are considered not collectible.
Securities shown above having fair values less than amortized cost and containing unrealized losses are evaluated periodically by the Corporation for other-than-temporary impairment. In this analysis, the Corporation determined that the decline in value is temporary and is related to the change in market interest rates since purchase. All
investment securities are rated AAA for credit quality by at least one major rating agency. The decline in value is not related to any company or industry specific event. The Corporation anticipates full recovery of par value with respect to these securities at maturity or sooner in the event of a more favorable market interest rate environment.
Prior to June 30, 2009, the Corporation owned preferred shares issued by Fannie Mae (FNMA) with a par value of $10.0 million and Freddie Mac (FHLMC) with a par value of $10.0 million. On September 7, 2008, the Federal Housing Finance Agency (FHFA) announced it was placing Fannie Mae and Freddie Mac under conservatorship and would eliminate dividends
on Fannie Mae and Freddie Mac common and preferred stock. The Corporation recorded a pre-tax impairment charge of $17.3 million, resulting in a charge of $11.3
67
CASCADE FINANCIAL CORPORATION AND SUBSIDIARIES
Notes to Consolidated Financial Statements
(Dollars in thousands, except share amounts)
million, net of taxes, to third quarter 2008 earnings. At March 31, 2009, the Corporation adjusted the value of these securities from $1.3 million to $436, which resulted in an additional charge of $858 taken in the first quarter of 2009. During the second quarter of 2009, these preferred shares of Fannie Mae and Freddie Mac were sold for an aggregate of $425 which resulted in an additional loss of $11.As of December 31, 2009, and 2008, the Corporation was required to maintain 85,850 and 89,350 shares, respectively, of $100 par value FHLB stock. As a member of the FHLB system, the Bank is required to maintain a minimum level of investment in FHLB stock based on specific percentages of its outstanding mortgages, total assets, or FHLB advances.
The Bank’s minimum required investment in FHLB stock was $8.6 million at December 31, 2009 and $8.9 million at December 31, 2008. The Bank may request redemption at par value of any stock in excess of the minimum required investment. Stock redemptions are at the discretion of the FHLB.
At December 31, 2009, the Bank held FHLB of Seattle stock with a par value of $11.9 million. The Corporation does not anticipate any impairment charges associated with these instruments. According to the AICPA Audit Guide, FHLB stock does not have readily determinable fair value and the equity ownership rights are more limited than would
be the case for a public company because of the Federal Housing Finance Agency’s (FHFA) oversight role in budgeting and approving dividends. FHLB stock is generally viewed as a long-term investment and as a restricted investment security, which is carried at cost. Thus, when evaluating FHLB stock for impairment, its value should be determined based on the ultimate recoverability of the par value rather than by recognizing temporary declines in value.
Under FHFA regulations, a Federal Home Loan Bank that fails to meet any regulatory capital requirement may not declare a dividend or redeem or repurchase capital stock in excess of what is required for members’ current loans. Moody’s Investors Service’s (Moody’s) current assessment of the FHLB’s portfolios
indicates that the true economic losses embedded in these securities are significantly less than the accounting impairments would suggest and are manageable given the FHLB’s capital levels. According to Moody’s, the large difference between the expected economic losses and the mark-to-market impairment losses for accounting purposes is attributed to market illiquidity, de-leveraging and stress in the credit market in general. Furthermore, Moody’s believes that the FHLB has the ability
to hold the securities until maturity. The FHLB has access to the U.S. Government-Sponsored Enterprise Credit Facility, a secured lending facility that serves as a liquidity backstop, substantially reducing the likelihood that the FHLB would need to sell securities to raise liquidity and, thereby, cause the realization of large economic losses. In addition, the Federal Reserve has begun to purchase direct debt obligations of Freddie Mac, Fannie Mae and the FHLB. Moody’s has stated that their
AAA senior debt rating and Prime-1 short-term debt rating are likely to remain unchanged based on expectations that the FHLB has a very high degree of government support. Based on the above, the Corporation has determined there is not an other-than-temporary impairment on the FHLB stock investment as of December 31, 2009.
Accrued interest receivable on securities and interest-bearing deposits was $2.1 million and $2.7 million at December 31, 2009, and 2008, respectively.
Proceeds from the sales of securities available-for-sale and gross realized gains and losses are summarized as follows for the years ended December 31, 2009, 2008, and 2007.
|
PROCEEDS |
GAINS |
LOSSES |
||||||||||
|
Year ended December 31, 2009 |
$ | 189,076 | $ | 1,599 | $ | (11 | ) | |||||
|
Year ended December 31, 2008 |
88,184 | 374 | (89 | ) | ||||||||
|
Year ended December 31, 2007 |
66,220 | 28 | - | |||||||||
68
CASCADE FINANCIAL CORPORATION AND SUBSIDIARIES
Notes to Consolidated Financial Statements
(Dollars in thousands, except share amounts)
Note 4 - LoansA summary of loans at December 31, 2009, and 2008, follows:
| DECEMBER 31, | ||||||||
|
2009 |
2008 |
|||||||
|
Business |
$ | 469,196 | $ | 485,060 | ||||
|
Construction (1) |
256,917 | 406,505 | ||||||
|
Commercial real estate |
183,286 | 122,951 | ||||||
|
Multifamily |
82,418 | 86,864 | ||||||
|
Consumer |
31,738 | 30,772 | ||||||
|
Residential |
179,133 | 126,089 | ||||||
|
Total loans |
1,202,688 | 1,258,241 | ||||||
|
Deferred loan fees, net |
(3,575 | ) | (3,069 | ) | ||||
|
Allowance for loan losses |
(25,900 | ) | (16,439 | ) | ||||
|
Net loans |
$ | 1,173,213 | $ | 1,238,733 | ||||
(1) Construction loans are net of loans in process.
Accrued interest on loans was $4.5 million and $4.9 million at December 31, 2009 and December 31, 2008, respectively.
At December 31, 2009, the contractual maturities of the loan portfolio were as follows:
|
FIXED |
VARIABLE |
ADJUSTABLE |
||||||||||||||
|
Term to maturity |
RATE |
RATE (1) |
RATE |
TOTAL |
||||||||||||
|
One year or less |
$ | 111,424 | $ | 237,726 | $ | 794 | $ | 349,944 | ||||||||
|
Over one through three years |
97,495 | 31,076 | 45,067 | 173,638 | ||||||||||||
|
Over three through five years |
101,547 | 7,315 | 80,865 | 189,727 | ||||||||||||
|
Over five through ten years |
62,721 | 10,040 | 212,891 | 285,652 | ||||||||||||
|
Over ten through twenty years |
5,082 | 3,809 | 28,091 | 36,982 | ||||||||||||
|
Over twenty years |
57,211 | 13,968 | 95,566 | 166,745 | ||||||||||||
|
Total |
$ | 435,480 | $ | 303,934 | $ | 463,274 | $ | 1,202,688 | ||||||||
(1) Variable includes all Prime, LIBOR, or Treasury indexed loans with a repricing frequency of three months or less.
A summary of the allowance for losses on loans follows:
| YEARS ENDED DECEMBER 31, | ||||||||||||
|
2009 |
2008 |
2007 |
||||||||||
|
Balances at beginning of year |
$ | 16,439 | $ | 11,653 | $ | 10,988 | ||||||
|
Off-balance sheet commitments |
24 | 49 | (142 | ) | ||||||||
|
Builder loan program discounts |
(1,171 | ) | - | - | ||||||||
|
Provision for losses |
44,175 | 7,240 | 1,350 | |||||||||
|
Recoveries |
275 | 1,282 | 135 | |||||||||
|
Charge-offs |
(33,842 | ) | (3,785 | ) | (678 | ) | ||||||
|
Balances at end of year |
$ | 25,900 | $ | 16,439 | $ | 11,653 | ||||||
69
CASCADE FINANCIAL CORPORATION AND SUBSIDIARIES
Notes to Consolidated Financial Statements
(Dollars in thousands, except share amounts)
The following tables show information on impaired loans:
|
DECEMBER 31, |
||||||||
|
2009 |
2008 |
|||||||
|
Impaired loans without a valuation allowance |
$ | 127,910 | $ | 53,618 | ||||
|
Impaired loans with a valuation allowance |
55,829 | 29,750 | ||||||
|
Total impaired loans |
$ | 183,739 | $ | 83,368 | ||||
|
Allowance for loan losses related to impaired loans |
$ | 6,422 | $ | 2,399 | ||||
|
Total nonperforming loans |
$ | 106,096 | $ | 40,278 | ||||
|
Total loans past-due ninety days or more and still accruing |
$ | 247 | $ | - | ||||
|
Performing restructured loans |
$ | 26,635 | $ | 910 | ||||
|
YEARS ENDED DECEMBER 31, |
||||||||||||
|
2009 |
2008 |
2007 |
||||||||||
|
Average investment in impaired loans |
$ | 190,399 | $ | 47,795 | $ | 6,450 | ||||||
|
Interest income recognized on impaired loans |
$ | 5,239 | $ | 4,525 | $ | 1,810 | ||||||
The principal balance on loans whose contractual terms have been restructured in a manner which grants a concession to a borrower experiencing financial difficulties was $51.9 million and $910 at December 31, 2009 and 2008, respectively. These restructured loan amounts have been included in the impaired loan totals noted above. Restructured
loans totaling $26.6 million and $910 at December 31, 2009 and 2008, respectively, were current in their payments and accruing interest.
If interest on nonperforming loans had been recognized in accordance with their contractual terms, such income would have been $7.5 million, $871 and $111 respectively, for the periods ended December 31, 2009, 2008, and 2007.
Note 5 - Mortgage Servicing Rights
A summary of capitalized mortgage servicing rights, included in other assets at December 31, 2009, 2008, and 2007 as follows:
| DECEMBER 31, | ||||||||||||
|
2009 |
2008 |
2007 |
||||||||||
|
Balance at beginning of year |
$ | 91 | $ | 130 | $ | 174 | ||||||
|
Additions |
- | - | - | |||||||||
|
Amortization |
(28 | ) | (39 | ) | (44 | ) | ||||||
|
Balance at end of year |
$ | 63 | $ | 91 | $ | 130 | ||||||
Note 6 – Real Estate Owned and Other Repossessed Assets
The following table presents real estate owned and other repossessed assets for the periods presented:
|
|
DECEMBER 31, |
|||||||
| 2009 | 2008 | |||||||
|
Beginning balance |
$ | 1,446 | $ | - | ||||
|
Loans transferred to REO |
23,798 | 5,704 | ||||||
|
Loans transferred to other repossessed assets |
10 | 179 | ||||||
|
Capitalized improvements |
1,164 | - | ||||||
|
Sales |
(6,087 | ) | (4,434 | ) | ||||
|
Writedowns |
(1,256 | ) | - | |||||
|
Net loss on sales |
(233 | ) | (3 | ) | ||||
|
Ending balance |
$ | 18,842 | $ | 1,446 | ||||
Real estate owned (REO) and other repossessed assets include property acquired by the Bank through foreclosure and are carried at the lower of the estimated fair value, less costs to sell, or the principal balance of the foreclosed loans. REO and repossessed assets totaled $18.8 million at December 31, 2009 and $1.4 million at December 31,
2008. REO as of
70
CASCADE FINANCIAL CORPORATION AND SUBSIDIARIES
Notes to Consolidated Financial Statements
(Dollars in thousands, except share amounts)
December 31, 2009 consisted of $13.1 million in construction/land development projects, $3.6 million in single-family residential condominiums, and $2.1 million in a multifamily condominium project.Note 7 - Premises and Equipment
A summary of premises and equipment follows:
| ESTIMATED |
DECEMBER 31, |
||||||||
|
USEFUL LIVES |
2009 |
2008 |
|||||||
|
Land |
$ | 4,291 | $ | 4,291 | |||||
|
Buildings |
40 years |
13,197 | 13,106 | ||||||
|
Leasehold improvements |
Lease term |
2,589 | 2,420 | ||||||
|
Furniture and equipment |
2-10 years |
13,976 | 13,293 | ||||||
| 34,053 | 33,110 | ||||||||
|
Accumulated depreciation and amortization |
(19,527 | ) | (17,647 | ) | |||||
|
Total |
$ | 14,526 | $ | 15,463 | |||||
Total depreciation and amortization expense was $2.3 million for the year ended December 31, 2009, $2.1 million for the year ended December 31, 2008, and $1.9 million for the year ended December 31, 2007.
Note 8 – Goodwill and Other Intangible Assets
At December 31, 2009, the Corporation had $12.9 million in goodwill as a result of a business combination. In the second and fourth quarters of 2009, the Corporation engaged an independent valuation consultant to assist in determining
whether, and to what extent, its goodwill asset was impaired. The goodwill impairment test included two steps. Step one, used to identify potential impairment, compared the estimated fair value of the Corporation with its carrying amount including goodwill. Step one inputs used to determine the implied fair value of the Corporation included
the quoted market price of Cascade’s common stock, market prices of common stocks of other banking organizations, common stock trading multiples, discounted cash flows and inputs from comparable transactions. If the estimated fair value exceeds its carrying amount, goodwill is considered not to be impaired. If the carrying amount exceeds its estimated fair value, the second step of a goodwill impairment test is performed to measure the amount of impairment loss, if any. The independent valuation consultant
determined in each test that the carrying amount exceeded the estimated fair value of the Corporation and the second step of the goodwill impairment test was performed. Step two of the goodwill impairment test compared the implied estimated fair value of goodwill with the carrying amount of the currently recorded goodwill. If the carrying amount of goodwill exceeds the implied fair value of the recorded goodwill, an impairment charge is taken in an amount equal to that excess. The goodwill impairment test performed
during the second quarter showed that, as a result of the significant decline in Cascade’s stock price and market capitalization over the course of 2009, and in conjunction with similar declines in the value of most financial institutions and the ongoing disruption in related financial markets, the Corporation’s goodwill was deemed to be impaired. As a result of the impairment analysis, the Corporation reduced the carrying value of goodwill in our Consolidated Balance Sheet by recording an $11.7 million
write-down in the second quarter which reduced the Bank’s December 31, 2008 goodwill balance of $24.6 million to $12.9 million. The write-down of goodwill was a non-cash charge that did not affect the Corporation’s or the Bank’s liquidity or operations. Also, since goodwill is excluded from regulatory capital calculations, the impairment charge (which was not deductible for
tax purposes) did not have an adverse effect on the “well-capitalized” regulatory capital ratios of the Corporation or the Bank. There was no goodwill impairment noted in the fourth quarter goodwill impairment test. The goodwill impairment test performed during the fourth quarter concluded that the fair value of the reporting unit exceeded its carrying value. There are many assumptions and estimates underlying the determination of whether goodwill has been impaired. Future events could cause management
to conclude that the Corporation’s goodwill has become further impaired which would result in the Corporation recording an additional impairment loss.
Goodwill and intangible assets consisted of the following at December 31, 2009, and 2008:
|
GROSS CARRYING AMOUNT |
||||||||
|
2009 |
2008 |
|||||||
|
Goodwill |
$ | 12,885 | $ | 24,585 | ||||
|
Core deposit intangible, net |
352 | 493 | ||||||
|
Total |
$ | 13,237 | $ | 25,078 | ||||
71
CASCADE FINANCIAL CORPORATION AND SUBSIDIARIES
Notes to Consolidated Financial Statements
(Dollars in thousands, except share amounts)
The carrying amount and accumulated amortization of the core deposit intangible asset at December 31, 2009, 2008, and 2007 was as follows:
|
YEARS ENDED DECEMBER 31, |
||||||||||||
|
2009 |
2008 |
2007 |
||||||||||
|
Gross carrying amount |
$ | 1,127 | $ | 1,127 | $ | 1,127 | ||||||
|
Accumulated amortization |
(775 | ) | (634 | ) | (493 | ) | ||||||
|
Net carrying amount |
$ | 352 | $ | 493 | $ | 634 | ||||||
Amortization expense for each of the years ended December 31, 2009, 2008, and 2007 was $141. Estimated existing intangible asset amortization for the following years is as follows:
|
For year ended 12/31/10 |
$ | 141 | ||
|
For year ended 12/31/11 |
141 | |||
|
For year ended 12/31/12 |
70 |
Note 9 - Deposits
Deposits are summarized as follows:
|
DECEMBER 31, |
||||||||
|
2009 |
2008 |
|||||||
|
Noninterest-bearing checking accounts |
$ | 99,724 | $ | 84,033 | ||||
|
Interest-bearing checking accounts |
345,198 | 102,810 | ||||||
|
Money market deposit accounts |
123,129 | 193,448 | ||||||
|
Savings accounts |
10,001 | 10,587 | ||||||
|
Certificates of deposit |
561,722 | 615,904 | ||||||
|
Total |
$ | 1,139,774 | $ | 1,006,782 | ||||
Included in the amounts above are $163.0 million and $286.9 million in brokered deposits as of December 31, 2009 and 2008, respectively.
The following table indicates the amount of the Bank’s jumbo certificates of deposit by time remaining until maturity at December 31, 2009. Jumbo certificates of deposit require minimum deposits of $100 thousand and rates paid on such accounts are negotiable.
|
DECEMBER 31, |
||||||||
|
2009 |
2008 |
|||||||
|
Three months or less |
$ | 63,879 | $ | 114,752 | ||||
|
Over three through six months |
36,476 | 47,887 | ||||||
|
Over six through twelve months |
31,857 | 37,949 | ||||||
|
Over twelve months |
13,963 | 9,886 | ||||||
|
Total |
$ | 146,175 | $ | 210,474 | ||||
Maturities of time deposits at December 31, 2009, are as follows:
|
Years ending December 31, |
2010 |
$ | 443,604 | ||
|
2011 |
97,493 | ||||
|
2012 |
4,273 | ||||
|
2013 |
2,907 | ||||
|
Thereafter |
13,445 | ||||
|
Total |
$ | 561,722 |
A summary of interest expense on deposits follows:
| YEARS ENDED DECEMBER 31, | ||||||||||||
|
2009 |
2008 |
2007 |
||||||||||
|
Checking and money market accounts |
$ | 3,951 | $ | 8,514 | $ | 13,061 | ||||||
|
Savings accounts and time deposits |
13,113 | 18,701 | 22,159 | |||||||||
|
Total |
$ | 17,064 | $ | 27,215 | $ | 35,220 | ||||||
72
CASCADE FINANCIAL CORPORATION AND SUBSIDIARIES
Notes to Consolidated Financial Statements
(Dollars in thousands, except share amounts)
Note 10 - FHLB AdvancesFHLB advances are summarized as follows:
| DECEMBER 31, | |||||||||||||||||
|
2009 |
2008 |
||||||||||||||||
|
WEIGHTED |
WEIGHTED |
||||||||||||||||
|
AVERAGE |
AVERAGE |
||||||||||||||||
|
INTEREST |
INTEREST |
||||||||||||||||
|
MATURITY DATE |
AMOUNT |
RATE |
AMOUNT |
RATE |
|||||||||||||
|
At December 31, |
2009 |
$ | - | - | % | $ | 10,000 | 3.62 | % | ||||||||
|
2010 |
- | - | - | 0 | |||||||||||||
|
2011 |
10,000 | 3.88 | 10,000 | 3.88 | |||||||||||||
|
2012 |
40,000 | 4.33 | 40,000 | 4.33 | |||||||||||||
|
2013 |
30,000 | 3.61 | 30,000 | 3.61 | |||||||||||||
|
2014 |
10,000 | 3.29 | 10,000 | 3.29 | |||||||||||||
|
Thereafter |
149,000 | 4.52 | 149,000 | 4.52 | |||||||||||||
| $ | 239,000 | 4.29 | % | $ | 249,000 | 4.27 | % | ||||||||||
| YEARS ENDED DECEMBER 31, | ||||||||
|
2009 |
2008 |
|||||||
|
Maximum amount of outstanding FHLB advances at any month-end |
$ | 249,000 | $ | 287,500 | ||||
|
Average amount of outstanding FHLB advances during the year |
243,904 | 256,898 | ||||||
The Bank’s total credit line with the FHLB-Seattle is equivalent to 35% of total assets, or up to approximately $597.0 million at December 31, 2009, and is subject to certain collateral requirements. At December 31, 2009, the Bank had a $65.0 million letter of credit from the FHLB and an unused line of credit from the FHLB-Seattle of $293.0 million subject to the availability of eligible collateral. The Bank had
$239.0 million in fixed-rate advances as of December 31, 2009. The FHLB has the option to call these advances and may do so in a rising rate environment.
FHLB advances and letters of credit are collateralized by otherwise unencumbered permanent residential mortgages, investment grade securities, and other eligible real estate mortgages. Federal statute requires all members of the FHLB to maintain collateral on FHLB borrowings, letters of credit, and advances equivalent to the amount borrowed
on a daily basis.
Note 11 - Securities Sold Under Agreements to Repurchase and Lines of Credit
(a) Securities sold under Agreements to Repurchase
The Corporation enters into sales of securities under agreements to repurchase (reverse repurchase agreements) that are treated as financing arrangements. Accordingly, the obligations to repurchase securities sold are reflected as a liability in the consolidated balance sheets. The securities underlying the agreements are under the Corporation’s
control and are held by nationally known government security dealers who are recognized as primary dealers by the Federal Reserve Board, or other investment banking firms approved by the Corporation’s Board of Directors.
Securities sold under agreements to repurchase the same securities consist of agency notes and bonds and/or mortgage-backed securities summarized as follows:
| UNDERLYING SECURITIES | ||||||||||||||||
|
WEIGHTED |
BOOK VALUE, |
|||||||||||||||
|
AVERAGE |
INCLUDING |
|||||||||||||||
|
BALANCE |
INTEREST |
ACCRUED |
MARKET |
|||||||||||||
|
OUTSTANDING |
RATE |
INTEREST |
VALUE |
|||||||||||||
|
December 31, 2009 |
$ | 145,410 | 5.85 | % | $ | 201,621 | $ | 199,183 | ||||||||
|
December 31, 2008 |
146,390 | 5.19 | 193,832 | 193,846 | ||||||||||||
Financial data pertaining to repurchase agreements follows:
| YEARS ENDED DECEMBER 31, | ||||||||
|
2009 |
2008 |
|||||||
|
Maximum amount of outstanding agreements at any month-end |
$ | 147,510 | $ | 147,740 | ||||
|
Average amount of outstanding agreements during the year |
146,872 | 124,211 | ||||||
73
CASCADE FINANCIAL CORPORATION AND SUBSIDIARIES
Notes to Consolidated Financial Statements
(Dollars in thousands, except share amounts)
At December 31, 2009, the Corporation had non-retail repurchase agreements in place with two firms, both of which require the market value of investments sold under agreements to repurchase to exceed the Corporation’s repurchase obligations. The following table summarizes these agreements:
|
Counterparty |
Securities sold under
agreement to repurchase
in excess of repurchase obligation |
Repurchase agreement
weighted average
maturity (in years) |
||||||
|
BNP Paribas |
$ | 36,187 | 9.7 | |||||
|
Deutsche Bank |
$ | 18,998 | 8.0 | |||||
The Corporation had $75.0 million of repurchase agreements with an adjustable rate tied to three-month LIBOR that resets every three months until maturity and $70.4 million that are fixed for the remainder of the agreement unless the lender terminates the agreement. Under the adjustable rate pricing formula, the interest rate increases when
LIBOR declines and decreases when LIBOR rises. The maximum interest rate under these agreements is 7%.
The repurchase agreements consist of a series of transactions with maturity dates ranging from 2017 to 2022. The agreements have provisions that allow the lender to periodically terminate the agreements. Termination dates typically occur once each quarter; however a portion of the agreements may not be terminated prior to December, 2012,
providing the Corporation offers the lender additional securities in December, 2010 and December, 2011.
(b) Lines of Credit
The Bank had a $154.0 million line of credit with the Federal Reserve Bank of San Francisco collateralized by commercial and construction loans. As detailed in the following table, the Bank had an outstanding balance of $20.0 million in Term Auction Facility (TAF) borrowings against this line as of December 31, 2009.
|
AMOUNT |
INTEREST RATE |
ORIGINATION DATE |
MATURITY DATE | |||||
| $ | 20,000 | 0.25 | % |
12/17/09 |
1/14/10 | |||
Note 12 - Junior Subordinated Debentures (Trust Preferred Securities (TPS))
On March 1, 2000, $10.3 million of 11% junior subordinated debentures were issued by a wholly owned business trust whose common equity is 100% owned by Cascade Financial Corporation, Cascade Capital Trust I. The Trust exists for the exclusive purpose of issuing and selling junior subordinated debentures issued by Cascade Financial Corporation,
and engaging in only those other activities necessary, advisable or incidental to the above. The Corporation used the proceeds for general corporate purposes including stock repurchases and investment in its subsidiary bank. The junior subordinated debentures will mature on March 1, 2030, unless redeemed prior to such date if certain conditions are met.
On December 15, 2004, the Corporation issued $5.2 million in junior subordinated debentures, as Cascade Capital Trust II. These debentures had a fixed coupon of 5.82% for the first five years and as of January 7, 2010 float at the three-month LIBOR plus 1.90% for the remaining twenty-five years. The debentures were callable at
par after the first five years.
On March 30, 2006, the Corporation issued an additional $10.3 million in junior subordinated debentures, as Cascade Capital Trust III. These debentures have a fixed coupon of 6.50% for the first five years and then float, if not called, at the three-month LIBOR plus 1.40% for the remaining twenty-five years.
The junior subordinated debentures issued under Cascade Capital Trusts II and III incorporate the same structure, for the same purposes as Cascade Capital Trust I. All of the above debentures are considered Tier 1 capital for regulatory purposes.
The Corporation applied fair value accounting to Cascade Capital Trust I. The change in fair market value of the junior subordinated debentures is recorded as a component of other income. The Corporation determined the fair value for Cascade Capital Trust I by using a model, primarily through establishing a discount rate. The rate was based
upon the rate of 20 year T-notes (the approximate remaining maturity) as of December 31, 2009, plus a credit spread developed by reviewing a number of other issues via Bloomberg analytics; an awareness of where the TPS are currently trading in the market; and a liquidity premium of 500 basis points due to the size of the Corporation and the issue. As with similar bonds, the
74
CASCADE FINANCIAL CORPORATION AND SUBSIDIARIES
Notes to Consolidated Financial Statements
(Dollars in thousands, except share amounts)
bonds were assumed to be outstanding until maturity. The derived rate was 24.55% and the valuation is considered a Level 3 measurement. That security had a substantial decline in its yield at a time when the market values on small bank trust preferred issues were flat or declining in value. The fair value option was not selected for the remaining variable rate junior subordinated debentures totaling $15.5 million.On November 5, 2009, the Board of Directors elected to defer payments due on these instruments. Under the terms of each instrument deferral of payments are permitted without triggering an event of default. Generally, during any deferral period, the Corporation is prohibited from paying any dividends or distributions on, or redeem, purchase
or acquire, or make a liquidation payment with respect to the Corporation’s capital stock, or make any payment of principal or interest on, or repay, repurchase or redeem any debt securities of the Corporation that rank pari passu in all respects with, or junior to, the specific instrument. In addition, during any deferral period, interest on the trust preferred securities is compounded from the date such interest would have been payable.
Note 13 - Income Taxes
Income tax (benefit) expense includes the following components:
|
YEARS ENDED DECEMBER 31, |
||||||||||||
|
2009 |
2008 |
2007 |
||||||||||
|
Current |
$ | (12,714 | ) | $ | 7,737 | $ | 9,365 | |||||
|
Deferred |
5,104 | (8,176 | ) | (1,982 | ) | |||||||
|
Total |
$ | (7,610 | ) | $ | (439 | ) | $ | 7,383 | ||||
As required by FASB ASC Topic 740, Accounting for Income Taxes, the Corporation continually reviews the likelihood that deferred tax assets will be realized in future tax periods under the “more-likely-than-not” criteria. The term more likely than not means a likelihood
of more than 50 percent. In making this judgment, ASC Topic 740 requires that all available evidence, both positive and negative, should be considered to determine whether, based on the weight of that evidence, a valuation allowance is required. As of December 31, 2009, the Corporation had $10.5 million of deferred tax assets and net deferred tax assets (after deferred tax liabilities) of $5.0 million related to the U.S. tax jurisdictions whose recoverability is dependent upon future profitability.
In the future, the Corporation’s effective tax rate could be adversely affected by several factors, many of which are outside of the Corporation’s control. The effective tax rate is affected by the proportion of revenues and income before taxes
in the various domestic jurisdictions in which the Corporation operates. Further, the Corporation is subject to changing tax laws, regulations and interpretations in multiple jurisdictions in which the Corporation operates, as well as the requirements, pronouncements and rulings of certain tax, regulatory and accounting organizations. The Corporation estimates its annual effective tax rate each quarter based on a combination of actual and
forecasted results of subsequent quarters. Consequently, significant changes in its actual quarterly or forecasted results may impact the effective tax rate for the current or future periods.
Positive evidence includes consistent core earnings and the probability that taxable income will be generated in future periods. The Corporation’s cumulative loss for the last three years is caused by the current year which is the first year in almost twenty years that the Corporation has reported a net loss. Earnings are negatively
impacted by the Corporation’s $11.7 million goodwill impairment charge taken in the second quarter of 2009, which has no federal income tax impact. Excluding this charge, the Corporation’s three-year net income would not be in a cumulative loss position. Further, the Corporation had regulatory ratings sufficient to receive TARP funds in 2008, and remains well capitalized to date. However, past performance is no indication of future performance by the Corporation.
At December 31, 2009, the Corporation had a $12.9 million current tax asset. The receivable is the result of tax carry-backs that the Corporation will recognize due to losses that have been recorded in 2009 and to OTTI charges taken in 2008 on Fannie Mae and Freddie Mac preferred stock. On September 7, 2008, the U.S. Treasury, the Federal
Reserve and the Federal Housing Finance Agency (FHFA) announced that FHFA was placing Fannie Mae and Freddie Mac under conservatorship and would eliminate dividends on Fannie Mae and Freddie Mac common and preferred stock. The Corporation recorded a pre-tax OTTI charge of $17.3 million to third quarter 2008 earnings and an additional charge of $858 in the first quarter of 2009. The sale of Fannie Mae and Freddie Mac preferred stock during the year allowed the Corporation to recover more than $6.3 million
in taxes paid for the 2009 tax return and accounts for a large portion of the current tax asset.
75
CASCADE FINANCIAL CORPORATION AND SUBSIDIARIES
Notes to Consolidated Financial Statements
(Dollars in thousands, except share amounts)
For the year ended December 31, 2009, the Corporation's effective tax rate was 24.5% compared to (26.6)% and 32.2% for the years ended December 31, 2008 and 2007. Tax credits on low income housing loans totaling $468, $379, and $52 for the years ended December 31, 2009, 2008, and 2007 combined with tax benefits related to interest on tax
exempt loans and increases in cash surrender value of bank owned life insurance were the significant factors contributing to the reduction in effective tax rates in 2009 and 2008.
Income tax (benefit) expense differs from that computed by applying the U.S. federal income tax rate of 35% to pretax income for the years ended December 31, 2009, 2008 and 2007, as a result of the following:
| YEARS ENDED DECEMBER 31, | ||||||||||||
|
2009 |
2008 |
2007 |
||||||||||
|
Computed “expected” tax (benefit) expense |
$ | (10,877 | ) | $ | 578 | $ | 8,025 | |||||
|
Goodwill |
4,095 | - | - | |||||||||
|
Low income housing tax credit |
(468 | ) | (379 | ) | (52 | ) | ||||||
|
Bank owned life insurance (BOLI) |
(310 | ) | (343 | ) | (239 | ) | ||||||
|
Tax exempt interest |
(156 | ) | (111 | ) | (218 | ) | ||||||
|
Nondeductible stock-based compensation cost |
48 | 65 | 68 | |||||||||
|
Dividend on preferred stock |
- | (223 | ) | - | ||||||||
|
Other, net |
58 | (26 | ) | (201 | ) | |||||||
|
Total |
$ | (7,610 | ) | $ | (439 | ) | $ | 7,383 | ||||
Under certain provisions of the Internal Revenue Code, the Corporation was allowed a statutory bad debt deduction (based upon a percentage of taxable income before such deduction) for additions to tax bad debt reserves established for the purpose of absorbing losses on loans or property acquired through foreclosure. This amount represents
allocations of income to bad debt deductions for tax reporting purposes only. Reduction of amounts so allocated for purposes other than tax bad debt losses will create income for tax reporting purposes only, which will be subject to the then-current corporate income tax rate.
The following table presents major components of the net deferred tax asset (liability) resulting from differences between financial reporting and tax bases at December 31, 2009, and December 31, 2008:
|
DECEMBER 31, |
||||||||
|
2009 |
2008 |
|||||||
|
Deferred tax assets: |
||||||||
|
Tax credit carry-forward |
$ | 856 | - | |||||
|
Alternative minimum tax credit carry-forward |
808 | - | ||||||
|
Securities available-for-sale |
622 | 355 | ||||||
|
Junior subordinated debentures |
- | 279 | ||||||
|
Premises and equipment |
343 | 788 | ||||||
|
Loans |
7,825 | 5,603 | ||||||
|
OTTI |
- | 6,068 | ||||||
|
Gross deferred tax assets |
10,454 | 13,093 | ||||||
|
Deferred tax liabilities: |
||||||||
|
Deferred loan fees |
(1,293 | ) | (1,305 | ) | ||||
|
Junior subordinated debentures |
(2,240 | ) | - | |||||
|
Core deposit intangible |
(123 | ) | (173 | ) | ||||
|
FHLB stock |
(1,732 | ) | (1,732 | ) | ||||
|
Other |
(75 | ) | (55 | ) | ||||
|
Gross deferred tax liabilities |
(5,463 | ) | (3,265 | ) | ||||
|
Net deferred tax asset |
$ | 4,991 | $ | 9,828 | ||||
Deferred tax assets and liabilities are recognized for the future tax consequences attributable to temporary differences between the financial statement carrying amounts of existing assets and liabilities and their respective tax basis. Deferred tax assets and liabilities are measured using enacted tax rates expected to apply to taxable income
in the years in which those temporary differences are expected to be recovered or settled. The effect on deferred tax assets and liabilities of a change in tax rates is recognized in income in the period that includes
76
CASCADE FINANCIAL CORPORATION AND SUBSIDIARIES
Notes to Consolidated Financial Statements
(Dollars in thousands, except share amounts)
the enactment date. These calculations are based on many complex factors including estimates of the timing of reversals of temporary differences, the interpretation of federal income tax laws, and a determination of the differences between the tax and the financial reporting basis of assets and liabilities. Actual results could differ significantly from the estimates and interpretations used in determining the current and deferred income tax liabilities.The Corporation maintains significant net deferred tax assets for deductible temporary differences, the largest of which relates to the allowance for loan losses, which is approximately 75% of the Corporation’s deferred tax assets. This deferred tax asset has increased $2.2 million as of December 31, 2009 as compared to the prior year-end
due to increased levels of reserves for delinquent and non-accruing loans brought about by the downturn in the local residential real estate market and the nationwide recession.
At December 31, 2009, the Corporation had alternative minimum tax (AMT) credit carryforwards of approximately $808 and general business credits of approximately $856 eligible to offset future federal income taxes. AMT credits can be carried forward indefinitely. The general business credits will begin to expire in 2027.
A valuation allowance is required on deferred tax assets if it is “more likely than not” that the deferred tax asset will not be realized. The determination of the realization of the deferred tax assets is highly subjective and dependent upon judgment concerning management’s evaluation of both positive and negative evidence,
including income and losses in recent years, the forecast of future income, applicable tax planning strategies, and assessments of the current and future economic and business conditions. The Corporation considers both positive and negative evidence regarding the ultimate realization of deferred tax assets. Based on the weight of the evidence, the Corporation has determined a valuation allowance is not required as of December 31, 2009.
The Corporation adopted the provisions of FASB ASC 740, Accounting for Uncertainty in Income Taxes, on January 1, 2007. The Corporation had no unrecognized tax benefits which would require an adjustment to the January 1, 2007 beginning balance of retained earnings. The Corporation had
no unrecognized tax benefits at December 31, 2009, 2008 or 2007.
The Corporation recognizes interest accrued and penalties related to unrecognized tax benefits in tax expense. During the years ended December 31, 2009, and 2008, the Corporation recognized no interest or penalties.
The Corporation and its subsidiaries file income tax returns in the U.S. Federal jurisdiction. With few exceptions, the Corporation is no longer subject to U.S. federal or state/local income tax examinations by tax authorities for years before 2006.
Note 14 – (Loss) Earnings per Common Share
The following table presents (loss) earnings per common share information:
|
YEARS ENDED DECEMBER 31, |
||||||||||||
|
2009 |
2008 |
2007 |
||||||||||
|
Net (loss) income |
$ | (23,468 | ) | $ | 2,090 | $ | 15,546 | |||||
|
Dividends on preferred stock |
1,943 | 216 | - | |||||||||
|
Accretion of issuance discount on preferred stock |
422 | 35 | - | |||||||||
|
Net (loss) income available for common stockholders |
$ | (25,833 | ) | $ | 1,839 | $ | 15,546 | |||||
|
Weighted average number of common shares outstanding, basic |
12,121,113 | 12,053,084 | 12,047,792 | |||||||||
|
Effect of dilutive stock options |
- | 106,090 | 237,062 | |||||||||
|
Weighted average number of common shares outstanding, diluted |
12,121,113 | 12,159,174 | 12,284,854 | |||||||||
|
(Loss) earnings per common share, basic |
$ | (2.13 | ) | $ | 0.15 | $ | 1.29 | |||||
|
(Loss) earnings per common share, diluted |
(2.13 | ) | 0.15 | 1.27 | ||||||||
For purposes of calculating basic and diluted (loss) earnings per common share, the numerator of net (loss) income available for common stockholders is the same. There were outstanding options to purchase 647,976; 399,385; and 174,810 shares of common stock at December 31, 2009, 2008, and 2007, respectively, that are considered anti-dilutive
and have
77
CASCADE FINANCIAL CORPORATION AND SUBSIDIARIES
Notes to Consolidated Financial Statements
(Dollars in thousands, except share amounts)
been excluded from the above calculation. Anti-dilutive options have an exercise price that is greater than the current market price of the stock. Also as of December 31, 2009, the warrant issued to the U.S. Treasury to purchase up to 863,442 shares of common stock was not included in the computation of diluted (loss) earnings per common share because the warrant’s exercise price was greater than the average market price of common shares.Note 15 – Related Party Transactions
The following table presents the balances and activity of loans to officers and directors during 2009 and 2008.
| DECEMBER 31, | ||||||||
|
2009 |
2008 |
|||||||
|
Balances at beginning of year |
$ | 1,421 | $ | 327 | ||||
|
New loans or advances |
157 | 1,100 | ||||||
|
Repayments |
(19 | ) | (6 | ) | ||||
|
Balances at end of year |
$ | 1,559 | $ | 1,421 | ||||
The loans (with certain directors or executive officers of the Bank) were in the ordinary course of business on substantially the same terms, including interest rates and collateral, as those prevailing at the time for comparable loans with persons not related to the Bank and did not involve more than normal risk of collectability or present
other unfavorable features.
Deposits held by executive officers and directors totaled $6.0 million at December 31, 2009, and $3.8 million at December 31, 2008. Included in these totals were $3.1 million and $1.6 million held in business accounts on which six directors have signing authority, at December 31, 2009, and December 31 2008, respectively.
Note 16 - Stockholders’ Equity
(a) U.S. Treasury Department’s Capital Purchase Program - TARP
On November 21, 2008, the Corporation completed its $39.0 million capital raise as a participant in the U.S. Treasury Department’s Capital Purchase Program (CPP). Under the terms of the transaction, the Corporation issued 38,970 shares of Series A Fixed-Rate Cumulative Perpetual Preferred Stock and a warrant to purchase 863,442 shares
of the Corporation’s common stock at an exercise price of $6.77 per share. The additional capital has enhanced the Bank’s capacity to support the communities it serves through its lending activities.
In determining the value of the Series A Preferred Stock and the attendant warrant from the U.S. Treasury’s Capital Purchase Program, the Corporation apportioned the values using the relative fair value approach. The Corporation computed the present value of the preferred stock at $23.5 million assuming a ten-year life, 5% interest
rate for the first five years and 9% for the second five years (the dividend that the Corporation will pay the Treasury). A discount rate of 14% was used as the approximate current cost of capital for the Corporation.
The Corporation computed a fair value of the warrants using the Black-Scholes option valuation model. The assumptions in deriving the value were a 34% volatility rate of the Corporation’s common stock, a 2.60% annual dividend rate on the Corporation’s common stock, a 2.75% risk free interest rate, which corresponded to the yield
on the five year Treasury note at the time of the issuance, and an assumed life of ten years. The present value of the warrants was computed to be $1.6 million. The present value of the preferred stock represented 93.87% of the combined present value of $25.0 million of the components of the $39.0 million received or $36.6 million. The resulting value for the warrants was 6.13% of the proceeds or $2.4 million.
The preferred shares issued under the CPP carry a 5% dividend for the first five years that increases to 9% thereafter. As a condition for participating in the CPP, the Corporation has accepted limitations on executive compensation and benefits. These limitations are explained in greater detail in the Corporation’s most recent
proxy statement on Schedule 14A filed with the SEC on March 23, 2009.
On November 5, 2009, the Board of Directors elected to defer the dividend payments on this preferred stock. Under the terms of the preferred stock, deferral of payment is permitted without triggering an event of default. Generally, during any deferral period, the Corporation is prohibited from paying any dividends or distributions
on, and may not redeem, purchase
78
CASCADE FINANCIAL CORPORATION AND SUBSIDIARIES
Notes to Consolidated Financial Statements
(Dollars in thousands, except share amounts)
or acquire, or make a liquidation payment with respect to the Corporation’s capital stock, or make any payment of principal or interest on, or repay, repurchase or redeem any debt securities of the Corporation that rank pari passu in all respects with, or junior to, the specific instrument. In addition, during any deferral period, dividends on the preferred stock are compounded from the date such dividends would have been payable.(b) Restrictions on Dividends
The principal source of the Corporation's revenue is dividends received from Cascade Bank. The payment of dividends is subject to government regulation, in that regulatory authorities may prohibit banks and bank holding companies from paying dividends that would constitute an unsafe or unsound banking practice. In addition, a bank may not
pay cash dividends if that payment could reduce the amount of its capital below that necessary to meet minimum applicable regulatory capital requirements. In November 2008, the Corporation issued preferred stock to the U.S. Treasury. As a provision of that issuance, the Corporation cannot increase its current cash dividend without prior approval of the U.S. Treasury for three years or until November 2011. While the Corporation is well capitalized by regulatory standards, in June 2009, the Corporation announced
that it would temporarily suspend its regular quarterly cash dividend on common stock to preserve capital.
Cascade Bank was notified by the FDIC in late September 2009, that based on an off-site review of its financial information, the Bank, among other restrictions, could not pay a cash dividend unless it obtained a non-objection from the FDIC. The Bank requested a non-objection and was informed orally that the request would be denied. Therefore,
the Bank is unable to pay a cash dividend to the Corporation. Dividends from the Bank are the Corporation’s primary source of cash.
(c) Regulatory Capital
The Corporation (on a consolidated basis) and the Bank are subject to various regulatory capital requirements administered by the federal banking agencies. Failure to meet minimum capital requirements can initiate certain mandatory and possibly additional discretionary actions by regulators that, if undertaken, could have a direct material
effect on the Corporation's and Bank's financial statements. Under capital adequacy guidelines and the regulatory framework for prompt corrective action, the Corporation and the Bank must meet specific capital guidelines that involve quantitative measures of their assets, liabilities and certain off-balance-sheet items as calculated under regulatory accounting practices. The capital amounts and classification are also subject
to qualitative judgments by the regulators about components, risk weightings, and other factors. Prompt corrective action provisions are not applicable to bank holding companies.
Quantitative measures established by regulation to ensure capital adequacy require the Corporation and the Bank to maintain minimum amounts and ratios (set forth in the following table) of total and Tier 1 capital (as defined in the regulations) to risk-weighted assets (as defined) and of Tier 1 capital (as defined) to average assets (as
defined). Management believes, as of December 31, 2009, and 2008, that the Corporation and the Bank met all capital adequacy requirements to which they are subject. To be categorized as well-capitalized, an institution must maintain minimum total risk-based, Tier 1 risk-based and Tier 1 leverage ratios as set forth in the following tables.
At December 31, 2009, banking regulations required institutions to have a minimum total risk-based capital to risk-weighted assets ratio of 8% and a Tier 1 (core) capital to adjusted total assets ratio of 4%. At December 31, 2009, the Bank was in compliance with the regulatory requirements for well-capitalized institutions.
| MINIMUM | ||||||||||||||||||||||||
|
REQUIREMENTS |
||||||||||||||||||||||||
|
FOR CAPITAL |
WELL-CAPITALIZED |
|||||||||||||||||||||||
|
ACTUAL |
ADEQUACY |
REQUIREMENTS |
||||||||||||||||||||||
|
CASCADE BANK |
AMOUNT |
RATIO |
AMOUNT |
RATIO |
AMOUNT |
RATIO |
||||||||||||||||||
|
December 31, 2009: |
||||||||||||||||||||||||
|
Total risk-based capital to risk-weighted assets (1) |
$ | 153,780 | 12.40 | % | $ | 99,205 | 8.00 | % | $ | 124,006 | 10.00 | % | ||||||||||||
|
Tier I (core) capital to risk-weighted assets |
138,150 | 11.14 | 49,603 | 4.00 | 74,404 | 6.00 | ||||||||||||||||||
|
Tier I (core) capital to average total assets |
138,150 | 8.32 | 66,425 | 4.00 | 83,032 | 5.00 | ||||||||||||||||||
|
December 31, 2008: |
||||||||||||||||||||||||
|
Total risk-based capital to risk-weighted assets (1) |
$ | 177,318 | 13.32 | % | $ | 106,493 | 8.00 | % | $ | 133,116 | 10.00 | % | ||||||||||||
|
Tier I (core) capital to risk-weighted assets |
160,786 | 12.08 | 53,247 | 4.00 | 79,870 | 6.00 | ||||||||||||||||||
|
Tier I (core) capital to average total assets |
160,786 | 10.34 | 62,215 | 4.00 | 77,769 | 5.00 | ||||||||||||||||||
|
(1) |
The Federal Reserve requires institutions to maintain Tier I capital of not less than one-half of total capital. |
79
CASCADE FINANCIAL CORPORATION AND SUBSIDIARIES
Notes to Consolidated Financial Statements
(Dollars in thousands, except share amounts)
The Corporation, as a bank holding company regulated by the Federal Reserve, is also subject to capital requirements that are similar to those for Cascade Bank.
| MINIMUM | ||||||||||||||||||||||||
|
REQUIREMENTS |
||||||||||||||||||||||||
|
FOR CAPITAL |
WELL-CAPITALIZED |
|||||||||||||||||||||||
|
ACTUAL |
ADEQUACY |
REQUIREMENTS |
||||||||||||||||||||||
|
CASCADE FINANCIAL CORP |
AMOUNT |
RATIO |
AMOUNT |
RATIO |
AMOUNT |
RATIO |
||||||||||||||||||
|
December 31, 2009: |
||||||||||||||||||||||||
|
Total risk-based capital to risk-weighted assets (1) |
$ | 158,882 | 12.82 | % | $ | 99,124 | 8.00 | % | $ | 123,906 | 10.00 | % | ||||||||||||
|
Tier I (core) capital to risk-weighted assets |
143,264 | 11.56 | 49,562 | 4.00 | 74,343 | 6.00 | ||||||||||||||||||
|
Tier I (core) capital to average total assets |
143,624 | 8.62 | 66,485 | 4.00 | 83,107 | 5.00 | ||||||||||||||||||
|
December 31, 2008: |
||||||||||||||||||||||||
|
Total risk-based capital to risk-weighted assets (1) |
$ | 176,681 | 13.26 | % | $ | 106,579 | 8.00 | % | $ | 133,224 | 10.00 | % | ||||||||||||
|
Tier I (core) capital to risk-weighted assets |
160,149 | 12.02 | 53,290 | 4.00 | 79,934 | 6.00 | ||||||||||||||||||
|
Tier I (core) capital to average total assets |
160,149 | 10.30 | 62,208 | 4.00 | 77,760 | 5.00 | ||||||||||||||||||
Note 17 – Regulatory Matters
In December 2009, Cascade Bank received the examination report of FDIC for the annual safety and soundness exam conducted by the regulators in May 2009. As previously announced, based on the examination report, on January 26, 2010 the board of directors of the Bank entered into an informal agreement called a memorandum of understanding, with
the regulators (the “FDIC Memorandum”). The FDIC Memorandum requires the Bank to take certain actions to correct deficiencies noted during the examination and to provide periodic reports to the regulators. These actions include performing a risk segmentation of the Bank’s loan portfolio; reducing concentrations of construction, lot development and other commercial real estate loans and levels of adversely classified and delinquent loans; strengthening credit administration; increasing board
oversight; reducing brokered deposits and other non-core funding and enhancing capital and strategic planning processes, and regulatory compliance policies.
The Board and management are committed to addressing and resolving these issues on a timely basis. Since completion of the regulatory examination, actions have already commenced to comply with many of these requirements, including working to improve our internal allowance for loan loss policies and procedures and refining our capital and
strategic planning efforts.
In light of the current challenging operating environment, along with our elevated level of nonperforming assets, delinquencies, and adversely classified assets, we may be subject to increased regulatory scrutiny, regulatory restrictions, and potential enforcement actions. Such enforcement actions could place additional limitations on our
business and adversely affect our ability to implement our business plans. Even though we remain “well-capitalized” based on our regulatory capital ratios, our regulators have the authority to restrict our operations to those consistent with adequately capitalized institutions and to require higher than normal capital levels to address current market, economic, loan portfolio and other risks. We may also be required to reduce our levels of construction and land development loans and classified or
non-performing assets within specified time frames. These time frames might not necessarily result in maximizing the price which might otherwise be received for the underlying properties. In addition, if such restrictions were also imposed upon other institutions which operate in our market area, multiple institutions disposing of properties at the same time could further diminish the potential proceeds received from the sale of these properties. If any of these or similar additional restrictions are placed on
us, it would limit the resources currently available to us as a well-capitalized institution.
Note 18 - Employee Benefit Plans
(a) Savings Plan
The Corporation maintains a savings plan under section 401(k) of the Internal Revenue Code, covering substantially all full-time employees. Under the plan, employee contributions are matched by the Corporation at a rate of 50% of the first $12 contributed.
Such matching becomes vested over a period of five years of credited service. Employees may make investments in various stock, fixed income or money market plans, or may purchase stock in the Corporation. The Corporation contributed $388, $382, and $336 to the plan for the years ended December 31, 2009, 2008, and 2007, respectively.
80
CASCADE FINANCIAL CORPORATION AND SUBSIDIARIES
Notes to Consolidated Financial Statements
(Dollars in thousands, except share amounts)
(b) Employee Stock Purchase Plan
The Corporation maintains an Employee Stock Purchase Plan, (ESPP) under the terms of which 213,212 shares of common stock have been authorized for issuance. The plan allows employees of the Corporation with three months of service the opportunity to purchase common stock through accumulated salary deductions during each offering period. On
the first day of each six-month offering period (January 1 and July 1 of each year), eligible employees who elect to participate are granted options to purchase a limited number of shares and unless the participant withdraws from the plan, the option is effectively exercised on the last day of each offering period. The aggregate number of shares to be purchased in any given offering is determined by dividing the accumulated salary deduction for the period by the lower of 85% of the market price of a common share
at the beginning or end of an offering period. During the year ended December 31, 2009, there were 48,081 shares purchased by employees participating in the ESPP. The ESPP provides that shares may either be purchased in the open market or may be new shares issued from the Corporation’s authorized but unissued shares. During the year ended December 31, 2009, there were 12,435 shares purchased on the open market for ESPP participants and 35,646 shares issued to participants from the Bank’s
authorized but unissued shares.
(c) Stock Options and Restricted Stock Grants
The stockholders of the Corporation approved two stock option plans to promote the best interest of the Corporation and its stockholders by providing an incentive to employees and directors. The plans permit the grant of incentive stock options and non-qualified stock options.
Options are granted to certain employees and directors at prices equal to the market value of the stock on the dates the options are granted. The options granted have a term of ten years from the grant date. Incentive stock options granted to employees vest over a five-year period. Non-qualified options granted to directors vest over
a four-year period. Compensation expense is recorded as if each vesting portion of the award is a separate award. The maximum number of options that may be issued under the plan is 937,500 (as adjusted for stock splits and dividends). The Corporation had 442,007 and 504,559 shares available for grant at December 31, 2009, and 2008, respectively.
Net compensation cost charged to earnings for stock-based compensation expense was $143 for 2009, $196 for 2008, and $213 for 2007. The total income tax benefit recognized in the income statement for stock based compensation arrangements was $4 for 2009, $30 for 2008, and $231 for 2007.
The following table provides key assumptions used for the determination of fair value for stock option grants:
|
YEARS ENDED DECEMBER 31, |
||||||||||||
|
2009 |
2008 |
2007 |
||||||||||
|
Risk-free interest rate |
N/A | 2.50 | % | 4.75 | % | |||||||
|
Expected life in years |
N/A | 6 | 5 | |||||||||
|
Expected volatility |
N/A | 24 | % | 24 | % | |||||||
|
Dividend yield |
N/A | 2.90 | % | 2.00 | % | |||||||
The fair value of options granted to the Corporation’s employees were estimated on the date of grant using the Black-Scholes valuation model. The application of this valuation model involves assumptions that are judgmental and sensitive in the determination of compensation expense.
Historical information was the primary basis for the selection of the expected volatility, expected dividend yield and the expected lives of the options. The Corporation has collected a long history of option activity and feels that this historical information presents the best basis for future projections. The risk-free interest rate
was selected based upon U.S. Treasury issues with a term equal to the expected life of the option being valued at the time of the grant.
81
CASCADE FINANCIAL CORPORATION AND SUBSIDIARIES
Notes to Consolidated Financial Statements
(Dollars in thousands, except share amounts)
A summary of option activity as of, and for the year ended, December 31, 2009 is as follows:
| Weighted- | ||||||||||||||||
|
Weighted- |
Average |
|||||||||||||||
|
Average |
Remaining |
|||||||||||||||
|
Exercise |
Contractual |
Aggregate |
||||||||||||||
|
Price per |
Term |
Intrinsic |
||||||||||||||
|
Options |
Share |
(in years) |
Value |
|||||||||||||
|
Outstanding as of December 31, 2008 |
656,883 | $ | 10.41 | 5.07 | $ | 153,385 | ||||||||||
|
Granted |
- | - | ||||||||||||||
|
Exercised |
- | - | ||||||||||||||
|
Forfeited/Cancelled |
(8,907 | ) | 7.20 | |||||||||||||
|
Outstanding as of December 31, 2009 |
647,976 | $ | 10.46 | 4.11 | $ | - | ||||||||||
|
Exercisable as of December 31, 2009 |
497,708 | $ | 9.51 | 3.14 | $ | - | ||||||||||
|
Options expected to invest |
635,743 | $ | 10.41 | 0.29 | $ | - | ||||||||||
All options granted have limited rights that enable a holder upon a change in control of the Corporation to elect to receive cash equal to the difference between the exercise price of the option and the fair market value of the common stock on the date of exercise. At December 31, 2009 and 2008, respectively, there were 497,708 and 441,658
shares that were fully exercisable.
No options were granted or exercised during 2009. The weighted average fair values of options granted under the Corporation's stock option plan were $2.59, and $4.04, respectively for the years ended December 31, 2008 and 2007. The total intrinsic value of options exercised were $133, and $1.1 million, respectively, during the years ended
December 31, 2008, and 2007. Total unrecognized compensation cost related to stock options was $113 as of December 31, 2009, $233 as of December 31, 2008, and $210 as of December 31, 2007. That cost is expected to be recognized over a weighted average period of 1.4 years. Cash received from options exercised under all share-based payment arrangements was $157, and $576, for the years ended December 31, 2008 and 2007, respectively.
During the year ended December 31, 2009, each Board member received an award of 3,582 shares of restricted stock worth approximately $12 on the day the shares were granted. These shares are part of the Board’s compensation package and vest in one year. The total number of shares of restricted stock granted for the year was 39,402.
Deferred Compensation Plan
In December 2004, the Board adopted the Cascade Bank Deferred Compensation Plan. The purpose of this Plan is to provide specified benefits to a select group of management or highly compensated employees who contribute materially to the continued growth, development and business success of the Bank. The Plan was inactive in
2007 and has been replaced with a new plan effective February 1, 2008.
On January 16, 2008, the Cascade Bank Non-Qualified Deferred Compensation Plan was adopted. Participants may contribute up to 50 percent of salary and 100 percent of any bonus payments received, net of applicable withholdings, to the Plan. In addition, the Compensation Committee has the authority to authorize an employer contribution to the
Plan for these same employees. There were no employer contributions made for the years ended December 31, 2009 and 2008. The contributions are based upon the performance of the Bank as well as the individual performance of each employee. The Non-Qualified Deferred Compensation Plan is also available to Directors. Each Director may contribute up to 100 percent of his or her director compensation to the Plan. No Corporation contributions are made for Directors.
Employment Agreement
The Bank entered into an employment agreement with Carol K. Nelson dated November 27, 2007 and modified November 31, 2008, which replaced a previous agreement, dated July 12, 2005. This agreement replaced a prior agreement dated March 26, 2002, and extended on January 27, 2004. The current agreement may be terminated upon 90 days written
notice.
82
CASCADE FINANCIAL CORPORATION AND SUBSIDIARIES
Notes to Consolidated Financial Statements
(Dollars in thousands, except share amounts)
(a) Financial Instruments
The fair value estimates presented below are subjective in nature, involve uncertainties and matters of significant judgment and, therefore, are not necessarily indicative of the amounts the Corporation could realize in a current market exchange. The Corporation has not included certain material items in its disclosure, such as the value
of the long-term relationships with the Corporation’s lending and deposit customers, since this is an intangible and not a financial instrument. Additionally, the estimates do not include any tax ramifications. There may be inherent weaknesses in any calculation technique, and changes in the underlying assumptions used, including discount rates and estimates of future cash flows, that could materially affect the results. For all of these reasons, the aggregation of the fair value calculations presented
herein do not represent, and should not be construed to represent, the underlying value of the Corporation.
The following table presents a summary of the fair value of the Corporation’s financial instruments:
| DECEMBER 31, | ||||||||||||||||
|
2009 |
2008 |
|||||||||||||||
|
CARRYING |
ESTIMATED |
CARRYING |
ESTIMATED |
|||||||||||||
|
VALUE |
FAIR VALUE |
VALUE |
FAIR VALUE |
|||||||||||||
|
Financial assets: |
||||||||||||||||
|
Cash and cash equivalents |
$ | 145,595 | $ | 145,595 | $ | 53,466 | $ | 53,466 | ||||||||
|
Securities available-for-sale |
227,805 | 227,805 | 123,678 | 123,678 | ||||||||||||
|
Securities held-to-maturity |
36,177 | 36,494 | 120,594 | 120,701 | ||||||||||||
|
FHLB stock |
11,920 | 11,920 | 11,920 | 11,920 | ||||||||||||
|
BOLI |
24,522 | 24,522 | 23,638 | 23,638 | ||||||||||||
|
Loans, net |
1,173,213 | 1,074,697 | 1,238,733 | 1,260,455 | ||||||||||||
|
REO and other repossessed assets |
18,842 | 18,842 | 1,446 | 1,446 | ||||||||||||
|
Financial liabilities: |
||||||||||||||||
|
Deposit accounts |
$ | 1,139,774 | $ | 1,116,840 | $ | 1,006,782 | $ | 997,826 | ||||||||
|
FHLB advances |
239,000 | 261,217 | 249,000 | 257,288 | ||||||||||||
|
FRB TAF borrowings |
20,000 | 20,000 | 40,000 | 40,008 | ||||||||||||
|
Securities sold under agreements to repurchase |
145,410 | 174,700 | 146,390 | 161,615 | ||||||||||||
|
Junior subordinated debentures |
15,465 | 8,079 | 15,465 | 11,569 | ||||||||||||
|
Junior subordinated debentures, at fair value |
3,341 | 3,341 | 10,510 | 10,510 | ||||||||||||
Cash and Cash Equivalents
The carrying amount represents fair value.
Securities including mortgage backed securities
Fair values are based on quoted market prices or dealer quotations when available or through the use of alternate approaches, such as matrix or model pricing, when market quotes are not readily available.
FHLB Stock
The Bank’s investment in FHLB stock is carried at par value ($100 per share), which reasonably approximates its fair value.
Bank Owned Life Insurance (BOLI)
The carrying amount of BOLI approximates its fair value, net of any surrender charges. Fair value of BOLI is estimated using the cash surrender value.
Loans
Fair values are estimated using current market interest rates to discount future cash flows for each of the different loan types. Interest rates used to discount the cash flows are based on published current market rates for similar products. Prepayment rates are based on expected future prepayment rates, or, where appropriate and available,
market prepayment rates. In addition to the yield adjustment noted above the Bank also includes a credit adjustment to determine the fair value of loans. The credit adjustment applies discounts to loans based upon type of loan and current loan classifications.
83
CASCADE FINANCIAL CORPORATION AND SUBSIDIARIES
Real Estate Owned
Notes to Consolidated Financial Statements
(Dollars in thousands, except share amounts)
The carrying amount represents fair value.
Deposits
The fair value of deposits with no stated maturity, such as checking accounts, money market deposit accounts and savings accounts, equals the amount payable on demand. The fair value of certificates of deposits is calculated based on the discounted value of contractual cash flows. The discount rate is equal to the rate currently offered on
similar products.
FHLB advances and securities sold under agreements to repurchase
The fair value is calculated based on the discounted cash flow method, adjusted for market interest rates and terms to maturity.
Junior Subordinated Debentures
The fair value is calculated based on the discounted cash flow method, adjusted for market interest rates and terms to maturity.
Junior Subordinated Debentures, at fair value
The fair value is calculated by using a model, primarily through establishing a discount rate. The rate was based upon the rate of 20 year T-notes (the approximate remaining maturity) as of December 31, 2009, plus a credit spread developed by reviewing a number of other issues via Bloomberg analytics; an awareness of where the TPS are currently
trading in the market; and a liquidity premium of 500 basis points due to the size of the Corporation and the issue. As with similar bonds, the bonds were assumed to be outstanding until maturity. The derived rate was 24.55% and the valuation is considered a Level 3 measurement. That security had a substantial decline in its yield at a time when the market values on small bank trust preferred issues were flat or declining in value. The fair value option was not selected for the remaining variable rate junior
subordinated debentures totaling $15.5 million.
Off-balance-sheet financial instruments
Commitments to extend credit, standby letters of credit and financial guarantees represent the principal categories of off-balance instruments (Note 20). The fair value of these commitments is not considered material because they are for a short period of time and subject to customary credit terms.
(b) Financial Assets and Liabilities Carried at Fair Value on a Recurring and Non-recurring Basis
Fair value is defined as the price that would be received to sell an asset or paid to transfer a liability in an orderly transaction between market participants on the measurement date. It also establishes a consistent framework for measuring fair value and expands disclosure requirements about fair value measurements. In determining fair
value, the Bank maximizes the use of observable inputs and minimizes the use of unobservable inputs. Observable inputs reflect market data obtained from independent sources, while unobservable inputs reflect the Bank’s estimates for market assumptions.
Valuation inputs refer to the assumptions market participants would use in pricing a given asset or liability using one of the three valuation techniques. Inputs can be observable or unobservable. Observable inputs are those assumptions that market participants would use in pricing the particular asset or liability. These inputs are based
on market data and are obtained from a source independent of the Bank. Unobservable inputs are assumptions based on the Bank’s own information or estimate of assumptions used by market participants in pricing the asset or liability. Unobservable inputs are based on the best and most current information available on the measurement date.
All inputs, whether observable or unobservable, are ranked in accordance with a prescribed fair value hierarchy that gives the highest ranking to quoted prices (unadjusted) in active markets for identical assets or liabilities (Level 1) and the lowest ranking to unobservable inputs (Level 3). Fair values for assets or liabilities classified
as Level 2 are based on one or a combination of the following factors: (i) quoted prices for similar assets; (ii) observable inputs for the asset or liability, such as interest rates or yield curves; or (iii) inputs derived principally from or corroborated by observable market data.
Determination of fair market values
Available-for-sale securities are priced using matrix pricing based on the securities’ relationship to other benchmark quoted prices (Level 2). Inputs to the valuation methodology include quoted prices for similar assets in active markets that are observable for the asset.
84
CASCADE FINANCIAL CORPORATION AND SUBSIDIARIES
Notes to Consolidated Financial Statements
(Dollars in thousands, except share amounts)
The Corporation has issued $10 million (of the $25 million outstanding) of junior subordinated debentures (Trust Preferred Securities or TPS) that are subject to fair value accounting. The change in fair market value of the junior subordinated debentures is recorded as a component of other income. During the fourth quarter FDIC restrictions
prohibited dividend payments from the Bank to the holding company, which in turn led us to defer the payment of interest on our Trust Preferred Securities (TPS). We continue to accrue these payments and expect to resume cumulative payments on these securities upon FDIC approval. Because of the dividend suspension, the fair value of the Corporation’s $10.0 million par junior subordinated debentures payable (Trust Preferred Securities) declined significantly, reducing our carrying value to $3.3 million, with
the difference recorded as a $7.2 million gain for the year. The Corporation determined the fair value for Cascade Capital Trust I by calculating the net present value of the Trust’s expected cash flows. The discount rate used was the rate of 20 year U.S. Treasury Notes (the approximate remaining maturity) as of December 31, 2009, plus a credit spread developed by reviewing a number of other similar issues, plus a liquidity premium of 5.55% due to the size of the Corporation and the issue. As with similar
bonds, the bonds were assumed to be outstanding until maturity. The derived rate was 24.55% and the valuation is considered a Level 3 measurement.
Real estate owned and other repossessed assets are recorded at the lower of the carrying amount of the loan or fair value less selling costs at the time of acquisition. Any write-downs based on the asset’s fair value at the date of acquisition are charged to the allowance for loan losses. After foreclosure, management periodically performs
valuations such that the real estate is carried at the lower of its new cost basis or fair value, net of estimated costs to sell.
The following table presents the balances of assets and liabilities measured at fair value on a recurring basis at December 31, 2009 and 2008, and the total (losses) gains from these fair value adjustments for the years ended December 31, 2009 and 2008.
|
Fair Value at December 31, 2009 |
Year Ended December 31, 2009 |
|||||||||||||||||||
|
Assets |
Level 1 |
Level 2 |
Level 3 |
Total |
Total Fair Value Adjustments |
|||||||||||||||
|
Mortgage-backed securities |
$ | - | $ | 41,280 | $ | - | $ | 41,280 | $ | 681 | ||||||||||
|
Agency notes & bonds |
$ | - | $ | 186,525 | $ | - | $ | 186,525 | $ | (2,283 | ) | |||||||||
|
Preferred stock |
$ | - | $ | - | $ | - | $ | - | $ | 840 | ||||||||||
|
Total |
$ | - | $ | 227,805 | $ | - | $ | 227,805 | $ | (762 | ) | |||||||||
|
Liabilities |
||||||||||||||||||||
|
Junior subordinated debentures |
$ | - | $ | - | $ | 3,341 | $ | 3,341 | $ | 7,169 | ||||||||||
|
Total |
$ | - | $ | - | $ | 3,341 | $ | 3,341 | $ | 7,169 | ||||||||||
|
Fair Value at December 31, 2008 |
Year Ended December 31, 2008 |
|||||||||||||||||||
|
Assets |
Level 1 |
Level 2 |
Level 3 |
Total |
Total Fair Value Adjustments |
|||||||||||||||
|
Mortgage-backed securities |
$ | - | $ | 41,851 | $ | - | $ | 41,851 | $ | 461 | ||||||||||
|
Agency notes & bonds |
$ | - | $ | 81,373 | $ | - | $ | 81,373 | $ | 156 | ||||||||||
|
Preferred stock |
$ | 454 | $ | - | $ | - | $ | 454 | $ | (840 | ) | |||||||||
|
Total |
$ | 454 | $ | 123,224 | $ | - | $ | 123,678 | $ | (223 | ) | |||||||||
|
Liabilities |
||||||||||||||||||||
|
Junior subordinated debentures |
$ | - | $ | - | $ | 10,510 | $ | 10,510 | $ | 912 | ||||||||||
|
Total |
$ | - | $ | - | $ | 10,510 | $ | 10,510 | $ | 912 | ||||||||||
85
CASCADE FINANCIAL CORPORATION AND SUBSIDIARIES
Notes to Consolidated Financial Statements
(Dollars in thousands, except share amounts)
|
Fair Value Measurements Using Significant Unobservable Inputs
(Level 3) |
||||||||
|
Year Ended
December 31, 2009 |
Year Ended
December 31, 2008 |
|||||||
|
Beginning balance |
$ | 10,510 | $ | 11,422 | ||||
|
Total gains recognized |
(7,169 | ) | (912 | ) | ||||
|
Ending balance |
$ | 3,341 | $ | 10,510 | ||||
The following table presents the balance of assets measured at fair value on a nonrecurring basis at December 31, 2009 and 2008, and the total impairment resulting from these fair value adjustments for the year ended December 31, 2009 and 2008.
|
Fair Value at December 31, 2009 |
Year Ended
December 31, 2009 |
|||||||||||||||||||
|
Description |
Level 1 |
Level 2 |
Level 3 |
Total(1) |
Total Gains(Losses) (2) |
|||||||||||||||
|
Impaired loans |
$ | - | $ | - | $ | 177,317 | $ | 177,317 | $ | (26,964 | ) | |||||||||
|
REO and other repossessed assets |
- | - | 18,842 | 18,842 | (1,488 | ) | ||||||||||||||
|
Goodwill |
- | - | - | - | (11,700 | ) | ||||||||||||||
|
Total |
$ | - | $ | - | $ | 196,159 | $ | 196,159 | $ | (40,152 | ) | |||||||||
|
Fair Value at December 31, 2008 |
Year Ended
December 31, 2008 |
|||||||||||||||||||
|
Description |
Level 1 |
Level 2 |
Level 3 |
Total (1) |
Total Gains(Losses) (2) |
|||||||||||||||
|
Impaired loans |
$ | - | $ | - | $ | 83,368 | $ | 83,368 | $ | 2,874 | ||||||||||
|
REO and other repossessed assets |
- | - | 1,446 | 1,446 | - | |||||||||||||||
|
Total |
$ | - | $ | - | $ | 84,814 | $ | 84,814 | $ | 2,874 | ||||||||||
|
(1) |
Impaired loans include loans on nonaccrual, classified doubtful and/or individually analyzed for impairment, adjusted by the impairment amount. REO is disclosed at the year-end book balance. Goodwill is carried at its $12.9 million adjusted book value at December 31, 2009, and therefore its fair value is not included in the table. |
|
(2) |
Total gains/losses for loans includes the actual impairment amount plus the allowance for loan loss write downs during the year for those loans considered impaired at year-end. Losses for REO are the net losses recognized during the year. In the second quarter of 2009, the Bank recorded an $11.7 million fair value adjustment on goodwill
which reduced the value of goodwill to $12.9 million. |
Note 20 – Commitments and Contingencies
(a) Lease Commitments
The Bank leases space for various branches. These leases run for a period ranging from 2 to 10 years and allow for established rent increases each year. Generally, these leases require the Bank to pay all taxes, maintenance and utility costs, as well as maintain certain types of insurance. The annual lease commitments at December 31, 2009,
are as follows:
|
Years ending December 31, |
2010 |
$ | 868 | ||
|
2011 |
853 | ||||
|
2012 |
840 | ||||
|
2013 |
840 | ||||
|
2014 |
774 | ||||
|
Thereafter |
7,727 | ||||
|
Total |
$ | 11,902 |
Rental expenses charged to operations were approximately $889, $825, and $763 for the years ended December 31, 2009, 2008, and 2007, respectively.
86
CASCADE FINANCIAL CORPORATION AND SUBSIDIARIES
Notes to Consolidated Financial Statements
(Dollars in thousands, except share amounts)
At December 31, 2009, the Corporation had outstanding commitments to grant loans of $4.2 million with fixed interest rates and $6.9 million with adjustable rates. The Corporation had non-mandatory forward commitments totaling $479 and $127 to sell loans into the secondary market at December 31, 2009, and December 31, 2008, respectively.
Commitments to extend credit are agreements to lend to a customer as long as there is no violation of any condition established in the contract. Commitments generally have fixed expiration dates or other termination clauses and may require payment of a fee. Since many of the commitments are expected to expire without being drawn upon, the
total commitment amounts do not necessarily represent future cash requirements. While approximately 100% of commercial letters of credit are utilized, a significant portion of such utilization is on an immediate payment basis. The Bank evaluates each customer's creditworthiness on a case-by-case basis. The amount of collateral obtained, if it is deemed necessary by the Bank upon extension of credit, is based on management's credit evaluation of the borrower.
Collateral held varies but may include accounts receivable, inventory, property, plant and equipment, and income-producing commercial properties.
Unfunded commitments under commercial lines of credit, revolving credit lines and loans in process are commitments for possible future extensions of credit to existing customers. Standby letters of credit and financial guarantees written are conditional commitments issued by the Bank to guarantee the performance of a customer to a third party.
Those guarantees are primarily issued to support public and private borrowing arrangements, bond financing, and similar transactions. The Bank underwrites its standby letters of credit using its policies and procedures applicable to loans in general. Standby letters of credit are made on both an unsecured and secured basis. The Bank has not been required to perform on any financial guarantees during the past two years. The Bank did not incur any losses on its commitments in 2009 or 2008.
At December 31, 2009, and 2008, the following financial instruments with off-balance sheet risk were outstanding:
| DECEMBER 31, | ||||||||
|
2009 |
2008 |
|||||||
|
Commitments to grant loans |
$ | 11,145 | $ | 6,327 | ||||
|
Unfunded commitments under lines of credit/loans in process |
122,714 | 167,353 | ||||||
|
Standby letters of credit and financial guarantees written |
1,695 | 5,116 | ||||||
|
Unused commitments on bankcards |
13,621 | 13,868 | ||||||
|
Total |
$ | 149,175 | $ | 192,664 | ||||
(c) Legal Contingencies
The Corporation is a defendant in various legal proceedings arising in connection with its business. It is the opinion of management that the financial position and the results of operations of the Corporation will not be materially adversely affected by the final outcome of these legal proceedings
and will have no material effect on the Corporation’s Consolidated Financial Statements.
(d) Regulatory Examinations
At periodic intervals, the Washington State Department of Financial Institutions and the Federal Deposit Insurance Corporation routinely examine the Corporation’s financial statements as part of their legally prescribed oversight of the banking industry. Based on these examinations, the regulators can direct that the Corporation’s
financial statements be adjusted in accordance with their findings.
(e) Significant Concentrations of Credit Risk
Concentration of credit risk is the risk associated with a lack of diversification, such as having substantial loan concentrations in a specific type of loan within our loan portfolio, thereby exposing us to greater risks resulting from adverse economic, political, regulatory,
geographic, industrial or credit developments. At December 31, 2009, our most significant concentration of credit risk was in loans secured by real estate. Approximately 85% of Cascade’s loan portfolio is secured by real estate. Over the last two years, there has been
87
CASCADE FINANCIAL CORPORATION AND SUBSIDIARIES
Notes to Consolidated Financial Statements
(Dollars in thousands, except share amounts)
deterioration in the residential development market which has led to an increase in nonperforming loans and the allowance for loan losses. See Note 4 of the Notes to Consolidated Financial Statements for additional information about loans.
At December 31, 2009, our most significant investment concentration of credit risk was with the U.S. Government, its agencies and Government Sponsored Enterprises. Our exposure, which results from positions in securities issued by the U.S. Government, and its agencies, and securities guaranteed by Government Sponsored Enterprises, was $258.5
million, or 94% of our total investment portfolio at December 31, 2009.
Note 21 - Condensed Financial Information of Cascade Financial Corporation
Following are the condensed financial statements of Cascade Financial Corporation (parent only) for the period indicated:
| BALANCE SHEET | DECEMBER 31, 2009 | DECEMBER 31, 2008 | ||||||
|
Assets: |
||||||||
|
Cash |
$ | 361 | $ | 287 | ||||
|
Investment in subsidiary |
155,270 | 185,759 | ||||||
|
Other assets |
1,243 | 1,292 | ||||||
| $ | 156,874 | $ | 187,338 | |||||
|
Liabilities and stockholders’ equity: |
||||||||
|
Other liabilities |
$ | 3,618 | $ | 1,241 | ||||
|
Junior subordinated debentures |
18,806 | 25,975 | ||||||
|
Stockholders’ equity |
134,450 | 160,122 | ||||||
| $ | 156,874 | $ | 187,338 | |||||
| INCOME STATEMENT | FOR THE YEARS ENDED DECEMBER 31, | |||||||||||
|
2009 |
2008 |
2007 |
||||||||||
|
Equity in undistributed net income of the subsidiary |
$ | (26,536 | ) | $ | 3,071 | $ | 16,745 | |||||
|
Interest income – junior subordinated debentures |
64 | 64 | 64 | |||||||||
|
Net gain on fair value of junior subordinated debentures payable |
7,169 | 912 | 576 | |||||||||
|
Operating expenses |
(399 | ) | (366 | ) | (364 | ) | ||||||
|
Interest expense – junior subordinated debentures |
(2,114 | ) | (2,120 | ) | (2,120 | ) | ||||||
|
(Loss) income before (benefit) provision from income taxes |
(21,816 | ) | 1,561 | 14,901 | ||||||||
|
(Benefit) provision from income taxes |
(1,652 | ) | 529 | 645 | ||||||||
|
Net (loss) income |
$ | (23,468 | ) | $ | 2,090 | $ | 15,546 | |||||
|
Dividends on preferred stock |
1,943 | 216 | - | |||||||||
|
Accretion of issuance discount on preferred stock |
422 | 35 | - | |||||||||
|
Net (loss) income available for common stockholders |
$ | (25,833 | ) | $ | 1,839 | $ | 15,546 | |||||
88
CASCADE FINANCIAL CORPORATION AND SUBSIDIARIES
Notes to Consolidated Financial Statements
(Dollars in thousands, except share amounts)
| STATEMENT OF CASH FLOWS | FOR THE YEARS ENDED DECEMBER 31, | |||||||||||
|
2009 |
2008 |
2007 |
||||||||||
|
Cash flows from operating activities: |
||||||||||||
|
Net (loss) income |
$ | (23,468 | ) | $ | 2,090 | $ | 15,546 | |||||
|
Adjustments to reconcile net (loss) income to net cash sed in operating activities: |
||||||||||||
|
Equity in net income of subsidiaries |
26,536 | (3,071 | ) | (16,745 | ) | |||||||
|
Increase (decrease) in other assets |
49 | 719 | (31 | ) | ||||||||
|
Decrease in other liabilities |
(4,763 | ) | (911 | ) | (629 | ) | ||||||
|
Net cash used in operating activities |
(1,646 | ) | (1,173 | ) | (1,859 | ) | ||||||
|
Cash flows from investing activities: |
||||||||||||
|
Dividends received from subsidiaries |
3,600 | 4,600 | 7,300 | |||||||||
|
Investment in subsidiary |
- | (38,970 | ) | - | ||||||||
|
Net cash provided by (used in) investing activities |
3,600 | (34,370 | ) | 7,300 | ||||||||
|
Cash flows from financing activities: |
||||||||||||
|
Repurchase of common stock |
- | - | (2,838 | ) | ||||||||
|
Proceeds from exercise of stock options |
209 | 357 | 582 | |||||||||
|
Tax benefit from stock-based compensation |
4 | 30 | 231 | |||||||||
|
Dividends paid |
(2,093 | ) | (3,794 | ) | (3,978 | ) | ||||||
|
Proceeds from preferred stock/warrants |
- | 38,970 | - | |||||||||
|
Net cash (used in) provided by financing activities |
(1,880 | ) | 35,563 | (6,003 | ) | |||||||
|
Net increase (decrease) in cash and cash equivalents |
74 | 20 | (562 | ) | ||||||||
|
Cash and cash equivalents: |
||||||||||||
|
Beginning of year |
287 | 267 | 829 | |||||||||
|
End of year |
$ | 361 | $ | 287 | $ | 267 | ||||||
Note 22 - Lines of Business
The Corporation and the Bank are managed by a legal entity and not by lines of business. The Bank’s operations include commercial banking services, such as lending activities, deposit products and other cash management services.
The performance of the Bank as a whole is reviewed by the Board of Directors and Management Committee. The Management Committee, which is the senior decision making group of the Bank, is comprised of six members including the President/CEO. Segment information is not necessary to be presented in the notes to the consolidated financial statements
because operating decisions are made based on the performance of the Corporation as a whole.
Note 23 - Selected Quarterly Financial Data (Unaudited)
| QUARTER ENDED | ||||||||||||||||
|
MAR 31, |
JUNE 30, |
SEPT 30, |
DEC 31, |
|||||||||||||
|
2009 |
2009 |
2009 |
2009 |
|||||||||||||
|
Interest income |
$ | 21,410 | $ | 20,215 | $ | 20,189 | $ | 20,014 | ||||||||
|
Interest expense |
10,291 | 9,392 | 9,271 | 9,586 | ||||||||||||
|
Net interest income |
11,119 | 10,823 | 10,918 | 10,428 | ||||||||||||
|
Provision for loan losses |
13,875 | 18,300 | 4,000 | 8,000 | ||||||||||||
|
Other income |
3,664 | 2,220 | 3,167 | 7,645 | ||||||||||||
|
Other expense |
8,627 | 9,995 | 7,945 | 8,620 | ||||||||||||
|
Goodwill impairment |
- | 11,700 | - | - | ||||||||||||
|
(Loss) income before provision for income taxes |
(7,719 | ) | (26,952 | ) | 2,140 | 1,453 | ||||||||||
|
(Benefit) provision for income taxes |
(2,902 | ) | (5,552 | ) | 507 | 338 | ||||||||||
|
Net (loss) income |
$ | (4,817 | ) | $ | (21,400 | ) | $ | 1,633 | $ | 1,115 | ||||||
|
Dividends on preferred stock |
482 | 487 | 487 | 487 | ||||||||||||
|
Accretion of issuance discount on preferred stock |
105 | 105 | 105 | 107 | ||||||||||||
|
(Loss) income available for common stockholders |
$ | (5,404 | ) | $ | (21,992 | ) | $ | 1,041 | $ | 521 | ||||||
|
(Loss) earnings per common share, basic |
$ | (0.45 | ) | $ | (1.82 | ) | $ | 0.09 | $ | 0.04 | ||||||
|
(Loss) earnings per common share, diluted |
(0.45 | ) | (1.82 | ) | 0.09 | 0.04 | ||||||||||
89
CASCADE FINANCIAL CORPORATION AND SUBSIDIARIES
Notes to Consolidated Financial Statements
(Dollars in thousands, except share amounts)
|
QUARTER ENDED |
||||||||||||||||
|
MAR 31, |
JUNE 30, |
SEPT 30, |
DEC 31, |
|||||||||||||
| 2008 | 2008 | 2008 | 2008 | |||||||||||||
|
Interest income |
$ | 23,014 | $ | 22,793 | $ | 24,345 | $ | 22,419 | ||||||||
|
Interest expense |
12,539 | 11,348 | 11,508 | 11,291 | ||||||||||||
|
Net interest income |
10,475 | 11,445 | 12,837 | 11,128 | ||||||||||||
|
Provision for loan losses |
2,390 | 1,200 | 1,250 | 2,400 | ||||||||||||
|
Other income |
2,454 | 2,217 | 2,326 | 1,890 | ||||||||||||
|
Other expense |
6,935 | 7,251 | 24,503 | 7,193 | ||||||||||||
|
Income (loss) before provision for income taxes |
3,604 | 5,211 | (10,590 | ) | 3,425 | |||||||||||
|
Provision (benefit) for income taxes |
990 | 1,577 | (3,971 | ) | 964 | |||||||||||
|
Net income (loss) |
$ | 2,614 | $ | 3,634 | $ | (6,619 | ) | $ | 2,461 | |||||||
|
Dividends on preferred stock |
- | - | - | 216 | ||||||||||||
|
Accretion of issuance discount on preferred stock |
- | - | - | 35 | ||||||||||||
|
Income (loss) available for common stockholders |
$ | 2,614 | $ | 3,634 | $ | (6,619 | ) | $ | 2,210 | |||||||
|
Earnings (loss) per common share, basic |
$ | 0.22 | $ | 0.30 | $ | (0.55 | ) | $ | 0.18 | |||||||
|
Earnings (loss) per common share, diluted |
0.21 | 0.30 | (0.55 | ) | 0.18 | |||||||||||
|
QUARTER ENDED |
||||||||||||||||
|
MAR 31, |
JUNE 30, |
SEPT 30, |
DEC 31, |
|||||||||||||
| 2007 | 2007 | 2007 | 2007 | |||||||||||||
|
Interest income |
$ | 22,631 | $ | 23,789 | $ | 23,378 | $ | 24,137 | ||||||||
|
Interest expense |
12,354 | 12,798 | 12,568 | 12,820 | ||||||||||||
|
Net interest income |
10,277 | 10,991 | 10,810 | 11,317 | ||||||||||||
|
Provision for loan losses |
250 | 250 | 350 | 500 | ||||||||||||
|
Other income |
2,051 | 1,834 | 1,942 | 1,739 | ||||||||||||
|
Other expense |
6,423 | 6,548 | 6,724 | 6,987 | ||||||||||||
|
Income before provision for income taxes |
5,655 | 6,027 | 5,678 | 5,569 | ||||||||||||
|
Provision for income taxes |
1,890 | 2,044 | 1,892 | 1,557 | ||||||||||||
|
Net income |
$ | 3,765 | $ | 3,983 | $ | 3,786 | $ | 4,012 | ||||||||
|
Earnings per share, basic |
$ | 0.31 | $ | 0.33 | $ | 0.32 | $ | 0.33 | ||||||||
|
Earnings per share, diluted |
0.30 | 0.32 | 0.31 | 0.33 | ||||||||||||
90
Exhibit Index
|
Exhibit No. |
Exhibit |
|
3.1(i) |
Articles of Incorporation of Cascade Financial Corporation (incorporated by reference to exhibit A to the definitive proxy statement filed on March 26, 2003 (File No. 000-25286)). |
|
3.2(i) |
Amendment to the Articles of Incorporation of Cascade Financial Corporation, including Statement of Designations for the Series A Preferred Stock (incorporated by reference to the registrant’s Form 8-K/A filed November 26, 2008 (File No. 000-25286)). |
|
3.3(ii) |
Bylaws of Cascade Financial Corporation (incorporated by reference to the registrant’s registration statement on Form S-4 filed March 31, 2004 (File No. 333-114087)). |
|
3.4(ii) |
Amendment to the Bylaws of Cascade Financial Corporation (incorporated by reference to the Corporation’s Form 8-K filed September 27, 2005 (File No. 0-25286)). |
|
4.1 |
Form of Series A Preferred Stock Certificate (incorporated by reference to the Corporation’s Form 8-K/A filed November 26, 2008 (File No. 000-25286)). |
|
4.2 |
Warrant to purchase 863,442 shares of Common Stock issued on November 21, 2008 (incorporated by reference to the registrant’s Form 8-K/A filed November 26, 2008 (File No. 000-25286)). |
|
10.1 |
Cascade Financial Corporation 1994 Employee Stock Purchase Plan (Incorporated by reference to the Corporation’s Registration Statement on Form S-4 (File No. 33-83200)). |
|
10.2 |
Cascade Financial Corporation 1992 Stock Option and Incentive Plan (Incorporated by reference to the Corporation’s Form 10-KSB for the period ending June 30, 1995). |
|
10.3 |
Cascade Financial Corporation Employee Stock Ownership Plan (Incorporated by reference to the Corporation’s Annual Report on Form 10-KSB for the period ending June 30, 1995). |
|
10.4 |
Cascade Financial Corporation 1997 Stock Option Plan (Incorporated by reference to Appendix E to the Prospectus included in the Corporation’s Registration Statement on Form S-4 (File No. 333-24203)). |
|
10.5 |
Cascade Financial Corporation 1997 Elective Equity Plan. (Incorporated by reference to Exhibit 10.7 of the Corporation’s Form 10-K for the period ending December 31, 2001). |
|
10.8 |
Cascade Bank Non-Qualified Deferred Compensation Plan dated February 1, 2008 (Incorporated by reference to Exhibit 10.1 of the Corporation’s Form 8-K filed January 16, 2008 (File No. 000-25286)). |
|
10.9 |
Letter Agreement, dated November 21, 2008, including Securities Purchase Agreement – Standard Terms, between the Company and the United States Department of the Treasury (Incorporated by reference to the Corporation’s Form 8-K/A filed November 26, 2008 (File No. 000-25286)). |
|
10.1 |
Form of Agreement to Amend Compensation Agreements with Senior Executive Officer, executed by Carol K. Nelson, Lars H. Johnson, Robert G. Disotell, LeAnne M. Harrington, Debbie E. McLeod, and Steven R. Erickson (Incorporated by reference to the Corporation’s Form 8-K/A filed November 26, 2008 (File No. 000-25286)). |
|
21 |
Subsidiaries. |
|
23 |
Consent of Independent Registered Public Accounting Firm – Moss Adams LLP. |
|
31.1 |
Certification of Chief Executive Officer pursuant to Section 302 of the Sarbanes-Oxley Act of 2002. |
|
31.2 |
Certification of Principal Financial Officer pursuant to Section 302 of the Sarbanes-Oxley Act of 2002. |
|
32 |
Certification of Annual Report on Form 10-K pursuant to Section 906 of the Sarbanes-Oxley Act of 2002. |
(b) Reports on Form 8-K
On October 21, 2009, the Corporation filed a Form 8-K reporting an attached press release announcing earnings information for the third quarter ended September 30, 2009, under Items 2.02 and 9.01 of Form 8-K.
On January 13, 2010, the Corporation filed a Form 8-K reporting an attached press release announcing its Chief Financial Officer was no longer employed by Cascade and Terry Stull was appointed Interim Chief Accounting Officer, under Items 8.01and 9.01 of Form 8-K.
On January 26, 2010, the Corporation filed a Form 8-K reporting an attached press release announcing earnings information for the fourth quarter ended December 31, 2009, under Items 2.02 and 9.01 of Form 8-K.
On March 3, 2010, the Corporation filed a Form 8-K announcing the Board has designated Terry Stull, SVP, Controller and Chief Accounting Officer , as the Interim Principal Financial Officer for purposes of filings with the U.S. Securities and Exchange Commission, under Item 5.02 on Form 8-K.
91
SIGNATURES
Pursuant to the requirements of Section 13 or 15(d) of the Securities Exchange Act of 1934, the registrant has duly caused this report to be signed on its behalf by the undersigned, thereunto duly authorized.
|
CASCADE FINANCIAL CORPORATION | |
|
|
|
|
Date: March 10, 2010 |
/s/ Carol K. Nelson |
|
By: Carol K. Nelson,
President and Chief Executive Officer
(Principal Executive Officer) | |
|
|
|
|
Date: March 10, 2010 |
/s/ Terry Stull |
|
By: Terry Stull,
Senior Vice President and Controller
(Chief Accounting Officer and
Principal Financial Officer) |
Pursuant to the requirements of Section 13 or 15(d) of the Securities Exchange Act of 1934, this report has been signed below by the following persons on behalf of the registrant and in the capacities and on the dates indicated.
|
By: |
/s/ David W. Duce |
By: |
/s/ Ronald E. Thompson | |
|
David W. Duce
Director |
Ronald E. Thompson
Director | |||
|
Date: |
March 10, 2010 |
Date: |
March 10, 2010 | |
|
By: |
/s/ Janice Halladay |
By: |
/s/ G. Brandt Westover | |
|
Janice Halladay
Director |
G. Brandt Westover
Director | |||
|
Date: |
March 10, 2010 |
Date: |
March 10, 2010 | |
|
By: |
/s/ David O’Connor |
By: |
/s/ D. R. Murphy | |
|
David O’Connor
Director |
D. R. Murphy
Chair | |||
|
Date: |
March 10, 2010 |
Date: |
March 10, 2010 | |
| By: | /s/ Richard L. Anderson | |||
|
Richard L. Anderson
Director |
||||
| Date: | March 10, 2010 |
92