Attached files
| file | filename |
|---|---|
| EX-23 - BOULDER BRANDS, INC. | v176609_ex23.htm |
| EX-21 - BOULDER BRANDS, INC. | v176609_ex21.htm |
| EX-10.5 - BOULDER BRANDS, INC. | v176609_ex10-5.htm |
| EX-31.2 - BOULDER BRANDS, INC. | v176609_ex31-2.htm |
| EX-31.1 - BOULDER BRANDS, INC. | v176609_ex31-1.htm |
| EX-10.2 - BOULDER BRANDS, INC. | v176609_ex10-2.htm |
| EX-10.9 - BOULDER BRANDS, INC. | v176609_ex10-9.htm |
| EX-32.1 - BOULDER BRANDS, INC. | v176609_ex32-1.htm |
| EX-32.2 - BOULDER BRANDS, INC. | v176609_ex32-2.htm |
UNITED
STATES SECURITIES AND EXCHANGE COMMISSION
Washington,
D.C. 20549
Form
10-K
Annual
Report Pursuant to Section 13 or 15(d) of the Securities Exchange Act of
1934
For
the fiscal year ended December 31, 2009
Commission
file number 001-33595
SMART
BALANCE, INC.
(Name of
issuer in its charter)
|
Delaware
(State
or other jurisdiction of
incorporation
or organization)
|
20-2949397
(I.R.S.
Employer
Identification
No.)
|
|
115
West Century Road – Suite 260
Paramus,
New Jersey
(Address
of principal executive offices)
|
07652
(Zip
Code)
|
|
(201)
568-9300
(Issuer’s
telephone number, including area code)
Securities
registered under Section 12(b) of the
Act:
|
|
Securities
registered pursuant to Section 12(g) of the Act:
Common
Stock, $.0001 par value per share
(Title
Of Class)
Indicate
by check mark if the registrant is a well-known seasoned issuer, as defined in
Rule 405 of the Securities Act.
Yes
¨ No x
Indicate
by check mark if the registrant is not required to file reports pursuant to
Section 13 or Section 15(d) of the Act.
Yes
¨ No x
Indicate
by check mark whether the issuer (1) has filed all reports required to be filed
by Section 13 or 15(d) of the Securities Exchange
Act of 1934 during the past 12 months (or for such shorter period that the
registrant was required to file such reports), and (2) has been subject to such
filing requirements for the past 90 days. Yes x No ¨
Indicate
by check mark whether the registrant has submitted electronically and posted on
its corporate web site, if any, every Interactive Data file required to be
submitted and posted pursuant to Rule 405 of Regulation S-T during the preceding
12 months (or for such shorter period that the registrant was required to submit
and post such files). Yes ¨
No ¨
Indicate
by check mark if disclosure of delinquent filers pursuant to Item 405 of
Regulation S-K is not contained herein, and will not be contained, to the best
of registrant’s knowledge, in definitive proxy or information statements
incorporated by reference in Part III of this Form 10-K or any amendment to this
Form 10-K. ¨
Indicate
by check mark whether the registrant is a large accelerated filer, an
accelerated filer, a non-accelerated filer, or a smaller reporting
company. See the definitions of “large accelerated filer,”
“accelerated filer,” and “smaller reporting company” in Rule 12b-2 of the
Exchange Act.
|
Large
accelerated filer ¨
|
Accelerated
filer x
|
|
Non-accelerated
filer ¨
|
Smaller
reporting company ¨
|
Indicate
by check mark whether the registrant is a shell company (as defined in Rule
12b-2 of the Exchange Act).
Yes
¨ No x
The
aggregate market value of the outstanding common stock, other than shares held
by persons who may be deemed affiliates of the registrant, computed by reference
to the closing sales price for the Registrant’s Common Stock on June 30, 2009
($6.81), as reported on the Nasdaq Global Market was approximately $240
million.
As of
March 1, 2010, there were 62,630,683 shares of common stock, par value $.0001
per share, of the registrant outstanding.
DOCUMENTS
INCORPORATED BY REFERENCE
Portions
of the registrant’s proxy statement in connection with its 2010 Annual Meeting
of Stockholders are incorporated by reference in Part III of this Annual Report
on Form 10-K.
TABLE
OF CONTENTS
|
Page
|
||
|
CAUTIONARY
NOTE REGARDING FORWARD-LOOKING STATEMENTS
|
1
|
|
|
PART
I
|
2
|
|
|
Item
1.
|
Business
|
2
|
|
Item
1A.
|
Risk
Factors
|
9
|
|
Item
1B.
|
Unresolved
Staff Comments
|
19
|
|
Item
2.
|
Properties
|
19
|
|
Item
3.
|
Legal
Proceedings
|
19
|
|
Item
4.
|
Reserved
|
19
|
|
PART
II
|
20
|
|
|
Item
5.
|
Market
for Registrant’s Common Equity, Related Stockholder Matters and Issuer
Purchases of Equity Securities
|
20
|
|
Item
6.
|
Selected
Historical Financial Information
|
22
|
|
Item
7.
|
Management’s
Discussion and Analysis of Financial Condition and Results of
Operations
|
25
|
|
Item
7A.
|
Quantitative
and Qualitative Disclosures About Market Risk
|
36
|
|
Item
8.
|
Consolidated
Financial Statements and Supplementary Data
|
37
|
|
Item
9.
|
Changes
in and Disagreements with Accountants on Accounting and Financial
Disclosure
|
37
|
|
Item
9A.
|
Controls
and Procedures
|
37
|
|
Item
9B.
|
Other
Information
|
38
|
|
PART
III
|
39
|
|
|
Item
10.
|
Directors,
Executive Officers and Corporate Governance
|
39
|
|
Item
11.
|
Executive
Compensation
|
42
|
|
Item
12.
|
Security
Ownership of Certain Beneficial Owners and Management
and Related Stockholder Matters
|
42
|
|
Item
13.
|
Certain
Relationships and Related Transactions, and Director
Independence
|
42
|
|
Item
14.
|
Principal
Accounting Fees and Services
|
42
|
|
PART
IV
|
43
|
|
|
Item
15.
|
Exhibits
and Financial Statement Schedules
|
43
|
|
INDEX
TO CONSOLIDATED FINANCIAL STATEMENTS
|
F-1
|
|
i
CAUTIONARY
NOTE REGARDING FORWARD-LOOKING STATEMENTS
Some of
the information in this annual report constitutes forward-looking statements
within the meaning of Section 21E of the Securities and Exchange Act of 1934, as
amended. You can identify these statements by forward-looking words such as
“may,” “expect,” “anticipate,” “contemplate,” “believe,” “estimate,” “intends,”
and “continue” or similar words. In addition, forward-looking
statements are statements which
|
|
·
|
discuss
future expectations or expansions of business
lines;
|
|
|
·
|
contain
projections of future results of operations or financial condition;
or
|
|
|
·
|
state
other “forward-looking”
information.
|
We
believe that communicating our expectations to our stockholders is important.
However, there are always events in the future that we are not able to
accurately predict or over which we have no control. The risk factors and
cautionary language discussed in this annual report, including the risk factors
described under “Item 1A – Risk Factors”, provide examples of risks,
uncertainties and events that may cause actual results to differ materially from
the expectations we describe in our forward-looking statements. These
risks include, among other things, our ability to:
|
|
·
|
maintain
margins during periods of commodity cost
fluctuation;
|
|
|
·
|
introduce
and expand our distribution of new
products;
|
|
|
·
|
meet
marketing and infrastructure needs;
|
|
|
·
|
respond
to changes in consumer demand;
|
|
|
·
|
respond
to adverse publicity affecting our company or
industry;
|
|
|
·
|
comply
with new regulatory requirements;
|
|
|
·
|
maintain
existing relationships with and secure new
customers;
|
|
|
·
|
continue
to rely on third party distributors, manufacturers and
suppliers; and
|
|
|
·
|
grow
net sales in a competitive environment and with increasingly price
sensitive consumers.
|
You are
cautioned not to place undue reliance on our forward-looking statements, which
speak only as of the date of this report.
All
forward-looking statements included herein attributable to us are expressly
qualified in their entirety by the cautionary statements contained or referred
to in this section. Except to the extent required by applicable laws and
regulations, we undertake no obligation to update these forward-looking
statements to reflect events or circumstances after the date of this report or
to reflect the occurrence of unanticipated events.
1
Item
1. Business
Overview
We are a
marketer of functional food products in the U.S. primarily under the Smart
Balance® and
Earth Balance® trademarks. Functional
food is defined as a food or a food ingredient that has been shown to affect
specific functions or systems in the body and may play an important role in
disease prevention. Our signature spreads products utilize a
proprietary licensed, patented technology that is naturally free of trans fats
and enhances good-to-bad cholesterol ratios when used as part of the Smart
Balance™ Food Plan. We have other product offerings utilizing our heart
healthier positioning and brand leverage, including peanut butter, cooking oils,
mayonnaise, popcorn, milk and sour cream.
We sell
Smart Balance® products
in grocery, mass merchandise and convenience stores. In the natural food
channel, we sell similar natural and organic products under the Earth
Balance® trademark. Our
products are available in all 50 states with little presence in international
markets. The Company has a growing presence in the foodservice and
industrial channels. The Smart Balance® line of
products was introduced in 1996 with the launch of our buttery spreads products
and has achieved growth in market share every year since. Our market
share in the spreads category in 2009 was 14.6%, according to Information
Resources, Inc. We outsource production and distribution and,
therefore, have no manufacturing facilities or warehouses.
Smart
Balance®
Products
The Smart
Balance® line of
products is available in a variety of categories, formats and sizes in the
supermarket, mass merchandise and convenience store channels of
distribution. In 2009, 2008 and 2007, Smart Balance® labeled
products represented approximately 89%, 88% and 86% of our sales,
respectively. In addition, in 2009, 2008 and 2007, our Smart
Balance® buttery
spreads products represented approximately 67%, 66% and 63% of our sales,
respectively. The buttery spreads products are generally available
throughout the United States while the other products have less distribution at
the current time. The buttery spreads are also available in bulk and
individual serving formats for use in the industrial and foodservice
channels.
Buttery
Spreads and Butter Blend Sticks
Our
buttery spreads are made from a patented blend of natural oils to help balance
fats in the consumer’s diet and to help improve the good-to-bad cholesterol
ratio when used as part of the Smart Balance™ Food Plan and contain no
hydrogenated or partially hydrogenated oils and only trace amounts of trans
fatty acids. The original buttery spread has won several awards as
the best-tasting product in its category.
There are
a number of varieties of our buttery spreads that offer different benefits
depending on consumers’ needs. Buttery spreads are available in
regular, light, low sodium and organic versions as well as versions that offer
benefits from added Omega-3s per serving and that achieve a favorable ratio
of Omega-6 to Omega-3 fatty acids. Some products use flax oil, fish
oil, plant sterols and olive oil to achieve desired benefit and taste
profiles.
Smart
Balance® Butter
Blend Stick is a 50/50 blend of creamery fresh butter and Smart Balance® buttery
spread in a convenient stick, with 28% less saturated fat than regular
butter. We also sell versions of butter blend sticks with a special
mix of Omega-3s from flax and fish oil. All versions are
non-hydrogenated and contain zero grams of trans fat per serving.
We also
market a Smart Balance® Buttery
Burst Spray. The spray has zero calories, zero carbs and zero fats
per serving and can be used as a pan spray or as a topping.
2
Peanut
Butter
Our
peanut butter products contain ALA (short-chain) Omega-3 from flax
oil. They have no hydrogenated oil and zero grams of trans fat per
serving. Each variety is made from premium, deep-roasted peanuts and
is all-natural and does not require refrigeration.
Cooking
Oil and Cooking Sprays
Our
cooking oil and cooking sprays are designed for use in cooking, baking and
salads to aid in avoiding trans fatty acids and hydrogenated
oils. They are used for healthier food preparation.
Light
Mayonnaise
Our Smart
Balance® Omega
Plus Light Mayonnaise has half the fat of regular mayonnaise, is
non-hydrogenated, contains zero grams of trans fat per serving and contains
natural plant sterols and ALA Omega-3.
Microwave
Popcorn
Smart
Balance® popcorn
features our patented oil blend and all varieties contain no hydrogenated oil or
trans fatty acids. Smart Balance® Popcorn
varieties include Smart ‘n Healthy™, Light Butter, and Smart
Movie-Style™.
Milk
We offer
a range of milk products, with different varieties containing EPA/DHA (long
chain) Omega-3s, Vitamin E, Vitamin C and/or plant sterols, as well as added
levels of calcium and protein. We use low and no fat milks enhanced
with non-fat milk solids to give the taste and texture of whole or reduced fat
milk. Our milk varieties include fat-free milk, 1% lowfat milk and
lactose-free milk. We expect that during 2010 our milk products will
be available in markets across the U.S.
Sour
Cream
We
introduced regular and reduced fat varieties of sour cream in late 2009 under
the Smart Balance® brand
and expect to expand distribution in 2010. The products have
excellent source levels of EPA/DHA (long chain) Omega-3s, anti-oxidant vitamin E
and vitamin D, and are a good source of calcium, with up to 66% more calcium
than other sour creams in the market.
Smart
Balance™ Food Plan
We
created the Smart Balance™ Food Plan, incorporating many of our products, in
order to help consumers achieve a healthy balance of natural fats in their daily
diet. The plan includes menus as well as numerous
recipes. Regular exercise is recommended in the plan as
well. Years of research have shown that including the right balance
of fats as a significant part of a varied diet can, among other benefits,
improve a consumer’s ratio of “good” HDL cholesterol to his or her “bad” LDL
cholesterol. Following our food plan will help limit intake of saturated
fat, and provide valuable Omega-3s while avoiding hydrogenated oil and harmful
trans-fatty acids.
Earth
Balance®
Products
The Earth
Balance® line of
products offers a variety of buttery spreads and sticks and nut butters
formulated for consumers interested in natural and organic
products. Earth Balance® products
represented approximately 7% of sales in 2009. They are primarily
available in the natural and organic channel of distribution and have a small
but growing presence in traditional retail outlets. Earth
Balance® products
are also marketed with the trademarks Soy Garden® and
NatucalÔ.
3
Bestlife™
Products
In the
fall of 2009, we signed an exclusive global agreement with the Best Life
Corporation to develop a popularly priced Bestlife™ brand, consisting of food
and beverage products that offer great taste, nutrition and
convenience. We are introducing the Bestlife™ line of spread products
in 2010, which feature partially hydrogenated oil-free products targeted to the
value segment consumer.
Industry
Overview and Trends
We
believe several factors are increasing consumer awareness of nutrition and
driving consumer demand for functional foods, including:
|
|
·
|
interest
in the relationship between diet and
health;
|
|
|
·
|
increasing
health care costs;
|
|
|
·
|
changes
in media attention and laws affecting labeling and product claims;
and
|
|
|
·
|
an
aging population, interested in prolonging life and the quality of
life.
|
As
Americans have increasingly sought out new ways to maintain and improve their
personal health, functional food has played an increasing role in
diets. The medical community and food and drink manufacturers are
responding to these demands. Goods and services that make claims of
contributing to personal health through natural and non-interventionist means
are increasingly available. Functional food promotion focuses on
consumer health enhancement and disease prevention.
Growth
Strategy
Our goal
is to become a recognized leader in providing nutritious and good tasting
products for a wide variety of consumer needs. We believe the Smart
Balance® brand
has the potential to become a broad functional foods platform across multiple
food categories. Our primary growth strategy is two-fold: (1) to
drive consumer and trade awareness of our brands and (2) to increase purchase
frequency by expanding product offerings and distribution in our core category
of spreads and into other dairy categories. In order to drive
consumer and trade awareness of our brands and add more households that prefer
our products, we will continue to use marketing and promotional programs to
drive trial and encourage brand loyalty. We spent over $40 million in 2008 for
consumer marketing and promotion and over $50 million in 2009. In
order to increase purchase frequency and expand our product offerings and
distribution, during 2008 we launched a successful distribution initiative to
increase shelf presence in retailers. The effort substantially
increased the average number of our products that retailers have on the shelf,
especially in the spreads category. Our current dairy aisle
initiative is the critical part of our growth plan. Centered on the
high purchase frequency of the milk category, we believe success in expanding in
the diary aisle will be the driver toward our growth goals.
Sales
and Distribution
Many
Smart Balance® products
are sold in all 50 states. A majority of our products are sold
through supermarket chains and food wholesalers. Since September
2007, we have utilized Acosta, Inc. as our national sales
agency. Additionally, a small portion of our products are
sold through independent food and beverage distributors.
Through
Acosta and our internal regional sales managers, we work with each distributor
and retailer to ensure that our products are effectively promoted. We
employ periodic in-store promotions that can include informational materials
about our products, sale pricing, product sampling, store advertising and
product displays to generate consumer interest in our products.
We use
third party distributors and a network of public warehouses to deliver product
from our manufacturers to our customers.
4
Our
largest customer in 2009 in terms of sales revenue was Wal-Mart Stores, Inc.,
accounting for approximately 19% of sales dollars. No other single
customer accounted for more than 10% of our sales revenues in 2009.
Marketing
Our
marketing efforts are designed to increase consumer awareness of and demand for
our products. We employ a broad mix of marketing, including print,
television, radio, coupons, in-store product sampling, consumer and trade events
and recipe and food plans. We use television advertising to reach a
larger number of target consumers. We use print ads in magazines with
wide circulation and in special interest publications targeted to groups such as
health food consumers, athletes and diabetics. We also use radio
advertising primarily to support event marketing, such as Heart Health
Month. We use coupons (freestanding insert newspaper and magazine
coupons and store register and on-pack coupons) to help stimulate product trial
and repeat purchases by providing consumers with economic
incentives.
We
believe that an effective marketing tool is the dissemination of educational
information through events and our websites explaining the nutritional qualities
of our products. Our sales and marketing team gathers information and
feedback from consumers and retailers to enable us to better meet changing
consumer needs. We provide access to consumer service representatives
through our toll free number to answer questions and educate consumers on
nutrition, new products and developments.
Manufacturing
We
outsource manufacturing of our products to third-party co-packers. We
do not own or operate any manufacturing facilities. Outsourcing is
designed to allow us to enhance production flexibility and capacity, leverage
working capital, and focus our energy and resources on marketing and sales,
while substantially avoiding capital expenditures and the complication of
managing a production work force. Our buttery spreads are produced by
two manufacturers, one of whom has multiple locations. Milk and dairy
products have regional suppliers. Most of our other products are each
supplied by a separate sole source. We believe our manufacturers have
the capacity to fulfill our production needs. We will monitor
capacity, service and costs and will qualify alternative sources of supply as
needed.
Most of
our raw materials are commodities that are broadly available from multiple
sources. Key raw materials used for our products are oil, peanuts and
milk. We maintain varying positions in key raw materials from time to time to
stabilize supply and price as appropriate.
Our
manufacturers supply our products at a price equal to the cost of ingredients
and certain packaging plus a contracted toll charge. We work with our
manufacturers to source high quality ingredients at attractive
pricing. We also negotiate certain commodities and packaging costs
directly with the suppliers. We bear all freight costs associated
with shipping finished products.
We
provide proprietary formula and processing information for our products to our
manufacturers. We receive production reports, quality control reports
and samples from product runs. In addition, our research and
development and quality control personnel visit each manufacturing facility on a
regular basis to ensure compliance with good manufacturing
practices.
Competition
The food
and beverage industry is highly competitive and numerous multinational, regional
and local firms currently compete, or are capable of competing, with
us. Our products compete with branded products as well as generic and
private-label products of food retailers, wholesalers and
cooperatives. We compete primarily on the basis of product benefits,
brand recognition, brand loyalty, service, marketing, advertising, patent
protections and price. Some competitors may have different profit or
strategic objectives than we do. Substantial advertising and
promotional expenditures are required to maintain or improve a brand’s market
position or to introduce a new product. Our largest principal
competitors are Unilever, ConAgra Foods and Land O’ Lakes, each of whom has
substantially greater market presence, longer operating histories, better
distribution, and greater financial, marketing, capital and other resources than
we do. Our competitors may also introduce new products or reformulate
existing products that may appeal to our consumers. Most recently,
some of our competitors have reformulated some of their products to remove
partially hydrogenated oils; removal of partially hydrogenated oils has
minimized our competitive advantage of comparing trans fat levels which was one
advantage featured in our marketing programs in 2009.
5
Intellectual
Property
In 1996,
GFA licensed technology from Brandeis University relating to the use of a
balanced proportion of saturated and polyunsaturated fatty acids from one or
more vegetable oil sources for incorporation in food products to increase HDL
and the HDL/LDL cholesterol ratio. Approximately 77% of our sales in
2009 were dependent upon this licensed, patented technology. Our
agreement with Brandeis provides us with an exclusive license to this
technology, which includes the following patents and applications:
|
|
·
|
Patent
No. 5,578,334 (US)—increasing the HDL level and the HDL/LDL ratio in human
serum with fat blends;
|
|
|
·
|
Patent
No. 5,843,497 (US)—increasing the HDL level and the HDL/LDL ratio in human
serum by balancing saturated and polyunsaturated dietary fatty
acids;
|
|
|
·
|
Patent
No. 5,874,117 (US)—blends of palm fat and corn oil provide
oxidation-resistant shortenings for baking and
frying;
|
|
|
·
|
Patent
No. 6,630,192 (US)—increasing the HDL level and the HDL/LDL ratio in human
serum by balancing saturated and polyunsaturated fatty
acids;
|
|
|
·
|
Patent
No. 7,229,653 (US)—increasing the HDL level and the HDL/LDL ratio in human
serum by balancing saturated and polyunsaturated dietary fatty
acids.
|
|
|
·
|
Patent
No. 2,173,545 (Canada)—increasing the HDL level and the HDL/LDL ratio in
human serum by balancing saturated and polyunsaturated dietary fatty
acids; and
|
|
|
·
|
Patent
No. EP 0 820 307 B1 (Germany, France, Great Britain, Netherlands and
Sweden)—increasing the HDL level and the HDL/LDL ratio in human serum by
balancing saturated and polyunsaturated dietary fatty
acids.
|
The
license also covers any corresponding foreign patents and subsequent U.S. or
foreign applications and any continuations, continuations-in-part, divisions and
re-issues. The license agreement imposes certain obligations on us
including diligently pursuing the development of commercial products under the
licensed technologies. The license will terminate: (1) with respect
to the U.S. patents described above, on April 7, 2015, which is when the patents
expire, (2) with respect to any other patent, upon the expiration of the patent
and (3) with respect to unpatented technology, on June 18, 2013. We
pay royalties to Brandeis for the use of the licensed technology based on an
agreed formula.
We pay
royalties to an individual who assigned a certain concept relative to peanut
butter to us for U.S. Patent No. 7,344,747 encompassing the peanut butter
concept. The patent will expire on January 24, 2026.
We have
acquired the rights from Brandeis for the use of certain technology embodied in
U.S. Patent No. 6,156,354 entitled “Hyper-absorption of vitamin E dispersed in
milks” and U.S. Patent No. 6,503,545 entitled “Hyper-absorption of vitamin E
combined with milk protein.”
6
In 2008,
GFA licensed technology from Perlman Consulting, LLC relating to the
stabilization of Omega-3 fatty acids in milk. Our agreement with Perlman
Consulting, LLC provides us with an exclusive license to this technology. The
license also includes any corresponding foreign patents and subsequent U.S. or
foreign applications and any continuations, continuations-in-part, divisions and
re-issues. There is a U.S. patent pending on the technology. We are
required to pay royalties to Perlman Consulting, LLC for the use of the licensed
technology. The amount of royalties due is based on the net sales of products
covered the licensed technology.
In 2008,
we entered into a multi-year agreement with Brandeis to fund research to develop
new product technologies for existing and future categories. Under
the agreement, $1 million will be paid over ten years, with an option to
increase funding. The bulk of support, $650,000, will be paid over
the first three years. In return, we will receive an option to
license any of the resulting technologies for use in our
products. Under a new, separate agreement, we have committed $500,000
to support research of new food technologies.
We are
allowed to sublicense the licensed technology to third parties and must pay a
portion of the sublicense fees to Brandeis.
We also
own Patent No. 5,147,134 for a process for the continuous production of
emulsions used in the blending of ingredients and Patent No. 5,027,901 for a
method minimizing the corrosion of machinery via emulsions.
In 2007,
three parties filed Oppositions to European Patent No. 820,307. We
believe that neither this proceeding, nor its outcome, will have any adverse
effect on our current business.
In total,
royalty expense was $1.3 million in 2009, of which $1.0 million was related to
our spreads business. In 2008, royalty expense was $1.0 million in
total, of which $0.9 million was related to our spreads business.
In
addition, our total research and development expenses during the last three
years were approximately $0.9 million in 2009, $0.3 million in 2008 and $0.1
million from May 21, 2007 (inception) to December 31, 2007. On a pro
forma basis, research and development expenses for the full year ended December
31, 2007 were $0.1 million.
Government
Regulation
The
manufacturing, packaging, labeling, advertising, distribution and sale of our
products are subject to regulation by various government agencies, principally
the FDA. The FDA regulates our products pursuant to the Federal Food,
Drug, and Cosmetic Act, which we refer to as the FDCA, and the Fair Packaging
and Labeling Act, which we refer to as the FPLA, and regulations
thereunder. The FDCA is intended, among other things, to ensure that
foods and beverages are wholesome, safe to eat and drink, and produced under
sanitary conditions, and that food and beverage labeling is truthful and not
deceptive. The FPLA provides requirements for the contents and
placement of information required on consumer packages to ensure that labeling
is useful and informative. Our products are generally classified and
regulated as food and beverage under the FDCA and are, therefore, not subject to
premarket approval by the FDA. However, our products are subject to
the comprehensive labeling and safety regulations of the FDA, the violation of
which could result in product seizure and condemnation, injunction of business
activities, or criminal or civil penalties. Furthermore, if the FDA
determines, on the basis of labeling, promotional claims, or marketing by us,
that the intended use of any of our products is for the diagnosis, cure,
mitigation, treatment or prevention of disease, it could regulate those products
as drugs and require, among other things, premarket approval for safety and
efficacy.
Our
advertising is subject to regulation by the FTC, pursuant to the Federal Trade
Commission Act, which we refer to as the FTCA, which prohibits unfair or
deceptive acts or practices including the dissemination of false or misleading
advertising. Violations of the FTCA may result in a cease and desist
order, injunction, or civil or criminal penalties. The FTC monitors
advertising and entertains inquiries and complaints from competing companies and
consumers. It also reviews referrals from industry self-regulatory
organizations, including the National Advertising Division of the Council of
Better Business Bureaus, Inc. (the “NAD”). The NAD administers a
voluntary self-regulatory, alternative dispute resolution process that is
supported by the advertising industry and serves the business community and the
public by fostering truthful and accurate advertising. Any future NAD
inquiries or FTC actions that result in modifications to our advertising or the
imposition of fines or penalties could have a material adverse effect on our
business, results of operations and financial condition.
7
Many
dairy products, such as our milks and sour creams, are highly regulated by
various federal and state agencies. These regulations include laws
concerning restrictions on product labeling, offering sizes and couponing
activities and laws regarding minimum markup requirements. We have been,
and likely will be, required to modify these product offerings and certain
activities related thereto to comply with the many different regulatory rules
and standards. Our products are also regulated by various agencies of the
jurisdictions and foreign countries in which our products are sold. We
have been, and we may be, required to alter certain products to comply with
foreign regulatory standards.
We are
also subject to the Lanham Act; state consumer protection
laws; federal, state and local workplace health and safety
laws; various federal, state and local environmental protection
laws; and various other federal, state and local statutes and
regulations applicable to the production, sale, safety, advertising, labeling
and ingredients of food products.
We
believe that we presently comply in all material respects with the foregoing
laws and regulations. There can be no assurance, however, that future
compliance with such laws or regulations will not have a material adverse effect
on our business, results of operations and financial condition.
We may be
subject to additional laws or regulations administered by the FDA or other
federal, state, or foreign regulatory authorities, the repeal of laws or
regulations, or more stringent interpretations or enforcements of current laws
or regulations, from time to time in the future. We cannot predict
the nature of such future laws, regulations, interpretations or applications,
nor can we predict what affect additional government regulations or
administrative orders, when and if promulgated, would have on our business in
the future. Such laws could, however, require the reformulation of
products, the recall, withholding or discontinuance of products, the imposition
of additional recordkeeping requirements, the revision of labeling, advertising
or other promotional materials, and changes in the level of scientific
substantiation needed to support claims. Any or all such government
actions could have a material adverse effect on our business, results of
operation and financial condition.
Seasonality
Our
business is subject to seasonal fluctuations. Historically, significant portions
of our net revenue and profits were, and may continue to be, realized during the
fourth quarter of our fiscal year, reflecting the holiday baking and cooking
season in which several of our products are utilized. In addition,
there are increased sales of these products during the Easter holiday
season. Because of the seasonality of our business, results for any
quarter are not necessarily indicative of the results that may be achieved for
the full fiscal year.
Employees
Because
we outsource the production and distribution of our products as well as certain
selling activities, we have a small number of employees. As of
December 31, 2009, we had 73 full and part time employees. Our plan
is to add more employees as business conditions dictate. Functions
performed by our employees include general management; finance and
accounting; legal and investor relations, sales, marketing
and customer service; and operations, quality control/quality
assurance and R&D.
Background
We were
incorporated in Delaware on May 31, 2005 under the name Boulder Specialty
Brands, Inc. in order to serve as a vehicle for the acquisition of a then
unidentified operating business and/or brand in the consumer food and beverage
industry. On May 21, 2007, we completed a merger with GFA Brands,
Inc. (“GFA”), which owned and marketed the Smart Balance® line of
products, among others. GFA became our wholly-owned subsidiary and is
currently our operating entity. After the merger, the Boulder
Specialty Brands, Inc. corporate name was changed to Smart Balance, Inc. (“Smart
Balance” or the “Company”). Pursuant to the merger agreement with
GFA, we paid an aggregate of $491 million in cash as merger
consideration. The cash consideration for the merger was funded with
cash from our December 2005 initial public offering, the proceeds of a private
placement and secured debt financings.
8
Company
Website and SEC Filings
The
Company’s website is www.smartbalance.com. The
information on our website is not incorporated by reference in this annual
report on Form 10-K.
All of
our filings with the Securities and Exchange Commission (the “SEC”) can be
accessed through our website promptly after filing; however, in the event that
the website is inaccessible, we will provide paper copies of our most recent
annual report on Form 10-K, the most recent quarterly report on Form 10-Q,
current reports filed or furnished on Form 8-K and all related amendments,
excluding exhibits, free of charge upon request. These filings are
also accessible on the SEC’s website at www.sec.gov.
In
addition to the other information set forth in this report, you should carefully
consider the following factors, which could materially affect our business,
financial condition or results of operations in future periods. The
risks described below are not the only risks facing our
Company. Additional risks not currently known to us or that we
currently deem to be immaterial also may materially adversely affect our
business, financial condition or results of operations in future
periods.
Risks
Associated with Our Business
A
substantial portion of our revenues are derived from the sales of our Smart
Balance® buttery
spreads products and our future ability to maintain and grow our revenues
depends upon continued sales of these products. Any adverse
developments with respect to the sale of Smart Balance® buttery
spreads products could significantly reduce revenues and have a material adverse
affect on our ability to remain profitable and achieve future
growth.
Approximately
67% of our revenues for the year ended December 31, 2009 resulted from
sales of our Smart Balance® buttery
spreads products, which we expect will continue to be a large percentage of
sales in the future. We cannot be certain that we will be able to
continue to commercialize our products or that any of our products will continue
to be accepted in their markets. Specifically, the following factors,
among others, could affect continued market acceptance and profitability of
Smart Balance® buttery
spreads products:
|
|
·
|
the
introduction of new products by our competitors into the functional food
market;
|
|
|
·
|
the
level and effectiveness of our sales and marketing
efforts;
|
|
|
·
|
continued
or accelerating decline in the buttery spreads
category;
|
|
|
·
|
any
unfavorable publicity regarding buttery spread products or similar
products;
|
|
|
·
|
litigation
or threats of litigation with respect to these
products;
|
|
|
·
|
the
price of the product relative to other competing
products;
|
|
|
·
|
any
changes in government policies and
practices;
|
|
|
·
|
regulatory
developments affecting the manufacture, marketing or use of these
products;
|
|
|
·
|
new
products or technologies which effectively render our buttery spreads
products obsolete;
|
|
|
·
|
new
science or research which undermines the efficacy of our buttery spreads
products; and
|
9
|
|
·
|
adverse
decisions or rulings limiting our ability to promote the benefits of our
buttery spreads products and
technology.
|
Any
adverse developments with respect to the sale of Smart Balance® buttery
spreads products could significantly reduce our revenues and have a material
adverse effect on our ability to maintain profitability and achieve our business
plan.
The
loss of a significant customer or significant reduction in purchase volume by
any such customer could have a material adverse affect on our revenues and net
income.
A limited
number of supermarket chains and food wholesalers account for a substantial
portion of our revenues. Smart Balance’s ten largest customers
accounted for approximately 61% of sales in 2009. Our largest
customer is Wal-Mart Stores, Inc., which accounted for approximately 19% of our
sales in 2009. There can be no assurance that our customers will
continue their relationships with us. In addition, there is no
assurance that our customers will not reduce our shelf space, continue to carry
the same number of our products, charge us more for shelf space or shelve our
new products. A significant reduction or loss in purchase volume from
Wal-Mart Stores, Inc. or other major customers could have a material adverse
effect on Smart Balance’s business, results of operations and financial
condition.
We
are dependent on third-party manufacturers, and the loss of a manufacturer or
the inability of a manufacturer to fulfill our orders or to maintain the quality
of our products could adversely affect our ability to make timely deliveries of
product or result in product recalls.
Smart
Balance does not own or operate any manufacturing facilities and is dependent on
third parties for the manufacture of its products. The ability of any
of our manufacturers to produce our products could be affected by catastrophic
events. We currently rely on and may continue to rely on two
manufacturers to produce all of our spreads. If either manufacturer
were unable or unwilling to produce sufficient quantities of our products in a
timely manner or renew contracts with us, we would have to identify and qualify
new manufacturers, which we may be unable to do. As we expand our
operations, we may have to seek new manufacturers and suppliers or enter into
new arrangements with existing ones. However, only a limited number
of manufacturers may have the ability to produce a high volume of our products,
and it could take a significant period of time to locate and qualify such
alternative production sources. In addition, we may encounter
difficulties or be unable to negotiate pricing or other terms as favorable as
those we currently enjoy.
There can
be no assurance that we would be able to identify and qualify new manufacturers
in a timely manner or that such manufacturers could allocate sufficient capacity
in order to meet our requirements, which could adversely affect our ability to
make timely deliveries of product. In addition, there can be no
assurance that the capacity of our current manufacturers will be sufficient to
fulfill our orders and any supply shortfall could materially and adversely
affect our business, results of operations, and financial
condition. Currently, some of our products are produced by a
single third party source maintaining only one facility. The risks of
interruption described above are exacerbated with respect to these single
source, single facility manufacturers.
Shipments
to and from the warehouses could be delayed for a variety of reasons, including
weather conditions, strikes, and shipping delays. Any significant
delay in the shipments of product would have a material adverse effect on our
business, results of operations and financial condition and could cause our
sales and earnings to fluctuate during a particular period or
periods. We have from time to time experienced, and may in the future
experience, delays in the production and delivery of product.
Our
manufacturers are required to maintain the quality of our products and to comply
with our codebook specifications and requirements for certain certifications. In
addition, our manufacturers are required to comply with all federal, state and
local laws with respect to food safety. There can be no assurance
that our manufacturers will continue to produce products that are consistent
with our standards or in compliance with applicable laws. We would
have the same issue with new suppliers. We have occasionally
received, and may from time to time receive, shipments of products that fail to
conform to our standards. The failure of any manufacturer to produce
products that conform to our standards could materially and adversely affect our
reputation in the marketplace and result in product recalls, product liability
claims and severe economic loss.
10
Our
business model relies heavily on the skill set, experience, industry knowledge
and industry contacts of our executive management team. The departure
of one or more members of our executive management team would be disruptive and
could have a material adverse effect on our business.
The business model we operate requires
specialized skill sets to operate and manage both internal and external teams
and operating entities in an efficient coordinated effort. There is a
limited available talent pool for these skill sets. If we experience
turnover in our executive management ranks there can be no assurance that we can
smoothly transition replacements in a timely and efficient manner. Unique
skill sets and industry contacts may be difficult or in some instances
impossible to duplicate. In addition, historically a significant
portion of our senior management’s compensation has consisted of stock options.
The stock options previously granted to our senior management are currently
significantly under water, meaning that the exercise prices of the options are
greater than the current market value of our common stock. This
decreased financial incentive could cause members of management to seek
employment elsewhere. Disruption to our organization as a result of
executive management turnover may have a detrimental impact on our ability to
maintain our business performance on a consistent level and could have a
material adverse effect on our business, financial condition, results of
operations, and liquidity.
We
rely on Acosta, Inc. to act as our sales agent and there could be significant
disruption in our ability to sell products to our customers for the vast
majority of our sales if our relationship was terminated
Acosta,
Inc. is the largest sales agency in the U.S. and represents our product line to
thousands of supermarkets and food stores. Our agreement with Acosta
is terminable by either us or Acosta after satisfaction of a short notice
period. The termination of our agreement would require us to seek
other sales agents, likely causing significant disruption to our business, and
could affect our relationships with our customers.
Changes
in consumer preferences and discretionary spending may have a material adverse
effect on our revenue, results of operations and financial
condition.
The food
processing industry in general and the functional food industry in particular
are subject to changing consumer trends, demands and
preferences. Trends within the functional food industry change often
and our failure to anticipate, identify or react to changes in these trends
could, among other things, lead to reduced demand and price reductions, and
could have a material adverse effect on our business, results of operations and
financial condition. These changes might include consumer demand for
new products or formulations that include health-promoting ingredients such as
nutraceuticals. In 2009, repeated lower price promotions by
competitors may have created expectations of future price declines and
promotions. There can be no assurance that these pricing
actions will not result in a loss of consumers and market share. Our
success depends, in part, on our ability to anticipate the tastes and dietary
habits of consumers and to offer products that appeal to their preferences on a
timely and affordable basis.
Our
business depends on our ability to protect our intellectual property
effectively. Our inability to protect our intellectual property could
harm the value of our brand and adversely affect our business.
Our
business depends substantially on the legal protection of proprietary rights in
intellectual property that we own or license. We also claim
proprietary rights in various unpatented technologies, know-how, trade secrets
and trademarks relating to our products and manufacturing
processes. Our ability to implement our business plan depends in part
on our ability to expand brand recognition using trademarks, service marks,
trade dress and other proprietary intellectual property, including our name and
logos. If existing contractual measures fail to protect our
proprietary rights, or if any third party misappropriates or infringes on our
intellectual property, any advantage those proprietary rights provide may be
negated and the value of our brands may be harmed, which could have a material
adverse effect upon our business and might prevent our brands from achieving or
maintaining market acceptance. Monitoring infringement of
intellectual property rights is difficult and we cannot be certain that the
precautions we have taken will prevent the unauthorized use of our intellectual
property and know-how, particularly in countries where we do not have trademarks
or patents at all or where the laws of such country may not protect our
proprietary rights as adequately as the laws of the United States or at
all. Accordingly, other parties, including competitors, may duplicate
our products using our proprietary technologies.
11
Pursuing
legal remedies against persons infringing on our patents or otherwise improperly
using our proprietary information is a costly and time-consuming process that
would divert management’s attention and other resources from the conduct of our
business, which could cause delays and other problems with the marketing and
sales of our products, as well as delays in deliveries. GFA has
commenced legal actions against third parties infringing on the patents in the
past. There can be no assurances that we will not encounter other
claims with respect to prior users of intellectual property relating to our
products. If so, this could harm our image, brand or competitive
position and cause us to incur significant penalties and costs, such as having a
patent invalidated or limited in its applicability.
We rely
on a combination of common law trademark rights, U.S. federal registration
rights, and trade secret laws to protect our proprietary
rights. There can be no assurance that we will be able to enforce our
trademark rights for current products or register trademarks or obtain common
law trademark rights using “smart balance” for any new product lines we may
introduce. The inability to have the exclusive right to use of the
term “Smart Balance” in new product names could weaken our ability to create a
strong “Smart Balance” brand in existing and new product
categories.
In
addition, in 2007, three parties filed Oppositions to European Patent No.
820,307 relating to increasing the HDL level and the HDL/LDL ratio in Human
Serum by Balancing Saturated and Polyunsaturated Dietary Fatty
Acids. A hearing is scheduled for July of 2010. We
anticipate a decision later in the year. We believe that neither this
proceeding, nor its outcome, will have any adverse effect on our current
business.
Although
we rely in part on common law trademarks to protect our proprietary rights,
common law trademark rights do not provide the same level of protection as
afforded by the United States federal registration of a
trademark. Common law trademark rights are limited to the geographic
area in which the trademark is actually used, plus a reasonable zone of future
expansion, while U.S. federal registration on the Principal Register provides
the registrant with superior rights throughout the United States, subject to
certain exceptions.
To the
extent that we have registered our trademarks in foreign jurisdictions where our
products are or may be sold, the protection available in such jurisdictions may
not be as extensive as the protection available in the United
States. In some countries, we may be unable to register the “Smart
Balance” trademark for the products that we may want to sell in that country,
which could adversely affect our ability to expand into such
country.
If
we fail to meet our obligations under our principal license agreement with
Brandeis University, we may lose our rights to key technologies on which our
business depends.
Approximately
77% of our sales for the year ended December 31, 2009 were dependent upon
our principal license of certain technology from Brandeis
University. The licensed technology covers all Smart Balance® spreads,
cheeses, shortenings and popcorn, all Earth Balance® spreads
and shortenings and Nucoa®
spread. The license agreement imposes obligations upon us, such as
payment obligations and obligations to diligently pursue the development of
commercial products under the licensed patents. If the licensor
believes that we have failed to meet our obligations under the license
agreement, the licensor could seek to limit or terminate our license rights,
which could lead to costly and time-consuming litigation and, potentially, a
loss of the licensed rights. During the period of any such
litigation, our ability to continue to sell existing products and to carry out
the development and commercialization of potential products or sub-license the
technology could be materially adversely affected. It is difficult to
accurately quantify the economic impact on us if we defaulted under our license
agreement except to conclude that our ability to continue our business could be
severely adversely affected. The license agreement is scheduled to
terminate when the underlying patents in each country expire. The
license agreement in the United States will expire in April 2015. Following the
expiration of the license agreement, the Company’s ability to maintain share
will be largely dependent on marketing efforts.
12
The
recent economic downturn in the U.S. and abroad and related consumer sentiment
could make it more difficult to sell our premium priced products and may have a
material adverse impact on our third-party manufacturers, suppliers,
distributors and customers, which could result in a material adverse effect on
our revenue, results of operations and financial condition.
The
recent economic downturn in the U.S. and abroad may negatively impact us in
several ways. First, high unemployment, loss of savings and
retirement funds, and a dramatic decline in the housing market, have led to a
lack of consumer confidence and widespread reduction of business activity
generally. Economic pressures and/or negative consumer sentiment may
make it difficult to sell our premium priced products or convince shoppers to
switch brands without expensive sampling programs and price
promotions. Second, one or more of our manufacturers, suppliers,
distributors and customers may experience cash flow problems and, therefore,
such manufacturers, suppliers, distributors and customers may be forced to
reduce their output, shut down their operations or file for bankruptcy
protection, which in some cases would make it difficult for us to continue
production of certain products, could require us to reduce sales of our products
or could result in uncollectable accounts receivable. Financial difficulties or
solvency problems at these manufacturers, suppliers and distributors could
materially adversely affect their ability to supply us with products, which
could disrupt our operations. It may be difficult to find a
replacement for certain manufacturers, suppliers or distributors without
significant delay or increase in cost.
We do not
expect that the difficult economic conditions are likely to improve
significantly in the near future. Any negative effect on the ability
of consumers to purchase our premium products, or any interruption of our
manufacturing, supply chain or distribution for any reason (including but not
limited to financial distress, natural disaster or production difficulties),
could substantially adversely affect our financial condition and results of
operations.
Fluctuations
in various food and supply costs could adversely affect our operating
results.
Our
manufacturers obtain most of the key ingredients used in our products from
third-party suppliers. As with most food products, the availability
and cost of raw materials used in our products can be significantly affected by
a number of factors beyond our control, such as general economic conditions
affecting growing decisions, weather conditions such as frosts, drought, and
floods, and plant diseases, pests and other acts of nature. Because
we do not control the production of raw materials, we are also subject to delays
caused by interruptions in production of raw materials based on conditions not
within our control. Such conditions include job actions or strikes by
employees of suppliers, weather, crop conditions, transportation interruptions,
natural disasters, palm oil sustainability issues and boycotts of products or
other catastrophic events. There can be no assurance that our
manufacturers will be able to obtain alternative sources of raw materials at
favorable prices, or at all, if any of them experience supply
shortages. In some instance, we enter into forward purchase
commitments to hedge the costs of projected commodity requirements needed to
produce our finished goods. These commitments are stated at a firm
price, or as a discount or premium from a future commodity price and are placed
with our manufacturers. There can be no assurance that our hedging
commitments will result in the lowest available cost for the commodities used in
our products.
The
inability of our manufacturers to obtain adequate supplies of raw materials for
our products at favorable prices, or at all, as a result of any of the foregoing
factors or otherwise could cause an increase in our cost of sales and a
corresponding decrease in gross margin, or cause our sales and earnings to
fluctuate from period to period. Such fluctuations and decrease in
gross margin could have a material adverse effect on our business, results of
operations and financial condition. There is no assurance that we
would be able to pass along any cost increases to our customers.
Our
advertising is regulated for accuracy, and if our advertising is determined to
be false or misleading, we may face fines or sanctions.
Our
advertising is subject to regulation by the Federal Trade Commission under the
Federal Trade Commission Act, which prohibits dissemination of false or
misleading advertising. In addition, the National Advertising
Division of the Council of Better Business Bureaus, Inc., which we refer to as
NAD, administers a self-regulatory program of the advertising industry to ensure
truth and accuracy in national advertising. NAD both monitors
national advertising and entertains inquiries and challenges from competing
companies and consumers. Should our advertising be determined to be
false or misleading, we may have to pay damages, withdraw our campaign and
possibly face fines or sanctions, which could have a material adverse affect on
our sales and operating results.
13
Adverse
publicity or consumer concern regarding the safety and quality of food products
or health concerns, whether with our products or for food products in the same
food group as our products, may result in loss of sales.
We are
highly dependent upon consumers’ perception of the safety, quality and possible
dietary benefits of our products. As a result, substantial negative
publicity concerning one or more of our products or other foods and beverages
similar to or in the same food group as our products could lead to a loss of
consumer confidence in our products, removal of our products from retailers’
shelves and reduced sales and prices of our products. Product quality
issues, actual or perceived, or allegations of product contamination, even when
false or unfounded, could hurt the image of our brand and cause consumers to
choose other products. Further, any product recall, whether due to
real or unfounded allegations, would damage our brand image and
reputation. Any of these events could have a material adverse effect
on our business, results of operations and financial condition.
If we
conduct operations in a market segment that suffers a loss in consumer
confidence as to the safety and quality of food and beverage products, our
business could be materially adversely affected. The food industry
has recently been subject to negative publicity concerning the health
implications of genetically modified organisms, obesity, trans fatty acids,
diacetyl, mad cow disease, avian flu and bacterial contamination, such as
salmonella. Developments in any of these areas including, but not
limited to, a negative perception about our proprietary formulations, could
cause our operating results to differ materially from expected results. Any of
these events could harm our sales and our operating results, perhaps
significantly.
We
have no long-term contracts with our customers which require the purchase of a
minimum amount of our products. The absence of long-term contracts
could result in periods during which we must continue to pay costs and service
indebtedness without current revenues or with reduced revenues.
As is
generally the case in the retail consumer goods industry, our customers do not
provide us with firm, long-term volume purchase commitments. As a
result of the absence of long-term contracts, we could have periods during which
we have no or only limited orders for our products, but we will continue to have
to pay our costs including costs to maintain our work force and service our
indebtedness, without the benefit of current revenues or with reduced
revenues. We cannot assure that we will be able to timely find new
customers to supplement periods where we experience no or limited purchase
orders or that we can recover fixed costs as a result of experiencing reduced
purchase orders. Periods of no or limited purchase orders for our
products could have a material adverse affect on our net income, cause us to
incur losses or result in violations of the debt covenants contained in our
credit agreement.
The
Company’s performance may be adversely affected by economic and political
conditions in the U.S. and abroad.
The
Company’s performance has been in the past and may continue in the future to be
impacted by economic and political conditions in the United States and
abroad. Such conditions and factors include changes in applicable
laws and regulations, including changes in food and drug laws, accounting
standards, taxation requirements and environmental laws. Other
factors impacting our operations include recessionary conditions, the
performance of businesses in hyperinflationary environments, terrorist acts and
political unrest. Such changes could materially and adversely affect
our financial results. In addition, unfavorable general economic
conditions could affect the affordability of, and consumer demand for, some of
our products. Under difficult economic conditions, consumers may seek
to reduce discretionary spending by foregoing purchases of our products or by
shifting away from our products to lower-priced products offered by our
competitors.
14
The
market price and trading volume of our common stock may be
volatile.
The
market price of our common stock could fluctuate significantly for many reasons,
including reasons not specifically related to our performance, such as industry
or market trends, reports by industry analysts, investor perceptions, actions by
credit rating agencies, negative announcements by our customers or competitors
regarding their own performance or actions taken by our competitors, as well as
general economic and industry conditions. For example, to the extent that other
companies within our industry experience declines in their stock price, our
stock price may decline as well. Our common stock price is also
affected by announcements we make about our business, analyst reports related to
our company, changes in financial estimates by analysts, rating agency
announcements about our business, and future sales of our common stock, among
other factors. Our stock price may also be affected by fluctuations
in the market share of our products. As a result of these factors,
investors in our common stock may not be able to resell their shares at or above
the price at which they purchase our common stock. In addition, the
stock market in general has experienced extreme price and volume fluctuations
that have often been unrelated or disproportionate to the operating performance
of companies like us. These broad market and industry factors may
materially reduce the market price of our common stock, regardless of our
operating performance.
Risks
Related to the Food and Beverage Industries
Our
business operations may be subject to numerous laws and governmental
regulations, exposing us to potential claims and compliance costs that could
adversely affect our operations.
Manufacturers
and marketers of food and beverage products are subject to extensive regulation
by the Food and Drug Administration, which we refer to as the FDA, the United
States Department of Agriculture, which we refer to as the USDA, and other
national, state and local authorities. For example, the Food, Drug and Cosmetic
Act and its regulations govern, among other things, the manufacturing,
composition and ingredients, packaging and safety of foods and beverages. Under
this act, the FDA regulates manufacturing practices for foods and beverages
through its current “good manufacturing practices” regulations, and imposes
ingredient specifications and requirements for many foods and beverages.
Additionally, the USDA has adopted regulations with respect to a national
organic labeling and certification program. Food and beverage manufacturing
facilities and products are also subject to periodic inspection by federal,
state and local authorities.
We are also subject to
numerous other laws and regulations, including laws and regulations
relating to competition, product safety, the protection of the environment, and
employment and labor practices, and the production, distribution and sale of
many of our products are subject to, among others, the Lanham Act, state
consumer protection laws, the Occupational Safety and
Health Act, various environmental statutes, as well as various state and local
statutes and regulations.
Any
changes in laws and regulations applicable to food and beverage products could
increase the cost of developing and distributing our products and otherwise
increase the cost of conducting our business, which would adversely affect our
financial condition. In addition, if we fail to comply with applicable laws and
regulations, including future laws and regulations, we may be subject to civil
remedies, including fines, injunctions, recalls or seizures, as well as
potential criminal sanctions, any of which could have a material adverse effect
on our business, financial condition, results of operations or
liquidity.
The
growth of our business will rely on our ability to successfully introduce
products in numerous new categories and distribution
channels. Recently, we have expanded Smart Balance presence in dairy
categories such as Milk and Sour Cream. These dairy industries are
highly regulated at the national, state and local levels and require significant
compliance and reporting activities. If we fail to comply with
applicable laws and regulations, including future laws and regulations, we may
be subject to civil remedies, including fines, injunctions, recalls or seizures,
as well as potential criminal sanctions, any of which could have a material
adverse effect on our business, financial condition, results of operations or
liquidity.
We could
also be affected by climate change. There is increasing concern that
a gradual increase in global average temperatures due to increased concentration
of carbon dioxide and other greenhouse gases in the atmosphere will cause
significant changes in weather patterns around the globe and an increase in the
frequency and severity of natural disasters. Decreased agricultural productivity
in certain regions as a result of changing weather patterns could limit
availability or increase the cost of key agricultural commodities. We
are a large user of palm oil and could be affected by sustainability issues
related to rain forests and the impact this would have on palm oil
production. Increased frequency or duration of extreme weather
conditions could also impair production capabilities, disrupt suppliers or
impact demand for our products. In addition, public expectations for reductions
in greenhouse gas emissions could result in increased energy, transportation and
raw material costs.
15
We
may be subject to significant liability should the consumption of any of food or
beverage products manufactured or marketed by us cause injury, illness or death.
Regardless of whether such claims against us are valid, they may be expensive to
defend and may generate negative publicity, both of which could adversely affect
our operating results.
The sale
of food and beverage products for human consumption involves the risk of injury
to consumers. Such injuries may result from tampering by unauthorized third
parties or product contamination or spoilage, including the presence of
bacterial contamination, foreign objects, substances, chemicals, other agents or
residues introduced during production processes. Although we believe
that we and our manufacturers are in material compliance with all applicable
laws and regulations, if the consumption of our products causes or is alleged to
have caused an illness in the future, we may become subject to claims or
lawsuits relating to such matters. Even if a product liability claim is
unsuccessful or is not fully pursued, the negative publicity surrounding an
illness, injury or death could materially adversely affect our reputation with
existing and potential customers on a permanent basis and our corporate image
and operating results. Moreover, claims or liabilities of this nature might not
be covered by insurance or by any rights of indemnity or contribution that we
may have. While we have product liability insurance coverage in amounts we
believe to be adequate, we cannot be sure that claims or liabilities will be
asserted for which adequate insurance will be available or that such claims or
liabilities will not exceed the available amount of insurance
coverage.
Our food
or beverage products may also experience product tampering, contamination or
spoilage or be mislabeled or otherwise damaged. Under certain circumstances a
product recall could be initiated, leading to a material adverse effect on our
reputation, operations and operating results. Recalls, though not mandated by
the Food Drug and Cosmetic Act, may be required nonetheless to avoid seizures or
civil or criminal litigation or due to market demands. Even if such a situation
does not necessitate a recall, product liability claims could be asserted
against us. A products liability judgment or a product recall involving us could
have a material adverse effect on our business, financial condition, results of
operations or liquidity.
We are
also heavily dependent on our manufacturers for compliance with sound and lawful
production of our products. Therefore, even if we have adequate insurance or
contractual indemnification, product liabilities relating to defective products
could have a material adverse effect on our business, results of operations,
liquidity, financial condition and brand image.
Regardless
of whether any claims against us are valid, or whether we are ultimately held
liable, claims may be expensive to defend and may divert time and money away
from our operations, which could have a detrimental effect on our performance. A
judgment that is significantly in excess of our insurance coverage for any
claims could materially and adversely affect our financial condition or results
of operations. Any adverse publicity resulting from these allegations may also
materially and adversely affect our reputation, which could adversely affect our
results.
The food
processing industry has been subject to a growing number of claims based on the
nutritional content of food products as well as disclosure and advertising
practices. We may also be subject to this type of proceeding in the future and,
even if not, publicity about these matters (particularly directed at the
quick-service and fast-casual segments of the industry) may harm our reputation
and adversely affect our results. In addition, suits against our
competitors can harm our business.
Successful
new product introductions are important to sustaining or growing our business
and there is no guarantee that customers will accept our products for their
stores or set reasonable prices for our products. In addition,
competitors may offer significant price reductions, and we cannot ensure that
consumers will find our products suitably differentiated from products of our
competitors.
The food
industry and retailers in the grocery industry use new products as a way of
creating excitement and variety of choices in order to attract
consumers. Our ability to develop, market, and sell new products at
an appropriate price may be hampered by the inability to get shelf space for our
products at a reasonable cost or once placed, have an attractive price set for
our products. Competitors, many of whom have greater resources than
us, vie for the same shelf placement and may offer incentives to the retailers
that we cannot match. In addition, unattractive shelf placement and
pricing may put us at a disadvantage to our competitors. We may need
to increase our marketing and advertising spending in order to protect our
existing market share or to promote new products, which could impact our
operating results. The inability to stay current with functional
foods trends through new products could materially adversely affect our business
performance.
16
Changes
in retail distribution arrangements and the trend toward less products stocked
at retail can result in the loss of retail shelf space and disrupt sales of food
or beverage products, which could cause our sales to fall.
From time
to time, retailers change distribution centers that supply some of their retail
stores or change sales agencies that are responsible for stocking and
maintaining food and beverage products in parts of their stores. If a new
distribution center has not previously distributed our products in that region
or if a sales agency is not familiar with our products, there will be a delay in
a distribution center’s ability to begin distributing new products in its region
or to arrange for a sales agency to represent and stock our products. If we do
not get approval to have our products offered in a new distribution region or if
getting this approval takes longer than anticipated, our operating results may
suffer. Likewise, if we cannot establish a relationship with a sales agent to
stock food or beverage products in one or a number of stores or if we
temporarily lose shelf space during the time it takes to do so, our sales may
decline. In addition, the trend by retailers of reducing the number
and inventory of items in stock and on shelf can lead to loss of sales and less
availability of our products to consumers.
The
food industry is highly competitive and we compete with many companies who have
greater resources than we do.
The food
industry is highly competitive and numerous multinational, regional and local
firms currently compete, or are capable of competing, with us. Our
products compete with branded products as well as generic and private-label
products of food retailers, wholesalers and cooperatives. We compete primarily
on the basis of product quality, brand recognition, brand loyalty, service,
marketing, advertising, patent protections and price. Some
competitors may have different profit or strategic objectives than we
do. Substantial advertising and promotional expenditures are required
to maintain or improve a brand’s market position or to introduce a new
product. Our largest principal competitors are Unilever, ConAgra
Foods and Land O’ Lakes, each of whom have substantially greater market
presence, longer operating histories, better distribution, and greater
financial, marketing, capital and other resources than us. Our
ability to gain or maintain market share may be limited as a result of actions
by competitors.
Risks
Relating to Our Secured Debt Financing
Our
ability to service debt may be limited, which could force us to reduce or delay
advertising and promotional expenditures, restructure our indebtedness or seek
additional equity capital.
As of
December 31, 2009, we had outstanding approximately $56.6 million of secured
debt.
The level
of our indebtedness could have important consequences to our stockholders,
including:
|
|
·
|
a
substantial portion of our cash flow from operations must be dedicated to
debt service and will not be available for other purposes, including the
declaration and payment of cash dividends, marketing and advertising, and
payments for shelf space;
|
|
|
·
|
our
ability to obtain additional debt financing in the future for working
capital, capital expenditures or acquisitions may be limited;
and
|
|
|
·
|
our
level of indebtedness could limit our flexibility in planning for and
reacting to changes in the industry and economic conditions
generally.
|
17
Our
ability to pay interest and principal on the secured debt financing will depend
upon our future operating performance, which will be affected by prevailing
economic conditions and financial, business and other factors, many of which are
beyond our control. In addition, due to the unprecedented weakness in
the U.S. economy, our ability to pay interest and principal on the secured debt
financing may depend on our customers’ financial stability and their ability to
pay us for their purchases in a timely fashion, or at all. Any
significant default or delay in our customers’ payments could result in our
inability to pay interest and principal on the secured debt financing in a
timely fashion.
We
anticipate that our operating cash flow will be sufficient to meet our operating
expenses and advertising and promotional expenditures, to sustain operations and
to service our interest and principal requirements as they become due. If we are
unable to generate sufficient cash flow to service our indebtedness and fund our
advertising and promotional expenditures, we will be forced to adopt an
alternative strategy that may include reducing or delaying advertising and
promotional expenditures, restructuring or refinancing our indebtedness or
seeking additional equity capital. There can be no assurance that any of these
strategies could be effected on satisfactory terms, if at all. Our ability to
meet our debt service obligations will be dependent upon our future performance
which, in turn, is subject to future economic conditions and to financial,
business and other factors, many of which are beyond our control.
If
we are obligated for any reason to repay our secured debt financing before the
scheduled installment dates, we could deplete our working capital, if available,
or make raising additional funds necessary. Our failure to repay the secured
debt financing, if required, could result in legal action against us which could
materially harm our business.
As of
December 31, 2009, we had outstanding approximately $56.6 million of secured
debt. Any event of default could require the early repayment of the secured debt
financing in whole or in part together with accrued interest on the outstanding
principal balance of the secured debt financing and any other applicable
penalties, including a default interest rate. If, prior to the maturity date, we
are required to repay the secured debt financing in full, we would be required
to use our limited working capital and raise additional funds. If we were unable
to repay the secured debt financing, and other applicable penalties, when
required, our lenders could commence legal action against us to recover the
amounts due. Any such action would be materially harmful to us and could require
us to curtail or cease operations.
The
loan agreement for the secured debt financing contains covenants that
significantly restrict our operations, which may negatively affect our ability
to operate our business and limit our ability to take advantage of potential
business opportunities.
The loan
agreement with respect to the secured debt financing contains numerous covenants
imposing financial and operating restrictions on our business. Any other future
debt agreements may contain similar covenants. These restrictions may affect our
ability to operate our business, limit our ability to take advantage of
potential business opportunities as they arise and adversely affect the conduct
of our current business. These covenants place restrictions on our ability to,
among other things:
|
|
·
|
incur
more debt or issue certain equity
interests;
|
|
|
·
|
pay
dividends, redeem or purchase our equity interests or make other
distributions;
|
|
|
·
|
make
certain acquisitions or
investments;
|
|
|
·
|
use
assets as security in other transactions or otherwise create
liens;
|
|
|
·
|
enter
into transactions with affiliates;
|
|
|
·
|
merge
or consolidate with
others; and
|
|
|
·
|
transfer
or sell assets, including the equity interests of our subsidiary, or use
asset sale proceeds.
|
18
Our
failure to comply with the covenants described above could result in an event of
default under the secured debt. See Item 7, “Management’s Discussion
and Analysis of Financial Condition and Results of Operations—Liquidity and
Capital Resources.”
Item
1B. Unresolved Staff
Comments
We have
received no written comments regarding our periodic or current reports from the
staff of the Securities and Exchange Commission that were issued 180 days or
more preceding December 31, 2009 that remain unresolved.
Item
2. Properties
Our
corporate headquarters are located at 115 West Century Road – Suite 260,
Paramus, New Jersey 07652 and our telephone number is (201) 568-9300. We
have two leases in place at this location. The initial term of the primary
lease for our corporate headquarters expires May 31, 2015 and we have two
options to extend for additional five-year terms. In 2009, we leased an
adjacent business suite at the same facility with an initial term expiring
November 30, 2013. The Company has an option to renew this separate lease
through May 31, 2015. The annual aggregate rent for the corporate
headquarters is approximately $550,000 through November 30, 2013.
We also
have three lease agreements for the lease of corporate office space in Niwot,
Colorado. The initial term of each of these leases expires July 31, 2012 and the
Company has the option to extend each lease for an additional thirty-six
months. The annual aggregate rental expense for this facility is
approximately $145,000 through July 31, 2012.
Management
believes that our facilities are suitable and adequate for the Company’s
needs.
Item
3. Legal
Proceedings
In 2007,
three parties filed Oppositions to European Patent No. 820,307 relating to
increasing the HDL level and the HDL/LDL ratio in Human Serum by Balancing
Saturated and Polyunsaturated Dietary Fatty Acids. A hearing is
scheduled for July of 2010. We anticipate a decision later in the
year. We believe that neither this proceeding, nor its outcome, will
have any adverse effect on our current business.
On
February 8, 2010, a lawsuit was filed against us in the Federal District Court
for the Central District in California in Santa Ana, California. The
complaint alleges, among other things, violations of California’s unfair
competition law, false advertising, and consumer remedies act and seeks to
identify all similarly situated plaintiffs and certify them in a class
action. We have not yet answered the complaint, but we intend to
vigorously defend against this suit. This suit involves our
Nucoa® stick
margarine product which represents less than 1% of our 2009
sales. Nucoa® stick
margarine is our only product which includes artificially produced trans
fats. We do not expect that resolution of this matter will have a
material adverse effect on our business.
We are
not a party to any other legal proceeding that we believe would have a material
adverse effect on our business, results of operations or financial
condition.
Item
4. Reserved
19
PART
II
|
|
Item
5.
|
Market
for Registrant’s Common Equity, Related Stockholder Matters and Issuer
Purchases of Equity Securities
|
Our
common stock is listed on the Nasdaq Global Market under the symbol
“SMBL”. The following table sets forth, for the quarterly periods
indicated, the high and low prices per share for the Company’s common stock on
the Nasdaq Global Market.
|
Common Stock
|
||||||||
|
High
|
Low
|
|||||||
|
2008
First Quarter
|
$ | 11.25 | $ | 4.85 | ||||
|
2008
Second Quarter
|
$ | 9.45 | $ | 6.85 | ||||
|
2008
Third Quarter
|
$ | 8.22 | $ | 5.18 | ||||
|
2008
Fourth Quarter
|
$ | 7.52 | $ | 4.58 | ||||
|
2009
First Quarter
|
$ | 8.10 | $ | 5.26 | ||||
|
2009
Second Quarter
|
$ | 8.73 | $ | 6.94 | ||||
|
2009
Third Quarter
|
$ | 6.93 | $ | 5.54 | ||||
|
2009
Fourth Quarter
|
$ | 6.35 | $ | 4.83 | ||||
Holders
As of
March 1, 2010, there were 29 holders of record of our common
stock. This figure does not include a substantially greater number of
“street name” holders or beneficial holders of our common stock, whose shares
are held of record by banks, brokers and other financial
institutions.
Dividends
We have
not paid any dividends on our common stock to date. Our secured debt
financing prohibits the payment of any cash dividends. Furthermore,
the payment of dividends is within the discretion of our board of directors and
our board presently intends to retain all earnings, if any, for use in our
business operations. Accordingly, we do not anticipate declaring any
dividends in the foreseeable future. Any decision to pay dividends
would depend on many factors including, but not limited to, our earnings,
financial condition, contractual obligations and regulatory considerations, and
would be at the discretion of our board of directors.
Unregistered
Equity Sales
During
the year ended December 31, 2009, no equity securities of the Company were sold
by the Company that were not registered under the Securities Act of 1933, as
amended.
20
Securities
Authorized for Issuance Under Equity Compensation Plans
The
following table displays equity compensation plan information as of December 31,
2009. For further information, see note 7 of “Notes to Consolidated
Financial Statements.”
Equity
Compensation Plan Information
|
Number of securities to
be issued upon exercise
of outstanding options,
warrants and rights
|
Weighted-average
exercise price of
outstanding options,
warrants and rights
|
Number of securities remaining
available for issuance under equity
compensation plans (excluding
securities reflected in column (a))
|
||||||||||
|
(a)
|
(b)
|
(c)
|
||||||||||
|
Equity
compensation plans approved by security holders
|
10,881,000 | $ | 9.40 | 1,269,000 | ||||||||
|
Equity
compensation plans not approved by security holders*
|
1,375,000 | 8.84 | 0 | |||||||||
|
Total
|
12,256,000 | $ | 9.34 | 1,269,000 | ||||||||
*Consists
of stock options granted under the Company’s Amended and Restated Inducement
Award Plan, which permits the Company to award stock options to individuals not
previously an employee of the Company pursuant to Nasdaq Marketplace Rule
4350.
21
Stock
Performance Graph
The
performance graph furnished below compares the annual cumulative total
stockholder return (assuming reinvestment of dividends) from investing $100 on
January 23, 2006 in each of (i) our common stock, (ii) a peer group index
consisting of the S&P Packaged Foods & Meats Index, and (iii) the
S&P SmallCap 600 Index. We completed our initial public offering on
December 21, 2005. We sold 12,760,840 units (consisting of one
share of common stock and one public warrant to purchase common stock) in our
initial public offering. The units became separable on
January 23, 2006. Prior to January 23, 2006, there was no
established public trading market for our common stock. For
compatibility purposes, the performance graph below compares the total return
from our common stock beginning January 23, 2006. To date, we
have not paid dividends, and no dividends are included in the representation of
our performance.
The stock
price performance on the graph below is not necessarily indicative of future
price performance.
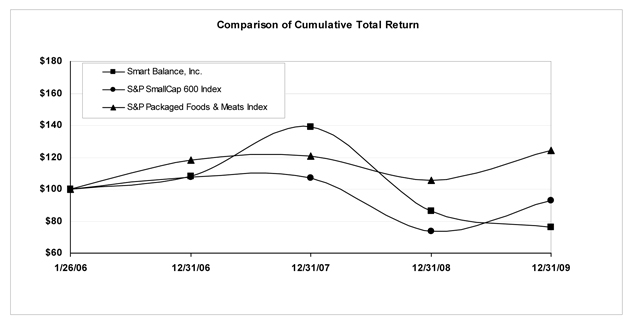
The stock
performance graph should not be deemed filed or incorporated by reference into
any other filing made by us under the Securities Act of 1933 or the Securities
Exchange Act of 1934, except to the extent that we specifically incorporate the
stock performance graph by reference in another filing.
Item
6. Selected
Historical Financial Information
The
following is a summary of selected financial data of the Company for the period
from May 31, 2005 (inception) to December 31, 2009. The
selected financial data should be read in conjunction with “Item 7, Management’s
Discussion and Analysis of Financial Condition and Results of Operations” and
our audited financial statements and the notes thereto included elsewhere in
this annual report (in thousands, except share data):
22
|
Twelve months ended December 31,
|
May 31, 2005
(inception) to
December 31,
|
|||||||||||||||||||
|
2009
|
2008
|
2007(1)
|
2006
|
2005
|
||||||||||||||||
|
Net
sales
|
$ | 239,503 | $ | 221,872 | $ | 111,038 | $ | - | $ | - | ||||||||||
|
Cost
of goods sold
|
123,974 | 126,904 | 58,715 | - | - | |||||||||||||||
|
Gross
profit
|
115,529 | 94,968 | 52,323 | - | - | |||||||||||||||
|
Operating
expenses:
|
||||||||||||||||||||
|
Marketing
|
37,383 | 33,034 | 15,118 | - | - | |||||||||||||||
|
Selling
|
17,580 | 16,662 | 12,268 | - | - | |||||||||||||||
|
General
and administrative
|
48,756 | 39,578 | 17,931 | - | - | |||||||||||||||
|
Expenses
settled with Founders’ stock
|
- | - | - | - | 2,360 | |||||||||||||||
|
Performance
based shares released from escrow
|
- | - | 18,456 | - | - | |||||||||||||||
|
Formation
and operating costs
|
- | - | - | 1,925 | 109 | |||||||||||||||
|
Total
operating expenses
|
103,719 | 89,274 | 63,773 | 1,925 | 2,469 | |||||||||||||||
|
Operating
profit (loss)
|
11,810 | 5,694 | (11,450 | ) | (1,925 | ) | (2,469 | ) | ||||||||||||
|
Other
income (expense):
|
||||||||||||||||||||
|
Interest
income
|
3 | 292 | 2,450 | 4,220 | 24 | |||||||||||||||
|
Interest
expense
|
(3,653 | ) | (9,049 | ) | (9,678 | ) | - | - | ||||||||||||
|
(Loss)
gain on derivative liability
|
(1,045 | ) | (5,132 | ) | (45,556 | ) | (15,266 | ) | 1,808 | |||||||||||
|
Other
income (expense), net
|
(2,291 | ) | (2,336 | ) | (1,020 | ) | - | - | ||||||||||||
|
Total
other income (expense)
|
(6,986 | ) | (16,225 | ) | (53,804 | ) | (11,046 | ) | 1,832 | |||||||||||
|
Income
(loss) before income taxes
|
4,824 | (10,531 | ) | (65,254 | ) | (12,971 | ) | (637 | ) | |||||||||||
|
Provision
(benefit) for income taxes
|
1,358 | (3,563 | ) | (706 | ) | 808 | - | |||||||||||||
|
Net
income (loss)
|
$ | 3,466 | $ | (6,968 | ) | $ | (64,548 | ) | $ | (13,779 | ) | $ | (637 | ) | ||||||
|
Less:
Unpaid dividends on cumulative preferred stock
|
$ | - | $ | - | $ | 37,159 | $ | - | $ | - | ||||||||||
|
Net
income (loss) available for common shares
|
$ | 3,466 | $ | (6,968 | ) | $ | (101,707 | ) | $ | (13,779 | ) | $ | (637 | ) | ||||||
|
Net
income (loss) per share - basic and diluted
|
$ | 0.06 | $ | (0.11 | ) | $ | (4.12 | ) | $ | (0.96 | ) | $ | (0.16 | ) | ||||||
|
Weighted
average shares outstanding:
|
||||||||||||||||||||
|
Basic
|
62,630,683 | 62,523,742 | 24,667,344 | 14,355,945 | 4,025,031 | |||||||||||||||
|
Diluted
|
62,703,434 | 62,523,742 | 24,667,344 | 14,355,945 | 4,025,031 | |||||||||||||||
|
(1)
|
The
Company acquired GFA on May 21,
2007.
|
|
December 31,
2009
|
December 31,
2008
|
December 31,
2007(1)
|
December 31,
2006
|
December 31,
2005
|
||||||||||||||||
|
Balance
sheet data:
|
||||||||||||||||||||
|
Cash
and cash equivalents
|
$ | 7,538 | $ | 5,492 | $ | 37,649 | $ | 569 | $ | 1,548 | ||||||||||
|
Investments
held in trust - restricted
|
— | — | — | 101,073 | 98,355 | |||||||||||||||
|
Other
current assets
|
23,822 | 26,675 | 28,787 | 1,051 | 377 | |||||||||||||||
|
Property
and equipment, net
|
4,634 | 4,301 | 1,805 | — | — | |||||||||||||||
|
Goodwill
|
374,886 | 374,886 | 374,886 | — | — | |||||||||||||||
|
Other
intangible assets
|
151,089 | 155,223 | 159,646 | — | — | |||||||||||||||
|
Other
non-current assets
|
3,096 | 1,959 | 3,594 | 3,591 | ||||||||||||||||
|
Total
assets
|
$ | 565,065 | $ | 568,536 | $ | 606,367 | $ | 106,284 | $ | 100,280 | ||||||||||
|
Current
liabilities
|
$ | 28,126 | $ | 26,018 | $ | 21,390 | $ | 8,578 | $ | 4,490 | ||||||||||
|
Derivative
liabilities
|
— | 5,132 | — | 32,285 | 17,018 | |||||||||||||||
|
Long-term
debt
|
51,143 | 69,504 | 119,504 | — | — | |||||||||||||||
|
Other
liabilities
|
965 | 162 | — | — | — | |||||||||||||||
|
Deferred
tax liability
|
43,824 | 46,268 | 53,294 | — | — | |||||||||||||||
|
Total
liabilities
|
124,058 | 147,084 | 194,188 | 40,863 | 21,508 | |||||||||||||||
|
Common
stock subject to possible conversion
|
— | — | — | 19,661 | 19,661 | |||||||||||||||
|
Deferred
interest income
|
— | — | — | 433 | — | |||||||||||||||
|
Series
A convertible preferred stock
|
— | — | 175,657 | — | — | |||||||||||||||
|
Series
A convertible preferred stock - par value
|
— | — | 2 | — | — | |||||||||||||||
|
Common
stock – par value
|
6 | 6 | 4 | 1 | 1 | |||||||||||||||
|
Additional
paid in capital
|
523,467 | 507,378 | 315,480 | 59,742 | 59,747 | |||||||||||||||
|
Retained
deficit
|
(82,466 | ) | (85,932 | ) | (78,964 | ) | (14,416 | ) | (637 | ) | ||||||||||
|
Total
stockholders’ equity
|
441,007 | 421,452 | 412,179 | 45,327 | 59,111 | |||||||||||||||
|
Total
liabilities and stockholders’ equity
|
$ | 565,065 | $ | 568,536 | $ | 606,367 | $ | 106,284 | $ | 100,280 | ||||||||||
|
(1)
|
The
Company acquired GFA on May 21,
2007.
|
23
GFA
GFA’s
historical information was derived from its audited consolidated financial
statements as of and for the period from January 1, 2007 through May 20, 2007
and as of and for the years ended December 31, 2006 and December 31,
2005. The information is only a summary and should be read in
conjunction with the historical consolidated financial statements and related
notes of GFA and its predecessor companies. The historical results included
below and elsewhere in this document are not indicative of the future
performance of GFA.
|
GFA Holdings, Inc.
|
||||||||||||
|
Period from
|
Year Ended
|
|||||||||||
| (in thousands) |
January 1, 2007 to
May 20, 2007
|
December 31,
2006
|
December 31,
2005
|
|||||||||
|
Consolidated
statement of operations data:
|
||||||||||||
|
Net
revenue
|
$ | 72,442 | $ | 158,468 | $ | 114,710 | ||||||
|
Gross
profit
|
39,721 | 88,707 | 67,007 | |||||||||
|
Operating
income (loss)
|
(8,952 | ) | 24,054 | 15,275 | ||||||||
|
Selected
balance sheet data (end of period):
|
||||||||||||
|
Total
assets
|
$ | 131,111 | $ | 118,877 | $ | 113,308 | ||||||
|
Long-term
debt, current portion
|
— | 4 ,725 | 5,846 | |||||||||
|
Long-term
dept, noncurrent portion
|
— | — | 12,879 | |||||||||
|
Deferred
tax liability, noncurrent
|
7,732 | 6,801 | 5,041 | |||||||||
24
Item
7. Management’s Discussion and Analysis of Financial Condition
and Results of Operations
The
following is a discussion of our financial condition and results of operations
for the years ended December 31, 2009, 2008 and 2007. This
section should be read in conjunction with our consolidated financial statements
including the notes thereto for the periods mentioned above, which are included
elsewhere in this report.
Company
Overview
We are a
consumer food products company that competes primarily in the retail branded
food products industry and focuses on providing value-added, functional food
products to consumers. Functional food is defined as a food or a food ingredient
that has been shown to affect specific functions or systems in the body and may
play an important role in disease prevention. We market buttery spreads,
popcorn, peanut butter, cooking oil, mayonnaise, milk, sour cream and other
products primarily under the Smart Balance®
trademark. In the natural food channel, we sell similar natural and
organic products under the Earth Balance® trademark.
Our trademarks are of material importance to our business and are protected by
registration or other means in the United States and a number of international
markets. Our buttery spreads business, marketed under Smart
Balance®, Earth
Balance®,
SmartBeat® and
Nucoa®, is by
far our most developed product group and accounted for approximately 75% of our
2009 sales. Our products are sold throughout the U.S. A
majority of our products are sold through supermarket chains and food
wholesalers.
We
outsource production of finished goods to third-party
manufacturers. We do not own or operate any manufacturing
facilities. Outsourcing allows us to focus our energy and resources
on marketing and sales, while substantially reducing capital expenditures and
avoiding the complication of managing a production work force. Our
manufacturers supply our products at a price equal to the cost of ingredients
and certain packaging plus a contracted toll charge. We use third
party distributors and a network of public warehouses to deliver products from
our manufacturers to our customers.
Our goal
is to become a recognized leader in providing nutritious and good tasting
products for a wide variety of consumer needs. We believe the Smart
Balance® brand
has the potential to become a broad functional foods platform across multiple
food categories. Our primary growth strategy is two-fold: (1) to
drive consumer and trade awareness of our brands and (2) to increase purchase
frequency by expanding product offerings and distribution in our core category
of spreads and into other dairy categories. In order to drive
consumer and trade awareness of our brands and add more households that prefer
our products, we will continue to use marketing and promotional programs to
drive trial and encourage brand loyalty. We spent over $40 million in 2008 for
consumer marketing and promotion and over $50 million in 2009. In
order to increase purchase frequency and expand our product offerings and
distribution, during 2008 we launched a successful distribution initiative to
increase shelf presence in retailers. The effort substantially
increased the average number of our products that retailers have on the shelf,
especially in the spreads category. Our current dairy aisle
initiative is the critical part of our growth plan. Centered on the
high purchase frequency of the milk category, we believe success in expanding in
the diary aisle will be the driver toward our growth goals.
2009 was
an important year in creating a foundation necessary to support growth over the
next several years. We increased our market share and profitability
in the core spreads category, established our dairy initiative, lead by our
enhanced milk products, and refinanced our credit facility with a strategically
flexible capital structure.
In our
core spreads category, for the year ended December 31, 2009 our dollar market
share was up a full point to 14.6% according to Information Resources
Incorporated data for the food channel. Accordingly, we
were first among competitors in dollar share growth in 2009 and
second behind private label in unit share growth, a solid accomplishment for a
premium priced product in this economy. We are now the number two
marketer of spreads in the U.S. on a dollar basis. Our strategy has always been
to maintain price and product positioning as a premium brand. As a
result, we lost some volume opportunities during the second half of 2009 as
consumers continued to be price sensitive and competitors sought to increase
unit share through price promotion.
25
For our
dairy initiative in 2009, we expanded distribution of milks to the Northeast,
beyond the initial Florida market. We launched sour cream products
later in the year to increase our positioning in the dairy aisle.
In 2009,
our gross margins improved substantially from 2008. Throughout 2009,
we benefited from lower and stable oil prices compared to the unprecedented
levels witnessed during 2008. Milk prices were also considerably
lower in 2009 compared to 2008. Both oil and milk are expected to
trend up in 2010 and the Company uses various financial tools including hedging
to ensure supply at stable prices. During 2009, we saw significant increases in
trade and consumer promotion costs that negatively impacted both net sales and
gross margin. These spending increases were designed to offer pricing
relief to our core consumers, as well as drive trial of our new
products.
We
restructured our long-term debt in November 2009 to give the Company greater
flexibility in strategic areas such as acquisitions and capital structure with
higher available credit and less restrictive financial covenants than our
previous facility. At the end of 2009 our debt was $57 million, down
$13 million from the end of 2008 and down $103 million since the acquisition of
GFA in 2007. Our board authorized a two-year, $25 million stock
repurchase program, which will be effective starting in March 2010.
In 2009,
we signed an exclusive license agreement to use the Bestlife™ brand across
virtually all food and beverage categories. The Best Life® program
was developed by Bob Greene, Oprah’s trainer and nutritional
advisor. We believe that this relationship provides us with a
significant opportunity to use a targeted marketing approach
to penetrate the value segment of the spreads category and other
categories where the Smart Balance® brand
does not participate.
In 2010,
we plan to expand milk and sour cream nationally and use advertising and other
marketing to drive trial. To continue to grow our presence in the spreads
category, we have developed our three-tier strategy, which allows us to compete
in multiple segments in the spreads category, with our Earth Balance® brand
in the super premium segment, our Smart Balance® brand in
the healthy premium segment and our new Bestlife™ brand in the value
segment. We expect pricing pressure in the spreads category to
continue for at least several quarters due to the economic conditions and
competitive promotional activity that started mid-year in 2009.
Smart
Balance – Results of Operations
Results
of Operations for the Year Ended December 31, 2009 Compared to the Year Ended
December 31, 2008 and for the Year Ended December 31, 2008 Compared to the Year
Ended December 31, 2007
|
(in millions, except per share
data)
|
Years Ended December 31,
|
|||||||||||
|
2009
|
2008
|
2007
|
||||||||||
|
Net
Sales
|
$ | 239.5 | $ | 221.9 | $ | 111.0 | ||||||
|
Cost
of Goods Sold
|
124.0 | 126.9 | 58.7 | |||||||||
|
Gross
Profit
|
115.5 | 95.0 | 52.3 | |||||||||
|
Operating
Expenses
|
103.7 | 89.3 | 63.8 | |||||||||
|
Operating
Income (Loss)
|
11.8 | 5.7 | (11.5 | ) | ||||||||
|
Other
Income (Expenses)
|
(7.0 | ) | (16.2 | ) | (53.7 | ) | ||||||
|
Income
(Loss) before Income Taxes
|
4.8 | (10.5 | ) | (65.2 | ) | |||||||
|
Provision
(Benefit) for Income Taxes
|
1.3 | (3.6 | ) | (0.7 | ) | |||||||
|
Net
Income (Loss)
|
$ | 3.5 | $ | (6.9 | ) | $ | (64.5 | ) | ||||
|
Net
Income (Loss) available to Common Shares
|
$ | 3.5 | $ | (6.9 | ) | $ | (101.7 | ) | ||||
|
Net
Income (Loss) Per Common Available Share
|
$ | 0.06 | $ | (0.11 | ) | $ | (4.12 | ) | ||||
26
Net
Sales:
Our net
sales for the year ended December 31, 2009 increased 7.9% to $239.5 million
compared with $221.9 million for 2008. The increase was due primarily
to an increase in case shipment volume of 6.4% and higher prices due to the
carryover effect of increases in 2008. The higher pricing was
partially offset by higher trade promotion spending and coupon redemption
costs. The increase in case shipment volume came from the expansion
of the Company’s milk products into selected markets in the Northeast, growth in
the spreads category, and the introduction of sour cream in the second half of
the year. This increase was partially offset by declines in the
cheese category, including the discontinuance of cream cheese. Our
net sales for the year ended December 31, 2008 were $221.9 million, which was
our first full year of operations. Net sales in 2008 reflected three
price increases for our spreads products due to rapidly rising commodity
costs. For the year ended December 31, 2007 our net sales were $111.0
million, which only included sales made after the GFA acquisition in
May.
Cost
of Goods Sold:
The cost
of goods sold for the year ended December 31, 2009 was $124.0 million compared
with $126.9 million in 2008. Increases in case shipment volume
was more than offset by lower input costs as commodity prices returned to more
normal levels compared with historic highs in 2008. The cost of goods
sold for the year ended December 31, 2008 was $126.9 million compared with $58.7
million for the year ended December 31, 2007, which only included cost of goods
sold made after the GFA acquisition in May.
Gross
Profit:
Gross
profit for the year ended December 31, 2009 increased 21.6% to $115.5 million
compared with $95.0 million in 2008. The increase in gross
profit was due to higher prices, increased case shipment volume and lower input
costs, partially offset by higher trade promotion spending and coupon redemption
costs. Gross profit for the year ended December 31, 2008 was $95.0
million compared with $52.3 million for the year ended December 31, 2007, which
only included gross profit after the GFA acquisition in May. Gross
profit as a percentage of net sales, was 48.2% in 2009 compared to 42.8% in
2008, and 47.1% in 2007. Significantly higher commodity costs and the
lag in the impact of our price increases in 2008 accounted for the decline in
gross profit percentage which was more than recovered in 2009 as pricing impacts
caught up and commodity costs returned to more normal levels in
2009.
Operating
Expenses:
Operating
expenses, which includes selling, marketing and general and administrative
expenses, were $103.7 million for the year ended December 31, 2009, compared
with $89.3 million in 2008 and $63.8 million in 2007. Operating
expenses in 2007 included GFA expenses since the acquisition in May and also
included $18.5 million in costs associated with the release from escrow of the
founders’ shares. Operating expenses increased $14.4 million in 2009
versus 2008 due to primarily to increased headcount and related costs to support
future growth and higher marketing expenses to increase awareness and trial of
our products. Excluding the costs associated with the founders’
shares release in 2007, operating expenses increased $44.0 million in 2008
versus 2007 primarily due to having a full year of GFA expenses, increased
headcount and related costs and higher marketing expenses. Included
in operating expenses was stock-based compensation expense, as determined under
authoritative accounting guidance for “share-based payments,” of
approximately $16.1 million for 2009, $14.9 million for 2008 and $6.7 million
for 2007. Also included in operating expenses were depreciation and
amortization expenses of $6.7 million in 2009, $6.3 million in 2008, and $4.0
million in 2007.
Operating
Income (Loss):
We had
operating income of $11.8 million in 2009 compared to $5.7 million in 2008 and a
loss of $11.5 million in 2007. The loss in 2007 included $18.5
million in costs associated with the founders’ shares
release. Operating income increased $6.1 million in 2009 versus 2008
due to the $20.5 increase in gross profit partially offset by the $14.4 million
increase in operating expenses. Operating income increased $17.1
million in 2008 versus 2007. Excluding the costs associated with the
founders’ shares release in 2007, operating income decreased $1.3 million in
2008 versus 2007 due primarily to having a full year of GFA operations, a lower
gross profit as a percent of sales due to commodity cost increases, and
increases in operating expenses.
27
Other
Income (Expense):
We had
other expenses of $7.0 million in 2009 compared with $16.2 million in 2008 and
$53.8 million in 2007. Included in the 2009 other expenses was $3.7
million of net interest expense, $1.0 of derivative losses related to the
Company’s interest rate swap, and $1.5 million related to our debt refinancing
in the fourth quarter, which included the write-off of $1.4 million of
unamortized financing costs. Included in other expenses in 2008 was
net interest expense of $8.8 million and $5.1 million of derivative losses
related to the Company’s interest rate swap. Included in other
expenses for 2007 was a $45.6 million non-cash loss from derivative liabilities
related to the Company’s warrants and net interest expense of $7.2
million.
Income
(Loss) before Income Taxes:
Our
income before income taxes was $4.8 million in 2009 compared with a loss of
$10.5 million in 2008 and a loss of $65.2 million in 2007.
Income
Taxes:
The
provision for income taxes for the year ended December 31, 2009 was $1.3 million
or 28.1% of pre-tax income, and included the one-time benefit of a state tax
resolution. The provision for income taxes for the year ended
December 31, 2008 was a benefit of $3.6 million or 33.8% of pre-tax
loss. The provision for income taxes for the year ended December 31,
2007 was a benefit of $0.7 million. The provision or benefit for
income taxes is based on taxable income, which excludes the losses for
derivatives related to our warrants in 2007 and the expenses related to
performance based founders’ shares released from escrow in 2007, which were not
deductible for tax purposes.
Net
Income (Loss):
Our net
income for the year ended December 31, 2009 was $3.5 million compared to a net
loss of $6.9 million in 2008 and a net loss of $64.5 million in
2007.
Net
Income (Loss) Available to Common Shares:
Our net
income available to common shares in 2009 was $3.5 million or $0.06 per share
compared with net loss of $6.9 million or $(0.11) per share in
2008. Our net loss available to common shares in 2007 was $101.7
million, which included a charge of $37.2 million for the accrual of dividends
on Series A convertible preferred stock. On January 3,
2008, we forced the conversion of our Series A convertible preferred stock into
common shares. Under the terms of the Series A convertible preferred
stock, on conversion, the holders of such shares were entitled to at least three
years of dividends compounded quarterly, which were payable in additional
shares. Accordingly, we accrued the value of these shares to be
distributed as the dividend earned at December 31, 2007. For both
basic and diluted shares, our loss per common shares for 2007 was
($4.12).
Smart
Balance –
Non-GAAP
Financial Measures
The
Company reports its financial results in accordance with accounting principles
generally accepted in the United States ("GAAP").
The
Company uses the term “cash operating income” as an important measure of
profitability and performance. Cash operating income is a non-GAAP
measure defined as operating income excluding stock based compensation,
depreciation, and amortization of intangibles. Our management uses
cash operating income for planning purposes, and we believe this measure
provides investors and securities analysts with important supplemental
information regarding the Company’s profitability and operating
performance. However, non-GAAP financial measures such as cash operating
income should be viewed in addition to, and not as an alternative for, the
Company's results prepared in accordance with GAAP. In addition, the
non-GAAP measures the Company uses may differ from non-GAAP measures used by
other companies. We have included reconciliations of cash operating income
to operating income as calculated in accordance with GAAP.
28
|
(in millions)
|
March
31,
2009
|
June
30,
2009
|
September
30,
2009
|
December
31,
2009
|
Full
Year
2009
|
|||||||||||||||
|
Operating
income
|
$ | 3.2 | $ | 2.5 | $ | 3.5 | $ | 2.6 | $ | 11.8 | ||||||||||
|
Add
back:
|
||||||||||||||||||||
|
Depreciation
and amortization of intangibles
|
1.2 | 1.2 | 1.2 | 1.3 | 4.9 | |||||||||||||||
|
Stock
option expense
|
4.0 | 4.0 | 4.1 | 4.0 | 16.1 | |||||||||||||||
|
Cash
Operating Income
|
$ | 8.4 | $ | 7.7 | $ | 8.8 | $ | 7.9 | $ | 32.8 | ||||||||||
|
March
31,
2008
|
June
30,
2008
|
September
30,
2008
|
December
31,
2008
|
Full
Year
2008
|
||||||||||||||||
|
Operating
income
|
$ | 2.0 | $ | (0.5 | ) | $ | 2.6 | $ | 1.6 | $ | 5.7 | |||||||||
|
Add
back:
|
||||||||||||||||||||
|
Depreciation
and amortization of intangibles
|
1.1 | 1.1 | 1.1 | 1.2 | 4.5 | |||||||||||||||
|
Stock
option expense
|
3.5 | 3.7 | 3.7 | 4.0 | 14.9 | |||||||||||||||
|
Cash
Operating Income
|
$ | 6.6 | $ | 4.3 | $ | 7.4 | $ | 6.8 | $ | 25.1 | ||||||||||
Smart
Balance – Cash Flows
Year
Ended December 31, 2009 Compared to the Year Ended December 31, 2008 and the
Year Ended December 31, 2008 Compared to the Year Ended December 31,
2007
Cash
provided by operating activities in 2009 was $18.2 million compared with $19.1
million in 2008. The $0.9 million decrease was primarily due to the
$5.1 million decrease in derivative liabilities from the pay down of the
interest rate swap and slightly higher working capital, partially offset by
higher net income of $3.5 million.
Cash
provided by operating activities in 2008 was $19.1 million compared to $0.7
million in 2007. This increase was largely due to lower working
capital and a full year of operations in 2008, after deducting non-cash charges
for stock based compensation of $14.9 million and derivative liabilities of $5.1
million.
Cash
provided by operating activities was $0.7 million for the year ended December
31, 2007. For the year ended December 31, 2007, we had a loss of
$64.5 million, which included non-cash charges for derivative losses of $45.5
million, $6.7 million for stock based compensation expenses and $18.5 million
for performance based founders’ shares released from escrow. Higher
working capital needs in 2007 largely offset the benefit of these non-cash
charges including depreciation and deferred income taxes.
In 2009,
cash used for investing activities was $1.1 million, primarily for software
development costs and the purchase of equipment. Cash used for
investing activities of $2.6 million in 2008 was also mainly for software
development costs and the purchase of equipment. Cash used in
investing activities totaled $388.1 million during the year ended December 31,
2007, which was primarily from our acquisition of GFA of $486.2 million less the
decrease of cash held in trust of $101.1 million.
Cash used
in financing activities was $15.1 million in 2009 primarily for the repayment of
debt of $73.5 million, partially offset by new financing of $60.6
million. Cash used for financing activities was $48.7 million in 2008
primarily for the repayment of debt of $50.0 million related to the acquisition
of GFA. Cash provided by financing activities was $424.4 million for
the year ended December 31, 2007. Cash provided by financing
activities in 2007 included the proceeds from the issuance of our common and
preferred stock of $107.5 million and $138.5 million, respectively, and the
issuance of debt of $160.0 million, all of which was issued in conjunction with
our acquisition of GFA. In addition, in December 2007, we received
$76.5 million from the exercise of public warrants, of which approximately $40
million was used to repay debt.
29
GFA
– Results of Operations
|
(in millions)
|
January 1 to
|
|||
|
May 20, 2007
|
||||
|
Net
Sales
|
$
|
72.4
|
||
|
Cost
of Goods Sold
|
32.7
|
|||
|
Gross
Profit
|
39.7
|
|||
|
Operating
Expenses
|
48.7
|
|||
|
Operating
(Loss)
|
(9.0
|
)
|
||
|
Other
(Expenses)
|
(0.4
|
)
|
||
|
(Loss)
before Income Taxes
|
(9.4
|
)
|
||
|
(Benefit)
for Income Tax
|
(3.8
|
)
|
||
|
Net
(Loss)
|
$
|
(5.6
|
)
|
|
Results
of Operations for the Period From January 1, 2007 to May 20, 2007
Net
revenue for the period from January 1, 2007 to May 20, 2007 was $72.4 million
while cost of goods sold for the period was $32.7 million resulting in a gross
profit as a percentage of revenues of 54.8%. Selling, general
and administrative expenses (SG&A) were $48.7 million for the period from
January 1, 2007 to May 20, 2007 and 67.2% as a percent of net
revenue. This percentage was due entirely to the inclusion of a bonus
accrual of approximately $21.8 million as part of the pending merger with
Boulder Specialty Brands, Inc. on May 21, 2007. Excluding this amount, SG&A
as a percentage of net revenue was 37.2%. Interest expense, which also includes
amortization of deferred financing costs, was $1.0 million for the
period. The $9.4 million loss before taxes, resulting tax benefit of
$3.8 million and net loss of $5.6 million for the period primarily reflect the
impact of the bonus accrual.
Liquidity
and Capital Resources
Liquidity:
Our
liquidity planning is largely dependent on our operating cash flows, which is
highly sensitive to changes in demand and, to a lesser extent, pricing, for our
major products. While changes in key operating costs, such as outsourced
production, advertising, promotion and distribution, may adversely affect cash
flows, we generate significant cash flows as demand for our products grows. Our
principal liquidity requirements are to finance current operations, pay down
existing indebtedness and fund future expansion. Under our new credit
agreement the Company can also repurchase common stock subject to a
determination of its excess cash flow as defined in that agreement. In December,
the Board approved the repurchase of up to $25 million of shares over a two year
period. Currently, our primary source of liquidity is cash generated
by operations.
We
believe that cash flows generated from operations, existing cash and cash
equivalents, and borrowing capacity under the revolving credit facility should
be sufficient to finance working capital requirements for our business for the
next twelve months. As of December 31, 2009, $43.4 million was
available for borrowing under our revolving credit facility and we had $7.5
million of cash. Developing and bringing to market other new brands
and business opportunities may require additional outside funding, which may
require us to seek out additional financing arrangements.
30
Secured
Debt Financing:
On November 4, 2009, the Company,
through its wholly-owned subsidiary GFA Brands, Inc. (the “Borrower”), entered
into a Credit Agreement (the “Credit Agreement”) with the various Lenders named
therein (the “Lenders”), and Bank of Montreal, as Administrative Agent (the
“Agent”). The Credit Agreement provides for $100 million in secured
debt financing consisting of a $55 million term loan (the “Term Loan”) and
a $45 million revolving credit facility (the “Revolver”). The
Revolver includes a $5 million sublimit for the issuance of letters of credit
and a $5 million sublimit for swing line loans. Subject to certain
conditions, the Borrower, at its option, may increase the Term Loan or increase the commitments under the Revolver (or a combination
of the two) up to an aggregate additional amount of $5 million. Such
increase may be provided by existing Lenders, or to the extent they decline to
do so, by adding additional Lenders.
The
Credit Agreement replaced the Company’s prior first lien and second lien credit
(the “Prior Facilities”). As of September 30, 2009, outstanding debt
under the Prior Facilities totaled approximately $65 million. Proceeds of the Credit Agreement were used
to repay the debt outstanding under the Prior Facilities and may also be used
for general corporate purposes and general working capital
purposes.
The Term
Loan and the loans made pursuant to the Revolver will mature on November 3,
2013. The Credit Agreement requires annual principal payments on the
Term Loan of $5.5 million.
Loans
outstanding under the Credit Agreement will bear interest, at the Borrower’s
option, at either a base rate (defined in the Credit Agreement as the greatest
of (i) 2.5%, (ii) the Agent’s prime rate, (iii) the federal funds rate plus
0.50% and (iv) a reserve adjusted one-month LIBOR rate plus 1.0%) or a
Eurodollar rate (of no less than 1.5%), in each case plus an applicable
margin. The applicable margin is determined under the Credit
Agreement based on the ratio of the Company’s total funded debt to EBITDA for
the prior four fiscal quarters (the “Leverage Ratio”), and may range from 2.25%
to 3.25%, in the case of base rate loans, and 3.25% to 4.25%, in the case of
Eurodollar rate loans. The Borrower must also pay a commitment fee on
the unused portion of the Revolver; the fee ranges from 0.50% to
0.75% depending on the Company’s Leverage Ratio.
Subject
to certain conditions, the Borrower may voluntarily prepay the loans under the
Credit Agreement in whole or in part, without premium or penalty (other than
customary breakage costs). Mandatory prepayments that are required
under the Credit Agreement include:
|
·
|
100%
of the net cash proceeds (as defined in the Credit Agreement) upon certain
dispositions of property or upon certain damages or seizures of property,
subject to limited exceptions;
|
|
·
|
50%
of all net cash proceeds from issuance of additional equity securities of
the Company, subject to limited exceptions, provided, however, if the
Company’s Leverage Ratio is less than 2.0 as of the end of the most
recently ended quarter, the prepayment is limited to 25% of such
proceeds;
|
|
·
|
100%
of the net cash proceeds from certain issuances of additional indebtedness
for borrowed money; and
|
|
·
|
Beginning
on December 31, 2010 and each fiscal year thereafter, an annual prepayment
equal to 25% of excess cash flow of the Company (as defined in the Credit
Agreement) for such fiscal year, provided however that such prepayment is
not required if the Company’s Leverage Ratio is less than 2.0x, measured
as of the end of such fiscal year.
|
The
Credit Agreement covenants include, among others: a limitation on the incurrence
of additional indebtedness; a limitation on mergers, acquisitions, investments
and dividend payments; and maintenance of specified financial
ratios. Under the Credit Agreement, the Company must maintain (1) a
Leverage Ratio that is not greater than 2.75 to 1.0 until December 30, 2011 and
not greater than 2.50 to 1.0 thereafter and (2) a ratio of EBITDA to Debt
Service (as defined in the Credit Agreement), in each case for the prior four
fiscal quarters, of not less than 2.00 to 1.00. The Company is also
limited to spending not more than $6 million of capital expenditures per year
with any unspent funds carried over to the next twelve months. At December 31,
2009, the Company was in compliance with all of its debt
covenants.
31
The
failure to satisfy covenants under the Credit Agreement or the occurrence of
other specified events that constitute an event of default could result in the
acceleration of the repayment obligations of the Borrower. The Credit
Agreement contains customary provisions relating to events of default for
agreements of this type. The events of default include, among others: the
nonpayment of any outstanding principal, interest, fees or other amounts due
under the Credit Agreement; certain bankruptcy events; judgments or
decrees against the Company or the Borrower; cross defaults to other
indebtedness exceeding $5.0 million; a change in control (as defined in the
Credit Agreement) of the Company or the Borrower; and the failure to perform or
observe covenants in the Credit Agreement.
The
obligations under the Credit Agreement are guaranteed by the Company and all
existing and future subsidiaries of the Borrower. The Borrower, the
Company and the other guarantors granted to the Agent, for the benefit of the
Lenders, a security interest in substantially all of their respective assets,
including, among other things, patents, patent licenses, trademarks and
trademark licenses.
After the
close of the transaction, total debt outstanding under the Credit Agreement
totaled approximately $60.6 million comprised of $55 million of Term Loan debt
and $5.6 million of borrowings under the Revolver. During December,
the Company repaid $4 million of the Revolver.
Long term
debt as of December 31, 2009 is as follows:
|
Term
loan
|
$ | 55,000 | ||
|
Revolver
|
1,643 | |||
|
Total
debt
|
56,643 | |||
|
Less:
Current maturities
|
(5,500 | ) | ||
|
Total
long term debt
|
$ | 51,143 |
The
interest rate from inception of the loan agreement through year end was
5.25%
Contractual
Obligations
The
following table summarizes contractual obligations and borrowings as of
December 31, 2009 and the timing and effect that such commitments are
expected to have on our liquidity and capital requirements in future
periods. We expect to fund other commitments primarily with operating
cash flows generated in the normal course of business.
Contractual
Obligations (in thousands)
|
Total
|
Due in Less
Than 1 Year
|
Due in
1-3 Years
|
Due in
3-5 Years
|
Due in More
Than 5 Years
|
||||||||||||||||
|
Building
Leases(1)
|
$ | 3,243 | $ | 703 | $ | 1,345 | $ | 1,004 | $ | 191 | ||||||||||
|
Oil
and Peanuts Purchase Commitments(2)
|
17,345 | 17,345 | — | — | — | |||||||||||||||
|
Debt
Obligations(3)
|
56,643 | 5,500 | 11,000 | 40,143 | — | |||||||||||||||
|
Brandeis
Contract
|
700,000 | 200,000 | 200,000 | 100,000 | 200,000 | |||||||||||||||
| $ | 777,231 | $ | 223,548 | $ | 212,345 | $ | 141,147 | $ | 200,191 | |||||||||||
_______________________________
(1) Includes: (i) a lease
agreement for the lease of a corporate office facility located in Paramus, NJ
with an approximate seven year life with the option to extend the lease for two
additional five year terms, and (ii) three lease agreements for the lease of a
corporate office facility located in Niwot, Colorado with an approximate five
year life with the option to extend each lease for 36 months. Rental
expense for operating leases for 2009 was $698 and for the years 2010 through
2014 is shown above.
32
(2)
Forward purchase commitments for a portion of the Company’s projected
requirement for peanuts and for palm, soy and canola oil. These
commitments may be stated at a firm price, or as a discount or premium from a
future commodity market price. Based on the most recent prices the
Company realized, these commitments would total approximately $17.3 million as
of December 31, 2009. The commitments are expected to be liquidated
by September 30, 2010.
(3)
For more information on our debt obligations, see the section entitled
“Secured Debt Financing” located elsewhere in this report.
Off
Balance Sheet Arrangements
We do not
have off-balance sheet arrangements, financings, or other relationships with
unconsolidated entities or other persons.
We
contract for significant amounts of soy, palm and canola oil products to support
the needs of our brands. The price and availability of these commodities
directly impacts our results of operations and can be expected to impact our
future results of operations. In addition, we contract for the manufacture of
our products with several contract manufacturers. Two contract manufacturers
produce nearly all of our Smart Balance® buttery
spreads products. Each of those manufacturers produce approximately
one-half of the total production and one uses multiple facilities to service the
required volume. We are dependent on these manufacturers for the
necessary production capacity in order for us to meet our customer
demands.
Seasonality
and Quarterly Results
Our business is
subject to seasonal fluctuations. Historically, significant portions
of net revenue and profits were, and may continue to be, realized
during the fourth quarter of our fiscal year, reflecting the holiday baking and
cooking season in which several of our products are utilized. In
addition, there are increased sales of these products during the Easter holiday
season. Because of the seasonality of our business, results for any
quarter are not necessarily indicative of the results that may be achieved for
the full fiscal year.
Impact
of Inflation
In general, we believe that, over time,
we are able to increase prices to counteract the majority of the inflationary
effects of increasing costs.
Critical
Accounting Policies
Our
consolidated financial statements are prepared in accordance with accounting
principles generally accepted in the United States, which require management to
make estimates, judgments and assumptions that affect the amounts reported in
the consolidated financial statements and accompanying notes. We
discuss below what we believe to be our most critical accounting policies and
estimates. While our estimates and assumptions are based on our
knowledge of current events and actions we may undertake in the future, actual
results may ultimately differ from these estimates and
assumptions. For a discussion of the Company’s significant
accounting policies, please see Note 1 of the notes to our consolidated audited
financial statements.
Revenue
Recognition
Revenue
is recognized when the earnings process is complete and the risks and rewards of
ownership have transferred to the customer, which is generally considered to
have occurred upon the receipt of product by the customer. The earnings process
is complete once the customer order has been placed and approved and the shipped
product has been received by the customer. Product is sold to customers on
credit terms established on an individual basis. The credit factors used include
historical performance, current economic conditions and the nature and volume of
the product. The Company offers its customers a variety of sales and incentive
programs, including discounts, allowances, coupons, slotting fees, and co-op
advertising; such amounts are estimated and recorded as a reduction in revenue.
The Company sells its products to customers without a right of return, is not
obligated to accept any returns, and has historically not accepted
returns.
33
Goodwill
Goodwill
is tested annually for impairment or more frequently if events or changes in
circumstances indicate that impairment may have occurred. The impairment
analysis for goodwill included a comparison of our carrying value (including
goodwill) to our estimated fair value. If the fair value does not exceed its
carrying value, then an additional analysis is performed to allocate the fair
value to all assets and liabilities as if it had been acquired in a business
combination and the fair value was its purchase price. If the excess of the fair
value of our identifiable assets and liabilities is less than the carrying value
of recorded goodwill, an impairment charge is recorded for the
difference. We completed our impairment analysis at June 30, 2009 and
determined that the estimated fair value was greater than the carrying value of
the recorded goodwill. At December 31, 2009, management reviewed the
Company’s fair value and obtained an independent valuation of our “control
premium” (or acquisition premium) which when added to our market capitalization
at December 31, 2009 exceeded our book value by 17%. The Company also performed
several discounted cash flow analyses which also supported our position that the
Company does not have any indications of impairment, and thus, we have not
recorded an impairment of goodwill. However, if the Company does not achieve its
growth targets, as contemplated, the Company may need to record an impairment
charge in the future. The review at December 31, 2009 was required
because during the second half of 2009 the Company’s market capitalization
periodically fell below its carrying value.
Other
Intangibles
Other
intangibles are comprised of both definite and indefinite life intangible assets
which are not amortized but are tested annually for impairment, or more
frequently if events or changes in circumstances indicate that the asset might
be impaired. As of December 31, 2009 the Company has determined that there is
not an impairment of these indefinite lived intangible assets. In
assessing the recoverability of indefinite life intangible assets, we make
assumptions about our estimated future cash flows and other factors to determine
the fair value of these assets. However, if the Company does not
achieve its growth targets as contemplated, the Company may need to record an
impairment charge in the future.
An
intangible asset is determined to have an indefinite useful life when there are
no legal, regulatory, contractual, competitive, and economic or any other
factors that may limit the period over which the asset is expected to contribute
directly or indirectly to our future cash flows. In each reporting period, we
also evaluate the remaining useful life of an intangible asset that is not being
amortized to determine whether events and circumstances continue to support an
indefinite useful life. If an intangible asset that is not being amortized is
determined to have a finite useful life, the asset will be amortized
prospectively over the estimated remaining useful life and accounted for in the
same manner as intangible assets subject to amortization.
We have
determined that our Smart Balance® and
Earth Balance®
trademarks have an indefinite life and these assets are not being amortized. We
believe that these trademarks, collectively, will contribute indefinitely to the
cash flows of the Company. Certain
other assets acquired, primarily patent technology, have been determined to have
definite lives ranging from 10 to 20 years and their costs are being amortized
over their expected lives.
We
generally expense legal and related costs incurred in defending or protecting
our intellectual property unless we can demonstrate that such costs added
economic value to the business enterprise in which case the Company will
capitalize such costs as part of intangible assets. The primary consideration in
making this determination is whether or not we can legally demonstrate that the
Company has been successful in defending itself against such intellectual
property challenges. The second consideration for capitalization is whether such
costs have, in fact, increased the economic value of our intellectual property.
Legal defense costs which do not meet the above criteria will be expensed as
incurred. Recovery of legal defense costs as part of a settlement agreement will
be recorded as a reduction of capitalized legal costs with any excess recorded
in income.
34
Long-Lived
Assets
The
Company reviews its long-lived assets for impairment whenever events or changes
in circumstances indicate that the carrying amount of the asset may not be
recovered. The Company looks primarily to the undiscounted future cash
flows in its assessment of whether or not long-lived assets have been
impaired.
Income
Taxes
Deferred
income taxes are provided for the differences between the basis of assets and
liabilities for financial reporting and income tax purposes.
Interest
Rate Swaps
We have
used interest rate swaps to cover exposure to changes in interest
rates. We recognize changes in the fair value of interest rate swaps
in earnings in the period when the change occurs.
Forward
Purchase Commitments
We enter
into forward purchase commitments with respect to projected commodity
requirements needed to produce our finished goods. These commitments
are stated at a firm price, or as a discount or premium from a future commodity
price and are placed with our manufacturers.
Acquisitions
We have
accounted for the GFA acquisition using the purchase method of
accounting. Under the purchase method, our consolidated financial
statements reflect the operations of GFA starting from the date of the
acquisition, May 21, 2007. In addition, the assets acquired and
liabilities assumed were recorded at the date of acquisition at their respective
estimated fair values, with any excess of the purchase price over the estimated
fair values of the net assets acquired recorded as goodwill.
Significant
judgment is required in estimating the fair value of intangible assets and in
assigning their respective useful lives. Accordingly, we obtained the
assistance of third-party valuation specialists for significant
terms. The fair value estimates are based on available historical
information and on future expectations and assumptions deemed reasonable by
management, but are inherently uncertain.
We
typically use an income method to estimate the fair value of intangible assets,
which is based on forecasts of the expected future cash flows attributable to
the respective assets. Significant estimates and assumptions inherent
in the valuations reflect a consideration of other marketplace participants, and
include the amount and timing of future cash flows (including expected growth
rates and profitability), the underlying product life cycles, economic barriers
to entry, a brand’s relative market position and the discount rate applied to
the cash flows. Unanticipated market or macroeconomic events and
circumstances may occur, which could affect the accuracy or validity of the
estimates and assumptions.
Share-Based
Compensation Expense
In
conjunction with the acquisition of GFA on May 21, 2007, we adopted appropriate
accounting authoritative guidance regarding “share-based payment,” which
requires the measurement and recognition of compensation expense for all
share-based payment awards made to employees and directors including employee
stock options based on estimated fair values. For 2009, employee
share-based compensation expense was $16.1 million.
In June
2009, the, Financial Accounting Standards Board (“FASB”) issued Statement of
Financial Accounting Standards (“SFAS”) No. 168, “The FASB Accounting Standards
Codification™ and the Hierarchy of Generally Accepted Accounting Principles – a
replacement of FASB Statement No. 162” (“SFAS 168”). The FASB Accounting
Standards Codification™ (“Codification” or “ASC”) became the source of
authoritative GAAP recognized by the FASB to be applied by nongovernmental
entities. Rules and interpretive releases of the SEC under authority of federal
securities laws are also sources of authoritative GAAP for SEC registrants. On
the effective date of SFAS 168, the Codification superseded all then-existing
non-SEC accounting and reporting standards. All other non-grandfathered non-SEC
accounting literature not included in the Codification became
non-authoritative.
35
Following
SFAS 168, the FASB will no longer issue new standards in the form of Statements,
FASB Staff Positions, or Emerging Issues Task Force Abstracts; instead, it will
issue Accounting Standards Updates (ASUs). The FASB will not consider ASCs as
authoritative in their own right; rather, these updates will serve only to
update the Codification, provide background information about the guidance, and
provide the bases for conclusions on the change(s) in the Codification. SFAS No.
168 is incorporated in ASC Topic 105, “Generally Accepted Accounting
Principles.” The Company adopted SFAS No. 168 for the quarter ended
September 30, 2009, and the Company will provide reference to both the
Codification topic reference and the previously authoritative references related
to Codification topics and subtopics, as appropriate.
In
May 2009, the FASB issued ASC Topic 855, Subsequent Events (ASC 855)
(formerly SFAS No. 165, Subsequent Events) which
establishes general standards for the evaluation, recognition and disclosure of
events and transactions that occur after the balance sheet date. Although there
is new terminology, the standard is based on the same principles as those that
currently exist in the auditing standards. The standard, which includes a new
required disclosure of the date through which management has evaluated
subsequent events, is effective for interim and annual periods ending after June
15, 2009. The adoption of ASC 855 had no effect on the Company’s financial
statements.
Effective
October 1, 2008, the Company adopted certain aspects of ASC Topic 825, Financial Instruments
(formerly SFAS 159, “The Fair Value Option for Financial Assets & Financial
Liabilities – including an amendment of SFAS No. 115.”). The
accounting guidance created a fair value option under which an entity may
irrevocably elect fair value as the initial and subsequent measurement attribute
for certain financial assets and liabilities on a contract by contract basis,
with changes in fair values recognized in earnings as these changes occur. The
adoption of ASC Topic 825 had no significant impact on the Company’s financial
condition or results of operations.
In
December 2007, the FASB issued ASC Topic 805, Business Combinations (ASC
805) (formerly SFAS 141R, “Business Combinations”). ASC Topic
805 changes how a reporting enterprise will account for the acquisition of a
business. ASC 805 will apply prospectively to business combinations with an
acquisition date on or after November 1, 2009. The adoption of ASC
Topic 805 is not expected to have a material impact on the Company’s
financial condition or results of operations, however future acquisitions would
be accounted for under the guidance.
We are
exposed to financial market risks due primarily to changes in interest rates on
our variable interest rate debt. Our previous loan agreement required
us to hedge through the use of an interest rate swap. This swap was
paid off on November 4, 2009. This swap converted a portion of our
variable interest rate into a fixed rate. We did not designate this
as a hedge for financial reporting purposes. Under our new loan
agreement, we also are subject to changes in interest rates, but are not
required to enter into an interest rate swap until the market LIBOR rate exceeds
1.5%. The three-month LIBOR rate at December 31, 2009 was
0.25%.
We
purchase significant amounts of soy, palm and canola oil products to support the
needs of our brands. The price and availability of these commodities directly
impacts our results of operations and can be expected to impact our future
results of operations. We do not engage in any hedging activities because we
enter into agreements that qualify as normal purchases and sales in the normal
course of business. Accordingly, the agreements do not qualify as
derivatives under existing authoritative accounting guidance, namely,
“Accounting for Derivative Instruments and Hedging Activities.” Based
on the most recent prices for soy, palm and canola oil products, as of December
31, 2009 we had commitments of $17.3 million.
36
We are
exposed to market risk from changes in interest rates charged on our debt. The
impact on earnings is subject to change as a result of movements in market
rates. A hypothetical increase in interest rates of 100 basis points would
result in potential reduction of future pre-tax earnings of approximately $0.1
million per year for every $10.0 million outstanding under our first lien credit
facility and approximately $0.1 million per year under our second lien credit
facility. Our ability to meet our debt service obligations will be
dependent upon our future performance which, in turn, is subject to future
economic conditions and to financial, business and other factors.
Item
8. Consolidated
Financial Statements and Supplementary Data
The
consolidated financial statements and supplementary data are listed in Part IV,
Item 15(a).
Item
9. Changes
in and Disagreements with Accountants on Accounting and Financial
Disclosure
None.
Item
9A. Controls and Procedures
Conclusion regarding the
effectiveness of disclosure controls and procedures. Our management, with
the participation of our Chief Executive Officer and Principal Financial and
Accounting Officers, evaluated the effectiveness of our disclosure controls and
procedures (as defined in Rules 13a-15(e) and 15d-15(e) under the Exchange
Act) as of December 31, 2009. Disclosure controls and procedures include,
without limitation, controls and procedures designed to ensure that information
required to be disclosed by the Company in the reports that we file or submit
under the Exchange Act is accumulated and communicated to our management,
including our Principal Executive Officer and Principal Financial Officer, as
appropriate to allow timely decisions regarding required disclosure. Management
recognizes that any controls and procedures, no matter how well designed and
operated, can provide only reasonable assurance of achieving their objectives
and management necessarily applies its judgment in evaluating the cost-benefit
relationship of possible controls and procedures. Based on management’s
evaluation of our disclosure controls and procedures as of December 31, 2009,
our Chief Executive Officer and Principal Financial Officer concluded that, as
of such date, our disclosure controls and procedures were
effective.
Internal control
over financial reporting. Our management is responsible for
establishing and maintaining adequate internal control over financial reporting,
as such term is defined in Exchange Act Rules 13a-15(f). Under the
supervision and with the participation of our management, including our chief
executive officer, chief operating officer and chief financial officer, we
conducted an evaluation of the effectiveness of our internal control over
financial reporting. Based on our evaluation, our management concluded that our
internal control over financial reporting was effective as of December 31,
2009.
Ehrhardt
Keefe Steiner & Hottman PC, an independent registered public accounting
firm, has audited the consolidated financial statements included in this annual
report on Form 10-K and, as part of their audit, has issued a report, included
herein, on the effectiveness of our internal control over financial
reporting.
Our
system of internal control over financial reporting was designed to provide
reasonable assurance regarding the preparation and fair presentation of
published financial statements in accordance with accounting principles
generally accepted in the United States. All internal control systems, no matter
how well designed, have inherent limitations. Therefore, even those systems
determined to be effective can provide only reasonable assurance and may not
prevent or detect misstatements. Also, projections of any evaluation of
effectiveness to future periods are subject to the risk that controls may become
inadequate because of changes in conditions, or that the degree of compliance
with the policies or procedures may deteriorate.
Changes
in Internal Control Over Financial Reporting
During
the fiscal quarter ended December 31, 2009, there was no change in our
internal control over financial reporting that has materially affected, or is
reasonably likely to materially affect, our internal control over financial
reporting.
37
Item
9B. Other
Information
On
January 21, 2010, the Company held a special meeting of its stockholders. The
special meeting was held in order to vote on the following matters:
Proposal 1: To
approve the proposed Second Amended and Restated Smart Balance, Inc. Stock and
Awards Plan, which has been revised to include provisions designed to make the
awards of stock options and performance-based restricted stock granted in the
future under the plan constitute “qualified performance-based compensation”
within the meaning of Section 162(m) of the Internal Revenue Code of 1986, as
amended (the “Code”). The votes on this proposal were cast as
follows:
|
For:
|
51,718,962 | |||
|
Against:
|
4,568,974 | |||
|
Abstain:
|
571,202 | |||
|
Broker
Non-Votes
|
0 |
Therefore,
in accordance with the voting results listed above, Proposal 1 was approved by
the stockholders of the Company.
Proposal 2: To
approve the stock option awards previously granted to the Company’s chief
executive officer, chief financial officer, two other executive officers and
four other officers under the Amended and Restated Smart Balance, Inc. Stock and
Awards Plan and the Amended and Restated Smart Balance, Inc. Inducement Award
Plan so that awards constitute “qualified performance-based compensation” within
the meaning of Section 162(m) of the Code. The votes on this proposal
were cast as follows:
|
For:
|
51,536,458 | |||
|
Against:
|
4,030,148 | |||
|
Abstain:
|
1,292,531 | |||
|
Broker
Non-Votes
|
0 |
Therefore,
in accordance with the voting results listed above, Proposal 2 was approved by
the stockholders of the Company.
38
PART
III
Item
10. Directors,
Executive Officers and Corporate Governance
Executive
Officers and Directors
Certain
information regarding our directors and executive officers is provided
below:
|
Name
|
Title
|
|
|
Stephen B. Hughes
|
Chairman
of the Board, Chief Executive Officer and Director
|
|
|
Robert S. Gluck
|
Vice
Chairman, Chief Operating Officer and Director
|
|
|
Alan
S. Gever
|
Executive
Vice President and Chief Financial Officer
|
|
|
John
F. Konzelmann
|
Vice
President, Controller and Principal Accounting Officer
|
|
|
Robert
J. Gillespie
|
Director
|
|
|
William
E. Hooper
|
Director
|
|
|
Gerald
J. Laber
|
Director
|
|
|
James
B. Leighton
|
Director
|
|
|
James
E. Lewis
|
Director
|
|
|
Robert
F. McCarthy
|
Director
|
|
|
Michael
R. O’Brien
|
Director
|
Stephen
B. Hughes, 54, has been our chairman of the board, chief executive
officer and a director since our inception in May 2005. Mr. Hughes served as the
sole officer and director of Hughes Consulting, Inc. from 2004 to
2007. From 2004 to 2007, Mr. Hughes served as a director of The
Cambridge Group, a leading demand strategy consulting firm headquartered in
Chicago, Illinois. While with Cambridge, Mr. Hughes led or participated in
securing new marketing strategy engagements with a number of major consumer
packaged goods companies. From 2002 to 2004, Mr. Hughes served first as vice
president of sales and then as the senior vice president of marketing and sales
for White Wave Foods Company, a division of Dean Foods Company. In June 2004,
Mr. Hughes was also named senior vice president of marketing and research and
development for Dean Foods’ newly formed White Wave division, a $1.1 billion
division with brands including Silk, Horizon, International Delight,
Land-o-Lakes and Marie’s. From 2000 to 2002, he served as chairman of
the board and chief executive officer of Frontier Natural Product, Inc., a
privately held cooperative providing distribution services, organic ingredients
and spices to the natural foods industry. Mr. Hughes holds a Bachelor
of Arts degree in economics and political science from Denison University and an
MBA degree with a concentration in marketing and finance from the University of
Chicago. He also serves on the board of trustees for the Alexander
Dawson School and as a director of B.F. Bolthouse LLC.
Robert
S. Gluck, 59, has been a vice chairman and a member of our board of
directors since November 2005. He served as our chief financial
officer from May 2007 until January 2008, and has served as our chief operating
officer since January 2008. From 2000 to 2004, Mr. Gluck served as
the senior vice president and chief financial officer of Unilever United States,
Inc. Mr. Gluck has also provided consulting services to companies
throughout the food industry through his consulting firm, Matthew Robert
Associates, LLC, where he specialized in strategic planning, financial
operations review, mergers and acquisitions, divestitures, competitive analysis
and peer group benchmarking. In February 2006, Mr. Gluck became the
president of Kristian Regale, a private company engaged in the sparkling juice
business. Mr. Gluck has no active day-to-day management role with
either Matthew Robert Associates, LLC or Kristian Regale. Mr. Gluck
holds a Bachelors degree in marketing from the New York Institute of Technology
and an MBA in finance from St. John’s University. He is a member of the
Financial Executives Institute, the Association for Corporate Growth, the Food
Marketing Institute, and the National Restaurant Association.
39
Alan S. Gever, 55, served as
our vice president of financial planning and analysis until January 7, 2008,
when he was appointed to be our executive vice president and chief financial
officer. Mr. Gever has a broad-based knowledge of the financial,
accounting and administrative functions of a business. While serving
as our vice president of financial planning and analysis, Mr. Gever was
responsible for leading internal planning, financial operations, and investor
relations efforts. Mr. Gever served, from 1992 to 1999, as chief
financial officer and general manager of the Nabisco Refrigerated Foods Group
which sold consumer branded margarine and egg substitute products. In
2000, Mr. Gever founded ShareMax.com, an internet-based provider of strategic
sourcing services to the consumer packaged goods industry. From 2001
to 2003 Mr. Gever served as chief financial officer of the Ultimate Juice
Company which was, at the time, the nation’s largest fresh juice manufacturer
with juice brands such as Naked Juice, Orchid Island, and Ziegler’s along with
Saratoga Spring bottled water. From 2003 to May 2007, Mr. Gever was a
principal of Northpointe Consulting Group LLC providing management consulting
services to startup and small-cap companies primarily in the food and beverage
industry. Mr. Gever received his bachelor’s degree in business
management from Seton Hall University in New Jersey.
John F. Konzelmann, 62, has
been our vice president, controller and principal accounting officer since June
2007. From June 2005 to June 2007, Mr. Konzelmann served as vice
president, controller and chief accounting officer at Alpharma Inc., a $0.7
billion specialty pharmaceutical company with operating activities in more than
6o countries. During his tenure there, he led the financial and
accounting teams in the sale of Alpharma’s global generics business to Actavis
Group for $810 million in December 2005 as well as the sale of the
related generics distribution business for $40 million in March
2006. Before joining Alpharma, Mr. Konzelmann was the assistant
corporate controller for Bestfoods and Unilever US. Mr. Konzelmann
received his B.S. and M.B.A. from Fairleigh Dickinson University. He
is a certified public accountant.
Robert
J. Gillespie, 66, has been a member of our board of directors since
September 2005. Mr. Gillespie is currently the principal of Westmount
Investments, LLC, a privately held investment company. In February
2006, Mr. Gillespie joined the board of directors of Kristian Regale, a private
company engaged in the sparkling juice business. Mr. Gillespie also serves on
the board of directors of SRV Bank and the Delbarton School. He
formerly served on the boards of directors of Best Foods, FM Global Insurance
Company, Advanced H2O Inc., Tiger 21, The Valley Hospital, Dominex, LLC and CSC
Consumer Products, and he is the former chairman of the Sarah W. Stedman Center
for Nutritional Studies at Duke University. Mr. Gillespie holds a
Bachelors degree in Science from St. Mary’s University of Halifax,
Canada; a Bachelors degree in mechanical engineering from Dalhousie
University of Halifax, Canada; and a Master of Science degree in
industrial administration from Purdue University.
William
E. Hooper, 72, has been a member of our board of directors since June
2005 and has served as our marketing coordinator since May 2007. Mr.
Hooper has been a senior executive in marketing and consumer communication
companies for the past 40 years. As such, Mr. Hooper has had
extensive experience in developing consumer marketing and advertising programs
for major national consumer food companies. Mr. Hooper was an
executive for 26 years, from 1964 to 1990, including serving as President and a
director of WB Donor, one of the largest national independent advertising
agencies in the United States. Mr. Hooper was principal of Hooper
Consulting LLC, a marketing and communications consultancy working with large
national advertisers and marketing companies heavily directed to the consumer
food business, from 1990 to 2000. Clients included Florida Department
of Citrus, Tropicana, ConAgra, Mead Johnson, Nabisco, Celestial Seasonings, and
White Wave Foods. From 2000 to September 2005, Mr. Hooper
served as chairman of Trahan, Burden & Charles Inc., or TBC, a mid-sized
national advertising agency headquartered in New York and Baltimore that
provides creative, public relations, media planning and buying, and direct
marketing services to a broad spectrum of corporate customers. Among
TBC’s clientele was Dow Jones & Company, Nextel Communications, Vanguard
Securities, Yellow Book Directories, Gaylord Hotels, The Mills Corporation, the
National Security Agency and Blue Cross and Blue Shield. Mr. Hooper
holds a B.S. degree in business administration from Loyola College of Maryland
and has served on the board of trustees of the Loyola College of Maryland, the
National Aquarium and the St. Joseph’s Medical Center in
Baltimore. He was also a member of the U.S. Army Reserve Military
Police Corp. from 1958 to 1966.
40
Gerald
J. ‘‘Bud’’ Laber, 66, has been a member of our board of directors since
June 2005. Mr. Laber has been a private investor since 2000, when he
retired after 33 years of service with Arthur Andersen. Mr. Laber was
a partner with Arthur Andersen from 1980 to 2000 and, with the exception of a
leave for military service from 1966 through 1968, was employed by Arthur
Andersen from 1965 until retiring in 2000. Mr. Laber is a certified
public accountant and is a member of the American Institute of Certified Public
Accountants and the Colorado Society of Certified Public
Accountants. Mr. Laber holds the National Association of Corporate
Directors Certificate of Corporate Education. Currently, Mr. Laber
is: (i) on the board of directors and chair of the audit committee of Scott’s
Liquid Gold since February 2004 and (ii) president of The Catholic Foundation of
Northern Colorado since January 2008. Formerly, Mr. Laber (i) served
as a member of the board of directors and chair of the audit committee of
Healthetech, Inc. from July 2003 to May 2006; (ii) served on the board of
directors and as chair of the audit committee of Spectralink Corporation from
April 2004 to March 2007; and (iii) served on the board of directors and audit
committee of Applied Films Corporation from July 2004 to July 2007 (chair from
October 2005 to July 2007). Each of these companies is, or was,
publicly traded. Mr. Laber holds a B.S.B.A. degree with a major in
accountancy from the University of South Dakota, and is a member of the board of
a charitable organization with offices in the metropolitan Denver, Colorado area
and is a member of the board of trustees of the University of South Dakota
Foundation.
James
B. Leighton, 53, has been a member of our board of directors since August
2007. From 2006 to 2009, Mr. Leighton served as the senior vice
president of operations and supply chain and is currently president of
foodservice and international businesses of Perdue Farms Incorporated, a large,
privately-held poultry company. From 2002 to 2006, Mr Leighton served
as the senior vice president of operations of Conagra Foods, Inc., one of the
largest food companies in the United States. Mr. Leighton holds a
B.S.B.A. degree in business administration and industrial relations from the
University of Iowa and a Masters degree in Business Administration from Keller
Graduate School of Management. Mr. Leighton serves on the non-profit
Foundation and Corporation Boards for Atlantic General Hospital.
James
E. Lewis, 60, has been a director of Smart Balance since inception in May
2005 and served as our vice chairman until May 14, 2007. Since 1991,
Mr. Lewis has served as chairman and chief executive of Jeltex Holdings,
LLC. Currently, Mr. Lewis is the sole officer and director of
Jeltex. The Jeltex group has been comprised of significant or
controlling ownership stakes acquired, held and sold for Mr. Lewis’ personal
account in a vertically integrated group of private food businesses engaged in
vegetable farming, fresh produce distribution, manufacture of canned foods and
retail grocery distribution. Today, Mr. Lewis and his spouse hold a
controlling interest in Centennial Specialty Foods Corporation, a public company
engaged in the manufacture and marketing of specialty branded, quality ethnic
Southwestern canned sauces and food products. Mr. Lewis is a
certified public accountant and is a member of the American Institute of
Certified Public Accountants and the Colorado Society of Certified Public
Accountants. He holds a BBA degree in accounting from Texas Tech
University.
Robert
F. McCarthy, 59, has been a member of our board of directors since June
2005. Since 2004, Mr. McCarthy has been active in advising several consumer
packaged goods companies and managing his personal investments. From
1998 to 2004, Mr. McCarthy co-led the roll-up of the consumer packaged goods
food sales agency business that resulted in the creation of a national agency,
Acosta Sales and Marketing Company. From 1998 to 2004, Mr. McCarthy
served as president of the Acosta Grocery Channel, the grocery division of
Acosta Sales and Marketing. Mr. McCarthy holds a BBA degree in
marketing from the University of Notre Dame and a Master of Management degree
from the Kellogg School of Business at Northwestern University.
41
Michael
R. O’Brien, 65, was a member of our board of directors from June 2005 to
November 2005 and was a senior advisor to us until August 2007, when he was
appointed to our board of directors. Mr. O’Brien co-founded Catalina Marketing
Corporation, a direct marketing company, in 1983, and served as Catalina’s
president until 1989 and as its chairman of the board and chief executive
officer until 1992. Since 1992, Mr. O’Brien has been chairman emeritus of, and a
consultant to, Catalina. Catalina was founded to develop and
distribute behavior-based communications for consumer packaged goods and
pharmaceutical products manufacturers, marketers and retailers. Currently, Mr.
O’Brien serves on Catalina’s board of directors. Mr. O’Brien has
previously served on the boards of directors of MemberWorks and Imagitas,
Inc. MemberWorks designs and markets innovative membership programs
that offer members access to significant savings at national brand name service
providers and merchants, while membership organizations receive royalties in
exchange for providing MemberWorks with members. Imagitas is a
targeted direct mail marketing company serving Federal and state governmental
agencies such as the U.S. Postal Service and corporate clients such as Home
Depot and Ford. Imagitas was sold to Pitney Bowes Inc. in 2005. Mr.
O’Brien attended the University of Kansas from 1961 − 1965.
The
Company has adopted a code of business conduct and ethics applicable to the
Company’s officers (including the Company’s principal executive officer and
principal financial officer) and employees, known as the Code of Business
Conduct and Ethics. The Code of Business Conduct and Ethics is
available on the Company’s website. In the event that we amend or
waive any of the provisions of the code of business conduct and ethics
applicable to our principal executive officer or principal financial officer
that relates to any element of the code of ethics definition enumerated in Item
406(b) of Regulation S-K, we intend to disclose the same on the Company’s
website at www.smartbalance.com.
Other
information concerning directors, executive officers and corporate governance is
incorporated by reference pursuant to Instruction G of Form 10-K from our
definitive proxy statement for the 2010 annual meeting of shareholders to be
filed with the Commission pursuant to Regulation 14A on or before April 30,
2010.
Item
11. Executive
Compensation
Information
concerning executive compensation is incorporated by reference pursuant to
Instruction G of Form 10-K from our definitive proxy statement for the 2010
annual meeting of shareholders to be filed with the Commission pursuant to
Regulation 14A on or before April 30, 2010.
|
|
Security
Ownership of Certain Beneficial Owners and Management and Related
Stockholder Matters
|
Item
13. Certain Relationships
and Related Transactions, and Director Independence
Information
concerning certain relationships and related transactions is incorporated by
reference pursuant to Instruction G of Form 10-K from our definitive proxy
statement for the 2010 annual meeting of shareholders to be filed with the
Commission pursuant to Regulation 14A on or before April 30, 2010.
Item
14. Principal Accounting
Fees and Services
Information
concerning principal accountant fees and services is incorporated by reference
pursuant to Instruction G of Form 10-K from our definitive proxy statement for
the 2010 annual meeting of shareholders to be filed with the Commission pursuant
to Regulation 14A on or before April 30, 2010.
42
PART
IV
Item
15. Exhibits; Financial
Statement Schedules
(a) Financial
Statements and Financial Statement Schedules. Smart Balance’s 2009
financial statements, together with the report of Ehrhardt Keefe
Steiner & Hottman PC, are listed on the index preceding the financial
statements at the end of this report. The schedules for which
provision is made in the applicable accounting regulations of the SEC are not
required under the related instructions or are inapplicable and, therefore, have
been omitted.
(b) Exhibits.
|
Exhibit
No.
|
Description
|
|
|
3.1
|
Restated
Certificate of Incorporation of Smart Balance, Inc. (1)
|
|
|
3.2
|
Bylaws
of Smart Balance, Inc. (f/k/a Boulder Specialty Brands, Inc.)
(2)
|
|
|
4
|
Specimen
Common Stock Certificate of Smart Balance, Inc. (3)
|
|
|
10.1
|
Credit
Agreement, dated as of November 4, 2009, by and among GFA Brands, Inc., as
borrower, Smart Balance, Inc., as parent, the Guarantors from time to time
parties thereto, the Lenders from time to time parties thereto,
and Bank of Montreal, as administrative agent (4)
|
|
|
10.2
|
Letter
of Understanding by and between GFA Brands, Inc. and Kagome Creative
Foods, Inc., dated as of March 5, 2010.
|
|
|
10.3
|
License
Agreement, dated as of June 18, 1996, by and between Brandeis University
and GFA Brands, Inc. (5)
|
|
|
10.4
|
Manufacturing
Agreement for Margarine and Spreads, dated March 2, 2007 by and between
GFA Brands, Inc. and Ventura Foods, LLC (6)
|
|
|
10.5
|
Second
Amended and Restated Stock and Award Plan *
|
|
|
10.6
|
Form
of Stock Option Award Agreement (7)*
|
|
|
10.7
|
Amended
Form of Stock Option Agreement (8)*
|
|
|
10.8
|
Form
of Change of Control Agreement (9)*
|
|
|
10.9
|
Financial
Performance Incentive Program *
|
|
|
18
|
Preferability
Letter from Independent Public Accountants (10)
|
|
|
21
|
Subsidiaries
|
|
|
23
|
Consent
of Ehrhardt Keefe Steiner & Hottman PC
|
|
|
31.1
|
Certification
of Principal Executive Officer Pursuant to Exchange Act Rules 13a-14(a)
and 15d-14(a), as adopted pursuant to Section 302 of the Sarbanes-Oxley
Act of 2002
|
|
|
31.2
|
Certification
of Principal Financial Officer Pursuant to Exchange Act Rules 13a-14(a)
and 15d-14(a), as adopted pursuant to Section 302 of the Sarbanes-Oxley
Act of 2002
|
|
|
32.1
|
Certification
of Principal Executive Officer Pursuant to 18 U.S.C. Section 1350, as
adopted pursuant to Section 906 of the Sarbanes-Oxley Act of
2002
|
|
|
32.2
|
Certification
of Principal Financial Officer Pursuant to 18 U.S.C. Section 1350, as
adopted pursuant to Section 906 of the Sarbanes-Oxley Act of
2002
|
43
|
1
|
Incorporated
by reference to Exhibit 4.1 to our current report on Form 8-K, filed with
the SEC on May 25, 2007.
|
|
2
|
Incorporated
by reference to Exhibit 3.2 to our registration statement on Form S-1
filed with the SEC on July 1, 2005 (File
No. 333-126364).
|
|
3
|
Incorporated
by reference to Exhibit 4.1 to Amendment No. 1 to our registration
statement on Form S-1 filed with the SEC on August 26,
2005.
|
|
4
|
Incorporated
by reference to Exhibit 10.1 to our current report on Form 8-K filed with
the SEC on November 6, 2009.
|
|
5
|
Incorporated
by reference to Exhibit 10.45 to our current report on Form 8-K filed with
the SEC on May 25, 2007.
|
|
6
|
Incorporated
by reference to Exhibit 10.46 to our current report on Form 8-K filed with
the SEC on May 25, 2007.
|
|
7
|
Incorporated
by reference to Exhibit 10.47 to our current report on Form 8-K filed with
the SEC on May 25, 2007.
|
|
8
|
Incorporated
by reference to Exhibit 10.1 to our current report on Form 8-K filed with
the SEC on November 6, 2008.
|
|
9
|
Incorporated
by reference to Exhibit 10.2 to our current report on Form 8-K filed with
the SEC on November 6, 2008.
|
|
10
|
Incorporated
by reference to Exhibit 18 to our quarterly report on Form 10-Q filed with
the SEC on May 9, 2008.
|
* Management
remuneration agreements.
_________________
In
reviewing the agreements included as exhibit to this report, please remember
that they are included to provide you with information regarding their terms and
are not intended to provide any other factual or disclosure information about
the Company or the other parties to the agreements. Some of the
agreements may contain representations and warranties by the parties to the
applicable agreement. To the extent that any agreement contains
representations and warranties, such representations and warranties have been
made solely for the benefit of the other parties to the applicable
contract.
Moreover,
any representations and warranties in the agreements attached to this report as
exhibits (1) should not in all instances be treated as categorical statements of
fact, but rather as a way of allocating the risk to one of the parties if those
statements prove to be inaccurate, (2) may have been qualified by disclosures
that were made to the other party in connection with the negotiation of the
applicable agreement, which disclosures are not necessarily reflected in the
agreement, (3) may apply standards of materiality in a way that is different
from what may be viewed as material to you or other investors, and (4) were made
only as of the date of the applicable agreement or such other date or dates as
may be specified in the agreement and are subject to more recent
developments. Accordingly, these representations and warranties may
not describe the actual state of affairs as of the date they were made or at any
other time.
44
SIGNATURES
Pursuant
to the requirements of Section 13 or 15(d) of the Securities Exchange Act
of 1934, the registrant has duly caused this report to be signed on its behalf
by the undersigned thereunto duly authorized on this 10th day of
March, 2010.
|
SMART
BALANCE, INC.
|
|
|
By:
|
/s/ Stephen B. Hughes
|
|
Stephen
B. Hughes
|
|
|
Chairman
and Chief Executive Officer
|
|
Pursuant
to the requirements of the Securities Exchange Act of 1934, this report has been
signed below by the following persons on behalf of the registrant, and in the
capacities and on the date indicated.
|
Name
|
Title
|
Date
|
||
|
/s/Stephen
B. Hughes
|
Chairman
and Chief Executive Officer,
|
March
10, 2010
|
||
|
Stephen
B. Hughes
|
Director
(Principal Executive Officer)
|
|||
|
/s/
Robert S. Gluck
|
Vice
Chairman and Chief Operating
|
March
10, 2010
|
||
|
Robert
S. Gluck
|
Officer,
Director
|
|||
|
/s/
Alan S. Gever
|
Executive
Vice President and Chief
|
March
10, 2010
|
||
|
Alan
S. Gever
|
Financial
Officer (Principal Financial Officer)
|
|||
|
/s/
John F. Konzelmann
|
Vice
President, Controller and
|
March
10, 2010
|
||
|
John
F. Konzelmann
|
Chief
Accounting Officer (Principal Accounting Officer)
|
|||
|
/s/ Robert
J. Gillespie
|
Director
|
March
10, 2010
|
||
|
Robert
J. Gillespie
|
||||
|
/s/
William E. Hooper
|
Director
|
March
10, 2010
|
||
|
William
E. Hooper
|
||||
|
/s/
Gerald J. Laber
|
Director
|
March
10, 2010
|
||
|
Gerald
J. Laber
|
||||
|
/s/
James B. Leighton
|
Director
|
March
10, 2010
|
||
|
James
B. Leighton
|
||||
|
/s/ James
E. Lewis
|
Director
|
March
10, 2010
|
||
|
James
E. Lewis
|
||||
|
/s/
Robert F. McCarthy
|
Director
|
March
10, 2010
|
||
|
Robert
F. McCarthy
|
||||
|
/s/
Michael R. O’Brien
|
Director
|
March
10, 2010
|
||
|
Michael
R. O’Brien
|
45
|
Page
|
||||
|
Report
of Independent Registered Public Accounting Firm
|
F-2 | |||
|
Consolidated
Balance Sheets as of December 31, 2009 and 2008
|
F-3 | |||
|
Consolidated
Statement of Operations for the years ended December 31, 2009, 2008 and
2007
|
F-4 | |||
|
Consolidated
Statement of Cash Flows for the years ended December 31, 2009, 2008 and
2007
|
F-5 | |||
|
Statement
of Changes in Stockholders’ Equity for the years ended December 31, 2009,
2008 and 2007
|
F-7 | |||
|
Notes
to Consolidated Financial Statements
|
F-8 | |||
F-1
The Board
of Directors and Stockholders
Smart
Balance, Inc:
We have
audited the accompanying consolidated balance sheets of Smart Balance, Inc and
subsidiary as of December 31, 2009 and 2008, and the related consolidated
statements of operations, changes in stockholders’ equity and cash flows for
each of the three years in the period ended December 31, 2009.
We also have audited the Company’s internal control over financial reporting
based on criteria established in Internal Control-Integrated
Framework issued by the Committee of Sponsoring Organizations of the
Treadway Commission (the “COSO Criteria”). The Company’s management is
responsible for these financial statements, for maintaining effective internal
control over financial reporting, and for its assessment of the effectiveness of
internal control over financial reporting included in the accompanying
management’s report. Our responsibility is to express an opinion on these
financial statements and the effectiveness of the Company’s internal control
over financial reporting based on our audits.
We
conducted our audits in accordance with the standards of the Public Company
Accounting Oversight Board (United States). Those standards require that
we plan and perform the audits to obtain reasonable assurance about whether the
financial statements are free of material misstatement and whether effective
internal control over financial reporting was maintained in all material
respects. Our audit of the financial statements included examining, on a
test basis, evidence supporting the amounts and disclosures in the financial
statements, assessing the accounting principles used and significant estimates
made by management, and evaluating the overall financial statement
presentation. Our audit of internal control included obtaining an
understanding of internal control over financial reporting, assessing the risk
that a material weakness exists, testing and evaluating the design and operating
effectiveness of internal control based on the assessed risk, and performing
such other procedures as we considered necessary in the circumstances. We
believe that our audits provide a reasonable basis for our
opinions.
A
company’s internal control over financial reporting is a process designed to
provide reasonable assurance regarding the reliability of financial reporting
and the preparation of financial statements for external purposes in accordance
with generally accepted accounting principles. A company’s internal
control over financial reporting includes those policies and procedures that
(1) pertain to the maintenance of records that, in reasonable detail,
accurately and fairly reflect the transactions and dispositions of the assets of
the company; (2) provide reasonable assurance that transactions are
recorded as necessary to permit preparation of financial statements in
accordance with generally accepted accounting principles, and that receipts and
expenditures of the company are being made only in accordance with
authorizations of management and directors of the company; and (3) provide
reasonable assurance regarding prevention or timely detection of unauthorized
acquisition, use, or disposition of the company’s assets that could have a
material effect on the financial statements.
Because
of its inherent limitations, internal control over financial reporting may not
prevent or detect misstatements. Also, projections of any evaluation of
effectiveness to future periods are subject to the risk that controls may become
inadequate because of changes in conditions, or that the degree of compliance
with the policies or procedures may deteriorate.
In our
opinion, the consolidated financial statements referred to above present fairly,
in all material respects, the financial position of Smart Balance Inc, and
subsidiary as of December 31, 2009 and 2008, and the results of their
operations and their cash flows for each of the three years in the period ended
December 31, 2009 in conformity with accounting principles generally
accepted in the United States of America. Also in our opinion, Smart
Balance Inc, and subsidiary maintained, in all material respects, effective
internal control over financial reporting as of December 31, 2009 based on
the COSO Criteria.
/s/ Ehrhardt
Keefe Steiner & Hottman PC
Denver,
Colorado
March 10,
2010
F-2
SMART
BALANCE, INC. AND SUBSIDIARY
(in
thousands, except share data)
|
December
31,
|
December
31,
|
|||||||
|
2009
|
2008
|
|||||||
|
Assets
|
||||||||
|
Current
assets:
|
||||||||
|
Cash
and cash equivalents
|
$ | 7,538 | $ | 5,492 | ||||
|
Accounts
receivable, net of allowance of: $345 (2009) and $256
(2008)
|
11,970 | 14,283 | ||||||
|
Accounts
receivable - other
|
650 | 692 | ||||||
|
Income
taxes receivable
|
1,131 | – | ||||||
|
Inventories
|
5,812 | 9,322 | ||||||
|
Prepaid
taxes
|
405 | 709 | ||||||
|
Prepaid
expenses and other assets
|
3,392 | 1,019 | ||||||
|
Deferred
tax asset
|
462 | 650 | ||||||
|
Total
current assets
|
31,360 | 32,167 | ||||||
|
Property
and equipment, net
|
4,634 | 4,301 | ||||||
|
Other
assets:
|
||||||||
|
Goodwill
|
374,886 | 374,886 | ||||||
|
Intangible
assets, net
|
151,089 | 155,223 | ||||||
|
Deferred
costs, net
|
2,111 | 1,737 | ||||||
|
Other
assets
|
985 | 222 | ||||||
|
Total
other assets
|
529,071 | 532,068 | ||||||
|
Total
assets
|
$ | 565,065 | $ | 568,536 | ||||
|
Liabilities
and Stockholders' Equity
|
||||||||
|
Current
liabilities
|
||||||||
|
Accounts
payable and accrued expenses
|
$ | 22,626 | $ | 24,938 | ||||
|
Income
taxes payable
|
– | 1,080 | ||||||
|
Current
portion of long term debt
|
5,500 | – | ||||||
|
Total
current liabilities
|
28,126 | 26,018 | ||||||
|
Long
term debt
|
51,143 | 69,504 | ||||||
|
Derivative
liability
|
– | 5,132 | ||||||
|
Deferred
tax liability
|
43,824 | 46,268 | ||||||
|
Other
liabilities
|
965 | 163 | ||||||
|
Total
liabilities
|
124,058 | 147,085 | ||||||
|
Commitment
and contingencies
|
||||||||
|
Stockholders'
equity
|
||||||||
|
Convertible
Preferred stock, $.0001 par value, 50,000,000 shares
authorized;
|
- | - | ||||||
|
Common
stock, $.0001 par value, 250,000,000 shares authorized; 62,630,683 issued
and outstanding
|
6 | 6 | ||||||
|
Additional
paid in capital
|
523,467 | 507,377 | ||||||
|
Retained
deficit
|
(82,466 | ) | (85,932 | ) | ||||
|
Total
stockholders' equity
|
441,007 | 421,451 | ||||||
|
Total
liabilities and stockholders' equity
|
$ | 565,065 | $ | 568,536 | ||||
See
accompanying notes to the consolidated financial statements
F-3
(in
thousands except per share data)
|
Year ended
December 31, 2009
|
Year ended
December 31, 2008
|
Year ended
December 31, 2007
|
||||||||||
|
Net
sales
|
$ | 239,503 | $ | 221,872 | $ | 111,038 | ||||||
|
Cost
of goods sold
|
123,974 | 126,904 | 58,715 | |||||||||
|
Gross
profit
|
115,529 | 94,968 | 52,323 | |||||||||
|
Operating
expenses:
|
||||||||||||
|
Marketing
|
37,383 | 33,034 | 15,118 | |||||||||
|
Selling
|
17,580 | 16,662 | 12,268 | |||||||||
|
General
and administrative
|
48,756 | 39,578 | 17,931 | |||||||||
|
Performance
based shares released from escrow
|
- | - | 18,456 | |||||||||
|
Total
operating expenses
|
103,719 | 89,274 | 63,773 | |||||||||
|
Operating
income (loss)
|
11,810 | 5,694 | (11,450 | ) | ||||||||
|
Other
income (expense):
|
||||||||||||
|
Interest
income
|
3 | 292 | 2,450 | |||||||||
|
Interest
expense
|
(3,653 | ) | (9,049 | ) | (9,678 | ) | ||||||
|
Loss
on derivative liability
|
(1,045 | ) | (5,132 | ) | (45,556 | ) | ||||||
|
Other
expense, net
|
(2,291 | ) | (2,336 | ) | (1,020 | ) | ||||||
|
Total
other income (expense)
|
(6,986 | ) | (16,225 | ) | (53,804 | ) | ||||||
|
Profit
(loss) before income taxes
|
4,824 | (10,531 | ) | (65,254 | ) | |||||||
|
Provision
(benefit) for income taxes
|
1,358 | (3,563 | ) | (706 | ) | |||||||
|
Net
income (loss)
|
$ | 3,466 | $ | (6,968 | ) | $ | (64,548 | ) | ||||
|
Less:
Unpaid dividends on convertible preferred stock
|
$ | - | $ | - | $ | 37,159 | ||||||
|
Net
income (loss) available for common shares
|
$ | 3,466 | $ | (6,968 | ) | $ | (101,707 | ) | ||||
|
Net
income (loss) per share - basic and diluted
|
$ | 0.06 | $ | (0.11 | ) | $ | (4.12 | ) | ||||
|
Weighted
average shares outstanding:
|
||||||||||||
|
Basic
|
62,630,683 | 62,523,742 | 24,667,344 | |||||||||
|
Diluted
|
62,703,434 | 62,523,742 | 24,667,344 | |||||||||
See accompanying notes to the
consolidated financial statements
F-4
SMART
BALANCE, INC. AND SUBSIDIARY
(in
thousands)
|
Year ended
December 31, 2009
|
Year ended
December 31, 2008
|
Year ended
December 31, 2007
|
||||||||||
|
Cash
flows from operating activities
|
||||||||||||
|
Net
income (loss)
|
$ | 3,466 | $ | (6,968 | ) | $ | (64,548 | ) | ||||
|
Adjustments
to reconcile net (loss) to net cash provided by operating
activities:
|
||||||||||||
|
Depreciation
and amortization of intangibles
|
4,905 | 4,497 | 2,558 | |||||||||
|
Amortization
of deferred financing costs
|
1,820 | 1,782 | 1,466 | |||||||||
|
Deferred
income taxes
|
(2,256 | ) | (6,596 | ) | (2,768 | ) | ||||||
|
Stock
based compensation
|
16,090 | 14,896 | 6,689 | |||||||||
|
Performance
based shares released from escrow
|
- | - | 18,456 | |||||||||
|
(Decrease)
increase in derivative liabilities
|
(5,132 | ) | 5,132 | 45,556 | ||||||||
|
Deferred
interest income
|
- | - | (432 | ) | ||||||||
|
Changes
in assets and liabilities:
|
||||||||||||
|
Accounts
receivable
|
2,313 | (2,550 | ) | (620 | ) | |||||||
|
Income
tax receivable
|
(1,131 | ) | - | - | ||||||||
|
Inventories
|
3,510 | (2,120 | ) | (2,417 | ) | |||||||
|
Prepaid
expenses and other current assets
|
(2,027 | ) | 6,353 | (3,072 | ) | |||||||
|
Accounts
payable and accrued expenses
|
(3,354 | ) | 4,642 | (151 | ) | |||||||
|
Net
cash provided by operating activities
|
18,204 | 19,068 | 717 | |||||||||
|
Cash
flows from investing activities
|
||||||||||||
|
Purchase
of GFA
|
- | - | (486,228 | ) | ||||||||
|
Purchase
of property and equipment
|
(1,172 | ) | (2,920 | ) | (1,744 | ) | ||||||
|
Purchase
of intangible assets
|
- | - | (1,152 | ) | ||||||||
|
Capitalization
of legal settlement
|
68 | 350 | - | |||||||||
|
Increase
in cash held in trust
|
- | - | 101,073 | |||||||||
|
Net
cash (used in) investing activities
|
(1,104 | ) | (2,570 | ) | (388,051 | ) | ||||||
|
Cash
flows from financing activities
|
||||||||||||
|
Proceeds
from issuance of long term debt
|
60,643 | - | 160,000 | |||||||||
|
Repayment
of debt
|
(73,504 | ) | (50,000 | ) | (40,496 | ) | ||||||
|
Proceeds
from issuance of common stock
|
- | - | 107,500 | |||||||||
|
Proceeds
from issuance of preferred stock
|
- | - | 138,500 | |||||||||
|
Proceeds
from sale of warrants
|
- | - | 76,515 | |||||||||
|
Payments
for offering and loan costs
|
(2,193 | ) | - | (17,399 | ) | |||||||
|
Repayment
of advances from stockholders
|
- | - | (206 | ) | ||||||||
|
Proceeds
from stock-related legal settlement
|
- | 1,345 | - | |||||||||
|
Net
cash (used in) provided by financing activities
|
(15,054 | ) | (48,655 | ) | 424,414 | |||||||
|
Net
increase (decrease) in cash for the period
|
2,046 | (32,157 | ) | 37,080 | ||||||||
|
Cash
– Beginning of period
|
5,492 | 37,649 | 569 | |||||||||
|
Cash
– End of period
|
$ | 7,538 | $ | 5,492 | $ | 37,649 | ||||||
See
accompanying notes to the consolidated financial statements
F-5
|
Year ended
December 31, 2009
|
Year ended
December 31, 2008
|
Year ended
December 31, 2007
|
||||||||||
|
Supplemental
disclosure of cash flow information:
|
||||||||||||
|
Accrued
dividend on Series A preferred stock
|
$ | - | $ | - | $ | 37,159 | ||||||
|
Cash
paid during the year for:
|
||||||||||||
|
Income
taxes, net of refunds
|
$ | 5,201 | $ | (2,032 | ) | $ | 4,583 | |||||
|
Interest
|
$ | 8,915 | $ | 8,112 | $ | 9,215 |
See
accompanying notes to the consolidated financial statements
F-6
For
the years ended December 31, 2009, 2008 and 2007
(in
thousands except shares)
|
Preferred Stock
|
Common Stock
|
|||||||||||||||||||||||||||
|
Shares
|
Amount
|
Shares
|
Amount
|
Additional
Paid in
Capital
|
Retained
Deficit
|
Stockholders’
Equity
|
||||||||||||||||||||||
|
Balance
at December 31, 2006
|
- | $ | - | 15,951,050 | $ | 2 | $ | 59,741 | $ | (14,416 | ) | $ | 45,327 | |||||||||||||||
|
Issuance
of Series A convertible preferred shares
|
15,388,899 | 138,500 | 138,500 | |||||||||||||||||||||||||
|
Issuance
of common stock
|
14,410,188 | 1 | 107,499 | 107,500 | ||||||||||||||||||||||||
|
Proceeds
from public warrants
|
12,752,625 | 1 | 76,515 | 76,516 | ||||||||||||||||||||||||
|
Stock
compensation expense
|
6,689 | 6,689 | ||||||||||||||||||||||||||
|
Conversion
of common stock held in escrow
|
19,661 | 19,661 | ||||||||||||||||||||||||||
|
Equity
issuance costs
|
(13,763 | ) | (13,763 | ) | ||||||||||||||||||||||||
|
Performance
based shares released from escrow
|
18,456 | 18,456 | ||||||||||||||||||||||||||
|
Reclassification
of derivative liability on warrants to equity
|
77,841 | 77,841 | ||||||||||||||||||||||||||
|
Accrued
dividend on convertible preferred stock
|
37,159 | (37,159 | ) | - | ||||||||||||||||||||||||
|
Net
loss
|
(64,548 | ) | (64,548 | ) | ||||||||||||||||||||||||
|
Balance
at December 31, 2007
|
15,388,899 | 175,659 | 43,113,863 | 4 | 315,480 | (78,964 | ) | 412,179 | ||||||||||||||||||||
|
Conversion
of preferred stock
|
(15,388,899 | ) | (175,659 | ) | 19,516,820 | 2 | 175,657 | - | ||||||||||||||||||||
|
Stock
compensation expense
|
14,896 | 14,896 | ||||||||||||||||||||||||||
|
Legal
settlement, net of tax
|
1,344 | 1,344 | ||||||||||||||||||||||||||
|
Net
loss
|
(6,968 | ) | (6,968 | ) | ||||||||||||||||||||||||
|
Balance
at December 31, 2008
|
- | - | 62,630,683 | 6 | 507,377 | (85,932 | ) | 421,451 | ||||||||||||||||||||
|
Stock
compensation expense
|
16,090 | 16,090 | ||||||||||||||||||||||||||
|
Net
income
|
3,466 | 3,466 | ||||||||||||||||||||||||||
|
Balance
at December 31, 2009
|
- | $ | - | 62,630,683 | $ | 6 | $ | 523,467 | $ | (82,466 | ) | $ | 441,007 | |||||||||||||||
See
accompanying notes to the consolidated financial statements
F-7
SMART
BALANCE, INC. AND SUBSIDIARY
(in
thousands except shares and per share)
|
1.
|
Basis of
presentation
|
The
consolidated financial statements included herein reflect the acquisition of GFA
Brands, Inc. (“GFA”) on May 21, 2007, with results of operations included from
that date and the estimated fair value of the net assets of GFA included on May
21, 2007. Prior to May 21, 2007, Smart Balance, Inc. (the” Company”)
was a blank check company with no operating activities, whose sole purpose was
to serve as a vehicle for an acquisition in the consumer foods or beverage
industry.
Certain
amounts have been reclassified to conform with the current year
presentation.
|
2.
|
Summary of Significant
Accounting Policies
|
Cash
and cash equivalents
The
Company considers all highly liquid investments with original maturities of
three months or less to be cash equivalents. At December 31, 2009 and
2008, the Company did not have any cash equivalents.
Accounts
receivable
Accounts
receivable are carried at original invoice amount less allowances for cash
discounts and doubtful receivables based on a review of all outstanding amounts.
Management determines the allowance for doubtful accounts by regularly
evaluating individual customer receivables and considering a customer’s
financial condition, credit history and current economic conditions. Accounts
receivable are written off when deemed uncollectible. Bad debt expense was not
material to the Company for the years ended December 31, 2009 and
2008. Recoveries of receivables previously written off are recorded
when received. The Company does not charge interest on past due
receivables.
Inventories
Inventories
are stated at the lower of cost (first-in, first-out) or market and consist
primarily of finished goods.
Property
and equipment
Property
and equipment are stated at cost and depreciated using the straight-line method
over the estimated useful lives of the assets ranging from 5 to 10 years.
Leasehold improvements are amortized using the straight-line method over the
shorter of the lease term or the estimated useful life of the
improvement. The Company continually evaluates whether events and
circumstances have occurred that indicate the remaining estimated useful life of
long-lived assets may warrant revision, or that the remaining balance of these
assets may not be recoverable. When deemed necessary, the Company
completes this evaluation by comparing the carrying amount of the assets against
the estimated undiscounted future cash flows associated with them. If such
evaluations indicate that the future undiscounted cash flows of amortizable
long-lived assets are not sufficient to recover the carrying value of such
assets, the assets are adjusted to their estimated fair
values.
F-8
Goodwill
Goodwill
is tested annually for impairment or more frequently if events or changes in
circumstances indicate that impairment may have occurred. The impairment
analysis for goodwill included a comparison of our carrying value (including
goodwill) to our estimated fair value. If the fair value does not exceed its
carrying value, then an additional analysis is performed to allocate the fair
value to all assets and liabilities as if it had been acquired in a business
combination and the fair value was its purchase price. If the excess of the fair
value of our identifiable assets and liabilities is less than the carrying value
of recorded goodwill, an impairment charge is recorded for the
difference. We completed our impairment analysis at June 30, 2009
with estimated fair value greater than the carrying value of the recorded
goodwill. At December 31, 2009, management reviewed the Company’s
fair value including obtaining an independent valuation of our ‘control premium”
(or acquisition premium) which when added to our market capitalization at
December 31, 2009 exceeded our book value by 17%. The Company also performed
several discounted cash flow analyses which also supported our position that the
Company does not have any indications of impairment, and thus, we have not
recorded an impairment of goodwill. However, if the Company does not achieve its
growth targets, as contemplated, there may be an impairment charge in the
future. The review at December 31, 2009 was required because during the second
half of 2009 the Company’s market capitalization was below book value at
December 31, 2009 and subsequently as well.
Intangible
assets
Other
intangibles are comprised of both definite and indefinite life intangible
assets. Indefinite life intangible assets are not amortized but are tested
annually for impairment, or more frequently if events or changes in
circumstances indicate that the asset might be impaired. In assessing the
recoverability of indefinite life intangible assets, the Company must make
assumptions about the estimated future cash flows and other factors to determine
the fair value of these assets.
An
intangible asset is determined to have an indefinite useful life when there are
no legal, regulatory, contractual, competitive, economic or any other factors
that may limit the period over which the asset is expected to contribute
directly or indirectly to the future cash flows of the Company. In each
reporting period, the Company also evaluates the remaining useful life of an
intangible asset that is not being amortized to determine whether events and
circumstances continue to support an indefinite useful life. If an intangible
asset that is not being amortized is determined to have a finite useful life,
the asset will be amortized prospectively over the estimated remaining useful
life and accounted for in the same manner as intangible assets subject to
amortization.
The
Company has determined that its Smart Balance® and
Earth Balance®
trademarks have an indefinite life and accordingly these assets are not being
amortized. Certain other assets acquired, primarily patent
technology, have been determined to have definite lives ranging from 10 to 20
years and their costs are being amortized over their expected
lives.
The
Company generally expenses legal and related costs incurred in defending or
protecting its intellectual property unless it can be established that such
costs have added economic value to the business enterprise, in which case the
Company capitalizes the costs incurred as part of intangible
assets. The primary consideration in making the determination of
whether to capitalize the costs is whether the Company can prove that it has
been successful in defending itself against such intellectual property
challenges. The second consideration for capitalization is whether
such costs have, in fact, increased the economic value of the Company’s
intellectual property. Legal defense costs that do not meet the
considerations described above will be expensed as incurred. Recovery
of legal expenses as part of a settlement agreement will be recorded as a
reduction of capitalized legal fees with any excess recorded as
income.
Shipping
and handling costs
Shipping
and handling costs to external customers for 2009, 2008 and from May 21, 2007
(inception) to December 31, 2007 was approximately $13,000, $12,773 and $7,051
respectively, and was included in selling expense. On a pro forma
basis, shipping and handling cost for the year ended December 31, 2007 was
$11,198.
Deferred
compensation plan
The
Company implemented a deferred compensation plan, effective January 1, 2008,
which is funded by whole life insurance in which employees participants elect to
defer a certain portion of their base salary and or bonus. The participant's
cash deferrals earn a return based on the participant's investment in several
investment options.
F-9
During
2009, the plan assets were less than the liability by $0.1 million due to
slightly lower returns on plan assets and the up-front cost of life insurance
and thus compensation expense was increased by this amount. The total of
participant deferrals, which is reflected in long-term employee related
liabilities and other, was $1.0 million and $0.2 million at
December 31, 2009 and 2008, respectively.
Deferred
costs
Deferred
loan costs associated with the secured debt financing are being amortized over
the life of the debt, using the effective interest method.
Revenue
recognition
Revenue
is recognized when the earnings process is complete and the risks and rewards of
ownership have transferred to the customer, which is generally considered to
have occurred upon the receipt of product by the customer. The earnings process
is complete once the customer order has been placed and approved and the product
shipped has been received by the customer. Product is sold to customers on
credit terms established on an individual basis. The credit factors used include
historical performance, current economic conditions and the nature and volume of
the product. The Company offers its customers a variety of sales and incentive
programs, including discounts, allowances, coupons, slotting fees, and co-op
advertising; such amounts are estimated and recorded as a reduction in revenue.
The Company sells their products to customers without the right of return and is
not obligated to accept any returns, and has historically not accepted
returns. For interim reporting, the Company estimates certain annual
sales incentives and marketing costs for most programs and records a pro rata
share in proportion to forecasted annual revenue. The difference
between the actual costs incurred to date and the amount deferred is shown as a
prepaid asset.
Earnings
(loss) per share of common stock
Basic
earnings (loss) per share is computed by dividing net income or loss applicable
to common stockholders by the weighted-average shares of common stock
outstanding for the period. Diluted earnings (loss) per share is
computed by dividing net income (loss) by the weighted-average shares
outstanding adjusted for any additional common shares that would have been
outstanding if all of the potential dilutive common shares had been
issued. Potential dilutive common shares outstanding would include
primarily stock options and founders’ warrants. The following table
summarizes stock options not included in the computation of diluted
EPS:
|
Year
Ended December 31,
|
||||||||
|
2009
|
2008
|
|||||||
|
Stock
options excluded due to option price being greater than market
value
|
11,881,000 | 11,327,000 | ||||||
|
Stock
options excluded due to anti-dilution
|
370,530 | 717,500 | ||||||
|
Founding
director warrants excluded due to anti-dilution
|
-0- | 1,000,000 | ||||||
Segments
Authoritative
accounting guidance requires segment information to be prepared and presented
using the “management” approach. The management approach is based on
the method that management organizes the segments within the Company for making
operating decisions and assessing performance. The Company evaluates
all products, makes operating decisions and performance assessments based on a
total company approach and therefore considers itself as having only one
segment. The Company’s buttery spreads business, marketed under Smart Balance®, Earth Balance®, SmartBeat® and Nucoa®,
is by far the most developed product segment and accounted for approximately 75%
of 2009 sales.
F-10
Fair
value of financial instruments
The
Company’s financial instruments consist of cash and cash equivalents, short term
trade receivables, payables and note payables. The carrying value of
cash and cash equivalents and short term receivables and payables approximate
fair value because of their short maturities. The Company’s
note payable is determined by quoted market prices that are reset every three
months and, therefore, approximates fair value. At December 31, 2008,
the Company used the income approach to determine the fair value of its interest
rate swap utilizing present value techniques and recorded $5,132 as a
non-current liability with an increase to interest expense. The fair value
measurement used to determine this amount was based on authoritative accounting
guidance for “Fair Value Measurements”, which requires a three-tier fair value
hierarchy that prioritizes inputs to measure fair value. These tiers include:
Level 1, defined as inputs, such as unadjusted quoted prices in an active market
for identical assets or liabilities; Level 2, defined as inputs other than
quoted market prices in active markets that are either directly or indirectly
observable; or Level 3, defined as unobservable inputs for use when little or no
market value exists therefore requiring an entity to develop its own
assumptions.
Research
and development
Research
and development expenses are charged to the Consolidated Statement of Operations
when incurred and amounted to $928 for 2009, $256 for 2008 and $64 from May 21,
2007 (inception) to December 31, 2007. On a pro forma basis, research
and development expenses for the year ended December 31, 2007 was
$94.
Derivative
Instruments
The
primary risks managed by derivative instruments are exposure to changes
in interest rate. The Company accounts for its derivative instruments in
accordance with authoritative accounting guidance for Accounting for Derivative
Instruments and Hedging Activities, which requires the recognition of all
derivative instruments as either assets or liabilities in the Consolidated
Balance Sheet at fair value.
On the
date on which the Company enters into a derivative, it must determine whether or
not to designate the derivative as a hedge.
Income
taxes
Deferred
income taxes are provided for the differences between the basis of assets and
liabilities for financial reporting and income tax purposes. A valuation
allowance is established when necessary to reduce deferred tax assets to the
amount expected to be realized. As of December 31, 2009, there was a small
valuation allowance recorded for state tax purposes. For the year
ended December 31, 2009, the effective tax rate was lower than the statutory
rate because of a one-time benefit from a state tax resolution. For
the years ended December 31, 2008 and 2007, the effective tax rate was higher
than the statutory tax rate primarily due to the effect of the change in
derivative liabilities since such losses are not deductible for income tax
purposes.
The
Company records a liability for all tax positions if it is not “more likely than
not” that the position is sustainable based on its technical
merits.
Advertising
Advertising
costs are charged to operations (selling, general and administrative expenses)
when incurred and amounted to $20,098 for 2009, $21,519 for 2008 and $12,063 for
the period from May 21, 2007 (inception) to December 31, 2007. The
Company expenses the cost of production for commercials where the commercial is
first run. As of December 31, 2009, $2,067 was recorded as prepaid as
these commercials had not yet run. On a pro forma basis, advertising
costs for the year ended December 31, 2007 was $22,010.
F-11
Share-Based
Compensation Expense
In
conjunction with the acquisition of GFA on May 21, 2007, we adopted appropriate
accounting authoritative guidance regarding “share-based payment,” which
requires the measurement and recognition of compensation expense for all
share-based payment awards made to employees and directors including employee
stock options based on estimated fair values. For 2009, employee
share-based compensation expense was $16.1 million.
Use
of estimates
The
preparation of financial statements in conformity with accounting principles
generally accepted in the United States requires management to make estimates
and assumptions that affect the reported amounts of assets and liabilities and
disclosure of contingent assets and liabilities at the date of the financial
statements and the reported amounts of revenue and expenses during the reporting
period. Actual results could differ from those estimates.
Concentration
of credit risk
Financial
instruments which potentially subject the Company to concentrations of credit
risk consist principally of cash, cash equivalents, short term investments and
trade receivables. The Company maintains the majority of its cash and
cash equivalents in the form of demand deposits with financial institutions that
management believes are creditworthy. At December 31, 2009, the cash
balances in these institutions exceeded federally insured
amounts. Concentrations of credit risk relative to trade receivables
are limited due to our diverse client base. The Company does have one
customer that accounted for approximately 19% of sales for 2009. The
aggregate accounts receivable from this customer amounted to approximately 18%
of the accounts receivable balance outstanding at December 31,
2009. The Company also has one product category, “spreads” which
accounts for 75% of total revenue and 73% of its revenues came from a license
from Brandeis University, which will expire in April, 2015.
Recently
issued accounting pronouncements
Recently
Issued Accounting Standards
In June
2009, the, Financial Accounting Standards Board (“FASB”) issued Statement of
Financial Accounting Standards (“SFAS”) No. 168, “The FASB Accounting Standards
Codification™ and the Hierarchy of Generally Accepted Accounting Principles – a
replacement of FASB Statement No. 162” (“SFAS 168”). The FASB Accounting
Standards Codification™, (“Codification” or “ASC”) became the source of
authoritative GAAP recognized by the FASB to be applied by nongovernmental
entities. Rules and interpretive releases of the SEC under authority of federal
securities laws are also sources of authoritative GAAP for SEC registrants. On
the effective date of SFAS 168, the Codification superseded all then-existing
non-SEC accounting and reporting standards. All other non-grandfathered non-SEC
accounting literature not included in the Codification became
non-authoritative.
Following
SFAS 168, the FASB will no longer issue new standards in the form of Statements,
FASB Staff Positions, or Emerging Issues Task Force Abstracts; instead, it will
issue Accounting Standards Updates (ASUs). The FASB will not consider ASCs as
authoritative in their own right; rather, these updates will serve only to
update the Codification, provide background information about the guidance, and
provide the bases for conclusions on the change(s) in the Codification. SFAS No.
168 is incorporated in ASC Topic 105, Generally Accepted Accounting
Principles. The Company adopted SFAS No. 168 for the fiscal year-ended
September 30, 2009, and the Company will provide reference to both the
Codification topic reference and the previously authoritative references related
to Codification topics and subtopics, as appropriate.
In
May 2009, the FASB issued ASC Topic 855, Subsequent Events (formerly
SFAS No. 165, Subsequent
Events) which establishes general standards for the evaluation,
recognition and disclosure of events and transactions that occur after the
balance sheet date. Although there is new terminology, the standard is based on
the same principles as those that currently exist in the auditing standards. The
standard, which includes a new required disclosure of the date through which
management has evaluated subsequent events, is effective for interim and annual
periods ending after June 15, 2009. The adoption of ASC 855 had no effect on the
Company’s financial statements.
F-12
Effective
October 1, 2008, the Company adopted certain aspects of ASC Topic 825. Financial Instruments
(formerly SFAS 159, “The Fair Value Option for Financial Assets & Financial
Liabilities – including an amendment of SFAS No. 115.”). The
accounting guidance created a fair value option under which an entity may
irrevocably elect fair value as the initial and subsequent measurement attribute
for certain financial assets and liabilities on a contract by contract basis,
with changes in fair values recognized in earnings as these changes occur. The
adoption of ASC Topic 825 had no significant impact on the Company’s financial
condition or results of operations.
In
December 2007, the FASB issued ASC Topic 805, Business Combinations
(formerly SFAS 141R, “Business Combinations,”) ASC Topic 805 changes how a
reporting enterprise will account for the acquisition of a business. ASC 805
will apply prospectively to business combinations with an acquisition date on or
after November 1, 2009. The adoption of ASC Topic 805 is not expected to
have a material impact on the Company’s financial condition or results of
operations, however future acquisitions would be accounted for under the
guidance.
|
3.
|
Property and
Equipment
|
Property
and equipment consist of the following:
|
December 31,
2009
|
December 31,
2008
|
|||||||
|
Software
development costs
|
$ | 3,857 | $ | 3,198 | ||||
|
Equipment
|
771 | 394 | ||||||
|
Furniture
and fixtures
|
976 | 850 | ||||||
|
Leasehold
improvements
|
342 | 332 | ||||||
|
Gross
assets
|
5,946 | 4,774 | ||||||
|
Less:
Accumulated depreciation
|
(1,312 | ) | (473 | ) | ||||
|
Property
and equipment, net
|
$ | 4,634 | $ | 4,301 | ||||
Depreciation
expense for the years ended December 31, 2009 and December 31, 2008 were $839
and $425, respectively.
|
4.
|
Intangible
Assets
|
The
following is a summary of intangible assets and goodwill as of December 31,
2009 and 2008:
|
Gross Carrying
Amount
|
Accumulated
Amortization
|
Adjustments
|
Net Carrying
Value
|
|||||||||||||
|
Patent
technology
|
$ | 40,000 | $ | 10,465 | $ | (68 | ) | $ | 29,467 | |||||||
|
Supply
relationship
|
1,000 | 180 | - | 820 | ||||||||||||
|
Trademarks
|
121,152 | - | (350 | ) | 120,802 | |||||||||||
|
Goodwill
|
374,886 | - | - | 374,886 | ||||||||||||
|
December
31, 2009
|
$ | 537,038 | $ | 10,645 | $ | (418 | ) | $ | 525,975 | |||||||
|
Gross Carrying
Amount
|
Accumulated
Amortization
|
Adjustments
|
Net Carrying
Value
|
|||||||||||||
|
Patent
technology
|
$ | 40,000 | $ | 6,466 | $ | - | $ | 33,534 | ||||||||
|
Supply
relationship
|
1,000 | 113 | - | 887 | ||||||||||||
|
Trademarks
|
121,152 | - | (350 | ) | 120,802 | |||||||||||
|
Goodwill
|
374,886 | - | - | 374,886 | ||||||||||||
|
December
31, 2008
|
$ | 537,038 | $ | 6,579 | $ | (350 | ) | $ | 530,109 | |||||||
F-13
Adjustments
to trademarks relate to a legal settlement received of $0.4 and serve to reduce
related costs previously capitalized. The amortization expense for
the next five years is approximately $4.1 million in each year.
|
5.
|
Accounts Payable and
Accrued Expenses
|
Accounts
payable and accrued expenses consist of the following:
|
December 31,
2009
|
December 31,
2008
|
|||||||
|
Accounts
payable
|
$ | 8,374 | $ | 16,972 | ||||
|
Accrued
expenses
|
14,252 | 7,966 | ||||||
|
Total
|
$ | 22,626 | $ | 24,938 | ||||
|
6.
|
Long Term
Debt
|
On
November 4, 2009, the Company, through its wholly-owned subsidiary GFA Brands,
Inc. (the “Borrower”), entered into a Credit Agreement (the “Credit Agreement”)
with the various Lenders named therein (the “Lenders”), and Bank of Montreal, as
Administrative Agent (the “Agent”). The Credit Agreement provides for
$100 million in secured debt financing consisting of a $55 million term
loan (the “Term Loan”) and a $45 million revolving credit facility (the
“Revolver”). The Revolver includes a $5 million sublimit for the
issuance of letters of credit and a $5 million sublimit for swing line
loans. Subject to certain conditions, the Borrower, to the extent
existing Lenders decline to do so by adding additional Lenders, may increase the
Term Loan or increase the commitments under the Revolver (or a combination of
the two) up to an aggregate additional amount of $5 million, at the Borrower’s
option.
The
Credit Agreement replaced the Company’s prior first lien and second lien credit
facilities with Bank of America Securities LLC and Bank of America, N.A. (the
“Prior Facilities”). As of September 30, 2009, outstanding debt under
the Prior Facilities totaled approximately $65 million. Proceeds of
the Credit Agreement were used to repay the debt outstanding under the Prior
Facilities and may also be used for general corporate purposes and general
working capital purposes.
The Term
Loan and the loans made pursuant to the Revolver will mature on November 3,
2013. The Credit Agreement requires annual principal payments on the
Term Loan of $5.5 million.
Loans
outstanding under the Credit Agreement will bear interest, at the Borrower’s
option, at either a base rate (defined in the Credit Agreement as the greatest
of (i) 2.5%, (ii) the Agent’s prime rate, (iii) the federal funds rate plus
0.50% and (iv) a reserve adjusted one-month LIBOR rate plus 1.0%) or a
Eurodollar rate (of no less than 1.5%), in each case plus an applicable
margin. The applicable margin is determined under the Credit
Agreement based on the ratio of the Company’s total funded debt to EBITDA for
the prior four fiscal quarters (the “Leverage Ratio”), and may range from 2.25%
to 3.25%, in the case of base rate loans, and 3.25% to 4.25%, in the case of
Eurodollar rate loans. The Borrower must also pay a commitment fee on
the unused portion of the Revolver determined under the Credit
Agreement based on the ratio of the Company’s Leverage Ratio and may
range from 0.50% to 0.75%.
Subject
to certain conditions, the Borrower may voluntarily prepay the loans under the
Credit Agreement in whole or in part, without premium or penalty (other than
customary breakage costs). Mandatory prepayments that are required
under the Credit Agreement include:
|
|
·
|
100% of the net cash proceeds (as
defined in the Credit Agreement) upon certain dispositions of property or
upon certain damages or seizures of property, subject to limited
exceptions;
|
|
|
·
|
50% of all net cash proceeds from
issuance of additional equity securities of the Company, subject to
limited exceptions, provided, however, if the Company’s Leverage Ratio is
less than 2.0 as of the end of the most recently ended quarter, the
prepayment is limited to 25% of such
proceeds;
|
F-14
|
|
·
|
100% of the amount of net cash
proceeds for certain issuances of additional indebtedness for borrowed
money; and
|
|
|
·
|
Beginning on December 31, 2010
and each fiscal year thereafter, an annual prepayment equal to 25% of
excess cash flow of the Company (as defined in the Credit Agreement) for
such fiscal year, provided such prepayment is not required if the Company
has a Leverage Ratio of 2.0 or less, measured as of the end of such fiscal
year.
|
The
Credit Agreement contains covenants that are customary for agreements of this
type. These covenants include, among others: a limitation on the
incurrence of additional indebtedness; a limitation on mergers, acquisitions,
investments and dividend payments; and maintenance of specified financial
ratios. Under the Credit Agreement, the Company must maintain (1) a
Leverage Ratio that is not greater than 2.75 to 1.0 until December 30, 2011 and
not greater than 2.50 to 1.0 thereafter and (2) a ratio of EBITDA to Debt
Service (as defined in the Credit Agreement), in each case for the prior four
fiscal quarters, of not less than 2.00 to 1.00. The Company is also
limited to spending not more than $6 million of capital expenditures per year
with any unspent funds carried over to the next twelve months. At
December 31, 2009, the Company was in compliance with all of its
covenants.
The
failure to satisfy covenants under the Credit Agreement or the occurrence of
other specified events that constitute an event of default could result in the
acceleration of the repayment obligations of the Borrower. The Credit
Agreement contains customary provisions relating to events of default for
agreements of this type. The events of default include, among others: the
nonpayment of any outstanding principal, interest, fees or other amounts due
under the Credit Agreement; certain bankruptcy events, judgments or decrees
against the Company or the Borrower; cross defaults to other indebtedness
exceeding $5.0 million; a change in control (as defined in the Credit Agreement)
of the Company or the Borrower; and the failure to perform or observe covenants
in the Credit Agreement.
The
obligations under the Credit Agreement are guaranteed by the Company and all
existing and future subsidiaries of the Borrower. The Borrower, the
Company and the other guarantors granted to the Agent, for the benefit of the
Lenders, a security interest in substantially all of its respective assets,
including, among other things, patents, patent licenses, trademarks and
trademark licenses.
After the
close of the transaction, total debt outstanding debt under the Credit Agreement
totaled approximately $60.6 million comprised of $55 million of Term Loan debt
and $5.6 million of borrowings under the Revolver.
The
Company is required to pay the following amounts in each of the next four
years:
|
2010
|
$ | 5,500 | ||
|
2011
|
5,500 | |||
|
2012
|
5,500 | |||
|
2013
|
40,143 | |||
|
Total
|
$ | 56,643 |
The
interest rate from inception of the loan agreement through year end was
5.25%.
|
7.
|
Stock-Based
Compensation
|
The
Company and its stockholders have authorized the issuance of up to 12,150,000
stock options under its Stock and Awards Plan. Through December 31,
2009, the Company had granted a total of 11,360,000 stock options under the
Stock and Awards Plan, of which 479,000 were forfeited.
F-15
In
addition, during the first quarter of 2008, the compensation committee and
sub-committee of the compensation committee approved the issuance of up to
1,375,000 inducement stock options grants to new employees outside of the
Company’s stock plan pursuant to NASDAQ Marketplace Rule 4350. During
the twelve months ended December 31, 2008, the Company issued all of the
1,375,000 inducement grant stock options to new employees.
The
Company has two types of stock options, traditional service-based with a four
year graded (25% vest each year) vesting and market condition-based stock
options which vest when the underlying stock price reaches either $16.75 and
$20.25, respectively, and remains there for 20 out of 30 consecutive trading
days. Stock options are granted to recipients at exercise prices equal to the
fair market value of the Company’s stock at the dates of grant and can consist
solely of the service-based options or market conditions-based options or a can
consist of a combination of both types of options. Stock options
granted to employees have a term of 10 years. The Company recognizes
stock-based compensation expense over the requisite service period of the
individual grants, which generally equals the vesting period, or as determined
by the Monte Carlo valuation model.
|
Number of
Outstanding
Shares
|
Weighted
Average
Exercise
Price
|
Weighted
Average
Remaining
Life (years)
|
||||||||||
|
Shares
at December 31, 2007
|
8,797,500 | $ | 9.88 | 7.79 | ||||||||
|
Options
granted
|
3,437,500 | 8.39 | 7.65 | |||||||||
|
Options
exercised
|
- | - | - | |||||||||
|
Options
canceled/forfeited
|
(190,000 | ) | 10.03 | 7.45 | ||||||||
|
Shares
at December 31, 2008
|
12,045,000 | $ | 9.47 | 7.03 | ||||||||
|
Options
granted
|
500,000 | 6.46 | 9.56 | |||||||||
|
Options
exercised
|
- | - | - | |||||||||
|
Options
canceled/forfeited
|
(289,000 | ) | 9.69 | 7.92 | ||||||||
|
Shares
at December 31, 2009
|
12,256,000 | $ | 9.34 | 7.78 | ||||||||
|
Shares
exercisable at December 31, 2009
|
2,822,375 | $ | 9.64 | 7.61 | ||||||||
The
weighted-average grant-date fair values of options granted during 2009, 2008 and
2007 were $3.20, $4.17 and $5.00, respectively.
The
following summarizes nonvested share activity for 2009:
|
Shares
|
Grant-Date
Fair Value
|
|||||||
|
Nonvested
at beginning of year
|
10,856,000 | $ | 4.78 | |||||
|
Granted
|
500,000 | 3.20 | ||||||
|
Vested
|
(1,658,375 | ) | 4.44 | |||||
|
Forfeited
|
(264,000 | ) | 5.01 | |||||
|
Non-vested
at end of year
|
9,433,625 | $ | 4.75 | |||||
As of
December 31, 2009, the total compensation cost related to nonvested awards not
yet recognized was $20.7 million with a weighed average period of 1.47 years
over which it is expected to be recognized.
The
Company accounts for its stock-based compensation awards in accordance with
authoritative accounting guidance for share-based payment, which requires
companies to recognize compensation expense for all equity-based compensation
awards issued to employees that are expected to vest. Compensation cost is based
on the fair value of awards as of the grant date.
F-16
Pre-tax
stock-based compensation expense included in reported net income is as
follows:
|
Year ended
December 31, 2009
|
Year ended
December 31, 2008
|
Year ended
December 31, 2007
|
||||||||||
|
Service
period-based
|
$ | 7,577 | $ | 6,856 | $ | 3,032 | ||||||
|
Market
price-based $16.75
|
4,885 | 4,617 | 2,099 | |||||||||
|
Market
price-based $20.25
|
3,628 | 3,423 | 1,558 | |||||||||
|
Total
|
$ | 16,090 | $ | 14,896 | $ | 6,689 | ||||||
For the
traditional service-based stock options, the Company estimated the fair value,
as of the date of grant, using a Black-Scholes pricing model with the following
assumptions: risk-free interest rate of 3.53%-4.67%, expected life 7
years for the service-based options and 10 years for the market price-based
options, no dividends and volatility of 35.9%-52.08%. The cost of the
service-based stock options is being amortized over a four year estimated
vesting period. In the case of the market price-based stock options,
the Company used the Monte Carlo valuation model and the same assumptions noted
above. The Company recognizes compensation expense for the market
price-based options over the estimated vesting period, which has been determined
to be 2.75-4.82 years and 3.68-5.53 years for the $16.75 and $20.25 awards,
respectively.
|
8.
|
Related Party
Transactions
|
Certain
stockholders, five of whom are directors and one senior advisor, purchased an
aggregate of 1,000,000 warrants concurrently with the closing of the Company’s
initial public offering at a price of $1.70 per warrant from the
Company. The warrants were exercisable into common stock at $6.00 per
share until December 16, 2009 at which time they expired.
|
9.
|
Interest Rate
Derivatives
|
In
conjunction with the original variable-rate debt arrangement, which was
terminated on November 4, 2009, the Company entered into notional $80,000 of
interest rate swap agreement which was designed to provide a constant interest
rate on the variable rate debt. The swap agreement was cancelled when the new
financing was put in place on November 4, 2009.
|
10.
|
License
|
A
substantial portion of the Company’s business is dependent on its exclusive
license of certain technology from Brandeis University. This license agreement,
dated June 1996, imposes certain obligations upon the Company, such as
diligently pursuing the development of commercial products under the licensed
technology. The agreement for each country expires at the end of the term of
each patent in such country and contains no minimum commitments. The amount of
royalties due is based on a formula of the percentage of oil and/or fat utilized
in the licensed products. Should Brandeis believe that the Company has failed to
meet its obligations under the license agreement, Brandeis could seek to limit
or terminate the Company’s license rights. Royalties earned by Brandeis in 2009
were approximately $991, for 2008 approximately $943 and from the date of our
initial business combination, May 21, 2007, until December 31, 2007,
were approximately $552.
|
11.
|
Income
Taxes
|
The
components of the Company’s income tax provision (benefit) for the years ended
December 31, 2009, 2008 and 2007 are of the following:
F-17
|
Year ended
December 31,
2009
|
Year ended
December 31,
2008
|
Year ended
December 31,
2007
|
||||||||||
|
Income
tax provision (benefit):
|
||||||||||||
|
Current
taxes:
|
||||||||||||
|
Federal
|
$ | 3,540 | $ | 2,474 | $ | 2,206 | ||||||
|
State
|
74 | 559 | (144 | ) | ||||||||
| 3,614 | 3,033 | 2,062 | ||||||||||
|
Deferred
taxes:
|
||||||||||||
|
Federal
|
$ | (1,909 | ) | $ | (6,026 | ) | $ | (2,677 | ) | |||
|
State
|
(347 | ) | (570 | ) | (91 | ) | ||||||
| (2,256 | ) | (6,596 | ) | (2,768 | ) | |||||||
|
Provision (benefit)
for income taxes
|
$ | 1,358 | $ | (3,563 | ) | $ | (706 | ) | ||||
The
reconciliation of the provision for income taxes based on the U.S. federal
statutory income tax rate to our provision for income taxes was as
follows:
|
Year ended
December 31, 2009
|
Year ended
December 31, 2008
|
Year ended
December 31, 2007
|
||||||||||
|
Expected
federal statutory taxes at 35%
|
$ | 1,688 | $ | (3,686 | ) | $ | (22,186 | ) | ||||
|
Performance
based shares released from escrow
|
— | — | 6,275 | |||||||||
|
Derivative
liabilities
|
— | — | 15,489 | |||||||||
|
Valuation
allowance
|
115 | — | — | |||||||||
|
State
refund benefit, net
|
(376 | ) | — | — | ||||||||
|
Other
|
(69 | ) | 123 | (284 | ) | |||||||
|
(Benefit)
Provision for income taxes
|
$ | 1,358 | $ | (3,563 | ) | $ | (706 | ) | ||||
The rate
reconciliation includes a benefit for state taxes resulting from amended returns
filed and refunds received during 2009. The amended returns were
filed in 2009 as a result of various voluntary state disclosure settlements
during the year, which impacted state apportionment factors.
Deferred
income tax assets or liabilities are computed based on the temporary differences
between the financial statement and income tax basis of assets and liabilities
using the enacted marginal tax rate in effect for the year in which the
differences are expected to reverse. Deferred income expenses or credits are
based on the changes in the deferred income tax assets or liabilities from
period to period.
|
December 31,
2009
|
December 31,
2008
|
|||||||
|
Deferred
tax assets:
|
||||||||
|
Derivative
liabilities
|
$ | — | $ | 2,003 | ||||
|
Stock
compensation
|
14,649 | 8,423 | ||||||
|
Inventory
|
247 | 294 | ||||||
|
Deferred
financing costs
|
— | 827 | ||||||
|
Net
operating loss carryforwards
|
218 | 45 | ||||||
|
Other
|
203 | 397 | ||||||
|
Total
deferred tax assets
|
15,317 | 11,989 | ||||||
|
Less
Valuation allowance
|
(115 | ) | — | |||||
|
Total
net deferred tax assets
|
15,202 | 11,989 | ||||||
|
Deferred
tax liabilities:
|
||||||||
|
Intangible
assets
|
(56,376 | ) | (57,302 | ) | ||||
|
Other
|
(2,188 | ) | (305 | ) | ||||
|
Total
deferred tax liabilities
|
(58,564 | ) | (57,607 | ) | ||||
|
Net
deferred tax liability
|
$ | (43,362 | ) | $ | (45,618 | ) | ||
|
Deferred
tax asset current
|
$ | 462 | $ | 650 | ||||
|
Long-term
deferred tax asset
|
14,740 | 11,339 | ||||||
|
Long-term
deferred tax liability
|
(58,564 | ) | (57,607 | ) | ||||
|
Net
deferred tax (liabilities)
|
$ | (43,362 | ) | $ | (45,618 | ) | ||
F-18
The
Company has state net operating loss ("NOL") carryforwards at December 31,
2009 of approximately $4.6 million for income tax purposes, which begin expiring
in 2014. A valuation allowance was established for approximately $115
for various state net operating losses that may expire prior to their
realization. The Company has not established a valuation allowance
for the realization of the remaining deferred tax assets, as the Company has
determined that it is more likely than not that the assets will be fully
utilized.
Significant
judgment is required in evaluating the Company's tax positions and determining
its provision for income taxes. During the ordinary course of
business, there are many transactions and calculations for which the ultimate
tax determination is uncertain. The Company establishes reserves for
tax-related uncertainties based on estimates of whether, and the extent to
which, additional taxes will be due. These reserves are established
when the Company believes that certain positions might be challenged despite its
belief that the Company's tax return positions are fully
supportable. The Company adjusts these reserves in light of changing
facts and circumstances, such as the outcome of tax audits. The
provision for income taxes includes the impact of reserve provisions and changes
to reserves that are considered appropriate. The Company has elected
to retain its existing accounting policy with respect to the treatment of
interest and penalties attributable to income taxes in accordance with FIN 48,
and continues to reflect interest and penalties attributable to income taxes, to
the extent they arise, as a component of its income tax provision or benefit as
well as its outstanding income tax assets and liabilities.
A
reconciliation of the beginning and ending amount of gross unrecognized tax
benefits as of December 31, 2009 was as follows:
|
December 31,
2009
|
December 31,
2008
|
|||||||
|
Gross
balance at January 1
|
$ | 651 | $ | 823 | ||||
|
Additions
based on tax positions related to the current year
|
82 | — | ||||||
|
Additions
for tax provision of prior years
|
— | 20 | ||||||
|
Deletions
for tax positions of prior years
|
(500 | ) | (192 | ) | ||||
|
Gross
balance at December 31
|
233 | 651 | ||||||
|
Payments
made
|
— | — | ||||||
|
Interest
and penalties
|
90 | 308 | ||||||
|
Balance
at December 31
|
$ | 323 | $ | 959 | ||||
At
December 31, 2009, the liability for income taxes associated with uncertain tax
position was $323, of which $226, if recognized would affect the effective tax
rate. The Company recognized interest and penalties related to
unrecognized tax benefits as a component of income tax expense. The
gross liability as of December 31, 2008 was $959 includes accrued interest of
$106 and penalties of $202. The liability as of December 31, 2009 was
$323, include accrued interest of $41 and penalties of $49.
The
Company believes it is reasonably possible that there will be a $284 decrease in
the gross tax liability for uncertain tax positions within the next 12 months
based on potential settlements with related tax authorities in various
jurisdictions.
The Joint
Committee is currently examining the 2007 federal tax return which resulted in a
tax refund of $4.7 million. The company does not anticipate any
adverse adjustments that would impact the amount of the refund during this
review. Prior periods have either been audited or are no longer
subject to IRS audit. In most state jurisdictions, the Company is no
longer subject to examination by tax authorities for years prior to
2004.
F-19
|
12.
|
Commitments and
Contingencies
|
The
following table summarizes contractual obligations and borrowings as of
December 31, 2009 and the timing and effect that such commitments are
expected to have on our liquidity and capital requirements in future
periods. We expect to fund these commitments primarily with operating
cash flows generated in the normal course of business.
Contractual
Obligations (in thousands)
|
Total
|
Due in Less
Than 1 Year
|
Due in
1-3 Years
|
Due in
3-5 Years
|
Due in More
Than 5 Years
|
||||||||||||||||
|
Building
Leases(1)
|
$ | 3,243 | $ | 703 | $ | 1,345 | $ | 1,004 | $ | 191 | ||||||||||
|
Oil
and Peanuts Purchase Commitments(2)
|
17,345 | 17,345 | — | — | — | |||||||||||||||
|
Debt
Obligations(3)
|
56,643 | 5,500 | 11,000 | 40,143 | — | |||||||||||||||
|
Brandeis
Contract
|
700,000 | 200,000 | 200,000 | 100,000 | 200,000 | |||||||||||||||
| $ | 777,231 | $ | 223,548 | $ | 213,345 | $ | 141,147 | $ | 200,191 | |||||||||||
_______________________________
(1) Includes: (i) a lease
agreement for the lease of a corporate office facility located in Paramus, NJ
with an approximate seven year life with the option to extend the lease for two
additional five year terms, and (ii) three lease agreements for the lease of a
corporate office facility located in Niwot, Colorado with an approximate five
year life with the option to extend each lease for 36 months. Rental
expense for operating leases for 2009 was $698 and for the years 2010 through
2014 is shown above.
(2)
Forward purchase commitments for a portion of the Company’s projected
requirement for peanuts and for palm, soy and canola oil. These
commitments may be stated at a firm price, or as a discount or premium from a
future commodity market price. Based on the most recent prices the
Company realized, these commitments would total approximately $17.3 million as
of December 31, 2009. The commitments are expected to be liquidated
by September 30, 2010.
(3)
For more information on our debt obligations, see the section entitled
“Secured Debt Financing” located elsewhere in this report.
|
13.
|
Legal
Proceedings
|
The
Company is currently involved in the following legal proceedings:
On
February 8, 2010 a lawsuit was filed against Smart Balance, Inc. in the Federal
District Court for the Central District in California in Santa Ana,
California. The complaint alleges, among other things, violations of
California’s unfair competition law, false advertising, and consumer remedies
act and seeks to identify all similarly situated plaintiffs and certify them in
a class action. The Company has not yet answered the complaint, but
intends to vigorously defend itself. The Company does not expect that
the resolution of this matter will have a material adverse effect on our
business.
In 2007,
three parties filed Oppositions to European Patent No. 820,307 relating to
increasing the HDL level and the HDL/LDL ratio in Human Serum by Balancing
Saturated and Polyunsaturated Dietary Fatty Acids. We believe that
neither this proceeding, nor its outcome, will have any adverse effect on our
current business.
We are
not a party to any other legal proceeding that we believe would have a material
adverse effect on our business, results of operations or financial
condition.
F-20
|
14.
|
Selected Quarterly
Financial Data (unaudited)
|
The
following table presents certain unaudited quarterly results for the years 2009
and 2008:
|
March 31,
2008
|
June 30,
2008
|
September 30,
2008
|
December 31,
2008
|
Full Year
2008
|
||||||||||||||||
|
Revenues
|
$ | 50,789 | $ | 47,990 | $ | 57,532 | $ | 65,561 | $ | 221,872 | ||||||||||
|
Operating
income (loss)
|
1,960 | (500 | ) | 2,575 | 1,659 | 5,694 | ||||||||||||||
|
Net
(loss)
|
$ | (1,177 | ) | $ | (1,535 | ) | $ | (1,614 | ) | $ | (2,641 | ) | $ | (6,968 | ) | |||||
|
Net
(loss) available for common shares
|
$ | (1,177 | ) | $ | (1,535 | ) | $ | (1,614 | ) | $ | (2,641 | ) | (6,968 | ) | ||||||
|
(Loss)
per share—diluted
|
$ | (0.02 | ) | $ | (0.02 | ) | $ | (0.03 | ) | $ | (0.04 | ) | $ | (0.11 | ) | |||||
|
Diluted
weighted average common shares outstanding
|
62,196,988 | 62,630,683 | 62,630,683 | 62,630,683 | 62,523,742 | |||||||||||||||
|
March 31,
2009
|
June 30,
2009
|
September 30,
2009
|
December 31,
2009
|
Full Year
2009
|
||||||||||||||||
|
Revenues
|
$ | 62,599 | $ | 58,185 | $ | 59,806 | $ | 58,913 | $ | 239,503 | ||||||||||
|
Operating
income (loss)
|
3,208 | 2,519 | 3,458 | 2,625 | 11,810 | |||||||||||||||
|
Net
income (loss)
|
$ | 1,146 | $ | 993 | $ | 1,271 | $ | 56 | $ | 3,466 | ||||||||||
|
Net
income (loss) available for common shares
|
$ | 1,146 | $ | 993 | $ | 1,271 | $ | 56 | 3,466 | |||||||||||
|
Income
(loss) per share—diluted
|
$ | 0.02 | $ | 0.02 | $ | 0.02 | $ | — | $ | 0.06 | ||||||||||
|
Diluted
weighted average common shares outstanding
|
62,706,184 | 62,820,162 | 62,691,742 | 62,631,058 | 62,703,434 | |||||||||||||||
F-21