Attached files
| file | filename |
|---|---|
| EX-99.1 - PRESS RELEASE - PANTRY INC | exhibit99_1.htm |
| 8-K - THE PANTRY, INC. FORM 8-K 03-10-2010 - PANTRY INC | form8k.htm |
Bank of America Merrill Lynch
2010 Consumer Conference
Frank G. Paci, EVP and CFO
March 10, 2010
2010 Consumer Conference
Frank G. Paci, EVP and CFO
March 10, 2010

Safe Harbor Statement
Some of the statements in this presentation constitute “forward-looking
statements” within the meaning of the Private Securities Litigation Reform Act
of 1995. All statements other than those of historical facts included herein,
including those related to the company’s financial outlook, goals, business
strategy, projected plans and objectives of management for future operations
and liquidity, are forward-looking statements. These forward-looking
statements are based on the company’s plans and expectations and involve a
number of risks and uncertainties that could cause actual results to vary
materially from the results and events anticipated or implied by such forward-
looking statements. Please refer to the company’s Annual Report on Form 10-
K and its other filings with the SEC for a discussion of significant risk factors
applicable to the company. In addition, the forward-looking statements
included in this presentation are based on the company’s estimates and plans
as of the date of this presentation. While the company may elect to update
these forward-looking statements at some point in the future, it specifically
disclaims any obligation to do so.
2
Company Overview
3
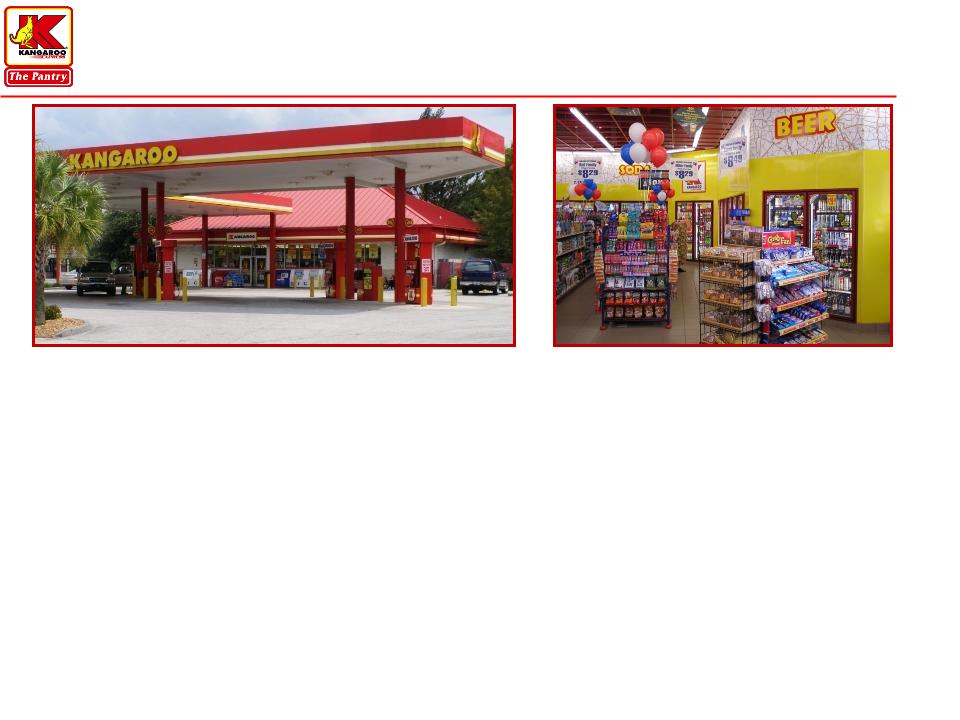
n Leading independently operated convenience store retailer in southeastern U.S. and
one of the largest in country
one of the largest in country
} 1,654 stores in 11 states as of March 3, 2010 with primary store brand of
Kangaroo Express®
Kangaroo Express®
} 2009 Financial Results:
} $1.66B merchandise revenue
} 2.08B retail gas gallons sold under multiple brands
} $169M in operating cash flow
n 234 Quick Service Restaurants in 224 locations as of March 3, 2010

Key Investment Highlights
4
Strong Cash Flow Generation allows us to invest in Growing
Our Business and De-lever Our Balance Sheet
Our Business and De-lever Our Balance Sheet
n Leading market positions in attractive Southeastern markets
n Significant scale advantages versus primary competitors
n Attractive sector consolidation potential
n Strong cash flow generation
n Investing in information systems and food service initiatives to
drive growth
drive growth
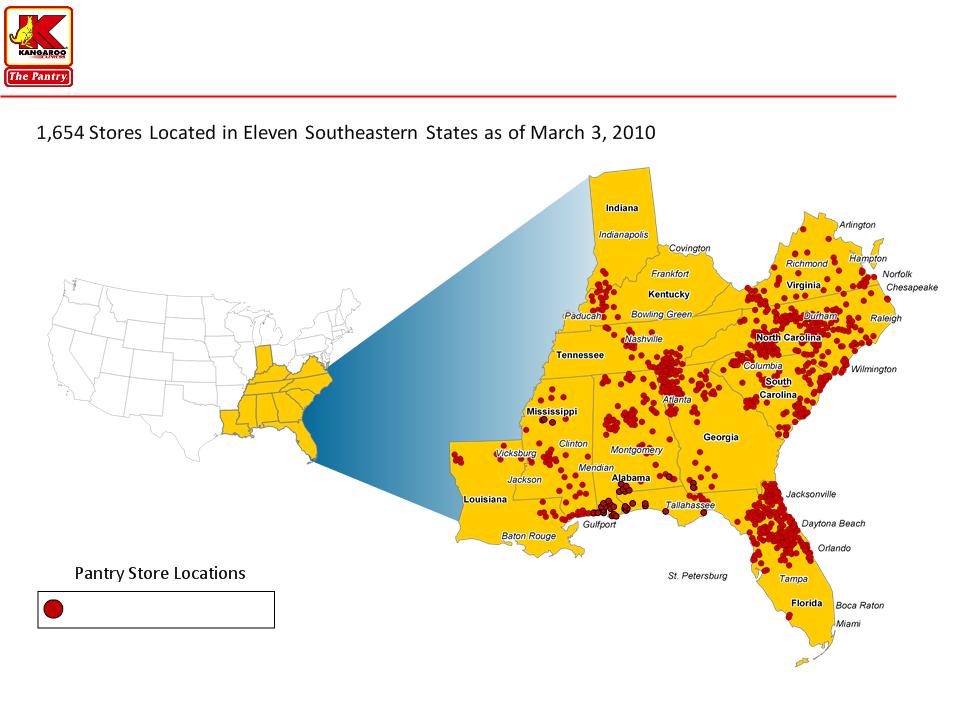
Leading Convenience Store Retailer Concentrated in the
Southeastern United States
Southeastern United States
5
_____________________
Note: Map is illustrative as of March 3, 2010.
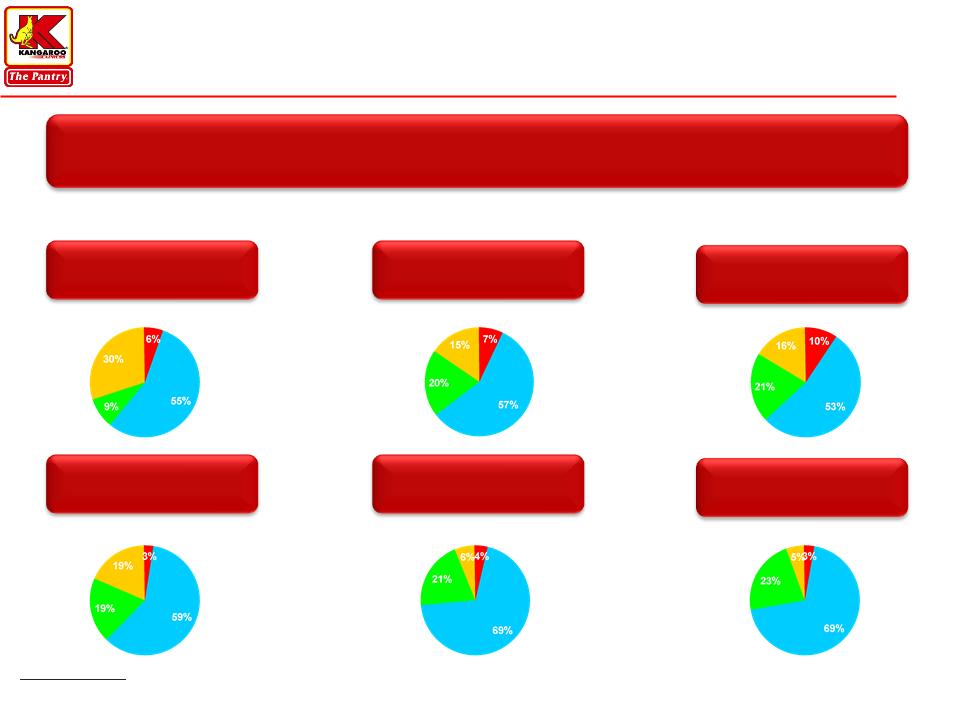
High Degree of Fragmentation Provides Continued
Consolidation Opportunities
Consolidation Opportunities
6
More than 50% of the stores in key markets are single store operators
Florida
(7,246 stores)
North Carolina
(5,350 stores)
South Carolina
(2,888 stores)
Markets Fragmentation(1)(2)
Tennessee
(3,657 stores)
Mississippi
(2,503 stores)
Alabama
(3,756 stores)
(1) Source: U.S. Convenience 2008 Store Count (Gas Only) from NACS/TDLinx.
(2) Pantry store counts as of March 3, 2010.
Pantry
1 Store
Operators
2-50 Store
Operators
Operators
>50 Store
Operators
Operators
Pantry
1 Store
Operators
2-50 Store
Operators
Operators
>50 Store
Operators
Operators
Pantry
1 Store
Operators
2-50 Store
Operators
Operators
>50 Store
Operators
Operators
Pantry
1 Store
Operators
2-50 Store
Operators
Operators
>50 Store
Operators
Operators
Pantry
1 Store
Operators
2-50 Store
Operators
Operators
>50 Store
Operators
Operators
Pantry
1 Store
Operators
2-50 Store
Operators
Operators
>50 Store
Operators
Operators
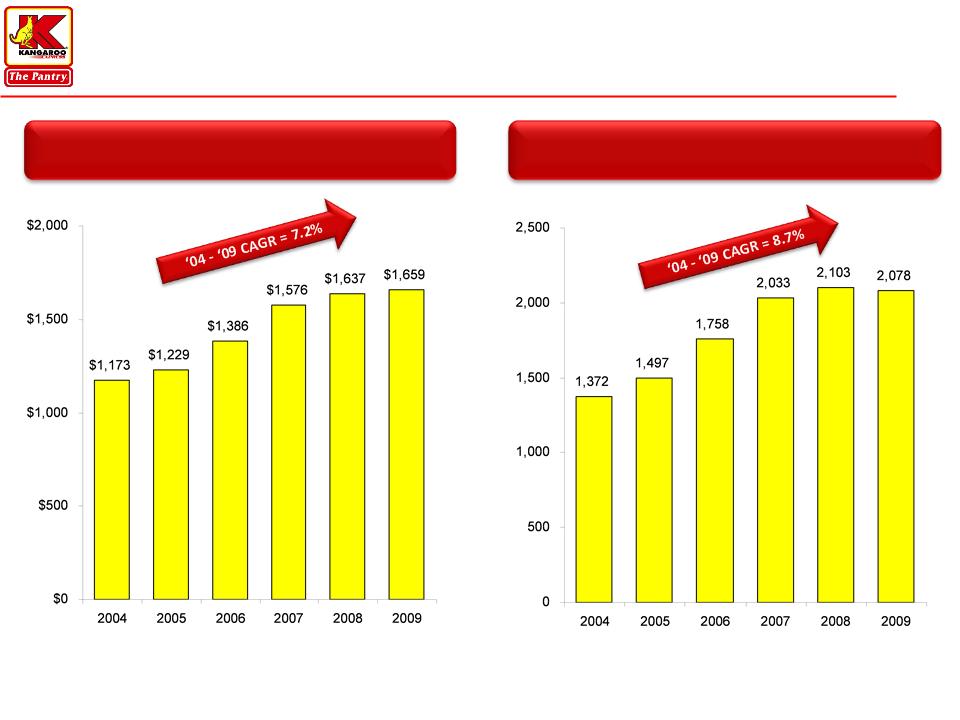
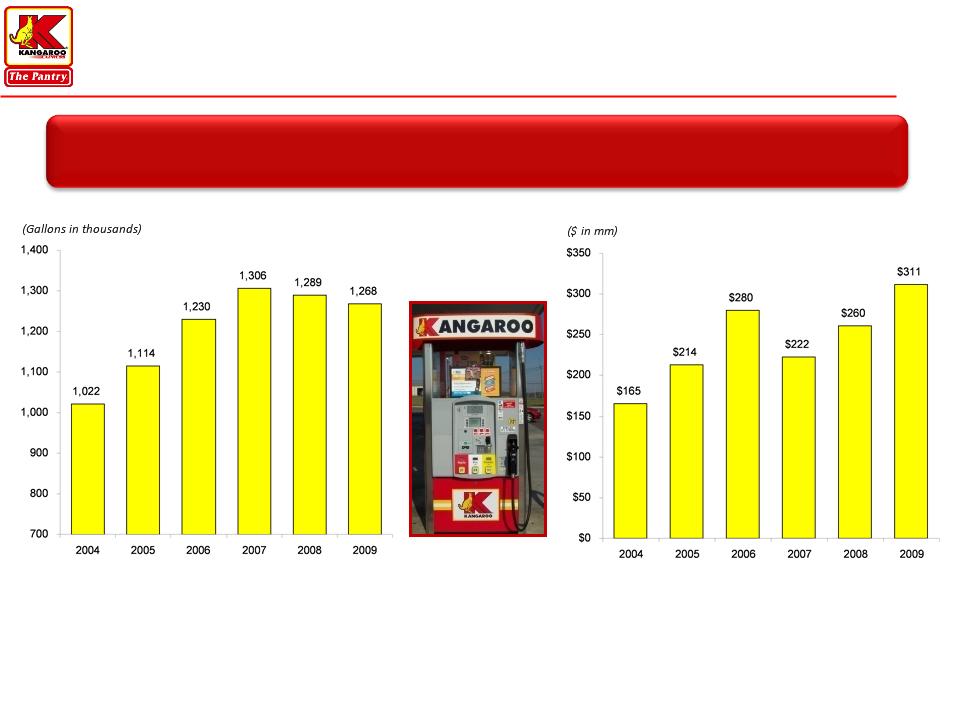
Strong Track Record of Growth…
7
Merchandise Revenue
Fiscal Year
Retail Gas Gallons Sold
Fiscal Year
($ in mm)
(Gallons in mm)
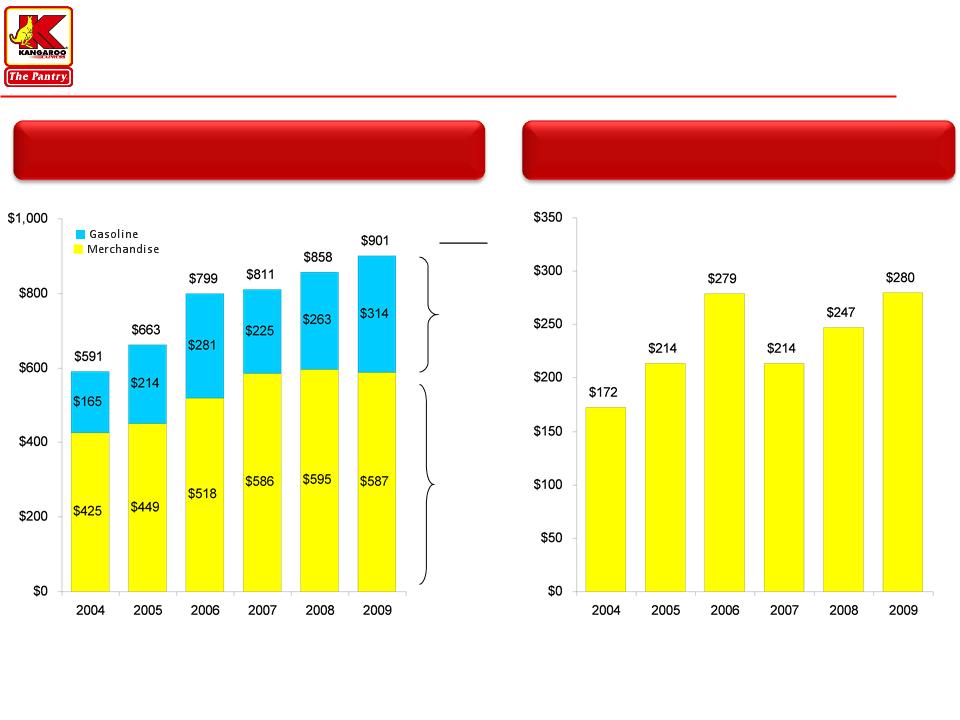
…Substantial EBITDA Generation…
8
Gross Profit
Fiscal Year
Reported EBITDA
Fiscal Year
’04-’09
CAGR
13.7%
6.7%
($ in mm)
($ in mm)
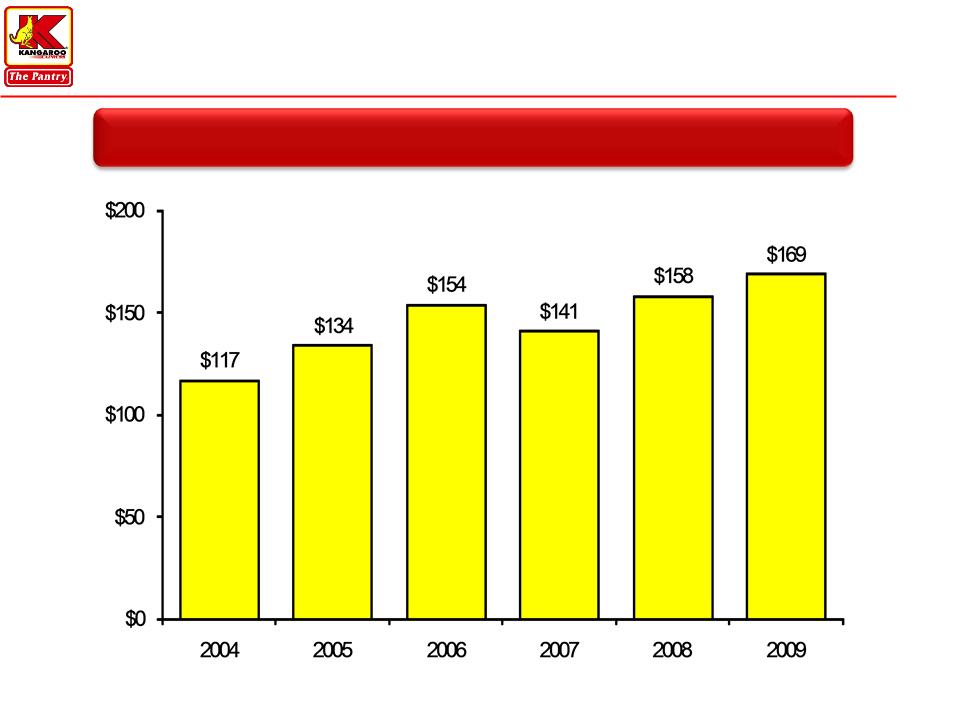
…And Significant Operating Cash Flow
9
($ in mm)
Fiscal Year
Operating Cash Flow
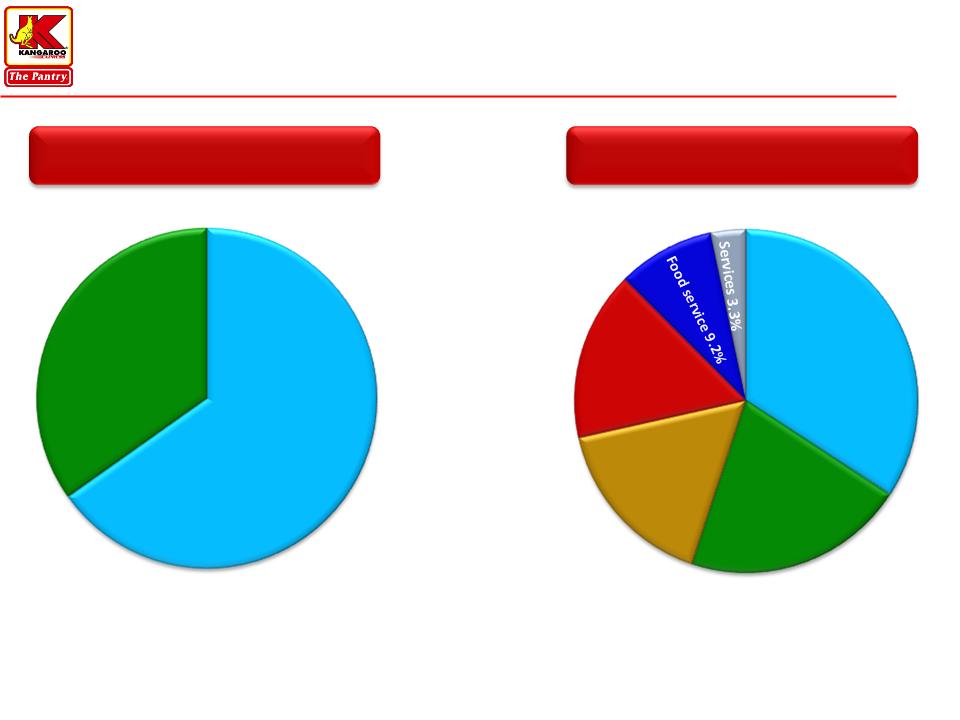
Merchandise Margin is the Primary Contributor of Our
Gross Profit
Gross Profit
10
Fiscal 2009 Gross Profit Mix
Fiscal 2009 Merchandise Sales Mix2
_____________________
(1) 2009 CPG (net of credit card fees and repairs and maintenance) was $0.150.
(2) Category sales mix estimates based on merchandise purchase and sales information.
(3) Includes Other Tobacco Products and Cigarettes.
Gas1
35%
Merchandise
65%
Tobacco products3
34.2%
Packaged
beverages
16.4%
Beer & wine
16.0%
Grocery
20.9%
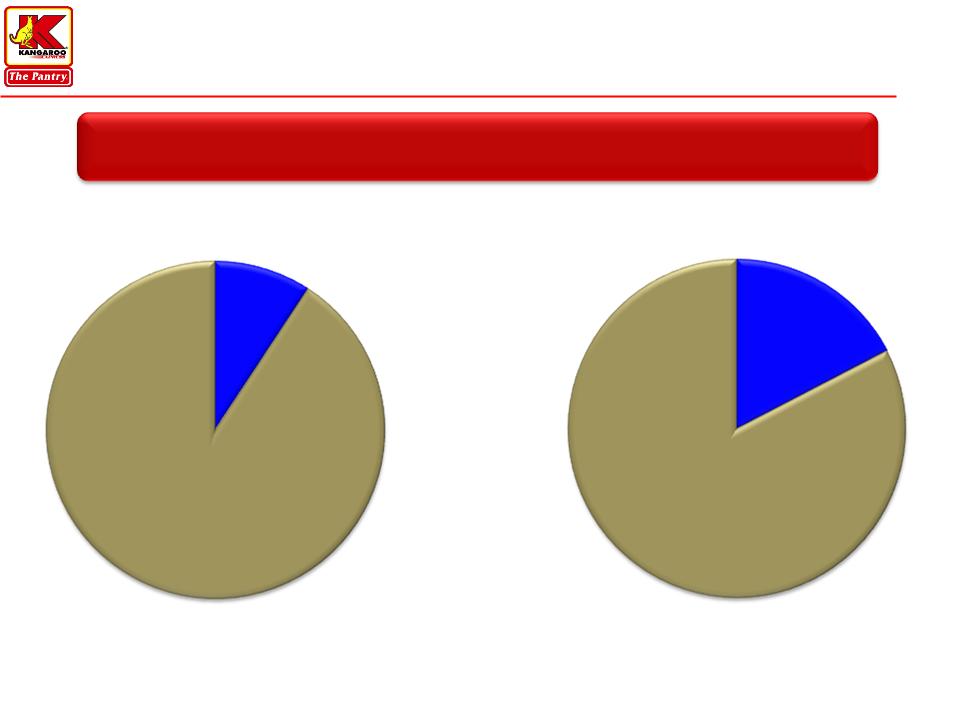
Capturing the Food Service Opportunity
11
_____________________
(1) Pantry Food Service includes Fast Food Service, Self-Service Fast Foods and Beverages and is for FY2009.
(2) Industry Data is for Calendar Year 2008 and Industry source is NACS.
Industry2
Pantry1
Food Service Mix of Total Inside Sales
17%
9%
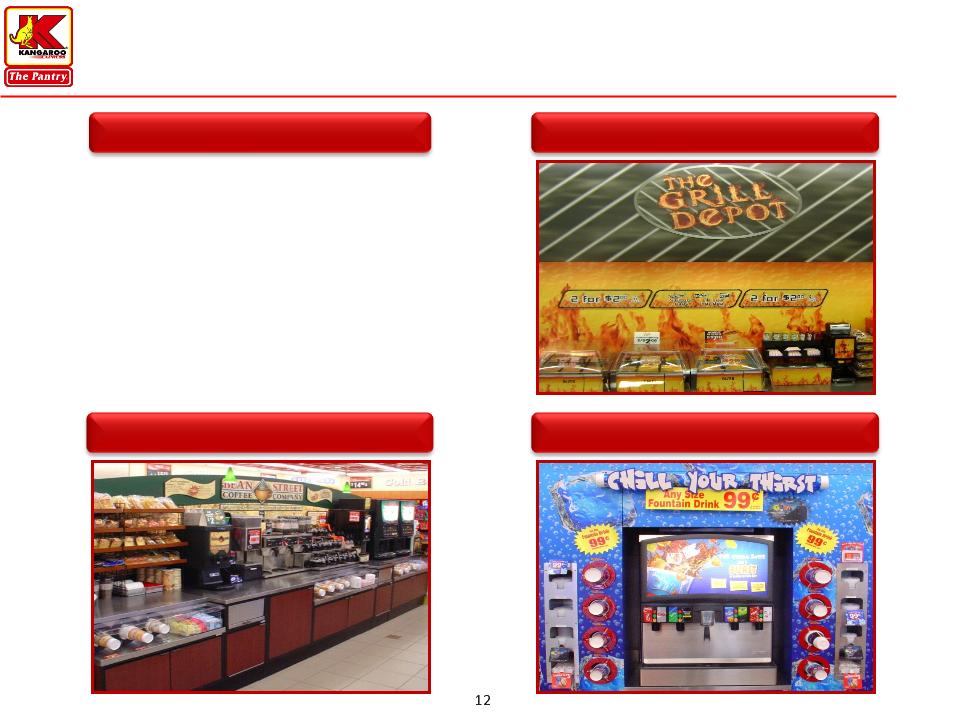
Core Store Food Service Offering
Lunch
Breakfast
Snacks
Expansion Opportunities
n Re-Image Stores
n Day Part Focus
} Breakfast, Lunch and Snacks
n Fresh and Healthier Offerings
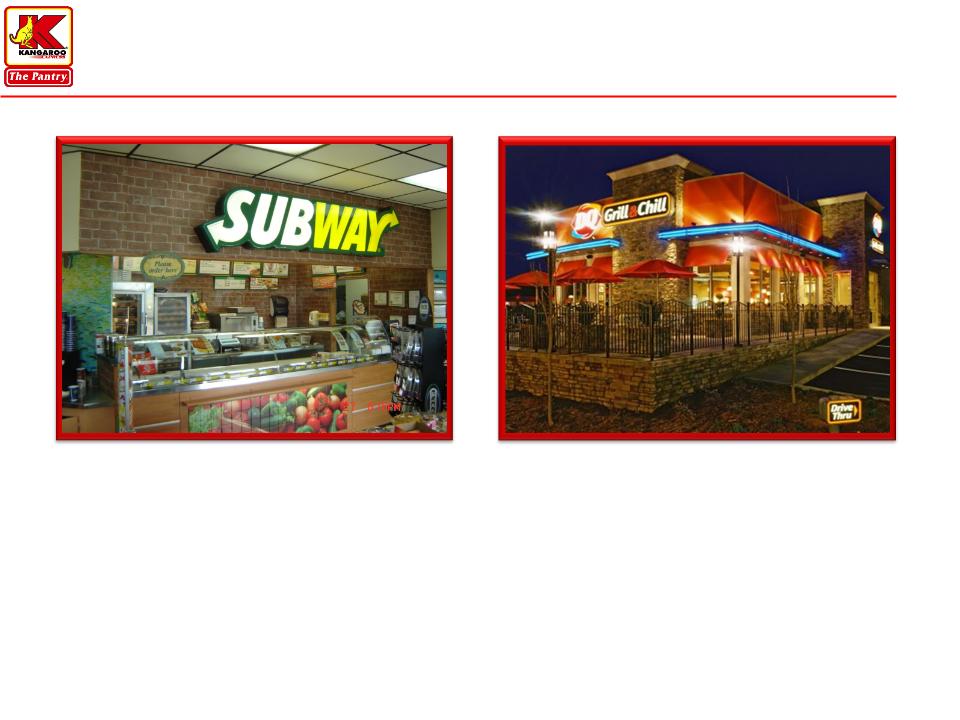
Branded Food Service
13
_____________________
Note: Grill & Chill picture not a Pantry location.
(1) QSR Count as of March 3, 2010.
n Anticipate 25 new nationally branded food service locations in FY2010
n Current portfolio1
} Subway - 126 locations
} Dairy Queen - 8 locations
} Proprietary Chicken - 63 locations
Gasoline Strategy Maximizes Fuel Gross Profit Dollars
14
We Balance Average Gallons Sold per Store and Gasoline Margin to
Maximize Overall Gross Profit Dollars
Maximize Overall Gross Profit Dollars
_____________________
(1) Net of credit card fees and repairs and maintenance.
Average Gallons Sold per Store
Fiscal Year
Comps
2.0%
-3.3%
-4.4%
1.0%
3.1%
4.7%
Retail Gasoline Gross Profit $
Fiscal Year
CPG
(1)
(1)
12.0¢
15.0¢
12.4¢
10.9¢
15.9¢
14.3¢
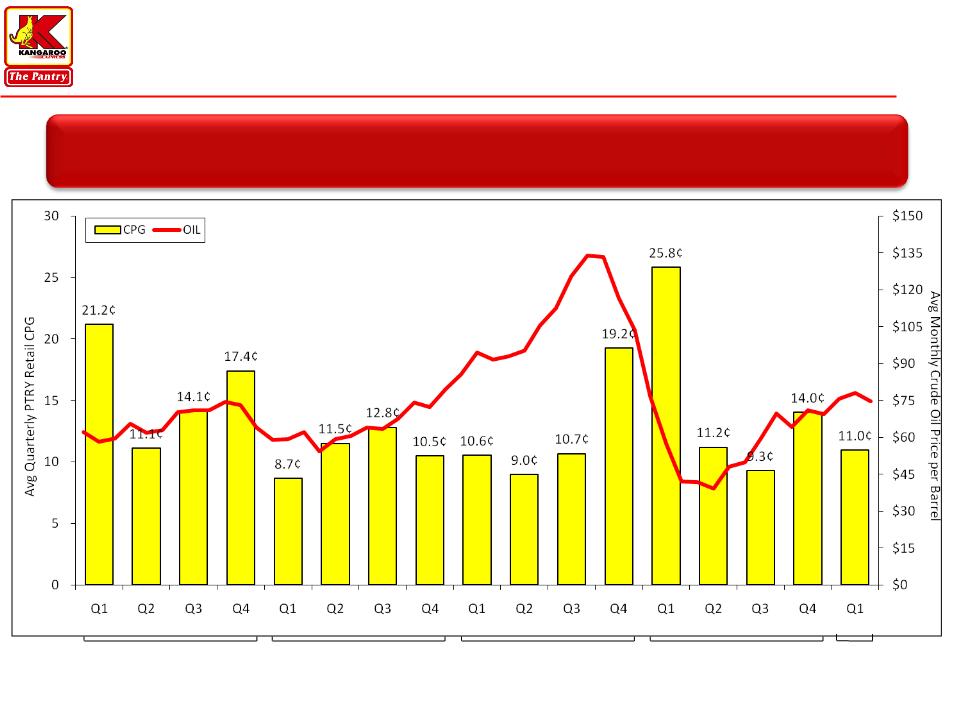
Oil Price Changes Drive Volatility in Quarterly Retail
Gasoline Cents per Gallon…
Gasoline Cents per Gallon…
Energy Market Volatility Impacts Margin
15
FY2006
FY2007
FY2008
FY2009
Source: Energy Information Administration. Data represents daily average futures contract price per barrel of light sweet crude (contract 1) and CPG is net of credit card fees and repairs and
maintenance.
maintenance.
FY2010
¢
¢
¢
¢
¢
¢
¢
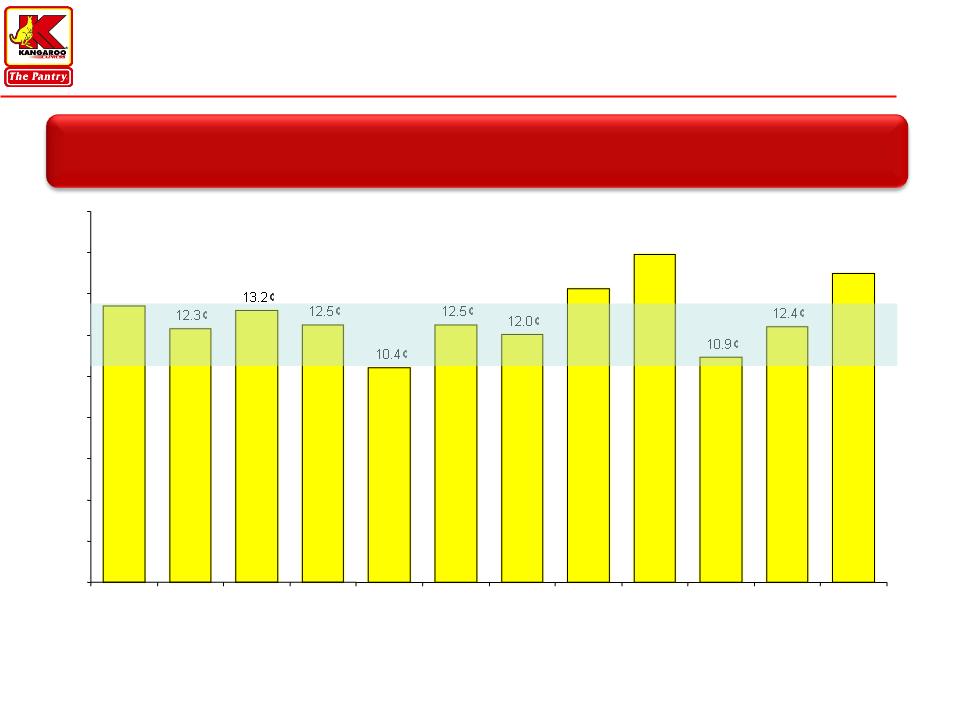
… But Annual CPG Tends to Remain Relatively Stable
16
Fiscal Year
_____________________
Note: Shaded area represents average historical CPG range and CPG is net of credit card fees and repairs and maintenance.
Annual Net CPG Margins Typically Range from 10.5¢ to 13.5¢
13.4¢
14.3¢
15.9¢
15.0¢
0¢
2¢
4¢
6¢
8¢
10¢
12¢
14¢
16¢
18¢
1998
1999
2000
2001
2002
2003
2004
2005
2006
2007
2008
2009
Key Initiatives Targeted to Leverage Our Competitive Advantages
17
n Focus on specific meal occasions such as breakfast, lunch and snacks
n Accelerate nationally branded food service locations
n Develop store reimaging concepts that feature broader food service offerings
n Established the position of Chief Information Officer
n Build business intelligence capabilities
n Upgrade POS and implement WAN across the store base
n Evaluate investment opportunities with a more disciplined focus
n Balance between store additions and investment in existing stores
n Weigh growth investment versus debt reduction
“On-The-Go” Meals
Information Systems
Return Optimization
We believe these actions will better position us to
drive growth when the market environment improves
drive growth when the market environment improves

Financial Flexibility
18
n Meaningful liquidity
} $180 million in cash-on-hand
} $225 million revolver - $0 drawn, approximately $142 million
available after LOCs
available after LOCs
n Long-term debt profile; earliest maturity is the convertible debt in
November 2012
November 2012
n Covenant-light bank facility(1)
} 6.25x Adj. Net Debt / EBITDAR Leverage - Currently 5.65x
} 2.25x Interest Coverage - Currently 2.69x
_____________________
Note: Balance Sheet data as of December 24, 2009.
(1) Per credit facility covenant calculations (8x rent methodology) for TTM as of December 24, 2009.

Key Investment Highlights
19
Strong Cash Flow Generation allows us to invest in Growing
Our Business and De-lever Our Balance Sheet
Our Business and De-lever Our Balance Sheet
n Leading market positions in attractive Southeastern markets
n Significant scale advantages versus primary competitors
n Attractive sector consolidation potential
n Strong cash flow generation
n Investing in information systems and food service initiatives to
drive growth
drive growth
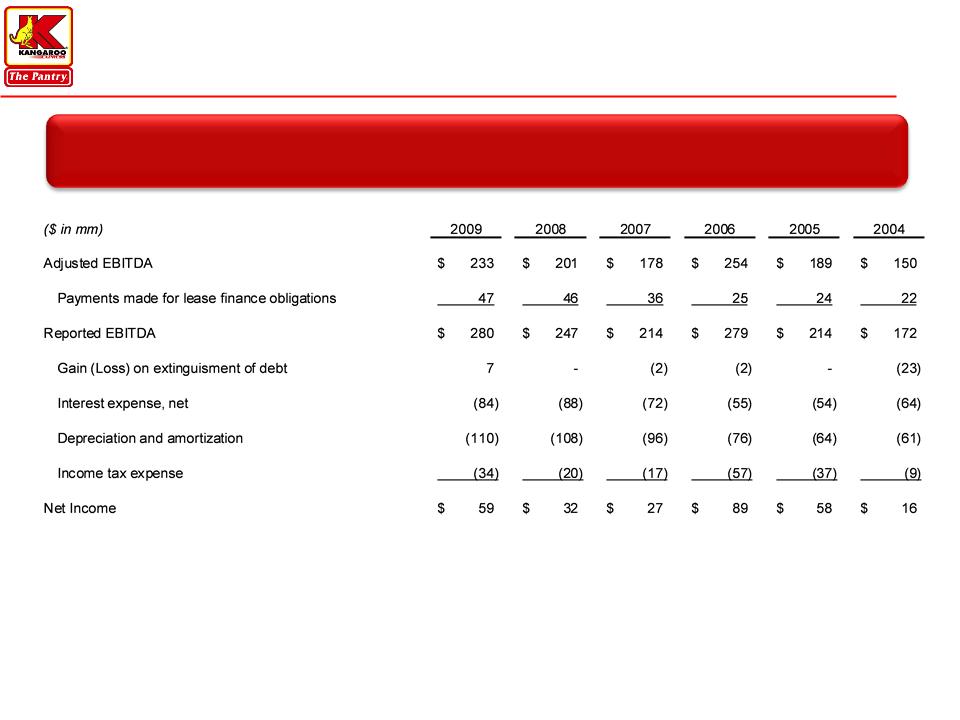
Reconciliation of Non-GAAP Measures
20
Adjusted EBITDA & EBITDA Reconciled to Net Income
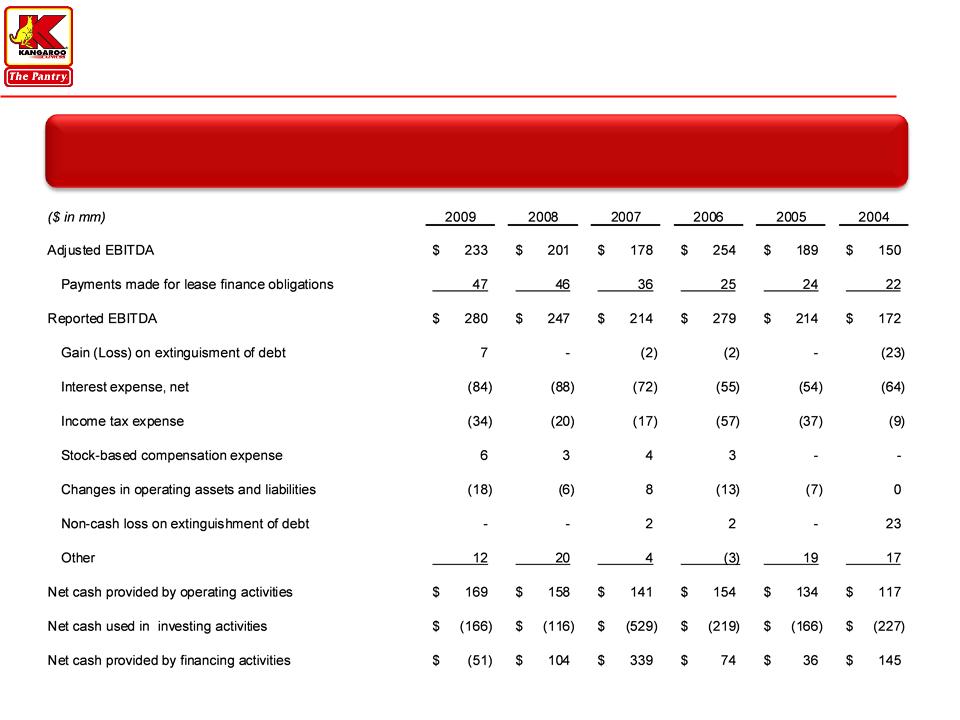
Reconciliation of Non-GAAP Measures
21
Adjusted EBITDA & EBITDA Reconciled to Cash Flows