Attached files
| file | filename |
|---|---|
| EX-23.1 - NL INDUSTRIES, INC. 10K09 EXHIBIT 23.1 - NL INDUSTRIES INC | nl10k08exhibit23_1.htm |
| EX-31.2 - NL INDUSTRIES, INC. 10K09 EXHIBIT 31.2 - NL INDUSTRIES INC | nl10k08exhibit31_2.htm |
| EX-23.2 - NL INDUSTRIES, INC. 10K09 EXHIBIT 23.2 - NL INDUSTRIES INC | nl10k08exhibit23_2.htm |
| EX-31.1 - NL INDUSTRIES, INC. 10K09 EXHIBIT 31.1 - NL INDUSTRIES INC | nl10k08exhibit31_1.htm |
| EX-32.1 - NL INDUSTRIES, INC. 10K09 EXHIBIT 32.1 - NL INDUSTRIES INC | nl10k08exhibit32_1.htm |
| EX-21.1 - NL INDUSTRIES, INC. 10K09 EXHIBIT 21.1 - NL INDUSTRIES INC | nl10k08exhibit21_1.htm |
| EX-10.38 - NL INDUSTRIES, INC. 10K09 EXHIBIT 10.38 - NL INDUSTRIES INC | nl10k08exhibit10_38.htm |
| EX-10.40 - NL INDUSTRIES, INC. 10K09 EXHIBIT 10.40 - NL INDUSTRIES INC | nl10k08exhibit10_40.htm |
| EX-10.39 - NL INDUSTRIES, INC. 10K09 EXHIBIT 10.39 - NL INDUSTRIES INC | nl10k08exhibit10_39.htm |
| EX-10.35 - NL INDUSTRIES, INC. 10K09 EXHIBIT 10.35 - NL INDUSTRIES INC | nl10k08exhibit10_35.htm |
|
SECURITIES
AND EXCHANGE COMMISSION
|
|
|
Washington,
D.C. 20549
|
|
|
X
FORM
10-K
|
|
|
ANNUAL
REPORT PURSUANT TO SECTION 13 OR 15(d) OF THE SECURITIES
EXCHANGE
ACT
OF 1934 - For the fiscal year ended December
31, 2009
|
|
|
Commission
file number 1-640
|
|
|
NL
INDUSTRIES, INC.
|
|
|
(Exact
name of Registrant as specified in its charter)
|
|
|
New
Jersey
|
13-5267260
|
|
(State
or other jurisdiction of
incorporation
or organization)
|
(IRS
Employer
Identification
No.)
|
|
5430 LBJ Freeway, Suite 1700, Dallas,
Texas
|
75240-2697
|
|
(Address
of principal executive offices)
|
(Zip
Code)
|
|
Registrant's
telephone number, including area
code: (972) 233-1700
|
|
|
Securities
registered pursuant to Section 12(b) of the Act:
|
|
|
Title of each class
|
Name
of each exchange on
which
registered
|
|
Common
stock
|
New
York Stock Exchange
|
Securities
registered pursuant to Section 12(g) of the Act:
None.
Indicate
by check mark:
If
the Registrant is a well-known seasoned issuer, as defined in Rule 405 of the
Securities Act. Yes No
X
If
the Registrant is not required to file reports pursuant to Section 13 or Section
15(d) of the Act. Yes No
X
Whether
the Registrant (1) has filed all reports required to be filed by Section 13 or
15(d) of the Securities Exchange Act of 1934 during the preceding 12 months and
(2) has been subject to such filing requirements for the past 90
days. Yes X No
Whether
the registrant has submitted electronically and posted on its corporate Web
site, if any, every Interactive Data File required to be submitted and posted
pursuant to Rule 405 of Regulation S-T during the preceding 12 months (or for
such shorter period that the registrant was required to submit and post such
files). * Yes No
|
·
|
The
registrant has not yet been phased into the interactive data
requirements.
|
If
disclosure of delinquent filers pursuant to Item 405 of Regulation S-K is not
contained herein, and will not be contained, to the best of Registrant's
knowledge, in definitive proxy or information statements incorporated by
reference in Part III of this Form 10-K or any amendment to this Form 10-K. Yes
X No
Whether
the Registrant is a large accelerated filer, an accelerated filer, a
non-accelerated filer or a smaller reporting company (as defined in Rule 12b-2
of the Act). Large accelerated filer
Accelerated filer X Non-accelerated
filer
Smaller reporting company
Whether
the Registrant is a shell company (as defined in Rule 12b-2 of the Act). Yes
No
X
The
aggregate market value of the 6.9 million shares of voting stock held by
nonaffiliates of NL Industries, Inc. as of June 30, 2009 (the last business day
of the Registrant's most recently-completed second fiscal quarter) approximated
$51 million.
As
of February 25, 2010, 48,621,934 shares of the Registrant's common stock were
outstanding.
Documents incorporated by
reference
The
information required by Part III is incorporated by reference from the
Registrant's definitive proxy statement to be filed with the Commission pursuant
to Regulation 14A not later than 120 days after the end of the fiscal year
covered by this report.
PART
I
|
|
ITEM
1. BUSINESS
|
The
Company
NL
Industries, Inc. was organized as a New Jersey corporation in
1891. Our common stock trades on the New York Stock Exchange, or the
NYSE, under the symbol NL. References to “NL Industries,” “NL,” the
“Company,” the “Registrant,” “we,” “our,” “us” and similar terms mean NL
Industries, Inc. and its subsidiaries and affiliate, unless the context
otherwise requires.
Our
principal executive offices are located at Three Lincoln Center, 5430 LBJ
Freeway, Suite 1700, Dallas, TX 75240. Our telephone number is (972)
233-1700. We maintain a website at www.nl-ind.com.
Business
Summary
We are
primarily a holding company. We operate in the component products
industry through our majority-owned subsidiary, CompX International Inc. (NYSE:
CIX). We operate in the chemicals industry through our
non-controlling interest in Kronos Worldwide, Inc. CompX (NYSE: CIX)
and Kronos (NYSE: KRO), each file periodic reports with the Securities and
Exchange Commission (“SEC”).
Organization
We are
majority-owned by Valhi, Inc. (NYSE: VHI). At December 31, 2009,
Valhi owned approximately 83% of our outstanding common
stock. Subsidiaries of Contran Corporation owned approximately 93% of
Valhi’s outstanding common stock at December 31, 2009. Substantially
all of Contran's outstanding voting stock is held by trusts established for the
benefit of certain children and grandchildren of Harold C. Simmons (for which
Mr. Simmons is the sole trustee) or is held directly by Mr. Simmons or other
persons or entities related to Mr. Simmons. Consequently, Mr. Simmons
may be deemed to control Contran, Valhi and us.
Forward-looking
Statements
This
Annual Report on Form 10-K contains forward-looking statements within the
meaning of the Private Securities Litigation Reform Act of 1995, as amended.
Statements in this Annual Report that are not historical facts are
forward-looking in nature and represent management’s beliefs and assumptions
based on currently available information. In some cases, you can
identify forward-looking statements by the use of words such as "believes,"
"intends," "may," "should," "could," "anticipates," "expects" or comparable
terminology, or by discussions of strategies or trends. Although we
believe that the expectations reflected in such forward-looking statements are
reasonable, we do not know if these expectations will be
correct. Such statements by their nature involve substantial risks
and uncertainties that could significantly impact expected results. Actual
future results could differ materially from those predicted. The
factors that could cause actual future results to differ materially from those
described herein are the risks and uncertainties discussed in this Annual Report
and those described from time to time in our other filings with the SEC include,
but are not limited to, the following:
|
·
|
Future
supply and demand for our products,
|
|
·
|
The
extent of the dependence of certain of our businesses on certain market
sectors,
|
|
·
|
The
cyclicality of our businesses (such as Kronos’ titanium dioxide pigments
(“TiO2”)
operations),
|
|
·
|
Customer
inventory levels (such as the extent to which Kronos’ customers may, from
time to time, accelerate purchases of TiO2 in
advance of anticipated price increases or defer purchases of TiO2 in
advance of anticipated price
decreases),
|
|
·
|
Changes
in raw material and other operating costs (such as energy and steel
costs),
|
|
·
|
General
global economic and political conditions (such as changes in the level of
gross domestic product in various regions of the world and the impact of
such changes on demand for, among other things, TiO2 and
component products),
|
|
·
|
Possible
disruption of our business or increases in the cost of doing business
resulting from terrorist activities or global
conflicts,
|
|
·
|
Competitive
products and prices, including increased competition from low-cost
manufacturing sources (such as
China),
|
|
·
|
Customer
and competitor strategies,
|
|
·
|
Potential
consolidation or solvency of our
competitors,
|
|
·
|
Demand
for office furniture,
|
|
·
|
Demand
for high performance marine
components,
|
|
·
|
Substitute
products,
|
|
·
|
The
impact of pricing and production
decisions,
|
|
·
|
Competitive
technology positions,
|
|
·
|
The
introduction of trade barriers,
|
|
·
|
Service
industry employment levels,
|
|
·
|
Fluctuations
in currency exchange rates (such as changes in the exchange rate between
the U.S. dollar and each of the euro, the Norwegian krone, the Canadian
dollar and the New Taiwan dollar),
|
|
·
|
Operating
interruptions (including, but not limited to, labor disputes, leaks,
natural disasters, fires, explosions, unscheduled or unplanned downtime
and transportation interruptions),
|
|
·
|
The
timing and amounts of insurance
recoveries,
|
|
·
|
Our
ability to maintain sufficient
liquidity,
|
|
·
|
The
extent to which our subsidiaries were to become unable to pay us
dividends,
|
|
·
|
CompX’s
and Kronos’ ability to renew or refinance credit
facilities,
|
|
·
|
CompX’s
ability to comply with covenants contained in its revolving bank credit
facility
|
|
·
|
The
ultimate outcome of income tax audits, tax settlement initiatives or other
tax matters,
|
|
·
|
Potential
difficulties in integrating completed or future
acquisitions,
|
|
·
|
Decisions
to sell operating assets other than in the ordinary course of
business,
|
|
·
|
Uncertainties
associated with the development of new product
features,
|
|
·
|
Our
ability to utilize income tax attributes or changes in income tax rates
related to such attributes, the benefits of which have been recognized
under the more-likely-than-not recognition
criteria,
|
|
·
|
Environmental
matters (such as those requiring compliance with emission and discharge
standards for existing and new facilities or new developments regarding
environmental remediation at sites related to our former
operations),
|
|
·
|
Government
laws and regulations and possible changes therein (such as changes in
government regulations which might impose various obligations on present
and former manufacturers of lead pigment and lead-based paint, including
us, with respect to asserted health concerns associated with the use of
such products),
|
|
·
|
The
ultimate resolution of pending litigation (such as our lead pigment and
environmental matters) and
|
|
·
|
Possible
future litigation.
|
Should
one or more of these risks materialize or if the consequences of such a
development worsen, or should the underlying assumptions prove incorrect, actual
results could differ materially from those currently forecasted or
expected. We disclaim any intention or obligation to update or revise
any forward-looking statement whether as a result of changes in information,
future events or otherwise.
Operations
and equity investment
Information
regarding our operations and the companies conducting such operations is set
forth below. Geographic financial information is included in Note 3
to the Consolidated Financial Statements, which is incorporated herein by
reference.
|
Component
Products
CompX
International Inc. - 87%
owned
at December 31, 2009
|
CompX
is a leading manufacturer of security products, precision ball bearing
slides and ergonomic computer support systems used in the office
furniture, transportation, postal, tool storage, appliance and a variety
of other industries. CompX is also a leading manufacturer of
stainless steel exhaust systems, gauges and throttle controls for the
performance marine industry. CompX has production facilities in
North America and Asia.
|
|
Chemicals
Kronos
Worldwide, Inc. – 36%
owned
at December 31, 2009
|
Kronos
is a leading global producer and marketer of value-added TiO2
pigments, which are used for imparting whiteness, brightness and opacity
to a diverse range of customer applications and end-use markets, including
coatings, plastics, paper and other industrial and consumer
"quality-of-life" products. Kronos has production
facilities in Europe and North America. Sales of TiO2
represented about 90% of Kronos’ total sales in 2009, with sales of
other products that are complementary to Kronos’ TiO2
business comprising the
remainder.
|
COMPONENT
PRODUCTS - COMPX INTERNATIONAL INC.
Industry Overview
- Through our majority-owned subsidiary, CompX, we manufacture components
that are sold to a variety of industries including office furniture,
recreational transportation (including performance boats), mailboxes, tool
boxes, appliances, banking equipment, vending equipment, computers and related
equipment. Approximately 34% of CompX’s total sales in 2009 are to
the office furniture manufacturing industry, compared to 33% in 2008 and 32% in
2007. We believe that our emphasis on new product features and sales
of our products to additional markets has resulted in our potential for higher
rates of earnings growth and diversification of risk.
Manufacturing,
Operations and Products – CompX’s Security Products business, with a
manufacturing facility in South Carolina and one in Illinois shared with the
Marine Components business, manufactures locking mechanisms and other security
products for sale to the postal, transportation, office and institutional
furniture, toolbox, banking, vending, general cabinetry and other
industries. We believe that CompX is a North American market leader
in the manufacture and sale of cabinet locks and other locking
mechanisms. CompX’s security products are used in a variety of
applications including ignition systems, mailboxes, toolboxes, vending and
gaming machines, parking meters, electrical circuit panels, storage
compartments, office furniture and medical cabinet security. These
products include:
|
·
|
disc
tumbler locks which provide moderate security and generally represent the
lowest cost lock to produce;
|
|
·
|
pin
tumbler locking mechanisms which are more costly to produce and are used
in applications requiring higher levels of security, including CompX’s
KeSet high
security system, which allows the user to change the keying on a single
lock 64 times without removing the lock from its enclosure;
and
|
|
·
|
innovative
eLock electronic locks which provide stand-alone or networked security and
audit trail capability for drug storage and other valuables through the
use of a proximity card, magnetic stripe or keypad
credentials.
|
A
substantial portion of CompX’s Security Products sales consist of products with
specialized adaptations to an individual manufacturer’s specifications, some of
which are listed above. CompX also has a standardized product line
suitable for many customers, which is offered through a North American
distribution network to lock distributors and to smaller original equipment
manufacturers (“OEMs”) via its STOCK LOCKS distribution
program.
CompX’s
Furniture Components business, with facilities in Canada, Michigan and Taiwan,
manufactures a complete line of precision ball bearing slides and ergonomic
computer support systems for use in applications such as computer-related
equipment, appliances, tool storage cabinets, imaging equipment, file cabinets,
desk drawers, automated teller machines and other applications. These
products include:
|
·
|
the
patented Integrated
Slide Lock which allows a file cabinet manufacturer to reduce the
possibility of multiple drawers being opened at the same
time;
|
|
·
|
the
patented adjustable Ball
Lock which reduces the risk of heavily-filled drawers, such as auto
mechanic tool boxes, from opening while in
movement;
|
|
·
|
the
Self-Closing
Slide, which is designed to assist in closing a drawer and is used
in applications such as bottom-mount
freezers;
|
|
·
|
articulating
computer keyboard support arms (designed to attach to desks in the
workplace and home office environments to alleviate possible user strains
and stress and maximize usable workspace), along with the patented LeverLock keyboard arm,
which is designed to make ergonomic adjustments to the keyboard arm
easier;
|
|
·
|
CPU
storage devices which minimize adverse effects of dust and moisture;
and
|
|
·
|
complementary
accessories, such as ergonomic wrist rest aids, mouse pad supports and
flat screen computer monitor support
arms.
|
CompX’s
Marine Components business, with a facility in Wisconsin and a facility in
Illinois shared with the Security Products business, manufactures and
distributes marine instruments, hardware and accessories for performance
boats. CompX’s specialty marine component products are high
performance components designed to operate within precise tolerances in the
highly corrosive marine environment. These products
include:
|
·
|
original
equipment and aftermarket stainless steel exhaust headers, exhaust pipes,
mufflers and other exhaust
components;
|
|
·
|
high
performance gauges such as GPS speedometers and
tachometers;
|
|
·
|
controls,
throttles, steering wheels and other billet accessories;
and
|
|
·
|
dash
panels, LED lighting, rigging and other
accessories.
|
CompX
operated six manufacturing facilities at December 31, 2009 including one
facility in Grayslake, Illinois that houses operations relating to Security
Products and Marine Components.
|
Security Products
|
Furniture Components
|
Marine Components
|
||
|
Mauldin,
SC
Grayslake,
IL
|
Kitchener,
Ontario
Byron
Center, MI
Taipei,
Taiwan
|
Neenah,
WI
Grayslake,
IL
|
Raw
Materials - CompX’s
primary raw materials are:
|
·
|
zinc,
copper and brass (used in the Security Products business for the
manufacture of locking mechanisms);
|
|
·
|
coiled
steel (used in the Furniture Components business for the manufacture of
precision ball bearing slides and ergonomic computer support
systems);
|
|
·
|
stainless
steel (used in the Marine Components business for the manufacture of
exhaust headers, pipes and other components);
and
|
|
·
|
plastic
resins (primarily used in the Furniture Components business for injection
molded plastics in the manufacture of ergonomic computer support
systems).
|
These raw
materials are purchased from several suppliers and are readily available from
numerous sources and accounted for approximately 18% of our total cost of goods
sold for 2009.
CompX
occasionally enters into raw material arrangements to mitigate the short-term
impact of future increases in raw material costs that are affected by commodity
markets. While these arrangements do not necessarily commit us to a
minimum volume of purchases, they generally provide for stated unit prices based
upon achievement of specified purchase volumes. We utilize purchase
arrangements to stabilize our raw material prices provided we meet the specified
minimum monthly purchase quantities. Commodity-related raw materials
purchased outside of these arrangements are sometimes subject to unanticipated
and sudden price increases. We generally seek to mitigate the impact
of fluctuations in raw material costs on our margins through improvements in
production efficiencies or other operating cost reductions. In the
event we are unable to offset raw material cost increases with other cost
reductions, it may be difficult to recover those cost increases through
increased product selling prices or raw material surcharges due to the
competitive nature of the markets served by our
products. Consequently, overall operating margins can be affected by
commodity-related raw material cost pressures. Commodity market
prices are cyclical, reflecting overall economic trends and specific
developments in consuming industries.
Patents and
Trademarks – CompX holds a number of
patents relating to component products, certain of which are believed to be
important to its continuing business activity. Patents generally have
a term of 20 years, and CompX’s patents have remaining terms ranging from less
than one year to 15 years at December 31, 2009. CompX’s major
trademarks and brand names include:
|
Furniture
Components
|
Security
Products
|
Marine
Components
|
||
|
CompX
Precision Slides®
|
CompX
Security Products®
|
Custom
Marine®
|
||
|
CompX
Waterloo®
|
National
Cabinet Lock®
|
Livorsi
Marine®
|
||
|
CompX
ErgonomX®
|
Fort
Lock®
|
CMI
Industrial Mufflers™
|
||
|
CompX
DurISLide®
|
Timberline®
|
Custom
Marine Stainless
|
||
|
Dynaslide®
|
Chicago
Lock®
|
Exhaust™
|
||
|
Waterloo
Furniture
|
STOCK
LOCKS®
|
The
#1 Choice in
|
||
|
Components
Limited®
|
KeSet®
|
Performance
Boating®
|
||
|
TuBar®
|
Mega
Rim™
|
|||
|
ACE
II®
|
Race
Rim™
|
|||
|
CompX
eLock®
|
CompX
Marine™
|
|||
|
Lockview®
Software
|
Sales, marketing
and distribution - CompX
sells components directly to large OEM customers through factory-based sales and
marketing professionals and with engineers working in concert with field
salespeople and independent manufacturers' representatives. CompX
selects manufacturers' representatives based on special skills in certain
markets or relationships with current or potential customers.
A
significant portion of CompX’s sales are also made through
distributors. CompX has a significant market share of cabinet lock
sales as a result of the locksmith distribution channel. CompX
supports distributor sales with a line of standardized products used by the
largest segments of the marketplace. These products are packaged and
merchandised for easy availability and handling by distributors and end
users. Due to CompX’s success with the STOCK LOCKS inventory program
within the Security Products business, similar programs have been implemented
for distributor sales of ergonomic computer support systems within the Furniture
Components business.
In 2009,
our ten largest customers accounted for approximately 39% of our total sales;
however, no one customer accounted for sales of 10% or more in
2009. Of the 39% of total sales, 18% (7 customers) was related to
Security Products sales and 21% (7 customers) was related to Furniture
Components sales, including 4 customers for which we sell both Security Products
and Furniture Components. Overall, our customer base is diverse and
the loss of any single customer would not have a material adverse effect on our
operations.
Competition
- CompX
operates in highly competitive markets, and competes primarily on the basis of
product design, including ergonomic and aesthetic factors, product quality and
durability, price, on-time delivery, service and technical
support. CompX focuses efforts on the middle- and high-end segments
of the market, where product design, quality, durability and service are valued
by the customer. CompX’s Marine Components business competes with
small domestic manufacturers and is minimally affected by non-U.S.
competitors. The Security Products and Furniture Components
businesses compete against a number of domestic and non-U.S.
manufacturers.
International
Operations - CompX
has substantial operations and assets located outside the United States,
principally Furniture Component operations in Canada and Taiwan. The
majority of our 2009 non-U.S. sales are to customers located in
Canada. These operations are subject to, among other things, currency
exchange rate fluctuations. Our results of operations have in the
past been both favorably and unfavorably affected by fluctuations in currency
exchange rates. Political and economic uncertainties in certain of
the countries in which we operate may expose us to risk of loss. We
do not believe that there is currently any likelihood of material loss through
political or economic instability, seizure, nationalization or similar
events. We cannot predict, however, whether events of this type in
the future could have a material effect on our operations. See Item 7
- "Management's Discussion and Analysis of Financial Condition and Results of
Operations" and Item 7A – "Quantitative and Qualitative Disclosures About Market
Risk."
Regulatory and
Environmental Matters - CompX’s operations are subject to federal, state,
local and non-U.S. laws and regulations relating to the use, storage, handling,
generation, transportation, treatment, emission, discharge, disposal,
remediation of and exposure to hazardous and non-hazardous substances, materials
and wastes ("Environmental Laws"). CompX’s operations are also
subject to federal, state, local and non-U.S. laws and regulations relating to
worker health and safety. We believe that CompX is in substantial
compliance with all such laws and regulations. To date, the costs of
maintaining compliance with such laws and regulations have not significantly
impacted our results. We currently do not anticipate any significant
costs or expenses relating to such matters; however, it is possible future laws
and regulations may require us to incur significant additional
expenditures.
Employees - As of December 31, 2009,
CompX employed the
following number of people:
|
United
States
|
528
|
|
Canada(1)
|
211
|
|
Taiwan
|
76
|
|
Total
|
815
|
|
(1)
|
Approximately
77% of the Canadian employees are represented by a labor union covered by
a collective bargaining agreement that expires in January 2012 which
provides for wage increases from 0% to 1% over the term of the
contract.
|
We
believe our labor relations are good at all of our facilities.
CHEMICALS
- KRONOS WORLDWIDE, INC.
Business
Overview -
Kronos is a leading global producer and marketer of value-added titanium
dioxide pigments. Kronos, along with its distributors and agents,
sells and provides technical services for its products to over 4,000 customers
in approximately 100 countries with the majority of sales in Europe and North
America. We believe that Kronos has developed considerable expertise
and efficiency in the manufacture, sale, shipment and service of its products in
domestic and international markets.
TiO2 is an
inorganic pigment used to impart whiteness, brightness and opacity for products
such as coatings, plastics, paper, fibers, food, ceramics and
cosmetics. TiO2 is
considered a “quality-of-life” product with demand and growth affected by gross
domestic product and overall economic conditions in markets in various parts of
the world. TiO2 derives
its value from its whitening properties and hiding power (opacity), which is the
ability to cover or mask other materials effectively and
efficiently. TiO2 is the
largest commercially-used whitening pigment because it has a high refractive
rating giving it more hiding power than any other commercially-produced white
pigment. In addition, TiO2 has
excellent resistance to interaction with other chemicals, good thermal stability
and resistance to ultraviolet degradation. Kronos ships TiO2 to
customers in either a powder or slurry form via rail, truck or ocean
carrier. Kronos, including its predecessors, has produced and
marketed TiO2 in North
America and Europe for over 80 years.
We
believe that Kronos is the second-largest producer of TiO2 in Europe
with approximately one-half of Kronos’ 2009 sales volumes attributable to
markets in Europe. The table below shows Kronos’ market share for its
significant markets, Europe and North America, for the last three
years:
|
2007
|
2008
|
2009
|
|
|
Europe
|
19%
|
19%
|
19%
|
|
North
America
|
15%
|
16%
|
16%
|
Per
capita utilization of TiO2 in the
United States and Western Europe far exceeds that of other areas in the
world. We expect these markets to continue to be the largest
consumers of TiO2 for the
foreseeable future. It is probable that significant markets for
TiO2
could emerge in other areas of the world. China continues to develop
into a significant market and as its economy continues to mature it is probable
that quality-of-life products, including TiO2, will
experience greater demand in that country. In addition, growth in
recent years in Eastern Europe and the Far East has been significant as the
economies in these regions continue developing to the point that quality-of-life
products, including TiO2,
experience greater demand. Industry demand declined in Eastern Europe
significantly in 2009 due to the global economic crisis.
Sales of
TiO2
comprised about 90% of Kronos’ net sales in 2009. The remaining 10%
of net sales is made up of other product lines that are complementary to
TiO2. These
other products are described as follows:
|
·
|
Kronos
owns and operates two ilmenite mines in Norway pursuant to a governmental
concession with an unlimited term. Kronos commenced production
from its second mine in 2009. Ilmenite is a raw material used
directly as a feedstock by some sulfate-process TiO2
plants, including all of its European sulfate-process
plants. Kronos also sells ilmenite ore to third-parties, some
of whom are competitors. The mines have estimated aggregate
reserves which are expected to last for at least another 60
years.
|
|
·
|
Kronos
manufactures and sells iron-based chemicals that are co-products and
processed co-products of TiO2
pigment production. These co-product chemicals are marketed
through Kronos’ Ecochem division and are primarily used as treatment and
conditioning agents for industrial effluents and municipal wastewater as
well as in the manufacture of iron pigments, cement and agricultural
products.
|
|
·
|
Kronos
manufactures and sells titanium oxychloride and titanyl sulfate which are
side-stream specialty products from the production of TiO2. Titanium
oxychloride is used in specialty applications in the formulation of
pearlescent pigments and in the production of electroceramic capacitors
for cell phones and other electronic devices. Titanyl sulfate
products are used in pearlescent pigments, natural gas pipe and other
specialty applications.
|
Manufacturing and
operation - Kronos currently produces over 40 different TiO2; grades
under the KronosTM
trademark which provide a variety of performance properties to meet customers’
specific requirements. Kronos’ major customers include domestic and
international paint, plastics and paper manufacturers.
Extenders,
such as kaolin clays, calcium carbonate and polymeric opacifiers, are used in a
number of the same end-use markets as white pigments. However, the opacity in
these products is not able to duplicate the performance characteristics of
TiO2;
therefore we believe these products are not effective substitutes for TiO2.
Kronos
produces TiO2
in two crystalline forms: rutile and anatase. Rutile TiO2 is
manufactured using both a chloride production process and a sulfate production
process, whereas anatase TiO2 is only
produced using a sulfate production process. Chloride process rutile
is preferred for the majority of customer applications. From a
technical standpoint, chloride process rutile has a bluer undertone and higher
durability than sulfate process rutile. Although many end-use
applications can use either form, chloride process rutile is the preferred form
for use in coatings and plastics, the two largest end-use
markets. Sulfate process anatase represents a much smaller percentage
of annual global TiO2 production
and is preferred for use in selected paper products, ceramics, rubber tires,
man-made fibers, food and cosmetics.
Chloride production
process -
Approximately three-fourths of Kronos’ current production capacity is based on
the chloride process. The chloride process is a continuous process in
which chlorine is used to extract rutile TiO2. The
chloride process typically has lower manufacturing costs than the sulfate
process due to newer technology, higher yield, less waste, lower energy
requirements and lower labor costs. The chloride process produces
less waste than the sulfate process because much of the chlorine is recycled and
feedstock bearing a higher titanium content is used.
Sulfate production process -
The sulfate process is a batch chemical process that uses sulfuric acid to
extract both rutile and anatase TiO2. In
addition to the factors indicated above, the higher production costs associated
with the sulfate process result in part from the need to process the spent
sulfuric acid remaining at the end of the production process.
Once an
intermediate TiO2 pigment
has been produced by either the chloride or sulfate process, it is “finished”
into products with specific performance characteristics for particular end-use
applications through proprietary processes involving various chemical surface
treatments and intensive micronizing (milling). Due to environmental
factors and customer considerations, the proportion of TiO2 industry
sales represented by chloride process pigments has increased relative to sulfate
process pigments and, in 2009, chloride process production facilities
represented approximately 60% of industry capacity.
Kronos
produced 402,000 metric tons of TiO2 in 2009,
down from the 514,000 metric tons produced in 2008. Such production
amounts include Kronos’ 50% interest in the TiO2
manufacturing joint-venture discussed below. Kronos’ average
production capacity utilization rates were near full capacity in 2007 and 2008
and approximately 76% in 2009. In late 2008, and as a result of the
sharp decline in global demand, Kronos experienced a build up in its inventory
levels. In order to decrease inventory levels and improve liquidity,
Kronos implemented production curtailments during the first half of
2009. Consequently, average production capacity utilization rates
were approximately 58% during the first half of 2009 as compared to 94% during
the second half of 2009.
Kronos’
production capacity has increased by approximately 30% over the past ten years
due to debottlenecking programs with only moderate capital
expenditures. We believe that Kronos’ annual attainable production
capacity for 2010 is approximately 532,000 metric tons and we currently expect
that Kronos will operate at approximately 90% to 95% of attainable capacity. See
Kronos’ Outlook in Item 7. Management’s Discussion and Analysis
of Financial Condition and Results of Operations.
Kronos
operated the following six TiO2
facilities, two slurry facilities and two ilmenite mines at December 31,
2009. Kronos owns all such facilities, unless otherwise
indicated.
|
Location
|
Description
|
|
|
Leverkusen,
Germany (1)
|
TiO2
production, Chloride and sulfate
process, co-products
|
|
|
Nordenham,
Germany
|
TiO2
production, Sulfate process, co-products
|
|
|
Langerbrugge,
Belgium
|
TiO2
production, Chloride process, co-products, titanium chemicals
products
|
|
|
Fredrikstad,
Norway (2)
|
TiO2
production, Sulfate process, co-products
|
|
|
Varennes,
Quebec
|
TiO2
production, Chloride and sulfate process, slurry facility, titanium
chemicals products
|
|
|
Lake
Charles, Louisiana (3)
|
TiO2
production, Chloride process
|
|
|
Lake
Charles, Louisiana
|
Slurry
facility
|
|
|
Hauge
i Dalane, Norway
|
Ilmenite
mines
|
|
|
(1)
|
The
Leverkusen facility is located within an extensive manufacturing complex
owned by Bayer AG. Kronos owns the Leverkusen facility, which
represents about one-third of its current TiO2
production capacity, but Kronos leases the land under the facility from
Bayer under a long term agreement which expires in 2050. Lease
payments are periodically negotiated with Bayer for periods of at least
two years at a time. Bayer provides some raw materials,
including chlorine, auxiliary and operating materials, utilities and
services necessary to operate the Leverkusen facility under separate
supplies and services agreements.
|
|
|
(2)
|
The
Fredrikstad plant is located on public land and is leased until 2013, with
an option to extend the lease for an additional 50
years.
|
|
|
(3)
|
Kronos
operates this facility in a 50/50 joint venture with
Huntsman.
|
Raw materials
- The primary raw materials used in chloride process TiO2 are
titanium-containing feedstock (natural rutile ore or purchased slag), chlorine
and coke. Chlorine and coke are available from a number of
suppliers. Titanium-containing feedstock suitable for use in the
chloride process is available from a limited but increasing number of suppliers
principally in Australia, South Africa, Canada, India and the United
States. Kronos purchases chloride process grade slag from Rio Tinto
Iron and Titanium under a long-term supply contract that expires at the end of
2011. Kronos purchases natural rutile ore primarily from Iluka
Resources, Limited under a long-term supply contract that expires at the end of
2014. Kronos has in the past been, and expects that in the future
will continue to be, successful in obtaining long-term extensions to these and
other existing supply contracts prior to their expiration. Kronos
expects the raw materials purchased under these contracts to meet its chloride
process feedstock requirements over the next several years.
The
primary raw materials used in sulfate process TiO2 are
titanium-containing feedstock primarily ilmenite or purchased sulfate-grade slag
and sulfuric acid. Sulfuric acid is available from a number of
suppliers. Titanium-containing feedstock suitable for use in the
sulfate process is available from a limited number of suppliers principally in
Norway, Canada, Australia, India and South Africa. As one of the few
vertically- integrated producers of sulfate process TiO2, Kronos
owns and operates rock ilmenite mines in Norway, which provided all of the
feedstock for its European sulfate process TiO2 plants in
2009. We expect that ilmenite production from the mine will meet
Kronos’ European sulfate process feedstock requirements for the foreseeable
future. For Kronos’ Canadian sulfate process plant, Kronos also
purchases sulfate grade slag primarily from Q.I.T. Fer et Titane Inc. (a
subsidiary of Rio Tinto Iron and Titanium), under a long-term supply contract
that expires at the end of 2014 and Eramet Titanium & Iron AS (formerly
Tinfos Titan and Iron KS) under a supply contract that expires in
2010. We expect the raw materials purchased under these contracts to
meet Kronos’ sulfate process feedstock requirements over the next few
years.
Many of
Kronos’ raw material contracts contain fixed quantities it is required to
purchase, although these contracts allow for an upward or downward adjustment in
the quantity purchased. The pricing under these agreements is
generally negotiated annually.
The following table summarizes raw
materials Kronos purchased or mined in 2009.
|
Production Process/Raw
Material
|
Raw Materials Procured or
Mined
|
|
(In
thousands of metric tons)
|
|
|
Chloride
process plants:
|
|
|
Purchased
slag or natural rutile ore
|
351
|
|
Sulfate
process plants:
|
|
|
Raw
ilmenite ore mined & used internally
|
226
|
|
Purchased
slag
|
13
|
TiO2 manufacturing
joint venture -
Kronos holds a 50% interest in a manufacturing joint venture with
Huntsman Corporation (Huntsman). The joint venture owns and operates
a chloride process TiO2 facility
located in Lake Charles, Louisiana. Kronos shares production from the
plant equally with Huntsman pursuant to separate offtake
agreements.
A
supervisory committee directs the business and affairs of the joint venture,
including production and output decisions. This committee is composed
of four members, two of whom Kronos appoints and two of whom Huntsman
appoints. Two general managers manage the operations of the joint
venture acting under the direction of the supervisory
committee. Kronos appoints one general manager and Huntsman appoints
the other.
Kronos is
required to purchase one-half of the TiO2 produced
by the joint venture. The joint venture is not consolidated in
Kronos’ financial statements because Kronos does not control
it. Kronos accounts for its interest in the joint venture by the
equity method. The joint venture operates on a break-even basis, and
therefore Kronos does not have any equity in earnings of the joint
venture. Kronos shares all costs and capital expenditures of the
joint venture equally with Huntsman with the exception of raw material and
packaging costs for the pigment grades produced. Kronos’ share of the
net costs is reported as cost of sales as the related TiO2 is
sold.
Competition
– The TiO2 industry
is highly competitive. Kronos’ principal competitors are E.I. du Pont
de Nemours & Co.; Millennium Inorganic Chemicals, Inc. (a subsidiary of
National Titanium Dioxide Company Ltd. (Cristal)); Huntsman; Tronox Incorporated
and Sachtleben Chemie. These competitors have estimated individual
shares of TiO2 production
capacity ranging from 4% (for Sachtleben) to 22% (for DuPont) and an estimated
aggregate share of worldwide TiO2 production
volume of approximately 60%. DuPont has over one-half of total North
American TiO2 production
capacity and is Kronos’ principal North American competitor. Tronox
filed for Chapter 11 bankruptcy protection in January 2009 and has continued to
operate as a debtor-in-possession since that date. In December 2009,
Tronox announced its intention to restructure and emerge from Chapter
11. It remains unclear how and to what extent Tronox or a successor
will compete in the TiO2 industry
at the conclusion of Tronox’s bankruptcy proceedings.
Kronos
competes primarily on the basis of price, product quality, technical service and
the availability of high-performance pigment grades. Although certain
TiO2
grades are considered specialty pigments, the majority of Kronos’ grades and
substantially all of Kronos’ production are considered commodity pigments with
price being one of the most significant competitive factors along with quality
and customer service. We believe that Kronos is the leading seller of
TiO2
in several countries, including Germany, with an estimated 13% share of
worldwide TiO2 sales
volume in 2009. Overall, Kronos is the world’s fourth-largest
producer of TiO2.
Over the
past ten years, Kronos and its competitors have increased industry capacity
through debottlenecking projects. Although overall industry pigment
demand is expected to be higher in 2010 as compared to 2009 as a result of
improving worldwide economic conditions, we do not expect any significant
efforts will be undertaken by Kronos or its competitors to further increase
capacity through such projects for the foreseeable future. If actual
developments differ from our expectations, Kronos’ and the TiO2 industry's
performance could be unfavorably affected.
Worldwide
capacity additions in the TiO2 market
resulting from construction of new plants require significant capital
expenditures and substantial lead time (typically three to five years in our
experience). We are not aware of any TiO2 plants
currently under construction, and we believe that it is not likely any new
plants will be constructed in Europe or North America in the foreseeable
future.
Research and
development – Kronos’
research and development activities are directed primarily on improving the
chloride and sulfate production processes, improving product quality and
strengthening Kronos’ competitive position by developing new pigment
applications. Kronos conducts research and development activities at
its Leverkusen, Germany facility. Kronos’ expenditures for research
and development and certain technical support programs were approximately $12
million in each of 2007, 2008 and 2009.
Kronos
continually seeks to improve the quality of its grades and has been successful
at developing new grades for existing and new applications to meet the needs of
customers and increase product life cycles. Since 2004, Kronos has
added five new grades for plastics and coatings applications.
Patents and
trademarks - We
believe that Kronos’ patents held for products and production processes are
important to Kronos and its continuing business activities. Kronos
seeks patent protection for technical developments, principally in the United
States, Canada and Europe, and from time to time enters into licensing
arrangements with third parties. Kronos’ existing patents generally
have terms of 20 years from the date of filing, and have remaining terms ranging
from less than 1 to 19 years. Kronos seeks to protect its
intellectual property rights, including its patent rights, and from time to time
Kronos engages in disputes relating to the protection and use of intellectual
property relating to its products.
Kronos’
trademarks, including KronosTM,
are protected by registration in the United States and elsewhere with respect to
those products Kronos manufactures and sells. Kronos also relies on
unpatented proprietary knowledge, continuing technological innovation and other
trade secrets to develop and maintain competitive position. Kronos’
proprietary chloride production process is an important part of its technology,
and Kronos’ business could be harmed if it failed to maintain confidentiality of
trade secrets used in this technology.
Customer base and
seasonality - Kronos sells to a diverse customer base, and no single
customer made up more than 10% of sales for 2009. Kronos’ largest ten
customers accounted for approximately 28% of sales in 2009.
Neither
Kronos’ business as a whole, nor any of its principal product groups is seasonal
to any significant extent. However, TiO2 sales are
generally higher in the second and third quarters of the year. This
is due in part to the increase in paint production in the spring to meet demand
during the spring and summer painting season.
Employees
- As of
December 31, 2009, Kronos employed the following number of people:
|
Europe
|
2,000
|
|
Canada
|
400
|
|
United
States(1)
|
40
|
|
Total
|
2,440
|
|
|
(1)Excludes
employees of the Louisiana joint
venture.
|
Kronos’
hourly employees in production facilities worldwide, including the TiO2 joint
venture, are represented by a variety of labor unions under labor agreements
with various expiration dates. Kronos’ European Union employees are
covered by master collective bargaining agreements in the chemicals industry
that are generally renewed annually. Kronos’ Canadian union employees
are covered by a collective bargaining agreement that expires in June
2010.
Regulatory and
environmental matters – Kronos’ operations are governed by various
environmental laws and regulations. Certain of Kronos’ operations
are, or have been, engaged in the handling, manufacture or use of substances or
compounds that may be considered toxic or hazardous within the meaning of
applicable environmental laws and regulations. As with other
companies engaged in similar businesses, certain past and current operations and
products of Kronos have the potential to cause environmental or other
damage. Kronos has implemented and continues to implement various
policies and programs in an effort to minimize these risks. Kronos’
policy is to maintain compliance with applicable environmental laws and
regulations at all of its facilities and to strive to improve our environmental
performance. It is possible that future developments, such as
stricter requirements in environmental laws and enforcement policies, could
adversely affect Kronos’ production, handling, use, storage, transportation,
sale or disposal of such substances and could adversely affect Kronos’
consolidated financial position and results of operations or
liquidity.
Kronos’
U.S. manufacturing operations are governed by federal environmental and worker
health and safety laws and regulations. These primarily consist of
the Resource Conservation and Recovery Act (“RCRA”), the Occupational Safety and
Health Act, the Clean Air Act, the Clean Water Act, the Safe Drinking Water Act,
the Toxic Substances Control Act and the Comprehensive Environmental Response,
Compensation and Liability Act, as amended by the Superfund Amendments and
Reauthorization Act (“CERCLA”), as well as the state counterparts of these
statutes. We believe the TiO2 plant
owned by the joint venture and a TiO2 slurry
facility Kronos owns in Lake Charles, Louisiana are in substantial compliance
with applicable requirements of these laws or compliance orders issued
thereunder. These are Kronos’ only U.S. manufacturing
facilities.
While the
laws regulating operations of industrial facilities in Europe vary from country
to country, a common regulatory framework is provided by the European Union
(“EU”). Germany and Belgium are members of the EU and follow its
initiatives. Norway is not a member but generally patterns its
environmental regulatory actions after the EU. We believe that Kronos
has obtained all required permits and is in substantial compliance with
applicable environmental requirements for its European and Canadian
facilities.
At
Kronos’ sulfate plant facilities in Germany, Kronos recycles weak sulfuric acid
either through contracts with third parties or at its own
facilities. In addition, at its German locations Kronos has a
contract with a third party to treat certain sulfate-process
effluents. At its Norwegian plant, Kronos ships spent acid to a third
party location where it is used as a neutralization agent. These
contracts may be terminated by either party after giving three or four years
advance notice, depending on the contract.
From time
to time, Kronos’ facilities may be subject to environmental regulatory
enforcement under U.S. and non-U.S. statutes. Typically Kronos
establishes compliance programs to resolve these
matters. Occasionally, Kronos may pay penalties. To date
such penalties have not involved amounts having a material adverse effect on
Kronos’ consolidated financial position, results of operations or
liquidity. We believe that all of Kronos’ facilities are in
substantial compliance with applicable environmental laws.
In
December 2006, the EU approved Registration, Evaluation and Authorization of
Chemicals (“REACH”), which took effect on June 1, 2007 and will be phased in
over 11 years. Under REACH, companies that manufacture or import more
than one ton of a chemical substance per year will be required to register such
chemical substances in a central data base. REACH affects Kronos’
European operations by imposing a testing, evaluation and registration program
for many of the chemicals Kronos uses or produces in Europe. Kronos
has established a REACH team that is working to identify and list all substances
purchased, manufactured or imported by or for Kronos in the
EU. Kronos spent $.4 million in 2007 and $.5 million in 2008 and $.7
million in 2009 on REACH compliance, and we do not anticipate that future
compliance costs will be material to Kronos.
Kronos’
capital expenditures in 2009 related to ongoing environmental compliance,
protection and improvement programs were $3.1 million, and are currently
expected to be approximately $12 million in 2010 including approximately $9.7
million for a desulfurization unit at its Belgian facility.
OTHER
In addition to our 87% ownership of
CompX and our 36% ownership of Kronos at December 31, 2009, we also own 100% of
EWI Re. Inc., an insurance brokerage and risk management services
company. We also hold certain marketable securities and other
investments. See Notes 4 and 17 to the Consolidated Financial
Statements.
Regulatory and
environmental matters –
We discuss regulatory and environmental matters in the respective
business sections contained elsewhere herein and in Item 3 - "Legal
Proceedings." In addition, the information included in Note 19 to the
Consolidated Financial Statements under the captions "Lead pigment litigation"
and "Environmental matters and litigation" is incorporated herein by
reference.
Insurance
– We maintain insurance for our businesses and operations, with customary
levels of coverage, deductibles and limits. See also Item 3 – “Legal
Proceedings – Insurance coverage claims” and Note 17 to our Consolidated
Financial Statements.
Business Strategy
– We
routinely compare our liquidity requirements and alternative uses of capital
against the estimated future cash flows we expect to receive from our
subsidiaries and affiliates. As a result of this process, we have in
the past and may in the future seek to raise additional capital, incur debt,
repurchase indebtedness in the market or otherwise, modify our dividend
policies, consider the sale of our interests in our subsidiaries, affiliates,
business units, marketable securities or other assets, or take a combination of
these and other steps, to increase liquidity, reduce indebtedness and fund
future activities. Such activities have in the past and may in the
future involve related companies. From time to time, we also evaluate
the restructuring of ownership interests among our respective subsidiaries and
related companies.
We and other entities that may be
deemed to be controlled by or that are affiliated with Mr. Harold C. Simmons
routinely evaluate acquisitions of interests in, or combinations with,
companies, including related companies, perceived by management to be
undervalued in the marketplace. These companies may or may not be
engaged in businesses related to our current businesses. In some
instances, we have actively managed the businesses acquired with a focus on
maximizing return-on-investment through cost reductions, capital expenditures,
improved operating efficiencies, selective marketing to address market niches,
disposition of marginal operations, use of leverage and redeployment of capital
to more productive assets. In other instances, we have disposed of
the acquired interest in a company prior to gaining control. We
intend to consider such activities in the future and may, in connection with
such activities, consider issuing additional equity securities and increasing
our indebtedness.
Available
information – Our fiscal year ends December 31. We furnish our
shareholders with annual reports containing audited financial
statements. In addition, we file annual, quarterly and current
reports, proxy and information statements and other information with the
SEC. Our consolidated subsidiary (CompX) and our significant equity
method investee (Kronos) also file annual, quarterly, and current reports, proxy
and information statements and other information with the SEC. We
also make our annual report on Form 10-K, quarterly reports on Form 10-Q,
current reports on Form 8-K and amendments thereto, available free of charge
through our website at www.nl-ind.com as
soon as reasonably practicable after they have been filed with the
SEC. We also provide to anyone, without charge, copies of such
documents upon written request. Such requests should be directed to
the attention of the Corporate Secretary at our address on the cover page of
this Form 10-K.
Additional
information, including our Audit Committee charter, our Code of Business Conduct
and Ethics and our Corporate Governance Guidelines can be found on our
website. Information contained on our website is not part of this
Annual Report.
The
general public may read and copy any materials we file with the SEC at the SEC’s
Public Reference Room at 100 F Street, NE, Washington, DC 20549. The
public may obtain information about the operation of the Public Reference Room
by calling the SEC at 1-800-SEC-0330. We are an electronic
filer. The SEC maintains an internet website at www.sec.gov that
contains reports, proxy and information statements and other information
regarding issuers that file electronically with the SEC, including
us.
ITEM
1A. RISK FACTORS
Listed below are certain risk factors
associated with us and our businesses. In addition to the potential
effect of these risk factors discussed below, any risk factor which could result
in reduced earnings or operating losses, or reduced liquidity, could in turn
adversely affect our ability to service our liabilities or pay dividends on our
common stock or adversely affect the quoted market prices for our
securities.
We
could incur significant costs related to legal and environmental
matters.
We
formerly manufactured lead pigments for use in paint. We and others
have been named as defendants in various legal proceedings seeking damages for
personal injury, property damage and governmental expenditures allegedly caused
by the use of lead-based paints. These lawsuits seek recovery under a
variety of theories, including public and private nuisance, negligent product
design, negligent failure to warn, strict liability, breach of warranty,
conspiracy/concert of action, aiding and abetting, enterprise liability, market
share or risk contribution liability, intentional tort, fraud and
misrepresentation, violations of state consumer protection statutes, supplier
negligence and similar claims. The plaintiffs in these actions
generally seek to impose on the defendants responsibility for lead paint
abatement and health concerns associated with the use of lead-based paints,
including damages for personal injury, contribution and/or indemnification for
medical expenses, medical monitoring expenses and costs for educational
programs. As with all legal proceedings, the outcome is
uncertain. Any liability we might incur in the future could be
material. See also Item 3 - “Legal Proceedings – Lead pigment
litigation.”
Certain
properties and facilities used in our former operations are the subject of
litigation, administrative proceedings or investigations arising under various
environmental laws. These proceedings seek cleanup costs, personal
injury or property damages and/or damages for injury to natural
resources. Some of these proceedings involve claims for substantial
amounts. Environmental obligations are difficult to assess and
estimate for numerous reasons, and we may incur costs for environmental
remediation in the future in excess of amounts currently
estimated. Any liability we might incur in the future could be
material. See also Item 3 - “Legal Proceedings – Environmental
matters and litigation.”
Our assets consist primarily of
investments in our operating subsidiaries and affiliates, and we are dependent
upon distributions from our subsidiaries and affiliates.
The
majority of our operating cash flows are generated by our operating
subsidiaries, and our ability to service liabilities and to pay dividends on our
common stock depends to a large extent upon the cash dividends or other
distributions we receive from our subsidiaries and affiliates. Our
subsidiaries and affiliates are separate and distinct legal entities and they
have no obligation, contingent or otherwise, to pay such cash dividends or other
distributions to us. In addition, the payment of dividends or other
distributions from our subsidiaries could be subject to restrictions on or
taxation of dividends or repatriation of earnings under applicable law, monetary
transfer restrictions, currency exchange regulations in jurisdictions in which
our subsidiaries operate or any other restrictions imposed by current or future
agreements to which our subsidiaries may be a party, including debt
instruments. Events beyond our control, including changes in general
business and economic conditions, could adversely impact the ability of our
subsidiaries to pay dividends or make other distributions to us. If
our subsidiaries were to become unable to make sufficient cash dividends or
other distributions to us, our ability to service our liabilities and to pay
dividends on our common stock could be adversely affected.
In this
regard, in the first quarter of 2009 Kronos announced the suspension of its
regular quarterly dividend in consideration of the challenges and opportunities
that exist in the TiO2 pigment
industry. We currently believe that we will have sufficient liquidity
to service our liabilities in 2010. See Item 7. “Management’s Discussion and
Analysis of Financial Condition and Results of Operations –
Liquidity.”
In February 2010, our Board of
Directors declared a first quarter 2010 cash dividend of $.125 per share to
shareholders of record as of March 10, 2010 to be paid on March 25,
2010. However, the declaration and payment of future dividends, and
the amount thereof, is discretionary and is dependent upon our results of
operations, financial condition, cash requirements for businesses, contractual
restrictions and other factors deemed relevant by our Board of
Directors. The amount and timing of past dividends is not necessarily
indicative of the amount or timing of any future dividends which might be
paid. There are currently no contractual restrictions on the amount
of dividends which we may pay.
In
addition, a significant portion of our assets consist of ownership interests in
our subsidiaries and affiliates. If we were required to liquidate any
of such securities in order to generate funds to satisfy our liabilities, we may
be required to sell such securities at a time or times at which we would not be
able to realize what we believe to be the actual value of such assets.
Many of the markets in which we
operate are mature and highly competitive resulting in pricing pressure and the
need to continuously reduce costs.
Many of
the markets CompX and Kronos serve are highly competitive, with a number of
competitors offering similar products. CompX focuses efforts on the
middle and high-end segment of the market where we feel that we can compete due
to the importance of product design, quality and durability to the
customer. However, our ability to effectively compete is impacted by
a number of factors. The occurrence of any of these factors could
result in reduced earnings or operating losses.
|
·
|
Competitors
may be able to drive down prices for our products because their costs are
lower than our costs, especially those located in
Asia.
|
|
·
|
Competitors'
financial, technological and other resources may be greater than our
resources, which may enable them to more effectively withstand changes in
market conditions.
|
|
·
|
Competitors
may be able to respond more quickly than we can to new or emerging
technologies and changes in customer
requirements.
|
|
·
|
Consolidation
of our competitors or customers in any of the markets in which we compete
may result in reduced demand for our
products.
|
|
·
|
New
competitors could emerge by modifying their existing production facilities
to manufacture products that compete with our
products.
|
|
·
|
Our
ability to sustain a cost structure that enables us to be
cost-competitive.
|
|
·
|
Our
ability to adjust costs relative to our
pricing.
|
|
·
|
Customers
may no longer value our product design, quality or durability over lower
cost products of our competitors.
|
Sales for certain precision slides
and ergonomic products are concentrated in the office furniture industry, which
has periodically experienced significant reductions in demand that could result
in reduced earnings or operating losses.
Sales of
CompX’s products to the office furniture manufacturing industry accounted for
approximately 34%, 33% and 32% for 2009, 2008 and 2007, respectively, of our net
sales. The future growth, if any, of the office furniture industry
will be affected by a variety of macroeconomic factors, such as service industry
employment levels, corporate cash flows and non-residential commercial
construction, as well as industry factors such as corporate reengineering and
restructuring, technology demands, ergonomic, health and safety concerns and
corporate relocations. There can be no assurance that current or future economic
or industry trends will not materially and adversely affect our
business.
Our
development of innovative features for our current component products is
critical to sustaining and growing our sales.
Historically,
CompX’s ability to provide value-added custom engineered component products that
address requirements of technology and space utilization has been a key element
of its success. We spend a significant amount of time and effort to
refine, improve and adapt our existing products for new customers and
applications. Since expenditures for these types of activities are
not considered research and development expense under accounting principles
generally accepted in the United States of America, the amount of our research
and development expenditures, which is not significant, is not indicative of the
overall effort involved in the development of new product features. The
introduction of new products and features requires the coordination of the
design, manufacturing and marketing of such products with potential
customers. The ability to coordinate these activities may be affected
by factors beyond CompX’s control. While we will continue to
emphasize the introduction of innovative new product features that target
customer-specific opportunities, we cannot assure you that any new products
CompX introduces will achieve the same degree of success that it has achieved
with its existing products. Introduction of new products typically
requires us to increase production volume on a timely basis while maintaining
product quality. Manufacturers often encounter difficulties in
increasing production volumes, including delays, quality control problems and
shortages of qualified personnel. As CompX attempts to introduce new
product features in the future, we cannot assure you that CompX will be able to
increase production volume without encountering these or other problems, which
might negatively impact our financial condition or results of
operations.
Demand
for, and prices of, certain of Kronos’ products are influenced by changing
market conditions and Kronos is currently operating in a depressed worldwide
market for its products, which may result in reduced earnings or operating
losses.
A
significant portion of our net income is attributable to sales of TiO2 by
Kronos. Approximately 90% of Kronos’ revenues are attributable to
sales of TiO2. Pricing
within the global TiO2 industry
over the long term is cyclical, and changes in economic conditions, especially
in Western industrialized nations, can significantly impact our earnings and
operating cash flows. The current world-wide economic downturn has
depressed sales volumes in 2009, principally in the first half of the year, and
we are unable to predict with a high degree of certainty when demand will return
to the levels experienced prior to the commencement of the
downturn. This may result in reduced earnings or operating
losses.
Historically,
the markets for many of Kronos’ products have experienced alternating periods of
increasing and decreasing demand. Relative changes in the selling
prices for Kronos’ products are one of the main factors that affect the level of
its profitability. In periods of increasing demand, Kronos’ selling
prices and profit margins generally will tend to increase, while in periods of
decreasing demand Kronos’ selling prices and profit margins generally tend to
decrease. Huntsman closed one of its European facilities and Tronox
closed its Savannah, Georgia facility in 2009. We believe that
further shutdowns or closures in the industry are possible. The
closures may not be sufficient to alleviate the current excess industry capacity
and such conditions may be further aggravated by anticipated or unanticipated
capacity additions or other events.
The
demand for TiO2 during a
given year is also subject to annual seasonal fluctuations. TiO2 sales are
generally higher in the second and third quarters of the year. This
is due in part to the increase in paint production in the spring to meet demand
during the spring and summer painting season.
Higher
costs or limited availability of our raw materials may decrease our
liquidity.
Certain
of the raw materials used in CompX’s products are commodities that are subject
to significant fluctuations in price in response to worldwide supply and
demand. Coiled steel is the major raw material used in the
manufacture of precision ball bearing slides and ergonomic computer support
systems. Plastic resins for injection molded plastics are also an
integral material for ergonomic computer support systems. Zinc is a
principal raw material used in the manufacture of security
products. Stainless steel tubing is the major raw material used in
the manufacture of marine exhaust systems. These raw materials are
purchased from several suppliers and are generally readily available from
numerous sources. We occasionally enter into raw material supply
arrangements to mitigate the short-term impact of future increases in raw
material costs. Materials purchased outside of these arrangements are
sometimes subject to unanticipated and sudden price increases. Should
our vendors not be able to meet their contractual obligations or should we be
otherwise unable to obtain necessary raw materials, we may incur higher costs
for raw materials or may be required to reduce production levels, either of
which may decrease our liquidity as we may be unable to offset the higher costs
with increased selling prices for our products.
Recent
and future acquisitions could subject us to a number of operational
risks.
A key
component of CompX’s strategy is to grow and diversify its business through
acquisitions. Our ability to successfully execute this component of
our strategy entails a number of risks, including:
|
·
|
the
identification of suitable growth
opportunities;
|
|
·
|
an
inaccurate assessment of acquired
liabilities;
|
|
·
|
the
entry into markets in which we may have limited or no
experience;
|
|
·
|
the
diversion of management’s attention from our core
businesses;
|
|
·
|
the
potential loss of key employees or customers of the acquired
businesses;
|
|
·
|
difficulties
in realizing projected efficiencies, synergies and cost savings
and
|
|
·
|
an
increase in our indebtedness and a limitation in our ability to access
additional capital when needed.
|
Kronos’
leverage may impair our financial condition or limit our ability to operate our
businesses.
As of
December 31, 2009, Kronos had consolidated debt of approximately $613.2 million,
which relates to Senior Secured Notes, a revolving credit facility of certain
wholly-owned subsidiaries of Kronos International, Inc. Kronos’ level
of debt could have important consequences to its stockholders (including us) and
creditors, including:
|
·
|
making
it more difficult for Kronos to satisfy its obligations with respect to
its liabilities;
|
|
·
|
increasing
its vulnerability to adverse general economic and industry
conditions;
|
|
·
|
requiring
that a portion of Kronos’ cash flows from operations be used for the
payment of interest on its debt, which reduces its ability to use cash
flow to fund working capital, capital expenditures, dividends on our
common stock, acquisitions or general corporate
requirements;
|
|
·
|
limiting
its ability to obtain additional financing to fund future working capital,
capital expenditures, dividends on its common stock, acquisitions or
general corporate requirements;
|
|
·
|
limiting
its flexibility in planning for, or reacting to, changes in Kronos’
business and the industry in which it operates
and
|
|
·
|
placing
it at a competitive disadvantage relative to other less leveraged
competitors.
|
In
addition to Kronos’ indebtedness, Kronos is party to various lease and other
agreements pursuant to which it is committed to pay approximately $383.2 million
in 2010. Kronos’ ability to make payments on and refinance its debt,
and to fund planned capital expenditures, depends on Kronos’ future ability to
generate cash flow. To some extent, this is subject to general
economic, financial, competitive, legislative, regulatory and other factors that
are beyond our control. In addition, Kronos’ ability to borrow funds
under its subsidiaries’ credit facilities in the future will in some instances
depend in part on these subsidiaries’ ability to maintain specified financial
ratios and satisfy certain financial covenants contained in the applicable
credit agreement.
Kronos’
business may not generate cash flows from operating activities sufficient to
enable Kronos to pay its debts when they become due and to fund other liquidity
needs. As a result, Kronos may need to refinance all or a portion of
its debt before maturity. Kronos may not be able to refinance any of
its debt in a timely manner on favorable terms, if at all in the current credit
markets. Any inability to generate sufficient cash flows or to
refinance Kronos’ debt on favorable terms could have a material adverse effect
on our financial condition.
Negative
worldwide economic conditions could continue to result in a decrease in our
sales and an increase in our operating costs, which could continue to adversely
affect our business and operating results.
If the
current worldwide economic downturn continues, many of CompX’s direct and
indirect customers may continue to delay or reduce their purchases of the
components we manufacture or of the products that utilize our
components. In addition, many of CompX’s customers rely on credit
financing for their working capital needs. If the negative conditions
in the global credit markets continue to prevent CompX’s customers' access to
credit, product orders may continue to decrease which could result in lower
sales. Likewise, if suppliers continue to face challenges in
obtaining credit, in selling their products or otherwise in operating their
businesses, they may become unable to continue to offer the materials CompX uses
to manufacture our products. These actions could continue to result
in reductions in our sales, increased price competition and increased operating
costs, which could adversely affect our business, results of operations and
financial condition.
Negative
global economic conditions increase the risk that we could suffer unrecoverable
losses on our customers' accounts receivable which would adversely affect our
financial results.
CompX and
Kronos extend credit and payment terms to some customers. Although we have an
ongoing process of evaluating customers' financial conditions, we could suffer
significant losses if a customer fails and/or is unable to pay. A
significant loss of an account receivable would have a negative impact on our
financial results.
Global
climate change legislation could negatively impact our financial results or
limit our ability to operate our businesses.
Kronos
and CompX operate production facilities in several countries. We
believe all of our worldwide production facilities are in substantial compliance
with applicable environmental laws. In many of the countries in which we
operate, legislation has been passed, or proposed legislation is being
considered, to limit greenhouse gases through various means including emissions
permits and/or energy taxes. In several of our production facilities, we
consume large amounts of energy, including electricity and natural gas. To
date the permit system in effect in the various countries in which we operate
has not had a material adverse effect on our financial results. However,
if greenhouse gas legislation were to be enacted in one or more countries, it
could negatively impact our future results from operations through increased
costs of production, particularly as it relates to our energy
requirements. If such increased costs of production were to
materialize, we may be unable to pass price increases onto our customers to
compensate for increased production costs, which may decrease our liquidity,
operating income and results of operations.
ITEM
1B. UNRESOLVED STAFF COMMENTS
None.
ITEM
2. PROPERTIES
Our
principal executive offices are located in an office building located at 5430
LBJ Freeway, Dallas, Texas, 75240-2697. The principal properties used
in the operations of our subsidiaries and affiliates, including certain risks
and uncertainties related thereto, are described in the applicable business
sections of Item 1 – “Business.” We believe that our facilities are
generally adequate and suitable for our respective uses.
ITEM 3. LEGAL
PROCEEDINGS
We are involved in various legal
proceedings. In addition to information that is included below, we
have included certain of the information called for by this Item in Note 19
to our Consolidated Financial Statements, and we are incorporating that
information here by reference.
Lead
pigment litigation
Our
former operations included the manufacture of lead pigments for use in paint and
lead-based paint. We, other former manufacturers of lead pigments for
use in paint and lead-based paint (together, the “former pigment manufacturers”)
and the Lead Industries Association (“LIA”), which discontinued business
operations in 2002, have been named as defendants in various legal proceedings
seeking damages for personal injury, property damage and governmental
expenditures allegedly caused by the use of lead-based
paints. Certain of these actions have been filed by or on behalf of
states, counties, cities or their public housing authorities and school
districts, and certain others have been asserted as class
actions. These lawsuits seek recovery under a variety of theories,
including public and private nuisance, negligent product design, negligent
failure to warn, strict liability, breach of warranty, conspiracy/concert of
action, aiding and abetting, enterprise liability, market share or risk
contribution liability, intentional tort, fraud and misrepresentation,
violations of state consumer protection statutes, supplier negligence and
similar claims.
The
plaintiffs in these actions generally seek to impose on the defendants
responsibility for lead paint abatement and health concerns associated with the
use of lead-based paints, including damages for personal injury, contribution
and/or indemnification for medical expenses, medical monitoring expenses and
costs for educational programs. To the extent the plaintiffs seek
compensatory or punitive damages in these actions, such damages are unspecified
unless otherwise indicated below. In some cases, the damages are
unspecified pursuant to the requirements of applicable state
law. A number of cases are inactive or have been dismissed or
withdrawn. Most of the remaining cases are in various pre-trial
stages. Some are on appeal following dismissal or summary judgment
rulings in favor of either the defendants or the plaintiffs. In
addition, various other cases are pending (in which we are not a defendant)
seeking recovery for injury allegedly caused by lead pigment and lead-based
paint. Although we are not a defendant in these cases, the outcome of
these cases may have an impact on cases that might be filed against us in the
future.
We believe that these actions are
without merit, and we intend to continue to deny all allegations of wrongdoing
and liability and to defend against all actions vigorously. We have
never settled any of these cases, nor have any final, non-appealable, adverse
judgments against us been entered.
We have
not accrued any amounts for any of the pending lead pigment and lead-based paint
litigation cases. Liability that may result, if any, cannot be
reasonably estimated. In addition, new cases may continue to be filed
against us. We cannot assure you that we will not incur liability in
the future in respect of any of the pending or possible litigation in view of
the inherent uncertainties involved in court and jury rulings. The
resolution of any of these cases could result in recognition of a loss
contingency accrual that could have a material adverse impact on our net income
for the interim or annual period during which such liability is recognized, and
a material adverse impact on our consolidated financial condition and
liquidity.
In
September 1999, an amended complaint was filed in Thomas v. Lead Industries
Association, et al. (Circuit Court, Milwaukee, Wisconsin, Case No.
99-CV-6411) adding as defendants the former pigment manufacturers to a suit
originally filed against plaintiff's landlords. Plaintiff, a minor,
alleged injuries purportedly caused by lead on the surfaces in homes in which he
resided and sought compensatory and punitive damages. The case was
tried in October 2007, and in November 2007 the jury returned a verdict in favor
of all defendants. In April 2008, plaintiff filed an appeal, and in
February 2009, the appeal was stayed after the appellate court received notice
that one of the defendants, Millennium Chemicals, Inc., had filed for
bankruptcy.
In April
2000, we were served with a complaint in County of Santa Clara v. Atlantic
Richfield Company, et al. (Superior Court of the State of California,
County of Santa Clara, Case No. CV788657) brought against the former pigment
manufacturers, the LIA and certain paint manufacturers. The County of
Santa Clara seeks to recover compensatory damages for funds the plaintiffs have
expended or will in the future expend for medical treatment, educational
expenses, abatement or other costs due to exposure to, or potential exposure to,
lead paint, disgorgement of profit, and punitive damages. Solano,
Alameda, San Francisco, Monterey and San Mateo counties, the cities of San
Francisco, Oakland, Los Angeles and San Diego, the Oakland and San Francisco
unified school districts and housing authorities and the Oakland Redevelopment
Agency have joined the case as plaintiffs. In January 2007,
plaintiffs amended the complaint to drop all of the claims except for the public
nuisance claim. In May 2008, the defendants filed a petition for
review by the California Supreme Court, which was granted in July
2008.
In June 2000, a complaint was filed in
Illinois state court, Lewis,
et al. v. Lead Industries Association, et al. (Circuit Court of Cook
County, Illinois, County Department, Chancery Division, Case
No. 00CH09800). Plaintiffs seek to represent two classes, one
consisting of minors between the ages of six months and six years who resided in
housing in Illinois built before 1978, and another consisting of individuals
between the ages of six and twenty years who lived in Illinois housing built
before 1978 when they were between the ages of six months and six years and who
had blood lead levels of 10 micrograms/deciliter or more. The
complaint seeks damages jointly and severally from the former pigment
manufacturers and the LIA to establish a medical screening fund for the first
class to determine blood lead levels, a medical monitoring fund for the second
class to detect the onset of latent diseases, and a fund for a public education
campaign. In April 2008, the trial court judge certified a class
of children whose blood lead levels were screened venously between August
1995 and February 2008 and who had incurred expenses associated with such
screening. The case is proceeding in the trial court.
In
November 2003, we were served with a complaint in Lauren Brown v. NL Industries, Inc.,
et al. (Circuit Court of Cook County, Illinois, County Department, Law
Division, Case No. 03L 012425). The complaint seeks damages against
us and two local property owners on behalf of a minor for injuries alleged to be
due to exposure to lead paint contained in the minor’s residence. The
case is proceeding in the trial court.
In January 2006, we were served with a
complaint in Hess, et al. v.
NL Industries, Inc., et al. (Missouri Circuit Court 22nd
Judicial Circuit, St. Louis City, Cause No. 052-11799). Plaintiffs
are two minor children who allege injuries purportedly caused by lead on the
surfaces of the home in which they resided. Plaintiffs seek
compensatory and punitive damages. The case is proceeding in the
trial court.
In
January and February 2007, we were served with several complaints, the majority
of which were filed in Circuit Court in Milwaukee County, Wisconsin. In
some cases, complaints have been filed elsewhere in Wisconsin. The
plaintiffs are minor children who allege injuries purportedly caused by lead on
the surfaces of the homes in which they reside. Plaintiffs seek
compensatory and punitive damages. The defendants in these cases include
us, American Cyanamid Company, Armstrong Containers, Inc., E.I. Du Pont de
Nemours & Company, Millennium Holdings, LLC, Atlanta Richfield Company, The
Sherwin-Williams Company, Conagra Foods, Inc. and the Wisconsin Department of
Health and Family Services. In some cases, additional lead paint
manufacturers and/or property owners are also defendants. Of the cases
filed, five remain pending and four of the remaining cases have been removed to
Federal court (Burton,
Owens, B. Stokes, and Gibson). Clark, the sole case
remaining in the State court, is scheduled for trial in May 2011.
In
February 2010, we were served with a complaint in Sifuentes v. American Cyanamid
Company, et al. (United District Court, Eastern District of Wisconsin,
Case No. 10-C-0075). The plaintiff in this case is a minor who
alleges injuries purportedly caused by lead on the surface of the home in which
he resided. The claims raised in this case are identical to those in
the Wisconsin cases described above. Defendants include us, American
Cyanamid Company, Armstrong Containers, Inc., E.I. Du Pont de Nemours &
Company, Atlanta Richfield Company and The Sherwin-Williams
Company. We intend to deny liability and will defend vigorously
against all claims.
In
addition to the foregoing litigation, various legislation and administrative
regulations have, from time to time, been proposed that seek to (a) impose
various obligations on present and former manufacturers of lead pigment and
lead-based paint with respect to asserted health concerns associated with the
use of such products and (b) effectively overturn court decisions in which we
and other pigment manufacturers have been successful. Examples of
such proposed legislation include bills which would permit civil liability for
damages on the basis of market share, rather than requiring plaintiffs to prove
that the defendant’s product caused the alleged damage, and bills which would
revive actions barred by the statute of limitations. While no
legislation or regulations have been enacted to date that are expected to have a
material adverse effect on our consolidated financial position, results of
operations or liquidity, the imposition of market share liability or other
legislation could have such an effect.
Environmental
matters and litigation
Our
operations are governed by various environmental laws and
regulations. Certain of our businesses are and have been engaged in
the handling, manufacture or use of substances or compounds that may be
considered toxic or hazardous within the meaning of applicable environmental
laws and regulations. As with other companies engaged in similar
businesses, certain of our past and current operations and products have the
potential to cause environmental or other damage. We have implemented
and continue to implement various policies and programs in an effort to minimize
these risks. Our policy is to maintain compliance with applicable
environmental laws and regulations at all of our plants and to strive to improve
environmental performance. From time to time, we may be subject to
environmental regulatory enforcement under U.S. and non-U.S. statutes, the
resolution of which typically involves the establishment of compliance
programs. It is possible that future developments, such as stricter
requirements of environmental laws and enforcement policies, could adversely
affect our production, handling, use, storage, transportation, sale or disposal
of such substances. We believe that all of our facilities are in
substantial compliance with applicable environmental laws.
Certain
properties and facilities used in our former operations, including divested
primary and secondary lead smelters and former mining locations, are the subject
of civil litigation, administrative proceedings or investigations arising under
federal and state environmental laws. Additionally, in connection
with past operating practices, we are currently involved as a defendant,
potentially responsible party (“PRP”) or both, pursuant to CERCLA, and similar
state laws in various governmental and private actions associated with waste
disposal sites, mining locations, and facilities we or our predecessors
currently or previously owned, operated or were used by us or our subsidiaries,
or their predecessors, certain of which are on the United States Environmental
Protection Agency’s (“EPA”) Superfund National Priorities List or similar state
lists. These proceedings seek cleanup costs, damages for personal
injury, property damage and/or damages for injury to natural
resources. Certain of these proceedings involve claims for
substantial amounts. Although we may be jointly and severally liable
for these costs, in most cases we are only one of a number of PRPs who may also
be jointly and severally liable, and among whom costs may be shared or
allocated. In addition, we are also a party to a number of personal
injury lawsuits filed in various jurisdictions alleging claims related to
environmental conditions alleged to have resulted from our
operations.
Environmental
obligations are difficult to assess and estimate for numerous reasons including
the:
|
·
|
complexity
and differing interpretations of governmental
regulations;
|
|
·
|
number
of PRPs and their ability or willingness to fund such allocation of
costs;
|
|
·
|
financial
capabilities of the PRPs and the allocation of costs among
them;
|
|
·
|
solvency
of other PRPs;
|
|
·
|
multiplicity
of possible solutions;
|
|
·
|
number
of years of investigatory, remedial and monitoring activity required;
and
|
|
·
|
number
of years between former operations and notice of claims and lack of
information and documents about the former
operations.
|
In
addition, the imposition of more stringent standards or requirements under
environmental laws or regulations, new developments or changes regarding site
cleanup costs or allocation of costs among PRPs, solvency of other PRPs, the
results of future testing and analysis undertaken with respect to certain sites
or a determination that we are potentially responsible for the release of
hazardous substances at other sites, could cause our expenditures to exceed our
current estimates. Because we may be jointly and severally liable for
the total remediation cost at certain sites, the amount for which we are
ultimately liable may exceed our accruals due to, among other things, the
reallocation of costs among PRPs or the insolvency of one or more
PRPs. We cannot assure you that actual costs will not exceed accrued
amounts or the upper end of the range for sites for which estimates have been
made, and we cannot assure you that costs will not be incurred for sites where
no estimates presently can be made. Further, additional environmental
matters may arise in the future. If we were to incur any future
liability, this could have a material adverse effect on our consolidated
financial statements, results of operations and liquidity.
We record
liabilities related to environmental remediation obligations when estimated
future expenditures are probable and reasonably estimable. We adjust
our environmental accruals as further information becomes available to us or as
circumstances change. We generally do not discount estimated future
expenditures to their present value due to the uncertainty of the timing of the
pay out. We recognize recoveries of remediation costs from other
parties, if any, as assets when their receipt is deemed probable. At
December 31, 2009, we have not recognized any receivables for
recoveries.
We do not
know and cannot estimate the exact time frame over which we will make payments
for our accrued environmental costs. The timing of payments depends
upon a number of factors including the timing of the actual remediation process;
which in turn depends on factors outside of our control. At each
balance sheet date, we estimate the amount of our accrued environmental costs
which we expect to pay within the next twelve months, and we classify this
estimate as a current liability. We classify the remaining accrued
environmental costs as a noncurrent liability.
On a
quarterly basis, we evaluate the potential range of our liability at sites where
we have been named as a PRP or defendant, including sites for which our
wholly-owned environmental management subsidiary, NL Environmental Management
Services, Inc. (“EMS”) has contractually assumed our obligations. See
Note 19 to our Consolidated Financial Statements. At December 31,
2009, we had accrued approximately $46 million, related to approximately 50
sites, which are environmental matters that we believe are at the present time
and/or in their current phase reasonably estimable. The upper end of
the range of reasonably possible costs to us for sites for which we believe it
is possible to estimate costs is approximately $81 million, including the amount
currently accrued. We have not discounted these estimates to present
value.
We
believe that it is not possible to estimate the range of costs for certain
sites. At December 31, 2009, there were approximately 5 sites for which we are
not currently able to estimate a range of costs. For these sites,
generally the investigation is in the early stages, and we are unable to
determine whether or not we actually had any association with the site, the
nature of our responsibility, if any, for the contamination at the site and the
extent of contamination at and cost to remediate the site. The timing
and availability of information on these sites is dependent on events outside of
our control, such as when the party alleging liability provides information to
us. At certain of these previously inactive sites, we have received
general and special notices of liability from the EPA and/or state agencies
alleging that we, sometimes with other PRPs, are liable for past and future
costs of remediating environmental contamination allegedly caused by former
operations. These notifications may assert that we, along with any
other alleged PRPs, are liable for past and/or future clean-up costs that could
be material to us if we are ultimately found liable.
In
December 2003, we were served with a complaint in The Quapaw Tribe of Oklahoma et al.
v. ASARCO Incorporated et al. (United States District Court, Northern
District of Oklahoma, Case No. 03-CII-846H(J)). The complaint alleges
public nuisance, private nuisance, trespass, strict liability, deceit by false
representation and was subsequently amended to assert claims under CERCLA
against us, six other mining companies and the United States of America with
respect to former operations in the Tar Creek mining district in
Oklahoma. Among other things, the complaint seeks actual and punitive
damages from defendants. We have moved to dismiss the complaint,
asserted certain counterclaims and have denied all of plaintiffs’
allegations. In February 2006, the court of appeals affirmed the
trial court’s ruling that plaintiffs waived their sovereign immunity to
defendants’ counter claim for contribution and indemnity. In December
2007, the court granted the defendants’ motion to dismiss the Tribe’s medical
monitoring claims and in July 2008, the court granted the defendants’ motion to
dismiss the Tribe’s CERCLA natural resources damages claim. In
January 2009, the defendants filed a motion for partial summary judgment,
seeking dismissal of certain plaintiffs’ claims for lack of
standing. In September 2009, the court granted in part and denied in
part the defendants’ joint motion to dismiss, thereby limiting the relief
recoverable by the Tribe, but allowing the plaintiffs to proceed with their
claims. Trial is set to begin in November 2010.
In
February 2004, we were served in Evans v. ASARCO (United
States District Court, Northern District of Oklahoma, Case No. 04-CV-94EA(M)),
an action on behalf of over two hundred individual plaintiffs, including owners
of residential, commercial and government property in the town of Quapaw,
Oklahoma, the mayor of the town of Quapaw, Oklahoma, and the School
Board of Quapaw, Oklahoma. Plaintiffs allege causes of action in
nuisance and seek a relocation program, property damages, including diminished
property value damages, and punitive damages. We answered the
complaint and denied all of plaintiffs’ allegations. In August 2009,
defendants filed a joint motion to dismiss the case, which was partially granted
in February 2010.
In
January 2006, we were served in Brown et al. v. NL Industries, Inc.
et al. (Circuit Court Wayne County, Michigan, Case No. 06-602096
CZ). Plaintiffs, property owners and other past or present residents
of the Krainz Woods Neighborhood of Wayne County, Michigan, allege causes of
action in negligence, nuisance, trespass and under the Michigan Natural
Resources and Environmental Protection Act with respect to a lead smelting
facility formerly operated by us and another defendant. Plaintiffs
seek property damages, personal injury damages, loss of income and medical
expense and medical monitoring costs. In October 2007, we moved to
dismiss several plaintiffs who failed to respond to discovery requests, and in
February 2008, the motion was granted with respect to all such
plaintiffs. In February 2008, the trial court entered a case
management order pursuant to which the case will proceed as to eight of the
plaintiffs’ claims, and the claims of the remaining plaintiffs have been stayed
in the meantime. In April 2008, the other defendant in the case
agreed to a settlement with the plaintiffs, and we are the only remaining
defendant. The claims of eight of the plaintiffs were tried in
January and February 2010, and the jury returned a verdict in favor of five of
the plaintiffs. The jury awarded $119,125 in economic and
non-economic property damages and $220,000 in reimbursement of environmental
assessment costs. At the conclusion of the trial, the judge instructed the
plaintiffs’ counsel to select another eight plaintiffs whose claims will be
tried in January 2011. We do not believe that the facts and evidence
support the verdict and damages awarded. We continue to believe that
the claims of the plaintiffs are without merit and are subject to certain
defenses and counterclaims. We intend to appeal any adverse judgment
the court may enter against us and to continue to vigorously defend the
matter.
In June
2006, we and several other PRPs received a Unilateral Administrative Order
(“UAO”) from the EPA regarding a formerly-owned mine and milling facility
located in Park Hills, Missouri. The Doe Run Company is the current
owner of the site, which was purchased by a predecessor of Doe Run from us in
approximately 1936. Doe Run is also named in the Order. In
April 2008, the parties signed a definitive cost sharing agreement for sharing
of the costs anticipated in connection with the order. In May 2008,
the parties began work at the site as required by the UAO and in accordance with
the cost sharing agreement.
In
October 2006, we entered into a consent decree in the United States District
Court for the District of Kansas, in which we agreed to perform remedial design
and remedial actions in Operating Unit 6 of the Waco Subsite of the Cherokee
County Superfund Site. We conducted milling activities on the portion
of the site which we have agreed to remediate. We are sharing
responsibility with other PRPs as well as the EPA for remediating a tributary
that drains the portions of the site in which the PRPs operated. We
have also reimbursed the EPA for a portion of its past and future response costs
related to the site. In the last two quarters of 2009, we were approached by
state and federal natural resource trustees and have participated in preliminary
discussions with respect to potential natural resource damage
claims.
In
November 2007, we were served with a complaint in United States of America v.
Halliburton Energy Services, Inc., et al. (U.S. District Court, Southern
District of Texas, Civil Action No. 07-cv-03795). The complaint seeks
to recover past costs the EPA incurred to conduct removal actions at three sites
in Texas where Gulf Nuclear, Inc. disposed of radioactive waste. The
complaint alleges that a former NL division sent waste to Gulf Nuclear for
disposal. This matter was tendered to Halliburton Energy Services,
Inc. (“Halliburton”) pursuant to defense and indemnification obligations assumed
as a result of Halliburton’s past acquisition of our former petroleum services
business. Halliburton denied any obligation to provide defense or
indemnification, and a separate action was filed by an affiliate against
Halliburton to enforce these obligations. We have denied all
liability and is defending vigorously against all claims brought by the
U.S. The case is proceeding in the trial court.
In June
2008, we were served in Barton, et al. v. NL Industries,
Inc., (U.S. District Court, Eastern District of Michigan, Case No.:
2:08-CV-12558). In January 2009, we were served in Brown, et al. v. NL Industries, Inc.
et al. (Circuit Court Wayne County, Michigan, Case No. 09-002458
CE). The plaintiffs in both of these cases are additional property owners
and other past or present residents of the Krainz Woods Neighborhood, and the
claims raised in these cases are identical to those in the Brown case described
above. We intend to deny liability in both subsequent cases and will
defend vigorously against all claims. In November 2009, we filed a
motion for summary judgment in the Barton case seeking dismissal of the case on
statute of limitations grounds against 48 plaintiffs, which remains
pending. The case is proceeding in the trial court.
In June
2008, we received a Directive and Notice to Insurers from the New Jersey
Department of Environmental Protection (“NJDEP”) regarding the Margaret’s Creek
site in Old Bridge Township, New Jersey. NJDEP alleged that a waste
hauler transported waste from one of our former facilities for disposal at the
site in the early 1970s. NJDEP has since referred the site to the
EPA, and in November 2009, the EPA added the site to the National Priorities
List under the name “Raritan Bay Slag Site.” We are monitoring
closely regarding the scope of the remedial activities that may be necessary at
the site and the identification of parties who may have liability for the
site.
In
September 2008, we received a Special Notice letter from the EPA for liability
associated with the Tar Creek site and a demand for related past and relocation
costs. We responded with a good-faith offer to pay certain of the
past costs and to complete limited work in the areas in which we operated, but
declined to pay for other past costs or any relocation costs. We are
involved in an ongoing dialogue with the EPA regarding a potential settlement
with the EPA. In October 2008, we received a claim from the State of
Oklahoma for past, future and relocation costs in connection to the
site. The state continues to monitor for a potential settlement
between the EPA and us and may subsequently attempt to pursue a separate
settlement with us.
In June
2009, we were served with a complaint in Consolidation Coal Company v. 3M
Company, et al. (United States District Court, Eastern District of North
Carolina, Civil Action No. 5:09-CV-00191-FL). The complaint seeks to
recover against NL and roughly 170 other defendants under CERCLA for past and
future response costs. The plaintiffs allege that NL’s former Albany
operation sent three PCB-containing transformers to the Ward Transformer
Superfund Site. We intend to deny liability and will defend
vigorously against all claims. In October 2009, NL and other
defendants filed a motion to dismiss the case.
In June
2009, NL was served with a third-party complaint in New Jersey Department of
Environmental Protection v. Occidental Chemical Corp., et al.
(L-009868-05, Superior Court of New Jersey, Essex County). NL is one of
approximately 300 third-party defendants (with a potential expansion of the case
to over 3,200 unnamed parties) that have been sued by third-party
plaintiffs Maxus Energy Corporation and Tierra Solutions, Inc., in
response to claims by the State of New Jersey against them seeking to recover
past and future environmental cleanup costs of the State and to obtain funds to
perform a natural resource damage assessment in connection
with contamination in the Passaic River and adjacent waters and
sediments (the “Newark Bay Complex”). NL was named in the third-party
complaint based upon its ownership of two former operating sites and purported
connection to a former Superfund site (at which NL was a small PRP) alleged to
have contributed to the contamination in the Newark Bay Complex. Discovery is
stayed for all third-party defendants pending approval of a settlement
plan. We intend to deny liability and will defend vigorously against
all of the claims.
In July
2009, we were served in Beets
v. Blue Tee Corp. et al. (Oklahoma State Court, District of Ottawa
County, Case No. CJ-09-298). The complaint alleges negligence, strict
liability, nuisance, and attractive nuisance against NL, four other mining
companies and a mobile home park. In the complaint, five minor
plaintiffs seek damages for personal injuries as well as punitive
damages. We intend to deny liability and will defend vigorously
against all claims. In August 2009, third-party defendant, the United
States of America, removed the case to the Northern District of Oklahoma, where
it was docketed as case No. 4:09-cv-546 and in September 2009, plaintiffs moved
to return the case to the Oklahoma State Court, District of Ottawa County. In
February 2010, the trial court granted plaintiffs' motion to
voluntarily dismiss with prejudice the claims of three of the five minor
plaintiffs.
In August
2009, we were served with a complaint in Raritan Baykeeper, Inc. d/b/a NY/NJ
Baykeeper et al. v. NL Industries, Inc. et al. (United States District
Court, District of New Jersey, Case No. 3:09-cv-04117). This is a
citizen's suit filed by two local environmental groups pursuant to the Resource
Conservation and Recovery Act and the Clean Water Act against NL, current
owners, developers and state and local government entities. The complaint
alleges that hazardous substances were and continue to be discharged from our
former Sayreville, New Jersey property into the sediments of the adjacent
Raritan River. The former Sayreville site is currently being remediated by
owner/developer parties under the oversight of the NJDEP. The
plaintiffs seek a declaratory judgment, injunctive relief, imposition of civil
penalties, and an award of costs. We intend to defend vigorously against
all of the claims. In December 2009, NL and other defendants filed a
motion to dismiss the case.
In
January 2010, we along with many other PRPs received a Special Notice letter
from the EPA for alleged liability associated with the Malone Superfund Site,
Texas City, Texas and an invitation to negotiate an agreement to perform the
final remedy at the site. We indicated to EPA our willingness to
negotiate resolution of our allocated share of liability at this former waste
disposal site, which will likely also involve discussions with the organized PRP
Group for the site. Our potential liability is believed to arise from
historic waste disposal transactions of our former petroleum service business.
This matter has been tendered to Halliburton pursuant to defense and
indemnification obligations assumed as a result of Halliburton’s past
acquisition of our former petroleum services business. Halliburton
denied any obligation to provide defense or indemnification, and this matter has
been included in the separate suit to enforce Halliburton’s
obligations.
In
January 2010, we were served with an amended complaint in Los Angeles Unified School District
v. Pozas Brothers Trucking Co., et al. (Los Angeles Superior Court,
Central Civil West, LASC Case No. BC 391342). The complaint was filed
against several defendants in connection to the alleged contamination of a 35
acre site in South Gate, California acquired by the plaintiff by eminent domain
to construct a middle school and high school. The plaintiff alleges
that NL’s predecessor, The 1230 Corporation (f/k/a Pioneer Aluminum, Inc.)
operated on a portion of property within the 35 acre site and is responsible for
contamination caused by its operations. The plaintiff has brought
claims for contribution, indemnity, and nuisance and is seeking past and future
clean-up and other response costs.
Other
litigation
In addition to the matters described
above, we and our affiliates are also involved in various other environmental,
contractual, product liability, patent (or intellectual property), employment
and other claims and disputes incidental to present and former
businesses. In certain cases, we have insurance coverage for these items,
although we do not expect additional material insurance coverage for
environmental claims.
We
currently believe that the disposition of all claims and disputes, individually
or in the aggregate, should not have a material adverse effect on our
consolidated financial position, results of operations or liquidity beyond the
accruals already provided.
Insurance
coverage claims
We are
involved in certain legal proceedings with a number of our former insurance
carriers regarding the nature and extent of the carriers’ obligations to us
under insurance policies with respect to certain lead pigment and asbestos
lawsuits. In addition to information that is included below, we have
included certain of the information called for by this Item in Note 19 to our
Consolidated Financial Statements, and we are incorporating that information
here by reference.
The issue
of whether insurance coverage for defense costs or indemnity or both will be
found to exist for our lead pigment and asbestos litigation depends upon a
variety of factors and we cannot assure you that such insurance coverage will be
available. We have not considered any potential insurance recoveries for
lead pigment or asbestos litigation matters in determining related
accruals.
We have agreements with two former
insurance carriers pursuant to which the carriers reimburse us for a portion of
our lead pigment litigation defense costs, and one carrier reimburses us for a
portion of our asbestos litigation defense costs. We are not able to
determine how much we will ultimately recover from these carriers for defense
costs incurred by us because of certain issues that arise regarding which
defense costs qualify for reimbursement. While we continue to seek
additional insurance recoveries, we do not know if we will be successful in
obtaining reimbursement for either defense costs or indemnity. We have not
considered any additional potential insurance recoveries in determining accruals
for lead pigment or asbestos litigation matters. Any additional insurance
recoveries would be recognized when the receipt is probable and the amount is
determinable.
We have
settled insurance coverage claims concerning environmental claims with certain
of our principal former carriers. We do not expect further material
settlements relating to environmental remediation coverage.
ITEM 4. RESERVED
PART
II
ITEM 5. MARKET
FOR REGISTRANT'S COMMON EQUITY AND RELATED STOCKHOLDER MATTERS
Our
common stock is listed and traded on the New York Stock Exchange (symbol:
NL). As of February 24, 2010, there were approximately 3,342 holders
of record of our common stock. The following table sets forth the
high and low closing per share sales prices for our common stock for the periods
indicated, according to Bloomberg, and cash dividends paid during such
periods. On February 26, 2010 the closing price of our common stock
was $7.22.
|
High
|
Low
|
Cash
dividends
paid
|
||||||||||
|
Year
ended December 31, 2008
|
||||||||||||
|
First
Quarter
|
$ | 11.63 | $ | 8.65 | $ | .125 | ||||||
|
Second
Quarter
|
11.89 | 9.53 | .125 | |||||||||
|
Third
Quarter
|
10.93 | 9.37 | .125 | |||||||||
|
Fourth
Quarter
|
13.96 | 8.09 | .125 | |||||||||
|
Year
ended December 31, 2009
|
||||||||||||
|
First
Quarter
|
$ | 14.35 | $ | 7.14 | $ | .125 | ||||||
|
Second
Quarter
|
12.85 | 6.74 | .125 | |||||||||
|
Third
Quarter
|
7.65 | 6.46 | .125 | |||||||||
|
Fourth
Quarter
|
7.27 | 6.12 | .125 | |||||||||
|
January
1, 2010 through February 26, 2010
|
$ | 7.49 | $ | 6.59 | $ | .125 | * | |||||
__________________________
|
*
|
In
February 2010, our Board of Directors declared a first quarter 2010 cash
dividend of $.125 per share to shareholders of record as of March 10, 2010
to be paid on March 25, 2010. However, the declaration and
payment of future dividends, and the amount thereof, is discretionary and
is dependent upon our results of operations, financial condition, cash
requirements for businesses, contractual restrictions and other factors
deemed relevant by our Board of Directors. The amount and
timing of past dividends is not necessarily indicative of the amount or
timing of any future dividends which might be paid. There are
currently no contractual restrictions on the amount of dividends which we
may pay.
|
Performance Graph
-
Set forth below is a line graph comparing the yearly change in our cumulative
total stockholder return on our common stock against the cumulative total return
of the S&P 500 Composite Stock Price Index and the S&P 500 Industrial
Conglomerates Index for the period from December 31, 2004 through December 31,
2009. The graph shows the value at December 31 of each year assuming
an original investment of $100 at December 31, 2004 and the reinvestment of
dividends.
|
2004
|
2005
|
2006
|
2007
|
2008
|
2009
|
|||||||||||||||||||
|
NL
common stock
|
$ | 100 | $ | 67 | $ | 52 | $ | 60 | $ | 74 | $ | 41 | ||||||||||||
|
S&P
500 Composite Stock Price Index
|
100 | 105 | 121 | 128 | 81 | 102 | ||||||||||||||||||
|
S&P
500 Industrial Conglomerates Index
|
100 | 96 | 104 | 109 | 53 | 58 | ||||||||||||||||||
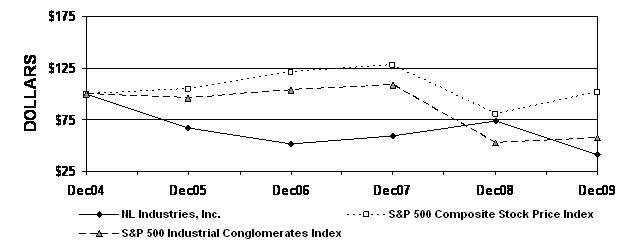
The
information contained in the performance graph shall not be deemed “soliciting
material” or “filed” with the SEC, or subject to the liabilities of Section 18
of the Securities Exchange Act, except to the extent we specifically request
that the material be treated as soliciting material or specifically incorporate
this performance graph by reference into a document filed under the Securities
Act or the Securities Exchange Act.
Equity
compensation plan information
We have
an equity compensation plan, which was approved by our shareholders, providing
for the discretionary grant to our employees and directors of, among other
things, options to purchase our common stock and stock awards. As of
December 31, 2009, there were 80,800 options outstanding to purchase shares of
our common stock, and approximately 4,082,000 shares were available for future
grant or issuance. We do not have any equity compensation plans that
were not approved by our shareholders. See Note 13 to our
Consolidated Financial Statements.
ITEM
6. SELECTED FINANCIAL DATA
The
following selected financial data should be read in conjunction with our
Consolidated Financial Statements and Item 7 - "Management's
Discussion and Analysis of Financial Condition and Results of
Operations."
|
Years ended December 31,
|
||||||||||||||||||||
|
2005
|
2006
|
2007
|
2008
|
2009
|
||||||||||||||||
|
(In
millions, except per share data)
|
||||||||||||||||||||
|
STATEMENTS
OF OPERATIONS DATA:
|
||||||||||||||||||||
|
Net
sales
|
$ | 186.4 | $ | 190.1 | $ | 177.7 | $ | 165.5 | $ | 116.1 | ||||||||||
|
Income
(loss) from component products operations
|
$ | 19.3 | $ | 20.5 | $ | 15.4 | $ | 5.3 | $ | (4.0 | ) | |||||||||
|
Equity
in earnings(losses) of Kronos
|
$ | 25.7 | $ | 29.3 | $ | (23.9 | ) | $ | 3.2 | $ | (12.5 | ) | ||||||||
|
Net
income (loss)
|
$ | 33.7 | $ | 29.6 | $ | .9 | $ | 32.8 | $ | (12.0 | ) | |||||||||
|
Net
income (loss) attributable to NL stockholders
|
$ | 33.0 | $ | 26.1 | $ | (1.7 | ) | $ | 33.2 | $ | (11.8 | ) | ||||||||
|
DILUTED
EARNINGS PER SHARE DATA:
|
||||||||||||||||||||
|
Net
income (loss) attributable to NL
stockholders
|
$ | .68 | $ | .54 | $ | (.04 | ) | $ | .68 | $ | (.24 | ) | ||||||||
|
Dividends
per share (1)
|
$ | 1.00 | $ | .50 | $ | .50 | $ | .50 | $ | .50 | ||||||||||
|
Weighted
average common shares outstanding
|
48,587 | 48,584 | 48,590 | 48,605 | 48,609 | |||||||||||||||
|
BALANCE
SHEET DATA (at year end):
|
||||||||||||||||||||
|
Total
assets
|
$ | 485.6 | $ | 529.3 | $ | 524.8 | $ | 419.5 | $ | 403.0 | ||||||||||
|
Long-term
debt, including current maturities (2)
|
1.4 | - | 50.0 | 43.0 | 42.2 | |||||||||||||||
|
NL
stockholders' equity
|
220.3 | 248.5 | 246.5 | 188.4 | 174.6 | |||||||||||||||
|
Total
equity
|
265.9 | 293.9 | 260.8 | 200.2 | 185.7 | |||||||||||||||
|
STATEMENT
OF CASH FLOW DATA:
|
||||||||||||||||||||
|
Net
cash provided by (used in):
|
||||||||||||||||||||
|
Operating
activities
|
$ | (5.3 | ) | $ | 29.0 | $ | (2.8 | ) | $ | .8 | $ | 1.4 | ||||||||
|
Investing
activities
|
18.5 | (25.2 | ) | 17.5 | 7.1 | 32.4 | ||||||||||||||
|
Financing
activities
|
(35.8 | ) | (27.7 | ) | (27.3 | ) | (32.2 | ) | (25.9 | ) | ||||||||||
|
(1)
|
Amounts
paid in the first quarter of 2005 were in the form of shares of Kronos
common stock. Amounts paid in all subsequent quarters have been
cash.
|
|
(2)
|
Long-term
debt in 2007, 2008 and 2009 represents a promissory note payable to an
affiliate. See Note 17 to our Consolidated Financial
Statements.
|
ITEM 7. MANAGEMENT'S
DISCUSSION AND ANALYSIS OF FINANCIAL CONDITION AND RESULTS OF
OPERATIONS
RESULTS
OF OPERATIONS
Business
Overview
We are primarily a holding
company. We operate in the component products industry through our
majority-owned subsidiary, CompX International Inc. We also own a
non-controlling interest in Kronos Worldwide, Inc. Both CompX (NYSE:
CIX) and Kronos (NYSE: KRO) file periodic reports with the SEC.
CompX is
a leading manufacturer of engineered components utilized in a variety of
applications and industries. Through its Security Products division
CompX manufactures mechanical and electrical cabinet locks and other locking
mechanisms used in postal, office and institutional furniture, transportation,
vending, tool storage and other general cabinetry
applications. CompX’s Furniture Components division manufactures
precision ball bearing slides and ergonomic computer support systems used in
office and institutional furniture, home appliances, tool storage and a variety
of other applications. CompX also manufactures stainless steel
exhaust systems, gauges and throttle controls for the performance boat industry
through its Marine Components division.
We account for our 36% non-controlling
interest in Kronos by the equity method. Kronos is a leading global
producer and marketer of value-added titanium dioxide
pigments. TiO2 is used
for a variety of manufacturing applications including plastics, paints, paper
and other industrial products.
Net
Income Overview
We had a
net loss attributable to NL stockholders of $11.8 million, or $.24 per share, in
2009 compared to net income of $33.2 million, or $.68 per diluted share, in 2008
and a net loss of $1.7 million, or $.04 per share, in 2007.
As more
fully discussed below, the decrease in our earnings per share from 2008 to 2009
is primarily due to the net effects of:
|
·
|
equity
in net losses of Kronos in 2009 as opposed to earnings in
2008,
|
|
·
|
lower
litigation settlement gains of $37.5 million in
2009,
|
|
·
|
lower
component products income from operations in 2009, including consideration
of the impact of the $10.1 million goodwill impairment charge related to
the marine components business line recognized in
2008,
|
|
·
|
higher
defined benefit pension expense in
2009,
|
|
·
|
lower
litigation and related expenses in
2009,
|
|
·
|
lower
environmental remediation expense in 2009
and
|
|
·
|
lower
insurance recoveries in 2009.
|
The
increase in our earnings per share from 2007 to 2008 is primarily due to the net
effects of:
|
·
|
a
litigation settlement pre-tax gain of $48.8 million in
2008,
|
|
·
|
a
goodwill impairment charge of $10.1 million in
2008,
|
|
·
|
higher
equity in earnings from Kronos in
2008,
|
|
·
|
lower
litigation and related expenses in
2008,
|
|
·
|
higher
environmental remediation expense in 2008
and
|
|
·
|
higher
insurance recoveries in 2008.
|
Our 2009
net loss attributable to NL stockholders includes:
|
·
|
a
litigation settlement gain of $.15 per share related to the settlement of
condemnation proceedings on real property we
owned,
|
|
·
|
income
of $.06 per share related to certain insurance recoveries
and
|
|
·
|
a
write-down of assets held for sale of $.01 per
share.
|
Our 2008
net income attributable to NL stockholders includes:
|
·
|
a
litigation settlement gain of $.65 per diluted share related to the
settlement of condemnation proceedings on real property we
owned,
|
|
·
|
a
goodwill impairment charge of $.21 per diluted share related to the marine
business line of our component products
operations,
|
|
·
|
interest
income of $.06 per diluted share related to certain escrow
funds,
|
|
·
|
income
included in our equity in earnings of Kronos of $.03 per diluted share
related to an adjustment of certain income tax attributes of Kronos in
Germany and
|
|
·
|
income
of $.13 per diluted share related to certain insurance
recoveries.
|
Our 2007
net loss attributable to NL stockholders includes:
|
·
|
a
charge included in our equity in earnings of Kronos of $.43 per diluted
share related to a reduction in Kronos’ net deferred income tax asset
resulting from a change in German income tax
rates,
|
|
·
|
a
charge included in our equity in earnings of Kronos of $.04 per diluted
share related to an adjustment of certain income tax attributes of Kronos
in Germany,
|
|
·
|
income
of $.30 per diluted share from a gain on sale of TIMET common
stock,
|
|
·
|
income
of $.08 per diluted share related to certain insurance recoveries we
received and
|
|
·
|
income
of $.03 per diluted share due to a net reduction in our reserve for
uncertain tax positions.
|
Outlook
for 2010
We
currently expect our net income in 2010 to be higher than in 2009 due to the net
effects of:
|
·
|
higher
component products income from operations in
2010,
|
|
·
|
higher
equity in earnings from Kronos in 2010
and
|
|
·
|
higher
litigation settlement gains in
2010.
|
Each of
these expectations is more fully discussed below.
Critical
accounting policies and estimates
The
accompanying "Management's Discussion and Analysis of Financial Condition and
Results of Operations" is based upon our Consolidated Financial Statements,
which have been prepared in accordance with accounting principles generally
accepted in the United States of America ("GAAP"). The preparation of
these financial statements requires us to make estimates and judgments that
affect the reported amounts of assets and liabilities and disclosure of
contingent assets and liabilities at the date of the financial statements, and
the reported amount of revenues and expenses during the reported
period. On an ongoing basis, we evaluate our estimates, including
those related to the recoverability of long-lived assets, pension and other
postretirement benefit obligations and the underlying actuarial assumptions
related thereto, the realization of deferred income tax assets and accruals for
litigation, income tax and other contingencies. We base our estimates
on historical experience and on various other assumptions we believe to be
reasonable under the circumstances, the results of which form the basis for
making judgments about the reported amounts of assets, liabilities, revenues and
expenses. Actual results may differ significantly from
previously-estimated amounts under different assumptions or
conditions.
The
following critical accounting policies affect our more significant judgments and
estimates used in the preparation of our Consolidated Financial
Statements:
|
·
|
Investments - We own
investments in certain companies that we account for as marketable
securities carried at fair value or that we account for under the equity
method. For these investments, we evaluate the fair value at
each balance sheet date. We use quoted market prices, Level 1
inputs as defined in Accounting Standards Codification (“ASC”) 820-10-35,
Fair Value Measurements
and Disclosures, to determine fair value for certain of our
marketable debt securities and publicly traded investees. We
record an impairment charge when we believe an investment has experienced
an other than temporary decline in fair value below its cost basis (for
marketable securities) or below its carrying value (for equity method
investees). Further adverse changes in market conditions or poor operating
results of underlying investments could result in losses or our inability
to recover the carrying value of the investments that may not be reflected
in an investment’s current carrying value, thereby possibly requiring us
to recognize an impairment charge in the
future.
|
At
December 31, 2009, the carrying value (which equals fair value) of substantially
all of our marketable securities equaled or exceeded the cost basis of each of
such investments. At December 31, 2009, the $16.25 per share quoted
market price of our investment in Kronos (our only equity method investee)
exceeded its per share net carrying value by 154%.
|
·
|
Long-lived
assets. We account for our long-lived assets in
accordance with applicable GAAP. We assess property and
equipment for impairment only when circumstances (as specified in ASC
360-10-35, Property,
Plant, and Equipment) indicate an impairment may
exist.
|
Due to
the continued decline in the marine industry and lower than expected results of
CompX’s Custom Marine and Livorsi Marine operations comprising its Marine
Components reporting unit, we evaluated the long-lived assets for the Marine
Components reporting unit in the third quarter of 2009 and concluded that no
impairments were present. However, if our future cash flows from
operations less capital expenditures were to drop significantly below our
current expectations (approximately 45% for Custom Marine and 75% for Livorsi
Marine), it is reasonably likely that we would conclude an impairment was
present. At December 31, 2009 the asset carrying values of Custom
Marine and Livorsi Marine were $6.3 million and $4.6 million,
respectively.
No other
long-lived assets in our other reporting units were tested for impairment during
2009 because there were no circumstances to indicate impairment may exist at
these units.
|
·
|
Goodwill - We perform a
goodwill impairment test annually in the third quarter of each
year. Goodwill is also evaluated for impairment at other times
whenever an event occurs or circumstances change that would more likely
than not reduce the fair value of a reporting unit below its carrying
value. The estimated fair values of CompX’s three reporting
units are determined using Level 3 inputs of a discounted cash flow
technique since Level 1 inputs of market prices are not available at the
reporting unit level. We also consider control premiums when
assessing fair value of our businesses. If the fair value is
less than the book value, the asset is written down to the estimated fair
value.
|
Considerable
management judgment is necessary to evaluate the impact of operating changes and
to estimate future cash flows. Assumptions used in our impairment
evaluations, such as forecasted growth rates and our cost of capital, are
consistent with our internal projections and operating
plans. However, different assumptions and estimates could result in
materially different findings which could result in the recognition of a
material goodwill impairment.
During
2009, we evaluated CompX’s Furniture Components reporting unit for goodwill
impairment at each of the first, second and third quarter interim
dates. We tested this reporting unit for impairment because, while
continuing to generate positive operating cash flows, it was reporting sales and
income from operations significantly below our expectations as a result of the
severe contraction in demand in the office furniture and appliance
markets. At each of these impairment review dates in 2009, we
concluded no impairments were present. However, if our future cash
flows from operations less capital expenditures for this reporting unit were to
be significantly below our current expectations (approximately 20% below our
current expectations), it is reasonably likely that we would conclude an
impairment of the goodwill associated with this reporting unit would be present
under ASC Topic 350-20-20 Goodwill. Per our
annual impairment review during the third quarter, the estimated fair value of
CompX’s Furniture Components reporting unit exceeded its carrying value by
30%. The carrying value included approximately $7.2 million of
goodwill. Holding all other assumptions constant at the reevaluation
date, an increase in the rate used to discount our expected cash flows of
approximately 200 basis points would reduce the enterprise value for CompX’s
Furniture Components unit sufficiently to indicate a potential
impairment.
During
the third quarter of 2008, we determined that all of the goodwill associated
with CompX’s Marine Components reporting unit was impaired. As a
result, we recognized a goodwill impairment charge of $10.1 million for the
Marine Components reporting unit, which represented all of the goodwill we had
previously recognized for this reporting unit. The factors that led
us to conclude goodwill associated with the Marine Components reporting unit was
fully impaired include the continued decline in consumer spending in the marine
market as well as the overall negative economic outlook, both of which resulted
in near-term and longer-term reduced revenue, profit and cash flow forecasts for
the Marine Components unit. While we continue to believe in the long
term potential of the Marine Components unit, due to the extraordinary economic
downturn in the boating industry we are not currently able to foresee when the
industry and our business will recover. In response to the present
economic conditions, CompX has taken steps to reduce operating costs without
inhibiting its ability to take advantage of opportunities to expand market
share.
We
performed our annual goodwill impairment analysis in the third quarter of 2009
for CompX’s Security Products reporting unit and concluded that there was no
impairment of the goodwill for this reporting unit. The estimated
fair value of the Security Products reporting unit was substantially in excess
of their respective carrying value.
|
·
|
Benefit plans - We
maintain various defined benefit pension plans and postretirement benefits
other than pensions (“OPEB”). We record annual amounts related
to these plans based upon calculations required by GAAP, which make use of
various actuarial assumptions, such as: discount rates, expected rates of
returns on plan assets, compensation increases, employee turnover rates,
mortality rates and expected health care trend rates. We review
our actuarial assumptions annually and make modifications to the
assumptions based on current rates and trends when we believe
appropriate. As required by GAAP, modifications to the
assumptions are generally recorded and amortized over future
periods. Different assumptions could result in the recognition
of materially different expense amounts over different periods of times
and materially different asset and liability amounts in our Consolidated
Financial Statements. These assumptions are more fully
described below under “Assumptions on defined benefit pension plans and
OPEB plans.”
|
|
·
|
Income taxes - We
recognize deferred taxes for future tax effects of temporary differences
between financial and income tax reporting in accordance with applicable
GAAP for accounting for income taxes. While we have considered
future taxable income and ongoing prudent and feasible tax planning
strategies in assessing the need for a deferred income tax asset valuation
allowance, it is possible that in the future we may change our estimate of
the amount of the deferred income tax assets that would
more-likely-than-not be realized in the future. If such changes
take place, there is a risk that an adjustment to our deferred income tax
asset valuation allowance may be required that would either increase or
decrease, as applicable, our reported net income in the period such change
in estimate was made.
|
We also
evaluate at the end of each reporting period whether some or all of the
undistributed earnings of our non-U.S. subsidiaries are permanently reinvested
(as that term is defined in GAAP). While we may have concluded in the
past that some undistributed earnings are permanently reinvested, facts and
circumstances can change in the future, such as a change in the expectation
regarding the capital needs of our non-U.S. subsidiaries, could result in a
conclusion that some or all of the undistributed earnings are no longer
permanently reinvested. If our prior conclusions change, we would
recognize a deferred income tax liability in an amount equal to the estimated
incremental U.S. income tax and withholding tax liability that would be
generated if all of such previously-considered permanently reinvested
undistributed earnings were distributed to us. We did not change our
conclusions on our undistributed foreign earnings in 2009.
Beginning
in 2007, we record a reserve for uncertain tax positions in accordance with the
then new provisions of ASC Topic 740, Income Taxes, for tax
positions where we believe it is more-likely-than-not our position will not
prevail with the applicable tax authorities. From time to time, tax
authorities will examine certain of our income tax returns. Tax
authorities may interpret tax regulations differently than we do.
Judgments and estimates made at a point in time may change based on the outcome
of tax audits and changes to or further interpretations of regulations, thereby
resulting in an increase or decrease in the amount we are required to accrue for
uncertain tax positions (and therefore a decrease or increase in our reported
net income in the period of such change). Our reserve for uncertain tax
positions changed during 2009. See Note 21 to our Consolidated Financial
Statements.
|
·
|
Accruals - We record
accruals for environmental, legal and other contingencies and commitments
when estimated future expenditures associated with such contingencies
become probable, and the amounts can be reasonably
estimated. However, new information may become available, or
circumstances (such as applicable laws and regulations) may change,
thereby resulting in an increase or decrease in the amount required to be
accrued for such matters (and therefore a decrease or increase in reported
net income in the period of such
change).
|
|
·
|
Inventory reserves -
CompX provides reserves for estimated obsolete or unmarketable inventories
equal to the difference between the cost of inventories and the estimated
net realizable value using assumptions about future demand for its
products and market conditions. CompX also considers the age
and the quantity of inventory on hand in estimating the
reserve. If actual market conditions are less favorable than
those we projected, we may be required to recognize additional inventory
reserves.
|
|
·
|
Assets Held for Sale -
Our assets held for sale at December 31, 2009, consist of a facility in
River Grove, Illinois and a facility in Neenah,
Wisconsin. These two properties (primarily land, buildings and
building improvements) were formerly used in CompX’s
operations. Discussions with potential buyers of both
properties had been active through the first quarter of
2009. Subsequently during the second quarter of 2009, and as
weak economic conditions continued longer than expected, we concluded that
it was unlikely we would sell these properties at or above their previous
carrying values in the near term and therefore an adjustment to their
carrying values was appropriate. In determining the estimated
fair values of the properties, we considered recent sales prices for other
properties near the facilities, which prices are Level 2 inputs as defined
by ASC 820-10-35. Accordingly, during the second quarter of
2009, we recorded a write-down of approximately $717,000 to reduce the
carrying value of these assets to their aggregate estimated fair value
less cost to sell of $2.8 million. This charge is included in
loss from operations. Both properties are being actively
marketed. However, due to the current state of the commercial
real estate market, we can not be certain of the timing of the disposition
of the assets. If we continue to experience difficulty in
disposing of the assets at or above their carrying value, we may have to
record additional write-downs of the assets in the
future.
|
Income
from operations of CompX and Kronos is impacted by certain of these significant
judgments and estimates, as summarized below:
|
·
|
Chemicals
– allowance for doubtful accounts, reserves for obsolete or unmarketable
inventories, impairment of equity method investments, long-lived assets,
defined benefit pension and OPEB plans and loss accruals
and
|
|
·
|
Component
products – reserves for obsolete or unmarketable inventories, impairment
of goodwill and long-lived assets and loss
accruals.
|
In
addition, general corporate and other items are impacted by the significant
judgments and estimates for impairment of marketable securities and equity
method investments, defined benefit pension and OPEB plans, deferred income tax
asset valuation allowances and loss accruals.
Income
from operations
The
following table shows the components of our income from operations.
|
Year ended December 31,
|
% Change
|
|||||||||||||||||||
|
2007
|
2008
|
2009
|
2007-08 | 2008-09 | ||||||||||||||||
|
(Dollars
in millions)
|
||||||||||||||||||||
|
CompX
|
$ | 15.4 | $ | 5.3 | $ | (4.0 | ) | (66 | )% | (175 | )% | |||||||||
|
Insurance
recoveries
|
5.6 | 9.6 | 4.6 | 70 | % | (52 | )% | |||||||||||||
|
Litigation
settlement gain
|
- | 48.8 | 11.3 | 100 | % | (77 | )% | |||||||||||||
|
Corporate
expense and other
|
(31.3 | ) | (24.9 | ) | (23.5 | ) | (20 | )% | (6 | )% | ||||||||||
|
Income
(loss) from operations
|
$ | (10.3 | ) | $ | 38.8 | $ | (11.6 | ) | 477 | % | (130 | )% | ||||||||
CompX
International Inc.
|
Year ended December 31,
|
% Change
|
|||||||||||||||||||
|
2007
|
2008
|
2009
|
2007-08 | 2008-09 | ||||||||||||||||
|
(Dollars
in millions)
|
||||||||||||||||||||
|
Net
sales
|
$ | 177.7 | $ | 165.5 | $ | 116.1 | (7 | )% | (30 | )% | ||||||||||
|
Cost
of goods sold
|
132.5 | 125.7 | 92.3 | (5 | )% | (27 | )% | |||||||||||||
|
Gross
margin
|
45.2 | 39.8 | 23.8 | (12 | )% | (40 | )% | |||||||||||||
|
Goodwill
impairment
|
- | 10.1 | - | 100 | % | (100 | )% | |||||||||||||
|
Operating
costs and expenses
|
29.8 | 24.4 | 27.8 | (18 | )% | 14 | % | |||||||||||||
|
Income(loss)from
operations
|
$ | 15.4 | $ | 5.3 | $ | (4.0 | ) | (66 | )% | (175 | )% | |||||||||
|
Percentage
of net sales:
|
||||||||||||||||||||
|
Cost
of goods sold
|
75 | % | 76 | % | 80 | % | ||||||||||||||
|
Gross
margin
|
25 | % | 24 | % | 20 | % | ||||||||||||||
|
Operating
costs and expenses
|
16 | % | 21 | % | 24 | % | ||||||||||||||
|
Income
(loss) from operations
|
9 | % | 3 | % | (3 | )% | ||||||||||||||
Net
Sales – Net
sales decreased approximately $49.4 million in 2009 as compared to 2008
principally due to lower order rates from our customers resulting from
unfavorable economic conditions in North America. CompX’s Furniture
Components, Security Products and Marine Components businesses accounted for
approximately 57%, 32% and 11%, respectively, of the total decrease in sales
year over year. Furniture Components sales contributed a greater
percentage of the total decrease due to its greater reliance on sales to a small
number of OEMs in a few markets. These OEMs included office
furniture, tool storage and appliance industries that were more severely
impacted by the economic slow-down compared to the greater diversification of
other Security Products customers and markets which more closely matched the
overall decline in the economy. The Marine business accounted for a
smaller percentage of the total decrease due to the smaller sales volume
associated with that business.
Net sales
decreased in 2008 as compared to 2007 principally due to lower order rates from
many of our customers resulting from unfavorable economic conditions in North
America, offset in part by the effect of sales price increases for certain
products to mitigate the effect of higher raw material costs. CompX’s Furniture
Components, Marine Components, and Security Products businesses accounted for
approximately 41%, 35%, and 24%, respectively of the total decrease in sales
year over year.
Costs of
Goods Sold and Gross Margin – Cost of goods sold
decreased from 2008 to 2009 primarily due to decreased sales
volumes. As a percentage of sales, gross margin decreased in 2009
from the prior year primarily due to reduced coverage of overhead and fixed
manufacturing costs from lower sales volume and the related under-utilization of
capacity, partially offset by a net $4.8 million in fixed manufacturing cost
reductions implemented in response to lower sales.
Cost of
goods sold decreased from 2007 to 2008 primarily due to decreased sales
volumes. As a percentage of sales, gross margin decreased slightly in
2008 from the prior year. The slight decrease in gross margin
percentage was due to the net impact of a number of factors including lower
facility utilization rates relating to the decrease in sales, lower depreciation
expense resulting from lower capital requirements relating to lower sales and
minor increases in variable production costs not fully offset by price
increases.
Goodwill
Impairment – During 2008, we recorded a non-cash goodwill impairment
charge of $10.1 million for CompX’s marine components reporting
unit. See Note 8 to our Consolidated Financial
Statements.
Income from
operations – Excluding the 2008
goodwill impairment charge discussed above, the comparison of income from
operations for 2009 to 2008 was primarily impacted by the net effects
of:
|
·
|
a
negative impact of approximately $21.2 million relating to lower order
rates from many of our customers resulting from unfavorable economic
conditions in North America,
|
|
·
|
approximately
$4.6 million of patent litigation expenses relating to Furniture
Components,
|
|
·
|
a
write-down on assets held for sale of approximately
$717,000,
|
|
·
|
a
$3.8 million reduction in fixed manufacturing expenses in response to the
lower sales volume,
|
|
·
|
a
$1.7 million reduction in lower operating costs and expenses in response
to the lower sales volume and
|
|
·
|
$900,000
in lower depreciation expense in 2009 due to a reduction in capital
expenditures for shorter lived assets over the last several years in
response to lower sales.
|
Excluding
the goodwill impairment charge, the comparison of income from operations for
2008 compared to 2007 includes the net effects of:
|
·
|
a
negative impact of approximately $5.4 million relating to lower order
rates from many of our customers resulting from unfavorable economic
conditions in North America,
|
|
·
|
increased
raw material costs that we were not able to fully recover through sales
price increases by approximately $1 million due to the competitive nature
of the markets we serve,
|
|
·
|
the
one-time $2.7 million charge for facility consolidation costs incurred in
2007,
|
|
·
|
$1.8
million in lower depreciation expense in 2008 due to a reduction in
capital expenditures for shorter lived assets over the last several years
in response to lower sales, and
|
|
·
|
$1.3
million favorable effect on operating income from changes in currency
exchange rates.
|
The $2.7
million facility consolidation costs incurred in 2007 include abnormal
manufacturing costs such as physical move costs, equipment installation,
redundant labor and recruiting fees, and fixed asset write-downs of
$765,000. Approximately $600,000 of the write-down relates to the
classification of our vacated River Grove facility as an “asset held for
sale.” See Note 14 to the Consolidated Financial
Statements.
Currency - CompX has substantial
operations and assets located outside the United States (in Canada and
Taiwan). The majority of sales generated from CompX’s non-U.S.
operations are denominated in the U.S. dollar with the remainder denominated in
other currencies, principally the Canadian dollar and the New Taiwan
dollar. Most raw materials, labor and other production costs for our
non-U.S. operations are denominated primarily in local
currencies. Consequently, the translated U.S. dollar values of our
non-U.S. sales and operating results are subject to currency exchange rate
fluctuations which may favorably or unfavorably impact reported earnings and may
affect comparability of period-to-period operating results. Overall,
fluctuations in currency exchange rates had the following effects on our net
sales and income from operations:
|
Impact of changes in foreign currency - 2008 vs.
2009 (in thousands)
|
|||||
|
Transaction
gains/(losses)recognized
|
Translation
gain/loss-
impact
of rate changes
|
Total
currency impact
2008
vs 2009
|
|||
|
2008
|
2009
|
Change
|
|||
|
Impact
on:
|
|||||
|
Net
Sales
|
$ -
|
$ -
|
$ -
|
$ (848)
|
$ (848)
|
|
Income
from operations
|
679
|
(236)
|
(915)
|
907
|
(8)
|
|
Impact of Changes in foreign currency - 2007 vs.
2008 (in thousands)
|
|||||
|
Transaction
gains/(losses)recognized
|
Translation
gain/loss-
impact
of rate changes
|
Total
currency impact
2007
vs 2008
|
|||
|
2007
|
2008
|
Change
|
|||
|
Impact
on:
|
|||||
|
Net
Sales
|
$ -
|
$ -
|
$ -
|
$ 406
|
$ 406
|
|
Income
from operations
|
(1,085)
|
679
|
1,764
|
(460)
|
1,304
|
The net
impact on income from operations of changes in currency rates from 2008 to 2009
was not significant. The positive impact on income from operations
for the 2007 versus 2008 comparison is due to transactional currency exchange
gains in 2008 as compared to losses in 2007 which were a function of the timing
of currency exchange rate changes and the settlement of non-local currency
receivables and payables.
General
– CompX’s profitability
primarily depends on our ability to utilize our production capacity effectively,
which is affected by, among other things, the demand for our products and our
ability to control our manufacturing costs, primarily comprising labor costs and
materials. The materials used in our products consist of purchased
components and raw materials some of which are subject to fluctuations in the
commodity markets such as zinc, copper, plastic resin, coiled steel and
stainless steel. Total material costs represent approximately 44% of our cost of
goods sold in 2009, with commodity-related raw materials accounting for
approximately 18% of our cost of goods sold. During 2007 and most of
2008, worldwide raw material costs increased significantly and then declined in
2009. We occasionally enter into commodity related raw material
supply arrangements to mitigate the short-term impact of future increases in
commodity-related raw material costs. While these arrangements do not
necessarily commit us to a minimum volume of purchases, they generally provide
for stated unit prices based upon achievement of specified volume purchase
levels. This allows us to stabilize commodity-related raw material
purchase prices to a certain extent, provided the specified minimum monthly
purchase quantities are met. We enter into such arrangements for zinc and coiled
steel. While commodity-related raw material purchase prices
stabilized to a certain extent in 2009, it is uncertain whether the current
prices will remain near the current levels during 2010. Materials
purchased on the spot market are sometimes subject to unanticipated and sudden
price increases. We generally seek to mitigate the impact of
fluctuations in raw material costs on our margins through improvements in
production efficiencies or other operating cost reductions. In the
event we are unable to offset raw material cost increases with other cost
reductions, it may be difficult to recover those cost increases through
increased product selling prices or raw material surcharges due to the
competitive nature of the markets served by our
products. Consequently, overall operating margins may be affected by
raw material cost pressures.
Results
by Reporting Unit
The key
performance indicator for CompX’s reporting units is the level of their income
from operations (see discussion below).
|
Years ended December 31,
|
% Change
|
|||||||||||||||||||
|
2007
|
2008
|
2009
|
2007 – 2008 | 2008 – 2009 | ||||||||||||||||
|
(In
millions)
|
||||||||||||||||||||
|
Net
sales:
|
||||||||||||||||||||
|
Security
Products
|
$ | 80.1 | $ | 77.1 | $ | 61.4 | (4 | %) | (20 | %) | ||||||||||
|
Furniture
Components
|
81.3 | 76.4 | 48.2 | (6 | %) | (37 | %) | |||||||||||||
|
Marine
Components
|
16.3 | 12.0 | 6.5 | (26 | %) | (46 | %) | |||||||||||||
|
Total
net sales
|
$ | 177.7 | $ | 165.5 | $ | 116.1 | (7 | %) | (30 | %) | ||||||||||
|
Gross
margin:
|
||||||||||||||||||||
|
Security
Products
|
$ | 24.1 | $ | 21.4 | $ | 17.8 | (10 | %) | (18 | %) | ||||||||||
|
Furniture
Components
|
16.7 | 16.0 | 6.5 | (4 | %) | (60 | %) | |||||||||||||
|
Marine
Components
|
4.4 | 2.4 | (0.5 | ) | (43 | %) | (120 | %) | ||||||||||||
|
Total
gross margin
|
$ | 45.2 | $ | 39.8 | $ | 23.8 | (12 | %) | (40 | %) | ||||||||||
|
Income
from operations (loss):
|
||||||||||||||||||||
|
Security
Products
|
$ | 12.2 | $ | 12.4 | $ | 9.7 | 4 | % | (24 | %) | ||||||||||
|
Furniture
Components
|
8.0 | 9.1 | (4.7 | ) | 15 | % | (151 | %) | ||||||||||||
|
Marine
Components
|
0.8 | (10.7 | ) | (3.0 | ) |
n.m.
|
71 | % | ||||||||||||
|
Corporate
operating expenses
|
(5.6 | ) | (5.5 | ) | (6.0 | ) | (2 | %) | (13 | %) | ||||||||||
|
Total
income from operations
|
$ | 15.4 | $ | 5.3 | $ | (4.0 | ) | (66 | %) | (175 | %) | |||||||||
|
Income
from operations margin:
|
||||||||||||||||||||
|
Security
Products
|
15 | % | 16 | % | 16 | % | ||||||||||||||
|
Furniture
Components
|
10 | % | 12 | % | (10 | %) | ||||||||||||||
|
Marine
Components
|
5 | % | (89 | %) | (46 | %) | ||||||||||||||
|
Total
income from operations margin
|
9 | % | 3 | % | (3 | %) | ||||||||||||||
|
n.m.
not meaningful
|
||||||||||||||||||||
Security Products
- Security Products net sales decreased 20% to $61.4 million in 2009
compared to $77.1 million in 2008. The decrease in sales is primarily
due to lower customer order rates from most of our customers resulting from
unfavorable economic conditions in North America. Gross margin
percentage increased slightly (less than 1%) in 2009 compared to 2008 and income
from operations percentage was comparable at 16% for the same periods. The
comparable gross margin and income from operations percentages were achieved
despite the significant decrease in sales due to the positive impact of (i) a
$2.1 million reduction in fixed manufacturing costs implemented in response to
lower sales, (ii) a $1.6 million improvement in variable contribution margin
through a combination of sales price increases implemented at the beginning of
2009 in response to cost increases experienced in 2008 and a more favorable
product mix and (iii) a $900,000 reduction in selling, general and
administrative costs in response to lower sales which were partially offset by
reduced fixed costs coverage from lower sales and the related under-utilization
of capacity.
Security
Products net sales decreased 4% to $77.1 million in 2008 compared to $80.1
million in 2007. The decrease in sales is primarily due to lower
order rates from many of our customers resulting from unfavorable economic
conditions in North America, offset in part by the effect of sales price
increases for certain products to mitigate the effect of higher raw material
costs. As a percentage of sales, gross margin decreased in 2008
compared to 2007 primarily due to increased raw material costs that were not
fully recovered through price increases by $1.5 million. Income from
operations percentage increased slightly in 2008 primarily as a result of $2.7
million of costs incurred in 2007 related to the consolidation of two of our
northern Illinois Security Products facilities shared with a Marine Components
operation.
Furniture
Components - Furniture Components
net sales decreased 37% to $48.2 million in 2009 from $76.4 million in 2008, primarily due
to lower order rates from most of our customers resulting from unfavorable
economic conditions in North America. Gross margin percentage
decreased approximately 8% in 2009 compared to 2008. Income from
operations decreased to a loss of $4.7 million in 2009 as compared to income of
$9.2 million in 2008. The decreases in the gross margin percentage
and income from operations are primarily the result of approximately $2.3
million in reduced fixed manufacturing cost coverage from lower sales and the
related under-utilization of capacity combined with approximately $4.6 million
of patent litigation expenses recorded in selling, general and administrative
expense partially offset by reduced fixed manufacturing costs of approximately
$2.4 million and reduced selling, general and administrative expenses of
approximately $1.2 million in response to lower sales.
Furniture
Components net sales decreased 6% to $76.4 million in 2008 from $81.3
million in 2007,
primarily due to lower order rates from many of our customers resulting from
unfavorable economic conditions in North America, offset in part by the effect
of sales price increases for certain products to mitigate the effect of higher
raw material costs. Gross margin percentage was comparable year over
year. Income from operations percentage increased in 2008 compared to
2007 primarily due to a $1.3 million favorable change in the effect of currency
exchange rates.
Marine Components
- Marine
Components net sales decreased 46% in 2009 as compared to 2008 primarily due to
a dramatic overall downturn in the marine industry. Gross margin
decreased to a loss in 2009 as compared to 2008. The 2008 operating
loss for the Marine Components business includes a goodwill impairment charge of
approximately $9.9 million. Excluding the goodwill impairment charge,
our operating loss increased approximately $2.5 million in 2009 as compared to
2008. The decrease in gross margin and increase in operating loss are
the result of reduced coverage of fixed costs from lower sales volume, partially
offset by reduced fixed manufacturing costs of approximately $270,000 and
reduced selling, general and administrative expenses of approximately $610,000
in response to lower sales.
Marine
Components net sales decreased 26% in 2008 as compared to 2007 primarily due to
an overall downturn in the marine industry. Gross margin percentage
decreased from 27% in 2007 to 21% in 2008. Excluding the goodwill
impairment charge discussed above, income from operations decreased from
approximately $800,000 of income in 2007 to an operating loss of approximately
$500,000 in 2008. The decreases in gross margin and income from
operations are the result of reduced coverage of fixed costs from lower sales
volume.
Outlook -
Demand for CompX’s products continues to be slow and unstable as
customers react to the condition of the overall economy. While
changes in market demand are not within our control, we are focused on the areas
we can impact. Staffing levels are continuously being evaluated in
relation to sales order rates resulting in headcount adjustments, to the extent
possible, to match staffing levels with demand. We expect our lean
manufacturing and cost improvement initiatives to continue to positively impact
our productivity and result in a more efficient infrastructure that we can
leverage when demand growth returns. Additionally, we continue to
seek opportunities to gain market share in markets we currently serve, expand
into new markets and develop new product features in order to mitigate the
impact of reduced demand as well as broaden our sales base.
In
addition to challenges with overall demand, volatility in the cost of our
commodity-related raw materials is ongoing. We currently expect these
costs to be volatile for 2010. We generally seek to mitigate the
impact of fluctuations in raw material costs on our margins through improvements
in production efficiencies or other operating cost reductions. In the
event we are unable to offset raw material cost increases with other cost
reductions, it may be difficult to recover those cost increases through
increased product selling prices or raw material surcharges due to the
competitive nature of the markets served by our products.
As
discussed in Note 19 to the Consolidated Financial Statements, a competitor has
filed claims against CompX for patent infringement. CompX has denied
the allegations of patent infringement and is seeking to have the claims
dismissed or is in settlement discussions, the outcome of which would not be
expected to have a material effect on our results of
operations. While we currently believe that the disposition of these
claims should not have a material, long-term adverse effect on our consolidated
financial condition, results of operations or liquidity, we expect to continue
to incur costs defending against such claims during the short-term that are
likely to be material.
During
the third quarter of 2009, CompX entered into a Third Amendment to its $37.5
million Credit Agreement (the “Third Amendment”). The
primary purpose of the Third Amendment was to adjust certain covenants in the
Credit Agreement in order to take into consideration the current and expected
future financial performance of CompX. See Note 12 to the Consolidated
Financial Statements. We believe that the adjustments to the
covenants will allow CompX to comply with the covenant restrictions through the
maturity of the facility in January 2012; however, if future operating results
differ materially from our expectations CompX may be unable to maintain
compliance. At December 31, 2009, no amounts were outstanding under
the facility. CompX is currently in compliance with all covenant
restrictions under the Credit Agreement. Maintaining compliance with
certain of the covenant restrictions is dependent upon CompX’s current financial
performance as measured at the end of each quarter. One of the
financial performance covenants requires earnings before interest and taxes for
the trailing four quarters (not including quarters prior to 2009) to be 2.5
times cash interest expense. Since CompX’s earnings before interest
and taxes was a loss of $147,000 and $2.0 million for the third and fourth
quarters of 2009, respectively, as measured under the terms of the Credit
Agreement, effectively it could not have had any borrowings outstanding under
the Credit Agreement during these periods of 2009 without violating the covenant
as any cash interest expense incurred would have exceeded the required 2.5 to 1
ratio. In the future, to the extent that CompX does not generate the
required amount of earnings before interest and taxes, as measured under the
Credit Agreement, it would similarly be unable to borrow on the Credit Agreement
without violating this financial performance covenant. However, there
are no current expectations that CompX will need to borrow on the revolving
credit facility in the near term as cash flows from operations are expected to
be sufficient to fund its future liquidity requirements.
As a
condition to the Third Amendment, in the third quarter 2009 CompX executed with
TIMET Finance Management Company (“TFMC”), an Amended and Restated Subordinated
Term Loan Promissory Note payable to the order of TFMC. The material
changes effected by the Amended and Restated TFMC Note were the deferral of
required principal and interest payments on the note until on or after January
1, 2011 and certain restrictions on the amount of payments that could be made
after that date. See Note 12 to the Condensed Consolidated Financial
Statements.
Kronos
Worldwide, Inc.
|
Years ended December 31,
|
% Change
|
|||||||||||||||||||
|
2007
|
2008
|
2009
|
2007-08 | 2008-09 | ||||||||||||||||
|
(Dollars
in millions)
|
||||||||||||||||||||
|
Net
sales
|
$ | 1,310.3 | $ | 1,316.9 | $ | 1,142.0 | 1 | % | (13 | )% | ||||||||||
|
Cost
of sales
|
1,058.9 | 1,096.3 | 1,011.7 | 4 | % | (8 | )% | |||||||||||||
|
Gross
margin
|
$ | 251.4 | $ | 220.6 | $ | 130.3 | ||||||||||||||
|
Income
(loss) from operations
|
$ | 84.9 | $ | 47.2 | $ | (15.7 | ) | (44 | )% | (133 | )% | |||||||||
|
Other,
net
|
2.5 | 1.0 | .2 | |||||||||||||||||
|
Interest
expense
|
(39.4 | ) | (42.2 | ) | (41.4 | ) | ||||||||||||||
|
Income
before income taxes
|
48.0 | 6.0 | (56.9 | ) | ||||||||||||||||
|
Provision
for income taxes (benefit)
|
114.7 | (3.0 | ) | (22.2 | ) | |||||||||||||||
|
Net
income (loss)
|
$ | (66.7 | ) | $ | 9.0 | $ | (34.7 | ) | ||||||||||||
|
Percentage
of net sales:
|
||||||||||||||||||||
|
Cost
of sales
|
81 | % | 83 | % | 89 | % | ||||||||||||||
|
Income
from operations
|
6 | % | 4 | % | (2 | )% | ||||||||||||||
|
Equity
in earnings (losses) of Kronos Worldwide, Inc.
|
$ | (23.9 | ) | $ | 3.2 | $ | (12.5 | ) | ||||||||||||
|
TiO2
operating statistics:
|
||||||||||||||||||||
|
Sales
volumes*
|
519 | 478 | 445 | (8 | )% | (7 | )% | |||||||||||||
|
Production
volumes*
|
512 | 514 | 402 | - | % | (22 | )% | |||||||||||||
|
Change
in TiO2
net sales:
|
||||||||||||||||||||
|
TiO2
product pricing
|
2 | % | (1 | )% | ||||||||||||||||
|
TiO2
sales volume
|
(8 | ) | (7 | ) | ||||||||||||||||
|
TiO2
product mix
|
2 | (2 | ) | |||||||||||||||||
|
Changes
in currency exchange rates
|
5 | (3 | ) | |||||||||||||||||
|
Total
|
1 | % | (13 | )% | ||||||||||||||||
*
Thousands of metric tons
Net
sales – Kronos’ net sales decreased 13% or $174.9 million in 2009
compared to 2008, primarily due to a 7% decrease in sales volumes and a 1%
decrease in average selling prices. Variations in grades of products
sold unfavorably impacted net sales by 2%. In addition, Kronos
estimates the unfavorable effect of changes in currency exchange rates decreased
net sales by approximately $35 million, or 3%, as compared to the same period in
2008. TiO2 selling
prices generally follow industry trends and prices will increase or decrease
generally as a result of competitive market pressures. As a result of
these market pressures, Kronos’ average TiO2 prices in
2009 were 1% lower than in the prior year. During the first half of
2009, Kronos’ average selling prices were generally declining, as it faced weak
demand and excessive inventory levels. Beginning mid-2009, Kronos and
its competitors announced various price increases. A portion of these
price increase announcements were implemented during the third and fourth
quarters of 2009, and as a result Kronos’ average selling price at the end of
the second half of 2009 was 3% higher than at the end of the first half of
2009.
Kronos’
net sales increased 1% or $6.6 million in 2008 compared to 2007, primarily due
to favorable currency exchange rates, which Kronos estimates increased net sales
for 2008 by approximately $61 million, or 5%, compared to the same period in
2007. Variations in grades of products sold favorably impacted net
sales by 2%, along with a 2% increase in average TiO2 selling
prices. TiO2 selling
prices generally follow industry trends and prices will increase or decrease
generally as a result of competitive market pressures. During the
early part of 2008, Kronos’ average selling prices were generally
flat. During the second and third quarters of 2008, Kronos and its
competitors announced various price increases and surcharges in response to
higher operating costs. A portion of these increase announcements
were implemented during the second, third and fourth quarters of 2008. The
positive impact of currency, product mix and pricing in 2008 were substantially
offset by an 8% decrease in sales volumes.
Kronos’
7% decrease in sales volumes in 2009 and 8% decrease in sales volumes for 2008
is primarily due to lower sales volumes in Europe and North America as a result
of a global weakening of demand due to poor overall economic
conditions.
Cost of
sales – Kronos’ cost of sales decreased 8% or $84.6 million in 2009
compared to 2008 primarily due to the impact of a 7% decrease in sales volumes,
lower raw material costs of $11.6 million, a decrease in maintenance costs of
$29.8 million as part of its efforts to reduce operating costs where possible
and currency fluctuations (primarily the euro). Cost of sales as a
percentage of net sales increased to 89% in the year ended December 31, 2009
compared to 83% in 2008 primarily due to the unfavorable effects of the
significant amount of unabsorbed fixed production costs resulting from reduced
production volumes during the first six months of 2009. TiO2 production
volumes decreased due to temporary plant curtailments during the first six
months of 2009 that resulted in approximately $80 million of unabsorbed fixed
production costs which were charged directly to cost of sales in the first six
months of 2009.
Kronos’
cost of sales increased 4% or $37.4 million in 2008 compared to 2007 due to the
impact of a 22% or approximately $27 million increase in utility costs
(primarily energy costs), a 10% or approximately $35 million increase in raw
material costs largely offset by currency fluctuations (primarily the
euro). Cost of sales as a percentage of net sales increased to 83% in
the year ended December 31, 2008 compared to 81% in the same period of 2007
primarily due to the net effects of higher operating costs and slightly higher
average selling prices.
Income (loss)
from operations –
Kronos’ income (loss) from operations declined by $62.9 million from
income of $47.2 million in 2008 to a loss from operations of $15.7 million in
2009. Income (loss) from operations as a percentage of net sales
declined to (2)% in 2009 from 4% in 2008. This decrease is driven by
the decline in gross margin, which fell to 11% in 2009 compared to 17% in
2008. Kronos’ gross margin decreased primarily because of the
significant amount of unabsorbed fixed production costs resulting from the
production curtailments implemented during the first six months of 2009 as well
as the effect of lower sales volumes. However, changes in currency
rates have positively affected Kronos’ gross margin and income (loss) from
operations. Kronos estimates that changes in currency exchange rates
increased income (loss) from operations by approximately $40 million in 2009 as
compared to 2008.
Kronos’ income from operations in 2008
declined by 44% to $47.2 million compared to 2007. Income from
operations as a percentage of net sales decreased to 4% in 2008 from 6% for
2007. The decline in income from operations is driven by the decline
in gross margin, which decreased to 17% in 2008 compared to 19% in
2007. While Kronos’ average TiO2 selling
prices were higher in 2008, gross margin decreased primarily because of lower
sales volumes and higher manufacturing costs, which more than offset the impact
of higher sales prices. Changes in currency rates have also
negatively affected gross margin. Kronos estimates the negative
effect of changes in currency exchange rates decreased income from operations by
approximately $4 million when comparing 2008 to 2007.
As a percentage of net sales, selling,
general and administrative expenses were relatively consistent at approximately
12% for 2007 and approximately 13% for both 2008 and 2009.
Other
non-operating income (expense) – Kronos’ interest
expense decreased $.8 million from $42.2 million in 2008 to $41.4 million in
2009 due to changes in currency exchange rates which offset the effect of
increased average borrowings under Kronos’ revolving credit facilities and
higher interest rates on its European credit facility. The interest
expense Kronos recognizes will vary with fluctuations in the euro exchange
rate.
Kronos’
interest expense increased $2.8 million from $39.4 million for 2007 to $42.2
million for 2008 due to unfavorable changes in currency exchange rates in 2008
compared to 2007 and increased borrowings in 2008 (primarily under Kronos’
European credit facility).
Income taxes –
Kronos’ income tax benefit was $22.2 million in 2009 compared to $3.0
million in 2008 and a provision of $114.7 million in 2007. Some of
the more significant items are summarized below.
Kronos’
income tax benefit for 2009 includes a non-cash benefit of $4.7 million related
to a net decrease in its reserve for uncertain tax positions primarily as a
result of the resolution of tax audits in Belgium and Germany in the third and
fourth quarters.
Kronos’
income tax benefit for 2008 includes a non-cash benefit of $7.2 million relating
to a European Court ruling that resulted in the favorable resolution of certain
income tax issues in Germany and an increase in the amount of Kronos’ German
corporate and trade tax net operating loss carryforwards.
Kronos’
income tax expense in 2007 includes (i) a non-cash charge of $90.8 million
relating to a decrease in Kronos’ net deferred income tax asset in Germany
resulting from the reduction in its income tax rates; (ii) a non-cash charge of
$8.7 million relating to the adjustment of certain German income tax attributes
and (iii) a non-cash income tax benefit of $2.0 million resulting from a net
reduction in its reserve for uncertain tax positions.
In
addition, and as a consequence of a European Court ruling that resulted in a
favorable resolution of certain income tax issues in Germany, during the first
quarter of 2010 the German tax authorities agreed to an increase in Kronos’
German net operating loss carryforward. Accordingly, Kronos expects
to report a non-cash income tax benefit of approximately $35.2 million in the
first quarter of 2010.
Effects of
currency exchange rates - Kronos
has substantial
operations and assets located outside the United States (primarily in Germany,
Belgium, Norway and Canada). The majority of its sales from non-U.S.
operations are denominated in currencies other than the U.S. dollar, principally
the euro, other major European currencies and the Canadian dollar. A
portion of the sales generated from non-U.S. operations is denominated in the
U.S. dollar. Certain raw materials used worldwide, primarily
titanium-containing feedstocks, are purchased in U.S. dollars, while labor and
other production costs are purchased primarily in local
currencies. Consequently, the translated U.S. dollar value of
non-U.S. sales and operating results are subject to currency exchange rate
fluctuations which may favorably or unfavorably impact reported earnings and may
affect the comparability of period-to-period operating results. In
addition to the impact of the translation of sales and expenses over time,
Kronos’ non-U.S. operations also generate currency transaction gains and losses
which primarily relate to the difference between the currency exchange rates in
effect when non-local currency sales or operating costs are initially
accrued and when such amounts are settled with the non-local
currency.
Overall,
Kronos estimates that fluctuations in currency exchange rates had the following
effects on sales and income (loss) from operations for the periods
indicated.
|
Impact of changes in foreign currency - 2008 vs.
2009 (in millions)
|
|||||
|
Transaction
gains/(losses)recognized
|
Translation
gain/loss-
impact
of rate changes
|
Total
currency impact
2008
vs 2009
|
|||
|
2008
|
2009
|
Change
|
|||
|
Impact
on:
|
|||||
|
Net
Sales
|
$ -
|
$ -
|
$ -
|
$ (35)
|
$ (35)
|
|
Income
(loss)
from
operations
|
1
|
10
|
9
|
30
|
39
|
|
Impact of changes in foreign currency - 2007 vs.
2008 (in millions)
|
|||||
|
Transaction
gains/(losses)recognized
|
Translation
gain/loss-
impact
of rate changes
|
Total
currency impact
2007
vs 2008
|
|||
|
2007
|
2008
|
Change
|
|||
|
Impact
on:
|
|||||
|
Net
Sales
|
$ -
|
$ -
|
$ -
|
$ 61
|
$ 61
|
|
Income
(loss)
from
operations
|
-
|
1
|
1
|
(5)
|
(4)
|
The
positive impact on income (loss) from operations for the 2008 versus 2009
comparison is due to increased transactional currency exchange gains in 2009 as
compared to 2008 which were a function of the timing of currency exchange rate
changes and the settlement of non-local currency receivables and
payables. The net impact on operations of changes in foreign currency
rates from 2007 to 2008 was not significant.
Outlook –
In response to the worldwide economic slowdown and weak consumer confidence,
Kronos reduced its production volumes during 2009 in order to reduce finished
goods inventory, improve liquidity and match production to market
demand. Overall industry pigment demand is expected to be higher in
2010 as compared to 2009 as a result of improving worldwide economic
conditions. During 2009, Kronos and its competitors announced price
increases, a portion of which were implemented during the second half of 2009,
with the remainder expected to be implemented in 2010. As a result,
the decline in Kronos’ average selling prices experienced during the first half
of 2009 ceased, and its average selling prices increased during the second half
of 2009. As a result of the expected continued implementation of
these and possible future price increases, Kronos anticipates average selling
prices will continue to increase during 2010.
Kronos
currently expects income from operations will be higher in 2010 as compared to
2009 due to the favorable effects of higher TiO2 sales
volumes, average selling prices and production volumes. Higher
production costs in 2009 resulted in part from the production curtailments
Kronos implemented in the first half of the year and the resulting unabsorbed
fixed production costs. While Kronos operated its facilities at
approximately 58% of capacity during the first half of 2009, it increased
capacity utilization to approximately 94% during the second half of
2009. Kronos believes its annual attainable production capacity for
2010 is approximately 532,000 metric tons, and currently expects to operate its
facilities at approximately 90% to 95% of such capacity during
2010. Kronos’ expected capacity utilization levels could be adjusted
upwards or downwards to match changes in demand for its product.
Overall,
Kronos expects to report net income in 2010 as compared to reporting a net loss
in 2009 due to higher expected income from operations in 2010 as well as the
impact of the $35.2 million non-cash income tax benefit it expects to recognize
in the first quarter of 2010, as discussed above.
Kronos’
expectations as to the future of the TiO2 industry
are based upon a number of factors beyond its control, including worldwide
growth of gross domestic product, competition in the marketplace, solvency and
continued operation of competitors, unexpected or earlier than expected capacity
additions or reductions and technological advances. If actual
developments differ from Kronos’ expectations, results of operations could be
unfavorably affected.
General
corporate and other items
Interest and
dividend income –
Interest and dividend income in 2009 decreased $5.3 million from 2008 and
increased $3.2 million in 2008 from 2007 primarily due to the interest received
in April 2008 on certain escrow funds we became entitled to as part of a
litigation settlement agreement. We recognized this as interest
income during the second quarter of 2008. See Note 19 to the
Consolidated Financial Statements.
Other
interest and dividend income fluctuates in part based upon the amount of funds
invested and yields thereon. We expect that interest income will be
lower in 2010 than 2009 primarily due lower cash available for
investment.
Securities
transactions - In
October 2007 we sold 800,000 shares of TIMET common stock to Valhi for $26.8
million. The transaction was approved by the independent members of
our board of directors. We recognized a $22.7 million pre-tax
security transaction gain in the fourth quarter of 2007 related to the
sale. See Note 4 to the Consolidated Financial
Statements.
Litigation
settlement gain – In October 2008 we recognized a $48.8 million gain
related to the initial closing associated with the settlement of condemnation
proceedings on certain real property we owned that is subject to environmental
remediation, and for which we had a carrying value of approximately $5.8 million
at the date of closing. The second closing related to this settlement
occurred in the second quarter of 2009, and we recognized an $11.3 million gain
for which we had a carrying value of approximately $487,000 at the date of
closing. See Note 19 to the Consolidated Financial
Statements.
Insurance
recoveries – We
have agreements with certain insurance carriers pursuant to which the carriers
reimbursed us for a portion of our past lead pigment and asbestos litigation
defense costs. Insurance recoveries include amounts we received from these
insurance carriers.
The agreements with certain of our
insurance carriers also include reimbursement for a portion of our future
litigation defense costs. We are not able to determine how much we
will ultimately recover from these carriers for defense costs incurred by us
because of certain issues that arise regarding which defense costs qualify for
reimbursement. Accordingly, these insurance recoveries are recognized
when the receipt is probable and the amount is determinable. See Note
19 to our Consolidated Financial Statements.
Corporate
expenses –
Corporate expenses were $23.5 million in 2009, $1.4 million or 6% lower
than in 2008 primarily due to lower legal and environmental expenses as noted
below, partially offset by higher pension expense as discussed in “Assumptions on defined benefit
pension plans and OPEB plans”. Included
in 2009 corporate expense are:
|
·
|
Litigation
and related costs of $12.4 million in 2009 compared to $14.6 million in
2008 and
|
|
·
|
Environmental
expenses of $3.7 million in 2009, compared to $6.8 million in
2008.
|
Corporate
expenses were $25.0 million in 2008, $6.3 million or 20% lower than in 2007
primarily due to lower litigation and related costs partially offset by higher
environmental expenses. Included in 2008 corporate expense
are:
|
·
|
Litigation
and related costs of $14.6 million in 2008 compared to $22.1 in 2007
and
|
|
·
|
Environmental
expenses of $6.8 million in 2008, compared to $4.4 million in
2007.
|
We expect
that our corporate expenses in 2010 will be comparable to 2009.
The level
of our litigation and related expenses varies from period to period depending
upon, among other things, the number of cases in which we are currently
involved, the nature of such cases and the current stage of such cases (e.g.
discovery, pre-trial motions, trial or appeal, if applicable). See
Note 19 to the Consolidated Financial
Statements. If our current expectations regarding the number of cases
in which we expected to be involved during 2010, or the nature of such cases,
were to change, our corporate expenses could be higher than we currently
estimate.
Obligations for environmental
remediation costs are difficult to assess and estimate, and it is possible that
actual costs for environmental remediation will exceed accrued amounts or that
costs will be incurred in the future for sites in which we cannot currently
estimate our liability. If these events were to occur in 2010, our
corporate expenses would be higher than we currently estimate. See
Note 19 to the Consolidated Financial Statements.
Interest
expense -
Substantially all of our interest expense in 2007, 2008 and 2009 relates
to CompX. Interest expense decreased approximately $1.3 million in
2009 compared to 2008 as the result of a lower interest rate on the outstanding
principal amount of our note payable to affiliate (5.05% at December 31, 2008 as
compared to 1.25% at December 31, 2009). Interest expense increased
approximately $1.6 million in 2008 compared to 2007 as a result of financing the
October 2007 repurchase and/or cancellation of a net $2.7 million shares of our
Class A common stock from an affiliate with a promissory note. See
Note 2 to the Consolidated Financial Statements.
Provision
(benefit) for income taxes - We recognized an income tax
benefit of $10.3 million in 2009 compared to an expense of $14.9 million in 2008
and a benefit of $8.3 million in 2007. In accordance with GAAP, we recognize
deferred income taxes on our undistributed equity in earnings of
Kronos. We do not recognize, and we are not required to pay, income
taxes to the extent we receive dividends from Kronos. Because we and
Kronos are part of the same U.S. federal income tax group, any dividends we
receive from Kronos are nontaxable to us. Therefore, our effective
income tax rate will generally be lower than the U.S. federal statutory income
tax rate in periods during which we receive dividends from Kronos. In
this regard, Kronos announced the suspension of its regularly quarterly dividend
in February 2009 in consideration of the challenges and opportunities that exist
in the TiO2 pigment
industry.
See Note
15 to our Consolidated Financial Statements for a tabular reconciliation of our
statutory tax expense to our actual tax expense. Some of the more
significant items impacting this reconciliation are summarized
below.
Our income tax benefit in 2009 includes
a $.6 million benefit related to a net reduction in our reserve for uncertain
tax positions primarily due certain statute of limitation expirations in the
fourth quarter of 2009.
The
goodwill impairment charge of $10.1 million recorded in the third quarter of
2008 (see Note 8) is non-deductible goodwill for income tax
purposes. Accordingly, there is no income tax benefit associated with
the goodwill impairment charge for financial reporting purposes. Our
income tax expense in 2008 includes a $2.1 million benefit related to a net
reduction in our reserve for uncertain tax positions primarily due to a fourth
quarter recognition of unrecognized tax benefits because of statute of
limitation expirations.
Our
income tax benefit in 2007 includes a $1.3 million benefit related to a net
reduction in our reserve for uncertain tax positions primarily due to a third
quarter recognition of unrecognized tax benefits because of statute of
limitation expirations.
Noncontrolling
interest –
Noncontrolling interest in net loss of subsidiary decreased $124,000 in 2009 as
compared to 2008. This increase is due to a higher net loss for CompX
in 2009.
Noncontrolling
interest decreased $3.0 million in 2008 as compared to 2007. This
decrease is due to both our increased ownership of CompX as compared to 2007 and
to lower earnings of CompX in 2008.
Related party
transactions – We are a party to certain transactions with related
parties. See Notes 2 and 17 to the Consolidated Financial
Statements. It is our policy to engage in transactions with related
parties on terms, in our opinion, no less favorable to us than we could obtain
from unrelated parties.
Recent accounting
pronouncements -
See Note 21 to our Consolidated Financial Statements.
Assumptions
on defined benefit pension plans and OPEB plans
Defined benefit
pension plans - We maintain various defined benefit pension plans in the
U.S. and the U.K., and Kronos maintains various defined benefit pension plans in
the U.S., Europe and Canada. See Note 16 to our Consolidated
Financial Statements.
Under
defined benefit pension plan accounting, we recognize defined benefit pension
plan expense and prepaid and accrued pension costs are each recognized based on
certain actuarial assumptions, principally the assumed discount rate, the
assumed long-term rate of return on plan assets and the assumed increase in
future compensation levels. We recognize the full funded status of
our defined benefit pension plans as either an asset (for overfunded plans) or a
liability (for underfunded plans) in our Consolidated Balance
Sheet.
We
recognized consolidated defined benefit pension plan income of $2.5 million in
2007 and $3.1 million in 2008, as compared to defined benefit pension plan
expense of $700,000 in 2009. The amount of funding requirements for
these defined benefit pension plans is generally based upon applicable
regulations (such as ERISA in the U.S.), and will generally differ from pension
expense recognized under GAAP for financial reporting purposes. We
made contributions to all of our plans of $900,000 in 2007, $600,000 in 2008 and
$500,000 in 2009.
Our defined benefit pension plan
expense was significantly higher in 2009 compared to pension income in 2008
primarily due to the expected return on plan assets for 2009 compared to 2008
resulting from the lower fair value of plan assets at the beginning of 2009 as
compared to the beginning of 2008.
The
discount rates we use for determining defined benefit pension expense and the
related pension obligations are based on current interest rates earned on
long-term bonds that receive one of the two highest ratings given by recognized
rating agencies in the applicable country where the defined benefit pension
benefits are being paid. In addition, we receive third-party advice
about appropriate discount rates, and these advisors may in some cases use their
own market indices. We adjust these discount rates as of each
December 31 valuation date to reflect then-current interest rates on such
long-term bonds. We use these discount rates to determine the
actuarial present value of the pension obligations as of December 31 of that
year. We also use these discount rates to determine the interest
component of defined benefit pension expense for the following
year.
At
December 31, 2009, our projected benefit obligations for defined benefit plans
comprised $42.5 million related to U.S. Plans and $8.5 million for the U.K.
plan, which is associated with a former disposed business unit. We
use different discount rate assumptions in determining our defined benefit
pension plan obligations and expense for the plans we maintain in the United
States and the U.K. as the interest rate environment differs from country to
country.
We used
the following discount rates for our defined benefit pension plans:
|
Discount
rates used for:
|
|||||
|
Obligations
at
December
31, 2007
and
expense in 2008
|
Obligations
at
December
31, 2008
and
expense in 2009
|
Obligations
at
December
31, 2009 and expense in 2010
|
|||
|
U.S.
|
6.1%
|
6.1%
|
5.7%
|
||
|
United
Kingdom
|
5.8%
|
6.0%
|
5.8%
|
||
The assumed long-term rate of return on
plan assets represents the estimated average rate of earnings expected to be
earned on the funds invested or to be invested from the plans’ assets provided
to fund the benefit payments inherent in the projected benefit
obligations. Unlike the discount rate, which is adjusted each year
based on changes in current long-term interest rates, the assumed long-term rate
of return on plan assets will not necessarily change based upon the actual
short-term performance of the plan assets in any given year. Defined
benefit pension expense each year is based upon the assumed long-term rate of
return on plan assets for each plan, the actual fair value of the plan assets as
of the beginning of the year and an estimate of the amount of contributions to
and distributions from the plan during the year. Differences between
the expected return on plan assets for a given year and the actual return are
deferred and amortized over future periods based either upon the expected
average remaining service life of the active plan participants (for plans for
which benefits are still being earned by active employees) or the average
remaining life expectancy of the inactive participants (for plans in which
benefits are not still being earned by active employees).
At
December 31, 2009, approximately 82% of the plan assets related to plan assets
for our plans in the U.S., with the remainder related to the
U.K. plan. We use different long-term rates of return on
plan asset assumptions for our U.S. and U.K. defined benefit pension plan
expense because the respective plan assets are invested in a different mix of
investments and the long-term rates of return for different investments differ
from country to country.
In
determining the expected long-term rate of return on plan asset assumptions, we
consider the long-term asset mix (e.g. equity vs. fixed income) for the assets
for each of our plans and the expected long-term rates of return for such asset
components. In addition, we receive advice about appropriate
long-term rates of return from our third-party actuaries. At December
31, 2008 and 2009, substantially all of the assets attributable to U.S. plans
were invested in the Combined Master Retirement Trust (“CMRT”), a collective
investment trust sponsored by Contran to permit the collective investment by
certain master trusts which fund certain employee benefits plans sponsored by
Contran and certain of its affiliates. Harold C. Simmons is the sole
trustee of the CMRT and is a member of the CMRT investment
committee.
The
CMRT’s long-term investment objective is to provide a rate of return exceeding a
composite of broad market equity and fixed income indices (including the S&P
500 and certain Russell indices), while utilizing both third-party investment
managers as well as investments directed by Mr. Simmons. The CMRT
holds TIMET common stock in its investment portfolio; however through December
31, 2009 NL invests in a portion of the CMRT which does not include the TIMET
holdings. During the history of the CMRT from its inception in 1988
through December 31, 2009, the average annual rate of return (excluding the
CMRT’s investment in TIMET common stock) has been 11%.
The CMRT
weighted-average asset allocation by asset category was as follows:
|
December
31,
|
||
|
2008
|
2009
|
|
|
Equity
securities and limited partnerships
|
53%
|
68%
|
|
Fixed
income securities
|
43
|
31
|
|
Cash,
cash equivalents and other
|
4
|
1
|
|
Total
|
100%
|
100%
|
We
regularly review our actual asset allocation for each of our plans, and will
periodically rebalance the investments in each plan to more accurately reflect
the targeted allocation when considered appropriate.
Our assumed long-term rates of return
on plan assets for 2007, 2008 and 2009 were as follows:
|
2007
|
2008
|
2009
|
||||
|
U.S.
|
10.0%
|
10.0%
|
10.0%
|
|||
|
United
Kingdom
|
6.5%
|
7.0%
|
6.5%
|
We currently expect to utilize the same
long-term rate of return on plan asset assumptions in 2010 as we used in 2009
for purposes of determining the 2010 defined benefit pension plan
expense.
To the extent that a plan’s particular
pension benefit formula calculates the pension benefit in whole or in part based
upon future compensation levels, the projected benefit obligations and the
pension expense would be based in part upon expected increases in future
compensation levels. However, we have no active employees participating in our
defined benefit pension plans. Such plans are closed to additional
participants and assumptions regarding future compensation levels are not
applicable for our plans.
In addition to the actuarial
assumptions discussed above, because we maintain a defined benefit pension plan
in the U.K., the amount of recognized defined benefit pension expense and the
amount of net pension asset and net pension liability will vary based upon
relative changes in currency exchange rates.
As
discussed above, assumed discount rates and rates of return on plan assets are
reevaluated annually. A reduction in the assumed discount rate
generally results in an actuarial loss, as the actuarially-determined present
value of estimated future benefit payments will increase. Conversely, an
increase in the assumed discount rate generally results in an actuarial gain. In
addition, an actual return on plan assets for a given year that is greater than
the assumed return on plan assets results in an actuarial gain, while an actual
return on plan assets that is less than the assumed return results in an
actuarial loss. Other actual outcomes that differ from previous
assumptions, such as individuals living longer or shorter than assumed in
mortality tables, which are also used to determine the actuarially-determined
present value of estimated future benefit payments, changes in such mortality
table themselves or plan amendments, will also result in actuarial losses or
gains. These amounts are recognized in other comprehensive
income. In addition, any actuarial gains generated in future periods
would reduce the negative amortization effect included in earnings of any
cumulative unrecognized actuarial losses, while any actuarial losses generated
in future periods would reduce the favorable amortization effect included in
earnings of any cumulative unrecognized actuarial gains.
During
2009, all of our defined benefit pension plans generated a combined net
actuarial loss of approximately $1.3 million. This actuarial loss
resulted primarily from the reduction of the assumed discount rate in
determining our projected benefit obligation.
Based on the actuarial assumptions
described above and our current expectation for what actual average currency
exchange rates will be during 2010, we expect that our defined benefit pension
expense will approximate $600,000 in 2010. In comparison, we expect
to be required to contribute approximately $600,000 to such plans during
2010.
As noted above, defined benefit pension
expense and the amounts recognized as accrued pension costs are based upon the
actuarial assumptions discussed above. We believe that all of the
actuarial assumptions used are reasonable and appropriate. However,
if we had lowered the assumed discount rate by 25 basis points for all of our
plans as of December 31, 2009, our aggregate projected benefit obligations would
have increased by approximately $1.0 million at that date. Such a
change would not materially impact our defined benefit pension income for
2009. Similarly, if we lowered the assumed long-term rate of return
on plan assets by 25 basis points for all of our plans, our defined benefit
pension expense would be expected to increase by approximately $95,000 during
2009.
OPEB plans
- We provide
certain health care and life insurance benefits for eligible retired employees
in the U.S. See Note 16 to our Consolidated Financial
Statements. Under GAAP, OPEB expense and accrued OPEB costs are based
on certain actuarial assumptions, principally the assumed discount rate and the
assumed rate of increases in future health care costs. We recognize
the full unfunded status of our OPEB plans as a liability.
We
recognized consolidated OPEB expense of $629,000 in 2007, $476,000 in 2008 and
$372,000 in 2009. Similar to defined benefit pension benefits, the
amount of funding will differ from the expense recognized for financial
reporting purposes, and contributions to the plans to cover benefit payments
aggregated $1.5 million in 2007, $1.1 million in 2008 and $800,000 in
2009. Substantially all of our accrued OPEB cost relates to benefits
being paid to retirees and their dependents, and no OPEB benefits are being
earned by current employees. As a result, the amount recognized for
OPEB expense for financial reporting purposes has been, and is expected to
continue to be, significantly less than the amount of OPEB benefit payments made
each year. Accordingly, the amount of accrued OPEB expense is
expected to decline gradually.
The assumed discount rates we utilize
for determining OPEB expense and the related accrued OPEB obligations are
generally based on the same discount rates we utilize for our defined benefit
pension plans.
In
estimating the health care cost trend rate, we consider our actual health care
cost experience, future benefit structures, industry trends and advice from our
third-party actuaries. In certain cases, we have the right to pass on
to retirees all or a portion of increases in health care
costs. During each of the past three years, we have assumed that the
relative increase in health care costs will generally trend downward over the
next several years, reflecting, among other things, assumed increases in
efficiency in the health care system and industry-wide and plan-design cost
containment initiatives. For example, at December 31, 2009 the
expected rate of increase in future health care costs ranges from 7.5% in 2010,
declining to 5.5% in 2014 and thereafter.
Based on
the actuarial assumptions described above, we expect that our consolidated OPEB
expense will approximate $300,000 in 2010. In comparison, we expect
to be required to make approximately $1.2 million of contributions to such plans
during 2010.
As noted above, OPEB expense and the
amount we recognize as accrued OPEB costs are based upon the actuarial
assumptions discussed above. We believe that all of the actuarial
assumptions used are reasonable and appropriate. If we had lowered
the assumed discount rate by 25 basis points for all of our OPEB plans as of
December 31, 2009, our aggregate projected benefit obligations would have
increased by approximately $200,000 at that date, and our OPEB expense would be
expected to decrease by less than $10,000 during 2010. Similarly, if
the assumed future health care cost trend rate had been increased by 100 basis
points, our accumulated OPEB obligations would have increased by approximately
$475,000 at December 31, 2009 and the change to OPEB expense would not have been
material.
Non-U.S.
operations
CompX -
CompX has substantial operations and assets located outside the United
States, principally furniture component product operations in Canada and
Taiwan. At December 31, 2009, CompX had substantial net assets
denominated in the Canadian dollar and the New Taiwan dollar.
Kronos -
Kronos has substantial operations located outside the United States
(principally Europe and Canada) for which the functional currency is not the
U.S. dollar. As a result, the reported amount of our net investment
in Kronos will fluctuate based upon changes in currency exchange
rates. At December 31, 2009, Kronos had substantial net assets
denominated in the euro, Canadian dollar, Norwegian krone and British pound
sterling.
LIQUIDITY
AND CAPITAL RESOURCES
Consolidated
cash flows
Operating
activities
Trends in cash flows from operating
activities, excluding the impact of deferred taxes and relative changes in
assets and liabilities, are generally similar to trends in our income from
operations. Cash flows provided by operating activities increased
from $760,000 in 2008 to $1.4 million in 2009. The $631,000 increase
in cash provided by operating activities includes the net effect
of:
|
·
|
Kronos’
suspension of its quarterly dividend in
2009,
|
|
·
|
lower
income from operations in 2009 of $22.2 million (excluding the litigation
settlement pre-tax gain of $11.3 million and the non-cash write-down of
$.7 million on assets held for sale in 2009 and the litigation settlement
pre-tax gain of $48.8 million and the $10.1 million non-cash goodwill
impairment charge in 2008),
|
|
·
|
a
higher amount of net cash provided by relative changes in receivables,
inventories and payables and accrued liabilities in 2009 of $25.5
million,
|
|
·
|
lower
cash paid for income taxes in 2009 of $16.9
million,
|
|
·
|
lower
interest income of $5.3 million in 2009 primarily due to $4.3 million of
interest received from certain escrow funds in
2008,
|
|
·
|
lower
cash paid for interest of $1.0 million in 2009 related to CompX’s
affiliate note payable and
|
|
·
|
higher
adjustments to the provision for inventory reserves in 2009 of
approximately $827,000 due to an increase in obsolete inventory resulting
from reduced demand.
|
Cash flows provided by operating
activities increased from $2.8 million used in operating activities in 2007 to
$760,000 provided by operating activities in 2008. The $3.5 million
increase in cash provided by operating activities includes the net effect
of:
|
·
|
higher
income from operations in 2008 of $10.4 million (excluding both the $10.1
million non-cash goodwill impairment charge and the litigation settlement
pre-tax gain of $48.8 million), due primarily to lower litigation expense
of $7.5 million and lower depreciation and amortization in 2008 of $2.0
million,
|
|
·
|
higher
interest income of $3.2 million in 2008 primarily due to $4.3 million of
interest received from certain escrow
funds,
|
|
·
|
higher
cash paid for environmental liabilities in 2008 of $2.3
million,
|
|
·
|
lower
net cash provided by relative changes in our inventories and receivables
of $3.0 million and
|
|
·
|
higher
cash paid for interest in 2008 of $2.2 million due to CompX’s issuance of
its note payable to an affiliate in the fourth quarter of
2007.
|
We do not
have complete access to CompX’s cash flows in part because we do not own 100% of
CompX. A detail of our consolidated cash flows from operating
activities is presented in the table below. Intercompany dividends
have been eliminated. The reference to NL Parent in the tables below
is a reference to NL Industries, Inc., as the parent company of CompX and our
other wholly-owned subsidiaries.
|
Years ended December 31,
|
||||||||||||
|
2007
|
2008
|
2009
|
||||||||||
|
(In
millions)
|
||||||||||||
|
Cash
provided by (used in) operating
activities:
|
|
|||||||||||
|
CompX
|
$ | 11.9 | $ | 15.7 | $ | 15.3 | ||||||
|
NL
Parent and wholly-owned subsidiaries
|
(9.3 | ) | (9.5 | ) | (8.5 | ) | ||||||
|
Eliminations
|
(5.4 | ) | (5.4 | ) | (5.4 | ) | ||||||
|
Total
|
$ | (2.8 | ) | $ | .8 | $ | 1.4 | |||||
Relative
changes in working capital can have a significant effect on cash flows from
operating activities. As shown below, our average days sales
outstanding decreased from December 31, 2008 to December 31, 2009. In
absolute terms, however, we reduced trade accounts receivable by $5.1 million in
2009 as compared to December 31, 2008. The reduction in our average
days sales outstanding was the result of our efforts to increase our accounts
receivable collection efforts in order to reduce our exposure to bad debts in
light of the challenging economic environment. Also shown below, our
average number of days in inventory decreased from December 31, 2008 to December
31, 2009. In addition, we reduced inventory by $6.4 million in 2009
as compared to 2008. The overall decrease in days in inventory was
the result of our focus on inventory management controls in order to ensure our
inventory balances are aligned with the current needs of our business in light
of the reduction in customer demand. We have provided 2007 data for
comparative purposes below.
|
2007
|
2008
|
2009
|
|
|
Days
sales outstanding
|
44
Days
|
41
Days
|
37
Days
|
|
Days
in inventory
|
63
Days
|
70
Days
|
64
Days
|
Investing
activities
Net cash
provided by investing activities totaled $32.4 million in 2009, $7.1 million in
2008, and $17.5 million in 2007. Capital expenditures, substantially all of
which relate to CompX, were $2.3 million in 2009, $6.9 million in 2008, and
$14.0 million in 2007. Capital expenditures in the past three years
have primarily emphasized improving our manufacturing facilities and investing
in manufacturing equipment which utilizes new technologies and increases
automation of the manufacturing process to provide for increased productivity
and efficiency.
During
2009:
|
·
|
we
received $11.8 million from the second closing contained in a settlement
agreement related to condemnation proceedings on certain real property we
formerly owned in New Jersey,
|
|
·
|
we
collected $22.2 million on notes receivable from
affiliates,
|
|
·
|
we
used $2.3 million for capital expenditures, substantially all of which
relates to CompX, and
|
|
·
|
we
purchased approximately 2,800 shares of Valhi in open-market transactions
for an aggregate amount of $33,000, and we purchased approximately 14,000
shares of Kronos in open–market transactions for an aggregate amount of
$139,000.
|
During
2008:
|
·
|
We
received $39.6 million from the initial closing contained in a settlement
agreement related to condemnation proceedings on certain real property we
owned in New Jersey,
|
|
·
|
We
provided loans to affiliates in the aggregate amount of $22.2
million,
|
|
·
|
CompX
purchased approximately 126,000 shares of its common stock in market
transactions for $1.0 million,
|
|
·
|
We
purchased approximately 79,500 shares of Kronos common stock for $.8
million and approximately 79,000 shares of Valhi for $1.1 million in
market transactions and
|
|
·
|
We
used a net $2.6 million of cash to fund two new escrow accounts related to
environmental matters (such escrow funds are classified as restricted
cash.)
|
In
addition during 2008 we received a $15 million promissory note related to the
settlement of condemnation proceedings. See Notes 9 and 19 to our
Consolidated Financial Statements.
During
2007:
|
·
|
We
sold 800,000 shares of TIMET common stock to Valhi at a cash price of
$33.50 per share, or an aggregate of $26.8
million,
|
|
·
|
We
had additional net proceeds from sales of other marketable securities of
$4.2 million and
|
|
·
|
CompX
purchased approximately 179,100 shares of its common stock in market
transactions for $3.3 million.
|
In
addition, during 2007 CompX repurchased or cancelled a net 2.7 million shares of
its Class A common stock held by TIMET, an affiliate, for $19.50 per share, or
aggregate consideration of $52.6 million, which was paid in the form of a
consolidated promissory note. See Notes 2 and 17 to our Consolidated
Financial Statements.
Financing
activities
Net cash
used in financing activities totaled $25.9 million, $32.2 million, and $27.3
million in 2009, 2008, and 2007, respectively. We paid cash dividends
of $24.3 million ($.50 per share) in each of 2009, 2008 and
2007. Other financing activities over the past three years consisted
principally of:
|
·
|
CompX
paid cash dividends to noncontrolling interests in the amount of $.8
million in 2009, $.8 million in 2008 and $1.9 million in
2007,
|
|
·
|
CompX
prepaid $.8 million in 2009, $7.0 million in 2008 and $2.6 million in 2007
on its note payable to TIMET and
|
|
·
|
CompX
received proceeds from the exercise of options to purchase CompX common
stock of $1.4 million in 2007.
|
CompX and
Kronos are in compliance with all of their debt covenants at December 31,
2009. Our and our affiliates’ ability to borrow funds under our
credit facilities in the future will, in some instances, depend in part on our
ability to comply with specified financial ratios and satisfy certain financial
covenants contained in the applicable credit agreements.
Certain
of Kronos’ credit facilities require the maintenance of minimum levels of
equity, require the maintenance of certain financial ratios, limit dividends and
additional indebtedness and contain other provisions and restrictive covenants
customary in lending transactions of this type. In this regard, in
the first half of 2009 Kronos reduced its production levels in response to the
current economic environment, which favorably impacted its liquidity and cash
flows by reducing inventory levels. The reduced capacity utilization
levels negatively impacted Kronos’ 2009 results of operations due to the
resulting unabsorbed fixed production costs that are charged to expense as
incurred. Furthermore, lower sales negatively impacted Kronos’
results of operations in the first half of 2009. As a result, we did
not expect Kronos to maintain compliance under its European revolving credit
facility with the required financial ratio of the borrowers’ net secured debt to
earnings before income taxes, interest and depreciation, as defined in the
credit facility, for the 12-month period ending March 31,
2009. Beginning on March 20, 2009, the lenders associated with
Kronos’ European revolving credit facility agreed to a series of waivers for
compliance with such required financial ratio. On September 15, 2009
Kronos and the lenders entered into the Fourth Amendment to the credit
facility. Among other things, the Fourth Amendment added two
additional financial covenants and increased the rate on outstanding borrowings
to LIBOR plus a margin ranging from 3% to 4% depending on the amount of
outstanding borrowings. Upon achieving a specified financial covenant,
these two additional financial covenants will no longer be in effect, and the
interest rate on outstanding borrowings will be reduced to LIBOR plus
1.75%. Additionally the borrowing availability under the line is limited
to euro 51 million ($73.5 million at December 31, 2009) until Kronos is in
compliance with certain specified financial covenants, and in any event no
earlier than March 31, 2010. We believe that Kronos will be able to
comply with the new financial covenants through the maturity of the facility;
however if future operating results differ materially from our predictions
Kronos may be unable to maintain compliance.
During
the fourth quarter of 2009, Kronos amended the terms of its Canadian revolving
credit facility to reduce the size of the facility from Cdn. $30 million to Cdn.
$20 million and extend the maturity date to January 2012.
At
December 31, 2009, Kronos is in compliance with all of its debt
covenants.
Liquidity
Our
primary source of liquidity on an ongoing basis is our cash flow from operating
activities. We generally use these amounts to (i) fund capital
expenditures (substantially all of which relate to CompX), (ii) pay ongoing
environmental remediation and legal expenses and (iii) provide for the payment
of debt service and dividends.
At
December 31, 2009, there were no amounts outstanding under CompX’s $37.5 million
revolving credit facility that matures in January 2012 and there are no current
expectations to borrow on the revolving credit facility in the near
term. As a result of covenant restrictions relating to the ratio of
earnings before interest and tax to cash interest expense, as defined in the
Credit Agreement, CompX would not have been able to borrow under the Credit
Agreement during the third or fourth quarters of 2009 due to a loss before
interest and tax incurred in each of those quarters,
respectively. Any future losses before interest and tax would also
likely restrict or prohibit borrowings under the Credit
Agreement. However, there are no current expectations that CompX will
be required to borrow on the revolving credit facility in the near term as cash
flows from operations are expected to be sufficient to fund its future liquidity
requirements. See “Outlook” for further discussion of expectations
relating to compliance with credit facility debt covenants.
While the
required ratio of earnings before interest and tax to cash interest expense
limited CompX’s ability to borrow under the Credit Agreement during the third
and fourth quarters of 2009, the financial covenant does not directly impact
CompX’s ability to pay dividends on its common stock. CompX believes
that cash generated from operations together with cash on hand will be
sufficient to meet its liquidity needs for working capital, capital
expenditures, debt service and dividends (if declared) for at least the next
twelve months. To the extent that actual operating results or other
developments differ from our expectations, CompX’s liquidity could be adversely
affected.
At
December 31, 2009, we had an aggregate of $36.9 million of restricted and
unrestricted cash, cash equivalents and debt securities. A detail by
entity is presented in the table below.
|
CompX
|
$20.8
|
|
NL
Parent and wholly-owned subsidiaries
|
16.1
|
|
Total
|
$36.9
|
We
routinely compare our liquidity requirements and alternative uses of capital
against the estimated future cash flows we expect to receive from our
subsidiaries and affiliates. As a result of this process, we have in
the past and may in the future seek to raise additional capital, incur debt,
repurchase indebtedness in the market or otherwise, modify our dividend
policies, consider the sale of our interests in our subsidiaries, affiliates,
business units, marketable securities or other assets, or take a combination of
these and other steps, to increase liquidity, reduce indebtedness and fund
future activities. Such activities have in the past and may in the
future involve related companies.
We
periodically evaluate acquisitions of interests in or combinations with
companies (including related companies) perceived by management to be
undervalued in the marketplace. These companies may or may not be
engaged in businesses related to our current businesses. We intend to
consider such acquisition activities in the future and, in connection with this
activity, may consider issuing additional equity securities and increasing
indebtedness. From time to time, we also evaluate the restructuring
of ownership interests among our respective subsidiaries and related
companies.
Based
upon our expectations of our operating performance, and the anticipated demands
on our cash resources we expect to have sufficient liquidity to meet our
short-term obligations (defined as the twelve-month period ending December 31,
2010). If actual developments differ from our expectations, our
liquidity could be adversely affected. In this regard, during 2010 we
currently expect to borrow funds from CompX in order to meet our cash
requirements, and CompX has agreed to loan us up to $8 million. The
amount of any such outstanding loan CompX would make to us at any time is at
CompX’s discretion. It is probable during 2010 that CompX will loan
amounts to us in addition to the $8 million available under the promissory
note. Any such loans would be eliminated in our Consolidated
Financial Statements.
Capital
Expenditures
We
currently expect that our aggregate capital expenditures for CompX in 2010 will
be approximately $3.6 million compared to $2.3 million in 2009 and $6.8 million
in 2008. CompX’s planned capital expenditures in 2009 were limited to
expenditures required to meet expected customer demand and properly maintain our
facilities. Capital spending for 2010 is expected to be funded
through cash on hand and cash generated from operations and relate to
expenditures required to meet expected customer demand and to properly maintain
our facilities. Kronos intends to spend approximately $43
million for major improvements and upgrades to existing facilities during 2010,
including approximately $12 million in the area of environmental protection and
compliance.
Dividends
Because
our operations are conducted primarily through subsidiaries and affiliates, our
long-term ability to meet parent company-level corporate obligations is largely
dependent on the receipt of dividends or other distributions from our
subsidiaries and affiliates. CompX currently pays a regular quarterly
dividend of $.125 per share. At that rate, and based on the 10.8
million shares of CompX we held at December 31, 2009, we would receive annual
dividends from CompX of $5.4 million. In addition, Valhi pays regular
quarterly dividends of $.10 per share. Based on the 4.8 million
shares of Valhi we held at December 31, 2009, we would receive annual dividends
from Valhi of $1.9 million. In February 2009, Kronos and TIMET announced the
suspension of their regularly quarterly dividends in consideration of the
challenges and opportunities that exist in the respective TiO2 pigments
and titanium metals industries. We received aggregate dividends from
Kronos and TIMET of $17.5 million and $435,000, respectively, in
2008.
Investments
in our Subsidiaries and Affiliates and other Acquisitions
We have
in the past, and may in the future, purchase the securities of our subsidiaries
and affiliates or third-parties in market or privately-negotiated
transactions. We base our purchase decisions on a variety of factors,
including an analysis of the optimal use of our capital, taking into account the
market value of the securities and the relative value of expected returns on
alternative investments. In connection with these activities, we may
consider issuing additional equity securities or increasing our
indebtedness. We may also evaluate the restructuring of ownership
interests of our businesses among our subsidiaries and related
companies.
During
2009, we purchased approximately 14,000 shares of Kronos in open-market
transactions for an aggregate amount of $139,000. Also during 2009 we
purchased approximately 2,800 shares of Valhi in open-market transactions for an
aggregate amount of $33,000. During 2008 we purchased approximately
79,000 shares of Valhi in open-market transactions for an aggregate amount of
$1.1 million and we purchased approximately 79,500 shares of Kronos in
open–market transactions for an aggregate amount of $800,000. See
Notes 4 and 7 to our Consolidated Financial Statements.
Summary
of debt and other contractual commitments
As more
fully described in the notes to our Consolidated Financial Statements, we are
party to various debt, lease and other agreements which contractually and
unconditionally commit us to pay certain amounts in the future. See
Notes 12 and 19 to our Consolidated Financial Statements. The
following table summarizes our contractual commitments as of December 31, 2009
by the type and date of payment.
|
Payment due date
|
||||||||||||||||||||
|
Contractual commitment
|
2010
|
2011/2012 | 2013/2014 |
2015
and
After
|
Total
|
|||||||||||||||
|
(In
millions)
|
||||||||||||||||||||
|
Note
and interest payable to affiliate
|
$ | - | $ | 3.5 | $ | 41.1 | $ | - | $ | 44.6 | ||||||||||
|
Estimated
tax obligations
|
.3 | - | - | - | .3 | |||||||||||||||
|
Operating
leases
|
.6 | .7 | - | - | 1.3 | |||||||||||||||
|
Purchase
obligations
|
11.4 | - | - | - | 11.4 | |||||||||||||||
|
Fixed
asset acquisitions
|
.4 | - | - | - | .4 | |||||||||||||||
| $ | 12.7 | $ | 4.2 | $ | 41.1 | $ | - | $ | 58.0 | |||||||||||
The
timing and amount shown for our commitments related to notes payable, operating
leases and fixed asset acquisitions are based upon the contractual payment
amount and the contractual payment date for such commitments. The
timing and amount shown for raw material and other purchase obligations, which
consist of all open purchase orders and contractual obligations (primarily
commitments to purchase raw materials) is also based on the contractual payment
amount and the contractual payment date for such commitments. The
amount shown for income taxes is the consolidated amount of income taxes payable
including the net amount payable to Valhi under our tax sharing agreement at
December 31, 2009, which is assumed to be paid during 2010. Fixed
asset acquisitions include firm purchase commitments for capital
projects.
The above
table does not reflect any amounts that we might pay to fund our defined benefit
pension and OPEB plans, as the timing and amount of any such future fundings are
unknown and dependent on, among other things, the future performance of defined
benefit pension plan assets, interest rate assumptions and actual future retiree
medical costs. Such defined benefit pension plans and OPEB plans are
discussed above in greater detail.
The above
table also does not reflect any amounts that we might pay to settle any of our
uncertain tax positions, as the timing and amount of any such future settlements
are unknown and dependent on, among other things, the timing of tax
audits. See Notes 15 and 21 to our Consolidated Financial
Statements.
Commitments
and contingencies
We are subject to certain commitments
and contingencies, as more fully described in Note 19 to our Consolidated
Financial Statements or in Part I, Item 3 of this report. In addition
to those legal proceedings described in Note 19 to our Consolidated Financial
Statements, various legislation and administrative regulations have, from time
to time, been proposed that seek to (i) impose various obligations on present
and former manufacturers of lead pigment and lead-based paint (including us)
with respect to asserted health concerns associated with the use of such
products and (ii) effectively overturn court decisions in which we and other
pigment manufacturers have been successful. Examples of such proposed
legislation include bills which would permit civil liability for damages on the
basis of market share, rather than requiring plaintiffs to prove that the
defendant's product caused the alleged damage, and bills which would revive
actions barred by the statute of limitations. While no legislation or
regulations have been enacted to date that are expected to have a material
adverse effect on our consolidated financial position, results of operations or
liquidity, enactment of such legislation could have such an
effect.
Off
balance sheet financing arrangements
Other
than operating lease commitments disclosed in Note 19 to our Consolidated
Financial Statements, we are not party to any material off-balance sheet
financing arrangements.
ITEM
7A. QUANTITATIVE
AND QUALITATIVE DISCLOSURES ABOUT MARKET RISK
General - We are exposed to market
risk from changes in currency exchange rates, interest rates, raw materials and
equity security prices.
Interest
rates - We are
exposed to market risk from changes in interest rates, primarily related to our
indebtedness.
At
December 31, 2009 and 2008, CompX had no amounts outstanding under its secured
Revolving Bank Credit Agreement. In conjunction with CompX’s
repurchase and/or cancellation of a net 2.7 million shares of its class A common
stock, during the fourth quarter of 2007, CompX issued a promissory note for
$52.6 million. See Notes 12 and 17 to our Consolidated Financial
Statements. At December 31, 2009, there was $42.2 million outstanding
on the promissory note ($43.0 million at December 31, 2008) which bears interest
at LIBOR plus 1%, (1.25% and 5.05% at December 31, 2009 and 2008, respectively)
and the fair value of such indebtedness approximates its carrying
value. The interest rate is reset quarterly based on the three month
LIBOR.
Currency exchange
rates - We are
exposed to market risk arising from changes in currency exchange rates as a
result of manufacturing and selling our products outside the United States
(principally Canada and Taiwan). A portion of sales generated from
our non-U.S. operations are denominated in currencies other than the U.S.
dollar, principally the Canadian dollar and the New Taiwan dollar. In
addition, a portion of our sales generated from our non-U.S. operations are
denominated in the U.S. dollar. Most raw materials, labor and other
production costs for such non-U.S. operations are denominated primarily in local
currencies. Consequently, the translated U.S. dollar value of our
non-U.S. sales and operating results are subject to currency exchange rate
fluctuations which may favorably or unfavorably impact reported earnings and may
affect comparability of period-to-period operating results.
As
mentioned above, certain of our sales generated by CompX’s non-U.S. operations
are denominated in U.S. dollars. To mitigate the financial statement
impact of changes in currency exchange rates, CompX periodically enters into
forward currency contracts. At each balance sheet date, outstanding
forward currency contracts are marked to market with any resulting gain or loss
recognized in income currently unless the contract is designated as a hedge upon
which the mark-to-market adjustment is recorded in other comprehensive income.
We had no forward currency contracts outstanding at December 31,
2009.
To manage
a portion of the currency exchange rate market risk associated with receivables,
or similar exchange rate risk associated with future sales, at December 31, 2008
CompX had entered into a series of short-term forward currency exchange
contracts to exchange an aggregate of $7.5 million for an equivalent value of
Canadian dollars at exchange rates of Cdn. $1.25 to $1.26 per U.S.
dollar. These contracts qualified for hedge accounting and matured
through June 2009. At December 31, 2008, the actual exchange rate was
Cdn. $1.22 per U.S. dollar. The estimated fair value of such
contracts was not material at December 31, 2008.
Marketable equity
and debt security prices
- We are exposed to market risk due to changes in prices of the
marketable securities which we own. The fair value of equity
securities at December 31, 2008 and 2009 was $64.0 million and $85.1 million,
respectively. The potential change in the aggregate fair value of
these investments, assuming a 10% change in prices, would be $6.4 million at
December 31, 2008 and $8.5 million at December 31, 2009. The fair
value of marketable debt securities at December 31, 2008 was $5.5 million and
was $5.2 million at December 31, 2009. The potential change in the
aggregate fair value of these investments assuming a 10% change in prices would
be $550,000 at December 31, 2008 and $520,000 at December 31, 2009.
Raw materials
- CompX will
occasionally enter into raw material arrangements to mitigate the short-term
impact of future increases in raw material costs. Otherwise, we
generally do not have long-term supply agreements for our raw material
requirements because either we believe the risk of unavailability of those raw
materials is low and we believe the price to be stable or because long-term
supply agreements for those materials are generally not available. We
do not engage in commodity hedging programs.
Other - We believe there may be a
certain amount of incompleteness in the sensitivity analyses presented
above. For example, the hypothetical effect of changes in interest
rates discussed above ignores the potential effect on other variables which
affect our results of operations and cash flows, such as demand for our
products, sales volumes, selling prices and operating
expenses. Contrary to the above assumptions, changes in interest
rates rarely result in simultaneous parallel shifts along the yield
curve. Accordingly, the amounts presented above are not necessarily
an accurate reflection of the potential losses we would incur assuming the
hypothetical changes in market prices were actually to occur.
The above discussion and estimated
sensitivity analysis amounts include forward-looking statements of market risk
which assume hypothetical changes in market prices. Actual future
market conditions will likely differ materially from such
assumptions. Accordingly, such forward-looking statements should not
be considered to be projections of future events, gains or
losses.
ITEM 8. FINANCIAL
STATEMENTS AND SUPPLEMENTARY DATA
The information called for by this Item
is contained in a separate section of this Annual Report. See "Index
of Financial Statements and Schedules" (page F-1).
|
ITEM 9.
|
CHANGES
IN AND DISAGREEMENTS WITH ACCOUNTANTS ON ACCOUNTING AND FINANCIAL
DISCLOSURE
|
None.
ITEM 9A. CONTROLS
AND PROCEDURES
Evaluation
of disclosure controls and procedures
We
maintain a system of disclosure controls and procedures. The term
"disclosure controls and procedures," as defined by Exchange Act Rule 13a-15(e),
means controls and other procedures that are designed to ensure that information
required to be disclosed in the reports that we file or submit to the SEC under
the Securities Exchange Act of 1934, as amended (the "Act"), is recorded,
processed, summarized and reported, within the time periods specified in the
SEC's rules and forms. Disclosure controls and procedures include,
without limitation, controls and procedures designed to ensure that information
we are required to disclose in the reports we file or submit to the SEC under
the Act is accumulated and communicated to our management, including our
principal executive officer and our principal financial officer, or persons
performing similar functions, as appropriate to allow timely decisions to be
made regarding required disclosure. Each of Harold C. Simmons, our
Chief Executive Officer, and Gregory M. Swalwell, our Vice President, Finance
and Chief Financial Officer, have evaluated the design and effectiveness of our
disclosure controls and procedures as of December 31, 2009. Based
upon their evaluation, these executive officers have concluded that our
disclosure controls and procedures are effective as of December 31,
2009.
Internal
control over financial reporting
We also
maintain internal control over financial reporting. The term
“internal control over financial reporting,” as defined by Exchange Act Rule
13a-15(f) means a process designed by, or under the supervision of, our
principal executive and principal financial officers, or persons performing
similar functions, and effected by the board of directors, management and other
personnel, to provide reasonable assurance regarding the reliability of
financial reporting and the preparation of financial statements for external
purposes in accordance with GAAP, and includes those policies and procedures
that:
|
·
|
pertain
to the maintenance of records that in reasonable detail accurately and
fairly reflect the transactions and dispositions of our
assets,
|
|
·
|
provide
reasonable assurance that transactions are recorded as necessary to permit
preparation of financial statements in accordance with GAAP, and that
receipts and expenditures are being made only in accordance with
authorizations of management and directors
and
|
|
·
|
provide
reasonable assurance regarding prevention or timely detection of an
unauthorized acquisition, use or disposition of assets that could have a
material effect on our Condensed Consolidated Financial
Statements.
|
Section
404 of the Sarbanes-Oxley Act of 2002 requires us to report on internal control
over financial reporting in this Annual Report on Form 10-K for the year ended
December 31, 2009. Our independent registered public accounting firm
is also required to audit our internal control over financial reporting as of
December 31, 2009.
As
permitted by the SEC, our assessment of internal control over financial
reporting excludes (i) internal control over financial reporting of equity
method investees and (ii) internal control over the preparation of our financial
statement schedules required by Article 12 of Regulation
S-X. However, our assessment of internal control over financial
reporting with respect to equity method investees did include controls over the
recording of amounts related to our investment that are recorded in the
consolidated financial statements, including controls over the selection of
accounting methods for our investments, the recognition of equity method
earnings and losses and the determination, valuation and recording of our
investment account balances.
Changes
in internal control over financial reporting
There has
been no change to our internal control over financial reporting during the
quarter ended December 31, 2009 that has materially affected, or is reasonably
likely to materially affect, our internal control over financial
reporting.
Management’s
report on internal control over financial reporting
Our
management is responsible for establishing and maintaining adequate internal
control over financial reporting, as such term is defined in Exchange Act Rules
13a-15(f) and 15d-15(f). Our evaluation of the effectiveness of
internal control over financial reporting is based upon the criteria established
in Internal Control –
Integrated Framework issued by the Committee of Sponsoring Organizations
of the Treadway Commission (commonly referred to as the “COSO”
framework). Based on our evaluation under that framework, we have
concluded that our internal control over financial reporting was effective as of
December 31, 2009.
PricewaterhouseCoopers LLP, the
independent registered public accounting firm that has audited our consolidated
financial statements included in this Annual Report, has audited the
effectiveness of our internal control over financial reporting as of December
31, 2009, as stated in their report which is included in this Annual Report on
Form 10-K.
Certifications
Our chief executive officer
is required to annually file a certification with the New York Stock Exchange
(“NYSE”), certifying our compliance with the corporate governance listing
standards of the NYSE. During 2009, our chief executive officer filed
such annual certification with the NYSE. The 2009 certification was
unqualified.
Our chief
executive officer and chief financial officer are also required to, among other
things, quarterly file certifications with the SEC regarding the quality of our
public disclosures, as required by Section 302 of the Sarbanes-Oxley Act of
2002. We have filed the certifications for the quarter ended December
31, 2009 as Exhibits 31.1 and 31.2 to this Annual Report on Form
10-K.
ITEM 9B. OTHER
INFORMATION
Not applicable.
PART
III
ITEM 10. DIRECTORS,
EXECUTIVE OFFICERS AND CORPORATE GOVERNANCE.
The information required by this Item
is incorporated by reference to our definitive Proxy Statement to be filed with
the SEC pursuant to Regulation 14A within 120 days after the end of the fiscal
year covered by this report (the "NL Proxy Statement").
ITEM 11. EXECUTIVE
COMPENSATION.
The information required by this Item
is incorporated by reference to the NL Proxy Statement.
ITEM 12. SECURITY
OWNERSHIP OF CERTAIN BENEFICIAL OWNERS AND MANAGEMENT AND RELATED STOCKHOLDER
MATTERS.
The information required by this Item
is incorporated by reference to the NL Proxy Statement.
ITEM 13. CERTAIN
RELATIONSHIPS AND RELATED TRANSACTIONS, AND DIRECTOR INDEPENDENCE.
The information required by this Item
is incorporated by reference to the NL Proxy Statement. See also Note
17 to the Consolidated Financial Statements.
ITEM 14. PRINCIPAL
ACCOUNTING FEES AND SERVICES.
The
Information required by this Item is incorporated by reference to the NL Proxy
Statement.
PART
IV
ITEM
15. EXHIBITS
AND FINANCIAL STATEMENT SCHEDULES
|
(a)
and (c)
|
Financial
Statements and Schedules
|
The
Registrant
The
consolidated financial statements and schedules of the Registrant listed on the
accompanying Index of Financial Statements and Schedules (see page F-1) are
filed as part of this Annual Report.
50%-or-less persons
|
|
The
consolidated financial statements of Kronos (36%-owned at December 31,
2009) are incorporated by reference in Exhibit 99.1 of this Annual Report
pursuant to Rule 3-09 of Regulation S-X. Management’s Report on
Internal Control Over Financial Reporting of Kronos is not included as
part of Exhibit 99.1. The Registrant is not required to provide
any other consolidated financial statements pursuant to Rule 3-09 of
Regulation S-X.
|
|
|
(b)
|
Exhibits
|
We have
included as exhibits the items listed in the Exhibit Index. We will
furnish a copy of any of the exhibits listed below upon payment of $4.00 per
exhibit to cover our cost to furnish the exhibits. Pursuant to Item
601(b)(4)(iii) of Regulation S-K, any instrument defining the rights of holders
of long-term debt issues and other agreements related to indebtedness which do
not exceed 10% of consolidated total assets as of December 31, 2009 will be
furnished to the Commission upon request.
We will
also furnish, without charge, a copy of our Code of Business Conduct and Ethics,
as adopted by the board of directors on February 19, 2004, upon
request. Such requests should be directed to the attention of our
Corporate Secretary at our corporate offices located at 5430 LBJ Freeway, Suite
1700, Dallas, Texas 75240.
Item
No. Exhibit
Index
|
2.1
|
Form
of Distribution Agreement between NL Industries, Inc. and Kronos
Worldwide, Inc. – incorporated by reference to Exhibit 2.1 to the Kronos
Worldwide, Inc. Registration Statement on Form 10 (File No.
001-31763).
|
|
3.1
|
Certificate
of Amended and Restated Certificate of Incorporation dated May 22,
2008 - incorporated by reference to Exhibit 1 to the Registrant’s
Proxy Statement on Schedule 14A (File No. 001-00640) for the annual
meeting held on May 21, 2008.
|
|
3.2
|
Amended
and Restated Bylaws of NL Industries, Inc. as of May 23, 2008 –
incorporated by reference to Exhibit 3.1 of the Registrant’s Current
Report on Form 8-K (File No. 001-00640) filed with the U.S. Securities and
Exchange Commission on May 23,
2008.
|
|
4.1
|
Indenture
governing the 6.5% Senior Secured Notes due 2013,
dated
|
|
as
of April 11, 2006, between Kronos International, Inc. and
The
|
|
|
Bank
of New York, as trustee (incorporated by reference to Exhibit 4.1 to the
Current Report on Form 8-K of Kronos International, Inc. (File No.
333-100047) that was filed with the U.S. Securities and Exchange
Commission on April 11, 2006).
|
|
10.1
|
Lease
Contract dated June 21, 1952, between Farbenfabriken Bayer
Aktiengesellschaft and Titangesellschaft mit beschrankter Haftung (German
language version and English translation thereof) - incorporated by
reference to Exhibit 10.14 to the Registrant’s Annual Report on Form 10-K
(File No. 001-00640) for the year ended December 31,
1985.
|
|
10.2
|
Formation
Agreement dated as of October 18, 1993 among Tioxide Americas Inc., Kronos
Louisiana, Inc. and Louisiana Pigment Company, L.P. - incorporated by
reference to Exhibit 10.2 to the Registrant’s Quarterly Report on Form
10-Q (File No. 001-00640) for the quarter ended September 30,
1993.
|
|
10.3
|
Joint
Venture Agreement dated as of October 18, 1993 between Tioxide Americas
Inc. and Kronos Louisiana, Inc. - incorporated by reference to Exhibit
10.3 to the Registrant’s Quarterly Report on Form 10-Q (File No.
001-00640) for the quarter ended September 30,
1993.
|
|
10.4
|
Kronos
Offtake Agreement dated as of October 18, 1993 between Kronos Louisiana,
Inc. and Louisiana Pigment Company, L.P. - incorporated by reference to
Exhibit 10.4 to the Registrant’s Quarterly Report on Form 10-Q (File No.
001-00640) for the quarter ended September 30,
1993.
|
|
10.5
|
Amendment
No. 1 to Kronos Offtake Agreement dated as of December 20, 1995 between
Kronos Louisiana, Inc. and Louisiana Pigment Company, L.P. - incorporated
by reference to Exhibit 10.22 to the Registrant’s Annual Report on Form
10-K (File No. 001-00640) for the year ended December 31,
1995.
|
|
10.6
|
Tioxide
Americas Offtake Agreement dated as of October 18, 1993 between Tioxide
Americas Inc. and Louisiana Pigment Company, L.P. - incorporated by
reference to Exhibit 10.5 to the Registrant’s Quarterly Report on Form
10-Q (File No. 001-00640) for the quarter ended September 30,
1993.
|
|
10.7
|
Amendment
No. 1 to Tioxide Americas Offtake Agreement dated as of December 20, 1995
between Tioxide Americas Inc. and Louisiana Pigment Company, L.P. -
incorporated by reference to Exhibit 10.24 to the Registrant’s Annual
Report on Form 10-K (File No. 001-00640) for the year ended December 31,
1995.
|
|
10.8
|
Parents’
Undertaking dated as of October 18, 1993 between ICI American Holdings
Inc. and Kronos Worldwide, Inc. (f/k/a Kronos, Inc.) - incorporated by
reference to Exhibit 10.9 to the Registrant’s Quarterly Report on Form
10-Q (File No. 001-00640) for the quarter ended September 30,
1993.
|
|
10.9
|
Allocation
Agreement dated as of October 18, 1993 between Tioxide Americas Inc., ICI
American Holdings, Inc., Kronos Worldwide, Inc. (f/k/a Kronos, Inc.). and
Kronos Louisiana, Inc. - incorporated by reference to Exhibit 10.10 to the
Registrant’s Quarterly Report on Form 10-Q (File No. 001-00640) for the
quarter ended September 30, 1993.
|
|
10.10 *
|
Form
of Kronos Worldwide, Inc. 2003 Long-Term Incentive Plan – incorporated by
reference to Exhibit 10.4 to the Kronos Worldwide, Inc. Registration
Statement on Form 10 (File No.
001-31763).
|
|
10.11
|
Intercorporate
Services Agreement by and between Contran Corporation and Kronos
Worldwide, Inc. – incorporated by reference to Exhibit 10.1 to the Kronos
Worldwide, Inc. Quarterly Report on Form 10-Q (File No. 001-31763) for the
quarter ended March 31, 2004.
|
|
10.12
|
Form
of Tax Agreement between Valhi, Inc. and Kronos Worldwide, Inc –
incorporated by reference to Exhibit 10.1 to the Kronos Worldwide, Inc.
Registration Statement on Form 10 (File No.
001-31763).
|
|
10.13
|
Euro
80,000,000 Facility Agreement, dated June 25, 2002, among Kronos Titan
GmbH & Co. OHG, Kronos Europe S.A./N.V., Kronos Titan A/S and Titania
A/S, as borrowers, Kronos Titan GmbH & Co. OHG, Kronos Europe
S.A./N.V. and Kronos Norge AS, as guarantors, Kronos Denmark ApS, as
security provider, Deutsche Bank AG, as mandated lead arranger, Deutsche
Bank Luxembourg S.A., as agent and security agent, and KBC Bank NV, as
fronting bank, and the financial institutions listed in Schedule 1
thereto, as lenders - incorporated by reference to Exhibit 10.1 to the
Quarterly Report on Form 10-Q of NL Industries, Inc. (File No. 001-00640)
for the quarter ended June 30,
2002.
|
|
10.14
|
First
Amendment Agreement, dated September 3, 2004, Relating to a Facility
Agreement dated June 25, 2002 among Kronos Titan GmbH, Kronos Europe
S.A./N.V., Kronos Titan AS and Titania A/S, as borrowers, Kronos Titan
GmbH, Kronos Europe S.A./N.V. and Kronos Norge AS, as guarantors, Kronos
Denmark ApS, as security provider, with Deutsche Bank Luxembourg S.A.,
acting as agent – incorporated by reference to Exhibit 10.8 to the
Registration Statement on Form S-1 of Kronos Worldwide, Inc. (File No.
333-119639).
|
|
10.15
|
Second
Amendment Agreement Relating to a Facility Agreement dated June 25, 2002
executed as of June 14, 2005 by and among Deutsche Bank AG, as mandated
lead arranger, Deutsche Bank Luxembourg S.A. as agent, the participating
lenders, Kronos Titan GmbH, Kronos Europe S.A./N.V, Kronos Titan AS,
Kronos Norge AS, Titania AS and Kronos Denmark ApS – incorporated by
reference to Exhibit 10.3 to the Annual report on Form 10-K (File No.
333-100047) of Kronos International, Inc. for the year ended December 31,
2009.
|
|
10.16
|
Third
Amendment Agreement Relating to a Facility Agreement dated June 25, 2002
executed as of May 26, 2008 by and among Deutsche Bank AG, as mandated
lead arranger, Deutsche Bank Luxembourg S.A., as agent, the participating
lenders, Kronos Titan GmbH, Kronos Europe S.A.,/N.V, Kronos Titan AS,
Kronos Norge AS, Titania AS and Kronos Denmark ApS – incorporated by
reference to Exhibit 10.4 to the Annual report on Form 10-K (File No.
333-100047) of Kronos International, Inc. for the year ended December 31,
2009.
|
|
10.17
|
Fourth
Amendment Agreement Relating to a Facility Agreement dated June 25, 2002
executed as of September 15, 2009 by and among Deutsche Bank AG, as
mandated lead arranger, Deutsche Bank Luxembourg S.A., as agent, the
participating lenders, Kronos Titan GmbH, Kronos Europe S.A./N.V., Kronos
Titan AS, Kronos Norge AS, Titania AS and Kronos Denmark ApS –
incorporated by reference to Exhibit 10.5 to the Annual report on Form
10-K (File No. 333-100047) of Kronos International, Inc. for the year
ended December 31, 2009.
|
|
10.18
|
Intercorporate
Services Agreement between CompX International Inc. and Contran
Corporation effective as of January 1, 2004 – incorporated by reference to
Exhibit 10.2 to the CompX International Inc. Annual Report on Form 10-K
(File No. 1-13905) for the year ended December 31,
2004.
|
|
10.19*
|
CompX
International Inc. 1997 Long-Term Incentive Plan – incorporated by
reference to Exhibit 10.2 to the CompX International Inc. Registration
Statement on Form S-1 (File No.
1-13905).
|
|
10.20
|
$50,000,000
Credit Agreement between CompX International Inc. and Wachovia Bank,
National Association, as Agent and various lending institutions dated
December 23, 2005 – incorporated by reference to Exhibit 10.9 of CompX
International Inc.’s Form 10-K (File No. 1-13905) for the year ended
December 31, 2009.
|
|
10.21
|
First
Amendment to Credit Agreement dated as of October 16, 2007 among CompX
International Inc., CompX Security Products, Inc., CompX Precision Slides
Inc., CompX Marine Inc., Custom Marine Inc., Livorsi Marine Inc., Wachovia
Bank, National Association for itself and as administrative agent for
Compass Bank and Comerica Bank - incorporated by reference to Exhibit
10.12 of CompX International Inc.’s Form 10-K (File No. 1-13905) for the
year ended December 31, 2007.
|
|
10.22
|
Second
Amendment to Credit Agreement dated as of January 15, 2009 among CompX
International Inc., CompX Security Products Inc., CompX Precision Slides
Inc., CompX Marine Inc., Custom Marine Inc., Livorsi Marine Inc., Wachovia
Bank, National Association for itself and as administrative agent for
Compass Bank and Comerica Bank - incorporated by reference to Exhibit 10.1
of the Registrant’s Current Report on Form 8-K (File No. 1-13905) filed on
January 21, 2009.
|
|
10.23
|
Third
Amendment to Credit Agreement dated as of September 21, 2009 by and among
CompX International Inc., CompX Security Products Inc., CompX Precision
Slides Inc., CompX Marine Inc., Custom Marine Inc., Livorsi Marine Inc.,
Wachovia Bank, National Association and Comerica Bank - incorporated by
reference to Exhibit 10.1 of the Registrant’s Current Report on Form 8-K
(File No. 1-13905) filed on September 24,
2009.
|
|
10.24
|
Stock
Purchase Agreement dated October 11, 2007 between NL Industries, Inc. and
Valhi, Inc., - incorporated by reference to Exhibit 10.6 of CompX
International Inc.’s Form 10-K (File No. 1-13905) for the year ended
December 31, 2007.
|
|
10.25
|
Stock
Purchase Agreement dated October 16, 2007 between CompX International,
Inc. and TIMET Finance Management Company – incorporated by reference to
Exhibit 10.6 of CompX International Inc.’s Form 10-K (File No. 1-13905)
for the year ended December 31,
2007.
|
|
10.26
|
Form
of Subordination Agreement among CompX International Inc., TIMET Finance
Management Company, CompX Security Products, Inc., CompX Precision Sildes
Inc., CompX Marine Inc., Custom Marine Inc., Livorsi Marine Inc., Wachovia
Bank, National Association as administrative agent for itself, Compass
Bank and Comerica Bank – incorporated by reference to Exhibit 10.8 of
CompX International Inc.’s Form 10-K (File No. 1-13905) for the year ended
December 31, 2007.
|
|
10.27
|
First
Amendment to Subordination Agreement dated as of the September 21, 2009 by
TIMET Finance Management Company and Wachovia Bank, National Association –
incorporated by reference to Exhibit 10.2 of the Registrant’s Current
Report on Form 8-K filed on September 24, 2009 (File No.
1-13905).
|
|
10.28
|
Subordinated
Term Loan Promissory Note dated October 26, 2007 executed by CompX
International Inc. and payable to the order of TIMET Finance Management
Company – incorporated by reference to Exhibit 10.9 of CompX International
Inc.’s Form 10-K (File No. 1-13905) for the year ended December 31,
2007.
|
|
10.29
|
Amended
and Restated Subordinated Term Loan Promissory Note dated September 21,
2009 in the original principal amount of $42,230,190 payable to the order
of TIMET Finance Management Company by CompX International Inc. –
incorporated by reference to Exhibit 10.3 of the Registrant’s Current
Report on Form 8-K (File No. 1-13905) filed on September 24,
2009.
|
|
10.30*
|
NL
Industries, Inc. 1998 Long-Term Incentive Plan - incorporated by reference
to Appendix A to the NL Industries, Inc. Proxy Statement on Schedule 14A
(File No. 001-00640) for the annual meeting of shareholders held on May 6,
1998.
|
|
10.31
|
Insurance
Sharing Agreement, effective January 1, 1990, by and between the
Registrant, NL Insurance, Ltd. (an indirect subsidiary of Tremont
Corporation) and Baroid Corporation - incorporated by reference to Exhibit
10.20 to the NL Industries, Inc. Annual Report on Form 10-K (File No.
001-00640) for the year ended December 31,
1991.
|
|
10.32
|
Amended
Tax Agreement among NL Industries, Inc., Valhi, Inc. and Contran
Corporation effective November 30, 2004 – incorporated by reference to
Exhibit 10.1 to the Registrant’s Current Report on Form 8-K (File No.
001-00640) as of November 30, 2004.
|
|
10.33
|
Intercorporate
Services Agreement by and between Contran Corporation and NL Industries,
Inc. effective as of January 1, 2004 – incorporated by reference to
Exhibit 10.1 to the NL Industries, Inc. Quarterly Report on Form 10-Q
(File No. 001-00640) for the quarter ended March 31,
2004.
|
|
10.34
|
Insurance
sharing agreement dated October 30, 2003 by and among CompX International
Inc., Contran Corporation, Keystone Consolidated Industries, Inc., Kronos
Worldwide, Inc., Titanium Metals Corp., Valhi, Inc. and NL Industries,
Inc. – incorporated by reference to Exhibit 10.48 to the NL Industries,
Inc. Annual Report on Form 10-K (File No. 001-00640) for the year ended
December 31, 2003.
|
|
10.35**
|
Reinstated
and Amended Settlement Agreement and Release, dated June 26, 2008, by and
among NL Industries, Inc., NL Environmental Management Services, Inc., the
Sayreville Economic and Redevelopment Agency, Sayreville Seaport
Associates, L.P., and the County of
Middlesex.
|
|
10.36
|
Amendment
to Restated and Amended Settlement Agreement and Release, dated September
25, 2008 by and among NL Industries, Inc., NL Environmental
Management Services, Inc., the Sayreville Economic and Redevelopment
Agency, Sayreville Seaport Associates, L.P., and the County of Middlesex -
incorporated by reference to Exhibit 10.2 to the NL Industries, Inc.
Current Report on Form 8-K (File No. 001-00640) that was filed with the
U.S. Securities and Exchange Commission on October 16,
2008.
|
|
10.37
|
Mortgage
Note, dated October 15, 2008 by Sayreville Seaport Associates, L.P. in
favor of NL Industries, Inc. and NL Environmental Management Services, Inc
- incorporated by reference to Exhibit 10.3 to the NL Industries, Inc.
Current Report on Form 8-K (File No. 001-00640) that was filed with the
U.S. Securities and Exchange Commission on October 16,
2008.
|
|
10.38**
|
Leasehold
Mortgage, Assignment, Security Agreement and Fixture Filing, dated October
15, 2008, by Sayreville Seaport Associates, L.P. in favor of NL
Industries, Inc. and NL Environmental Management Services,
Inc.
|
|
10.39**
|
Intercreditor,
Subordination and Standstill Agreement, dated October 15, 2008, by NL
Industries, Inc., NL Environmental Management Services, Inc., Bank of
America, N.A. on behalf of itself and the other financial institutions,
and acknowledged and consented to by Sayreville Seaport Associates, L.P.
and J. Brian O'Neill
|
|
10.40**
|
Multi
Party Agreement, dated October 15, 2008 by and among Sayreville Seaport
Associates, L.P., Sayreville Seaport Associates Acquisition Company, LLC,
OPG Participation, LLC, J. Brian O'Neill, NL Industries, Inc., NL
Environmental Management Services, Inc., The Prudential Insurance Company
of America, Sayreville PRISA II
LLC.
|
|
10.41
|
Guaranty
Agreement, dated October 15, 2008, by J. Brian O’Neill in favor of NL
Industries, Inc. and NL Environmental Management Services, Inc -
incorporated by reference to Exhibit 10.7 to the NL Industries, Inc.
Current Report on Form 8-K (File No. 001-00640) that was filed with the
U.S. Securities and Exchange Commission on October 16,
2008.
|
|
10.42
|
Unsecured
Revolving Demand Promissory Note dated October 29, 2008 in the original
principal amount of $40.0 million executed by Kronos Worldwide, Inc. and
payable to the order of NL Industries, Inc. - incorporated by reference to
Exhibit 10.1 to the Current Report on Form 8-K that Kronos Worldwide, Inc.
(Commission File No. 1-31763) filed with the U.S. Securities and Exchange
Commission on October 29, 2008.
|
|
10.43
|
Unsecured
Revolving Demand Promissory Note dated November 5, 2008 in the original
principal amount of $40.0 million executed by Valhi, Inc. and payable to
the order of NL Industries, Inc. -incorporated by reference to Exhibit
10.1 to the NL Industries, Inc. Current Report on Form 8-K, Commission
(File No. 001-0064), that was filed with the U.S. Securities and Exchange
Commission on November 5, 2008.
|
|
21.1**
|
Subsidiaries
of the Registrant.
|
|
23.1**
|
Consent
of PricewaterhouseCoopers LLP with respect to NL’s consolidated financial
statements.
|
|
23.2**
|
Consent
of PricewaterhouseCoopers LLP with respect to Kronos’ consolidated
financial statements
|
|
31.1**
|
Certification
|
|
31.2**
|
Certification
|
|
32.1**
|
Certification
|
|
99.1
|
Consolidated
financial statements of Kronos Worldwide, Inc. – incorporated by reference
to Kronos’ Annual Report on Form 10-K (File No. 1-31763) for the year
ended December 31, 2009.
|
|
*
|
Management
contract, compensatory plan or
arrangement.
|
|
**
|
Filed
herewith
|
SIGNATURES
Pursuant
to the requirements of Section 13 or 15(d) of the Securities Exchange Act of
1934, the Registrant has duly caused this report to be signed on its behalf by
the undersigned, thereunto duly authorized.
NL Industries, Inc.
(Registrant)
|
By:/s/ Harold C.
Simmons
|
|
Harold
C. Simmons
|
|
March
9, 2010
|
|
(Chairman
of the Board and
Chief
Executive Officer)
|
Pursuant
to the requirements of the Securities Exchange Act of 1934, this report has been
signed below by the following persons on behalf of the Registrant and in the
capacities and on the dates indicated:
|
/s/ Steven L.
Watson
|
|
|
Harold
C. Simmons, March 9, 2010
|
Steven
L. Watson, March 9, 2010
|
|
(Chairman
of the Board and Chief
|
(Director)
|
|
Executive
Officer)
|
|
|
/s/ Thomas P.
Stafford
|
/s/ Glenn R.
Simmons
|
|
Thomas
P. Stafford, March 9, 2010
|
Glenn
R. Simmons, March 9, 2010
|
|
(Director)
|
(Director)
|
|
/s/ C. H. Moore, Jr.
|
/s/ Gregory M.
Swalwell
|
|
C.
H. Moore, Jr., March 9, 2010
|
Gregory
M. Swalwell, March 9, 2010
|
|
(Director)
|
(Vice
President, Finance and Chief Financial Officer, Principal Financial
Officer)
|
|
/s/ Terry N.
Worrell
|
/s/ Tim C.
Hafer
|
|
Terry
N. Worrell, March 9, 2010
|
Tim
C. Hafer, March 9, 2010
|
|
(Director)
|
(Vice
President and Controller, Principal Accounting
Officer)
|
NL
Industries, Inc.
Annual
Report on Form 10-K
Items
8, 15(a) and 15(c)
Index
of Financial Statements and Schedules
|
Financial
Statements
|
Page
|
|
Report
of Independent Registered Public Accounting Firm
|
F-2
|
|
Consolidated
Balance Sheets - December 31, 2008 and 2009
|
F-4
|
|
Consolidated Statements of Operations -
Years ended December 31, 2007,
2008 and 2009
|
F-6
|
|
Consolidated Statements of Comprehensive Income
(Loss) -
Years ended December 31, 2007,
2008 and 2009
|
F-7
|
|
Consolidated Statements of Stockholders' Equity -
Years ended December 31, 2007,
2008 and 2009
|
F-8
|
|
Consolidated Statements of Cash Flows -
Years ended December 31, 2007,
2008 and 2009
|
F-9
|
|
Notes to Consolidated Financial Statements
|
F-11
|
|
Financial Statement Schedule
|
|
|
Schedule I – Condensed Financial Information of Registrant
|
S-1
|
|
Schedules II,
III and IV are omitted because they are not applicable
or the required amounts are either not material or are presented in the
Notes to the Consolidated Financial Statements.
|
REPORT
OF INDEPENDENT REGISTERED PUBLIC ACCOUNTING FIRM
To the
Stockholders and Board of Directors of NL Industries, Inc.:
In our
opinion, the accompanying consolidated balance sheets and the related
consolidated statements of operations, of comprehensive income, of stockholders’
equity and of cash flows present fairly, in all material respects, the financial
position of NL Industries, Inc. and its subsidiaries at December 31, 2008 and
2009 and the results of their operations and their cash flows for each of the
three years in the period ended December 31, 2009 in conformity with accounting
principles generally accepted in the United States of America. In
addition, in our opinion, the financial statement schedule listed in the
accompanying index presents fairly, in all material respects, the information
set forth therein when read in conjunction with the related consolidated
financial statements. Also in our opinion, the Company maintained, in
all material respects, effective internal control over financial reporting as of
December 31, 2009, based on criteria established in Internal Control - Integrated
Framework issued by the Committee of Sponsoring Organizations of the
Treadway Commission (COSO). The Company's management is responsible
for these financial statements and financial statement schedule, for maintaining
effective internal control over financial reporting and for its assessment of
the effectiveness of internal control over financial reporting, included in
Management’s Report on Internal Control Over Financial Reporting under Item
9A. Our responsibility is to express opinions on these financial
statements, on the financial statement schedule, and on the Company's internal
control over financial reporting based on our integrated audits. We
conducted our audits in accordance with the standards of the Public Company
Accounting Oversight Board (United States). Those standards require
that we plan and perform the audits to obtain reasonable assurance about whether
the financial statements are free of material misstatement and whether effective
internal control over financial reporting was maintained in all material
respects. Our audits of the financial statements included examining,
on a test basis, evidence supporting the amounts and disclosures in the
financial statements, assessing the accounting principles used and significant
estimates made by management, and evaluating the overall financial statement
presentation. Our audit of internal control over financial reporting
included obtaining an understanding of internal control over financial
reporting, assessing the risk that a material weakness exists, and testing and
evaluating the design and operating effectiveness of internal control based on
the assessed risk. Our audits also included performing such other
procedures as we considered necessary in the circumstances. We believe that our
audits provide a reasonable basis for our opinions.
As
discussed in Note 1 to the Consolidated Financial Statements, the Company
changed the manner in which it classified its noncontrolling interest in
2009.
A
company’s internal control over financial reporting is a process designed to
provide reasonable assurance regarding the reliability of financial reporting
and the preparation of financial statements for external purposes in accordance
with generally accepted accounting principles. A company’s internal
control over financial reporting includes those policies and procedures that (i)
pertain to the maintenance of records that, in reasonable detail, accurately and
fairly reflect the transactions and dispositions of the assets of the company;
(ii) provide reasonable assurance that transactions are recorded as necessary to
permit preparation of financial statements in accordance with generally accepted
accounting principles, and that receipts and expenditures of the Company are
being made only in accordance with authorizations of management and directors of
the company; and (iii) provide reasonable assurance regarding prevention or
timely detection of unauthorized acquisition, use, or disposition of the
Company’s assets that could have a material effect on the financial
statements.
Because
of its inherent limitations, internal control over financial reporting may not
prevent or detect misstatements. Also, projections of any evaluation
of effectiveness to future periods are subject to the risk that controls may
become inadequate because of changes in conditions, or that the degree of
compliance with the policies or procedures may deteriorate.
/s/
PricewaterhouseCoopers LLP
Dallas,
Texas
March 9,
2010
NL
INDUSTRIES, INC. AND SUBSIDIARIES
CONSOLIDATED
BALANCE SHEETS
(In
thousands, except per share data)
|
ASSETS
|
December 31,
|
|||||||
|
2008
|
2009
|
|||||||
|
Current
assets:
|
||||||||
|
Cash and cash equivalents
|
$ | 16,450 | $ | 24,555 | ||||
|
Restricted cash and cash equivalents
|
7,457 | 7,157 | ||||||
|
Marketable securities
|
5,534 | 5,225 | ||||||
|
Accounts and other receivables,
net
|
25,513 | 14,165 | ||||||
|
Receivable from affiliates
|
3,150 | 2,888 | ||||||
|
Inventories,
net
|
22,661 | 16,266 | ||||||
|
Prepaid expenses
and other
|
1,435 | 1,349 | ||||||
|
Deferred income taxes
|
5,766 | 5,039 | ||||||
|
Total current assets
|
87,966 | 76,644 | ||||||
|
Other assets:
|
||||||||
|
Marketable equity securities
|
64,000 | 85,073 | ||||||
|
Investment in and
advances to
Kronos Worldwide, Inc.
|
133,745 | 112,766 | ||||||
|
Goodwill
|
44,194 | 44,316 | ||||||
|
Assets
held for sale
|
3,517 | 2,800 | ||||||
|
Other,
net
|
17,832 | 17,026 | ||||||
|
Total other assets
|
263,288 | 261,981 | ||||||
|
Property and equipment:
|
||||||||
|
Land
|
12,232 | 12,368 | ||||||
|
Buildings
|
32,723 | 34,261 | ||||||
|
Equipment
|
115,546 | 126,203 | ||||||
|
Construction in progress
|
4,406 | 1,180 | ||||||
| 164,907 | 174,012 | |||||||
|
Less accumulated depreciation
|
96,625 | 109,646 | ||||||
|
Net property and equipment
|
68,282 | 64,366 | ||||||
|
Total
assets
|
$ | 419,536 | $ | 402,991 | ||||
NL
INDUSTRIES, INC. AND SUBSIDIARIES
CONSOLIDATED
BALANCE SHEETS (CONTINUED)
(In
thousands, except per share data)
|
LIABILITIES AND STOCKHOLDERS'
EQUITY
|
December 31,
|
|||||||
|
2008
|
2009
|
|||||||
|
Current liabilities:
|
||||||||
|
Accounts payable
|
$ | 6,802 | $ | 6,664 | ||||
|
Accrued liabilities
|
24,475 | 25,966 | ||||||
|
Accrued environmental costs
|
9,834 | 8,328 | ||||||
|
Payable to affiliates
|
3,139 | 583 | ||||||
|
Income taxes
|
1,167 | 332 | ||||||
|
Total current liabilities
|
45,417 | 41,873 | ||||||
|
Noncurrent liabilities:
|
||||||||
|
Note
payable and interest due to affiliate
|
41,980 | 42,540 | ||||||
|
Accrued pension costs
|
11,768 | 12,233 | ||||||
|
Accrued postretirement benefits (OPEB)
cost
|
8,883 | 8,307 | ||||||
|
Accrued environmental costs
|
40,220 | 37,518 | ||||||
|
Deferred income taxes
|
49,215 | 55,750 | ||||||
|
Other
|
21,823 | 19,112 | ||||||
|
Total noncurrent liabilities
|
173,889 | 175,460 | ||||||
|
Equity:
|
||||||||
|
NL
stockholders’ equity:
|
||||||||
|
Preferred stock, no par value; 5,000
shares
authorized; none issued
|
- | - | ||||||
|
Common stock, $.125 par value; 150,000
shares
authorized; 48,599 and 48,612 shares issued
and outstanding
|
6,074 | 6,076 | ||||||
|
Additional paid-in capital
|
330,879 | 311,939 | ||||||
|
Retained earnings
|
16,909 | - | ||||||
|
Accumulated other comprehensive income:
|
||||||||
|
Marketable securities
|
24,970 | 38,577 | ||||||
|
Currency translation
|
(135,922 | ) | (128,753 | ) | ||||
|
Defined
benefit pension plans
|
(54,333 | ) | (52,574 | ) | ||||
|
Postretirement
benefit (OPEB) plans
|
(213 | ) | (661 | ) | ||||
|
Total NL
stockholders' equity
|
188,364 | 174,604 | ||||||
|
Noncontrolling
interest in subsidiary
|
11,866 | 11,054 | ||||||
|
Total
equity
|
200,230 | 185,658 | ||||||
|
Total
liabilities and stockholders' equity
|
$ | 419,536 | $ | 402,991 | ||||
Commitments
and contingencies (Notes 15, 19 and 21)
See
accompanying Notes to Consolidated Financial Statements.
NL
INDUSTRIES, INC. AND SUBSIDIARIES
CONSOLIDATED
STATEMENTS OF OPERATIONS
(In
thousands, except per share data)
|
Years ended December 31,
|
||||||||||||
|
2007
|
2008
|
2009
|
||||||||||
|
Net
sales
|
$ | 177,683 | $ | 165,502 | $ | 116,125 | ||||||
|
Cost
of goods sold
|
132,455 | 125,749 | 92,345 | |||||||||
|
Gross margin
|
45,228 | 39,753 | 23,780 | |||||||||
|
Selling, general and administrative expense
|
25,846 | 24,818 | 26,722 | |||||||||
|
Other operating income (expense):
|
||||||||||||
|
Insurance
recoveries
|
5,659 | 9,610 | 4,631 | |||||||||
|
Facility
consolidation expense
|
(2,665 | ) | - | - | ||||||||
|
Goodwill
impairment
|
- | (10,111 | ) | - | ||||||||
|
Litigation
settlement gains
|
- | 48,806 | 11,313 | |||||||||
|
Currency
transaction gains (losses), net
|
(1,086 | ) | 679 | (236 | ) | |||||||
|
Assets
held for sale write-down
|
- | - | (717 | ) | ||||||||
|
Other
income (expense), net
|
(256 | ) | (131 | ) | (75 | ) | ||||||
|
Corporate expense
|
(31,318 | ) | (25,012 | ) | (23,547 | ) | ||||||
|
Income (loss)
from operations
|
(10,284 | ) | 38,776 | (11,573 | ) | |||||||
|
Equity in earnings (losses)
of Kronos Worldwide, Inc.
|
(23,901 | ) | 3,229 | (12,470 | ) | |||||||
|
Other income (expense):
|
||||||||||||
|
Interest and dividends
|
4,778 | 8,010 | 2,752 | |||||||||
|
Securities transactions, net
|
22,749 | (1 | ) | (9 | ) | |||||||
|
Interest expense
|
(760 | ) | (2,362 | ) | (1,060 | ) | ||||||
|
Income (loss)
before income taxes
|
(7,418 | ) | 47,652 | (22,360 | ) | |||||||
|
Provision for income taxes (benefit)
|
(8,311 | ) | 14,850 | (10,347 | ) | |||||||
|
Net
income (loss)
|
893 | 32,802 | (12,013 | ) | ||||||||
|
Noncontrolling
interest in net income (loss) of subsidiary
|
2,624 | (382 | ) | (258 | ) | |||||||
|
Net income
(loss) attributable to NL stockholders
|
$ | (1,731 | ) | $ | 33,184 | $ | (11,755 | ) | ||||
|
Amounts
attributable to NL stockholders:
|
||||||||||||
|
Basic
and diluted net income (loss) per share
|
$ | (.04 | ) | $ | .68 | $ | (.24 | ) | ||||
|
Cash
dividend per share
|
$ | .50 | $ | .50 | $ | .50 | ||||||
|
Weighted-average
shares used in the calculation of net income per share:
|
||||||||||||
|
Basic
|
48,590 | 48,596 | 48,609 | |||||||||
|
Dilutive
impact of stock options
|
- | 9 | - | |||||||||
|
Diluted
|
48,590 | 48,605 | 48,609 | |||||||||
See
accompanying Notes to Consolidated Financial Statements.
NL
INDUSTRIES, INC. AND SUBSIDIARIES
CONSOLIDATED
STATEMENTS OF COMPREHENSIVE INCOME (LOSS)
(In
thousands)
|
Years ended December 31,
|
||||||||||||
|
2007
|
2008
|
2009
|
||||||||||
|
Net
income (loss)
|
$ | 893 | $ | 32,802 | $ | (12,013 | ) | |||||
|
Other
comprehensive income (loss), net of tax:
|
||||||||||||
|
Marketable
securities:
|
||||||||||||
|
Unrealized
net gains (losses) arising during the year
|
15,475 | (32,633 | ) | 13,607 | ||||||||
|
Realized
gains included in net income
|
(14,668 | ) | - | - | ||||||||
| 807 | (32,633 | ) | 13,607 | |||||||||
|
Currency
translation adjustment
|
10,969 | (12,423 | ) | 7,415 | ||||||||
|
Defined
benefit pension plans:
|
||||||||||||
|
Net
actuarial gain (loss) arising during the year
|
10,618 | (23,151 | ) | (259 | ) | |||||||
|
Amortization
of prior service cost, net transition obligation and net actuarial losses
included in net periodic pension cost
|
1,623 | 191 | 2,018 | |||||||||
| 12,241 | (22,960 | ) | 1,759 | |||||||||
|
Postretirement
benefit (OPEB) plan adjustment:
|
||||||||||||
|
Net
actuarial gain (loss) arising during the year
|
861 | 746 | (303 | ) | ||||||||
|
Amortization
of prior service credit included in net periodic pension
cost
|
(75 | ) | (134 | ) | (145 | ) | ||||||
| 786 | 612 | (448 | ) | |||||||||
|
Total
other comprehensive income (loss)
|
24,803 | (67,404 | ) | 22,333 | ||||||||
|
Comprehensive
income (loss)
|
25,696 | (34,602 | ) | 10,320 | ||||||||
|
Comprehensive
income (loss) attributable
to
noncontrolling interest
|
3,441 | (712 | ) | (12 | ) | |||||||
|
Comprehensive
income (loss) attributable
to
NL stockholders
|
$ | 22,255 | $ | (33,890 | ) | $ | 10,332 | |||||
See
accompanying Notes to Consolidated Financial Statements.
NL
INDUSTRIES , INC. AND SUBSIDIARIES
CONSOLIDATED
STATEMENTS OF STOCKHOLDERS' EQUITY
Years
ended December 31, 2007, 2008 and 2009
(In
thousands, except per share data)
|
NL
Stockholders’ Equity
|
||||||||||||||||||||||||||||||||||||
|
Accumulative
other
|
||||||||||||||||||||||||||||||||||||
|
Additional
|
Retained
|
comprehensive
income (loss)
|
||||||||||||||||||||||||||||||||||
|
Common
|
paid-in
|
earnings
|
Marketable
|
Currency
|
Pension
|
OPEB
|
Noncontrolling
|
|||||||||||||||||||||||||||||
|
stock
|
capital
|
(deficit)
|
securities
|
translation
|
plans
|
plans
|
interest
|
Total
|
||||||||||||||||||||||||||||
|
Balance at December 31, 2006
|
$ | 6,073 | $ | 363,472 | $ | 1,826 | $ | 56,796 | $ | (133,981 | ) | $ | (44,063 | ) | $ | (1,611 | ) | $ | 45,416 | $ | 293,928 | |||||||||||||||
|
Net loss
|
- | - | (1,731 | ) | - | - | - | - | 2,624 | 893 | ||||||||||||||||||||||||||
|
Other comprehensive income (loss), net of tax
|
- | - | - | 807 | 10,152 | 12,241 | 786 | 817 | 24,803 | |||||||||||||||||||||||||||
|
Issuance of common stock
|
- | 63 | - | - | - | - | - | 460 | 523 | |||||||||||||||||||||||||||
|
Cash dividends - $.50 per share
|
- | (18,222 | ) | (6,073 | ) | - | - | - | - | (1,918 | ) | (26,213 | ) | |||||||||||||||||||||||
|
Change in accounting:
|
||||||||||||||||||||||||||||||||||||
|
Uncertain
tax positions provisions of
ASC
Topic 740
|
- | - | (97 | ) | - | - | - | - | 12 | (85 | ) | |||||||||||||||||||||||||
|
Asset
and liability provisions of ASC
Topic
715
|
- | - | (450 | ) | - | - | 449 | - | - | (1 | ) | |||||||||||||||||||||||||
|
CompX
stock buyback
|
- | - | - | - | - | - | - | (33,045 | ) | (33,045 | ) | |||||||||||||||||||||||||
|
Other
|
- | 25 | - | - | - | - | - | - | 25 | |||||||||||||||||||||||||||
|
Balance at December 31, 2007
|
6,073 | 345,338 | (6,525 | ) | 57,603 | (123,829 | ) | (31,373 | ) | (825 | ) | 14,366 | 260,828 | |||||||||||||||||||||||
|
Net income
|
- | - | 33,184 | - | - | - | - | (382 | ) | 32,802 | ||||||||||||||||||||||||||
|
Other comprehensive income (loss), net of tax
|
- | - | - | (32,633 | ) | (12,093 | ) | (22,960 | ) | 612 | (330 | ) | (67,404 | ) | ||||||||||||||||||||||
|
Issuance of common stock
|
1 | 71 | - | - | - | - | - | 7 | 79 | |||||||||||||||||||||||||||
|
Cash dividends - $.50 per share
|
- | (14,549 | ) | (9,750 | ) | - | - | - | - | (804 | ) | (25,103 | ) | |||||||||||||||||||||||
|
Other
|
- | 19 | - | - | - | - | - | (991 | ) | (972 | ) | |||||||||||||||||||||||||
|
Balance at December 31, 2008
|
6,074 | 330,879 | 16,909 | 24,970 | (135,922 | ) | (54,333 | ) | (213 | ) | 11,866 | 200,230 | ||||||||||||||||||||||||
|
Net
loss
|
- | - | (11,755 | ) | - | - | - | - | (258 | ) | (12,013 | ) | ||||||||||||||||||||||||
|
Other
comprehensive income (loss), net of tax
|
- | - | - | 13,607 | 7,169 | 1,759 | (448 | ) | 246 | 22,333 | ||||||||||||||||||||||||||
|
Issuance
of common stock
|
2 | 133 | - | - | - | - | - | 6 | 141 | |||||||||||||||||||||||||||
|
Cash
dividends - $.50 per share
|
- | (19,151 | ) | (5,154 | ) | - | - | - | - | (806 | ) | (25,111 | ) | |||||||||||||||||||||||
|
Other
|
- | 78 | - | - | - | - | - | - | 78 | |||||||||||||||||||||||||||
|
Balance
at December 31, 2009
|
$ | 6,076 | $ | 311,939 | $ | - | $ | 38,577 | $ | (128,753 | ) | $ | (52,574 | ) | $ | (661 | ) | $ | 11,054 | $ | 185,658 | |||||||||||||||
See accompanying Notes to Consolidated Financial
Statements.
NL
INDUSTRIES, INC. AND SUBSIDIARIES
CONSOLIDATED
STATEMENTS OF CASH FLOWS
(In
thousands)
|
Years ended December 31,
|
||||||||||||
|
2007
|
2008
|
2009
|
||||||||||
|
Cash
flows from operating activities:
|
||||||||||||
|
Net
income (loss)
|
$ | 893 | $ | 32,802 | $ | (12,013 | ) | |||||
|
Depreciation
and amortization
|
11,375 | 9,420 | 8,272 | |||||||||
|
Deferred
income taxes
|
(12,604 | ) | (4,352 | ) | (4,703 | ) | ||||||
|
Provision
for inventory reserves
|
141 | 195 | 1,022 | |||||||||
|
Securities
transaction gains
|
(22,749 | ) | - | - | ||||||||
|
Benefit
plan expense greater (less)
than
cash funding:
|
||||||||||||
|
Defined
benefit pension plans
|
(2,464 | ) | (2,976 | ) | 833 | |||||||
|
Other
postretirement benefit plans
|
629 | 476 | 372 | |||||||||
|
Equity
in Kronos Worldwide, Inc.
|
23,901 | (3,229 | ) | 12,470 | ||||||||
|
Distributions
from Kronos Worldwide, Inc.
|
17,516 | 17,532 | - | |||||||||
|
Goodwill
impairment
|
- | 10,111 | - | |||||||||
|
Litigation
settlement gains
|
- | (48,806 | ) | (11,313 | ) | |||||||
|
Assets
held for sale write-down
|
- | - | 717 | |||||||||
|
Other,
net
|
1,272 | 406 | 534 | |||||||||
|
Change
in assets and liabilities:
|
||||||||||||
|
Accounts
and other receivable
|
1,032 | (4,703 | ) | 12,081 | ||||||||
|
Inventories
|
(1,813 | ) | 889 | 5,878 | ||||||||
|
Prepaid
expenses
|
(160 | ) | 92 | 803 | ||||||||
|
Accounts
payable and accrued liabilities
|
(918 | ) | (2,830 | ) | 1,996 | |||||||
|
Income
taxes
|
(1,127 | ) | 976 | (3,432 | ) | |||||||
|
Accounts
with affiliates
|
(12,779 | ) | 2,277 | (3,767 | ) | |||||||
|
Accrued
environmental costs
|
(383 | ) | (275 | ) | (4,208 | ) | ||||||
|
Other
noncurrent assets and liabilities, net
|
(4,533 | ) | (7,245 | ) | (4,151 | ) | ||||||
|
Net
cash provided by (used in) operating activities
|
(2,771 | ) | 760 | 1,391 | ||||||||
|
Cash
flows from investing activities:
|
||||||||||||
|
Capital
expenditures
|
(13,998 | ) | (6,897 | ) | (2,324 | ) | ||||||
|
Proceeds
from real estate-related litigation settlement
|
- | 39,550 | 11,800 | |||||||||
|
Loans
to affiliates, net
|
- | (22,210 | ) | 22,210 | ||||||||
|
Collection
of note receivable
|
1,306 | 1,306 | 261 | |||||||||
|
Change
in restricted cash equivalents and marketable debt securities,
net
|
2,386 | (2,558 | ) | 447 | ||||||||
|
Proceeds
from disposal of:
|
||||||||||||
|
Marketable
securities
|
36,894 | 554 | 164 | |||||||||
|
Property
and equipment
|
73 | 377 | - | |||||||||
|
Purchase
of:
|
||||||||||||
|
CompX
common stock
|
(3,309 | ) | (1,007 | ) | - | |||||||
|
Kronos
common stock
|
- | (793 | ) | (139 | ) | |||||||
|
Valhi
common stock
|
- | (1,081 | ) | (33 | ) | |||||||
|
Other
marketable securities
|
(5,861 | ) | (156 | ) | - | |||||||
|
Net
cash provided by investing activities
|
17,491 | 7,085 | 32,386 | |||||||||
NL
INDUSTRIES, INC. AND SUBSIDIARIES
CONSOLIDATED
STATEMENTS OF CASH FLOWS (CONTINUED)
(In
thousands)
|
Years
ended December 31,
|
||||||||||||
|
2007
|
2008
|
2009
|
||||||||||
|
Cash
flows from financing activities:
|
||||||||||||
|
Repayment
of note payable to affiliate
|
$ | (2,600 | ) | $ | (7,000 | ) | $ | (750 | ) | |||
|
Cash
dividends paid
|
(24,295 | ) | (24,299 | ) | (24,305 | ) | ||||||
|
Proceeds
from issuance of stock:
|
||||||||||||
|
NL
common stock
|
- | 6 | 84 | |||||||||
|
CompX
common stock
|
1,395 | - | - | |||||||||
|
Tax
benefit from exercise of stock options
|
73 | - | - | |||||||||
|
Distributions
to noncontrolling interests
|
(1,918 | ) | (804 | ) | (806 | ) | ||||||
|
Deferred
financing costs paid
|
- | (56 | ) | (133 | ) | |||||||
|
Net
cash used in financing activities
|
(27,345 | ) | (32,153 | ) | (25,910 | ) | ||||||
|
Net
increase (decrease)
|
$ | (12,625 | ) | $ | (24,308 | ) | $ | 7,867 | ||||
|
Cash
and cash equivalents - net change from:
|
||||||||||||
|
Operating, investing and financing activities
|
$ | (12,625 | ) | $ | (24,308 | ) | $ | 7,867 | ||||
|
Currency translation
|
995 | (354 | ) | 238 | ||||||||
|
Cash
and cash
equivalents at beginning of year
|
52,742 | 41,112 | 16,450 | |||||||||
|
Cash
and cash equivalents at end of year
|
$ | 41,112 | $ | 16,450 | $ | 24,555 | ||||||
|
Supplemental disclosures:
|
||||||||||||
|
Cash
paid for:
|
||||||||||||
|
Interest
|
$ | 109 | $ | 2,278 | $ | 1,246 | ||||||
|
Income taxes,
net
|
19,680 | 19,398 | 2,548 | |||||||||
|
Non-cash investing and
financing activities:
|
||||||||||||
|
Note
payable to affiliate issued for repurchase of CompX common
stock
|
$ | 52,580 | $ | - | $ | - | ||||||
|
Receipt
of TIMET shares from Valhi
|
11,410 | - | - | |||||||||
|
Accrual
for capital expenditures
|
665 | 511 | 666 | |||||||||
|
Note
receivable from litigation settlement
|
- | 15,000 | - | |||||||||
NL
INDUSTRIES, INC. AND SUBSIDIARIES
NOTES
TO CONSOLIDATED FINANCIAL STATEMENTS
December
31, 2009
Note
1
- Organization
and basis of presentation:
Nature of our
business – NL Industries, Inc. (NYSE: NL) is primarily a holding
company. We operate in the component products industry through our
majority-owned subsidiary, CompX International Inc. (NYSE: CIX). We
operate in the chemicals industry through our noncontrolling interest in Kronos
Worldwide, Inc. (NYSE: KRO).
Organization
– We are
majority-owned by Valhi, Inc. (NYSE: VHI), which owns approximately 83% of our
outstanding common stock at December 31, 2009. Valhi is
majority-owned by subsidiaries of Contran Corporation. Substantially
all of Contran's outstanding voting stock is held by trusts established for the
benefit of certain children and grandchildren of Harold C. Simmons (for which
Mr. Simmons is the sole trustee), or is held by Mr. Simmons or other persons or
companies related to Mr. Simmons. Consequently, Mr. Simmons may be
deemed to control Contran, Valhi and us.
Unless
otherwise indicated, references in this report to “we,” “us” or “our” refer to
NL Industries, Inc. and its subsidiaries and affiliate, Kronos, taken as a
whole.
Management’s
estimates - In
preparing our financial statements in conformity with accounting principles
generally accepted in the United States of America (“GAAP”), we are required to
make estimates and assumptions that affect the reported amounts of our assets
and liabilities and disclosures of contingent assets and liabilities at each
balance sheet date, and the reported amounts of our revenues and expenses during
each reporting period. Actual results may differ significantly from
previously-estimated amounts under different assumptions or
conditions.
Principles of
consolidation - Our consolidated financial statements include the
financial position, results of operations and cash flows of NL and our
wholly-owned and majority-owned subsidiaries, including CompX. We
account for the 13% of CompX stock we do not own as a noncontrolling
interest. We eliminate all material intercompany accounts and
balances.
Beginning
January 1, 2009 we adopted the new provisions of Accounting Standards
Codification (“ASC”) Topic 810 Consolidation, which
establishes an equity transaction framework of accounting for noncontrolling
interest. Under the framework, which applies to transactions on a
prospective basis, changes in ownership are accounted for as equity transactions
with no gain or loss recognized on the transaction unless there is a change in
control. Prior to the adoption of the new provisions, we accounted
for increases in ownership interests of our consolidated subsidiaries, either
through our purchase of additional shares of their common stock or through their
purchase of their own shares of common stock, by the purchase method (step
acquisition). Unless otherwise noted, such purchase accounting
generally resulted in an adjustment to the carrying amount of goodwill for our
consolidated subsidiaries. We accounted for decreases in our
ownership interest of our consolidated subsidiaries through cash sales of their
common stock to third parties (either by us or by our subsidiary) by recognizing
a gain or loss in net income equal to the difference between the proceeds from
such sale and the carrying value of the shares sold. See Note
21.
Currency
translation - The financial statements of our non-U.S. subsidiaries are
translated to U.S. dollars. The functional currency of our non-U.S.
subsidiaries is generally the local currency of their
country. Accordingly, we translate the assets and liabilities at
year-end rates of exchange, while we translate their revenues and expenses at
average exchange rates prevailing during the year. We accumulate the
resulting translation adjustments in stockholders' equity as part of accumulated
other comprehensive income, net of related deferred income taxes and
noncontrolling interest. We recognize currency transaction gains and
losses in income.
Derivatives and
hedging activities – We
recognize derivatives as either an asset or liability measured at fair value in
accordance with ASC Topic 815, Derivatives and
Hedging. We recognize the effect of changes in the fair value
of derivatives either in net income or other comprehensive income, depending on
the intended use of the derivative. See Note 20.
Cash and cash
equivalents - We
classify bank time deposits and government and commercial notes and bills with
original maturities of three months or less as cash equivalents.
Restricted cash
equivalents and restricted marketable debt securities - We classify cash
equivalents and marketable debt securities that have been segregated or are
otherwise limited in use as restricted. To the extent the restricted
amount relates to a recognized liability, we classify such restricted amount as
either a current or noncurrent asset to correspond with the classification of
the liability. To the extent the restricted amount does not relate to
a recognized liability, we classify restricted cash as a current asset and we
classify the restricted debt security as either a current or noncurrent asset
depending upon the maturity date of the security. See Note 4.
Marketable
securities and securities transactions – We carry marketable debt and
equity securities at fair value. ASC Topic 820, Fair Value Measurements and
Disclosures, establishes a consistent framework for measuring fair value
and beginning January 1, 2008 (with certain exceptions) this framework is
generally applied to all financial statement items required to be measured at
fair value. The standard requires fair value measurements to be
classified and disclosed in one of the following three categories:
|
·
|
Level 1 – Unadjusted
quoted prices in active markets that are accessible at the measurement
date for identical, unrestricted assets or
liabilities;
|
|
|
·
|
Level 2 – Quoted prices
in markets that are not active, or inputs which are observable, either
directly or indirectly, for substantially the full term of the assets or
liability; and
|
|
|
·
|
Level 3 – Prices or
valuation techniques that require inputs that are both significant to the
fair value measurement and
unobservable.
|
We
accumulate unrealized gains and losses on available-for-sale securities as part
of accumulated other comprehensive income, net of related deferred income taxes
and noncontrolling interest. We calculate realized gains and losses
by the specific identification of securities sold.
Accounts
receivable - We provide an allowance for doubtful accounts for known and
estimated potential losses arising from sales to customers based on a periodic
review of these accounts.
Inventories and
cost of goods sold - We state inventories at the lower
of cost or market, net of allowance for obsolete and slow-moving
inventories. We generally base inventory costs for all inventory
categories on an average cost that approximates the first-in, first-out
method. Inventories include the costs for raw materials, the cost to
manufacture the raw materials into finished goods and
overhead. Depending on the inventory’s stage of completion, our
manufacturing costs can include the costs of packing and finishing, utilities,
maintenance and depreciation, shipping and handling, and salaries and benefits
associated with our manufacturing process. We allocate fixed
manufacturing overhead based on normal production
capacity. Unallocated overhead costs resulting from periods with
abnormally low production levels are charged to expense as
incurred. As inventory is sold to third parties, we recognize the
cost of goods sold in the same period that the sale occurs. We
periodically review our inventory for estimated obsolescence or instances when
inventory is no longer marketable for its intended use, and we record any
write-down equal to the difference between the cost of inventory and its
estimated net realizable value based on assumptions about alternative uses,
market conditions and other factors.
Investment in
Kronos Worldwide, Inc. – We account for our 36% non-controlling interest
in Kronos by the equity method. See Note 7.
Goodwill and
other intangible assets; amortization expense - Goodwill represents the
excess of cost over fair value of individual net assets acquired in business
combinations. Goodwill is not subject to periodic
amortization. We amortize other intangible assets, consisting
principally of certain acquired patents and tradenames, using the straight-line
method over their estimated lives and state them net of accumulated
amortization. We evaluate goodwill for impairment annually, or when
circumstances indicate the carrying value may not be recoverable. We
evaluate other intangible assets for impairment when events or changes in
circumstances indicate the carrying value may not be recoverable. See
Notes 8 and 9.
Property and
equipment; depreciation expense - We state property and equipment,
including purchased computer software for internal use, at cost. We
compute depreciation of property and equipment for financial reporting purposes
principally by the straight-line method over the estimated useful lives of 15 to
40 years for buildings and 3 to 20 years for equipment and
software. We use accelerated depreciation methods for income tax
purposes, as permitted. Depreciation expense was $10.4 million in
2007, $8.6 million in 2008, and $7.7 million in 2009. Upon sale or
retirement of an asset, the related cost and accumulated depreciation are
removed from the accounts and any gain or loss is recognized in income
currently. Expenditures for maintenance, repairs and minor renewals
are expensed; expenditures for major improvements are capitalized.
We
perform impairment tests when events or changes in circumstances indicate the
carrying value may not be recoverable. We consider all relevant
factors. We perform impairment tests by comparing the estimated
future undiscounted cash flows associated with the asset to the asset’s net
carrying value to determine whether impairment exists.
Employee benefit
plans - Accounting and funding policies for our retirement and post
retirement benefits other than pensions (“OPEB”) plans are described in Note
16.
Income
taxes - We and
our qualifying subsidiaries are members of Contran’s consolidated U.S. federal
income tax group (the “Contran Tax Group”). We and certain of our
qualifying subsidiaries also file consolidated unitary state income tax returns
with Contran in qualifying U.S. jurisdictions. As a member of the
Contran Tax Group, we are jointly and severally liable for the federal income
tax liability of Contran and the other companies included in the Contran Tax
Group for all periods in which we are included in the Contran Tax
Group. See Note 19. We are party to a tax sharing
agreement with Valhi and Contran pursuant to which we generally compute our
provision for income taxes on a separate-company basis, and make payments to or
receive payments from Valhi in amounts that we would have paid to or received
from the U.S. Internal Revenue Service or the applicable state tax authority had
we not been a member of the Contran Tax Group. Refunds are limited to
amounts previously paid under the Contran Tax Agreement unless the individual
company was entitled to a refund from the U.S. Internal Revenue Service on a
separate company basis. The separate company provisions and payments
are computed using the tax elections made by Contran. We made net
cash payments to Valhi for income taxes of $14.2 million in 2007, $15.4 million
in 2008 and $.8 million in 2009.
We
recognize deferred income tax assets and liabilities for the expected future tax
consequences of temporary differences between the income tax and financial
reporting carrying amounts of our assets and liabilities, including investments
in our subsidiaries and affiliates who are not members of the Contran Tax Group
and undistributed earnings of non-U.S. subsidiaries which are not permanently
reinvested. In addition, we recognize deferred income taxes with
respect to the excess of the financial reporting carrying amount over the income
tax basis of our direct investment in Kronos common stock because the exemption
under GAAP to avoid recognition of such deferred income taxes is not available
to us. The earnings of our non-U.S. subsidiaries subject to permanent
reinvestment plans aggregated $5.7 million at December 31, 2009 (2008 - $5.6
million). It is not practical for us to determine the amount of the
unrecognized deferred income tax liability related to such earnings due to the
complexities associated with the U.S. taxation on earnings of non-U.S.
subsidiaries repatriated to the U.S. We periodically evaluate our
deferred income tax assets and recognize a valuation allowance based on the
estimate of the amount of such deferred tax assets which we believe does not
meet the more-likely-than-not recognition criteria.
We record
a reserve for uncertain tax positions where we believe it is
more-likely-than-not our position will not prevail with the applicable tax
authorities. See Note 21.
Environmental
remediation costs – We record liabilities
related to environmental remediation obligations when estimated future
expenditures are probable and reasonably estimable. We adjust these
accruals as further information becomes available to us or as circumstances
change. We generally do not discount estimated future expenditures to
present value. We recognize any recoveries of remediation costs from
other parties when we deem their receipt probable. At December 31,
2008 and 2009, we had not recognized any receivables for
recoveries. See Note 19.
Net sales
– We record sales when products are shipped and title and other risks and
rewards of ownership have passed to the customer. We include amounts
charged to customers for shipping and handling costs, which are not material, in
net sales. We state sales net of price, early payment and distributor
discounts and volume rebates. We report taxes assessed by a
governmental authority such as sales, use, value added and excise taxes on a net
basis (i.e., we do not recognize these taxes in either our revenues or in our
costs and expenses).
Selling, general
and administrative expenses; advertising costs; research and development
costs - Selling,
general and administrative expenses include costs related to marketing, sales,
distribution, research and development, legal and administrative functions such
as accounting, treasury and finance, as well as costs for salaries and benefits,
travel and entertainment, promotional materials and professional
fees. Advertising costs are expensed as incurred and were
approximately $1 million in each of 2007 and 2008 and $500,000 in
2009. Research, development and certain sales technical support costs
related to continuing operations are expensed as incurred and approximated
$200,000 in each of 2007 and 2008 and $1.4 million in 2009.
Corporate
expenses - Corporate expenses include environmental, legal and other
costs attributable to formerly-owned business units.
Earnings per
share - Basic earnings per share of common stock is based upon the
weighted average number of our common shares actually outstanding during each
period. Diluted earnings per share of common stock includes the
impact of our outstanding dilutive stock options. The weighted
average number of outstanding stock options excluded from the calculation of
diluted earnings per share because their impact would have been anti-dilutive
was immaterial in each of 2007, 2008 and 2009.
Note
2
- Business
combinations and related transactions:
In October 2007, CompX repurchased or
cancelled a net 2.7 million shares of its Class A common stock held by TIMET,
including the Class A shares held indirectly by TIMET through its ownership
interest in CompX Group, Inc. The repurchase was approved by the
independent members of CompX’s board of directors. CompX purchased or
cancelled these shares for $19.50 per share, or aggregate consideration of $52.6
million, which was paid in the form of a promissory note. See Note
17. The price per share was determined based on CompX’s open market
repurchases of its Class A common stock around the time the repurchase from
TIMET was approved. As a result of the repurchase or cancellation of
CompX’s Class A shares from TIMET, TIMET no longer has any direct or indirect
ownership in CompX or in CompX Group. CompX’s outstanding Class A
shares were reduced by 2.7 million and, as a result, our ownership interest in
CompX increased to approximately 86%. During 2008, CompX purchased
approximately 126,000 shares of its Class A shares, which has subsequently
increased NL’s ownership to approximately 87%. We accounted for
our increase in ownership of CompX by the purchase method (step
acquisition). CompX did not repurchase any of its shares in
2009.
Note
3 - Geographic information:
We
operate in the component products industry through our majority ownership of
CompX. CompX manufactures and sells security products, precision ball
bearing slides, and ergonomic computer support systems used in the office
furniture, transportation, postal, tool storage, appliance and a variety of
other industries. CompX is also a leading manufacturer of stainless
steel exhaust systems, gauges, and throttle controls for the performance marine
industry. CompX has production facilities in North America and
Asia.
For
geographic information, we attribute net sales to the place of manufacture
(point of origin) and the location of the customer (point of destination); we
attribute property and equipment to their physical location. At
December 31, 2008 and 2009 the net assets of non-U.S. subsidiaries included in
consolidated net assets approximated $28.5 million and $27.9 million,
respectively.
|
Years ended December 31,
|
||||||||||||
|
2007
|
2008
|
2009
|
||||||||||
|
(In
millions)
|
||||||||||||
|
Net
sales - point of origin:
|
||||||||||||
|
United States
|
$ | 118.5 | $ | 115.5 | $ | 84.8 | ||||||
|
Canada
|
52.7 | 46.5 | 29.0 | |||||||||
|
Taiwan
|
11.7 | 8.3 | 5.8 | |||||||||
|
Eliminations
|
(5.2 | ) | (4.8 | ) | (3.5 | ) | ||||||
|
Total
|
$ | 177.7 | $ | 165.5 | $ | 116.1 | ||||||
|
|
||||||||||||
|
Net sales - point of destination:
|
||||||||||||
|
United States
|
$ | 147.8 | $ | 134.2 | $ | 96.0 | ||||||
|
Canada
|
19.3 | 16.9 | 10.4 | |||||||||
|
Other
|
10.6 | 14.4 | 9.7 | |||||||||
|
Total
|
$ | 177.7 | $ | 165.5 | $ | 116.1 | ||||||
|
December
31,
|
||||||||
|
2008
|
2009
|
|||||||
|
(In
millions)
|
||||||||
|
Identifiable
assets -
|
||||||||
|
Net property and equipment:
|
||||||||
|
United States
|
$ | 52.2 | $ | 47.8 | ||||
|
Canada
|
9.0 | 9.2 | ||||||
|
Taiwan
|
7.1 | 7.4 | ||||||
|
Total
|
$ | 68.3 | $ | 64.4 | ||||
Note
4
- Marketable
securities:
|
December
31,
|
||||||||
|
2008
|
2009
|
|||||||
|
(In
thousands)
|
||||||||
|
Current
assets (available-for-sale):
|
||||||||
|
Restricted
debt securities
|
$ | 5,372 | $ | 5,225 | ||||
|
Other
marketable securities
|
162 | - | ||||||
|
Total
|
$ | 5,534 | $ | 5,225 | ||||
|
Noncurrent
assets (available-for-sale):
|
||||||||
|
Valhi
common stock
|
$ | 51,234 | $ | 66,930 | ||||
|
TIMET
common stock
|
12,766 | 18,143 | ||||||
|
Total
|
$ | 64,000 | $ | 85,073 | ||||
| Fair Value Measurements | ||||||||||||
|
Total
|
Quoted Prices in Active Markets (Level 1) |
Siginficant Other
Observable Inputs (Level
2)
|
||||||||||
|
(in
thousands)
|
||||||||||||
|
December
31, 2008:
|
||||||||||||
|
Current assets (available-for-sale):
|
||||||||||||
|
Restricted debt securities
|
$ | 5,372 | $ | - | $ | 5,372 | ||||||
|
Other marketable securities
|
162 | - | 162 | |||||||||
|
Total
|
$ | 5,534 | $ | - | $ | 5,534 | ||||||
|
Noncurrent assets (available-for-sale):
|
||||||||||||
|
Valhi
common stock
|
$ | 51,234 | $ | 51,234 | $ | - | ||||||
|
TIMET
common stock
|
12,766 | 12,766 | - | |||||||||
|
Total
|
$ | 64,000 | $ | 64,000 | $ | - | ||||||
|
December
31, 2009:
|
||||||||||||
|
Current assets (available-for-sale):
|
||||||||||||
|
Restricted debt securities
|
$ | 5,225 | $ | - | $ | 5,225 | ||||||
|
Noncurrent assets (available-for-sale):
|
||||||||||||
|
Valhi common stock
|
$ | 66,930 | $ | 66,930 | $ | - | ||||||
|
TIMET common stock
|
18,143 | 18,143 | - | |||||||||
|
Total
|
$ | 85,073 | $ | 85,073 | $ | - | ||||||
We held
no level 3 securities at December 31, 2008 and 2009. Restricted debt
securities at December 31, 2008 and 2009 collateralize certain of our
outstanding letters of credit.
The
aggregate cost of the restricted debt securities and other available-for-sale
marketable securities approximates their net carrying value at December 31, 2008
and 2009. The fair value of these securities is generally determined
using Level 2 inputs because although these securities are traded, in many cases
the market is not active and the year end valuation is based on the last trade
of the year which may be several days prior to December 31.
At
December 31, 2008 and 2009, we owned approximately 4.8 million shares of Valhi
common stock. We account for our shares of Valhi common stock as
available-for-sale marketable equity securities carried at fair value based on
quoted market prices, a Level 1 input. The quoted market price per
share of Valhi common stock was $10.70 and $13.97 at December 31, 2008 and 2009,
respectively, with an aggregate market value of $51.2 million and $66.9 million,
respectively. The aggregate cost basis of our investment in Valhi
common stock was $24.3 million at both December 31, 2008 and 2009.
In
October 2007, we sold 800,000 shares of our TIMET common stock to Valhi for
approximately $26.8 million cash. The transaction was approved by the
independent members of our board of directors. The transaction was
valued based on TIMET’s October 10, 2007 closing market price. As a
result of such sale, we recognized a pre-tax securities transaction gain in the
fourth quarter of 2007 of $22.7 million.
At
December 31, 2008 and 2009, we owned approximately 1.4 million shares of TIMET
common stock. The quoted market price per share of TIMET common stock
was $8.81 and $12.52 at December 31, 2008 and 2009, respectively, or an
aggregate market value of $12.8 million and $18.1 million,
respectively. The aggregate cost basis of our shares of TIMET common
stock was $7.4 million at December 31, 2008 and 2009.
The Valhi
and TIMET common stock we own is subject to the restrictions on resale pursuant
to certain provisions of the Securities and Exchange Commission (“SEC”) Rule
144. In addition, as a majority-owned subsidiary of Valhi we cannot
vote our shares of Valhi common stock under Delaware Corporation Law, but we do
receive dividends from Valhi on these shares, when declared and
paid. For financial reporting purposes, Valhi reports its
proportional interest in these shares as treasury stock.
Note
5
- Accounts
and other receivables, net:
|
December 31,
|
||||||||
|
2008
|
2009
|
|||||||
|
(In
thousands)
|
||||||||
|
Trade
receivables
|
$ | 17,598 | $ | 12,204 | ||||
|
Accrued
insurance recoveries
|
7,219 | 465 | ||||||
|
Other
receivables
|
1,069 | 133 | ||||||
|
Refundable
income taxes
|
338 | 1,844 | ||||||
|
Allowance
for doubtful accounts
|
(711 | ) | (481 | ) | ||||
|
Total
|
$ | 25,513 | $ | 14,165 | ||||
Accrued insurance recoveries are
discussed in Note 19.
Note 6 - Inventories, net:
|
December 31,
|
||||||||
|
2008
|
2009
|
|||||||
|
(In
thousands)
|
||||||||
|
Raw
materials
|
$ | 7,552 | $ | 4,830 | ||||
|
In
process products
|
8,225 | 6,151 | ||||||
|
Finished
products
|
6,884 | 5,285 | ||||||
|
Total
|
$ | 22,661 | $ | 16,266 | ||||
Note
7
- Investment
in and advances to Kronos Worldwide, Inc.:
At
December 31, 2009, we owned approximately 17.6 million shares of Kronos common
stock and the quoted market price was $16.25 per share, or an aggregate market
value of $286.2 million. At December 31, 2008, we owned approximately
17.5 million Kronos shares and the quoted market price per share was $11.65, or
an aggregate market value of $205.0 million. During 2009 we purchased
approximately 14,000 shares of Kronos common stock in market transactions for an
aggregate $139,000. As part of our appeal of certain litigation
discussed in Note 19, we have pledged 2.5 million of our shares of Kronos stock
(and a nominal number of shares of our CompX common stock).
The
composition of our investment in and advances to Kronos at December 31, 2008 and
2009 are summarized below. Our loan to Kronos is discussed in Note
17.
|
December 31,
|
||||||||
|
2008
|
2009
|
|||||||
|
(In
millions)
|
||||||||
|
Investment
in Kronos
|
$ | 114.5 | $ | 112.8 | ||||
|
Loan
to Kronos
|
19.2 | - | ||||||
|
Total
assets
|
$ | 133.7 | $ | 112.8 | ||||
The
change in the carrying value of our investment in Kronos during the past three
years is summarized below:
|
Year ended December 31,
|
||||||||||||
|
2007
|
2008
|
2009
|
||||||||||
|
(In
millions)
|
||||||||||||
|
Balance
at the beginning of the period
|
$ | 160.5 | $ | 147.1 | $ | 114.5 | ||||||
|
Equity
in earnings (losses) of Kronos
|
(23.9 | ) | 3.2 | (12.5 | ) | |||||||
|
Dividends
received from Kronos
|
(17.5 | ) | (17.5 | ) | - | |||||||
|
Purchases
of Kronos stock
|
- | .8 | .1 | |||||||||
|
Equity
in Kronos’ changes in accounting
|
(2.1 | ) | - | - | ||||||||
|
Other,
principally equity in Kronos’ other comprehensive income
|
30.1 | (19.1 | ) | 10.7 | ||||||||
|
Balance
at the end of the period
|
$ | 147.1 | $ | 114.5 | $ | 112.8 | ||||||
Selected
financial information of Kronos is summarized below:
|
December 31,
|
||||||||
|
2008
|
2009
|
|||||||
|
(In
millions)
|
||||||||
|
Current
assets
|
$ | 589.5 | $ | 529.9 | ||||
|
Property
and equipment, net
|
485.5 | 499.7 | ||||||
|
Investment
in TiO2
joint venture
|
105.6 | 98.7 | ||||||
|
Other
noncurrent assets
|
178.1 | 196.7 | ||||||
|
Total
assets
|
$ | 1,358.7 | $ | 1,325.0 | ||||
|
Current
liabilities
|
$ | 204.4 | $ | 215.4 | ||||
|
Long-term
debt
|
618.5 | 611.1 | ||||||
|
Note
payable to NL
|
19.2 | - | ||||||
|
Accrued
pension and post retirement benefits
|
134.2 | 131.7 | ||||||
|
Other
noncurrent liabilities
|
64.5 | 54.3 | ||||||
|
Stockholders’
equity
|
317.9 | 312.5 | ||||||
|
Total
liabilities and stockholders’ equity
|
$ | 1,358.7 | $ | 1,325.0 | ||||
|
Year ended December 31,
|
||||||||||||
|
2007
|
2008
|
2009
|
||||||||||
|
(In
millions)
|
||||||||||||
|
Net
sales
|
$ | 1,310.3 | $ | 1,316.9 | $ | 1,142.0 | ||||||
|
Cost
of sales
|
1,058.9 | 1,096.3 | 1,011.7 | |||||||||
|
Income
(loss) from operations
|
84.9 | 47.2 | (15.7 | ) | ||||||||
|
Net
income (loss)
|
(66.7 | ) | 9.0 | (34.7 | ) | |||||||
Note
8 – Goodwill:
Substantially
all of our goodwill is related to our component products operations and was
generated from CompX's acquisitions of certain business units and the step
acquisition of CompX discussed in Note 2, as such goodwill was determined prior
to the adoption of the equity transaction framework provisions of ASC Topic 810
on January 1, 2009. See Note 21. Our remaining goodwill resulted
from our acquisition of EWI RE, Inc., an insurance broker subsidiary, and
totaled approximately $6.4 million.
We have
assigned goodwill related to the component products operations to three reporting units (as that term
is defined in ASC Topic 350-20-20 Goodwill): one consisting of
CompX's security products operations, one consisting of CompX’s furniture
components operations and one consisting of CompX’s marine component
operations. We test for goodwill impairment at the reporting unit
level. In accordance with the requirements of ASC Topic 350-20-20, we
test for goodwill impairment at each of our three component products reporting
units as well as the goodwill associated with the EWI reporting unit during the
third quarter of each year or when circumstances arise that indicate impairment
might be present. In determining the estimated fair value of the reporting
units, we use appropriate valuation techniques, such as discounted cash
flows. Such discounted cash flows are a Level 3 input as defined by
ASC 820-10-35 (although this guidance was not in effect with respect to
estimating the fair value of a reporting unit until January 1,
2009). If the carrying amount of goodwill exceeds its implied fair
value, an impairment charge is recorded. Our 2007 and 2009 annual
impairment reviews of goodwill indicated no impairments. The only
goodwill impairment we have recorded since we began testing goodwill on an
annual basis is the 2008 impairment noted below.
During
the third quarter of 2008, we recorded a goodwill impairment charge of $10.1
million for CompX’s marine components reporting unit, which represented all of
the goodwill we had previously recognized for this reporting unit (including a
nominal amount of goodwill inherent in our investment in CompX.) We
used a discounted cash flow methodology in determining the estimated fair value
of CompX’s marine components reporting unit. The factors that led us
to conclude goodwill associated with the marine components reporting unit was
fully impaired included the continued decline in consumer spending in the marine
market as well as the overall negative economic outlook, both of which resulted
in near-term and longer-term reduced revenue, profit and cash flow forecasts for
the marine components unit. While we continue to believe in the
long-term potential of the marine components reporting unit, due to the
extraordinary economic downturn in the marine industry we are not currently able
to foresee when the industry and our business will recover. In response to
the present economic conditions, we have taken steps to reduce operating costs
without inhibiting our ability to take advantage of opportunities to expand our
market share.
During
2009 due to the continued unfavorable economic trends associated with CompX’s
furniture components reporting unit including, among other things, sales and
operating income falling materially below our projections, we re-evaluated
goodwill associated with this reporting unit at the first and second interim
periods of 2009, along with the annual testing date in the third
quarter. At each interim and annual testing date, we concluded that
no impairments were present. At December 31, 2009 CompX’s furniture
components reporting unit had approximately $7.2 million of
goodwill.
Changes
in the carrying amount of goodwill related to our three components products
reporting units (which exclude the $6.4 million of goodwill related to our EWI
reporting unit) during the past three years are presented in the table
below.
|
Component
products operations
(In
millions)
|
|
|
Balance
at December 31, 2006
|
$26.6
|
|
Goodwill
acquired during the year
|
21.7
|
|
Balance
at December 31, 2007
|
48.3
|
|
Goodwill
impairment during the year
|
(10.1)
|
|
Changes
in currency exchange rates
|
(.4)
|
|
Balance
at December 31, 2008
|
37.8
|
|
Changes
in currency exchange rates
|
.1
|
|
Balance
at December 31, 2009
|
$37.9
|
Note
9
- Intangible
and other noncurrent assets:
|
December 31,
|
||||||||
|
2008
|
2009
|
|||||||
|
(In
thousands)
|
||||||||
|
Promissory
note receivable
|
$ | 15,000 | $ | 15,000 | ||||
|
Patents
and other intangible assets, net
|
1,991 | 1,408 | ||||||
|
Other
|
841 | 618 | ||||||
|
Total
|
$ | 17,832 | $ | 17,026 | ||||
Patents
and other intangible assets, all of which relate to CompX, are stated net of
accumulated amortization of $3.7 million at December 31, 2008 and $4.2 million
at December 31, 2009.
Aggregate
amortization expense of all intangible assets, including certain intangible
assets which were fully amortized prior to 2008, was $1,216,000 in 2007,
$716,000 in 2008 and $549,000 in 2009 and is expected to be approximately
$600,000 in 2010, $400,000 in 2011, $300,000 in 2012, $100,000 in 2013 and
$29,000 in 2014.
The
promissory note receivable bears interest at LIBOR plus 2.75%, with interest
payable monthly. All principal is due no later than October
2011. The promissory note is collateralized by a real estate
developer’s ground lease on certain real property we owned that was taken in
condemnation proceeding, and all improvements to the property performed by the
developer. Both the promissory note and our lien on the property are
subordinated to certain senior indebtedness of the developer. In the
event that the developer has not repaid the promissory note at its stated
maturity, we have the right to demand repayment of up to $15.0 million due under
the promissory note from one of the developer’s equity partners, and such right
is not subordinated to the developer’s senior indebtedness. See Note
19.
Note
10 -Accrued
liabilities:
|
December 31,
|
||||||||
|
2008
|
2009
|
|||||||
|
(In
thousands)
|
||||||||
|
Employee
benefits
|
$ | 8,158 | $ | 7,561 | ||||
|
Professional
fees and settlements
|
3,624 | 6,747 | ||||||
|
Reserve
for uncertain tax positions
|
212 | 59 | ||||||
|
Other
|
12,481 | 11,599 | ||||||
|
Total
|
$ | 24,475 | $ | 25,966 | ||||
Note
11
- Other
noncurrent liabilities:
|
December 31,
|
||||||||
|
2008
|
2009
|
|||||||
|
(In
thousands)
|
||||||||
|
Insurance
claims and expenses
|
$ | 1,197 | $ | 659 | ||||
|
Reserve
for uncertain tax positions
|
19,121 | 16,936 | ||||||
|
Other
|
1,505 | 1,517 | ||||||
|
Total
|
$ | 21,823 | $ | 19,112 | ||||
Our reserve for uncertain tax positions
is discussed in Note 21.
Note
12 – Credit facility:
At
December 31, 2009, CompX had a $37.5 million revolving credit facility that
matures in January 2012. Until the end of March 2011, any outstanding
borrowings are limited to the sum of 80% of CompX’s consolidated net accounts
receivable, 50% of CompX’s consolidated raw material inventory, 50% of CompX’s
consolidated finished goods inventory and 100% of CompX’s consolidated
unrestricted cash and cash equivalents. Any amounts outstanding under
the credit facility bear interest, at our option, at the prime rate plus a
margin or at LIBOR plus a margin. The credit facility is
collateralized by 65% of the ownership interests in CompX’s first-tier non-U.S.
subsidiaries. The facility, as amended, contains certain covenants
and restrictions customary in lending transactions of this type, which among
other things restricts CompX’s ability to incur debt, incur liens, pay dividends
or merge or consolidate with, or transfer substantially all assets to, another
entity. The facility also required maintenance of specified levels of
net worth (as defined). In the event of a change of control, as
defined, the lenders would have the right to accelerate the maturity of the
facility. One of the financial performance covenants requires CompX’s
earnings before interest and taxes for the trailing four quarters (not including
quarters prior to 2009) to be 2.5 times cash interest expense. As a
result of CompX’s loss before interest and taxes at December 31, 2009, it could
not have had any borrowings outstanding under the Credit Agreement without
violating the covenant as any cash interest incurred would have exceeded the
required 2.5 to 1 ratio. At December 31, 2008 and 2009, no amounts were
outstanding under the facility. We believe that CompX will be able to
comply with the current covenant through the maturity of the facility in January
2012; however if future operating results differ materially from our predictions
CompX may be unable to maintain compliance.
The
credit facility permits CompX to pay dividends and/or repurchase common stock in
an amount equal to the sum of (i) a dividend of $.125 per share in any calendar
quarter, not to exceed $8.0 million in any calendar year, plus (ii) $20.0
million plus 50% of aggregate net income over the term of the credit
facility. In addition to the permitted $.125 per share amount to
repurchase its common stock and/or to pay dividends, at December 31, 2009, $19.4
million was available for dividends and/or repurchases of our common stock under
the terms of the facility.
Note
13 - Stockholders' equity:
|
Shares
of common stock issued and
outstanding
|
|
|
(In
thousands)
|
|
|
Balance
at December 31, 2006
|
48,586
|
|
Common
stock issued
|
6
|
|
Balance
at December 31, 2007
|
48,592
|
|
Common
stock issued
|
7
|
|
Balance
at December 31, 2008
|
48,599
|
|
Common
stock issued
|
13
|
|
Balance
at December 31, 2009
|
48,612
|
Stock
options - The NL
Industries, Inc. 1998 Long-Term Incentive Plan provides for the discretionary
grant of restricted common stock, stock options, stock appreciation rights
(“SARs”) and other incentive compensation to our officers and other key
employees and non-employee directors, including individuals who are employed by
Kronos. In addition, certain stock options granted pursuant to
another plan remain outstanding at December 31, 2009, but we may not grant any
additional options under that plan.
We may
issue up to five million shares of our common stock pursuant to the 1998 plan,
and at December 31, 2009 4.1 million shares were available for future
grants. The 1998 plan currently provides for the grant of options due
to its extension for an additional five years and for options which are not
qualified as incentive stock options. Generally, stock options and
SARs (collectively, “options”) are granted at a price equal to or greater than
100% of the market price at the date of grant, vest over a five-year period and
expire ten years from the date of grant. Restricted stock,
forfeitable unless certain periods of employment are completed, is held in
escrow in the name of the grantee until the restriction period
expires. No SARs have been granted under the 1998
plan.
Changes
in outstanding options granted under all plans are summarized in the table
below. We did not grant any options during 2007, 2008 or
2009.
|
Shares
|
Exercise
price
per
share
|
Amount
payable
upon
exercise
|
Weighted-
average exercise price
|
|||||||||||||
|
(In
thousands, except per share amounts)
|
||||||||||||||||
|
Outstanding
at December 31, 2006
|
106 | $ | 2.66 - $ 11.49 | $ | 1,027 | $ | 9.71 | |||||||||
|
Cancelled
|
(9 | ) | 5.19 - 11.49 | (67 | ) | 7.51 | ||||||||||
|
Outstanding
at December 31, 2007
|
97 | 2.66 - 11.49 | 960 | 9.91 | ||||||||||||
|
Exercised
|
(1 | ) | 5.63 | (3 | ) | 5.63 | ||||||||||
|
Cancelled
|
(1 | ) | 11.49 | (14 | ) | 11.49 | ||||||||||
|
Outstanding
at December 31, 2008
|
95 | 2.66 - 11.49 | 943 | 9.92 | ||||||||||||
|
Exercised
|
(7 | ) | 2.66 - 11.49 | (42 | ) | 6.11 | ||||||||||
|
Cancelled
|
(7 | ) | 2.66 - 11.49 | (76 | ) | 10.40 | ||||||||||
|
Outstanding
at December 31, 2009
|
81 | $ | 5.63 - $ 11.49 | $ | 825 | $ | 10.20 | |||||||||
At
December 31, 2009 all of the outstanding options were exercisable. At
December 31, 2009, the aggregate intrinsic value (defined as the excess of the
market price of our common stock over the exercise price) for the outstanding
options for which the exercise price was less than the market price of our
common stock of $6.94 per share was approximately
$23,000. Outstanding options at December 31, 2009 expire at various
dates through 2011. Shares issued under the 1998 plan are generally
newly-issued shares, however prior to 2005 we issued shares from our treasury
shares.
The
intrinsic value of options exercised aggregated nil in 2007, $5,000 in 2008 and
$43,000 in 2009 and the related income tax benefit from such exercises was
approximately nil in 2007, $2,000 in 2008 and $15,000 in 2009.
Stock option plan
of subsidiaries and affiliates - CompX maintains a stock option plan that
provides for the grant of options to purchase its common stock. At
December 31, 2009, options to purchase 81,000 CompX shares were outstanding with
exercise prices ranging from $12.15 to $19.25 per share, or an aggregate amount
payable upon exercise of $1.4 million. Through December 31, 2009,
Kronos has not granted any options to purchase its common stock.
Note
14 – Facility consolidation and assets held for sale:
Prior to
2007, CompX had three facilities in northern Illinois, two security products
facilities (located in Lake Bluff, Illinois and River Grove, Illinois) and one
marine components facility (located in Grayslake, Illinois). In order
to create opportunities to reduce operating costs and improve operating
efficiencies, CompX determined that it would be more effective to consolidate
these three operations into one location. In 2006, CompX acquired
land adjacent to the marine components facility for approximately $1.8 million
in order to expand the facility, and during 2007 CompX incurred approximately
$9.6 million of capital expenditures in connection with the
expansion.
In
addition to the capital expenditures, during 2007, CompX incurred approximately
$2.7 million in expenses relating to the facility consolidation including
physical move costs, equipment installation, redundant labor and recruiting fees
and write-downs for fixed assets no longer in use, all of which are included in
facility consolidation expense in the accompanying Consolidated Statement of
Operations. The majority of these costs were incurred during the
fourth quarter of 2007.
The fixed
asset write-downs amounted to $765,000 of which $600,000 related to the
classification of the River Grove facility as an “asset held for sale” in
November 2007 as it was no longer being utilized and met all of the criteria
under GAAP to be classified as an “asset held for sale.” In
classifying the facility and related assets (primarily land, building, and
building improvements) as held for sale, CompX concluded that the carrying
amount of the assets exceeded the estimated fair value less costs to sell such
assets. In determining the estimated fair value of such assets, CompX
considered recent sales prices for other property near the facility (Level 2
inputs). Accordingly, we recognized $600,000 to write-down the assets
to their estimated net realizable value of approximately $3.1 million at
December 31, 2007.
Our
assets held for sale at December 31, 2009, consist of the River Grove facility
discussed above and a facility in Neenah, Wisconsin. These two
properties (primarily land, buildings and building improvements) were formerly
used in CompX’s operations. Discussions with potential buyers of both
properties had been active through the first quarter of
2009. Subsequently during the second quarter of 2009, and as weak
economic conditions continued longer than expected, CompX concluded that it was
unlikely it would sell these properties at or above their previous carrying
values in the near term and therefore an adjustment to their carrying values was
appropriate. In determining the estimated fair values of the
properties, we considered recent sales prices for other properties near the
facilities (Level 2 inputs). Accordingly, during the second quarter
of 2009, we recorded a write-down of approximately $717,000 to reduce the
carrying value of these assets to their aggregate estimated fair value less cost
to sell of $2.8 million. Both properties are being actively
marketed. However, due to the current state of the commercial real
estate market, we cannot be certain of the timing of the disposition of the
assets.
Note 15 - Income
taxes:
|
Years ended December 31,
|
||||||||||||
|
2007
|
2008
|
2009
|
||||||||||
|
(In
millions)
|
||||||||||||
|
Pre-tax
income (loss):
|
||||||||||||
|
U.S.
|
$ | (14.9 | ) | $ | 53.0 | $ | (20.4 | ) | ||||
|
Non-U.S.
|
7.5 |
(5.3
|
) | (2.0 | ) | |||||||
|
Total
|
$ | (7.4 | ) | $ | 47.7 | $ | (22.4 | ) | ||||
|
Expected tax (benefit)
expense, at U.S. federal
statutory income tax rate of 35%
|
$ | (2.6 | ) | $ | 16.7 | $ | (7.8 | ) | ||||
|
Non-U.S. tax rates
|
(.2 | ) | (.3 | ) | .1 | |||||||
|
Incremental U.S. tax and rate differences
on equity in earnings
|
(5.0 | ) | (3.4 | ) | (1.2 | ) | ||||||
|
Nondeductible expenses
|
.5 | .3 | .3 | |||||||||
|
U.S. state income taxes, net
|
.5 | .9 | (.6 | ) | ||||||||
|
Goodwill
impairment
|
- | 3.5 | - | |||||||||
|
Tax contingency reserve adjustment, net
|
(1.3 | ) | (2.1 | ) | (.6 | ) | ||||||
|
Other, net
|
(.2 | ) | (.7 | ) | (.5 | ) | ||||||
|
Provision
for income taxes (benefit)
|
$ | (8.3 | ) | $ | 14.9 | $ | (10.3 | ) | ||||
|
Years ended December 31,
|
||||||||||||
|
2007
|
2008
|
2009
|
||||||||||
|
(In
millions)
|
||||||||||||
|
Components
of income tax expense (benefit):
|
||||||||||||
|
Currently payable (refundable):
|
||||||||||||
|
U.S. federal and state
|
$ | .1 | $ | 18.6 | $ | (2.7 | ) | |||||
|
Non-U.S.
|
3.6 | 3.7 | (.7 | ) | ||||||||
| 3.7 | 22.3 | (3.4 | ) | |||||||||
|
Deferred income taxes (benefit):
|
||||||||||||
|
U.S. federal and state
|
(12.0 | ) | (7.1 | ) | (6.8 | ) | ||||||
|
Non-U.S.
|
- | (.3 | ) | (.1 | ) | |||||||
| (12.0 | ) | (7.4 | ) | (6.9 | ) | |||||||
|
Total
|
$ | (8.3 | ) | $ | 14.9 | $ | (10.3 | ) | ||||
|
Years ended December 31,
|
||||||||||||
|
2007
|
2008
|
2009
|
||||||||||
|
(In
millions)
|
||||||||||||
|
Comprehensive
provision for
income
taxes (benefit) allocable to:
|
||||||||||||
|
Income
(loss) from operations
|
$ | (8.3 | ) | $ | 14.9 | $ | (10.3 | ) | ||||
|
Other
comprehensive income (loss):
|
||||||||||||
|
Marketable
securities
|
(5.6 | ) | (17.8 | ) | 7.4 | |||||||
|
Pension
liabilities
|
6.8 | (12.6 | ) | 1.0 | ||||||||
|
OPEB
Plans
|
.4 | .3 | (.2 | ) | ||||||||
|
Currency
translation
|
6.0 | (7.0 | ) | 3.8 | ||||||||
|
Total
|
$ | (.7 | ) | $ | (22.2 | ) | $ | 1.7 | ||||
The components of the net deferred
tax liability at December 31, 2008 and 2009 are summarized in the following
table. We have not recognized any deferred income tax asset valuation
allowance during the past three years.
|
December 31,
|
||||||||||||||||
|
2008
|
2009
|
|||||||||||||||
|
Assets
|
Liabilities
|
Assets
|
Liabilities
|
|||||||||||||
|
(In
millions)
|
||||||||||||||||
|
Tax effect of temporary differences
related to:
|
||||||||||||||||
|
Inventories
|
$ | .9 | $ | - | $ | .8 | $ | - | ||||||||
|
Marketable securities
|
- | (2.4 | ) | - | (9.9 | ) | ||||||||||
|
Property and equipment
|
- | (5.5 | ) | - | (5.5 | ) | ||||||||||
|
Accrued OPEB costs
|
3.5 | - | 3.3 | - | ||||||||||||
|
Accrued pension cost
|
4.2 | - | 4.4 | - | ||||||||||||
|
Accrued environmental liabilities
|
17.7 | - | 16.3 | - | ||||||||||||
|
Other accrued liabilities and deductible
differences
|
2.6 | - | 2.2 | - | ||||||||||||
|
Other taxable differences
|
- | (11.3 | ) | - | (11.2 | ) | ||||||||||
|
Investments in subsidiaries and
affiliates
|
- | (53.3 | ) | - | (51.5 | ) | ||||||||||
|
Tax loss and tax credit carryforwards
|
.2 | - | .3 | - | ||||||||||||
|
Adjusted gross deferred tax assets
(liabilities)
|
29.1 | (72.5 | ) | 27.3 | (78.1 | ) | ||||||||||
|
Netting of items by tax jurisdiction
|
(23.3 | ) | 23.3 | (22.3 | ) | 22.3 | ||||||||||
| 5.8 | (49.2 | ) | 5.0 | (55.8 | ) | |||||||||||
|
Less net current deferred tax asset
|
5.8 | - | 5.0 | - | ||||||||||||
|
Net noncurrent deferred tax liability
|
$ | - | $ | (49.2 | ) | $ | - | $ | (55.8 | ) | ||||||
We received 2.2 million shares of TIMET
common stock in March 2007 when Valhi paid a special dividend. For
income tax purposes, the tax basis in the shares of TIMET we received is equal
to the fair value of such TIMET shares on the date we received
them. However, if the fair value of all of the TIMET shares
distributed by Valhi exceeds Valhi’s cumulative earnings and profits as of the
end of 2007, we are required to reduce the tax basis of the shares of Valhi
common stock we own by an amount equal to the lesser of our tax basis in such
Valhi shares or our pro-rata share of the amount by which the aggregate fair
value of the TIMET shares distributed by Valhi exceeds Valhi’s earnings and
profits. Additionally, if our pro-rata share of the amount by which
the aggregate fair value of the TIMET shares distributed by Valhi exceeds
Valhi’s earnings and profits is greater than the tax basis of our Valhi shares,
we are required to recognize a capital gain for the difference. The
fair value of the TIMET shares we received exceeds our share of Valhi’s
cumulative earnings and profits at the end of 2007 and exceeds our aggregate tax
basis of our Valhi shares. Accordingly, the benefit associated with
receiving a fair-value tax basis in our TIMET shares has been offset by the
elimination of the tax basis in our Valhi shares and the capital gain we are
required to recognize for the excess. The income tax generated from
this capital gain is approximately $11.2 million. For financial
reporting purposes, we provide deferred income taxes for the excess of the
carrying value over the tax basis of our shares of both Valhi and TIMET common
stock, and as a result the $11.2 million current income tax generated is offset
by deferred income taxes we previously provided on our shares of Valhi common
stock.
We, our qualifying subsidiaries and
Valhi are members of Contran’s consolidated U.S. federal income tax group (the
“Contran Tax Group”). We make payments to Valhi for income taxes in
amounts that we would have paid to the U.S. Internal Revenue Service had we not
been a member of the Contran Tax Group. Approximately $10.8 million
of the $11.2 million tax related to the TIMET distribution is payable to Valhi
(the remaining $.4 million relates to one of our subsidiaries that was not a
member of the Contran Tax Group on the distribution date). Valhi is
not currently required to pay this $10.8 million tax liability to Contran, nor
is Contran currently required to pay this tax liability to the applicable tax
authority, because the related taxable gain is currently deferred at the Valhi
and Contran levels since Valhi and NL are members of the Valhi tax group on a
separate company basis and of the Contran Tax Group. This income tax
liability would become payable by Valhi to Contran, and by Contran to the
applicable tax authority, when the shares of Valhi common stock held by NL are
sold or otherwise transferred outside the Contran Tax Group or in the event of
certain restructuring transactions involving NL and Valhi.
Tax authorities are continuing to
examine certain of our U.S. and non U.S. tax returns, including those of Kronos,
and tax authorities have or may propose tax deficiencies, including penalties
and interest. We cannot guarantee that these tax matters will be
resolved in our favor due to the inherent uncertainties involved in settlement
initiatives and court and tax proceedings. We believe that we have
adequate accruals for additional taxes and related interest expense which could
ultimately result from tax examinations. We believe the ultimate
disposition of tax examinations should not have a material adverse effect on our
consolidated financial position, results of operations or
liquidity.
In March
2010, Kronos received a reevised notice of proposed adjustment from the Canadian
tax authorities related to the years 2002 through 2004. Kronos objects to
the proposed assessment and intends to formally respond to the Canadian tax
authorities in the second quarter of 2010. If the full amount of the
proposed adjustment were ultimately to be assessed against Kronos the impact to
our consolidated financial statements would be approximately $.9
million. Because of the inherent uncertainties involved in the
settlement of the potential exposure, if any, the final outcome is also
uncertain. We believe that we have provided adequate
reserves.
As a
consequence of a European Court ruling that resulted in a favorable resolution
of certain income tax issues in Germany, during the first quarter of 2010 the
German tax authorities agreed to an increase in Kronos’ German net operating
loss carryforward. Accordingly, Kronos expects to report a non-cash
income tax benefit of approximately $35.2 million in the first quarter of
2010.
The goodwill impairment charge of $10.1
million recorded in the third quarter of 2008 (see Note 8) is non-deductible
goodwill for income tax purposes. Accordingly, there is no income tax
benefit associated with the goodwill for financial reporting
purposes.
Note
16 - Employee benefit plans:
Defined
contribution plans
- We maintain various defined contribution pension plans
worldwide. Company contributions are based on matching or other
formulas. Defined contribution plan expense approximated $2.5 million
in 2007, $2.1 million in 2008 and $1.5 million in 2009.
Accounting for
defined benefit pension and postretirement benefits other than pension (“OPEB”)
plans - We
recognize all changes in the funded status of these plans through comprehensive
income, net of income taxes. Any future changes will be recognized
either in net income, to the extent they are reflected in periodic benefit cost,
or through other comprehensive income. Prior to December 31,
2007 we used September 30 as a measurement date for certain of our pension
plans. In accordance with asset and liability recognition provisions of ASC
Topic 715 Compensation –
Retirement Benefits, effective December 31, 2007 we transitioned all of
our plans which had previously used a September 30 measurement date to a
December 31 measurement date using a 15 month net periodic benefit
cost. Accordingly one-fifth of the net periodic benefit cost for the
period from October 1, 2006 through December 31, 2007, net of income taxes, has
been allocated as a direct adjustment to retained earnings to reflect this
change and four-fifths of the cost was allocated to expense in
2007. In addition, we are providing the expanded disclosures
regarding our defined benefit pension plan assets as of December 31, 2009, as
required by the provisions of ASC Topic 715.
Defined benefit
plans – We
maintain a defined benefit pension plan in the U.S. We also maintain
a plan in the United Kingdom related to a former disposed business unit in the
U.K. All of our defined benefit plans use a December 31 measurement
date. The benefits under our defined benefit plans are based upon
years of service and employee compensation. Prior to 2007, the plans
were closed to new participants and no additional benefits accrue to existing
plan participants. Our funding policy is to contribute annually the
minimum amount required under ERISA (or equivalent non U.S.) regulations plus
additional amounts as we deem appropriate.
We
currently expect to contribute approximately $600,000 to all of our defined
benefit pension plans during 2010. Benefit payments to plan
participants out of plan assets are expected to be the equivalent of (in
millions):
|
2010
|
$ 3.2
|
|
|
2011
|
3.2
|
|
|
2012
|
3.2
|
|
|
2013
|
3.3
|
|
|
2014
|
3.4
|
|
|
Next 5 years
|
17.5
|
The
funded status of our defined benefit pension plans is presented in the table
below.
|
Years ended December 31,
|
||||||||
|
2008
|
2009
|
|||||||
|
(In
thousands)
|
||||||||
|
Change
in projected benefit obligations ("PBO"):
|
||||||||
|
Balance
at beginning of the year
|
$ | 50,922 | $ | 47,964 | ||||
|
Interest cost
|
2,931 | 2,722 | ||||||
|
Participant contributions
|
10 | 7 | ||||||
|
Plan
amendment
|
27 | - | ||||||
|
Actuarial losses,
net
|
125 | 2,795 | ||||||
|
Change in currency exchange rates
|
(2,535 | ) | 913 | |||||
|
Benefits paid
|
(3,516 | ) | (3,342 | ) | ||||
|
Benefit
obligation at end of the year
|
47,964 | 51,059 | ||||||
|
Change in plan assets:
|
||||||||
|
Fair value
at beginning of the year
|
66,706 | 36,022 | ||||||
|
Actual return on plan assets
|
(25,593 | ) | 4,836 | |||||
|
Employer contributions
|
560 | 453 | ||||||
|
Participant contributions
|
10 | 7 | ||||||
|
Change in currency exchange rates
|
(2,145 | ) | 675 | |||||
|
Benefits paid
|
(3,516 | ) | (3,342 | ) | ||||
|
Fair value of
plan assets at end of year
|
36,022 | 38,651 | ||||||
|
Funded status
|
$ | (11,942 | ) | $ | (12,408 | ) | ||
|
Amounts recognized in the
Consolidated Balance Sheets:
|
||||||||
|
Accrued pension costs:
|
||||||||
|
Current
|
$ | (174 | ) | $ | (175 | ) | ||
|
Noncurrent
|
(11,768 | ) | (12,233 | ) | ||||
| $ | (11,942 | ) | $ | (12,408 | ) | |||
|
Accumulated other comprehensive income
-
|
||||||||
|
actuarial
losses (gains), net
|
$ | 26,393 | $ | 26,372 | ||||
|
Accumulated
benefit obligation (“ABO”)
|
$ | 47,964 | $ | 51,059 | ||||
The
amounts shown in the table above for unrecognized actuarial gains and losses at
December 31, 2008 and 2009 have not been recognized as components of our
periodic defined benefit pension cost as of those dates. These
amounts will be recognized as components of our periodic defined benefit cost in
future years. These amounts, net of deferred income taxes, are
recognized in our accumulated other comprehensive income (loss) at December 31,
2008 and 2009. We expect that $1.2 million of the unrecognized
actuarial losses will be recognized as a component of our periodic defined
benefit pension cost in 2010. The table below details the changes in
other comprehensive income during 2007, 2008 and 2009.
|
Years
ended December 31,
|
||||||||||||
|
2007
|
2008
|
2009
|
||||||||||
|
(In
thousands)
|
||||||||||||
|
Changes
in plan assets and benefit obligations recognized in other comprehensive
income:
|
||||||||||||
|
Net
actuarial gain (loss) arising during the year
|
$ | 1,735 | $ | (31,640 | ) | $ | (1,286 | ) | ||||
|
Amortization
of unrecognized net actuarial loss
|
295 | 144 | 1,307 | |||||||||
|
Change
in measurement date
|
76 | - | - | |||||||||
|
Total
|
$ | 2,106 | $ | (31,496 | ) | $ | 21 | |||||
The
components of our net periodic defined benefit pension cost are presented in the
table below. The amount shown below for the amortization of
unrecognized actuarial losses in 2007, 2008 and 2009, net of deferred income
taxes, was recognized as a component of our accumulated other comprehensive
income at December 31, 2006, 2007 and 2008, respectively.
|
Years ended December 31,
|
||||||||||||
|
2007
|
2008
|
2009
|
||||||||||
|
(In
thousands)
|
||||||||||||
|
Net
periodic pension cost (income):
|
||||||||||||
|
Interest cost on PBO
|
$ | 2,925 | $ | 2,931 | $ | 2,722 | ||||||
|
Expected return on plan assets
|
(5,800 | ) | (6,209 | ) | (3,300 | ) | ||||||
|
Plan
amendment
|
- | 27 | - | |||||||||
|
Amortization
of unrecognized net actuarial losses
|
295 | 144 | 1,307 | |||||||||
|
Total
|
$ | (2,580 | ) | $ | (3,107 | ) | $ | 729 | ||||
Certain
information concerning our defined benefit pension plans is presented in the
table below.
|
December 31,
|
||||||||
|
2008
|
2009
|
|||||||
|
(In
thousands)
|
||||||||
|
PBO
at end of the year:
|
||||||||
|
U.S. plan
|
$ | 41,440 | $ | 42,534 | ||||
|
U.K. plan
|
6,524 | 8,525 | ||||||
|
Total
|
$ | 47,964 | $ | 51,059 | ||||
|
Fair value of plan assets at end of the year:
|
||||||||
|
U.S. plan
|
$ | 30,623 | $ | 31,683 | ||||
|
U.K. plan
|
5,399 | 6,968 | ||||||
|
Total
|
$ | 36,022 | $ | 38,651 | ||||
|
Plans
for which the accumulated benefit obligationexceeds plan assets:
|
||||||||
|
PBO
|
$ | 47,964 | $ | 51,059 | ||||
|
ABO
|
47,964 | 51,059 | ||||||
|
Fair
value of plan assets
|
36,022 | 38,651 | ||||||
The weighted-average rate assumptions
used in determining the actuarial present value of our benefit obligations as of
December 31, 2008 and 2009 are 6.1% and 5.7%, respectively. Such
weighted-average rates were determined using the projected benefit obligations
at each date. Since our plans are closed to new participants and no
new additional benefits accrue to existing plan participants, assumptions
regarding future compensation levels are not
applicable. Consequently, the accumulated benefit obligations for all
of our defined benefit pension plans were equal to the projected benefit
obligations at December 31, 2008 and 2009.
The
weighted-average rate assumptions used in determining the net periodic pension
cost for 2007, 2008 and 2009 are presented in the table below. Such
weighted-average discount rates were determined using the projected benefit
obligations as of the beginning of each year and the weighted-average long-term
return on plan assets was determined using the fair value of plan assets as of
the beginning of each year.
|
Years ended
December 31,
|
|||
|
Rate
|
2007
|
2008
|
2009
|
|
Discount
rate
|
5.7%
|
6.0%
|
6.1%
|
|
Long-term
return on plan assets
|
9.6%
|
9.6%
|
9.5%
|
Variances
from actuarially assumed rates will result in increases or decreases in
accumulated pension obligations, pension expense and funding requirements in
future periods.
As noted
above we are adopting the fair value measurement and disclosure provisions of
ASC Topic 715 Compensation –
Retirement Benefits beginning with our December 31, 2009 plan asset
values. The standard required us to adopt these provisions on a
prospective basis for the December 31, 2009 plan assets only.
At
December 31, 2008 and 2009, substantially all of the assets attributable to our
U.S. plans were invested in the Combined Master Retirement Trust (“CMRT”), a
collective investment trust sponsored by Contran to permit the collective
investment by certain master trusts that fund certain employee benefits plans
sponsored by Contran and certain of its affiliates. The CMRT’s long-term
investment objective is to provide a rate of return exceeding a composite of
broad market equity and fixed income indices (including the S&P 500 and
certain Russell indicies) while utilizing both third-party investment managers
as well as investments directed by Mr. Simmons. Mr. Simmons is the
sole trustee of the CMRT. The trustee of the CMRT, along with the
CMRT's investment committee, of which Mr. Simmons is a member, actively manages
the investments of the CMRT. The CMRT trustee and investment
committee seek to maximize returns in order to meet the CMRT’s long-term
investment objective. The CMRT trustee and investment committee do
not maintain a specific target asset allocation in order to achieve their
objectives, but instead they periodically change the asset mix of the CMRT based
upon, among other things, advice they receive from third-party advisors and
their expectations regarding potential returns for various investment
alternatives and what asset mix will generate the greatest overall
return. During the history of the CMRT from its inception in 1988
through December 31, 2009, the average annual rate of return of the CMRT has
been 11%. For the years ended December 31, 2007, 2008 and 2009, the assumed
long-term rate of return for plan assets invested in the CMRT was
10%. In determining the appropriateness of the long-term rate of
return assumption, we primarily rely on the historical rates of return achieved
by the CMRT, although we consider other factors as well including, among other
things, the investment objectives of the CMRT's managers and their expectation
that such historical returns will in the future continue to be achieved over the
long-term.
At
December 31, 2009, the portion of the CMRT in which our U.S. plans are invested
is represented by investments which are valued using Level 1, Level 2 and Level
3 inputs with approximately 75% valued using Level 1 inputs, 4% using Level 2
inputs and 21% using Level 3 inputs. The CMRT is not traded on any
market. The CMRT unit value is determined semi-monthly and the plans
have the ability to redeem all or any portion of their investment in the CMRT at
any time based on the most recent semi-monthly valuation. However,
the plans do not have the right to individual assets held by the CMRT and the
CMRT has the sole discretion in determining how to meet any redemption
request. For purposes of our plan asset disclosure, we consider the
investment in the CMRT a Level 2 input because (i) the CMRT value is established
semi-monthly and the plans have the right to redeem their investment in the
CMRT, in part or in whole, at anytime based on the most recent value and (ii)
approximately 79% of the assets of the CMRT are valued using either Level 1 or
Level 2 inputs, as noted above, which have observable inputs. The
total fair value of all of the CMRT assets, including funds of Contran and its
other affiliates that also invest in the CMRT, was $399 million and $407 million
at December 31, 2008 and 2009, respectively. At December 31, 2009
approximately 50% of the CMRT assets were invested in domestic equity securities
with the majority of these being publically traded securities; approximately 7%
were invested in publically traded international equity securities;
approximately 30% were invested in publically traded fixed income securities;
approximately 11% were invested in various privately managed limited
partnerships and the remainder was invested in real estate and cash and cash
equivalents.
At
December 31, 2008 approximately 53% of the CMRT assets were invested in equity
securities; approximately 43% in debt securities and the remainder was invested
in real estate and cash equivalents. The composition of our December
31, 2009 pension plan assets by fair value level were as follows:
|
Fair
Value Measurements at
December
31, 2009
|
||||||||||||
|
Total
|
Quoted
Prices in Active Markets (Level
1)
|
Significant
Other Observable Inputs (Level
2)
|
||||||||||
|
(In
millions)
|
||||||||||||
|
CMRT
|
$ | 31.0 | $ | - | $ | 31.0 | ||||||
|
Other
|
7.7 | 7.7 | - | |||||||||
|
Total
|
$ | 38.7 | $ | 7.7 | $ | 31.0 | ||||||
Postretirement
benefits other than pensions - In addition to providing pension benefits,
we also provide certain health care and life insurance benefits for eligible
retired employees. We use a December 31 measurement date for our OPEB
plans. Prior to 2007, this plan was closed to new participants, and
no additional benefits accrue to existing plan participants. The
majority of all retirees are required to contribute a portion of the cost of
their benefits and certain current and future retirees are eligible for reduced
health care benefits at age 65. We have no OPEB plan assets, rather,
we fund postretirement benefits as they are incurred, net of any contributions
by the retiree. At December 31, 2009, we currently expect to
contribute approximately $1.2 million to all OPEB plans during
2010. Benefit payments, net of estimated Medicare Part D subsidy of
approximately $175,000 per year, expected to be paid to OPEB plan participants
are summarized in the table below:
|
2010
|
$1.2
million
|
|
|
2011
|
1.1
million
|
|
|
2012
|
1.1
million
|
|
|
2013
|
1.0
million
|
|
|
2014
|
.9
million
|
|
|
Next 5 years
|
3.7
million
|
The
funded status of our OPEB plans is presented in the table below.
|
Years ended December 31,
|
||||||||
|
2008
|
2009
|
|||||||
|
(In
thousands)
|
||||||||
|
Actuarial
present value of accumulated
OPEB obligations:
|
||||||||
|
Balance at beginning of the year
|
$ | 11,242 | $ | 10,114 | ||||
|
Interest cost
|
655 | 551 | ||||||
|
Actuarial gain
|
(665 | ) | (437 | ) | ||||
|
Net
benefits paid
|
(1,118 | ) | (767 | ) | ||||
|
Obligations at end of the year
|
10,114 | 9,461 | ||||||
|
Fair
value of plan assets at end of year
|
- | - | ||||||
|
Funded status
|
$ | (10,114 | ) | $ | (9,461 | ) | ||
|
Accrued
OPEB costs recognized in the
Consolidated Balance Sheets:
|
||||||||
|
Current
|
$ | (1,231 | ) | $ | (1,154 | ) | ||
|
Noncurrent
|
(8,883 | ) | (8,307 | ) | ||||
|
Total
|
$ | (10,114 | ) | $ | (9,461 | ) | ||
|
Accumulated other comprehensive loss:
|
||||||||
|
Unrecognized net actuarial losses
|
$ | 1,288 | $ | 851 | ||||
|
Unrecognized prior service credit
|
(704 | ) | (525 | ) | ||||
|
Total
|
$ | 584 | $ | 326 | ||||
The
amounts shown in the table above for unrecognized actuarial losses and prior
service credit at December 31, 2008 and 2009 have not been recognized as
components of our periodic OPEB cost as of those dates. These amounts
will be recognized as components of our periodic OPEB cost in future
years. These amounts, net of deferred income taxes, are now
recognized in our accumulated other comprehensive income at December 31, 2008
and 2009. We expect to recognize approximately $179,000 of the prior
service credit as a component of our periodic OPEB cost in 2010.
The table
below details the changes in other comprehensive income during 2007, 2008 and
2009.
|
Years
ended December 31,
|
||||||||||||
|
2007
|
2008
|
2009
|
||||||||||
|
(In
thousands)
|
||||||||||||
|
Changes
in benefit obligations recognized in
other
comprehensive income:
|
||||||||||||
|
Net
actuarial gain arising during the year
|
$ | (836 | ) | $ | (665 | ) | $ | (437 | ) | |||
|
Plan
amendments
|
(425 | ) | - | - | ||||||||
|
Amortization
of unrecognized:
Prior
service credit
|
112 | 179 | 179 | |||||||||
|
Net
actuarial losses
|
(15 | ) | - | - | ||||||||
|
Total
|
$ | (1,164 | ) | $ | (486 | ) | $ | (258 | ) | |||
The
components of our periodic OPEB cost are presented in the table
below. The amounts shown below for the amortization of unrecognized
actuarial losses and prior service credit in 2008 and 2009, net of deferred
income taxes, were recognized as components of our accumulated other
comprehensive income at December 31, 2007, 2008 and 2009
respectively.
|
Years ended December 31,
|
||||||||||||
|
2007
|
2008
|
2009
|
||||||||||
|
(In
thousands)
|
||||||||||||
|
Net
periodic OPEB cost:
|
||||||||||||
|
Interest cost
|
$ | 726 | $ | 655 | $ | 551 | ||||||
|
Amortization of prior service credit
|
(112 | ) | (179 | ) | (179 | ) | ||||||
|
Recognized actuarial losses
|
15 | - | - | |||||||||
|
Total
|
$ | 629 | $ | 476 | $ | 372 | ||||||
A summary
of our key actuarial assumptions used to determine the net benefit obligation as
of December 31, 2008 and 2009 follows:
|
2008
|
2009
|
|
|
Health
care inflation:
|
||
|
Initial
rate
|
8.0%
|
7.5%
|
|
Ultimate
rate
|
5.5%
|
5.5%
|
|
Year
of ultimate rate achievement
|
2014
|
2014
|
|
Discount
rate
|
5.8%
|
4.9%
|
The
assumed health care cost trend rate has a significant effect on the amount we
report for OPEB cost. A one-percent change in assumed health care
trend rates would have the following effect:
|
1% Increase
|
1% Decrease
|
|
|
(In
thousands)
|
||
|
Effect
on net OPEB cost during 2009
|
$ 25
|
$(20)
|
|
Effect
at December 31, 2009 on
postretirement
obligation
|
475
|
(430)
|
The
weighted average discount rate used in determining the net periodic OPEB cost
for 2009 was 5.8% (the rate was 6.2% in 2008 and 5.8% in 2007). The
weighted average rate was determined using the projected benefit obligation as
of the beginning of each year.
Note
17 - Related party transactions:
We may be
deemed to be controlled by Harold C. Simmons. See
Note 1. We and other entities that may be deemed to be
controlled by or affiliated with Mr. Simmons sometimes engage in (a)
intercorporate transactions such as guarantees, management and expense sharing
arrangements, shared fee arrangements, joint ventures, partnerships, loans,
options, advances of funds on open account, and sales, leases and exchanges of
assets, including securities issued by both related and unrelated parties and
(b) common investment and acquisition strategies, business combinations,
reorganizations, recapitalizations, securities repurchases, and purchases and
sales (and other acquisitions and dispositions) of subsidiaries, divisions or
other business units, which transactions have involved both related and
unrelated parties and have included transactions which resulted in the
acquisition by one related party of a publicly-held noncontrolling equity
interest in another related party. We periodically consider, review
and evaluate, and understand that Contran and related entities consider, review
and evaluate such transactions. Depending upon the business, tax and
other objectives then relevant, it is possible that we might be a party to one
or more such transactions in the future.
Receivables
from and payables to affiliates are summarized in the table below:
|
December 31,
|
||||||||
|
2008
|
2009
|
|||||||
|
(In
thousands)
|
||||||||
|
Current
receivables from affiliates:
|
||||||||
|
Income
taxes receivable from Valhi
|
$ | 150 | $ | 2,880 | ||||
|
Note
receivable from Valhi
|
3,000 | - | ||||||
|
Valhi
– trade items
|
- | 8 | ||||||
|
Total
|
$ | 3,150 | $ | 2,888 | ||||
|
Current
payables to affiliates:
|
||||||||
|
Income
taxes payable to Valhi
|
$ | 919 | $ | - | ||||
|
Note
payable TIMET
|
1,000 | - | ||||||
|
Accrued
interest payable to TIMET
|
528 | - | ||||||
|
Kronos
– trade items
|
256 | 112 | ||||||
|
Tremont
– trade items
|
436 | 471 | ||||||
|
Total
|
$ | 3,139 | $ | 583 | ||||
|
December 31,
|
||||||||
|
2008
|
2009
|
|||||||
|
(In
thousands)
|
||||||||
|
Noncurrent
payable to affiliate:
|
||||||||
|
Note
payable to TIMET
|
$ | 42,980 | $ | 42,230 | ||||
|
Accrued
interest payable to TIMET
|
- | 310 | ||||||
| 42,980 | 42,540 | |||||||
|
Less
current maturities
|
1,000 | - | ||||||
|
Total
note payable and interest due to TIMET
|
$ | 41,980 | $ | 42,540 | ||||
In 2007,
CompX purchased or cancelled a net 2.7 million shares of its Class A common
stock from TIMET. CompX purchased or cancelled these shares for
$19.50 per share, or aggregate consideration of $52.6 million, which was paid in
the form of a promissory note. The price per share was determined
based on CompX’s open market repurchases of its Class A common stock around the
time the repurchase and/or cancellation from TIMET was approved. The
promissory note, as amended, bears interest at LIBOR plus 1% (1.25% at December
31, 2009) and provides for quarterly principal repayments of $250,000 commencing
in March 2011, with the balance due at maturity in September
2014. Prior to September 2009, we made required quarterly interest
payments and made quarterly principal repayments of $250,000 commencing in
September 2008. We could also make principal prepayments at any time,
in any amount without penalty, including $2.6 million paid in the fourth quarter
of 2007 and $7.0 million paid during 2008. The promissory note is
subordinated to CompX’s U.S. revolving bank credit agreement, and no further
principal or interest payments are due until March 2011. See Note
12. We may make additional prepayments on or after March 31, 2011,
subject to meeting certain conditions specified in the revolving bank credit
agreement. At December 31, 2009, the principal amount outstanding
under the promissory note was approximately $42.2 million and the amount of
related accrued and unpaid interest was approximately
$311,000. Interest expense on the note payable to TIMET was
approximately $.6 million, $2.2 million and $.8 million in 2007, 2008 and 2009,
respectively. The scheduled repayments of the promissory note are
shown in the table below.
|
Years ending December 31,
|
Amount
|
|
(In
thousands)
|
|
|
2010
|
$ -
|
|
2011
|
1,000
|
|
2012
|
1,000
|
|
2013
|
1,000
|
|
2014
|
39,230
|
|
Total
|
$42,230
|
From time
to time, we will have loans and advances outstanding between us and various
related parties, pursuant to term and demand notes. We generally
enter into these loans and advances for cash management
purposes. When we loan funds to related parties, we are generally
able to earn a higher rate of return on the loan than the lender would earn if
the funds were invested in other instruments. While certain of such
loans may be of a lesser credit quality than cash equivalent instruments
otherwise available to us, we believe that we have evaluated the credit risks
involved and reflected those credit risks in the terms of the applicable
loans. When we borrow from related parties, we are generally able to
pay a lower rate of interest than we would pay if we borrowed from unrelated
parties.
In 2008
the independent members of our Board of Directors and the independent members of
the Board of Directors of Kronos and Valhi approved the terms for us to lend up
to $40 million to each of Kronos and Valhi through December 31, 2009. Our
loans to Kronos and Valhi under each of the revolving notes were unsecured, bore
interest at the prime rate minus 1.5% and were due no later than December 31,
2009. At December 31, 2008, we had loans of $19.2 million
outstanding under the revolving note to Kronos and $3.0 million outstanding to
Valhi, which amounts were repaid to us during 2009. Loans to Kronos
are included in our equity investment in Kronos. See Note
7. Interest earned on our notes receivable from Kronos and Valhi
aggregated approximately $115,000 in 2008 and $270,000 in 2009.
Under the
terms of various intercorporate services agreements ("ISAs") we enter into with
Contran, employees of Contran will provide certain management, tax planning,
financial and administrative services to the other company on a fee
basis. Such charges are based upon estimates of the time devoted by
the Contran employees to our affairs and the compensation and other expenses
associated with those persons. Because of the large number of
companies affiliated with Contran, we believe we benefit from cost savings and
economies of scale gained by not having certain management, financial and
administrative staffs duplicated at each entity, thus allowing certain Contran
employees to provide services to multiple companies but only be compensated by
Contran. The net ISA fees charged to us by Contran, (including
amounts attributable to Kronos for all periods), approved by the independent
members of the applicable board of directors, aggregated approximately $14.3
million, $14.7 million, and $15.4 million in 2007, 2008 and 2009
respectively.
Tall
Pines Insurance Company (“TPIC”) and EWI RE, Inc. provide for or broker certain
insurance or reinsurance policies for Contran and certain of its subsidiaries
and affiliates, including us. Tall Pines is wholly-owned by a
subsidiary of Valhi and EWI is a wholly-owned subsidiary of
ours. Consistent with insurance industry practices, Tall Pines and
EWI receive commissions from insurance and reinsurance underwriters and/or
assess fees for the policies that they provide or broker. These
amounts principally included payments for insurance and reinsurance premiums
paid to third parties, but also included commissions paid to Tall Pines and
EWI. Tall Pines purchases reinsurance for substantially all of the
risks it underwrites. We expect that these relationships with Tall
Pines and EWI will continue in 2010.
Contran
and certain of its subsidiaries and affiliates, including us, purchase certain
of their insurance policies as a group, with the costs of the jointly-owned
policies being apportioned among the participating companies. With
respect to certain of such policies, it is possible that unusually large losses
incurred by one or more insured party during a given policy period could leave
the other participating companies without adequate coverage under that policy
for the balance of the policy period. As a result, Contran and
certain of its subsidiaries and affiliates, including us, have entered into a
loss sharing agreement under which any uninsured loss is shared by those
entities who have submitted claims under the relevant policy. We
believe the benefits in the form of reduced premiums and broader coverage
associated with the group coverage for such policies justifies the risk
associated with the potential for any uninsured loss.
Note
18 – Other operating income (expense):
Insurance
recoveries in 2007, 2008 and 2009 relate to amounts we received from certain of
our former insurance carriers, and relate principally to the recovery of prior
lead pigment and asbestos litigation defense costs incurred by us. We
have agreements with two former insurance carriers pursuant to which the
carriers reimburse us for a portion of our future lead pigment litigation
defense costs, and one such carrier reimburses us for a portion of our future
asbestos litigation defense costs. We are not able to determine how
much we will ultimately recover from these carriers for defense costs incurred
by us because of certain issues that arise regarding which defense costs qualify
for reimbursement.
While we
continue to seek additional insurance recoveries for lead pigment and asbestos
litigation matters, we do not know the extent to which we will be successful in
obtaining additional reimbursement for either defense costs or
indemnity. Any additional insurance recoveries would be recognized
when the receipt is probable and the amount is determinable.
The
litigation settlement gain is discussed in Note 19.
Note
19 - Commitments and contingencies:
Lead pigment
litigation
Our
former operations included the manufacture of lead pigments for use in paint and
lead-based paint. We, other former manufacturers of lead pigments for
use in paint and lead-based paint (together, the “former pigment
manufacturers”), and the Lead Industries Association (“LIA”), which discontinued
business operations in 2002, have been named as defendants in various legal
proceedings seeking damages for personal injury, property damage and
governmental expenditures allegedly caused by the use of lead-based
paints. Certain of these actions have been filed by or on behalf of
states, counties, cities or their public housing authorities and school
districts, and certain others have been asserted as class
actions. These lawsuits seek recovery under a variety of theories,
including public and private nuisance, negligent product design, negligent
failure to warn, strict liability, breach of warranty, conspiracy/concert of
action, aiding and abetting, enterprise liability, market share or risk
contribution liability, intentional tort, fraud and misrepresentation,
violations of state consumer protection statutes, supplier negligence and
similar claims.
The
plaintiffs in these actions generally seek to impose on the defendants
responsibility for lead paint abatement and health concerns associated with the
use of lead-based paints, including damages for personal injury, contribution
and/or indemnification for medical expenses, medical monitoring expenses and
costs for educational programs. To the extent the plaintiffs seek
compensatory or punitive damages in these actions, such damages are generally
unspecified. In some cases, the damages are unspecified pursuant to
the requirements of applicable state law. A number of cases are
inactive or have been dismissed or withdrawn. Most of the remaining
cases are in various pre-trial stages. Some are on appeal following
dismissal or summary judgment rulings in favor of either the defendants or the
plaintiffs. In addition, various other cases (in which we are not a
defendant) are pending that seek recovery for injury allegedly caused by lead
pigment and lead-based paint. Although we are not a defendant in
these cases, the outcome of these cases may have an impact on cases that might
be filed against us in the future.
We
believe that these actions are without merit, and we intend to continue to deny
all allegations of wrongdoing and liability and to defend against all actions
vigorously. We do not believe it is probable that we have incurred
any liability with respect to all of the lead pigment litigation cases to which
we are a party, and liability to us that may result, if any, in this regard
cannot be reasonably estimated, because:
|
·
|
we
have never settled any of these
cases,
|
|
·
|
no
final, non-appealable adverse verdicts have ever been entered against us,
and
|
|
·
|
we
have never ultimately been found liable with respect to any such
litigation matters.
|
Accordingly,
we have not accrued any amounts for any of the pending lead pigment and
lead-based paint litigation cases. New cases may continue to be filed
against us. We cannot assure you that we will not incur liability in
the future in respect of any of the pending or possible litigation in view of
the inherent uncertainties involved in court and jury rulings. The
resolution of any of these cases could result in recognition of a loss
contingency accrual that could have a material adverse impact on our net income
for the interim or annual period during which such liability is recognized and a
material adverse impact on our consolidated financial condition and
liquidity.
Environmental
matters and litigation
Our
operations are governed by various environmental laws and
regulations. Certain of our businesses are and have been engaged in
the handling, manufacture or use of substances or compounds that may be
considered toxic or hazardous within the meaning of applicable environmental
laws and regulations. As with other companies engaged in similar
businesses, certain of our past and current operations and products have the
potential to cause environmental or other damage. We have implemented
and continue to implement various policies and programs in an effort to minimize
these risks. Our policy is to maintain compliance with applicable
environmental laws and regulations at all of our plants and to strive to improve
environmental performance. From time to time, we may be subject to
environmental regulatory enforcement under U.S. and non-U.S. statutes, the
resolution of which typically involves the establishment of compliance
programs. It is possible that future developments, such as stricter
requirements of environmental laws and enforcement policies, could adversely
affect our production, handling, use, storage, transportation, sale or disposal
of such substances. We believe that all of our facilities are in
substantial compliance with applicable environmental laws.
Certain
properties and facilities used in our former operations, including divested
primary and secondary lead smelters and former mining locations, are the subject
of civil litigation, administrative proceedings or investigations arising under
federal and state environmental laws. Additionally, in connection
with past operating practices, we are currently involved as a defendant,
potentially responsible party (“PRP”) or both, pursuant to the Comprehensive
Environmental Response, Compensation and Liability Act, as amended by the
Superfund Amendments and Reauthorization Act (“CERCLA”), and similar state laws
in various governmental and private actions associated with waste disposal
sites, mining locations, and facilities we or our predecessors currently or
previously owned, operated or were used by us or our subsidiaries, or their
predecessors, certain of which are on the United States Environmental Protection
Agency’s (“EPA”) Superfund National Priorities List or similar state
lists. These proceedings seek cleanup costs, damages for personal
injury or property damage and/or damages for injury to natural
resources. Certain of these proceedings involve claims for
substantial amounts. Although we may be jointly and severally liable
for these costs, in most cases we are only one of a number of PRPs who may also
be jointly and severally liable, and among whom costs may be shared or
allocated. In addition, we are also a party to a number of personal
injury lawsuits filed in various jurisdictions alleging claims related to
environmental conditions alleged to have resulted from our
operations.
Environmental
obligations are difficult to assess and estimate for numerous reasons including
the:
|
·
|
complexity
and differing interpretations of governmental
regulations,
|
|
·
|
number
of PRPs and their ability or willingness to fund such allocation of
costs,
|
|
·
|
financial
capabilities of the PRPs and the allocation of costs among
them,
|
|
·
|
solvency
of other PRPs,
|
|
·
|
multiplicity
of possible solutions,
|
|
·
|
number
of years of investigatory, remedial and monitoring activity required
and
|
|
·
|
number
of years between former operations and notice of claims and lack of
information and documents about the former
operations.
|
In
addition, the imposition of more stringent standards or requirements under
environmental laws or regulations, new developments or changes regarding site
cleanup costs or allocation of costs among PRPs, solvency of other PRPs, the
results of future testing and analysis undertaken with respect to certain sites
or a determination that we are potentially responsible for the release of
hazardous substances at other sites, could cause our expenditures to exceed our
current estimates. Because we may be jointly and severally liable for
the total remediation cost at certain sites, the amount for which we are
ultimately liable may exceed our accruals due to, among other things, the
reallocation of costs among PRPs or the insolvency of one or more
PRPs. We cannot assure you that actual costs will not exceed accrued
amounts or the upper end of the range for sites for which estimates have been
made, and we cannot assure you that costs will not be incurred for sites where
no estimates presently can be made. Further, additional environmental
matters may arise in the future. If we were to incur any future
liability, this could have a material adverse effect on our consolidated
financial statements, results of operations and liquidity.
We record
liabilities related to environmental remediation obligations when estimated
future expenditures are probable and reasonably estimable. We adjust
our environmental accruals as further information becomes available to us or as
circumstances change. We generally do not discount estimated future
expenditures to their present value due to the uncertainty of the timing of the
pay out. We recognize recoveries of remediation costs from other
parties, if any, as assets when their receipt is deemed probable. At
December 31, 2009, we have not recognized any receivables for
recoveries.
We do not
know and cannot estimate the exact time frame over which we will make payments
for our accrued environmental costs. The timing of payments depends
upon a number of factors including the timing of the actual remediation process;
which in turn depends on factors outside of our control. At each
balance sheet date, we estimate the amount of our accrued environmental costs
which we expect to pay within the next twelve months, and we classify this
estimate as a current liability. We classify the remaining accrued
environmental costs as a noncurrent liability.
The table
below presents a summary of the activity in our accrued environmental costs
during the past three years. The amount charged to expense is
included in corporate expense on our consolidated statements of
income.
|
Years ended December 31,
|
||||||||||||
|
2007
|
2008
|
2009
|
||||||||||
|
(In
thousands)
|
||||||||||||
|
Balance
at the beginning of the year
|
$ | 50,713 | $ | 50,330 | $ | 50,054 | ||||||
|
Additions
charged to expense, net
|
4,368 | 6,779 | 3,725 | |||||||||
|
Payments,
net
|
(4,751 | ) | (7,055 | ) | (7,933 | ) | ||||||
|
Balance
at the end of the year
|
$ | 50,330 | $ | 50,054 | $ | 45,846 | ||||||
|
Amounts
recognized in the balance sheet:
|
||||||||||||
|
Current liability
|
$ | 11,863 | $ | 9,834 | $ | 8,328 | ||||||
|
Noncurrent liability
|
38,467 | 40,220 | 37,518 | |||||||||
|
Total
|
$ | 50,330 | $ | 50,054 | $ | 45,846 | ||||||
On a
quarterly basis, we evaluate the potential range of our liability at sites where
we have been named as a PRP or defendant, including sites for which our
wholly-owned environmental management subsidiary, EMS, has contractually assumed
our obligations. At December 31, 2009, we had accrued approximately
$46 million, related to approximately 50 sites, which are environmental matters
that we believe are at the present time and/or in their current phase reasonably
estimable. The upper end of the range of reasonably possible costs to
us for sites for which we believe it is possible to estimate costs is
approximately $81 million, including the amount currently accrued. We
have not discounted these estimates to present value.
We
believe that it is not possible to estimate the range of costs for certain
sites. At December 31, 2009, there were approximately 5 sites for which we are
not currently able to estimate a range of costs. For these sites,
generally the investigation is in the early stages, and we are unable to
determine whether or not we actually had any association with the site, the
nature of our responsibility, if any, for the contamination at the site and the
extent of contamination at and cost to remediate the site. The timing
and availability of information on these sites is dependent on events outside of
our control, such as when the party alleging liability provides information to
us. At certain of these previously inactive sites, we have received
general and special notices of liability from the EPA and/or state agencies
alleging that we, sometimes with other PRPs, are liable for past and future
costs of remediating environmental contamination allegedly caused by former
operations. These notifications may assert that we, along with any
other alleged PRPs, are liable for past and/or future clean-up costs that could
be material to us if we are ultimately found liable.
In 2005,
certain real property we owned that is subject to environmental remediation was
taken from us in a condemnation proceeding by a governmental authority in New
Jersey. The condemnation proceeds, the adequacy of which we disputed,
were placed into escrow with a court in New Jersey. Because the funds
were in escrow with the court and were beyond our control, we never gave
recognition to such condemnation proceeds for financial reporting
purposes. In October 2008 we reached a definitive settlement
agreement with such governmental authority and a real estate developer, among
others, pursuant to which, among other things, we would receive certain
agreed-upon amounts in satisfaction of our claim to just compensation for the
taking of our property in the condemnation proceeding at three separate
closings, and we would be indemnified against certain environmental liabilities
related to such property, in exchange for the release of our equitable lien on
specified portions of the property at each closing. At the initial
October 2008 closing, we received aggregate proceeds of $54.6 million,
comprising $39.6 million in cash plus a promissory note in the amount of $15.0
million in exchange for the release of our equitable lien on a portion of the
property. In April 2009, the second closing was completed, pursuant
to which we received an aggregate of $11.8 million in cash. The
agreement calls for one final closing that is scheduled to occur in October 2010
and that is subject to, among other things, our receipt of an additional
payment.
For
financial reporting purposes, we have accounted for the aggregate consideration
received in the 2008 and 2009 closings of the reinstated settlement agreement by
the full accrual method of accounting for real estate sales (since the
settlement agreement arose out of a dispute concerning the adequacy of the
condemnation proceeds for our former real property in New Jersey). Under
this method, we recognized a pre-tax gain of $48.8 million in the fourth quarter
of 2008 and a pre-tax gain of $11.3 million in the second quarter of 2009, in
both cases based on the difference between the aggregate consideration received
and the carrying value of the portion of the property for which we have released
our equitable lien in the closings ($5.5 million and $487,000,
respectively). Similarly, the cash consideration we received in the
closings is reflected as an investing activity in our Condensed Consolidated
Statement of Cash Flows. Our carrying value of the remaining portion
of this property, attributable to the portion of the property for which our
equitable lien would be released in the third closing, was approximately
$500,000 at December 31, 2009.
Insurance
coverage claims
We are
involved in certain legal proceedings with a number of our former insurance
carriers regarding the nature and extent of the carriers’ obligations to us
under insurance policies with respect to certain lead pigment and asbestos
lawsuits. The issue of whether insurance coverage for defense costs
or indemnity or both will be found to exist for our lead pigment and asbestos
litigation depends upon a variety of factors, and we cannot assure you that such
insurance coverage will be available.
We have agreements with two former
insurance carriers pursuant to which the carriers reimburse us for a portion of
our future lead pigment litigation defense costs, and one such carrier
reimburses us for a portion of our future asbestos litigation defense
costs. We are not able to determine how much we will ultimately
recover from these carriers for defense costs incurred by us because of certain
issues that arise regarding which defense costs qualify for
reimbursement. While we continue to seek additional insurance
recoveries, we do not know if we will be successful in obtaining reimbursement
for either defense costs or indemnity. Accordingly, these insurance
recoveries are recognized when the receipt is probable and the amount is
determinable.
In
October 2005 we were served with a complaint in OneBeacon American Insurance Company
v. NL Industries, Inc., et al. (Supreme Court of the State of New York,
County of New York, Index No. 603429-05). The plaintiff, a former
insurance carrier, seeks a declaratory judgment of its obligations to us under
insurance policies issued to us by the plaintiff’s predecessor with respect to
certain lead pigment lawsuits filed against us. In March 2006, the
trial court denied our motion to dismiss. In April 2006, we filed a
notice of appeal of the trial court’s ruling, and in September 2007, the Supreme
Court – Appellate Division (First Department) reversed and ordered that the
OneBeacon complaint be dismissed. The Appellate Division did not
dismiss the counterclaims and cross claims.
In
February 2006, we were served with a complaint in Certain Underwriters at Lloyds,
London v. Millennium Holdings LLC et al. (Supreme Court of the State of
New York, County of New York, Index No. 06/60026). The plaintiff, a
former insurance carrier of ours, seeks a declaratory judgment of its
obligations to us under insurance policies issued to us by the plaintiff with
respect to certain lead pigment lawsuits.
In
December 2008, we reached partial settlements with the plaintiffs in the two
cases discussed above, pursuant to which the two former insurance carriers
agreed to pay us an aggregate of approximately $7.2 million in settlement of
certain counter-claims related to past lead pigment and asbestos defense
costs. We received these funds from the carriers in January
2009. In connection with these partial settlements, we agreed to
dismiss the case captioned NL
Industries, Inc. v. OneBeacon America Insurance Company, et al. (District
Court for Dallas County, Texas, Case No. 05-11347), and in January 2009 we filed
a notice of non-suit without prejudice in that matter. The remaining
claims in New York state cases are proceeding in the trial court.
Other
litigation
In June
2005, we received notices from the three minority shareholders of EMS indicating
they were each exercising their right, which became exercisable on June 1, 2005,
to require EMS to purchase their preferred shares in EMS as of June 30, 2005 for
a formula-determined amount as provided in EMS’ certificate of
incorporation. In accordance with the certificate of incorporation, we
made a determination in good faith of the amount payable to the three former
minority shareholders to purchase their shares of EMS stock, which amount may be
subject to review by a third party. In June 2005, we set aside funds as
payment for the shares of EMS, but as of December 31, 2009 the former minority
shareholders had not tendered their shares. Therefore, the liability owed
to these former minority shareholders has not been extinguished for financial
reporting purposes as of December 31, 2009 and remains recognized as a current
liability in our Consolidated Financial Statements. We have similarly
classified the funds which have been set aside in restricted cash and cash
equivalents.
In May
2007, we filed a complaint in Texas state court (Contran Corporation, et al. v. Terry
S. Casey, et al., Case No. 07-04855, 192nd Judicial District Court, Dallas
County, Texas) in which we alleged negligence,
conversion, and breach of contract against a former service provider of ours who
was also a former minority shareholder of EMS. In February 2008, two other
former minority shareholders of EMS filed counterclaims, a third-party petition
and petition in intervention, seeking damages related to their former ownership
in EMS. Our original claims were removed to arbitration, and the case is
now captioned Industrial
Recovery Capital Holdings Co. et al. v. Harold C. Simmons et al., Case No. 08-02589, District Court,
Dallas County, Texas. The defendants are us, Contran and certain of
our and EMS’s current or former officers or directors. The plaintiffs
claim that, in preparing the valuation of the former minority shareholders’
preferred shares for purchase by EMS, defendants committed breach of fiduciary
duty, civil conspiracy, and breach of contract. We and EMS filed
counterclaims against the former minority shareholders relating to the formation
and management of EMS. The case was tried in July 2009, and the jury
returned a verdict in favor of the plaintiffs. The jury awarded $28.2
million in breach of contract damages and $33.7 million in breach of fiduciary
duty damages. In addition, the jury awarded an aggregate of $145
million in punitive damages associated with the finding of breach of fiduciary
duty. The plaintiffs will be required to elect breach of contract or
breach of fiduciary duty damages, and the punitive damages would be awarded only
if the fiduciary duty claim and the punitive damage award are upheld on
appeal. Following the jury verdict, we filed a motion to disregard
the jury’s findings and for judgment notwithstanding the verdict. In
October 2009, the judge denied our motions and entered a final judgment.
In November 2009, we filed a motion for new trial and, alternatively, for
reduction of the damages awarded against us. In December 2009, the
punitive damages were reduced from $145 million to $67.4 million. In
January 2010, we filed a notice of appeal with the Texas State Court of Appeals
(5th
District). We do not believe that the facts and evidence support the
judgment and damages awarded. We continue to believe that the claims of
the plaintiffs are without merit and are subject to certain defenses and
counterclaims. Moreover, we believe that the plaintiffs’ claims are
required to be resolved by independent third-parties pursuant to the applicable
governing documents, whose findings would be binding on all parties. We
intend to continue to vigorously defend the matter. We expect that the
judgment will be set aside. At December 31, 2009, we believe that we have
adequately accrued for the amount we will ultimately be required to pay to the
former minority shareholders in this matter, and our accrual in this regard is
included in other current accrued liabilities. See Note 10. Such
amount could be increased or decreased as further information becomes available
or circumstances change.
We have
been named as a defendant in various lawsuits in several jurisdictions, alleging
personal injuries as a result of occupational exposure primarily to products
manufactured by our former operations containing asbestos, silica and/or mixed
dust. During the first quarter of 2009, certain of these cases involving
multiple plaintiffs were separated into single-plaintiff cases. As a
result, the total number of outstanding cases
increased. Approximately 1,226 of these types of cases remain
pending, involving a total of approximately 2,800 plaintiffs. In addition,
the claims of approximately 7,500 plaintiffs have been administratively
dismissed or placed on the inactive docket in Ohio and Indiana state
courts. We do not expect these claims will be re-opened unless the
plaintiffs meet the courts’ medical criteria for asbestos-related
claims. We have not accrued any amounts for this litigation because
of the uncertainty of liability and inability to reasonably estimate the
liability, if any. To date, we have not been adjudicated liable in any of
these matters. Based on information available to us,
including:
|
·
|
facts
concerning historical operations,
|
|
·
|
the
rate of new claims,
|
|
·
|
the
number of claims from which we have been dismissed
and
|
|
·
|
our
prior experience in the defense of these
matters,
|
we
believe that the range of reasonably possible outcomes of these matters will be
consistent with our historical costs (which are not
material). Furthermore, we do not expect any reasonably possible
outcome would involve amounts material to our consolidated financial position,
results of operations or liquidity. We have sought and will continue
to vigorously seek, dismissal and/or a finding of no liability from each
claim. In addition, from time to time, we have received notices regarding
asbestos or silica claims purporting to be brought against former subsidiaries,
including notices provided to insurers with which we have entered into
settlements extinguishing certain insurance policies. These insurers may
seek indemnification from us.
CompX
On
February 10, 2009, a complaint (Doc. No. DN2650) was filed with the U.S.
International Trade Commission (“ITC”) by Humanscale Corporation requesting that
the ITC commence an investigation pursuant to Section 337 of the Tariff Act of
1930 to evaluate allegations concerning the unlawful importation of certain
adjustable keyboard related products into the U.S. by CompX’s Canadian
subsidiary. The products are alleged to infringe certain claims under
U.S. patent No. 5,292,097C1 (the “‘097 Patent”) held by
Humanscale. The complaint seeks as relief the barring of future
imports of the products into the U.S. until the expiration of the related patent
in March 2011. In March 2009 the ITC agreed to undertake the
investigation and set a procedural schedule with a hearing set for December 12,
2009 and a target date of June 2010 for its findings. The hearing was
completed on December 4, 2009. On February 23, 2010, the administrative
law judge overseeing the investigation issued his opinion, finding that a
significant independent claim within the ‘097 Patent was determined to be
“obvious” under 35 U.S.C. Section 102, which generally results in the lack of
enforceability of such a claim against infringement. The judge further
found that 38 of the 40 keyboard support products in question that CompX imports
into the United States from its Canadian subsidiary did not infringe on the ‘097
Patent. The sales of the remaining two products found to be
infringing are not significant. CompX denies any infringement alleged in
the investigation and plans to defend itself with respect to any claims of
infringement by Humanscale through the Presidential review process of the
ruling, which is expected to conclude in August 2010.
On
February 13, 2009, a Complaint for patent infringement was filed in the United
States District Court, Eastern District of Virginia, Alexandria Division (CV No.
3:09CV86-JRS) by Humanscale Corporation against CompX International Inc. and
CompX Waterloo. CompX answered the allegations of infringement of
Humanscale’s ‘097 Patent set forth in the complaint on March 30,
2009. CompX filed for a stay in the U.S. District Court Action
pending the completion of the related case before the ITC with respect to
Humanscale’s claims (as a matter of legislated right because of the ITC action)
while at the same time counterclaiming patent infringement claims against
Humanscale for infringement of CompX’s keyboard support arm patents (U.S. No.
5,037,054 and U.S. No. 5,257,767) by Humanscale’s models 2G, 4G and 5G support
arms. Humanscale has filed a response not opposing CompX’s motion to
stay their patent infringement claims but opposing CompX’s patent infringement
counterclaims against them and asking the Court to stay all claims in the matter
until the ITC investigation is concluded. CompX filed its response to
their motions. At a hearing before the court held on May 19, 2009,
CompX’s motion to stay the Humanscale claim of patent infringement was granted
and Humanscale’s motion to stay CompX’s counterclaims was denied. A
jury trial was completed on February 25, 2010 relating to CompX’s counter
claims, with the jury finding that Humanscale infringed on CompX’s patents and
awarded damages to CompX in excess of $19 million for past
royalties. The verdict is subject to appeal. Due to the
uncertain nature of the ongoing legal proceedings we have not accrued a
receivable for the amount of the award.
We
currently believe that the disposition of all of these various other claims and
disputes, individually or in the aggregate, should not have a material adverse
effect on our consolidated financial position, results of operations or
liquidity beyond the accruals already provided.
Concentrations
of credit risk
Component
products are sold primarily in North America to original equipment
manufacturers. The ten largest customers accounted for approximately
31% of sales in 2007, 35% in 2008 and 39% in 2009. No customer
accounted for sales of 10% or more in 2007, 2008 or 2009.
At
December 31, 2009, consolidated cash, cash equivalents, restricted cash and
marketable securities includes $11.8 million invested in U.S. Treasury and
government agency securities purchased under short-term agreements to resell
(2008 - $11.9 million), all of which is held in trust by a single U.S.
bank.
Other
Rent
expense, principally for CompX operating facilities and equipment was $429,000
in 2007, $648,000 in 2008 and $658,000 in 2009. At December 31, 2009,
future minimum rentals under noncancellable operating leases are
approximately:
|
Years ending December 31,
|
Amount
|
|
(In
thousands)
|
|
|
2010
|
$ 579
|
|
2011
|
512
|
|
2012
|
208
|
|
Total
|
$ 1,299
|
Income
taxes
We and
Valhi have agreed to a policy providing for the allocation of tax liabilities
and tax payments as described in Note 1. Under applicable law, we, as
well as every other member of the Contran Tax Group, are each jointly and
severally liable for the aggregate federal income tax liability of Contran and
the other companies included in the Contran Tax Group for all periods in which
we are included in the Contran Tax Group. Valhi has agreed, however,
to indemnify us for any liability for income taxes of the Contran Tax Group in
excess of our tax liability previously computed and paid by NL in accordance
with the tax allocation policy. In this regard, in the event that all
or a portion of the $10.8 million income tax liability discussed in Note 15
related to the shares of TIMET transferred by Valhi to us in 2007 becomes
payable by Contran to the applicable tax authority, we and every other member of
the Contran Tax Group would be jointly and severally liable for such income tax
liabilities in the event Contran did not pay such tax to the applicable tax
authority. However, in this event, we would also have the benefit of
Valhi’s indemnification, as described above.
Note
20 - Financial instruments:
We
adopted the fair value framework of ASC Topic 820 effective January 1, 2008
for financial assets and liabilities measured on a recurring basis. The
statement requires fair value measurements to be classified and disclosed in one
of the following three categories, see Note 1.
The
following table summarizes the valuation of our short-term investments and
marketable securities by the ASC Topic 820 categories as of December 31, 2008
and 2009:
|
Fair
Value Measurements
|
||||||
|
Total
|
Quoted
Prices in Active Markets (Level
1)
|
Significant
Other Observable Inputs (Level
2)
|
||||
|
(in
millions)
|
||||||
|
December
31, 2008:
|
||||||
|
Marketable
securities:
|
||||||
|
Current
|
$ 5.5
|
$ -
|
$ 5.5
|
|||
|
Noncurrent
|
64.0
|
64.0
|
-
|
|||
|
December
31, 2009:
|
||||||
|
Marketable
securities:
|
||||||
|
Current
|
$ 5.2
|
$ -
|
$ 5.2
|
|||
|
Noncurrent
|
85.1
|
85.1
|
-
|
|||
See Note
4 for information on how we determine fair value of our marketable
securities.
Certain
of our sales generated by CompX’s non-U.S. operations are denominated in U.S.
dollars. CompX periodically uses currency forward contracts to manage
a portion of currency exchange rate market risk associated with receivables, or
similar exchange rate risk associated with future sales, denominated in a
currency other than the holder's functional currency. CompX has not
entered into these contracts for trading or speculative purposes in the past,
nor does it anticipate entering into such contracts for trading or speculative
purposes in the future. Most of the currency forward contracts meet
the criteria for hedge accounting under GAAP and are designated as cash flow
hedges. For these currency forward contracts, gains and losses
representing the effective portion of our hedges are deferred as a component of
accumulated other comprehensive income, and are subsequently recognized in
earnings at the time the hedged item affects earnings. Occasionally
CompX enters into currency forward contracts which do not meet the criteria for
hedge accounting. For these contracts, we mark-to-market the
estimated fair value of the contracts at each balance sheet date based on quoted
market prices for the forward contracts, with any resulting gain or loss
recognized in income as part of net currency transactions. The quoted
market prices for the forward contracts are a Level 1 input as defined by ASC
820-10-35. We had no
currency forward contracts outstanding at December 31, 2009. At
December 31, 2008, we held a series of contracts to exchange an aggregate of
U.S. $7.5 million for an equivalent value of Canadian dollars at exchange rates
ranging from Cdn. $1.25 to $1.26 per U.S. dollar. These contracts
qualified for hedge accounting and matured through June 2009. The
exchange rate was $1.22 per U.S. dollar at December 31, 2008. The
estimated fair value of the contracts was not material at December 31,
2008.
The
following table presents the financial instruments that are not carried at fair
value but which require fair value disclosure as December 31, 2008 and
2009:
|
December 31, 2008
|
December 31, 2009
|
|||
|
Carrying
Amount
|
Fair
Value
|
Carrying
Amount
|
Fair
Value
|
|
|
(in
millions)
|
||||
|
Cash
and cash equivalents, current restricted cash equivalents and current
marketable securities
|
$ 29.4
|
$ 29.4
|
$ 36.9
|
$ 36.9
|
|
Promissory
note receivable
|
15.0
|
15.0
|
15.0
|
15.0
|
|
Note
payable to affiliate
|
43.0
|
43.0
|
42.2
|
42.2
|
|
Noncontrolling
interest in CompX common stock
|
11.9
|
8.5
|
11.1
|
12.2
|
|
NL
stockholders’ equity
|
188.4
|
651.2
|
174.6
|
337.4
|
The fair
value of our noncurrent marketable equity securities, restricted marketable debt
securities, noncontrolling interest in CompX and NL stockholder’s equity are
based upon quoted market prices at each balance sheet date, which represent
Level 1 inputs. The fair value of our promissory note receivable and
our variable interest rate debt is deemed to approximate book
value. Due to their near-term maturities, the carrying amounts of
accounts receivable and accounts payable are considered equivalent to fair
value.
Note
21 – Recent accounting pronouncements:
Noncontrolling
Interest – In
December 2007, the Financial Accounting Standards Board (“FASB”) issued
Statement of Financial Accounting Standard (“SFAS”) No. 160, Noncontrolling Interests in
Consolidated Financial Statements, an Amendment of ARB No. 51, which is
now included with ASC Topic 810 Consolidation. SFAS No. 160
establishes a single method of accounting for changes in a parent’s ownership
interest in a subsidiary that do not result in deconsolidation. On a
prospective basis, any changes in ownership are accounted for as equity
transactions with no gain or loss recognized on the transactions unless there is
a change in control; under previous GAAP such changes in ownership would
generally result either in the recognition of additional goodwill (for an
increase in ownership) or a gain or loss included in the determination of net
income (for a decrease in ownership). The statement standardizes the
presentation of noncontrolling interest as a component of equity on the balance
sheet and on a net income basis in the statement of operations. This
Statement also requires expanded disclosures in the consolidated financial
statements that clearly identify and distinguish between the interests of the
parent and the interests of the noncontrolling owners of a
subsidiary. Upon adoption, we reclassified our consolidated balance
sheet and statement of operations to conform to the new presentation
requirements for noncontrolling interest for all periods presented.
Benefit Plan
Asset Disclosures
- During the fourth quarter of 2008, the FASB issued FSP SFAS 132 (R)-1,
Employers’ Disclosures about
Postretirement Benefit Plan Assets, which is now included
with ASC Topic 715 Defined
Benefit Plans. This statement amends SFAS No. 87, 88 and 106
to require expanded disclosures about employers’ pension plan
assets. FSP 132 (R)-1 became effective for us beginning with this
annual report, and we have provided the expanded disclosures about our pension
plan assets in Note 16.
Derivative
Disclosures – In March 2008 the FASB issued SFAS No. 161, Disclosures about Derivative
Instruments and Hedging Activities, an Amendment of FASB Statement No. 133,
which is now included with ASC Topic 815 Derivatives and
Hedging. SFAS No. 161 changes the disclosure requirements for
derivative instruments and hedging activities to provide enhanced disclosures
about how and why we use derivative instruments, how derivative instruments and
related hedged items are accounted for under SFAS No. 133 and how derivative
instruments and related hedged items affect our financial position and
performance and cash flows. This statement became effective for us in the
first quarter of 2009. We periodically use currency forward contracts to
manage a portion of our currency exchange rate market risk associated with trade
receivables or future sales. Because our prior disclosures regarding these
forward contracts substantially met all of the applicable disclosure
requirements of the new standard, its effectiveness did not have a significant
effect on our Consolidated Financial Statements.
Other-Than-Temporary
Impairments - In
April 2009 the FASB issued FASB Staff Position (“FSP”) FAS 115-2 and FAS 124-2,
Recognition and Presentation
of Other-Than-Temporary Impairments, which is now included with ASC
Topic 320 Debt and Equity
Securities. The FSP amends existing guidance for the
recognition and measurement of other-than-temporary impairments for debt and
equity securities classified as available-for-sale and held-to-maturity, and
expands the disclosure requirements for interim and annual periods for
available-for-sale and held-to-maturity debt securities, including information
about investments in an unrealized loss position for which an
other-than-temporary impairment has or has not been recognized. This
FSP became effective for us in the second quarter of 2009 and its adoption did
not have a material effect on our Consolidated Financial
Statements.
Fair Value
Disclosures -
Also in April 2009 the FASB issued FSP FAS 107-1 and APB 28-1, Interim Disclosures about Fair Value
of Financial Instruments, which is now included with ASC Topic 825 Financial
Instruments. This FSP requires us to disclose the fair value
of all financial instruments for which it is practicable to estimate the value,
whether recognized or not recognized in the statement of financial position, as
required by SFAS No. 107, Disclosures about Fair Value of Financial
Instruments for interim as well as annual periods. Prior to
the adoption of the FSP we were only required to disclose this information
annually. This FSP became effective for us in the second quarter of
2009. See Note 20.
Subsequent
Events – In May 2009, the FASB issued SFAS No. 165, Subsequent Events, which is
now included with ASC Topic 855 Subsequent
Events. SFAS No. 165 establishes general standards of
accounting for and disclosure of events that occur after the balance sheet date
but before financial statements are issued. This statement clarifies existing
guidance on subsequent events including:
|
·
|
the
requirement that a public entity evaluate subsequent events through the
issue date of the financial
statements,
|
|
·
|
the
determination of when the effects of subsequent events should be
recognized in the financial statements
and
|
|
·
|
the
disclosures regarding all subsequent
events.
|
SFAS No.
165 became effective for us in the second quarter of 2009 and its adoption did
not have a material effect on our Consolidated Financial
Statements.
Uncertain Tax
Positions -
In the second quarter of 2006 the FASB issued FIN 48, Accounting for Uncertain Tax
Positions, which
is now included with ASC Topic 740 Income Taxes, which we
adopted on January 1, 2007. FIN 48 clarifies when and how much of a
benefit we can recognize in our consolidated financial statements for certain
positions taken in our income tax returns and enhances the disclosure
requirements for our income tax policies and reserves. Among other things,
FIN 48 prohibits us from recognizing the benefits of a tax position unless we
believe it is more-likely-than-not our position will prevail with the applicable
tax authorities and limits the amount of the benefit to the largest amount for
which we believe the likelihood of realization is greater than 50%. FIN 48
also requires companies to accrue penalties and interest on the difference
between tax positions taken on their tax returns and the amount of benefit
recognized for financial reporting purposes under the new standard. We are
required to classify any future reserves for uncertain tax positions in a
separate current or noncurrent liability, depending on the nature of the tax
position.
Upon
adoption of FIN 48 on January 1, 2007, we decreased our existing reserve for
uncertain tax positions, which we previously classified as part of our deferred
income taxes, from $24.3 million to $23.9 million and accounted for such $.4
million decrease as an increase in retained earnings in accordance with the
transition provisions of the standard. Kronos also adopted FIN 48 as of
January 1, 2007. The amount of our pro-rata share of the impact to Kronos
from adopting FIN 48, net of our applicable deferred income taxes, resulted in a
$.5 million decrease in our retained earnings.
The
following table shows the changes in the amount of our uncertain tax positions
(exclusive of the effect of interest and penalties) during 2007, 2008 and
2009:
|
December 31,
|
||||||||||||
|
2007
|
2008
|
2009
|
||||||||||
|
(In
millions)
|
||||||||||||
|
Unrecognized
liabilities:
|
||||||||||||
|
Balance
at the beginning of the period
|
$ | 23.1 | $ | 21.1 | $ | 18.8 | ||||||
|
Tax
positions taken in prior periods:
|
||||||||||||
|
Gross
decreases
|
- | (.3 | ) | - | ||||||||
|
Settlements
with taxing authorities-cash paid
|
(.3 | ) | - | - | ||||||||
|
Lapse
of applicable statute of limitations
|
(1.7 | ) | (2.0 | ) | (1.8 | ) | ||||||
|
Balance
at the end of the period
|
$ | 21.1 | $ | 18.8 | $ | 17.0 | ||||||
If our
uncertain tax positions were recognized, a benefit of $19.0 million, $16.8
million and $15.3 million would affect our effective income tax rate in 2007,
2008 and 2009, respectively. We currently estimate that our unrecognized
tax benefits will decrease by approximately $130,000 during the next twelve
months due to the resolution of certain examination and filing procedures
related to one or more of our subsidiaries and to the expiration of certain
statutes of limitations.
We accrue
interest and penalties on our uncertain tax positions as a component of our
provision for income taxes. The amount of interest and penalties we
accrued during 2007 was $1.3 million, and at December 31, 2008 and December 31,
2009 we had $.5 million and an immaterial amount, respectively, accrued for
interest and penalties for our uncertain tax positions.
We file
income tax returns in various U.S. federal, state and local jurisdictions.
We also file income tax returns in various non-U.S. jurisdictions, principally
in Canada and Taiwan. Our domestic income tax returns prior to 2006 are
generally considered closed to examination by applicable tax authorities.
Our non-U.S. income tax returns are generally considered closed to examination
for years prior to 2004 for Taiwan and 2005 for Canada.
Note
22
- Quarterly
results of operations (unaudited):
|
Quarter ended
|
||||||||||||||||
|
March 31
|
June 30
|
Sept. 30
|
Dec. 31
|
|||||||||||||
|
(In
millions, except per share data)
|
||||||||||||||||
|
Year ended December 31, 2008
|
||||||||||||||||
|
Net sales
|
$ | 40.5 | $ | 43.7 | $ | 43.9 | $ | 37.4 | ||||||||
|
Gross margin
|
9.4 | 11.0 | 11.2 | 8.2 | ||||||||||||
|
Net
income (loss)
|
(.1 | ) | 4.3 | (7.7 | ) | 36.3 | ||||||||||
|
Net income
(loss) attributable to NL stockholders
(a)
|
(.3 | ) | 4.0 | (6.8 | ) | 36.3 | ||||||||||
|
Diluted earnings
(loss) per common share
|
$ | (.01 | ) | $ | .08 | $ | (.14 | ) | $ | .75 | ||||||
|
Quarter ended
|
||||||||||||||||
|
March 31
|
June 30
|
Sept. 30
|
Dec. 31
|
|||||||||||||
|
(In
millions, except per share data)
|
||||||||||||||||
|
Year ended December 31, 2009
|
||||||||||||||||
|
Net sales
|
$ | 28.5 | $ | 29.2 | $ | 29.4 | $ | 29.0 | ||||||||
|
Gross margin
(c)
|
4.8 | 6.2 | 7.0 | 5.8 | ||||||||||||
|
Net
income (loss)
|
(11.9 | ) | (2.4 | ) | 3.2 | (1.0 | ) | |||||||||
|
Net income
(loss) attributable to NL stockholders (b)(c)
|
(11.8 | ) | (2.1 | ) | 3.1 | (.9 | ) | |||||||||
|
Diluted earnings
(loss) per common share
|
$ | (.24 | ) | $ | (.04 | ) | $ | .06 | $ | (.02 | ) | |||||
The sum
of the quarterly per share amounts may not equal the annual per share amounts
due to relative changes in the weighted average number of shares used in the per
share computations.
(a) We
recognized the following amounts during 2008:
|
|
·
|
$10.1
million goodwill impairment charge in the third quarter, see Note
8;
|
|
|
·
|
$48.8
million pre-tax gain in the fourth quarter for a litigation settlement,
see Note 19; and
|
|
·
|
$2.6
million ($1.7 million net of tax) included in our equity in net income of
Kronos in the second quarter related to an adjustment of certain income
tax attributes of Kronos in
Germany.
|
(b) We
recognized the following amounts during 2009:
|
|
·
|
$.7
million write-down of assets held for sale in the second quarter, see Note
14;
|
|
|
· $11.3 million
pre-tax gain in the second quarter for a litigation settlement, see Note
19; and
|
|
|
·
$.3 million included in our equity in loss of Kronos in the fourth quarter
($.2 million, net of income taxes) in connection with the correction of
Kronos’ employee benefit
expense previously
recognized for 2007, 2008 and the first three quarters of
2009.
|
|
(c)
|
In
the fourth quarter of 2009, we recognized an inventory adjustment to
correct an error in the valuation of certain of CompX’s raw material
inventories at one of its locations, which negatively impacted gross
profit by approximately $300,000. Net income attributable to NL
stockholders in the fourth quarter of 2009 includes a $160,000 charge, net
of income tax, less than $.01 per share, related to this
item.
|
|
|
NL
INDUSTRIES, INC. AND SUBSIDIARIES
SCHEDULE
I - CONDENSED FINANCIAL INFORMATION OF REGISTRANT
Condensed
Balance Sheets
(In
thousands)
|
December 31,
|
||||||||
|
2008
|
2009
|
|||||||
|
Current
assets:
|
||||||||
|
Cash and cash equivalents
|
$ | 1,075 | $ | 2,842 | ||||
|
Restricted cash equivalents
|
2,452 | 2,454 | ||||||
|
Restricted marketable debt securities
|
5,371 | 5,225 | ||||||
|
Accounts and notes receivable
|
7,343 | 597 | ||||||
|
Receivable from subsidiaries and affiliates
|
6,308 | 3,370 | ||||||
|
Prepaid expenses
|
35 | 116 | ||||||
|
Deferred income taxes
|
3,611 | 2,734 | ||||||
|
Total current assets
|
26,195 | 17,338 | ||||||
|
Other assets:
|
||||||||
|
Marketable securities
|
46,317 | 61,409 | ||||||
|
Investment in subsidiaries
|
97,419 | 97,005 | ||||||
|
Investment in Kronos Worldwide, Inc.
|
133,745 | 112,766 | ||||||
|
Other
|
15,490 | 15,317 | ||||||
|
Property and equipment, net
|
647 | 581 | ||||||
|
Total other assets
|
293,618 | 287,078 | ||||||
|
Total
assets
|
$ | 319,813 | $ | 304,416 | ||||
|
Current liabilities:
|
||||||||
|
Accounts payable and accrued liabilities
|
$ | 6,755 | $ | 7,689 | ||||
|
Payable to subsidiaries and affiliates
|
22,185 | 18,682 | ||||||
|
Accrued environmental costs
|
7,253 | 6,128 | ||||||
|
Total current liabilities
|
36,193 | 32,499 | ||||||
|
Noncurrent liabilities:
|
||||||||
|
Deferred income tax
|
39,240 | 45,897 | ||||||
|
Accrued environmental costs
|
13,542 | 11,765 | ||||||
|
Accrued pension cost
|
11,767 | 12,233 | ||||||
|
Accrued postretirement benefits cost
|
8,883 | 8,307 | ||||||
|
Other
|
21,824 | 19,111 | ||||||
|
Total noncurrent liabilities
|
95,256 | 97,313 | ||||||
|
Stockholders' equity
|
188,364 | 174,604 | ||||||
|
Total
liabilities and stockholders' equity
|
$ | 319,813 | $ | 304,416 | ||||
The
accompanying Notes are an integral part of the financial
statements.
NL
INDUSTRIES, INC. AND SUBSIDIARIES
SCHEDULE
I - CONDENSED FINANCIAL INFORMATION OF REGISTRANT (CONTINUED)
Condensed
Statements of Operations
(In
thousands)
|
Years ended December
31,
|
||||||||||||
|
2007
|
2008
|
2009
|
||||||||||
|
Revenues
and other income (expense):
|
||||||||||||
|
Equity
in losses of subsidiaries and affiliates
|
$ | (18,401 | ) | $ | (3,706 | ) | $ | (13,076 | ) | |||
|
Litigation
settlement gains
|
- | 52,266 | 11,476 | |||||||||
|
Interest and dividends
|
1,482 | 6,266 | 1,847 | |||||||||
|
Securities transactions, net
|
22,741 | - | - | |||||||||
|
Insurance
recoveries
|
5,659 | 9,610 | 4,631 | |||||||||
|
Other income
(expense), net
|
(215 | ) | 65 | 69 | ||||||||
|
Total
revenues and other income
|
11,266 | 64,501 | 4,947 | |||||||||
|
Costs and expenses:
|
||||||||||||
|
Corporate
expense
|
28,842 | 23,516 | 23,046 | |||||||||
|
Interest
|
1 | - | - | |||||||||
|
Total
costs and expenses
|
28,843 | 23,516 | 23,046 | |||||||||
|
Income
(loss) before income taxes
|
(17,577 | ) | 40,985 | (18,099 | ) | |||||||
|
Income
tax expense (benefit)
|
(15,846 | ) | 7,801 | (6,344 | ) | |||||||
|
Net
income (loss)
|
$ | (1,731 | ) | $ | 33,184 | $ | (11,755 | ) | ||||
The
accompanying Notes are an integral part of the financial
statements.
NL
INDUSTRIES, INC. AND SUBSIDIARIES
SCHEDULE
I - CONDENSED FINANCIAL INFORMATION OF REGISTRANT (CONTINUED)
Condensed
Statements of Cash Flows
(In
thousands)
|
Years ended December 31,
|
||||||||||||
|
2007
|
2008
|
2009
|
||||||||||
|
Cash
flows from operating activities:
|
||||||||||||
|
Net
income (loss)
|
$ | (1,731 | ) | $ | 33,184 | $ | (11,755 | ) | ||||
|
Distributions
from Kronos
|
17,516 | 17,532 | - | |||||||||
|
Distributions
from CompX
|
8,376 | 5,378 | 5,378 | |||||||||
|
Deferred
income taxes
|
(5,871 | ) | (4,250 | ) | (1,594 | ) | ||||||
|
Equity
in net loss of subsidiaries and investments
|
18,401 | 3,706 | 13,076 | |||||||||
|
Securities
transactions
|
(22,741 | ) | - | - | ||||||||
|
Litigation
settlement gains
|
- | (52,266 | ) | (11,476 | ) | |||||||
|
Other,
net
|
(1,578 | ) | (2,429 | ) | 1,277 | |||||||
|
Net
change in assets and liabilities
|
(15,795 | ) | (9,700 | ) | 692 | |||||||
|
Net
cash used in operating activities
|
(3,423 | ) | (8,845 | ) | (4,402 | ) | ||||||
|
Cash
flows from investing activities:
|
||||||||||||
|
Capital
expenditures
|
(175 | ) | (45 | ) | (1 | ) | ||||||
|
Loans
to affiliates, net
|
- | (22,210 | ) | 22,210 | ||||||||
|
Proceeds
from real estate-related litigation settlement
|
- | 39,550 | 11,800 | |||||||||
|
Change
in restricted cash equivalents and marketable debt securities,
net
|
(7 | ) | (2,379 | ) | 144 | |||||||
|
Purchase
of CompX common stock
|
- | (1,081 | ) | - | ||||||||
|
Proceeds
from disposal of marketable securities
|
26,800 | - | - | |||||||||
|
Other
|
- | (794 | ) | (173 | ) | |||||||
|
Net
cash provided by investing activities
|
26,618 | 13,041 | 33,980 | |||||||||
|
Cash
flows from financing activities:
|
||||||||||||
|
Loans from affiliates, net
|
(5,380 | ) | 16,630 | (3,590 | ) | |||||||
|
Dividends paid
|
(24,295 | ) | (24,299 | ) | (24,305 | ) | ||||||
|
Common stock issued
|
- | 6 | 84 | |||||||||
|
Net
cash used in financing activities
|
(29,675 | ) | (7,663 | ) | (27,811 | ) | ||||||
|
Net
change during the year from operating investing and financing
activities
|
(6,480 | ) | (3,467 | ) | 1,767 | |||||||
|
Balance
at beginning of year
|
11,022 | 4,542 | 1,075 | |||||||||
|
Balance
at end of year
|
$ | 4,542 | $ | 1,075 | $ | 2,842 | ||||||
The
accompanying Notes are an integral part of the financial
statements.
NL
INDUSTRIES, INC. AND SUBSIDIARIES
SCHEDULE
I - CONDENSED FINANCIAL INFORMATION OF REGISTRANT (CONTINUED)
Notes
to Condensed Financial Information
December
31, 2009
Note
1
- Basis
of presentation:
The
Consolidated Financial Statements of NL Industries, Inc. and the related Notes
to Consolidated Financial Statements are incorporated herein by
reference. The accompanying financial statements reflect NL
Industries, Inc.'s investment in Kronos Worldwide, Inc., CompX International
Inc. and NL's other subsidiaries on the equity method of
accounting.
Note
2 – Investment in and advances to subsidiaries:
|
__December 31,_
|
||||||||
|
2008
|
2009
|
|||||||
|
(In
thousands)
|
||||||||
|
Current:
|
||||||||
|
Receivable
from:
|
||||||||
|
Valhi
– federal income taxes
|
$ | 150 | $ | 3,125 | ||||
|
CompX
– state income taxes
|
- | 245 | ||||||
|
Valhi
|
3,000 | - | ||||||
|
EMS
|
3,158 | - | ||||||
|
Total
|
$ | 6,308 | $ | 3,370 | ||||
|
Payable
to:
|
||||||||
|
EWI
- promissory note
|
$ | 2,000 | $ | 2,000 | ||||
|
EMS
- promissory note
|
16,630 | 13,040 | ||||||
|
CompX
– federal income taxes
|
1,472 | 1,726 | ||||||
|
Valhi
– state income taxes
|
919 | 245 | ||||||
|
EWI
– income taxes
|
16 | 7 | ||||||
|
EMS
– income taxes
|
456 | 15 | ||||||
|
Tremont
|
436 | 471 | ||||||
|
Kronos
|
256 | 112 | ||||||
|
EMS
|
- | 1,066 | ||||||
|
Total
|
$ | 22,185 | $ | 18,682 | ||||
|
December 31,
|
||||||||
|
2008
|
2009
|
|||||||
|
(In
thousands)
|
||||||||
|
Investment
in:
|
||||||||
|
CompX
|
$ | 86,372 | $ | 80,934 | ||||
|
Other
subsidiaries
|
11,047 | 16,071 | ||||||
|
Total
|
$ | 97,419 | $ | 97,005 | ||||
|
Years ended December 31,
|
||||||||||||
|
2007
|
2008
|
2009
|
||||||||||
|
(In
thousands)
|
||||||||||||
|
Equity
in earnings (losses) of subsidiaries and affiliates:
|
||||||||||||
|
Kronos
|
$ | (23,901 | ) | $ | 3,229 | $ | (12,470 | ) | ||||
|
CompX
|
6,356 | (3,257 | ) | (1,735 | ) | |||||||
|
Other
subsidiaries
|
(856 | ) | (3,678 | ) | 1,129 | |||||||
|
Total
|
$ | (18,401 | ) | $ | (3,706 | ) | $ | (13,076 | ) | |||
We have a
demand revolving promissory note between us and EWI Re, Inc., that provides for
borrowings of up to $3 million. Our loans from EWI are unsecured and bear
interest at a rate equal to the three month United States LIBOR rate plus 1.75%
per year with all principal due on demand (and no later than December 31,
2011).
We also
have a demand revolving promissory note with EMS, for borrowings up to $21
million. Our loans from EMS are unsecured and bear interest at
a rate equal to the three month United States LIBOR rate plus one 1.75% per year
with all principal due on demand (and no later than December 31,
2011).