Attached files
Table of Contents
UNITED STATES
SECURITIES AND EXCHANGE COMMISSION
Washington, D.C. 20549
FORM 10-K
(Mark One)
| x | ANNUAL REPORT PURSUANT TO SECTION 13 OR 15(d) OF THE SECURITIES EXCHANGE ACT OF 1934 |
For the fiscal year ended December 31, 2009
OR
| ¨ | TRANSITION REPORT PURSUANT TO SECTION 13 OR 15(d) OF THE SECURITIES EXCHANGE ACT OF 1934 |
For the transition period from to
Commission file number 000-50262
INTELSAT S.A.
(Exact name of registrant as specified in its charter)
| Luxembourg | 98-0346003 | |
| (State or Other Jurisdiction of Incorporation or Organization) |
(I.R.S. Employer Identification No.) | |
| 23, avenue Monterey Luxembourg |
L-2086 | |
| (Address of Principal Executive Offices) | (Zip Code) |
+352 24-87-9920
Registrant’s telephone number, including area code
Securities registered pursuant to Section 12(b) of the Act: None
Securities registered pursuant to Section 12(g) of the Act: None
Indicate by check mark if the registrant is a well-known seasoned issuer, as defined in Rule 405 of the Securities Act. Yes ¨ No x
Indicate by check mark if the registrant is not required to file reports pursuant to Section 13 or Section 15(d) of the Act. Yes x No ¨
Indicate by check mark whether the registrant: (1) has filed all reports required to be filed by Section 13 or 15(d) of the Securities Exchange Act of 1934 during the preceding 12 months (or for such shorter period that the registrant was required to file such reports), and (2) has been subject to such filing requirements for the past 90 days. Yes ¨ No x
Indicate by check mark whether the registrant has submitted electronically and posted on its corporate Web site, if any, every Interactive Data File required to be submitted and posted pursuant to Rule 405 of Regulation S-T (§232.405 of this chapter) during the preceding 12 months (or for such shorter period that the registrant was required to submit and post such files). Yes ¨ No ¨
Indicate by check mark if disclosure of delinquent filers pursuant to Item 405 of Regulation S-K is not contained herein, and will not be contained, to the best of registrant’s knowledge, in definitive proxy or information statements incorporated by reference in Part III of this Form 10-K or any amendment to this Form 10-K. x
Indicate by check mark whether the registrant is a large accelerated filer, an accelerated filer, a non-accelerated filer, or a smaller reporting company. See definitions of “large accelerated filer,” “accelerated filer” and “smaller reporting company” in Rule 12b-2 of the Exchange Act. (Check one):
Large accelerated filer ¨ Accelerated filer ¨ Non-accelerated filer x Smaller reporting company ¨
Indicate by check mark whether the registrant is a shell company (as defined in Rule 12b-2 of the Exchange Act). Yes ¨ No x
The aggregate market value of the registrant’s voting stock held by non-affiliates is zero. The registrant is a privately held corporation.
As of March 5, 2010, 5,000,000 common shares, par value $1.00 per share, were outstanding.
Documents incorporated by reference: None
Table of Contents
| Page | ||||
| 1 | ||||
| Part I |
||||
| Item 1. |
3 | |||
| Item 1A. |
30 | |||
| Item 1B. |
41 | |||
| Item 2. |
42 | |||
| Item 3. |
43 | |||
| Item 4. |
43 | |||
| Part II |
||||
| Item 5. |
44 | |||
| Item 6. |
44 | |||
| Item 7. |
Management’s Discussion and Analysis of Financial Condition and Results of Operations |
46 | ||
| Item 7A. |
84 | |||
| Item 8. |
85 | |||
| Item 9. |
Changes in and Disagreements with Accountants on Accounting and Financial Disclosure |
85 | ||
| Item 9A(T). |
85 | |||
| Item 9B. |
86 | |||
| Part III |
||||
| Item 10. |
87 | |||
| Item 11. |
90 | |||
| Item 12. |
Security Ownership of Certain Beneficial Owners and Management and Related Stockholder Matters |
111 | ||
| Item 13. |
Certain Relationships and Related Transactions, and Director Independence |
112 | ||
| Item 14. |
114 | |||
| Part IV |
||||
| Item 15. |
115 | |||
| 116 | ||||
| F-1 | ||||
Table of Contents
Some of the statements in this Annual Report on Form 10-K, or Annual Report, constitute forward-looking statements that do not directly or exclusively relate to historical facts. The Private Securities Litigation Reform Act of 1995 provides a “safe harbor” for certain forward-looking statements as long as they are identified as forward-looking and are accompanied by meaningful cautionary statements identifying important factors that could cause actual results to differ materially from the expectations expressed or implied in the forward-looking statements.
When used in this Annual Report, the words “may,” “will,” “ might,” “should,” “expect,” “plan,” “anticipate,” “project,” “believe,” “estimate,” “predict,” “intend,” “potential,” “outlook” and “continue,” and the negative of these terms, and other similar expressions are intended to identify forward-looking statements and information. Examples of these forward-looking statements include, but are not limited to, statements regarding the following: our goal to expand our leading fixed satellite services (“FSS”) business in high growth regions and applications while maintaining our focus on operational discipline; our expectation that our current capital expenditure program will position our network to capitalize on the FSS sector’s best growth opportunities globally, while providing optimal coverage to meet needs across our targeted customer sets; the characteristics of our refreshed fleet when the current investment cycle is completed; our belief that our strategies will position us to continue to deliver high operating margins, and as our current fleet investment program is completed, strong cash flow generation; the trends we believe will increase demand for satellite services and that we believe will allow us to capture new business opportunities in the future; our intent to continue to evaluate and pursue strategic transactions that complement our global fleet, provide growth capacity and allow us to respond to our customer needs; our belief that our network services and media customers increasingly require managed services best addressed by a network that combines space and terrestrial infrastructure; our expectation that the FSS sector will experience moderate growth over the next few years; our expectation that we will benefit from the general trend towards IP-based networking and distribution, including growing use of new media formats, as well as infrastructure applications in emerging regions; our expectation that we will continue to implement compression technologies into our ground network to reduce the bandwidth necessary for network service applications, increasing our customers’ efficiency and expanding our market potential, particularly in emerging regions; our belief that our enhancement of our fully-integrated terrestrial network to an all IP network environment will improve our ground support of high bandwidth applications such as high definition video and will allow us to converge our media and network services terrestrial network infrastructures; the trends that we believe will impact our revenue and operating expenses in the future; our assessments regarding how long satellites that have experienced anomalies in the past should be able to provide service on their transponders; our assessment of the risk of additional anomalies occurring on our satellites; our expectation that certain anomalies will not result in the acceleration of capital expenditures; our plans for satellite launches in the near term; our expected capital expenditures in 2010 and during the next several years; our belief that the diversity of our revenue and customer base allows us to recognize trends, capture new growth opportunities, and gain experience that can be transferred to customers in other regions, enables us to capitalize on changing market conditions and mitigates the impact of fluctuations in any specific customer type or geographic region; our belief that our global scale, diversity, collection of spectrum rights, technical expertise and fully integrated hybrid network form a strategic platform that positions us to identify and capitalize on new opportunities in satellite services; our belief that the scale of our fleet can reduce the financial impact of any satellite failures and protect against service interruption; and the impact on our financial position or results of operations of pending legal proceedings.
The forward-looking statements made in this Annual Report reflect our intentions, plans, expectations, assumptions and beliefs about future events. These forward-looking statements speak only as of their dates and are not guarantees of future performance or results and are subject to risks, uncertainties and other factors, many of which are outside of our control. These factors could cause actual results or developments to differ materially from the expectations expressed or implied in the forward-looking statements and include known and unknown risks. Known risks include, among others, the risks discussed in Item 1A—Risk Factors, the political, economic and legal conditions in the markets we are targeting for communications services or in which we operate and other risks and uncertainties inherent in the telecommunications business in general and the satellite communications business in particular.
1
Table of Contents
Other factors that may cause results or developments to differ materially from the forward-looking statements made in this Annual Report include, but are not limited to:
| • | risks associated with operating our in-orbit satellites; |
| • | satellite launch failures, satellite launch and construction delays and in-orbit failures or reduced performance; |
| • | potential changes in the number of companies offering commercial satellite launch services and the number of commercial satellite launch opportunities available in any given time period that could impact our ability to timely schedule future launches and the prices we have to pay for such launches; |
| • | our ability to obtain new satellite insurance policies with financially viable insurance carriers on commercially reasonable terms or at all, as well as the ability of our insurance carriers to fulfill their obligations; |
| • | possible future losses on satellites that are not adequately covered by insurance; |
| • | domestic and international government regulation; |
| • | changes in our revenue backlog or expected revenue backlog for future services; |
| • | pricing pressure and overcapacity in the markets in which we compete; |
| • | inadequate access to capital markets; |
| • | the competitive environment in which we operate; |
| • | customer defaults on their obligations owed to us; |
| • | our international operations and other uncertainties associated with doing business internationally; |
| • | litigation; and |
| • | other risks discussed under Item 1A—Risk Factors. |
Although we believe that the expectations reflected in the forward-looking statements are reasonable, we cannot guarantee our future results, level of activity, performance or achievements. Because actual results could differ materially from our intentions, plans, expectations, assumptions and beliefs about the future, you are urged not to rely on forward-looking statements in this Annual Report and to view all forward-looking statements made in this Annual Report with caution. We do not undertake any obligation to update or revise any forward-looking statements, whether as a result of new information, future events or otherwise.
2
Table of Contents
PART I
| Item 1. | Business |
In this Annual Report unless otherwise indicated or the context otherwise requires, (1) the terms “we,” “us,” “our,” “the Company” and “Intelsat” refer to Intelsat, Ltd. and its subsidiaries on a consolidated basis prior to the Migration (as defined below) and Intelsat S.A. and its subsidiaries on a consolidated basis subsequent to the Migration, (2) the terms “Serafina Holdings” and “Intelsat Global” refer to Intelsat Global, Ltd. (formerly known as Serafina Holdings Limited) prior to the Migration and to Intelsat Global S.A. subsequent to the Migration, (3) the terms “Serafina” and “Intelsat Global Subsidiary” refer to Intelsat Global Subsidiary, Ltd. (formerly known as Serafina Acquisition Limited) prior to the Migration and to Intelsat Global Subsidiary S.A. subsequent to the Migration, (4) the term “Intelsat Holdings” refers to our parent, Intelsat Holdings, Ltd., prior to the Migration and to Intelsat Holdings S.A. subsequent to the Migration, (5) the term “Intelsat Bermuda” refers to Intelsat (Bermuda), Ltd., Intelsat, Ltd.’s direct wholly-owned subsidiary, prior to the Migration and the term “Intelsat Luxembourg” refers to Intelsat (Luxembourg) S.A., Intelsat S.A.’s direct wholly-owned subsidiary, subsequent to the Migration, (6) the term “Intelsat Jackson” refers to Intelsat Jackson Holdings, Ltd., a direct wholly-owned subsidiary of Intelsat Bermuda, prior to the Migration, and to Intelsat Jackson Holdings S.A., Intelsat Luxembourg’s direct wholly-owned subsidiary, subsequent to the Migration, (7) the term “Intermediate Holdco” refers to Intelsat Intermediate Holding Company, Ltd., a direct wholly-owned subsidiary of Intelsat Jackson, prior to the Migration and to Intelsat Intermediate Holding Company S.A. subsequent to the Migration, (8) the term “Intelsat Sub Holdco” refers to Intelsat Subsidiary Holding Company, Ltd., a direct wholly-owned subsidiary of Intermediate Holdco, prior to the Migration and to Intelsat Subsidiary Holding Company S.A. subsequent to the Migration, (9) the term “PanAmSat Holdco” refers to PanAmSat Holding Corporation, and not to its subsidiaries, prior to the PanAmSat Acquisition Transactions (as defined below) and the term “Intelsat Holding Corporation” refers to Intelsat Holding Corporation, and not to its subsidiaries, thereafter, (10) the terms “Intelsat Corp” and “Intelsat Corporation” refer to PanAmSat Corporation prior to the PanAmSat Acquisition Transactions and to Intelsat Corporation thereafter, (11) the term “PanAmSat” refers to PanAmSat Holding Corporation and its subsidiaries on a consolidated basis prior to the PanAmSat Acquisition Transactions, and (12) the term “New Sponsors Acquisition Transactions” refers to the acquisition of Intelsat Holdings by Serafina in February 2008 and related transactions, as discussed under Item 7—Management’s Discussion and Analysis of Financial Condition and Results of Operations—Impact of the New Sponsors Acquisition Transactions. We refer to Intelsat General Corporation, our government business subsidiary, as “Intelsat General.” In this Annual Report, unless the context otherwise requires, all references to transponder capacity or demand refer to transponder capacity or demand in the C-band and Ku-band only.
Overview
Intelsat operates the world’s largest fixed satellite services (“FSS”) business, providing a critical layer in the global communications infrastructure. Based on the scale and global coverage of our network, our extensive customer relationships and our reputation for highly reliable services, we believe that we are the leading FSS company in the world. We operate more satellite capacity in orbit, have more satellite capacity under contract, serve more commercial customers and deliver services in more countries than any other commercial satellite operator.
Our business provides mission critical communication services to the world’s leading media companies, wireline and wireless telecommunications operators, data networking service providers, multinational corporations, and Internet service providers (“ISPs”). We are the leading provider of commercial satellite capacity to the U.S. government and other select military organizations and contractors. The span of our business ranges from global distribution of content for media companies to essential network backbones for communications providers in high-growth emerging markets.
3
Table of Contents
Our business is the most diversified in the FSS sector based on types of service offerings, number of customers and revenue concentration by satellite and geography. This diversity reduces our market and operating risk. Our broad customer base and geographic presence also provide us with early opportunities to support new communications applications in a converging world.
Our satellite-based solutions are a critical component of our customers’ infrastructures. Generally, our customers need the connectivity satellites provide so long as they are in business or pursuing their mission. This gives us stability during economic downturns. Our services also provide strong value in support of our customers’ businesses. For instance, for media applications, our satellite services provide efficient broadcast distribution that is difficult for terrestrial services to match. For network services applications, our satellite solutions provide higher reliability than is available from local terrestrial services, and allow our customers to reach geographies that they would otherwise be unable to serve. The Intelsat network supports:
| • | The distribution of television entertainment and news programming; |
| • | The expansion of wireless networks in emerging regions without adequate infrastructure; |
| • | Ubiquitous access to broadband for Internet and fixed and mobile networks used by corporations and other organizations; |
| • | Completion and extension of international, national and regional voice and data networks; and |
| • | Highly specialized fixed and mobile military applications, such as secure communications networks and bandwidth to enable manned and unmanned aerial vehicle missions. |
We provide our infrastructure services on a satellite fleet comprised of over 50 satellites, covering 99% of the earth’s populated regions. Our satellite capacity is complemented by a terrestrial network comprised of leased fiber optic cable and owned and operated teleports. We believe that our hybrid satellite-terrestrial network provides significant differentiation and is an important element of our growth strategy.
We have a reputation for operational and engineering leadership, built on our experience of over 45 years in the FSS sector. The reliability of our network is outstanding, delivering 99.9998% network availability on station-kept satellites to our customers in 2009. We built our centrally operated, fully integrated network using the world’s largest collection of FSS spectrum rights at valuable orbital locations, from which we can deliver services to established regions as well as higher-growth emerging regions.
We operate in an attractive, well-developed sector of the satellite communications industry, which is benefiting from increasing demand for capacity from the commercial sector and governments. The FSS sector is characterized by steady and predictable contracted revenue streams, high operating margins, strong cash flows and long-term contractual commitments. We believe these sector characteristics, coupled with our cost-efficient, fully integrated operating structure and favorable tax profile, provide us with an attractive business model.
As of December 31, 2009, our revenue backlog, which is our expected future revenue under existing customer contracts, was approximately $9.4 billion. We typically contract with our customers for long-term commitments of up to 15 years. Approximately 96% of this backlog relates to contracts that are non-cancelable or cancelable only upon payment of substantial termination fees. For the year ended December 31, 2009, we generated revenue of $2.5 billion, a growth rate of 6% over the combined year ended December 31, 2008.
We believe that our global scale and efficient operating profile, diversified customer sets and sizeable backlog, together with the growing worldwide demand for entertainment and connectivity, provide us with a platform for success.
4
Table of Contents
The FSS Sector
Fixed satellite services are an integral part of the global communications infrastructure. The global FSS sector is expected to generate revenues of approximately $9.6 billion in 2010 according to NSR, a leading international market research and consulting firm specializing in satellite and wireless technology and applications.
Our customers use our services because of the distinct technical and economic benefits that satellite services provide for certain critical applications. Satellites provide a number of advantages over terrestrial communications systems, including the following:
| • | Satellite beams effectively blanket service regions with bandwidth, enabling any user within a coverage area to have equal access to highly reliable bandwidth; |
| • | Efficient content distribution through the ability to broadcast high quality signals from a single location to many locations simultaneously; |
| • | The ability to extend beyond terrestrial network end points, or provide an alternative path to terrestrial infrastructure, thus avoiding points of congestion or unreliability; |
| • | Fast network deployments, with network performance easily replicated across each site regardless of geography or infrastructure, and efficient centralized control and management; |
| • | Superior end-to-end network availability as compared to the availability of terrestrial networks; and |
| • | Instant communications infrastructure for disaster recovery. |
There is a finite number of geostationary orbital slots in which FSS satellites can be located, and many orbital locations already hold operational satellites. The owners of these satellites operate them under coordination agreements designed to avoid interference with other operators’ satellites.
Today, there are only three FSS operators, including us, providing global services, which is increasingly important as multinationals and governments seek a one-stop solution for obtaining global connectivity. In addition, there are a number of operators with fewer satellites that provide regional and/or national services. Intelsat is the largest of any operator in terms of rights to orbital slots in the most valuable C- and Ku-band spectrums.
We believe a number of trends are creating increasing demand for satellite services, expanding the FSS sector:
| • | Globalization of economic activities is increasing the geographic expansion of corporations and the communications networks that support them and creating new audiences for content. Globalization also increases the communications requirements for governments supporting embassy and military applications. |
| • | Connectivity and broadband access are essential elements of infrastructure supporting the rapid economic growth of developing nations. Globally dispersed organizations are increasingly moving to satellite-based infrastructure to provide better access, reliability and control. |
| • | Proliferation of content and formats is resulting in increased bandwidth requirements as content owners seek to maximize distribution to multiple viewing audiences across multiple technologies. High definition television (“HDTV”), three-dimensional high definition television (“3DTV”), Internet distribution of traditional television programming, Internet protocol television (“IPTV”) and video to the handset are all examples of the expanding format and distribution requirements of media programmers. |
5
Table of Contents
| • | Mobility applications, such as wireless phone services, maritime communications and aerial services, are fueling demand for bandwidth on the move. Rapid growth in cellular services for developing regions is expected to transition demand for voice only services to demand for data and video services over time, resulting in increased network bandwidth requirements. Given the low penetration of fixed-line telephone services in emerging markets and the introduction of smart phones and netbooks, Internet access in these markets may be primarily mobile. Significant technology advancements in aerial data and video services for government applications, such as unmanned aerial vehicles, also is resulting in increased demand for satellite-based bandwidth. |
In total, C- and Ku-band transponder service revenue in the FSS sector is expected to grow at a compound annual growth rate (“CAGR”) of 4.1% from 2010 to 2015 according to NSR. The fundamentals of the sector have consistently improved over the past few years, with continued strong demand despite the generally poor economic environment in many regions of the world. The average price per transponder for the period 2009 to 2011 forecasted by NSR in its 2009 study was approximately 12.5% higher than that forecasted for the same period in a similar study issued by NSR in 2006.
Our Customer Sets
We are the largest FSS operator and, based on the number of transponders contracted, we hold the leading position in each of our three customer sectors: network services, media and government. Characteristics of our customer sets are summarized below:
| Year Ended |
% of Total Revenue |
% of Total Backlog(1) |
Backlog to Revenue Multiple |
Representative Customers | ||||||
| Network Services |
49 | % | 39 | % | 3.0x | British Telecommunications, France Telecom, MTN Group, Schlumberger, Verizon, Vodacom | ||||
| Media |
31 | % | 52 | % | 6.3x | Discovery Communications, Fox Entertainment Group, Home Box Office, DIRECTV Latin America, The Walt Disney Company, Turner Broadcasting System | ||||
| Government |
17 | % | 6 | % | 1.2x | Australian Defence Force, National Oceanic and Atmospheric Administration, U.S. Department of Defense, U.S. Department of State, U.S. Navy | ||||
| * | Does not include Satellite Related Services and Other |
| (1) | Backlog as of December 31, 2009 |
We provide satellite capacity and related communications services for the transmission of video, data and voice signals. Our customer contracts offer four different service types: transponder services, managed services, channel services and mobile satellite services and other. We also perform satellite-related consulting and technical services for various third parties, such as operating satellites for other satellite owners.
Network Services
Network services is our largest customer set, and for the year ended December 31, 2009 accounted for 49% of our revenue and a contracted backlog of $3.7 billion at such date. Our business generated from the network services sector is generally characterized by three to five year, and up to 15 year, contracts with many of the world’s leading communications providers, including:
| • | Wireline and wireless telecommunications carriers, including global, regional and national providers; |
| • | Corporate network service providers; |
6
Table of Contents
| • | Value-added services providers, such as those serving the oil and gas and maritime industries; and |
| • | Multinational corporations and entities. |
There is an increasing need for basic and high-speed connectivity in developed and emerging regions around the world. Our satellite capacity, paired with our terrestrial network comprised of leased fiber, teleports, and data networking platforms, enables the transmission of video, data and voice to and from virtually any point on the surface of the earth. We provide an essential element of the infrastructure supporting the rapid expansion of wireless services in many emerging markets. Penetration of 3G wireless services in developing regions is expected to reach over one billion subscribers by 2012 according to the International Telecommunications Union (“ITU”).
Our network services offerings are comprised of three primary categories:
| • | Transponder services—full-time capacity services used by telecom operators, wireless companies, data network operators and value-added network operators for telecom or broadband network infrastructure. |
| • | Managed services—full-time services used by value-added network operators, mobile services operators, telecom operators and ISPs that provide integrated networking platforms comprised of satellite capacity, fiber, teleport and hardware. Operators and service providers use these shared, managed platforms as the basis for, or an economical extension of, their service offerings. |
| • | Channel services—full-time point-to-point service offerings used by telecom operators to supplement international network connectivities where there are no fiber alternatives or as a backup system to fiber routes. |
Our network services offerings are an essential component of our customers’ services, providing backbone infrastructure, expanded service areas and hard-to-reach connectivities. We believe that Intelsat is a preferred provider because of our global service capability and our expertise in delivering service operator-grade network availability and efficient network control.
We have established regional shared data networking platforms at our teleports that are connected to over 40 of our satellites. As a result, our customers can quickly establish highly reliable services across multiple regions, yet operate them on a centralized basis. Our satellite-based solutions allow customers to rapidly expand their service territories, increase the access speed and capabilities for their existing networks and efficiently address new customer and end-user requirements.
Highlights of our network services business include the following:
| • | We are the leading provider of satellite capacity for voice and data applications in every region according to Euroconsult, a leading international research and consulting company specializing in space satellite communications and broadcasting; |
| • | We provide services to many of the world’s largest telecommunications companies. Of the customers we categorize as telecommunications companies, our revenue from the top 25 in aggregate has grown at a CAGR of 11.3% from 2007 to 2009; |
| • | We believe we are the leading provider of satellite capacity for cellular backhaul applications connecting a cellular access point to the telecommunications network, providing network extensions in merging regions. Approximately 60 of our customers use our satellite-based backhaul services as a core component of their network infrastructure due to unreliable or non-existent terrestrial infrastructure. Our cellular backhaul customers include eight of the top ten mobile groups in Africa, such groups representing 64% of the region’s subscribers; and |
| • | Over 200 value-added network operators use our global broadband hybrid infrastructure to deliver regional and global services. Applications for these services include corporate networks for multi-nationals, Internet access and broadband for maritime applications. |
7
Table of Contents
We believe we are the leading provider of satellite capacity for network services, and that we are well positioned to benefit from the growing segments of this market. These segments include:
| • | Satellite-based private data networks, including VSAT networks. C- and Ku-band transponder demand for VSAT services is expected to grow at a CAGR of 6.8% from 2010 to 2015, according to NSR; |
| • | Cellular backhaul via satellite, for which satellite capacity demand is expected to grow by a CAGR of 6.3% from 2010 to 2015, according to NSR; and |
| • | Broadband for maritime applications, which is expected to grow by a CAGR of 9.7% from 2010 to 2015 according to NSR. |
Media
Media customers were the second largest source of our revenue for the year ended December 31, 2009, accounting for 31% of our revenue and a contracted backlog of $4.9 billion at such date. We provide satellite capacity for the transmission of entertainment, news, sports and educational programming for approximately 300 content providers and direct-to-home (“DTH”) platform operators worldwide. Our revenue generated from the media sector is generally characterized by non-cancellable, long-term contracts with terms of up to 15 years with premier customers including:
| • | National broadcasters; |
| • | Content providers and distributors; |
| • | Cable programmers; and |
| • | DTH platform operators. |
Broadcasters, content providers and cable programmers seek efficient distribution of their content to make it easily obtainable by affiliates, cable operators and DTH platforms. Our strong cable distribution neighborhoods offer media customers high penetration of regional and national audiences.
Broadcasters, content providers and cable programmers also select us because our global capabilities enable the distribution or retrieval of content to or from virtually any point on earth. For instance, we regularly provide fully integrated global distribution networks for content providers that need to distribute their products across multiple continents. We believe DTH platform operators turn to us because the scale and flexibility of our fleet lowers their operating risk, as we have multiple satellites serving every region.
Our media sector service offerings are comprised of two primary categories:
| • | Transponder services, which include: |
| • | Video distribution services—full-time services used by programmers and broadcasters to distribute content to cable systems and to affiliates; |
| • | DTH television services—full-time services used by DTH platform operators to distribute their content to consumer set-top boxes; and |
| • | Video contribution services—full-time and part-time services used to gather news and events from a remote location for delivery to a production facility. |
| • | Managed services, which include: |
| • | Hybrid satellite, fiber and teleport managed services – full-time services typically used by programmers to outsource additional elements of their transmission infrastructure, such as uplinking programming in digitally compressed formats; and |
| • | Part-time managed services, including occasional use services for news, sports and entertainment organizations gathering programming from a remote location for delivery to a production facility. |
8
Table of Contents
We believe that we enjoy a strong reputation for delivering the high network reliability required to serve the demanding media sector.
Our fully integrated satellite, fiber and teleport facilities provide enhanced quality control for programmers. We are increasingly offering bundled, value-added services that include managed fiber services, digital encoding of video channels and up-linking and down-linking services to and from our satellites and teleport facilities. Our bundled services address programmers’ interests in delivering content to multiple distribution channels, such as television and Internet, and their needs for launching programs to new regions in a cost-efficient manner.
Highlights of our media business include the following:
| • | Of our 54 satellites, 25 are premium video neighborhoods, offering programmers superior audience penetration, with 10 serving the United States, five serving Latin America, three serving Asia, four serving Europe, and three serving Africa and the Middle East. |
| • | We are positioned as a leading provider of global distribution to our media customers. Our top 20 video distribution customers buy service on our network across three or more geographic regions, demonstrating the value provided by the global reach of our network. |
| • | In North America, we believe that we are the leading provider of FSS capacity for the distribution of high definition and cable programming. Our Galaxy 13 satellite provided the first high definition neighborhood in North America, and today, the Galaxy fleet distributes nearly 150 high definition channels, and we distribute nearly 200 high definition channels on a global basis. In its 2009 study, NSR forecasted that the number of standard and high definition television channels are expected to grow at a CAGR of 6.7% from 2010 to 2015. |
| • | We are a leading provider of FSS capacity for DTH services, delivering programming to millions of viewers and supporting more than 30 DTH platforms around the world. |
| • | We are a leading provider of managed occasional use services for news and sports organizations. In early 2010, we landed a special events team in Haiti within hours of its tragic earthquake, providing a critical link for broadcast teams reporting on the event. In the eleven days following the event, we uplinked over 500 hours of broadcasts from the disaster zone. |
| • | Global C- and Ku-band transponder revenue from FSS video applications is forecasted to grow at an overall CAGR of approximately 4.8% from 2010 to 2015, according to NSR. |
Government
The government sector accounted for 17% of our revenue for the year ended December 31, 2009 and $520 million of our contracted backlog at such date. Our customer base includes many of the leading government communications providers, including:
| • | U.S. military and allied partners; |
| • | Civilian agencies; and |
| • | Commercial customers serving the defense sector. |
We are a leading FSS provider of commercial satellite services to the government sector, and have built a reputation as a trusted partner for the provision of highly customized, secure satellite-based solutions. Our government sector service offerings are comprised of three primary categories:
| • | Transponder services, which include: |
| • | Full time services, for use in private, secure data networks and providing bandwidth for operating unmanned aerial vehicles; |
9
Table of Contents
| • | Managed services, which include: |
| • | Secure access to broadband networking platforms for fast deployments of services; and |
| • | Mobile satellite services and other, which include: |
| • | Resale of full-time and on-demand services for L-band mobile satellite services (“MSS”), X-band and other spectrums not available on our network, as further described below; |
| • | Technical consulting services; and |
| • | Sales of equipment and hardware as part of turn-key satellite solutions. |
We attribute our strength in this area to our global capacity, flexible fleet, specialized security clearances, quality reputation and unique, satellite-specific system integration skills. In responding to customer requirements, we also procure and integrate mobile satellite services provided by other satellite operators, either to supplement our capacity or to obtain capacity in frequencies not available on our fleet, such as L-band MSS, X-band or UHF. These mobile satellite services are low risk in nature and have minimal, if any, associated capital investment. The terms and conditions of the procured capacity are generally matched to contractual commitments from our customers.
Our leading position with the government sector has allowed us to benefit from a number of recent trends. These include:
| • | Growth in demand for secure high bandwidth services related to the surge in use of mobile solutions for intelligence, surveillance and reconnaissance, such as unmanned aerial vehicles; |
| • | Growth in demand for commercial capacity resulting from the cancelation or delay of proprietary government satellite programs; |
| • | Growth in rapid response managed and turn-key, secure communication systems including design, hardware, installation and transmission capacity; and |
| • | Long-term contracts resulting from the use of commercial satellite programs to host proprietary military payloads, providing a shared ride to space and on-going operations and maintenance. |
We believe our reputation as a provider of secure solutions, our global fleet, our customer relationships, our ability to provide turn-key services and our demonstrated willingness to reposition or procure capacity to support specific requirements position us to successfully compete for the increasing demand for satellite solutions for military and civilian applications.
Highlights of our government business include the following:
| • | We are the leading FSS provider of government satellite services in the U.S., according to research consultants, Frost & Sullivan. |
| • | The reliability and scale of our fleet and planned launches of new and replacement satellites allows us to address changing demand for satellite coverage and to provide mission-critical communications capabilities. For instance, our Intelsat 22 satellite will host a UHF payload under a 10-year agreement with the Australian Defense Force. |
| • | Our business generated from the government sector is generally characterized by annual contracts with multi-year renewal options, consistent with U.S. government procurement practices. We have historically been successful in achieving very high renewal rates on our government sector business, which were above 88% on an annual basis in 2008 and 2009. |
10
Table of Contents
| • | The U.S. government and military is one of the largest users of commercial FSS satellites for government/military applications on a global basis. We currently serve more than 200 U.S. government customers, either directly or as a sub-contractor. |
| • | According to Frost & Sullivan, U.S. government and military spending on commercial satellite capacity is expected to grow by a CAGR of 15.6% from 2010 to 2015. |
Our Diverse Business
Our revenue and backlog diversity spans customer sets and applications, as discussed above, as well as geographic regions and satellites. We believe our diversity allows us to recognize trends to capture new growth opportunities, and gain experience that can be transferred to customers in different regions.
We believe we are the sector leader by transponder share in all but one of the geographic regions covered by our network, and our leading positions align to the regions identified by industry analysts as those that either purchase the most satellite capacity or are emerging regions that have the highest growth prospects, such as Africa and Latin America.
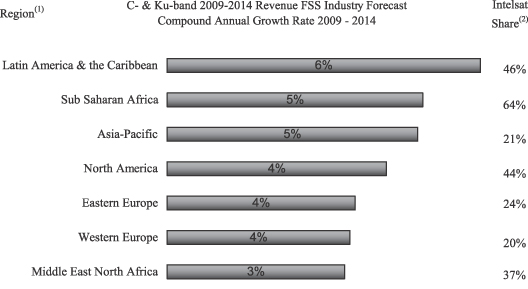
| Source: | NSR , Global Assessment of Satellite Demand: 6th Edition, September 2009 |
| (1) | Excludes Atlantic Ocean and Pacific Ocean regions |
| (2) | Based on C-band and Ku-band in-use transponders, share by region as of 12/31/08 |
Our diversity also reduces our business risk. The diversity of our revenue and customer base enables us to capitalize on changing market conditions and mitigates the impact of fluctuations in any specific customer type or geographic region. The scale of our fleet can also reduce the financial impact of satellite failures and protect against service interruption. No single satellite generated more than 4% of our revenue and no single customer accounted for more than 4% of our revenue for the year ended December 31, 2009.
11
Table of Contents
By region and service sector, our backlog as of December 31, 2009 was as follows:
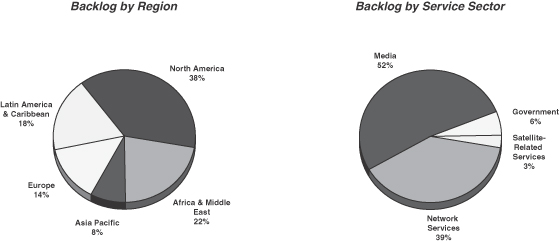
Note: Regional designation for backlog is based on customer billing address.
Our Strategy
We seek revenue growth and increased cash flows by expanding our leading FSS business in high growth regions and applications while maintaining our focus on operational discipline. Given our efficient operating structure, we believe our strategies will position us to continue to deliver high operating margins, and to generate strong cash flow and growth as our current fleet investment program is completed. The key components of our strategy include the following:
Focus our core business on attractive and growing applications
We have an industry-leading position in each of the customer sets served by our business. We believe our global network and regional strengths will allow us to capture new business opportunities as a result of the following:
Network Services:
| • | Growth in multinational enterprise broadband access requirements resulting from globalization; |
| • | The continued expansion of cellular networks and voice and data growth in emerging regions with inadequate infrastructure; and |
| • | New broadband connectivity requirements for aerial and maritime applications. |
Media:
| • | Content and format proliferation, such as standard definition and high definition formats, increasing the capacity needs of our programmer customers; |
12
Table of Contents
| • | New and expanding DTH platforms in fast growing emerging regions; and |
| • | Programmers and broadcasters seeking new global distribution capabilities to deliver content in new regions. |
Government:
| • | The need for broadband and turn-key networks for in-theatre communications; |
| • | Rapidly increasing bandwidth requirements resulting from the use of manned and unmanned aerial vehicles; and |
| • | Hosted payload opportunities as government customers increasingly seek timely and cost efficient access to space, filling capacity gaps by co-locating their space assets on commercial satellites. |
Optimize our space-based assets, including orbital locations and spacecraft
We are conducting a significant capital expenditure fleet investment program during the five-year period from 2008 to 2012. Our program is designed to position the Intelsat satellite network to capitalize on the FSS sector’s best growth opportunities globally, while providing optimal coverage to meet needs across our targeted customer sets. By the conclusion of the current investment cycle in 2012, the characteristics of our refreshed fleet are expected to include the following:
| • | A significant increase in the proportion of high-power, land mass-focused transponders suitable for broadband and video applications, which typically command a higher price, resulting in an opportunity to increase the overall yield on our fleet; |
| • | Expanded capacity to serve our faster-growth network services and government customers, particularly in emerging markets; |
| • | Expanded capacity at our most valuable regional video distribution neighborhoods; |
| • | Reduced risk of anomalies resulting from the replacement of satellites with known health issues; |
| • | No significant increase in the total amount of station-kept transponder capacity; and |
| • | A longer average remaining useful life of our satellite fleet. |
Incorporate new technology into our core network to capture growth from new applications and next generation customer requirements
Our global scale, diversity, collection of spectrum rights, technical expertise and fully integrated hybrid network form a strategic platform that positions us to identify and capitalize on new opportunities in satellite services. Our fleet is large and diversified by coverage, manufacturer and age. As satellites reach the end of their service lives, we have an ongoing opportunity to refresh the technology we use to serve our customers, resulting in flexibility to address new opportunities as they are identified. Our newer assets, including our enhanced terrestrial network, are used to address current market requirements, allowing older assets to be redeployed to serve legacy customer applications still efficiently served by those assets.
As a result, we believe that we are well positioned to accommodate new business models as they are adopted by our customers. We expect to benefit from the general trend towards IP-based networking and distribution, including growing use of new media formats, as well as infrastructure applications in emerging regions.
We are also investing in enhanced technology in our terrestrial network to deliver converging video and IP content, thus expanding the services we provide to the media and telecommunications industries. We intend to continue to implement compression technologies into our ground network to reduce the bandwidth necessary for
13
Table of Contents
network service applications, increasing our customers’ efficiency and expanding our market potential, particularly in emerging regions. Finally, we intend to leverage our frequent satellite launches to offer government and other customers the ability to integrate their payloads with our spacecraft, providing fast and cost-effective access to space.
Opportunistically use acquisitions and creative business structures for cost-efficient growth and attractive returns
Our record of capitalizing on strategic growth opportunities through targeted acquisitions and business ventures is well established. In addition, we have demonstrated our ability to integrate acquisitions efficiently and quickly, due to our scale and our centralized satellite operations philosophy. In 2006, we completed the largest acquisition in the history of the FSS sector with our $6.4 billion acquisition of PanAmSat Holding Corporation. In recent years, we have completed other, smaller transactions involving single satellites with partners in diverse regions, such as JSAT International Inc. (“JSAT”) in Asia, Telenor Inma AS (“Telenor”) in Europe, and Convergence SPV Ltd. (“Convergence Partners”) in Africa. We will continue to evaluate potential asset purchases, joint ventures and creative business and financial structures that complement our global fleet, provide growth capacity and allow us to respond to customer needs.
Our Network
Our global network is comprised of 54 satellites and ground facilities, including teleports and leased fiber that support our commercial services and the operation and control of our satellites.
Our customers depend on our global communications network and our operational and engineering leadership. Highlights of our network include:
| • | Prime orbital locations, reflecting a valuable portfolio of coordinated fixed satellite spectrum rights; |
| • | Highly reliable services, including network availability of 99.9998% on station-kept satellites for the year ended December 31, 2009; |
| • | Flexibility to relocate satellites to other orbital locations as demand patterns change; |
| • | Design features and steerable beams on many of our satellites that enable us to reconfigure capacity to provide different areas of coverage; and |
| • | Resilience, with multiple satellites serving each region, allowing for improved restoration alternatives should a satellite anomaly occur. |
14
Table of Contents
The table below provides a summary of our satellite fleet as of December 31, 2009. It does not include IS-15, which was successfully launched on November 30, 2009 and placed into service in January 2010, and IS-16, which was successfully launched on February 11, 2010 and will be placed into service in March 2010.
| Satellite |
Manufacturer |
Orbital |
Launch Date | Estimated End of Service Life(1) | ||||
| Station Kept: |
||||||||
| IS-701 |
SS/L(2) | 180°E | 10/93 | 1/12 | ||||
| IS-702 |
SS/L | 66°E | 6/94 | 5/12 | ||||
| IS-706 |
SS/L | 54.85°E | 5/95 | 1/13 | ||||
| IS-707 |
SS/L | 307°E | 3/96 | 3/13 | ||||
| IS-709 |
SS/L | 85.15°E | 6/96 | 6/12 | ||||
| IS-802 |
LMC(3) | 32.9°E | 6/97 | 9/10 | ||||
| IS-805 |
LMC | 304.5°E | 6/98 | 6/16 | ||||
| IS-901 |
SS/L | 342°E | 6/01 | 6/19 | ||||
| IS-902 |
SS/L | 62°E | 8/01 | 8/19 | ||||
| IS-903 |
SS/L | 325.5°E | 3/02 | 4/19 | ||||
| IS-904 |
SS/L | 60°E | 2/02 | 1/20 | ||||
| IS-905 |
SS/L | 335.5°E | 6/02 | 6/20 | ||||
| IS-906 |
SS/L | 64.15°E | 9/02 | 9/20 | ||||
| IS-907 |
SS/L | 332.5°E | 2/03 | 2/21 | ||||
| IS-10-02(4) |
EADS Astrium | 359°E | 6/04 | 1/22 | ||||
| Galaxy 19 |
SS/L | 97°W | 9/08 | 9/24 | ||||
| Galaxy 23(5) |
SS/L | 121°W | 8/03 | 8/21 | ||||
| Galaxy 25 |
SS/L | 93.1°W | 5/97 | 5/15 | ||||
| Galaxy 26 |
SS/L | 50.75°E | 2/99 | 3/11 | ||||
| Galaxy 27 |
SS/L | 129°W | 9/99 | 10/11 | ||||
| Galaxy 28 |
SS/L | 89°W | 6/05 | 10/22 | ||||
| HGS-3 |
BSS(6) | 38°E | 2/96 | 9/11 | ||||
| IS-1R |
BSS | 50°W | 11/00 | 2/16 | ||||
| IS-4(7) |
BSS | 72°E | 8/95 | 8/10 | ||||
| IS-5 |
BSS | 169°E | 8/97 | 10/12 | ||||
| IS-7 |
SS/L | 68.65°E | 9/98 | 11/13 | ||||
| IS-8 |
SS/L | 166°E | 11/98 | 1/14 | ||||
| IS-9 |
BSS | 58°W | 7/00 | 10/12 | ||||
| IS-10(8) |
BSS | 68.5°E | 5/01 | 6/16 | ||||
| IS-11 |
ORB(9) | 317°E | 10/07 | 10/23 | ||||
| IS-12 |
SS/L | 45°E | 10/00 | 1/16 | ||||
| IS-14 |
SS/L | 315°E | 11/09 | TBD | ||||
| IS-25 |
SS/L | Drift(10) | 07/08 | 7/24 | ||||
| Galaxy 3C |
BSS | 95.05°W | 6/02 | 9/20 | ||||
| Galaxy 11 |
BSS | 32.8°E | 12/99 | 4/15 | ||||
| Galaxy 12 |
ORB | 123.1°W | 4/03 | 4/20 | ||||
| Galaxy 13/Horizons-1(11) |
BSS | 127°W | 9/03 | 12/18 | ||||
| Galaxy 14 |
ORB | 125°W | 8/05 | 12/20 | ||||
| Galaxy 15 |
ORB | 133°W | 10/05 | 10/22 | ||||
| Galaxy 16 |
SS/L | 99°W | 6/06 | 6/24 | ||||
| Galaxy 17 |
Thales(12) | 91°W | 5/07 | 5/23 | ||||
| Galaxy 18 |
SS/L | 123°W | 5/08 | 5/24 | ||||
| Horizons-2(13) |
ORB | 74.05°W | 12/07 | 12/23 |
15
Table of Contents
| Satellite |
Manufacturer |
Orbital |
Launch Date | Estimated End of Service Life(1) | ||||
| Inclined Orbit: |
||||||||
| IS-601 |
BSS | 47.5°E | 10/91 | 5/12 | ||||
| IS-602 |
BSS | 177.85°E | 10/89 | 8/11 | ||||
| IS-603 |
BSS | 340.05°E | 3/90 | 3/13 | ||||
| IS-705 |
SS/L | 310°E | 3/95 | 11/12 | ||||
| IS-801 |
LMC | 328.5°E | 3/97 | 8/13 | ||||
| Leasat F5(14) |
BSS | 100°E | 1/90 | 3/11 | ||||
| IS-2 |
BSS | 169.1°E | 7/94 | 7/11 | ||||
| Galaxy 9(15) |
BSS | 81°W | 5/96 | 7/10 | ||||
| IS-3R |
BSS | 43.1°W | 1/96 | 7/11 | ||||
| IS-24 |
IAI (16) | 47.3°E | 5/96 | 1/14 | ||||
| IS-26 |
BSS | Drift(17) | 2/97 | 12/14 |
| (1) | Engineering estimates of the service life as of December 31, 2009 as determined by remaining fuel levels, consumption rates and other considerations (including power) and assuming no relocation of the satellite. |
| (2) | Space Systems/Loral, Inc. |
| (3) | Lockheed Martin Corporation. |
| (4) | Telenor owns 18 transponders (measured in equivalent 36 MHz transponders) of this satellite’s Ku-band payload. |
| (5) | EchoStar Communications Corporation owns all of this satellite’s Ku-band transponders and a portion of the common elements of the satellite. |
| (6) | Boeing Satellite Systems, Inc., formerly Hughes Aircraft Company. |
| (7) | On February 1, 2010, the backup spacecraft control processor (“SCP”) on IS-4 failed, resulting in a loss of the spacecraft. |
| (8) | In the first quarter of 2010, IS-10 lost its secondary Xenon-Ion Propulsion System (“XIPS”) and is now operating on its backup bi-propellant system. The revised estimated end of service life is now estimated to be September 2013. See—Satellite Health and Technology—Other Anomalies for a discussion of propulsion system anomalies on our BSS 601 HP satellites. |
| (9) | Orbital Sciences Corporation. |
| (10) | This satellite is drifting to its permanent location at 328.5°E and is expected to arrive in April 2010. |
| (11) | Horizons Satellite Holdings, LLC (“Horizons”), our joint venture with JSAT, owns and operates the Ku-band payload on this satellite. We are the exclusive owner of the C-band payload. |
| (12) | Thales Alenia Space. |
| (13) | Horizons owns and operates the payload on this satellite. |
| (14) | Leasat F5 provides services in the X-band and UHF-band frequencies for military applications. |
| (15) | Galaxy 9 was relocated from 74.15ºW to 81ºW and placed into an inverted North/South attitude in order to serve Latin America. |
| (16) | Israel Aerospace Industries, Ltd. |
| (17) | This satellite is drifting to its permanent location at 50.5°E and is expected to arrive in May 2010. |
Satellite Systems
There are three primary types of commercial communications satellite systems: low-earth orbit systems, medium-earth orbit systems and geosynchronous systems. All of our satellites are geosynchronous satellites and are located approximately 22,300 miles, or 35,700 kilometers, above the equator. These satellites can receive radio frequency communications from an origination point, relay those signals over great distances and distribute those signals to a single receiver or multiple receivers within the coverage areas of the satellites’ transmission beams.
16
Table of Contents
Geosynchronous satellites send these signals using various parts of the radio frequency spectrum. The spectrum available for use at each orbital location includes the following frequency bands in which most commercial satellite services are offered today:
| • | C-band—low power, broad beams requiring use of relatively larger antennae, valued as spectrum least susceptible to transmission impairments such as rain; |
| • | Ku-band—high power, narrow to medium size beams facilitating use of smaller antennae favored by businesses, but somewhat less reliable due to weather-related impairments; and |
| • | Ka-band—very high power, very narrow beams facilitating use of very small transmit/receive antennae, but less reliable due to high transmission impairments such as rain. The Ka-band is utilized for various applications, including broadband services. |
Substantially all of the station-kept satellites in our fleet are designed to provide capacity using the C- and/or Ku-bands of this spectrum.
A geosynchronous satellite is referred to as geostationary, or station-kept, when it is operated within an assigned orbital control, or station-keeping box, which is defined by a specific range of latitudes and longitudes. Geostationary satellites revolve around the earth with a speed that corresponds to that of the earth’s rotation and appear to remain above a fixed point on the earth’s surface at all times. Geosynchronous satellites that are not station-kept are in inclined orbit. The daily north south motion of a satellite in inclined orbit exceeds the specified range of latitudes of its assigned station-keeping box, and the satellite appears to oscillate slowly, moving above and below the equator every day. An operator will typically operate a satellite in inclined orbit toward the end of its service life because the operator is able to save significant amounts of fuel by not controlling the north-south position of the satellite and is thereby able to substantially extend the service life of the satellite. The types of services and customers that can access an inclined orbit satellite have traditionally been limited due to the movement of the satellite relative to a fixed ground antenna, however, recent technology innovations now allow the use of inclined orbit capacity for certain applications. As a result, we anticipate demand for inclined orbit capacity may increase over the next few years if these applications are successfully introduced. As of December 31, 2009, eleven of our satellites were operating in an inclined orbit, with most continuing to earn revenue beyond our original estimated life for each of these satellites.
In-Orbit Satellites
We believe that our strong operational performance is due primarily to our satellite procurement and operations philosophy. Our operations and engineering staff is involved from the design through the decommissioning of each satellite that we procure. Our staff works at the manufacturers’ and launchers’ sites to monitor progress, allowing us to maintain close technical collaboration with our contractors during the process of designing, manufacturing and launching a satellite. We continue our engineering involvement throughout the operating lifetime of each satellite. Extensive monitoring of earth station operations and around-the-clock satellite control and network operations support ensure our consistent operational quality, as well as timely corrections when problems occur. In addition, we have in place contingency plans for technical problems that may occur during the lifetime of a satellite.
These features also contribute to the resilience of our network, which enables us to ensure the continuity of service that is important for our customers and to retain revenue in the event that we need to move customers to alternative capacity. The design flexibility of some of our satellites enables us to meet customer demand and respond to changing market conditions.
As of December 31, 2009 our in-orbit fleet of satellites had 1,231 and 798 36-MHz equivalent transponders available for transmitting in the C-band and the Ku-band, respectively. These totals measure transponders on station-kept satellites. The average system fill factor for our satellites, which represents the percentage of our total available transponder capacity that is in use or that is reserved at a given time (including guaranteed reservations for service), was 83.1% as of December 31, 2009.
17
Table of Contents
The design life of a satellite is the length of time that the satellite’s hardware is designed by the manufacturer to remain operational under normal operating conditions. In contrast, a satellite’s orbital maneuver life is the length of time the satellite has enough fuel to remain operational. A satellite’s service life is based upon fuel levels and other considerations, including power. Satellites launched in the recent past are generally expected to remain in service for the lesser of maneuver life or 16 years. Satellites typically have enough fuel to maintain between 16 and 18 years of station-kept operations. The average remaining service life of our satellites was approximately 8.1 years as of December 31, 2009 weighted on the basis of nominally available capacity for the station-kept satellites we own.
Planned Satellites
As of December 31, 2009 we had orders for the following nine satellites including the Intelsat New Dawn satellite, of which six are replacement satellites. Generally, these satellites are being built over a period of three years. In the following table, a replacement satellite refers to a planned satellite of which certain customers may have the option of continuity of service between the existing satellite operating at the designated role and the planned satellite.
| Satellite |
Manufacturer |
Role |
Earliest Launch Date |
Expected | ||||
| IS-16 |
Orbital | New satellite originally planned to be a ground spare for IS-11 in the event of an unsuccessful launch. IS-11 was launched successfully. IS-16 will be located at 58°W. | Q1 2010(1) |
Proton | ||||
| IS-17 |
SS/L | Replacement satellite for IS-702 located at 66°E. | Q1 2011 | Sea Launch | ||||
| IS-18 |
Orbital | Replacement satellite for IS-701 located at 180°E. | Q1 2011 | Land Launch | ||||
| IS-19 |
SS/L | Replacement satellite for IS-8 located at 166°E. | Q1 2012 | TBD | ||||
| IS-20 |
SS/L | Replacement satellite for IS-10 and IS-7 co-located at 68.5°E. | Q1 2012 | TBD | ||||
| IS-21 |
Boeing | Replacement satellite for IS-9 located at 302°E. | Q2 2012 | TBD | ||||
| IS-22 |
Boeing | Satellite that includes a specialized UHF communications payload built in connection with an agreement with the Australian Defense Force. To be located at 72°E. | Q1 2012 | TBD | ||||
| IS-23 |
TBD | Replacement satellite for IS-707 located at 307°E. | Q1 2012 | TBD | ||||
| Intelsat New Dawn |
Orbital | New satellite of our New Dawn joint venture expected to serve Africa. To be located at 33°E. | Q4 2010 | Arianespace | ||||
| (1) | IS-16 was launched successfully on February 11, 2010 and is expected to be placed into service in March 2010. |
Launch Services Agreements
During the third quarter of 2008, we entered into a launch services agreement with Sea Launch providing for up to four satellite launches. Sea Launch has recently filed a voluntary petition for relief under Chapter 11 of the Bankruptcy Code. See Item 1A—Risk Factors—Risk Factors Relating to Our Industry—Our dependence on outside contractors could result in increased costs and delays related to the launch of our new satellites, which could in turn adversely affect our business, operating results, liquidity and financial condition.
18
Table of Contents
Future Satellites
We would expect to replace other existing satellites, as necessary, with satellites that meet customer needs and that have a compelling economic rationale. We periodically conduct evaluations to determine the current and projected strategic and economic value of our existing and any planned satellites and to guide us in redeploying satellite resources as appropriate.
Network Operations and Current Ground Facilities
We control and operate each of our satellites and manage the communications services for which each satellite is used from the time of its initial deployment through the end of its operational life, and we believe that our technical skill in performing these critical operations differentiates us from our competition. We provide most of these services from our satellite operations centers in Washington, D.C. and Long Beach, California and our customer service center in Ellenwood, Georgia. In the event of a natural disaster or other situation disabling one of the facilities, each satellite operations center has the functional ability to provide instantaneous restoration of services on behalf of the other, demonstrating the efficiency and effectiveness of our network. Utilizing state-of-the-art satellite command and control hardware and software, our satellite operations centers analyze telemetry from our satellites in order to monitor their status and track their location.
Our satellite operations centers use a network of ground facilities to perform their functions. This network includes 17 earth stations (“TT&C stations”) that provide tracking, telemetry and control (“TT&C”) services for our satellites and various other earth stations worldwide. Through our ground facilities, we constantly monitor signal quality, protect bandwidth from piracy or other interference and maintain customer installed equipment.
Our customer service center located in Ellenwood, Georgia includes a specialized video operations center, data operations center, and rapid access center. This facility is responsible for managing the communications services that we provide to our customers and is the first point of contact for customers needing assistance in using our network. We also maintain a back-up operations facility and data center a relatively short distance from our Washington, D.C. facility in Hagerstown, Maryland. This facility provides back-up emergency operational services in the event that our Ellenwood, Georgia customer service center experiences an interruption.
We have invested heavily in our fully integrated terrestrial network which complements our satellite network. Our network includes teleport, leased fiber and network performance monitoring systems and enables us to provide end-to-end managed solutions to our customers. In addition to leased fiber connecting high-density routes, our ground network also features strategically located points of presence, which are drop-off points for our customers’ traffic that are close to major interconnection hubs for telecommunications applications, video transmissions and trunking to the Internet backbone. We are enhancing our terrestrial network to an all IP network environment that will improve our ground support of high bandwidth applications such as HD video. We believe the CISCO-based network architecture will effectively allow us to converge our media and network services terrestrial network infrastructures, resulting in reduced costs, and will provide opportunities for generating additional revenue from existing and new customers by bundling combinations of media and network services products that can be offered through a single access circuit into our network.
Capacity Sparing and Backup and General Satellite Risk Management
As part of our satellite risk management, we continually evaluate, and design plans to mitigate, the areas of greatest risk within our fleet, especially for those satellites with known technical risks. We believe that the availability of spare transponder services capacity, together with the overlapping coverage areas of our satellites and flexible satellite design features described in —Our Network—Satellite Systems above, are important aspects of our ability to provide reliable service to our customers. In addition, these factors could help us to mitigate the financial impact to our operations attributable to the occurrence of a major satellite anomaly, including the loss of a satellite. Although we do not maintain backup for all of our transponder services operating
19
Table of Contents
capacity, we maintain some form of backup capacity for each satellite designated as being in primary operating service. Our restoration backup capacity may include any one or more of the following:
| • | designated reserve transponders on the satellite or other on-board backup systems or designed-in redundancies, |
| • | an in-orbit spare satellite, or |
| • | interim restoration capacity on other satellites. |
In addition, we provide some capacity on a preemptible basis and could preempt the use of this capacity to provide backup capacity in the event of a loss of a satellite.
We typically obtain launch insurance for our satellites at the time of launch and will decide whether or not to obtain such insurance taking into consideration launch insurance rates, terms of available coverage and alternative risk management strategies, including the availability of backup satellites and transponders in the event of a launch failure. Launch insurance coverage is typically in an amount equal to the fully capitalized cost of the satellite, which generally includes the construction costs, the portion of the insurance premium related to launch, the cost of the launch services and capitalized interest (but may exclude any unpaid incentive payments to the manufacturer).
Five of the satellites in our fleet are covered by in-orbit insurance. In-orbit insurance coverage may initially be for an amount comparable to launch insurance levels, generally decreases over time and is typically based on the declining book value of the satellite. We do not currently insure against lost revenue in the event of a total or partial loss of a satellite.
One of the five insured satellites, Galaxy 13/Horizons-1, was covered by an insurance policy with substantial exclusions or exceptions to coverage for failures of specific components identified by the underwriters as at risk for possible failure, primarily related to XIPS related anomalies (“Significant Exclusion Policies”). The Significant Exclusion Policies reduce the probability of an insurance recovery in the event of a loss on this satellite.
Sales, Marketing and Distribution Channels
Our company tagline, “Closer, by far,” describes the close working relationship we strive to build with our customers. Our Intelsat Global Sales & Marketing Ltd. subsidiary (“Intelsat Global Sales”), located in London, England, is our global sales and marketing headquarters. In addition, we have established local sales and marketing support offices in the following locations around the world:
| • Australia |
• Japan | |
| • Brazil |
• Mexico | |
| • China |
• Singapore | |
| • France |
• South Africa | |
| • Germany |
• United Arab Emirates | |
| • India |
• United States | |
By establishing local offices closer to our customers and staffing those offices with experienced personnel, we believe that we are able to provide flexible and responsive service and technical support to our customers. Our sales and marketing organization reflects our corporate focus on our three principal customer sets of network services, media and government. Our sales team includes technical marketing and sales engineering application expertise and a sales approach focused on creating integrated solutions for our customers’ communications requirements.
We use a range of direct and wholesale distribution methods to sell our services, depending upon the region, applicable regulatory requirements and customer application.
20
Table of Contents
Satellite Health and Technology
Our satellite fleet is diversified by manufacturer and satellite type, and as a result, our fleet is generally healthy, with 99.9998% availability of station-kept satellite capacity during the year ended December 31, 2009. We have experienced some technical problems with our current fleet but have been able to minimize the impact of these problems on our customers, our operations and our business in recent years. Many of these problems have been component failures and anomalies that have had little long-term impact to date on the overall transponder availability in our satellite fleet. All of our satellites have been designed to accommodate an anticipated rate of equipment failures with adequate redundancy to meet or exceed their orbital design lives, and to date, this redundancy design scheme has proven effective. After each anomaly we have generally restored services for our customers on the affected satellite, provided alternative capacity on other satellites in our fleet, or provided capacity that we purchased from other satellite operators.
Significant Anomalies
On January 14, 2005, our IS-804 satellite experienced a sudden and unexpected electrical power system anomaly that resulted in the total loss of the satellite. IS-804 was a Lockheed Martin 7000 series (the “LM 7000 series”) satellite, and as of December 31, 2009 we operated three other satellites in the LM 7000 series, IS-801, IS-802 and IS-805. Of these three satellites, only IS-805 remains in a primary role. Based on the report of the failure review board that we established with Lockheed Martin Corporation, we believe that the IS-804 failure was not likely to have been caused by an IS-804 specific workmanship or hardware element, but was most likely caused by a high current event in the battery circuitry triggered by an electrostatic discharge that propagated to cause the sudden failure of the high voltage power system. We therefore believe that although this risk exists for our other LM 7000 series satellites, the risk of any individual satellite having a similar anomaly is low.
On September 21, 2006, our IS-802 satellite experienced a reduction of electrical power capability that resulted in a degraded capability of the satellite. A substantial subset of transponders on IS-802 were subsequently reactivated and are operating normally. The anomaly review board that we established with Lockheed Martin Corporation to investigate the cause of the anomaly concluded that the IS-802 anomaly was most likely caused by an electrical short internal to the solar array harness located on the south solar array boom. The anomaly review board found that this anomaly was significantly different from previous LM 7000 series spacecraft failures and was the first failure of this type on a solar array of the LM 7000 series. We therefore believe that although this risk exists for our other LM 7000 series satellites, the risk of any individual satellite having a similar anomaly is low.
On November 28, 2004, our Galaxy 27 satellite experienced a sudden anomaly in its north electrical distribution system which resulted in the loss of control of the satellite and the interruption of customer services on the satellite. Galaxy 27 is a FS 1300 series satellite manufactured by SS/L. Our engineers were able to regain command and control of Galaxy 27, and it was placed back in service, with reduced payload capacity, following operational testing. We have determined that the north electrical distribution system on Galaxy 27 and the communications capacity associated with it are not operational, and the satellite has lost redundancy in nearly all of its components. As a result, Galaxy 27 faces an increased risk of loss in the future. As of December 31, 2009, a substantial subset of Galaxy 27’s transponders, which are all powered by the south electrical distribution system, have been tested, are performing normally and are available for service to our customers. Some of these transponders are currently being used by our customers.
On June 29, 2008, our Galaxy 26 satellite experienced a sudden and unexpected electrical distribution anomaly causing the loss of a substantial portion of the satellite power generating capability and resulting in the interruption of some of the customer services on the satellite. Galaxy 26 is also a FS 1300 series satellite. Certain transponders continue to operate normally. However, the anomaly resulted in a reduction to the estimated remaining useful life of the satellite.
With respect to both the Galaxy 27 and Galaxy 26 anomalies, the failure review boards that we established with SS/L identified the likely root cause of the anomalies as a design flaw which is affected by a number of
21
Table of Contents
parameters and in some extreme cases can result in an electrical system anomaly. The design flaw also exists on IS-8. This satellite has been in service since November 1998 and has not experienced an electrical system anomaly. Along with the manufacturer, we continually monitor this problem and we have ordered a replacement for IS-8 expected to be launched in 2012.
Other Anomalies
We have also identified three other types of common anomalies among the satellite models in our fleet, which have had an operational impact in the past and could, if they materialize, have an impact in the future. These are:
| • | failure of the SCP in Boeing 601 (“BSS 601”) satellites; |
| • | failure of the on-board XIPS used to maintain the in-orbit position of Boeing 601 High Power Series (“BSS 601 HP”) satellites; and |
| • | accelerated solar array degradation in early Boeing 702 (“BSS 702”) satellites. |
SCP Failures. Many of our satellites use an on-board SCP to provide automatic on-board control of many operational functions. SCPs are a critical component in the operation of such satellites. Each such satellite has a backup SCP, which is available in the event of a failure of the primary SCP. Certain BSS 601 satellites have experienced SCP failures. The risk of SCP failure appears to decline as these satellites age.
As of December 31, 2009, we operated five BSS 601 satellites: HGS-3, which is utilized by a third-party, IS-2, IS-3R, IS-4, which had previously experienced primary SCP failure and was operating on its backup SCP, and IS-26. These satellites have been identified as having heightened susceptibility to the SCP problem. On February 1, 2010, the backup SCP on IS-4 failed, resulting in a loss of the spacecraft. IS-4 carried commercial traffic and operated in a secondary role. Its failure did not cause a significant interruption of our business or require replacement of a satellite. IS-2, IS-3R and IS-26 have been in continuous operation since 1994, 1996 and 1997, respectively. Both primary and backup SCPs on these satellites are monitored regularly and remain fully functional. Accordingly, we believe it is unlikely that additional SCP failures will occur; however, should they occur, we do not anticipate an interruption in business or early replacement of these satellites as a result.
BSS 601 HP XIPS. The BSS 601 HP satellite uses XIPS as its primary propulsion system. There are two separate XIPS on each BSS 601 HP, each one of which is capable of maintaining the satellite in its orbital position. The satellite also has a completely independent bi-propellant propulsion system as a backup to the XIPS. As a result, the failure of a XIPS on a BSS 601 HP typically would have no effect on the satellite’s performance or its operating life. However, the failure of both XIPS would require the use of the backup bi-propellant propulsion system, which could result in a shorter operating life for the satellite depending on the amount of bi-propellant fuel remaining. XIPS failures do not typically result in a catastrophic failure of the satellite or affect the communications capability of the satellite.
As of December 31, 2009, we operated four BSS 601 HP satellites, IS-5, IS-9, IS-10 and Galaxy 13/Horizons-1. IS-5 and Galaxy 13/Horizons-1 continue to have both XIPS available as their primary propulsion system. IS-9 and IS-10 have experienced the failure of both XIPS and are operating on their backup bi-propellant systems. These two satellites are expected to be replaced by 2012. Our BSS 601 HP satellites had available bi-propellant fuel for a range of approximately two and a half to eight years from December 31, 2009. No assurance can be given that we will not have further XIPS failures that result in shortened satellite lives. We have decommissioned three satellites that had experienced failure of both XIPS. IS-6B was replaced by IS-11 during the first quarter of 2008, Galaxy 10R was replaced by Galaxy 18 during the second quarter of 2008, and Galaxy 4R was decommissioned in March 2009.
BSS 702 Solar Arrays. All of our satellites have solar arrays that power their operating systems and transponders and recharge the batteries used when solar power is not available. Solar array performance typically degrades over time in a predictable manner. Additional power margins and other operational flexibility are
22
Table of Contents
designed into satellites to allow for such degradation without loss of performance or operating life. Certain BSS 702 satellites have experienced greater than anticipated degradation of their solar arrays resulting from the design of the solar arrays. Such degradation, if continued, results in a shortened operating life of a satellite or the need to reduce the use of the communications payload.
As of December 31, 2009, we operated three BSS 702 satellites, two of which are affected by accelerated solar array degradation, Galaxy 11 and IS-1R. Service to customers has not been affected, and we expect that both of these satellites will continue to serve customers until we replace or supplement them with new satellites. Along with the manufacturer, we continually monitor the problem to determine its cause and its expected effect. Due to this continued degradation, Galaxy 11’s estimated end of service life is April 2015 and IS-1R’s estimated end of service life is February 2016. Both satellites are currently operating in secondary roles. The third BSS 702 satellite that we operated as of December 31, 2009, Galaxy 3C, was launched after the solar array anomaly was identified, and it has a substantially different solar array design intended to eliminate the problem. This satellite has been in service since September 2002 and has not experienced similar degradation problems.
Competition
We compete in the communications market for the provision of video, data and voice connectivity worldwide. Communications services are provided using various communications technologies, including satellite networks, which provide services as a substitute for, or as a complement to, the capabilities of terrestrial networks. See—The FSS Sector above for a description of the FSS sector generally and the advantages of satellite communications.
We are a satellite operator that operates worldwide. Our competition includes providers of fixed satellite services of varying size. We also face significant competition from suppliers of terrestrial communications capacity. We compete with other satellite operators for both point-to-multipoint and point-to-point services. We compete with fiber optic cable operators principally for point-to-point services.
We also face competition from resellers of FSS and fiber capacity. Resellers purchase FSS or fiber capacity from current or future providers and then resell the capacity to their customers. Capacity for resale is readily available because resellers can typically procure capacity on short notice, given that FSS and fiber capacity is available.
We compete with providers of terrestrial fiber optic cable capacity on certain routes and networks. As a result, we have been experiencing, and expect to continue to experience, a decline in our channel product revenue due to the build-out of fiber optic cable capacity. However, we believe that satellites have advantages over fiber optic cables in certain regions and for certain applications. The primary use of fiber optic cable is carrying high-volume communications traffic from point to point, and fiber capacity is available at substantially lower prices than satellite capacity once operational. Consequently, the growth in fiber optic cable capacity on point-to-point transoceanic routes, particularly across the Atlantic Ocean, has led voice, data and video contribution customers that require service between major city hubs to migrate from satellite to fiber optic cable. However, satellite capacity remains competitive for signals that need to be transmitted beyond the main termination points of fiber optic cable, for point-to-multipoint transmissions and for signals seeking to bypass congested terrestrial networks. Satellite capacity is also competitive in parts of the world where providing fiber optic cable capacity is not yet cost-effective or is physically not feasible. We believe that in those applications and regions where we do compete with fiber optic cable companies, the basis for competition is primarily price.
Regulation
As an operator of privately owned global satellite systems, we are subject to U.S. government regulation; regulation by foreign national telecommunications authorities; and the ITU frequency coordination process and regulations.
23
Table of Contents
U.S. Government Regulation
FCC Regulation. Almost all of the satellites in our current constellation are licensed and regulated by the Federal Communications Commission, or the FCC. We have final or temporary FCC authorization for all of our U.S.-licensed operating satellites. Satellite licenses typically have a fifteen-year term. At the end of a license term, we can request special temporary authorization or a license modification to continue operating a satellite. In addition, our FCC satellite licenses which relate to use of those orbital locations and associated frequencies that were transferred to the United States at the time of our privatization in July 2001 are conditioned on our remaining a signatory to the Public Services Agreement with the International Telecommunications Satellite Organization described below under —Our History—The Privatization. Furthermore, any transfer of these licenses by us to a third party or a successor-in-interest is only permitted if such third party or successor-in-interest has undertaken to perform our obligations under the Public Services Agreement.
Changes to our satellite system generally require prior FCC approval. From time to time, we have pending applications for permanent or temporary changes in orbital locations, frequencies and technical design. From time to time, we also file applications for replacement or additional satellites. Replacement satellite applications are eligible for streamlined processing if they are unopposed and propose technical characteristics consistent with those of the satellite that is being replaced. In the case of additional FSS geostationary satellites, the FCC processes requests for new orbital locations or frequencies on a first come, first served basis and requires licensees to post a $3.0 million bond and to comply with a schedule of progress “milestones,” establishing deadlines to sign a satellite construction contract; complete critical design review; begin spacecraft construction; and launch and operate the satellite. Upon completion of each milestone, the amount of the bond is reduced proportionately. A satellite licensee not satisfying a milestone will lose its license and must forfeit the remaining amount on its bond absent circumstances warranting a milestone extension under the FCC’s rules and policies.
We have subsidiaries that hold other FCC licenses, including earth station licenses associated with technical facilities located in several states and in Washington, D.C. We must pay FCC filing fees in connection with our space station and earth station applications, and we must also pay annual regulatory fees to the FCC. Violations of the FCC’s rules can result in various sanctions including fines, loss of authorizations or the denial of applications for new authorizations or the renewal of existing authorizations.
We are not regulated as a common carrier for most of our activities, therefore we are not subject to rate regulation or the obligation not to discriminate among customers and we operate most of our activities with minimal governmental scrutiny of our business decisions. One of our subsidiaries is regulated as a common carrier. Common carriers are subject to FCC requirements, which include: traffic and revenue reports, international circuit status reports, international interconnected private line reports, notification and approval for foreign carrier affiliations, filing of contracts with international carriers, annual financial reports, equal employment opportunity reports, assistance for law enforcement and maintenance of customer billing records for 18 months. We currently qualify for exemptions from several of these reporting requirements.
U.S. Export Control Requirements and Sanctions Regulation. We must comply with U.S. export control laws and regulations, specifically the Arms Export Control Act, the International Traffic in Arms Regulations (“ITAR”), the Export Administration Regulations and the trade sanctions laws and regulations in the operation of our business. The export of satellites, satellite hardware, defense services and technical information relating to satellites to non-U.S. satellite manufacturing firms, launch services providers, insurers, customers, employees and other non-U.S. persons is regulated by the U.S. Department of State’s Directorate of Defense Trade Controls, or DDTC, under the ITAR. Certain of our contracts for the manufacture, launch, operation and insurance of our satellites involve the export to non-U.S. persons of technical data or hardware regulated by the ITAR. We have obtained all of the specific DDTC authorizations currently needed in order to fulfill our obligations under contracts with non-U.S. entities, and we believe that the terms of these licenses are sufficient given the scope and duration of the contracts to which they pertain. Many of our employees are non-U.S. nationals. We have obtained a license from the DDTC to allow certain of our non-U.S. national employees access to our technical information that is controlled under the ITAR.
24
Table of Contents
The U.S. Department of Commerce’s Bureau of Industry and Security also regulates some of our activities under the Export Administration Regulations. The Bureau regulates our export of equipment to earth stations in our ground network located outside of the United States. It is our practice to obtain all licenses necessary for the furnishing of original or spare equipment for the operation of our TT&C stations in a timely manner in order to facilitate the shipment of this equipment when needed.
We cannot provide services to certain countries subject to U.S. trade sanctions unless we first obtain the necessary authorizations from the Office of Foreign Assets Control. Where required, the U.S. Department of the Treasury’s Office of Foreign Assets Control has granted us the authorizations needed to provide satellite capacity and related administrative services to U.S.-sanctioned countries.
U.S. Department of Defense Security Clearances. To participate in classified U.S. government programs, we sought and obtained security clearances for one of our subsidiaries from the U.S. Department of Defense as required under the national security laws and regulations of the United States by entering into a proxy agreement with the U.S. government. Because Intelsat S.A. is a Luxembourg company, and prior to the Migration was a Bermuda company, with significant non-U.S. investment and employees, we sought and obtained Department of Defense approval of various mechanisms to mitigate the impact on the required security clearances. If we do not maintain the security clearances that we have obtained from the U.S. Department of Defense, we will not be able to perform our obligations under any classified U.S. government contracts to which our subsidiary is a party, the U.S. government would have the right to terminate our contracts requiring access to classified information and we will not be able to enter into new classified contracts. Further, if we materially violate the terms of the proxy agreement, the subsidiary holding the security clearances may be suspended or debarred from performing any government contracts, whether classified or unclassified.
Regulation by Foreign National Telecommunications Authorities
U.K. Regulation. The United Kingdom is the licensing jurisdiction for the BSS portion of the Ku-band on the IS-805 satellite. Satellite operators in the United Kingdom are regulated by the U.K.’s Office of Communications.
Papua New Guinea Regulation. The Papua New Guinea Telecommunication Authority (“PANGTEL”) is the licensing jurisdiction for our use of the C-band payload on the Galaxy 23 satellite. We are required to pay fees to PANGTEL in connection with our use of this orbital location.
German Regulation. We hold licenses for several earth stations in Germany, as well as authorizations to operate the IS-12, IS-601 and IS-24 satellites at two orbital locations.
South African Regulation. We also hold a license for an earth station in South Africa.
Japan Regulation. We and JSAT are the sole members of Horizons and in 2002 the Japanese telecommunications ministry authorized Horizons to operate the Ku-band payload on the Galaxy 13/Horizons-1 satellite. In 2003, the FCC added this Ku-band payload to its “Permitted Space Station List,” enabling Horizons to use the payload to provide non-DTH services in the United States, and in May 2004, the FCC expanded this authority to include one-way DTH services. We are the exclusive owner of the C-band payload on Galaxy 13/Horizons-1, which the FCC has licensed us to operate.
Other National Telecommunications Authorities. As a provider of satellite capacity, we are also subject to the national communications and broadcasting laws and regulations of many foreign countries in which we operate. Most countries require us to obtain a license or other form of written authorization from the regulator prior to offering service. We have obtained or are obtaining these licenses or written authorizations in all countries in which they are required. Most countries allow authorized telecommunications providers to own their own transmission facilities and to purchase satellite capacity without restriction, facilitating customer access to our services. Other countries maintain strict monopoly regimes or otherwise regulate the provision of our
25
Table of Contents
services. In order to provide services in these countries, we may need to negotiate an operating agreement with a monopoly entity that covers the types of services to be offered by each party, the contractual terms for service and each party’s rates. As we have developed our ground network and expanded our service offerings, we have been required to obtain additional licenses and authorizations. To date, we believe that we have identified and complied with all of the regulatory requirements applicable to us in connection with our ground network and expanded services.
The International Telecommunication Union Frequency Coordination Process and Regulation
Our use of orbital locations is subject to the frequency coordination and recording process of the ITU. In order to protect satellite systems from harmful radio frequency interference from other satellite systems, the ITU maintains a Master International Frequency Register of radio frequency assignments and their associated orbital locations. Each ITU notifying administration is required by treaty to give notice of, coordinate and record its proposed use of radio frequency assignments and associated orbital locations with the ITU’s Radiocommunication Bureau.
When the coordination process is completed, the ITU formally notifies all proposed users of frequencies and orbital locations in order to protect the recorded assignments associated with a given orbital location from subsequent or nonconforming interfering uses by Member States of the ITU. The ITU’s Radio Regulations do not contain mandatory dispute resolution or enforcement mechanisms. The Radio Regulations’ arbitration procedure is voluntary and neither the ITU specifically, nor international law generally, provides clear remedies if this voluntary process fails. Only nations have full standing as ITU members. Therefore, we must rely on governments to represent our interests before the ITU, including obtaining new rights to use orbital locations and resolving disputes relating to the ITU’s regulations.
Employees
As of December 31, 2009, we had 1,111 full-time regular employees. These employees consisted of:
| • | 523 employees in engineering, operations and related information systems; |
| • | 280 employees in finance, legal, corporate information systems and other administrative functions; |
| • | 217 employees in sales, marketing and strategy; and |
| • | 91 employees in support of government sales and marketing. |
As of December 31, 2009, 991 of these employees were located in the United States, and the remainder of our employees were in various other locations around the world. We believe that our relations with our employees are good. None of our employees is represented by a union or covered by a collective bargaining agreement.
Environmental Matters
Our operations are subject to various laws and regulations relating to the protection of the environment, including those governing the management, storage and disposal of hazardous materials and the cleanup of contamination. As an owner or operator of property and in connection with current and historical operations at some of our sites, we could incur significant costs, including cleanup costs, fines, sanctions and third-party claims, as a result of violations of or liabilities under environmental laws and regulations. For instance, some of our operations require continuous power supply, and, as a result, current and past operations at our teleport and other technical facilities include fuel storage and batteries for back-up power generators. We believe, however, that our operations are in substantial compliance with environmental laws and regulations.
Our History
Intelsat, Ltd. was the successor entity to the International Telecommunications Satellite Organization (the “IGO”). The IGO was a public intergovernmental organization created on an interim basis by its initial member states in 1964 and formally established in February 1973 upon entry into force of an intergovernmental
26
Table of Contents
agreement. The member states that were party to the treaty governing the IGO designated certain entities, known as the Signatories, to market and use the IGO’s communications system within their territories and to hold investment share in the IGO. Signatories were either private telecommunications entities or governmental agencies of the applicable party’s country or territory. Some Signatories authorized certain other entities located within their territories that used the IGO’s satellite system, known as the Investing Entities, to invest in the IGO as well. Both Signatories and Investing Entities made capital contributions to the IGO and received capital repayments from the IGO in proportion to their investment share in the IGO. Signatories and Investing Entities were also the IGO’s principal customers. Each Signatory’s and Investing Entity’s investment share in the IGO was based on its level of use of the IGO’s satellite system as compared to the use by other Signatories and Investing Entities.
As a public intergovernmental organization, the IGO was exempt from various taxes and enjoyed privileges, exemptions and immunities in many of its member states. However, due to its status as an intergovernmental organization, the IGO’s business was subject to certain operating restrictions. For example, the IGO could not own or operate its own earth stations or provide retail services directly to end users in certain countries. It also could not set market-based pricing for its services or engage in business relationships with non-Signatories without first obtaining Signatory approval.
The Privatization
Our management began contemplating privatization in the mid-1990s in order to be able to operate our business free of the restrictions described above and to better position us to be responsive to a number of commercial, competitive and regulatory forces. In November 2000, the IGO’s Assembly of Parties unanimously approved our management’s specific plan for our privatization and set the date of privatization for July 18, 2001. On July 18, 2001, substantially all of the assets and liabilities of the IGO were transferred to us.
The privatization required the amendment of the two formal agreements establishing the IGO. These two agreements were the Agreement Relating to the International Telecommunications Satellite
Organization “INTELSAT,” known as the INTELSAT Agreement, and the Operating Agreement Relating to the International Telecommunications Satellite Organization “INTELSAT,” known as the Operating Agreement, which both entered into force in February 1973. Because the process to formally ratify the amendments to the INTELSAT Agreement was expected to be lengthy, the IGO’s Assembly of Parties decided to provisionally apply, or rapidly implement, the amendments on a consensus basis with effect from July 18, 2001, pending their formal ratification. Formal entry into force of the amendments to the INTELSAT Agreement occurred on November 30, 2004.
Upon our privatization, each Signatory and Investing Entity that executed and delivered the required privatization agreements, including a shareholders agreement, received shares in Intelsat, Ltd. in proportion to its investment share in the IGO.
The IGO, referred to post-privatization as the International Telecommunications Satellite Organization (“ITSO”), continues to exist as an intergovernmental organization and will continue to exist as such for a period of at least 12 years after July 18, 2001, and then may be terminated by a decision of a governing body of ITSO called the Assembly of Parties. Pursuant to a Public Services Agreement among ITSO and Intelsat, Ltd. and certain of our subsidiaries, we have an obligation to provide our services in a manner consistent with the core principles of global coverage and connectivity, lifeline connectivity and non-discriminatory access, and ITSO monitors our implementation of this obligation. These core principles are described below under—Certain Customer Service Agreements—Novation Agreements and—Certain Customer Service Agreements—Lifeline Connectivity Obligation Contracts.
27
Table of Contents
The 2005 Acquisition Transactions
On January 28, 2005, Intelsat, Ltd. was acquired by Intelsat Holdings for total cash consideration of approximately $3.2 billion, with pre-acquisition debt of approximately $1.9 billion remaining outstanding. Intelsat Holdings was initially formed as a Bermuda company at the direction of funds advised by or associated with Apax Partners Worldwide LLP and Apax Partners, L.P., Apollo Management V, L.P., MDP Global Investors Limited, and Permira Advisers LLC (collectively, the “Former Sponsors”).
The PanAmSat Acquisition Transactions
On August 28, 2005, Intelsat Bermuda, PanAmSat Holdco and Proton Acquisition Corporation, a wholly-owned subsidiary of Intelsat Bermuda, signed a definitive merger agreement pursuant to which Intelsat Bermuda acquired all of the outstanding equity interests in PanAmSat Holdco for $25.00 per common share in cash, or approximately $3.2 billion in the aggregate (plus approximately $0.00927 per share as the pro rata share of undeclared regular quarterly dividends). Upon completion of the acquisition on July 3, 2006, PanAmSat Holdco and Intelsat Sub Holdco became separate direct or indirect wholly-owned subsidiaries of Intelsat Bermuda. As part of this transaction, approximately $3.2 billion in existing debt of PanAmSat Holdco and its subsidiaries was either refinanced or remained outstanding. The acquisition and the related transactions are referred to collectively as the PanAmSat Acquisition Transactions. Concurrently with the PanAmSat Acquisition Transactions, Intelsat General, the entity that operates our government services business, purchased the government services business of PanAmSat.
The New Sponsors Acquisition Transactions
On February 4, 2008, Serafina completed its acquisition of 100% of the equity ownership of Intelsat Holdings (the “New Sponsors Acquisition”) for total cash consideration of approximately $5.0 billion, pursuant to a share purchase agreement among Serafina, Intelsat Holdings, certain shareholders of Intelsat Holdings and Serafina Holdings (the “BC Share Purchase Agreement”). Serafina Holdings is an entity formed by funds controlled by BC Partners Holdings Limited (the “BCEC Funds”) and certain other investors. Subsequent to the execution of the BC Share Purchase Agreement, two investment funds controlled by Silver Lake Partners, L.P. (“Silver Lake Partners”) and other equity investors joined the BCEC Funds as the equity sponsors of Serafina Holdings. We refer to the BCEC Funds, the Silver Lake Partners funds and the other equity sponsors collectively as the New Sponsors. As a result of completion of the New Sponsors Acquisition and related financing transactions, we and our subsidiaries assumed aggregate net incremental debt of approximately $3.7 billion. See Item 7—Management’s Discussion and Analysis of Financial Condition and Results of Operations—Impact of the New Sponsors Acquisition Transactions.
The Luxembourg Migration
On December 15, 2009, Intelsat, Ltd. and certain of its parent holding companies and subsidiaries migrated their jurisdiction of organization from Bermuda to Luxembourg (the “Migration”). As a result of the Migration, our headquarters are located in Luxembourg. Each company that migrated has continued its corporate and legal personality in Luxembourg. Subsequent to the Migration, Intelsat Global, Ltd. is now known as Intelsat Global S.A., Intelsat Global Subsidiary, Ltd. is now known as Intelsat Global Subsidiary S.A., Intelsat Holdings, Ltd. is now known as Intelsat Holdings S.A., Intelsat, Ltd. is now known as Intelsat S.A., Intelsat (Bermuda), Ltd. is now known as Intelsat (Luxembourg) S.A., Intelsat Jackson Holdings, Ltd. is now known as Intelsat Jackson Holdings S.A., Intelsat Intermediate Holding Company, Ltd. is now known as Intelsat Intermediate Holding Company S.A. and Intelsat Subsidiary Holding Company, Ltd. is now known as Intelsat Subsidiary Holding Company S.A.
Certain Customer Service Agreements
Our Intelsat Global Sales subsidiary is the contracting party for certain of our customer service agreements. For regulatory reasons, some of our Brazilian customers contract with our Brazilian subsidiaries. Our U.S.,
28
Table of Contents
Canadian and Caribbean customers enter into agreements with certain of our U.S. subsidiaries. References to “our,” “we” and “us” below in our discussion of our service agreements are to the Intelsat entities that are the actual contracting parties to the service agreements.
Our customers generally obtain satellite capacity from us by placing an order pursuant to one of several master customer service agreements. These agreements offer different service types, including transponder services, managed services, mobile satellite services and channel. For a description of these service types and a breakdown of our revenue by service type, see Item 7—Management’s Discussion and Analysis of Financial Condition and Results of Operations—Revenue and—Results of Operations.
Most customer service commitments entered into prior to our privatization were transferred to us from the IGO pursuant to novation agreements. Since the privatization, our customers generally order services pursuant to master service agreements. The novation agreements and the master service agreements that Intelsat entered into in connection with the privatization contain provisions that restrict certain aspects of our business. These provisions are described below. Following our privatization, we have entered into master service agreements that do not contain these types of restrictions.
Novation Agreements
Each Intelsat novation agreement sets forth the terms and conditions upon which the service commitments entered into prior to the privatization are provided and the same terms and conditions generally apply to all customer service commitments transferred by the IGO pursuant to a novation agreement. Certain outstanding customer commitments represented in our December 31, 2009 backlog are covered by novation agreements. Approximately 1.5% of our backlog is covered by lifeline connectivity obligation, or LCO, protection. Although our backlog could be reduced if our LCO protection obligations are triggered, LCO has not had a significant impact on our backlog to date.
Lifeline Connectivity Obligation Contracts
In connection with our privatization, customers that novated service commitments and that met specified eligibility criteria had the option of entering into LCO contracts. An LCO contract provides price and capacity protection for a covered service commitment until the earlier of July 18, 2013 or the expiration of the commitment, which may be renewed as many times as required up to July 18, 2013 at a price no higher than the price charged for that service on the privatization date. Our customers cannot elect to receive LCO protection on contracts effective after the privatization date, except in limited circumstances. As of December 31, 2009, approximately 1.5% of the outstanding customer commitments in our backlog were LCO-protected. The LCO contracts obligate us, in some circumstances, to reduce the prices we charge for covered service commitments, based on the cumulative price increases and decreases of our non-LCO protected service commitments against a specified pricing index calculated annually on July 18. Because the cumulative decrease in pricing to non-LCO customers through July 18, 2009 has been less than 15%, we have not as of yet been required to reduce prices for our LCO-protected service commitments.
Pursuant to a Public Services Agreement that Intelsat entered into with ITSO in connection with the privatization, ITSO monitors our implementation of the LCO protections. Under the Public Services Agreement, we are obligated to provide our services in a manner consistent with the core principles of global coverage and connectivity, lifeline connectivity and non-discriminatory access. Global coverage and connectivity refers to the principle that our satellite system should provide the maximum coverage of the earth available from satellites in geostationary orbit and that it should have sufficient interconnection capabilities to make communication possible within and between Africa, Asia, Europe, North America and South America. Lifeline connectivity refers to the principle that we should make our satellite system available at protected price levels to users in low income countries, countries with low teledensity and other countries that are dependent on our system for access to international telecommunications services. Non-discriminatory access refers to the principle that all entities should have a fair and equal opportunity to access our satellite system.
29
Table of Contents
| Item 1A. | Risk Factors |
The risks described below are not the only ones that we may face. Additional risks that are not currently known to us or that we currently consider immaterial may also impair our business, financial condition or results of operations.
Risk Factors Relating to Our Business
We are subject to significant competition both within the FSS sector and from other providers of communications capacity, such as fiber optic cable capacity. Competition from other telecommunications providers could have a material adverse effect on our business and could prevent us from implementing our business strategy and expanding our operations as planned.
We face significant competition in the FSS sector in different regions around the world. We compete against other satellite operators and against suppliers of ground-based communications capacity. The increasing availability of satellite capacity and capacity from other forms of communications technology has historically created an excess supply of telecommunications capacity in certain regions from time to time. Competition in the FSS sector lowers prices, which can reduce our operating margins and the cash available to fund our operations and service our debt obligations. In addition, there has been a trend toward consolidation of major FSS providers as customers increasingly demand more robust distribution platforms with network redundancies and worldwide reach, and we expect to face increased competition as a result of this trend. Our direct competitors are likely to continue developing and launching satellites with greater power and more transponders, which may create satellite capacity at lower costs. In order to compete effectively, we may have to invest in similar technology.
We also face challenges to our business apart from these industry trends that our competition may not face. A significant portion of our revenue has historically been derived from channel services. Since fiber optic cable capacity, when available, is at substantially lower prices than satellite capacity for the same routes, competition from fiber optic cable has resulted in a migration of our point-to-point customers from satellite to fiber optic cable on certain routes. We have experienced erosion in our revenue from point-to-point services in recent years due to the build-out of fiber optic cable capacity, and we expect this erosion to continue. Some other FSS operators have service mixes that are less dependent on point-to-point connectivity than our current service mix. Our plan to address this erosion and sustain our business includes expanding our customer base in point-to-multipoint services, such as video, and growing our managed services business.
In addition, we believe that there are many companies that are seeking ways to improve the ability of existing land-based infrastructure, such as fiber optic cable, to transmit signals. Any significant improvement or increase in the amount of land-based capacity, particularly with respect to the existing fiber optic cable infrastructure and point-to-point applications, may cause our video services customers to shift their transmissions to land-based capacity or make it more difficult for us to obtain new customers. If fiber optic cable networks or other ground-based high-capacity transmission systems are available to service a particular point, that capacity, when available, is generally less expensive than satellite capacity. As land-based telecommunications services expand, demand for some satellite-based services may be reduced.
Failure to compete effectively with other FSS operators and to adapt to new competition and new technologies or failure to implement our business strategy while maintaining our existing business would result in a loss of revenue and a decline in profitability, a decrease in the value of our business and a downgrade of our credit ratings, which would restrict our access to the capital markets.
30
Table of Contents
The market for fixed satellite services may not grow or may shrink and therefore we may not be able to attract new customers, retain our existing customers or implement our strategies to grow our business. In addition, pricing pressures may have an adverse impact on FSS sector revenue.
The FSS sector, as a whole, is currently expected to experience moderate growth over the next few years. However, the market for fixed satellite services may not grow or may shrink. Competing technologies, such as fiber optic cable, are continuing to adversely affect the point-to- point segment of the FSS sector. In the point-to-multipoint segment, the global economic downturn, the transition of video traffic from analog to digital and continuing improvements in compression technology have negatively impacted demand for certain fixed satellite services. Developments that we expect to support the growth of the satellite services industry, such as continued growth in data traffic and the proliferation of HDTV and niche programming, may fail to materialize or may not occur in the manner or to the extent we anticipate. Any of these industry dynamics could negatively affect our operations and financial condition.
Because the market for fixed satellite services may not grow or may shrink, we may not be able to attract customers for the managed services that we are providing as part of our strategy to sustain our business. Reduced growth in the FSS sector may also adversely affect our ability to retain our existing customers. A shrinking market could reduce the number and value of our customer contracts and would have a material adverse effect on our business and results of operations. In addition, there could be a substantial negative impact on our credit ratings and our ability to access the capital markets.
The FSS sector has in the past decade experienced periods of pricing pressures that have resulted in reduced revenues of FSS operators. If similar pricing pressures were to occur in the future, this could have a significant negative impact on our revenues and financial condition.
Our financial condition could be materially and adversely affected if we were to suffer a satellite loss that is not adequately covered by insurance.
We currently carry in-orbit insurance only with respect to a small portion of our satellite fleet. As our satellite insurance policies expire, we may elect to reduce or eliminate insurance coverage relating to certain of our satellites to the extent permitted by our debt agreements if, in our view, exclusions make such policies ineffective or the costs of coverage make such insurance impractical and we believe that we can more reasonably protect our business through the use of in-orbit spare satellites, backup transponders and self-insurance. A partial or complete failure of a revenue-producing satellite, whether insured or not, could require additional, unplanned capital expenditures, an acceleration of planned capital expenditures, interruptions in service, a reduction in contracted backlog and lost revenue and could have a material adverse effect on our business, financial condition and results of operations.
We also maintain third-party liability insurance on certain of our satellites. This insurance, however, may not be adequate or available to cover all third-party liability damages that may be caused by any of our satellites, and we may not in the future be able to renew our third-party liability coverage on reasonable terms and conditions, if at all.
We have several large customers and the loss of, or default by, any one of them could materially reduce our revenue and materially adversely affect our business.
We rely on a limited number of customers to provide a substantial portion of our revenue and contracted backlog. For the predecessor year ended December 31, 2007, the combined year ended December 31, 2008 and the year ended December 31, 2009, our ten largest customers and their affiliates represented approximately 23%, 20% and 20% of our revenue, respectively. The loss of, or default by, one or more of these customers could significantly affect our revenue and operating margins.
31
Table of Contents
Some customers have in the past defaulted and, although we monitor our larger customers’ financial performance and seek deposits, guarantees and other methods of protection against default where possible, our customers may in the future default on their obligations to us due to bankruptcy, lack of liquidity, operational failure or other reasons. Defaults by any of our larger customers or by a group of smaller customers who, collectively, represent a significant portion of our revenue could adversely affect our revenue, operating margins and cash flows. If our backlog is reduced due to the financial difficulties of our customers, our revenue and operating margins would be further negatively impacted.
The recent global recession may have significant effects on our customers and suppliers, which could adversely affect our business, operating results and financial condition.
The recent global recession, as well as a slow recovery period, may lead to lower demand for our services, increased incidences of our customers’ inability to pay for our services, or the insolvency of our customers. In addition, if our suppliers face challenges in obtaining credit, selling their products or otherwise in operating their businesses profitably, they may raise prices, lower production levels or cease operations. For instance, one of our launch service providers filed a voluntary petition for relief under Chapter 11 of the Bankruptcy Code. Any of these events may negatively impact our sales, revenue generation and margins, and consequently adversely affect our business, operating results and financial condition.
We have a substantial amount of indebtedness, which may adversely affect our cash flow and our ability to operate our business, remain in compliance with debt covenants and make payments on our indebtedness.
As of December 31, 2009, (a) Intelsat Sub Holdco and its subsidiaries had approximately $4.1 billion principal amount of total third-party debt (including the guarantee by Intelsat Sub Holdco and certain of its subsidiaries of Intelsat Jackson’s senior unsecured credit agreement dated February 2, 2007 (the “Intelsat Jackson Senior Unsecured Credit Agreement”) and senior unsecured credit agreement dated July 1, 2008 (the “New Intelsat Jackson Senior Unsecured Credit Agreement” and, together with the Intelsat Jackson Senior Unsecured Credit Agreement, the “Intelsat Jackson Unsecured Credit Agreements”) and Intelsat Jackson’s 9 1/4% Senior Notes due 2016, 9 1/2% Senior Notes due 2016 and 8 1/2% Senior Notes due 2019) on a consolidated basis, (b) Intermediate Holdco and its subsidiaries had approximately $4.6 billion principal amount of total third-party debt (including the guarantee by Intelsat Sub Holdco and certain of its subsidiaries of the Intelsat Jackson Unsecured Credit Agreements and Intelsat Jackson’s 9 1/4% Senior Notes due 2016, 9 1/2% Senior Notes due 2016 and 8 1/2% Senior Notes due 2019) on a consolidated basis, (c) Intelsat Jackson had approximately $9.2 billion principal amount of total third-party debt on a consolidated basis, (d) Intelsat Luxembourg had approximately $14.1 billion principal amount of total third-party debt on a consolidated basis, (e) Intelsat S.A. had approximately $15.0 billion principal amount of total third-party debt on a consolidated basis, approximately $2.4 billion of which was secured debt, and (f) Intelsat Corp had approximately $3.3 billion principal amount of total third-party debt on a consolidated basis, approximately $2.1 billion of which was secured debt. In addition, as of December 31, 2009, Intelsat Sub Holdco and Intelsat Corp, the direct borrowers under their respective senior secured credit facilities, had $247.9 million (net of standby letters of credit) and $152.2 million (net of standby letters of credit), respectively, of availability under their senior secured credit facilities, all of which were obligations of Intelsat Sub Holdco, Intelsat Corp or their respective guarantors.
The indentures and credit agreements governing a substantial portion of the outstanding debt of Intelsat Luxembourg, Intelsat Jackson, Intermediate Holdco and Intelsat Sub Holdco and their respective subsidiaries permit each of these companies to make payments to their respective direct and indirect parent companies to fund the cash interest payments on such indebtedness, so long as no default or event of default shall have occurred and be continuing or would occur as a consequence thereof.
32
Table of Contents
Our substantial indebtedness could have important consequences. For example, it could:
| • | make it more difficult for us to satisfy obligations with respect to indebtedness, including through refinancing, and any failure to comply with the obligations of any of our debt instruments, including financial and other restrictive covenants, could result in an event of default under the indentures governing our notes and the agreements governing such other indebtedness; |
| • | require us to dedicate a substantial portion of available cash flow to pay principal and interest on debt, which will reduce the funds available for working capital, capital expenditures, acquisitions and other general corporate purposes; |
| • | limit flexibility in planning for and reacting to changes in our business and in the industry in which we operate; |
| • | limit our ability to engage in strategic transactions or implement our respective business strategies; |
| • | limit our ability to borrow additional funds; and |
| • | place us at a disadvantage compared to any competitors that have less debt. |
Any of the factors listed above could materially and adversely affect our business and our results of operations. Furthermore, our interest expense could increase if interest rates rise because certain portions of our debt bear interest at floating rates. If we do not have sufficient cash flow to service our debt, we may be required to refinance all or part of our existing debt, sell assets, borrow more money or sell securities, none of which we can guarantee we will be able to do.
We may be able to incur significant additional indebtedness in the future. Although the agreements governing our indebtedness contain restrictions on the incurrence of certain additional indebtedness, these restrictions are subject to a number of important qualifications and exceptions, and the indebtedness incurred in compliance with these restrictions could be substantial. If we incur new indebtedness, the related risks, including those described above, could intensify.
The terms of Intelsat Sub Holdco’s and Intelsat Corp’s senior secured credit facilities, the Intelsat Jackson Unsecured Credit Agreements, the indentures governing our existing notes and the terms of our other indebtedness may restrict our current and future operations, particularly our ability to respond to changes in our business or to take certain actions.
The credit agreements governing Intelsat Sub Holdco’s and Intelsat Corp’s senior secured credit facilities, the Intelsat Jackson Unsecured Credit Agreements, the indentures governing our existing notes and the terms of our other outstanding indebtedness contain, and any future indebtedness of ours would likely contain, a number of restrictive covenants imposing significant operating and financial restrictions on Intelsat S.A. and some or all of its subsidiaries, as well as on Intelsat Holding Corporation and Intelsat Corp and certain of their subsidiaries, including restrictions that may limit our ability to engage in acts that may be in our long-term best interests. The senior secured credit facilities of Intelsat Sub Holdco and Intelsat Corp include a financial covenant that requires the applicable borrower not to exceed a maximum senior secured leverage ratio. In addition, the senior secured credit facilities require the applicable borrower to use a portion of the proceeds of certain asset sales, in excess of a specified amount, that are not reinvested in its business to repay indebtedness under such facilities.
The credit agreements governing the senior secured credit facilities, the Intelsat Jackson Unsecured Credit Agreements, and the indentures governing our existing notes include covenants restricting, among other things, the ability of Intelsat S.A. or its subsidiaries to:
| • | incur or guarantee additional debt or issue disqualified stock; |
| • | pay dividends (including to fund cash interest payments at different entity levels), or make redemptions, repurchases or distributions, with respect to ordinary shares or capital stock; |
| • | create or incur certain liens; |
33
Table of Contents
| • | make certain loans or investments; |
| • | engage in mergers, acquisitions, amalgamations, asset sales and sale and leaseback transactions; and |
| • | engage in transactions with affiliates. |
These covenants are subject to a number of qualifications and exceptions. The operating and financial restrictions and covenants in our existing debt agreements and any future financing agreements may adversely affect our ability to finance future operations or capital needs or to engage in other business activities. A breach of any of the restrictive covenants in Intelsat Sub Holdco’s senior secured credit facilities or Intelsat Corp’s senior secured credit facilities could result in a default under the applicable credit facilities. If any such default occurs, the lenders under the applicable credit facilities may elect to declare all outstanding borrowings, together with accrued interest and other fees, to be immediately due and payable, enforce their security interest or require us to apply all available cash to repay these borrowings. If this occurred under our senior secured credit facilities, this would result in an event of default under our existing notes and the Intelsat Jackson Unsecured Credit Agreements. The lenders under the senior secured credit facilities will also have the right in these circumstances to terminate any commitments they have to fund further borrowings. If Intelsat Sub Holdco or Intelsat Corp were unable to repay outstanding borrowings when due, the lenders under the applicable senior secured credit facilities would have the right to proceed against the collateral granted to them to secure the debt owed to them. If the repayment of the debt under one or both of these senior secured credit facilities were to be accelerated, our assets might not be sufficient to repay such debt in full or to repay the notes and our other debt.
Our business is capital intensive, and we may not be able to raise adequate capital to finance our business strategies, or we may be able to do so only on terms that significantly restrict our ability to operate our business.
Implementation of our business strategy requires a substantial outlay of capital. As we pursue our business strategies and seek to respond to opportunities and trends in our industry, our actual capital expenditures may differ from our expected capital expenditures and there can be no assurance that we will be able to satisfy our capital requirements in the future. We currently expect that the majority of our liquidity requirements in 2010 will be satisfied by cash on hand, cash generated from our operations and borrowings under our revolving credit facilities. However, if we determine we need to obtain additional funds through external financing and are unable to do so, we may be prevented from fully implementing our business strategy.
The availability and cost to us of external financing depend on a number of factors, including general market conditions, our financial performance and our credit rating. Both our credit rating and our ability to obtain financing generally may be influenced by the supply and demand characteristics of the telecommunications sector in general and of the FSS sector in particular. Declines in our expected future revenue under contracts with customers and challenging business conditions faced by our customers are among factors that may adversely affect our credit. Other factors that could impact our credit include the amount of debt in our current capital structure, activities associated with our strategic initiatives, our expected future cash flows and the capital expenditures required to execute our business strategy. The overall impact on our financial condition of any transaction that we pursue may be negative or may be negatively perceived by the financial markets and ratings agencies and may result in adverse rating agency actions with respect to our credit rating. A disruption in the capital markets, a deterioration in our financial performance or a credit rating downgrade could limit our ability to obtain financing or could result in any such financing being available only at greater cost or on more restrictive terms than might otherwise be available. Our credit rating was downgraded by Moody’s Investor Services Inc. in June 2006, in January 2008, in February 2009 and again in October 2009 and by Standard & Poor’s Ratings Group, or S&P, in June 2006, June 2007, February 2008 (but only with respect to one tranche of our debt) and again in October 2009. Our debt agreements also impose restrictions on our operation of our business and could make it more difficult for us to obtain further external financing if required. See—The terms of Intelsat Sub Holdco’s and Intelsat Corp’s senior secured credit facilities, the Intelsat Jackson Unsecured Credit Agreements, the indentures governing our existing notes and the terms of our other indebtedness may restrict our current and future operations, particularly our ability to respond to changes in our business or to take certain actions.
34
Table of Contents
Long-term disruptions in the capital and credit markets as a result of uncertainty due to the recent global recession, changing or increased regulation or failures of significant financial institutions could adversely affect our access to capital. If financial market disruptions intensify it may make it difficult for us to raise additional capital or refinance debt when needed, on acceptable terms or at all. Any disruption could require us to take measures to conserve cash until the markets stabilize or until alternative credit arrangements or other funding for our business needs can be arranged. Such measures could include deferring capital expenditures and reducing or eliminating other discretionary uses of cash.
We may become subject to unanticipated tax liabilities that may have a material adverse effect on our results of operations.
Intelsat S.A. and certain of its subsidiaries are Luxembourg-based companies and are subject to Luxembourg taxation for corporations. We believe that a significant portion of the income derived from our communications network will not be subject to tax in Luxembourg, or in other countries in which we conduct activities or in which our customers are located, including the United States and the United Kingdom. However, this belief is based on the anticipated nature and conduct of our business, which may change. It is also based on our current position under the tax laws of the countries in which we have assets or conduct activities. This position is subject to review and possible challenge by taxing authorities and to possible changes in law that may have a retroactive effect. For example, Intelsat S.A. and its non-U.S. subsidiaries intend to conduct their operations (and believe they have conducted their operations to date) so that Intelsat S.A. and its non-U.S. subsidiaries will not be (and have not been) engaged in a trade or business within the United States, will not earn (and have not earned) income effectively connected with such a business that would be subject to U.S. federal income tax and will not be subject (and have not been subject) to significant U.S. withholding tax. However, the U.S. Internal Revenue Service may conclude that Intelsat S.A. and/or its non-U.S. subsidiaries have engaged in a trade or business within the United States and/or have been subject to significant U.S. withholding tax. Such a determination could result in a substantial unanticipated tax liability for us. In addition, legislation is proposed from time to time in various jurisdictions, relating to changes in laws which, if enacted, could have a material adverse effect on our results of operations.
In December 2006, the U.S. Department of the Treasury finalized regulations with respect to the source of international and other types of communications income. The regulations as adopted may, under certain circumstances, subject us to U.S. withholding tax on a significant portion of our income, possibly even if we are not found to have engaged in a trade or business within the United States or to have had an office or other fixed place of business in the United States.
We conduct business with customers and counterparties in multiple countries and jurisdictions. Our overall tax burden is affected by tax legislation in these jurisdictions and the terms of income tax treaties between these countries and the countries in which our subsidiaries are qualified residents for treaty purposes as in effect from time to time. Tax legislation in these countries and jurisdictions may be amended and treaties are regularly renegotiated by the contracting countries and, in each case, may change. If tax legislation or treaties were to change, we could become subject to additional taxes that could have a material adverse effect on our financial condition or results of operations.
The extent to which certain taxing jurisdictions may require us to pay tax or to make payments in lieu of tax cannot be determined in advance. In addition, our operations and payments due to us may be affected by changes in taxation, including retroactive tax claims or assessments of withholding on amounts payable to us or other taxes assessed at the source, in excess of the taxation we anticipate based on business contacts and practices and the current tax regimes. Our results of operations could be materially adversely affected if we become subject to a significant amount of unanticipated tax liabilities.
35
Table of Contents
We are subject to political, economic and other risks due to the international nature of our operations.
We provide communications services in approximately 200 countries and territories. Accordingly, we may be subject to greater risks than other satellite operators as a result of the international nature of our business operations. We could be harmed financially and operationally by tariffs, taxes and other trade barriers that may be imposed on our services, or by political and economic instability in the countries in which we provide service. If we ever need to pursue legal remedies against our customers or our business partners located outside of Luxembourg, the United States or the United Kingdom, it may be difficult for us to enforce our rights against them.
Almost all of our customers pay for our services in U.S. dollars, although we are exposed to some risk related to customers who do not pay in U.S. dollars. Fluctuations in the value of non-U.S. currencies may make payment in U.S. dollars more expensive for our non-U.S. customers. In addition, our non-U.S. customers may have difficulty obtaining U.S. currency and/or remitting payment due to currency exchange controls.
Our New Sponsors control us and may have conflicts of interest with us in the future.
Intelsat Global is controlled by affiliates of the New Sponsors and the funds advised by or associated with the New Sponsors. The New Sponsors, together with certain members of our senior management team and other designated employees, beneficially own substantially all of the equity interests in Intelsat Global, which is the direct parent of Intelsat Global Subsidiary, which is the direct parent of Intelsat Holdings, which is the direct parent of Intelsat S.A. The New Sponsors also own a portion of the outstanding notes issued by Intelsat Luxembourg. The New Sponsors have control over our decisions to enter into any corporate transaction and have the ability to prevent any transaction that requires the approval of shareholders. For example, the New Sponsors could cause us to make acquisitions that increase the amount of our indebtedness. Additionally, the New Sponsors are in the business of making investments in companies and may from time to time acquire and hold interests in businesses that compete directly or indirectly with us. The New Sponsors may also pursue acquisition opportunities that may be complementary to our business, and, as a result, those acquisition opportunities may not be available to us. So long as the New Sponsors continue to own a significant amount of the equity of Intelsat Global, they will continue to be able to strongly influence or effectively control our decisions.
We may not be able to complete strategic transactions, which may prevent us from implementing strategies to grow our business.
We intend to continue to evaluate and pursue strategic transactions that can, among other things, broaden our customer base, provide enhanced geographic presence and provide complementary technical and commercial capabilities. Successful completion of any strategic transaction we identify depends on a number of factors that are not entirely within our control, including our ability to negotiate acceptable terms, conclude satisfactory agreements and obtain all necessary regulatory approvals. In addition, we may need to finance any strategic transaction that we identify, and may not be able to obtain the necessary financing on satisfactory terms and within the timeframe that would permit a transaction to proceed. We may also fail to discover liabilities of a business or operating or other problems prior to completing a transaction. We could experience adverse accounting and financial consequences, such as the need to make large provisions against the acquired assets or to write down the acquired assets. We might also experience a dilutive effect on our earnings. In addition, depending on how any such transaction is structured, there may be an adverse impact on our capital structure. We may incur significant costs arising from our efforts to engage in strategic transactions, and such costs may exceed the returns that we realize from a given transaction. Moreover, these expenditures may not result in the successful completion of a transaction.
We could be prevented from, or significantly delayed in, achieving our strategic goals if we are unable to complete strategic transactions or to integrate acquired businesses successfully into our business. Any strategic transactions that we do complete may not promote our business strategy, may negatively affect the value of our business or may adversely affect our prospects for long-term growth.
36
Table of Contents
Risk Factors Relating to Our Industry
We may experience in-orbit satellite failures or degradations in performance that could impair the commercial performance of our satellites, which could lead to lost revenue, an increase in our cash operating expenses, lower operating income or lost backlog.
Satellites utilize highly complex technology and operate in the harsh environment of space and, accordingly, are subject to significant operational risks while in orbit. These risks include malfunctions, commonly referred to as anomalies, that have occurred in our satellites and the satellites of other operators as a result of:
| • | the satellite manufacturer’s error, whether due to the use of new and largely unproven technology or due to a design, manufacturing or assembly defect that was not discovered before launch; |
| • | problems with the power systems of the satellites, including: |
| • | circuit failures or other array degradation causing reductions in the power output of the solar arrays on the satellites, which could require us to forego the use of some transponders initially and to turn off additional transponders in later years; and/or |
| • | failure of the cells within the batteries, whose sole purpose is to power the payload and spacecraft operations during the daily eclipse periods which occur for brief periods of time during two 40-day periods around March 21 and September 21 of each year; and |
| • | problems with the control systems of the satellites, including: |
| • | failure of the primary and/or backup SCP; and |
| • | failure of the XIPS used on certain Boeing satellites, which is an electronic propulsion system that maintains the spacecraft’s proper in-orbit position; and/or |
| • | general failures resulting from operating satellites in the harsh space environment, such as premature component failure or wear out. |
We have experienced anomalies in each of the categories described above. Although we work closely with the satellite manufacturers to determine and eliminate the cause of these anomalies in new satellites and provide for on-satellite backups for certain critical components to minimize or eliminate service disruptions in the event of failure, we may experience anomalies in the future, whether of the types described above or arising from the failure of other systems or components. These anomalies can manifest themselves in scale from minor reductions of equipment redundancy to marginal reductions in capacity to complete satellite failure. Some of our satellites have experienced significant anomalies in the past and some have components that are now known to be susceptible to similar significant anomalies. Each of these is discussed in Item 1—Business—Satellite Health and Technology. An on-satellite backup for certain components may not be available upon the occurrence of such an anomaly.
Any single anomaly or series of anomalies could materially and adversely affect our operations, our revenues, our relationship with our current customers and our ability to attract new customers for our satellite services. In particular, future anomalies may result in the loss of individual transponders on a satellite, a group of transponders on that satellite or the entire satellite, depending on the nature of the anomaly and the availability of on-satellite backups. Anomalies and our estimate of their future effect may also cause a reduction of the expected service life of a satellite and contracted backlog. Anomalies may also cause a reduction of the revenue generated by that satellite or the recognition of an impairment loss. Finally, the occurrence of anomalies may adversely affect our ability to insure our satellites at commercially reasonable premiums, if at all. While some anomalies are covered by insurance policies, others are not or may not be covered. See—Risk Factors Relating to Our Business—Our financial condition could be materially and adversely affected if we were to suffer a satellite loss that is not adequately covered by insurance.
37
Table of Contents
Many of the technical problems we have experienced with our current fleet have been component failures and anomalies. Our IS-804 satellite experienced a sudden and unexpected electrical power system anomaly that resulted in the total loss of the satellite in January 2005. The IS-804 satellite was a LM 7000 series satellite, and we operate three other satellites in the LM 7000 series, the IS-801, IS-802 and IS-805 satellites. We believe that the IS-804 satellite failure was most likely caused by a high current event in the battery circuitry triggered by an electrostatic discharge that propagated to cause the sudden failure of the high voltage power system.
Our IS-802 satellite experienced a reduction of electrical power capability that resulted in a degraded capability of the satellite in September 2006. A significant subset of transponders on IS-802 were subsequently reactivated and are operating normally. We believe that the IS-802 anomaly was most likely caused by an electrical short internal to the solar array harness located on the south solar array boom.
Our Galaxy 26 and Galaxy 27 satellites experienced sudden anomalies in their electrical distribution systems that resulted in the loss of control of the satellites and the interruption of customer services on the satellites in November 2004 and June 2008, respectively. We believe the likely root cause of the anomalies is a design flaw that is affected by a number of parameters and in some extreme cases can result in an electrical system anomaly. This design flaw exists on three of our satellites, Galaxy 27, Galaxy 26 and IS-8.
We may also experience additional anomalies relating to the failure of the SCP in certain of our BSS 601 satellites, various anomalies associated with XIPS in our BSS 601 HP satellites or a progressive degradation of the solar arrays in certain of our BSS 702 satellites.
Three of the BSS 601 satellites that we operated in the past, as well as BSS 601 satellites operated by others, have experienced a failure of the primary and backup SCPs. On January 15, 2006, our Galaxy 3R satellite experienced an anomaly of its back-up SCP and was taken out of service. On February 1, 2010 our IS-4 satellite experienced an anomaly of its backup SCP and was taken out of service. These events did not have a material impact on our operations or financial results.
Certain of the BSS 601 HP satellites have experienced various problems associated with their XIPS. We currently operate four satellites of this type, two of which have experienced failures of both XIPS. We may in the future experience similar problems associated with XIPS or other propulsion systems on our satellites.
Two of the three BSS 702 satellites that we operate, as well as BSS 702s of a similar design operated by others, have experienced a progressive degradation of their solar arrays causing a reduction in output power. Along with the manufacturer, we continually monitor the problem to determine its cause and its expected effect. The power reduction may require us to permanently turn off certain transponders on the affected satellites to allow for the continued operation of other transponders, which could result in a loss of revenues, or may result in a reduction of the satellite’s service life. In 2004, based on a review of available data, we reduced our estimate of the service lives of both satellites due to the continued degradation.
We may experience a launch failure or other satellite damage or destruction during launch, which could result in a total or partial satellite loss. A new satellite could also fail to achieve its designated orbital location after launch. Any such loss of a satellite could negatively impact our business plans and could reduce our revenue.
Satellites are subject to certain risks related to failed launches. Launch failures result in significant delays in the deployment of satellites because of the need both to construct replacement satellites, which can take 24 months or longer, and to obtain other launch opportunities. Such significant delays could materially and adversely affect our operations and our revenue. In addition, significant delays could give customers who have purchased or reserved capacity on that satellite a right to terminate their service contracts relating to the satellite.
38
Table of Contents
We may not be able to accommodate affected customers on other satellites until a replacement satellite is available. A customer’s termination of its service contracts with us as a result of a launch failure would reduce our contracted backlog. Delay caused by launch failures may also preclude us from pursuing new business opportunities and undermine our ability to implement our business strategy.
Launch vehicles may also under-perform, in which case the satellite may still be placed into service by using its onboard propulsion systems to reach the desired orbital location, resulting in a reduction in its service life. In addition, although we have had launch insurance on all of our launches to date, if we were not able to obtain launch insurance on reasonable terms and a launch failure were to occur, we would directly suffer the loss of the cost of the satellite and related costs, which could be more than $250 million.
Since 1975, we and the entities we have acquired have launched 106 satellites. Eight of these satellites were destroyed as a result of launch failures. In addition, certain launch vehicles that we have used or are scheduled to use have experienced launch failures in the past. Launch failure rates vary according to the launch vehicle used.
New or proposed satellites are subject to construction and launch delays, the occurrence of which can materially and adversely affect our operations.
The construction and launch of satellites are subject to certain delays. Such delays can result from the delays in the construction of satellites and launch vehicles, the periodic unavailability of reliable launch opportunities, possible delays in obtaining regulatory approvals and launch failures. We have in the past experienced delays in satellite construction and launch which have adversely affected our operations. Future delays may have the same effect. A significant delay in the future delivery of any satellite may also adversely affect our marketing plan for the satellite. If satellite construction schedules are not met, a launch opportunity may not be available at the time a satellite is ready to be launched. Further, any significant delay in the commencement of service of any of our satellites could enable customers who pre-purchased or agreed to utilize transponder capacity on the satellite to terminate their contracts and could affect our plans to replace an in-orbit satellite prior to the end of its service life. The failure to implement our satellite deployment plan on schedule could have a material adverse effect on our financial condition and results of operations. Delays in the launch of a satellite intended to replace an existing satellite that results in the existing satellite reaching its end of life before being replaced could result in loss of business to the extent an in-orbit backup is not available.
Our dependence on outside contractors could result in increased costs and delays related to the launch of our new satellites, which would in turn adversely affect our business, operating results and financial condition.
There are a limited number of companies that we are able to use to launch our satellites and a limited number of commercial satellite launch opportunities available in any given time period. Adverse events with respect to our launch service providers, such as satellite launch failures, could result in increased costs or delays in the launch of our satellites. General economic conditions may also affect the ability of launch providers to provide launch services on commercially reasonable terms or to fulfill their obligations in terms of launch dates, pricing, or both. In the event that our launch service providers are unable to fulfill their obligations, we may have difficulty procuring alternative services in a timely manner and may incur significant additional expenses as a result. Any such increased costs and delays could have a material adverse effect on our business, operating results and financial condition.
One of our launch service providers, Sea Launch Company L.L.C. (“Sea Launch”), with which we have contracted for the future launch of one satellite and have options for the launch of four additional satellites, has filed a voluntary petition for relief under the Bankruptcy Code. As of December 31, 2009, we had approximately $43 million outstanding of payments made to Sea Launch relating to satellite launches that Sea Launch is still required to provide us. While Sea Launch is continuing to operate as a debtor-in-possession, and while we may receive full or partial credit for prior payments relating to the launches, there can be no assurance that Sea
39
Table of Contents
Launch will honor its contractual obligations to us, or do so without charging us significant additional amounts beyond what is provided for in our current agreements. In addition, should we try to procure alternative launch services for the satellites involved, there can be no assurance that we will not incur significant delays and significant additional expenses as a result.
Risk Factors Relating to Regulation
We are subject to regulatory and licensing requirements in each of the countries in which we provide services, and our business is sensitive to regulatory changes in those countries.
The telecommunications industry is highly regulated, and in connection with providing satellite capacity, ground network uplinks, downlinks and other value-added services to our customers, we need to maintain regulatory approvals, and from time to time obtain new regulatory approvals, from various countries. Obtaining and maintaining these approvals can involve significant time and expense. If we cannot obtain or are delayed in obtaining the required regulatory approvals, we may not be able to provide these services to our customers or expand into new services. In addition, the laws and regulations to which we are subject could change at any time, thus making it more difficult for us to obtain new regulatory approvals or causing our existing approvals to be revoked or adversely modified. Because the regulatory schemes vary by country, we may also be subject to regulations of which we are not presently aware and could be subject to sanctions by a foreign government that could materially and adversely affect our operations in that country. If we cannot comply with the laws and regulations that apply to us, we could lose our revenue from services provided to the countries and territories covered by these laws and regulations and be subject to criminal or civil sanctions.
If we do not maintain regulatory authorizations for our existing satellites and associated ground facilities or obtain authorizations for our future satellites and associated ground facilities, we may not be able to operate our existing satellites or expand our operations.
Our operation of existing satellites is authorized and regulated by the FCC, the U.K. Office of Communications, the telecommunications licensing authority in Papua New Guinea, the telecommunications ministry of Japan, and the regulatory agency of Germany. If we do not maintain authorizations for our existing satellites, we would not be able to operate the satellites covered by those authorizations, unless we obtained authorization from another licensing jurisdiction. Some of our authorizations provide waivers of technical regulations. If we do not maintain these waivers, we would be subject to operational restrictions or interference that would affect our use of existing satellites. Loss of a satellite authorization could cause us to lose the revenue from services provided by that satellite at a particular orbital location to the extent these services cannot be provided by satellites at other orbital locations.
Our launch and operation of planned satellites require additional regulatory authorizations from the FCC or a non-U.S. licensing jurisdiction, some of which we have already obtained. If we do not obtain any required authorizations in the future, we would not be able to operate our planned satellites. If we obtain a required authorization but we do not meet milestones regarding the construction, launch and operation of a satellite by deadlines that may be established in the authorization, we could lose our authorization to operate a satellite using certain frequencies in an orbital location. Any authorizations we obtain may also impose operational restrictions or permit interference that could affect our use of planned satellites.
If we do not occupy unused orbital locations by specified deadlines, or do not maintain satellites in orbital locations we currently use, those orbital locations may become available for other satellite operators to use.
Our in-orbit satellites do not currently occupy all of the orbital locations for which we have obtained regulatory authorizations. If we are unable to place satellites into currently unused orbital locations by specified deadlines and in a manner that satisfies the ITU, or national regulatory requirements, or if we are unable to
40
Table of Contents
maintain satellites at the orbital locations that we currently use, we may lose our rights to use these orbital locations and the locations could become available for other satellite operators to use. We cannot operate our satellites without a sufficient number of suitable orbital locations in which to place the satellites. The loss of one or more of our orbital locations could negatively affect our plans and our ability to implement our business strategy.
Coordination results may adversely affect our ability to use a satellite at a given orbital location for our proposed service or coverage area.
We are required to record frequencies and orbital locations used by our satellites with the ITU and to coordinate the use of these frequencies and orbital locations in order to avoid interference to or from other satellites. The results of coordination may adversely affect our use of satellites at particular orbital locations. If we are unable to coordinate our satellites by specified deadlines, we may not be able to use a satellite at a given orbital location for our proposed service or coverage area. The use of our satellites may also be temporarily or permanently adversely affected if the operation of adjacent satellite networks does not conform to coordination agreements resulting in the acceptable interference levels being exceeded (e.g., due to operational errors associated with the transmissions to adjacent satellite networks).
Our failure to maintain or obtain authorizations under the U.S. export control and trade sanctions laws and regulations could have a material adverse effect on our business.
The export of satellites and technical information related to satellites, earth station equipment and provision of services to certain countries are subject to State Department, Commerce Department and Treasury Department regulations. If we do not maintain our existing authorizations or obtain necessary future authorizations under the export control laws and regulations of the United States, we may be unable to export technical information or equipment to non-U.S. persons and companies, including to our own non-U.S. employees, as required to fulfill existing contracts. If we do not maintain our existing authorizations or obtain necessary future authorizations under the trade sanctions laws and regulations of the United States, we may not be able to provide satellite capacity and related administrative services to certain countries subject to U.S. sanctions. In addition, because we conduct management activities from Luxembourg, our U.S. suppliers must comply with U.S. export control laws and regulations in connection with their export of satellites and related equipment and technical information to us. Our ability to acquire new satellites, launch new satellites or operate our satellites could also be negatively affected if our suppliers do not obtain required U.S. export authorizations.
If we do not maintain required security clearances from, and comply with our agreements with, the U.S. Department of Defense, we will not be able to continue to perform our obligations under classified U.S. government contracts.
To participate in classified U.S. government programs, we sought and obtained security clearances for one of our subsidiaries from the U.S. Department of Defense as required under the national security laws and regulations of the United States by entering into a proxy agreement with the U.S. government. If we do not maintain these security clearances, we will not be able to perform our obligations under any classified U.S. government contracts to which our subsidiary is a party, the U.S. government would have the right to terminate our contracts requiring access to classified information and we will not be able to enter into new classified contracts. As a result, our business could be materially adversely affected. Further, if we materially violate the terms of the proxy agreement, which limits our ability to control the operations of this subsidiary, the subsidiary holding the security clearances may be suspended or debarred from performing any government contracts, whether classified or unclassified.
| Item 1B. | Unresolved Staff Comments |
Not applicable.
41
Table of Contents
| Item 2. | Properties |
We own the two facilities in which most of our operations and employees are located in Washington, D.C. and Ellenwood, Georgia. We own the Washington, D.C. building where our administrative headquarters and primary satellite operations center are located. The land that underlies this building is leased from the U.S. government pursuant to a lease that expires in 2081. The building has approximately 917,000 gross square feet, of which approximately 546,500 square feet is used for office space and satellite operations facilities. See Item 1—Business—Our Network—Network Operations and Current Ground Facilities for descriptions of these facilities. The building also houses the majority of our sales and marketing support staff and other administrative personnel. We also lease approximately 28,546 square feet in Bethesda, Maryland where the employees of our Intelsat General subsidiary are located.
We also own a facility in Ellenwood, Georgia in which our primary customer service center is located. The facility has approximately 129,000 square feet of office space and operations facilities, which are based in two buildings and multiple antenna shelters on the property. See Item 1—Business—Our Network—Network Operations and Current Ground Facilities for a description of this facility.
Our backup satellite operations center is located at a facility which we own in Long Beach, California, which includes approximately 68,875 square feet for administrative and operational facilities. Our current plan is to lease a significant portion of this facility to third parties.
We use a worldwide ground network to operate our satellite fleet and to manage the communications services that we provide to our customers. This network is comprised of 49 owned and leased earth station and teleport facilities around the world, including 21 earth stations that perform TT&C services.
The six TT&C earth stations in our ground network which we own are located in Ellenwood, Georgia, in Fillmore, Napa and Riverside, California, in Paumalu, Hawaii and in Fuchsstadt, Germany. We lease facilities at 15 other locations for satellite operations. We also contract with the owners of some of these facilities for the provision of additional services. The locations of other earth stations in our ground network include Argentina, Australia, Bahrain, India, Italy, South Korea, Russia, South Africa, French Polynesia, Taiwan, Uruguay and the United Arab Emirates. Our network also consists of the leased communications links that connect the earth stations to our satellite operations center located at our Washington, D.C. building and to our back-up operations facility.
In addition to providing TT&C services for the operation of our satellite fleet, we own and lease facilities in order to provide teleport services to our customers. We own seven teleports in Riverside, Napa and Fillmore, California, in Ellenwood, Georgia, in Paumalu, Hawaii, in Hagerstown, Maryland and in Fuchsstadt, Germany. We lease teleport facilities at a number of other U.S. and international locations, including Castle Rock, Colorado, Australia, Cyprus, Hong Kong, Kuwait, South Korea, Switzerland, the United Arab Emirates and the United Kingdom.
We have established points of presence connected by leased fiber at key traffic exchange points around the world, including Los Angeles, New York, Hong Kong and London. We lease our facilities at these traffic exchange points. We have also established video points of presence connected by leased fiber at key video exchange points around the world, including Los Angeles, Denver, New York, Washington, D.C. and London. We lease our facilities at these video exchange points. We use our teleports and points of presence in combination with our satellite network to provide our customers with managed data and video services.
We lease office space in Luxembourg, Hamilton, Bermuda, London, England, and Wilton, Connecticut. Our Luxembourg office serves as the headquarters for Intelsat Global, Intelsat Global Subsidiary, Intelsat Holdings, Intelsat S.A., Intelsat Luxembourg, Intelsat Jackson, Intermediate Holdco and Intelsat Sub Holdco. Prior to the Migration, the headquarters of these companies was located in Bermuda. The lease on our Bermuda office is set to expire in June 2010. Our London office houses the employees of Intelsat Global Sales, our sales and
42
Table of Contents
marketing subsidiary, and functions as our global sales headquarters. The Wilton, Connecticut office formerly housed the administrative functions of the prior PanAmSat business. This facility is under a lease set to expire in 2011, and we subleased this space to third parties beginning in mid-2007, when we discontinued our operations at this facility under our integration plans. We also lease office space in New York, Florida, Australia, Brazil, China, France, Germany, India, Japan, Mexico, Singapore, South Africa and the United Arab Emirates for our local sales and marketing support offices.
| Item 3. | Legal Proceedings |
We are subject to litigation in the ordinary course of business, but management does not believe that the resolution of any pending proceedings would have a material adverse effect on our financial position or results of operations.
| Item 4. | Reserved |
43
Table of Contents
PART II
| Item 5. | Market for Registrant’s Common Equity, Related Stockholder Matters and Issuer Purchases of Equity Securities |
Not applicable.
| Item 6. | Selected Financial Data |
The following selected historical consolidated financial data should be read in conjunction with, and is qualified by reference to, Item 7—Management’s Discussion and Analysis of Financial Condition and Results of Operations and our audited consolidated financial statements and their notes included elsewhere in this Annual Report. The consolidated statement of operations data and consolidated cash flow data for the year ended December 31, 2007, the period January 1, 2008 to January 31, 2008 (predecessor entity), the period February 1, 2008 to December 31, 2008 (successor entity) and the year ended December 31, 2009, and the consolidated balance sheet data as of December 31, 2008 and 2009 have been derived from consolidated financial statements audited by KPMG LLP, an independent registered public accounting firm, included elsewhere in this Annual Report. The consolidated statement of operations data and consolidated cash flow data for the period January 1, 2005 to January 31, 2005 (predecessor entity), the period February 1, 2005 to December 31, 2005 (predecessor entity) and the year ended December 31, 2006, and the consolidated balance sheet data as of December 31, 2005, 2006 and 2007 have been derived from consolidated financial statements that are not included in this Annual Report.
| Predecessor Entity | Predecessor Entity | Successor Entity | ||||||||||||||||||||||||||||||
| January 1 to January 31, 2005 |
February 1 to December 31, 2005 |
Year Ended December 31, |
January 1 to January 31, 2008 |
February 1 to December 31, 2008 |
Year Ended December 31, 2009 |
|||||||||||||||||||||||||||
| 2006 | 2007 | |||||||||||||||||||||||||||||||
| (in thousands) | ||||||||||||||||||||||||||||||||
| Consolidated Statement of Operations Data |
||||||||||||||||||||||||||||||||
| Revenue |
$ | 97,917 | $ | 1,073,566 | $ | 1,662,666 | $ | 2,183,079 | $ | 190,261 | $ | 2,174,640 | $ | 2,513,039 | ||||||||||||||||||
| Operating expenses: |
||||||||||||||||||||||||||||||||
| Direct costs of revenue (exclusive of depreciation and amortization) |
26,939 | 215,590 | 274,280 | 323,557 | 25,683 | 337,466 | 401,826 | |||||||||||||||||||||||||
| Selling, general and administrative |
55,491 | 142,824 | 198,189 | 238,490 | 18,485 | 182,957 | 259,944 | |||||||||||||||||||||||||
| Depreciation and amortization |
39,184 | 534,329 | 701,517 | 784,120 | 64,157 | 795,663 | 804,037 | |||||||||||||||||||||||||
| Restructuring and transaction costs |
263 | — | 26,452 | 9,258 | 313,102 | 1,926 | — | |||||||||||||||||||||||||
| Impairment of asset value |
69,227 | — | 48,974 | — | — | 390,444 | 499,100 | |||||||||||||||||||||||||
| Losses on derivative financial instruments |
— | — | 11,731 | 11,699 | 11,431 | 155,305 | 2,681 | |||||||||||||||||||||||||
| Total operating expenses |
191,104 | 892,743 | 1,261,143 | 1,367,124 | 432,858 | 1,863,761 | 1,967,588 | |||||||||||||||||||||||||
| Income (loss) from operations |
(93,187 | ) | 180,823 | 401,523 | 815,955 | (242,597 | ) | 310,879 | 545,451 | |||||||||||||||||||||||
| Interest expense, net |
12,024 | 365,418 | 724,141 | 954,607 | 80,275 | 1,295,458 | 1,362,823 | |||||||||||||||||||||||||
| Gain (loss) on early extinguishment of debt |
— | — | — | (38,143 | ) | — | 576 | 4,697 | ||||||||||||||||||||||||
| Other income (expense), net |
(115 | ) | (8,191 | ) | (27,246 | ) | (137 | ) | 535 | (11,957 | ) | 42,013 | ||||||||||||||||||||
| Loss before income taxes |
(105,326 | ) | (192,786 | ) | (349,864 | ) | (176,932 | ) | (322,337 | ) | (995,960 | ) | (770,662 | ) | ||||||||||||||||||
| Provision for (benefit from) income taxes |
4,400 | 22,772 | 18,850 | 14,957 | (10,476 | ) | (109,561 | ) | 11,399 | |||||||||||||||||||||||
| Net loss |
(109,726 | ) | (215,558 | ) | (368,714 | ) | (191,889 | ) | (311,861 | ) | (886,399 | ) | (782,061 | ) | ||||||||||||||||||
| Net loss attributable to noncontrolling interest |
— | — | — | — | — | 93 | 369 | |||||||||||||||||||||||||
| Net loss attributable to Intelsat S.A. |
$ | (109,726 | ) | $ | (215,558 | ) | $ | (368,714 | ) | $ | (191,889 | ) | $ | (311,861 | ) | $ | (886,306 | ) | $ | (781,692 | ) | |||||||||||
| Consolidated Cash Flow Data |
||||||||||||||||||||||||||||||||
| Net cash provided by operating activities |
$ | 11,384 | $ | 493,628 | $ | 448,556 | $ | 557,021 | $ | 19,619 | $ | 876,143 | $ | 873,656 | ||||||||||||||||||
| Net cash provided by (used in) investing activities |
37,608 | (112,795 | ) | (3,304,607 | ) | (540,988 | ) | (24,701 | ) | (409,897 | ) | (947,095 | ) | |||||||||||||||||||
| Net cash provided by (used in) financing activities |
(475 | ) | (216,398 | ) | 3,079,761 | (173,602 | ) | (22,304 | ) | (1,504,431 | ) | 73,001 | ||||||||||||||||||||
| Other Data |
||||||||||||||||||||||||||||||||
| Capital expenditures |
$ | 953 | $ | 132,554 | $ | 152,086 | $ | 543,612 | $ | 24,701 | $ | 397,759 | $ | 943,133 | ||||||||||||||||||
44
Table of Contents
| Predecessor Entity | Successor Entity | ||||||||||||||||||||
| As of December 31, | As of December 31, | ||||||||||||||||||||
| 2005 | 2006 | 2007 | 2008 | 2009 | |||||||||||||||||
| (in thousands) | |||||||||||||||||||||
| Consolidated Balance Sheet Data |
|||||||||||||||||||||
| Cash and cash equivalents |
$ | 360,070 | $ | 583,656 | $ | 426,569 | $ | 470,211 | $ | 477,571 | |||||||||||
| Satellites and other property and equipment, net |
3,237,341 | 4,729,135 | 4,586,348 | 5,339,671 | 5,781,955 | ||||||||||||||||
| Total assets |
5,294,444 | 12,401,408 | 12,053,332 | 17,657,332 | 17,342,935 | ||||||||||||||||
| Total debt |
4,801,113 | 11,279,615 | 11,265,404 | 14,873,333 | 15,320,699 | ||||||||||||||||
| Shareholder’s equity (deficit) |
(206,265 | ) | (541,341 | ) | (722,384 | ) | 504,347 | (210,763 | ) | ||||||||||||
45
Table of Contents
| Item 7. | Management’s Discussion and Analysis of Financial Condition and Results of Operations |
The following discussion and analysis of our historical consolidated financial statements covers periods before and after the New Sponsors Acquisition Transactions. This discussion should be read together with Item 6—Selected Financial Data and our consolidated financial statements and their notes included elsewhere in this Annual Report. Our consolidated financial statements are prepared in accordance with accounting principles generally accepted in the United States, or U.S. GAAP, and, unless otherwise indicated, the other financial information contained in this Annual Report has also been prepared in accordance with U.S. GAAP. See “Forward-Looking Statements” and Item 1A—Risk Factors for a discussion of factors that could cause our future financial condition and results of operations to be different from those discussed below. Certain monetary amounts, percentages and other figures included in this Annual Report have been subject to rounding adjustments. Accordingly, figures shown as totals in certain tables may not be the arithmetic aggregation of the figures that precede them, and figures expressed as percentages in the text may not total 100% or, as applicable, when aggregated may not be the arithmetic aggregation of the percentages that precede them. Unless otherwise indicated, all references to “dollars” and “$” in this Annual Report are to, and all monetary amounts in this Annual Report are presented in, U.S. dollars.
Overview
Intelsat operates the world’s largest FSS business, providing a critical layer in the global communications infrastructure. We provide our infrastructure services on a satellite fleet comprised of over 50 satellites covering 99% of the earth’s populated regions. Our satellite capacity is complemented by a terrestrial network comprised of leased fiber optic cable and owned and operated teleports. We operate more satellite capacity in orbit, have more satellite capacity under contract, serve more commercial customers, deliver services in more countries and distribute more television channels than any other commercial satellite operator.
Impact of the New Sponsors Acquisition Transactions
On February 4, 2008, Serafina completed its acquisition of 100% of the equity ownership of Intelsat Holdings for total cash consideration of approximately $5.0 billion. The former shareholders of Intelsat Holdings (other than management) sold 100% of their equity interests in Intelsat Holdings. Upon closing, management contributed to Serafina Holdings the portion of their equity interests in Intelsat Holdings not purchased for cash by Serafina in exchange for equity interests in Serafina Holdings (which was renamed Intelsat Global, Ltd. on February 8, 2008).
In order to finance the New Sponsors Acquisition, Serafina borrowed $4.96 billion in aggregate principal amount of term loans under a $2.81 billion senior unsecured bridge loan credit agreement, dated as of February 4, 2008 (the “Senior Bridge Loan Credit Agreement”) and a $2.15 billion senior unsecured payment-in-kind election bridge loan credit agreement, dated as of February 4, 2008 (the “PIK Election Bridge Loan Credit Agreement” and, together with the Senior Bridge Loan Credit Agreement, the “Bridge Loan Credit Agreements”). See —Liquidity and Capital Resources—Long-Term Debt—New Sponsors Acquisition Financing.
Immediately following the New Sponsors Acquisition, Intelsat Bermuda, our direct wholly-owned subsidiary, transferred certain of its assets (including all of its direct and indirect ownership interests in our subsidiaries) and certain of its liabilities and obligations to a newly formed direct wholly-owned subsidiary, Intelsat Jackson, pursuant to an assignment and assumption agreement (the “Intelsat Bermuda Transfer”). Following the Intelsat Bermuda Transfer, Intelsat Jackson became the owner of substantially all of Intelsat Bermuda’s assets and the obligor with respect to substantially all of Intelsat Bermuda’s liabilities and obligations, and Intelsat Bermuda no longer had any rights or obligations with respect to such assets and liabilities. Immediately after the consummation of the Intelsat Bermuda Transfer, Serafina assigned certain of its assets and liabilities to Intelsat Bermuda (the “Serafina Assignment”), including Serafina’s rights and obligations under the Bridge Loan Credit Agreements and a Commitment Letter, dated as of June 19, 2007, among Serafina and certain banks, related to the financing of the New Sponsors Acquisition, as amended by the Commitment Letter Amendment, dated as of February 7, 2008 (the “Financing Commitment Letter”). In addition, Intelsat Sub
46
Table of Contents
Holdco and Intelsat Corporation (“Intelsat Corp”) entered into amendments to their respective existing senior secured credit facilities, and Intelsat Corp entered into a joinder agreement to its existing credit agreement, to facilitate the New Sponsors Acquisition. In connection with the New Sponsors Acquisition, on February 7, 2008, Intelsat Jackson redeemed all $260.0 million of its outstanding Floating Rate Senior Notes due 2013 and all $600.0 million of its outstanding Floating Rate Senior Notes due 2015, and on March 6, 2008, Intelsat, Ltd. redeemed all $400.0 million of its outstanding 5 1/4% Senior Notes due 2008. The New Sponsors Acquisition and the transactions described above are collectively referred to as the New Sponsors Acquisition Transactions.
Immediately upon the closing of the New Sponsors Acquisition, the Intelsat Bermuda and Intelsat Sub Holdco monitoring fee agreements with the Former Sponsors were terminated. Intelsat Bermuda entered into a new monitoring fee agreement (the “2008 MFA”) with BC Partners Holdings Limited and Silver Lake Management Company III, L.L.C. (together, the “2008 MFA parties”), pursuant to which the 2008 MFA parties provide certain monitoring, advisory and consulting services to Intelsat Bermuda.
The New Sponsors Acquisition resulted in a change of control under the indentures governing certain of our outstanding series of notes and Intelsat Jackson’s Senior Unsecured Credit Agreement dated February 2, 2007, giving the holders of those notes and loans the right to require the respective issuers to repurchase such notes and the borrower to repay such loans at 101% of their principal amount, plus accrued interest to the date of repurchase or repayment. During the second and third quarters of 2008, the relevant entities completed each such change of control offer, financing the repurchases and repayment through backstop unsecured credit agreement borrowings under the Financing Commitment Letter or with proceeds from offerings of notes and a new unsecured term loan borrowing. See —Liquidity and Capital Resources—Long-Term Debt—New Sponsors Acquisition Financing—Change of Control Offers and —Liquidity and Capital Resources—Long-Term Debt—New Sponsors Acquisition Financing—2008 Debt Refinancings.
In addition, all outstanding restricted performance shares under the Intelsat Holdings, Ltd. 2005 Share Incentive Plan (the “2005 Share Plan”) vested upon consummation of the New Sponsors Acquisition. Vesting in share-based compensation arrangements (“SCAs”) issued under the 2005 Share Plan doubled if the awardee was still employed on February 4, 2008. The vested SCAs were cancelled in return for cash in an amount equal to the excess of approximately $400 (the per share price of the transaction) over the exercise price of each share covered. Vested restricted shares (including time and performance vesting shares) were purchased at approximately $400 per share. In connection with the New Sponsors Acquisition, each unvested restricted share of Intelsat Holdings was exchanged for approximately four unvested restricted shares of Intelsat Global (“exchange shares”) and the exchange shares continued to be classified as a liability of Intelsat Global due to certain repurchase features in the 2005 Share Plan. In addition, the original vesting periods associated with the unvested Intelsat Holdings restricted shares continued. In May 2009, the board of directors of Intelsat Global adopted an amended and restated Intelsat Global, Ltd. 2008 Share Incentive Plan (the “2008 Share Plan”), and Intelsat Global entered into new restricted share agreements with respect to the exchange shares. As a result, as of December 31, 2009, these exchange share grants were no longer subject to certain repurchase features and were instead deemed to be granted in accordance with the guidance provided in Financial Accounting Standards Board (“FASB”) Accounting Standards Codification (“ASC”) (the “Codification”) Topic 718, Compensation —Stock Compensation (“FASB ASC 718”).
In connection with the completion of the New Sponsors Acquisition Transactions, we recorded $313.1 million of transaction costs in our consolidated statement of operations during the predecessor period January 1, 2008 to January 31, 2008. These costs included $197.2 million of costs associated with the repurchase or cancellation of restricted shares and SCAs of Intelsat Holdings, an advisory service fee of $60.0 million paid to the 2008 MFA parties, and $55.3 million in professional fees.
The New Sponsors Acquisition was accounted for by Intelsat Holdings under the purchase method of accounting in accordance with FASB ASC Topic 805, Business Combinations (“FASB ASC 805”). As a result, the purchase price was allocated to the assets acquired and liabilities assumed based on their estimated fair market values at the date of acquisition. In accordance with Topic 5J of the codified SEC Staff Accounting
47
Table of Contents
Bulletins, the purchase accounting adjustments have been “pushed down” and recorded in our consolidated financial statements, which resulted in a new basis of accounting for the “successor period” beginning after the consummation of the New Sponsors Acquisition. Determining fair values required us to make significant estimates and assumptions. In order to develop estimates of fair values, we considered the following generally accepted valuation approaches: the cost approach, the income approach and the market approach. Our estimates included assumptions about projected growth rates, cost of capital, effective tax rates, tax amortization periods, technology royalty rates and technology life cycles, the regulatory and legal environment, and industry and economic trends. While we believe that the estimates and assumptions underlying the valuation methodologies were reasonable, different assumptions could have resulted in different market values. The purchase price allocation was finalized during the year ended December 31, 2008.
Revenue
Revenue Overview
We earn revenue primarily by providing services over satellite transponder capacity to our customers. Our customers generally obtain satellite capacity from us by placing an order pursuant to one of several master customer service agreements. The master customer agreements and related service orders under which we sell services specify, among other things, the amount of satellite capacity to be provided, whether service will be non-preemptible or preemptible and the service term. Most services are full time in nature, with service terms ranging from one year to as long as 15 years. Occasional use services used for video applications can be for much shorter periods, including increments of one hour. Our master customer service agreements offer different service types, including transponder services, managed services, and channel, which are all services that are provided on, or used to provide access to, our global network. Our customer agreements also cover services from third parties, or mobile satellite services, that can include transponder services and mobile satellite services (“MSS”). The following table describes our primary service types:
| Service Type |
Description | |
| Transponder Services |
• Commitments by customers to receive service via, or to utilize capacity on particular designated transponders according to specified technical and commercial terms | |
| Managed Services |
• Hybrid services which combine satellite capacity, teleport facilities, satellite communications hardware and fiber optic cable and other ground facilities to provide managed and monitored broadband, Internet, video and private network services to customers. | |
| Mobile Satellite Services and Other |
• Voice, data and video services provided by third-party commercial satellite operators for which the desired frequency type or geographic coverage is not available on our network, which we refer to as off-network. These services include mobile satellite services, for which our Intelsat General business is a reseller. This category also includes revenue for a number of satellite-related consulting and technical services that involve the lifecycle of satellite operations and related infrastructure, from satellite and launch vehicle procurement through TT&C services and related equipment sales. | |
| Channel |
• Commitments by customers to purchase an overall amount or level of service, without committing to particular designated transponders for specified terms within the commitment period. Services are offered “off the shelf,” so technical terms are not specially tailored to a given customer. Channel is not considered a core service offering due to changing market requirements and the proliferation of fiber alternatives for point-to-point customer applications | |
48
Table of Contents
We market our services on a global basis, with almost every populated region of the world contributing to our revenue. The diversity of our revenue allows us to benefit from changing market conditions and lowers our risk from revenue fluctuations in our service applications and geographic regions.
Trends Impacting Our Revenue
Our revenue at any given time is partially dependent on the supply of communications capacity available in a geographic region, including capacity from other satellite providers and from competing technologies such as fiber optic cable networks, as well as the level of demand for that capacity. See Item 1—Business—The FSS Sector for a discussion of the global trends creating demand for our services. In recent years, we have generated new revenue from a number of sources, including on our global network from growth in demand for transponder services for network services applications such as network extensions for cellular phone operators and satellite-based private data networks and managed services for Internet backbone access and corporate broadband networks. We have also experienced growth in demand for transponder services for use in video applications such as HDTV services and DTH television services. New transponder services and managed services revenue has also been generated from demand for government applications, such as support for military operations. Growth in demand for mobile satellite services, generally from demand from our government customers for spectrum or regional coverage unavailable on our network, has also resulted in new revenue. Although margins for these mobile satellite services are typically substantially lower than for services provided on our network, our mobile satellite services are low risk in nature, with the terms and conditions of the procured capacity typically matched to contractual commitments from our customers.
See Item 1—Business—Our Customer Sets for a discussion of our customers’ uses of our services and see Item 1—Business—Our Strategy for a discussion of our strategies with respect to marketing to our various customer sets.
Customer Applications
Our transponder services, managed services, mobile satellite services and channel are used by our customers for three primary customer applications: network service applications, media applications and government applications.
Pricing
We believe that the flexibility that we have to help our customers optimize their services and in pricing services for new capacity in certain regions has positively affected our revenue. Although the pricing of our services is generally fixed for the duration of existing service commitments, new and renewing service commitments are priced competitively to reflect regional demand and other factors, subject to the contractual restrictions noted in the paragraph below. We believe that this flexibility in pricing our services will continue to positively affect our revenue from certain geographic regions. Over the last three years, we experienced improving pricing trends in most of the regions we serve, including in North America, Africa, the Middle East and Eastern Europe.
We are subject to contractual restrictions that constrain our ability to price services according to market rates in some limited circumstances. These contractual restrictions include the LCO protection provisions described in Item 1—Business—Certain Customer Service Agreements.
49
Table of Contents
Operating Expenses
Direct Costs of Revenue (Exclusive of Depreciation and Amortization)
Direct costs of revenue relate to costs associated with the operation and control of our satellites, our communications network and engineering support and consist principally of salaries and related employment costs, in-orbit insurance, earth station operating costs and facilities costs. Our direct costs of revenue fluctuate based on the number and type of services offered and under development. Direct costs of revenue have increased due to our expanded sales of mobile satellite services to customers of our Intelsat General business and due to launch vehicle costs related to satellite-related services. We expect our direct costs of revenue to increase as we add customers and expand our managed services and mobile satellite services.
Selling, General and Administrative Expenses
Selling, general and administrative expenses relate to costs associated with our sales and marketing staff and our administrative staff, which includes legal, finance and human resources. Staff expenses consist primarily of salaries and related employment costs including stock compensation, travel costs and office occupancy costs. Selling, general and administrative expenses also include building maintenance and rent expenses and the provision for uncollectible accounts. Selling, general and administrative expenses also include fees for professional services and fees payable to the New Sponsors and related parties in support of the New Sponsors Acquisition Transactions and other strategic activities, which have been significant in recent periods due to the high level of transaction activity. Selling, general and administrative expenses fluctuate with the number of customers served and the number and types of services offered.
Depreciation and Amortization
Our capital assets consist primarily of our satellites and associated ground network infrastructure. Included in capitalized satellite costs are the costs for satellite construction, satellite launch services, insurance premiums for satellite launch and the in-orbit testing period, the net present value of deferred satellite performance incentives payable to satellite manufacturers, and capitalized interest incurred during the satellite construction period.
Capital assets are depreciated or amortized on a straight-line basis over their estimated useful lives. The remaining depreciable lives of our satellites range from less than one year to 16 years. As a result of the New Sponsors Acquisition Transactions, our depreciation and amortization costs have increased, principally due to depreciation costs we incurred on satellites and the amortization of intangible assets primarily due to increases in fair values as a result of purchase accounting.
Impairment Charges
We recorded a non-cash impairment charge of $63.6 million during the second quarter of 2008 related to the write-down of the Galaxy 26 satellite to its fair value after a partial loss of the satellite. We also recorded $326.8 million in non-cash impairment charges in connection with our 2008 annual impairment assessment of our orbital locations. During the first quarter of 2009, the credit markets continued to experience difficulties, with new debt issuances being priced at significantly higher effective interest rates as compared to the pricing of debt issuances completed in prior periods. The higher effective interest rates reflected, in our view, higher discounts being applied in the valuation of companies generally, and were therefore considered by us to be an indicator of potential impairment to the fair value of our right to operate at orbital locations. The higher interest rates resulted in an increase to our weighted average cost of capital, and led to our recognizing a non-cash impairment charge of $499.1 million in the first quarter of 2009. See—Critical Accounting Policies—Asset Impairment Assessments.
50
Table of Contents
Backlog
We benefit from strong visibility of our future revenues. Our backlog, which is our expected future revenue under all our customer contracts, but includes only our pro rata share of backlog of our joint venture investments, was approximately $9.4 billion as of December 31, 2009. As of December 31, 2009, the weighted average remaining customer contract life was approximately 4.7 years. We currently expect to deliver services associated with approximately $2.1 billion, or approximately 22%, of our December 31, 2009 backlog during the year ending December 31, 2010. Based on our backlog at December 31, 2009, we expect to recognize at least $105.9 million in channel applications revenue over the next twelve months. The amount included in backlog represents the full service charge for the duration of the contract and does not include termination fees. As of December 31, 2009, 96% of our total backlog related to contracts that either were non-cancellable or had substantial termination fees. In certain cases of breach for non-payment or customer bankruptcy, we may not be able to recover the full value of certain contracts or termination fees. Our expected future revenue under contractual backlog as of December 31, 2009 was as follows (in millions):
| Period |
|||
| 2010 |
$ | 2,073.3 | |
| 2011 |
1,514.6 | ||
| 2012 |
1,165.6 | ||
| 2013 |
952.9 | ||
| 2014 |
759.8 | ||
| 2015 and thereafter |
2,950.5 | ||
| Total |
$ | 9,416.7 | |
Our backlog by service type as of December 31, 2009 was as follows (in millions, except percentages):
| Service Type |
Amount | Percent | ||||
| Transponder services |
$ | 8,073.5 | 86 | % | ||
| Managed services |
465.8 | 5 | ||||
| Mobile satellite services and other |
455.0 | 5 | ||||
| Channel |
422.4 | 4 | ||||
| Total |
$ | 9,416.7 | 100 | % | ||
We believe this backlog and the resulting predictable cash flows in the FSS sector reduce the volatility of our net cash provided by operating activities more than would be typical for a company outside our industry.
Results of Operations
Years Ended December 31, 2008 and 2009
As a result of the consummation of the New Sponsors Acquisition, the financial results for the combined year ended December 31, 2008 have been separately presented for the “predecessor entity” for the period January 1, 2008 to January 31, 2008 and for the “successor entity” for the period February 1, 2008 to December 31, 2008. As such, the reported results of operations for the combined year ended December 31, 2008 are not necessarily comparable to the year ended December 31, 2009, primarily due to interest expense resulting from the acquisition financing and depreciation and amortization costs principally due to the fair value adjustments to long-lived assets in connection with the New Sponsors Acquisition. The historical results are not necessarily indicative of results to be expected for any future period.
For comparative purposes, we combined the periods from January 1, 2008 to January 31, 2008 and February 1, 2008 to December 31, 2008 in our discussion below, as we believe this combination is useful to
51
Table of Contents
provide the reader a year-over-year comparison for purposes of understanding our Management’s Discussion and Analysis of Financial Condition and Results of Operations. We believe this combination of results for the predecessor entity and successor entity periods facilitates an investor’s understanding of our results of operations for the year ended December 31, 2009 compared to the combined year ended December 31, 2008. However, this combination is not a measure in accordance with United States generally accepted accounting principles (“U.S. GAAP”) and should not be used in isolation or substituted for the separate predecessor entity and successor entity results.
| Predecessor Entity |
Successor Entity |
Combined | ||||||||||||
| Period January 1, 2008 to January 31, 2008 |
Period February 1, 2008 to December 31, 2008 |
Year Ended December 31, 2008 |
||||||||||||
| (in thousands) | ||||||||||||||
| Revenue |
$ | 190,261 | $ | 2,174,640 | $ | 2,364,901 | ||||||||
| Operating expenses: |
||||||||||||||
| Direct costs of revenue (exclusive of depreciation and amortization) |
25,683 | 337,466 | 363,149 | |||||||||||
| Selling, general and administrative |
18,485 | 182,957 | 201,442 | |||||||||||
| Depreciation and amortization |
64,157 | 795,663 | 859,820 | |||||||||||
| Transaction costs |
313,102 | 1,926 | 315,028 | |||||||||||
| Impairment of asset value |
— | 390,444 | 390,444 | |||||||||||
| Losses on derivative financial instruments |
11,431 | 155,305 | 166,736 | |||||||||||
| Total operating expenses |
432,858 | 1,863,761 | 2,296,619 | |||||||||||
| Income (loss) from operations |
(242,597 | ) | 310,879 | 68,282 | ||||||||||
| Interest expense, net |
80,275 | 1,295,458 | 1,375,733 | |||||||||||
| Gain on early extinguishment of debt |
— | 576 | 576 | |||||||||||
| Other income (expense), net |
535 | (11,957 | ) | (11,422 | ) | |||||||||
| Loss before income taxes |
(322,337 | ) | (995,960 | ) | (1,318,297 | ) | ||||||||
| Benefit from income taxes |
(10,476 | ) | (109,561 | ) | (120,037 | ) | ||||||||
| Net loss |
(311,861 | ) | (886,399 | ) | (1,198,260 | ) | ||||||||
| Net loss attributable to noncontrolling interest |
— | 93 | 93 | |||||||||||
| Net loss attributable to Intelsat S.A. |
$ | (311,861 | ) | $ | (886,306 | ) | $ | (1,198,167 | ) | |||||
52
Table of Contents
The following table sets forth our comparative statements of operations for the periods shown with the increase (decrease) and percentage changes, except those deemed not meaningful (“NM”), between the periods presented (in thousands, except percentages):
| Year Ended December 31, 2009 Compared to Combined Year Ended December 31, 2008 |
|||||||||||||||
| Combined | |||||||||||||||
| Year Ended December 31, 2008 |
Year Ended December 31, 2009 |
Increase (Decrease) |
Percentage Change |
||||||||||||
| Revenue |
$ | 2,364,901 | $ | 2,513,039 | $ | 148,138 | 6 | % | |||||||
| Operating expenses: |
|||||||||||||||
| Direct costs of revenue (exclusive of depreciation and amortization) |
363,149 | 401,826 | 38,677 | 11 | |||||||||||
| Selling, general and administrative |
201,442 | 259,944 | 58,502 | 29 | |||||||||||
| Depreciation and amortization |
859,820 | 804,037 | (55,783 | ) | (6 | ) | |||||||||
| Transaction costs |
315,028 | — | (315,028 | ) | NM | ||||||||||
| Impairment of asset value |
390,444 | 499,100 | 108,656 | 28 | |||||||||||
| (Gains) losses on derivative financial instruments |
166,736 | 2,681 | (164,055 | ) | (98 | ) | |||||||||
| Total operating expenses |
2,296,619 | 1,967,588 | (329,031 | ) | (14 | ) | |||||||||
| Income from operations |
68,282 | 545,451 | 477,169 | NM | |||||||||||
| Interest expense, net |
1,375,733 | 1,362,823 | (12,910 | ) | (1 | ) | |||||||||
| Gain on early extinguishment of debt |
576 | 4,697 | 4,121 | NM | |||||||||||
| Other income (expense), net |
(11,422 | ) | 42,013 | 53,435 | NM | ||||||||||
| Loss before income taxes |
(1,318,297 | ) | (770,662 | ) | 547,635 | (42 | ) | ||||||||
| Provision for (benefit from) income taxes |
(120,037 | ) | 11,399 | 131,436 | NM | ||||||||||
| Net loss |
(1,198,260 | ) | (782,061 | ) | 416,199 | (35 | )% | ||||||||
| Net loss attributable to noncontrolling interest |
93 | 369 | 276 | NM | |||||||||||
| Net loss attributable to Intelsat S.A. |
$ | (1,198,167 | ) | $ | (781,692 | ) | $ | 416,475 | (35 | )% | |||||
Revenue
The following table sets forth our comparative revenue by service type for the periods shown (in thousands, except percentages):
| Predecessor Entity |
Successor Entity | Combined | Successor Entity |
||||||||||||||||||
| Period January 1, 2008 to January 31, 2008 |
Period February 1, 2008 to December 31, 2008 |
Year Ended December 31, 2008 |
Year Ended December 31, 2009 |
Increase (Decrease) |
Percentage Change |
||||||||||||||||
| Transponder services |
$ | 146,344 | $ | 1,648,899 | $ | 1,795,243 | $ | 1,901,235 | $ | 105,992 | 6 | % | |||||||||
| Managed services |
23,847 | 278,725 | 302,572 | 313,336 | 10,764 | 4 | |||||||||||||||
| Mobile satellite services and other |
7,545 | 114,848 | 122,393 | 164,808 | 42,415 | 35 | |||||||||||||||
| Channel |
12,525 | 132,168 | 144,693 | 133,660 | (11,033 | ) | (8 | ) | |||||||||||||
| Total |
$ | 190,261 | $ | 2,174,640 | $ | 2,364,901 | $ | 2,513,039 | $ | 148,138 | 6 | % | |||||||||
53
Table of Contents
Revenue for the year ended December 31, 2009 increased by $148.1 million, or 6%, as compared to the combined year ended December 31, 2008. Included in the year ended December 31, 2009 was revenue of $44.2 million earned from the resale of launch vehicles and related services, a business which we do not currently intend to pursue in the future. By service type, our revenue increased or decreased due to the following:
| • | Transponder services—an aggregate increase of $106.0 million, primarily due to a $72.9 million increase in revenue from network services customers, resulting from new business, service expansions and strong renewals, primarily in the Latin America and Caribbean, the Europe and the Africa and Middle East regions, and a $57.2 million increase in revenues from customers of our Intelsat General business, resulting from new business, service expansions and strong renewals primarily in the North America region, a portion of which was related to capacity resold from third parties. These increases were partially offset by a $24.1 million decline in revenue from media customers primarily due to the conclusion of two contracts in 2008, one in the Africa and Middle East region and one in the North America region, as well as a decline in the Latin America and Caribbean regions. |
| • | Managed services—an aggregate increase of $10.8 million, primarily due to an increase in revenue from network services customers, resulting from new business and service expansions in trunking and private line solutions primarily in the Africa and Middle East region. |
| • | Mobile satellite services and other—an aggregate increase of $42.4 million, primarily due to increased revenues from professional and technical services performed for satellite operators and other customers of our satellite-related services business, including $26.3 million in increased revenue from the completion of the resale of two launch vehicles during the year ended December 31, 2009, and increased revenue from third-party usage-based mobile services and sales of customer premises equipment primarily for customers of our Intelsat General business. |
| • | Channel—a decrease of $11.0 million related to continued declines from the migration of point-to-point satellite traffic to fiber optic cables across transoceanic routes and the optimization of customer networks, a trend which we expect will continue. |
Operating Expenses
Direct Costs of Revenue (Exclusive of Depreciation and Amortization)
Direct costs of revenue increased by $38.7 million, or 11%, to $401.8 million for the year ended December 31, 2009 as compared to the combined year ended December 31, 2008. The increase was primarily due to the following:
| • | an increase of $19.1 million primarily for mobile satellite services sold to customers of our Intelsat General business; |
| • | an increase of $8.6 million related to launch vehicle resale costs incurred by our satellite related services business; |
| • | an increase of $3.9 million in staff expenses primarily related to the adoption of the 2008 Share Plan and equity grants to employees during 2009; and |
| • | an increase of $3.2 million related to earth station operations. |
Selling, General and Administrative
Selling, general and administrative expenses increased by $58.5 million, or 29%, to $259.9 million for the year ended December 31, 2009 as compared to the combined year ended December 31, 2008. The increase was primarily due to an increase of $54.8 million in costs related to the adoption of the 2008 Share Plan and equity grants to employees during 2009.
54
Table of Contents
Depreciation and Amortization
Depreciation and amortization expense decreased by $55.8 million, or 6%, to $804.0 million for the year ended December 31, 2009 as compared to the combined year ended December 31, 2008. This decrease was primarily due to:
| • | a net decrease of $60.4 million in depreciation expense due to certain satellites, ground and other assets becoming fully depreciated, the impairment of Galaxy 26 in 2008 and changes in estimated remaining useful lives of certain satellites; and |
| • | a decrease of $18.3 million in amortization expense primarily due to changes in the expected pattern of consumption of amortizable intangible assets; partially offset by |
| • | an increase of $26.5 million in depreciation expense resulting from the impact of satellites placed into service during the second half of 2008 and the third quarter of 2009; and |
| • | an increase of $2.5 million in depreciation expense attributable to the write-up of our depreciable assets to fair value upon the closing of the New Sponsors Acquisition. |
Income from Operations
Our income from operations increased by $477.2 million to $545.5 million for the year ended December 31, 2009 as compared to $68.3 million for the combined year ended December 31, 2008. The year-over-year comparisons of our financial results were affected by certain material pre-tax charges as discussed below:
| • | a $499.1 million non-cash impairment charge recorded in the first quarter of 2009 related to the impairment of our rights to operate at orbital locations resulting from an increase in the discount rate used in our valuation process, compared to a total $390.4 million non-cash impairment charge in 2008 related to the impairment of our orbital locations as a result of the annual impairment analysis of non-amortizable intangible assets, and the impairment of Galaxy 26; |
| • | a $164.0 million increase in income from operations as a result of a decrease in the losses recognized on our derivative financial instruments for the year ended December 31, 2009 as compared to the combined year ended December 31, 2008. The value of undesignated interest rate swaps decreased due to cash settlements for interest, representing the difference between the amount of floating rate interest we receive and the amount of fixed rate interest we pay, offset by an increase in fair value as a result of marking-to-market as well as the decrease in the outstanding liability related to our put option embedded derivative; and |
| • | $315.0 million in transaction costs incurred during the combined year ended December 31, 2008 upon consummation of the New Sponsors Acquisition, with no similar costs incurred during the year ended December 31, 2009. |
Interest Expense, Net
Interest expense, net consists of the gross interest expense we incur less the amount of interest we capitalize related to capital assets under construction and less interest income earned. We also held interest rate swaps with an aggregate notional amount of $3.3 billion to economically hedge the variability in cash flow on a portion of the floating-rate term loans under our senior secured and unsecured credit facilities. The swaps have not been designated as hedges for accounting purposes. Interest expense, net decreased by $12.9 million, or 1%, to $1.36 billion for the year ended December 31, 2009, as compared to $1.38 billion for the combined year ended December 31, 2008. The decrease in interest expense was principally due to the following:
| • | a decrease of $96.3 million due to lower interest rates on our variable rate debt in 2009 as compared to 2008; and |
| • | an increase of $13.1 million in capitalized interest expense; partially offset by |
55
Table of Contents
| • | an increase of approximately $68.5 million due to a higher principal amount outstanding of Intelsat Luxembourg’s 11 1/2% /12 1/2% Senior PIK Election Notes due 2017 (the “2017 PIK Notes”), partially offset by a decrease in interest expense resulting from the purchase of a portion of the 2017 PIK Notes with proceeds from the 2009 Jackson Notes Offering (as defined below in—Liquidity and Capital Resources—Long-term Debt—Long-Term Debt Changes in 2009); |
| • | an increase of approximately $15.3 million due to the incurrence or assumption of approximately $3.7 billion of net additional indebtedness and the refinancing of portions of our debt at higher interest rates in connection with the New Sponsors Acquisition; |
| • | an increase of $5.4 million due to a higher principal amount of debt and higher interest rates resulting from the repurchase or repayment of certain notes or loans in connection with our change of control offers that were completed in the second and third quarters of 2008; and |
| • | an increase of $4.8 million related to the additional indebtedness incurred in connection with the offering of the 2009 Sub Holdco Notes (as defined below in—Liquidity and Capital Resources—Long-term Debt—Long-Term Debt Changes in 2009). |
The non-cash portion of total interest expense, net was $423.4 million for the year ended December 31, 2009 and included $298 million of payment-in-kind (“PIK”) interest expense.
Gain on Early Extinguishment of Debt
Gain on early extinguishment of debt was $4.7 million for the year ended December 31, 2009 as compared to $0.6 million for the combined year ended December 31, 2008. The increase of $4.1 million was primarily related to a $19.7 million gain on early extinguishment of debt due to the paydown of $400.0 million face amount of the 2017 PIK Notes in October 2009. This was partially offset by a $15.0 million loss on early extinguishment of debt recognized in connection with Intelsat Sub Holdco’s purchase of $114.2 million of Intelsat, Ltd.’s outstanding 7 5/ 8% Senior Notes due 2012 for $93.3 million and $346.5 million of Intelsat, Ltd.’s outstanding 6 1/2% Senior Notes due 2013 for $254.6 million pursuant to the Tender Offer (as defined below in—Liquidity and Capital Resources—Long-Term Debt—Long-Term Debt Changes in 2009). The loss was primarily driven by the difference between the carrying value of the notes purchased and the cash paid for the purchase, as a result of the higher unamortized discount recorded in connection with the New Sponsors Acquisition, when our pre-acquisition long-term debt was adjusted to fair value as of the effective date of the transaction.
Other Income (Expense), Net
Other income, net was $42.0 million for the year ended December 31, 2009 as compared to $11.4 million other expense, net for the combined year ended December 31, 2008. The increase of $53.4 million was primarily related to equity method and impairment losses of $17.6 million recorded during the year ended December 31, 2008, $27.3 million of gain from the sale of our equity ownership in WildBlue Communications, Inc. (“WildBlue”) in the fourth quarter of 2009, and a net $13.9 million increase in exchange rate gains, primarily due to the U.S. dollar strengthening against the Brazilian real, which impacts our service contracts with our Brazilian customers. Offsetting these increases were a $3.8 million decrease in miscellaneous income, driven by income in 2008 resulting from a reduction in the amounts we were required to pay under a customer contract as a result of an amendment, and a $1.8 million decrease related to a realized gain on our available-for-sale investments in 2008 compared to a realized loss in 2009.
Provision for (Benefit from) Income Taxes
Our provision for income taxes increased by $131.4 million to $11.4 million for the year ended December 31, 2009 as compared to a benefit of $120.0 million for the combined year ended December 31, 2008. The increase in expense was principally due to higher earnings in our historical subsidiaries subject to U.S. and
56
Table of Contents
U.K. tax as compared to the prior year period primarily due to one-time transaction costs, losses on derivative financial instruments and impairment charges taken in 2008, which exceeded the amounts in 2009. The tax expense reported in our consolidated statements of operations was mostly attributable to U.S. and U.K. taxes, as well as withholding taxes on revenue earned in many of our foreign markets.
Years Ended December 31, 2007 and 2008
As a result of the consummation of the New Sponsors Acquisition, the financial results for 2008 have been separately presented for the “Predecessor Entity” for the period January 1, 2008 to January 31, 2008 and for the “Successor Entity” for the period February 1, 2008 to December 31, 2008. As a result of the New Sponsors Acquisition, the reported results of operations for the years ended December 31, 2007 and 2008 are not necessarily comparable. The primary differences include higher interest expense resulting from the acquisition financing and higher depreciation and amortization cost principally due to the fair value adjustments to long-lived assets in connection with the New Sponsors Acquisition Transactions. The historical results are not necessarily indicative of results to be expected for any future period.
For comparative purposes, we combined the periods from January 1, 2008 through December 31, 2008 in our discussion below, as we believe this combination is useful to provide the reader a year-over-year comparison for purposes of understanding our Management’s Discussion and Analysis of Financial Condition and Results of Operations. This combination of results for the Predecessor Entity and Successor Entity periods facilitates an investor’s understanding of our results of operations for 2007 compared to the combined year ended December 31, 2008. However, this combination is not a U.S. GAAP measure and should not be used in isolation or substituted for the separate predecessor entity and successor entity results.
| Predecessor Entity | Successor Entity | Combined | ||||||||||||
| Period January 1, 2008 to January 31, 2008 |
Period February 1, 2008 to December 31, 2008 |
Year Ended December 31, 2008 |
||||||||||||
| (in thousands) | ||||||||||||||
| Revenue |
$ | 190,261 | $ | 2,174,640 | $ | 2,364,901 | ||||||||
| Operating expenses: |
||||||||||||||
| Direct costs of revenue (exclusive of depreciation and amortization) |
25,683 | 337,466 | 363,149 | |||||||||||
| Selling, general and administrative |
18,485 | 182,957 | 201,442 | |||||||||||
| Depreciation and amortization |
64,157 | 795,663 | 859,820 | |||||||||||
| Transaction costs |
313,102 | 1,926 | 315,028 | |||||||||||
| Impairment of asset value |
— | 390,444 | 390,444 | |||||||||||
| Losses on derivative financial instruments |
11,431 | 155,305 | 166,736 | |||||||||||
| Total operating expenses |
432,858 | 1,863,761 | 2,296,619 | |||||||||||
| Income (loss) from operations |
(242,597 | ) | 310,879 | 68,282 | ||||||||||
| Interest expense, net |
80,275 | 1,295,458 | 1,375,733 | |||||||||||
| Gain on early extinguishment of debt |
— | 576 | 576 | |||||||||||
| Other income (expense), net |
535 | (11,957 | ) | (11,422 | ) | |||||||||
| Loss before income taxes |
(322,337 | ) | (995,960 | ) | (1,318,297 | ) | ||||||||
| Benefit from income taxes |
(10,476 | ) | (109,561 | ) | (120,037 | ) | ||||||||
| Net loss |
(311,861 | ) | (886,399 | ) | (1,198,260 | ) | ||||||||
| Net loss attributable to noncontrolling interest |
— | 93 | 93 | |||||||||||
| Net loss attributable to Intelsat S.A. |
$ | (311,861 | ) | $ | (886,306 | ) | $ | (1,198,167 | ) | |||||
57
Table of Contents
The following table sets forth our comparative statements of operations for the year ended December 31, 2007 and for the combined year ended December 31, 2008, with the increase (decrease) and percentage changes, except those deemed not meaningful (“NM”), between the periods presented (in thousands, except percentages):
| Combined | Combined Year Ended December 31, 2008 Compared to Year Ended December 31, 2007 |
||||||||||||||||
| Year Ended December 31, 2007 |
Year Ended December 31, 2008 |
Increase (Decrease) |
Percentage Change |
||||||||||||||
| Revenue |
$ | 2,183,079 | $ | 2,364,901 | $ | 181,822 | 8 | % | |||||||||
| Operating expenses: |
|||||||||||||||||
| Direct costs of revenue (exclusive of depreciation and amortization) |
323,557 | 363,149 | 39,592 | 12 | |||||||||||||
| Selling, general and administrative |
238,490 | 201,442 | (37,048 | ) | (16 | ) | |||||||||||
| Depreciation and amortization |
784,120 | 859,820 | 75,700 | 10 | |||||||||||||
| Transaction costs |
9,258 | 315,028 | 305,770 | NM | |||||||||||||
| Impairment of asset value |
— | 390,444 | 390,444 | NM | |||||||||||||
| Losses on derivative financial instruments |
11,699 | 166,736 | 155,037 | NM | |||||||||||||
| Total operating expenses |
1,367,124 | 2,296,619 | 929,495 | 68 | |||||||||||||
| Income from operations |
815,955 | 68,282 | (747,673 | ) | (92 | ) | |||||||||||
| Interest expense, net |
954,607 | 1,375,733 | 421,126 | 44 | |||||||||||||
| Gain (loss) on early extinguishment of debt |
(38,143 | ) | 576 | 38,719 | NM | ||||||||||||
| Other expense, net |
(137 | ) | (11,422 | ) | (11,285 | ) | NM | ||||||||||
| Loss before income taxes |
(176,932 | ) | (1,318,297 | ) | (1,141,365 | ) | NM | ||||||||||
| Provision for (benefit from) income taxes |
14,957 | (120,037 | ) | (134,994 | ) | NM | |||||||||||
| Net loss |
(191,889 | ) | (1,198,260 | ) | (1,006,371 | ) | NM | % | |||||||||
| Net loss attributable to noncontrolling interest |
— | 93 | 93 | NM | |||||||||||||
| Net loss attributable to Intelsat S.A. |
$ | (191,889 | ) | $ | (1,198,167 | ) | $ | (1,006,278 | ) | NM | % | ||||||
Revenue
The following table sets forth our comparative revenue by service type for the year ended December 31, 2007 (Predecessor Entity), the period January 1, 2008 to January 31, 2008 (Predecessor Entity), the period February 1, 2008 to December 31, 2008 (Successor Entity) and the combined year ended December 31, 2008, with the increase (decrease) and percentage changes between the year ended December 31, 2007 and the combined year ended December 31, 2008 presented (in thousands, except percentages):
| Predecessor Entity | Successor Entity | Combined | |||||||||||||||||||
| Year Ended December 31, 2007 |
Period January 1, 2008 to January 31, 2008 |
Period February 1, 2008 to December 31, 2008 |
Year Ended December 31, 2008 |
Increase (Decrease) |
Percentage Change |
||||||||||||||||
| Transponder services |
$ | 1,654,321 | $ | 146,344 | $ | 1,648,899 | $ | 1,795,243 | $ | 140,922 | 9 | % | |||||||||
| Managed services |
264,038 | 23,847 | 278,725 | 302,572 | 38,534 | 15 | |||||||||||||||
| Channel |
163,488 | 12,525 | 132,168 | 144,693 | (18,795 | ) | (11 | ) | |||||||||||||
| Mobile satellite services and other |
101,232 | 7,545 | 114,848 | 122,393 | 21,161 | 21 | |||||||||||||||
| Total |
$ | 2,183,079 | $ | 190,261 | $ | 2,174,640 | $ | 2,364,901 | $ | 181,822 | 8 | % | |||||||||
58
Table of Contents
Revenue for the combined year ended December 31, 2008 increased by $181.8 million, or 8%, as compared to the year ended December 31, 2007. New business, strong renewals, expansion of existing contracts and improved contract terms contributed to the overall favorable trends. All regions reported revenue increases, with the Europe, the Africa and Middle East, and the North America regions showing the strongest gains. By service type, our revenue increased or decreased due to the following:
| • | Transponder services—an aggregate increase of $140.9 million, due primarily to a $114.0 million increase in revenues from network services customers, which resulted from new capacity services and strong renewals in the Africa and Middle East and the Europe regions, and a $32.5 million increase in revenues from our government business customers resulting from new services and strong renewals in North America, offset partially by a decline in revenues from media customers, primarily in North America. |
| • | Managed services—an aggregate increase of $38.5 million, due primarily to a $23.1 million increase in revenue from network services customers, resulting from new business and service expansion in trunking and private line solutions and GXS broadband solutions in the Africa and Middle East, the North America and the Europe regions, an $11.7 million increase in revenues from managed video solutions for media customers primarily in the Europe and the Latin America and Caribbean regions, and an increase of $3.7 million in revenues from managed services for our government business customers. |
| • | Channel—a decrease of $18.8 million related to continued declines from the migration of point-to point satellite traffic to fiber optic cables across transoceanic routes and the optimization of customer networks, a trend which we expect will continue. |
| • | Mobile satellite services and other—an aggregate increase of $21.2 million primarily due to a $3.5 million increase in satellite-related services sold mainly to customers in North America, a $10.5 million increase in usage based mobile services for our government business customers and a $7.2 million increase in professional services, including provision of customer premises equipment for our government business customers. |
Operating Expenses
Direct Costs of Revenue (Exclusive of Depreciation and Amortization)
Direct costs of revenue increased by $39.6 million, or 12%, to $363.1 million for the combined year ended December 31, 2008 as compared to the year ended December 31, 2007. The increase was primarily due to:
| • | a $27.1 million increase in cost of sales, fiber and third-party satellite capacity costs related to increased revenues; |
| • | a $10.5 million increase in cost of sales to support our satellite services program management; and |
| • | a $6.1 million increase in office and occupancy expense primarily due to building modification and maintenance programs; partially offset by |
| • | a $5.4 million decrease in other expenses primarily due to lower satellite-related insurance costs during the combined year ended December 31, 2008. |
Selling, General and Administrative
Selling, general and administrative expenses decreased by $37.0 million, or 16%, to $201.4 million for the combined year ended December 31, 2008 as compared to the year ended December 31, 2007. The decrease was primarily due to:
| • | a $17.4 million decrease in bad debt expense due to improvements in the timing and amount of account collections, as well as the collection of certain accounts that had been reserved for; |
59
Table of Contents
| • | a $12.3 million decrease in professional fees in the combined year ended December 31, 2008 due to heightened expenses incurred during the year ended December 31, 2007 to support our integration activities and other merger and acquisition activities; and |
| • | an $11.5 million decrease in staff expenses due to the departure of certain executive level staff and other staff reductions during the combined year ended December 31, 2008. |
Depreciation and Amortization
Depreciation and amortization expense increased by $75.7 million, or 10%, to $859.8 million for the combined year ended December 31, 2008 as compared to the year ended December 31, 2007. This increase was primarily due to:
| • | an increase of $89.7 million in depreciation and amortization expense primarily attributable to the write-up of our depreciable satellites and amortizable assets to fair value upon the closing of the New Sponsors Acquisition; and |
| • | an increase of $24.0 million in depreciation expense resulting from the full year impact of satellites placed into service during 2007 and the impact of satellites placed into service in 2008, primarily our Galaxy 17, IS-11, Galaxy 18 and Galaxy 19 satellites; partially offset by |
| • | a decrease of $33.6 million in depreciation expense due to certain satellites becoming fully depreciated in 2008. |
Income from Operations
Our income from operations decreased by $747.7 million, or 92%, for the combined year ended December 31, 2008 as compared to the year ended December 31, 2007. The year-over-year comparisons of our financial results were affected by material pre-tax charges as discussed below:
| • | a $390.4 million non-cash impairment charge in 2008, of which $326.8 million was related to the impairment of our orbital locations as a result of our annual impairment analysis of non-amortizable intangible assets and $63.6 million was related to our Galaxy 26 satellite, which experienced a sudden and unexpected electrical distribution anomaly (see—Critical Accounting Policies—Asset Impairment Assessments); |
| • | a $305.8 million increase in restructuring and transaction costs primarily associated with the New Sponsors Acquisition Transactions, which in 2008 primarily consisted of $197.2 million related to the sale or cancellation of restricted shares and SCAs, a transaction fee of $60.0 million paid to entities affiliated or associated with the New Sponsors under the 2008 MFA and $55.3 million in seller professional fees; and |
| • | a $155.0 million decrease in the value of undesignated interest rate swaps as a result of changes in interest rates. |
Interest Expense, Net
Interest expense, net consists of the gross interest expense we incur less the amount of interest we capitalize related to capital assets under construction and less interest income earned during the year. Interest expense, net increased by $421.1 million, or 44%, to $1.38 billion for the combined year ended December 31, 2008 as compared to $954.6 million for the year ended December 31, 2007. The increase in interest expense was principally due to the following:
| • | an increase of $424.6 million due to the incurrence of approximately $3.7 billion of net additional indebtedness in connection with the New Sponsors Acquisition; and |
60
Table of Contents
| • | an increase of $35.3 million related to the amortization of discounts resulting from the adjustments to fair value of our debt in purchase accounting in connection with the New Sponsors Acquisition and the higher principal and interest resulting from the change of control refinancings; partially offset by |
| • | a decrease of $44.3 million due to lower interest rates on our variable rate debt in 2008 as compared to 2007. |
The non-cash portion of total interest expense, net was $412.7 million for the combined year ended December 31, 2008 and included $210.5 million of paid-in-kind interest expense and $75.0 million of additional interest accrued to account for the escalation of the applicable interest rate margins under the effective interest method. The remaining non-cash interest expense was primarily associated with the amortization of the deferred financing fees incurred as a result of new or refinanced debt and the amortization and accretion of discounts and premiums recorded to adjust our debt to fair value in connection with the New Sponsors Acquisition.
Gain (loss) on Early Extinguishment of Debt
Gain (loss) on early extinguishment of debt was a gain of $0.6 million for the combined year ended December 31, 2008 as compared to a loss of $38.1 million for the year ended December 31, 2007. The increase of $38.7 million was primarily related to the $38.1 million loss due to write-offs of debt issuance costs and premiums paid during the year ended December 31, 2007, in connection with the 2007 Refinancings (as defined below in—Liquidity and Capital Resources—2007 Refinancings).
Other Expense, Net
Other expense, net was $11.4 million for the combined year ended December 31, 2008 as compared to $0.1 million for the year ended December 31, 2007. This $11.3 million increase was primarily related to an increase of $10.2 million in equity method and impairment losses from our investment in the satellite-based broadband services provider, WildBlue, including the recognition of $13.0 million of previously suspended losses, and a $6.6 million increase in exchange rate losses, primarily due to the U.S. dollar strengthening against the Brazilian real, which impacts our service contracts with our Brazilian customers. Offsetting these increases are an increase of $3.9 million in miscellaneous income, including income resulting from a reduction in the amounts we are required to pay under a customer contract as a result of a recent amendment, $0.6 million in realized gains on our available-for-sale investments, and a $0.7 million increase in rental income.
Provision for (Benefit from) Income Taxes
Our provision for income taxes decreased by $135.0 million to a benefit of $120.0 million for the combined year ended December 31, 2008 as compared to a provision of $15.0 million for the combined year ended December 31, 2007. The decrease in expense was principally due to lower earnings in our historical subsidiaries subject to U.S. and U.K. tax as compared to the prior year period. As Bermuda does not currently impose an income tax, our statutory tax rate was zero. The difference between tax expense reported in our consolidated statements of operations and tax computed at statutory rates was attributable to the provision for foreign taxes, which were principally U.S. and U.K. taxes, as well as withholding taxes on revenue earned in many of our foreign markets.
61
Table of Contents
EBITDA
EBITDA consists of earnings before net interest, gain (loss) on early extinguishment of debt, taxes and depreciation and amortization. EBITDA is a measure commonly used in the FSS sector, and we present EBITDA to enhance the understanding of our operating performance. We use EBITDA as one criterion for evaluating our performance relative to that of our peers. We believe that EBITDA is an operating performance measure, and not a liquidity measure, that provides investors and analysts with a measure of operating results unaffected by differences in capital structures, capital investment cycles and ages of related assets among otherwise comparable companies. However, EBITDA is not a measure of financial performance under U.S. GAAP, and our EBITDA may not be comparable to similarly titled measures of other companies. EBITDA should not be considered as an alternative to operating income (loss) or net income (loss) attributable to Intelsat S.A., determined in accordance with U.S. GAAP, as an indicator of our operating performance, or as an alternative to cash flows from operating activities, determined in accordance with U.S. GAAP, as an indicator of cash flows, or as a measure of liquidity.
A reconciliation of net loss attributable to Intelsat S.A. to EBITDA for the periods shown is as follows (in thousands):
| Predecessor Entity | Combined | Successor Entity | ||||||||||||
| Year Ended December 31, 2007 |
Year Ended December 31, 2008 |
Year Ended December 31, 2009 |
||||||||||||
| Net loss attributable to Intelsat S.A. |
$ | (191,889 | ) | $ | (1,198,167 | ) | $ | (781,692 | ) | |||||
| Add: |
||||||||||||||
| Interest expense, net |
954,607 | 1,375,733 | 1,362,823 | |||||||||||
| (Gain) loss on early extinguishment of debt |
38,143 | (576 | ) | (4,697 | ) | |||||||||
| Provision for (benefit from) income taxes |
14,957 | (120,037 | ) | 11,399 | ||||||||||
| Depreciation and amortization |
784,120 | 859,820 | 804,037 | |||||||||||
| EBITDA |
$ | 1,599,938 | $ | 916,773 | $ | 1,391,870 | ||||||||
Liquidity and Capital Resources
Cash Flow Items
Our cash flows consisted of the following for the periods shown (in thousands):
| Predecessor Entity | Successor Entity | Combined | Successor Entity | |||||||||||||||||||
| Year Ended December 31, 2007 |
Period January 1, 2008 to January 31, 2008 |
Period February 1, 2008 to December 31, 2008 |
Year Ended December 31, 2008 |
Year Ended December 31, 2009 |
||||||||||||||||||
| Net cash provided by operating activities |
$ | 557,021 | $ | 19,619 | $ | 876,143 | $ | 895,762 | $ | 873,656 | ||||||||||||
| Net cash used in investing activities |
(540,988 | ) | (24,701 | ) | (409,897 | ) | (434,598 | ) | (947,095 | ) | ||||||||||||
| Net cash provided by (used in) financing activities |
(173,602 | ) | (22,304 | ) | (1,504,431 | ) | (1,526,735 | ) | 73,001 | |||||||||||||
| Net change in cash and cash equivalents |
(157,087 | ) | (27,249 | ) | (1,044,426 | ) | (1,071,675 | ) | 7,360 | |||||||||||||
Net Cash Provided by Operating Activities
Net cash provided by operating activities decreased by $22.1 million to $873.7 million for the year ended December 31, 2009 as compared to the combined year ended December 31, 2008. The decreased cash flows from operating activities primarily resulted from an increase in payments of accounts payable and accrued liabilities,
62
Table of Contents
including accrued interest. A decrease in collections from accounts receivable as compared to 2008 and an increase in other long-term liabilities also contributed to the decreased cash flows. These decreases were partially offset by an increase in net income excluding non-cash items, a decrease in prepaid expenses and other assets and an increase in deferred revenue.
Net Cash Used in Investing Activities
Net cash used in investing activities increased by $512.5 million to $947.1 million for the year ended December 31, 2009 as compared to the combined year ended December 31, 2008. This increase was primarily due to higher capital expenditures of $520.7 million associated with satellites under construction and the purchase of satellites during 2009.
Net Cash Provided by (Used in) Financing Activities
Net cash provided by financing activities was $73.0 million for the year ended December 31, 2009 compared to net cash used in financing activities of $1.5 billion for the combined year ended December 31, 2008. The increase was primarily due to higher repayments of long-term debt, partially offset by proceeds received from refinancing of debt in 2008 completed in connection with the New Sponsor Acquisition. During the year ended 2009, cash provided by financing activities included proceeds from issuance of long-term debt of $961.9 million, partially offset by a loan repayment to Intelsat Holdings of $34.0 million and repayments on other long-term debt of $823.3 million.
Long-Term Debt
We are a highly leveraged company and, in connection with the consummation of the New Sponsors Acquisition Transactions, we became a significantly more highly leveraged company, which has resulted in a significant increase in our interest expense.
In connection with the New Sponsors Acquisition, our pre-acquisition long-term debt was adjusted to fair value as of the effective date of the transaction, resulting in a net decrease of $182.5 million to the carrying value of the debt. This net difference between the fair value and par value of the debt is being amortized as an increase to interest expense over the remaining term of the related debt using the effective interest method.
Senior Secured Credit Facilities
Intelsat Sub Holdco Senior Secured Credit Facility
Intelsat Sub Holdco entered into an amended and restated credit agreement (the “Sub Holdco Credit Agreement”) on July 3, 2006. The Sub Holdco Credit Agreement provides for a $344.8 million Tranche B Term Loan facility due in 2013 and a $270.8 million revolving credit facility due in 2012. Up to $200.0 million of the revolving credit facility is available for issuance of letters of credit. Additionally, up to $35.0 million of the revolving credit facility is available for swingline loans.
Intelsat Sub Holdco is required to pay a commitment fee for the unused commitments under the revolving credit facility, if any, at a rate per annum of 0.375%. Both the face amount of any outstanding letters of credit and any swingline loans reduce availability under the revolving credit facility on a dollar for dollar basis. Obligations under the Sub Holdco Credit Agreement are guaranteed by certain of Intelsat Sub Holdco’s subsidiaries, as well as by Intelsat Luxembourg, Intelsat Jackson and Intermediate Holdco, and secured by a perfected first priority security interest to the extent legally permissible in substantially all of the tangible and intangible assets of the borrower and subsidiary guarantors, with certain agreed exceptions.
On January 19, 2007, Intelsat Sub Holdco amended its senior secured credit facility to change interest rates on the Term Loan B facilities. Interest rates for the term loan portion of the Sub Holdco Credit Agreement range, at the option of Intelsat Sub Holdco, (i) from the London Interbank Offered Rate (“LIBOR”) plus 1.75% to
63
Table of Contents
LIBOR plus 2.00%, or (ii) Above Bank Rate (“ABR”) plus 0.75% to the ABR plus 1.00%, depending on certain financial measures. Interest rates for the revolving credit facility portion of the Sub Holdco Credit Agreement range, at the option of Intelsat Sub Holdco, (i) from LIBOR plus 2.00% to LIBOR plus 2.25% or (ii) the ABR plus 1.00% to the ABR plus 1.25%, depending on certain financial measures. The ABR and LIBOR, plus the applicable margins, are determined as specified in the Sub Holdco Credit Agreement, as amended.
On January 25, 2008, Intelsat Sub Holdco entered into Amendment No. 3 to the Sub Holdco Credit Agreement, which became effective upon the consummation of the New Sponsors Acquisition and amended and modified the Sub Holdco Credit Agreement to, among other things:
| (a) | change the applicable margin (i) on ABR loans under the Tranche B Term Loan, revolving credit loan and swingline loan facilities to a rate of 1.5% per annum and (ii) on LIBOR loans under the Tranche B Term Loan, revolving credit loan and swingline loan facilities to a rate of 2.5% per annum; |
| (b) | reduce the size of the revolving facility by $50.0 million and add a $50.0 million incremental revolving credit facility provision; |
| (c) | add language requiring the payment of a prepayment premium for prepayments of term loans prior to February 4, 2010; |
| (d) | make certain changes permitting the New Sponsors Acquisition; and |
| (e) | add a financial maintenance covenant requiring compliance with a Consolidated Secured Debt to Consolidated EBITDA Ratio (as defined in the Sub Holdco Credit Agreement) of less than or equal to 1.5 to 1.0. |
The Consolidated Secured Debt to Consolidated EBITDA Ratio is determined by comparing Consolidated Secured Debt to Consolidated EBITDA, each as defined under the Sub Holdco Credit Agreement. We were in compliance with this financial maintenance covenant ratio with a Consolidated Secured Debt to Consolidated EBITDA Ratio of 0.02:1.00 as of December 31, 2009. In the event we were to fail to comply with this financial maintenance covenant ratio and were unable to obtain waivers, we would default under the Intelsat Sub Holdco Credit Agreement, and the lenders under the Intelsat Sub Holdco Credit Agreement could accelerate our obligations thereunder, which would result in an event of default under our existing notes and the Intelsat Jackson unsecured credit agreements.
No amounts were outstanding under the revolving credit facility as of December 31, 2009; however, $22.9 million in letters of credit were issued and outstanding under the facility. The borrowing availability under the revolving credit facility was $247.9 million at such date.
Intelsat Corp Senior Secured Credit Facility
As of December 31, 2009, Intelsat Corp had a revolving credit facility and certain term loans outstanding under the Intelsat Corporation Amended and Restated Credit Agreement (the “Intelsat Corp Amended and Restated Credit Agreement”), which consisted of a $355.9 million Tranche A-3 Senior Secured Term loan due in 2012, a $1.8 billion Tranche B-2 Senior Secured Term Loan facility due in 2014, and a $175.0 million revolving credit facility due in 2012. Up to $150.0 million of the revolving credit facility is available for issuance of letters of credit. Additionally, up to $35.0 million of the revolving credit facility is available for swingline loans.
Intelsat Corp is required to pay a commitment fee for the unused commitments under the revolving credit facility, if any, at a rate per annum of 0.375%. Both the face amount of any outstanding letters of credit and any swingline loans reduce availability under the revolving credit facility on a dollar for dollar basis. Obligations under the Intelsat Corp Amended and Restated Credit Agreement continue to be guaranteed by certain of Intelsat Corp’s subsidiaries and are secured by a perfected first priority security interest to the extent legally permissible in substantially all of the borrower’s and the guarantors’ tangible and intangible assets, with certain agreed exceptions.
64
Table of Contents
In connection with the PanAmSat Acquisition Transactions, Intelsat Corp entered into an amendment to renew and extend the Intelsat Corp Amended and Restated Credit Agreement on July 3, 2006. Also, on January 19, 2007, Intelsat Corp amended the Intelsat Corp Amended and Restated Credit Agreement to change the interest rate on the Term Loan facilities. Interest rates for the term loan portion of the Intelsat Corp Amended and Restated Credit Agreement range from LIBOR plus 1.75% to LIBOR plus 2.00% or the ABR plus 0.75% to the ABR plus 1.00%, depending on certain financial measures. Interest rates for the revolving credit facility portion of the Intelsat Corp Amended and Restated Credit Agreement range from LIBOR plus 2.125% to LIBOR plus 2.875% or the ABR plus 1.125% to the ABR plus 1.875%, depending on certain financial measures. The ABR and LIBOR, plus the applicable margins, are determined as specified in the Intelsat Corp Amended and Restated Credit Agreement, as amended through January 19, 2007.
On January 25, 2008, Intelsat Corp entered into Amendment No. 2 to the Intelsat Corp Amended and Restated Credit Agreement, which became effective upon the consummation of the New Sponsors Acquisition and amended and modified the Intelsat Corp Amended and Restated Credit Agreement to, among other things:
| (a) | change the applicable margin (i) on ABR loans that are term loans to a rate of 1.5% per annum, (ii) on LIBOR loans that are term loans to a rate of 2.5% per annum, (iii) on ABR loans that are revolving credit loans or swingline loans to a rate of between 1.5% and 1.875%, and (iv) on LIBOR loans that are revolving credit loans or swingline loans to a rate of between 2.5% and 2.875%; |
| (b) | reduce the size of the revolving facility by $75.0 million and add a $75.0 million incremental revolving credit facility provision; |
| (c) | require the payment of a prepayment premium for prepayments of term loans prior to February 4, 2011 (with respect to Tranche B-2-A Term Loans) or February 14, 2010 (with respect to Tranche B-2-B Term Loans); |
| (d) | make certain changes permitting the New Sponsors Acquisition; and |
| (e) | add a financial maintenance covenant requiring compliance with a Consolidated Secured Debt to Consolidated EBITDA Ratio (as defined in the Intelsat Corp Amended and Restated Credit Agreement) of less than or equal to 4.5 to 1.0. |
On February 4, 2008, in connection with the New Sponsors Acquisition, Intelsat Corp also executed a Joinder Agreement by and among Intelsat Corp, the several lenders party thereto and certain other parties, to the Intelsat Corp Amended and Restated Credit Agreement pursuant to which it incurred an additional $150.0 million in aggregate principal amount of Tranche B-2 Term Loan.
The Consolidated Secured Debt to Consolidated EBITDA Ratio is determined by comparing Consolidated Secured Debt to Consolidated EBITDA, each as defined under the Intelsat Corp Amended and Restated Credit Agreement. We were in compliance with this financial maintenance covenant ratio, with a Consolidated Secured Debt to Consolidated EBITDA Ratio of 2.57:1.00, as of December 31, 2009. In the event we were to fail to comply with this financial maintenance covenant ratio and were unable to obtain waivers, we would default under the Intelsat Corp Amended and Restated Credit Agreement, and the lenders under the Intelsat Corp Amended and Restated Credit Agreement could accelerate our obligations thereunder, which would result in an event of default under our existing notes and the Intelsat Jackson unsecured credit agreements.
No amounts were outstanding under the revolving credit facility as of December 31, 2009; however, $2.1 million in letters of credit were issued and outstanding under the facility. The borrowing availability under the revolving credit facility was $152.2 million at such date. One of the lenders under the revolving credit facility, representing approximately $20.8 million of the $175.0 million of aggregate lending commitments, did not provide any funds in response to a September 2008 borrowing request we made under the revolving credit facility. Our availability of $152.2 million as of December 31, 2009 under the revolving credit facility does not include this $20.8 million commitment, and we can provide no assurance that the commitment will be honored by the relevant lender if we make future borrowing requests.
65
Table of Contents
The 2007 Refinancings
On January 12, 2007, Intelsat Bermuda issued $600.0 million in Floating Rate Senior Notes due 2015 (the “Refinancing Notes”). The net proceeds of this offering, together with cash on hand, were used to repay Intelsat Bermuda’s then outstanding $600.0 million Senior Unsecured Bridge Loan, and to pay related fees and expenses. On January 19, 2007, Intelsat Sub Holdco amended the New Sub Holdco Credit Agreement to reduce the Term Loan B facility interest rate from a range of LIBOR plus 2.00% to LIBOR plus 2.25% to a range of LIBOR plus 1.75% to LIBOR plus 2.00%. Also on January 19, 2007, Intelsat Corporation further amended its Amended and Restated Credit Agreement to reduce the Term Loan A-3 interest rate and Term Loan B-2 interest rate from a range of LIBOR plus 2.125% to LIBOR plus 2.875% to a range of LIBOR plus 1.75% to LIBOR plus 2.00%. The interest rate ranges were again amended effective February 4, 2008. In addition, on February 2, 2007, Intelsat Bermuda borrowed a $1.0 billion term loan due 2014 pursuant to the Intelsat Jackson Senior Unsecured Credit Agreement, which was assumed by Intelsat Jackson as part of the Intelsat Bermuda Transfer. The proceeds of the borrowing thereunder were contributed to Intermediate Holdco, and Intermediate Holdco contributed the proceeds to Intelsat Sub Holdco, which used the proceeds, together with cash on hand, to redeem its outstanding $1.0 billion Floating Rate Senior Notes due 2012 and pay the related premium, fees and expenses. The issuance of the Refinancing Notes, the amendments to Intelsat Sub Holdco’s and Intelsat Corporation’s credit agreements, the borrowing under the Intelsat Bermuda Unsecured Credit Agreement and the related repayment of Intelsat Bermuda’s Senior Unsecured Bridge Loan and redemption of Intelsat Sub Holdco’s $1.0 billion Floating Rate Senior Notes due 2012 are referred to collectively as the 2007 Refinancings.
New Sponsors Acquisition Financing
Bridge Loan Credit Agreements
On February 4, 2008, in order to partially finance the New Sponsors Acquisition, Serafina borrowed $4.96 billion in aggregate principal amount of term loans under the Bridge Loan Credit Agreements. Immediately following the New Sponsors Acquisition and the Intelsat Bermuda Transfer, Intelsat Bermuda assumed the Bridge Loan Agreements as part of the Serafina Assignment.
Borrowings under the Senior Bridge Loan Credit Agreement bore interest at LIBOR, plus a margin of 4.5%. Borrowings under the PIK Election Bridge Loan Credit Agreement bore interest at LIBOR, plus a margin of 4.75%. In addition, we had the option to pay interest under the PIK Election Bridge Loan Credit Agreement in PIK interest at a PIK interest rate equal to the cash pay interest rate in effect during the interest period plus 100 basis points. We elected to pay interest under the PIK Election Bridge Loan Credit Agreement entirely in PIK interest for all interest periods through June 26, 2008.
On June 27, 2008, Intelsat Bermuda repaid in full the Bridge Loan Credit Agreements and issued new senior notes as described in—2008 Debt Refinancings below.
Credit Facility Amendments
In connection with the New Sponsors Acquisition, Intelsat Sub Holdco and Intelsat Corp entered into amendments to their existing credit agreements. See—Senior Secured Credit Facilities above.
Debt Transfer, Repayment and Redemptions
On January 15, 2008, we repaid at maturity Intelsat Corp’s $150.0 million 6 3/8% Senior Notes due 2008 using funds borrowed under the revolving credit facility portion of Intelsat Corp’s senior secured credit facilities. On February 4, 2008, Intelsat Corp used the proceeds of its incremental Tranche B-2 Term Loan and cash on hand to repay this $150.0 million revolver borrowing.
66
Table of Contents
Intelsat Bermuda assigned its debt obligations to Intelsat Jackson on February 4, 2008 (see—Impact of Significant Transactions—New Sponsors Acquisition Transactions) and we subsequently redeemed $1.26 billion in long-term debt and incurred early redemption premiums of $38.5 million as follows:
| • | on February 7, 2008, Intelsat Jackson’s $260.0 million of Floating Rate Senior Notes due 2013 were redeemed and an early redemption premium of $18.9 million was incurred; |
| • | on February 7, 2008, Intelsat Jackson’s $600.0 million of Floating Rate Senior Notes due 2015 were redeemed and an early redemption premium of $12.0 million was incurred; and |
| • | on March 6, 2008, Intelsat, Ltd.’s $400.0 million of 5 1/4% Senior Notes due 2008 were redeemed and an early redemption premium of $7.6 million was incurred. |
The premiums incurred were included in the fair value of the associated debt as of the date of the New Sponsors Acquisition.
Change of Control Offers
The New Sponsors Acquisition resulted in a change of control under the indentures governing certain of our outstanding series of notes and the Intelsat Jackson Senior Unsecured Credit Agreement, giving the holders of those notes and loans the right to require us to repurchase such notes and repay such loans at 101% of their principal amount, plus accrued interest to the date of repurchase or repayment. During the second and third quarters of 2008, the relevant entities completed each such change of control offer, financing the repurchases and repayment through backstop unsecured credit agreement borrowings under the Financing Commitment Letter or with proceeds from offerings of notes and a new unsecured term loan borrowing.
The following principal amounts were tendered and repurchased or repaid in the change of control offers:
| • | $281.8 million of Intelsat Jackson’s 11 1/4% Senior Notes due 2016; |
| • | $695.0 million of Intelsat Jackson’s 9 1/4% Senior Notes due 2016; |
| • | $804.8 million of loans outstanding under the Intelsat Jackson Senior Unsecured Credit Agreement; |
| • | $408.1 million of Intermediate Holdco’s $478.7 million aggregate principal amount at maturity of 9 1/4% Senior Discount Notes due 2015; |
| • | $874.6 million of Intelsat Sub Holdco’s 8 1/4% Senior Notes due 2013; |
| • | $674.3 million of Intelsat Sub Holdco’s 8 5/8% Senior Notes due 2015; |
| • | $651.6 million of Intelsat Corp’s 9% Senior Notes due 2014; and |
| • | $575.0 million of Intelsat Corp’s 9% Senior Notes due 2016. |
2008 Debt Refinancings
On June 27, 2008, Intelsat Bermuda issued $2.81 billion of 11 1/4% Senior Notes due 2017 (the “2017 Senior Notes”), and $2.23 billion of the 2017 PIK Notes. Proceeds from the issuance of the 2017 Senior Notes and the 2017 PIK Notes were used to repay in full the $4.96 billion of borrowings under the Bridge Loan Credit Agreements.
Interest on both the 2017 Senior Notes and the 2017 PIK Notes is payable semi-annually on August 15 and February 15, commencing on August 15, 2008. The 2017 Senior Notes bore interest at 7.28% on and prior to August 4, 2008, and bear interest at 11 1/4% after August 4, 2008.
67
Table of Contents
Intelsat Luxembourg may, at its option, elect to pay interest for any applicable interest period on the 2017 PIK Notes (i) entirely in cash, (ii) entirely in PIK interest or (iii) 50% in cash and 50% in PIK interest, through February 15, 2013. After February 15, 2013, interest on the 2017 PIK Notes is payable in cash. Cash interest on the 2017 PIK Notes accrued at the rate of 7.53% on and prior to August 4, 2008, and accrues at 11 1/2% after August 4, 2008. If we elect to pay interest in the form of PIK interest, the applicable PIK interest rate will be the cash pay interest rate in effect during the period plus 100 basis points. If we elect to pay interest in the form of PIK interest, we will either increase the principal amount of the outstanding 2017 PIK Notes or issue new 2017 PIK Notes to holders of the 2017 PIK Notes in an amount equal to the amount of PIK interest for the applicable interest payment period. We made elections to pay interest on the 2017 PIK Notes entirely in PIK interest for all interest periods through August 15, 2010.
On June 27, 2008, Intelsat Sub Holdco repaid $883.3 million of borrowings under a backstop senior unsecured credit agreement due 2013 and $681.0 million of borrowings under a backstop senior unsecured credit agreement due 2015 with the proceeds of an offering of $883.3 million of Senior Notes due 2013, bearing interest at 8 1/2% (guaranteed by certain subsidiaries), and $681.0 million of Senior Notes due 2015, bearing interest at 8 7/ 8% (guaranteed by certain subsidiaries) (collectively, the “New Sub Holdco Senior Notes”). The initial purchasers of the New Sub Holdco Senior Notes and the lenders under the backstop senior unsecured credit agreements were affiliated parties and the repayment was completed without an exchange of cash between us and the lenders.
On June 27, 2008, Intermediate Holdco repaid borrowings under a backstop senior unsecured credit agreement due 2015 with the proceeds of an offering of 9 1/2% Senior Discount Notes due 2015 (the “2015 Senior Discount Notes”). The initial purchasers of the 2015 Senior Discount Notes and the lenders under the backstop senior unsecured credit agreement were affiliated parties and the repayment was completed without an exchange of cash between us and the lenders.
On July 1, 2008, Intelsat Jackson issued $284.6 million of Senior Notes due 2016, bearing interest at 11 1/2%, and $701.9 million of Senior Notes due 2016 (guaranteed by certain subsidiaries), bearing interest at 9 1 /2% (collectively, the “New Jackson Senior Notes”). The proceeds of the New Jackson Senior Notes were used, together with cash on hand, to fund the repurchase of Intelsat Jackson’s 11 1/4% Senior Notes due 2016 and Intelsat Jackson’s 9 1/4% Senior Notes due 2016 tendered in change of control offers. The New Jackson Senior Notes have substantially similar terms to the notes repurchased.
Intelsat Jackson also repaid loans tendered in a change of control offer relating to the Intelsat Jackson Senior Unsecured Credit Agreement with borrowings of $810.9 million under a new senior unsecured credit agreement that was entered into on July 1, 2008 (the “New Intelsat Jackson Senior Unsecured Credit Agreement”), together with cash on hand. Borrowings under the New Intelsat Jackson Senior Unsecured Credit Agreement bear interest at either (i) LIBOR plus 300 basis points or (ii) the ABR, which is the rate for any day equal to the higher of (a) the Federal Funds Rate plus 50 basis points or (b) the prime rate, plus 200 basis points.
On July 18, 2008, Intelsat Corp repaid $658.1 million of borrowings under a backstop senior unsecured credit agreement due 2014 and $580.7 million of borrowings under a backstop senior unsecured credit agreement due 2016 with the proceeds of an offering of $658.1 million of Senior Notes due 2014, bearing interest at 9 1/4%, and $580.7 million of Senior Notes due 2016, bearing interest at 9 1/4% (collectively, the “New Intelsat Corp Senior Notes”). The initial purchasers of the New Intelsat Corp Senior Notes and the lenders under the backstop senior unsecured credit agreements were affiliated parties and the repayment was completed without an exchange of cash between us and the lenders.
Long-Term Debt Changes in 2009
On October 20, 2009, our indirect subsidiary, Intelsat Jackson, completed an offering of $500.0 million aggregate principal amount at maturity of 8 1/2% Senior Notes due 2019, which yielded $487.1 million of cash proceeds at issuance (the “2009 Jackson Notes Offering”). Upon consummation of the 2009 Jackson Notes
68
Table of Contents
Offering, Intelsat Jackson paid a dividend to Intelsat Bermuda in an amount equal to the purchase price paid by Intelsat Bermuda to purchase $400.0 million face amount of the 2017 PIK Notes from Banc of America Securities LLC at a discount. Intelsat Bermuda then canceled the purchased 2017 PIK Notes. After giving effect to the purchase of the 2017 PIK Notes and fees and expenses related thereto and the 2009 Jackson Notes Offering, $101.1 million of the proceeds from the 2009 Jackson Notes Offering remained available for general corporate purposes.
On July 31, 2009, our indirect subsidiary, Intelsat Sub Holdco, redeemed the approximately $0.4 million principal amount of its outstanding 8 5/8% Senior Notes due 2015 and the approximately $0.4 million principal amount of its outstanding 8 1/4% Senior Notes due 2013.
On July 31, 2009, our indirect subsidiary, Intelsat Corp, redeemed the approximately $1.0 million principal amount of its outstanding 9% Senior Notes due 2014 and the approximately $0.01 million principal amount of its outstanding 9% Senior Notes due 2016.
On February 12, 2009, our indirect subsidiary, Intelsat Sub Holdco, purchased $114.2 million of Intelsat, Ltd.’s outstanding 7 5/8% Senior Notes due 2012 for $93.3 million and $346.5 million of Intelsat, Ltd.’s outstanding 6 1/2% Senior Notes due 2013 for $254.6 million pursuant to a cash tender offer (the “Tender Offer”). Intelsat Sub Holdco funded the Tender Offer through an offering of $400.0 million aggregate principal amount at maturity of 8 7/8% Senior Notes due 2015, Series B (the “2009 Sub Holdco Notes”), completed on February 12, 2009, which yielded $348.3 million of proceeds at issuance, together with cash on hand. The new notes have terms substantially similar to Intelsat Sub Holdco’s outstanding 8 7/8% Senior Notes due 2015 issued in June 2008.
New Dawn Credit Facilities
On December 5, 2008, New Dawn Satellite Company Ltd. (“New Dawn”) entered into a $215.0 million secured financing arrangement that consists of senior and mezzanine term loan facilities. The credit facilities are non-recourse to New Dawn’s shareholders, including Intelsat S.A. and its wholly-owned subsidiaries, beyond the shareholders’ scheduled capital contributions. The senior facility provides for a commitment of up to $125.0 million. The interest rate on term loans under the senior facility is the aggregate of LIBOR plus an applicable margin between 3.0% and 4.0% and certain costs, if incurred. The mezzanine facility provides for a commitment of up to $90.0 million. The interest rate on term loans under the mezzanine facility is the aggregate of LIBOR plus an applicable margin between 5.3% and 6.3% and certain costs, if incurred. New Dawn is required to pay a commitment fee at a rate per annum of 0.5% on any unused commitments under the credit facilities. During the year ended December 31, 2009, New Dawn incurred satellite related capital expenditures of $97.9 million, and as of December 31, 2009 it had aggregate outstanding borrowings of $114.8 million under the credit facilities.
Satellite Performance Incentives
Our cost of satellite construction includes an element of deferred consideration to satellite manufacturers referred to as satellite performance incentives. We are contractually obligated to make these payments over the lives of the satellites, provided the satellites continue to operate in accordance with contractual specifications. We capitalize the present value of these payments as part of the cost of the satellites and record a corresponding liability to the satellite manufacturers. This asset is amortized over the useful lives of the satellites and the liability is accreted as interest expense based on the passage of time and reduced as the payments are made. Our total satellite performance incentive payment liability as of December 31, 2008 and 2009 was $155.2 million and $147.5 million, respectively.
69
Table of Contents
Sub Holdco Adjusted EBITDA and Intelsat Luxembourg Adjusted EBITDA
In addition to EBITDA, which is calculated as set forth in—Results of Operations, we calculate a measure called Sub Holdco Adjusted EBITDA, based on the term Consolidated EBITDA, as defined in the Sub Holdco Credit Agreement. Sub Holdco Adjusted EBITDA consists of EBITDA as adjusted to exclude or include certain unusual items, certain other operating expense items and other adjustments permitted in calculating covenant compliance under the Sub Holdco Credit Agreement as described in the table and related footnotes below. Sub Holdco Adjusted EBITDA, as presented below, is calculated only with respect to Intelsat Sub Holdco and its subsidiaries. Sub Holdco Adjusted EBITDA is a material component of certain ratios used in the Sub Holdco Credit Agreement, such as the secured debt leverage ratio and the total leverage ratio.
Under the Sub Holdco Credit Agreement, Intelsat Sub Holdco must maintain a pro forma secured net debt leverage ratio not greater than 1.50 to 1.00 at the end of each fiscal quarter, and generally may not incur additional indebtedness (subject to certain exceptions) if the total leverage ratio calculated on a pro forma basis at the time of incurrence would exceed 4.75 to 1.00. In addition, under the investments and dividends covenants contained in the Sub Holdco Credit Agreement, the ability of Intelsat Sub Holdco to make investments and pay dividends is restricted by formulas based on the amount of Sub Holdco Adjusted EBITDA measured from April 1, 2006.
In addition to EBITDA and Sub Holdco Adjusted EBITDA, we also calculate a measure called Intelsat Luxembourg Adjusted EBITDA (previously referred to as New Bermuda Adjusted EBITDA), based on the term Adjusted EBITDA, as defined in the indenture governing the 2017 Senior Notes and the 2017 PIK Notes (collectively, the “2008 Luxembourg Notes”).
Intelsat Luxembourg Adjusted EBITDA consists of EBITDA as adjusted to exclude or include certain unusual items, certain other operating expense items and other adjustments permitted in calculating covenant compliance under the indenture of Intelsat Luxembourg as described in the table and related footnotes below. Intelsat Luxembourg Adjusted EBITDA as presented below is calculated only with respect to Intelsat Luxembourg and its subsidiaries. Intelsat Luxembourg Adjusted EBITDA is a material component of certain ratios used in the indenture governing the 2008 Luxembourg Notes, such as the debt to Intelsat Luxembourg Adjusted EBITDA ratio and the secured indebtedness leverage ratio.
Under Intelsat Luxembourg’s indenture, Intelsat Luxembourg generally may not incur additional indebtedness (subject to certain exceptions) if the debt to Intelsat Luxembourg Adjusted EBITDA ratio calculated on a pro forma basis at the time of such incurrence would exceed 8.00 to 1.00 and Intelsat Luxembourg cannot incur certain liens to secure indebtedness (subject to certain exceptions) if the secured indebtedness leverage ratio, after giving effect to the incurrence, exceeds 2.50 to 1.00. In addition, under this indenture, satisfaction of a 6.75 to 1.00 debt to Intelsat Luxembourg Adjusted EBITDA ratio is generally (subject to certain exceptions) a condition to the making of restricted payments by Intelsat Luxembourg. Furthermore, under the restricted payments covenants contained in this indenture (subject to certain exceptions), the ability of Intelsat Luxembourg to make restricted payments (including the making of investments and the payment of dividends) is restricted by a formula based on the amount of Intelsat Luxembourg Adjusted EBITDA measured from January 1, 2008 and calculated without making pro forma adjustments.
We believe that the inclusion of Sub Holdco Adjusted EBITDA and Intelsat Luxembourg Adjusted EBITDA in this Annual Report is appropriate to provide additional information to investors about the calculation of certain covenants in the Sub Holdco Credit Agreement and the indenture governing the 2008 Luxembourg Notes as mentioned above. We believe that some investors may use Sub Holdco Adjusted EBITDA and Intelsat Luxembourg Adjusted EBITDA to evaluate our liquidity and financial condition. Sub Holdco Adjusted EBITDA and Intelsat Luxembourg Adjusted EBITDA are not measures of financial performance under U.S. GAAP, and Sub Holdco Adjusted EBITDA and Intelsat Luxembourg Adjusted EBITDA may not be comparable to similarly titled measures of other companies. Sub Holdco Adjusted EBITDA and Intelsat Luxembourg Adjusted EBITDA should not be considered as alternatives to operating income (loss) or net income (loss) attributable to Intelsat
70
Table of Contents
S.A., determined in accordance with U.S. GAAP, as indicators of our operating performance, or as alternatives to cash flows from operating activities, determined in accordance with U.S. GAAP, as indicators of cash flows, or as measures of liquidity.
A reconciliation of net cash provided by Intelsat S.A. operating activities to net loss attributable to Intelsat S.A.; net loss attributable to Intelsat S.A. to Intelsat S.A. EBITDA; Intelsat S.A. EBITDA to Intelsat Luxembourg Adjusted EBITDA; and Intelsat Luxembourg Adjusted EBITDA to Sub Holdco Adjusted EBITDA is as follows (in thousands):
| Combined(1) | Successor Entity | |||||||
| Year Ended December 31, 2008 |
Year Ended December 31, 2009 |
|||||||
| Reconciliation of net cash provided by operating activities to net loss attributable to |
||||||||
| Net cash provided by operating activities |
$ | 895,762 | $ | 873,656 | ||||
| Depreciation and amortization |
(859,820 | ) | (804,037 | ) | ||||
| Impairment of asset value |
(390,444 | ) | (499,100 | ) | ||||
| Provision for doubtful accounts |
5,215 | (3,387 | ) | |||||
| Foreign currency transaction gain (loss) |
(6,104 | ) | 7,798 | |||||
| Loss on disposal of assets |
(588 | ) | (2,709 | ) | ||||
| Share-based compensation expense |
(199,564 | ) | (56,965 | ) | ||||
| Deferred income taxes |
163,426 | 43,258 | ||||||
| Amortization of discount, premium, issuance costs and other non-cash items |
(202,208 | ) | (125,337 | ) | ||||
| Interest paid-in-kind |
(210,481 | ) | (298,030 | ) | ||||
| Gain on early extinguishment of debt |
592 | 5,180 | ||||||
| Share in gain (loss) of unconsolidated affiliates |
(17,127 | ) | 517 | |||||
| Gain on sale of investment |
— | 27,333 | ||||||
| Unrealized gains (losses) on derivative financial instruments |
(142,312 | ) | 83,953 | |||||
| Other non-cash items |
(5,969 | ) | (178 | ) | ||||
| Changes in operating assets and liabilities, net of effect of acquisition |
(228,545 | ) | (33,644 | ) | ||||
| Net loss attributable to Intelsat S.A. |
(1,198,167 | ) | (781,692 | ) | ||||
| Add (Subtract): |
||||||||
| Interest expense, net |
1,375,733 | 1,362,823 | ||||||
| Gain on early extinguishment of debt |
(576 | ) | (4,697 | ) | ||||
| Provision for (benefit from) income taxes |
(120,037 | ) | 11,399 | |||||
| Depreciation and amortization |
859,820 | 804,037 | ||||||
| Intelsat S.A. EBITDA |
916,773 | 1,391,870 | ||||||
| Add (Subtract): |
||||||||
| Parent and intercompany expenses, net(2) |
13,567 | 12,723 | ||||||
| EBITDA from unrestricted subsidiaries(3) |
— | (822 | ) | |||||
| Compensation and benefits(4) |
5,420 | 61,229 | ||||||
| Transaction costs(5) |
315,028 | — | ||||||
| Acquisition related expenses(6) |
10,240 | 23,188 | ||||||
| Share in (gain) loss of unconsolidated affiliates(7) |
17,111 | (517 | ) | |||||
| Impairment of asset value(8) |
390,444 | 499,100 | ||||||
| Losses on derivative financial instruments(9) |
166,736 | 2,681 | ||||||
| Gain on sale of investment(10) |
— | (27,333 | ) | |||||
| Non-recurring and other non-cash items(11) |
30,523 | 23,475 | ||||||
| Satellite performance incentives(12) |
(10,789 | ) | (8,686 | ) | ||||
| Intelsat Luxembourg Adjusted EBITDA |
1,855,053 | 1,976,908 | ||||||
| Add (Subtract): |
||||||||
| Intelsat Corp Adjusted EBITDA(13) |
(772,890 | ) | (763,338 | ) | ||||
| Parent and intercompany expenses(14) |
1,033 | 412 | ||||||
| Non-recurring intercompany expenses |
34,991 | — | ||||||
| Satellite performance incentives(12) |
10,789 | 8,686 | ||||||
| Sub Holdco Adjusted EBITDA |
$ | 1,128,976 | $ | 1,222,668 | ||||
71
Table of Contents
| (1) | As a result of the consummation of the New Sponsors Acquisition, the financial results for the combined year ended December 31, 2008 have been presented separately in our consolidated statements of operations for the “predecessor” entity for the period January 1, 2008 to January 31, 2008 and for the “successor” entity for the period February 1, 2008 to December 31, 2008. For comparative purposes, we combined the periods from January 1, 2008 to January 31, 2008 and February 1, 2008 to December 31, 2008, as we believe this combination is useful to provide the reader a more accurate comparison. This combination is not a U.S. GAAP measure and it is provided to enhance the reader’s understanding of the results of operations for the periods presented. |
| (2) | Represents expenses incurred at Intelsat S.A. for employee salaries and benefits, office operating costs and other expenses. |
| (3) | Reflects EBITDA of our unrestricted subsidiary, New Dawn, which is excluded under the definitions of Intelsat Luxembourg Adjusted EBITDA and Sub Holdco Adjusted EBITDA. |
| (4) | Reflects the portion of the expenses incurred relating to our equity compensation plans, defined benefit retirement plan and other postretirement benefits that are excludable under the definitions of Intelsat Luxembourg Adjusted EBITDA and Sub Holdco Adjusted EBITDA. |
| (5) | Reflects transaction costs related to the New Sponsors Acquisition Transactions. |
| (6) | Reflects expenses incurred in connection with the monitoring fee agreements to provide certain monitoring, advisory and consulting services to Intelsat Luxembourg, Intelsat Sub Holdco and their respective subsidiaries. |
| (7) | Represents gain (loss) incurred under the equity method of accounting. |
| (8) | Represents the non-cash impairment charge recorded to write-down our intangible assets determined to have indefinite useful lives in accordance with FASB ASC Topic 350, Intangible—Goodwill and Other (“FASB ASC 350”). |
| (9) | Represents the changes in the fair value of the undesignated interest rate swaps as well as the difference between the amount of floating rate interest we receive and the amount of fixed rate interest we pay and the change in the fair value of our put option embedded derivative related to the notes issued in February 2009 by Intelsat Sub Holdco, which are recognized in operating income. |
| (10) | Represents the gain on the sale of our investment in WildBlue to Viasat, Inc., which closed in December 2009. |
| (11) | Reflects certain non-recurring gains and losses and non-cash items, including costs associated with the migration of our jurisdiction of organization from Bermuda to Luxembourg, costs incurred in connection with the New Sponsors Acquisition, expense for services on the Galaxy 13/Horizons-1 and Horizons-2 satellites and non-cash income related to the recognition of deferred revenue on a straight-line basis of certain prepaid capacity contracts, which are excluded under the definitions of Intelsat Luxembourg Adjusted EBITDA and Sub Holdco Adjusted EBITDA. |
| (12) | Represents satellite performance incentive interest expense required to be excluded from interest expense for the calculation of Intelsat Luxembourg Adjusted EBITDA, but permitted to be included as part of interest expense for the calculation of Sub Holdco Adjusted EBITDA. |
| (13) | This measure is reported publicly by our subsidiary, Intelsat Corp, which is not a subsidiary of Intelsat Sub Holdco. |
| (14) | Reflects expenses of Intelsat Luxembourg and other holding companies not consolidated under Intelsat Sub Holdco. |
Funding Sources and Uses
We are a highly leveraged company and have incurred significant additional debt over the last three years, which has resulted in a large increase in our obligations related to debt service, including increased interest expense. Our interest expense for the year ended December 31, 2009 was $1.4 billion, which included $423.4 million of non-cash interest expense. We currently expect to use cash on hand, cash flows from operations and availability under our senior secured credit facilities to fund our most significant cash outlays, including debt service requirements and capital expenditures, in the next twelve months. We continually evaluate ways to simplify our capital structure and opportunistically extend our maturities and reduce our costs of debt.
No amounts were outstanding under our revolving credit facilities as of December 31, 2009; however, we had aggregate outstanding letters of credit of $22.9 million under the revolver portion of Intelsat Sub Holdco’s senior secured credit facilities and $2.1 million under the revolver portion of Intelsat Corp’s senior secured credit facilities. Intelsat Sub Holdco and Intelsat Corp had $247.9 million (net of standby letters of credit) and $152.2 million (net of standby letters of credit), respectively, of availability remaining under their senior secured credit facilities at that date. Under the terms of the credit agreements governing both Intelsat Sub Holdco’s senior secured credit facilities and Intelsat Corp’s amended and restated senior secured credit facilities, the ability of each company to borrow under its respective revolving credit facility is subject to compliance by each company’s indirect parent, Intelsat S.A., with a senior secured debt covenant included in the indenture governing Intelsat S.A.’s outstanding senior notes. As a result, under certain circumstances, Intelsat Sub Holdco may not be able to
72
Table of Contents
borrow up to the full amount of borrowing availability under its revolving credit facility if Intelsat Corp has certain amounts outstanding under its revolving credit facility, and Intelsat Corp may not be able to borrow up to the full amount of borrowing availability under its revolving credit facility if Intelsat Sub Holdco has certain amounts outstanding under its revolving credit facility.
Capital Expenditures
Our capital expenditures depend on our business strategies and reflect our commercial responses to opportunities and trends in our industry. Our actual capital expenditures may differ from our expected capital expenditures if, among other things, we enter into any currently unplanned strategic transactions. Levels of capital spending from one year to the next are also influenced by the nature of the satellite life cycle and by the capital-intensive nature of the satellite industry. For example, we incur significant capital expenditures during the years in which satellites are under construction. We typically procure a new satellite within a timeframe that would allow the satellite to be deployed at least one year prior to the end of the service life of the satellite to be replaced. As a result, we frequently experience significant variances in our capital expenditures from year to year. The following table compares our satellite-related capital expenditures to total capital expenditures from 2005 through 2009 (the table below does not reflect expenditures of PanAmSat prior to its acquisition in 2006) (in thousands).
| Year |
Satellite- Related Capital Expenditures |
Total Capital Expenditures | ||||
| 2005 |
$ | 99,901 | $ | 133,507 | ||
| 2006 |
101,335 | 152,086 | ||||
| 2007 |
474,060 | 543,612 | ||||
| 2008 |
370,761 | 422,460 | ||||
| 2009 |
887,595 | 943,133 | ||||
| Total |
1,933,652 | 2,194,798 | ||||
Payment for satellites and other property and equipment also excludes funds paid for deposits on future satellites and launches that are included as a part of other assets and capitalized as construction progresses.
We have eight satellites in development, including Intelsat New Dawn, that are expected to be launched from 2010 to 2012. In addition to these announced programs, we expect to procure two additional replacement satellites during this period. By the conclusion of 2012, we do not expect our total station-kept transponder count to change significantly from current levels. We expect our 2010 total capital expenditures to range from $825 million to $900 million, including some capital expenditures that were expected to be incurred in 2009 but that now are expected to be incurred in 2010. Expected annual capital expenditure ranges for fiscal years 2011 and 2012 are $800 million to $875 million, and $450 million to $525 million, respectively. Our capital expenditures guidance excludes capital expenditures associated with the Intelsat New Dawn satellite being procured and launched by our New Dawn joint venture.
Currency and Exchange Rates
Substantially all of our customer contracts, capital expenditure contracts and operating expense obligations are denominated in U.S. dollars. Consequently, we are not exposed to material foreign currency exchange risk. However, the service contracts with our Brazilian customers provide for payment in Brazilian reais. Accordingly, we are subject to the risk of a reduction in the value of the Brazilian reais as compared to the U.S. dollar in connection with payments made by Brazilian customers, and our exposure to fluctuations in the exchange rate for Brazilian reais is ongoing. However, the rates payable under our service contracts with Brazilian customers are adjusted annually to account for inflation in Brazil, thereby mitigating the risk. For the year ended December 31,
73
Table of Contents
2007, the predecessor period January 1, 2008 to January 31, 2008 and the successor period February 1, 2008 to December 31, 2008 and the year ended December 31, 2009, our Brazilian customers represented approximately 2%, 2.1%, 2.4% and 2%, respectively, of our revenues. Transactions in other currencies are converted into U.S. dollars using rates in effect on the dates of the transactions.
We recorded a foreign currency exchange loss of $7.8 million during the year ended December 31, 2009, $6.1 million during the combined year ended December 31, 2008 and a gain of $0.5 million during the year ended December 31, 2007. The gain or loss in each year was primarily attributable to the conversion of our Brazilian reais cash balances held in Brazil and other working capital account balances to U.S. dollars at the exchange rate in effect on the last day of the applicable year or, with respect to exchange transactions effected during the year, at the time the exchange transactions occurred.
Off-Balance Sheet Arrangements
On August 1, 2005, Intelsat Corp formed a second satellite joint investment with JSAT to build and launch a Ku-band satellite, Horizons–2. The Horizons-2 satellite was launched in December 2007 and placed into service in February 2008. Our investment is being accounted for using the equity method of accounting. The total future joint investment in Horizons-2 is expected to be $130.4 million as of December 31, 2009, of which each of the joint venture partners is required to fund their 50% share. Our share of the results of Horizons-2 is included in other income (expense), net in the accompanying consolidated statements of operations and was income of $0.3 million for the successor period February 1, 2008 to December 31, 2008 and the year ended December 31, 2009. As of December 31, 2008 and 2009, the investment balance of $79.2 million and $75.3 million, respectively, was included within other assets in the accompanying consolidated balance sheets. In connection with the New Sponsors Acquisition, there was no adjustment to the investment balance or the corresponding liability balance.
In connection with our investment in Horizons-2, we entered into a capital contribution and subscription agreement in August 2005, which requires us to fund our 50% share of the amounts due under Horizons-2’s loan agreement with a third-party lender. Pursuant to this agreement, we had made contributions of $9.7 million and $12.2 million as of December 31, 2008 and 2009, respectively. We have entered into a security and pledge agreement with a third-party lender and, pursuant to this agreement, granted a security interest in our contribution obligation to the lender. Therefore, we have recorded this obligation as an indirect guarantee. We recorded a liability of $12.2 million within accrued liabilities as of each of December 31, 2008 and 2009, and a liability of $61.0 million and $48.8 million within other long-term liabilities as of December 31, 2008 and 2009, respectively, in the accompanying consolidated balance sheets.
We do not have any other significant off-balance sheet arrangements that have, or are reasonably likely to have, a current or future material effect on our financial condition, results of operations or liquidity.
74
Table of Contents
Contractual Obligations and Commercial Commitments
The following table sets forth our contractual obligations and capital and certain other commitments as of December 31, 2009 and the expected year of payment (in thousands):
| Payments due by year | ||||||||||||||||||||||||||||
| Contractual Obligations(1) |
2010 | 2011 | 2012 | 2013 | 2014 | 2015 and thereafter |
Other | Total | ||||||||||||||||||||
| Long-Term debt obligations |
||||||||||||||||||||||||||||
| Intelsat S.A. and subsidiary notes and credit facilities (excluding Intelsat Corp)—principal payment(2) |
$ | 8,448 | $ | 3,448 | $ | 495,967 | $ | 1,574,848 | $ | 1,024,491 | $ | 9,471,549 | $ | — | $ | 12,578,751 | ||||||||||||
| Intelsat S.A. and subsidiary notes and credit facilities (excluding Intelsat Corp)—interest payment(3) |
880,963 | 1,182,034 | 1,164,124 | 1,105,284 | 1,009,099 | 2,118,487 | — | 7,459,991 | ||||||||||||||||||||
| Intelsat Corp notes and credit facilities—principal payment |
89,051 | 91,275 | 77,929 | 17,869 | 2,320,034 | 705,719 | — | 3,301,877 | ||||||||||||||||||||
| Intelsat Corp notes and credit facilities—interest payment(3) |
176,038 | 173,564 | 170,743 | 169,207 | 134,615 | 196,590 | — | 1,020,757 | ||||||||||||||||||||
| Capital lease obligations (including interest) |
196 | — | — | — | — | — | — | 196 | ||||||||||||||||||||
| Operating lease obligations |
2,705 | 1,699 | (150 | )(7) | (1,084 | )(7) | (989 | )(7) | 44,814 | — | 46,995 | |||||||||||||||||
| Purchase obligations(4) |
781,905 | 406,738 | 74,819 | 27,934 | 14,494 | 140,176 | — | 1,446,066 | ||||||||||||||||||||
| Other long-term liabilities (including interest)(5) |
43,717 | 36,870 | 36,458 | 35,296 | 33,639 | 89,695 | — | 275,675 | ||||||||||||||||||||
| Income tax contingencies(6) |
— | — | — | — | — | — | 86,921 | 86,921 | ||||||||||||||||||||
| Total contractual obligations |
$ | 1,983,023 | $ | 1,895,628 | $ | 2,019,890 | $ | 2,929,354 | $ | 4,535,383 | $ | 12,767,030 | $ | 86,921 | $ | 26,217,229 | ||||||||||||
| (1) | Obligations related to Intelsat’s pension and postretirement medical benefit obligations are excluded from the table. See Note 6—Retirement Plans and Other Retiree Benefits to our audited consolidated financial statements included elsewhere in this Annual Report. |
| (2) | Principal payments for Intelsat S.A. and subsidiaries include PIK interest capitalized as part of the 2017 PIK Notes principal in February 2010. |
| (3) | Represents estimated interest payments to be made on our fixed and variable rate debt and fees owed in connection with our senior secured credit facilities and letters of credit. All interest payments assume that principal payments are made as originally scheduled. Interest payments for variable rate debt and incentive obligations have been estimated based on the current interest rates. |
| (4) | Includes satellite construction and launch contracts, estimated payments to be made on performance incentive obligations related to certain satellites that are currently under construction, vendor contracts and customer commitments. |
| (5) | Includes satellite performance incentive obligations (and interest thereon) and our Horizons contribution obligation. Also, excludes future commitments related to our interest rate swaps. |
| (6) | The timing of future cash flows from income tax contingencies cannot be reasonably estimated and therefore are reflected in the Other column. See Note 13—Income Taxes in our consolidated financial statements elsewhere in this Annual Report for further discussion of income tax contingencies. |
| (7) | In 2013 and 2014, our rental income on our owned Washington, D.C. building and our sublease income on leased facilities will exceed our operating lease commitments. |
Satellite Construction and Launch Obligations
As of December 31, 2009, we had approximately $1.3 billion of expenditures remaining under our existing satellite construction contracts and satellite launch contracts. Satellite launch and in-orbit insurance contracts related to future satellites to be launched are cancelable up to thirty days prior to the satellite’s launch. As of December 31, 2009, we did not have any non-cancelable commitments related to existing launch insurance or in-orbit insurance contracts for satellites to be launched.
See Item 1—Business—Our Network—Planned Satellites for details relating to certain of our satellite construction and launch contracts.
Horizons Contributions Obligation
See—Off-Balance Sheet Arrangements for additional information regarding our contribution obligation for Horizons-2.
75
Table of Contents
Operating Leases
We have commitments for operating leases primarily relating to equipment and office facilities. These leases contain escalation provisions for increases. As of December 31, 2009, minimum annual rentals of all leases (net of sublease income on leased facilities and rental income on our owned Washington, D.C. building totaling $16.8 million), totaled approximately $47.0 million, exclusive of potential increases in real estate taxes, operating assessments and future sublease income.
Customer and Vendor Contracts
We have contracts with certain of our customers which require us to provide equipment, services and other support during the term of the related contracts. We also have long-term contractual obligations with service providers primarily for the operation of certain of our satellites. As of December 31, 2009, we had commitments under these customer and vendor contracts which totaled approximately $183.8 million related to the provision of equipment, services and other support.
Critical Accounting Policies
Our consolidated financial statements are based on the selection of accounting policies and the application of accounting estimates, some of which require management to make significant assumptions. Actual results could differ from those estimates. We believe that some of the more important estimates and related assumptions that affect our financial condition and results of operations are in the areas of revenue recognition, the allowance for doubtful accounts, satellites and other property and equipment, business combinations, income taxes, asset impairments and fair value measurements. There were no accounting policies adopted during 2008 or 2009 that had a material effect on our financial condition or results of operations.
Revenue Recognition, Accounts Receivable and Allowance for Doubtful Accounts
Revenue Recognition. We earn revenue primarily from satellite utilization charges and, to a lesser extent, from providing managed services to our customers. In general, we recognize revenue from satellite utilization in the period during which the services are provided. While the majority of our revenue transactions contain standard business terms and conditions, there are certain transactions that contain non-standard business terms and conditions. Additionally, we may enter into certain sales transactions that involve multiple element arrangements (arrangements with more than one deliverable). As a result, significant contract interpretation is sometimes required to determine the appropriate accounting for these transactions, including:
| • | whether an arrangement contains a lease or is otherwise subject to lease accounting literature; |
| • | whether an arrangement should be reported gross as a principal versus net as an agent; |
| • | whether we can develop reasonably dependable estimates about the extent of progress towards contract completion, contract revenues and costs; |
| • | whether we receive a separately identifiable benefit when cash is paid to a vendor and whether we can make a reasonable estimate of the fair value of such benefit; |
| • | how the arrangement consideration should be allocated among potential multiple elements; and |
| • | when to recognize revenue related to the deliverables. |
76
Table of Contents
We receive payments from some customers in advance of our providing services. Amounts received from customers pursuant to satellite capacity prepayment options are recorded in the consolidated financial statements as deferred revenue. These deferred amounts are recognized as revenue on a straight-line basis over the agreement terms.
In addition, our revenue recognition policy requires an assessment as to whether collection is reasonably assured, which requires us, among other things, to evaluate the creditworthiness of our customers. Changes in judgments in these assumptions and estimates could materially impact the timing and/or amount of revenue recognition.
Allowance for Doubtful Accounts. Our allowance for doubtful accounts is determined through an evaluation of the aging of our accounts receivable, and considers such factors as the likelihood of collection based upon an evaluation of the customer’s creditworthiness, the customer’s payment history and other conditions or circumstances that may affect the likelihood of payment, such as political and economic conditions in the country in which the customer is located. When we have determined that the collection of payments for satellite utilization or managed services is not reasonably assured at the time the service is provided, we defer recognition of the revenue until such time as collection is believed to be reasonably assured or the payment is received. If our estimate of the likelihood of collection is not accurate, we may experience lower revenue or an increase in our provision for doubtful accounts.
Satellites and Other Property and Equipment
Satellites and other property and equipment acquired as part of the New Sponsors Acquisition were based on their fair value as of the date of acquisition, excluding satellites under construction at the time of the acquisition, which were reflected at historical cost (which we believed approximated fair value). Satellites and other property and equipment purchased following the New Sponsors Acquisition are stated at cost. Historical cost consists primarily of the cost of satellite construction and launch, including premiums for launch insurance and insurance during the period of in-orbit testing, the net present value of performance incentives expected to be payable to the satellite manufacturers, costs directly associated with the monitoring and support of satellite construction and interest costs incurred during the period of satellite construction. Satellite construction and launch services are generally procured under long-term contracts that provide for payments by us over the contract periods. Satellite construction and launch services costs are capitalized to reflect progress toward completion, which typically coincides with contract milestone payment schedules. Insurance premiums related to satellite launches and subsequent in-orbit testing are capitalized and amortized over the estimated useful lives of the related satellites. Performance incentives payable in future periods are dependent on the continued satisfactory performance of the satellites in service.
Satellites and other property and equipment are depreciated and amortized on a straight-line basis over their estimated useful lives. The remaining depreciable lives of our satellites range from less than one year to 16 years as of December 31, 2009. We make estimates of the useful lives of our satellites for depreciation purposes based upon an analysis of each satellite’s performance, including its orbital design life and its estimated service life. The orbital design life of a satellite is the length of time that the manufacturer has contractually committed that the satellite’s hardware will remain operational under normal operating conditions. In contrast, a satellite’s service life is the length of time the satellite is expected to remain operational as determined by remaining fuel levels and consumption rates. Our in-orbit satellites generally have orbital design lives ranging from ten to 15 years and service lives as high as 20 years. The useful depreciable lives of our satellites generally exceed the orbital design lives and are less than the service lives. Although the service lives of our satellites have historically extended beyond their depreciable lives, this trend may not continue. We periodically review the remaining estimated useful lives of our satellites to determine if any revisions to our estimates are necessary based on the health of the individual satellites. Changes in our estimate of the useful lives of our satellites could have a material effect on our financial position or results of operations.
77
Table of Contents
We charge to operations the carrying value of any satellite lost as a result of a launch or in-orbit failure upon the occurrence of the loss. In the event of a partial failure, we record an impairment charge to operations upon the occurrence of the loss if the undiscounted future cash flows are less than the carrying value of the satellite. We measure the impairment charge as the excess of the carrying value of the satellite over its estimated fair value as determined by the present value of estimated expected future cash flows using a discount rate commensurate with the risks involved. We reduce the charge to operations resulting from either a complete or a partial failure by the amount of any insurance proceeds that were either due and payable to or received by us, and by the amount of any deferred satellite performance incentives that are no longer applicable following the failure. See —Asset Impairment Assessments below for further discussion.
Business Combinations
Our business combinations are accounted for in accordance with the guidance provided under FASB ASC Topic 805, Business Combinations (“FASB ASC 805”), whereby the tangible and separately identifiable intangible assets acquired and liabilities assumed are recognized at their estimated fair market values at the acquisition date. The portion of the purchase price in excess of the estimated fair market value of the net tangible and separately identifiable intangible assets acquired represents goodwill. The allocation of the purchase price related to our business combinations involves estimates and judgments by our management that may be adjusted during the allocation period, but in no case beyond one year from the acquisition date, except for pre-acquisition tax contingencies that may be adjusted beyond the allocation period in accordance with FASB ASC 805. These allocations are made based on management’s best estimates and assumptions. In arriving at the fair values of assets acquired and liabilities assumed, we consider the following generally accepted valuation approaches: the cost approach, income approach, and market approach. Our estimates may also include assumptions about projected growth rates, cost of capital, effective tax rates, tax amortization periods, technology royalty rates and technology life cycles, the regulatory and legal environment, and industry and economic trends.
Asset Impairment Assessments
Goodwill. We account for goodwill and other intangible assets in accordance with the guidance provided under FASB ASC 350. Under this topic, goodwill and other intangible assets acquired in a business combination, and determined to have an indefinite useful life, are not amortized but are tested for impairment annually or more often if an event or circumstances indicate that an impairment loss has been incurred. We are required to identify reporting units at a level below the company’s identified operating segments for impairment analysis. We have identified only one reporting unit for the goodwill impairment test. Additionally, our identifiable intangible assets with estimable useful lives are amortized based on the expected pattern of consumption for each respective asset.
Assumptions and Approach Used. We follow a two-step process to evaluate if a potential impairment exists to our recorded amounts of goodwill. The first step of the process is to compare the reporting unit’s fair value to its carrying value, including goodwill. In the event the carrying value of our reporting unit exceeds its fair value, goodwill is considered impaired and the second step is required. The second step requires us to calculate a hypothetical purchase allocation to compare the current implied fair value of the goodwill to the current carrying value of the goodwill. The implied fair value of goodwill is determined in the same manner as the amount of goodwill recognized in a business combination, which is the excess of the fair value over the aggregate fair values of the individual assets, liabilities and identifiable intangibles as if they were being acquired in a business combination. If the implied fair value of goodwill as described above exceeds recorded goodwill, there is no impairment. If the goodwill exceeds the implied fair value, an impairment charge would be recorded for the excess. Furthermore, an impairment loss cannot exceed the amount of goodwill assigned to a reporting unit. After recognizing the impairment loss, the corresponding loss establishes a new basis in the goodwill. Subsequent reversals of goodwill impairment losses are not permitted under applicable accounting standards.
We determined the estimated fair value of our reporting unit using discounted cash flow analysis, along with independent source data related to comparative market multiples and, when available, recent transactions. The
78
Table of Contents
discounted cash flows were derived from our five-year projection of revenues and expenses plus a residual value, with the resulting projected cash flows discounted at an appropriate weighted average cost of capital. The analysis, which was completed in the fourth quarter of 2009, did not result in an impairment of our goodwill.
The key assumptions in our discounted cash flow analysis related to revenue growth rates, operating costs and capital expenditures. Our impairment analysis could be impacted by uncontrollable or unforeseeable events that could positively or negatively affect the anticipated future economic and operating conditions. A change in the estimated future cash flows could change our estimated fair values and result in future impairments.
Our analysis included projected growth rates for revenue consistent with general expectations in the FSS sector and our historical experience. The FSS sector is characterized by relatively stable and predictable contracted revenue streams, high operating margins, strong cash flows and long-term contractual commitments. We benefit from strong visibility into our future revenues and had backlog, which is our expected future revenue under all our customer contracts, of $9.4 billion as of December 31, 2009. Additionally, the long-term growth rate assumed in our discounted cash flow analysis could have declined significantly and we still would not have incurred an impairment to goodwill as of December 31, 2009, based upon our discounted cash flow analysis.
Our projected cash flows were discounted using a weighted average discount rate of 10.5% based on an estimated weighted average cost of capital which included certain key inputs such as the average capital structures of comparable companies, specifically a market participant debt to equity ratio of 33.4% debt and 66.6% equity, and an equity risk premium of 5.5%, taking into account the current contraction in the economic environment.
Trade name. We have implemented the relief from royalty method to determine the estimated fair value of the Intelsat trade name. The relief from royalty analysis is comprised of two major steps: i) a determination of the hypothetical royalty rate, and ii) the subsequent application of the royalty rate to projected revenue. In determining the hypothetical royalty rate utilized in the relief from royalty approach, we considered comparable license agreements, operating earnings benchmark rule of thumb, an excess earnings analysis to determine aggregate intangible asset earnings, and other qualitative factors. Based on our analysis, the fair value of the Intelsat trade name as of the end of the fourth quarter of 2009 was not impaired.
The key assumptions used in our model to fair value the Intelsat trade name included the tax rate and discount rate. A change in the estimated tax rates or discount rate could result in future impairments.
Orbital Locations. Intelsat is authorized by governments to operate satellites at certain orbital locations – i.e., longitudinal coordinates along the Clarke Belt. The Clarke Belt is the part of space approximately 42,165 kilometers above the plane of the equator where geostationary orbit may be achieved. Various governments acquire rights to these orbital locations through filings made with the ITU, a sub-organization of the United Nations. We will continue to have rights to operate at our orbital locations so long as we maintain our authorizations to do so. See Item 1—Business—Regulation and Item 1A—Risk Factors—Risk Factors Relating to Regulation.
Our rights to operate at orbital locations can be used and sold individually; however, since satellites and customers can be and are moved from one orbital location to another, our rights are used in conjunction with each other as a network that can change to meet the changing needs of our customers and market demands. Due to the interchangeable nature of orbital locations, the aggregate value of all of the orbital locations is used to measure the extent of impairment, if any.
Assumptions and Approach Used. We determined the estimated fair value of our right to operate at orbital locations using the build up method, as described below, to determine the cash flows for the income approach, with the resulting projected cash flows discounted at an appropriate weighted average cost of capital. In instances where the build up method did not generate positive value for the rights to operate at an orbital location, but the
79
Table of Contents
right was expected to generate revenue, we assigned a value based upon independent source data for recent transactions of similar orbital locations.
Under the build up approach, the amount an investor would be willing to pay for the right to operate a satellite business at an orbital location is calculated by first estimating the cash flows that typical market participants would assume could be available from the right to operate satellites using the subject location in a similar market. It is assumed that rather than acquiring such a business as a going concern, the buyer would hypothetically start with the right to operate at an orbital location and build a new operation with similar attributes from scratch. Thus the buyer/builder is considered to incur the start-up costs and losses typically associated with the going concern value and pay for all other tangible and intangible assets. Based upon our analysis, which was completed in the fourth quarter of 2009, we did not have an impairment of the orbital locations.
The key assumptions used in estimating the fair values of our rights to operate at our orbital locations included: (i) market penetration leading to revenue growth, (ii) profit margin, (iii) duration and profile of the build up period, (iv) estimated start-up costs and losses incurred during the build up period and (v) weighted average cost of capital.
Long-Lived and Amortizable Intangible Assets. We review our long-lived and amortizable intangible assets to assess whether an impairment has occurred in accordance with the guidance provided under FASB ASC Topic 360, Property, Plant and Equipment, whenever events or changes in circumstances indicate, in our judgment, that the carrying amount of an asset may not be recoverable. These indicators of impairment can include, but are not limited to, the following:
| • | satellite anomalies, such as a partial or full loss of power; |
| • | under-performance of an asset as compared to expectations; and |
| • | shortened useful lives due to changes in the way an asset is used or expected to be used. |
The recoverability of an asset to be held and used is measured by a comparison of the carrying amount of the asset to the estimated undiscounted future cash flows expected to be generated by the asset. If the carrying amount of the asset exceeds its estimated undiscounted future cash flows, an impairment charge is recognized in the amount by which the carrying amount of the asset exceeds its fair value, determined by either a quoted market price, if any, or a value determined by utilizing a discounted cash flow technique. Additionally, when assets are expected to be used in future periods, a shortened depreciable life may be utilized if appropriate, resulting in accelerated depreciation.
Assumptions and Approach Used. We employ a discounted future cash flow approach to estimate the fair value of our long lived intangible assets when an impairment assessment is required. During 2009, there were no such anomalies or events requiring a full impairment analysis for an amortizable long-lived asset.
Typically, in estimating the discounted cash flows for our satellites, we primarily use our internally prepared budgets and forecast information. The cash flows would then be discounted at an appropriate weighted average cost of capital. Therefore, typically a change in the estimated future cash flows could change our estimated fair value resulting in additional impairment when applicable.
Income Taxes
We account for income taxes in accordance with the guidance provided under FASB ASC Topic 740, Income Taxes (“FASB ASC 740”). We are subject to income taxes in the United States as well as a number of foreign jurisdictions. Significant judgment is required in the calculation of our tax provision and the resultant tax liabilities and in the recoverability of our deferred tax assets that arise from temporary differences between the tax and financial statement recognition of revenue and expense and net operating loss and credit carryforwards.
80
Table of Contents
As part of our financial process, we must assess the likelihood that our deferred tax assets can be recovered. Under FASB ASC 740, a valuation allowance is required when it is more likely than not that all, or a portion, of the deferred tax asset will not be realized. We evaluate the recoverability of our deferred tax assets based in part on the existence of deferred tax liabilities that can be used to realize the deferred tax assets.
During the ordinary course of business, there are many transactions and calculations for which the ultimate tax determination is uncertain. We evaluate our tax positions to determine if it is more likely than not that a tax position is sustainable, based solely on its technical merits and presuming the taxing authorities’ full knowledge of the position and having access to all relevant facts and information. When a tax position does not meet the more likely than not standard, a liability is recorded for the entire amount of the unrecognized tax benefit. Additionally, for those tax positions that are determined more likely than not to be sustainable, we measure the tax position at the largest amount of benefit more likely than not (determined by cumulative probability) to be realized upon settlement with the taxing authority.
Fair Value Measurements
We estimate the fair value of our financial instruments using available market information and valuation methodologies. The carrying amounts of cash and cash equivalents, receivables, accounts payable and accrued liabilities approximate their fair values because of the short maturity of these financial instruments. The fair value for publicly traded instruments is determined using quoted market prices and, for non-publicly traded instruments, fair value is based upon composite pricing from a variety of sources, including market leading data providers, market makers, and leading brokerage firms. We have determined that the valuation measurement inputs for our publicly traded instruments represent unadjusted quoted market prices in active markets, and therefore, have been classified within Level 1 of the hierarchy framework established by FASB ASC Topic 820, Fair Value Measurements and Disclosure (“FASB ASC 820”). We determined the inputs of our non-publicly traded instruments to be within Level 2 of the FASB ASC 820 hierarchy framework.
On January 1, 2008, we prospectively adopted FASB ASC 820, which defines fair value as the price that would be received in the sale of an asset or paid to transfer a liability in an orderly transaction between market participants at the measurement date. FASB ASC 820 requires disclosure of the extent to which fair value is used to measure financial assets and liabilities, the inputs utilized in calculating valuation measurements, and the effect of the measurement of significant unobservable inputs on earnings, or changes in net assets, as of the measurement date. FASB ASC 820 establishes a three-level valuation hierarchy based upon the transparency of inputs utilized in the measurement and valuation of financial assets or liabilities as of the measurement date:
| • | Level 1—unadjusted quoted prices for identical assets or liabilities in active markets; |
| • | Level 2—quoted prices for similar assets and liabilities in active markets, quoted prices for identical or similar assets or liabilities in markets that are not active, and inputs other than quoted market prices that are observable or that can be corroborated by observable market data by correlation; and |
| • | Level 3—unobservable inputs based upon the reporting entity’s internally developed assumptions which market participants would use in pricing the asset or liability. |
We performed an evaluation of our financial assets and liabilities that met the criteria of the disclosure requirements and fair value framework of FASB ASC 820. As a result of that evaluation, we identified investments in marketable securities, interest rate financial derivative instruments, embedded derivative instruments, and redeemable noncontrolling interest as having met such criteria.
We account for our investments in marketable securities in accordance with FASB ASC Topic 320, Investments—Debt and Equity Securities. All investments have been classified as available-for-sale securities as of December 31, 2008 and 2009, and are included in other assets in the accompanying consolidated balance sheets. Available-for-sale securities are stated at fair value with any unrealized gains and losses included in
81
Table of Contents
accumulated other comprehensive income (loss) within shareholder’s equity (deficit). Realized gains and losses and declines in fair value on available-for-sale securities that are determined to be other than temporary are included in other income (expense), net within our consolidated statements of operations. Interest and dividends on available-for-sale securities are included in interest expense, net and other income (expense), net, respectively, within the consolidated statements of operations. We determined that the valuation measurement inputs of these marketable securities represent unadjusted quoted prices in active markets and, accordingly, have classified such investments within Level 1 of the FASB ASC 820 hierarchy framework.
The fair value of our interest rate financial derivative instruments reflects the estimated amounts that we would pay or receive to terminate the agreement at the reporting date, taking into account current interest rates, the market expectation for future interest rates and current creditworthiness of both our counterparties and ourselves. Observable inputs utilized in the income approach valuation technique incorporate identical contractual notional amounts, fixed coupon rates, periodic terms for interest payments and contract maturity. Although we have determined that the majority of the inputs used to value our derivatives fall within Level 2 of the fair value hierarchy, the credit valuation adjustments, if any, associated with our derivatives utilize Level 3 inputs, such as the estimates of current credit spread, to evaluate the likelihood of default by us or our counterparties. We also considered the existence of offset provisions and other credit enhancements that serve to reduce the credit exposure associated with the asset or liability being fair valued. We have assessed the significance of the inputs of the credit valuation adjustments to the overall valuation of our derivative positions and have determined that the credit valuation adjustments are not significant to the overall valuation of our derivatives. As a result, we have determined that our derivative valuations in their entirety are classified in Level 2 of the fair value hierarchy.
We account for a contingent put option embedded within the 2009 Sub Holdco Notes under FASB ASC Topic 815, Derivatives and Hedging (“FASB ASC 815”), bifurcating the put option from the debt host instrument and classifying it as a derivative instrument. We estimated the fair value of the embedded derivative on the issuance date and subsequently revalue the derivative at the end of each reporting period, recognizing any change in fair value through earnings. We use a standard valuation technique whereby the critical assumptions and underlyings include the debt maturity date, issue price, coupon rate, change of control put price, and the estimated date of a change in control. We have identified the inputs used to calculate the fair value as Level 3 inputs and have concluded that the valuation in its entirety is classified in Level 3 of the fair value hierarchy.
In accordance with the guidance provided in the Distinguishing Liabilities from Equity topic of the Codification regarding the classification and measurement of redeemable securities, we mark to market the fair value of the noncontrolling interest in New Dawn, a joint venture investment, a majority owned subsidiary which is a joint venture investment with Convergence Partners at each reporting period. Convergence Partners has at its option the ability to require Intelsat to buy its ownership interest at fair value subsequent to the operations of New Dawn’s assets for a period defined in the New Dawn Project Agreement. We calculate the estimated amount that we would be required to pay to Convergence Partners as if the option was exercised using Level 3 inputs such as the discounted cash flows and reflect the value within mezzanine equity.
Recently Issued Accounting Pronouncements
In June 2009, the FASB issued Accounting Standards Update No. 2009-1 105, Generally Accepted Accounting Principles (“Topic 105”), which establishes the Codification as the official single source of authoritative U.S. GAAP, superseding existing literature issued by the FASB, American Institute of Certified Public Accountants, Emerging Issues Task Force (“EITF”) and related literature. The Codification became effective for interim and annual periods ending on or after September 15, 2009, after which only one level of authoritative U.S. GAAP exists and all other literature is considered non-authoritative. The Codification does not change existing U.S. GAAP. The Codification was effective for our third quarter 2009 financial statements and the principal impact on our financial statements is limited to disclosures as all future references to authoritative accounting literature will be referenced in accordance with the Codification. Pursuant to the provisions of Topic
82
Table of Contents
105, we have updated references to U.S. GAAP in our financial statements issued for the period ended December 31, 2009. The adoption of Topic 105 did not impact our financial position or results of operations.
Accounting pronouncements issued prior to the Codification will continue to be referenced by their original issuance reference for consistency with prior period filings. We have also provided the Codification topic into which the accounting guidance has been incorporated subsequent to its original issuance.
In September 2009, the FASB amended the Revenue Recognition—Multiple Element Arrangements topic of the Codification. Currently, the absence of vendor specific objective evidence (“VSOE”) or third party evidence (“TPE”) of the fair value of the undelivered item(s) in an arrangement with multiple deliverables is one of the most common reasons entities are unable to recognize revenue on items that have been delivered. The amendment modifies the fair value requirements by providing an alternative for establishing fair value of a deliverable. In instances where VSOE or TPE of the fair value for any of the deliverables in an arrangement is unavailable, the entity may develop a best estimate of the selling price for those deliverables and allocate the arrangement consideration using the relative selling price method. Application of the residual method of allocating an arrangement fee between delivered and undelivered elements will no longer be permitted. Additionally, entities will be required to disclose more information about their multiple-element revenue arrangements. This amendment will be effective and applied prospectively to all revenue arrangements entered into or materially modified in fiscal years beginning on or after June 15, 2010 with early adoption permitted. We intend to adopt the amended revenue recognation guidance in the first quarter of 2010 and do not expect the adoption to have a significant impact on our consolidated financial statements.
In June 2009, the FASB issued SFAS No. 166, Accounting for Transfers of Financial Assets—an amendment of FASB Statement No. 140 (“SFAS No. 166”). Subsequent to the issuance of this accounting pronouncement, SFAS No. 166 has been incorporated into the Codification under the FASB ASC 860 Transfers and Servicing, which establishes accounting and reporting standards for transfers and servicing of financial assets. SFAS No. 166 is intended to improve the relevance, representational faithfulness, and comparability of information that a reporting entity provides in its financial statements related to a transfer of financial assets, the effects of a transfer on its financial position, financial performance, and cash flows, and a transferor’s continuing involvement, if any, in transferred financial assets. SFAS No. 166 will be effective at the start of the first annual reporting period beginning after November 15, 2009. We have evaluated the requirements of SFAS No. 166 and noted that the adoption of SFAS No. 166 will not have a material impact to our consolidated financial statements.
In June 2009, the FASB issued SFAS No. 167, Amendments to FASB Interpretation No. 46(R) (“SFAS No. 167”). Subsequent to the issuance of this accounting pronouncement, SFAS No. 167 has been incorporated into the Codification under the FASB ASC 810 Consolidations. SFAS No. 167 is intended to address the effects on certain provisions of FASB Interpretation No. 46 (revised December 2003), Consolidation of Variable Interest Entities (“FIN 46(R)”), as a result of the elimination of the qualifying special-purpose entity concept in SFAS No. 166 and constituent concerns about the application of certain key provisions of FIN 46(R), including those in which the accounting and disclosures under FIN 46(R) do not always provide timely and useful information about an entity’s involvement in a variable interest entity. SFAS No. 167 will be effective at the start of the first annual reporting period beginning after November 15, 2009. We have evaluated the requirements of SFAS No. 167 and its effect to our unconsolidated variable interest entities, and do not believe that the adoption of the standard will not have a material impact to our consolidated financial statements.
Related Party Transactions
See Item 13—Certain Relationships and Related Transactions, and Director Independence, appearing elsewhere in this Annual Report.
83
Table of Contents
| Item 7A. | Quantitative and Qualitative Disclosures About Market Risk |
We are primarily exposed to the market risk associated with unfavorable movements in interest rates and foreign currencies. The risk inherent in our market risk sensitive instruments and positions is the potential loss arising from adverse changes in those factors. In addition, with respect to our interest rate swaps as described below, we are exposed to counterparty credit risk, which we seek to minimize through credit support agreements and the review and monitoring of all counterparties. We do not purchase or hold any derivative financial instruments for speculative purposes.
Interest Rate Risk
The satellite communications industry is a capital intensive, technology driven business. We are subject to interest rate risk primarily associated with our borrowings. Interest rate risk is the risk that changes in interest rates could adversely affect earnings and cash flows. Specific interest rate risks include: the risk of increasing interest rates on short-term debt; the risk of increasing interest rates for planned new fixed rate long-term financings; and the risk of increasing interest rates for planned refinancings using long-term fixed rate debt.
Approximately 78%, or $12.2 billion, of our debt as of December 31, 2009 was fixed-rate debt, excluding interest rate swaps. While changes in interest rates impact the fair value of this debt, there is no impact to earnings or cash flows because we intend to hold these obligations to maturity unless market and other conditions are favorable.
As of December 31, 2009, we held interest rate swaps with an aggregate notional amount of $3.3 billion with maturities ranging from 2010 to 2014. These swaps were entered into to economically hedge the variability in cash flow on a portion of the floating rate term loans under our senior secured and unsecured credit facilities. On a quarterly basis, we receive a floating rate of interest equal to the three-month LIBOR and pay a fixed rate of interest. On December 31, 2009, the rate we would pay averaged 3.9% and the rate we would receive averaged 0.3%.
In addition, certain of these swaps contain options covering a notional amount of $717.0 million that would effectively permit us to terminate the underlying swaps on March 14, 2011, prior to the stated maturity of March 14, 2013. If we exercise the options, the cash flows (excluding accrued and unpaid interest) for the underlying swap and those from the options are expected to offset one another.
These interest rate swaps and options have not been designated for hedge accounting treatment in accordance with FASB ASC Topic 815, Derivatives and Hedging, as amended and interpreted, and the changes in fair value of these instruments will be recognized in earnings during the period of change. Assuming a one percentage point decrease in the prevailing forward yield curve, the fair value of the interest rate swap liability would decrease to a liability of approximately $188.6 million from $113.9 million and the fair value of the options would increase to an asset of approximately $26.3 million from $15.5 million.
We perform interest rate sensitivity analyses on our variable rate debt, including interest rate swaps, and cash and cash equivalents. These analyses indicate that a one percentage point change in interest rates would have minimal impact on our consolidated statements of operations and cash flows as of December 31, 2009. While our variable-rate debt may impact earnings and cash flows as interest rates change, it is not subject to changes in fair values.
Foreign Currency Risk
We do not currently use foreign currency derivatives to hedge our foreign currency exposures. Substantially all of our customer contracts, capital expenditure contracts and operating expense obligations are denominated in U.S. dollars. Consequently, we are not exposed to material foreign currency exchange risk. However, the service
84
Table of Contents
contracts with our Brazilian customers provide for payment in Brazilian reais. Accordingly, we are subject to the risk of a reduction in the value of the Brazilian reais as compared to the U.S. dollar in connection with payments made by Brazilian customers, and our exposure to fluctuations in the exchange rate for Brazilian reais is ongoing. However, the rates payable under our service contracts with Brazilian customers are adjusted annually to account for inflation in Brazil, thereby mitigating the risk. For the predecessor year ended December 31, 2007, the combined year ended December 31, 2008 and the year ended December 31, 2009, our Brazilian customers represented approximately 2%, 2.4% and 2% of our revenue, respectively. Transactions in other currencies are converted into U.S. dollars using rates in effect on the dates of the transactions.
| Item 8. | Financial Statements and Supplementary Data |
Our consolidated financial statements are filed under this item, beginning on page F-1 of this Annual Report on Form 10-K. The financial statement schedules required under Regulation S-X are filed pursuant to Item 15 of this Annual Report on Form 10-K.
| Item 9. | Changes in and Disagreements with Accountants on Accounting and Financial Disclosure |
None.
| Item 9A(T). | Controls and Procedures |
(a) Disclosure Controls and Procedures
Disclosure controls and procedures are controls and procedures that are designed to ensure that information required to be disclosed by us in reports that we file or submit under the Securities Exchange Act of 1934, as amended (the “Exchange Act”) is recorded, processed, summarized and timely reported as provided in SEC rules and forms. We periodically review the design and effectiveness of our disclosure controls and procedures worldwide, including compliance with various laws and regulations that apply to our operations. We make modifications to improve the design and effectiveness of our disclosure controls and procedures, and may take other corrective action, if our reviews identify a need for such modifications or actions. In designing and evaluating the disclosure controls and procedures, we recognize that any controls and procedures, no matter how well designed and operated, can provide only reasonable assurance of achieving the desired control objectives.
We have carried out an evaluation, under the supervision and the participation of our management, including our principal executive officer and our principal financial officer, of the effectiveness of the design and operation of our disclosure controls and procedures (as defined in Rule 13a-15(e) and 15d-15(e) under the Exchange Act), as of the year ended December 31, 2009. Based upon that evaluation, our principal executive officer and our principal financial officer concluded that our disclosure controls and procedures were effective as of December 31, 2009.
(b) Management’s Annual Report on Internal Control over Financial Reporting
Our management is responsible for establishing and maintaining adequate internal control over financial reporting, as such term is defined in Exchange Act Rule 13a-15(f). Under the supervision and with the participation of our management, including our principal executive officer and principal financial officer, we conducted an evaluation of the effectiveness of our internal control over financial reporting based on the framework set forth in Internal Control—Integrated Framework issued by the Committee of Sponsoring Organizations of the Treadway Commission. Based on our evaluation, management has concluded that our internal control over financial reporting was effective as of December 31, 2009.
This Annual Report does not include an attestation report of our independent registered public accounting firm regarding internal control over financial reporting. Management’s report was not subject to attestation by our independent registered public accounting firm pursuant to temporary rules of the SEC that permit us to provide only management’s report in this Annual Report on Form 10-K.
85
Table of Contents
(c) Changes in Internal Control over Financial Reporting
There were no changes that occurred in our internal control over financial reporting during the quarter ended December 31, 2009 that have materially affected, or are reasonably likely to materially affect, internal control over financial reporting.
| Item 9B. | Other Information |
None.
86
Table of Contents
PART III
| Item 10. | Directors, Executive Officers and Corporate Governance |
Executive Officers and Directors
Our current executive officers and directors are as follows:
| Name |
Age | Position | ||
| David McGlade |
49 | Director, Deputy Chairman and Chief Executive Officer, Intelsat S.A. | ||
| Raymond Svider |
47 | Chairman and Director, Intelsat S.A. | ||
| Michael McDonnell |
46 | Executive Vice President and Chief Financial Officer, Intelsat S.A. | ||
| Phillip Spector |
59 | Executive Vice President Business Development, General Counsel and Assistant Secretary, Intelsat S.A. | ||
| Stephen Spengler |
50 | Executive Vice President Sales and Marketing, Intelsat Corporation | ||
| Thierry Guillemin |
50 | Senior Vice President and Chief Technical Officer, Intelsat Corporation | ||
| Anita Beier |
54 | Senior Vice President and Controller, Intelsat Corporation | ||
| Justin Bateman |
36 | Director | ||
| Egon Durban |
36 | Director | ||
| John Joyce |
56 | Director | ||
| James Rubin |
42 | Director |
The following is a brief biography of each of our executive officers and directors:
Mr. McGlade has been the Chief Executive Officer of Intelsat S.A. since April 2005 and became Deputy Chairman of the board of directors in August 2008. Prior to that, Mr. McGlade was the Chief Executive Officer of O2 UK, the largest subsidiary of mmO2 plc and a leading U.K. cellular telephone company, a position he took in October 2000. He was also an Executive Director of O2 plc. During his tenure at O2 UK and O2, Mr. McGlade was a director of the GSM Association, a trade association for GSM mobile operators, and served as Chairman of its Finance Committee from February 2004 to February 2005. He was also a director of Tesco Mobile from September 2003 to March 2005 and a director of The Link, a distributor of mobile phones and other high technology consumer merchandise, from December 2000 to May 2004. We believe Mr. McGlade’s extensive telecommunications industry experience is of benefit to our board. Mr. McGlade is currently a director of Skyworks Solutions, Inc. Mr. McGlade’s business address is 23, avenue Monterey, L-2086 Luxembourg.
Mr. Svider became a director of Intelsat S.A. in February 2008 and became the Chairman of the board of directors of Intelsat S.A. in May 2008. Mr. Svider is Co-Chairman and has been a Managing Partner of BC Partners, since 2003. He joined BC Partners in 1992 in Paris before moving to London in 2000 to lead its investments in the technology and telecoms industries. Over the years, Mr. Svider has participated in or led a variety of investments including Tubesca, Nutreco, UTL, Neopost, Polyconcept, Neuf Telecom, Unity Media/Tele Columbus, Office Depot Inc. and ATI Enterprises. He is currently on the board of Office Depot Inc. and ATI Enterprises. Prior to joining BC Partners; Mr. Svider worked in investment banking at Wasserstein Perella in New York and Paris, and at the Boston Consulting Group in Chicago. Mr. Svider holds a Master of Business Administration from the University of Chicago and a Master of Science in Engineering from both Ecole Polytechnique and Ecole Nationale Superieure des Telecommunications in France. We believe Mr. Svider’s experience overseeing other BC Partners portfolio companies is of benefit to our board. Mr. Svider’s business address is 23, avenue Monterey, L-2086 Luxembourg.
Mr. McDonnell became the Executive Vice President and Chief Financial Officer of Intelsat S.A. in November 2008. He was previously Executive Vice President, Chief Financial Officer and Treasurer of MCG Capital Corporation, a publicly-held commercial finance company, from September 2004 and its Chief Operating Officer since August 2006. From August 2000 to August 2004, Mr. McDonnell was employed by direct-to-home satellite television operator, DISH Network Corporation (f/k/a EchoStar Communications Corporation), where he served as Executive Vice President and Chief Financial Officer from July 2004 to August 2004 and as Senior Vice President and Chief Financial Officer from August 2000 to July 2004. Prior to joining EchoStar, from 1986
87
Table of Contents
to 2000 Mr. McDonnell was employed by PricewaterhouseCoopers LLP, where he was a partner from 1996. He also currently serves on the board of directors of Catalyst Health Solutions, Inc. (f/k/a HealthExtras, Inc.), a pharmacy benefit management company. Mr. McDonnell’s business address is 23, avenue Monterey, L-2086 Luxembourg.
Mr. Spector became the Executive Vice President and General Counsel of Intelsat S.A. in February 2005 and the Head of Business Development in April 2007. He was previously the managing partner of the Washington, D.C. office of the law firm of Paul, Weiss, Rifkind, Wharton & Garrison LLP, and chair of the firm’s Communications & Technology Group. He is the former Chairman of the American Bar Association’s International Communications Committee, and served in the U.S. government as Associate Assistant to the President and as a law clerk to a Supreme Court justice. Mr. Spector is a magna cum laude graduate of the Harvard Law School and holds a Master in Public Policy degree from Harvard’s Kennedy School of Government. Mr. Spector’s business address is 23, avenue Monterey, L-2086 Luxembourg.
Mr. Spengler became the Executive Vice President Sales and Marketing of Intelsat Corporation in February 2008. From July 2006 to February 2008, he served as Intelsat Corporation’s Senior Vice President, Europe, Middle East, Africa & Asia Pacific Sales. From February 2006 to July 2006, Mr. Spengler served as Acting Senior Vice President Sales & Marketing of Intelsat Global Service Corporation, leading Intelsat S.A.’s global marketing and sales organizations immediately prior to the acquisition of PanAmSat. From July 2003 to February 2006, he served as Vice President, Sales, Network Services & Telecom of Intelsat Global Service Corporation. Prior to joining Intelsat, Mr. Spengler held various positions in the telecommunications industry, including serving from March 2002 to June 2003 as Senior Vice President of Global Sales, Broadband Access Networks, at Cirronet, Inc., a developer of wireless products for Internet access, industrial and scientific use. Mr. Spengler’s business address is 3400 International Drive, N.W., Washington, D.C. 20008, United States.
Mr. Guillemin became the Senior Vice President and Chief Technical Officer of Intelsat Corporation in February 2008, with responsibility for customer operations, space systems management and planning, and satellite operations. From July 2006 to February 2008, he served as Intelsat Corporation’s Vice President of Satellite Operations & Engineering, in which role he was responsible for the service availability of Intelsat’s entire in-orbit fleet of satellites (combined with PanAmSat’s). From July 2005 to July 2006, Mr. Guillemin served as Vice President of Satellite Engineering & Program Management of Intelsat Global Service Corporation, and from January 2003 to July 2005, he served as Senior Director of Satellite Operations. He has over 25 years’ experience in the satellite industry, in disciplines including spacecraft development, launch and operations. Mr. Guillemin’s business address is 3400 International Drive, N.W., Washington, D.C. 20008, United States.
Ms. Beier became the Senior Vice President and Controller of Intelsat Global Service Corporation on May 15, 2006 and of Intelsat Corporation on July 3, 2006. Prior to joining Intelsat, Ms. Beier served as Senior Vice President—Finance and Controller of US Airways, Inc. from May 2004 to April 2006 and as Vice President & Controller from June 1999 to May 2004. Prior to joining US Airways, Inc., Ms. Beier served as Vice President—Financial Planning at CSX Corporation, a transportation company providing rail and intermodal services, from September 1998 to June 1999. Ms. Beier’s business address is 3400 International Drive N.W., Washington, D.C. 20008, United States.
Mr. Bateman became a director of Intelsat S.A. in August 2008. Mr. Bateman is a Partner of BC Partners based in its New York office, the investment arm of which he co-established in early 2008. He initially joined BC Partners’ London office in 2000 from PricewaterhouseCoopers, where he spent three years in Transaction Services working on due diligence projects for both financial investors and corporate clients. In 2002/2003 he left BC Partners to complete his MBA at INSEAD before rejoining its London office. Mr. Bateman serves on the board of Office Depot Inc. He has a degree in economics from the University of Cambridge in the UK. We believe Mr. Bateman’s accounting and financial education and experience are of benefit to our board. Mr. Bateman’s business address is 23, avenue Monterey, L-2086 Luxembourg.
88
Table of Contents
Mr. Durban became a director of Intelsat S.A. in February 2008. Mr. Durban is a Managing Director based in London responsible for overseeing Silver Lake’s European operations. Mr. Durban joined Silver Lake in 1999 as a founding principal and has worked in the firm’s Menlo Park and New York offices. Mr. Durban serves on the Supervisory Board of Skype and is the Chairman of its Operating Committee, serves on the Supervisory Board and Operating Committee of NXP B.V., on the Operating Committee of SunGard Capital Corporation, and serves on Silver Lake’s Management, Investment and Operating and Valuation Committees. Prior to Silver Lake, Mr. Durban worked in Morgan Stanley’s Investment Banking Division. Mr. Durban graduated from Georgetown University with a BS in Finance. We believe Mr. Durban’s experience overseeing Silver Lake portfolio companies is of benefit to our board. Mr. Durban’s business address is 23, avenue Monterey, L-2086 Luxembourg.
Mr. Joyce became a director of Intelsat S.A. in August 2008. Mr. Joyce is a Managing Director of Silver Lake, a private equity firm that he joined in July 2005. Prior to joining Silver Lake, Mr. Joyce spent 30 years with IBM, serving most recently as Senior Vice President and Group Executive of the IBM Global Services Division, the world’s largest information technology services and consulting provider. From 1999 to 2004, Mr. Joyce was Chief Financial Officer of IBM. Prior to that, Mr. Joyce served in a variety of roles, including President, IBM Asia Pacific and Vice President and Controller for IBM’s global operations. Mr. Joyce serves as a director of Avago Technology, Hewlett-Packard Company and a number of private companies. We believe Mr. Joyce’s extensive experience managing large international operations is of benefit to our board. Mr. Joyce’s business address is 23, avenue Monterey, L-2086 Luxembourg.
Mr. Rubin became a director of Intelsat S.A. in August 2008. Mr. Rubin is a Senior Partner of BC Partners, which he joined in May 2008 from One Equity Partners, where he was a founding partner since its inception in 2001. Mr. Rubin originated and executed transactions in a variety of industries with a particular focus on healthcare and business services and was also responsible for building One Equity’s practice in India. Prior to forming One Equity, Mr. Rubin was a Vice President with Allen & Company Incorporated, a New York merchant bank specializing in media and entertainment transactions and advisory work. From 1996 to 1998, he held a number of senior policy positions with the Federal Communications Commission. Mr. Rubin serves on the board of Office Depot Inc. He received his A.B. from Harvard College and a J.D. from Yale Law School. Mr. Rubin is a Board Member of two New York City non-profits: Common Ground Communities and Echoing Green, and serves on the Board of The Dalton School. We believe Mr. Rubin’s significant business and finance experience is of benefit to our board. Mr. Rubin’s business address is 23, avenue Monterey, L-2086 Luxembourg.
Board Leadership Structure
Our board of directors is led by a Chairman who is a Managing Partner of a private equity firm that is affiliated with entities that own or control more than 70% of the outstanding equity of Intelsat Global. Our Chief Executive Officer is also the Deputy Chairman of our board, and has an employment agreement pursuant to which he reports to the board of directors. The separation of the Chairman and Chief Executive Officer positions is appropriate for a privately-held company such as ours.
Audit Committee
Intelsat S.A. has an audit committee consisting of Messrs. Svider, Durban, Bateman and Joyce. The members are not independent since they are associated with the New Sponsors. Pursuant to its charter and the authority delegated to it by the board of directors, the audit committee has sole authority for the engagement, compensation and oversight of our independent registered public accounting firm. In addition, the audit committee reviews the results and scope of the audit and other services provided by our independent registered public accounting firm, and also reviews our accounting and control procedures and policies. The audit committee also is a primary monitor of risks impacting the Company, and performs the primary risk oversight role of the board of directors. The audit committee meets as often as it determines necessary but not less frequently than once every fiscal quarter. Our board of directors has determined that each member of the audit committee is an audit committee financial expert.
89
Table of Contents
Compensation Committee
Intelsat S.A. has a compensation committee consisting of Messrs. Svider and Durban. The members are not independent since they are associated with the New Sponsors. Pursuant to its charter and the authority delegated to it by the board of directors, the compensation committee has responsibility for the approval and evaluation of all of our compensation plans, policies and programs as they affect Intelsat S.A.’s chief executive officer and its other executive officers. The compensation committee meets as often as it determines necessary.
Compensation Committee Interlocks and Insider Participation
Intelsat S.A.’s compensation committee is currently comprised of Messrs. Svider and Durban, directors of Intelsat S.A. None of these individuals has been at any time an officer or employee of Intelsat S.A., other than Mr. Svider who serves as our Chairman. During 2009, Intelsat S.A. had no compensation committee “interlocks”—meaning that it was not the case that an executive officer of ours served as a director or member of the compensation committee of another entity and an executive officer of the other entity served as a director or member of our compensation committee.
Code of Ethics
We have adopted a Code of Ethics for Senior Financial Officers, including our chief executive officer, chief financial officer, principal accounting officer, controller and any other person performing similar functions. The Code of Ethics is posted on our website at www.intelsat.com. We intend to disclose on our website any amendments to or waivers of this Code of Ethics.
| Item 11. | Executive Compensation |
Compensation Discussion and Analysis
Introduction
The Company’s senior executive team includes:
| • | David McGlade, Deputy Chairman and Chief Executive Officer; |
| • | Michael McDonnell, Executive Vice President and Chief Financial Officer; |
| • | Phillip Spector, Executive Vice President, Business Development and General Counsel; |
| • | Stephen Spengler, Executive Vice President, Sales and Marketing, Intelsat Corporation; and |
| • | Thierry Guillemin, Senior Vice President and Chief Technical Officer, Intelsat Corporation. |
During 2009, Messrs. McGlade, McDonnell, Spector, Spengler and Guillemin comprised the Named Executive Officers (the “NEOs”) for the Company. The Company’s compensation objectives and policies, together with specific information on the compensation for each NEO, are described herein.
Compensation Objectives
Our executive compensation programs are designed to encourage our executives to think and act like owners of the Company. We want our executive officers to focus on generating returns for our shareholders, but at the same time to share the downside risk if their decisions cause poor performance. Through our performance management and rewards programs, we endeavor to create an environment that fosters and rewards increasing enterprise value.
The Company has developed a set of strategic corporate objectives designed to support long term growth in its enterprise value. The strategic corporate objectives are set in four areas: financial, customers, internal processes and people. Through this process, the Company achieves a balanced focus on corporate performance
90
Table of Contents
without overemphasizing one area over the other. Additionally, the Company sets specific metrics and initiatives designed to measure performance against the strategic goals. Through our pay-for-performance culture, a significant portion of our executives’ compensation is linked to performance against these objectives.
Our Compensation Committee reviews all of the compensation policies covering NEOs and approves all compensation for the NEOs with employment agreements, as described below.
Compensation Policy
We believe that in order to achieve our objectives, our executive compensation programs must be competitive, reward good results and provide incentives for future performance that sustain and enhance long-term shareholder value. Our overall executive compensation philosophy is one based upon alignment with our shareholders. The level of total compensation varies based upon the returns ultimately achieved by our shareholders. The amount of variable compensation also increases with the level of the executive officer.
Our performance-driven compensation policy consists of the following three components:
| • | base salary; |
| • | short-term incentive awards (in the form of annual cash bonuses); and |
| • | long-term incentive awards (in the form of restricted shares and options). |
We use short-term compensation (base salaries and annual cash bonuses) to provide competitive levels of cash compensation for our executives and to focus them on our annual goals and objectives. We use long-term compensation (restricted shares and options) to achieve our goal of driving long-term growth in share value. This long-term compensation element is designed to emphasize the performance measures our executives need to achieve in order to deliver shareholder value. Our NEOs hold a mixture of previously granted restricted shares and newly granted restricted shares and options awarded in connection with the Company’s acquisition by our New Sponsors in February of 2008 and thereafter. These newly granted equity incentive awards are subject to a variety of time and performance vesting requirements, all closely linked to the long-term growth in the value of the Company.
We carefully determine the percentage mix of compensation components we think is appropriate for each of our NEOs. This is not a mechanical process and we use our judgment and experience to determine the appropriate mix of compensation for each individual. We also look at market data for comparable executive positions. The number of restricted shares and options each currently serving NEO received was based on the expectations we have for the individual and, over time, on such officer’s performance against those expectations.
Base salary may constitute a minority portion of the total compensation of our NEOs. We set salary to provide adequate cash compensation to be competitive in the market for executive talent, but we focus on total compensation, including short-term and long-term compensation, so that our NEOs are prepared to have “at risk” a significant portion of their total compensation.
The level and terms of compensation for Messrs. McGlade, McDonnell and Spector are set forth in the terms of employment agreements between Intelsat Global S.A. and the executive. The terms of compensation for Messrs. Spengler and Guillemin are governed by the general policies and plans of the Company and are not set forth in employment agreements, with the exception of letters regarding arrangements for severance under certain conditions.
Elements of Compensation
Base Salary. Base salary is used to recognize the experience, skills, knowledge and responsibilities required of the executive officers in their roles. When establishing the 2009 base salaries of the NEOs, the Compensation Committee and management considered a number of factors, including the functional role of the position, the
91
Table of Contents
individual’s performance, the level of the individual’s responsibility, the individual’s prior experience in similar positions, competitive market data, the ability to replace the individual, the base salary of the individual at his or her prior employment or prior position within the Company and the number of well-qualified candidates available. The salaries of the NEOs are reviewed on an annual basis, as well as at the time of promotion or other changes in responsibilities.
Annual Cash Bonuses. We maintain a corporate bonus plan, which was adopted by the board of directors in March 2006 (the “Bonus Plan”). The Bonus Plan provides that certain of our and our subsidiaries’ employees, including the NEOs, may be awarded cash bonuses based on the attainment of specific performance goals and business criteria established by our board of directors for participants in the Bonus Plan. These goals and criteria for the 2009 fiscal year included certain revenue, backlog, adjusted operating expense and adjusted EBITDA targets, all as defined by the Compensation Committee. For the 2010 fiscal year, the goals and criteria include certain revenue, backlog and adjusted EBITDA targets, as defined by the Compensation Committee.
Annual cash bonuses are short-term incentive awards intended to reward individual performance for the prior fiscal year and will, therefore, vary from year to year. These bonuses are determined on a discretionary basis. Our Compensation Committee, in consultation with management, establishes performance targets which determine bonus eligibility for our executives. The Compensation Committee also has discretion to award additional bonuses to our executives up to specified percentages of annual base salary. Bonus targets are determined based upon the executive’s level in the Company as well as by a total cash compensation market comparison. Awards for the subject year are determined based upon completion of the audited consolidated financial statements for that year.
The employment agreements for Messrs. McGlade, McDonnell and Spector specify that their annual target bonus percentages are 100%, 65% and 65%, respectively, of the executive’s annual base salary. These bonus amounts are paid in the event of the Company’s achievement of pre-established metrics at the target level. The Compensation Committee also has discretion, in the event of significant outperformance of target objective criteria, to award additional bonuses. The Compensation Committee has established two additional levels of performance, tied to objective criteria at two tiers above the target levels, at which Messrs. McGlade, McDonnell and Spector may achieve additional bonuses. At the first tier of stretch performance, Messrs. McGlade, McDonnell and Spector may each receive an additional bonus of up to 50% of such executive’s annual base salary. At the second tier of stretch performance, Mr. McGlade may achieve an additional bonus of up to another 50% of his annual base salary and Messrs. McDonnell and Spector may each achieve an additional bonus of up to another 15% of such executive’s annual base salary. In the case of Messrs. Spengler and Guillemin, their target bonus percentages have been established pursuant to the terms of the Bonus Plan at 60% and 45%, respectively, of the executive’s annual base salary. In the event that the corporate performance achieves the first tier of stretch performance and based upon each executive’s individual performance, Messrs. Spengler and Guillemin each has the ability to obtain a maximum additional bonus in the amounts of 40.8% and 30.6%, respectively, of annual base salary.
Each of the target goals and criteria for bonuses referred to above is based on thorough discussion between the Compensation Committee and management as to budgets and projections for the relevant year. Great care is taken to ensure that the targets are difficult to achieve but achievable, thereby ensuring that the NEOs and other management are appropriately incentivized to perform at the highest levels. While the Bonus Plan is a discretionary plan and the Compensation Committee retains the right to award compensation absent the attainment of performance criteria, that discretion has not been exercised as the Company has achieved its financial targets under the Bonus Plan for the past three years.
Long-Term Incentive Awards
Shares and Options. At the NEO level, we have sought to weight our compensation programs to ownership of common shares. We believe that share ownership by our executives enhances our ability to deliver superior shareholder returns by increasing the alignment between the interests of our employees and our shareholders. The
92
Table of Contents
equity awards granted to our executives are governed by the terms of the Intelsat Global, Ltd. 2008 Share Incentive Plan (the “2008 Share Plan”). The goal of the 2008 Share Plan is to engage our NEOs and other key employees as partners in the Company’s success and help the Company realize the maximum return from its strategy. We do not have a formal requirement for share ownership by any group of employees. The 2008 Share Plan provides for the granting of incentive share options, nonqualified share options, restricted shares, restricted share units, share appreciation rights, phantom shares and performance awards to our and our subsidiaries’ and specified affiliates’ employees, officers and directors, including the NEOs.
The Compensation Committee has exclusive authority to select the persons to receive awards and the amount and the type of equity awards under the 2008 Share Plan. At the time of each award, the Compensation Committee determines the terms of the award, including the performance period (or periods) and the performance objectives relating to the award. The Company’s policy has been to grant equity awards that align with the ownership objectives of our principal shareholders. Because the Company is privately held, the grant is typically a one-time grant at the outset of the shareholder investment, with vesting and other performance criteria aligned with the growth expected and the length of investment expected by the shareholders. For example, Messrs. McGlade, Spector, Spengler and Guillemin each received a grant of shares in connection with the investment of prior sponsors in January of 2005. Upon the disposition of the prior sponsor shares, these executives received compensation commensurate with the return on investment received by the prior sponsors. See footnote 8 to the Summary Compensation Table for the amounts received by each of the executives. As described more fully below in the equity award agreements narrative, each of the NEOs received new equity grants in connection with the investment of the New Sponsors, with terms and conditions aligned with the New Sponsors’ investment horizon. Additional grants may also occur upon the promotion or hire of a new executive.
Based upon the rights of the executive and the Company under the terms of their award agreements, some option grants are considered to be a share-based compensation arrangement (an “SCA”) for accounting purposes rather than an option; however, from a compensation policy perspective, the award is intended to operate like an option. For purposes of this Compensation Discussion and Analysis section and the tables included in this Executive Compensation item, any reference to an option includes SCAs. For further explanation of the accounting treatment of options and SCAs, see Note 5 to the consolidated financial statements included elsewhere in this Annual Report.
In addition to grants made under the 2008 Share Plan, Messrs. McGlade and Spector each purchased for cash certain unrestricted shares of Intelsat Global S.A. pursuant to subscription agreements entered into in May 2009.
Restricted Shares. Each of the NEOs holds restricted shares that are subject to transfer, vesting and other restrictions as set forth in their applicable award agreements. A portion of these restricted shares vests each month with full vesting being achieved over a period of five years, subject to the executive’s continued employment. Certain of the shares awarded are also subject to the meeting of performance criteria based on annual performance targets and cumulative total return earned by certain principal shareholders of Intelsat Global on their investment. Upon termination of employment, the Company retains the unilateral right to repurchase vested shares at fair market value as defined in the 2008 Share Plan. See the discussion of individual agreements following the Summary Compensation Table for further details regarding these restricted shares.
Options. Each of the NEOs holds options that are subject to transfer, vesting and other restrictions as set forth in their applicable award agreements. A portion of these options vests upon the meeting of annual performance targets and a portion vests upon the determination of the cumulative total return earned by certain principal shareholders of Intelsat Global on their investment. These options are also subject to forfeiture and other restrictions as set forth in the executives’ respective award agreements. Upon termination of employment, the Company retains the right to cancel vested options or to repurchase shares acquired upon exercise of the options in exchange for an amount set forth in the 2008 Share Plan. See the discussion of individual agreements following the Summary Compensation Table for further details regarding these options.
93
Table of Contents
Other Elements. Other elements of our executive compensation program include certain severance arrangements and perquisites, all of which are more fully described in those parts of this Item 11 which follow this Compensation Discussion and Analysis. Our philosophy with respect to these items is to maintain competitive overall compensation programs. The NEOs also participate in our other benefit plans on the same terms as other employees. These plans include a 401(k) plan, medical, dental, disability and life insurance. However, under the terms of their employment agreements, Messrs. McGlade and Spector are provided with certain retiree medical benefits that are not otherwise provided to participants under the terms of the medical plan. Additionally, for employees hired prior to July 19, 2001, the Company maintains a defined benefit pension plan. Of the NEOs, only Mr. Guillemin is eligible to participate in this plan.
Competitive Market Review
During 2009, the Company conducted a review of our executive short-term compensation program. The objective of the review was to determine relative market competitiveness of our compensation to enable the Company to attract and to retain key executive talent.
In setting compensation we target the median compensation range for base salary and above median for total cash compensation (base salary and target bonus). Using market survey data we compared our executive officers’ total direct compensation levels to an industry peer group of companies and other general survey data. The peer group was selected based on industry, size (determined by reviewing both revenue levels and enterprise value) and other factors such as market capitalization. Based on this review, it was determined that all elements of our executive compensation program were reasonably competitive with market rates for comparable executive officers.
Role of Executive Officers in Setting Executive Compensation
The Compensation Committee approves the final determination of compensation for Messrs. Spector and McDonnell, acting on recommendation of our Chief Executive Officer, David McGlade, and in consultation with the head of our human resources department. The Compensation Committee determines the compensation of Mr. McGlade acting with advice from the head of our human resources department. Mr. McGlade plays no role in determining his own compensation. The compensation for Messrs. Spengler and Guillemin is set by Mr. McGlade in consultation with the head of our human resources department.
Conclusion
Our compensation policies are designed to recruit, retain and motivate our senior executive officers, to align their interests with those of our shareholders, and ultimately to reward them for outstanding performance.
94
Table of Contents
Summary Compensation Table
The following summarizes the compensation earned during the year ended December 31, 2009 by our NEOs, who are our Chief Executive Officer, Chief Financial Officer, and our three other most highly compensated executive officers who were serving as executive officers on December 31, 2009.
| Name and |
Year | Salary ($) |
Bonus ($) |
Stock Awards ($) |
Option Awards ($) |
Non-Equity Incentive Plan Compensation ($) |
Change in Pension Value and Non-Qualified Deferred Compensation ($) |
All Other Compensation ($) |
Total ($) | ||||||||||||||||||||||||
| David McGlade |
2009 | $ | 1,016,923 | (1) | $ | — | $ | 3,427,935 | (7) | $ | — | (9) | $ | 2,040,000 | (10) | $ | — | $ | 1,931,407 | (12) | $ | 8,416,265 | |||||||||||
| Deputy Chairman and Chief Executive Officer |
2008 | $ | 978,538 | $ | — | $ | — | (8) | $ | — | $ | 2,000,000 | $ | — | $ | 52,929 | $ | 3,031,467 | |||||||||||||||
| 2007 | $ | 808,615 | $ | — | $ | — | $ | — | $ | 1,221,000 | $ | — | $ | 58,095 | $ | 2,087,710 | |||||||||||||||||
| Michael McDonnell |
2009 | $ | 525,894 | (2) | $ | — | $ | 865,686 | (7) | $ | — | (9) | $ | 686,238 | (10) | $ | — | $ | 565,285 | (13) | $ | 2,643,103 | |||||||||||
| Executive Vice President and Chief Financial Officer |
2008 | $ | 69,327 | $ | 100,000 | $ | — | $ | — | $ | 167,375 | $ | — | $ | 7,349 | $ | 344,051 | ||||||||||||||||
| Phillip Spector |
2009 | $ | 525,894 | (3) | $ | — | $ | 865,686 | (7) | $ | — | (9) | $ | 686,238 | (10) | $ | — | $ | 457,023 | (14) | $ | 2,534,841 | |||||||||||
| Executive Vice President, Business Development and General Counsel |
2008 | $ | 512,115 | $ | — | $ | — | (8) | $ | — | $ | 669,500 | $ | — | $ | 55,698 | $ | 1,237,313 | |||||||||||||||
| 2007 | $ | 486,769 | $ | — | $ | — | $ | — | $ | 563,500 | $ | — | $ | 51,285 | $ | 1,101,554 | |||||||||||||||||
| Stephen Spengler |
2009 | $ | 347,692 | (4) | $ | 58,432 | (6) | $ | 507,744 | (7) | $ | — | (9) | $ | 325,080 | (10) | $ | — | $ | 337,826 | (15) | $ | 1,576,774 | ||||||||||
| Executive Vice President, Sales and Marketing |
2008 | $ | 326,269 | $ | — | $ | — | (8) | $ | — | $ | 311,148 | $ | — | $ | 37,757 | $ | 675,174 | |||||||||||||||
| Thierry Guillemin |
2009 | $ | 292,452 | (5) | $ | — | $ | 330,033 | (7) | $ | — | (9) | $ | 205,932 | (10) | $ | 60,263 | $ | 247,570 | (16) | $ | 1,136,250 | |||||||||||
| Senior Vice President and Chief Technical Officer |
2008 | $ | 269,558 | $ | — | $ | — | (8) | $ | — | $ | 191,565 | $ | 32,804 | (11) | $ | 21,399 | $ | 515,326 | ||||||||||||||
| (1) | Mr. McGlade has an employment agreement that provided for an annual salary of $1,000,000 from February 4, 2008 through February 15, 2009. From February 16, 2009 through February 14, 2010, Mr. McGlade’s annual salary was $1,020,000. Effective February 15, 2010, Mr. McGlade’s annual salary was increased to $1,040,400. |
| (2) | Mr. McDonnell has an employment agreement that provided for an annual salary of $515,000 from his employment date on November 3, 2008 through February 15, 2009. From February 16, 2009 through February 14, 2010, Mr. McDonnell’s annual salary was $527,875. Effective February 15, 2010, Mr. McDonnell’s annual salary was increased to $538,433. |
| (3) | Mr. Spector has an employment agreement that provided for an annual salary of $515,000 from February 4, 2008 through February 15, 2009. From February 16, 2009 through February 14, 2010, Mr. Spector’s annual salary was $527,875. Effective February 15, 2010, Mr. Spector’s annual salary was increased to $538,433. |
| (4) | Mr. Spengler’s annual salary was $335,000 from February 18, 2008 through February 15, 2009. From February 16, 2009 through February 14, 2010, Mr. Spengler’s annual salary was $350,000. Effective February 15, 2010, Mr. Spengler’s annual salary was increased to $357,000. |
| (5) | Mr. Guillemin’s annual salary was $275,000 from February 18, 2008 through February 15, 2009. From February 16, 2009 through February 14, 2010, Mr. Guillemin’s annual salary was $295,625. Effective February 15, 2010, Mr. Guillemin’s annual salary was increased to $307,450. |
| (6) | Mr. Spengler received this amount of retention bonus in connection with a retention bonus program implemented at the time of the New Sponsors Acquisition. |
| (7) | Messrs. McGlade, McDonnell, Spector, Spengler and Guillemin each received a grant of stock awards in 2009 with a combination of time vesting and performance vesting. These amounts reflect the assumption that all time and performance vesting criteria will ultimately be met and a fair value on grant date of $10.73 per share. The assumptions used in determining the fair value of the shares are set forth in Note 5 to the consolidated financial statements. |
| (8) | Messrs. McGlade, Spector, Spengler and Guillemin each received payments in 2008 as a result of the disposition of their shares as part of the New Sponsors Acquisition. These payments were with respect to restricted share awards granted in 2005. The cash payments received were $81,191,359, $35,871,919, $6,847,952 and $1,283,971, respectively. |
| (9) | Messrs. McGlade, McDonnell, Spector, Spengler and Guillemin each received an award of options in 2009, all of which become vested upon the achievement of certain annual and investment return performance standards. The table assumes that the portion of the award which vests upon achievement of financial targets in 2010 have vested; however, the table also assumes that the annual performance targets beyond 2010 and the exit investment target are not achieved, as we cannot say that such future performance is “probable” of outcome. However, even assuming that the highest level of performance criteria is achieved, the value at grant date was “0” based upon the intrinsic value of the option at grant date under fair value determination computed in accordance with FASB ASC 718. |
95
Table of Contents
| (10) | Payments for 2009 were based on performance criteria established at the beginning of 2009 in accordance with the Bonus Plan described above. We met each of the targeted performance criteria, plus first tier and second tier stretch levels for each metric established as part of the Bonus Plan for the year ended December 31, 2009. As a result of meeting these targets, performance incentive payments were made in accordance with the terms of the Bonus Plan and applicable executive employment agreements. Payments were approved by the Compensation Committee and paid in March 2010. |
| (11) | Mr. Guillemin participated in the Company’s Pension Plan and Restoration Plan, as described below in the Pension Benefits section of this Item 11. This amount reflects the change in the actuarial present value of his accrued benefit over the 12 month period from December 31, 2008 through December 31, 2009, using a discount rate of 5.88% for the fiscal year ended December 31, 2009 and a discount rate of 6.27% for the prior year’s calculation, and using an assumed retirement date of November 1, 2019 (age 60). No other NEO participates in the Pension Plan or the Restoration Plan. |
| (12) | This amount includes: (a) an auto/financial planning/club dues allowance of $20,000; (b) executive benefits paid for by the Company including tax gross up payments where applicable, in the amounts of $6,263 for life insurance, $2,124 ($774 of which was to cover taxes) for personal excess liability insurance, $2,931 ($1,397 of which was to cover taxes) for a comprehensive physical examination, and $960 for long-term disability insurance; (c) $300,000 in relocation expenses reimbursed pursuant to Mr. McGlade’s employment agreement; (d) $1,572,179 in payments made to cover the federal and state taxes on the income resulting from the grant of restricted shares during 2009; and (e) $26,950 in contributions to Mr. McGlade’s 401(k) plan account. |
| (13) | This amount includes: (a) an auto/financial planning/club dues allowance of $20,000; (b) executive benefits paid for by the Company including tax gross up payments where applicable, in the amounts of $2,557 for life insurance, $3,503 ($1,478 of which was to cover taxes) for personal excess liability insurance, $5,918 ($2,497 of which was to cover taxes) for a comprehensive physical examination, and $960 for long-term disability insurance; (c) $505,397 in payments made to cover the federal and state taxes on the income resulting from the grant of restricted shares during 2009; and (d) $26,950 in contributions to Mr. McDonnell’s 401(k) plan account. |
| (14) | This amount includes: (a) an auto/financial planning/club dues allowance of $20,000; (b) executive benefits paid for by the Company including tax gross up payments where applicable, in the amounts of $8,499 for life insurance, $2,124 ($774 of which was to cover taxes) for personal excess liability insurance, and $2,414 ($880 of which was to cover taxes) for a comprehensive physical examination; (c) $397,036 in payments made to cover the federal and state taxes on the income resulting from the grant of restricted shares during 2009; and (d) $26,950 in contributions to Mr. Spector’s 401(k) plan account. |
| (15) | This amount includes: (a) an auto allowance of $6,000; (b) executive benefits paid for by the Company including tax gross up payments where applicable, in the amounts of $2,427 for life insurance, $2,336 ($986 of which was to cover taxes) for personal excess liability insurance, and $3,687 ($1,344 of which was to cover taxes) for a comprehensive physical examination; (c) $296,426 in payments made to cover the federal and state taxes on the income resulting from the grant of restricted shares during 2009; and (d) $26,950 in contributions to Mr. Spengler’s 401(k) plan account. |
| (16) | This amount includes: (a) an auto allowance of $6,000; (b) executive benefits paid for by the Company including tax gross up payments where applicable, in the amounts of $2,041 for life insurance, $2,495 ($1,145 of which was to cover taxes) for personal excess liability insurance, and $880 for long-term disability insurance; (c) $223,904 in payments made to cover the federal and state taxes on the income resulting from the grant of restricted shares during 2009; and (d) $12,250 in contributions to Mr. Guillemin’s 401(k) plan account. |
96
Table of Contents
Grants of Plan-Based Awards
The following table sets forth information concerning the number and value of grants of stock plan-based awards to our NEOs during the year ended December 31, 2009.
| Name |
Grant Date | Estimated Possible Payouts Under Equity Incentive Plan Awards(1) |
Exercise or Base Price of Option Awards |
Grant Date Fair Value of Shares and Option Awards |
|||||||||||
| Threshold (#) | Target (#) | Maximum (#) | |||||||||||||
| David McGlade |
|||||||||||||||
| 5/6/2009 | 319,472 | — | $ | 3,427,935 | (2) | ||||||||||
| 5/6/2009 | 136,916 | 251,013 | $ | 100.00 | $ | — | (3) | ||||||||
| Michael McDonnell |
|||||||||||||||
| 5/6/2009 | 80,679 | $ | — | $ | 865,686 | (2) | |||||||||
| 5/6/2009 | 34,577 | 63,391 | $ | 100.00 | $ | — | (3) | ||||||||
| Phillip Spector |
|||||||||||||||
| 5/6/2009 | 80,679 | $ | — | $ | 865,686 | (2) | |||||||||
| 5/6/2009 | 34,577 | 63,391 | $ | 100.00 | $ | — | (3) | ||||||||
| Stephen Spengler |
|||||||||||||||
| 5/8/2009 | 47,320 | $ | — | $ | 507,744 | (2) | |||||||||
| 5/8/2009 | 20,280 | 37,180 | $ | 100.00 | $ | — | (4) | ||||||||
| Thierry Guillemin |
|||||||||||||||
| 5/8/2009 | 30,758 | $ | — | $ | 330,033 | (2) | |||||||||
| 5/8/2009 | 13,182 | 24,167 | $ | 100.00 | $ | — | (4) | ||||||||
| (1) | Each executive received grants of options and shares during 2009 as described in detail below in the equity award agreements narrative disclosure which may have future value depending upon the achievement of annual and exit performance targets and upon levels of investment return achieved by certain of our principal shareholders. Assuming that the performance targets are all met, and assuming a grant date fair value of $10.73 for shares and $0 for options, the estimated future payout value for Messrs. McGlade, McDonnell, Spector, Spengler and Guillemin are the same amounts reflected in the column titled “Grant Date Fair Value of Stock and Option Awards.” It should be noted that Intelsat Global is privately held and there is no public market for its securities. Accordingly, we have used management’s estimate of the fair value of the shares, relying in part on the most recent independent valuation performed as of the grant date. |
| (2) | These awards represent restricted shares of Class B common stock issued in connection with the New Sponsors Acquisition. The fair value of the Class B shares was $10.73 on grant date. Additional details of the awards are set forth in the equity award agreements narrative below and additional details about the fair value determination are set forth in Note 5 to the consolidated financial statements. |
| (3) | These awards represent options to purchase Class A common stock issued in connection with the New Sponsors Acquisition. Additional details of the awards are set forth in the equity award agreements narrative below and additional details about the fair value determination are set forth in Note 5 to the consolidated financial statements. |
| (4) | These awards represent share-based compensation arrangements issued in connection with the New Sponsors Acquisition. No grant date has been established under the provisions of FASB ASC 718 and accordingly there is no fair value associated with the stock award. Additional details of the awards are set forth in the equity award agreements narrative and additional details about the fair value determination are set forth in Note 5 to the consolidated financial statements. |
97
Table of Contents
Employment and Other Agreements
Messrs. McGlade, McDonnell and Spector each are employed with the Company pursuant to employment agreements with Intelsat Global, Ltd. and Intelsat, Ltd. On December 21, 2009, in connection with the migration of Intelsat Global and certain of our other companies to Luxembourg, these employment agreements were assigned to Intelsat Management LLC, a direct subsidiary of Intelsat S.A. and the company by which they are now employed.
Pursuant to the employment agreement, Mr. McGlade serves as Deputy Chairman of the Board of Directors and Chief Executive Officer. Mr. McDonnell serves as Executive Vice President and Chief Financial Officer and Mr. Spector serves as Executive Vice President and General Counsel of the Company.
Messrs. Spengler and Guillemin are not party to employment agreements with the Company, however, the Company does have certain severance and other obligations to them pursuant to Company policies and each has a letter agreement covering the payment of severance benefits in the event of certain termination circumstances.
Each of the NEOs is a party to agreements governing the terms of his restricted share awards and option/SCA awards. Details of the agreements in place for 2009 for each of the NEOs appear below.
Employment Agreements with Messrs. McGlade, McDonnell and Spector
McGlade Employment Agreement. On December 29, 2008, Mr. McGlade entered into a new employment agreement with Intelsat Global and the Company, effective as of February 4, 2008, and as amended on May 6, 2009 (the “McGlade Employment Agreement”). The McGlade Employment Agreement provides for Mr. McGlade’s continued employment as Chief Executive Officer of each of Intelsat Global and the Company, his continued service as a member of the board of directors of each of Intelsat Global and the Company, and his nomination for reelection as a member of the board of directors of each of Intelsat Global and the Company at the expiration of the then current term. The McGlade Employment Agreement supersedes the terms and conditions of his prior employment agreement.
McDonnell Employment Agreement. On May 6, 2009, Mr. McDonnell entered into an employment agreement with Intelsat Global and the Company (the “McDonnell Employment Agreement”). The McDonnell Employment Agreement provides for Mr. McDonnell’s continued employment as Executive Vice President and Chief Financial Officer of each of Intelsat Global and the Company. The McDonnell Employment Agreement supersedes the terms and conditions of the offer letter between Mr. McDonnell and the Company.
Spector Employment Agreement. On May 6, 2009, Mr. Spector entered into an employment agreement with Intelsat Global and the Company (the “Spector Employment Agreement”). The Spector Employment Agreement provides for Mr. Spector’s continued employment as Executive Vice President and General Counsel of each of Intelsat Global and the Company. The Spector Employment Agreement supersedes the terms and conditions of his prior employment agreement.
Compensation and Benefits. The McGlade, McDonnell and Spector Employment Agreements each has a term of one year and renews automatically for successive one year periods, unless earlier terminated. The McGlade Employment Agreement provides that Mr. McGlade will be paid an annual base salary of no less than $1,000,000 during the term, which will be reviewed for increase no less frequently than annually. The McDonnell and Spector Employment Agreements provide that Messrs. McDonnell and Spector will each be paid an annual base salary of no less than $527,875 during the term, which will be reviewed for increase no less frequently than annually.
The McGlade Employment Agreement also provides that Mr. McGlade will be eligible for (i) a basic annual bonus of 100% of annual base salary, based on meeting pre-established performance criteria, and (ii) two
98
Table of Contents
additional annual bonuses, the “stretch” bonus and “super stretch” bonus, each of 50% of annual base salary and each based on meeting incrementally more difficult to achieve pre-established performance criteria. In exchange for Mr. McGlade’s waiver of any relocation reimbursement commitments set forth in his prior employment agreement, the Company paid Mr. McGlade consideration in the amount of $300,000.
The McDonnell and Spector Employment Agreements also provide that Messrs. McDonnell and Spector will be eligible for (i) a basic annual bonus of 65% of annual base salary, based on meeting pre-established performance criteria, and (ii) two additional annual bonuses, the “stretch” bonus at 50% of base salary and the “super stretch” bonus at 15% of annual base salary and each based on meeting incrementally more difficult to achieve pre-established performance criteria.
During the employment term, Messrs. McGlade, McDonnell and Spector will each be eligible to participate in the Company’s employee benefit plans and programs. The McGlade Employment Agreement and Spector Employment Agreement also provide for them to receive certain retiree medical benefits for the respective lifetimes of Mr. McGlade and Mr. Spector and their spouses under the Intelsat Group Welfare Benefits Plan.
The McGlade, McDonnell and Spector Employment Agreements also provide for the executives to receive certain perquisites as set forth therein and quantified in the Summary Compensation Table set forth above.
Severance Benefits. The McGlade, McDonnell and Spector Employment Agreements also provide for certain severance benefits to be paid to the executive in the event of employment termination under certain circumstances. Specifically, if the executive’s employment is terminated without cause or if he resigns for good reason (in either case as defined in the McGlade, McDonnell and Spector Employment Agreements) on or after January 1, 2009, subject to his timely execution and non-revocation of a waiver and release of claims and the executive’s continued compliance with the terms of the employment agreement, and except as otherwise required by law or by the terms of the Company’s benefit plans (excluding severance plans), the executive will be paid severance in an amount equal to a multiple of the sum of the executive’s (i) annual base salary plus (ii) the basic annual bonus and the stretch annual bonus (as in effect on the date of such termination of employment) (the “Target Bonus”), which severance amount shall be payable on the sixtieth day after such termination of employment. For purposes of calculating the severance benefit under this provision, the multiple is 1.5 for Mr. McGlade and 1.25 for Messrs. McDonnell and Spector.
In addition, in connection with a termination of the executive’s employment without cause or for good reason, and in the event of a termination of his employment by reason of his death or disability, the executive will be paid any earned but unpaid compensation and a pro-rata Target Bonus for the year of his termination of employment based on actual results and the portion of the fiscal year the executive was employed by the Company through the effective date of such termination of employment, payable in the calendar year following such termination of employment at such time bonuses are paid to the Company’s other senior executives. The McGlade, McDonnell and Spector Employment Agreements define good reason to include any of (i) a material diminution of title, position or responsibilities, (ii) a material breach by the Company of any terms of the applicable executive’s Employment Agreement; (iii) a reduction of the executive’s base salary or bonus potential, and (iv) under certain specified conditions, relocation or a requirement to work from a location other than the principal place of employment.
In the event that certain specified corporate transactions occur, and the affirmative written consent of certain shareholders or a representative thereof is not required for the Company to terminate the executive’s employment at the time of such termination, and the executive is terminated without cause or resigns for good reason (each as defined in the applicable McGlade, McDonnell or Spector Employment Agreement), then applicable vesting provisions of the executive’s equity award agreements shall apply as if a change in control (as defined in the applicable McGlade, McDonnell or Spector Employment Agreement) had occurred immediately prior to such termination of employment. If the affirmative written consent of certain shareholders or a representative thereof is required for the Company to terminate the executive’s employment at the time of such termination following
99
Table of Contents
such a corporate transaction, and the executive is terminated without cause or resigns for good reason on or after the date that is eighteen months following the date of such corporate transaction, then the applicable vesting provision of the executive’s equity award agreements shall apply as if a change in control had occurred immediately prior to such termination of employment.
Partial Gross Up Payment. In the event that excise tax under Section 4999 of the Internal Revenue Code of 1986, as amended (the “Code”), will be imposed on any compensation or benefits received by Messrs. McGlade, McDonnell or Spector, then, if (i) no shares of the Company are readily tradable on an established securities market or otherwise and (ii) the shareholders that controlled more than 75% of the voting power of the Company entitled to vote on February 4, 2008 no longer hold 75% of such voting power at the time such excise tax would be imposed, the Company shall pay the executive an additional payment (the “Partial Gross-Up Payment”) equal to the amount of the excise tax that will be imposed on such compensation or benefits; provided, that such Partial Gross-Up Payment will not include any additional payments for any federal, state or local income taxes imposed on such compensation or benefits or on the Partial Gross-Up Payment, including any excise tax imposed on the Partial Gross-Up Payment. In the event that excise tax under Section 4999 of the Code will be imposed on any compensation or benefits received by Messrs. McGlade, McDonnell or Spector and the Company’s shares are readily tradable on an established securities market or otherwise at such time, then the Company shall pay the executive an additional payment such that he will be placed in the same after-tax position that he would have been in had no excise tax been imposed.
Non-Competition. The McGlade, McDonnell and Spector Employment Agreements each provide that, during the executive’s employment with the Company and for one year after termination of his employment, whether voluntary or involuntary, the executive will not compete with the Company or its affiliates or hire or attempt to hire any person who is or was, during the year prior to the termination of his employment, an employee of the Company.
Employment Arrangements with Messrs. Spengler and Guillemin
Messrs. Spengler and Guillemin do not have employment agreements, but under the terms of the Company’s severance plans and agreements, in the event their employment is involuntarily terminated without cause, Messrs. Spengler and Guillemin are entitled to a severance benefit equal to nine months’ salary and eight months’ salary, respectively, and executive outplacement services. The severance benefits are contingent upon the executive signing a standard release of claims and a non-compete, non-solicitation and non-disparagement agreement. Cause is defined as willful misconduct or negligence in the performance of duties. Additionally, on May 8, 2009, Intelsat Global entered into letter agreements with Messrs. Spengler and Guillemin providing for an enhanced severance benefit under certain limited circumstances (the “Severance Agreements”). The Severance Agreements provide that in the event the executive is terminated without cause or resigns for good reason (in either case as defined in the Severance Agreement) following certain specified corporate transactions identified in the Severance Agreements, the executive will be paid an amount equal to one times base salary as in effect on the date of termination, payable in a lump sum on the sixtieth day after such termination of employment. The Severance Agreements will supersede each executive’s existing severance arrangements to the extent the Severance Agreements apply with respect to an executive’s termination of employment.
Equity Award Agreements
McGlade, McDonnell and Spector Awards. On May 6, 2009, Messrs. McGlade and Spector each entered into a Class A Restricted Share Agreement, a Class B Restricted Share Agreement and an Option Agreement and Mr. McDonnell entered into a Class B Restricted Share Agreement and an Option Agreement, each with Intelsat Global.
The Class A Restricted Share Agreements entered into with Messrs. McGlade and Spector govern the terms and conditions applicable to the executive’s outstanding restricted share awards under a previous plan that were
100
Table of Contents
unvested at the time of the New Sponsors Acquisition Transaction and were exchanged for restricted shares in the new corporate entity (“Rollover Shares”). These Rollover Shares are subject to vesting and forfeiture provisions. Subject to the executive’s continued employment, the Class A Shares subject to the Class A Restricted Share Agreement vest in twenty-four equal monthly installments on the last day of each month commencing February 29, 2008. The Class A Shares subject to the Class A Restricted Share Agreement shall automatically vest immediately prior to a change in control (as defined in the 2008 Share Plan) or if the executive dies or becomes disabled, his employment is terminated without cause or if he resigns for good reason (in either case as defined in the McGlade or Spector Employment Agreement, as applicable). The Class A Restricted Share Agreement also provides that in the event of the executive’s termination of employment, Intelsat Global may repurchase the shares subject to the agreement generally for fair market value, unless the termination is for cause. If the executive is terminated for cause, the shares may be repurchased for the executive’s purchase price or the per share fair market value of the Class A Shares as of February 4, 2008. The Class A Restricted Share Agreements govern 158,810.45 Rollover Shares for Mr. McGlade and 70,165.54 Rollover Shares for Mr. Spector.
The Class B Restricted Share Agreements entered into with Messrs. McGlade, McDonnell and Spector govern the terms and conditions applicable to the Class B Shares issued to each executive as of May 6, 2009. A portion of the Class B Shares subject to the Class B Restricted Share Agreement are subject to time vesting (“Class B Time-Vesting Shares”) and a portion of the Class B Shares are subject to annual performance-based vesting upon the achievement of certain adjusted EBITDA and revenue goals for fiscal years 2008 and 2009 (“Class B Performance Shares”).
Mr. McGlade was awarded 319,472 Class B Shares, with 228,194 designated as Class B Time-Vesting Shares and the remaining 91,278 designated as Class B Performance Shares. Of the 228,194 Class B Time-Vesting Shares issued to Mr. McGlade, 25% were vested on the date of grant and the remaining shares vest in equal installments over 45 months from the date of grant, commencing on June 4, 2009. Mr. McDonnell was awarded 80,679 Class B Shares, with 57,628 designated as Class B Time-Vesting Shares and the remaining 23,051designated as Class B Performance Shares. Of the 57,628 Class B Time-Vesting Shares issued to Mr. McDonnell, 10% were vested on the date of grant and the remaining shares vest in equal installments over 54 months from the date of grant, commencing on June 4, 2009. Mr. Spector was awarded 80,679 Class B Shares, with 57,628 designated as Class B Time-Vesting Shares and the remaining 23,051 designated as Class B Performance Shares. Of the 57,628 Class B Time-Vesting Shares issued to Mr. Spector, 25% were vested on the date of grant and the remaining shares vest in equal installments over 45 months from the date of grant, commencing on June 4, 2009.
In the event of a change in control, as defined in the 2008 Share Plan, the Class B Time-Vesting Shares become fully vested, and the Class B Performance Shares vest if certain principal shareholders receive a three times multiple on their investment (four times if the change in control occurs after February 4, 2015). In the event the executive dies or becomes disabled, the Class B Time-Vesting Shares become fully vested and the Class B Performance Shares cease vesting and unvested shares are forfeited, unless, within six months following such termination, an initial public offering occurs or Intelsat Global enters into a definitive agreement resulting in a change in control, in which case the unvested shares will be eligible to become vested as if a change in control had occurred immediately prior to termination (“Transaction Vesting Protection”). In the event the executive is terminated without cause or resigns for good reason (in either case as defined in the executive’s Employment Agreement), the Transaction Vesting Protection applies to both the Class B Time-Vesting and Class B Performance Shares, and if such termination occurs after July 31, 2010 (April 30, 2011 for Mr. McDonnell), 50% of the unvested Class B Time-Vesting Shares vest. The Class B Restricted Share Agreements for Messrs. McGlade, McDonnell and Spector provide for similar repurchase rights for Intelsat Global as are set forth in the executive’s Class A Restricted Share Agreement, provided, however, that the repurchase price is generally a liquidation fair market value. In the event the executive breaches any covenants contained in the executive’s Employment Agreement, he will be required to repay Intelsat Global for all the Class B Shares which vested during the twelve months preceding the breach of the covenants.
101
Table of Contents
The Option Agreements entered into with Messrs. McGlade, McDonnell and Spector govern the terms and conditions applicable to options to purchase Class A Shares granted to each executive as of May 6, 2009. The exercise price of each option is $100 per share. Each option is subject to performance vesting. Each option will vest with respect to a portion of the Class A Shares (the “Annual Performance Options”) based upon the achievement of certain adjusted EBITDA and revenue goals for 2010, 2011 and 2012 (and 2013 with respect to Mr. McDonnell), as defined in the Option Agreement, subject to catch-up vesting upon achievement of targets in later years or if certain principal shareholders of Intelsat Global receive a three times multiple on their investment (four times if the change in control occurs after February 4, 2015) in connection with a change in control. Upon the occurrence of a change in control or other realization event for certain specified shareholders, the option will vest ratably with respect to the remaining Class A Shares (the “Exit Performance Option”) based upon a sliding scale of return on their investment from 3.3 times to 4.1 times. The option generally expires on the earliest to occur of: (i) February 4, 2018, (ii) 90 days following resignation without good reason, (iii) one year following termination without cause or for good reason or upon death or disability, or (iv) the date of termination for cause. The option is subject to Transaction Vesting Protection following a termination due to death or disability, a termination without cause, or a resignation for good reason. Additionally, in the event that the executive is terminated without cause or resigns for good reason following certain specified corporate transactions, the option will vest as if a change in control had occurred immediately prior to termination. The Class A Shares acquired upon exercise of the options are subject to Intelsat Global repurchase rights similar to the rights specified in the executives’ Class A Restricted Share Agreements. In the event the executive breaches any covenants contained in the executive’s Employment Agreement, he will be required to repay Intelsat Global an amount equal to the number of shares acquired pursuant to the option during the twelve months preceding the breach of the covenants multiplied by the excess of the fair market value of the shares over the exercise price paid.
Mr. McGlade was awarded options to purchase 251,013 Class A Shares, with 136,916 designated as Annual Performance Options and the remaining 114,097 designated as Exit Performance Options. Mr. McDonnell was awarded options to purchase 63,391 Class A Shares, with 34,577 designated as Annual Performance Options and the remaining 28,814 designated as Exit Performance Options. Mr. Spector was awarded options to purchase 63,391 Class A Shares, with 34,577 designated as Annual Performance Options and the remaining 28,814 designated as Exit Performance Options.
Spengler and Guillemin Awards. On May 8, 2009, Intelsat Global entered into Class A Restricted Share Agreements, Class B Restricted Share Agreements and Option Agreements with each of Messrs. Spengler and Guillemin.
The Class A Restricted Share Agreements govern the terms and conditions applicable to Rollover Shares, consisting of the Class A Shares issued to Messrs. Spengler and Guillemin as of February 4, 2008 in exchange for a previous equity award. Mr. Spengler’s Class A Restricted Share Agreement covers 16,237.41 Class A Shares and Mr. Guillemin’s Class A Restricted Share Agreement covers 3,044.47 Class A Shares. The shares are subject to vesting and forfeiture provisions. Subject to each of their continued employment, the Class A Shares subject to the Class A Restricted Share Agreements vest in twenty-three equal monthly installments on the first day of each month commencing on March 1, 2008. The Class A Shares subject to the Class A Restricted Share Agreement shall automatically vest immediately prior to a change in control (as defined in the 2008 Share Plan), provided that no such acceleration of vesting shall occur to the extent that it would result in payments that are not fully deductible to the Company as a result of Section 280G of the Code. If either Mr. Spengler or Mr. Guillemin dies or becomes disabled, the unvested Class A Shares subject to the Class A Restricted Share Agreement shall automatically vest. In the event that either Mr. Spengler or Mr. Guillemin is terminated without cause following certain specified corporate transactions, his respective Class A Shares will vest as if a change in control had occurred immediately prior to such termination. The Class A Restricted Share Agreements also provide that in the event of the holder’s termination of employment, Intelsat Global may repurchase the shares subject to the agreement generally for fair market value, unless the termination is for cause. If either Mr. Spengler or Mr. Guillemin is terminated for cause, his shares may be repurchased at a price per share equal to par value.
102
Table of Contents
The Class B Restricted Share Agreements govern the terms and conditions applicable to the Class B Shares issued to Messrs. Spengler and Guillemin as of May 8, 2009. Mr. Spengler’s Class B Restricted Share Agreement covers 47,320 Class B Shares of which 33,800 are designated as Class B Time-Vesting Shares and the remaining 13,520 are designated as Class B Performance Shares. Mr. Guillemin’s Class B Restricted Share Agreement covers 30,758 Class B Shares of which 21,970 are designated as Class B Time-Vesting Shares and the remaining 8,788 are designated as Class B Performance Shares. With respect to the Class B Time-Vesting Shares issued to each of Messrs. Spengler and Guillemin, 25% of the shares vested as of the date of grant and the remaining shares vesting in equal installments over 45 months from the date of grant, commencing on June 4, 2009.
In the event of a change in control, as defined in the award agreements, the Class B Time-Vesting Shares issued to Messrs. Spengler and Guillemin become fully vested, and their Class B Performance Shares vest if certain principal shareholders of Intelsat Global receive a three times multiple on their investment (four times if the change in control occurs after February 4, 2015). In the event that either Mr. Spengler or Mr. Guillemin is terminated without cause, as defined in the 2008 Share Plan, resigns for any reason, dies or becomes disabled, his Class B Time-Vesting Shares and Class B Performance Shares cease vesting and all unvested shares are forfeited.
In the event that either Mr. Spengler or Mr. Guillemin is terminated without cause or resigns for good reason (as defined in the Class B Restricted Share Agreement) following certain specified corporate transactions, his respective Class B Time-Vesting Shares and Class B Performance Shares will vest as if a change in control had occurred immediately prior to such termination. The Class B Restricted Share Agreements also provide that in the event of the holder’s termination of employment without cause or for good reason, Intelsat Global may repurchase the shares subject to the agreement generally for a liquidation fair market value, unless the termination is for cause. If the termination is for cause, the shares may be repurchased at a price per share equal to par value. The Class B Restricted Share Agreements also contain covenants generally restricting Messrs. Spengler and Guillemin from competing against Intelsat Global for a period of one year following termination. In the event of a breach of this covenant, or any other applicable covenants, the executive will be required to repay Intelsat Global for all the Class B Shares which vested during the twenty-four months preceding the breach of the covenants.
The Option Agreements govern the terms and conditions applicable to options to purchase Class A Shares granted to Messrs. Spengler and Guillemin as of May 8, 2009. Mr. Spengler was awarded an option to purchase 37,180 Class A Shares, with 20,280 designated as Annual Performance Options and the remaining 16,900 designated as Exit Performance Options. Mr. Guillemin was awarded an option to purchase 24,167 Class A Shares, with 13,182 designated as Annual Performance Options and the remaining 10,985 designated as Exit Performance Options. The exercise price of each option is $100 per share. The options are subject to performance vesting as set forth above for the other executives’ Annual Performance Options and Exit Performance Options. The options generally expire on the earliest to occur of: (i) February 4, 2018, (ii) 90 days following termination of employment, other than as a result of death or disability, (iii) one year following termination upon death or disability, and (iv) the date of termination for cause. In the event that either Mr. Spengler or Mr. Guillemin is terminated without cause or resigns for good reason following certain specified corporate transactions, his respective options will vest as if a change in control had occurred immediately prior to such termination. The Class A Shares acquired upon exercise of the options are subject to repurchase rights similar to the rights specified in the Class A Restricted Share Agreements. The Option Agreements contain similar covenants as the Class B Restricted Share Agreements. In the event of a breach of any of the covenants contained in the Option Agreements, or any other applicable covenants, the individual will be required to repay Intelsat Global an amount equal to the number of shares acquired pursuant to the option during the twenty-four months preceding the breach of the covenants multiplied by the excess of the fair market value of the shares over the exercise price paid.
Management Shareholders Agreement. Each recipient of an equity award is, or prior to the exercise of any options, will become, a party to that certain Management Shareholders Agreement, entered into on May 6,
103
Table of Contents
2009 and effective as of February 4, 2008, by and among Intelsat Global, the principal shareholders of Intelsat Global and all employees (the “Management Shareholders”) who hold Class A Shares or Class B Shares (the “Management Shareholders Agreement”). The Management Shareholders Agreement governs the terms and conditions of a Management Shareholder’s ownership of Class A Shares and Class B Shares and applies to each Management Shareholder and any person or entity to whom the Management Shareholder’s shares are transferred (whether voluntarily or involuntarily).
In general, the Management Shareholders Agreement prevents Management Shareholders from transferring any Class A Shares or Class B Shares without the consent of the Board of Directors of Intelsat Global. If the Board approves any such transfer, certain shareholders have a right of first offer to purchase the shares proposed to be transferred. Notwithstanding the general prohibition on transferring shares, Management Shareholders may be permitted to transfer shares pursuant to “tag along” and “drag along” rights set forth in the Management Shareholders Agreement.
In addition, the Management Shareholders Agreement permits certain principal shareholders to repurchase Class A Shares and/or Class B shares from a Management Shareholder following the Management Shareholder’s termination of employment if Intelsat Global does not repurchase such shares pursuant to the applicable award agreement. The Management Shareholders Agreement also provides “priority subscription” rights. If certain principal shareholders purchase additional shares, the priority subscription rights allow Management Shareholders to purchase additional shares on the same terms as the sponsor shareholders.
The Management Shareholders Agreement terminates upon an initial public offering (generally defined as a public offering of at least 20% of outstanding shares of Intelsat Global), the liquidation of Intelsat Global or sale of all or substantially all of Intelsat Global’s assets, or a date established by the Board to terminate the Management Shareholders Agreement. In addition, the Management Shareholders Agreement may terminate at specified times following Intelsat Global’s merger with a public company.
Each of Messrs. McGlade, Spector, and McDonnell have entered into letter agreements (the “MSA Letter Agreements”) amending the Management Shareholders Agreement as it applies to the shares held by such executives. The MSA Letter Agreements generally provide for “piggy back registration rights,” additional option grants upon certain conversions of Class B Shares, and limits on Intelsat Global’s ability to repurchase co-invest Class A Shares purchased by certain of the executives pursuant to subscription agreements if the fair market value is less than the original purchase price per share for such shares.
104
Table of Contents
Outstanding Equity Awards at Fiscal Year-End
The following table sets forth certain information concerning the number and value of any outstanding unvested restricted share awards and unexercised options held by the NEOs at December 31, 2009. There was no public market for Intelsat Global’s common stock as of December 31, 2009.
| Option Awards | Stock Awards | ||||||||||||
| Name |
Equity Incentive Plan Awards: Number of Securities Underlying Unexercised Unearned Options |
Option Exercise Price |
Option Expiration Date |
Number of Shares or Units of Stock That Have Not Vested |
Market Value of Shares or Units of Stock That Have Not Vested |
||||||||
| David McGlade |
251,013 | $ | 100.00 | 5/6/2019 | (1) | ||||||||
| 6,617 | $ | 807,689 | (2) | ||||||||||
| 190,162 | $ | 8,450,794 | (3) | ||||||||||
| Michael McDonnell |
63,391 | $ | 100.00 | 5/6/2019 | (1) | ||||||||
| 65,312 | $ | 2,902,461 | (3) | ||||||||||
| Phillip Spector |
63,391 | $ | 100.00 | 5/6/2019 | (1) | ||||||||
| 2,924 | $ | 356,862 | (2) | ||||||||||
| 48,023 | $ | 2,134,151 | (3) | ||||||||||
| Stephen Spengler |
37,180 | $ | 100.00 | 5/8/2019 | (1) | ||||||||
| 706 | $ | 86,183 | (2) | ||||||||||
| 28,167 | $ | 1,251,728 | (3) | ||||||||||
| Thierry Guillemin |
24,167 | $ | 100.00 | 5/8/2019 | (1) | ||||||||
| 132 | $ | 16,152 | (2) | ||||||||||
| 18,308 | $ | 813,621 | (3) | ||||||||||
| (1) | The vesting date for the option awards is annually on the date the board of directors approves the audited financial statements of 2011, 2012 and 2013 for the Annual Performance Options, contingent upon meeting performance targets, and upon certain realization events for certain principal shareholders with respect to the Exit Performance Options as described more fully in the narrative under equity award agreements. |
| (2) | These awards are for Class A Shares of Intelsat Global. Because Intelsat Global is privately held, there is no public market for these securities. The market value provided here was based upon management’s estimate of fair value, relying in part on the most recent independent valuation performed, dated as of December 31, 2009, which set forth a Class A Share value of $122.06 per share. These are Rollover Shares which vest for Messrs. McGlade and Spector as of January 31, 2010 and for Messrs. Spengler and Guillemin as of January 1, 2010. |
| (3) | This award is for Class B Shares of Intelsat Global. The market value reflected here is based upon management’s estimate of fair value, relying in part on the most recent independent valuation performed, dated as of December 31, 2009, which set forth a Class B Share value of $44.44 per share. The vesting date for the Class B Time-Vesting Shares is monthly, with full vesting occurring for Messrs. McGlade, Spector, Spengler and Guillemin on February 4, 2013 and for Mr. McDonnell on November 4, 2013. The vesting date for the Performance Shares was determined as of March 3, 2010, and the performance targets as described more fully in the narrative under equity award agreements were met. |
105
Table of Contents
Option Exercises and Stock Vested
The following table sets forth certain information regarding the number of restricted shares and options that vested in 2009, together with the corresponding amounts realized by the NEOs.
| Name |
Option Awards | Stock Awards | ||||||||
| Number of Shares Acquired on Exercise |
Value Realized on Exercise |
Number of Shares Acquired on Vesting |
Value Realized on Vesting |
|||||||
| David McGlade |
— | — | (1) | |||||||
| 79,405 | $ | 9,692,202 | (2) | |||||||
| 129,310 | $ | 5,746,541 | (3) | |||||||
| Michael McDonnell |
— | — | (1) | |||||||
| 15,367 | $ | 682,913 | (3) | |||||||
| Phillip Spector |
— | — | (1) | |||||||
| 35,083 | $ | 4,282,203 | (2) | |||||||
| 32,656 | $ | 1,451,223 | (3) | |||||||
| Stephen Spengler |
— | — | (1) | |||||||
| 8,472 | $ | 1,034,054 | (2) | |||||||
| 19,153 | $ | 851,173 | (3) | |||||||
| Thierry Guillemin |
— | — | (1) | |||||||
| 1,588 | $ | 193,883 | (2) | |||||||
| 12,450 | $ | 553,264 | (3) | |||||||
| (1) | There were no options exercised during 2009 by the NEOs. |
| (2) | Because Intelsat Global is privately held, there is no public market for these securities. The value realized on vesting provided here is based upon management’s estimate of the fair value, relying in part on the most recent independent valuation performed, dated as of December 31, 2009. This reflects a grant of Class A Shares and the realized value is based on a Class A Share value of $122.06 per share. |
| (3) | This award is for Class B Shares. The value realized on vesting provided here is based on management’s estimate of the fair value, relying in part on the most recent independent valuation performed, dated as of December 31, 2009, which set forth a Class B Share value of $44.44 per share. |
Pension Benefits
The following table sets forth the actuarial present value of accumulated benefits for Mr. Guillemin, the only one of our NEOs who is eligible to participate in the pension plan of the Company.
| Name |
Plan Name | Number of Years of Credited Service |
Present Value of Accumulated Benefit |
Payments During the Last Fiscal Year | |||||
| Thierry Guillemin |
Intelsat Staff Retirement Plan | 10.1667 | $ | 226,106 | — | ||||
| Intelsat Restoration Plan | 9.9167 | $ | 16,329 | — | |||||
| Total |
$ | 242,435 | |||||||
The Intelsat Staff Retirement Plan is a tax-qualified defined benefit pension plan covering U.S.-based employees of Intelsat who were hired prior to July 19, 2001. The benefits under the plan are calculated based upon a set of formulas that take into account the participant’s hire date, years of service and average compensation. For Mr. Guillemin, the formula is 2.0% of final average earnings for each year of service prior to 2002, plus 1.5% of final average earnings for each year of service on or after 2002. Final average earnings for Mr. Guillemin includes regular earnings and does not include bonus payments, and is based on average earnings
106
Table of Contents
over the 60 months of employment that produces the highest average. Early retirement is available at age 55 with three years of service, and there is a seven year vesting schedule. The portion of Mr. Guillemin’s benefit attributable to pre-2002 service is payable on an unreduced basis at age 60. Benefit payments may be taken in the form of a single life annuity, a partially subsidized 60% or 75% joint and survivor annuity if married at the time of benefit commencement, a 50% or 100% joint and survivor annuity if unmarried at the time of benefit commencement, a lump sum or a reduced annuity plus a partial lump sum. Benefits paid in the form of an annuity are adjusted for cost of living increases but only on the portion of the benefit attributable to pre-2002 service and pre-2006 compensation. See Note 5 to the consolidated financial statements for additional disclosure on the assumptions used to value pension benefits.
As a tax-qualified plan, benefits under the Intelsat Staff Retirement Plan are subject to certain Code limitations on benefits and compensation. The Intelsat Restoration Plan is a non-qualified retirement plan that is intended to make participants “whole” if their benefit under the Intelsat Staff Retirement Plan is diminished due to limits on annual benefits under Section 415 of the Code or limits on includable compensation under Section 401(a)(17) of the Code. Effective on September 30, 2009, the Intelsat Restoration Plan was frozen and there are no benefit accruals under that plan after that date. Based on this freezing of accruals under the Intelsat Restoration Plan, the number of years of credited service reflected in the table for Mr. Guillemin is less than his actual years of service and reflects service through September 30, 2009.
Nonqualified Deferred Compensation
No deferred compensation programs are maintained for the Company’s NEOs.
Severance and Change of Control Arrangements
Upon termination of employment, the NEOs may receive payments under their employment agreements or Company policies, as applicable, which are described in detail in the section entitled Employment and Other Agreements.
107
Table of Contents
Benefits and Payments Upon Termination
The following is a table which shows, hypothetically, what each of the current NEOs would receive upon termination of employment under varying circumstances, assuming such termination occurred on December 31, 2009 and assuming that Intelsat Global repurchased equity at an assumed fair market value. However, this table does not take into account all of the restrictions and other provisions of relevant employment contracts described earlier. Thus, this table does not represent guarantees to any NEO that he will receive the amounts set forth herein.
| Name |
Resignation Without Good Reason |
Resignation With Good Reason or Involuntary Termination Without Cause |
Resignation With Good Reason or Involuntary Termination Without Cause Following a Change of Control |
Death or Disability |
Termination For Cause | ||||||||||||||
| David McGlade |
|||||||||||||||||||
| Accrued Salary and Vacation(1) |
$ | 146,964 | $ | 146,964 | $ | 146,964 | $ | 146,964 | $ | 146,964 | |||||||||
| Accrued Bonus(2) |
— | $ | 1,530,000 | (3) | $ | 1,530,000 | (3) | $ | 1,530,000 | (3) | — | ||||||||
| Severance |
— | $ | 3,825,000 | (4) | $ | 3,825,000 | (4) | — | — | ||||||||||
| Vested Shares and Options |
$ | 15,220,623 | (5) | $ | 22,236,985 | (6) | $ | 26,431,956 | (7) | $ | 25,425,160 | (8) | $ | 15,220,623 | |||||
| Unvested Shares and Options |
$ | 1,968 | (9) | $ | 1,902 | (9) | — | $ | 456 | (9) | $ | 1,968 | |||||||
| Medical Benefits(10) |
$ | 375,473 | $ | 375,473 | $ | 375,473 | $ | 375,473 | — | ||||||||||
| TOTAL |
$ | 15,745,028 | $ | 28,116,324 | $ | 32,309,393 | $ | 27,478,053 | $ | 15,369,555 | |||||||||
| Michael McDonnell |
|||||||||||||||||||
| Accrued Salary and Vacation(1) |
$ | 57,591 | $ | 57,591 | $ | 57,591 | $ | 57,591 | $ | 57,591 | |||||||||
| Accrued Bonus(2) |
— | $ | 607,056 | (3) | $ | 607,056 | (3) | $ | 607,056 | (3) | — | ||||||||
| Severance |
— | $ | 1,418,664 | (11) | $ | 1,418,664 | (11) | — | — | ||||||||||
| Vested Shares and Options |
$ | 154 | (5) | $ | 338,998 | (6) | $ | 1,779,779 | (7) | $ | 1,334,829 | (8) | $ | 154 | |||||
| Unvested Shares and Options |
$ | 653 | (9) | $ | 653 | (9) | — | $ | 29 | (9) | $ | 653 | |||||||
| TOTAL |
$ | 58,398 | $ | 2,422,962 | $ | 3,863,090 | $ | 1,999,505 | $ | 58,398 | |||||||||
| Phillip Spector |
|||||||||||||||||||
| Accrued Salary and Vacation(1) |
$ | 78,869 | $ | 78,869 | $ | 78,869 | $ | 78,869 | $ | 78,869 | |||||||||
| Accrued Bonus(2) |
— | $ | 607,056 | (3) | $ | 607,056 | (3) | $ | 607,056 | (3) | — | ||||||||
| Severance |
— | $ | 1,418,664 | (11) | $ | 1,418,664 | (11) | — | — | ||||||||||
| Vested Shares and Options |
$ | 6,724,515 | (5) | $ | 9,284,793 | (6) | $ | 10,344,185 | (7) | $ | 10,089,921 | (8) | $ | 6,724,515 | |||||
| Unvested Shares and Options |
$ | 509 | (9) | $ | 480 | (9) | — | (9) | $ | 115 | (9) | $ | 509 | ||||||
| Medical Benefits(10) |
$ | 243,679 | $ | 243,679 | $ | 243,679 | $ | 243,679 | — | ||||||||||
| TOTAL |
$ | 7,047,572 | $ | 11,633,541 | $ | 12,692,453 | $ | 11,019,640 | $ | 6,803,893 | |||||||||
| Stephen Spengler |
|||||||||||||||||||
| Accrued Salary and Vacation(1) |
$ | 52,500 | $ | 52,500 | $ | 52,500 | $ | 52,500 | $ | 52,500 | |||||||||
| Accrued Bonus(2) |
— | — | — | $ | 325,080 | (12) | — | ||||||||||||
| Severance |
— | $ | 262,500 | (13) | $ | 262,500 | (13) | — | — | ||||||||||
| Vested Shares and Options |
$ | 1,533,326 | (14) | $ | 2,318,277 | (15) | $ | 2,876,692 | (16) | $ | 2,404,460 | (17) | $ | 347 | |||||
| Unvested Shares and Options |
$ | 289 | (9) | $ | 289 | (9) | $ | 68 | (9) | $ | 68 | (9) | $ | 289 | |||||
| TOTAL |
$ | 1,586,115 | $ | 2,633,566 | $ | 3,191,760 | $ | 2,782,108 | $ | 53,136 | |||||||||
| Thierry Guillemin |
|||||||||||||||||||
| Accrued Salary and Vacation(1) |
$ | 35,904 | $ | 35,904 | $ | 35,904 | $ | 35,904 | $ | 35,904 | |||||||||
| Accrued Bonus(2) |
— | — | — | $ | 205,932 | (12) | — | ||||||||||||
| Severance |
— | $ | 197,083 | (18) | $ | 197,083 | (18) | — | — | ||||||||||
| Vested Shares and Options |
$ | 291,338 | (14) | $ | 630,096 | (15) | $ | 953,198 | (16) | $ | 646,248 | (17) | $ | 154 | |||||
| Unvested Shares and Options |
$ | 184 | (9) | $ | 184 | (9) | $ | 44 | (9) | $ | 44 | (9) | $ | 184 | |||||
| TOTAL |
$ | 327,426 | $ | 863,267 | $ | 1,186,229 | $ | 888,128 | $ | 36,242 | |||||||||
108
Table of Contents
| (1) | This reflects unpaid salary for days worked prior to termination and accrued but unpaid vacation as of December 31, 2009. |
| (2) | It is currently the policy under our Bonus Plan that no bonus payments are made to plan participants who leave prior to the bonus payment date in March, unless otherwise provided for in an applicable employment agreement. |
| (3) | Under the applicable executive’s Employment Agreement, he is entitled to a pro-rata bonus at the tier 1 stretch level for the year of termination based on actual results and the portion of the year he was employed. This amount assumes the maximum amount payable for a full year of employment and corporate results achieved at the tier 1 stretch level. |
| (4) | Severance payment equal to 1.5 times the sum of base salary plus bonus calculated at the tier 1 stretch level (150% of base salary), payable in a lump sum on the 60th day following termination. |
| (5) | Rollover Shares that are vested may be repurchased at any time during the two years following a resignation that occurs through July 31, 2010 at a price per share equal to the lesser of the fair market value of such share on (i) the date of resignation or (ii) February 4, 2008 ($100). For resignations that occur after July 31, 2010, the repurchase price is based on the fair market value of the share on the date of resignation. Management estimates, relying in part on the most recent independent valuation performed, that the fair market value of the Class A Shares as of December 31, 2009 was $122.06. Accordingly, the value assumes a repurchase by Intelsat Global of vested Rollover Shares for $100.00 per share. Class B shares that are vested may be repurchased at any time during the two years following a resignation that occurs through July 31, 2010 (April 30, 2011 for Mr. McDonnell) at a price per share equal to the lesser of the Class B repurchase price defined in the 2008 Share Plan (liquidation value) on (i) the date of resignation or (ii) May 6, 2009. For resignations that occur after July 31, 2010, the repurchase price is based on the Class B repurchase price on the date of resignation. Accordingly, because the Class B repurchase price at grant date was $0, no value has been given to any vested Class B shares, other than par value at $0.01 per share. |
| (6) | Rollover Shares that are unvested at the time of termination immediately vest upon termination. Vested Rollover Shares may be repurchased at any time during the two years following the termination at a price per share equal to the fair market value of the share on the date of termination. Based upon management’s estimate of the fair value, relying in part on the most recent independent valuation performed, the fair market value of the Class A Shares as of December 31, 2009 was $122.06 per share. Accordingly, the value assumes all unvested Rollover Shares vest and are repurchased by Intelsat Global at $122.06 per share. The equity award agreements for Messrs. McGlade and Spector also provide that in the event of a change of control or initial public offering within six months of the termination of employment where the share value exceeds $122.06, the executive is entitled to an additional payment equal to the number of vested shares times the excess of the higher share value over $122.06. Class B Shares that are vested may be repurchased at any time during the two-year period following termination at a price per share equal to Class B repurchase price defined in the 2008 Share Plan (liquidation value) on the date of termination. For purposes of this value, the Class B repurchase price was assumed to be $22.06 per share. |
| (7) | All Rollover Shares that are unvested immediately vest upon a change in control. Rollover Shares may be repurchased at any time during the two years following the termination at a price per share equal to the fair market value on the date of termination. This value is based on the Class A Share value of $122.06 per share. All unvested Class B Time-Vesting Shares immediately vest upon a change of control. Class B Performance Shares vest if performance criteria are met within six months from the date of the change in control. The value shown reflects 100% vesting on all Class B Time-Vesting and Performance Shares and assumes that the shares are repurchased at a Class B repurchase price of $22.06 per share. |
| (8) | All unvested Rollover Shares and Class B Time-Vesting Shares become immediately vested upon the termination of the executive’s employment due to death or disability. This value reflects a repurchase of Rollover Shares at $122.06 per share and a repurchase of vested Class B Shares at a Class B repurchase price of $22.06. |
| (9) | Any unvested shares are forfeited upon termination of employment, but must be repurchased at the par value of the shares ($0.01) and returned to the corporate treasury. |
| (10) | The McGlade and Spector Employment Agreements provide for Messrs. McGlade and Spector to receive retiree medical benefits for the executive and his spouse upon termination of employment. This represents the present value of Intelsat’s net premium cost, assuming a trend rate of 5% increases each year, immediate retirement on December 31, 2009, that each executive and each spouse live to age 80 and a discount rate of 6.3%. |
| (11) | Severance payment equal to 1.25 times the sum of base salary plus bonus calculated at the tier 1 stretch level (115% of base salary), payable in a lump sum on the 60th day following termination. |
| (12) | It is currently the policy under our Bonus Plan to provide a pro-rata bonus, based upon actual financial performance, pro-rated for the date of death or disability, for employees who die or become disabled during the fiscal year. This number assumes a date of death or disability on December 31, 2009, corporate performance at the stretch level and individual performance rated at the same level as the prior year. |
| (13) | Payment is equal to nine months’ base salary payable in a lump sum at termination. |
| (14) | Rollover Shares that are vested may be repurchased at any time following a resignation at a price per share equal to the lesser of the fair market value of such share on (i) the date of resignation or (ii) February 4, 2008 ($100). The assumed fair market value of the Class A Shares as of December 31, 2009 was $122.06. Accordingly, the value assumes a repurchase by the Company of vested Rollover Shares for $100.00 per share. Class B Time-Vesting Shares that are vested may be repurchased at any time following termination at a price per share equal to the lesser of the Class B repurchase price defined in the 2008 Share Plan (liquidation value) on (i) the date of resignation or (ii) May 8, 2009. Accordingly, because the Class B repurchase price at grant date was $0, no value has been given to any vested Class B shares, other than par value at $0.01 per share. |
| (15) | Rollover Shares that are vested at the time of termination may be repurchased at any time following the termination at a price per share equal to the fair market value of the share on the date of termination. The assumed fair market value of the Class A Shares as of December 31, 2009 was $122.06. Accordingly, the value assumes all unvested Rollover Shares vest and are repurchased by the Company at $122.06 per share. Class B Shares that are vested may be repurchased at any time during the two-year period following termination at a price per share equal to Class B repurchase price defined in the 2008 Share Plan (liquidation value) on the date of termination. For purposes of this value, the Class B repurchase price was assumed to be $22.06 per share. |
| (16) | All Rollover Shares that are unvested immediately vest upon a change in control. Rollover Shares may be repurchased at any time following the termination at a price per share equal to the fair market value on the date of termination. This value is based on the Class A Share value of $122.06 per share. All unvested Class B Time –Vesting Shares immediately vest upon a change of control. |
109
Table of Contents
| The value shown reflects 100% vesting on all Class B Time-Vesting and 50% vesting on Class B Performance Shares and assumes that the shares are repurchased at a Class B Repurchase price of $22.06 per share. |
| (17) | All unvested Rollover Shares become immediately vested upon the termination of the executive’s employment due to death or disability. This value reflects a repurchase of Rollover Shares at $122.06 per share and a repurchase of vested Class B Shares at a Class B repurchase price of $22.06 per share. |
| (18) | Payment is equal to eight months’ base salary payable in a lump sum at termination. |
Director Compensation
We do not compensate our directors for their service on the board of directors or any committee of the board of directors. Non-executive members of the board are reimbursed for travel and other out-of-pocket expenses related to their board service pursuant to a monitoring fee agreement entered into with certain principal shareholders on February 4, 2008. For more information regarding the monitoring fee agreements, see Item 13—Certain Relationships and Related Transactions, and Director Independence—Certain Relationships and Related Transactions—Monitoring Fee Agreements and Transaction Fees. Mr. Raymond Svider, a Managing Partner of BC Partners, Intelsat’s majority shareholder, is currently and has been since May 1, 2008, the Chairman of our Board of Directors.
Compensation Committee Report
The Compensation Committee has reviewed the Compensation Discussion and Analysis section above, referred to as the CD&A, with management and, based on this review and discussion, has recommended to our board of directors that the CD&A be included in this Annual Report on Form 10-K.
Raymond Svider (Chairman)
Egon Durban
110
Table of Contents
| Item 12. | Security Ownership of Certain Beneficial Owners and Management and Related Stockholder Matters |
Directors, Executive Officers and Principal Shareholders
Intelsat S.A. is an indirect, wholly-owned subsidiary of Intelsat Global. Shares of Intelsat Global are currently held by the New Sponsors and certain members of our management and other designated employees.
The members of Intelsat S.A.’s board of directors nominated by a New Sponsor may be deemed to beneficially own shares owned by such New Sponsors. The following table and accompanying footnotes show information regarding the beneficial ownership of Intelsat Global’s common shares by:
| • | each person known by us to beneficially own 5% or more of Intelsat Global’s outstanding common shares; |
| • | each of Intelsat Global’s and our directors; |
| • | each Named Executive Officer; and |
| • | all directors and executive officers as a group. |
The percentage of beneficial ownership set forth below is based on approximately 14,917,540.56 Intelsat Global Class A common shares and 900,249.00 Class B common shares issued and outstanding as of March 5, 2010. All Class A common and Class B common shares listed in the table below are entitled to one vote per share, unless otherwise indicated in the notes thereto. Unless otherwise indicated, the address of each person named in the table below is c/o Intelsat Global, S.A., 23, avenue Monterey, L-2086 Luxembourg.
| Name of Beneficial Owner: |
Number of Class A Common Shares Beneficially Owned(1) |
% of Class A Common Shares Beneficially Owned(1) |
Number of Class B Common Shares Beneficially Owned(1) |
% of Class B Common Shares Beneficially Owned(1) |
Number of All Voting Shares Beneficially Owned(1) |
% of All Voting Shares Beneficially Owned(1) |
|||||||||
| Funds advised by BC Partners(2) |
11,330,000.04 | 76.0 | % | — | — | 11,330,000.04 | 71.6 | % | |||||||
| Funds advised by Silver Lake Partners(3) |
2,489,976.25 | 16.7 | % | — | — | 2,489,976.25 | 15.7 | % | |||||||
| David McGlade(4) |
258,810.45 | 1.7 | % | 319,472.00 | 35.5 | % | 578,282.45 | 3.7 | % | ||||||
| Phillip Spector(5) |
90,165.54 | * | 80,679.00 | 9.0 | % | 170,844.54 | 1.1 | % | |||||||
| Michael McDonnell(6) |
* | * | 80,679.00 | 9.0 | % | * | * | ||||||||
| Stephen Spengler(7) |
* | * | 47,320.00 | 5.3 | % | * | * | ||||||||
| Thierry Guillemin(8) |
* | * | 30,758.00 | 3.4 | % | * | * | ||||||||
| Directors and Executive Officers as a Group (11 persons)(9) |
14,193,697.53 | 95.1 | % | 568,725.00 | 63.2 | % | 14,762,422.53 | 93.3 | % |
| * | Represents beneficial ownership of less than one percent of common shares outstanding. |
| (1) | The amounts and percentages of Intelsat Global’s common shares beneficially owned are reported on the basis of regulations of the SEC governing the determination of beneficial ownership of securities. Under the rules of the SEC, a person is deemed to be a “beneficial owner” of a security if that person has or shares “voting power,” which includes the power to vote or to direct the voting of such security, or “investment power,” which includes the power to dispose of or to direct the disposition of such security. A person is also deemed to be a beneficial owner of any securities of which that person has a right to acquire beneficial ownership within sixty days. Under these rules, more than one person may be deemed to be a beneficial owner of such securities as to which such person has an economic interest. |
| (2) | Represents shares held by BC European Capital VIII funds, BC European Capital—Intelsat Co-Investment and Intelsat Co-Investment 1 and BC European Capital—Intelsat Syndication L.P. |
111
Table of Contents
| (3) | Represents shares held by Silver Lake Partners III, L.P. and Silver Lake Technology Investors III, L.P. |
| (4) | Includes shares held by The David P. McGlade 2009 GRAT dated May 12, 2009 and The McGlade Family Trust dated January 2, 2009. Mr. McGlade exercises voting power over these shares, a portion of which are subject to vesting and other restrictions described in Item 11—Executive Compensation—Compensation Discussion and Analysis. |
| (5) | Includes shares held by The Phillip L. Spector Trust U/A dated 12/21/07, The Phillip L. Spector GRAT and The Phillip L. Spector GRAT#2. Mr. Spector exercises voting power over these shares, a portion of which are subject to vesting and other restrictions described in Item 11—Executive Compensation—Compensation Discussion and Analysis. |
| (6) | Mr. McDonnell exercises voting power over 80,679.00 Class B common shares, a portion of which are subject to vesting and other restrictions as described in Item 11—Executive Compensation—Compensation Discussion & Analysis. |
| (7) | Mr. Spengler exercises voting power over 16,237.41 Class A common shares and 47,320.00 Class B common shares, a portion of which are subject to vesting and other restrictions as described in Item 11—Executive Compensation—Compensation Discussion and Analysis. Mr. Spengler’s business address is 3400 International Drive, N.W., Washington, D.C. 20008. |
| (8) | Mr. Guillemin exercises voting power over 3,044.47 Class A common shares and 30,758.00 Class B common shares, a portion of which are subject to vesting and other restrictions as described in Item 11—Executive Compensation—Compensation Discussion and Analysis. Mr. Guillemin’s business address is 3400 International Drive, N.W., Washington, D.C. 20008. |
| (9) | Directors and executive officers as a group hold 248,257.87 restricted Class A common shares, 568,725.00 restricted Class B common shares and share-based compensation arrangements entitling them to purchase 5,463.37 Class A common shares that are exercisable within sixty days of March 5, 2010 under applicable vesting schedules. |
| Item 13. | Certain Relationships and Related Transactions, and Director Independence |
Certain Related Party Transactions
Monitoring Fee Agreements and Transaction Fees
In connection with the closing of the New Sponsors Acquisition Transactions, Intelsat Bermuda entered into a monitoring fee agreement (the “2008 MFA”) with the New Sponsors, or affiliates of, or entities advised by, designated by or associated with the New Sponsors, as the case may be (collectively, the “2008 MFA parties”), pursuant to which the 2008 MFA parties provide certain monitoring, advisory and consulting services to Intelsat Bermuda. Pursuant to the 2008 MFA, an annual fee equal to the greater of $6.25 million and 1.25% of adjusted EBITDA (as defined in the Senior Bridge Loan Credit Agreement) is paid to the 2008 MFA parties, and Intelsat Bermuda reimburses the 2008 MFA parties for their out-of-pocket expenses. Intelsat Bermuda also agreed to indemnify the 2008 MFA parties and their directors, officers, employees, agents and representatives for losses relating to the services contemplated by the 2008 MFA and the engagement of the 2008 MFA parties pursuant to, and the performance by them of the services contemplated by, the 2008 MFA. We recorded expense for services associated with the 2008 MFA of $8.5 million and $23.2 million during the successor period February 1, 2008 to December 31, 2008 and the year ended December 31, 2009, respectively.
As payment for certain structuring and advisory services rendered, Intelsat Bermuda paid an aggregate transaction and advisory fee of $60.0 million to the 2008 MFA parties at the closing of the New Sponsors Acquisition Transactions.
2008 Share Plan, Employment Agreements and Award Agreements
On May 6, 2009, the Board of Directors of Intelsat Global adopted the 2008 Share Plan, under which certain employees and directors are eligible to be granted awards. On May 6, 2009, Intelsat Global also entered into or amended employment agreements with Messrs. McGlade, Spector, and McDonnell, entered into agreements with
112
Table of Contents
Messrs. Spengler and Guillemin providing certain severance benefits, and entered into equity award agreements with Messrs. McGlade, Spector, McDonnell, Spengler and Guillemin. See Item 11—Executive Compensation—Employment and Other Agreements.
Subscription Agreements
On May 6, 2009, Intelsat Global entered into Subscription Agreements with certain trusts established for the benefit of Mr. McGlade and his family (the “McGlade Trust”) and the benefit of Mr. Spector and his family (the “Spector Trusts”), pursuant to which the McGlade Trust purchased 100,000 Class A common shares and the Spector Trusts purchased 20,000 Class A common shares of Intelsat Global for an aggregate purchase price of $10 million and $2 million, respectively.
WildBlue Option Agreement
On August 17, 2009 we entered into an agreement with WildBlue, in which we had an ownership interest of approximately 28% prior to December 15, 2009, granting WildBlue the exclusive option to acquire certain of our rights to operate a Ka-Band satellite system at a designated orbital location for $0.2 million. This amount is included in other income, net for the year ended December 31, 2009 in our consolidated statement of operations. On December 15, 2009 we sold our ownership interest in WildBlue to Viasat Inc. in exchange for newly issued shares of Viasat Inc. common stock. A gain on the sale was recorded within our consolidated statement of operations for $27.3 million for the year ended December 31, 2009.
Review and Approval of Related Party Transactions
We review all relationships and transactions in which we and our directors, executive officers or any beneficial owner of greater than 5% of Intelsat Global’s common shares or their immediate family members are participants to determine whether such persons have a direct or indirect material interest. Our legal staff is primarily responsible for the development and implementation of processes and controls to obtain information from our directors and executive officers with respect to related person transactions and for then determining, based on the facts and circumstances, whether we or a related person has a direct or indirect material interest in the transaction. As required under SEC rules, transactions that are determined to be directly or indirectly material to us or a related person are disclosed in this Annual Report on Form 10-K. Our audit committee charter also provides for the review of related party transactions by our audit committee.
In addition, we and our board of directors follow the requirements set forth in the transactions with affiliates covenant contained in our indentures and credit agreement. In summary, these agreements provide that we will not, and we will not permit any of our restricted subsidiaries to, directly or indirectly, make any payment to, or sell, lease, transfer or otherwise dispose of any of our properties or assets to, or purchase any property or assets from, or enter into or make or amend any transaction or series of transactions, contract, agreement, understanding, loan, advance or guarantee with or for the benefit of, any affiliate (as defined in the agreements) involving aggregate consideration in excess of specified thresholds, unless we determine that the terms of such transaction are not materially less favorable to such company than those that could have been obtained in a comparable transaction by such company with an unrelated person and that the terms of such transaction are substantially as favorable to such company as it would obtain in a comparable arm’s-length transaction with a person that is not an affiliate, subject to certain exceptions specified in such agreements. Copies of our indentures and credit agreement are on file with the SEC as exhibits to our periodic filings.
Director Independence
We are a privately held corporation. Under current rules of public trading markets, such as the NASDAQ and the New York Stock Exchange, none of our directors would be deemed to be “independent”, as each of them is either associated with the New Sponsors or is a member of our management.
113
Table of Contents
| Item 14. | Principal Accountant Fees and Services |
Audit Fees
Our audit fees for 2008 and 2009 were $4.9 million and $3.3 million, respectively.
Audit-Related Fees
Our audit-related fees for 2008 and 2009 were $1.0 million and $0.3 million, respectively. Our audit-related fees for 2009 included fees primarily related to the review of offering memoranda prepared in connection with the refinancing of our debt.
Tax Fees
None.
All Other Fees
None.
Audit Committee Pre-Approval Policies and Procedures
Consistent with SEC requirements regarding auditor independence, the audit committee has adopted a policy to pre-approve services to be provided by our independent registered public accounting firm prior to commencement of the specified service. The requests for pre-approval are submitted to the audit committee, or a designated member of the audit committee, by our Chief Financial Officer or Controller, and the audit committee chairman executes engagement letters from our independent registered public accounting firm following approval by audit committee members, or the designated member of the audit committee. All services performed by KPMG LLP during 2009 were pre-approved by the audit committee.
114
Table of Contents
PART IV
| Item 15. | Exhibits and Financial Statement Schedules |
(a)(1) The following financial statements are included in this Annual Report on Form 10-K:
| Page | ||
| F-2 | ||
| Consolidated Balance Sheets as of December 31, 2008 and 2009 |
F-3 | |
| F-4 | ||
| F-5 | ||
| F-6 | ||
| F-7 | ||
| (a)(2) The following financial statement schedule is included in this Annual Report on Form 10-K: |
||
| S-1 | ||
| (a)(3) List of Exhibits: The exhibits filed as part of this report are listed in the Exhibit Index. |
||
115
Table of Contents
Pursuant to the requirements of Section 13 or 15(d) of the Securities Exchange Act of 1934, the registrant has duly caused this report to be signed on its behalf by the undersigned, thereunto duly authorized.
| INTELSAT S.A. | ||
| By |
/s/ DAVID MCGLADE | |
| David McGlade | ||
| Chief Executive Officer | ||
Date: March 9, 2010
Pursuant to the requirements of the Securities Exchange Act of 1934, this report has been signed by the following persons on behalf of the registrant in the capacities and on the dates indicated.
| Signature |
Title |
Date | ||
| /S/ DAVID MCGLADE David McGlade |
Chief Executive Officer, Deputy Chairman and Director (Principal Executive Officer) |
March 9, 2010 | ||
| /s/ MICHAEL MCDONNELL Michael McDonnell |
Executive Vice President and Chief Financial Officer (Principal Financial Officer) |
March 9, 2010 | ||
| /S/ ANITA BEIER Anita Beier |
Senior Vice President and Controller, Intelsat Corporation (Principal Accounting Officer) |
March 9, 2010 | ||
| /s/ RAYMOND SVIDER Raymond Svider |
Chairman and Director |
March 9, 2010 | ||
| /S/ JUSTIN BATEMAN Justin Bateman |
Director |
March 9, 2010 | ||
| /S/ EGON DURBAN Egon Durban |
Director |
March 9, 2010 | ||
| /S/ JOHN JOYCE John Joyce |
Director |
March 9, 2010 | ||
| /S/ JAMES RUBIN James Rubin |
Director |
March 9, 2010 | ||
116
Table of Contents
Index to Consolidated Financial Statements
| Page | ||
| F-2 | ||
| Consolidated Balance Sheets as of December 31, 2008 and 2009 |
F-3 | |
| F-4 | ||
| F-5 | ||
| F-6 | ||
| F-7 | ||
| S-1 | ||
F-1
Table of Contents
Report of Independent Registered Public Accounting Firm
The Board of Directors and Shareholder
Intelsat S.A.
We have audited the consolidated financial statements of Intelsat S.A. and subsidiaries as listed in the accompanying index. In connection with our audits of the consolidated financial statements, we also have audited the financial statement schedule as listed in the accompanying index. These consolidated financial statements and financial statement schedule are the responsibility of the Company’s management. Our responsibility is to express an opinion on these consolidated financial statements and financial statement schedule based on our audits.
We conducted our audits in accordance with the standards of the Public Company Accounting Oversight Board (United States). Those standards require that we plan and perform the audit to obtain reasonable assurance about whether the financial statements are free of material misstatement. An audit includes examining, on a test basis, evidence supporting the amounts and disclosures in the financial statements. An audit also includes assessing the accounting principles used and significant estimates made by management, as well as evaluating the overall financial statement presentation. We believe that our audits provide a reasonable basis for our opinion.
In our opinion, the consolidated financial statements referred to above present fairly, in all material respects, the financial position of Intelsat S.A. and subsidiaries as of December 31, 2008 and 2009, and the results of their operations and their cash flows for the year ended December 31, 2007 (predecessor entity), the period January 1, 2008 to January 31, 2008 (predecessor entity), the period February 1, 2008 to December 31, 2008 (successor entity) and the year ended December 31, 2009 (successor entity), in conformity with U.S. generally accepted accounting principles. Also in our opinion, the related financial statement schedule, when considered in relation to the basic consolidated financial statements taken as a whole, presents fairly, in all material respects, the information set forth therein.
As discussed in Note 6 to the consolidated financial statements, the Company adopted Financial Accounting Standards No. 158, Employers’ Accounting for Defined Benefit Pension and Other Postretirement Plans, included in ASC Subtopic 715-20, Compensation—Retirement Benefits—Defined Benefit Plans—General, as of December 31, 2007.
/s/ KPMG LLP
McLean, Virginia
March 9, 2010
F-2
Table of Contents
CONSOLIDATED BALANCE SHEETS
(in thousands, except share amounts)
| As of December 31, 2008 |
As of December 31, 2009 |
|||||||
| ASSETS |
||||||||
| Current assets: |
||||||||
| Cash and cash equivalents |
$ | 470,211 | $ | 477,571 | ||||
| Receivables, net of allowance of $20,237 in 2008 and $20,517 in 2009 |
302,934 | 294,539 | ||||||
| Deferred income taxes |
48,623 | 50,643 | ||||||
| Prepaid expenses and other current assets |
56,883 | 33,561 | ||||||
| Total current assets |
878,651 | 856,314 | ||||||
| Satellites and other property and equipment, net |
5,339,671 | 5,781,955 | ||||||
| Goodwill |
6,774,334 | 6,780,827 | ||||||
| Non-amortizable intangible assets |
2,957,200 | 2,458,100 | ||||||
| Amortizable intangible assets, net |
1,124,275 | 978,599 | ||||||
| Other assets |
583,201 | 487,140 | ||||||
| Total assets |
$ | 17,657,332 | $ | 17,342,935 | ||||
| LIABILITIES AND SHAREHOLDER’S EQUITY (DEFICIT) |
||||||||
| Current liabilities: |
||||||||
| Accounts payable and accrued liabilities |
$ | 125,310 | $ | 157,519 | ||||
| Employee related liabilities |
49,184 | 48,882 | ||||||
| Accrued interest payable |
410,082 | 369,376 | ||||||
| Current portion of long-term debt |
99,358 | 97,689 | ||||||
| Deferred satellite performance incentives |
26,247 | 18,683 | ||||||
| Deferred revenue |
78,082 | 53,671 | ||||||
| Other current liabilities |
56,950 | 68,823 | ||||||
| Total current liabilities |
845,213 | 814,643 | ||||||
| Long-term debt, net of current portion |
14,773,975 | 15,223,010 | ||||||
| Deferred satellite performance incentives, net of current portion |
128,972 | 128,774 | ||||||
| Deferred revenue, net of current portion |
166,311 | 254,636 | ||||||
| Deferred income taxes |
562,742 | 548,719 | ||||||
| Accrued retirement benefits |
235,014 | 239,873 | ||||||
| Other long-term liabilities |
436,258 | 335,159 | ||||||
| Noncontrolling interest |
4,500 | 8,884 | ||||||
| Commitments and contingencies (Notes 15 and 16) |
||||||||
| Shareholder’s equity (deficit): |
||||||||
| Ordinary shares, $1.00 par value, 12,000 shares authorized, issued and outstanding at December 31, 2008; 100,000,000 shares authorized and 5,000,000 shares issued and outstanding at December 31, 2009 |
12 | 5,000 | ||||||
| Paid-in capital |
1,461,006 | 1,520,616 | ||||||
| Accumulated deficit |
(886,306 | ) | (1,667,998 | ) | ||||
| Accumulated other comprehensive loss |
(70,365 | ) | (68,381 | ) | ||||
| Total shareholder’s equity (deficit) |
504,347 | (210,763 | ) | |||||
| Total liabilities and shareholder’s equity (deficit) |
$ | 17,657,332 | $ | 17,342,935 | ||||
See accompanying notes to consolidated financial statements.
F-3
Table of Contents
CONSOLIDATED STATEMENTS OF OPERATIONS
(in thousands)
| Predecessor Entity | Successor Entity | |||||||||||||||||
| Year Ended December 31, 2007 |
Period January 1, 2008 to January 31, 2008 |
Period February 1, 2008 to December 31, 2008 |
Year Ended December 31, 2009 |
|||||||||||||||
| Revenue |
$ | 2,183,079 | $ | 190,261 | $ | 2,174,640 | $ | 2,513,039 | ||||||||||
| Operating expenses: |
||||||||||||||||||
| Direct costs of revenue (exclusive of depreciation and amortization) |
323,557 | 25,683 | 337,466 | 401,826 | ||||||||||||||
| Selling, general and administrative |
238,490 | 18,485 | 182,957 | 259,944 | ||||||||||||||
| Depreciation and amortization |
784,120 | 64,157 | 795,663 | 804,037 | ||||||||||||||
| Transaction costs |
9,258 | 313,102 | 1,926 | — | ||||||||||||||
| Impairment of asset value |
— | — | 390,444 | 499,100 | ||||||||||||||
| Losses on derivative financial instruments |
11,699 | 11,431 | 155,305 | 2,681 | ||||||||||||||
| Total operating expenses |
1,367,124 | 432,858 | 1,863,761 | 1,967,588 | ||||||||||||||
| Income (loss) from operations |
815,955 | (242,597 | ) | 310,879 | 545,451 | |||||||||||||
| Interest expense, net |
954,607 | 80,275 | 1,295,458 | 1,362,823 | ||||||||||||||
| Gain (loss) on early extinguishment of debt |
(38,143 | ) | — | 576 | 4,697 | |||||||||||||
| Other income (expense), net |
(137 | ) | 535 | (11,957 | ) | 42,013 | ||||||||||||
| Loss before income taxes |
(176,932 | ) | (322,337 | ) | (995,960 | ) | (770,662 | ) | ||||||||||
| Provision for (benefit from) income taxes |
14,957 | (10,476 | ) | (109,561 | ) | 11,399 | ||||||||||||
| Net loss |
(191,889 | ) | (311,861 | ) | (886,399 | ) | (782,061 | ) | ||||||||||
| Net loss attributable to noncontrolling interest |
— | — | 93 | 369 | ||||||||||||||
| Net loss attributable to Intelsat S.A. |
$ | (191,889 | ) | $ | (311,861 | ) | $ | (886,306 | ) | $ | (781,692 | ) | ||||||
See accompanying notes to consolidated financial statements.
F-4
Table of Contents
CONSOLIDATED STATEMENTS OF CHANGES IN SHAREHOLDER’S EQUITY (DEFICIT)
(in thousands, except share amounts)
| Ordinary | Paid-in Capital |
Accumulated Deficit |
Accumulated Other Comprehensive Income (Loss) |
Total Shareholder’s Equity (Deficit) |
Total Comprehensive Loss |
||||||||||||||||||||
| Shares | Amount | ||||||||||||||||||||||||
| Predecessor entity |
|||||||||||||||||||||||||
| Balance, January 1, 2007 |
12,000 | $ | 12 | $ | 29,746 | $ | (571,174 | ) | $ | 75 | $ | (541,341 | ) | ||||||||||||
| Cumulative effect of adoption of FIN 48 |
— | — | — | (498 | ) | — | (498 | ) | |||||||||||||||||
| Net loss |
— | — | — | (191,889 | ) | — | (191,889 | ) | $ | (191,889 | ) | ||||||||||||||
| Minimum pension liability, net of tax of ($1.1) million |
— | — | — | — | (1,870 | ) | (1,870 | ) | (1,870 | ) | |||||||||||||||
| Other comprehensive income |
— | — | — | — | 91 | 91 | 91 | ||||||||||||||||||
| Total comprehensive loss |
$ | (193,668 | ) | ||||||||||||||||||||||
| Adjustment to initially apply SFAS No. 158, net of tax of $4.2 million |
— | — | — | — | 7,778 | 7,778 | |||||||||||||||||||
| Liabilities assumed by parent |
— | — | 5,345 | — | — | 5,345 | |||||||||||||||||||
| Balance, December 31, 2007 |
12,000 | $ | 12 | $ | 35,091 | $ | (763,561 | ) | $ | 6,074 | $ | (722,384 | ) | ||||||||||||
| Adjustment to apply SFAS No. 158, net of tax of $0.2 million |
— | $ | — | $ | — | $ | (421 | ) | $ | — | $ | (421 | ) | ||||||||||||
| Net loss for the period January 1, 2008 to January 31, 2008 |
— | — | — | (311,861 | ) | — | (311,861 | ) | $ | (311,861 | ) | ||||||||||||||
| Liabilities assumed by parent |
— | — | 196,414 | — | — | 196,414 | |||||||||||||||||||
| Other comprehensive loss |
— | — | — | — | (293 | ) | (293 | ) | (293 | ) | |||||||||||||||
| Total comprehensive loss |
$ | (312,154 | ) | ||||||||||||||||||||||
| Balance, January 31, 2008 (prior to Acquisition Transactions) |
12,000 | $ | 12 | $ | 231,505 | $ | (1,075,843 | ) | $ | 5,781 | $ | (838,545 | ) | ||||||||||||
| Acquisition Transactions |
— | $ | — | $ | 1,221,755 | $ | 1,075,843 | $ | (5,781 | ) | $ | 2,291,817 | |||||||||||||
| Successor entity |
|||||||||||||||||||||||||
| Balance, February 1, 2008 |
12,000 | $ | 12 | $ | 1,453,260 | $ | — | $ | — | $ | 1,453,272 | ||||||||||||||
| Net loss for the period February 1, 2008 to December 31, 2008 |
— | — | — | (886,306 | ) | — | (886,306 | ) | $ | (886,306 | ) | ||||||||||||||
| Liabilities assumed by parent |
— | — | 7,746 | — | — | 7,746 | |||||||||||||||||||
| Postretirement/pension liability adjustment, net of tax of $39.2 million |
— | — | — | — | (67,744 | ) | (67,744 | ) | (67,744 | ) | |||||||||||||||
| Other comprehensive loss |
— | — | — | — | (2,621 | ) | (2,621 | ) | (2,621 | ) | |||||||||||||||
| Total comprehensive loss |
$ | (956,671 | ) | ||||||||||||||||||||||
| Balance, December 31, 2008 |
12,000 | $ | 12 | $ | 1,461,006 | $ | (886,306 | ) | $ | (70,365 | ) | $ | 504,347 | ||||||||||||
| Net loss for the year ended December 31, 2009 |
— | $ | — | $ | — | $ | (781,692 | ) | $ | — | $ | (781,692 | ) | $ | (781,692 | ) | |||||||||
| Liabilities assumed by parent and other contributed capital |
— | — | 56,965 | — | — | 56,965 | |||||||||||||||||||
| Change of Domicile: |
|||||||||||||||||||||||||
| Recapitalization of common shares |
4,988,000 | 4,988 | — | — | — | 4,988 | |||||||||||||||||||
| Contribution surplus |
— | — | 7,012 | — | — | 7,012 | |||||||||||||||||||
| Mark to market valuation adjustment for redeemable noncontrolling interest |
— | — | (4,367 | ) | — | — | (4,367 | ) | |||||||||||||||||
| Postretirement/pension liability adjustment, net of tax of $0.3 million |
— | — | — | — | (250 | ) | (250 | ) | (250 | ) | |||||||||||||||
| Other comprehensive income, net of tax of ($0.5) million |
— | — | — | — | 2,234 | 2,234 | 2,234 | ||||||||||||||||||
| Total comprehensive loss |
$ | (779,708 | ) | ||||||||||||||||||||||
| Balance, December 31, 2009 |
5,000,000 | $ | 5,000 | $ | 1,520,616 | $ | (1,667,998 | ) | $ | (68,381 | ) | $ | (210,763 | ) | |||||||||||
See accompanying notes to consolidated financial statements.
F-5
Table of Contents
CONSOLIDATED STATEMENTS OF CASH FLOWS
(in thousands)
| Predecessor Entity | Successor Entity | |||||||||||||||||
| Year Ended December 31, 2007 |
Period January 1, 2008 to January 31, 2008 |
Period February 1, 2008 to December 31, 2008 |
Year Ended December 31, 2009 |
|||||||||||||||
| Cash flows from operating activities: |
||||||||||||||||||
| Net loss |
$ | (191,889 | ) | $ | (311,861 | ) | $ | (886,399 | ) | $ | (782,061 | ) | ||||||
| Adjustments to reconcile net loss to net cash provided by operating activities: |
||||||||||||||||||
| Depreciation and amortization |
784,120 | 64,157 | 795,663 | 804,037 | ||||||||||||||
| Impairment of asset value |
— | — | 390,444 | 499,100 | ||||||||||||||
| Provision for doubtful accounts |
12,199 | 3,922 | (9,137 | ) | 3,387 | |||||||||||||
| Foreign currency transaction gain (loss) |
(482 | ) | (137 | ) | 6,241 | (7,798 | ) | |||||||||||
| Loss on disposal of assets |
262 | — | 588 | 2,709 | ||||||||||||||
| Share-based compensation expense |
5,046 | 196,414 | 3,150 | 56,965 | ||||||||||||||
| Compensation cost paid by parent |
288 | — | — | — | ||||||||||||||
| Deferred income taxes |
(37,701 | ) | (16,668 | ) | (146,758 | ) | (43,258 | ) | ||||||||||
| Amortization of discount, premium, issuance costs and other non-cash items |
76,868 | 6,494 | 195,714 | 125,337 | ||||||||||||||
| Interest paid-in-kind |
— | — | 210,481 | 298,030 | ||||||||||||||
| (Gain) loss on early extinguishment of debt |
28,143 | — | (592 | ) | (5,180 | ) | ||||||||||||
| Share in (gain) loss of unconsolidated affiliates |
6,838 | — | 17,127 | (517 | ) | |||||||||||||
| Gain of sale of investment |
(27,333 | ) | ||||||||||||||||
| Unrealized (gains) losses on derivative financial instruments |
21,596 | 11,748 | 130,564 | (83,953 | ) | |||||||||||||
| Net loss attributable to noncontrolling interests |
— | — | 93 | 369 | ||||||||||||||
| Other non-cash items |
13,351 | 108 | 5,861 | 178 | ||||||||||||||
| Changes in operating assets and liabilities net of effect of acquisition: |
||||||||||||||||||
| Receivables |
(24,573 | ) | 358 | 16,080 | 5,008 | |||||||||||||
| Prepaid expenses and other assets |
(38,309 | ) | (25,270 | ) | (47,741 | ) | 20,071 | |||||||||||
| Accounts payable and accrued liabilities |
(95,964 | ) | 70,704 | 139,519 | (53,107 | ) | ||||||||||||
| Deferred revenue |
17,041 | 14,342 | 32,718 | 63,914 | ||||||||||||||
| Accrued retirement benefits |
(6,982 | ) | 78 | 1,802 | 4,860 | |||||||||||||
| Other long-term liabilities |
(12,831 | ) | 5,230 | 20,725 | (7,102 | ) | ||||||||||||
| Net cash provided by operating activities |
557,021 | 19,619 | 876,143 | 873,656 | ||||||||||||||
| Cash flows from investing activities: |
||||||||||||||||||
| Payments for satellites and other property and equipment (including capitalized interest) |
(543,612 | ) | (24,701 | ) | (397,759 | ) | (943,133 | ) | ||||||||||
| Proceeds from sale of other property and equipment |
— | — | 686 | |||||||||||||||
| Capital contributions to unconsolidated affiliates |
— | — | (27,280 | ) | (12,210 | ) | ||||||||||||
| Other investing activities |
2,624 | — | 15,142 | 7,562 | ||||||||||||||
| Net cash used in investing activities |
(540,988 | ) | (24,701 | ) | (409,897 | ) | (947,095 | ) | ||||||||||
| Cash flows from financing activities: |
||||||||||||||||||
| Repayments of long-term debt |
(1,661,580 | ) | (168,847 | ) | (6,280,165 | ) | (823,309 | ) | ||||||||||
| Repayment of revolving credit facility |
— | — | (241,221 | ) | — | |||||||||||||
| Loan proceeds received (repaid) from/to Intelsat Holdings |
— | 34,000 | (34,000 | ) | ||||||||||||||
| Proceeds from issuance of long-term debt |
1,595,000 | — | 5,012,783 | 961,917 | ||||||||||||||
| Proceeds from revolving credit facility |
— | 150,000 | 241,221 | — | ||||||||||||||
| Capital contribution from parent |
12,000 | |||||||||||||||||
| Debt issuance costs |
(31,017 | ) | — | (119,633 | ) | (17,522 | ) | |||||||||||
| Repayments of funding of capital expenditures by customer |
(41,282 | ) | — | (30,862 | ) | — | ||||||||||||
| Payment of premium on early retirement of debt |
(10,000 | ) | — | (88,104 | ) | — | ||||||||||||
| Noncontrolling interest in New Dawn |
— | — | — | 377 | ||||||||||||||
| Principal payments on deferred satellite performance incentives |
(18,556 | ) | (1,333 | ) | (23,302 | ) | (24,603 | ) | ||||||||||
| Principal payments on capital lease obligations |
(6,167 | ) | (2,124 | ) | (9,148 | ) | (1,859 | ) | ||||||||||
| Net cash provided by (used in) financing activities |
(173,602 | ) | (22,304 | ) | (1,504,431 | ) | 73,001 | |||||||||||
| Effect of exchange rate changes on cash and cash equivalents |
482 | 137 | (6,241 | ) | 7,798 | |||||||||||||
| Net change in cash and cash equivalents |
(157,087 | ) | (27,249 | ) | (1,044,426 | ) | 7,360 | |||||||||||
| Cash and cash equivalents, beginning of period |
583,656 | 426,569 | 1,514,637 | 470,211 | ||||||||||||||
| Cash and cash equivalents, end of period |
$ | 426,569 | $ | 399,320 | $ | 470,211 | $ | 477,571 | ||||||||||
| Supplemental cash flow information: |
||||||||||||||||||
| Interest paid, net of amounts capitalized |
$ | 949,735 | $ | 119,399 | $ | 712,284 | $ | 978,515 | ||||||||||
| Income taxes paid |
65,301 | 4,028 | 44,687 | 52,070 | ||||||||||||||
| Supplemental disclosure of non-cash investing activities: |
||||||||||||||||||
| Capitalization of deferred satellite performance incentives |
$ | 19,100 | $ | — | $ | 21,175 | $ | 16,705 | ||||||||||
| Accrued capital expenditures |
26,727 | 13,363 | 32,017 | 78,151 | ||||||||||||||
| Note: | The increase in cash and cash equivalents between the predecessor entity ending balance for the period January 1, 2008 to January 31, 2008 and the successor entity opening balance is due to approximately $1.1 billion in cash received in connection with the closing of the New Sponsors Acquisition Transactions. |
See accompanying notes to consolidated financial statements.
F-6
Table of Contents
NOTES TO CONSOLIDATED FINANCIAL STATEMENTS
Note 1 Background of Company
Intelsat S.A. (“Intelsat,” “we,” “us” or “our”) provides satellite communications services worldwide through a global communications network of 54 satellites in orbit as of December 31, 2009 and ground facilities related to the satellite operations and control, and teleport services.
On December 15, 2009, Intelsat, Ltd. and certain of its parent holding companies and subsidiaries migrated their jurisdiction of organization from Bermuda to Luxembourg (the “Migration”). As a result of the Migration, our headquarters are located in Luxembourg. Each company that migrated has continued its corporate and legal personality in Luxembourg. Subsequent to the Migration, Intelsat Global, Ltd. is now known as Intelsat Global S.A., Intelsat Global Subsidiary, Ltd. is now known as Intelsat Global Subsidiary S.A., Intelsat Holdings, Ltd. (“Intelsat Holdings”) is now known as Intelsat Holdings S.A., Intelsat, Ltd. is now known as Intelsat S.A., Intelsat (Bermuda), Ltd., (“Intelsat Bermuda”) is now known as Intelsat (Luxembourg) S.A. (“Intelsat Luxembourg”), Intelsat Jackson Holdings, Ltd. (“Intelsat Jackson”) is now known as Intelsat Jackson Holdings S.A., Intelsat Intermediate Holding Company, Ltd. (“Intermediate Holdco”) is now known as Intelsat Intermediate Holding Company S.A. and Intelsat Subsidiary Holding Company, Ltd. (“Intelsat Sub Holdco”) is now known as Intelsat Subsidiary Holding Company S.A.
The International Telecommunications Satellite Organization “INTELSAT” (the “IGO”) was established on an interim basis in 1964. The IGO was formally established on February 12, 1973 in accordance with the provisions of an intergovernmental agreement (the “INTELSAT Agreement”) and an operating agreement (the “Operating Agreement”). The parties to the INTELSAT Agreement were the IGO’s 148 member countries. Substantially all of the IGO’s assets, liabilities, rights, obligations and operations were transferred to Intelsat, Ltd. and its wholly-owned subsidiaries on July 18, 2001 in a transaction referred to as the privatization. The IGO’s shareholders received shares in Intelsat, Ltd., a company originally organized under the laws of Bermuda, in proportion to their ownership in the IGO on the privatization date and became holders of 100% of the outstanding ordinary shares of Intelsat.
On January 28, 2005, Intelsat, Ltd. was acquired by Intelsat Holdings, formerly known as Zeus Holdings, Limited, a Bermuda company formed at the direction of funds advised by or associated with Apax Partners Worldwide LLP and Apax Partners, L.P., Apollo Management V, L.P., MDP Global Investors, Limited and Permira Advisers LLC.
On July 3, 2006, Intelsat Bermuda, a wholly-owned indirect subsidiary of Intelsat Holdings, completed the acquisition of PanAmSat Holding Corporation (“PanAmSat Holdco”) pursuant to a merger agreement dated as of August 28, 2005, by and among Intelsat Bermuda, Proton Acquisition Corporation (“Merger Sub”), a wholly-owned subsidiary of Intelsat Bermuda, and PanAmSat Holdco (the “Merger Agreement”). Pursuant to the Merger Agreement, Merger Sub merged with and into PanAmSat Holdco, with PanAmSat Holdco surviving the merger (the “Merger Transaction”). Upon completion of the Merger Transaction, PanAmSat Holdco’s equity holders ceased to hold shares or other equity interest in PanAmSat Holdco. On July 3, 2006, following the completion of the acquisition, PanAmSat Holdco was renamed “Intelsat Holding Corporation” and PanAmSat Corporation was renamed “Intelsat Corporation” (“Intelsat Corporation”). Upon completion of the PanAmSat Acquisition Transactions (as defined below), PanAmSat Holdco became a wholly-owned subsidiary of Intelsat Bermuda.
In connection with, and in order to effect, the transactions contemplated by the Merger Agreement and the related financing, Intelsat Bermuda created a new direct wholly-owned subsidiary, Intermediate Holdco. Intelsat Bermuda transferred substantially all of its assets (other than cash, certain prepaid expenses and the capital stock of Merger Sub) and liabilities to Intermediate Holdco. In addition, on July 3, 2006, we incurred approximately $3.5 billion of additional debt and assumed $3.2 billion of outstanding debt to finance the Merger Transaction.
F-7
Table of Contents
INTELSAT S.A.
NOTES TO CONSOLIDATED FINANCIAL STATEMENTS—(Continued)
Also, on July 3, 2006 Intelsat Sub Holdco terminated its prior senior secured credit facilities and entered into new senior secured credit facilities under a credit agreement, to change certain of the terms thereunder. These transactions and the Merger Transaction are collectively referred to as the PanAmSat Acquisition Transactions.
On February 4, 2008, Serafina Acquisition Limited (“Serafina”) completed its acquisition of 100% of the equity ownership of Intelsat Holdings for total cash consideration of approximately $5.0 billion, pursuant to a Share Purchase Agreement, dated as of June 19, 2007 (the “BC Share Purchase Agreement”), among Serafina, Intelsat Holdings, certain shareholders of Intelsat Holdings and Serafina Holdings Limited (“Serafina Holdings”), the direct parent of Serafina. This transaction is referred to as the New Sponsors Acquisition (see Note 3—New Sponsors Acquisition).
Although the effective date of the New Sponsors Acquisition was February 4, 2008, due to the immateriality of the results of operations for the period between February 1, 2008 and February 4, 2008, we have accounted for the New Sponsors Acquisition as if it had occurred on February 1, 2008, except for acquisition transactions costs which were recorded within the predecessor period of January 1, 2008 to January 31, 2008.
Our consolidated financial statements for the year ended December 31, 2007 and the period January 1, 2008 to January 31, 2008 represent the “predecessor” entity. The period February 1, 2008 to December 31, 2008 and the year ended December 31, 2009 represent the “successor” entity. As a result of the application of purchase accounting, the consolidated financial statements of the predecessor entity are not comparable with the consolidated financial statements of the successor entity, because they are, in effect, those of a new entity.
Note 2 Significant Accounting Policies
(a) Principles of Consolidation
The accompanying consolidated financial statements include the accounts of Intelsat, its wholly-owned subsidiaries and a joint venture with Convergence SPV, Ltd. (“Convergence Partners”) named New Dawn Satellite Company Ltd., of which we have a 74.9% interest and, as more fully described in Note 9—Investments, we account for the percentage interest in New Dawn that we do not own as a minority interest. Investments where we exercise significant influence but do not control (generally 20% to 50% ownership interest) are accounted for under the equity method of accounting and are periodically reviewed for impairment. All significant intercompany accounts and transactions have been eliminated.
(b) Use of Estimates
The preparation of these consolidated financial statements in conformity with United States generally accepted accounting principles (“U.S. GAAP”) requires management to make estimates and assumptions that affect the amounts reported in these consolidated financial statements and accompanying notes. Examples of estimates include the determination of fair value with respect to certain assets acquired and liabilities assumed in the New Sponsors Acquisition, the allowance for doubtful accounts, pension and postretirement benefits, the fair value of our derivative instruments, the fair value of the redeemable noncontrolling interest, the fair value of share-based and other compensation awards, income taxes, useful lives of satellites, intangible assets and other property and equipment, the recoverability of goodwill and the fair value of non-amortizable intangible assets. Changes in such estimates may affect amounts reported in future periods.
F-8
Table of Contents
INTELSAT S.A.
NOTES TO CONSOLIDATED FINANCIAL STATEMENTS—(Continued)
(c) Revenue Recognition
We earn revenue primarily from satellite utilization charges and, to a lesser extent, from providing managed services to customers. We enter into contracts with customers to provide satellite transponders and transponder capacity and, in certain cases, earth stations and teleport facilities, for periods typically ranging from one year to the life of the satellite. Our revenue recognition policies by product or service offering are as follows:
Satellite Utilization Charge. We generally recognize revenues on a straight-line basis over the term of the related customer contract unless collectability is not reasonably assured. Revenues from occasional use services are recognized ratably as the services are performed. We have certain obligations, including providing spare or substitute capacity if available, in the event of satellite service failure under certain long-term agreements. Except for certain deposits, we are not obligated to refund satellite utilization payments previously made.
Satellite Related Consulting and Technical Service. Revenues earned from the provision of consulting services by employee specialists are typically recognized on a monthly basis as those services are performed. Consulting services, which call for services with specific deliverables, such as Transfer Orbit Support Services or training programs, are typically recognized upon the completion of those services. Revenue from the provision of market research materials is recognized on a monthly basis as those services are performed.
Tracking, Telemetry and Control (“TT&C”). We earn TT&C services revenue from providing operational services to other satellite owners and from certain customers on our satellites. The TT&C services are performed by our consulting/technical services group. TT&C agreements entered into in connection with our satellite utilization contracts are typically for the period of the related service agreement and are recognized ratably over the term of the service agreement. We also earn revenue for TT&C services in relation to our satellite utilization agreements with customers. Fees for such services are either included in the customers’ utilization charges or billed separately.
In-Orbit Backup Services and Equipment Sale. We provide back-up transponder capacity that is held on reserve for certain customers on agreed upon terms. We recognize revenues for in-orbit protection services ratably over the term of the related agreement. We also record revenue related to equipment sales, which represents equipment purchased, constructed or developed on behalf of the customers. We recognize revenue related to these equipment sales upon transfer to the customer of title to the equipment.
Revenue Share Arrangements. We recognize revenues under revenue share agreements for satellite-related services either on a gross or net basis in accordance the Principal Agent Considerations topic of the Financial Accounting Standards Board (“FASB”) Accounting Standards Codification (“ASC”) (the “Codification”) which provides guidance and clarifies when an entity should report revenue gross as a principal versus net as an agent, depending on the nature of the specific contractual relationship.
Construction Program Management. Construction program management arrangements that extend beyond one year are accounted for in accordance with the Construction-Type and Production-Type Contracts topic of the Codification. We generally record long-term, fixed price, development and production contracts utilizing the percentage of completion method as the basis to measure progress towards completion of the contract and for recognizing revenues. Progress towards contract completion is measured when achieving performance milestones or using the cost-to-cost method.
We may sell these services individually or in some combination to our customers. When these products and services are sold together, we account for the multiple elements under FASB ASC Topic 605-25, Multiple Element Arrangements (“FASB ASC 605-25”). FASB ASC 605-25 provides guidance on accounting for arrangements that involve the delivery or performance of multiple products, services and/or rights to use assets.
F-9
Table of Contents
INTELSAT S.A.
NOTES TO CONSOLIDATED FINANCIAL STATEMENTS—(Continued)
We allocate revenue for transactions or collaborations that include multiple elements to each unit of accounting based on its relative fair value, and recognize revenue for each unit of accounting when the revenue recognition criteria have been met. We recognize revenue for delivered elements having stand-alone value when we have objective and reliable evidence of fair value for each undelivered element. When we determine that the delivered element does not have stand-alone value, or when the fair value cannot be reasonably estimated for the undelivered element, the revenue is deferred and recognized over the period the services are performed, or until fair value can objectively be determined for any undelivered elements.
(d) Fair Value Measurements
We estimate the fair value of our financial instruments using available market information and valuation methodologies. The carrying amounts of cash and cash equivalents, receivables, accounts payable and accrued liabilities approximate their fair values because of the short maturity of these financial instruments.
On January 1, 2008, we prospectively adopted FASB ASC Topic 820, Fair Value Measurements and Disclosure (“FASB ASC 820”), which defines fair value as the price that would be received in the sale of an asset or paid to transfer a liability in an orderly transaction between market participants at the measurement date. FASB ASC 820 requires disclosure of the extent to which fair value is used to measure financial assets and liabilities, the inputs utilized in calculating valuation measurements, and the effect of the measurement of significant unobservable inputs on earnings, or changes in net assets, as of the measurement date. FASB ASC 820 establishes a three-level valuation hierarchy based upon the transparency of inputs utilized in the measurement and valuation of financial assets or liabilities as of the measurement date. We apply fair value accounting for all financial assets and liabilities and non-financial assets and liabilities that are recognized or disclosed at fair value in the financial statements on a recurring basis.
We performed an evaluation of our financial assets and liabilities that met the criteria of the disclosure requirements and fair value framework of FASB ASC 820. As a result of that evaluation, we identified investments in marketable securities, interest rate financial derivative instruments, embedded derivative instruments and a redeemable noncontrolling interest as having met such criteria.
We account for our investments in marketable securities in accordance with FASB ASC Topic 320, Investments—Debt and Equity Securities. All investments have been classified as available-for-sale securities as of December 31, 2008 and 2009, and are included within other assets in the accompanying consolidated balance sheets. Available-for-sale securities are stated at fair value with any unrealized gains and losses included in accumulated other comprehensive income (loss) within shareholder’s equity (deficit). Realized gains and losses and declines in fair value on available-for-sale securities that are determined to be other than temporary are included in other income (expense), net within our consolidated statements of operations. Interest and dividends on available-for-sale securities are included in interest expense, net and other income (expense), net, respectively, within the consolidated statements of operations. We determined that the valuation measurement inputs of these marketable securities represent unadjusted quoted prices in active markets and, accordingly, have classified such investments within Level 1 of the Section 820 fair value hierarchy.
The fair value of our interest rate financial derivative instruments reflects the estimated amounts that we would pay or receive to terminate the agreement at the reporting date, taking into account current interest rates, the market expectation for future interest rates and current creditworthiness of both the counterparties and ourselves. Observable inputs utilized in the income approach valuation technique incorporate identical contractual notional amounts, fixed coupon rates, periodic terms for interest payments and contract maturity. Although we have determined that the majority of the inputs used to value our derivatives fall within Level 2 of
F-10
Table of Contents
INTELSAT S.A.
NOTES TO CONSOLIDATED FINANCIAL STATEMENTS—(Continued)
the fair value hierarchy, the credit valuation adjustments, if any, associated with our derivatives utilize Level 3 inputs, such as the estimates of current credit spread, to evaluate the likelihood of default by us or our counterparties. We also considered the existence of offset provisions and other credit enhancements that serve to reduce the credit exposure associated with the asset or liability being fair valued. We have assessed the significance of the inputs of the credit valuation adjustments to the overall valuation of our derivative positions and have determined that the credit valuation adjustments are not significant to the overall valuation of our derivatives. As a result, we have determined that our derivative valuations in their entirety are classified in Level 2 of the fair value hierarchy.
We account for a contingent put option embedded within Sub Holdco’s 8 7/8% Senior Notes due 2015, Series B (the “2009 Sub Holdco Notes”) under FASB ASC Topic 815, Derivatives and Hedging (“FASB ASC 815”), bifurcating the put option from the debt host instrument and classifying it as a derivative instrument. We estimated the fair value of the embedded derivative on the issuance date and subsequently revalue the derivative at the end of each reporting period, recognizing any change in fair value through earnings. We use a standard valuation technique whereby the critical assumptions and underlyings include the debt maturity date, issue price, coupon rate, change of control put price, and the estimated date of a change in control. We have identified the inputs used to calculate the fair value as Level 3 inputs and have concluded that the valuation in its entirety is classified in Level 3 of the fair value hierarchy.
In accordance with the guidance provided in FASB ASC Topic 480, Distinguishing Liabilities from Equity, regarding the classification and measurement of redeemable securities, we mark to market the fair value of the noncontrolling interest in New Dawn Satellite Company Ltd (“New Dawn”), a majority owned subsidiary which is a joint venture investment with Convergence SPV Ltd. (“Convergence Partners”), at each reporting period. Convergence Partners has at its option the ability to require Intelsat to buy its ownership interest at fair value subsequent to the operations of New Dawn’s assets for a period defined in the New Dawn Project Agreement. We estimated the fair value of the put option using Level 3 inputs such as the discounted cash flows.
(e) Cash and Cash Equivalents
Cash and cash equivalents consist of cash on hand and highly liquid investments with original maturities of three months or less and generally consist of time deposits with banks and money market funds. The carrying amount of these investments approximates market value.
(f) Receivables and Concentration of Credit Risk
We provide satellite services and extend credit to numerous customers in the satellite communication, telecommunications and video markets. To the extent that the credit quality of customers deteriorates, we may have exposure to credit losses. Management monitors its exposure to credit losses and maintains allowances for anticipated losses. Management believes it has adequate customer collateral and reserves to cover its exposure.
Our allowance for doubtful accounts is determined through an evaluation of the aging of our accounts receivable, and considers such factors as the likelihood of collection based upon an evaluation of the customer’s creditworthiness, the customer’s payment history and other conditions or circumstances that may affect the likelihood of payment, such as political and economic conditions in the country in which the customer is located. When we have determined that the collection of payments for satellite utilization or managed services is not reasonably assured at the time the service is provided, we defer recognition of the revenue until such time as collection is believed to be reasonably assured or the payment is received. If our estimate of the likelihood of collection differs from actual results, we may experience lower revenue or an increase in our provision for doubtful accounts.
F-11
Table of Contents
INTELSAT S.A.
NOTES TO CONSOLIDATED FINANCIAL STATEMENTS—(Continued)
(g) Satellites and Other Property and Equipment
Satellites and other property and equipment are stated at historical cost, or in the case of certain satellites acquired, the fair value at the date of acquisition, and consist primarily of the costs of satellite construction and launch, including launch insurance and insurance during the period of in-orbit testing, the net present value of performance incentives expected to be payable to the satellite manufacturers, costs directly associated with the monitoring and support of satellite construction, and interest costs incurred during the period of satellite construction.
Satellite construction and launch services are generally procured under long-term contracts that provide for payments over the contract periods. Satellite construction and launch services costs are capitalized to reflect progress toward completion. Capitalizing these costs typically coincides with contract milestone payment schedules. Performance incentives payable in future periods are dependent on the continued satisfactory performance of the satellites in service. Satellites and other property and equipment are depreciated on a straight-line basis over the following estimated useful lives:
| Years | ||
| Buildings and improvements |
10 – 40 | |
| Satellites and related costs |
11 – 17 | |
| Ground segment equipment and software |
4 – 15 | |
| Furniture and fixtures and computer hardware |
4 – 12 | |
| Leasehold improvements |
2 – 12 |
(h) Other Assets
Other assets consist of investments in certain equity securities, unamortized debt issuance costs, long-term deposits, long-term receivables and other miscellaneous deferred charges and long-term assets. Debt issuance costs, which represent our costs incurred to secure debt financing, are amortized to interest expense using the effective interest method, over the life of the related indebtedness.
(i) Business Combinations
Business combinations are accounted for whereby the tangible and separately identifiable intangible assets acquired and liabilities assumed are recognized at their estimated fair market values at the acquisition date. The portion of the purchase price in excess of the estimated fair market value of the net tangible and separately identifiable intangible assets acquired represents goodwill. The allocation of the purchase price involves estimates and judgments by us that may be adjusted during the allocation period. In arriving at the fair values of assets acquired and liabilities assumed, we consider the following generally accepted valuation approaches: the cost approach, income approach, and market approach. Our estimates may also include assumptions about projected growth rates, cost of capital, effective tax rates, tax amortization periods, technology royalty rates and technology life cycles, the regulatory and legal environment, and industry and economic trends.
(j) Goodwill and Other Intangible Assets
Goodwill. We account for goodwill and other intangible assets in accordance with FASB ASC Topic 350, Intangibles—Goodwill and Other (“FASB ASC 350”). Goodwill represents the excess of acquisition costs over the fair value of the net tangible assets and identifiable intangible assets of businesses acquired. Goodwill and certain other intangible assets deemed to have indefinite lives are not amortized but are tested on an annual basis for impairment during the fourth quarter, or whenever events or changes in circumstances indicate that the
F-12
Table of Contents
INTELSAT S.A.
NOTES TO CONSOLIDATED FINANCIAL STATEMENTS—(Continued)
carrying amount may not be fully recoverable. The impairment test compares the reporting unit’s carrying value to its fair value and, when appropriate, the carrying value of goodwill is reduced to fair value (see Note 10—Goodwill and Other Intangible Assets).
Other Intangible Assets. Intangible assets arising from business combinations are initially recorded at fair value. Other intangible assets not arising from business combinations are initially recorded at cost. Intangible assets with determinable lives consist of backlog, customer relationships, and technologies and are amortized based on the expected pattern of consumption. We review these intangible assets for impairment whenever facts and circumstances indicate that the carrying amounts may not be recoverable (see Note 10—Goodwill and Other Intangible Assets).
(k) Impairment of Long-Lived Assets
Long-lived assets, including property and equipment and acquired intangible assets with estimable useful lives, are reviewed for impairment whenever events or changes in circumstances indicate that the carrying amount of an asset may not be recoverable. These indicators of impairment can include, but are not limited to, the following:
| • | satellite anomalies, such as a partial or full loss of power; |
| • | under-performance of an asset as compared to expectations; and |
| • | shortened useful lives due to changes in the way an asset is used or expected to be used. |
The recoverability of an asset to be held and used is determined by comparison of the carrying amount to the estimated undiscounted future cash flows expected to be generated by the asset. If the carrying amount of the asset exceeds its estimated undiscounted future cash flows, an impairment charge is recognized in the amount by which the carrying amount of the asset exceeds its fair value, determined by either a quoted market price, if any, or a value determined by utilizing a discounted cash flow technique. Additionally, when assets are expected to be used in future periods, a shortened depreciable life may be utilized if appropriate, resulting in accelerated depreciation.
(l) Income Taxes
We account for income taxes in accordance with FASB ASC Topic 740, Income Taxes (“FASB ASC 740”). Deferred income tax assets and liabilities are determined based on the difference between the consolidated financial statements and the income tax bases of our assets and liabilities and net operating loss and credit carryforwards, using the enacted marginal tax rate. We are subject to income taxes in the United States as well as a number of foreign jurisdictions. Significant judgment is required in the calculation of our tax provision and the resultant tax liabilities and in the recoverability of our deferred tax assets that arise from temporary differences between the tax and financial statement recognition of revenue and expense and net operating loss and credit carryforwards.
As part of our financial process, we must assess the likelihood that our deferred tax assets can be recovered. A valuation allowance is required when it is more likely than not that all, or a portion, of the deferred tax asset will not be realized. We evaluate the recoverability of our deferred tax assets based in part on the existence of deferred tax liabilities that can be used to realize the deferred tax assets.
During the ordinary course of business, there are certain transactions and calculations for which the ultimate tax determination is uncertain. We evaluate our tax positions to determine if it is more likely than not that a tax position is sustainable, based solely on its technical merits and presuming the taxing authorities’ full knowledge of the position and having access to all relevant facts and information. When a tax position does not meet the more likely than not standard, a liability is recorded for the entire amount of the unrecognized tax benefit.
F-13
Table of Contents
INTELSAT S.A.
NOTES TO CONSOLIDATED FINANCIAL STATEMENTS—(Continued)
Additionally, for those tax positions that are determined more likely than not to be sustainable, we measure the tax position at the largest amount of benefit more likely than not (determined by cumulative probability) to be realized upon settlement with the taxing authority.
(m) Currency and Exchange Rates
Substantially all customer contracts, capital expenditure contracts and operating expense obligations are denominated in U.S. dollars. Consequently, we do not believe that we are exposed to material currency exchange risk.
(n) Comprehensive Income
Comprehensive income consists of net income and other gains and losses affecting shareholder’s equity that, under U.S. GAAP, are excluded from net income. For us, such items consist primarily of, the change in the market value of available-for-sale securities and minimum pension liability adjustments.
(o) Share-Based Compensation
Share-based compensation cost is recognized based on the requirements of FASB ASC Topic 718, Compensation—Stock Compensation (“FASB ASC 718”).
(p) Deferred Satellite Performance Incentives
The cost of satellite construction includes an element of deferred consideration to satellite manufacturers referred to as satellite performance incentives. We are contractually obligated to make these payments over the lives of the satellites, provided the satellites continue to operate in accordance with contractual specifications. Historically, the satellite manufacturers have earned substantially all of these payments. Therefore, we account for these payments as deferred financing. We capitalize the present value of these payments as part of the cost of the satellites and record a corresponding liability to the satellite manufacturers. Interest expense is recognized on the deferred financing and the liability is accreted upward based on the passage of time and reduced as the payments are made.
(q) Reclassifications
Certain reclassifications have been made to the prior years’ financial statements to conform to the current year presentation. The reclassifications had no effect on previously reported results of operations, cash flows or retained earnings.
(r) New Accounting Pronouncements
In June 2009, the FASB issued Accounting Standards Update No. 2009-1 Topic 105, Generally Accepted Accounting Principles (“Topic 105”), which establishes the Codification as the official single source of authoritative U.S. GAAP, superseding existing literature issued by the FASB, American Institute of Certified Public Accountants, Emerging Issues Task Force (“EITF”) and related literature. The Codification became effective for interim and annual periods ending on or after September 15, 2009, after which only one level of authoritative U.S. GAAP exists and all other literature is considered non-authoritative. The Codification does not change existing U.S. GAAP. The Codification was effective for our third quarter 2009 financial statements and the principal impact on our financial statements is limited to disclosures as all future references to authoritative accounting literature will be referenced in accordance with the Codification. Pursuant to the provisions of Topic
F-14
Table of Contents
INTELSAT S.A.
NOTES TO CONSOLIDATED FINANCIAL STATEMENTS—(Continued)
105, we have updated references to U.S. GAAP in our financial statements issued for the period ended December 31, 2009. The adoption of Topic 105 did not impact our financial position or results of operations.
Accounting pronouncements issued prior to the Codification will continue to be referenced by their original issuance reference for consistency with prior period filings. We have also provided the Codification topic into which the accounting guidance has been incorporated subsequent to its original issuance.
In September 2009, the FASB amended the Revenue Recognition—Multiple Element Arrangements topic of the Codification. Currently, the absence of vendor specific objective evidence (“VSOE”) or third party evidence (“TPE”) of the fair value of the undelivered item(s) in an arrangement with multiple deliverables is one of the most common reasons entities are unable to recognize revenue on items that have been delivered. The amendment modifies the fair value requirements by providing an alternative for establishing fair value of a deliverable. In instances where VSOE or TPE of the fair value for any of the deliverables in an arrangement is unavailable, the entity may develop a best estimate of the selling price for those deliverables and allocate the arrangement consideration using the relative selling price method. Application of the residual method of allocating an arrangement fee between delivered and undelivered elements will no longer be permitted. Additionally, entities will be required to disclose more information about their multiple-element revenue arrangements. This amendment will be effective and applied prospectively to all revenue arrangements entered into or materially modified in fiscal years beginning on or after June 15, 2010 with early adoption permitted. We intend to adopt the amended revenue recognition guidance in the first quarter of 2010 and do not expect the adoption to have a significant impact on our consolidated financial statements.
In June 2009, the FASB issued Statements of Financial Accounting Standards (“SFAS”) No. 166, Accounting for Transfers of Financial Assets—an amendment of FASB Statement No. 140 (“SFAS No. 166”). Subsequent to the issuance of this accounting pronouncement, SFAS No. 166 has been incorporated into the Codification under FASB ASC Topic 860, Transfers and Servicing, which establishes accounting and reporting standards for transfers and servicing of financial assets. SFAS No. 166 is intended to improve the relevance, representational faithfulness, and comparability of information that a reporting entity provides in its financial statements related to a transfer of financial assets, the effects of a transfer on its financial position, financial performance, and cash flows, and a transferor’s continuing involvement, if any, in transferred financial assets. SFAS No. 166 will be effective at the start of the first annual reporting period beginning after November 15, 2009. We have evaluated the requirements of SFAS No. 166 and noted that the adoption of SFAS No. 166 will not have a material impact to our consolidated financial statements.
In June 2009, the FASB issued SFAS No. 167, Amendments to FASB Interpretation No. 46(R) (“SFAS No. 167”). Subsequent to the issuance of this accounting pronouncement, SFAS No. 167 has been incorporated into the Codification under FASB ASC Topic 810, Consolidations. SFAS No. 167 is intended to address the effects on certain provisions of FASB Interpretation No. 46 (revised December 2003), Consolidation of Variable Interest Entities (“FIN 46(R)”), as a result of the elimination of the qualifying special-purpose entity concept in SFAS No. 166 and constituent concerns about the application of certain key provisions of FIN 46(R), including those in which the accounting and disclosures under FIN 46(R) do not always provide timely and useful information about an entity’s involvement in a variable interest entity. SFAS No. 167 will be effective at the start of the first annual reporting period beginning after November 15, 2009. We have evaluated the requirements of SFAS No. 167 and its effect to our unconsolidated variable interest entities, and do not believe that the adoption of the standard will have a material impact to our consolidated financial statements.
F-15
Table of Contents
INTELSAT S.A.
NOTES TO CONSOLIDATED FINANCIAL STATEMENTS—(Continued)
Note 3 New Sponsors Acquisition
On February 4, 2008, Serafina completed its acquisition of 100% of the equity ownership of Intelsat Holdings for total cash consideration of approximately $5.0 billion, pursuant to the BC Share Purchase Agreement. The former shareholders of Intelsat Holdings (other than management) sold 100% of their equity interests in Intelsat Holdings. Upon closing, management contributed to Serafina Holdings the portion of their equity interests in Intelsat Holdings not purchased for cash by Serafina in exchange for equity interests in Serafina Holdings (which was renamed Intelsat Global, Ltd. (“Intelsat Global”) on February 8, 2008).
In order to finance the New Sponsors Acquisition, Serafina borrowed $4.96 billion in aggregate principal amount of term loans under a $2.81 billion senior unsecured bridge loan credit agreement, dated as of February 4, 2008 (the “Senior Bridge Loan Credit Agreement”) and a $2.15 billion senior unsecured payment-in-kind election bridge loan credit agreement, dated as of February 4, 2008 (the “PIK Election Bridge Loan Credit Agreement” and, together with the Senior Bridge Loan Credit Agreement, the “Bridge Loan Credit Agreements”) (see Note 11—Long-Term Debt). Serafina Holdings is an entity newly formed by funds controlled by BC Partners Holdings Limited (“BC Partners”) and certain other investors (collectively, the “BCEC Funds”). Subsequent to the execution of the BC Share Purchase Agreement, two investment funds controlled by Silver Lake Partners (“Silver Lake”) and other equity investors joined the BCEC Funds as the equity sponsors of Serafina Holdings. The BCEC Funds, the Silver Lake funds and the other equity sponsors are referred to as the New Sponsors and the acquisition of Intelsat Holdings, our indirect parent, referred to as the New Sponsors Acquisition.
Immediately following the New Sponsors Acquisition, Intelsat Bermuda, our direct wholly-owned subsidiary, transferred certain of its assets (including all of its direct and indirect ownership interests in its subsidiaries) and certain of its liabilities and obligations to a newly formed direct wholly-owned subsidiary, Intelsat Jackson Holdings, Ltd (“Intelsat Jackson”), pursuant to an assignment and assumption agreement (the “Intelsat Bermuda Transfer”). Following the Intelsat Bermuda Transfer, Intelsat Jackson became the owner of substantially all of Intelsat Bermuda’s assets and the obligor with respect to substantially all of Intelsat Bermuda’s liabilities and obligations, and Intelsat Bermuda no longer had any rights or obligations with respect to such assets and liabilities. Immediately after the consummation of the Intelsat Bermuda Transfer, Serafina assigned certain of its assets and liabilities to Intelsat Bermuda (the “Serafina Assignment”), including Serafina’s rights and obligations under the Bridge Loan Credit Agreements and a Commitment Letter, dated as of June 19, 2007 among Serafina and certain banks related to the financing of the New Sponsors Acquisition, as amended by the Commitment Letter Amendment, dated as of February 7, 2008 (the “Financing Commitment Letter”). In addition, our subsidiaries, Intelsat Sub Holdco and Intelsat Corp, entered into amendments to their existing credit agreements, and Intelsat Corp entered into a joinder agreement to its existing credit agreement, to facilitate the New Sponsors Acquisition. In connection with the New Sponsors Acquisition, on February 7, 2008, Intelsat Jackson redeemed pursuant to their terms all $260.0 million of its outstanding Floating Rate Senior Notes due 2013 and all $600.0 million of its outstanding Floating Rate Senior Notes due 2015, and on March 6, 2008, Intelsat, Ltd. redeemed pursuant to their terms all $400.0 million of its outstanding 5 1/4% Senior Notes due 2008. The New Sponsors Acquisition and the transactions described above are collectively referred to as the New Sponsors Acquisition Transactions.
Immediately upon the closing of the New Sponsors Acquisition, the Intelsat Bermuda and Intelsat Sub Holdco monitoring fee agreements with Apax Partners Worldwide LLP and Apax Partners, L.P., Apollo Management V, L.P., MDP Global Investors Limited, and Permira Advisers LLC (collectively, the “Former Sponsors”) were terminated. Intelsat Bermuda entered into a new monitoring fee agreement (the “2008 MFA”) with BC Partners and Silver Lake Management Company III, L.L.C. (together, the “2008 MFA parties”), pursuant to which the 2008 MFA parties provide certain monitoring, advisory and consulting services to Intelsat Bermuda.
F-16
Table of Contents
INTELSAT S.A.
NOTES TO CONSOLIDATED FINANCIAL STATEMENTS—(Continued)
The New Sponsors Acquisition was accounted for by Intelsat Holdings under the purchase method of accounting in accordance with FASB ASC Topic 805, Business Combinations. As a result, the purchase price was allocated to the assets acquired and liabilities assumed based on their estimated fair market values at the date of acquisition. In accordance with Topic 5J of the codified SEC Staff Accounting Bulletins, the purchase accounting adjustments have been “pushed down” and recorded in our consolidated financial statements, which resulted in a new basis of accounting for the “successor period” beginning after the consummation of the New Sponsors Acquisition. Determining fair values of the assets acquired and liabilities assumed required us to make significant estimates and assumptions. In order to develop estimates of fair values of the assets acquired and liabilities assumed, we considered the following generally accepted valuation approaches: the cost approach, the income approach and the market approach. Our estimates included assumptions about projected growth rates, cost of capital, effective tax rates, tax amortization periods, technology royalty rates and technology life cycles, the regulatory and legal environment, and industry and economic trends. While we believe that the estimates and assumptions underlying the valuation methodologies were reasonable, different assumptions could have resulted in different market values. The purchase price allocation was finalized during the period ended December 31, 2008.
In connection with the completion of the New Sponsors Acquisition Transactions, we recorded $313.1 million of transaction costs within restructuring and transaction costs in our consolidated statements of operations during the predecessor period January 1, 2008 to January 31, 2008. These costs included $197.2 million of costs associated with the repurchase or cancellation of restricted shares and share-based compensation arrangements (“SCAs”) of Intelsat Holdings, an advisory service fee of $60.0 million paid to the 2008 MFA parties, and $55.3 million in professional fees.
Note 4 Fair Value Measurements
FASB ASC 820 defines fair value, establishes a market-based framework or hierarchy for measuring fair value and provides for certain required disclosures about fair value measurements. The guidance is applicable whenever another accounting pronouncement requires or permits assets and liabilities to be measured at fair value, but does not require any new fair value measurements.
The fair value hierarchy prioritizes the inputs used in valuation techniques into three levels as follows:
| • | Level 1—unadjusted quoted prices for identical assets or liabilities in active markets; |
| • | Level 2—quoted prices for similar assets and liabilities in active markets, quoted prices for identical or similar assets or liabilities in markets that are not active, and inputs other than quoted market prices that are observable or that can be corroborated by observable market data by correlation; and |
| • | Level 3—unobservable inputs based upon the reporting entity’s internally developed assumptions which market participants would use in pricing the asset or liability. |
F-17
Table of Contents
INTELSAT S.A.
NOTES TO CONSOLIDATED FINANCIAL STATEMENTS—(Continued)
The following table presents assets and liabilities measured and recorded at fair value in our consolidated balance sheets on a recurring basis and their level within the fair value hierarchy (in thousands):
| Fair Value Measurements at December 31, 2009 | ||||||||||||
| Description |
As of December 31, 2009 |
Quoted Prices in Active Markets for Identical Assets (Level 1) |
Significant Other Observable Inputs (Level 2) |
Significant Unobservable Inputs (Level 3) | ||||||||
| Assets |
||||||||||||
| Marketable securities(1) |
$ | 34,303 | $ | 34,303 | $ | — | $ | — | ||||
| Undesignated interest rate swaps |
15,662 | — | 15,662 | — | ||||||||
| Total assets |
$ | 49,965 | $ | 34,303 | $ | 15,662 | $ | — | ||||
| Liabilities |
||||||||||||
| Undesignated interest rate swaps |
$ | 115,512 | $ | — | $ | 115,512 | $ | — | ||||
| Embedded derivative |
14,600 | — | — | 14,600 | ||||||||
| Redeemable noncontrolling interest(2) |
8,884 | — | — | 8,884 | ||||||||
| Total liabilities |
$ | 138,996 | $ | — | $ | 115,512 | $ | 23,484 | ||||
| (1) | Marketable securities consist of available-for-sale securities with a cost basis of $27.3 million and other securities whose fair value represents its cost basis. |
| (2) | Redeemable noncontrolling interest is classified as mezzanine equity in the accompanying consolidated balance sheets. |
The following table presents the activity for those items measured at fair value on a recurring basis using significant unobservable inputs (Level 3) as defined in FASB ASC 820 for the year ended December 31, 2009 (in thousands):
| Fair Value Measurements Using Significant Unobservable Inputs (Level 3) |
||||||||||||
| Redeemable Noncontrolling Interest |
Embedded Derivative |
Total | ||||||||||
| Balance at December 31, 2008 |
$ | 4,500 | $ | — | $ | 4,500 | ||||||
| Purchases, issuances and settlements |
— | 36,040 | 36,040 | |||||||||
| Mark to market valuation adjustments |
4,754 | (21,440 | ) | (16,686 | ) | |||||||
| Net Income attributable to noncontrolling interest |
(370 | ) | — | (370 | ) | |||||||
| Balance at December 31, 2009 |
$ | 8,884 | $ | 14,600 | $ | 23,484 | ||||||
In accordance with the Distinguishing Liabilities from Equity topic of the Codification regarding the classification and measurement of redeemable securities, we mark to market the fair value of the noncontrolling interest in our joint venture investment, at each reporting period. We performed a fair value analysis of the noncontrolling interest related to our 74.9% indirect ownership interest in New Dawn as of December 31, 2009, and this resulted in a non-cash increase in the noncontrolling interest of $4.4 million.
Certain assets and liabilities are measured at fair value on a nonrecurring basis; that is, such items are not measured at fair value on an ongoing basis but are subject to fair value adjustments only in certain circumstances, such as if there is evidence of impairment. During the year ended December 31, 2009, our rights to operate at
F-18
Table of Contents
INTELSAT S.A.
NOTES TO CONSOLIDATED FINANCIAL STATEMENTS—(Continued)
orbital locations were written down to the estimated fair value of $2.4 billion, from the aggregate carrying value of $2.9 billion as of December 31, 2008, due to an impairment identified during the first quarter of 2009. The fair value of the orbital locations was determined using Level 3 unobservable inputs (see Note 10—Goodwill and Other Intangible Assets).
Note 5 Share-Based and Other Compensation Plans
(a) 2005 Share Plan
(i) Restricted Shares
The board of directors of Intelsat Holdings adopted the Intelsat Holdings, Ltd. 2005 Share Incentive Plan (the “2005 Share Plan”) with an effective date of January 28, 2005. Of the shares awarded under the 2005 Share Plan, a portion were time vesting shares and a portion were performance shares that were to vest upon meeting certain performance criteria. Due to certain repurchase features in the 2005 Share Plan, the restricted share grants were classified as a liability of Intelsat Holdings. Upon consummation of the New Sponsors Acquisition on February 4, 2008, all outstanding performance-based restricted shares and a portion of the time vesting shares under the 2005 Share Plan vested. Vested restricted shares (including time and performance vesting shares) were purchased by the New Sponsors at approximately $400 per share (the per share price specified in the BC Share Purchase Agreement). In connection with the vesting of these awards upon the consummation of the acquisition, we recorded compensation expense of $148.9 million in the predecessor period January 1, 2008 to January 31, 2008. In connection with the New Sponsors Acquisition, each unvested restricted share of Intelsat Holdings was exchanged for approximately four unvested restricted shares of Intelsat Global (see (b) 2008 Share Plan (i) Rollover Shares below).
A summary of the changes in Intelsat Holdings’ non-vested restricted shares during the year ended December 31, 2007 and the period January 1, 2008 to January 31, 2008, is set forth below:
| Number of Shares | Fair Value | |||||
| Restricted shares: |
||||||
| Total non-vested restricted shares at December 31, 2006 |
413,483 | $ | 2.15 | |||
| Restricted shares forfeited and repurchased at par value |
(41,177 | ) | $ | 2.15 | ||
| Vested |
(38,161 | ) | $ | 2.15 | ||
| Total non-vested restricted shares at December 31, 2007 |
334,145 | $ | 2.15 | |||
| Vested |
(260,720 | ) | $ | 2.15 | ||
| Total non-vested restricted shares at January 31, 2008 |
73,425 | $ | 2.15 | |||
(ii) Share-Based Compensation Arrangements
During 2006 and 2007, Intelsat Holdings entered into share-based compensation arrangements (“SCAs”) with selected employees of Intelsat Holdings and its direct and indirect subsidiaries under the 2005 Share Plan, which permitted such employees to purchase Intelsat Holdings common shares. These SCAs vested over time and were subject to continued employment through each applicable vesting date. The vesting of these SCAs was to accelerate in the event of the occurrence of both a change in control and a termination without cause (each as defined in the 2005 Share Plan) of the relevant employee. Any outstanding but unexercised SCAs could be cancelled at any time after termination of employment. Shares issued as a result of the exercise of SCAs could be repurchased at the lesser of fair market value and the exercise price in the event of voluntary termination by the employee and other defined circumstances. Since these repurchase features enabled Intelsat Holdings to recover
F-19
Table of Contents
INTELSAT S.A.
NOTES TO CONSOLIDATED FINANCIAL STATEMENTS—(Continued)
the shares without transferring any appreciation in value if the employee were to terminate voluntarily, the SCAs were not deemed to be granted under the guidance provided by FASB ASC 718. The repurchase features provided that if an employee were to be terminated without cause or upon death or disability, Intelsat Holdings would have the right for two years to repurchase any vested shares at fair value as determined on the termination date.
In connection with the New Sponsors Acquisition, vesting in SCAs issued under the 2005 Share Plan doubled at consummation of the transaction if the awardee was still employed on February 4, 2008. The vested SCAs were cancelled in return for cash in an amount equal to the excess of approximately $400 (the per share price of the transaction) over the exercise price of each share covered. In connection with the vesting and cancellation of these awards, we recorded expense of $47.6 million in the predecessor period January 1, 2008 to January 31, 2008. The remaining unvested SCAs were rolled over into new SCAs of Intelsat Global with new repurchase features (see (b) 2008 Share Plan (ii) Rollover Options below).
(b) 2008 Share Plan
On May 6, 2009, the board of directors of Intelsat Global adopted the amended and restated Intelsat Global, Ltd. 2008 Share Incentive Plan (the “2008 Share Plan”). The 2008 Share Plan provides for a variety of equity-based awards with respect to Class A common shares (the “Class A Shares”), and Class B common shares (the “Class B Shares” and, together with the Class A Shares, the “Common Shares”), including non-qualified share options, incentive share options (within the meaning of Section 422 of the United States Internal Revenue Service Tax Code), restricted share awards, restricted share unit awards, share appreciation rights, phantom share awards and performance-based awards.
A total of 1,689,975 Common Shares may be issued under the 2008 Share Plan; provided, however, that no more than 946,386 Class B Shares may be issued under the 2008 Share Plan. Class A Shares may be issued pursuant to any type of award; however, Class B Shares may only be issued pursuant to restricted share awards. Additionally, 438,827 Class A Shares shall be available for issuance pursuant to the vesting and/or exercise of certain options and restricted share awards previously granted pursuant to the 2005 Share Plan (the “Rollover Awards”). To the extent that any award, other than the Rollover Awards, terminates, expires, or lapses for any reason, or is settled in cash without delivery of shares (or, in the case of restricted shares, without vesting) to the participant, then any shares subject to the award may be used again for new grants under the 2008 Share Plan.
(i) Rollover Shares
In connection with the adoption of the 2008 Share Plan, 293,926 Class A Shares previously granted pursuant to the 2005 Share Plan, of which 228,976 Class A Shares had been awarded to certain executive officers (the “Rollover Executive Officers”) under employment agreements, became subject to new Class A restricted share agreements and the provisions of the 2008 Share Plan. These rollover shares continue to be classified as a liability of Intelsat Global due to certain repurchase features in the 2008 Share Plan and the new Class A restricted share agreements. The rollover shares continued to vest in the same increments and on the same vesting dates as were applicable prior to the closing of the New Sponsors Acquisition.
During the successor period February 1, 2008 to December 31, 2008 and the year ended December 31, 2009, we recorded compensation expense of $0.1 million and $30.9 million, respectively, related to the rollover shares. Prior to the adoption of the 2008 Share Plan in May 2009, we calculated compensation expense related to the rollover shares using the provisions of the 2005 Share Plan over the vesting period based on a fair value of $0.54. For the year ended December 31, 2009, we calculated compensation expense based on the fair value of the
F-20
Table of Contents
INTELSAT S.A.
NOTES TO CONSOLIDATED FINANCIAL STATEMENTS—(Continued)
Class A shares, taking into consideration the repurchase features set forth in the new Class A restricted share agreements. The fair value equaled the fair value of the Class A shares at December 31, 2009 for the rollover shares held by the Rollover Executive Officers and the fair value equaled the fair value of the Class A shares at the date of grant, $100.00 per share, for rollover shares held by all other awardees. Since the rollover shares consisted of shares of our indirect parent, Intelsat Global, compensation costs for vested awards and the cost to repurchase shares were reflected as capital contributions in the form of liabilities assumed by parent in the accompanying statements of shareholder’s equity (deficit).
A summary of the changes in Intelsat Global’s rollover shares during the successor period February 1, 2008 to December 31, 2008 and the year ended December 31, 2009 is set forth below:
| Rollover Executive Officers | All Other Awardees | |||||||||||
| Shares | Fair Value | Shares | Fair Value | |||||||||
| Rollover shares: |
||||||||||||
| Non-vested rollover shares outstanding as of February 1, 2008 |
228,976 | $ | 0.54 | 64,950 | $ | 0.54 | ||||||
| Rollover shares forfeited and purchased at par value |
— | $ | 0.54 | (2,250 | ) | $ | 0.54 | |||||
| Vested |
(104,947 | ) | $ | 0.54 | (27,710 | ) | $ | 0.54 | ||||
| Total non-vested rollover shares at December 31, 2008 |
124,029 | $ | 0.54 | 34,990 | $ | 0.54 | ||||||
| Rollover shares forfeited and purchased at par value |
— | $ | 48.74 | (12,178 | ) | $ | 48.74 | |||||
| Vested |
(114,488 | ) | $ | 48.74 | (21,136 | ) | $ | 48.74 | ||||
| Total non-vested rollover shares at December 31, 2009 |
9,541 | $ | 122.06 | 1,676 | $ | 100.00 | ||||||
The non-vested rollover shares had a remaining weighted average vesting period of 1 month as of December 31, 2009.
(ii) Rollover Options
In connection with the adoption of the 2008 Share Plan, the unvested SCAs of Intelsat Holdings that had been rolled over into SCAs of Intelsat Global became subject to new option agreements and the provisions of the 2008 Share Plan. As a result, the SCAs were no longer subject to the same repurchase features that had applied previously, and the SCAs were deemed a grant of options to purchase Intelsat Global Class A Shares under FASB ASC 718.
Holders of these options who terminate employment with Intelsat Global or its subsidiaries will forfeit any unvested options. Additionally, the option agreements have certain repurchase features which provide that if an employee is terminated without cause or upon death or disability, Intelsat Global has the right for two years to repurchase any vested options, and any shares issued upon exercise of vested options, at the fair market value of the shares, less exercise price in the case of options, as determined on the termination date. In the event an employee resigns, Intelsat Global has the right to repurchase any vested options, and any shares issued upon exercise of vested options, at a price equal to the lesser of the fair market value of the shares at resignation and $100.00 per share, less the applicable exercise price of $25.00 per share.
During the successor period February 1, 2008 to December 31, 2008 we recognized $3.1 million of compensation expense related to the cancellation of 46,787 rollover options in return for cash during the period. Prior to the adoption of the 2008 Share Plan in May 2009, we calculated compensation expense related to the rollover options under the provisions of the 2005 Share Plan. For the year ended December 31, 2009, we recognized $12.1 million as compensation expense related to the rollover options. We recorded compensation
F-21
Table of Contents
INTELSAT S.A.
NOTES TO CONSOLIDATED FINANCIAL STATEMENTS—(Continued)
expense for these time vesting restricted options over the vesting period based on the intrinsic value at December 31, 2009, taking into consideration the repurchase features set forth in the underlying agreements. The intrinsic value of the rollover options at December 31, 2009 was $75.00 per share. Since the rollover options consisted of options to purchase shares of our indirect parent, Intelsat Global, compensation costs for vested options and the cost to repurchase options were reflected as capital contributions in the form of liabilities assumed by parent in the accompanying statements of shareholder’s equity (deficit).
A summary of the changes in Intelsat Global’s rollover options outstanding during the successor period February 1, 2008 to December 31, 2008 and the year ended December 31, 2009 is set forth below:
| Number of Shares |
Intrinsic Value | |||||
| Rollover options outstanding as of February 1, 2008 |
331,853 | $ | — | |||
| Forfeited |
(161,751 | ) | $ | — | ||
| Rollover options outstanding at December 31, 2008 |
170,102 | $ | — | |||
| Forfeited |
— | $ | — | |||
| Rollover options outstanding at December 31, 2009 |
170,102 | $ | 75.00 | |||
| Rollover options exercisable at December 31, 2009 |
160,569 | $ | 75.00 | |||
(iii) Class B Share Grants
In connection with the adoption of the 2008 Share Plan, 900,249 Class B Shares were awarded to employees of Intelsat Global and its subsidiaries. These shares are subject to transfer, vesting and other restrictions set forth in the applicable Class B restricted share agreements, as described below.
Class B Share Grants to Certain Executive Officers
The 480,830 Class B Shares issued to certain of our executive officers ( the” Class B Executive Officers”) as of May 6, 2009 are subject to time vesting, generally with 25% of the shares vested as of the date of grant and the remaining shares vesting in equal monthly installments of 1/45th per month commencing June 4, 2009 (the “Executive Officer Class B Time-Vesting Shares”). The remaining 75% of the Class B Shares are subject to annual performance-based vesting upon the achievement of certain adjusted EBITDA and revenue goals for 2008 and 2009 (and 2010 for individuals hired after the first quarter of 2008), as defined in the applicable agreements, subject to catch-up vesting upon achievement of targets in later years (the “Executive Officer Class B Performance Shares”).
In the event of a change in control, as defined in the 2008 Share Plan, the Executive Officer Class B Time-Vesting Shares become fully vested, and the Executive Officer Class B Performance Shares vest if certain principal shareholders of Intelsat Global, as defined in the applicable agreements (the “Principal Shareholders”), receive a three times multiple on their investment (four times if the change in control occurs after February 4, 2015). In the event the Class B Executive Officer dies or becomes disabled, such individual’s Executive Officer Class B Time-Vesting Shares become fully vested and such individual’s Executive Officer Class B Performance Shares cease vesting and unvested shares are forfeited, unless, within six months following such termination, an initial public offering occurs or Intelsat Global enters into a definitive agreement resulting in a change in control, in which case the unvested shares will be eligible to become vested as if a change in control had occurred immediately prior to termination (the “Executive Officer Transaction Vesting Protection”). In the event the Class B Executive Officer is terminated without cause or resigns for good reason (in either case as defined in the Class B Executive Officer’s employment
F-22
Table of Contents
INTELSAT S.A.
NOTES TO CONSOLIDATED FINANCIAL STATEMENTS—(Continued)
agreement) such individual’s Executive Officer Transaction Vesting Protection applies to both such individual’s Executive Officer Class B Time-Vesting Shares and such individual’s Executive Officer Class B Performance Shares, and if such termination occurs after certain service period obligations are met, 50% of such individual’s unvested Executive Officer Class B Time-Vesting Shares vest. In the event the Class B Executive Officer breaches any covenants contained in the applicable employment agreements, such individual will be required to repay Intelsat Global for all Class B Shares which vested during the twelve months preceding the breach of the covenant.
Class B Share Grants to All Other Awardees
419,419 restricted Class B Shares were issued effective as of May 8, 2009 to certain other members of management and key employees of Intelsat Global and its subsidiaries. Generally, five-sevenths of these Class B Shares are subject to time vesting, with 10% of the shares generally vesting six months after the later of February 4, 2008 or the date of hire, and the remaining shares vesting in equal monthly installments of 1/54th per month thereafter (the “Management Class B Time-Vesting Shares”). The remaining Class B Shares are subject to annual performance-based vesting upon the achievement of certain adjusted EBITDA and revenue goals for 2008 and 2009 (and 2010 for individuals hired after the first quarter of 2008), as defined in the applicable agreements, subject to catch-up vesting upon achievement of targets in later years (the “Management Class B Performance Shares”).
In the event of a change in control, as defined in the applicable agreement, the Management Class B Time-Vesting Shares become fully vested, and the Management Class B Performance Shares vest if the Principal Shareholders receive a three times multiple on their investment (four times if the change in control occurs after February 4, 2015).
In the event of the termination, death or disability of the holder, the respective Management Class B Time-Vesting Shares and Management Class B Performance Shares cease vesting and all unvested shares are forfeited. In the event of the holder’s termination of employment without cause, Intelsat Global may repurchase the shares generally for fair market value. If the termination is for cause, as defined in the 2008 Share Plan, the shares may be repurchased at a price per share equal to par value, and if the termination is due to the holder’s resignation, the repurchase price is defined in the 2008 Share Plan and applicable agreements.
Due to certain repurchase features in the 2008 Share Plan and the terms of the applicable restricted share agreements, all restricted Class B Share grants were classified as a liability of Intelsat Global. During the year ended December 31, 2009, we recorded compensation expense of $13.5 million related to these restricted Class B shares. We calculated compensation expense for the Executive Officer Class B Time-Vesting Shares ratably over the vesting period and for the Executive Officer Class B Performance Shares based on the performance-based vesting criteria specified in the applicable agreements. Compensation expense was based on the intrinsic value at December 31, 2009 of $44.44 per share for the Class B Executive Officers (which equaled fair value, based on our estimate, relying in part on a third party valuation) and $10.73 per share for all other awardees, although a different fair market value might apply to the repurchase terms of the awards applicable to an employee termination without cause. Since the Class B Share grants consisted of shares of our indirect parent, Intelsat Global, compensation costs for vested awards and the cost to repurchase shares were reflected as capital contributions in the form of liabilities assumed by parent in the accompanying statements of shareholder’s equity (deficit).
F-23
Table of Contents
INTELSAT S.A.
NOTES TO CONSOLIDATED FINANCIAL STATEMENTS—(Continued)
A summary of the changes in Intelsat Global’s restricted Class B Shares during the year ended December 31, 2009 is set forth below:
| Class B Executive Officers | All Other Awardees | |||||||||||
| Shares | Fair Value |
Shares | Fair Value | |||||||||
| Non-vested Class B Shares at January 1, 2009 |
— | $ | — | — | $ | — | ||||||
| Class B Shares granted on May 6, 2009 |
480,830 | $ | 10.73 | 419,419 | $ | 10.73 | ||||||
| Vested |
(177,333 | ) | $ | 10.73 | (167,500 | ) | $ | 10.73 | ||||
| Total non-vested Class B Shares at December 31, 2009 |
303,497 | $ | 44.44 | 251,919 | $ | 10.73 | ||||||
(iv) Class A Share Option Grants and SCAs
In connection with the adoption of the 2008 Share Plan, 707,351 Intelsat Global Class A SCAs were awarded to employees of Intelsat Global and its subsidiaries under SCAs at an exercise price of $100 per share (the “New 2008 SCAs”), and 377,795 Class A Share options were awarded to certain of our executive officers under option agreements at an exercise price of $100 per share. These awards are subject to transfer, vesting and other restrictions set forth in the various agreements, as described below.
Class A Share Option Grants to Certain Executive Officers
These options will vest with respect to 206,070 Class A Shares based upon the achievement of certain adjusted EBITDA and revenue goals for 2010, 2011 and 2012 (and 2013 for individuals hired after the first quarter of 2008), as defined in the applicable agreements, subject to catch-up vesting upon achievement of targets in later years or if the Principal Shareholders receive a three times multiple on their investment (four times if the change in control occurs after February 4, 2015) in connection with a change in control. Upon the occurrence of a change in control or other realization event for the Principal Shareholders, the options will vest ratably with respect to an additional 171,725 Class A Shares based upon a sliding scale of return on the Principal Shareholders’ investment from 3.3 times to 4.1 times. The options generally expire on the earliest to occur of: (i) February 4, 2018, (ii) 90 days following resignation without good reason, (iii) one year following termination without cause or for good reason or upon death or disability and (iv) the date of termination for cause. The options are subject to Executive Officer Transaction Vesting Protection following a termination due to death or disability, a termination without cause or a resignation for good reason. Additionally, in the event that the executive officer is terminated without cause or resigns for good reason following certain specified corporate transactions, the option will vest as if a change in control had occurred immediately prior to termination. The Class A Shares acquired upon exercise of the options are subject to repurchase rights similar to the rights specified in the executive officer’s Class B restricted share agreement. In the event the executive officer breaches any covenants contained in the executive officer’s employment agreement, such individual will be required to repay Intelsat Global an amount equal to the number of shares acquired pursuant to the option during the twelve months preceding the breach of the covenants, multiplied by the excess of the fair market value of the shares over the exercise price paid. These awards were deemed a grant of options to purchase Intelsat Global common shares under the guidance provided by FASB ASC 718.
During the year ended December 31, 2009, we recorded compensation expense of $0.5 million related to these Class A options. We calculated compensation expense for the Class A options based on the performance-based vesting criteria specified in the applicable agreements, the meeting of certain of the goals of which we have deemed to be probable as of December 31, 2009. Compensation expense was based on the intrinsic value at December 31, 2009 of $22.06 per share.
F-24
Table of Contents
INTELSAT S.A.
NOTES TO CONSOLIDATED FINANCIAL STATEMENTS—(Continued)
Class A SCAs for All Other Employees
Approximately 55% of the shares subject to the New 2008 SCAs will vest based upon the achievement of certain adjusted EBITDA and revenue goals for 2010, 2011 and 2012 (and 2013 for individuals hired after the first quarter of 2008), as defined in the applicable agreements, subject to catch-up vesting in certain circumstances, including upon achievement of targets in later years or if the Principal Shareholders receive a three times multiple on their investment (four times if the change in control occurs after February 4, 2015) in connection with a change in control, as defined. Approximately 45% of the shares subject to the New 2008 SCAs will vest upon the occurrence of a change in control or other realization event based upon a sliding scale of return on the Principal Shareholders’ investment from 3.3 times to 4.1 times. The New 2008 SCAs generally expire on the earliest to occur of: (i) February 4, 2018, (ii) 90 days following termination of employment, other than as a result of death or disability, (iii) one year following termination upon death or disability and (iv) the date of termination for cause. Class A Shares acquired upon exercise of the New 2008 SCAs are subject to repurchase rights of Intelsat Global similar to the rights specified in the agreements governing the restricted Class B Share grants. The New 2008 SCAs also contain restrictive covenants similar to those contained in the agreements governing the restricted Class B Share grants.
Any Class A Shares held by employees as a result of the exercise of the New 2008 SCAs can be repurchased at the lesser of fair market value and the exercise price in the event of voluntary termination by the employee and other defined circumstances. Since these repurchase features enable Intelsat Global to recover the shares without transferring any appreciation in value if the employee were to terminate voluntarily, the New 2008 SCAs were not deemed to be granted. The repurchase features provide that if an employee were to be terminated without cause or upon death or disability, Intelsat Global would have the right for two years to repurchase any vested shares issued upon exercise of the New 2008 SCAs at fair value as determined on the termination date.
Note 6 Retirement Plans and Other Retiree Benefits
(a) Pension and Other Postretirement Benefits
We maintain a noncontributory defined benefit retirement plan covering certain of our employees. The cost of providing benefits to eligible participants under the defined benefit retirement plan is calculated using the plan’s benefit formulas, which take into account the participants’ remuneration, dates of hire, years of eligible service, and certain actuarial assumptions. In addition, as part of the overall medical plan, we provide postretirement medical benefits to certain current retirees who meet the criteria under the medical plan for postretirement benefit eligibility.
The defined benefit retirement plan is subject to the provisions of the Employee Retirement Income Security Act of 1974, as amended. We expect that our future contributions to the defined benefit retirement plan will be based on the minimum funding requirements of the Internal Revenue Code and on the plan’s funded status. Recent market conditions have resulted in an unusually high degree of volatility and increased risks related to the short-term liquidity of certain investments held by our defined benefit plan, which could impact the value of the plan assets after the date of these consolidated financial statements. Additionally, any significant decline in the fair value of our defined benefit retirement plan assets could affect its funded status. The impact on the funded status as of October 1, the plan’s annual measurement date, is determined based upon market conditions in effect when we completed our annual valuation. Based on these criteria, we were not required to make additional contributions in 2009 to the defined benefit retirement plan, however we currently expect that we will be required to make additional contributions in 2010 of approximately $9.6 million under our defined benefit retirement plan and $4.0 million related to the funding of postretirement medical benefits under our medical plan.
We adopted the provision of FASB ASC Topic 715, Compensation—Retirement Benefits (“FASB ASC 715”), to recognize the overfunded or underfunded status of defined benefit and postretirement plans as an asset or liability in the consolidated statement of financial condition at December 31, 2007. Effective December 31,
F-25
Table of Contents
INTELSAT S.A.
NOTES TO CONSOLIDATED FINANCIAL STATEMENTS—(Continued)
2008, FASB ASC 715 requires an employer to measure defined benefit plan assets and obligations as of the date of the employer’s fiscal year-end. We previously performed this measurement at September 30 of each year. On January 1, 2008, we adopted the measurement date provision under the alternative transition method, utilizing a 15-month model for transition. Accordingly, we used our September 30, 2007 valuation to project 15 months of net periodic benefit cost and recognized three-fifteenths, or $0.4 million (net of tax), of such costs as an adjustment to accumulated deficit in January 2008.
Reconciliation of Funded Status and Accumulated Benefit Obligation. Expenses for our defined benefit retirement plan and for postretirement medical benefits that are provided under our medical plan are developed from actuarial valuations. The following summarizes the projected benefit obligations, plan assets and funded status of the defined benefit retirement plan, as well as the projected benefit obligations of the postretirement medical benefits provided under our medical plan (in thousands, except percentages):
| 15 Month Period Ended December 31, 2008 |
Year Ended December 31, 2009 |
|||||||||||||||
| Pension Benefits |
Other Post- retirement Benefits |
Pension Benefits |
Other Post- retirement Benefits |
|||||||||||||
| Change in benefit obligation |
||||||||||||||||
| Benefit obligation at beginning of period |
$ | 321,893 | $ | 76,763 | $ | 341,713 | $ | 78,295 | ||||||||
| Service cost |
3,145 | 1,183 | 2,774 | 781 | ||||||||||||
| Interest cost |
25,053 | 6,118 | 20,706 | 4,810 | ||||||||||||
| Employee contributions |
— | 544 | — | 451 | ||||||||||||
| Benefits paid |
(31,459 | ) | (4,440 | ) | (20,345 | ) | (4,017 | ) | ||||||||
| Plan amendments |
(1,645 | ) | — | — | — | |||||||||||
| Curtailment |
— | — | (51 | ) | — | |||||||||||
| Actuarial (gain) loss |
24,726 | (1,873 | ) | 22,043 | 4,529 | |||||||||||
| Benefit obligation at end of period |
$ | 341,713 | $ | 78,295 | $ | 366,840 | $ | 84,849 | ||||||||
| Change in plan assets |
||||||||||||||||
| Plan assets at beginning of period |
311,379 | $ | — | $ | 181,382 | $ | — | |||||||||
| Employer contributions |
1,120 | 3,896 | 655 | 3,566 | ||||||||||||
| Employee contributions |
— | 544 | — | 451 | ||||||||||||
| Actual return on plan assets |
(99,658 | ) | — | 46,608 | — | |||||||||||
| Benefits paid |
(31,459 | ) | (4,440 | ) | (20,345 | ) | (4,017 | ) | ||||||||
| Plan assets at fair value at end of period |
$ | 181,382 | $ | — | $ | 208,300 | $ | — | ||||||||
| Accrued benefits costs and Funded status of the plans |
$ | (160,331 | ) | $ | (78,295 | ) | $ | (158,540 | ) | $ | (84,849 | ) | ||||
| Accumulated benefit obligation |
$ | 331,114 | $ | 355,904 | ||||||||||||
| Weighted average assumptions used to determine accumulated benefit obligation and accrued benefit costs |
||||||||||||||||
| Discount rate |
6.27 | % | 6.30 | % | 5.88 | % | 5.95 | % | ||||||||
| Salary rate |
3.75 | % | — | 3.25 | % | — | ||||||||||
| Weighted average assumptions used to determine net periodic benefit costs |
||||||||||||||||
| Discount rate |
6.31 | % | 6.35 | % | 6.27 | % | 6.30 | % | ||||||||
| Expected rate of return on plan assets |
8.5 | % | — | 8.0 | % | — | ||||||||||
| Rate of compensation increase |
3.5 | % | — | 3.75 | % | — | ||||||||||
F-26
Table of Contents
INTELSAT S.A.
NOTES TO CONSOLIDATED FINANCIAL STATEMENTS—(Continued)
| 15 Month Period Ended December 31, 2008 |
Year Ended December 31, 2009 |
|||||||||||||||
| Pension Benefits |
Other Post- retirement Benefits |
Pension Benefits |
Other Post- retirement Benefits |
|||||||||||||
| Amounts in accumulated other comprehensive loss not yet recognized in net periodic benefit cost |
||||||||||||||||
| Actuarial (gain) loss, net of tax |
$ | 71,689 | $ | (2,905 | ) | $ | 69,178 | $ | (251 | ) | ||||||
| Prior service credits, net of tax |
(1,040 | ) | — | (932 | ) | — | ||||||||||
| Total |
$ | 70,649 | $ | (2,905 | ) | $ | 68,246 | $ | (251 | ) | ||||||
| Amounts in accumulated other comprehensive loss expected to be recognized in net periodic benefit cost in the subsequent year |
||||||||||||||||
| Actuarial loss |
$ | — | $ | — | $ | (3,641 | ) | $ | — | |||||||
| Prior service credits |
172 | — | 172 | — | ||||||||||||
| Total |
$ | 172 | $ | — | $ | (3,469 | ) | $ | — | |||||||
Yield curves matching our benefit obligations were derived from monthly bid-price bond data including corporate bonds and excluding bonds that are callable, make-whole, sinkable and putable as well as those for which the quoted yield-to-maturity is zero. Using this bond universe, regression analysis is used to identify the best-fitting regression curve that links yield-to-maturity providing match to data for both long and short maturities. The resulting regressed coupon yield curve is smoothly continuous along its entire length and represents an unbiased average of the observed market data and takes into account all information for both a single maturity and across all maturities.
Interest rates used in these valuations are key assumptions, including discount rates used in determining the present value of future benefit payments and expected return on plan assets, which are reviewed and updated on an annual basis. The discount rates reflect market rates for high-quality corporate bonds. We consider current market conditions, including changes in interest rates, in making assumptions. In establishing the expected return on assets assumption, we review the asset allocations considering plan maturity and develop return assumptions based on different asset classes. The return assumptions are established after reviewing historical returns of broader market indexes, as well as historical performance of the investments in the plan. Our pension plan assets are managed in accordance with an investment policy adopted by the pension committee, as discussed below.
Plan Assets. The investment policy of the Plan includes target allocation percentages of approximately 65% for investments in equity securities (49% U.S. equities and 16% non-U.S. equities) and 35% for investments in fixed income securities. There are restrictions on investment managers to prevent the concentration of investments in the securities of any one company or industry, the purchase of tax-exempt securities, direct investments in commodities and short sales and to impose other restrictions. Plan assets include investments in equity and bond funds, U.S. government securities funds and liquid reserve funds. The mutual funds in which the plans assets are invested are institutionally managed mutual funds with diversified exposures into multiple asset classes implemented with over 40 investment managers. The guidelines and objectives of the funds are congruent with the Intelsat investment policy statement.
F-27
Table of Contents
INTELSAT S.A.
NOTES TO CONSOLIDATED FINANCIAL STATEMENTS—(Continued)
The target and actual asset allocation of our pension plan assets was as follows:
| As of December 31, 2008 | As of December 31, 2009 | |||||||||||
| Target Allocation |
Actual Allocation |
Target Allocation |
Actual Allocation |
|||||||||
| Asset Category |
||||||||||||
| Equity securities |
65 | % | 59 | % | 65 | % | 67 | % | ||||
| Debt securities |
35 | % | 41 | % | 35 | % | 33 | % | ||||
| Total |
100 | % | 100 | % | 100 | % | 100 | % | ||||
The fair values of our pension plan assets by asset category are as follows (in thousands):
| Fair Value Measurements at December 31, 2008 |
Fair Value Measurements at December 31, 2009 | |||||
| Quoted Prices in Active Markets for Identical Assets (Level 1) |
Quoted Prices in Active Markets for Identical Assets (Level 1) | |||||
| Asset Category |
||||||
| Equity Securities |
||||||
| U.S. Large-Cap(1) |
$ | 69,404 | $ | 90,280 | ||
| U.S. Small/Mid-Cap(2) |
10,290 | 15,489 | ||||
| World Equity Ex-US(3) |
27,831 | 33,606 | ||||
| Fixed Income Securities |
||||||
| Long Duration Bonds(4) |
48,355 | 42,047 | ||||
| High Yield Bonds(5) |
15,427 | 18,182 | ||||
| Emerging Market Fixed income (Non-US)(6) |
9,665 | 8,345 | ||||
| Income earned but not yet received |
410 | 351 | ||||
| Total |
$ | 181,382 | $ | 208,300 | ||
| (1) | US large cap equity fund invests primarily in a portfolio of common stocks included in the S&P 500 Index, as well as other equity securities and derivative instruments whose value is derived from the performance of the S&P 500. |
| (2) | US small/mid cap equity fund invests primarily in a portfolio of common stocks included in the Russell 2500 Index. |
| (3) | World equity ex-US fund invests primarily in common stocks and other equity securities whose issuers comprise a broad range of capitalizations and are located outside of the U.S. The fund invests primarily in developed countries but may also invest in emerging markets. |
| (4) | Long duration bond fund seeks to duplicate the return characteristics of high quality corporate bonds with a duration range of 10-13 years. The fund’s investment strategy is designed to aid corporate pension plans with asset liability management in order to reduce funding status volatility caused by changes in interest rates. |
| (5) | High yield bond fund seeks to maximize return by investing primarily in a diversified portfolio of higher yielding, lower rated fixed income securities. The fund will invest primarily in securities rated below investment grade, including corporate bonds, convertible and preferred securities and zero coupon obligations. |
| (6) | Emerging markets debt fund seeks to maximize return investing in fixed income securities of emerging markets issuers. The fund will invest primarily in U.S. dollar denominated debt securities of government, government-related and corporate issuers in emerging market countries, as well as entities organized to restructure the outstanding debt of such issuers. |
F-28
Table of Contents
INTELSAT S.A.
NOTES TO CONSOLIDATED FINANCIAL STATEMENTS—(Continued)
Net periodic pension benefit costs included the following components (in thousands):
| Predecessor Entity | Successor Entity | |||||||||||||||||
| Year Ended December 31, 2007 |
Period January 1, 2008 to January 31, 2008 |
Period February 1, 2008 to December 31, 2008 |
Year Ended December 31, 2009 |
|||||||||||||||
| Service cost |
$ | 3,236 | $ | 217 | $ | 2,277 | $ | 2,774 | ||||||||||
| Interest cost |
17,758 | 1,621 | 18,569 | 20,706 | ||||||||||||||
| Expected return on plan assets |
(23,558 | ) | (2,014 | ) | (21,175 | ) | (20,573 | ) | ||||||||||
| Amortization of unrecognized prior service cost |
(391 | ) | (26 | ) | — | (172 | ) | |||||||||||
| Amortization of unrecognized net loss |
— | 18 | — | — | ||||||||||||||
| Total benefit |
(2,955 | ) | (184 | ) | (329 | ) | 2,735 | |||||||||||
| Curtailment gain |
(735 | ) | — | — | (55 | ) | ||||||||||||
| Net periodic (benefits) costs after curtailment |
$ | (3,690 | ) | $ | (184 | ) | $ | (329 | ) | $ | 2,680 | |||||||
We have accrued benefit costs at December 31, 2009 related to the pension benefits of $158.5 million, of which $0.6 million was recorded within other current liabilities and $157.9 million in other long-term liabilities, and accrued benefit costs at December 31, 2009 related to the other postretirement benefits of $84.8 million, of which $4.0 million was recorded in other current liabilities and $80.8 million was recorded in other long-term liabilities.
Net periodic other postretirement benefit costs included the following components (in thousands):
| Predecessor Entity | Successor Entity | |||||||||||||||
| Year Ended December 31, 2007 |
Period January 1, 2008 to January 31, 2008 |
Period February 1, 2008 to December 31, 2008 |
Year Ended December 31, 2009 | |||||||||||||
| Service cost |
$ | 1,576 | $ | 83 | $ | 850 | $ | 781 | ||||||||
| Interest cost |
4,240 | 387 | 4,570 | 4,810 | ||||||||||||
| Amortization of unrecognized prior service cost |
— | 10 | — | — | ||||||||||||
| Amortization of unrecognized net gain |
(96 | ) | (24 | ) | — | — | ||||||||||
| Curtailment gain |
(81 | ) | — | — | — | |||||||||||
| Total costs |
$ | 5,639 | $ | 456 | $ | 5,420 | $ | 5,591 | ||||||||
The effect of the New Sponsors Acquisition and the allocation of the purchase price to the individual assets acquired and liabilities assumed resulted in an increase to the projected benefit obligation of $43.2 million. Additionally, all previously existing net gain or loss, prior service cost or credits recognized in accumulated other comprehensive loss were eliminated in purchase accounting (see Note 3—New Sponsors Acquisition).
Depending upon our actual future health care claims, our actual costs may vary significantly from those projected above. As of both December 31, 2008 and December 31, 2009 the assumed health care cost trend rate of 9.0%. This rate is assumed to decrease gradually to 5.0% by the year 2017 and to remain at that level of annual increase thereafter. Increasing the assumed health care cost trend rate by 1% each year would increase the other postretirement benefits obligation as of December 31, 2009 by $8.8 million. Decreasing this trend rate by 1% each year would reduce the other postretirement benefits obligation as of December 31, 2009 by $7.5 million. A 1% increase or decrease in the assumed health care cost trend rate would have increased or decreased the net periodic other postretirement benefits cost for 2009 by $0.5 million.
F-29
Table of Contents
INTELSAT S.A.
NOTES TO CONSOLIDATED FINANCIAL STATEMENTS—(Continued)
The benefits expected to be paid in each of the next five years and in the aggregate for the five years thereafter are as follows (in thousands):
| Pension Benefits |
Other Post- retirement Benefits | |||||
| 2010 |
$ | 23,410 | $ | 4,195 | ||
| 2011 |
22,403 | 4,547 | ||||
| 2012 |
23,852 | 4,952 | ||||
| 2013 |
23,873 | 5,332 | ||||
| 2014 |
24,405 | 5,660 | ||||
| 2015 to 2019 |
132,289 | 34,028 | ||||
| Total |
$ | 250,232 | $ | 58,714 | ||
(b) Other Retirement Plans
We maintain two defined contribution retirement plans, qualified under the provisions of Section 401(k) of the Internal Revenue Code, for certain of our employees in the United States. We recognized compensation expense for these plans of $7.9 million, $0.5 million, $8.4 million, and $9.0 million, for the predecessor year ended December 31, 2007, the predecessor period January 1, 2008 to January 31, 2008, the successor period February 1, 2008 to December 31, 2008 and the year ended December 31, 2009, respectively. We also maintain other defined contribution retirement plans in several non-U.S. jurisdictions, but such plans are not material to our financial position or results of operations.
Note 7 Receivables
Receivables were comprised of the following (in thousands):
| As of December 31, 2008 |
As of December 31, 2009 |
|||||||
| Service charges: |
||||||||
| Billed |
$ | 301,789 | $ | 294,105 | ||||
| Unbilled |
13,934 | 10,918 | ||||||
| Other |
7,448 | 10,033 | ||||||
| Allowance for doubtful accounts |
(20,237 | ) | (20,517 | ) | ||||
| Total |
$ | 302,934 | $ | 294,539 | ||||
Unbilled service charges represent amounts earned and accrued as receivables from customers for their usage of our satellite system prior to the end of the period. Unbilled service charges are expected to be billed and collected within twelve months of the respective balance sheet date. Other receivables as of December 31, 2008 and 2009 include $2.2 million and $3.3 million, respectively, of receivables due from our parent, Intelsat Holdings.
F-30
Table of Contents
INTELSAT S.A.
NOTES TO CONSOLIDATED FINANCIAL STATEMENTS—(Continued)
Note 8 Satellites and Other Property and Equipment
(a) Satellites and Other Property and Equipment
Satellites and other property and equipment, including a satellite utilized under a capital lease agreement, were comprised of the following (in thousands):
| As of December 31, 2008 |
As of December 31, 2009 |
|||||||
| Satellites and launch vehicles |
$ | 5,372,439 | $ | 6,384,964 | ||||
| Information systems and ground segment |
332,750 | 377,237 | ||||||
| Buildings and other |
264,907 | 273,518 | ||||||
| Total cost |
5,970,096 | 7,035,719 | ||||||
| Less: accumulated depreciation |
(630,425 | ) | (1,253,764 | ) | ||||
| Total |
$ | 5,339,671 | $ | 5,781,955 | ||||
Satellites and other property and equipment, net as of December 31, 2008 and 2009 included construction-in-progress of $538.5 million and $1.1 billion, respectively. These amounts relate primarily to satellites under construction and related launch services. Interest costs of $56.9 million, $4.7 million, $60.9 million, and $78.8 million, were capitalized for the predecessor year ended December 31, 2007, the predecessor period January 1, 2008 to January 31, 2008, the successor period February 1, 2008 to December 31, 2008 and the year ended December 31, 2009, respectively. Included in satellites and launch vehicles is a satellite under capital lease, which at December 31, 2008 had a net book value of $2.8 million and was fully depreciated as of December 31, 2009. Carrying amounts as of December 31, 2009 reflect the fair value adjustments recorded in connection with the New Sponsors Acquisition (see Note 3—New Sponsors Acquisition).
We have entered into launch contracts for the launch of both specified and unspecified future satellites. Each of these launch contracts provides that such contract may be terminated at our option, subject to payment of a termination fee that increases in magnitude as the applicable launch date approaches. In addition, in the event of a failure of any launch, we may exercise our right to obtain a replacement launch within a specified period following our request for re-launch.
In August 2009, we purchased from Israel Aerospace Industries Ltd. its Amos-1 satellite, which is currently in inclined orbit, plus related ground assets. The satellite, with nine Ku-band transponders, had an estimated remaining useful life of 4.0 years at closing, and was purchased together with ground assets for $14.0 million, of which $7.0 million was paid at closing. As of December 31, 2009, the remaining $7.0 million was payable over the next two years. This satellite, which we renamed IS-24, began providing service in November 2009.
On October 29, 2009, we were selected as the successful bidder at a bankruptcy auction for the Protostar I satellite with an all cash offer of $210.0 million. The purchase of the satellite and related ground assets closed in December 2009. The satellite, with 16 Ku-band transponders, has an estimated remaining useful life of 15.5 years. This satellite, which was renamed IS-25, is expected to begin providing service in April 2010.
In December 2009, we purchased from SKY Perfect JSAT Corporation its JCSAT-R satellite, which is currently in inclined orbit, plus related ground assets. The satellite, with 28 Ku-band transponders and 12 C-band transponders, had an estimated remaining useful life of 5.0 years at closing, and was purchased together with ground assets for $5.0 million, of which $0.5 million was paid at closing. The remaining $4.5 million was paid in January 2010. This satellite, which was renamed IS-26, is expected to begin providing service in June 2010.
F-31
Table of Contents
INTELSAT S.A.
NOTES TO CONSOLIDATED FINANCIAL STATEMENTS—(Continued)
(b) Satellite Launches
On November 23, 2009, we successfully launched IS-14 satellite into orbit. This satellite replaces Intelsat 1R at 315º east longitude and serves programmers, government and corporate broadband customers in Latin America, Europe, and Africa. This satellite entered into service during December 2009.
On November 30, 2009, we successfully launched IS-15 satellite into orbit. This satellite replaces Intelsat 709 at 85º east longitude and serves programmers, government and corporate broadband customers in the Middle East, Indian Ocean region, and Russia. This satellite is expected to begin providing service in January 2010.
(c) Satellite Health
Our satellite fleet is diversified by manufacturer and satellite type, and as a result, our fleet is generally healthy. We have experienced some technical problems with our current fleet but have been able to minimize the impact of these problems on our customers, our operations and our business in recent years. Many of these problems have been component failures and anomalies that have had little long-term impact to date on the overall transponder availability in our satellite fleet. All of our satellites have been designed to accommodate an anticipated rate of equipment failures with adequate redundancy to meet or exceed their orbital design lives, and to date, this redundancy design scheme has proven effective. After each anomaly we have generally restored services for our customers on the affected satellite, provided alternative capacity on other satellites in our fleet, or provided capacity that we purchased from other satellite operators.
Significant Anomalies
On November 28, 2004, our Galaxy 27 satellite experienced a sudden anomaly in its north electrical distribution system which resulted in the loss of control of the satellite and the interruption of customer services on the satellite. Galaxy 27 is a FS 1300 series satellite manufactured by SS/L. Our engineers were able to regain command and control of Galaxy 27, and it was placed back in service, with reduced payload capacity, following operational testing. We have determined that the north electrical distribution system on Galaxy 27 and the communications capacity associated with it are not operational, and the satellite has lost redundancy in nearly all of its components. As a result, Galaxy 27 faces an increased risk of loss in the future. As of December 31, 2009, a substantial subset of Galaxy 27’s transponders, which are all powered by the south electrical distribution system, have been tested, are performing normally and are available for service to our customers. Some of these transponders are currently being used by our customers.
On January 14, 2005, our IS-804 satellite experienced a sudden and unexpected electrical power system anomaly that resulted in the total loss of the satellite. IS-804 was a Lockheed Martin 7000 series (the “LM 7000 series”) satellite, and as of December 31, 2009 we operated three other satellites in the LM 7000 series, IS-801, IS-802 and IS-805. Of these three satellites, only IS-805 remains in a primary role. Based on the report of the failure review board that we established with Lockheed Martin Corporation, we believe that the IS-804 failure was not likely to have been caused by an IS-804 specific workmanship or hardware element, but was most likely caused by a high current event in the battery circuitry triggered by an electrostatic discharge that propagated to cause the sudden failure of the high voltage power system. We therefore believe that although this risk exists for our other LM 7000 series satellites, the risk of any individual satellite having a similar anomaly is low.
On September 21, 2006, our IS-802 satellite experienced a reduction of electrical power capability that resulted in a degraded capability of the satellite. Eleven transponders on IS-802 were subsequently reactivated and are operating normally. The anomaly review board that we established with Lockheed Martin Corporation to
F-32
Table of Contents
INTELSAT S.A.
NOTES TO CONSOLIDATED FINANCIAL STATEMENTS—(Continued)
investigate the cause of the anomaly concluded that the IS-802 anomaly was most likely to have been caused by an electrical short internal to the solar array harness located on the south solar array boom. The anomaly review board found that this anomaly was significantly different from previous LM 7000 series spacecraft failures and was the first failure of this type on a solar array of the LM 7000 series. We therefore believe that, although this risk exists for our other LM 7000 series satellites, the risk of any individual satellite having a similar anomaly is low.
On June 29, 2008, our Galaxy 26 satellite experienced a sudden and unexpected electrical distribution anomaly causing the loss of a substantial portion of the satellite power generating capability and resulting in the interruption of some of the customer services on the satellite. Galaxy 26 is also a FS 1300 series satellite. Certain transponders continue to operate normally. However, the anomaly resulted in a reduction to the estimated remaining useful life of the satellite.
With respect to both the Galaxy 27 and Galaxy 26 anomalies, the failure review boards that we established with SS/L identified the likely root cause of the anomalies as a design flaw which is affected by a number of parameters and in some extreme cases can result in an electrical system anomaly. The design flaw also exists on IS-8. This satellite has been in service since November 1998 and has not experienced an electrical system anomaly. Along with the manufacturer, we continually monitor this problem and we have ordered a replacement for IS-8 expected to be launched in late 2012.
Other Anomalies
We have also identified three other types of common anomalies among the satellite models in our fleet, which have had an operational impact in the past and could, if they materialize, have an impact in the future. These are:
| • | failure of the on-board spacecraft control processor (“SCP”) in Boeing 601 (“BSS 601”) satellites; and |
| • | failure of the on-board XIPS used to maintain the in-orbit position of Boeing 601 High Power Series (“BSS 601 HP”) satellites; and |
| • | accelerated solar array degradation in early Boeing 702 (“BSS 702”) satellites. |
SCP Failures. Many of our satellites use an on-board SCP to provide automatic on-board control of many operational functions. SCPs are a critical component in the operation of such satellites. Each such satellite has a backup SCP, which is available in the event of a failure of the primary SCP. Certain BSS 601 satellites have experienced SCP failures. The risk of SCP failure appears to decline as these satellites age.
As of December 31, 2009, we operated five BSS 601 satellites: HGS-3, which is utilized by a third-party, IS-2, IS-3R, IS-4, which had previously experienced primary SCP failure and was operating on its backup SCP, and IS-26. These satellites have been identified as having heightened susceptibility to the SCP problem. On February 1, 2010, the backup SCP on IS-4 failed, resulting in a loss of the spacecraft. IS-4 carried commercial traffic and operated in a secondary role. Its failure did not cause a significant interruption of our business or require replacement of a satellite. IS-2, IS-3R and IS-26 have been in continuous operation since 1994, 1996 and 1997, respectively. Both primary and backup SCPs on these satellites are monitored regularly and remain fully functional. Accordingly, we believe it is unlikely that additional SCP failures will occur and we do not anticipate an interruption in business or early replacement of these satellites.
BSS 601 HP XIPS. The BSS 601 HP satellite uses XIPS as its primary propulsion system. There are two separate XIPS on each BSS 601 HP, each one of which is capable of maintaining the satellite in its orbital
F-33
Table of Contents
INTELSAT S.A.
NOTES TO CONSOLIDATED FINANCIAL STATEMENTS—(Continued)
position. The satellite also has a completely independent bi-propellant propulsion system as a backup to the XIPS. As a result, the failure of a XIPS on a BSS 601 HP typically would have no effect on the satellite’s performance or its operating life. However, the failure of both XIPS would require the use of the backup bi-propellant propulsion system, which could result in a shorter operating life for the satellite depending on the amount of bi-propellant fuel remaining. XIPS failures do not typically result in a catastrophic failure of the satellite or affect the communications capability of the satellite.
As of December 31, 2009, we operated four BSS 601 HP satellites, IS-5, IS-9, 1S-10 and Galaxy 13/Horizons-1. IS-5 and Galaxy 13/Horizons-1 continue to have both XIPS available as their primary propulsion system. IS-9 and IS-10 have experienced the failure of both XIPS and are operating on their backup bi-propellant systems. These two satellites are expected to be replaced by 2012. Our BSS 601 HP satellites have available bi-propellant fuel for a range of approximately two and a half to eight years from December 31, 2009. No assurance can be given that we will not have further XIPS failures that result in shortened satellite lives. We have decommissioned three satellites that had experienced failure of both XIPS. IS-6B was replaced by IS-11 during the first quarter of 2008, Galaxy 10R was replaced by Galaxy 18 during the second quarter of 2008, and Galaxy 4R was decommissioned in March 2009.
BSS 702 Solar Arrays. All of our satellites have solar arrays that power their operating systems and transponders and recharge the batteries used when solar power is not available. Solar array performance typically degrades over time in a predictable manner. Additional power margins and other operational flexibility are designed into satellites to allow for such degradation without loss of performance or operating life. Certain BSS 702 satellites have experienced greater than anticipated degradation of their solar arrays resulting from the design of the solar arrays. Such degradation, if continued, results in a shortened operating life of a satellite or the need to reduce the use of the communications payload.
As of December 31, 2009, we operated three BSS 702 satellites, two of which are affected by accelerated solar array degradation, Galaxy 11 and IS-1R. Service to customers has not been affected, and we expect that both of these satellites will continue to serve customers until we replace or supplement them with new satellites. Along with the manufacturer, we continually monitor the problem to determine its cause and its expected effect. Due to this continued degradation, Galaxy 11’s estimated end of service life is April 2015 and IS-1R’s estimated end of service life is February 2016. Both satellites are currently operating in secondary roles. The third BSS 702 satellite that we operated as of December 31, 2009, Galaxy 3C, was launched after the solar array anomaly was identified, and it has a substantially different solar array design intended to eliminate the problem. This satellite has been in service since September 2002 and has not experienced similar degradation problems.
Note 9 Investments
(a) WildBlue Communications, Inc.
Prior to December 15, 2009 we had an ownership interest of approximately 28% in WildBlue Communications, Inc. (“WildBlue”), a company offering broadband Internet access services in the continental United States via Ka-band satellite capacity. We accounted for our investment using the equity method of accounting. Because of a history of operating and on-going losses at WildBlue, the investment was determined to have a new basis of zero in connection with the allocation of the purchase price from the New Sponsors Acquisition at February 1, 2008. As of December 31, 2008 and 2009, our cumulative losses exceeded the investment, and as a result, the investment balance remained at zero and no additional losses from WildBlue were recognized.
F-34
Table of Contents
INTELSAT S.A.
NOTES TO CONSOLIDATED FINANCIAL STATEMENTS—(Continued)
On December 15, 2009, we sold our ownership interest in WildBlue to Viasat Inc. through a non-cash transaction whereby we exchanged our interest in WildBlue for shares of Viasat Inc. common stock. A gain on the sale was recorded within our consolidated statement of operations for $27.3 million during the year ended December 31, 2009.
(b) Horizons-1 and Horizons-2
As a result of our acquisition of PanAmSat Holdco and its subsidiaries on July 3, 2006 and related transactions (the “PanAmSat Acquisition Transactions”), we have a joint venture with JSAT International, Inc. (“JSAT”), a leading satellite operator in the Asia-Pacific region. The joint venture is named Horizons Satellite Holdings, LLC, and consists of two investments: Horizons-1 Satellite LLC (“Horizons-1”) and Horizons-2 Satellite LLC (“Horizons-2”). We provide certain services to the joint venture and utilize capacity from the joint venture.
Horizons-1 owns and operates the Ku-band portion of the Horizons-1 satellite in the fixed satellite services sector, offering service to customers in the Asia-Pacific region. We have a 50% ownership interest in Horizons-1, an investment which is accounted for under the equity method of accounting. Our share of the results of Horizons-1 is included in other income (expense), net in the accompanying consolidated statements of operations and was income of $0.2 million, $0.02 million, $0.2 million and $0.2 million for the predecessor year ended December 31, 2007, the predecessor period January 1, 2008 to January 31, 2008, the successor period February 1, 2008 to December 31, 2008, and the year ended December 31, 2009, respectively. The investment balance of $15.7 million and $12.6 million as of December 31, 2008 and 2009, respectively, was included within other assets in the accompanying consolidated balance sheets.
During the predecessor year ended December 31, 2007, the predecessor period January 1, 2008 to January 31, 2008, the successor period February 1, 2008 to December 31, 2008 and the year ended December 31, 2009, we recorded expenses of $3.9 million, $0.3 million, $3.5 million and $3.8 million, respectively, in relation to the utilization of Ku-band satellite capacity from Horizons-1. Additionally, we provide TT&C and administrative services for the Horizons-1 satellite. We recorded revenue for these services of $0.6 million, $0.1 million, $0.6 million and $0.6 million during the predecessor year ended December 31, 2007, the predecessor period January 1, 2008 to January 31, 2008, the successor period February 1, 2008 to December 31, 2008 and the year ended December 31, 2009, respectively.
We also have a revenue share agreement with JSAT related to services sold on the Horizons-1 satellite. We are responsible for the billing and collecting for all such services sold, but recognize revenue on a net basis. As a result of this agreement, we reduced revenue by $14.8 million, $1.1 million, $14.0 million and $14.9 million for the predecessor year ended December 31, 2007, the predecessor period January 1, 2008 to January 31, 2008, the successor period February 1, 2008 to December 31, 2008 and the year ended December 31, 2009, respectively. The payable due to JSAT was $2.0 million and $1.8 million as of December 31, 2008 and 2009, respectively.
On August 1, 2005, Intelsat Corp formed a second satellite joint investment with JSAT to build and launch a Ku-band satellite, Horizons–2. The Horizons-2 satellite was launched in December 2007 and placed into service in February 2008. Our investment is being accounted for using the equity method of accounting. The total future joint investment in Horizons-2 is expected to be $130.4 million as of December 31, 2009, of which each of the joint venture partners is required to fund their 50% share. Our share of the results of Horizons-2 is included in other income (expense), net in the accompanying consolidated statements of operations and was income of $0.3 million for the successor period February 1, 2008 to December 31, 2008 and the year ended December 31, 2009. As of December 31, 2008 and 2009, the investment balance of $79.2 million and $75.3 million,
F-35
Table of Contents
INTELSAT S.A.
NOTES TO CONSOLIDATED FINANCIAL STATEMENTS—(Continued)
respectively, and was included within other assets in the accompanying consolidated balance sheets. In connection with the New Sponsors Acquisition, there was no adjustment to the investment balance or the corresponding liability balance (see Note 3—New Sponsors Acquisition).
In connection with our investment in Horizons-2, we entered into a capital contribution and subscription agreement in August 2005, which requires us to fund our 50% share of the amounts due under Horizons-2’s loan agreement with a third-party lender. Pursuant to this agreement, we made contributions of $9.7 million and $12.2 million as of December 31, 2008 and 2009, respectively. We have entered into a security and pledge agreement with a third-party lender and, pursuant to this agreement, granted a security interest in our contribution obligation to the lender. Therefore, we have recorded this obligation as an indirect guarantee. We recorded a liability of $12.2 million within accrued liabilities as of December 31, 2008 and 2009, and a liability of $61.0 million and $48.8 million within other long-term liabilities as of December 31, 2008 and 2009, respectively, in the accompanying consolidated balance sheets.
We provide TT&C and administrative services for the Horizons-2 satellite. We did not receive any revenue for these services during the predecessor year ended December 31, 2007 or the predecessor period January 1, 2008 to January 31, 2008. We recorded revenue for these services of $0.7 million and $0.8 million during the successor period February 1, 2008 to December 31, 2008 and the year ended December 31, 2009, respectively. During the successor period February 1, 2008 to December 31, 2008 and the year ended December 31, 2009, we recorded expenses of $6.9 million and $7.1 million, respectively, in relation to the utilization of satellite capacity for the Horizons-2 satellite.
We also have a revenue share agreement with JSAT related to services sold on the Horizons-2 satellite. We are responsible for the billing and collecting for all such services sold, but recognize revenue on a net basis. As a result of this agreement, we reduced revenue by $6.8 million and $9.7 million for the successor period February 1, 2008 to December 31, 2008 and the year ended December 31, 2009, respectively. The amount payable to JSAT was $2.2 million and $1.8 million as of December 31, 2008 and 2009, respectively.
(c) New Dawn
In June 2008, we entered into a project and shareholders’ agreement (the “New Dawn Project Agreement”) with Convergence Partners pursuant to which New Dawn Satellite Company Ltd., a Mauritius company in which we have a 74.9% indirect ownership interest and Convergence Partners has a 25.1% noncontrolling ownership interest, intends to procure and launch a new satellite to provide satellite transponder services to customers in Africa. We currently expect the satellite to be launched during the fourth quarter of 2010.
New Dawn entered into a secured loan financing arrangement, which is non-recourse to New Dawn’s shareholders, including us and our wholly-owned subsidiaries, beyond the shareholders’ scheduled capital contributions, on December 5, 2008 to obtain $215.0 million of financing to fund a portion of the cost of construction and launch of the new satellite (see Note 11—Long-Term Debt). In addition, we and Convergence Partners have agreed to make certain capital contributions to New Dawn in proportion to our respective ownership interests in New Dawn to fund a portion of these costs. Out of the total equity contributions of $18.3 million in 2008, our initial capital contributions were $13.7 million and Convergence Partners’ contributions were $4.6 million. Total equity contributions during 2009 were $1.5 million, of which $1.1 million were attributable to Intelsat with the remaining $0.4 million contributed by Convergence Partners. New Dawn and its subsidiaries are unrestricted subsidiaries for purposes of applicable indentures and credit agreements of Intelsat and its wholly-owned subsidiaries.
F-36
Table of Contents
INTELSAT S.A.
NOTES TO CONSOLIDATED FINANCIAL STATEMENTS—(Continued)
We have agreed to provide sales and marketing services, engineering and administrative support services, and have agreed to perform satellite-related consulting and technical services for New Dawn. The services include the provision of program management services with respect to the satellite and launch vehicle construction programs as well as TT&C services for the new satellite. In addition, for a fee of $15.0 million together with assumption of continuing payment obligations, we assigned New Dawn a launch service contract to provide for the launch of the New Dawn satellite.
Convergence Partners has at its option the ability to require Intelsat to buy its ownership interest at fair value subsequent to the operations of New Dawn’s assets for a period as defined in the New Dawn Project Agreement. As a result of this option, as of each balance sheet date, we have reflected within mezzanine equity the estimated amount that we would pay to Convergence Partners as if the option was exercised. This amount reflects the fair value analysis we performed at December 31, 2009, which resulted in a $4.4 million increase in the fair value. The $4.4 million change in fair value is shown as a reduction in our paid-in capital at December 31, 2009. We have assessed the significance of the Level 3 inputs to the overall valuation and have concluded that the valuation in its entirety is classified in Level 3 of the fair value hierarchy (see Note 2—Significant Accounting Policies).
As of December 31, 2009, we consolidated New Dawn within our consolidated financial statements, net of eliminating entries. Additionally, we accounted for the percentage interest in New Dawn owned by Convergence Partners as a noncontrolling interest. We recorded the transaction in accordance with the guidance provided under the Distinguishing Liabilities from Equity topic of the Codification specifically related to the classification and measurement of redeemable securities during the first quarter of 2009.
Note 10 Goodwill and Other Intangible Assets
The carrying amounts of goodwill and acquired intangible assets not subject to amortization consist of the following (in thousands):
| As of December 31, 2008 |
As of December 31, 2009 | |||||
| Goodwill |
$ | 6,774,334 | $ | 6,780,827 | ||
| Trade name |
70,400 | 70,400 | ||||
| Orbital locations |
2,886,800 | 2,387,700 | ||||
We account for goodwill and other intangible assets in accordance with FASB ASC 350 and have deemed these assets to have indefinite lives. Under FASB ASC 350, we perform an annual goodwill impairment analysis during the fourth quarter of each year and whenever events and circumstances indicate that the carrying value may not be recoverable. The following is a discussion of our impairment analysis and methodology:
Goodwill. We follow a two-step process to evaluate if a potential impairment exists to our recorded amounts of goodwill and tradename. The first step of the process is to compare the reporting unit’s fair value to its carrying value, including goodwill. In the event the carrying value of our reporting unit exceeds its fair value, goodwill is considered impaired and the second step is required. The second step requires us to calculate a hypothetical purchase allocation to compare the current implied fair value of the goodwill to the current carrying value of the goodwill. The implied fair value of goodwill is determined in the same manner as the amount of goodwill recognized in a business combination, which is the excess of the fair value over the aggregate fair values of the individual assets, liabilities and identifiable intangibles, as if they were being acquired in a business
F-37
Table of Contents
INTELSAT S.A.
NOTES TO CONSOLIDATED FINANCIAL STATEMENTS—(Continued)
combination. If the implied fair value of goodwill as described above exceeds recorded goodwill, there is no impairment. If the recorded goodwill exceeds the implied fair value, an impairment charge would be recorded for the excess. Furthermore, an impairment loss cannot exceed the amount of goodwill assigned to a reporting unit. After recognizing the impairment loss, the corresponding loss establishes a new basis in the goodwill. Subsequent reversals of goodwill impairment losses are not permitted under applicable accounting standards.
We determined the estimated fair value of our reporting unit using discounted cash flow analysis, along with independent source data related to comparative market multiples and, when available, recent transactions which are all considered Level 3 inputs within the fair value hierarchy under FASB ASC 820. The discounted cash flows were derived from a five-year projection of revenues and expenses plus a residual value, with the resulting projected cash flows discounted at an appropriate weighted average cost of capital. The analysis, which was completed in the fourth quarter of 2009, did not result in an impairment of our goodwill intangible.
Trade name. We have implemented the relief from royalty method to determine the estimated fair value of the Intelsat trade name. The relief from royalty analysis is comprised of two major steps: i) a determination of the hypothetical royalty rate, and ii) the subsequent application of the royalty rate to projected revenue. In determining the hypothetical royalty rate utilized in the relief from royalty approach, we considered comparable license agreements, operating earnings benchmark rule of thumb, an excess earnings analysis to determine aggregate intangible asset earnings, and other qualitative factors which are all considered Level 3 inputs within the fair value hierarchy under FASB ASC 820. Based on our analysis, the fair value of the Intelsat trade name as of the fourth quarter of 2009 was not impaired.
Orbital Locations. We are authorized by governments to operate satellites at certain orbital locations – i.e., longitudinal coordinates along the Clarke Belt. The Clarke Belt is the part of space approximately 42,165 kilometers above the plane of the equator where geostationary orbit may be achieved. Various governments acquire rights to these orbital locations through filings made with the International Telecommunication Union (the “ITU”), a sub-organization of the United Nations. We will continue to have rights to operate at our orbital locations so long as we maintain our authorizations to do so.
We determined the estimated fair value of our right to operate at orbital locations using the build up method to determine the cash flows for the income approach, with the resulting projected cash flows discounted at an appropriate weighted average cost of capital. In instances where the build up method did not generate positive value for the right to operate at an orbital location, but the right was expected to generate revenue, we assigned a value based upon independent source data for recent transactions of similar orbital locations which are all considered Level 3 inputs within the fair value hierarchy under FASB ASC 820. The analysis, which was completed in the fourth quarter 2008, led to the recording of a non-cash impairment charge of $326.8 million.
During the first quarter of 2009, the credit markets continued to experience difficulties, with new debt issuances being priced at significantly higher effective interest rates as compared to the pricing of debt issuances completed in prior periods. The higher effective interest rates reflected, in our view, higher discounts being applied in the valuation of companies generally, and were therefore considered by us to be an indicator of potential impairment to the fair value of our right to operate at orbital locations. The higher interest rates resulted in an increase to our weighted average cost of capital, and led to our recognizing a non-cash impairment charge of $499.1 million in the first quarter of 2009.
F-38
Table of Contents
INTELSAT S.A.
NOTES TO CONSOLIDATED FINANCIAL STATEMENTS—(Continued)
The carrying amount and accumulated amortization of acquired intangible assets subject to amortization consisted of the following (in thousands):
| As of December 31, 2008 | As of December 31, 2009 | |||||||||||||||||||
| Gross Carrying Amount |
Accumulated Amortization |
Net Carrying Amount |
Gross Carrying Amount |
Accumulated Amortization |
Net Carrying Amount | |||||||||||||||
| Backlog and other |
$ | 743,760 | $ | (146,745 | ) | $ | 597,015 | $ | 743,760 | $ | (270,905 | ) | $ | 472,855 | ||||||
| Customer relationships |
534,030 | (8,266 | ) | 525,764 | 534,030 | (28,366 | ) | 505,664 | ||||||||||||
| Technology |
2,700 | (1,204 | ) | 1,496 | 2,700 | (2,620 | ) | 80 | ||||||||||||
| Total |
$ | 1,280,490 | $ | (156,215 | ) | $ | 1,124,275 | $ | 1,280,490 | $ | (301,891 | ) | $ | 978,599 | ||||||
Intangible assets are amortized based on the expected pattern of consumption. As of December 31, 2009, backlog and other, customer relationships and technology had weighted-average useful lives of four years, thirteen years and two years, respectively. We recorded amortization expense of $93.5 million, $7.8 million, $156.2 million and $145.7 million for the year ended December 31, 2007, the predecessor period January 1, 2008 to January 31, 2008, the successor period February 1, 2008 to December 31, 2008 and the year ended December 31, 2009, respectively.
Scheduled amortization charges for the intangible assets over the next five years are as follows (in thousands):
| Year |
Amount | ||
| 2010 |
$ | 130,281 | |
| 2011 |
105,451 | ||
| 2012 |
91,781 | ||
| 2013 |
82,311 | ||
| 2014 |
68,231 | ||
In the first quarter of 2009, the FASB revised FASB ASC 350 to provide additional guidance for determining the useful life of intangible assets. The revised guidance provides that we are required to disclose on an interim and annual basis our policy related to the renewal or extension of the term of our intangible assets. Our policy is to expense all costs incurred to renew or extend the terms of our intangible assets. The renewal expenses for the year ended December 31, 2009 were immaterial to our results of operations.
F-39
Table of Contents
INTELSAT S.A.
NOTES TO CONSOLIDATED FINANCIAL STATEMENTS—(Continued)
Note 11 Long-Term Debt
The carrying amounts and fair values of our notes payable and long-term debt were as follows (in thousands):
| As of December 31, 2008 | As of December 31, 2009 | |||||||||||||
| Amount | Fair Value | Amount | Fair Value | |||||||||||
| Intelsat S.A.: |
||||||||||||||
| 6.5% Senior Notes due November 2013 |
$ | 700,000 | $ | 364,000 | $ | 353,550 | $ | 328,802 | ||||||
| Unamortized discount on 6.5% Senior Notes |
(215,885 | ) | — | (92,653 | ) | — | ||||||||
| 7.625% Senior Notes due April 2012 |
600,000 | 369,600 | 485,841 | 478,553 | ||||||||||
| Unamortized discount on 7.625% Senior Notes |
(118,883 | ) | — | (71,932 | ) | — | ||||||||
| Total Intelsat S.A. obligations |
965,232 | 733,600 | 674,806 | 807,355 | ||||||||||
| Intelsat Luxembourg: |
||||||||||||||
| 11.25% Senior Notes due February 2017 |
2,805,000 | 1,654,950 | 2,805,000 | 2,812,013 | ||||||||||
| 11.5% / 12.5% Senior PIK Election Notes due |
2,258,815 | 1,061,643 | 2,149,991 | 2,106,991 | ||||||||||
| Total Intelsat Luxembourg obligations |
5,063,815 | 2,716,593 | 4,954,991 | 4,919,004 | ||||||||||
| Intelsat Jackson: |
||||||||||||||
| 11.25% Senior Notes due June 2016 |
1,048,220 | 921,385 | 1,048,220 | 1,132,078 | ||||||||||
| Unamortized premium on 11.25% Senior Notes |
6,184 | — | 5,619 | — | ||||||||||
| 11.5% Senior Notes due June 2016 |
284,595 | 224,830 | 284,595 | 306,651 | ||||||||||
| 9.5% Senior Notes due June 2016 |
701,913 | 642,952 | 701,913 | 751,047 | ||||||||||
| 9.25% Senior Notes due June 2016 |
55,035 | 49,862 | 55,035 | 55,794 | ||||||||||
| Senior Unsecured Credit Facilities due February 2014 |
195,152 | 121,970 | 195,152 | 176,515 | ||||||||||
| New Senior Unsecured Credit Facilities due |
810,876 | 506,798 | 810,876 | 733,437 | ||||||||||
| 8.5% Senior Notes due 2019 |
— | — | 500,000 | 513,750 | ||||||||||
| Unamortized discount on 8.5% Senior Notes |
— | — | (4,119 | ) | — | |||||||||
| Note payable to Intelsat Holdings S.A. |
34,000 | 34,000 | — | — | ||||||||||
| Total Intelsat Jackson obligations |
3,135,975 | 2,501,797 | 3,597,291 | 3,669,272 | ||||||||||
| Intermediate Holdco: |
||||||||||||||
| 9.25% aggregate principal amount at maturity of $4,545 Senior Discount Notes due February 2015 |
4,125 | 3,119 | 4,516 | 4,640 | ||||||||||
| 9.5% aggregate principal amount at maturity of $481,020 Senior Discount Notes due February 2015 |
435,072 | 328,914 | 477,385 | 490,513 | ||||||||||
| Total Intermediate Holdco obligations |
439,197 | 332,033 | 481,901 | 495,153 | ||||||||||
F-40
Table of Contents
INTELSAT S.A.
NOTES TO CONSOLIDATED FINANCIAL STATEMENTS—(Continued)
| As of December 31, 2008 | As of December 31, 2009 | |||||||||||||
| Amount | Fair Value | Amount | Fair Value | |||||||||||
| Intelsat Sub Holdco: |
||||||||||||||
| 8.25% Senior Notes due January 2013 |
400 | 368 | — | — | ||||||||||
| 8.5% Senior Notes due January 2013 |
883,346 | 813,562 | 883,346 | 901,013 | ||||||||||
| 8.625% Senior Notes due January 2015 |
430 | 390 | — | — | ||||||||||
| 8.875% Senior Notes due January 2015 |
681,012 | 616,997 | 681,012 | 703,145 | ||||||||||
| Senior Secured Credit Facilities due July 2013 |
337,855 | 269,608 | 334,408 | 317,420 | ||||||||||
| 8.875% Senior Notes due January 2015, Series B |
— | — | 400,000 | 413,000 | ||||||||||
| Unamortized discount on 8.875% Senior Notes |
— | — | (73,759 | ) | — | |||||||||
| Capital lease obligations |
2,050 | 2,050 | 191 | 191 | ||||||||||
| 7% Note payable to Lockheed Martin Corporation |
10,000 | 10,000 | 5,000 | 5,000 | ||||||||||
| Total Intelsat Sub Holdco obligations |
1,915,093 | 1,712,975 | 2,230,198 | 2,339,769 | ||||||||||
| New Dawn: |
||||||||||||||
| Senior Secured Debt Facility |
— | — | 72,652 | 72,652 | ||||||||||
| Mezzanine Facility Term Loan |
— | — | 42,137 | 42,137 | ||||||||||
| New Dawn obligations |
— | — | 114,789 | 114,789 | ||||||||||
| Intelsat Corp: |
||||||||||||||
| Senior Secured Credit Facilities due January 2014 |
1,751,260 | 1,320,450 | 1,733,391 | 1,630,427 | ||||||||||
| Unamortized discount on Senior Secured Credit Facilities |
(13,052 | ) | — | (10,785 | ) | — | ||||||||
| Senior Secured Credit Facilities due July 2012 |
275,830 | 237,214 | 204,648 | 195,644 | ||||||||||
| 9% Senior Notes due August 2014 |
1,016 | 859 | — | — | ||||||||||
| 9.25% Senior Notes due August 2014 |
658,119 | 556,111 | 658,119 | 676,217 | ||||||||||
| 9% Senior Notes due January 2016 |
10 | 9 | — | — | ||||||||||
| 9.25% Senior Notes due June 2016 |
580,720 | 526,131 | 580,719 | 599,592 | ||||||||||
| 6.875% Senior Secured Debentures due |
125,000 | 72,500 | 125,000 | 104,688 | ||||||||||
| Unamortized discount on 6.875% Senior Secured Debentures |
(24,882 | ) | — | (24,369 | ) | — | ||||||||
| Total Intelsat Corp obligations |
3,354,021 | 2,713,274 | 3,266,723 | 3,206,568 | ||||||||||
| Total Intelsat S.A. long-term debt |
14,873,333 | $ | 10,710,272 | 15,320,699 | $ | 15,551,910 | ||||||||
| Less: |
||||||||||||||
| Current portion of capital lease obligations |
1,859 | 191 | ||||||||||||
| Current portion of long-term debt |
97,499 | 97,498 | ||||||||||||
| Total current portion |
99,358 | 97,689 | ||||||||||||
| Total long-term debt, excluding current portion |
$ | 14,773,975 | $ | 15,223,010 | ||||||||||
F-41
Table of Contents
INTELSAT S.A.
NOTES TO CONSOLIDATED FINANCIAL STATEMENTS—(Continued)
The fair value for publicly traded instruments is determined using quoted market prices and, for non-publicly traded instruments, fair value is based upon composite pricing from a variety of sources, including market leading data providers, market makers, and leading brokerage firms. Substantially all of the inputs used to determine the fair value are classified as Level 1 inputs within the fair value hierarchy from FASB ASC 820, except our senior secured credit facilities, the inputs for which are classified as Level 2. The fair values of the New Dawn obligations and the note payable to Lockheed Martin Corporation approximate their respective book values.
Required principal repayments of long-term debt, excluding payments on capital lease obligations, over the next five years and thereafter as of December 31, 2009 are as follows (in thousands):
| Year |
Amount | ||
| 2010 |
$ | 97,498 | |
| 2011 |
94,724 | ||
| 2012 |
573,560 | ||
| 2013 |
1,592,016 | ||
| 2014 |
3,343,498 | ||
| 2015 and thereafter |
9,894,873 | ||
| Total |
$ | 15,596,169 | |
Description of Indebtedness
(a) Intelsat S.A.
Senior Notes due 2013
Intelsat S.A. had $353.6 million in aggregate principal amount of 2013 Senior Notes outstanding at December 31, 2009 (the “2013 Senior Notes”). These notes bear interest at 6 1/2% annually and mature in November 2013.
Interest is payable on the 2013 Senior Notes semi-annually on May 1 and November 1 of each year. Intelsat S.A. may redeem some or all of the 2013 Senior Notes at any time at the redemption prices set forth in the 2013 Senior Notes. Intelsat S.A. may also redeem the outstanding 2013 Senior Notes in whole in the event of certain tax changes affecting the senior notes, as set forth in the indenture governing the 2013 Senior Notes. The 2013 Senior Notes are senior unsecured obligations of Intelsat S.A. and rank equally with Intelsat S.A.’s other senior unsecured indebtedness.
Senior Notes due 2012
Intelsat S.A. had $485.8 million in aggregate principal amount of 2012 Senior Notes outstanding at December 31, 2009 (the “2012 Senior Notes”). These notes bear interest at 7 5/8% annually and mature in April 2012.
Interest is payable on the 2012 Senior Notes semi-annually on April 15 and October 15 of each year. Intelsat S.A. may redeem some or all of the 2012 Senior Notes at any time at the redemption prices set forth in the 2012 Senior Notes. Intelsat S.A. may also redeem the outstanding 2012 Senior Notes in whole in the event of certain tax changes affecting the 2012 Senior Notes, as set forth in the indenture governing the 2012 Senior Notes. The 2012 Senior Notes are senior unsecured obligations of Intelsat S.A. and rank equally with Intelsat S.A.’s other senior unsecured indebtedness.
F-42
Table of Contents
INTELSAT S.A.
NOTES TO CONSOLIDATED FINANCIAL STATEMENTS—(Continued)
(b) Intelsat Luxembourg
Senior Notes due 2017
Intelsat Luxembourg had $2.8 billion in aggregate principal amount of 2017 Senior Notes at December 31, 2009 (the “2017 Senior Notes”). These notes bore interest at 7 7/8% on and prior to August 4, 2008, and bear interest at 11 1/4% after August 4, 2008. The notes mature in February of 2017. Interest on the 2017 Senior Notes is payable semi-annually on August 15 and February 15, commencing on August 15, 2008. The 2017 Senior Notes are senior unsecured obligations of Intelsat Luxembourg and rank equally with Intelsat Luxembourg’s other senior unsecured indebtedness. The 2017 Senior Notes are guaranteed by Intelsat S.A.
Senior PIK Election Notes due 2017
Intelsat Luxembourg had $2.1 billion in aggregate principal amount of Senior PIK Election Notes due 2017 (the “2017 PIK Notes”) at December 31, 2009. The notes mature in February of 2017. Interest on the 2017 PIK Notes is payable semi-annually on August 15 and February 15, commencing on August 15, 2008. The 2017 PIK Notes are senior unsecured obligations of Intelsat Luxembourg and rank equally with Intelsat Luxembourg’s other senior unsecured indebtedness. The 2017 PIK Notes are guaranteed by Intelsat S.A.
Intelsat Luxembourg may, at its option, elect to pay interest on the 2017 PIK Notes (i) entirely in cash, (ii) entirely in PIK interest or (iii) 50% in cash and 50% in payment-in-kind (“PIK”) interest, through February 15, 2013. After February 15, 2013, interest on the 2017 PIK Notes will be payable in cash. Cash interest on the 2017 PIK Notes accrued at the rate of 7.53% on and prior to August 4, 2008, and accrues at 11 1/2% after August 4, 2008. If we elect to pay in PIK interest, the applicable PIK interest rate will be the cash pay interest rate in effect during the period plus 100 basis points. If we elect to pay any PIK interest, we will either increase the principal amount of the outstanding 2017 PIK Notes or issue new 2017 PIK Notes to holders of the 2017 PIK Notes in an amount equal to the amount of PIK interest for the applicable interest payment period.
We have elected to pay interest on the 2017 PIK Notes entirely in PIK interest through August 14, 2010.
(c) Intelsat Jackson
11 1/4% Senior Notes due 2016 and 11 1/2% Senior Notes due 2016
Intelsat Jackson had $1.0 billion in aggregate principal amount of its 11 1/4% Senior Notes due 2016 (the “2016 Notes”) and $284.6 million in aggregate principal amount of its 11 1/2% Senior Notes due 2016 (the “New 2016 Notes”) outstanding at December 31, 2009. The 2016 Notes and the New 2016 Notes are guaranteed by Intelsat S.A.
Interest is payable on both the 2016 Notes and the New 2016 Notes (collectively, the “Intelsat Jackson Senior Notes”) semi-annually on June 15 and December 15. Intelsat Jackson may redeem some or all of the Intelsat Jackson Senior Notes at any time prior to June 15, 2011 at a price equal to 100% of the principal amount thereof plus the make-whole premium described in the respective notes. Thereafter, Intelsat Jackson may redeem some or all of the respective notes at the applicable redemption prices set forth in the respective notes. The Intelsat Jackson Senior Notes are senior unsecured obligations of Intelsat Jackson and rank equally with Intelsat Jackson’s other senior unsecured indebtedness.
F-43
Table of Contents
INTELSAT S.A.
NOTES TO CONSOLIDATED FINANCIAL STATEMENTS—(Continued)
9 1/4% Senior Notes due 2016 and 9 1/2% Senior Notes due 2016
Intelsat Jackson had $55.0 million in aggregate principal amount of its 9 1/4% Senior Notes due 2016 (the “2016 Guaranteed Notes”) and $701.9 million in aggregate principal amount of its 9 1/2% Senior Notes due 2016 (the “New 2016 Guaranteed Notes”) outstanding at December 31, 2009. The 2016 Guaranteed Notes and the New 2016 Guaranteed Notes are guaranteed by Intelsat S.A., Intelsat Luxembourg, Intelsat Sub Holdco and certain of its subsidiaries.
Interest is payable on both the 2016 Guaranteed Notes and the New 2016 Guaranteed Notes (collectively, the “Intelsat Jackson Guaranteed Notes”) semi-annually on June 15 and December 15. Intelsat Jackson may redeem some or all of the Intelsat Jackson Guaranteed Notes at any time prior to June 15, 2011 at a price equal to 100% of the principal amount thereof plus the make-whole premium described in the respective notes. Thereafter, Intelsat Jackson may redeem some or all of the respective notes at the applicable redemption prices set forth in the respective notes. The Intelsat Jackson Guaranteed Notes are senior unsecured obligations of Intelsat Jackson and rank equally with Intelsat Jackson’s other senior unsecured indebtedness.
8 1/2% Senior Notes due 2019
Intelsat Jackson had $500.0 million in aggregate principal amount of its 8 1/2% Senior Notes due 2019 (the “2019 Notes”) outstanding at December 31, 2009. The 2019 Notes are guaranteed by Intelsat S.A., Intelsat Luxembourg, Intelsat Sub Holdco and certain of its subsidiaries.
Interest is payable on the 2019 Notes semi-annually on May 1 and November 1. Intelsat Jackson may redeem some or all of the 2019 Notes at any time prior to November 1, 2014 at a price equal to 100% of the principal amount thereof plus the make-whole premium described in the respective notes. Thereafter, Intelsat Jackson may redeem some or all of the respective notes at the applicable redemption prices set forth in the respective notes.
The 2019 Notes are senior unsecured obligations of Intelsat Jackson and rank equally with Intelsat Jackson’s other senior unsecured indebtedness.
Intelsat Jackson Senior Unsecured Credit Agreement
Intelsat Jackson has a senior unsecured credit facility consisting of a senior unsecured term loan facility due 2014 with $195.2 million outstanding at December 31, 2009. As discussed above, pursuant to the Intelsat Bermuda Transfer, the Intelsat Jackson Senior Unsecured Credit Agreement was transferred to Intelsat Jackson, and Intelsat Bermuda executed a supplemental agreement pursuant to which it became a guarantor of the Intelsat Jackson Senior Unsecured Credit Agreement.
Borrowings under the Intelsat Jackson Senior Unsecured Credit Agreement bear interest at either (i) London Interbank Offered Rate (“LIBOR”) plus 250 basis points or (ii) the Above Bank Rate (“ABR”), which is the rate for any day equal to the higher of (a) the Federal Funds Rate plus1/2 of 1.00% and (b) the rate of interest in effect for such day as its prime rate, plus 150 basis points.
Borrowings under the Intelsat Jackson Senior Unsecured Credit Agreement are prepayable at any time without premium or penalty. With respect to a change in control or asset sales, the Intelsat Jackson Unsecured Credit Agreement contains substantially the same prepayment provisions as the 2016 Guaranteed Notes (as defined above).
F-44
Table of Contents
INTELSAT S.A.
NOTES TO CONSOLIDATED FINANCIAL STATEMENTS—(Continued)
Borrowings under the Intelsat Jackson Senior Unsecured Credit Agreement are guaranteed by Intelsat S.A., Intelsat Luxembourg, Intelsat Sub Holdco and all of Intelsat Sub Holdco’s subsidiaries that guarantee the 2016 Guaranteed Notes and the 2019 Notes.
New Intelsat Jackson Senior Unsecured Credit Agreement
On July 1, 2008, Intelsat Jackson entered into the New Intelsat Jackson Senior Unsecured Credit Agreement, consisting of a senior unsecured term loan facility due 2014 with $810.9 million outstanding at December 31, 2009.
Borrowings under the New Intelsat Jackson Senior Unsecured Credit Agreement bear interest at either (i) LIBOR plus 300 basis points or (ii) the ABR, which is the rate for any day equal to the higher of (a) the Federal Funds Rate plus 50 basis points or (b) the prime rate, plus 200 basis points. With respect to a change in control or asset sales, the New Intelsat Jackson Senior Unsecured Credit Agreement contains substantially the same prepayment provisions as the Intelsat Jackson Senior Unsecured Credit Agreement.
Borrowings under the New Intelsat Jackson Senior Unsecured Credit Agreement are guaranteed by Intelsat S.A., Intelsat Luxembourg, Intelsat Sub Holdco and all of Intelsat Sub Holdco’s subsidiaries that guarantee the 2016 Guaranteed Notes and the 2019 Notes.
(d) Intermediate Holdco
Senior Discount Notes due 2015
Intermediate Holdco had $4.5 million in aggregate principal amount at maturity of 9 1/ 4% Senior Discount Notes due 2015 (the “2015 Discount Notes”) outstanding at December 31, 2009.
Until February 1, 2010, interest accrued on the 2015 Discount Notes at the rate of 9 1/4% per annum in the form of an increase in the accreted value (representing amortization of original issue discount) between the date of original issuance and February 1, 2010. Cash interest is payable on the 2015 Discount Notes semi-annually on February 1 and August 1, beginning on August 1, 2010.
The 2015 Discount Notes are senior unsecured obligations of Intermediate Holdco and Intelsat S.A. and rank equally with the other senior unsecured indebtedness of Intermediate Holdco and Intelsat S.A. Borrowings under the 2015 Discount Notes are guaranteed by Intelsat Luxembourg and Intelsat Jackson.
New Senior Discount Notes due 2015
On June 27, 2008, Intermediate Holdco issued $481.0 million in aggregate principal amount at maturity of 9 1/2% Senior Discount Notes due 2015 (the “New 2015 Senior Discount Notes”) in a private placement.
Until February 1, 2010, interest accrued on the New 2015 Senior Discount Notes at the rate of 9 1/2% per annum in the form of an increase in the accreted value (representing amortization of original issue discount) between the date of original issuance and February 1, 2010. Cash interest is payable on the New 2015 Discount Notes semi-annually on February 1 and August 1, beginning on August 1, 2010.
Intermediate Holdco may redeem some or all of the New 2015 Senior Discount Notes at any time prior to February 1, 2010 at a price equal to 100% of the accreted value of the New 2015 Senior Discount Notes plus the make-whole premium described in the New 2015 Senior Discount Notes. On and after February 1, 2010,
F-45
Table of Contents
INTELSAT S.A.
NOTES TO CONSOLIDATED FINANCIAL STATEMENTS—(Continued)
Intermediate Holdco may redeem some or all of the New 2015 Senior Discount Notes at any time at the redemption prices set forth in the New 2015 Senior Discount Notes.
The New 2015 Senior Discount Notes are senior unsecured obligations of Intermediate Holdco and Intelsat S.A. and rank equally with the other senior unsecured indebtedness of Intermediate Holdco and Intelsat S.A. Borrowings under the New 2015 Senior Discount Notes are guaranteed by Intelsat Luxembourg and Intelsat Jackson.
(e) Intelsat Sub Holdco
8 1/2% Senior Notes due 2013 and 8 7/8% Senior Notes due 2015
On June 27, 2008, Intelsat Sub Holdco issued $883.3 million of Senior Notes due 2013, bearing interest at 8 1/2% (guaranteed by certain subsidiaries), and $681.0 million of Senior Notes due 2015, bearing interest at 8 7/8% (guaranteed by certain subsidiaries) (collectively, the “New Sub Holdco Senior Notes”).
Interest is payable on the New Sub Holdco Senior Notes semi-annually on January 15 and July 15. Intelsat Sub Holdco may redeem some or all of the 8 7/8 % Senior Notes due 2015 at any time prior to January 15, 2010, at a price equal to 100% of the principal amount thereof plus the make-whole premium described in the respective notes. Thereafter, Intelsat Sub Holdco may redeem some or all of the New Sub Holdco Senior Notes at a price equal to 100% of the principal amount thereof plus the make-whole premium described in the respective notes.
The New Sub Holdco Senior Notes are senior unsecured obligations of Intelsat Sub Holdco and rank equally with Intelsat Sub Holdco’s other senior unsecured indebtedness. The New Sub Holdco Senior Notes are guaranteed by Intelsat S.A., Intelsat Luxembourg, Intelsat Jackson, Intermediate Holdco and certain subsidiaries of Intelsat Sub Holdco.
8 7/8% Senior Notes due 2015, Series B
On February 12, 2009, Intelsat Sub Holdco issued $400.0 million of Senior Notes due 2015 (the “2015 Senior Notes”), bearing interest at 8 7/8% (guaranteed by certain subsidiaries).
Interest is payable on the 2015 Senior Notes semi-annually on January 15 and July 15. Intelsat Sub Holdco may redeem some or all of the 8 7/8% Senior Notes due 2015 at any time prior to January 15, 2010, at a price equal to 100% of the principal amount thereof plus the make-whole premium described in the respective notes. Thereafter, Intelsat Sub Holdco may redeem some or all of the 2015 Senior Notes at a price equal to 100% of the principal amount thereof plus the make-whole premium described in the respective notes.
The 2015 Senior Notes are senior unsecured obligations of Intelsat Sub Holdco and rank equally with Intelsat Sub Holdco’s other senior unsecured indebtedness. The 2015 Senior Notes are guaranteed by Intelsat S.A., Intelsat Luxembourg, Intelsat Jackson, Intermediate Holdco and certain subsidiaries of Intelsat Sub Holdco.
At the date of issuance of the 2009 Sub Holdco Notes, we determined that these debt instruments contained a contingent put option clause within the host contract, which affords the holders of the notes the option to require the issuer to repurchase such notes at 101% of their principal amount in the event of a change of control, as defined in the indenture governing the notes. In our evaluation of the financing arrangement, we concluded that the contingent put option required bifurcation in accordance with current accounting standards under FASB
F-46
Table of Contents
INTELSAT S.A.
NOTES TO CONSOLIDATED FINANCIAL STATEMENTS—(Continued)
ASC 815. We were therefore required to bifurcate the contingent put option and carry it as a derivative liability at fair value. We estimated the fair value of the derivative on the date of inception using a standard valuation technique, which places the most significant emphasis upon the estimated date and probability of a change of control and incorporates the issue price, maturity date and change of control put price. The fair value of the embedded derivative was calculated at $36.0 million upon inception and $14.6 million at December 31, 2009. The allocation of a portion of the proceeds from the debt issuance to the fair value of the embedded derivative resulted in an additional discount to the carrying value of the 2009 Sub Holdco Notes. The additional discount will be amortized in the consolidated statements of operations using the effective interest method over the term of the 2009 Sub Holdco Notes. Additionally, the embedded derivative will be adjusted to fair value at the end of each reporting period with any change in fair value recognized through earnings (see Note 12—Derivative Instruments and Hedging Activities—Put Option Embedded Derivative Instrument).
Senior Secured Credit Facilities
On January 25, 2008, Intelsat Sub Holdco entered into Amendment No. 2 to its amended and restated credit agreement (the “Sub Holdco Credit Agreement”), which became effective upon the consummation of the New Sponsors Acquisition and amended and modified the Sub Holdco Credit Agreement.
The senior secured credit facilities as amended to date consist of:
| • | a $344.8 million senior secured term loan facility with a seven-year maturity; |
| • | a $270.8 million senior secured revolving credit facility with a six-year maturity; and |
| • | a $50.0 million incremental revolving credit facility provision. |
The revolving credit facility is available on a revolving basis and terminates on July 3, 2012. $200.0 million of the revolving credit facility is available for issuance of letters of credit. Additionally, $35.0 million of the revolving credit facility is available for swingline loans. Both the face amount of any outstanding letters of credit and any swingline loans will reduce availability under the revolving credit facility on a dollar for dollar basis.
Following an amendment on January 25, 2008, interest rates for the term loan portion of the Sub Holdco Credit Agreement range, at the option of Intelsat Sub Holdco, (i) from the LIBOR rate plus 1.75% to the LIBOR rate plus 2.00%, or (ii) the ABR, which is the rate for any day (rounded upwards, if necessary, to the next 1/16 of 1.00%) equal to the greater of (a) the prime rate in effect on such day or (b) the Federal Funds Rate in effect on such day plus 1/2 of 1.00%, as defined in the Sub Holdco Credit Agreement, plus 0.75%, to the ABR plus 1.00%, depending on certain financial measures. Interest rates for the revolving credit facility portion of the Sub Holdco Credit Agreement range, at the option of Intelsat Sub Holdco, (i) from LIBOR plus 2.00% to LIBOR plus 2.50% or (ii) the ABR plus 1.00% to the ABR plus 1.50%, depending on certain financial measures. The ABR and LIBOR, plus the applicable margins, are determined as specified in the Sub Holdco Credit Agreement, as amended.
Intelsat Sub Holdco is required to pay a commitment fee for the unused commitments under the revolving credit facility, if any, at a rate per annum of 3/8%. Both the face amount of any outstanding letters of credit and any swingline loans reduce availability under the revolving credit facility on a dollar for dollar basis. Obligations under the Sub Holdco Credit Agreement are guaranteed by certain of Intelsat Sub Holdco’s subsidiaries, as well as by Intelsat Luxembourg, Intelsat Jackson and Intermediate Holdco, and secured by a perfected first priority security interest to the extent legally permissible in substantially all of the tangible and intangible assets of the borrower and guarantors, with certain agreed exceptions.
F-47
Table of Contents
INTELSAT S.A.
NOTES TO CONSOLIDATED FINANCIAL STATEMENTS—(Continued)
No amounts were outstanding under the revolving credit facility as of December 31, 2009; however, $22.9 million in letters of credit were issued and outstanding under the facility. The borrowing availability under the revolving credit facility was $247.9 million at such date. Under the terms of the credit agreements governing both Intelsat Sub Holdco’s senior secured credit facilities and Intelsat Corp’s amended and restated senior credit facilities, the ability of each company to borrow under its respective revolving credit facility is subject to compliance by each company’s indirect parent, Intelsat S.A., under a senior secured debt covenant included in the indenture governing the 2012 Senior Notes and the 2013 Senior Notes. As a result, under certain circumstances, Intelsat Sub Holdco may not be able to borrow up to the full amount of borrowing availability under its revolving credit facility if Intelsat Corp has certain amounts outstanding under its revolving credit facility, and Intelsat Corp may not be able to borrow up to the full amount of borrowing availability under its revolving credit facility if Intelsat Sub Holdco has certain amounts outstanding under its revolving credit facility.
The credit agreement governing Intelsat Sub Holdco’s senior secured credit facilities and the indentures governing all our outstanding notes contain a number of restrictive covenants that impose significant operating and financial restrictions on us. The senior secured credit facilities also include a financial covenant that requires the borrower to maintain compliance with a Consolidated Secured Debt to Consolidated EBITDA Ratio (as defined in the Sub Holdco Credit Agreement) of less than or equal to 1.5 to 1.0. We were in compliance with this financial maintenance covenant ratio with a Consolidated Secured Debt to Consolidated EBITDA Ratio of 0.02:1.00 as of December 31, 2009. In addition, the senior secured credit facilities require that the borrower use a portion of the proceeds of certain asset sales, in excess of specified amounts, that are not reinvested in the business, to repay indebtedness under such facilities. The credit agreement governing the senior secured credit facilities and the indentures governing the outstanding notes also include covenants (subject to a number of qualifications) restricting, among other things, our ability and certain of our subsidiaries’ ability to pay dividends, or make redemptions, repurchases or distributions with respect to capital stock; make certain loans or investments; engage in mergers, acquisitions, asset sales and sale and lease-back transactions; and engage in transactions with affiliates.
(f) Intelsat New Dawn
New Dawn Credit Facilities
On December 5, 2008, New Dawn entered into a $215.0 million secured financing arrangement that consists of a senior and mezzanine term loan facilities. The credit facilities are non-recourse to New Dawn’s shareholders, including us and our wholly-owned subsidiaries, beyond the shareholders’ scheduled capital contributions. The senior facility provides for a commitment of up to $125.0 million. The interest rate on term loans under the senior facility is the aggregate of the LIBOR plus an applicable margin between 3.0% and 4.0% and certain costs, if incurred. The mezzanine facility provides for a commitment of up to $90.0 million. The interest rate on term loans under the mezzanine facility is the aggregate of LIBOR plus an applicable margin between 5.3% and 6.3% and certain costs, if incurred. New Dawn is required to pay a commitment fee at a rate per annum of 1/2% on any unused commitments under the credit facilities. During the twelve months ended December 31, 2009, New Dawn incurred satellite related capital expenditures of $97.9 million.
(g) Intelsat Corp
Senior Secured Credit Facilities
On January 25, 2008, Intelsat Corp entered into Amendment No. 2 to the Intelsat Corp Amended and Restated Credit Agreement, which became effective upon the consummation of the New Sponsors Acquisition. On February 4, 2008, in connection with the New Sponsors Acquisition, Intelsat Corp also executed a Joinder Agreement by and among Intelsat Corp, the several lenders party thereto and certain other parties, to the Intelsat
F-48
Table of Contents
INTELSAT S.A.
NOTES TO CONSOLIDATED FINANCIAL STATEMENTS—(Continued)
Corp Amended and Restated Credit Agreement pursuant to which it incurred an additional $150.0 million in aggregate principal amount of Tranche B-2 Term Loan.
Intelsat Corporation’s senior secured credit facilities consist of:
| • | a $355.9 million senior secured Term Loan A-3 Facility with a six-year maturity; |
| • | a $1,785.1 million senior secured Term Loan B-2 Facility with a seven and one half-year maturity; |
| • | a $175.0 million senior secured revolving credit facility with a six-year maturity; and |
| • | a $75.0 million incremental revolving credit facility provision. |
The revolving credit facility is available on a revolving basis and terminates on July 3, 2012. $150.0 million of the revolving credit facility is available for issuance of letters of credit. Additionally, a portion of the revolving credit facility is available for swingline loans. Both the face amount of any outstanding letters of credit and any swingline loans will reduce availability under the revolving credit facility on a dollar for dollar basis. Following the amendment on January 25, 2008, interest rates for the term loan portion of the Intelsat Corp Amended and Restated Credit Agreement range, at the option of Intelsat Corp, (i) from LIBOR plus 1.75% to LIBOR plus 2.50% or (ii) the ABR plus 0.75% to the ABR plus 1.50%, depending on certain financial measures. Interest rates for the revolving credit facility portion of the Intelsat Corp Amended and Restated Credit Agreement range, at the option of Intelsat Corp, (i) from LIBOR plus 2.50% to LIBOR plus 2.875% or (ii) the ABR plus 1.50% to the ABR plus 1.875%, depending on certain financial measures. The ABR and LIBOR, plus the applicable margins, are determined as specified in the Intelsat Corp Amended and Restated Credit Agreement, as amended.
Intelsat Corp is required to pay a commitment fee for the unused commitments under the revolving credit facility, if any, at a rate per annum of 0.375%. Certain of the collateral pledged to secure Intelsat Corp’s obligations under its senior secured credit facilities is shared with the holders of Intelsat Corp’s $125.0 million 6 7/ 8% Senior Secured Debentures due 2028.
No amounts were outstanding under the revolving credit facility as of December 31, 2009; however, $2.1 million in letters of credit were issued and outstanding under the facility. The borrowing availability under the revolving credit facility was $152.2 million at December 31, 2009. Under the terms of the credit agreements governing both Intelsat Sub Holdco’s senior secured credit facilities and Intelsat Corp’s amended and restated senior credit facilities, the ability of each company to borrow under its respective revolving credit facility is subject to compliance by each company’s indirect parent, Intelsat S.A., under a senior secured debt covenant included in the indenture governing Intelsat S.A.’s outstanding senior notes. As a result, under certain circumstances, Intelsat Corp may not be able to borrow up to the full amount of borrowing availability under its revolving credit facility if Intelsat Sub Holdco has certain amounts outstanding under its revolving credit facility.
The credit agreement governing the Intelsat Corp senior secured credit facilities and the indentures governing our outstanding notes described below contain a number of restrictive covenants that impose significant operating and financial restrictions on us. The senior secured credit facilities also include a financial covenant that requires the borrower to maintain a Consolidated Secured Debt to Consolidated EBITDA Ratio (as defined in the Intelsat Corp Amended and Restated Credit Agreement) of less than or equal to 4.5 to 1.0. We were in compliance with this financial maintenance covenant ratio, with a Consolidated Secured Debt to Consolidated EBITDA Ratio of 2.57:1.00, as of December 31, 2009. In addition, the senior secured credit facilities require that the borrower use a portion of the proceeds of certain asset sales, in excess of specified amounts, that are not reinvested in the business, to repay indebtedness under such facilities. The credit agreement
governing the senior secured credit facilities and the indentures governing the outstanding notes also include
F-49
Table of Contents
INTELSAT S.A.
NOTES TO CONSOLIDATED FINANCIAL STATEMENTS—(Continued)
covenants (subject to a number of qualifications) restricting, among other things, our ability and certain of our subsidiaries’ ability to pay dividends, or make redemptions, repurchases or distributions with respect to capital stock; make certain loans or investments; engage in mergers, acquisitions, asset sales and sale and lease-back transactions; and engage in transactions with affiliates.
9 1/4% Senior Notes due 2014
Intelsat Corp had $658.1 million in aggregate principal amount of its 9 1/4% Senior Notes due 2014, (the “New Intelsat Corp 2014 Senior Notes”) outstanding at December 31, 2009.
Interest on these notes is payable semi-annually on February 15 and August 15 of each year. If Intelsat Corp makes certain asset sales, Intelsat Corp may be required to offer to repurchase some or all of these notes at a purchase price equal to 100% of the principal amount plus accrued and unpaid interest and Special Interest (as defined in the Intelsat Corp 2014 Senior Notes), if any.
The New Intelsat Corp 2014 Senior Notes are senior unsecured obligations of Intelsat Corp and rank equally with Intelsat Corp’s other senior unsecured indebtedness.
9 1/4% Senior Notes due 2016
Intelsat Corp had $580.7 million of its 9 1/4% Senior Notes due 2016, (the “Intelsat Corp 2016 Senior Notes”) outstanding at December 31, 2009.
Interest on these notes is payable semi-annually on June 15 and December 15 of each year. Prior to June 15, 2011, Intelsat Corp has the option to redeem all or a portion of these notes at a price equal to 100% of the principal amount thereof plus a “make-whole” premium; Intelsat Corp has the option to redeem all or a portion of these notes on or after June 15, 2011 at par plus accrued interest plus a premium equal to 4 1/2%, which premium shall decline ratably on each yearly anniversary of the date of issuance to zero on the date that is two years prior to the maturity date of these notes. If Intelsat Corp makes certain asset sales, it may be required to offer to repurchase some or all of these notes at a purchase price equal to 100% of the principal amount plus accrued and unpaid interest, if any.
The Intelsat Corp 2016 Senior Notes are senior unsecured obligations of Intelsat Corp and rank equally with Intelsat Corp’s other senior unsecured indebtedness.
6 7/8% Senior Secured Debentures due 2028
The 6 7/8% Senior Secured Debentures due 2028, (the “Intelsat Corp Senior Debentures”) were issued pursuant to an indenture, dated January 16, 1998. The Intelsat Corp Senior Debentures are limited to $125.0 million aggregate principal amount, all of which is presently outstanding. The indenture governing these securities contains limitations on Intelsat Corp’s ability to incur liens and enter into sale and lease-back transactions. These debentures are secured equally and ratably with respect to certain pledged collateral under Intelsat Corp’s senior secured credit facilities.
2008 and 2009 Debt Transactions
During 2008 and 2009, we engaged in a number of transactions relating to our debt, as summarized below.
New Sponsors Acquisition Financing
See Note 3—New Sponsors Acquisition for a description of the financing of this transaction.
F-50
Table of Contents
INTELSAT S.A.
NOTES TO CONSOLIDATED FINANCIAL STATEMENTS—(Continued)
Change of Control Offers
The New Sponsors Acquisition resulted in a change of control under the indentures governing certain of our outstanding series of notes and the Intelsat Jackson Senior Unsecured Credit Agreement, giving the holders of those notes and loans the right to require us to repurchase such notes and repay such loans at 101% of their principal amount, plus accrued interest to the date of repurchase or repayment. During the second and third quarters of 2008, the relevant entities completed each such change of control offer, financing the repurchases and repayment through backstop unsecured credit agreement borrowings or with proceeds from offerings of notes and a new unsecured term loan borrowing.
The following principal amounts were tendered and repurchased or repaid in the change of control offers:
| • | $281.8 million of Intelsat Jackson’s 11 1/4% Senior Notes due 2016; |
| • | $695.0 million of Intelsat Jackson’s 9 1/4% Senior Notes due 2016; |
| • | $804.8 million of loans outstanding under the Intelsat Jackson Senior Unsecured Credit Agreement; |
| • | $408.1 million of Intermediate Holdco’s $478.7 million aggregate principal amount at maturity of 9 1 /4% Senior Discount Notes due 2015; |
| • | $874.6 million of Intelsat Sub Holdco’s 8 1/ 4% Senior Notes due 2013; |
| • | $674.3 million of Intelsat Sub Holdco’s 8 5/8% Senior Notes due 2015; |
| • | $651.6 million of Intelsat Corp’s 9% Senior Notes due 2014; and |
| • | $575.0 million of Intelsat Corp’s 9% Senior Notes due 2016. |
2008 Debt Refinancings
On June 27, 2008, Intelsat Luxembourg issued $2.81 billion of the 2017 Senior Notes and $2.23 billion of the 2017 PIK Notes described above. Proceeds from the issuance of the 2017 Senior Notes and the 2017 PIK Notes were used to repay in full the $4.96 billion of borrowings under bridge loan credit agreements. On June 27, 2008, Intelsat Sub Holdco repaid $883.3 million of borrowings under a backstop senior unsecured credit agreement due 2013 and $681.0 million of borrowings under a backstop senior unsecured credit agreement due 2015 with the proceeds of an offering of the New Sub Holdco Senior Notes described above. On June 27, 2008, Intermediate Holdco repaid borrowings under a backstop senior unsecured credit agreement due 2015 with the proceeds of an offering of the New 2015 Senior Discount Notes described above.
On July 1, 2008, Intelsat Jackson issued the New 2016 Notes and the New 2016 Guaranteed Notes described above. The proceeds of these notes were used, together with cash on hand, to fund the repurchase of 2016 Notes and 2016 Guaranteed Notes tendered in change of control offers. Intelsat Jackson also repaid loans tendered in a change of control offer relating to the Intelsat Jackson Senior Unsecured Credit Agreement with borrowings under the New Intelsat Jackson Senior Unsecured Credit Agreement described above, together with cash on hand. On July 18, 2008, Intelsat Corp repaid $658.1 million of borrowings under a backstop senior unsecured credit agreement due 2014 and $580.7 million of borrowings under a backstop senior unsecured credit agreement due 2016 with the proceeds of an offering of the New Intelsat Corp Senior Notes due 2014 and the Intelsat Corp Senior Notes due 2016 described above.
F-51
Table of Contents
INTELSAT S.A.
NOTES TO CONSOLIDATED FINANCIAL STATEMENTS—(Continued)
2009 Debt Transactions
On February 12, 2009, Intelsat Sub Holdco purchased $114.2 million principal amount of the 2012 Senior Notes described above for $93.3 million and $346.5 million principal amount of the 2013 Senior Notes described above for $254.6 million pursuant to a tender offer. Also, Intelsat Sub Holdco completed an offering of $400.0 million aggregate principal amount at maturity of the 2015 Senior Notes described above, which yielded $348.3 million of proceeds at issuance.
On July 31, 2009, Intelsat Sub Holdco redeemed the approximately $0.4 million principal amount of its outstanding 8 5/8% Senior Notes due 2015 and the approximately $0.4 million principal amount of its outstanding 8 1/4% Senior Notes due 2013. On July 31, 2009, Intelsat Corp redeemed the approximately $1.0 million principal amount of its outstanding 9% Senior Notes due 2014 and the approximately $0.01 million principal amount of its outstanding 9% Senior Notes due 2016.
On October 20, 2009, Intelsat Jackson, completed an offering of the 2019 Notes described above. Intelsat Jackson paid a dividend of a portion of the cash proceeds of the offering to Intelsat Luxembourg in an amount equal to the price paid by Intelsat Luxembourg to purchase $400.0 million face amount of the 2017 PIK Notes from Banc of America Securities LLC at a discount. Intelsat Luxembourg then canceled the purchased 2017 PIK Notes.
Note 12 Derivative Instruments and Hedging Activities
Interest Rate Swaps
We are subject to interest rate risk primarily associated with our variable rate borrowings. Interest rate risk is the risk that changes in interest rates could adversely affect earnings and cash flows. Specific interest rate risk includes: the risk of increasing interest rates on short-term debt; the risk of increasing interest rates for planned new fixed long-term financings; and the risk of increasing interest rates for planned refinancing using long-term fixed rate debt. In order to mitigate this risk, we have entered into interest rate swap agreements to reduce the impact of interest rate movements on future interest expense by converting substantially all of our floating-rate debt to a fixed rate.
As of December 31, 2009, we held interest rate swaps with an aggregate notional amount of $3.3 billion with maturities ranging from 2010 to 2014. These swaps were entered into as further described below to economically hedge the variability in cash flow on a portion of the floating-rate term loans under our senior secured and unsecured credit facilities, but have not been designated as hedges for accounting purposes. On a quarterly basis, we receive a floating rate of interest on a $3.0 billion notional amount equal to the three-month LIBOR and pay a fixed rate of interest. Additionally, on a $312.5 million notional amount, we receive a floating rate of interest equal to the one-month LIBOR plus a spread and pay a floating rate of interest equal to the three-month LIBOR.
In July 2009, New Dawn entered into two floating to fixed interest rate swaps to hedge future interest payments on loans under New Dawn’s senior and mezzanine term loan facilities. The first interest rate swap has an effective date of August 4, 2009 with varying notional amounts maturing on July 7, 2011. We receive an interest rate of three-month LIBOR and pay a fixed coupon of 1.55%. Interest payments for each quarterly period are deferred until the maturity date and all the accrued interest will be paid at maturity. The second interest rate swap has an effective date of July 7, 2011, maturing on July 7, 2014, with a notional amount of $65.5 million for mezzanine loans and varying notional amounts for underlying senior loans. We receive an interest rate of three-month LIBOR and pay a fixed coupon of 3.72%. Both these swaps were undesignated as hedges for accounting purposes.
F-52
Table of Contents
INTELSAT S.A.
NOTES TO CONSOLIDATED FINANCIAL STATEMENTS—(Continued)
In June 2009, we entered into an interest rate basis swap with an aggregate notional principal amount of $312.5 million that will mature on March 15, 2010. Under this basis swap, we will pay interest based on the three month LIBOR rate and receive interest based on the one month LIBOR rate plus a fixed spread.
In February 2008, we entered into five-year interest rate swaps with an effective date of March 14, 2008 to hedge interest expense on an aggregate notional amount of $2.35 billion expected to mature on March 14, 2013. Certain of these swaps contain options covering a notional amount of $717.0 million that would effectively permit us to terminate the underlying swaps on March 14, 2011, prior to the stated maturity of March 14, 2013. If we exercise the options, the cash flows (excluding accrued and unpaid interest) for the underlying swap and those from the options are expected to offset one another.
On March 14, 2005, our indirect wholly-owned subsidiary, Intelsat Corp, entered into a five-year interest rate swap to hedge interest expense on a notional amount of $1.25 billion of debt. On March 14, 2008, under the original terms of the swap agreement, the notional amount was reduced to $625.0 million, at which level it will remain until expiration on March 14, 2010. This swap was entered into to reduce the variability in cash flow on a portion of our floating-rate term loans. On a quarterly basis, we receive a floating rate of interest equal to the three-month LIBOR and pay a fixed rate of interest that is subject to scheduled rate increases.
The counterparties to such agreements are highly rated financial institutions. In the unlikely event that the counterparties fail to meet the terms of the interest rate swaps, our exposure is limited to the interest rate differential on the notional amount at each quarterly settlement period over the life of the agreement. We do not anticipate non-performance by the counterparties.
All of these interest rate swaps were undesignated as of December 31, 2009. The swaps have been marked-to-market with any change in fair value recorded within (gains) losses on derivative financial instruments in our consolidated statements of operations.
We incorporate credit valuation adjustments to appropriately reflect both our own nonperformance risk and the respective counterparty’s nonperformance risk in the fair value measurements of our derivatives. The fair value measurement of derivatives could result in either a net asset or a net liability position for us. In adjusting the fair value of our derivative contracts for the effect of nonperformance risk, we have considered the impact of netting arrangements as applicable and necessary. When the swaps are in net liability position for us, the credit valuation adjustments are calculated by determining the total expected exposure of the derivatives, incorporating the current and potential future exposures and then applying an applicable credit spread to the exposure. The total expected exposure of a derivative is derived using market-observable inputs, such as yield curves and volatilities. The inputs utilized for our own credit spread are based on implied spreads from traded levels of our debt. Accordingly, as of December 31, 2009 we recorded a non-cash credit valuation adjustment of approximately $0.9 million that reduced our derivative liabilities by $0.9 million.
As of December 31, 2008 and December 31, 2009, $2.4 million and $11.2 million was included in other current liabilities, respectively, and $156.7 million and $88.6 million was included in other long-term liabilities, respectively, within our consolidated balance sheets related to the interest rate swaps. On the interest rate reset date of December 10, 2009, the interest rate which the counterparties utilized to compute interest due to us was determined to be 0.25425%.
Put Option Embedded Derivative Instrument
As discussed in Note 11—Long-Term Debt, following an evaluation of the 2009 Sub Holdco Notes Offering, we concluded that the contingent put option embedded within the indenture governing the 2009 Sub Holdco Notes meets the criteria under FASB ASC 815, to be bifurcated from the debt host instrument and
F-53
Table of Contents
INTELSAT S.A.
NOTES TO CONSOLIDATED FINANCIAL STATEMENTS—(Continued)
classified as a derivative instrument. We estimated the fair value of the embedded derivative on the issuance date and will subsequently revalue the derivative at the end of each reporting period, recognizing any change in fair value through earnings. We use a standard valuation technique whereby the critical assumptions and underlyings include the debt maturity date, issue price, coupon rate, change of control put price, and the estimated date of a change in control. The fair value of the put option embedded derivative as of December 31, 2009 was $14.6 million based on our fair value analysis and $21.4 million of non-cash gain was recorded within gains or losses on derivative financial instruments during the year ended December 31, 2009.
In accordance with disclosure requirements provided under FASB ASC 815, we include the following tabular presentation, which sets forth the fair value of our derivatives by category (in thousands):
| Asset Derivatives | Liability Derivatives | |||||||
| Derivatives not designated as hedging instruments |
Balance Sheet Location |
December 31, |
December 31, | |||||
| Undesignated interest rate swaps(a) |
Other long-term liabilities | $ | 15,662 | $ | 104,263 | |||
| Undesignated interest rate swaps |
Other current liabilities | — | 11,249 | |||||
| Put option embedded derivative |
Other long-term liabilities | — | 14,600 | |||||
| Total derivatives |
$ | 15,662 | $ | 130,112 | ||||
| (a) | The value of undesignated interest rate swaps on our consolidated balance sheet is net of $15.7 million, which represents the fair value of options permitting us to terminate the underlying swaps. The fair value of these options is classified as an asset derivative in the table above. |
The following tabular presentation sets forth the effect of the derivative instruments on the consolidated statements of operations (in thousands):
| Derivatives not designated as hedging instruments |
Presentation in Statements of Operations |
Year Ended December 31, 2009 |
||||
| Undesignated interest rate swaps |
Losses on derivative financial instruments | $ | 24,121 | |||
| Put option embedded derivative |
Gains on derivative financial instruments | (21,440 | ) | |||
| Total gains and losses on derivative financial instruments |
$ | 2,681 | ||||
Note 13 Income Taxes
The following table summarizes our total loss before income taxes (in thousands):
| Predecessor Entity | Successor Entity | |||||||||||||||||
| Year Ended December 31, 2007 |
Period January 1, 2008 to January 31, 2008 |
Period February 1, 2008 to December 31, 2008 |
Year Ended December 31, 2009 |
|||||||||||||||
| Domestic income (loss) before income taxes |
$ | (390,098 | ) | $ | (301,079 | ) | $ | (815,303 | ) | $ | 114,380 | |||||||
| Foreign income (loss) before income taxes |
213,166 | (21,258 | ) | (180,564 | ) | (885,042 | ) | |||||||||||
| Total loss before income taxes |
$ | (176,932 | ) | $ | (322,337 | ) | $ | (995,867 | ) | $ | (770,662 | ) | ||||||
F-54
Table of Contents
INTELSAT S.A.
NOTES TO CONSOLIDATED FINANCIAL STATEMENTS—(Continued)
The provision for (benefit from) income taxes consisted of the following (in thousands):
| Predecessor Entity | Successor Entity | |||||||||||||||||
| Year Ended December 31, 2007 |
January 1, 2008 to January 31, 2008 |
February 1, 2008 to January 31, 2008 |
Year Ended December 31, 2009 |
|||||||||||||||
| Taxes currently payable (receivable): |
||||||||||||||||||
| Domestic |
$ | — | $ | — | $ | — | $ | 1,206 | ||||||||||
| Foreign |
52,916 | 23,159 | 41,026 | 47,111 | ||||||||||||||
| Total |
52,916 | 23,159 | 41,026 | 48,317 | ||||||||||||||
| Deferred tax liabilities (benefits): |
||||||||||||||||||
| Foreign |
(37,959 | ) | (33,635 | ) | (150,587 | ) | (36,918 | ) | ||||||||||
| Total |
(37,959 | ) | (33,635 | ) | (150,587 | ) | (36,918 | ) | ||||||||||
| Total income tax provision (benefit): |
$ | 14,957 | $ | (10,476 | ) | $ | (109,561 | ) | $ | 11,399 | ||||||||
The income tax provision (benefit) was different from the amount computed using the Luxembourg statutory income tax rate of 28.59% for the reasons set forth in the following table (in thousands):
| Year Ended December 31, 2009 |
||||
| Expected tax benefit at Luxembourg statutory income tax rate |
$ | (220,332 | ) | |
| Foreign income tax differential |
252,996 | |||
| Nontaxable interest income |
(41,368 | ) | ||
| U.S. extraterritorial income exclusion tax benefit |
(4,149 | ) | ||
| Change in tax rate |
8,864 | |||
| Nondeductible stock compensation expense |
1,316 | |||
| Changes in tax reserves |
11,434 | |||
| Basis difference in WildBlue |
(29,066 | ) | ||
| Fair market value basis adjustment on Luxembourg assets and liabilities |
(687,529 | ) | ||
| Changes in valuation allowance |
719,801 | |||
| Other |
(568 | ) | ||
| Total income tax provision |
$ | 11,399 | ||
A rate reconciliation table was not required prior to the year ended December 31, 2009 as we were domiciled in Bermuda, a jurisdiction that does not impose income taxes. As a result of the Migration to Luxembourg, most of our operations are now located in taxable jurisdictions, including Luxembourg, the U.S. and the U.K. The Migration had no impact on our book tax expense for the year ended December 31, 2009. As a result of the Migration, we received a step-up in the tax basis of our migrated assets and liabilities. Deferred taxes have been provided for the difference between book value and tax value of our assets and liabilities, and were established at December 15, 2009 at the statutory income tax rate. However, because of our cumulative losses in recent years, and the inherent uncertainty associated with the realization of future income in the near term, we recorded a valuation allowance against our net deferred tax assets at December 31, 2009. Our Luxembourg companies generated a loss for the period from December 15 to December 31, 2009. We also recorded a full valuation allowance against the net operating and loss carryforwards.
F-55
Table of Contents
INTELSAT S.A.
NOTES TO CONSOLIDATED FINANCIAL STATEMENTS—(Continued)
The components of the net deferred tax liability were as follows (in thousands):
| As of December 31, 2008 |
As of December 31, 2009 |
|||||||
| Deferred tax assets: |
||||||||
| Accruals and advances |
$ | 5,642 | $ | 46,896 | ||||
| Amortizable intangible assets |
— | 673,359 | ||||||
| Non-amortizable intangible assets |
— | 84,598 | ||||||
| Performance incentives |
44,707 | 44,097 | ||||||
| Sales-type leases |
26,119 | 20,895 | ||||||
| Customer deposits |
44,056 | 63,660 | ||||||
| Debt issuance costs |
13,624 | 8,360 | ||||||
| Bad debt reserve |
5,945 | 6,865 | ||||||
| Accrued retirement benefits |
94,811 | 52,414 | ||||||
| Interest rate swap |
32,930 | 19,209 | ||||||
| Satellites and other property and equipment |
— | 67,275 | ||||||
| Net operating loss carryforward |
17,814 | 61,455 | ||||||
| Capital loss carryforward |
— | 20,414 | ||||||
| Alternative minimum tax credit carryforward |
18,079 | 14,122 | ||||||
| Other |
10,841 | 7,589 | ||||||
| Total deferred tax assets |
314,568 | 1,191,208 | ||||||
| Deferred tax liabilities: |
||||||||
| Satellites and other property and equipment |
(269,258 | ) | (297,301 | ) | ||||
| Amortizable intangible assets |
(203,587 | ) | (178,527 | ) | ||||
| Non-amortizable intangible assets |
(283,992 | ) | (240,960 | ) | ||||
| Launch options |
(23,817 | ) | — | |||||
| Debt obligations |
— | (142,527 | ) | |||||
| Other |
(10,114 | ) | (18,165 | ) | ||||
| Total deferred tax liabilities |
(790,768 | ) | (877,480 | ) | ||||
| Valuation allowance |
(850 | ) | (753,367 | ) | ||||
| Total net deferred tax liabilities |
$ | (477,050 | ) | $ | (439,639 | ) | ||
In connection with the sale of our equity method investment in WildBlue, we recognized a net deferred tax asset of $11.0 million related to historic differences between book value and tax basis in the equity investment. We also recorded a deferred tax asset for a capital loss carryforward related to this sale.
Our valuation allowance at December 31, 2009 was $753.4 million, of which $699.9 million relates to the net deferred tax asset recorded as a result of the Migration and $20.4 million relates to our capital loss carryforwards, including $18.5 million from the sale of WildBlue. Almost all of the remaining valuation allowance relates to state net operating loss carryforwards, which are discussed further below. Certain of the operations of our subsidiaries are controlled by various intercompany agreements which provide these subsidiaries with predictable operating profits. Other subsidiaries, principally those that are subsidiaries of Intelsat Corp, are subject to the risks of our overall business conditions which make their earnings less predictable.
F-56
Table of Contents
INTELSAT S.A.
NOTES TO CONSOLIDATED FINANCIAL STATEMENTS—(Continued)
As of December 31, 2008 and 2009, our consolidated balance sheets include a deferred tax asset in the amount of $17.8 million and $61.5 million, respectively, attributable to the future benefit from the utilization of certain net operating loss carryforwards and $18.1 million and $14.1 million of deferred tax assets, respectively, attributable to the future benefit from the utilization of alternative minimum tax credit carryforwards. As of December 31, 2009, we had tax effected U.S. federal, state and foreign tax net operating loss carryforwards of $43.0 million expiring between 2016 to 2029 and tax effected net operating loss carryforwards of $18.5 million having no expiration. Our alternative minimum tax credit carryforward was $14.1 million, which may be carried forward indefinitely. Our capital loss carryforward was $20.4 million, which may be carried forward for the next five years to offset capital gains. As we do not believe we will generate capital gains sufficient to offset these capital losses in the next five years an offsetting valuation allowance has been recorded. The schedule above shows an increase in the overall net operating loss carryforwards to reflect state loss carryforwards of $32.8 million, tax effected, that still exist after the use of the federal net operating losses, but for which we do not expect to be able to realize a future benefit. For this reason, a corresponding valuation allowance is included in the schedule above. This change in the presentation of state loss carryforwards at December 31, 2009 has no impact on the balance sheet or statement of operations.
The following table summarizes the activity related to our unrecognized tax benefits (in thousands):
| 2008 | 2009 | |||||||
| Balance at January 1 |
$ | 62,537 | $ | 86,808 | ||||
| Increases related to current year tax positions |
16,823 | 6,585 | ||||||
| Increases related to prior year tax positions |
20,005 | 17,496 | ||||||
| Decreases related to prior year tax positions |
(4,544 | ) | (10,948 | ) | ||||
| Expiration of statute of limitations for the assessment of taxes |
(7,518 | ) | (6,722 | ) | ||||
| Decreases related to the settlement of tax positions |
(495 | ) | (6,298 | ) | ||||
| Balance at December 31 |
$ | 86,808 | $ | 86,921 | ||||
As of December 31, 2009, our gross unrecognized tax benefits were $86.9 million (including interest and penalties), of which $68.1 million if recognized, would affect our effective tax rate. As of December 31, 2008 and 2009, we had recorded reserves for interest and penalties of $6.6 million and $5.2 million, respectively. We continue to recognize interest and, to the extent applicable, penalties with respect to the unrecognized tax benefits as income tax expense.
We operate in various taxable jurisdictions throughout the world and our tax returns are subject to audit and review from time to time. We consider Luxembourg, the United Kingdom and the United States to be our significant tax jurisdictions. Our Luxembourg, U.S. and U.K. companies are subject to federal, state and local income tax examination for periods after July 18, 2001. During the third quarter of 2009, we received final notice from the U.K. tax authorities for amounts due related to the audit of our U.K. operations. We paid $6.3 million in the third quarter of 2009 related to the settlement of balances due. During the third quarter of 2008, the U.S. Internal Revenue Service began its audit of Intelsat Corp for the years ended December 31, 2005 and 2006. We expect the audit to be closed for the period under review in the next twelve months. At this point in time, it is too early to anticipate the probability of any adjustments.
We believe it is reasonably possible that in the next twelve months we will recognize a decrease in unrecognized tax benefits related to the expiration of certain statutes of limitations or the conclusion of ongoing audits of up to $27.2 million. Within the next twelve months, we believe that there are no other jurisdictions in which the outcome of unresolved issues or claims is likely to be material to our results of operations, financial position or cash flows.
F-57
Table of Contents
INTELSAT S.A.
NOTES TO CONSOLIDATED FINANCIAL STATEMENTS—(Continued)
During 2009, we recorded additional liabilities related to withholding taxes of $13.6 million in accordance with FASB ASC 740. This includes $12.8 million of new potential exposure resulting from certain sales in the Asia-Pacific market. As of December 31, 2009, we have not received any assessments with respect to this additional exposure, and it is our intention to appeal any such assessments.
Tax Contingency
Prior to August 20, 2004, our subsidiary, Intelsat Corp, joined with The DIRECTV Group and General Motors Corporation in filing a consolidated U.S. federal income tax return. In April 2004, Intelsat Corp entered into a tax separation agreement with The DIRECTV Group that superseded four earlier tax-related agreements among Intelsat Corp and its subsidiaries, The DIRECTV Group and certain of its affiliates. Pursuant to the tax separation agreement, The DIRECTV Group agreed to indemnify Intelsat Corp for all federal and consolidated state and local income taxes a taxing authority may attempt to collect from Intelsat Corp regarding any liability for the federal or consolidated state or local income taxes of General Motors Corporation and The DIRECTV Group, except those income taxes Intelsat Corp is required to pay under the tax separation agreement. In addition, The DIRECTV Group agreed to indemnify Intelsat Corp for any taxes (other than those taxes described in the preceding sentence) related to any periods or portions of such periods ending on or prior to the day of the closing of the PanAmSat recapitalization, which occurred on August 20, 2004, in amounts equal to 80% of the first $75.0 million of such other taxes and 100% of any other taxes in excess of the first $75.0 million. As a result, Intelsat Corp’s tax exposure after indemnification related to these periods is capped at $15.0 million, of which $4.0 million has been paid to date. The tax separation agreement with The DIRECTV Group is effective from August 20, 2004 until the expiration of the statute of limitations with respect to all taxes to which the tax separation agreement relates. As of December 31, 2008 and 2009, we recorded tax indemnification receivables of $5.9 million and $2.3 million, respectively.
Note 14 Restructuring and Transaction Costs
Our restructuring and transaction costs include our historical facilities restructuring plans and management-approved restructuring plans to consolidate and integrate the management and operations of Intelsat and PanAmSat Holdco subsequent to consummation of the PanAmSat Acquisition Transactions as well as transaction-related expenses incurred in connection with the New Sponsors Acquisition.
(a) Facilities Restructuring Plan
We approved a facilities restructuring plan subsequent to the consummation of the PanAmSat Acquisition Transactions which included the closure of PanAmSat’s former corporate headquarters in Wilton, Connecticut, as well as two other locations in the United States. These costs relate primarily to payments due on existing lease obligations that are expected to be incurred and paid through 2011. PanAmSat also had recorded liabilities in connection with its 2002 approval of a plan to restructure several of its United States locations and close certain facilities, some of which are currently being leased through 2011. The facilities restructuring liability was $5.5 million and $2.9 million as of December 31, 2008 and 2009, respectively, the current portion of which is included in accounts payable and accrued liabilities, with the remainder in other long-term liabilities in our consolidated balance sheets. We expect to pay $1.9 million within the next 12 months in connection with the facilities restructuring plan.
F-58
Table of Contents
INTELSAT S.A.
NOTES TO CONSOLIDATED FINANCIAL STATEMENTS—(Continued)
(b) Workforce Restructuring Plan
As part of the consolidation and integration associated with the PanAmSat Acquisition Transactions, we approved a workforce restructuring plan. This plan provided for the relocation and/or severance of employees due to planned facility closures. This workforce reduction covered approximately 400 employees. The remainder of the workforce restructuring liability of $0.4 million at December 31, 2008 was paid in June 2009. No remaining liability existed as of December 31, 2009.
The following table summarizes the recorded accruals, which are included in accounts payable and accrued liabilities, employee related liabilities, and other long-term liabilities in the accompanying consolidated balance sheets, and activity related to the facilities restructuring and workforce restructuring (in millions):
| Facilities Restructuring Plan |
Workforce Restructuring Plan |
Total | ||||||||||
| Predecessor entity |
||||||||||||
| Balance at December 31, 2007 |
$ | 6.4 | $ | 6.7 | $ | 13.1 | ||||||
| Net cash payments |
(0.1 | ) | (3.1 | ) | (3.2 | ) | ||||||
| Balance at January 31, 2008 |
6.3 | 3.6 | 9.9 | |||||||||
| Fair value adjustments |
$ | (0.6 | ) | $ | — | $ | (0.6 | ) | ||||
| Successor entity |
||||||||||||
| Balance at February 1, 2008 |
$ | 5.7 | $ | 3.6 | $ | 9.3 | ||||||
| Restructuring charges |
1.9 | — | 1.9 | |||||||||
| Net cash payments |
(2.1 | ) | (3.2 | ) | (5.3 | ) | ||||||
| Balance at December 31, 2008 |
$ | 5.5 | $ | 0.4 | $ | 5.9 | ||||||
| Other adjustments |
(0.8 | ) | — | (0.8 | ) | |||||||
| Net cash payments |
(1.8 | ) | (0.4 | ) | (2.2 | ) | ||||||
| Balance at December 31, 2009 |
$ | 2.9 | $ | — | $ | 2.9 | ||||||
No additional charges related to the facilities restructuring plan or the workforce restructuring plan are expected to be incurred.
F-59
Table of Contents
INTELSAT S.A.
NOTES TO CONSOLIDATED FINANCIAL STATEMENTS—(Continued)
Note 15 Contractual Commitments
In the further development and operation of our commercial global communications satellite system, significant additional expenditures are anticipated. In connection with these and other expenditures, we have assumed a significant amount of long-term debt, as described in Note 11—Long-Term Debt. In addition to these debt and related interest obligations, we have expenditures represented by other contractual commitments. The additional expenditures as of December 31, 2009 and the expected year of payment are as follows (in thousands):
| Satellite Construction and Launch Obligations |
Satellite Performance Incentive Obligations |
Horizons Contribution Obligations(1) |
Capital Leases |
Operating Leases |
Customer and Vendor Contracts |
Total | |||||||||||||||||
| 2010 |
$ | 644,924 | (2) | $ | 30,161 | $ | 13,556 | $ | 196 | $ | 2,705 | $ | 136,981 | $ | 828,523 | ||||||||
| 2011 |
385,559 | 23,787 | 13,083 | — | 1,699 | 21,179 | 445,307 | ||||||||||||||||
| 2012 |
60,400 | 23,446 | 13,012 | — | (150 | )(3) | 14,419 | 111,127 | |||||||||||||||
| 2013 |
18,469 | 22,415 | 12,881 | — | (1,084 | )(3) | 9,465 | 62,146 | |||||||||||||||
| 2014 |
13,369 | 20,955 | 12,684 | — | (989 | )(3) | 1,125 | 47,144 | |||||||||||||||
| 2015 and thereafter |
139,587 | 89,695 | — | — | 44,814 | 589 | 274,685 | ||||||||||||||||
| Total contractual commitments |
$ | 1,262,308 | $ | 210,459 | $ | 65,216 | $ | 196 | $ | 46,995 | $ | 183,758 | $ | 1,768,932 | |||||||||
| (1) | See Note 9—Investments. |
| (2) | In 2010, the total Satellite Construction and Launch Obligations amount includes a payment obligation for our Thor 6 lease agreement that is not captured in our capitalized satellite expense, due to a special Hosted Payload contract. |
| (3) | In 2013 and 2014, the total of our rental income on our owned Washington, D.C. building (see (c) Operating Leases) and our sublease income on leased facilities will exceed our operating lease commitments. |
(a) Satellite Construction and Launch Obligations
As of December 31, 2009, we had approximately $1.3 billion of expenditures remaining under our existing satellite construction and launch contracts. Satellite launch and in-orbit insurance contracts related to future satellites to be launched are cancelable up to thirty days prior to the satellite’s launch. As of December 31, 2009, we did not have any non-cancelable commitments related to existing launch insurance or in-orbit insurance contracts for satellites to be launched.
The satellite construction contracts typically require that we make progress payments during the period of the satellite’s construction. The satellite construction contracts contain provisions that allow us to terminate the contracts with or without cause. If terminated without cause, we would forfeit the progress payments and be subject to termination payments that escalate with the passage of time. If terminated for cause, we would be entitled to recover any payments we made under the contracts and certain liquidated damages as specified in the contracts.
(b) Satellite Performance Incentive Obligations
Satellite construction contracts also typically require that we make orbital incentive payments (plus interest as defined in each agreement with the satellite manufacturer) over the orbital life of the satellite. The incentive obligations may be subject to reduction or refund if the satellite fails to meet specific technical operating
F-60
Table of Contents
INTELSAT S.A.
NOTES TO CONSOLIDATED FINANCIAL STATEMENTS—(Continued)
standards. As of December 31, 2008 and 2009, we had $155.2 million and $147.5 million, respectively, recorded in relation to satellite performance incentive obligations, excluding future interest payments.
(c) Operating Leases
We have commitments for operating leases primarily relating to equipment and office facilities. These leases contain escalation provisions for increases. As of December 31, 2009, the total obligation related to operating leases, net of $16.8 million aggregate sublease income on leased facilities and rental income, was $47.0 million. We lease space in our Washington, D.C. building, which we own, to various tenants. As of December 31, 2009, the minimum rental income anticipated with respect to this building is $12.3 million, of which $11.4 million is expected to be received during the next five years. Rental income and sublease income are included in other income (expense), net in the accompanying consolidated statements of operations.
Total rent expense for the year ended December 31, 2007, the predecessor period January 1, 2008 to January 31, 2008, the successor period February 1, 2008 to December 31, 2008 and the year ended December 31, 2009, was $8.5 million, $0.6 million, $8.2 million and $7.0 million, respectively.
(d) Customer and Vendor Contracts
We have contracts with certain customers which require us to provide equipment, services and other support during the term of the related contracts. We also have long-term contractual obligations with service providers primarily for the operation of certain of our satellites. As of December 31, 2009, we had commitments under these customer and vendor contracts which totaled approximately $183.8 million related to the provision of equipment, services and other support.
Note 16 Contingencies
(a) Insurance
As of December 31, 2009, the majority of our satellites were uninsured. Of the insured satellites, one was covered by an insurance policy with substantial exclusions or exceptions to coverage for failures of specific components identified by the underwriters as at risk for possible failure (“Significant Exclusion Policies”). The Significant Exclusion Policies reduce the probability of an insurance recovery in the event of a loss on this satellite. Galaxy 13/Horizons-1, which was placed in service in January 2004 and is insured by a policy with an exclusion for XIPS related anomalies, continues to have XIPS available as its primary propulsion system. It also has a bi-propellent fuel system currently in use, with sufficient bi-propellant fuel to maintain station-kept orbit until approximately 2016.
An uninsured failure of one or more satellites could have a material adverse effect on our financial condition and results of operations. In addition, higher premiums on insurance policies would increase our costs, thereby reducing income from operations by the amount of such increased premiums.
(b) Litigation and Claims
We are subject to litigation in the ordinary course of business, but management does not believe that the resolution of any pending proceedings would have a material adverse effect on our financial position or results of operations.
F-61
Table of Contents
INTELSAT S.A.
NOTES TO CONSOLIDATED FINANCIAL STATEMENTS—(Continued)
(c) LCO Protection
Most of the customer service commitments entered into prior to our privatization were transferred to us pursuant to novation agreements. Certain of these agreements contain provisions, including provisions for lifeline connectivity obligation (“LCO”) protection, which constrain our ability to price services in some circumstances. Our LCO contracts require us to provide customers with the right to renew their service commitments covered by LCO contracts at prices no higher than the prices charged for those services on the privatization date. Under some circumstances, we may also be required by an LCO contract to reduce the price for a service commitment covered by the contract. LCO protection may continue until July 18, 2013. As of December 31, 2009, we had approximately $140.0 million of backlog covered by LCO contracts and to date we have not been required to reduce prices for our LCO-protected service commitments. There can be no assurance that we will not be required to reduce prices in the future under our LCO commitments.
(d) Launch Service Providers
One of our launch service providers, Sea Launch Company L.L.C. (“Sea Launch”), with which we have contracted for the future launch of one satellite, and have options for the launch of four additional satellites, has filed a voluntary petition for relief under Chapter 11 of the Bankruptcy Code. As of December 31, 2009, we had approximately $43 million outstanding of payments made to Sea Launch relating to satellite launches that Sea Launch is still required to provide us. While Sea Launch is continuing to operate as a debtor-in-possession, and while we may receive full or partial credit for prior payments relating to the launches if Sea Launch is unable to perform the launches, there can be no assurance that Sea Launch will honor its contractual obligations to us, or do so without charging us significant additional amounts beyond what is provided for in our current agreements. In addition, should we try to procure alternative launch services for the satellites involved, there can be no assurance that we will not incur significant delays and significant additional expenses as a result.
Note 17 Business and Geographic Segment Information
We operate in a single industry segment, in which we provide satellite services to our communications customers around the world. Revenue by region is based on the locations of customers to which services are billed. Our satellites are in geosynchronous orbit, and consequently are not attributable to any geographic location. Of our remaining assets, substantially all are located in the United States.
F-62
Table of Contents
INTELSAT S.A.
NOTES TO CONSOLIDATED FINANCIAL STATEMENTS—(Continued)
The geographic distribution of our revenue was as follows:
| Predecessor Entity | Successor Entity | |||||||||||||
| Year Ended December 31, 2007 |
Period January 1, 2008 to January 31, 2008 |
Period February 1, 2008 to December 31, 2008 |
Year Ended December 31, 2009 |
|||||||||||
| North America |
48 | % | 48 | % | 46 | % | 46 | % | ||||||
| Europe |
15 | % | 16 | % | 17 | % | 17 | % | ||||||
| Africa and Middle East |
17 | % | 18 | % | 17 | % | 17 | % | ||||||
| Latin America and Caribbean |
12 | % | 11 | % | 12 | % | 12 | % | ||||||
| Asia Pacific |
8 | % | 7 | % | 8 | % | 8 | % | ||||||
Approximately 6%, 7%, 5% and 4% of our revenue was derived from our largest customer during the year ended December 31, 2007, the predecessor period January 1, 2008 to January 31, 2008, the successor period February 1, 2008 to December 31, 2008 and the year ended December 31, 2009, respectively. The ten largest customers accounted for approximately 23%, 23%, 20% and 20% of our revenue for the year ended December 31, 2007, the predecessor period January 1, 2008 to January 31, 2008, the successor period February 1, 2008 to December 31, 2008 and the year ended December 31, 2009, respectively.
Our revenues were derived from the following services (in thousands, except percentages):
| Predecessor Entity | Successor Entity | |||||||||||||||||||||||||
| Year Ended December 31, 2007 |
Period January 1, 2008 to January 31, 2008 |
Period February 1, 2008 to December 31, 2008 |
Year Ended December 31, 2009 |
|||||||||||||||||||||||
| Transponder services |
$ | 1,654,321 | 76 | % | $ | 146,344 | 77 | % | $ | 1,648,899 | 76 | % | $ | 1,901,235 | 76 | % | ||||||||||
| Managed services |
264,038 | 12 | % | 23,847 | 12 | % | 278,725 | 13 | % | 313,336 | 12 | % | ||||||||||||||
| Mobile satellite services and other |
101,232 | 5 | % | 7,545 | 4 | % | 114,848 | 5 | % | 164,808 | 7 | % | ||||||||||||||
| Channel |
163,488 | 7 | % | 12,525 | 7 | % | 132,168 | 6 | % | 133,660 | 5 | % | ||||||||||||||
| Total |
$ | 2,183,079 | 100 | % | $ | 190,261 | 100 | % | $ | 2,174,640 | 100 | % | $ | 2,513,039 | 100 | % | ||||||||||
Note 18 Related Party Transactions
(a) Shareholders Agreement
The shareholders of Intelsat Holdings, including recipients of restricted share awards of Intelsat Holdings, entered into a shareholders agreement on January 28, 2005. The shareholders agreement and the bye-laws of Intelsat Holdings provided, among other things, for the governance of Intelsat Holdings and its subsidiaries and provided specific rights to and limitations upon the holders of Intelsat Holdings’ share capital with respect to shares held by such holders.
The agreement terminated upon the completion of the New Sponsors Acquisition, and the New Sponsors and other shareholders of Serafina Holdings entered into similar shareholders agreements on February 4, 2008.
F-63
Table of Contents
INTELSAT S.A.
NOTES TO CONSOLIDATED FINANCIAL STATEMENTS—(Continued)
(b) Monitoring Fee Agreements and Transaction Fees
In connection with the closing of the New Sponsors Acquisition on February 4, 2008, Intelsat Luxembourg, our direct wholly-owned subsidiary, entered into a new monitoring fee agreement (“the 2008 MFA”) with BC Partners and Silver Lake Management Company III, L.L.C. (together, the “2008 MFA parties”), pursuant to which the 2008 MFA parties provide certain monitoring, advisory and consulting services to Intelsat Luxembourg. We recorded expense for services associated with the 2008 MFA of $8.5 million and $23.2 million during the successor period February 1, 2008 to December 31, 2008 and the year ended December 31, 2009, respectively.
As payment for certain structuring and advisory services rendered, Intelsat Luxembourg also paid and expensed an aggregate transaction and advisory fee of $60.0 million to the 2008 MFA parties upon the closing of the New Sponsors Acquisition Transactions.
In connection with the closing of the PanAmSat Acquisition Transactions, Intelsat Bermuda entered into a monitoring fee agreement (the “2006 MFA”) with the Former Sponsors, or affiliates of, or entities advised by, designated by or associated with, the former sponsors, as the case may be (collectively, the “2006 MFA parties”), pursuant to which the 2006 MFA parties provided certain monitoring, advisory and consulting services with respect to Intelsat Bermuda, PanAmSat Holdco and their respective subsidiaries. In connection with the consummation of the New Sponsors Acquisition, this agreement was terminated. Pursuant to the 2006 MFA, an annual fee equal to the greater of $6.25 million or 1.25% of Intelsat Corp Adjusted EBITDA (as defined in the indenture governing the 9% Senior Notes due 2016 of Intelsat Corp) was to be paid, and Intelsat Bermuda reimbursed the 2006 MFA parties for their out-of-pocket expenses. We recorded expense for services associated with the 2006 MFA of $11.2 million during the year ended December 31, 2007 and $0.7 million during the predecessor period January 1, 2008 to January 31, 2008.
In connection with the closing of our acquisition by Intelsat Holdings in January 2005, Intelsat SubHoldco entered into a monitoring fee agreement (the “2005 MFA”) with Intelsat Holdings and the former sponsors, or affiliates of, or entities advised by, designated by or associated with, the former sponsors, as the case may be (collectively, the “2005 MFA parties”), pursuant to which the 2005 MFA parties provided certain monitoring, advisory and consulting services to Intelsat. In connection with the consummation of the New Sponsors Acquisition, this agreement was terminated. Pursuant to the 2005 MFA, Intelsat Sub Holdco was obligated to pay an annual fee equal to the greater of $6.25 million or 1.25% of adjusted EBITDA as defined in the indenture governing Intelsat Sub Holdco’s 8 1/4% Senior Notes due 2013 and Intelsat Sub Holdco’s 8 5/8% Senior Notes due 2015, and to reimburse the 2005 MFA parties for their out-of-pocket expenses. We recorded expense for services associated with the 2005 MFA of $12.6 million during the year ended December 31, 2007 and $1.0 million during the predecessor period January 1, 2008 to January 31, 2008.
(c) Ownership by Management
In connection with and after the closing of the PanAmSat Acquisition Transactions, Intelsat Holdings entered into SCAs under its existing 2005 Share Plan with certain directors, officers and key employees of Intelsat Holdings and its subsidiaries. In addition, upon consummation of the New Sponsors Acquisition on February 4, 2008, all outstanding restricted performance shares under the 2005 Share Plan vested. Vesting in SCAs issued under the 2005 Share Plan doubled at consummation of the New Sponsors Acquisition if the awardee was still employed on February 4, 2008. The vested SCAs were cancelled in return for cash in an amount equal to the excess of approximately $400 (the per share price of the transaction) over the exercise price of each share covered. Vested restricted shares (including time and performance vesting shares) were purchased at approximately $400 per share (the per share price specified in the BC Share Purchase Agreement). In
F-64
Table of Contents
INTELSAT S.A.
NOTES TO CONSOLIDATED FINANCIAL STATEMENTS—(Continued)
connection with the vesting and modification of these awards upon the consummation of the acquisition, we recorded compensation expense of $197.2 million in January 2008.
Certain directors, officers and key employees of Intelsat Global and its subsidiaries hold restricted shares, options and SCAs of Intelsat Global. In May 2009, Intelsat Global issued new restricted shares, SCAs and options to certain directors, officers and key employees under the 2008 Share Plan (see Note 5(a)—2005 Share Plan and Note 5(b)—2008 Share Plan). In May 2009, certain of our executive officers also purchased shares of Intelsat Global. In the aggregate, these shares and arrangements outstanding as of December 31, 2009 provided for the issuance of approximately 13.0% of the voting equity of Intelsat Global on a fully diluted basis.
(d) Sponsor and Executive Investments
Apollo Management V, L.P., one of our former sponsors, is the indirect controlling stockholder of Hughes Communications, Inc. and Hughes Network Systems, LLC (“HNS”). HNS is one of our largest network services customers. We recorded $119.2 million and $9.5 million of revenue during the year ended December 31, 2007 and the predecessor period January 1, 2008 to January 31, 2008, respectively, for satellite capacity and other services provided to HNS. The receivable outstanding from HNS as of December 31, 2007 was $12.5 million. Two members of the board of directors prior to the New Sponsors Acquisition, Messrs. Africk and Stone, served on the board of directors of Hughes Communications, Inc. and the board of managers of HNS.
During 2008, affiliates or associates of funds and investment vehicles advised or controlled by one of the New Sponsors, Silver Lake, purchased $90.9 million of the 2017 Senior Notes and affiliates or associates of funds and investment vehicles advised or controlled by another of the New Sponsors, BC Partners, also purchased $90.9 million of the 2017 Senior Notes.
Also during 2008, an entity associated with funds and investment vehicles advised or controlled by Silver Lake purchased a further $100.0 million of the 2017 Senior Notes and $650.0 million original principal amount of the 2017 PIK Notes. Mr. Svider, Chairman of our board of directors, Mr. McGlade, our Chief Executive Officer and Deputy Chairman of our board of directors, and a trust of which Mr. Spector, our Executive Vice President, Business Development, and General Counsel, is the beneficiary, invested $3.8 million, $2.5 million and $0.6 million, respectively, as limited partners in the entity through which the notes were purchased.
(e) Horizons
We have a 50% ownership interest in Horizons-1 and Horizons-2 as a result of a joint venture with JSAT (see Note 9—Investments).
(f) New Dawn
We have a 74.9% ownership interest in New Dawn as a result of a project and shareholders’ agreement with Convergence Partners (see Note 9—Investments).
(g) Receivable from Parent
We had a receivable from Intelsat Global as of December 31, 2008 and 2009 of $2.2 million and $3.3 million, respectively (see Note 7—Receivables).
F-65
Table of Contents
INTELSAT S.A.
NOTES TO CONSOLIDATED FINANCIAL STATEMENTS—(Continued)
Note 19 Quarterly Results of Operations (unaudited)
The summary financial information below includes the predecessor entity for periods prior to the Intelsat Acquisition Transactions and the successor entity for periods following the New Sponsors Acquisition Transactions (in thousands).
| Predecessor Entity |
Successor Entity | |||||||||||||||||||||
| Period January 1 to January 31 |
Period February 1 to March 31 |
Quarter ended June 30 |
Quarter ended September 30 |
Quarter ended December 31 |
||||||||||||||||||
| 2008 |
||||||||||||||||||||||
| Revenue |
$ | 190,261 | $ | 382,417 | $ | 584,921 | $ | 598,512 | $ | 608,789 | ||||||||||||
| Income (loss) from operations |
(242,597 | ) | 122,847 | 269,999 | 200,394 | (282,362 | ) | |||||||||||||||
| Net loss |
(311,861 | ) | (100,827 | ) | (81,961 | ) | (179,291 | ) | (524,321 | ) | ||||||||||||
| Net loss attributable to Intelsat S.A. |
(311,861 | ) | (100,827 | ) | (81,961 | ) | (179,291 | ) | (524,228 | ) | ||||||||||||
| Quarter Ended | ||||||||||||||||||||||
| March 31 | June 30 | September 30 | December 31 | |||||||||||||||||||
| 2009 |
||||||||||||||||||||||
| Revenue |
$ | 631,847 | $ | 642,484 | $ | 617,888 | $ | 620,820 | ||||||||||||||
| Income (loss) from operations |
(236,168 | ) | 316,992 | 235,966 | 228,660 | |||||||||||||||||
| Net loss |
(557,586 | ) | (32,748 | ) | (94,784 | ) | (96,943 | ) | ||||||||||||||
| Net loss attributable to Intelsat S.A. |
(557,646 | ) | (32,740 | ) | (94,276 | ) | (97,030 | ) | ||||||||||||||
Our quarterly revenue and operating income are generally not impacted by seasonality since customer contracts for satellite utilization are generally long-term. The quarterly results for the predecessor period January 1, 2008 to January 31, 2008 reflects the transaction costs impact of $313.1 million directly related to the New Sponsors Acquisition Transactions. The quarter ended June 30, 2008 includes a one-time impairment charge of $63.6 million related to the Galaxy 26 satellite anomaly. The quarter ended December 31, 2008 includes $326.8 million related to the impairment of our rights to operate at orbital locations.
The quarter ended March 31, 2009 includes $499.1 million related to the impairment of our rights to operate at orbital locations. The quarter ended June 30, 2009 includes a $52.1 million gain on derivative financial instruments.
Note 20 Subsequent Events
On February 1, 2010 our IS-4 satellite experienced an anomaly. The anomaly has caused this satellite to be deemed unrecoverable, which we expect will result in a net non-cash impairment charge in February 2010 of $6.5 million to write off the value of the IS-4 satellite, which was not insured, and related deferred performance incentive obligations. We are working with the satellite’s manufacturer to determine the cause of the anomaly. Launched in 1995, IS-4 was expected to reach its end of service life later this year. The IS-4 had previously experienced the failure of its satellite control processor (“SCP”) and was operating on its backup SCP.
Note 21 Supplemental Consolidating Financial Information
In connection with the acquisition of Intelsat, Ltd. by Intelsat Holdings in January 2005, and related amalgamations, Intelsat Sub Holdco issued $2.6 billion aggregate principal amount of debt (the “2005 Acquisition Finance Notes”), the majority of which was tendered and repurchased in change of control offers in June 2008. The 2005 Acquisition Finance Notes are fully and unconditionally guaranteed, jointly and severally, by Intelsat, Ltd., Intelsat Bermuda, Intelsat Jackson, Intermediate Holdco, our indirect wholly-owned subsidiary, and certain wholly-owned subsidiaries of Intelsat Sub Holdco (the “Subsidiary Guarantors”).
F-66
Table of Contents
INTELSAT S.A.
NOTES TO CONSOLIDATED FINANCIAL STATEMENTS—(Continued)
On February 11, 2005, Intelsat, Ltd. and Zeus Special Subsidiary Limited issued $478.7 million in aggregate principal amount at maturity of 9 1/4% Senior Discount Notes due 2015 (the “2015 Discount Notes”), yielding approximately $305.3 million of net proceeds at issuance. On March 3, 2005, Intelsat Bermuda transferred substantially all of its assets to Intelsat Sub Holdco and Intelsat Sub Holdco assumed substantially all of the then-existing liabilities of Intelsat Bermuda. Following these transactions, Zeus Special Subsidiary Limited was amalgamated with Intelsat Bermuda, and Intelsat Bermuda became an obligor on the 2015 Discount Notes.
On July 3, 2006, in connection with the PanAmSat Acquisition Transactions, Intelsat Bermuda transferred the obligation on the 2015 Discount Notes to its wholly-owned subsidiary, Intermediate Holdco. Intermediate Holdco became an obligor on the 2015 Discount Notes and confirmed its guarantee of the 2005 Acquisition Finance Notes and Intelsat Bermuda became a guarantor of the 2015 Discount Notes and confirmed its guarantee of the 2005 Acquisition Finance Notes. The 2015 Discount Notes are not guaranteed by any of Intelsat Bermuda’s direct or indirect subsidiaries.
In connection with the PanAmSat Acquisition Transactions, Intelsat Bermuda issued $1.33 billion of 11 1/4% Senior Notes due 2016 and $260.0 million of Floating Rate Senior Notes due 2013 (collectively, the “July 2006 Notes”). The July 2006 Notes are fully and unconditionally guaranteed, jointly and severally, by Intelsat. The July 2006 Notes are not guaranteed by any of Intelsat Bermuda’s direct or indirect subsidiaries.
On January 12, 2007, Intelsat Bermuda issued $600.0 million in Floating Rate Senior Notes due 2015 (the “Refinancing Notes”), which were fully and unconditionally guaranteed, jointly and severally, by Intelsat, Ltd.
On February 4, 2008, promptly after the consummation of the New Sponsors Acquisition, Intelsat Bermuda transferred certain of its assets and certain of its liabilities and obligations (including the July 2006 Notes, the Refinancing Notes and its senior unsecured credit facility) to a newly formed direct wholly-owned subsidiary, Intelsat Jackson. Intelsat Jackson became the obligor on the July 2006 Notes and the Refinancing Notes and a guarantor of the 2005 Acquisition Finance Notes and the 2015 Discount Notes, and Intelsat Bermuda confirmed its guarantee of the 2015 Discount Notes, the July 2006 Notes, the Refinancing Notes and the 2005 Acquisition Finance Notes.
On February 7, 2008, Intelsat Jackson redeemed, pursuant to their terms, all $260.0 million of its Floating Rate Senior Notes due 2013 and all $600.0 million of its outstanding Refinancing Notes.
In addition, on June 27, 2008, Intelsat Bermuda issued the 2017 Senior Notes and the 2017 PIK Notes, which were fully and unconditionally guaranteed, jointly and severally, by Intelsat, Ltd.
Separate financial statements of Intelsat S.A., Intelsat Luxembourg, Intelsat Jackson, Intermediate Holdco, Intelsat Sub Holdco and the Subsidiary Guarantors are not presented because management believes that such financial statements would not be material to investors. Investments in non-guarantor subsidiaries in the following condensed consolidating financial information are accounted for under the equity method of accounting. Consolidating adjustments include the following:
| • | elimination of investment in subsidiaries; |
| • | elimination of intercompany accounts; |
| • | elimination of intercompany sales between guarantor and non-guarantor subsidiaries; and |
| • | elimination of equity in earnings (losses) of subsidiaries. |
F-67
Table of Contents
INTELSAT S.A. AND SUBSIDIARIES
CONDENSED CONSOLIDATING BALANCE SHEET
AS OF DECEMBER 31, 2009
(in thousands)
| Intelsat S.A. | Intelsat Luxembourg |
Intelsat Jackson |
Intermediate Holdco |
Intelsat Sub Holdco |
Intelsat Sub Holdco Subsidiary Guarantors |
Non-Guarantor Subsidiaries |
Eliminations | Consolidated | ||||||||||||||||||||||||
| ASSETS |
||||||||||||||||||||||||||||||||
| Current assets: |
||||||||||||||||||||||||||||||||
| Cash and cash equivalents |
$ | 21,817 | $ | 16,115 | $ | 2,207 | $ | 41 | $ | 227,610 | $ | 104,992 | $ | 209,781 | $ | (104,992 | ) | $ | 477,571 | |||||||||||||
| Receivables, net of allowance |
3,282 | — | — | — | 180,019 | 180,013 | 111,238 | (180,013 | ) | 294,539 | ||||||||||||||||||||||
| Deferred income taxes |
— | — | — | — | 1,077 | 1,077 | 49,566 | (1,077 | ) | 50,643 | ||||||||||||||||||||||
| Prepaid expenses and other current assets |
680 | — | — | — | 16,206 | 16,023 | 19,918 | (19,266 | ) | 33,561 | ||||||||||||||||||||||
| Intercompany receivables |
— | — | — | — | 638,361 | 11,526,269 | 107,008 | (12,271,638 | ) | — | ||||||||||||||||||||||
| Total current assets |
25,779 | 16,115 | 2,207 | 41 | 1,063,273 | 11,828,374 | 497,511 | (12,576,986 | ) | 856,314 | ||||||||||||||||||||||
| Satellites and other property and equipment, net |
— | — | — | — | 3,220,658 | 3,220,466 | 2,559,435 | (3,218,604 | ) | 5,781,955 | ||||||||||||||||||||||
| Goodwill |
— | — | — | — | 3,434,165 | — | 3,346,662 | — | 6,780,827 | |||||||||||||||||||||||
| Non-amortizable intangible assets |
— | — | — | — | 1,805,130 | — | 652,970 | — | 2,458,100 | |||||||||||||||||||||||
| Amortizable intangible assets, net |
— | — | — | — | 490,684 | — | 487,915 | — | 978,599 | |||||||||||||||||||||||
| Investment in affiliates |
962,656 | 6,091,942 | 9,971,587 | 7,407,372 | (32,832 | ) | (41,903 | ) | 88,902 | (24,358,822 | ) | 88,902 | ||||||||||||||||||||
| Other assets |
— | 124,926 | 27,955 | 3,789 | 255,663 | 121,747 | 92,382 | (228,224 | ) | 398,238 | ||||||||||||||||||||||
| Total assets |
$ | 988,435 | $ | 6,232,983 | $ | 10,001,749 | $ | 7,411,202 | $ | 10,236,741 | $ | 15,128,684 | $ | 7,725,777 | $ | (40,382,636 | ) | $ | 17,342,935 | |||||||||||||
| LIABILITIES AND SHAREHOLDER’S EQUITY |
||||||||||||||||||||||||||||||||
| Current liabilities: |
||||||||||||||||||||||||||||||||
| Accounts payable and accrued liabilities |
$ | 2,196 | $ | 508 | $ | 243 | $ | — | $ | 83,443 | $ | 81,436 | $ | 123,255 | $ | (84,680 | ) | $ | 206,401 | |||||||||||||
| Accrued interest payable |
11,651 | 220,740 | 20,356 | — | 82,911 | 3,416 | 33,718 | (3,416 | ) | 369,376 | ||||||||||||||||||||||
| Current portion of long-term debt |
— | — | — | — | 8,448 | 5,000 | 89,241 | (5,000 | ) | 97,689 | ||||||||||||||||||||||
| Deferred satellite performance incentives |
— | — | — | — | 3,974 | 3,974 | 14,709 | (3,974 | ) | 18,683 | ||||||||||||||||||||||
| Other current liabilities |
— | — | 1,293 | — | 72,737 | 72,298 | 48,464 | (72,298 | ) | 122,494 | ||||||||||||||||||||||
| Intercompany payables |
474,422 | 12,595 | 206,467 | 51,884 | — | — | — | (745,368 | ) | — | ||||||||||||||||||||||
| Total current liabilities |
488,269 | 233,843 | 228,359 | 51,884 | 251,513 | 166,124 | 309,387 | (914,736 | ) | 814,643 | ||||||||||||||||||||||
| Long-term debt, net of current portion |
674,806 | 4,954,990 | 3,597,292 | 481,901 | 2,221,559 | — | 3,292,462 | — | 15,223,010 | |||||||||||||||||||||||
| Deferred satellite performance incentives, net of current portion |
— | — | — | — | 23,201 | 23,201 | 105,573 | (23,201 | ) | 128,774 | ||||||||||||||||||||||
| Deferred revenue, net of current portion |
— | — | — | — | 197,938 | 197,938 | 56,698 | (197,938 | ) | 254,636 | ||||||||||||||||||||||
| Deferred income taxes |
37,985 | 14,090 | 50,656 | 3,746 | — | — | 548,719 | (106,477 | ) | 548,719 | ||||||||||||||||||||||
| Accrued retirement benefits |
— | — | — | — | 73,222 | 73,222 | 166,651 | (73,222 | ) | 239,873 | ||||||||||||||||||||||
| Other long-term liabilities |
— | 63,433 | 33,500 | — | 61,936 | 29,510 | 176,290 | (29,510 | ) | 335,159 | ||||||||||||||||||||||
| Noncontrolling interest |
— | — | — | — | — | — | 8,884 | — | 8,884 | |||||||||||||||||||||||
| Shareholder’s equity: |
||||||||||||||||||||||||||||||||
| Common shares |
5,000 | 669,036 | 4,959,000 | 3,602,000 | 484,000 | 200 | 70 | (9,714,306 | ) | 5,000 | ||||||||||||||||||||||
| Other shareholder’s equity |
(217,625 | ) | 297,591 | 1,132,942 | 3,271,671 | 6,923,372 | 14,638,489 | 3,061,043 | (29,323,246 | ) | (215,763 | ) | ||||||||||||||||||||
| Total liabilities and shareholder’s equity |
$ | 988,435 | $ | 6,232,983 | $ | 10,001,749 | $ | 7,411,202 | $ | 10,236,741 | $ | 15,128,684 | $ | 7,725,777 | $ | (40,382,636 | ) | $ | 17,342,935 | |||||||||||||
(Certain totals may not add due to the effects of rounding)
F-68
Table of Contents
INTELSAT S.A. AND SUBSIDIARIES
CONDENSED CONSOLIDATING BALANCE SHEET
AS OF DECEMBER 31, 2008
(in thousands)
| Intelsat S.A. | Intelsat Luxembourg |
Intelsat Jackson |
Intermediate Holdco |
Intelsat Sub Holdco |
Intelsat Sub Holdco Subsidiary Guarantors |
Non-Guarantor Subsidiaries |
Eliminations | Consolidated | ||||||||||||||||||||||
| ASSETS |
||||||||||||||||||||||||||||||
| Current assets: |
||||||||||||||||||||||||||||||
| Cash and cash equivalents |
$ | 6,286 | $ | 181,650 | $ | 20,166 | $ | 50 | $ | 149,003 | $ | 74,815 | $ | 113,056 | $ | (74,815 | ) | $ | 470,211 | |||||||||||
| Receivables, net of allowance |
2,108 | — | — | — | 192,916 | 192,909 | 107,910 | (192,909 | ) | 302,934 | ||||||||||||||||||||
| Deferred income taxes |
— | — | — | — | 2,411 | 2,411 | 46,212 | (2,411 | ) | 48,623 | ||||||||||||||||||||
| Prepaid expenses and other current assets |
1,027 | — | — | 91 | 21,050 | 20,976 | 38,618 | (24,879 | ) | 56,883 | ||||||||||||||||||||
| Intercompany receivables |
— | — | — | — | 686,360 | — | 308,541 | (994,901 | ) | — | ||||||||||||||||||||
| Total current assets |
9,421 | 181,650 | 20,166 | 141 | 1,051,740 | 291,111 | 614,337 | (1,289,915 | ) | 878,651 | ||||||||||||||||||||
| Satellites and other property and equipment, net |
— | — | — | — | 2,844,927 | 2,843,653 | 2,494,744 | (2,843,653 | ) | 5,339,671 | ||||||||||||||||||||
| Goodwill |
— | — | — | — | 3,434,165 | — | 3,340,169 | — | 6,774,334 | |||||||||||||||||||||
| Non-amortizable intangible assets |
— | — | — | — | 2,160,130 | — | 797,070 | — | 2,957,200 | |||||||||||||||||||||
| Amortizable intangible assets, net |
— | — | — | — | 579,650 | — | 544,625 | — | 1,124,275 | |||||||||||||||||||||
| Investment in affiliates |
1,994,848 | 7,126,074 | 10,640,176 | 7,750,641 | (40,782 | ) | (54,207 | ) | 95,937 | (27,416,750 | ) | 95,937 | ||||||||||||||||||
| Other assets |
— | 144,388 | 20,434 | 5,043 | 113,216 | 87,442 | 204,183 | (87,442 | ) | 487,264 | ||||||||||||||||||||
| Total assets |
$ | 2,004,269 | $ | 7,452,112 | $ | 10,680,776 | $ | 7,755,825 | $ | 10,143,046 | $ | 3,167,999 | $ | 8,091,065 | $ | (31,637,760 | ) | $ | 17,657,332 | |||||||||||
| LIABILITIES AND SHAREHOLDER’S EQUITY |
||||||||||||||||||||||||||||||
| Current liabilities: |
||||||||||||||||||||||||||||||
| Accounts payable and accrued liabilities |
$ | 5,913 | $ | 29 | $ | — | $ | — | $ | 58,047 | $ | 57,832 | $ | 114,408 | $ | (61,735 | ) | $ | 174,494 | |||||||||||
| Accrued interest payable |
17,242 | 225,879 | 29,175 | — | 73,723 | 5,582 | 64,063 | (5,582 | ) | 410,082 | ||||||||||||||||||||
| Current portion of long-term debt |
— | — | — | — | 9,939 | 6,492 | 89,419 | (6,492 | ) | 99,358 | ||||||||||||||||||||
| Deferred satellite performance incentives |
— | — | — | — | 8,740 | 8,740 | 17,507 | (8,740 | ) | 26,247 | ||||||||||||||||||||
| Other current liabilities |
— | — | 530 | — | 69,088 | 68,911 | 65,414 | (68,911 | ) | 135,032 | ||||||||||||||||||||
| Intercompany payables |
511,535 | 92,559 | 339,820 | 50,987 | — | 1,065,317 | — | (2,060,218 | ) | — | ||||||||||||||||||||
| Total current liabilities |
534,690 | 318,467 | 369,525 | 50,987 | 219,537 | 1,212,874 | 350,811 | (2,211,678 | ) | 845,213 | ||||||||||||||||||||
| Long-term debt, net of current portion |
965,232 | 5,063,815 | 3,135,975 | 439,197 | 1,904,596 | 5,000 | 3,265,160 | (5,000 | ) | 14,773,975 | ||||||||||||||||||||
| Deferred satellite performance incentives, net of current portion |
— | — | — | — | 26,621 | 26,621 | 102,351 | (26,621 | ) | 128,972 | ||||||||||||||||||||
| Deferred revenue, net of current portion |
— | — | — | — | 123,792 | 123,792 | 42,519 | (123,792 | ) | 166,311 | ||||||||||||||||||||
| Deferred income taxes |
— | — | — | — | — | — | 562,742 | — | 562,742 | |||||||||||||||||||||
| Accrued retirement benefits |
— | — | — | — | 67,053 | 67,053 | 167,961 | (67,053 | ) | 235,014 | ||||||||||||||||||||
| Other long-term liabilities |
— | 74,982 | 49,202 | — | 50,806 | 22,863 | 261,268 | (22,863 | ) | 436,258 | ||||||||||||||||||||
| Noncontrolling interest |
— | — | — | — | — | — | 4,500 | — | 4,500 | |||||||||||||||||||||
| Shareholder’s equity: |
||||||||||||||||||||||||||||||
| Ordinary shares |
12 | 12 | 12 | — | 12 | — | 70 | (106 | ) | 12 | ||||||||||||||||||||
| Other shareholder’s equity |
504,335 | 1,994,836 | 7,126,062 | 7,265,641 | 7,750,629 | 1,709,796 | 3,333,683 | (29,180,647 | ) | 504,335 | ||||||||||||||||||||
| Total liabilities and shareholder’s equity |
$ | 2,004,269 | $ | 7,452,112 | $ | 10,680,776 | $ | 7,755,825 | $ | 10,143,046 | $ | 3,167,999 | $ | 8,091,065 | $ | (31,637,760 | ) | $ | 17,657,332 | |||||||||||
(Certain totals may not add due to the effects of rounding)
F-69
Table of Contents
INTELSAT S.A. AND SUBSIDIARIES
CONDENSED CONSOLIDATING STATEMENT OF OPERATIONS
FOR THE YEAR ENDED DECEMBER 31, 2009
(in thousands)
| Intelsat S.A. | Intelsat Luxembourg |
Intelsat Jackson |
Intermediate Holdco |
Intelsat Sub Holdco |
Intelsat Sub Holdco Subsidiary Guarantors |
Non-Guarantor Subsidiaries |
Eliminations | Consolidated | ||||||||||||||||||||||||||||
| Revenue |
$ | — | $ | — | $ | — | $ | — | $ | 1,520,514 | $ | 1,535,902 | $ | 1,574,757 | $ | (2,118,134 | ) | $ | 2,513,039 | |||||||||||||||||
| Operating expenses: |
||||||||||||||||||||||||||||||||||||
| Direct costs of revenue (exclusive of depreciation and amortization) |
— | 23 | — | — | 302,975 | 1,554,353 | 678,480 | (2,134,005 | ) | 401,826 | ||||||||||||||||||||||||||
| Selling, general and administrative |
28,029 | 23,250 | 224 | 15 | 36,151 | 28,927 | 176,717 | (33,369 | ) | 259,944 | ||||||||||||||||||||||||||
| Depreciation and amortization |
— | — | — | — | 459,473 | 369,425 | 344,564 | (369,425 | ) | 804,037 | ||||||||||||||||||||||||||
| Impairment of asset value |
— | — | — | — | 355,000 | — | 144,100 | — | 499,100 | |||||||||||||||||||||||||||
| Losses on derivative financial instruments |
— | — | 4,672 | — | (19,825 | ) | — | 17,834 | — | 2,681 | ||||||||||||||||||||||||||
| Total operating expenses |
28,029 | 23,273 | 4,896 | 15 | 1,133,774 | 1,952,705 | 1,361,695 | (2,536,799 | ) | 1,967,588 | ||||||||||||||||||||||||||
| Income (loss) from operations |
(28,029 | ) | (23,273 | ) | (4,896 | ) | (15 | ) | 386,740 | (416,803 | ) | 213,062 | 418,665 | 545,451 | ||||||||||||||||||||||
| Interest expense (income), net |
104,311 | 622,058 | 291,908 | 44,942 | 134,116 | 2,717 | 166,688 | (3,917 | ) | 1,362,823 | ||||||||||||||||||||||||||
| Gain (loss) on early extinguishment of debt |
(74,483 | ) | 19,676 | — | — | 60,755 | — | (51 | ) | (1,200 | ) | 4,697 | ||||||||||||||||||||||||
| Subsidiary income (loss) |
(538,746 | ) | 126,784 | 474,244 | 440,263 | 10,282 | 11,393 | — | (524,220 | ) | — | |||||||||||||||||||||||||
| Other income (expense), net |
— | (1 | ) | — | — | 31,972 | 31,974 | 10,042 | (31,974 | ) | 42,013 | |||||||||||||||||||||||||
| Income (loss) before income taxes |
(745,569 | ) | (498,872 | ) | 177,440 | 395,306 | 355,633 | (376,153 | ) | 56,365 | (134,812 | ) | (770,662 | ) | ||||||||||||||||||||||
| Provision for (benefit from) income taxes |
37,985 | 14,133 | 50,656 | 3,746 | (84,630 | ) | 26,710 | (10,491 | ) | (26,710 | ) | 11,399 | ||||||||||||||||||||||||
| Net income (loss) |
(783,554 | ) | (513,005 | ) | 126,784 | 391,560 | 440,263 | (402,863 | ) | 66,856 | (108,102 | ) | (782,061 | ) | ||||||||||||||||||||||
| Net loss attributable to noncontrolling interest |
— | — | — | — | — | — | 369 | — | 369 | |||||||||||||||||||||||||||
| Net income (loss) attributable to Intelsat S.A. |
$ | (783,554 | ) | $ | (513,005 | ) | $ | 126,784 | $ | 391,560 | $ | 440,263 | $ | (402,863 | ) | $ | 67,225 | $ | (108,102 | ) | $ | (781,692 | ) | |||||||||||||
(Certain totals may not add due to the effects of rounding)
F-70
Table of Contents
INTELSAT S.A. AND SUBSIDIARIES
CONDENSED CONSOLIDATING STATEMENT OF OPERATIONS
FOR THE PERIOD JANUARY 1, 2008 TO JANUARY 31, 2008
(in thousands)
| Intelsat S.A. | Intelsat Luxembourg |
Intermediate Holdco |
Intelsat Sub Holdco |
Intelsat Sub Holdco Subsidiary Guarantors |
Non-Guarantor Subsidiaries |
Eliminations | Consolidated | ||||||||||||||||||||||||
| Revenue |
$ | — | $ | — | $ | — | $ | 110,468 | $ | 110,468 | $ | 149,448 | $ | (180,123 | ) | $ | 190,261 | ||||||||||||||
| Operating expenses: |
|||||||||||||||||||||||||||||||
| Direct costs of revenue (exclusive of depreciation and amortization) |
— | — | — | 54,830 | 129,481 | 40,500 | (199,128 | ) | 25,683 | ||||||||||||||||||||||
| Selling, general and administrative |
1,600 | 739 | — | 2,169 | 1,076 | 13,983 | (1,082 | ) | 18,485 | ||||||||||||||||||||||
| Depreciation and amortization |
— | — | — | 36,204 | 33,004 | 27,953 | (33,004 | ) | 64,157 | ||||||||||||||||||||||
| Transaction costs |
186,601 | 60,000 | — | 2,188 | 1,008 | 64,313 | (1,008 | ) | 313,102 | ||||||||||||||||||||||
| Losses on derivative financial instruments |
— | — | — | — | — | 11,431 | — | 11,431 | |||||||||||||||||||||||
| Total operating expenses |
188,201 | 60,739 | — | 95,391 | 164,569 | 158,180 | (234,222 | ) | 432,858 | ||||||||||||||||||||||
| Income (loss) from operations |
(188,201 | ) | (60,739 | ) | — | 15,077 | (54,101 | ) | (8,732 | ) | 54,099 | (242,597 | ) | ||||||||||||||||||
| Interest expense, net |
14,168 | 35,621 | 3,117 | 6,359 | 3,504 | 21,010 | (3,504 | ) | 80,275 | ||||||||||||||||||||||
| Subsidiary income (loss) |
(109,492 | ) | (13,132 | ) | 5,249 | (512 | ) | (512 | ) | — | 118,399 | — | |||||||||||||||||||
| Other income, net |
— | — | — | 331 | 331 | 204 | (331 | ) | 535 | ||||||||||||||||||||||
| Income (loss) before income taxes |
(311,861 | ) | (109,492 | ) | 2,132 | 8,537 | (57,786 | ) | (29,538 | ) | 175,671 | (322,337 | ) | ||||||||||||||||||
| Provision for (benefit from) income taxes |
— | — | — | 3,288 | 3,072 | (13,764 | ) | (3,072 | ) | (10,476 | ) | ||||||||||||||||||||
| Net income (loss) |
$ | (311,861 | ) | $ | (109,492 | ) | $ | 2,132 | $ | 5,249 | $ | (60,858 | ) | $ | (15,774 | ) | $ | 178,743 | $ | (311,861 | ) | ||||||||||
(Certain totals may not add due to the effects of rounding)
F-71
Table of Contents
INTELSAT S.A. AND SUBSIDIARIES
CONDENSED CONSOLIDATING STATEMENT OF OPERATIONS
FOR THE PERIOD FEBRUARY 1, 2008 TO DECEMBER 31, 2008
(in thousands)
| Intelsat S.A. | Intelsat Luxembourg |
Intelsat Jackson |
Intermediate Holdco |
Intelsat Sub Holdco |
Intelsat Sub Holdco Subsidiary Guarantors |
Non-Guarantor Subsidiaries |
Eliminations | Consolidated | ||||||||||||||||||||||||||||
| Revenue |
$ | — | $ | — | $ | — | $ | — | $ | 1,307,350 | $ | 1,307,350 | $ | 1,330,785 | $ | (1,770,845 | ) | $ | 2,174,640 | |||||||||||||||||
| Operating expenses: |
||||||||||||||||||||||||||||||||||||
| Direct costs of revenue (exclusive of depreciation and amortization) |
— | — | — | — | 272,023 | 1,329,891 | 528,946 | (1,793,394 | ) | 337,466 | ||||||||||||||||||||||||||
| Selling, general and administrative |
21,019 | 9,976 | 67 | 200 | 26,286 | 23,077 | 125,403 | (23,071 | ) | 182,957 | ||||||||||||||||||||||||||
| Depreciation and amortization |
— | — | — | — | 466,747 | 363,916 | 328,916 | (363,916 | ) | 795,663 | ||||||||||||||||||||||||||
| Restructuring costs |
— | — | — | — | — | — | 1,926 | — | 1,926 | |||||||||||||||||||||||||||
| Impairment of asset value |
— | — | — | — | 134,444 | 63,644 | 256,000 | (63,644 | ) | 390,444 | ||||||||||||||||||||||||||
| Losses on derivative financial instruments |
— | — | 53,843 | — | 18,010 | — | 83,452 | — | 155,305 | |||||||||||||||||||||||||||
| Total operating expenses |
21,019 | 9,976 | 53,910 | 200 | 917,510 | 1,780,528 | 1,324,643 | (2,244,025 | ) | 1,863,761 | ||||||||||||||||||||||||||
| Income (loss) from operations |
(21,019 | ) | (9,976 | ) | (53,910 | ) | (200 | ) | 389,840 | (473,178 | ) | 6,142 | 473,180 | 310,879 | ||||||||||||||||||||||
| Interest expense (income), net |
124,433 | 535,036 | 270,443 | 38,252 | 110,020 | (3,023 | ) | 217,272 | 3,025 | 1,295,458 | ||||||||||||||||||||||||||
| Gain (loss) on early extinguishment of debt |
— | — | (20 | ) | — | 3 | — | 593 | — | 576 | ||||||||||||||||||||||||||
| Subsidiary income (loss) |
(740,855 | ) | (195,824 | ) | 128,549 | 279,698 | 1,304 | 1,581 | — | 525,547 | — | |||||||||||||||||||||||||
| Other income (expense), net |
1 | 2 | — | 3 | (14,058 | ) | (14,058 | ) | 2,095 | 14,058 | (11,957 | ) | ||||||||||||||||||||||||
| Income (loss) before income taxes |
(886,306 | ) | (740,834 | ) | (195,824 | ) | 241,249 | 267,069 | (482,632 | ) | (208,442 | ) | 1,009,760 | (995,960 | ) | |||||||||||||||||||||
| Provision for (benefit from) income taxes |
— | 21 | — | — | (12,629 | ) | (13,286 | ) | (96,953 | ) | 13,286 | (109,561 | ) | |||||||||||||||||||||||
| Net income (loss) |
(886,306 | ) | (740,855 | ) | (195,824 | ) | 241,249 | 279,698 | (469,346 | ) | (111,489 | ) | 996,474 | (886,399 | ) | |||||||||||||||||||||
| Net loss attributable to noncontrolling interest |
— | — | — | — | — | — | 93 | — | 93 | |||||||||||||||||||||||||||
| Net income (loss) attributable to Intelsat S.A. |
$ | (886,306 | ) | $ | (740,855 | ) | $ | (195,824 | ) | $ | 241,249 | $ | 279,698 | $ | (469,346 | ) | $ | (111,396 | ) | $ | 996,474 | $ | (886,306 | ) | ||||||||||||
(Certain totals may not add due to the effects of rounding)
F-72
Table of Contents
INTELSAT S.A. AND SUBSIDIARIES
CONDENSED CONSOLIDATING STATEMENT OF OPERATIONS
FOR THE YEAR ENDED DECEMBER 31, 2007
(in thousands)
| Intelsat S.A. |
Intelsat Luxembourg |
Intermediate Holdco |
Intelsat Sub Holdco |
Intelsat Sub Holdco Subsidiary Guarantors |
Non-Guarantor Subsidiaries |
Eliminations | Consolidated | |||||||||||||||||||||||||
| Revenue |
$ | — | $ | — | $ | — | $ | 1,254,092 | $ | 1,249,237 | $ | 1,342,248 | $ | (1,662,498 | ) | $ | 2,183,079 | |||||||||||||||
| Operating expenses: |
||||||||||||||||||||||||||||||||
| Direct costs of revenue (exclusive of depreciation and amortization) |
— | — | — | 267,998 | 1,270,800 | 466,155 | (1,681,396 | ) | 323,557 | |||||||||||||||||||||||
| Selling, general and administrative |
24,744 | 11,409 | 8 | 51,696 | 36,637 | 153,299 | (39,303 | ) | 238,490 | |||||||||||||||||||||||
| Depreciation and amortization |
— | — | — | 468,900 | 430,501 | 315,220 | (430,501 | ) | 784,120 | |||||||||||||||||||||||
| Restructuring costs |
— | — | — | 102 | 102 | 9,156 | (102 | ) | 9,258 | |||||||||||||||||||||||
| Losses on derivative financial instruments |
— | — | — | — | — | 11,699 | — | 11,699 | ||||||||||||||||||||||||
| Total operating expenses |
24,744 | 11,409 | 8 | 788,696 | 1,738,040 | 955,529 | (2,151,302 | ) | 1,367,124 | |||||||||||||||||||||||
| Income (loss) from operations |
(24,744 | ) | (11,409 | ) | (8 | ) | 465,396 | (488,803 | ) | 386,719 | 488,804 | 815,955 | ||||||||||||||||||||
| Interest expense, net |
179,751 | 386,995 | 36,354 | 88,186 | 43,280 | 263,321 | (43,280 | ) | 954,607 | |||||||||||||||||||||||
| Loss on early extinguishment of debt |
— | — | — | (38,143 | ) | — | — | — | (38,143 | ) | ||||||||||||||||||||||
| Subsidiary income |
12,662 | 411,066 | 293,387 | 891 | 891 | — | (718,897 | ) | — | |||||||||||||||||||||||
| Other income (expense), net |
(3 | ) | — | — | (4,999 | ) | (4,986 | ) | 4,865 | 4,986 | (137 | ) | ||||||||||||||||||||
| Income (loss) before income taxes |
(191,836 | ) | 12,662 | 257,025 | 334,959 | (536,178 | ) | 128,263 | (181,827 | ) | (176,932 | ) | ||||||||||||||||||||
| Provision for (benefit from) income taxes |
53 | — | — | 41,572 | 38,474 | (26,668 | ) | (38,474 | ) | 14,957 | ||||||||||||||||||||||
| Net income (loss) |
$ | (191,889 | ) | $ | 12,662 | $ | 257,025 | $ | 293,387 | $ | (574,652 | ) | $ | 154,931 | $ | (143,353 | ) | $ | (191,889 | ) | ||||||||||||
(Certain totals may not add due to the effects of rounding)
F-73
Table of Contents
INTELSAT S.A. AND SUBSIDIARIES
CONDENSED CONSOLIDATING STATEMENT OF CASH FLOWS
FOR THE YEAR ENDED DECEMBER 31, 2009
(in thousands)
| Intelsat S.A. | Intelsat Luxembourg |
Intelsat Jackson |
Intermediate Holdco |
Intelsat Sub Holdco |
Intelsat Sub Holdco Subsidiary Guarantors |
Non-Guarantor Subsidiaries |
Consolidation and Eliminations |
Consolidated | |||||||||||||||||||
| Cash flows from operating activities: |
(96,719 | ) | (348,049 | ) | (296,687 | ) | (9 | ) | 1,045,274 | 811,758 | 492,850 | (734,762 | ) | 873,656 | |||||||||||||
| Cash flows from investing activities: |
|||||||||||||||||||||||||||
| Payments for satellites and other property and equipment (including capitalized interest) |
— | — | — | — | (800,282 | ) | (800,282 | ) | (368,021 | ) | 1,025,452 | (943,133 | ) | ||||||||||||||
| Proceeds from sale of other property and equipment |
— | — | — | — | 97,200 | 97,200 | 128,648 | (322,362 | ) | 686 | |||||||||||||||||
| Disbursements for intercompany loans |
— | — | (10,616 | ) | — | (135,793 | ) | (63,951 | ) | (140,519 | ) | 350,879 | — | ||||||||||||||
| Capital contribution to unconsolidated affiliates |
— | — | — | — | — | — | (12,210 | ) | — | (12,210 | ) | ||||||||||||||||
| Investment in subsidiaries |
(5,000 | ) | — | (100,000 | ) | (100,000 | ) | (1,124 | ) | — | — | 206,124 | — | ||||||||||||||
| Investment in affiliate debt |
— | — | — | — | (347,953 | ) | — | — | 347,953 | — | |||||||||||||||||
| Dividend from affiliates |
53,625 | 596,524 | 283,560 | 283,560 | — | — | — | (1,217,269 | ) | — | |||||||||||||||||
| Other investing activities |
— | — | — | — | — | — | 7,562 | — | 7,562 | ||||||||||||||||||
| Net cash provided by (used in) investing activities |
48,625 | 596,524 | 172,944 | 183,560 | (1,187,952 | ) | (767,033 | ) | (384,540 | ) | 390,777 | (947,095 | ) | ||||||||||||||
| Cash flows from financing activities: |
|||||||||||||||||||||||||||
| Repayments of long-term debt |
— | (376,000 | ) | — | — | (9,277 | ) | (5,000 | ) | (90,078 | ) | (342,954 | ) | (823,309 | ) | ||||||||||||
| Repayment of loan proceeds received from Intelsat Holdings |
— | — | (34,000 | ) | — | — | — | — | — | (34,000 | ) | ||||||||||||||||
| Proceeds from issuance of long-term debt |
— | — | 495,830 | — | 354,000 | — | 112,087 | — | 961,917 | ||||||||||||||||||
| Proceeds from (repayment of) intercompany borrowing |
51,625 | 10,616 | 250,670 | — | 77,000 | — | (25,980 | ) | (363,931 | ) | — | ||||||||||||||||
| Debt issuance costs |
— | — | (10,192 | ) | — | (7,330 | ) | — | — | — | (17,522 | ) | |||||||||||||||
| Principal payments on deferred satellite performance incentives |
— | — | — | — | (8,320 | ) | (8,320 | ) | (16,283 | ) | 8,320 | (24,603 | ) | ||||||||||||||
| Principal payments on capital lease obligations |
— | — | — | — | (1,492 | ) | (1,492 | ) | (367 | ) | 1,492 | (1,859 | ) | ||||||||||||||
| Capital contribution from parent |
12,000 | 5,000 | 100,000 | 100,000 | 1,124 | (206,124 | ) | 12,000 | |||||||||||||||||||
| Dividends to shareholders |
— | (53,625 | ) | (596,524 | ) | (283,560 | ) | (283,560 | ) | — | — | 1,217,269 | — | ||||||||||||||
| Noncontrolling interest in New Dawn |
377 | — | 377 | ||||||||||||||||||||||||
| Net cash provided by (used in) financing activities |
63,625 | (414,009 | ) | 105,784 | (183,560 | ) | 221,021 | (14,812 | ) | (19,120 | ) | 314,072 | 73,001 | ||||||||||||||
| Effect of exchange rate changes on cash and cash equivalents |
— | (1 | ) | — | — | 264 | 264 | 7,535 | (264 | ) | 7,798 | ||||||||||||||||
| Net change in cash and cash equivalents |
15,531 | (165,535 | ) | (17,959 | ) | (9 | ) | 78,607 | 30,177 | 96,725 | (30,176 | ) | 7,360 | ||||||||||||||
| Cash and cash equivalents, beginning of period |
6,286 | 181,650 | 20,166 | 50 | 149,003 | 74,815 | 113,056 | (74,815 | ) | 470,211 | |||||||||||||||||
| Cash and cash equivalents, end of period |
21,817 | 16,115 | 2,207 | 41 | 227,610 | 104,992 | 209,781 | (104,992 | ) | 477,571 | |||||||||||||||||
(Certain totals may not add due to the effects of rounding)
F-74
Table of Contents
INTELSAT S.A. AND SUBSIDIARIES
CONDENSED CONSOLIDATING STATEMENT OF CASH FLOWS
FOR THE PERIOD JANUARY 1, 2008 TO JANUARY 31, 2008
(in thousands)
| Intelsat S.A. | Intelsat Luxembourg |
Intermediate Holdco |
Intelsat Sub Holdco |
Intelsat Sub Holdco Subsidiary Guarantors |
Non-Guarantor Subsidiaries |
Eliminations | Consolidated | ||||||||||||||||||||||||
| Cash flows from operating activities |
$ | (1,179 | ) | $ | (46,397 | ) | $ | — | $ | (1,531 | ) | $ | (11,112 | ) | $ | 68,726 | $ | 11,112 | $ | 19,619 | |||||||||||
| Cash flows from investing activities: |
|||||||||||||||||||||||||||||||
| Payments for satellites and other property and equipment (including capitalized interest) |
— | — | — | (9,908 | ) | (9,908 | ) | (14,793 | ) | 9,908 | (24,701 | ) | |||||||||||||||||||
| Proceeds from intercompany loan receivables |
— | — | — | 34,000 | 34,000 | — | (68,000 | ) | — | ||||||||||||||||||||||
| Net cash provided by (used in) investing activities |
— | — | — | 24,092 | 24,092 | (14,793 | ) | (58,092 | ) | (24,701 | ) | ||||||||||||||||||||
| Cash flows from financing activities: |
|||||||||||||||||||||||||||||||
| Repayments of long-term debt |
— | — | — | (5,862 | ) | (5,000 | ) | (162,985 | ) | 5,000 | (168,847 | ) | |||||||||||||||||||
| Proceeds from revolving credit facility |
— | — | — | — | — | 150,000 | — | 150,000 | |||||||||||||||||||||||
| Repayment of intercompany loans |
— | — | — | — | (102,937 | ) | (34,000 | ) | 136,937 | — | |||||||||||||||||||||
| Principal payments on deferred satellite performance incentives |
— | — | — | (87 | ) | (87 | ) | (1,246 | ) | 87 | (1,333 | ) | |||||||||||||||||||
| Principal payments on capital lease obligations |
— | — | — | (2,124 | ) | (2,124 | ) | — | 2,124 | (2,124 | ) | ||||||||||||||||||||
| Net cash used in financing activities |
— | — | — | (8,073 | ) | (110,148 | ) | (48,231 | ) | 144,148 | (22,304 | ) | |||||||||||||||||||
| Effect of exchange rate changes on cash and cash equivalents |
— | — | — | 45 | 45 | 92 | (45 | ) | 137 | ||||||||||||||||||||||
| Net change in cash and cash equivalents |
(1,179 | ) | (46,397 | ) | — | 14,533 | (97,123 | ) | 5,794 | 97,123 | (27,249 | ) | |||||||||||||||||||
| Cash and cash equivalents, beginning of period |
1,391 | 50,998 | — | 233,880 | 118,282 | 140,300 | (118,282 | ) | 426,569 | ||||||||||||||||||||||
| Cash and cash equivalents, end of period |
$ | 212 | $ | 4,601 | $ | — | $ | 248,413 | $ | 21,159 | $ | 146,094 | $ | (21,159 | ) | $ | 399,320 | ||||||||||||||
(Certain totals may not add due to the effects of rounding)
F-75
Table of Contents
INTELSAT S.A. AND SUBSIDIARIES
CONDENSED CONSOLIDATING STATEMENT OF CASH FLOWS
FOR THE PERIOD FEBRUARY 1, 2008 TO DECEMBER 31, 2008
(in thousands)
| Intelsat S.A. | Intelsat Luxembourg |
Intelsat Jackson |
Intermediate Holdco |
Intelsat Sub Holdco |
Intelsat Sub Holdco Subsidiary Guarantors |
Non-Guarantor Subsidiaries |
Eliminations | Consolidated | ||||||||||||||||||||||||||||
| Cash flows from operating activities |
$ | (32,741 | ) | $ | (33,103 | ) | $ | (253,857 | ) | $ | 5,822 | $ | 703,009 | $ | 364,536 | $ | 487,013 | $ | (364,536 | ) | $ | 876,143 | ||||||||||||||
| Cash flows from investing activities: |
||||||||||||||||||||||||||||||||||||
| Payments for satellites and other property and equipment (including capitalized interest) |
— | — | — | — | (272,915 | ) | (272,915 | ) | (124,844 | ) | 272,915 | (397,759 | ) | |||||||||||||||||||||||
| Capital contributions to unconsolidated affiliates |
— | — | — | — | (17,621 | ) | (17,621 | ) | (9,659 | ) | 17,621 | (27,280 | ) | |||||||||||||||||||||||
| Capital contribution from Intelsat Holdings |
4,596 | — | — | — | — | — | — | — | 4,596 | |||||||||||||||||||||||||||
| Dividend from affiliates |
439,565 | 621,746 | 826,018 | 826,018 | — | (2,713,347 | ) | — | ||||||||||||||||||||||||||||
| Investment in subsidiaries |
— | — | — | — | (13,703 | ) | 1,000 | 13,703 | (1,000 | ) | — | |||||||||||||||||||||||||
| Minority interest in New Dawn |
4,592 | — | 4,592 | |||||||||||||||||||||||||||||||||
| Other investing activities |
— | — | — | — | — | — | 5,954 | — | 5,954 | |||||||||||||||||||||||||||
| Net cash provided by (used in) investing activities |
444,161 | 621,746 | 826,018 | 826,018 | (304,239 | ) | (289,536 | ) | (110,254 | ) | (2,423,811 | ) | (409,897 | ) | ||||||||||||||||||||||
| Cash flows from financing activities: |
||||||||||||||||||||||||||||||||||||
| Repayments of long-term debt |
(400,000 | ) | — | (2,641,597 | ) | (408,117 | ) | (1,551,756 | ) | — | (1,278,695 | ) | — | (6,280,165 | ) | |||||||||||||||||||||
| Repayments of revolving credit facility |
— | — | — | (175,120 | ) | — | (66,101 | ) | — | (241,221 | ) | |||||||||||||||||||||||||
| Proceeds from issuance of long-term debt |
— | — | 1,797,389 | 412,197 | 1,564,358 | — | 1,238,839 | — | 5,012,783 | |||||||||||||||||||||||||||
| Loan proceeds from Intelsat Holdings |
— | — | 34,000 | — | — | — | — | — | 34,000 | |||||||||||||||||||||||||||
| Proceeds from revolving credit facility |
— | — | 175,120 | — | 66,101 | — | 241,221 | |||||||||||||||||||||||||||||
| Proceeds from (repayment of) intercompany loans |
(201,629 | ) | 83,000 | 226,973 | (565 | ) | 149,194 | (9,016 | ) | (256,973 | ) | 9,016 | — | |||||||||||||||||||||||
| Debt issuance costs |
— | (55,032 | ) | (21,731 | ) | (5,207 | ) | (19,662 | ) | — | (18,001 | ) | — | (119,633 | ) | |||||||||||||||||||||
| Repayments of funding of capital expenditures by customer |
— | — | — | — | — | — | (30,862 | ) | — | (30,862 | ) | |||||||||||||||||||||||||
| Payment of premium on early retirement of debt |
(7,615 | ) | — | (48,654 | ) | (4,080 | ) | (15,489 | ) | — | (12,266 | ) | — | (88,104 | ) | |||||||||||||||||||||
| Principal payments on deferred satellite performance incentives |
— | — | — | — | (3,942 | ) | (3,942 | ) | (19,360 | ) | 3,942 | (23,302 | ) | |||||||||||||||||||||||
| Principal payments on capital lease obligations |
— | — | — | — | (8,822 | ) | (8,822 | ) | (326 | ) | 8,822 | (9,148 | ) | |||||||||||||||||||||||
| Dividends to shareholders |
— | (439,565 | ) | (621,746 | ) | (826,018 | ) | (826,018 | ) | — | — | 2,713,347 | — | |||||||||||||||||||||||
| Net cash used in financing activities |
(609,244 | ) | (411,597 | ) | (1,275,366 | ) | (831,790 | ) | (712,137 | ) | (21,780 | ) | (377,644 | ) | 2,735,127 | (1,504,431 | ) | |||||||||||||||||||
| Effect of exchange rate changes on cash and cash equivalents |
— | 2 | — | — | (263 | ) | (263 | ) | (5,980 | ) | 263 | (6,241 | ) | |||||||||||||||||||||||
| Net change in cash and cash equivalents |
(197,824 | ) | 177,048 | (703,205 | ) | 50 | (313,630 | ) | 52,957 | (6,865 | ) | (52,957 | ) | (1,044,426 | ) | |||||||||||||||||||||
| Cash and cash equivalents, beginning of period |
204,110 | 4,602 | 723,371 | — | 462,633 | 21,858 | 119,921 | (21,858 | ) | 1,514,637 | ||||||||||||||||||||||||||
| Cash and cash equivalents, end of period |
$ | 6,286 | $ | 181,650 | $ | 20,166 | $ | 50 | 149,003 | $ | 74,815 | $ | 113,056 | $ | (74,815 | ) | $ | 470,211 | ||||||||||||||||||
(Certain totals may not add due to the effects of rounding)
F-76
Table of Contents
INTELSAT S.A. AND SUBSIDIARIES
CONDENSED CONSOLIDATING STATEMENT OF CASH FLOWS
FOR THE YEAR ENDED DECEMBER 31, 2007
(in thousands)
| Intelsat S.A. | Intelsat Luxembourg |
Intermediate Holdco |
Intelsat Sub Holdco |
Intelsat Sub Holdco Subsidiary Guarantors |
Non-Guarantor Subsidiaries |
Eliminations | Consolidated | |||||||||||||||||||||||||
| Cash flows from operating activities |
$ | (121,437 | ) | $ | (370,411 | ) | $ | — | $ | 542,295 | $ | 152,847 | $ | 506,574 | $ | (152,847 | ) | $ | 557,021 | |||||||||||||
| Cash flows from investing activities: |
||||||||||||||||||||||||||||||||
| Payments for satellites and other property and equipment |
— | — | — | (156,762 | ) | (156,762 | ) | (386,850 | ) | 156,762 | (543,612 | ) | ||||||||||||||||||||
| Other investing activities |
— | — | — | — | — | 2,624 | — | 2,624 | ||||||||||||||||||||||||
| Advances from subsidiaries |
— | — | — | — | — | (67,431 | ) | 67,431 | — | |||||||||||||||||||||||
| Investment in subsidiaries |
116,000 | (538,690 | ) | (538,690 | ) | — | — | — | 961,380 | — | ||||||||||||||||||||||
| Net cash provided by (used in) investing activities |
116,000 | (538,690 | ) | (538,690 | ) | (156,762 | ) | (156,762 | ) | (451,657 | ) | 1,185,573 | (540,988 | ) | ||||||||||||||||||
| Cash flows from financing activities: |
||||||||||||||||||||||||||||||||
| Repayments of long-term debt |
— | (600,000 | ) | — | (1,008,448 | ) | (5,000 | ) | (53,132 | ) | 5,000 | (1,661,580 | ) | |||||||||||||||||||
| Proceeds from issuance of long-term debt |
— | 1,595,000 | — | — | — | — | — | 1,595,000 | ||||||||||||||||||||||||
| Repayment of credit facility borrowings |
— | (51,194 | ) | — | — | — | — | 51,194 | — | |||||||||||||||||||||||
| Proceeds from revolving credit facility |
— | 118,625 | — | — | — | — | (118,625 | ) | — | |||||||||||||||||||||||
| Debt issuance costs |
— | (28,322 | ) | — | (523 | ) | — | (2,172 | ) | — | (31,017 | ) | ||||||||||||||||||||
| Repayments of funding of capital expenditures by customer |
— | — | — | — | — | (41,282 | ) | — | (41,282 | ) | ||||||||||||||||||||||
| Payment of premium on early retirement of debt |
— | — | — | (10,000 | ) | — | — | — | (10,000 | ) | ||||||||||||||||||||||
| Capital contributions from parent companies |
— | — | 977,000 | 977,000 | — | — | (1,954,000 | ) | — | |||||||||||||||||||||||
| Principal payments on deferred satellite performance incentives |
— | — | — | (5,089 | ) | (5,089 | ) | (13,467 | ) | 5,089 | (18,556 | ) | ||||||||||||||||||||
| Principal payments on capital lease obligations |
— | — | — | (6,167 | ) | (6,167 | ) | — | 6,167 | (6,167 | ) | |||||||||||||||||||||
| Dividends to shareholders |
— | (116,000 | ) | (438,310 | ) | (438,310 | ) | — | — | 992,620 | — | |||||||||||||||||||||
| Net cash provided by (used in) financing activities |
— | 918,109 | 538,690 | (491,537 | ) | (16,256 | ) | (110,053 | ) | (1,012,555 | ) | (173,602 | ) | |||||||||||||||||||
| Effect of exchange rate changes on cash |
(6 | ) | — | — | (1,529 | ) | (1,515 | ) | 2,017 | 1,515 | 482 | |||||||||||||||||||||
| Net change in cash and cash equivalents |
(5,443 | ) | 9,008 | — | (107,533 | ) | (21,686 | ) | (53,119 | ) | 21,686 | (157,087 | ) | |||||||||||||||||||
| Cash and cash equivalents, beginning of period |
6,834 | 41,990 | — | 341,413 | 139,968 | 193,419 | (139,968 | ) | 583,656 | |||||||||||||||||||||||
| Cash and cash equivalents, end of period |
$ | 1,391 | $ | 50,998 | $ | — | $ | 233,880 | $ | 118,282 | $ | 140,300 | $ | (118,282 | ) | $ | 426,569 | |||||||||||||||
(Certain totals may not add due to the effects of rounding)
F-77
Table of Contents
INTELSAT S.A.
NOTES TO CONSOLIDATED FINANCIAL STATEMENTS—(Continued)
(in thousands, except percentages, share and per share amounts and where otherwise noted)
On March 3, 2005, Intelsat Bermuda transferred substantially all of its assets to Intelsat Sub Holdco and Intelsat Sub Holdco assumed substantially all of the then-existing liabilities of Intelsat Bermuda.
In connection with the PanAmSat Acquisition Transactions, Intelsat Bermuda issued $750.0 million of 9.25% Senior Notes due 2016 (the “Jackson Guaranteed Notes”). The Jackson Guaranteed Notes are fully and unconditionally guaranteed, jointly and severally, by Intelsat, its indirect wholly-owned subsidiary, Intelsat Sub Holdco, and the Subsidiary Guarantors.
On February 4, 2008, promptly after the consummation of the New Sponsors Acquisition, Intelsat Bermuda transferred certain of its assets and certain of its liabilities and obligations (including the Jackson Guaranteed Notes) to Intelsat Jackson. Intelsat Jackson became the obligor on the Jackson Guaranteed Notes and Intelsat Bermuda confirmed its guarantee of the Jackson Guaranteed Notes.
Separate financial statements of Intelsat S.A., Intelsat Luxembourg, Intelsat Jackson, Intelsat Sub Holdco and the Subsidiary Guarantors are not presented because management believes that such financial statement would not be material to investors.
Investments in non-guarantor subsidiaries in the following condensed consolidating financial information are accounted for under the equity method of accounting. Consolidating adjustments include the following:
| • | elimination of investment in subsidiaries; |
| • | elimination of intercompany accounts; |
| • | elimination of intercompany sales between guarantor and non-guarantor subsidiaries; and |
| • | elimination of equity in earnings (losses) of subsidiaries. |
F-78
Table of Contents
INTELSAT S.A. AND SUBSIDIARIES
CONDENSED CONSOLIDATING BALANCE SHEET
AS OF DECEMBER 31, 2009
(in thousands)
| Intelsat S.A. | Intelsat Luxembourg |
Intelsat Jackson |
Subsidiary Guarantors |
Non-Guarantor Subsidiaries |
Eliminations | Consolidated | ||||||||||||||||||||
| ASSETS |
||||||||||||||||||||||||||
| Current assets: |
||||||||||||||||||||||||||
| Cash and cash equivalents |
$ | 21,817 | $ | 16,115 | $ | 229,817 | $ | 227,610 | $ | 209,822 | $ | (227,610 | ) | $ | 477,571 | |||||||||||
| Receivables, net of allowance |
3,282 | — | 180,019 | 180,019 | 111,238 | (180,019 | ) | 294,539 | ||||||||||||||||||
| Deferred income taxes |
— | — | 1,077 | 1,077 | 49,566 | (1,077 | ) | 50,643 | ||||||||||||||||||
| Prepaid expenses and other current assets |
680 | — | 16,206 | 16,206 | 19,918 | (19,449 | ) | 33,561 | ||||||||||||||||||
| Intercompany receivables |
— | — | 431,894 | 638,361 | 55,123 | (1,125,378 | ) | — | ||||||||||||||||||
| Total current assets |
25,779 | 16,115 | 859,013 | 1,063,273 | 445,667 | (1,553,533 | ) | 856,314 | ||||||||||||||||||
| Satellites and other property and equipment, net |
— | — | 3,220,658 | 3,220,658 | 2,559,435 | (3,218,796 | ) | 5,781,955 | ||||||||||||||||||
| Goodwill |
— | — | 3,434,165 | 3,434,165 | 3,346,662 | (3,434,165 | ) | 6,780,827 | ||||||||||||||||||
| Non-amortizable intangible assets |
— | — | 1,805,130 | 1,805,130 | 652,970 | (1,805,130 | ) | 2,458,100 | ||||||||||||||||||
| Amortizable intangible assets, net |
— | — | 490,684 | 490,684 | 487,915 | (490,684 | ) | 978,599 | ||||||||||||||||||
| Investment in affiliates |
962,656 | 6,091,942 | 2,531,383 | (32,832 | ) | 88,902 | (9,553,149 | ) | 88,902 | |||||||||||||||||
| Other assets |
— | 124,926 | 283,619 | 255,663 | 96,170 | (362,140 | ) | 398,238 | ||||||||||||||||||
| Total assets |
$ | 988,435 | $ | 6,232,983 | $ | 12,624,652 | $ | 10,236,741 | $ | 7,677,721 | $ | (20,417,597 | ) | $ | 17,342,935 | |||||||||||
| LIABILITIES AND SHAREHOLDER’S EQUITY |
||||||||||||||||||||||||||
| Current liabilities: |
||||||||||||||||||||||||||
| Accounts payable and accrued liabilities |
$ | 2,196 | $ | 508 | $ | 83,686 | $ | 83,443 | $ | 123,254 | $ | (86,686 | ) | $ | 206,401 | |||||||||||
| Accrued interest payable |
11,651 | 220,740 | 103,268 | 82,911 | 33,717 | (82,911 | ) | 369,376 | ||||||||||||||||||
| Current portion of long-term debt |
— | — | 8,448 | 8,448 | 89,241 | (8,448 | ) | 97,689 | ||||||||||||||||||
| Deferred satellite performance incentives |
— | — | 3,974 | 3,974 | 14,709 | (3,974 | ) | 18,683 | ||||||||||||||||||
| Other current liabilities |
— | — | 74,030 | 72,737 | 48,464 | (72,737 | ) | 122,494 | ||||||||||||||||||
| Intercompany payables |
474,422 | 12,595 | — | — | — | (487,017 | ) | — | ||||||||||||||||||
| Total current liabilities |
488,269 | 233,843 | 273,406 | 251,513 | 309,385 | (741,773 | ) | 814,643 | ||||||||||||||||||
| Long-term debt, net of current portion |
674,806 | 4,954,990 | 5,818,851 | 2,221,559 | 3,774,363 | (2,221,559 | ) | 15,223,010 | ||||||||||||||||||
| Deferred satellite performance incentives, net of current portion |
— | — | 23,201 | 23,201 | 105,573 | (23,201 | ) | 128,774 | ||||||||||||||||||
| Deferred revenue, net of current portion |
— | — | 197,938 | 197,938 | 56,698 | (197,938 | ) | 254,636 | ||||||||||||||||||
| Deferred income taxes |
37,985 | 14,090 | 50,656 | — | 552,465 | (106,477 | ) | 548,719 | ||||||||||||||||||
| Accrued retirement benefits |
— | — | 73,222 | 73,222 | 166,651 | (73,222 | ) | 239,873 | ||||||||||||||||||
| Other long-term liabilities |
— | 63,433 | 95,436 | 61,936 | 176,290 | (61,936 | ) | 335,159 | ||||||||||||||||||
| Noncontrolling interest |
— | — | — | — | 8,884 | — | 8,884 | |||||||||||||||||||
| Shareholder’s equity: |
||||||||||||||||||||||||||
| Common shares |
5,000 | 669,036 | 4,959,000 | 484,000 | 3,602,070 | (9,714,106 | ) | 5,000 | ||||||||||||||||||
| Other shareholder’s equity |
(217,625 | ) | 297,591 | 1,132,942 | 6,923,372 | (1,074,658 | ) | (7,277,385 | ) | (215,763 | ) | |||||||||||||||
| Total liabilities and shareholder’s equity |
$ | 988,435 | $ | 6,232,983 | $ | 12,624,652 | $ | 10,236,741 | $ | 7,677,721 | $ | (20,417,597 | ) | $ | 17,342,935 | |||||||||||
(Certain totals may not add due to the effects of rounding)
F-79
Table of Contents
INTELSAT S.A. AND SUBSIDIARIES
CONDENSED CONSOLIDATING BALANCE SHEET
AS OF DECEMBER 31, 2008
(in thousands)
| Intelsat S.A. | Intelsat Luxembourg |
Intelsat Jackson |
Subsidiary Guarantors |
Non-Guarantor Subsidiaries |
Eliminations | Consolidated | |||||||||||||||||
| ASSETS |
|||||||||||||||||||||||
| Current assets: |
|||||||||||||||||||||||
| Cash and cash equivalents |
$ | 6,286 | $ | 181,650 | $ | 169,169 | $ | 149,003 | $ | 113,106 | $ | (149,003 | ) | $ | 470,211 | ||||||||
| Receivables, net of allowance |
2,108 | — | 192,916 | 192,916 | 107,910 | (192,916 | ) | 302,934 | |||||||||||||||
| Deferred income taxes |
— | — | 2,411 | 2,411 | 46,212 | (2,411 | ) | 48,623 | |||||||||||||||
| Prepaid expenses and other current assets |
1,027 | — | 21,050 | 21,050 | 38,709 | (24,953 | ) | 56,883 | |||||||||||||||
| Intercompany receivables |
— | — | 346,541 | 686,361 | 257,553 | (1,290,455 | ) | — | |||||||||||||||
| Total current assets |
9,421 | 181,650 | 732,087 | 1,051,741 | 563,490 | (1,659,738 | ) | 878,651 | |||||||||||||||
| Satellites and other property and equipment, net |
— | — | 2,844,927 | 2,844,927 | 2,494,744 | (2,844,927 | ) | 5,339,671 | |||||||||||||||
| Goodwill |
— | — | 3,434,165 | 3,434,165 | 3,340,169 | (3,434,165 | ) | 6,774,334 | |||||||||||||||
| Non-amortizable intangible assets |
— | — | 2,160,130 | 2,160,130 | 797,070 | (2,160,130 | ) | 2,957,200 | |||||||||||||||
| Amortizable intangible assets, net |
— | — | 579,650 | 579,650 | 544,625 | (579,650 | ) | 1,124,275 | |||||||||||||||
| Investment in affiliates |
1,994,848 | 7,126,074 | 2,848,753 | (40,782 | ) | 95,937 | (11,928,893 | ) | 95,937 | ||||||||||||||
| Other assets |
— | 144,388 | 133,650 | 113,216 | 209,226 | (113,216 | ) | 487,264 | |||||||||||||||
| Total assets |
$ | 2,004,269 | $ | 7,452,112 | $ | 12,733,362 | $ | 10,143,047 | $ | 8,045,261 | $ | (22,720,719 | ) | $ | 17,657,332 | ||||||||
| LIABILITIES AND SHAREHOLDER’S EQUITY |
|||||||||||||||||||||||
| Current liabilities: |
|||||||||||||||||||||||
| Accounts payable and accrued liabilities |
$ | 5,913 | $ | 29 | $ | 58,047 | $ | 58,047 | $ | 114,408 | $ | (61,950 | ) | $ | 174,494 | ||||||||
| Accrued interest payable |
17,242 | 225,879 | 102,898 | 73,723 | 64,063 | (73,723 | ) | 410,082 | |||||||||||||||
| Current portion of long-term debt |
— | — | 9,939 | 9,939 | 89,419 | (9,939 | ) | 99,358 | |||||||||||||||
| Deferred satellite performance incentives |
— | — | 8,740 | 8,740 | 17,507 | (8,740 | ) | 26,247 | |||||||||||||||
| Other current liabilities |
— | — | 69,618 | 69,088 | 65,414 | (69,088 | ) | 135,032 | |||||||||||||||
| Intercompany payables |
511,535 | 92,559 | — | — | — | (604,094 | ) | — | |||||||||||||||
| Total current liabilities |
534,690 | 318,467 | 249,242 | 219,537 | 350,811 | (827,534 | ) | 845,213 | |||||||||||||||
| Long-term debt, net of current portion |
965,232 | 5,063,815 | 5,040,571 | 1,904,596 | 3,704,357 | (1,904,596 | ) | 14,773,975 | |||||||||||||||
| Deferred satellite performance incentives, net of current portion |
— | — | 26,621 | 26,621 | 102,351 | (26,621 | ) | 128,972 | |||||||||||||||
| Deferred revenue, net of current portion |
— | — | 123,792 | 123,792 | 42,519 | (123,792 | ) | 166,311 | |||||||||||||||
| Deferred income taxes |
— | — | — | — | 562,742 | — | 562,742 | ||||||||||||||||
| Accrued retirement benefits |
— | — | 67,053 | 67,053 | 167,961 | (67,053 | ) | 235,014 | |||||||||||||||
| Other long-term liabilities |
— | 74,982 | 100,009 | 50,807 | 261,267 | (50,807 | ) | 436,258 | |||||||||||||||
| Noncontrolling interest |
— | — | — | — | 4,500 | — | 4,500 | ||||||||||||||||
| Shareholder’s equity: |
|||||||||||||||||||||||
| Ordinary shares |
12 | 12 | 12 | 12 | 70 | (106 | ) | 12 | |||||||||||||||
| Other shareholder’s equity |
504,335 | 1,994,836 | 7,126,062 | 7,750,629 | 2,848,683 | (19,720,210 | ) | 504,335 | |||||||||||||||
| Total liabilities and shareholder’s equity |
$ | 2,004,269 | $ | 7,452,112 | $ | 12,733,362 | $ | 10,143,047 | $ | 8,045,261 | $ | (22,720,719 | ) | $ | 17,657,332 | ||||||||
(Certain totals may not add due to the effects of rounding)
F-80
Table of Contents
INTELSAT S.A. AND SUBSIDIARIES
CONDENSED CONSOLIDATING STATEMENT OF OPERATIONS
FOR THE YEAR ENDED DECEMBER 31, 2009
(in thousands)
| Intelsat S.A. | Intelsat Luxembourg |
Intelsat Jackson |
Subsidiary Guarantors |
Non-Guarantor Subsidiaries |
Eliminations | Consolidated | ||||||||||||||||||||||
| Revenue |
$ | — | $ | — | $ | 1,520,514 | $ | 1,520,514 | $ | 1,574,757 | $ | (2,102,746 | ) | $ | 2,513,039 | |||||||||||||
| Operating expenses: |
||||||||||||||||||||||||||||
| Direct costs of revenue (exclusive of depreciation and amortization) |
— | 23 | 302,975 | 302,975 | 678,480 | (882,627 | ) | 401,826 | ||||||||||||||||||||
| Selling, general and administrative |
28,029 | 23,250 | 36,375 | 36,151 | 176,732 | (40,593 | ) | 259,944 | ||||||||||||||||||||
| Depreciation and amortization |
— | — | 459,473 | 459,473 | 344,564 | (459,473 | ) | 804,037 | ||||||||||||||||||||
| Impairment of asset value |
— | — | 355,000 | 355,000 | 144,100 | (355,000 | ) | 499,100 | ||||||||||||||||||||
| Losses on derivative financial instruments |
— | — | (15,153 | ) | (19,825 | ) | 17,834 | 19,825 | 2,681 | |||||||||||||||||||
| Total operating expenses |
28,029 | 23,273 | 1,138,670 | 1,133,774 | 1,361,710 | (1,717,868 | ) | 1,967,588 | ||||||||||||||||||||
| Income (loss) from operations |
(28,029 | ) | (23,273 | ) | 381,844 | 386,740 | 213,047 | (384,878 | ) | 545,451 | ||||||||||||||||||
| Interest expense, net |
104,311 | 622,058 | 426,024 | 134,116 | 211,630 | (135,316 | ) | 1,362,823 | ||||||||||||||||||||
| Gain (loss) on early extinguishment of debt |
(74,483 | ) | 19,676 | 60,755 | 60,755 | (51 | ) | (61,955 | ) | 4,697 | ||||||||||||||||||
| Subsidiary income (loss) |
(538,746 | ) | 126,784 | 44,263 | 10,282 | — | 357,417 | — | ||||||||||||||||||||
| Other income (expense), net |
— | (1 | ) | 31,972 | 31,972 | 10,042 | (31,972 | ) | 42,013 | |||||||||||||||||||
| Income (loss) before income taxes |
(745,569 | ) | (498,872 | ) | 92,810 | 355,633 | 11,408 | 13,928 | (770,662 | ) | ||||||||||||||||||
| Provision for (benefit from) income taxes |
37,985 | 14,133 | (33,974 | ) | (84,630 | ) | (6,745 | ) | 84,630 | 11,399 | ||||||||||||||||||
| Net income (loss) |
(783,554 | ) | (513,005 | ) | 126,784 | 440,263 | 18,153 | (70,702 | ) | (782,061 | ) | |||||||||||||||||
| Net loss attributable to noncontrolling interest |
— | — | — | — | 369 | — | 369 | |||||||||||||||||||||
| Net income (loss) attributable to Intelsat S.A. |
$ | (783,554 | ) | $ | (513,005 | ) | $ | 126,784 | $ | 440,263 | $ | 18,522 | $ | (70,702 | ) | $ | (781,692 | ) | ||||||||||
(Certain totals may not add due to the effects of rounding)
F-81
Table of Contents
INTELSAT S.A. AND SUBSIDIARIES
CONDENSED CONSOLIDATING STATEMENT OF OPERATIONS
FOR THE PERIOD JANUARY 1, 2008 TO JANUARY 31, 2008
(in thousands)
| Intelsat S.A. | Intelsat Luxembourg |
Subsidiary Guarantors |
Non-Guarantor Subsidiaries |
Eliminations | Consolidated | |||||||||||||||||||
| Revenue |
$ | — | $ | 110,468 | $ | 110,468 | $ | 149,448 | $ | (180,123 | ) | $ | 190,261 | |||||||||||
| Operating expenses: |
||||||||||||||||||||||||
| Direct costs of revenue (exclusive of depreciation and amortization) |
— | 54,830 | 54,830 | 40,500 | (124,477 | ) | 25,683 | |||||||||||||||||
| Selling, general and administrative |
1,600 | 2,908 | 2,169 | 13,985 | (2,177 | ) | 18,485 | |||||||||||||||||
| Depreciation and amortization |
— | 36,204 | 36,204 | 27,953 | (36,204 | ) | 64,157 | |||||||||||||||||
| Restructuring and transaction costs |
186,601 | 62,188 | 2,188 | 64,313 | (2,188 | ) | 313,102 | |||||||||||||||||
| Losses on derivative financial instruments |
— | — | — | 11,431 | — | 11,431 | ||||||||||||||||||
| Total operating expenses |
188,201 | 156,130 | 95,391 | 158,182 | (165,046 | ) | 432,858 | |||||||||||||||||
| Income (loss) from operations |
(188,201 | ) | (45,662 | ) | 15,077 | (8,734 | ) | (15,077 | ) | (242,597 | ) | |||||||||||||
| Interest expense, net |
14,168 | 41,981 | 6,359 | 24,126 | (6,359 | ) | 80,275 | |||||||||||||||||
| Subsidiary loss |
(109,492 | ) | (18,892 | ) | (512 | ) | — | 128,896 | — | |||||||||||||||
| Other income, net |
— | 331 | 331 | 204 | (331 | ) | 535 | |||||||||||||||||
| Income (loss) before income taxes |
(311,861 | ) | (106,204 | ) | 8,537 | (32,656 | ) | 119,847 | (322,337 | ) | ||||||||||||||
| Provision for (benefit from) income taxes |
— | 3,288 | 3,288 | (13,764 | ) | (3,288 | ) | (10,476 | ) | |||||||||||||||
| Net income (loss) |
$ | (311,861 | ) | $ | (109,492 | ) | $ | 5,249 | $ | (18,892 | ) | $ | 123,135 | $ | (311,861 | ) | ||||||||
(Certain totals may not add due to the effects of rounding)
F-82
Table of Contents
INTELSAT S.A. AND SUBSIDIARIES
CONDENSED CONSOLIDATING STATEMENT OF OPERATIONS
FOR THE PERIOD FEBRUARY 1, 2008 TO DECEMBER 31, 2008
(in thousands)
| Intelsat S.A. | Intelsat Luxembourg |
Intelsat Jackson |
Subsidiary Guarantors |
Non-Guarantor Subsidiaries |
Eliminations | Consolidated | ||||||||||||||||||||||
| Revenue |
$ | — | $ | — | $ | 1,307,350 | $ | 1,307,350 | $ | 1,330,785 | $ | (1,770,845 | ) | $ | 2,174,640 | |||||||||||||
| Operating expenses: |
||||||||||||||||||||||||||||
| Direct costs of revenue (exclusive of depreciation and amortization) |
— | — | 272,023 | 272,023 | 528,946 | (735,526 | ) | 337,466 | ||||||||||||||||||||
| Selling, general and administrative |
21,019 | 9,976 | 26,353 | 26,286 | 125,601 | (26,278 | ) | 182,957 | ||||||||||||||||||||
| Depreciation and amortization |
— | — | 466,747 | 466,747 | 328,916 | (466,747 | ) | 795,663 | ||||||||||||||||||||
| Restructuring costs |
— | — | — | — | 1,926 | — | 1,926 | |||||||||||||||||||||
| Impairment of asset value |
— | — | 134,444 | 134,444 | 256,000 | (134,444 | ) | 390,444 | ||||||||||||||||||||
| Losses on derivative financial instruments |
— | — | 71,853 | 18,010 | 83,452 | (18,010 | ) | 155,305 | ||||||||||||||||||||
| Total operating expenses |
21,019 | 9,976 | 971,420 | 917,510 | 1,324,841 | (1,381,005 | ) | 1,863,761 | ||||||||||||||||||||
| Income (loss) from operations |
(21,019 | ) | (9,976 | ) | 335,930 | 389,840 | 5,944 | (389,840 | ) | 310,879 | ||||||||||||||||||
| Interest expense, net |
124,433 | 535,036 | 380,463 | 110,020 | 255,526 | (110,020 | ) | 1,295,458 | ||||||||||||||||||||
| Gain (loss) on early extinguishment of debt |
— | — | (17 | ) | 3 | 593 | (3 | ) | 576 | |||||||||||||||||||
| Subsidiary income (loss) |
(740,855 | ) | (195,824 | ) | (149,845 | ) | 1,304 | — | 1,085,220 | — | ||||||||||||||||||
| Other income (expense), net |
1 | 2 | (14,058 | ) | (14,058 | ) | 2,098 | 14,058 | (11,957 | ) | ||||||||||||||||||
| Income (loss) before income taxes |
(886,306 | ) | (740,834 | ) | (208,453 | ) | 267,069 | (246,891 | ) | 819,455 | (995,960 | ) | ||||||||||||||||
| Provision for (benefit from) income taxes |
— | 21 | (12,629 | ) | (12,629 | ) | (96,953 | ) | 12,629 | (109,561 | ) | |||||||||||||||||
| Net income (loss) |
(886,306 | ) | (740,855 | ) | (195,824 | ) | 279,698 | (149,938 | ) | 806,826 | (886,399 | ) | ||||||||||||||||
| Net loss attributable to noncontrolling interest |
— | — | — | — | 93 | — | 93 | |||||||||||||||||||||
| Net income (loss) attributable to Intelsat S.A. |
$ | (886,306 | ) | $ | (740,855 | ) | $ | (195,824 | ) | $ | 279,698 | $ | (149,845 | ) | $ | 806,826 | $ | (886,306 | ) | |||||||||
(Certain totals may not add due to the effects of rounding)
F-83
Table of Contents
INTELSAT S.A. AND SUBSIDIARIES
CONDENSED CONSOLIDATING STATEMENT OF OPERATIONS
FOR THE YEAR ENDED DECEMBER 31, 2007
(in thousands)
| Intelsat S.A. | Intelsat Luxembourg |
Subsidiary Guarantors |
Non-Guarantor Subsidiaries |
Eliminations | Consolidated | |||||||||||||||||||
| Revenue |
$ | — | $ | 1,254,092 | $ | 1,254,092 | $ | 1,342,248 | $ | (1,667,353 | ) | $ | 2,183,079 | |||||||||||
| Operating expenses: |
||||||||||||||||||||||||
| Direct costs of revenue (exclusive of depreciation and amortization) |
— | 267,999 | 267,998 | 466,155 | (678,595 | ) | 323,557 | |||||||||||||||||
| Selling, general and administrative |
24,744 | 63,103 | 51,697 | 153,307 | (54,361 | ) | 238,490 | |||||||||||||||||
| Depreciation and amortization |
— | 468,900 | 468,900 | 315,220 | (468,900 | ) | 784,120 | |||||||||||||||||
| Restructuring costs |
— | 102 | 102 | 9,156 | (102 | ) | 9,258 | |||||||||||||||||
| Losses on derivative financial instruments |
— | — | — | 11,699 | — | 11,699 | ||||||||||||||||||
| Total operating expenses |
24,744 | 800,104 | 788,697 | 955,537 | (1,201,958 | ) | 1,367,124 | |||||||||||||||||
| Income (loss) from operations |
(24,744 | ) | 453,988 | 465,395 | 386,711 | (465,395 | ) | 815,955 | ||||||||||||||||
| Interest expense, net |
179,751 | 475,181 | 88,187 | 299,675 | (88,187 | ) | 954,607 | |||||||||||||||||
| Loss on early extinguishment of debt |
— | (38,143 | ) | (38,143 | ) | — | 38,143 | (38,143 | ) | |||||||||||||||
| Subsidiary income (loss) |
12,662 | 118,569 | 891 | — | (132,122 | ) | — | |||||||||||||||||
| Other income (expense), net |
(3 | ) | (4,999 | ) | (4,999 | ) | 4,865 | 4,999 | (137 | ) | ||||||||||||||
| Income (loss) before income taxes |
(191,836 | ) | 54,234 | 334,957 | 91,901 | (466,188 | ) | (176,932 | ) | |||||||||||||||
| Provision for (benefit from) income taxes |
53 | 41,572 | 41,572 | (26,668 | ) | (41,572 | ) | 14,957 | ||||||||||||||||
| Net income (loss) |
$ | (191,889 | ) | $ | 12,662 | $ | 293,385 | $ | 118,569 | $ | (424,616 | ) | $ | (191,889 | ) | |||||||||
(Certain totals may not add due to the effects of rounding)
F-84
Table of Contents
INTELSAT S.A. AND SUBSIDIARIES
CONDENSED CONSOLIDATING STATEMENT OF CASH FLOWS
FOR THE YEAR ENDED DECEMBER 31, 2009
(in thousands)
| Intelsat S.A. | Intelsat Luxembourg |
Intelsat Jackson |
Subsidiary Guarantors |
Non-Guarantor Subsidiaries |
Consolidation and Eliminations |
Consolidated | |||||||||||||||
| Cash flows from operating activities: |
(96,719 | ) | (348,049 | ) | 748,587 | 1,045,274 | 492,840 | (968,278 | ) | 873,656 | |||||||||||
| Cash flows from investing activities: |
|||||||||||||||||||||
| Payments for satellites and other property and equipment (including capitalized interest) |
— | — | (800,282 | ) | (800,282 | ) | (368,021 | ) | 1,025,452 | (943,133 | ) | ||||||||||
| Proceeds from sale of other property and equipment |
— | — | 97,200 | 97,200 | 128,648 | (322,362 | ) | 686 | |||||||||||||
| Disbursements for intercompany loans |
— | — | (146,409 | ) | (135,793 | ) | (140,519 | ) | 422,721 | — | |||||||||||
| Capital contribution to unconsolidated affiliates |
— | — | — | — | (12,210 | ) | — | (12,210 | ) | ||||||||||||
| Investment in subsidiaries |
(5,000 | ) | — | (101,124 | ) | (1,124 | ) | (100,000 | ) | 207,248 | — | ||||||||||
| Investment in affiliate debt |
— | — | (347,953 | ) | (347,953 | ) | — | 695,906 | — | ||||||||||||
| Dividend from affiliates |
53,625 | 596,524 | 283,560 | — | 283,560 | (1,217,269 | ) | — | |||||||||||||
| Other investing activities |
— | — | — | — | 7,562 | — | 7,562 | ||||||||||||||
| Net cash provided by (used in) investing activities |
48,625 | 596,524 | (1,015,008 | ) | (1,187,952 | ) | (200,980 | ) | 811,696 | (947,095 | ) | ||||||||||
| Cash flows from financing activities: |
|||||||||||||||||||||
| Repayments of long-term debt |
— | (376,000 | ) | (9,277 | ) | (9,277 | ) | (90,078 | ) | (338,677 | ) | (823,309 | ) | ||||||||
| Repayment of loan proceeds received from Intelsat Holdings |
— | — | (34,000 | ) | — | — | — | (34,000 | ) | ||||||||||||
| Proceeds from issuance of long-term debt |
— | — | 849,830 | 354,000 | 112,087 | (354,000 | ) | 961,917 | |||||||||||||
| Proceeds from (repayment of) intercompany borrowing |
51,625 | 10,616 | 327,670 | 77,000 | (25,980 | ) | (440,931 | ) | — | ||||||||||||
| Debt issuance costs |
— | — | (17,522 | ) | (7,330 | ) | — | 7,330 | (17,522 | ) | |||||||||||
| Principal payments on deferred satellite performance incentives |
— | — | (8,320 | ) | (8,320 | ) | (16,283 | ) | 8,320 | (24,603 | ) | ||||||||||
| Principal payments on capital lease obligations |
— | — | (1,492 | ) | (1,492 | ) | (367 | ) | 1,492 | (1,859 | ) | ||||||||||
| Capital contribution from parent |
12,000 | 5,000 | 100,000 | 100,000 | 101,124 | (306,124 | ) | 12,000 | |||||||||||||
| Dividend to shareholders |
— | (53,625 | ) | (880,084 | ) | (283,560 | ) | (283,560 | ) | 1,500,829 | — | ||||||||||
| Noncontrolling interest in New Dawn |
377 | — | 377 | ||||||||||||||||||
| Net cash provided by financing activities |
63,625 | (414,009 | ) | 326,805 | 221,021 | (202,680 | ) | 78,239 | 73,001 | ||||||||||||
| Effect of exchange rate changes on cash |
— | (1 | ) | 264 | 264 | 7,535 | (264 | ) | 7,798 | ||||||||||||
| Net change in cash and cash equivalents |
15,531 | (165,535 | ) | 60,648 | 78,607 | 96,716 | (78,606 | ) | 7,360 | ||||||||||||
| Cash and cash equivalents, beginning of period |
6,286 | 181,650 | 169,169 | 149,003 | 113,106 | (149,003 | ) | 470,211 | |||||||||||||
| Cash and cash equivalents, end of period |
21,817 | 16,115 | 229,817 | 227,610 | 209,822 | (227,609 | ) | 477,571 | |||||||||||||
(Certain totals may not add due to the effects of rounding)
F-85
Table of Contents
INTELSAT S.A. AND SUBSIDIARIES
CONDENSED CONSOLIDATING STATEMENT OF CASH FLOWS
FOR THE PERIOD JANUARY 1, 2008 TO JANUARY 31, 2008
(in thousands)
| Intelsat S.A. | Intelsat Luxembourg |
Subsidiary Guarantors |
Non-Guarantor Subsidiaries |
Eliminations | Consolidated | |||||||||||||||||||
| Cash flows from operating activities |
$ | (1,179 | ) | $ | (47,928 | ) | $ | (1,531 | ) | $ | 68,726 | $ | 1,531 | $ | 19,619 | |||||||||
| Cash flows from investing activities: |
||||||||||||||||||||||||
| Payments for satellites and other property and equipment (including capitalized interest) |
— | (9,908 | ) | (9,908 | ) | (14,793 | ) | 9,908 | (24,701 | ) | ||||||||||||||
| Proceeds from intercompany loan receivables |
— | 34,000 | 34,000 | — | (68,000 | ) | — | |||||||||||||||||
| Net cash provided by (used in) investing activities |
— | 24,092 | 24,092 | (14,793 | ) | (58,092 | ) | (24,701 | ) | |||||||||||||||
| Cash flows from financing activities: |
||||||||||||||||||||||||
| Repayments of long-term debt |
— | (5,862 | ) | (5,862 | ) | (162,985 | ) | 5,862 | (168,847 | ) | ||||||||||||||
| Proceeds from credit facility borrowings |
— | — | — | 150,000 | — | 150,000 | ||||||||||||||||||
| Repayment of intercompany loans |
— | — | — | (34,000 | ) | 34,000 | — | |||||||||||||||||
| Principal payments on deferred satellite performance incentives |
— | (87 | ) | (87 | ) | (1,246 | ) | 87 | (1,333 | ) | ||||||||||||||
| Principal payments on capital lease obligations |
— | (2,124 | ) | (2,124 | ) | — | 2,124 | (2,124 | ) | |||||||||||||||
| Net cash used in financing activities |
— | (8,073 | ) | (8,073 | ) | (48,231 | ) | 42,073 | (22,304 | ) | ||||||||||||||
| Effect of exchange rate changes on cash and cash equivalents |
— | 45 | 45 | 92 | (45 | ) | 137 | |||||||||||||||||
| Net change in cash and cash equivalents |
(1,179 | ) | (31,864 | ) | 14,533 | 5,794 | (14,533 | ) | (27,249 | ) | ||||||||||||||
| Cash and cash equivalents, beginning of period |
1,391 | 284,878 | 233,880 | 140,300 | (233,880 | ) | 426,569 | |||||||||||||||||
| Cash and cash equivalents, end of period |
$ | 212 | $ | 253,014 | $ | 248,413 | $ | 146,094 | $ | (248,413 | ) | $ | 399,320 | |||||||||||
(Certain totals may not add due to the effects of rounding)
F-86
Table of Contents
INTELSAT S.A. AND SUBSIDIARIES
CONDENSED CONSOLIDATING STATEMENT OF CASH FLOWS
FOR THE PERIOD FEBRUARY 1, 2008 TO DECEMBER 31, 2008
(in thousands)
| Intelsat S.A. | Intelsat Luxembourg |
Intelsat Jackson |
Subsidiary Guarantors |
Non-Guarantor Subsidiaries |
Eliminations | Consolidated | ||||||||||||||||||||||
| Cash flows from operating activities |
$ | (32,741 | ) | $ | (33,103 | ) | $ | 449,152 | $ | 703,009 | $ | 492,835 | $ | (703,009 | ) | $ | 876,143 | |||||||||||
| Cash flows from investing activities: |
||||||||||||||||||||||||||||
| Payments for satellites and other property and equipment (including capitalized interest) |
— | — | (272,915 | ) | (272,915 | ) | (124,844 | ) | 272,915 | (397,759 | ) | |||||||||||||||||
| Capital contributions to unconsolidated affiliates |
— | — | (17,621 | ) | (17,621 | ) | (9,659 | ) | 17,621 | (27,280 | ) | |||||||||||||||||
| Capital contribution from Intelsat Holdings |
4,596 | — | — | — | — | — | 4,596 | |||||||||||||||||||||
| Dividend from affiliates |
439,565 | 621,746 | 826,018 | — | 826,018 | (2,713,347 | ) | — | ||||||||||||||||||||
| Investment in subsidiaries |
— | — | (13,703 | ) | (13,703 | ) | 13,703 | 13,703 | — | |||||||||||||||||||
| Minority interest in New Dawn |
— | — | — | — | 4,592 | — | 4,592 | |||||||||||||||||||||
| Other investing activities |
— | — | — | — | 5,954 | — | 5,954 | |||||||||||||||||||||
| Net cash provided by (used in) investing activities |
444,161 | 621,746 | 521,779 | (304,239 | ) | 715,764 | (2,409,108 | ) | (409,897 | ) | ||||||||||||||||||
| Cash flows from financing activities: |
||||||||||||||||||||||||||||
| Repayments of long-term debt |
(400,000 | ) | — | (4,193,353 | ) | (1,551,756 | ) | (1,686,812 | ) | 1,551,756 | (6,280,165 | ) | ||||||||||||||||
| Repayments of revolving credit facility |
— | — | (175,120 | ) | (175,120 | ) | (66,101 | ) | 175,120 | (241,221 | ) | |||||||||||||||||
| Proceeds from issuance of long-term debt |
— | — | 3,361,747 | 1,564,358 | 1,651,036 | (1,564,358 | ) | 5,012,783 | ||||||||||||||||||||
| Loan received from Intelsat Holdings |
— | — | 34,000 | — | — | — | 34,000 | |||||||||||||||||||||
| Proceeds from revolving credit facility |
— | — | 175,120 | 175,120 | 66,101 | (175,120 | ) | 241,221 | ||||||||||||||||||||
| Proceeds from (repayment of) intercompany loans |
(201,629 | ) | 83,000 | 376,167 | 149,194 | (257,538 | ) | (149,194 | ) | — | ||||||||||||||||||
| Debt issuance costs |
— | (55,032 | ) | (41,393 | ) | (19,662 | ) | (23,208 | ) | 19,662 | (119,633 | ) | ||||||||||||||||
| Repayment of funding of capital expenditures by customer |
— | — | — | — | (30,862 | ) | — | (30,862 | ) | |||||||||||||||||||
| Payment of premium on early retirement of debt |
(7,615 | ) | — | (64,143 | ) | (15,489 | ) | (16,346 | ) | 15,489 | (88,104 | ) | ||||||||||||||||
| Principal payments on deferred satellite performance incentives |
— | — | (3,942 | ) | (3,942 | ) | (19,360 | ) | 3,942 | (23,302 | ) | |||||||||||||||||
| Principal payments on capital lease obligations |
— | — | (8,822 | ) | (8,822 | ) | (326 | ) | 8,822 | (9,148 | ) | |||||||||||||||||
| Dividends to shareholders |
— | (439,565 | ) | (1,447,764 | ) | (826,018 | ) | (826,018 | ) | 3,539,365 | — | |||||||||||||||||
| Net cash used in financing activities |
(609,244 | ) | (411,597 | ) | (1,987,503 | ) | (712,137 | ) | (1,209,434 | ) | 3,425,484 | (1,504,431 | ) | |||||||||||||||
| Effect of exchange rate changes on cash and cash equivalents |
— | 2 | (263 | ) | (263 | ) | (5,980 | ) | 263 | (6,241 | ) | |||||||||||||||||
| Net change in cash and cash equivalents |
(197,824 | ) | 177,048 | (1,016,835 | ) | (313,630 | ) | (6,815 | ) | 313,630 | (1,044,426 | ) | ||||||||||||||||
| Cash and cash equivalents, beginning of period |
204,110 | 4,602 | 1,186,004 | 462,633 | 119,921 | (462,633 | ) | 1,514,637 | ||||||||||||||||||||
| Cash and cash equivalents, end of period |
$ | 6,286 | $ | 181,650 | $ | 169,169 | $ | 149,003 | $ | 113,106 | $ | (149,003 | ) | $ | 470,211 | |||||||||||||
(Certain totals may not add due to the effects of rounding)
F-87
Table of Contents
INTELSAT S.A. AND SUBSIDIARIES
CONDENSED CONSOLIDATING STATEMENT OF CASH FLOWS
FOR THE YEAR ENDED DECEMBER 31, 2007
(in thousands)
| Intelsat S.A. | Intelsat Luxembourg |
Subsidiary Guarantors |
Non-Guarantor Subsidiaries |
Eliminations | Consolidated | |||||||||||||||||||
| Cash flows from operating activities |
$ | (121,437 | ) | $ | 171,884 | $ | 542,295 | $ | 506,575 | $ | (542,296 | ) | $ | 557,021 | ||||||||||
| Cash flows from investing activities: |
||||||||||||||||||||||||
| Payments for satellites and other property and equipment |
— | (156,762 | ) | (156,762 | ) | (386,850 | ) | 156,762 | (543,612 | ) | ||||||||||||||
| Other investing activities |
— | — | — | 2,624 | — | 2,624 | ||||||||||||||||||
| Advances to subsidiaries |
— | — | — | (67,431 | ) | 67,431 | — | |||||||||||||||||
| Investment in subsidiaries |
116,000 | (538,690 | ) | — | (538,690 | ) | 961,380 | — | ||||||||||||||||
| Net cash provided by (used in) investing activities |
116,000 | (695,452 | ) | (156,762 | ) | (990,347 | ) | 1,185,573 | (540,988 | ) | ||||||||||||||
| Cash flows from financing activities: |
||||||||||||||||||||||||
| Repayments of long-term debt |
— | (1,608,448 | ) | (1,008,448 | ) | (53,132 | ) | 1,008,448 | (1,661,580 | ) | ||||||||||||||
| Proceeds from issuance of long-term debt |
— | 1,595,000 | — | — | — | 1,595,000 | ||||||||||||||||||
| Repayment of credit facility borrowings |
— | (51,194 | ) | — | — | 51,194 | — | |||||||||||||||||
| Proceeds from revolving credit facility |
— | 118,625 | — | — | (118,625 | ) | — | |||||||||||||||||
| Debt issuance costs |
— | (28,845 | ) | (523 | ) | (2,172 | ) | 523 | (31,017 | ) | ||||||||||||||
| Repayments of funding of capital expenditures by customer |
— | — | — | (41,282 | ) | — | (41,282 | ) | ||||||||||||||||
| Payment of premium on early retirement of debt |
— | (10,000 | ) | (10,000 | ) | — | 10,000 | (10,000 | ) | |||||||||||||||
| Capital contributions from parent companies |
— | 977,000 | 977,000 | 977,000 | (2,931,000 | ) | — | |||||||||||||||||
| Principal payments on deferred satellite performance incentives |
— | (5,089 | ) | (5,089 | ) | (13,467 | ) | 5,089 | (18,556 | ) | ||||||||||||||
| Principal payments on capital lease obligations |
— | (6,167 | ) | (6,167 | ) | — | 6,167 | (6,167 | ) | |||||||||||||||
| Dividends to shareholders |
— | (554,310 | ) | (438,310 | ) | (438,310 | ) | 1,430,930 | — | |||||||||||||||
| Net cash provided by (used in) financing activities |
— | 426,572 | (491,537 | ) | 428,637 | (537,274 | ) | (173,602 | ) | |||||||||||||||
| Effect of exchange rate changes on cash |
(6 | ) | (1,529 | ) | (1,529 | ) | 2,017 | 1,529 | 482 | |||||||||||||||
| Net change in cash and cash equivalents |
(5,443 | ) | (98,525 | ) | (107,533 | ) | (53,118 | ) | 107,532 | (157,087 | ) | |||||||||||||
| Cash and cash equivalents, beginning of period |
6,834 | 383,403 | 341,413 | 193,418 | (341,412 | ) | 583,656 | |||||||||||||||||
| Cash and cash equivalents, end of period |
$ | 1,391 | $ | 284,878 | $ | 233,880 | $ | 140,300 | $ | (233,880 | ) | $ | 426,569 | |||||||||||
(Certain totals may not add due to the effects of rounding)
F-88
Table of Contents
SCHEDULE II—VALUATION AND QUALIFYING ACCOUNTS
| Description |
Balance at Beginning of Period |
Charged to Costs and Expenses |
Charged to Other Accounts |
Deductions | Adjustments(1) | Balance at End of Period |
||||||||||||||||
| (in thousands) | ||||||||||||||||||||||
| Year ended December 31, 2007: |
||||||||||||||||||||||
| Allowance for doubtful accounts |
$ | 29,946 | $ | 12,199 | $ | — | $ | (9,357 | ) | $ | — | $ | 32,788 | |||||||||
| Reserve for operating leases |
$ | 194 | $ | (31 | ) | $ | — | $ | — | $ | — | $ | 163 | |||||||||
| Restructuring reserve |
$ | 27,497 | $ | 9,258 | $ | 522 | $ | (24,146 | ) | $ | — | $ | 13,131 | |||||||||
| Predecessor period January 1, 2008 to January 31, 2008: |
||||||||||||||||||||||
| Allowance for doubtful accounts |
$ | 32,788 | $ | 3,922 | $ | — | $ | (94 | ) | $ | — | $ | 36,616 | |||||||||
| Reserve for operating leases |
$ | 163 | $ | (3 | ) | $ | — | $ | — | $ | — | $ | 160 | |||||||||
| Restructuring reserve |
$ | 13,131 | $ | (8 | ) | $ | (3,296 | ) | $ | — | $ | 9,827 | ||||||||||
| Fair value adjustments to restructuring reserve |
$ | — | $ | — | $ | — | $ | — | $ | (576 | ) | $ | (576 | ) | ||||||||
| Successor period February 1, 2008 to December 31, 2008: |
||||||||||||||||||||||
| Allowance for doubtful accounts |
$ | 36,616 | $ | (9,137 | ) | $ | — | $ | (7,242 | ) | $ | — | $ | 20,237 | ||||||||
| Reserve for operating leases |
$ | 160 | $ | (28 | ) | $ | — | $ | — | $ | — | $ | 132 | |||||||||
| Restructuring reserve |
$ | 9,251 | $ | 1,963 | $ | — | $ | (5,234 | ) | $ | — | $ | 5,980 | |||||||||
| Year ended December 31, 2009: |
||||||||||||||||||||||
| Allowance for doubtful accounts |
$ | 20,237 | $ | 3,356 | $ | — | $ | (3,076 | ) | $ | — | $ | 20,517 | |||||||||
| Reserve for operating leases |
$ | 132 | $ | (31 | ) | $ | — | $ | — | $ | — | $ | 101 | |||||||||
| Restructuring reserve |
$ | 5,980 | $ | (802 | ) | $ | — | $ | (2,222 | ) | $ | — | $ | 2,956 | ||||||||
| (1) | Adjustments reflect changes in allocation of the purchase price and fair value adjustments recorded or additional liabilities established in connection with the PanAmSat Acquisition Transactions and the New Sponsors Acquisition Transactions. |
S-1
Table of Contents
| Exhibit No. |
Document Description | |
| 2.1 | Share Purchase Agreement, dated as of June 19, 2007, by and among Intelsat Holdings, Ltd., Serafina Holdings Limited, Serafina Acquisition Limited and certain shareholders of Intelsat Holdings, Ltd. (incorporated by reference to Exhibit 99.1 of Intelsat, Ltd.’s Report on Form 8-K, File No. 000-50262, filed on June 25, 2007). | |
| 2.2 | Transaction Agreement and Plan of Amalgamation, dated as of August 16, 2004, by and among Intelsat, Ltd., Intelsat (Bermuda), Ltd., Intelsat Holdings, Ltd. (formerly known as Zeus Holdings Limited), Zeus Merger One Limited and Zeus Merger Two Limited (incorporated by reference to Exhibit 99.1 of Intelsat, Ltd.’s Report on Form 8-K, File No. 000-50262, filed on February 4, 2005). | |
| 2.3 | Merger Agreement, dated as of August 28, 2005, by and among Intelsat (Bermuda), Ltd., Proton Acquisition Corporation and PanAmSat Holding Corporation (incorporated by reference to Exhibit 2.1 of Intelsat, Ltd.’s Report on Form 8-K, File No. 000-50262, filed on August 30, 2005). | |
| 3.1 | Consolidated Articles of Incorporation of Intelsat S.A. dated December 15, 2009. * | |
| 4.1 | Indenture for the 11 1/4% Senior Notes due 2016, dated as of July 3, 2006, by and among Intelsat (Bermuda), Ltd., as issuer, Intelsat, Ltd., as parent guarantor, and Wells Fargo Bank, National Association, as trustee (including the Form of Original 11 1/4% Senior Notes and Form of Exchange 11 1/4% Senior Notes) (incorporated by reference to Exhibit 4.1 to Intelsat, Ltd.’s Report on Form 8-K, File No. 000-50262, filed on July 10, 2006). | |
| 4.2 | Indenture for the 9 1/4% Senior Notes due 2016, dated as of July 3, 2006, by and among Intelsat (Bermuda), Ltd., as issuer, Intelsat, Ltd., as parent guarantor, the Subsidiary Guarantors named therein and Wells Fargo Bank, National Association, as trustee (including the Form of Original 9 1/4% Senior Notes due 2016 and Form of Exchange 9 1/4% Senior Notes due 2016) (incorporated by reference to Exhibit 4.2 to Intelsat, Ltd.’s Report on Form 8-K, File No. 000-50262, filed on July 10, 2006). | |
| 4.3 | Indenture for the 9% Senior Notes due 2016, dated as of July 3, 2006, by and among Intelsat Corporation, the Subsidiary Guarantors named therein and Wells Fargo Bank, National Association (including the Form of Original 9% Senior Notes due 2016 and the Form of Exchange 9% Senior Notes due 2016) (incorporated by reference to Exhibit 4.1 of Intelsat Holding Corporation’s Report on Form 8-K, file No. 001-32456, filed on July 10, 2006). | |
| 4.4 | Indenture for the 9% Senior Notes due 2014, dated August 20, 2004, among PanAmSat Corporation, the Guarantors named therein and The Bank of New York, as trustee (incorporated by reference to Exhibit 4.1 of Intelsat Corporation’s quarterly report on Form 10-Q for the quarter ended September 30, 2004, File No. 000-22531, filed on November 15, 2004). | |
| 4.5 | Indenture for the 8 1/4% Senior Notes due 2013 and the 8 5/8% Senior Notes due 2015, dated as of January 28, 2005, by and among Zeus Merger Two Limited, as issuer, Zeus Merger One Limited, as parent guarantor, and Wells Fargo Bank, National Association, as trustee (including the Form of Original 8 1/4% Senior Notes due 2013, Form of Exchange 8 1/4% Senior Notes due 2013, Form of Original 8 5/8% Senior Notes due 2015 and Form of Exchange 8 5/8% Senior Notes due 2015) (incorporated by reference to Exhibit 4.1 of Intelsat Ltd.’s Report on Form 8-K, File No. 000-50262, filed on February 4, 2005). | |
| 4.6 | Supplemental Indenture for the 8 1/4% Senior Notes due 2013 and the 8 5/8% Senior Notes due 2015, dated as of January 28, 2005, by and among Intelsat Holdings LLC, Intelsat LLC, Intelsat Global Sales & Marketing Ltd., Intelsat USA Sales Corp., Intelsat USA License Corp., Intelsat Global Service Corporation and Wells Fargo Bank, National Association (incorporated by reference to Exhibit 2.6 of Intelsat, Ltd.’s Annual Report on Form 20-F for the year ended December 31, 2004, File No. 000-50262, filed on March 15, 2005). | |
Table of Contents
| Exhibit No. |
Document Description | |
| 4.7 | Second Supplemental Indenture for the 8 1/4% Senior Notes due 2013 and the 8 5/8% Senior Notes due 2015, dated as of March 3, 2005, by and among Intelsat Subsidiary Holding Company, Ltd., Intelsat (Bermuda), Ltd., Intelsat, Ltd., Intelsat Holdings LLC, Intelsat LLC, Intelsat Global Sales & Marketing Ltd., Intelsat USA Sales Corp., Intelsat USA License Corp., Intelsat Global Service Corporation and Wells Fargo Bank, National Association (incorporated by reference to Exhibit 2.7 of Intelsat, Ltd.’s Annual Report on Form 20-F for the year ended December 31, 2004, File No. 000-50262 filed on March 15, 2005). | |
| 4.8 | Third Supplemental Indenture for the 8 1/4 % Senior Notes due 2013 and the 8 5/8% Senior Notes due 2015, dated as of March 3, 2005, by and among Intelsat (Bermuda), Ltd., Intelsat Subsidiary Holding Company, Ltd. and Wells Fargo Bank, National Association (incorporated by reference to Exhibit 2.8 of Intelsat, Ltd.’s Annual Report on Form 20-F for the year ended December 31, 2004, File No. 000-50262, filed on March 15, 2005). | |
| 4.9 | Fourth Supplemental Indenture, dated as of December 28, 2005, by and among Intelsat UK Financial Services Ltd., Intelsat Subsidiary Holding Company, Ltd. and Wells Fargo, National Association (incorporated by reference to Exhibit 4.21 of Intelsat Subsidiary Holding Company, Ltd.’s Amendment No. 1 to its Registration Statement on Form S-4, File No. 333-12946507, filed on February 10, 2006). | |
| 4.10 | Fifth Supplemental Indenture, dated as of July 3, 2006, by and among Intelsat (Bermuda), Ltd., Intelsat Intermediate Holding Company, Ltd., Intelsat Subsidiary Holding Company, Ltd. and Wells Fargo Bank, National Association (incorporated by reference to Exhibit 4.20 of Intelsat Intermediate Holding Company, Ltd.’s Registration Statement on Form S-4, File No. 333-136193, filed on July 31, 2006). | |
| 4.11 | Indenture for the 7 5/8% Senior Notes due 2012 and 6 1/2% Senior Notes due 2013, dated as of April 1, 2002, between Intelsat, Ltd. and The Bank of New York, as Trustee (including Form of Original 7 5 /8% Senior Notes due 2012) (incorporated by reference to Exhibit 4.1 of the Registration Statement on Form F-4, File No. 333-99189, filed on September 5, 2002). | |
| 4.12 | Officers’ Certificate dated April 15, 2002 relating to Intelsat, Ltd.’s 7 5/8% Senior Notes due 2012 (incorporated by reference to Exhibit 4.2 of the Registration Statement on Form F-4, File No. 333-99189, filed on September 5, 2002). | |
| 4.13 | Officers’ Certificate dated November 7, 2003 relating to Intelsat, Ltd.’s 6 1/ 2% Senior Notes due 2013 (including the forms of Notes) (incorporated by reference to Exhibit 4.2 of the Registration Statement on Form F-4, File No. 333-110671, filed on November 21, 2003). | |
| 4.14 | Indenture for 9 1/4% Senior Discount Notes due 2015, dated as of February 11, 2005, by and among Zeus Special Subsidiary Limited, Intelsat, Ltd. and Wells Fargo Bank, National Association (including the Forms of 9 1/4% Senior Discount Notes due 2015) (incorporated by reference to Exhibit 2.11 of Intelsat, Ltd.’s Annual Report on Form 20-F for the year ended December 31, 2004, File No. 000-50262, filed on March 15, 2005). | |
| 4.15 | Supplemental Indenture for the 9 1/4% Senior Discount Notes due 2015, dated as of March 3, 2005, by and among Intelsat (Bermuda), Ltd., Intelsat, Ltd. and Wells Fargo Bank, National Association (incorporated by reference to Exhibit 2.12 of Intelsat, Ltd.’s Annual Report on Form 20-F for the year ended December 31, 2004, File No. 000-50262, filed on March 15, 2005). | |
| 4.16 | Second Supplemental Indenture for the 9 1/4% Senior Discount Notes due 2015, dated as of July 3, 2006, by and among Intelsat (Bermuda), Ltd., Intelsat Intermediate Holding Company, Ltd., Intelsat Ltd. and Wells Fargo Bank, National Association (incorporated by reference to Exhibit 4.5 of Intelsat Intermediate Holding Company, Ltd.’s Registration Statement on Form S-4, File No. 333-136193, filed on July 31, 2006). | |
Table of Contents
| Exhibit No. |
Document Description | |
| 4.17 | Third Supplemental Indenture for the 9 1/4 % Senior Discount Notes due 2015, dated as of July 3, 2006, by and among Intelsat (Bermuda), Ltd., Intelsat Intermediate Holding Company, Ltd., and Wells Fargo Bank, National Association (incorporated by reference to Exhibit 4.6 of Intelsat Intermediate Holding Company, Ltd.’s Registration Statement on Form S-4, File No. 333-136193, filed on July 31, 2006). | |
| 4.18 | Second Supplemental Indenture for the 9% Senior Notes due 2016, dated as of September 27, 2007, among Intelsat Satellite Galaxy 17, Inc., Intelsat Corporation and Wells Fargo Bank, National Association, as trustee (incorporated by reference to Exhibit 4.1 to Intelsat, Ltd.’s Report on Form 10-Q, File No. 000-50262, filed on November 9, 2007). | |
| 4.19 | Supplemental Indenture for the 9% Senior Notes due 2014, dated as of September 27, 2007, among Intelsat Satellite Galaxy 17, Inc., Intelsat Corporation, the other Guarantors party thereto and The Bank of New York, as trustee (incorporated by reference to Exhibit 4.2 to Intelsat, Ltd.’s Report on Form 10-Q, File No. 000-50262, filed on November 9, 2007). | |
| 4.20 | First Supplemental Indenture for the 9 1/ 4% Senior Notes due 2016, dated as of February 4, 2008, among Intelsat (Bermuda), Ltd., Intelsat Jackson Holdings, Ltd., Intelsat, Ltd., as parent guarantor, Intelsat Subsidiary Holding Company, Ltd., Intelsat Holdings LLC, Intelsat LLC, Intelsat Global Sales & Marketing Ltd., Intelsat USA Sales Corp., Intelsat USA License Corp., Intelsat Global Service Corporation and Intelsat UK Financial Services Ltd., as subsidiary guarantors, and Wells Fargo Bank, National Association, as trustee (incorporated by reference to Exhibit 10.7 of Intelsat, Ltd.’s Report on Form 8-K, File No. 000-50262, filed on February 8, 2008). | |
| 4.21 | Second Supplemental Indenture for the 9 1/ 4% Senior Notes due 2016, dated as of February 4, 2008, among Intelsat (Bermuda), Ltd., Intelsat Jackson Holdings, Ltd. and Wells Fargo Bank, National Association, as trustee (incorporated by reference to Exhibit 10.8 of Intelsat, Ltd.’s Report on Form 8-K, File No. 000-50262, filed on February 8, 2008). | |
| 4.22 | First Supplemental Indenture for the 11 1/ 4% Senior Notes due 2016, dated as of February 4, 2008, among Intelsat (Bermuda), Ltd., Intelsat Jackson Holdings, Ltd., Intelsat, Ltd., as parent guarantor, and Wells Fargo Bank, National Association, as trustee (incorporated by reference to Exhibit 10.9 of Intelsat, Ltd.’s Report on Form 8-K, File No. 000-50262, filed on February 8, 2008). | |
| 4.23 | Second Supplemental Indenture for the 11 1/ 4% Senior Notes due 2016, dated as of February 4, 2008, among Intelsat (Bermuda), Ltd., Intelsat Jackson Holdings, Ltd. and Wells Fargo Bank, National Association, as trustee (incorporated by reference to Exhibit 10.10 of Intelsat, Ltd.’s Report on Form 8-K, File No. 000-50262, filed on February 8, 2008). | |
| 4.24 | Fourth Supplemental Indenture for the 9 1/ 4% Senior Discount Notes due 2015, dated as of February 4, 2008, among Intelsat (Bermuda), Ltd., Intelsat Jackson Holdings, Ltd., Intelsat Intermediate Holding Company, Ltd., Intelsat, Ltd., as co-obligor, and Wells Fargo Bank, National Association, as trustee (incorporated by reference to Exhibit 10.13 of Intelsat, Ltd.’s Report on Form 8-K, File No. 000-50262, filed on February 8, 2008). | |
| 4.25 | Sixth Supplemental Indenture for the 8 1/ 4% Senior Notes due 2013 and the 8 5/8% Senior Notes due 2015, dated as of February 4, 2008, among Intelsat (Bermuda), Ltd., Intelsat Jackson Holdings, Ltd., Intelsat Subsidiary Holding Company, Ltd. and Wells Fargo Bank, National Association, as trustee (incorporated by reference to Exhibit 10.14 of Intelsat, Ltd.’s Report on Form 8-K, File No. 000-50262, filed on February 8, 2008). | |
| 4.26 | Supplemental Indenture for the 9% Senior Notes due 2014, dated as of January 17, 2008, among Intelsat Satellite IS 11, Inc., Intelsat Corporation, the guarantors party thereto and The Bank of New York, as trustee (incorporated by reference to Exhibit 10.5 of Intelsat, Ltd.’s Quarterly Report on Form 10-Q, File No. 000-50262, filed on May 15, 2008). | |
Table of Contents
| Exhibit No. |
Document Description | |
| 4.27 | Third Supplemental Indenture for the 9% Senior Notes due 2016, dated as of January 17, 2008, among Intelsat Satellite IS 11, Inc., Intelsat Corporation and Wells Fargo Bank, National Association, as trustee ((incorporated by reference to Exhibit 10.6 of Intelsat, Ltd.’s Quarterly Report on Form 10-Q, File No. 000-50262, filed on May 15, 2008) | |
| 4.28 | Indenture for the 11 1/4% Senior Notes due 2017 and the 11 1/2%/12 1/ 2% Senior PIK Election Notes due 2017, dated as of June 27, 2008, by and among Intelsat (Bermuda), Ltd., as Issuer, Intelsat, Ltd., as Parent Guarantor, and Wells Fargo Bank, National Association, as Trustee (including the forms of Notes) (incorporated by reference to Exhibit 4.1 of Intelsat, Ltd.’s Report on Form 8-K, File No. 000-50262, filed on July 3, 2008). | |
| 4.29 | Indenture for the 9 1/2% Senior Discount Notes due 2015, dated as of June 27, 2008, by and among Intelsat Intermediate Holding Company, Ltd., as Issuer, Intelsat, Ltd., as Co-Obligor, Intelsat (Bermuda), Ltd. and Intelsat Jackson Holdings, Ltd., as Guarantors, and Wells Fargo Bank, National Association, as Trustee (including the forms of Notes) (incorporated by reference to Exhibit 4.2 of Intelsat, Ltd.’s Report on Form 8-K, File No. 000-50262, filed on July 3, 2008). | |
| 4.30 | Indenture for the 8 1/2% Senior Notes due 2013 and the 8 7/8% Senior Notes due 2015, dated as of June 27, 2008, by and among Intelsat Subsidiary Holding Company, Ltd., as Issuer, Intelsat, Ltd., Intelsat (Bermuda), Ltd., Intelsat Jackson Holdings, Ltd. and Intelsat Intermediate Holding Company, Ltd., as Parent Guarantors, the subsidiary guarantors named therein and Wells Fargo Bank, National Association, as Trustee (including the forms of Notes) (incorporated by reference to Exhibit 4.3 of Intelsat, Ltd.’s Report on Form 8-K, File No. 000-50262, filed on July 3, 2008). | |
| 4.31 | Indenture for the 11 1/2% Senior Notes due 2016, dated as of July 1, 2008, by and among Intelsat Jackson Holdings, Ltd., as Issuer, Intelsat, Ltd. and Intelsat (Bermuda), Ltd., as Parent Guarantors, and Wells Fargo Bank, National Association, as Trustee (including the forms of Notes) (incorporated by reference to Exhibit 4.4 of Intelsat, Ltd.’s Report on Form 8-K, File No. 000-50262, filed on July 3, 2008). | |
| 4.32 | Indenture for the 9 1/2% Senior Notes due 2016, dated as of July 1, 2008, by and among Intelsat Jackson Holdings, Ltd., as Issuer, Intelsat, Ltd. and Intelsat (Bermuda), Ltd., as Parent Guarantors, the subsidiary guarantors named therein and Wells Fargo Bank, National Association, as Trustee (including the forms of Notes) (incorporated by reference to Exhibit 4.5 of Intelsat, Ltd.’s Report on Form 8-K, File No. 000-50262, filed on July 3, 2008). | |
| 4.33 | Registration Rights Agreement, dated as of June 27, 2008, among Intelsat, Ltd., Intelsat (Bermuda), Ltd., Intelsat Intermediate Holding Company, Ltd., Intelsat Subsidiary Holding Company, Ltd., Intelsat Jackson Holdings, Ltd., the subsidiary guarantors named therein, and Credit Suisse Securities (USA) LLC, Morgan Stanley & Co. Incorporated and Banc of America Securities LLC as Representatives of the Initial Purchasers named therein (incorporated by reference to Exhibit 4.6 of Intelsat, Ltd.’s Report on Form 8-K, File No. 000-50262, filed on July 3, 2008). | |
| 4.34 | Registration Rights Agreement, dated as of July 1, 2008, among Intelsat, Ltd., Intelsat (Bermuda), Ltd., Intelsat Jackson Holdings, Ltd., the subsidiary guarantors named therein, and Credit Suisse Securities (USA) LLC, Morgan Stanley & Co. Incorporated and Banc of America Securities LLC as Representatives of the Initial Purchasers named therein (incorporated by reference to Exhibit 4.7 of Intelsat, Ltd.’s Report on Form 8-K, File No. 000-50262, filed on July 3, 2008). | |
| 4.35 | Indenture for the 9 1/4% Senior Notes due 2014, dated as of July 18, 2008, by and among Intelsat Corporation, as Issuer, the subsidiary guarantors named therein and Wells Fargo Bank, National Association, as Trustee (including the forms of Notes) (incorporated by reference to Exhibit 4.1 of Intelsat Corporation’s Report on Form 8-K, File No. 0-22531, filed on July 22, 2008). | |
Table of Contents
| Exhibit No. |
Document Description | |
| 4.36 | Indenture for the 9 1/4% Senior Notes due 2016, dated as of July 18, 2008, by and among Intelsat Corporation, as Issuer, the subsidiary guarantors named therein and Wells Fargo Bank, National Association, as Trustee (including the forms of Notes) (incorporated by reference to Exhibit 4.2 of Intelsat Corporation’s Report on Form 8-K, File No. 0-22531, filed on July 22, 2008). | |
| 4.37 | Registration Rights Agreement, dated as of July 18, 2008, among Intelsat Corporation, the subsidiary guarantors named therein, and Credit Suisse Securities (USA) LLC, Morgan Stanley & Co. Incorporated and Banc of America Securities LLC as Representatives of the Initial Purchasers named therein (incorporated by reference to Exhibit 4.3 of Intelsat Corporation’s Report on Form 8-K, File No. 0-22531, filed on July 22, 2008). | |
| 4.38 | Fourth Supplemental Indenture for the 9% Senior Notes due 2016, dated as of July 15, 2008, among Intelsat Satellite Galaxy 18, Inc., Intelsat Corporation and Wells Fargo Bank, National Association, as trustee (incorporated by reference to Exhibit 4.7 of Intelsat, Ltd.’s Quarterly Report on Form 10-Q for the period ended September 30, 2008, File No. 000-50262, filed on November 13, 2008). | |
| 4.39 | Supplemental Indenture for the 9% Senior Notes due 2014, dated as of July 15, 2008, among Intelsat Satellite Galaxy 18, Inc., Intelsat Corporation, the other Guarantors party thereto and The Bank of New York Mellon, as trustee (incorporated by reference to Exhibit 4.8 of Intelsat, Ltd.’s Quarterly Report on Form 10-Q for the period ended September 30, 2008, File No. 000-50262, filed on November 13, 2008). | |
| 4.40 | Indenture for the 8 7/8% Senior Notes due 2015, Series B, dated as of February 12, 2009, by and among Intelsat Subsidiary Holding Company, Ltd., as Issuer, Intelsat, Ltd., Intelsat (Bermuda), Ltd., Intelsat Jackson Holdings, Ltd. and Intelsat Intermediate Holding Company, Ltd., as Parent Guarantors, the subsidiary guarantors named therein and Wells Fargo Bank, National Association, as Trustee (including the forms of Notes) (incorporated by reference to Exhibit 4.1 of Intelsat, Ltd.’s Report on Form 8-K, File No. 000-50262, filed on February 18, 2009). | |
| 4.41 | Registration Rights Agreement, dated as of February 12, 2009, among Intelsat Subsidiary Holding Company, Ltd., as Issuer, Intelsat, Ltd., Intelsat (Bermuda), Ltd., Intelsat Jackson Holdings, Ltd. and Intelsat Intermediate Holding Company, Ltd., as Parent Guarantors, the subsidiary guarantors named therein, and Goldman, Sachs & Co. and Credit Suisse Securities (USA) LLC as the Initial Purchasers (incorporated by reference to Exhibit 4.2 of Intelsat, Ltd.’s Report on Form 8-K, File No. 000-50262, filed on February 18, 2009). | |
| 4.42 | Supplemental Indenture for the 8 1/2% Senior Notes due 2013 and the 8 7/8% Senior Notes due 2015, dated as of June 29, 2009, among Intelsat Subsidiary Holding Company, Ltd., Intelsat, Ltd., other guarantors named therein, and Wells Fargo Bank, National Association, as trustee (incorporated by reference to Exhibit 99.1 to Intelsat, Ltd.’s Report on Form 8-K, File No. 000-50262, filed on July 6, 2009). | |
| 4.43 | Supplemental Indenture for the 9 1/2% Senior Notes due 2015, dated as of June 29, 2009, among Intelsat Intermediate Holding Company, Ltd., Intelsat, Ltd., other guarantors named therein, and Wells Fargo Bank, National Association, as trustee (incorporated by reference to Exhibit 99.2 to Intelsat, Ltd.’s Report on Form 8-K, File No. 000-50262, filed on July 6, 2009). | |
| 4.44 | Supplemental Indenture for the 11 1/2% Senior Notes due 2016 and the 9 1/2% Senior Notes due 2016, dated as of July 1, 2009, among Intelsat Jackson Holdings, Ltd., Intelsat, Ltd., other guarantors named therein, and Wells Fargo Bank, National Association, as trustee (incorporated by reference to Exhibit 99.3 to Intelsat, Ltd.’s Report on Form 8-K, File No. 000-50262, filed on July 6, 2009). | |
| 4.45 | Supplemental Indenture for the 9 1/4% Senior Notes due 2014, dated July 20, 2009, among Intelsat Corporation and Wells Fargo Bank, National Association, as trustee (incorporated by reference to Exhibit 99.1 to Intelsat, Ltd.’s Report on Form 8-K, File No. 000-50262, filed on July 23, 2009). | |
Table of Contents
| Exhibit No. |
Document Description | |
| 4.46 | Supplemental Indenture for the 9 1/4% Senior Notes due 2016, dated July 20, 2009, among Intelsat Corporation and Wells Fargo Bank, National Association, as trustee (incorporated by reference to Exhibit 99.2 to Intelsat, Ltd.’s Report on Form 8-K, File No. 000-50262, filed on July 23, 2009). | |
| 4.47 | Indenture for the 8 1/2% Senior Notes due 2019, dated as of October 20, 2009, by and among Intelsat Jackson Holdings, Ltd., as Issuer, Intelsat, Ltd. and Intelsat (Bermuda), Ltd., as Parent Guarantors, the subsidiary guarantors named therein and Wells Fargo Bank, National Association, as Trustee (including the forms of Notes) (incorporated by reference to Exhibit 4.1 of Intelsat, Ltd.’s Report on Form 8-K, File No. 000-50262, filed on October 22, 2009). | |
| 4.48 | Registration Rights Agreement, dated as of October 20, 2009, among Intelsat Jackson Holdings, Ltd., as issuer, Intelsat, Ltd. and Intelsat (Bermuda), Ltd., as parent guarantors, the subsidiary guarantors named therein and Banc of America Securities LLC, as Representative of the Initial Purchasers named on Schedule I thereto (incorporated by reference to Exhibit 4.2 of Intelsat, Ltd.’s Report on Form 8-K, File No. 000-50262, filed on October 22, 2009). | |
| 4.49 | Supplemental Indenture for the 9 1/4% Senior Notes due 2016, dated as of December 14, 2009, among Intelsat Satellite IS 14, Inc., Intelsat Corporation, the other Guarantors party thereto and Wells Fargo Bank, National Association, as trustee. * | |
| 4.50 | Supplemental Indenture for the 9 1/4% Senior Notes due 2014, dated as of December 14, 2009, among Intelsat Satellite IS 14, Inc., Intelsat Corporation and Wells Fargo Bank, National Association, as trustee. * | |
| 10.1 | Credit Agreement dated as of July 3, 2006 among Intelsat Subsidiary Holding Company, Ltd., Intelsat Intermediate Holding Company, Ltd. and the other parties named therein (incorporated by reference to Exhibit 10.1 of Intelsat, Ltd.’s Report on Form 8-K, File No. 000-50262, filed on July 10, 2006). | |
| 10.2 | Amendment Agreement (relating to Credit Agreement), dated as of July 3, 2006, by and among Intelsat Corporation (formerly known as PanAmSat Corporation) and the other parties named therein (incorporated by reference to Exhibit 10.1 of Intelsat Holding Corporation’s Report on Form 8-K, file No. 001-32456, filed on July 10, 2006). | |
| 10.3 | Credit Agreement, dated as of August 20, 2004, as amended and restated as of March 22, 2005, as further amended and restated as of July 3, 2006, among Intelsat Corporation (formerly known as PanAmSat Corporation) and the other parties named therein (incorporated by reference to Exhibit 10.2 of Intelsat Holding Corporation’s Report on Form 8-K, file No. 001-32456, filed on July 10, 2006). | |
| 10.4 | Form of Share Option Agreement under Intelsat Holdings, Ltd. 2005 Share Incentive Plan (incorporated by reference to Exhibit 10.12 of Intelsat, Ltd.’s Quarterly Report on Form 10-Q for the quarter ended September 30, 2006, File No. 000-50262, filed on November 15, 2006). | |
| 10.5 | Headquarters Land Lease, dated as of June 8, 1982, between the International Telecommunications Satellite Organization and the U.S. Government, as amended (incorporated by reference to Exhibit 10.16 of the Registration Statement on Form F-4, File No. 333-99189, filed on September 5, 2002). | |
| 10.6 | Letter Agreement, dated as of December 22, 2004, between Zeus Holdings Limited and David McGlade (incorporated by reference to Exhibit 3.14 of Intelsat, Ltd.’s Annual Report on Form 20-F for the year ended December 31, 2004, File No. 000-50262, filed on March 15, 2005). | |
| 10.7 | Letter Agreement, dated as of February 25, 2005, between Zeus Holdings Limited and David McGlade (incorporated by reference to Exhibit 3.15 of Intelsat, Ltd.’s Annual Report on Form 20-F for the year ended December 31, 2004, File No. 000-50262, filed on March 15, 2005). | |
| 10.8 | Intelsat Holdings, Ltd. 2005 Share Incentive Plan (incorporated by reference to Exhibit 10.1 to Intelsat Ltd.’s Current Report on Form 8-K dated May 10, 2005). | |
Table of Contents
| Exhibit No. |
Document Description | |
| 10.9 | Form of Restricted Share Agreement under Intelsat Holdings, Ltd. 2005 Share Incentive Plan (incorporated by reference to Exhibit 10.2 to Intelsat Ltd.’s Current Report on Form 8-K dated May 10, 2005). | |
| 10.10 | Intelsat Holdings, Ltd. Bonus Plan (incorporated by reference to Exhibit 10.3 to Intelsat Ltd.’s Current Report on Form 8-K dated May 10, 2005). | |
| 10.11 | Amendment No. 1 to Credit Agreement, dated January 19, 2007, among Intelsat Intermediate Holding Company, Ltd., Intelsat Subsidiary Holding Company, Ltd. and the other parties named therein (incorporated by reference to Exhibit 10.1 of Intelsat, Ltd.’s Report on Form 8-K, File No. 000-50262, filed on January 25, 2007). | |
| 10.12 | Amendment No. 2 to Credit Agreement, dated January 19, 2007, among Intelsat Intermediate Holding Company, Ltd., Intelsat Subsidiary Holding Company, Ltd. and the other parties named therein (incorporated by reference to Exhibit 10.2 of Intelsat, Ltd.’s Report on Form 8-K, File No. 000-50262, filed on January 25, 2007). | |
| 10.13 | Amendment No. 1 to Credit Agreement, dated January 19, 2007, among Intelsat Corporation and the other parties named therein (incorporated by reference to Exhibit 10.1 of Intelsat Corporation’s Report on Form 8-K, File No. 000-22531, filed on January 25, 2007). | |
| 10.14 | Credit Agreement, dated as of February 2, 2007, by and among Intelsat (Bermuda), Ltd., as the Borrower, Intelsat, Ltd., as Guarantor, and the Several Lenders from time to time parties thereto, Bank of America, N.A., as Administrative Agent, Deutsche Bank Securities Inc., as Syndication Agent, Banc of America Securities LLC and Deutsche Bank Securities Inc., as Joint Lead Arrangers, and Banc of America Securities LLC, Deutsche Bank Securities Inc., Credit Suisse Securities (USA) LLC and Morgan Stanley Senior Funding, Inc., as Joint Bookrunners (incorporated by reference to Exhibit 10.1 of Intelsat, Ltd.’s Report on Form 8-K, File No. 000-50262, filed on February 6, 2007). | |
| 10.15 | Amendment No. 3 to Credit Agreement and Appointment of Administrative Agent, dated as of January 25, 2008, among Intelsat Intermediate Holding Company, Ltd., Intelsat Subsidiary Holding Company, Ltd., the lenders party thereto, Citicorp USA, Inc., in its capacity as administrative agent for the lenders and as agent for the secured parties, and Credit Suisse, Cayman Islands Branch, as successor administrative agent (incorporated by reference to Exhibit 10.1 of Intelsat, Ltd.’s Report on Form 8-K, File No. 000-50262, filed on February 8, 2008). | |
| 10.16 | Amendment No. 2 to Credit Agreement and Appointment of Administrative Agent, dated as of January 25, 2008, among Intelsat Corporation, the lenders party thereto, Citicorp USA, Inc., in its capacity as administrative agent for the lenders and as agent for the secured parties, and Credit Suisse, Cayman Islands Branch, as successor administrative agent (incorporated by reference to Exhibit 10.2 of Intelsat, Ltd.’s Report on Form 8-K, File No. 000-50262, filed on February 8, 2008). | |
| 10.17 | Joinder Agreement, dated as of February 4, 2008, among Intelsat Corporation, Credit Suisse, Cayman Islands Branch, and the lenders a party thereto (incorporated by reference to Exhibit 10.3 of Intelsat, Ltd.’s Report on Form 8-K, File No. 000-50262, filed on February 8, 2008). | |
| 10.18 | Assignment and Assumption Agreement, dated as of February 4, 2008, between Intelsat (Bermuda), Ltd. and Intelsat Jackson Holdings, Ltd. (incorporated by reference to Exhibit 10.4 of Intelsat, Ltd.’s Report on Form 8-K, File No. 000-50262, filed on February 8, 2008). | |
| 10.19 | Assumption and Affirmation Agreement, dated as of February 4, 2007, among Intelsat (Bermuda), Ltd., Intelsat Jackson Holdings, Ltd., Intelsat, Ltd., as parent guarantor, Intelsat Subsidiary Holding Company, Ltd., Intelsat Holdings LLC, Intelsat LLC, Intelsat Global Sales & Marketing Ltd., Intelsat USA Sales Corp., Intelsat USA License Corp., Intelsat Global Service Corporation and Intelsat UK Financial Services Ltd., as subsidiary guarantors, and Bank of America, N.A., as administrative agent for the lenders (incorporated by reference to Exhibit 10.5 of Intelsat, Ltd.’s Report on Form 8-K, File No. 000-50262, filed on February 8, 2008). | |
Table of Contents
| Exhibit No. |
Document Description | |
| 10.20 | New Guarantee Agreement, dated as of February 4, 2008, among Intelsat (Bermuda), Ltd., Intelsat Jackson Holdings, Ltd. and Bank of America, N.A., as administrative agent for the Lenders (incorporated by reference to Exhibit 10.6 of Intelsat, Ltd.’s Report on Form 8-K, File No. 000-50262, filed on February 8, 2008). | |
| 10.21 | Assignment and Assumption Agreement, dated as of February 4, 2008, between Serafina Acquisition Limited and Intelsat (Bermuda), Ltd. (incorporated by reference to Exhibit 10.15 of Intelsat, Ltd.’s Report on Form 8-K, File No. 000-50262, filed on February 8, 2008). | |
| 10.22 | Assumption Agreement, dated as of February 4, 2008, among Serafina Acquisition Limited, Intelsat (Bermuda), Ltd. and Credit Suisse, Cayman Islands Branch, as administrative agent for the lenders (incorporated by reference to Exhibit 10.16 of Intelsat, Ltd.’s Report on Form 8-K, File No. 000-50262, filed on February 8, 2008). | |
| 10.23 | Senior Unsecured Bridge Loan Credit Agreement, dated as of February 4, 2008, among Serafina Acquisition Limited, as initial borrower, Intelsat (Bermuda), Ltd., as borrower, the several lenders from time to time party thereto, Credit Suisse, Cayman Islands Branch, as administrative agent, Banc of America Bridge LLC, as syndication agent, Morgan Stanley Senior Funding, Inc., as documentation agent, and Credit Suisse Securities (USA) LLC, Banc of America Securities LLC and Morgan Stanley Senior Funding, Inc., as joint lead arrangers and joint bookrunners (incorporated by reference to Exhibit 10.17 of Intelsat, Ltd.’s Report on Form 8-K, File No. 000-50262, filed on February 8, 2008). | |
| 10.24 | Senior Unsecured PIK Election Bridge Loan Credit Agreement, dated as of February 4, 2008, among Serafina Acquisition Limited, as initial borrower, Intelsat (Bermuda), Ltd., as borrower, the several lenders from time to time party thereto, Credit Suisse, Cayman Islands Branch, as administrative agent, Banc of America Bridge LLC, as syndication agent, Morgan Stanley Senior Funding, Inc., as documentation agent, and Credit Suisse Securities (USA) LLC, Banc of America Securities LLC and Morgan Stanley Senior Funding, Inc., as joint lead arrangers and joint bookrunners (incorporated by reference to Exhibit 10.18 of Intelsat, Ltd.’s Report on Form 8-K, File No. 000-50262, filed on February 8, 2008). | |
| 10.25 | Commitment Letter, dated as of June 19, 2007, among Serafina Acquisition Limited, Credit Suisse, Banc of America, N.A., Banc of America Bridge LLC and Morgan Stanley Senior Funding, Inc., as initial lenders (incorporated by reference to Exhibit 10.19 of Intelsat, Ltd.’s Report on Form 8-K, File No. 000-50262, filed on February 8, 2008). | |
| 10.26 | Amended and Restated Commitment Letter Amendment, dated as of February 7, 2008, among Serafina Acquisition Limited, Credit Suisse, Banc of America, N.A., Banc of America Bridge LLC and Morgan Stanley Senior Funding, Inc., as initial lenders (incorporated by reference to Exhibit 10.20 of Intelsat, Ltd.’s Report on Form 8-K, File No. 000-50262, filed on February 8, 2008). | |
| 10.27 | Monitoring Fee Agreement, dated as of February 4, 2008, among Intelsat (Bermuda), Ltd., BC Partners Limited and Silver Lake Management Company III, L.L.C. (incorporated by reference to Exhibit 10.21 of Intelsat, Ltd.’s Report on Form 8-K, File No. 000-50262, filed on February 8, 2008). | |
| 10.28 | 8.50% $883,346,000 Senior Unsecured Credit Agreement, dated May 2, 2008, by and among Intelsat Subsidiary Holding Company, Ltd., as the Borrower, Intelsat, Ltd., Intelsat (Bermuda), Ltd., Intelsat Jackson Holdings, Ltd. and Intelsat Intermediate Holding Company, Ltd., as parent guarantors, the several lenders from time to time party thereto, Credit Suisse, Cayman Islands Branch, as Administrative Agent, and Credit Suisse Securities (USA) LLC, Banc of America Securities LLC and Morgan Stanley Senior Funding, Inc., as joint lead arrangers, and the other parties thereto (incorporated by reference to Exhibit 10.1 of Intelsat, Ltd.’s Report on Form 8-K, File No. 000-50262, filed on May 6, 2008). | |
Table of Contents
| Exhibit No. |
Document Description | |
| 10.29 | 8.875% $681,012,700 Senior Unsecured Credit Agreement, dated May 2, 2008, by and among Intelsat Subsidiary Holding Company, Ltd., as the Borrower, Intelsat, Ltd., Intelsat (Bermuda), Ltd., Intelsat Jackson Holdings, Ltd. and Intelsat Intermediate Holding Company, Ltd., as parent guarantors, the several lenders from time to time party thereto, Credit Suisse, Cayman Islands Branch, as Administrative Agent, and Credit Suisse Securities (USA) LLC, Banc of America Securities LLC and Morgan Stanley Senior Funding, Inc., as joint lead arrangers, and the other parties thereto (incorporated by reference to Exhibit 10.2 of Intelsat, Ltd.’s Report on Form 8-K, File No. 000-50262, filed on May 6, 2008). | |
| 10.30 | 9 1/4% $658,119,030 Senior Unsecured Credit Agreement, dated May 2, 2008, by and among Intelsat Corporation, as the Borrower, the several lenders from time to time party thereto, Credit Suisse, Cayman Islands Branch, as Administrative Agent, and Credit Suisse Securities (USA) LLC, Banc of America Securities LLC and Morgan Stanley Senior Funding, Inc., as joint lead arrangers, and the other parties thereto (incorporated by reference to Exhibit 10.3 of Intelsat, Ltd.’s Report on Form 8-K, File No. 000-50262, filed on May 6, 2008). | |
| 10.31 | Credit Agreement, dated as of July 1, 2008, by and among Intelsat Jackson Holdings, Ltd., as the Borrower, Intelsat (Bermuda), Ltd., as Guarantor, and the Several Lenders from time to time parties thereto, Credit Suisse, Cayman Islands Branch, as Administrative Agent, Banc of America Bridge LLC, as Syndication Agent, Morgan Stanley Senior Funding, Inc., as Documentation Agent, and Credit Suisse Securities (USA) LLC, Banc of America Securities LLC and Morgan Stanley Senior Funding, Inc. as Joint Lead Arrangers and Joint Bookrunners (incorporated by reference to Exhibit 10.1 of Intelsat, Ltd.’s Report on Form 8-K, File No. 000-50262, filed on July 3, 2008). | |
| 10.32 | Employment Agreement, dated as of December 29, 2008 and effective as of February 4, 2008, by and among Intelsat Global, Ltd., Intelsat, Ltd. and David McGlade (incorporated by reference to Exhibit 10.1 of Intelsat, Ltd.’s Report on Form 8-K, File No. 000-50262, filed on January 5, 2009). | |
| 10.33 | Third Amendment to Headquarters Land Lease, dated as of 28 March, 2006, between the Government of the United States and Intelsat Global Service Corporation, successor-in-interest to International Telecommunications Satellite Organization (incorporated by reference to Exhibit 10.60 of Intelsat S.A.’s Annual Report on Form 10-K for the year ended December 31, 2008). | |
| 10.34 | Amendment to Monitoring Fee Agreement, dated April 10, 2008, among Intelsat (Bermuda), Ltd., BC Partners Limited and Silver Lake Management Company III, L.L.C. (incorporated by reference to Exhibit 10.61 of Intelsat S.A.’s Annual Report on Form 10-K for the year ended December 31, 2008). | |
| 10.35 | Intelsat Global, Ltd. 2008 Share Incentive Plan (incorporated by reference to Exhibit 10.1 of Intelsat, Ltd.’s Report on Form 8-K, File No. 000-50262, filed on May 12, 2009). | |
| 10.36 | Class A Restricted Share Agreement, dated May 6, 2009, between Intelsat Global, Ltd. and David McGlade (incorporated by reference to Exhibit 10.2 of Intelsat, Ltd.’s Report on Form 8-K, File No. 000-50262, filed on May 12, 2009). | |
| 10.37 | Class A Restricted Share Agreement, dated May 6, 2009, between Intelsat Global, Ltd. and Phillip Spector (incorporated by reference to Exhibit 10.3 of Intelsat, Ltd.’s Report on Form 8-K, File No. 000-50262, filed on May 12, 2009). | |
| 10.38 | Class A Restricted Share Agreement, dated May 8, 2009, between Intelsat Global, Ltd. and Stephen Spengler (incorporated by reference to Exhibit 10.4 of Intelsat, Ltd.’s Report on Form 8-K, File No. 000-50262, filed on May 12, 2009). | |
| 10.39 | Class A Restricted Share Agreement, dated May 8, 2009, between Intelsat Global, Ltd. and Thierry Guillemin (incorporated by reference to Exhibit 10.5 of Intelsat, Ltd.’s Report on Form 8-K, File No. 000-50262, filed on May 12, 2009). | |
Table of Contents
| Exhibit No. |
Document Description | |
| 10.40 | Class B Restricted Share Agreement, dated May 6, 2009, between Intelsat Global, Ltd. and David McGlade (incorporated by reference to Exhibit 10.6 of Intelsat, Ltd.’s Report on Form 8-K, File No. 000-50262, filed on May 12, 2009). | |
| 10.41 | Class B Restricted Share Agreement, dated May 6, 2009, between Intelsat Global, Ltd. and Phillip Spector (incorporated by reference to Exhibit 10.7 of Intelsat, Ltd.’s Report on Form 8-K, File No. 000-50262, filed on May 12, 2009). | |
| 10.42 | Class B Restricted Share Agreement, dated May 6, 2009, between Intelsat Global, Ltd. and Michael McDonnell (incorporated by reference to Exhibit 10.8 of Intelsat, Ltd.’s Report on Form 8-K, File No. 000-50262, filed on May 12, 2009). | |
| 10.43 | Class B Restricted Share Agreement, dated May 8, 2009, between Intelsat Global, Ltd. and Stephen Spengler (incorporated by reference to Exhibit 10.9 of Intelsat, Ltd.’s Report on Form 8-K, File No. 000-50262, filed on May 12, 2009). | |
| 10.44 | Class B Restricted Share Agreement, dated May 8, 2009, between Intelsat Global, Ltd. and Thierry Guillemin (incorporated by reference to Exhibit 10.10 of Intelsat, Ltd.’s Report on Form 8-K, File No. 000-50262, filed on May 12, 2009). | |
| 10.45 | Management Shareholders Agreement of Intelsat Global, Ltd (incorporated by reference to Exhibit 10.11 of Intelsat, Ltd.’s Report on Form 8-K, File No. 000-50262, filed on May 12, 2009). | |
| 10.46 | Letter Agreement, dated May 6, 2009, between Intelsat Global, Ltd. and David McGlade regarding the Management Shareholders Agreement (incorporated by reference to Exhibit 10.12 of Intelsat, Ltd.’s Report on Form 8-K, File No. 000-50262, filed on May 12, 2009). | |
| 10.47 | Letter Agreement, dated May 6, 2009, between Intelsat Global, Ltd. and Phillip Spector regarding the Management Shareholders Agreement (incorporated by reference to Exhibit 10.13 of Intelsat, Ltd.’s Report on Form 8-K, File No. 000-50262, filed on May 12, 2009). | |
| 10.48 | Letter Agreement, dated May 6, 2009, between Intelsat Global, Ltd. and Michael McDonnell regarding the Management Shareholders Agreement (incorporated by reference to Exhibit 10.14 of Intelsat, Ltd.’s Report on Form 8-K, File No. 000-50262, filed on May 12, 2009). | |
| 10.49 | Option Agreement, dated May 6, 2009, between Intelsat Global, Ltd. and David McGlade (incorporated by reference to Exhibit 10.15 of Intelsat, Ltd.’s Report on Form 8-K, File No. 000-50262, filed on May 12, 2009). | |
| 10.50 | Option Agreement, dated May 6, 2009, between Intelsat Global, Ltd. and Phillip Spector (incorporated by reference to Exhibit 10.16 of Intelsat, Ltd.’s Report on Form 8-K, File No. 000-50262, filed on May 12, 2009). | |
| 10.51 | Option Agreement, dated May 6, 2009, between Intelsat Global, Ltd. and Michael McDonnell (incorporated by reference to Exhibit 10.17 of Intelsat, Ltd.’s Report on Form 8-K, File No. 000-50262, filed on May 12, 2009). | |
| 10.52 | Option Agreement, dated May 8, 2009, between Intelsat Global, Ltd. and Stephen Spengler (incorporated by reference to Exhibit 10.18 of Intelsat, Ltd.’s Report on Form 8-K, File No. 000-50262, filed on May 12, 2009). | |
| 10.53 | Option Agreement, dated May 8, 2009, between Intelsat Global, Ltd. and Thierry Guillemin (incorporated by reference to Exhibit 10.19 of Intelsat, Ltd.’s Report on Form 8-K, File No. 000-50262, filed on May 12, 2009). | |
| 10.54 | Form of Management Class B Restricted Share Agreement, dated May 8, 2009 (incorporated by reference to Exhibit 10.20 of Intelsat, Ltd.’s Report on Form 8-K, File No. 000-50262, filed on May 12, 2009). | |
Table of Contents
| Exhibit No. |
Document Description | |
| 10.55 | Form of Management Option Agreement, dated May 8, 2009 (incorporated by reference to Exhibit 10.21 of Intelsat, Ltd.’s Report on Form 8-K, File No. 000-50262, filed on May 12, 2009). | |
| 10.56 | Form of Management Class A Restricted Share Agreement, dated May 8, 2009 (incorporated by reference to Exhibit 10.22 of Intelsat, Ltd.’s Report on Form 8-K, File No. 000-50262, filed on May 12, 2009). | |
| 10.57 | Form of Share Option Agreement, dated May 8, 2009 (incorporated by reference to Exhibit 10.23 of Intelsat, Ltd.’s Report on Form 8-K, File No. 000-50262, filed on May 12, 2009). | |
| 10.58 | Amendment and Acknowledgement, dated May 6, 2009, between Intelsat, Ltd., Intelsat Global, Ltd. and David McGlade (incorporated by reference to Exhibit 10.24 of Intelsat, Ltd.’s Report on Form 8-K, File No. 000-50262, filed on May 12, 2009). | |
| 10.59 | Employment Agreement, dated May 6, 2009 between Intelsat Global, Ltd., Intelsat, Ltd. and Phillip Spector (incorporated by reference to Exhibit 10.25 of Intelsat, Ltd.’s Report on Form 8-K, File No. 000-50262, filed on May 12, 2009). | |
| 10.60 | Employment Agreement, dated May 6, 2009 between Intelsat Global, Ltd., Intelsat, Ltd. and Michael McDonnell (incorporated by reference to Exhibit 10.26 of Intelsat, Ltd.’s Report on Form 8-K, File No. 000-50262, filed on May 12, 2009). | |
| 10.61 | Severance Agreement, dated May 8, 2009, between Intelsat Global, Ltd. and Stephen Spengler (incorporated by reference to Exhibit 10.27 of Intelsat, Ltd.’s Report on Form 8-K, File No. 000-50262, filed on May 12, 2009). | |
| 10.62 | Severance Agreement, dated May 8, 2009, between Intelsat Global, Ltd. and Thierry Guillemin (incorporated by reference to Exhibit 10.28 of Intelsat, Ltd.’s Report on Form 8-K, File No. 000-50262, filed on May 12, 2009). | |
| 10.63 | Purchase Agreement, dated October 30, 2009, between Intelsat Subsidiary Holding Company, Ltd. and ProtoStar I Ltd. * | |
| 10.64 | Joinder Agreement, dated December 2, 2009, among Barclays Bank plc, Intelsat Subsidiary Holding Company, Ltd. and Credit Suisse AG, Cayman Islands Branch. * | |
| 10.65 | Assignment and Modification Agreement effective December 21, 2009, to Employment Agreement dated December 29, 2008, among David McGlade, Intelsat Global, Ltd., Intelsat, Ltd. and Intelsat Management LLC. * | |
| 10.66 | Assignment and Modification Agreement effective December 21, 2009, to Employment Agreement dated May 6, 2009, among Phillip Spector, Intelsat Global, Ltd., Intelsat, Ltd. and Intelsat Management LLC. * | |
| 10.67 | Assignment and Modification Agreement effective December 21, 2009, to Employment Agreement dated May 6, 2009, among Michael McDonnell, Intelsat Global, Ltd., Intelsat, Ltd. and Intelsat Management LLC. * | |
| 10.68 | Amendment to Class A Restricted Share Agreement, dated December 7, 2009, between Intelsat Global, Ltd. and David McGlade. * | |
| 10.69 | Amendment to Class A Restricted Share Agreement, dated December 7, 2009, between Intelsat Global, Ltd. and Phillip Spector. * | |
| 10.70 | Amendment to Class B Restricted Share Agreement, dated December 7, 2009, between Intelsat Global, Ltd. and David McGlade. * | |
| 10.71 | Amendment to Class B Restricted Share Agreement, dated December 7, 2009, between Intelsat Global, Ltd. and Phillip Spector. * | |
Table of Contents
| Exhibit No. |
Document Description | |
| 10.72 | Amendment to Class B Restricted Share Agreement, dated December 7, 2009, between Intelsat Global, Ltd. and Michael McDonnell. * | |
| 10.73 | Letter Amendment, dated December 7, 2009, between Intelsat Global, Ltd. and David McGlade. * | |
| 10.74 | Letter Amendment, dated December 7, 2009, between Intelsat Global, Ltd. and Phillip Spector. * | |
| 10.75 | Letter Amendment, dated December 7, 2009, between Intelsat Global, Ltd. and Michael McDonnell. * | |
| 10.76 | Amendment to Management Shareholders Agreement of Intelsat Global, Ltd., dated as of December 7, 2009 and effective as of December 15, 2009. * | |
| 10.77 | Acknowledgment Agreement, dated December 7, 2009, among certain shareholders of Intelsat Global, Ltd., regarding the Amendment to Management Shareholders Agreement of Intelsat Global, Ltd. * | |
| 10.78 | Consent, dated as of November 2, 2009, related to the Credit Agreement, dated as of July 3, 2006, among Intermediate Holding Company, Ltd., Intelsat Subsidiary Holding Company, Ltd., the lenders party thereto, and Credit Suisse, Cayman Islands Branch, as administrative agent.* | |
| 21.1 | List of subsidiaries. * | |
| 31.1 | Certification of the Chief Executive Officer pursuant to Rule 15d-14(a) of the Securities Exchange Act of 1934, as amended. * | |
| 31.2 | Certification of the Chief Financial Officer pursuant to Rule 15d-14(a) of the Securities Exchange Act of 1934, as amended. * | |
| 32.1 | Certification of the Chief Executive Officer pursuant to 18 U.S.C. Section 1350. * | |
| 32.2 | Certification of the Chief Financial Officer pursuant to 18 U.S.C. Section 1350. * | |
| * | Filed herewith. |