Attached files
| file | filename |
|---|---|
| 8-K - FORM 8-K - AMERICAN PHYSICIANS CAPITAL INC | k48933e8vk.htm |
Exhibit 99.1
| RAYMOND JAMES INSTITUTIONAL INVESTOR CONFERENCE MARCH 10, 2010 |

| Forward-Looking Statements 2 Certain statements made by American Physicians Capital, Inc. during this presentation may constitute forward-looking statements within the meaning of the federal securities laws. When we use words such as "will," "should," "believes," "expects," "anticipates," "estimates" or similar expressions we are making forward-looking statements. While we believe any forward- looking statements we will make are reasonable, they are subject to risks and uncertainties, and actual results could differ materially. These risks and uncertainties include, but are not limited to, the following: increased competition could adversely affect our ability to sell our products at premium rates we deem adequate, which may result in a decrease in premium volume, a decrease in our profitability, or both; our reserves for unpaid losses and loss adjustment expenses are based on estimates that may prove to be inadequate to cover our losses; an interruption or change in current marketing and agency relationships could reduce the amount of premium we are able to write; if we are unable to obtain or collect on ceded reinsurance, our results of operations and financial condition may be adversely affected; our geographic concentration in certain Midwestern states and New Mexico ties our performance to the business, economic, regulatory and legislative conditions in those states; a downgrade in the A.M. Best Company financial strength rating of our insurance subsidiaries could reduce the amount of business we are able to write; changes in interest rates could adversely impact our results of operation, cash flows and financial condition; market illiquidity and volatility associated with the current financial crisis makes the fair values of our investments more difficult to estimate, and may have other unforeseen consequences that we are currently unable to predict; the unpredictability of court decisions could have a material adverse financial impact on our business operations; our business could be adversely affected by the loss of one or more of our key employees; the insurance industry is subject to regulatory oversight that may impact the manner in which we operate our business, our ability to obtain future premium rate increases, the type and amount of our investments, the levels of capital and surplus deemed adequate to protect policyholder interests, or the ability of our insurance subsidiaries to pay dividends to the holding company; our status as an insurance holding company with no direct operations could adversely affect our ability to meet our debt obligations and fund future cash dividends and share repurchases; legislative or judicial changes in the tort system may have adverse or unintended consequences that could materially and adversely affect our results of operations and financial condition; applicable law and certain provisions in our articles and bylaws may prevent and discourage unsolicited attempts to acquire our Company that may be in the best interest of our shareholders or that might result in a substantial profit to our shareholders; any other factors listed or discussed in the reports filed by APCapital with the Securities and Exchange Commission under the Securities Exchange Act of 1934. APCapital does not undertake, and expressly disclaims any obligation, to update or alter its statements whether as a result of new information, future events or otherwise, except as required by applicable law. |
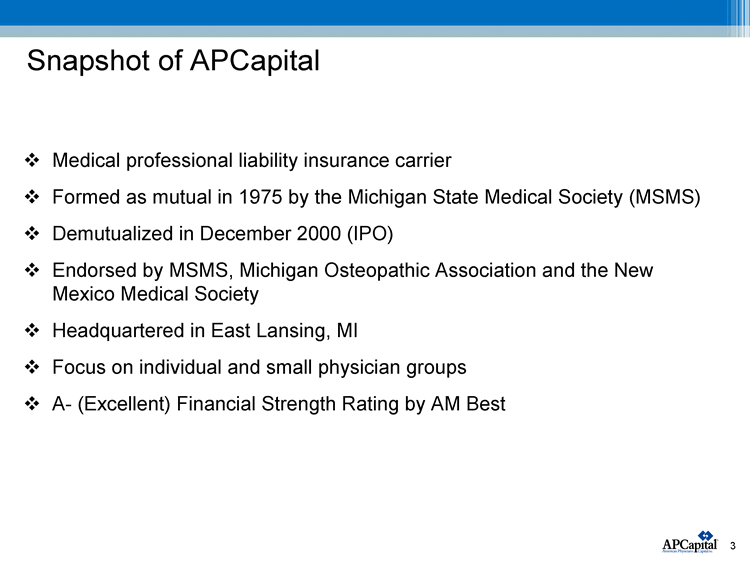
| Snapshot of APCapital Medical professional liability insurance carrier Formed as mutual in 1975 by the Michigan State Medical Society (MSMS) Demutualized in December 2000 (IPO) Endorsed by MSMS, Michigan Osteopathic Association and the New Mexico Medical Society Headquartered in East Lansing, MI Focus on individual and small physician groups A- (Excellent) Financial Strength Rating by AM Best 3 |

| Snapshot of APCapital Approximately 8,800 policies in-force at December 31, 2009 Marketing in primarily 5 states with a focus on the upper Midwest region and New Mexico Assets totaled $944.5 million at December 31, 2009 NASDAQ Global Select Market: ACAP Market cap $273.4 million1 based on 9,986,000 shares outstanding as of December 31, 2009 4 1As of February 17, 2010 |

| Snapshot of APCapital 5 Operating States YE 12/31/09 Direct Premiums Written YE 12/31/09 Direct Premiums Written Market Share Ranking 1 Expansion % by State $ in Millions Michigan 35% $40.3 2nd Home State Illinois 30% $33.8 2nd Internal Ohio 15% $17.0 4th Internal New Mexico 15% $16.8 1st Merged NMPMLC in 1997 Kentucky, Indiana, Wisconsin 5% $5.4 1 Source: Highline Data - Based on 2008 direct premiums written |

| Experienced Management Team Name Title Years of Industry-Related Experience Years of Medical Malpractice Experience Kevin Clinton, FCAS President & CEO 32 24 Frank Freund, CPA Chief Financial Officer 28 28 Annette Flood, RN, JD Chief Operating Officer 24 24 Kevin Dyke, FCAS VP, Actuarial 18 10 Rhonda Fossitt, CPCU, RPLU VP, Underwriting 32 13 Laura Kline, CIC, CPCU VP, Marketing 23 23 Jennifer Lawter, RN, JD VP, Risk Management 27 19 Cathy Shutack, BS VP, Claims 20 11 6 Experience in Medical Professional Liability Industry is a Must for Success |

| Focused Distribution System Use a focused, multi-channeled distribution system Premium under controlled distribution channels grew to 60% in 2009 from 45% in 2005 7 60% Controlled Distribution |

| Adequate Rates Drive Profitability 8 Average Rate Change Since 2002 |

| Disciplined Underwriting Maintained strict underwriting standards throughout soft market Continually enhancing our unique underwriting systems Performing on-site visits by risk management Predictive modeling and Communication Skills Assessment test Policy type primarily claims-made 66% of premiums are claims-made policies Only offer occurrence policies in: Michigan - our home state with 35 years of data and good tort reform New Mexico and Indiana - required for access to state compensation fund 9 |

| Intelligent Claims Management Produces Favorable Trial Results 10 Trial Results for APCapital (2004 - 2009) |

| Claims Reported Per 100 Insureds 11 Reported Frequency Trend Professional Liability Excluding Florida and Tails Frequency is down 53% from 2002 5.00 7.00 9.00 11.00 13.00 15.00 17.00 19.00 21.00 23.00 25.00 2000 - 1 2000 - 2 2001 - 1 2001 - 2 2002 - 1 2002 - 2 2003 - 1 2003 - 2 2004 - 1 2004 - 2 2005 - 1 2005 - 2 2006 - 1 2006 - 2 2007 - 1 2007 - 2 2008 - 1 2008 - 2 2009 - 1 2009 - 2 Reported Claims per 100 Policies (Physicians) Calendar Half Years |

| Reserve Strength Medical Professional Liability A Look at How Loss and ALAE Reserves as of 12/31/2006 have Developed Net Loss and ALAE Reserves as of 12/31/2006: $512.5 million Net Loss and ALAE Reserves paid as of 12/31/2009: $157.0 million Remaining Net Loss & ALAE Reserves as of 12/31/2009: $249.8 million Favorable reserve development as of 12/31/2009: $105.7 million 12 |
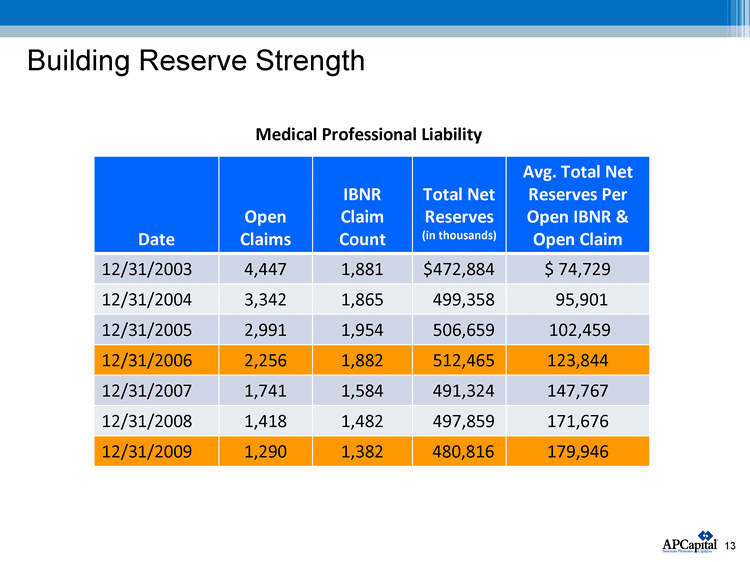
| Building Reserve Strength 13 Date Open Claims IBNR Claim Count Total Net Reserves (in thousands) Avg. Total Net Reserves Per Open IBNR & Open Claim 12/31/2003 4,447 1,881 $472,884 $ 74,729 12/31/2004 3,342 1,865 499,358 95,901 12/31/2005 2,991 1,954 506,659 102,459 12/31/2006 2,256 1,882 512,465 123,844 12/31/2007 1,741 1,584 491,324 147,767 12/31/2008 1,418 1,482 497,859 171,676 12/31/2009 1,290 1,382 480,816 179,946 Medical Professional Liability |

| APCapital Is Well Positioned For Changing Underwriting Cycles Unique and disciplined underwriting Understand importance for proper market timing Have tough, but smart defense of claims We remain opportunistic and flexible Look for strategic acquisitions 14 |

| FRANK H. FREUND CHIEF FINANCIAL OFFICER 15 |

| Financial Results --- GAAP 16 (dollars in thousands except per share data) 2009 2008 $ % Direct Premiums Written 113,232 $ 125,018 $ (11,786) $ -9.4% Net Premiums Written 109,713 $ 120,117 $ (10,404) $ -8.7% Net Premiums Earned 114,878 $ 124,268 $ (9,390) $ -7.6% Investment Income 30,910 36,864 (5,954) -16.2% Net Realized (Losses) (543) (658) 115 -17.5% Other Income 769 730 39 5.3% Total Revenues 146,014 161,204 (15,190) -9.4% Loss & LAE Expense: Current Year 94,121 97,489 (3,368) -3.5% Prior Year (36,559) (32,178) (4,381) 13.6% 57,562 65,311 (7,749) -11.9% Underwriting Expenses 28,515 27,458 1,057 3.8% Other Expenses 3,437 4,460 (1,023) -22.9% Total Expenses 89,514 97,229 (7,715) -7.9% Income Before Tax 56,500 63,975 (7,475) -11.7% Federal Income Tax 15,940 18,779 (2,839) -15.1% Net Income 40,560 $ 45,196 $ (4,636) $ -10.3% Diluted Weighted Average Shares Outstanding 11,061 13,094 (2,033) $ -15.5% Diluted Earnings Per Share 3.67 $ 3.45 $ 0.22 $ 6.4% Accident Year Loss Ratio 81.9% 78.5% 3.4% Calendar Year Loss Ratio 50.1% 52.6% -2.5% Underwriting Ratio 24.8% 22.1% 2.7% Combined Ratio 74.9% 74.7% 0.2% December 31, Year Ended Change |

| Diluted Earnings per Share 17 *Excludes impact of deferred tax asset allowance reversal |

| Calendar Year Combined Ratio (GAAP basis) 18 |

| Return on Equity Focus on return on GAAP equity**/capital management Fifth consecutive year our return on equity equaled or exceeded 14% Long-term return on GAAP equity target is 11-13% 19 *Excludes impact of deferred tax asset allowance reversal **Based on beginning of year equity |

| Investments Highlights No subprime losses No problem bank or broker bond holdings All mortgage-backed securities issued by government sponsored agencies All insured tax-exempt securities have an underlying rating of "A" or higher and are essential purpose bonds Other investments in American Physicians Services Group, Kingsway Financial Services and Stilwell Funds 20 (in thousands) December 31, December 31, 2009 % 2008 % U.S. Government - $ 0.00% 64,458 $ 7.76% Tax Exempt 385,111 48.18% 383,547 46.17% Corporates 79,414 9.93% 105,824 12.74% Mortgage Backed 109,399 13.69% 150,862 18.16% Total Bonds 573,924 71.80% 704,691 88.83% Cash & Cash Equivalents 172,162 21.54% 101,637 12.24% Other Investments 53,303 6.66% 24,320 2.93% Total Portfolio 799,389 $ 100.00% 830,648 $ 100.00% Bond Allocation Available-for-Sale 205,073 $ 35.73% 222,941 $ 31.64% Held-to-Maturity 368,851 64.27% 481,750 68.36% 573,924 $ 100.00% 704,691 $ 100.00% Average Return 3.85% 4.38% Bond Duration 2.29 2.60 AAA 43.7% AA 39.7% A 11.8% BBB 2.6% BB 1.1% Private 1.1% Average AA+ Rating Allocation |

| Excess Capacity 21 Net Premium Written to Available Surplus Ratios |
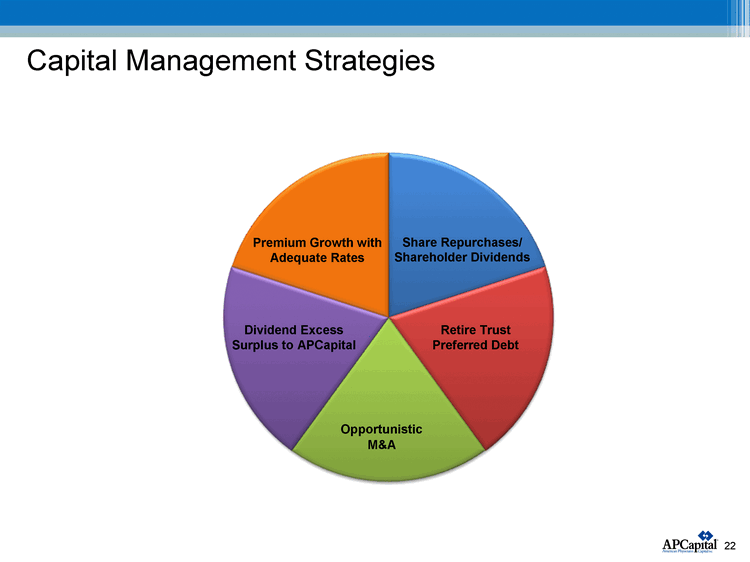
| Capital Management Strategies 22 Premium Growth with Adequate Rates Share Repurchases/ Shareholder Dividends Dividend Excess Surplus to APCapital Opportunistic M&A Retire Trust Preferred Debt |
| Why Invest in APCapital Experienced management team Business strategy producing positive results Strong financial position Well positioned for opportunities in underwriting cycle Continued positive trends Effective capital management 23 |

| Questions 24 |

| Shareholder Analysis 25 American Physicians Capital, Inc. Based on SEC filings and Company Records Fully % of Diulted Diluted Shares Insiders: Shares Options Shares (1) Outstanding Stilwell* 1,291,964 - 1,291,964 12.5% Clinton 171,701 159,996 331,697 3.2% Freund 65,782 80,000 145,782 1.4% Flood 18,883 89,997 108,880 1.1% Baumann 59,630 - 59,630 0.6% Mukkamala 51,132 - 51,132 0.5% Haynes 27,400 - 27,400 0.3% Rinek 6,000 - 6,000 0.1% Schneider 1,158 - 1,158 0.0% Thomas 0 - 0 0.0% Insiders 1,693,650 329,993 2,023,643 19.6% % of Diulted Shares Institutions: (2) Shares Outstanding Stilwell Value LLC* 1,191,964 11.6% BlackRock Global Investors 772,151 7.5% Vanguard Group, Inc. 595,381 5.8% JPMorgan Asset Management, Inc. 590,382 5.7% NFJ Investment Group 556,233 5.4% Dimensional Fund Advisors, Inc. 481,030 4.7% James Investment Research, Inc. 358,924 3.5% Turner Investment Partners, Inc. 344,958 3.3% Renaissance Technologies LLC 344,835 3.3% State Street Global Advisors 245,831 2.4% Top 10 Institutional Shareholders 5,481,689 53.1% Total Institutional Shareholders ** 8,292,350 80.4% Total Diluted Shares Outstanding 10,315,993 100% ** Does not include Stilwell Value as these shares are included in Insiders * Stilwell Value LLC is managed by Joseph Stilwell, a director on APCapital's Board. Insider holdings for Stilwell based on 2008 proxy disclosure adjusted for four for three stock split. |
