Attached files
| file | filename |
|---|---|
| 8-K - FORM 8-K - W&T OFFSHORE INC | d8k.htm |
 Raymond James Institutional Investors Conference March 10, 2010 Exhibit 99.1 |
 1 Company Highlights Highlights Reserve Data 2009 2008 Ticker WTI (NYSE) Proved Reserves (Bcfe) 371 491 Initial Public Offering January 2005 Proved Developed Reserves (Bcfe) 284 334 Employees 286 Proved Developed % 76 % 68 % Market Capitalization ($ in MMs) (1) $693 Oil and Liquids % 55 % 54 % Insider Ownership (% of S. O.) 58 % Key Financials ($ in MMs) 2009 2008 2007 Production Revenue $611 $1,216 $1,114 Average Daily Production (MMcfe) 220 +/- Adjusted EBITDA $342 $884 $820 Natural Gas % 53 % Adjusted EBITDA Margin % 56 % 73 % 74 % Operated Production % (net) 74 % CAPEX $276 $658 $362 Field Statistics (as of 12/31/09) # of Producing Fields w/WI 82 (2) Approx. Acreage (Gross/Net) 0.9 million/0.6 million % Held-by-Production 79 % (1) Market Capitalization as of March 5, 2010. (2) Reflects sale of non-core fields (2nd & 4th quarter 2009), expired leases,
and P&A program. |
 2 Key Investment Considerations • Large acreage position in the Gulf of Mexico • Operating in the Gulf of Mexico for 26 years • Experienced staff • Strong cash flow & good liquidity • Balanced oil and gas reserve mix • Focused on growth opportunities at reasonable cost – Improving environment for acquisitions and joint venture opportunities – Large prospect inventory – Focus on high impact opportunities • Improving operating metrics and margins – Lower LOE, ARO, DD&A rate, rig rates and overhead expenses • Strong Insider Ownership (~58%) |
 3 Proved Reserve Geographic Diversification Our geographic diversity provides additional protection during a hurricane |
 4 What is great about the Gulf of Mexico • Great history of production and reserves – Reserves at deeper but virtually untapped zones, significant upside potential (i.e. Davy Jones, Jack, etc.) – Highly prolific with multiple pay zones – Reserve to production profile is consistent – Established infrastructure on shelf • Attractive reservoir characteristic – High porosity rock provides quick return on investment – Cash flow velocity significantly higher than most other basins – Balanced growth opportunities (high impact or low risk) |
 5 Our Historical Gulf of Mexico Focus • Operating successfully in the Gulf of Mexico for 26 years – 10 year exploration drilling success rate of 78% – 10 year development drilling success rate of 90% – Established infrastructure allows for accelerated cash flow • Inventory of 160 drilling prospects – WTI holds interest in about 82 fields - spread across the GOM – Significant reserve upside potential in deeper zones – Extensive seismic, production and log data • Active M&A and joint venture market • Costs historically adjust quickly to commodity prices – Late 2008 & first half of 2009 was exception, partially due to Hurricane |
 6 Accomplishments in 2009 • 77% success in 2009 exploration and development drilling program, including successfully drilling eight of ten exploration wells and two of three development wells • Asset retirement obligations decreased $199.1 million via dispositions and cost revisions • LOE decreased $25.8 million for the year through divestitures of non-core assets and cost reduction initiatives ($2.15/Mcfe in 2009 vs. $2.35/Mcfe in 2008) • Hedged approximately 20 Bcfe of 2010 production • Returned to profitability • Maintained liquidity without dilution |
 7 2010 Goals & Objectives: Focusing on Growth and Profitability • Grow reserves – Initial drilling program of 10 wells – 187 Bcfe net unrisked most likely reserves – Pursue acquisitions with proved reserves and exploitation opportunities – Drill high impact wells – 63% increase in cap-ex program • Increase production – 2009 & 2010 drilling program, including potential joint ventures – Recompletions & Workovers – Potential acquisition of producing properties |
 8 2010 Goals & Objectives: Focusing on Growth and Profitability – Cont’d • Cost management – LOE controls – Possible divestiture on non-core properties – Committed to competitive F&D metrics • Improve EBITDA margins closer to historic levels – Reducing costs of goods & services in line with commodity prices – New hedging program |
 9 Reserve Growth Opportunities • Acquisitions – Prices have declined substantially since 2008 – Deal flow is accelerating – Experienced A&D team – Evaluating onshore (long life reserves) and offshore (deepwater) – Aggressively pursue acquisitions in the current environment • Drilling Projects – Large inventory of conventional shelf projects – Joint ventures – Focus on high impact exploration projects – Onshore |
 10 2010 Capital Expenditures Budget • $450 million budget is 63% higher than in 2009 • $153 million is allocated to: – Ten wells, including nine exploration and one development – Well recompletions, facilities capital, seismic and leasehold • Remainder of budget has been allocated to: – Acquisitions – Joint ventures or third-party drilling prospects – Drilling other prospects within our 160 well prospect inventory |
 11 Ewing Bank Proposed 2010 Drilling Program Viosca Knoll S. Pass E. Add Mississippi Canyon Atwater Valley Green Canyon Garden Banks East Breaks Mustang Island Matagorda Island Brazos Galveston High Island E. Cameron Vermilion Eugene Island Ship Shoal South Timbalier West Delta Grand Isle Main Pass W. Cameron Exploration MP 98 - #1 WI: 100% Shelf MP 108 – E3 WI: 67% Shelf Bay Marchand #2 WI: 30% Shelf VK 734 A-4 WI: 100% Shelf Non-commercial HI 129 #16 ST2 WI: 10% Shelf Development Plus: Four additional exploration wells, which includes one onshore well and one deepwater well MP 283 – A2ST4 WI: 89% Shelf Main Pass S. and E. |
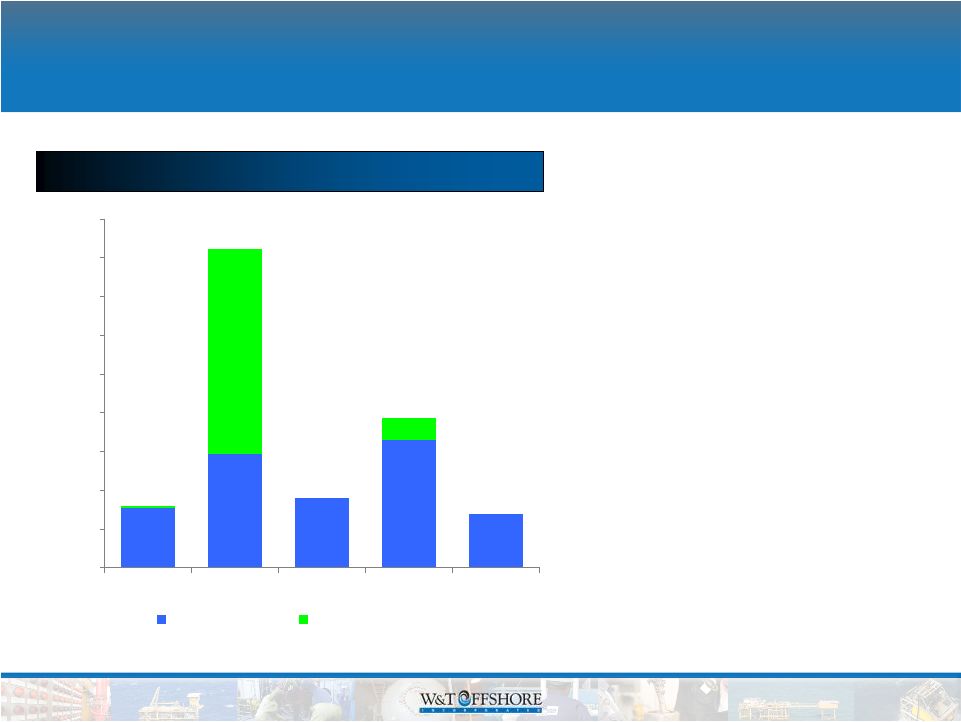 12 Strategic Budgeting with a Long-Term Focus • We drill within cash flow • Focus on maintaining liquidity • Reduce capital budget when service costs are high and commodity prices are low • Maintain a disciplined investment strategy • In 2010, we expect to spend 63% more on capital expenditures over 2009 due to better operating metrics $276 $658 $361 $306 $589 $17 $1,062 $117 $0 $200 $400 $600 $800 $1,000 $1,200 $1,400 $1,600 $1,800 2005 2006 2007 2008 2009 Drilling CapEx Acquisition CapEx Capital Expenditures ($ in millions) |
 13 Proved Reserves by Year • Reserves & production growth typically track capital spending levels • Negative pricing & adverse economic conditions offset drilling successes and acquisitions • New SEC rules reduced reserves in 2009 * Includes 157.5 Bcfe of downward revisions, most of which is related to pricing. ** Includes 48.2 Bcfe reduction due to SEC rule changes. 215.9 401.2 332.8 227.9 165.8 275.6 334.0 306.0 263.3 205.2 $323.0 $361.2 $774.9 $276.1 $1,650.8 0.0 200.0 400.0 600.0 800.0 2005 2006 2007 2008 2009 $0 $200 $400 $600 $800 $1,000 $1,200 $1,400 $1,600 $1,800 Oil & NGLs (Bcfe) Natural Gas (Bcf) Total CapEx 491.5 735.2 491.1* 638.8 371.0** 215.9 401.2 332.8 227.9 165.8 275.6 334.0 306.0 263.3 205.2 $323.0 $361.2 $276.1 $1,650.8 0.0 200.0 400.0 600.0 800.0 2005 2006 2007 2008 2009 $0 $200 $400 $600 $800 $1,000 $1,200 $1,400 $1,600 $1,800 Oil & NGLs (Bcfe) Natural Gas (Bcf) Total CapEx 491.5 735.2 491.1* 638.8 371.0** $774.9 |
 14 Production Profile • 2010 production guidance of 60 to 80 BCFE is based on the initial 7 well budget and $150 million cap-ex program – not full $450 million budget • Second half of 2008 and 2009 was focused on preserving capital and lower cost projects with high impact such as workovers and recompletions • Extensive 2010 workover and recomplete program planned 71.1 99.2 (1) (2) 126.5 Oil & NGLs (Bcfe) Natural Gas (Bcf) (3) 97.9 94.8 (1) 2005 Production does not include17.4 Bcfe of deferral caused by Hurricanes Katrina and Rita
(2) 2006 Production does not include 7.8 Bcfe of deferral caused by Hurricanes Katrina
and Rita (3) 2008 Production does not include 21.7 Bcfe of deferral caused by Hurricanes
Gustav and Ike |
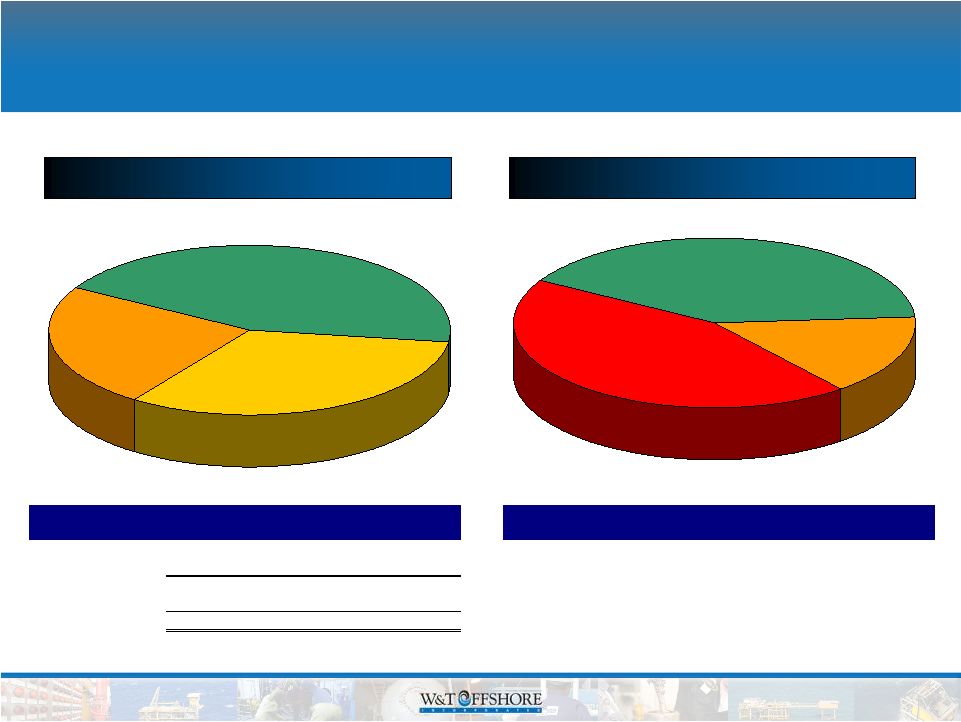 15 Proved & 3P Reserves Mix PDP 43% PDNP 33% PUD 24% 2009 – Proved Reserves Proved 40% Probable 16% Possible 44% 2009 - 3P Reserves Oil Gas Total Mbo MMcf MMcfe PDP 12,667 86,561 162,564 43% PDNP 11,041 54,714 120,963 33% Total Proved Dev. 23,709 141,275 283,527 PUD 10,494 24,482 87,445 24% Total Proved 34,203 165,757 370,972 100% Reserve Mix 55 % 45 % 100 % Oil Gas Total Mbo MMcf MMcfe Proved 34,203 165,757 370,972 40% Probable 13,043 62,201 140,458 15% Possible 37,048 183,520 405,805 44% |
 16 Strategic Acquisition Criteria Opportunistic Approach • Properties generating cash flow – Strong current production rates • Financeable – Large portion of reserve base is proved developed and can be financed • Identified upside – Properties have undrilled prospects – Contiguous acreage to existing heritage properties – Undeveloped lease blocks / acreage • Overlooked assets – Workover and recompletion opportunities • Adding staff to focus on deepwater and long life reserves |
 17 Prudent Investment Strategy • Proven, experienced and expanding A&D team • Improving transaction market (1) – Domestic E&P transactions of $5.8 billion in 2009 compared to $26.6 billion in 2008 – Deals of $7.8 billion done thus far in 2010 – Transaction prices have fallen from $22.92/Boe in the third quarter of 2008 to $13.67/Boe in the first quarter of 2010 • Evaluating multiple basins • Disciplined investment approach (1) Source: Bloomberg and other industry data. |
 18 Adjusted EBITDA Margins Improving • Cost of goods & services have historically tracked with commodity prices in the GOM • From 2000 thru 2007, Adj. EBITDA margins averaged 79% despite variable commodity prices • In 2009, margins were squeezed by high service costs and low commodity prices • Hurricane Ike caused service costs to remain high • Margin improvement in latter part of 2009 is expected to continue in 2010 |
 19 W&T Liquidity - Opportunities • Reduced debt by $200 million and ARO by $200 million • Cash balance at February 25, 2010 ~ $250 million • Revolver availability at February 25, 2010 = $262 million with $405 million borrowing base – We redrew the revolver to generate interest income that helps offset the effects of the interest rate swap |
 20 Key Drivers • Large acreage position • Operating in the Gulf of Mexico for 26 years • Strong cash flow & liquidity • Focus on achieving sustainable production and reserve growth • Improving operating metrics and margins • Growing staff to increase investment opportunities • Strong insider ownership • Solid and well positioned for the future |
 21 The following table presents a reconciliation of our consolidated net income to consolidated EBITDA to Adjusted EBITDA: We define EBITDA as net income (loss) plus income tax expense (benefit), net interest
expense (which includes interest income), depreciation, depletion,
amortization and accretion and impairment of oil and natural gas properties. Adjusted EBITDA excludes the loss on extinguishment of debt and the unrealized gain or loss related to our
derivative contracts. Although not prescribed under GAAP, we believe
the presentation of EBITDA and Adjusted EBITDA provide useful information regarding our ability to service debt and fund capital expenditures and they help our investors understand our
operating performance and make it easier to compare our results with those
of other companies that have different financing, capital and tax structures. EBITDA and Adjusted EBITDA should not be considered in isolation from or as a substitute for net income, as an indication of operating performance or cash flow from operating activities or as a measure of liquidity.
EBITDA and Adjusted EBITDA, as we calculate them, may not be comparable to
EBITDA and Adjusted EBITDA measures reported by other companies. In addition, EBITDA and Adjusted EBITDA do not represent funds available for discretionary use. 2000 2001 2002 2003 2004 2005 2006 2007 2008 2009 ($ in thousands) Net income 48,204 $ 63,569 $ 2,049 $ 116,582 $ 149,482 $ 189,023 $ 199,104 $ 144,300 $ (558,819) $ (187,919) $ Income taxes (benefit) -- -- 52,408 61,156 80,008 101,003 107,205 71,459 (269,663) (74,111) Net interest expense (income) 4,918 3,902 3,001 2,229 1,842 (1,601) 11,261 30,684 21,337 39,245 Depreciation, depletion, amortization and accretion 29,775 65,293 89,941 143,692 164,808 183,833 337,627 532,910 521,776 342,537 Impairment of oil and natural gas properties -- -- -- -- -- -- -- -- 1,182,758 218,871 EBITDA 82,177 132,764 147,399 323,659 396,140 472,258 655,242 779,353 897,389 338,623 Loss on extinguishment of debt -- -- -- -- -- -- -- 2,806 -- 2,926 Unrealized derivatives loss (gain) -- -- -- -- -- -- (13,476) 37,831 (13,501) 693 Adjusted EBITDA 82,177 $ 132,764 $ 147,399 $ 323,659 $ 396,140 $ 472,258 $ 641,766 $ 819,990 $ 883,888 $ 342,242 $ Year Ended December 31, Reconciliation of Net Income to EBITDA |
 22 Forward-Looking Statement Disclosure This presentation, contains “forward-looking statements” within the meaning of the Private Securities Litigation Reform Act of 1995, Section 27A of the Securities Act and Section 21E of the Exchange Act.
Forward-looking statements give our current expectations or forecasts of
future events. They include statements regarding our future operating and financial performance. Although we believe the expectations and forecasts reflected in these and other
forward-looking statements are reasonable, we can give no assurance they
will prove to have been correct. They can be affected by inaccurate assumptions or by known or unknown risks and uncertainties. You should understand that the following important
factors, could affect our future results and could cause those results or
other outcomes to differ materially from those expressed or implied in the forward-looking statements relating to: (1) amount, nature and timing of capital expenditures; (2) drilling of wells and other planned exploitation activities; (3) timing and amount of future production of oil and natural gas; (4)
increases in production growth and proved reserves; (5) operating costs such
as lease operating expenses, administrative costs and other expenses; (6) our future operating or financial results; (7) cash flow and anticipated liquidity; (8) our
business strategy, including expansion into the deep shelf and the deepwater
of the Gulf of Mexico, and the availability of acquisition opportunities; (9) hedging strategy; (10) exploration and exploitation activities and property acquisitions; (11) marketing of oil
and natural gas; (12) governmental and environmental regulation of the
oil and gas industry; (13) environmental liabilities relating to potential pollution arising from our operations; (14) our level of indebtedness; (15) timing and amount of future dividends;
(16) industry competition, conditions, performance and consolidation; (17)
natural events such as severe weather, hurricanes, floods, fire and earthquakes; and (18) availability of drilling rigs and other oil field equipment and services. We caution you not to place undue reliance on these forward-looking statements,
which speak only as of the date of this presentation or as of the date of
the report or document in which they are contained, and we undertake no obligation to update such information. The filings with the SEC are hereby incorporated herein by reference and qualifies the
presentation in its entirety. Cautionary Note to U.S. Investors The United States Securities and Exchange Commission permits oil and gas companies, in their filings with the SEC, to disclose only proved reserves that a company has demonstrated by actual production or conclusive formation tests to be economically and legally producible under existing economic and operating
conditions. U.S. Investors are urged to consider closely the
disclosure in our Form 10-K for the year ended December 31, 2007, available from us at Nine Greenway Plaza, Suite 300, Houston, Texas 77046. You can obtain these forms from the SEC by
calling 1-800-SEC-0330. |
 W&T Offshore, Inc. (NYSE: WTI) Nine Greenway Plaza Suite 300 Houston, TX 77046 Main line - 713-626-8525 Fax - 713-626-8527 Investor Relations - 713-297-8024 www.wtoffshore.com www.investorrelations@wtoffshore.com |
 Appendix |
 25 2010 Guidance and Capital Budget Estimated Production (1) Full-Year 2010 Crude oil (MMBbls) 4.6 – 6.2 Natural gas (Bcf) 32.4 – 42.8 Total (Bcfe) 60.0 – 80.0 Operating Expenses ($ in millions) Full-Year 2010 Lease operating
expenses
$168 – $206 Gathering, transportation & production taxes $14 – $18 General and administrative $43 – $47 (1) Includes the build up associated with the seven wells in the original 2010 Budget. |
 26 Hedging Strategy & Schedule • The Company has hedged 11.9 Bcf of its 2010 natural gas production and 1.27 MMBbls of its 2010 oil production – Hedges were put in place to augment the borrowing base and the 2010 drilling
budget – Natural gas production is hedged with floors as low as $5.00 and ceilings as high as $9.40 – Crude oil is hedged with floors as low as $65.00 and ceilings as high as $90.35 – We also have entered in a natural gas swap for 2010 for 730,000 MMBtu or 2,000 MMBtu/day (1) Includes 2,000 MMBtu/day for Swaps Note: Daily volumes may not foot to notional quantities due to rounding. 1Q 2010 2Q 2010 3Q 2010 4Q 2010 Natural Gas (MMBtu/day) Collars Volumes 51,056 34,648 16,799 19,911 Weighted Avg Price $5.00 - $5.94 $5.00 - $6.09 $5.00 - $6.60 $5.00 - $8.35 Crude Oil (Bbls/day) Collars Volumes 4,750 4,250 2,261 2,645 Weighted Avg Price $69.85 - $81.57 $69.84 - $83.82 $69.84 - $85.51 $69.74 - $86.22 Approximate Mcfe/d (1) 81,556 62,148 32,364 37,782 |