Attached files
| file | filename |
|---|---|
| EX-32.1 - EXHIBIT 32.1 - RCN CORP /DE/ | c97394exv32w1.htm |
| EX-31.1 - EXHIBIT 31.1 - RCN CORP /DE/ | c97394exv31w1.htm |
| EX-31.2 - EXHIBIT 31.2 - RCN CORP /DE/ | c97394exv31w2.htm |
| EX-23.2 - EXHIBIT 23.2 - RCN CORP /DE/ | c97394exv23w2.htm |
| EX-32.2 - EXHIBIT 32.2 - RCN CORP /DE/ | c97394exv32w2.htm |
| EX-23.1 - EXHIBIT 23.1 - RCN CORP /DE/ | c97394exv23w1.htm |
| EX-21.1 - EXHIBIT 21.1 - RCN CORP /DE/ | c97394exv21w1.htm |
| EX-10.41 - EXHIBIT 10.41 - RCN CORP /DE/ | c97394exv10w41.htm |
| EX-10.38 - EXHIBIT 10.38 - RCN CORP /DE/ | c97394exv10w38.htm |
| EX-10.35 - EXHIBIT 10.35 - RCN CORP /DE/ | c97394exv10w35.htm |
| EX-10.24 - EXHIBIT 10.24 - RCN CORP /DE/ | c97394exv10w24.htm |
| EX-10.22 - EXHIBIT 10.22 - RCN CORP /DE/ | c97394exv10w22.htm |
| EX-10.36 - EXHIBIT 10.36 - RCN CORP /DE/ | c97394exv10w36.htm |
| EX-10.37 - EXHIBIT 10.37 - RCN CORP /DE/ | c97394exv10w37.htm |
Table of Contents
UNITED STATES SECURITIES AND EXCHANGE COMMISSION
WASHINGTON, D.C. 20549
FORM 10-K
(Mark One)
| þ | ANNUAL REPORT PURSUANT TO SECTION 13 OR 15(d) OF THE SECURITIES EXCHANGE ACT OF 1934 |
For the fiscal year ended December 31, 2009
or
| o | TRANSITION REPORT PURSUANT TO SECTION 13 OR 15(d) OF THE SECURITIES EXCHANGE ACT OF 1934 |
For the transition period from to
Commission file number 1-16805

RCN Corporation
(Exact name of registrant as specified in charter)
| Delaware | 22-3498533 | |
| (State or other jurisdiction of | (I.R.S. Employer | |
| incorporation or organization) | Identification No.) | |
| 196 Van Buren Street, Herndon, VA | 20170 | |
| (Address of principal executive offices) | (Zip Code) |
Registrant’s telephone number, including area code:
(703) 434-8200
(703) 434-8200
Securities Registered Pursuant to Section 12(b) of the Act:
None
None
Securities Registered Pursuant to Section 12(g) of the Act:
Common stock, par value $0.01 per share
(Title of Classes)
Common stock, par value $0.01 per share
(Title of Classes)
Indicate by check mark if the registrant is a well-known seasoned issuer, as defined in Rule
405 of the Securities Act.
Yes o No þ
Indicate by check mark if the registrant is not required to file reports pursuant to Section
13 or Section 15(d) of the Act.
Yes o No þ
Indicate by check mark whether the registrant (1) has filed all reports required to be filed
by Section 13 or 15(d) of the Securities Exchange Act of 1934 during the preceding 12 months (or
for such shorter period that the registrant was required to file such reports), and (2) has been
subject to such filing requirements for the past 90 days. Yes þ No o
Indicate by check mark whether the registrant has submitted electronically and posted on its
corporate Web site, if any, every Interactive Data File required to be submitted and posted
pursuant to Rule 405 of Regulation S-T (§ 232.405 of this chapter) during the preceding 12 months
(or for such shorter period that the registrant was required to submit and post such files). Yes
o No o
Indicate by check mark if disclosure of delinquent filers pursuant to Item 405 of Regulation
S-K (§ 229.405 of this chapter) is not contained herein, and will not be contained, to the best of
registrant’s knowledge, in definitive proxy or information statements incorporated by reference in
Part III of this Form 10-K or any amendment to this Form 10-K. o
Indicate by check mark whether the registrant is a large accelerated filer, an accelerated
filer, a non-accelerated filer, or a smaller reporting company. See the definitions of “large
accelerated filer”, “accelerated filer” and “smaller reporting company” in Rule 12b-2 of the
Exchange Act. (Check one):
| o Large accelerated filer | þ Accelerated filer | o Non-accelerated filer | o Smaller reporting company |
Indicate by check mark whether the registrant is a shell company (as defined in Rule 12b-2 of
the Exchange Act.):
Yes o No þ
The aggregate market value of the outstanding common stock of the Registrant held by
non-affiliates as of June 30, 2009 based on the closing price of $9.30 on the NASDAQ was $243.8
million. Shares reported on Schedule 13D or 13G as being beneficially owned by a holder or group of
holders who collectively beneficially own 15% or more of the registrant’s outstanding common stock
have been excluded from such calculation. Such exclusion, however, shall not constitute an
admission that such persons possess the power to direct or cause the direction of the management
and policies of the registrant. There were 35,276,955 shares of voting common stock with a par
value of $0.01 outstanding at March 3, 2010.
Indicate by check mark whether the registrant has filed all documents and reports to be filed
by Sections 12, 13 or 15(d) of the Securities Exchange Act 1934 subsequent to the distribution of
securities under a plan confirmed by a court. Yes þ No o
DOCUMENTS INCORPORATED BY REFERENCE
Pursuant to General Instruction G(3) to Form 10-K, the information required by Part III of this Annual Report on Form
10-K will be filed by amendment with the Securities and Exchange Commission within 120 days of the end of the
Registrant’s year ended December 31, 2009.
RCN CORPORATION AND SUBSIDIARIES
For the year ended December 31, 2009
Table of Contents
For the year ended December 31, 2009
Table of Contents
| Page | ||||||||
| 4 | ||||||||
| 17 | ||||||||
| 21 | ||||||||
| 21 | ||||||||
| 21 | ||||||||
| 21 | ||||||||
| 21 | ||||||||
| 23 | ||||||||
| 24 | ||||||||
| 34 | ||||||||
| 35 | ||||||||
| 35 | ||||||||
| 35 | ||||||||
| 36 | ||||||||
| 36 | ||||||||
| 36 | ||||||||
| 36 | ||||||||
| 36 | ||||||||
| 36 | ||||||||
| 37 | ||||||||
| S-1 | ||||||||
| E-1 | ||||||||
| F-1 | ||||||||
| Exhibit 10.22 | ||||||||
| Exhibit 10.24 | ||||||||
| Exhibit 10.35 | ||||||||
| Exhibit 10.36 | ||||||||
| Exhibit 10.37 | ||||||||
| Exhibit 10.38 | ||||||||
| Exhibit 10.41 | ||||||||
| Exhibit 21.1 | ||||||||
| Exhibit 23.1 | ||||||||
| Exhibit 23.2 | ||||||||
| Exhibit 31.1 | ||||||||
| Exhibit 31.2 | ||||||||
| Exhibit 32.1 | ||||||||
| Exhibit 32.2 | ||||||||
2
Table of Contents
Cautionary Statements Regarding Forward-Looking Statements
Certain of the statements contained in this Form 10-K (“Annual Report”) constitute
“forward-looking statements” within the meaning of the Private Securities Litigation Reform Act of
1995. These forward-looking statements reflect the current views of RCN Corporation (“RCN” or the
“Company”) with respect to current events and financial performance. You can identify these
statements by forward-looking words such as “may,” “will,” “expect,” “intend,” “anticipate,”
“believe,” “estimate,” “plan,” “could,” “should,” and “continue” or similar words. These
forward-looking statements may also use different phrases. From time to time, RCN also provides
forward-looking statements in other materials RCN releases to the public or files with the
Securities and Exchange Commission (“SEC”), as well as oral forward-looking statements. You should
consult any further disclosures on related subjects in RCN’s Quarterly Reports on Form 10-Q and
Current Reports on Form 8-K filed with the SEC.
While we believe the judgments we have made with respect to forward-looking statements are
reasonable, you should understand that these statements are not guarantees of future performance or
results and such forward-looking statements are and will be subject to many risks, uncertainties
and factors, which may cause RCN’s actual results to be materially different from such
forward-looking statements. Factors that could cause RCN’s actual results to differ materially from
these forward-looking statements include, but are not limited to, the following:
| • | our ability to operate in compliance with the terms of our financing facilities (particularly the financial covenants); |
| • | our ability to maintain adequate liquidity and produce sufficient cash flow to fund our capital expenditures and debt service; |
| • | our ability to attract and retain qualified management and other personnel; |
| • | our ability to maintain current price levels; |
| • | our ability to acquire new customers and retain existing customers; |
| • | changes in the competitive environment in which we operate, including the emergence of new competitors and the effect of competition in our markets; |
| • | changes in government and regulatory policies; |
| • | deterioration in and uncertainty relating to economic conditions generally and, in particular, affecting the markets in which we operate; |
| • | pricing and availability of equipment and programming; |
| • | our ability to obtain regulatory approvals and to meet the requirements in our license agreements; |
| • | our ability to complete acquisitions or divestitures and to integrate any business or operation acquired; |
| • | our ability to enter into strategic business relationships; |
| • | our ability to overcome significant operating losses; |
| • | our ability to expand our operating margins; |
| • | our ability to develop products and services and to penetrate existing and new markets; |
| • | technological developments and changes in the industry; and |
| • | the risks discussed in Part 1, Item 1A “Risk Factors” below. |
Statements in this Annual Report and the exhibits to this report should be evaluated in light
of these important factors, and you should not unduly rely on these forward-looking statements. RCN
is not obligated to, and undertakes no obligation to publicly update any forward-looking statement
due to actual results, changes in assumptions, new information or future events.
3
Table of Contents
PART I
| ITEM 1. | BUSINESS |
Introduction
RCN is a competitive broadband services provider, delivering all-digital and high-definition
video, high-speed internet and premium voice services to Residential and Small and Medium Business
(“SMB”) customers under the brand names of RCN and RCN Business Services, respectively. In
addition, through our RCN Metro Optical Networks business unit (“RCN Metro”), we deliver
fiber-based high-capacity data transport services to large commercial customers, primarily large
enterprises and carriers, targeting the metropolitan central business districts in our geographic
markets. We construct and operate our own networks, and our primary service areas include:
Washington, D.C., Philadelphia, Lehigh Valley (PA), New York City, Boston and Chicago.
Our RCN and RCN Business Services network passes over 1.4 million marketable homes and
businesses, and we currently have licenses to provide video services to over 5 million licensed
homes and businesses in our footprint. We serve approximately 429,000 residential and SMB
customers.
RCN Metro also has numerous points of presence in other key cities from Richmond, Virginia to
Portland, Maine. RCN Metro currently enters approximately 1,500 locations through our own diverse
fiber facilities, providing connectivity to private networks, as well as telecommunications carrier
meet points, and local exchange central offices owned and operated by other carriers. Our RCN
Metro fiber routes now total approximately 10,000 route miles, with thousands of additional commercial
buildings on or near our network. We also have approximately 335,000 fiber strand miles, which highlights
the fact that many of our metro and intercity rings are fiber-rich.
Subsequent to the Company’s acquisition of NEON Communications Group, Inc. (“NEON”) in
November 2007, management reorganized RCN’s business into two key segments: (i) Residential/SMB and
(ii) RCN Metro. There is substantial managerial, network, operational support and product overlap
between the Residential and SMB businesses and, as a result, we had historically reported these two
businesses as one segment. RCN Metro, however, is managed separately from the other two business
units, with separate network operations, engineering, and sales personnel, as well as separate
systems, processes, products, customers and financial measures. Management of the Company’s two
key businesses is unified only at the most senior executive levels of the Company. Therefore,
beginning with the results of operations for 2008, the financial results of the RCN Metro business
unit are reported as a separate segment in accordance with the requirements in the Financial
Accounting Standards Board (“FASB”) Accounting Standards Codification (“ASC”) Topic 280 Segment
Reporting (“ASC Topic 280”). All prior period amounts in this Report have been restated to present
the results as two separate reportable segments. For financial and other information about our
segments, refer to Item 8, Note 15 to our Consolidated Financial Statements included in this Annual
Report on Form 10-K.
RCN is a Delaware corporation formed in 1997. Our principal executive office is located at 196
Van Buren Street, Suite 300, Herndon, Virginia 20170, and our telephone number is (703) 434-8200.
Available Information and Websites
The public may read and copy any materials we file with the SEC at the SEC’s Public Reference
Room at 100 F Street, NE, Washington, D.C. 20549. The public may obtain information on the
operation of the Public Reference Room by calling the SEC at 1-800-SEC-0330. Our annual reports on
Form 10-K, quarterly reports on Form 10-Q, current reports on Form 8-K and any amendments to such
reports filed with or furnished to the SEC pursuant to Sections 13(a) or 15(d) of the Securities
Exchange Act of 1934, as amended (the “Exchange Act”) are available free of charge on the SEC’s web
site at www.sec.gov and on our web site at www.rcn.com as soon as reasonably practicable after such
reports are electronically filed with the SEC. The information posted on our web site is not
incorporated into our SEC filings.
General Development of Business
The following are some of the more significant developments in our business during 2009:
| • | Consolidated revenue of $763.8 million, representing 3.3% growth compared to 2008, comprised of 1.1% growth in our Residential/SMB segment and 10.7% growth in our RCN Metro segment |
4
Table of Contents
| • | Consolidated Operating Income before depreciation and amortization, stock-based compensation, exit costs and restructuring charges of $218.8 million, representing 12.7% growth compared to 2008, comprised of 6.8% growth in our Residential/SMB segment and 30.0% growth in our RCN Metro segment |
| • | Significant growth in cash flow, as net cash provided by operating activities increased by $12.9 million, and additions to property, plant and equipment decreased by $25.0 million, driving the combined balance of our cash and cash equivalents plus short-term investments to $86.9 million |
| • | Completion of Project Analog Crush in all of our Residential/SMB markets; RCN is now 100% digital in all markets, a first among major market MSO’s |
| • | Launched DOCSIS 3.0 in New York during the quarter ended December 31, 2009 |
| • | Repurchased approximately 1.3 million shares at an average price of $5.49 per share; program-to-date, approximately 2.6 million shares have been repurchased, representing nearly 7% of the total outstanding shares, at an average price of $7.10 per share |
Description of our Businesses
Residential / SMB Segment
In 2009, our Residential/SMB segment generated approximately 75% of our consolidated revenues
(see Note 15 “Financial Data by Business Segment” to our Consolidated Financial Statements).
Through our RCN and RCN Business Services business units, we offer video, telephone, and high-speed Internet products to residential and SMB customers.
Customers can purchase our products on an a la carte basis, or they may choose to bundle multiple
services into a single subscription with single billing and a single point of installation and
support. Customers who bundle services typically receive those services at a discount to the sum of
the a la carte prices of the individual products. Our bundle approach reduces operating costs due
to efficiencies in customer care, billing, and support, and we believe offers our customers a
greater value. Approximately 67% of our current customer base purchases bundled products.
Video Services
Our video service delivers multiple channels of television programming to subscribers who pay
a monthly recurring fee. Subscription rates and other related charges vary depending on the type
of service selected and equipment used by the subscriber. We offer varied channel line-ups in each
system serving a particular geographic market. Channel offerings are in accordance with applicable
local and federal regulatory requirements and are also based on programming preferences and
demographics in each of our markets. We receive television signals delivered from television
networks over-the-air, by fiber-optic transport, or via satellite delivery to our antennas,
microwave relay stations and satellite earth stations. We aggregate and organize these signals in
our technical facilities and deliver a specified lineup of programming services to our subscribers
in an all-digital format.
Our video services include:
| • | Basic and Signature Services: Our video customers receive a package of basic programming that generally consists of local broadcast television stations, local community programming (including governmental and public access), and limited satellite-delivered or non-broadcast channels. The basic channel line-up generally includes up to 50 channels. Our “Signature” or expanded basic programming package includes approximately 150 additional channels, including many popular regional and national cable networks. Both of these service levels are delivered in a 100% digital viewing format for all customers. |
| • | Enhanced Digital Services: We offer additional programming content to customers who desire broader programming choices through our “Premiere” service package, which includes nearly a hundred additional channels, such as special interest networks, movie and entertainment networks. |
| • | Premium Channels: Our customers can also purchase premium movie and entertainment channels, such as Showtime, HBO, Starz, and Encore on an a la carte basis for a monthly fee. All such services include related video on demand content as part of the monthly subscription. We also provide foreign language programming for an additional monthly fee. |
5
Table of Contents
| • | High-Definition Television (“HDTV”): Our HDTV service provides customers who utilize advanced digital set-top boxes with improved, high-resolution picture quality, improved audio quality and a wide screen format. We currently offer our HDTV customers 100+ high-definition channels in most areas, including most broadcast networks, leading national cable networks, regional sports networks, and premium channels. In addition, our HDTV customers have access to selected VOD content in high-definition format. |
| • | Video on Demand (“VOD”) and Subscription Video on Demand (“SVOD”): Our VOD service provides customers with access to an extensive library of movies and other television content with control over the timing and playback of that content. A substantial portion of this content is free to our customers, and we continue to expand our library as more content becomes available. RCN also offers SVOD services which provide our customers with on demand access to additional content that is either associated with premium content to which they subscribe, or made available for an additional fee. |
| • | Digital Video Recorder (“DVR”): RCN offers a dual-tuner High-Definition DVR set-top box that allows our customers to record one program while viewing another whether it is recorded in standard definition or high-definition. DVR technology affords the ability to our customers to digitally record, store and play television programs without the inconvenience of tapes or DVDs. In 2009, RCN entered into an agreement with TiVo Inc. whereby RCN will offer co-branded, uniquely configured TiVo High Definition DVRs to its Residential and SMB customers. Expected to launch in the second quarter of 2010, the RCN TiVo DVR is a truly innovative convergence of video and broadband programming controlled through a single user interface that is simple, intuitive, and dramatically different from that of other DVRs. The RCN TiVo DVR will give customers a first of its kind video experience by fully integrating RCN’s digital programming and VOD library with a wide variety of broadband delivered video programming, providing access to a vast library of programming not available through traditional cable or satellite services. |
| • | Pay-Per-View (“PPV”): Our PPV service provides customers with the ability to order, for a separate fee, movies as well as “Big Event” programming such as sporting events or music concerts on an unedited, commercial-free basis. |
| • | Lehigh Valley Studio: We operate a video production studio located in Lehigh Valley, Pennsylvania, where we produce sports, news, and entertainment programs focused on community and local interest in our markets. Much of this RCN-produced content is made available on an on-demand basis through our VOD platform. |
| • | Bulk Video Services: We provide video services to hotels, hospitals, universities, and other organizations seeking to deliver multiple video connections by means of a single relationship with a video provider. |
High-Speed Data Services
We offer high-speed Internet services to residential and SMB customers at download speeds
ranging from 1.5 megabits per second (“Mbps”) to 20 Mbps in all of our markets, and up to 60 Mbps
in selected markets. Our data services include Internet
access, email and webmail, Internet security, and other web-based services.
Voice Services
We provide local, long distance, and international voice telephone services. We offer a full
range of calling plans that generally include unlimited local, regional, and long distance calling
with a variety of calling features. Our voice service features include voicemail, caller
identification, call waiting, call forwarding, 3-way calling, 911 access, operator services, and
directory assistance. We provide voice services through a traditional, switched platform to our
legacy phone customers, and for our newer phone customers, including all new installations, we use
a “digital phone” architecture that transmits data signals over our broadband network between the
customer premises and an RCN switch, which then interfaces with the public switched telephone
network.
RCN and RCN Business Services Network
Our RCN and RCN Business Services network architecture consists of a hybrid-fiber-coax network
predominantly designed and built to support a bandwidth of 860 Megahertz. This architecture
enables us to offer video, high-speed data, and local and long distance voice services to customers
over a common network infrastructure. Our network also supports two-way interactive services such
as VOD and linear pay-per-view services, as well as higher bandwidth high-definition video
services. The conversion to an all-digital video platform has allowed us to reallocate bandwidth
on our network and to launch expanded and enhanced programming services.
Our distribution network relies on service nodes, which receive video, data and voice signals
from our fiber optic network and transmit those signals along our coaxial “last mile” distribution
cables to customers’ premises. Our fiber cable entering any particular service node typically
reaches to within 1,000 feet of the customers’ premises, and the node service area typically
consists of approximately 150 homes or small business locations. This small node service area
combined with the deep fiber architecture provides for better operational performance of our
network and also provides higher bandwidth per home than the traditional network design of other
cable and telecommunication service providers.
6
Table of Contents
Our data network consists of the networking and computer equipment required to provide
complete internet service provider (“ISP”) services to both our residential and SMB customers. We
maintain an Internet backbone network that is used to interconnect to both settlement-free and
settlement-based carriers. During the fourth quarter of 2009, we launched DOCSIS 3.0 in our New
York market, offering download speeds of up to 60Mbps and upload speeds of up to 10Mbps. We expect
to deploy DOCSIS 3.0 in our remaining markets over the next 18 months, which will include upgrades
enabling us to offer even higher upload and download speeds.
We also maintain a carrier grade voice network that is capable of delivering high-quality
voice services to residential and SMB customers. We provide voice services to our legacy phone
customers through a traditional, circuit-switched platform, which uses our fiber-optic backbone facilities
with synchronous optical network (“SONET”) transport electronics to provide interconnection from
the RCN local telephony switch to the telephony distribution electronics. Our circuit-switched
voice network provides primary line service with full interconnection to the local emergency 911
centers and includes reserve batteries in the network or at the customers premise to provide backup
power in the event of a commercial power outage. For our newer phone customers, including all new
installations, we use a “digital phone” architecture that transmits data signals over our broadband
network between the customer premises and the RCN local telephony switch, which then interfaces
with the public switched telephone network. During 2009, we purchased a MetaSwitch SoftSwitch, to
begin our migration to an all-IP telephony platform. Residential customers will see the benefits
of an enhanced calling feature set, including advanced voicemail and messaging services, while SMB
customers will have access to a full suite of business grade
features, as well as Hosted IP PBX and
SIP Trunking. We expect to begin deployment of the SoftSwitch platform during the second quarter
of 2010 in our New York Market, with additional deployments expected in our remaining markets over
the next two years.
Customer Service
Customer service is an essential element of our business. We provide customer support for
routine customer technical and billing questions through third party outsourcing providers, which
utilize domestic U.S. and international customer care professionals. More advanced customer
questions and technical problems are handled by RCN employees, either in our centralized call
center locations in Pennsylvania or the local markets we serve. We also provide certain customer
service functions via the Internet.
Sales and Marketing
We sell our products through a variety of channels, including inbound and outbound telesales
(which account for the majority of our sales), local direct sales representatives, customer care
representatives, and our e-commerce platform. We use targeted marketing techniques to generate
interest in our products, including direct mail (which accounts for the majority of our marketing
spend), radio, television and print advertising, as well as local market promotions directed at
specific multi-dwelling units and well-attended entertainment and sporting events. We also use
search engine marketing and customer referrals to market our products. Since our serviceable area
is typically smaller than the overall media footprint in the metro markets we serve, we tend to
focus more on direct mail and targeted local tactics rather than broader sources of media.
Pricing of Our Products and Services
Our revenues are generated principally from the monthly fees paid by our customers for
services we offer. We also earn revenue from fees for services other than our delivery of
traditional video programming packages, such as Pay-Per-View services, certain subscription-based
and transactional VOD offerings, and certain Internet broadband services. We price our services to
promote sales of bundled packages, primarily through volume discounts and other promotions. An
installation fee is generally charged to new and reconnected customers. We also charge monthly fees
for customer premise equipment. We have historically increased our prices by varying amounts based
upon the increase in costs of programming services we purchase from networks.
Competition
We compete with a wide range of service providers in each market, including incumbent local
exchange carriers (“ILECs”), incumbent multiple system cable operators (“MSOs”), Direct Broadcast
Satellite (“DBS”) providers, wireless providers and competitive telecommunications and Internet
service providers. In recent years, competition has increased significantly for video, voice and
data services in our markets, and we believe it will continue to intensify in the future. Our
primary competitors, particularly Comcast, Time Warner, Verizon and AT&T possess significantly
greater financial resources than we do, which they are using to fund substantial network expansions
and upgrades, as well as product and service enhancements, and because we are presently unable to
match this level of overall investment, we rely on our ability to provide more personalized and
effective services to our customers and to operate more efficiently to compete against these
companies.
7
Table of Contents
Our primary competition for video services consists of incumbent MSOs and ILECs named above in
our metro markets, Service Electric in Lehigh Valley, PA, and the DBS providers, DirecTV and Dish
Network. We also, to a lesser degree, compete with interactive broadband services, wireless and
other emerging technologies that provide for the distribution and viewing of video programming, as
well as home video products.
Our primary competition for voice and high-speed Internet services consists of incumbent MSOs
and ILECs named above in our metro markets, Service Electric in Lehigh Valley, PA, Competitive
Local Exchange Carriers (“CLECs”), VoIP service providers, and wireless providers.
Sources of Supply
To provide video service, we purchase programming content from a number of networks. Our
programming contracts generally continue for a fixed period of time and are subject to periodic,
negotiated renewal, and we generally pay a monthly license fee based on the number of subscribers
who access the programming. Some content providers offer financial incentives to support the
launch of a channel and/or ongoing marketing efforts. For shopping and certain VOD and
Pay-Per-View services, we receive a percentage of the amount that our customers spend from the
content providers.
In an effort to achieve greater purchasing power, we purchase some of our programming content
through the National Cable Television Co-op (“NCTC”), a cooperative buying organization that
provides volume discounts to its members on programming purchased through the NCTC. The remainder
of our programming is the result of direct agreements with the programmers. Our programming costs
have increased every year we have operated and we expect them to continue to increase due to a
variety of factors, including annual rate increases required under existing contracts, increases
from programming agreement renewals, increases resulting from enhancements to existing channel
content, and increases from the addition of new channels.
We also rely heavily on a limited number of key vendors for the infrastructure and software
needed to run our network, including customer premise equipment.
RCN Metro Segment
In 2009, our RCN Metro segment generated approximately 25% of our consolidated revenues (see
Note 15 “Financial Data by Business Segment” to our Consolidated Financial Statements). Through our
RCN Metro segment, we offer commercial transport products and services to large enterprise and
carrier customers. We distinguish RCN Metro in our markets by offering high-bandwidth,
high-availability, diverse and redundant solutions for our customers, as well as superior customer
service and technical responsiveness. Our RCN Metro network includes numerous unique fiber routes,
making us an attractive provider of telecommunications services to critical customer locations that
require redundant and diverse communications solutions.
Our enterprise customers are generally large corporations, financial, healthcare and
educational institutions, and government agencies seeking high-bandwidth data transport services.
We target Fortune 1000 companies and work closely with enterprise clients to develop custom
telecommunications solutions that leverage our network and operational expertise. We have
developed significant expertise in meeting the telecommunications needs of financial services
firms, with several stock exchanges and major banks among our customers. Enterprise customers
represent approximately 40% of RCN Metro’s revenue.
Our carrier customers are telecommunications services companies, including ILEC’s, CLEC’s, and
other service providers, who utilize our services to provide redundancy for their own networks and
to develop customer-specific applications. Wireless communications providers are among our largest
carrier customers, to whom we provide backhaul transport services to aggregate traffic from their
geographically-dispersed cell sites and switch sites. Carrier customers represent approximately
60% of RCN Metro’s revenue.
8
Table of Contents
RCN Metro Products
Our commercial product offerings include metro and intercity SONET, dense wavelength division
multiplexing (“DWDM”), and Ethernet based transport services, co-location services, and IP
services. Following the initiation of RCN Metro service to a customer in any building, we target
other potential customers in that building to deliver higher margin, incremental products and
services to multiple customers located in that building.
| • | Transport Services: We provide SONET and Ethernet-based data transport services both within our metro markets and between cities over our intercity fiber network. Specific service offerings include: SONET Private Line services at bandwidth levels including DS-1, DS-3, OC-3, OC-12, OC-48, and OC-192; Wavelength (DWDM) services enabling flexible and scalable high-capacity transport at 1.25, 2.5 and 10 Gbps; and Ethernet services via dedicated, point-to-point as well as point-to-multipoint connectivity. We offer these services utilizing a variety of equipment platforms, enabling us to deliver services to customers in their preferred telecommunications architecture, including Cisco, Nortel, Lucent, and Ciena equipment. |
| • | Co-Location Services: We offer co-location services to our customers by maintaining secured and monitored technical space in the same facilities as several of our larger network operations locations. We offer full disaster recovery and data back-up capabilities in facilities that help assure maximum server and data availability, as well as customized monitoring, maintenance and hosting services, and provide cost-effective pricing for customers who desire to combine co-location and hosting services with our data transport services. |
| • | Internet Access: Our Internet access offerings include dedicated access services targeted at businesses that desire single or multipoint high-speed, dedicated connections to the Internet. Our dedicated Internet access service provides internet speeds of up to a Gigabit per second. We maintain numerous public and private peering arrangements with other Internet backbone networks in our geographic footprint. |
RCN Metro Network
RCN Metro’s network is a fiber-based, highly redundant, survivable network optimized to
deliver carrier grade telecommunications services to enterprise and carrier customers. The RCN Metro fiber-optic network is comprised of fiber owned by RCN and fiber leased from third party providers,
typically under long-term leases. The majority of RCN Metro’s fiber route miles are leased, while the majority of RCN
Metro’s fiber strand miles are owned. In several of our markets, the majority of our commercial fiber cable deployed is placed in entirely separate conduit
facilities from those of the incumbent service providers, providing a major competitive
differentiator and selling point for our enterprise and carrier
customers. In other cases, we
utilize the rights-of-way provided by incumbent telecommunications and utility providers, or our
own facilities in public rights-of-way. The acquisition of NEON substantially extended the reach
of our RCN Metro network, adding intercity transport routes that extend from Maine to Virginia.
Several of these newly added routes follow geographic paths that are diverse from the I-95 corridor
along which many of the industry’s existing north-south telecommunications facilities traditionally
follow.
A substantial majority of our RCN Metro revenue is earned using network routes and equipment
that are distinct from our RCN and RCN Business Services network assets. We are able, however, to
leverage the deeply penetrated fiber footprints of our RCN and RCN Business Services networks to
deliver high-bandwidth enterprise and carrier products to additional locations. In addition, we
maintain two separate RCN Metro network operations centers, staffed by telecommunications engineers
and operations professionals trained specifically to support RCN Metro customers. Finally, the
design, installation, support, and disconnection of RCN Metro services are performed by
technicians trained specifically to work in our RCN Metro network environment. We utilize common
back-office support services with our RCN and RCN Business Services units to obtain
cost efficiencies while maintaining our focus on enterprise and carrier customers.
Our RCN Metro network was designed to provide highly redundant fiber facilities between key
customer locations within the central business districts of the major cities and regions in which
we operate. Our fiber network is comprised of approximately 10,000 miles of fiber cable routes, offering
approximately 335,000 fiber miles of network capacity. Our services are delivered over fiber optic cable
installed, monitored, and maintained entirely by RCN. We currently deliver fiber-based
communications services to approximately 1,500 on-net locations, including connections to more than
144 ILEC central offices and 24 co-location facilities.
Sales and Customer Support
We rely primarily on a direct sales strategy to sell our enterprise and carrier services,
supplemented by referrals from our other business units and key vendors. We distinguish our
commercial offerings by combining attractive pricing, industry leading reliability and redundancy,
a large number of diverse network routes, and a customer-focused support and care orientation. We
provide our customers with dedicated customer account managers to support technical and billing
inquiries.
Pricing
Our RCN Metro services are typically priced on an individual case basis, although we maintain
standard rates for certain products in existing locations. We strive to maintain pricing that is
competitive with, or superior to, the prices available from competing telecommunications providers.
Pricing is predominantly driven by a combination of the volume of business conducted by a customer
with RCN Metro, the prevailing market rate for the applicable services, RCN Metro’s construction
and other costs incurred to provide the services, and RCN Metro’s internal thresholds for return on
capital investments.
9
Table of Contents
Competition
Our RCN Metro business unit competes against the largest ILECs, CLECs, and other data
transport providers, including Verizon Business, AT&T, Qwest, Level 3 Communications, and AboveNet.
The ILECs, in particular, have significant advantages over RCN Metro, including greater capital
resources, local networks in many markets where we do not have facilities, and longstanding
customer relationships, particularly in buildings that we have not previously serviced. We also
face competition from smaller competitive access providers, CLECs and other new entrants. We seek
to distinguish our products by offering diverse network paths, redundancy, superior care and
technical responsiveness, and value-added product offerings, such as co-location, tailored to the
needs of our customers.
Regulation
Overview
Telecommunications and cable television operators are subject to extensive regulation by the
Federal Communications Commission (“FCC”), state Public Utilities Commissions (“PUCs”), and Local
Franchise Authorities (“LFAs”). These regulations affect the manner in which we operate our
business and can also have direct and indirect impacts on our costs of operation and profitability.
Set forth below is a summary of significant federal, state, and local existing and proposed
regulations and legislation that may affect our provision of video, data and voice services. Other
aspects of existing federal regulations, copyright licensing, and, in many jurisdictions, state and
local franchise and telecommunications regulatory requirements, are also subject to judicial
proceedings, legislative hearings and administrative proposals that could change, in varying
degrees, the operations of telecommunications companies such as ours.
Regulation of Video Services
Cable Television Systems
Our cable television systems are subject to Federal regulation under the Communications Act of
1934, as amended by, among other things, the Cable Television Consumer Protection and Competition
Act of 1992, and the Telecommunications Act of 1996 (the “Communications Act”). The Communications
Act regulates, among other things, broadcast signal carriage requirements that allow local
commercial television broadcast stations to require a cable system to carry the station. Local
commercial television broadcast stations may elect once every three years to require a cable system
to carry the station (“must-carry”), subject to certain exceptions, or to withhold consent and
negotiate the terms of carriage (“retransmission consent”). A cable system generally is required to
devote up to one-third of its activated channel capacity for the carriage of local commercial
television stations whether under the must-carry or retransmission consent requirements of the
Communications Act. The Communications Act also permits LFAs to require cable operators to set
aside certain channels for public, educational and governmental
(“PEG”) programming. Cable systems with 36 or more channels must also make available a portion
of their channel capacity for commercial leased access by third parties to provide programming that
may compete with services offered by the cable operator. Local non-commercial television stations
are also given mandatory carriage rights. Our FCC licenses also include certain earth station
radio licenses pursuant to which we operate our cable head-end equipment.
Because cable communications systems use local streets and rights-of-way, they are generally
also subject to state and local regulation, typically imposed through the local franchising process
and by local cable regulatory ordinances. The terms and conditions of state or local government
franchises vary from jurisdiction to jurisdiction. Generally, they contain provisions governing
franchise fees, monetary and in-kind contributions to PEG channels and services, franchise term,
time limitations on commencement and completion of construction, system technical standards, and
other conditions of service, including the number of PEG channels, the provision of free cable
and/or broadband service to schools and other public institutions, liquidated damages and the
maintenance of insurance and indemnity bonds, maintenance obligations, customer service standards,
franchise renewal, sale or transfer of the franchise, use and occupancy of public streets, and
types of cable services provided. LFAs may not award exclusive franchises within their
jurisdictions. The Communications Act also provides that, in granting or renewing franchises, LFAs
may establish requirements for cable-related facilities and equipment, but may not regulate video
programming content other than in broad categories. From time to time a LFA may amend its local
cable ordinances or we may disagree with a LFA as to our obligations under our franchise or the
cable ordinance, the outcome of which could have a material effect on our results of operations.
10
Table of Contents
We have approximately 121 cable franchises and open video system (“OVS”) agreements, permits
and similar authorizations (“franchise agreements”) issued by local, state and federal government
authorities.
OVS
In some jurisdictions, we provide cable television programming as an OVS provider pursuant to
certificates issued to us by the FCC. The OVS framework is an alternative regulatory structure,
established at the federal level, for operators providing multi-channel video service to
subscribers. Although exempted by federal law from some of the regulations that apply to cable
operators, the FCC rules require OVS operators to make channel capacity on the system available to
unaffiliated video programming providers (“VPPs”). We have provided VPPs with notice of the
opportunity to obtain capacity on our operational OVS systems, but to date no VPP has requested
carriage on any of our systems. OVS networks, like cable systems, are also subject to local
regulation for use of local streets and rights-of-way. We have entered into franchise or other
agreements with each of the municipalities where we offer OVS services that provide for the payment
of the fees and carriage of PEG channels required by the federal Communications Act. The terms and
conditions of our OVS agreements vary from jurisdiction to jurisdiction, but generally contain
provisions governing gross receipts fees, term, PEG channel and funding requirements, and other
right-of-way management requirements similar to those in our cable franchises. Local cable
ordinances may also regulate certain aspects of our OVS service, and OVS operators are also subject
to the same requirements as cable operators with regard to retransmission consent and must-carry,
carriage of non-commercial television stations, and certain other programming-related regulatory
requirements, as well as other cable-related FCC regulations.
Cable and OVS Regulation
Our existing cable and OVS Franchise Agreements expire at varying times. Prior to the
scheduled expiration of most Franchise Agreements, we initiate renewal proceedings with the
granting authorities, and historically, our Franchise Agreements that have reached their expiration
dates have been renewed or extended. The Communications Act provides for a cable license renewal
process in which granting authorities may not unreasonably withhold cable franchise renewals. Our
OVS authorizations are issued by the FCC, which would provide a forum for appeal if a LFA were to
unreasonably withhold a renewal of an OVS agreement. Currently, several of our cable franchises in
the eastern Pennsylvania and Boston markets and our New York City OVS agreement are beyond their
stated expiration dates but are continuing under their existing terms and conditions during renewal
negotiations. Although we cannot be certain that we
will be able to renew these or other Franchise Agreements on acceptable terms, our experience
and the experience of other cable providers has been that, absent any significant disputes as to
compliance with the prior agreement, Franchise Agreements are generally renewed on substantially
similar terms upon expiration by mutual agreement between the LFA and the provider.
The Communications Act limits franchise fees to 5% of gross revenues derived from the
provision of cable services. Accordingly, most Franchise Agreements require us to pay the granting
authority a fee of up to 5% of our gross cable service revenues earned in the franchised territory.
We are entitled to and generally pass this fee through to our customers. In addition, franchises
generally provide for monetary or in-kind capital contributions to support PEG services (“PEG
Fees”). In our OVS markets, we are required to match the franchise and PEG Fees paid by incumbent
operators. Those PEG Fees typically range from 1% to 3% of gross revenues or are assessed on a
“per subscriber” basis and often include “in kind” services, such as the dedication of fiber
facilities for use by the franchise authority and other PEG entities. However, certain
jurisdictions have adopted flat rate contributions rather than a rate based on revenues or numbers
of subscribers. In flat rate jurisdictions, we are at a cost disadvantage compared to larger cable
systems that pay a lower effective per subscriber fee.
The FCC recently adopted an order that would place a cap of 5%, inclusive of all PEG Fees, on
the fees paid by new cable entrants. A subsequent FCC order affords similar relief to existing
operators, like RCN, at the time their existing franchise agreements are renewed. These orders may
give new cable providers who may enter certain of our markets a temporary cost advantage over us
and other existing cable operators, since the new entrants will pay a maximum of 5% and not have to
contribute the additional PEG Fees and in-kind contributions assessed on existing operators in the
market for the period until their current franchise agreements expire.
A number of state legislatures, including several in our service areas, have adopted
legislation that is intended to facilitate new entry into the cable market. Where such “statewide
franchise” laws are adopted, the FCC will defer to the state with respect to franchise procedures.
Like the FCC franchise orders, these laws generally enable new operators to enter our markets more
quickly than they would have been able to do under the traditional franchise procedures. However,
these new “statewide franchise” procedures will also be available to us to facilitate our expansion
into new service areas and, like the FCC orders, may also facilitate and lessen the obligations
imposed by LFAs in our future renewal processes.
11
Table of Contents
In addition, the FCC has adopted several “net neutrality” principles that assure access by
consumers to their choice of Internet content, connection equipment, and applications without
unreasonable restrictions by cable, broadband and other network providers. We are committed to
compliance with the FCC’s net neutrality requirements. However, the FCC has undertaken a
proceeding in which it will determine whether to adopt more comprehensive net neutrality rules and
regulations that would affect the manner in which we manage our broadband network which, if
adopted, could impose significant costs on us and restrict the manner in which we conduct our
business. The FCC has received thousands of public comments on all sides of the issue and we
cannot predict whether the FCC will adopt regulations or how, if adopted, they will affect our
business.
The FCC is also undertaking a review of the broadband market in the United States pursuant to
the American Recovery and Reinvestment Act of 2009 and developing a National Broadband Plan (“FCC
Broadband Plan”) that will “seek to ensure that all people of the United States shall have access
to broadband capability and shall establish benchmarks for meeting that goal.” The FCC’s report to
Congress on its Broadband Plan is currently anticipated to be released in March 2010. One of the
many areas that the FCC is investigating in connection with that Broadband Plan is whether and how
it should encourage innovation in the market for video set-top boxes and other navigation devices
that are able to access all types of video content, including cable and online Internet video
streams. It is too soon to predict what impact if any the FCC’s Broadband Plan may have on our
business.
In connection with the digital television (“DTV”) transition in which television stations
converted to full digital broadcasting on June 12, 2009 (“DTV Transition”), the FCC is considering
whether to require cable operators to carry more than one digital program stream from each of the
broadcasters in their
markets. If adopted, this would result in dedication of considerable additional channel
capacity by cable operators to local broadcasters. The proposal, which would affect all of our
markets, has been the subject of considerable debate and cable industry opposition at the FCC, and
it is too soon to tell whether the FCC will adopt such a rule. If adopted, it would also affect
all of our cable competitors and any such ruling would likely not have a disproportionate effect on
our ability to compete with other cable operators in the market.
In addition to the FCC regulations previously discussed, there are other FCC cable regulations
that directly affect the way that we operate our video businesses in areas such as: equal
employment opportunity; syndicated program exclusivity; network program non-duplication;
registration of cable systems; maintenance of various records and public inspection files;
microwave frequency usage; lockbox availability; sponsorship identification; antenna structure
notification; tower marking and lighting; carriage of local sports broadcast programming;
application of rules governing political broadcasts; limitations on advertising contained in
non-broadcast children’s programming; consumer protection and customer service; ownership and
access to cable home wiring and home run wiring in multiple dwelling units (“MDUs”); indecent
programming; programmer access to cable systems; programming agreements; technical standards; and
consumer electronics equipment compatibility and closed captioning. Moreover, from time to time
Congress may enact additional legislation that impacts the manner in which we conduct our business
and our costs of doing so. For example, a bill has been introduced in the U.S. House of
Representatives that would, if enacted, require the FCC to adopt volume control standards for
commercials on broadcast, cable or other multichannel video programming platforms to keep them from
being excessively loud. It is too early to predict whether that particular legislation or some
form of it will ultimately be enacted into law, or what the effects would be on our business.
The FCC has the authority to enforce its regulations by imposing substantial fines, issuing
cease and desist orders and/or imposing other administrative sanctions, such as revoking FCC
licenses needed to operate transmission facilities often used in connection with cable operations.
Regulation of Information Services
Our broadband Internet access service and the other information services we offer using
Internet protocol are not subject to extensive economic regulation, but are subject to laws
regarding customer privacy, protection of minors, and other matters which vary by jurisdiction.
Broadband Internet access providers, as well as voice services providers, are subject to federal
laws requiring them to provide certain capabilities for intercepting and recording communications
to authorized law enforcement agencies. Some federal, state, local and foreign governmental
regulators are considering a number of legislative and regulatory proposals with respect to
Internet user privacy, infringement, pricing and quality of products and services, and intellectual
property ownership. The FCC is also reportedly considering extending obligations to contribute to
the federal Universal Service Fund to some information services, possibly including some forms of
Internet access, but has not yet announced any specific proposals.
12
Table of Contents
Regulation of Telecommunications Services
Federal Regulation
The use of our network for interstate and international voice and data telecommunications
services, including the local component of any interstate or international call, is regulated by
the FCC under the Communications Act. We provide domestic interstate voice services nationwide and
have been authorized by the FCC to offer worldwide international services. The rates, terms, and
conditions of these services are no longer subject to FCC tariffing, but we remain subject to the
FCC’s jurisdiction over complaints regarding these services. We are required to pay various
regulatory fees and assessments to support programs authorized by the FCC. We must also comply with
FCC rules regarding the disclosure of rates, terms and conditions of service; the content and
format of invoices; obtaining proper authorization for carrier changes; and other consumer
protection matters. In addition, the FCC requires prior approval for transfers of control and asset
transfers by regulated carriers, including reorganizations and asset transfers undertaken in
connection with restructuring transactions.
The Communications Act gives us important rights to connect with the networks of ILECs in the
areas where we operate. This law, among other things, requires ILECs to provide nondiscriminatory
access and interconnection to potential competitors, such as CLECs, cable operators, wireless
telecommunications providers and long distance companies. These obligations include the following:
| • | Interconnection: Requires the ILECs to permit their competitors to interconnect with ILEC facilities at any technically feasible point in the ILEC’s network. |
| • | Reciprocal Compensation: Requires all ILECs and CLECs to complete calls originated by competing local exchange carriers under reciprocal arrangements at prices set by the FCC, PUCs or negotiated prices. |
| • | Access to Unbundled Network Elements: Requires ILECs to provide nondiscriminatory access to unbundled network elements (“UNEs”), including network facilities, equipment, features, functions and capabilities, at any technical feasible point within their networks, on nondiscriminatory terms, at prices based on the ILEC’s forward looking costs, which may include a reasonable profit. |
| • | Co-location of Equipment: Allows CLECs to install and maintain their own network equipment in ILEC central offices. |
| • | Resale: Requires the ILEC to establish wholesale “discounted” rates for services it provides to end-users at retail rates. |
| • | Number Portability: Requires all ILECs and CLECs to permit users of telecommunications services to retain existing telephone numbers without impairment of quality, reliability or convenience when switching from one telecommunications provider to another. |
| • | Dialing Parity: Requires the ILECs and CLECs to establish dialing parity so that all customers must dial the same number of digits to place the same type of call. |
| • | Access to Rights-of-Way: Requires all ILECs to permit competing carriers access to poles, ducts, conduits and rights-of-way at regulated prices. |
Regulations promulgated by the FCC to implement these provisions of the law require local
exchange carriers to provide competitors with access to UNEs at prices based on incremental cost
studies. In orders released in 2003 and 2005, the FCC adopted significant changes to its UNE rules.
Because we typically own or lease our own network rather than relying on the ILECs’ facilities,
these changes have affected us less than they have some of our competitors.
The FCC in certain cases has agreed to forbear from applying its UNE requirements in certain
geographic markets where it has determined that sufficient competition exists in the provision of
local telecommunications services. To date, none of these decisions have affected markets in which
we are operating. The FCC recently denied Verizon’s requests for forbearance in six markets,
including Boston, New York, and Philadelphia, but this decision was remanded to the FCC by an
appeals court for further consideration, and the FCC is expected to revise its ruling sometime in
early 2010. We are unable to predict the outcome of this proceeding, or the potential effect a
modification of the FCC order might have upon our operations in these markets.
We have interconnection agreements with Verizon, AT&T, and other ILECs serving the markets
where they provide telephone service. These agreements, which are required under the terms of the
Communications Act, are usually effective for terms of two or three years. As a general matter,
these agreements provide for service to continue without interruption while a new agreement is
negotiated. Most
of the agreements also provide for amendments in the event of changes in the law, such as the
regulatory and court decisions described above.
The FCC Broadband Plan, which is expected to be released in March 2010 and which will likely
set forth a comprehensive set of regulatory proposals designed to improve the availability and
affordability of broadband services to all consumers, regardless of location or economic status,
may include proposed changes to many of the existing regulatory policies discussed in this section;
however, until the Plan is released, we cannot predict how it may affect our business.
13
Table of Contents
Reciprocal Compensation
Our interconnection agreements with ILECs entitle us to collect reciprocal compensation
payments from them for local telephone calls that terminate on our facilities. In 2001, the FCC
adopted rules limiting the compensation that we can collect for terminating dial-up Internet
traffic, and it modified these rules in 2004 and re-affirmed them in November 2008, and its latest
decision was upheld by a federal appeals court. Under these rules, the maximum rate for termination
of this class of traffic was reduced in a series of steps to its current level of $.0007 per
minute, which will remain in effect until further action by the FCC. Changes in the FCC rules due
to court review, or on the FCC’s own initiative, could have a material effect on the amount of
revenue we obtain from these payments but in any event would not have a material effect on
consolidated revenue.
Access Charges
We pay access fees directly to local exchange carriers or indirectly to underlying long
distance carriers for the origination and termination of our interstate and intrastate long
distance voice traffic. Generally, intrastate access charges are higher than interstate access
charges. Therefore, to the degree access charges increase or a greater percentage of our long
distance traffic is intrastate, our costs of providing long distance services will increase. When
providing local telephone service, we also bill access charges to long distance providers for the
origination and termination of those providers’ long distance calls. Accordingly, we benefit from
the receipt of intrastate and interstate long distance traffic. The FCC and several states,
including New York, Massachusetts, Pennsylvania, and Maryland, have adopted rules prohibiting
competitive carriers like us from imposing access charges that are greater than those of the ILEC
in a service area. The FCC currently is considering public comments on a proposal to substantially
reduce both access charges and reciprocal compensation payments over a period of several years. It
is not known yet when the FCC will act on this proposal, or whether it will adopt any portion of
it. Because we both make payments to and receive payments from other carriers for exchange of
local and long distance calls, the FCC’s ultimate determination may have a material effect upon our
business.
Special Access
The FCC is investigating the prices charged by large ILECs for leased, dedicated facilities
(such as T-1 and DS-3 lines), which are known as “special access” services. We sometimes purchase
these services to supplement our own network facilities; however, RCN Metro also provides services
that compete against ILEC special access services. Changes in special access pricing therefore may
affect us in ways that are difficult to predict. We cannot predict when the FCC may resolve this
investigation or whether it will result in material changes in prices.
Slamming and Cramming
Customers may change local and long distance service providers at any time. The FCC and some
states regulate this process and require that specific procedures be followed. When these
procedures are not followed, particularly if the change is unauthorized, the process is known as
“slamming.” The FCC has levied substantial fines for slamming. The risk of financial damage, in the
form of fines, penalties and legal fees and costs, and to business reputation from slamming is
significant.
FCC rules and other laws also regulate the types of services that can appear on a local
telephone bill, as well as the format of those bills. Only charges for services authorized by the
subscriber may appear on bills. The practice of billing for unauthorized services is known as
“cramming.” Violations of rules regarding cramming may result in fines, penalties, and other costs.
We have implemented internal procedures designed to ensure that new subscribers are switched
to our services in accordance with federal and state regulations and that our customer bills comply
with the law. Because of the large volume of service orders we process, it is possible that some
unauthorized carrier changes may be processed inadvertently or that subscribers may be billed for
services they did not order, and we cannot assure you that we will not be subject to slamming or
cramming complaints.
14
Table of Contents
Digital Phone
For all new installations we use a “digital phone” architecture that transmits data signals
over our broadband network between the customer premises and an RCN switch for carriage to and from
the public switched telephone network (“PSTN”). Our legacy phone customers use our
circuit-switched architecture. The FCC currently is investigating what, if any, regulatory
requirements should apply to the provision of telephone service over Internet facilities, and
whether regulation of this service should differ from regulation of traditional telephone service.
Although we consider this a facilities-based service where phone calls transit through the PSTN
rather than through the public Internet, the FCC classifies this as a VoIP service for emergency
9-1-1 reporting. The FCC has adopted rules requiring providers of VoIP services that are
interconnected to the public switched telephone network to comply with many of the same regulatory
obligations as traditional telephone carriers, including among other things providing all customers
with emergency 9-1-1 dialing service with certain capabilities, paying various regulatory fees, and
installing network capabilities required by law enforcement agencies for interception of
communications pursuant to the Communications Assistance for Law Enforcement Act. Because we
operate as a regulated telephone carrier, our digital phone service was already required to comply
with these obligations and we did not incur any additional burdens as a result of the FCC orders.
State Regulation
State PUCs have jurisdiction over intrastate communications (i.e., those that originate and
terminate in the same state). Providers of intrastate local and long distance telephone services
typically must receive a certificate of public convenience and necessity or similar authorization
in order to offer local and intrastate toll services. We are also subject to state laws and
regulations regarding slamming, cramming, and other consumer protection and disclosure regulations.
Our rates for intrastate-switched access services, which we provide to long distance companies to
originate and terminate in-state toll calls, are subject to the jurisdiction of the state PUC where
the call originated and terminated. All such state regulations could materially and adversely
affect our revenues and business opportunities within that state.
State PUCs also have jurisdiction over the terms and conditions of interconnection agreements
between ILECs and other carriers. In each state, we have the option of adopting the terms of an
agreement negotiated by another carrier. If no such agreement is available, we can negotiate a new
agreement with the ILEC, and in the event of an impasse either the ILEC or we may request binding
arbitration by the PUC.
Taxes and Regulatory Fees
We are subject to numerous local, state and federal taxes and regulatory fees, including the
federal excise tax, FCC universal service fund contributions and regulatory fees, and numerous PUC
regulatory fees. We have procedures in place designed to ensure that we properly collect taxes and
fees from our customers and remit such taxes and fees to the appropriate entity pursuant to
applicable law and/or regulation.
Other Regulatory Issues
Digital Set-Top Box Regulation
Currently, most subscribers access video services through a leased set-top box that integrates
programming security features we need to prevent theft of our signals with the channel navigation
function of the box. The FCC adopted regulations that became effective on July 1, 2007 that
require the distribution of set-top boxes that separate the security features from the channel
navigation features to further its policy of permitting subscribers to use equipment provided by
third parties to obtain the services we deliver. We obtained successive waivers so that we could
continue to deploy our most basic non-compliant set-top box until December 31, 2009. As of January
1, 2010, all new set-top boxes that we deploy must comply with the separate security requirements
and therefore, our most basic set-top box will be more costly. Although the rule also affects the
costs of all of our cable competitors, it is possible that we could be disproportionately affected
if our larger competitors, who have significantly greater volume purchasing power, are able to
negotiate volume discounts on equipment purchases not available to RCN.
Right-of-Way Access
The City of New York has imposed a right-of-way fee on our gross revenue for
telecommunications services that is in addition to the gross revenues fees we pay pursuant to our
OVS agreement. Although the City of New York imposes a similar fee on the telecommunications
services offered by our CLEC competitors, the fee has the effect of raising our costs as compared
to Verizon and our incumbent cable competitors, who are not currently subject to the fee.
15
Table of Contents
Pole and Conduit Attachments
The Communications Act requires phone companies and other utilities (other than those owned by
municipalities or cooperatives) to provide cable systems with nondiscriminatory access to any pole
or right-of-way controlled by the utility. The rates that utilities may charge for such access are
regulated by the FCC or, alternatively, by states that certify to the FCC that they regulate such
rates. There is always the possibility that the FCC or a state could permit the increase of pole
attachment rates paid by cable operators. Additionally, higher pole attachment rates apply to pole
attachments that are subject to the FCC’s telecommunications services pole rates. In a ruling of
particular importance to us, the United States Supreme Court held that broadband service providers
that co-mingled video, telecommunications, and Internet services over their networks were entitled
to the protections of the FCC regulations regarding pole attachment rates. The FCC is currently
considering whether to require a uniform rate structure for telecommunications and cable pole
attachments. There is a risk that we will face higher pole attachment costs as a result of this
proceeding.
Program Access
Section 628 of the Federal Communications Act currently precludes any cable operator or
satellite video programmer affiliated with a cable company or with a common carrier providing
satellite-delivered video programming directly to its subscribers, from favoring an affiliated
company over competitors. In certain circumstances, programmers are required to sell their
programming to other multi-channel video distributors. The law and related FCC rules also limit the
ability of program suppliers affiliated with cable companies to offer exclusive programming
arrangements to their affiliates. In addition, the FCC recently decided to extend, on a
case-by-case complaint basis, the program access obligations to regional sports networks that are
terrestrially delivered, including high definition programming for which standard definition
programming is made available, and, where the denial of other types of local programming is shown
to pose a significant hindrance to competition, the FCC will also consider mandating access to such
programming. Unless the FCC decides to further extend these requirements, however, the law and
related FCC regulations are currently scheduled to sunset in 2012, and, with respect to
terrestrially-delivered programming our ability to obtain ‘must have’ programming before that time
will be dependent upon our being able to prevail in an FCC complaint proceeding. We therefore do
not have guaranteed future access to certain programming that is highly desirable to our customers,
which could materially impact our ability to compete effectively in our markets. In addition, these
statutory and regulatory limitations do not cover programming that is distributed by programming
suppliers who are not affiliates of cable operators.
Commercial Leased Access
Cable systems with 36 or more channels must make available a portion of their channel capacity
for commercial leased access by third parties to facilitate competitive programming efforts. We
have not been subject to many requests for carriage under the leased access rules. However, the
FCC has modified the way that cable operators must calculate their rates for such access. It is
possible that, unless this change is reversed on appeal, there may be more carriage requests in the
future. We cannot assure that we would be able to recover our costs under the new methodology or
that the use of our network capacity for such carriage would not materially impact our ability to
compete effectively in our markets.
Building Access
In certain instances, we have had difficulty gaining access to the video distribution wiring
in certain MDUs because building management will not permit us to install our own distribution
wiring and/or the incumbent cable company has not permitted use of the existing wiring on an
equitable basis when we attempt to initiate service to an individual unit previously served by the
incumbent.
We are also at times precluded from serving an MDU because the owner has entered into an
exclusive agreement with another provider. In some instances, these exclusive agreements are
perpetual. The FCC recently prohibited cable operators from enforcing such exclusive access
contracts for the provision of video service in MDUs and from entering into such contracts in the
future. The order does not go so far as to require that MDU owners allow access to other
operators, but there are mandatory building access statutes in several of the states in which we
operate that give us that right, including New York, Massachusetts, the District of Columbia,
Illinois, and Pennsylvania. As a result, we expect that the FCC order prohibiting the enforcement
of exclusive access agreements will not have a negative impact on us, as we have not had the
ability to enter into such exclusive contracts over the vast majority of our operating footprint,
but rather will have a positive impact insofar as it prohibits our competitors from enforcing and
entering into new exclusive agreements.
The FCC is also considering whether to impose similar prohibitions on the enforcement and
entry of bulk sales agreements and exclusive marketing agreements between MDU owners and cable
operators. To date there has been no decision in that proceeding, but to the extent that the FCC
were to render current bulk sales and exclusive marketing agreements unenforceable or prohibit them
going forward, it could affect the way we market and offer our services in some markets.
16
Table of Contents
Customer Proprietary Network Information
RCN collects and uses various types of customer information, including personally identifiable
information and information regarding customers’ use of our services. FCC rules govern our
handling of Customer Proprietary Network Information (“CPNI”), which includes information that
relates to the quantity, technical configuration, type, destination, location, and amount of use of
a telecommunications or interconnected VoIP service, subscription information, and information
contained in customer bills. We have implemented numerous company-wide measures designed to ensure
compliance with the CPNI rules, but cannot assure you that we will not be subject to CPNI penalties
or complaints arising during the process of implementing these measures.
Furthermore, Massachusetts recently enacted data privacy requirements for the protection of
personal information about the residents of the Commonwealth of Massachusetts. Pursuant to these
requirements, RCN is required to have an information security program in place with designated
employees to oversee the program and regular internal audits of the program. We have implemented
company-wide measures to comply with the Massachusetts data privacy requirements.
Red Flag Rules
RCN maintains accounts for, and collects in arrears certain fees and charges from, residential
customers. As a result, under the Federal Trade Commission’s (“FTC”) recently enacted Red Flag
Rules,
RCN is a creditor that must comply with certain requirements designed to prevent, detect and
mitigate identity theft on residential and certain other customer accounts. The Red Flag Rules
require that creditors establish and implement an Identity Theft Prevention Program and take
certain other measures to prevent, detect and mitigate identity theft. FTC enforcement of the Red
Flag Rules will commence as of June 1, 2010. We are implementing company-wide measures designed to
ensure compliance with the Red Flag Rules, but cannot assure you that we will not be subject to
enforcement action arising during the implementation of these measures or thereafter.
Employees
As of December 31, 2009, we had approximately 1,500 employees, substantially all of which are
full-time. Approximately 83% of these employees are associated with the RCN and RCN Business
Services Segment. None of the employees are covered by a collective bargaining agreement.
| ITEM 1A. | RISK FACTORS |
We have a history of net losses and we emerged from Chapter 11 reorganization in 2004.
In each period since we emerged from bankruptcy in 2004, we have incurred net losses. For 2009, 2008
and 2007, we have reported net losses of $28.6 million, $70.7 million and $152.0 million,
respectively. Our net losses are principally attributable to insufficient revenue to cover our
operating expenses, which we expect will remain significant.
Our markets are highly competitive, and many of our competitors have significant advantages. We
may not be able to respond quickly or effectively to changes in the competitive environment, which
could have a material adverse impact on our results of operations and financial position.
In each of our markets we face significant competition from incumbent MSOs and ILECs, CLECs,
VoIP service providers, and wireless providers. Many of these competitors have numerous
advantages, including:
| • | significant economies of scale; |
| • | greater brand recognition; |
| • | greater financial, technical, marketing and other resources; |
| • | well-established customer and vendor relationships; |
| • | significant control over limited conduit and pole space (in the case of incumbent cable and telephone companies); and |
| • | ownership of content and/or significant cost advantages in the acquisition of content. |
Due to the relatively small size of our customer-base and market share in each of our markets,
our service pricing is competitively sensitive. If our competitors were to market their services
at substantially lower prices, this could lead to pressure on the pricing of our services, and
could materially adversely affect our results of operations and ability to add or retain customers
and to expand the services purchased by our customers.
17
Table of Contents
In particular, we face increasing competition from incumbent telephone companies. For
example, Verizon and other competitors now offer video services in several of our service areas and
are expected to continue deploying video services in most of our remaining service areas in the
next several years.
Incumbent telephone companies’ competitive position has been improved by recent operational,
regulatory and legislative advances. The attractive demographics of our major urban markets make
many of our service areas desirable locations for investment in video distribution technologies by
both incumbents and new entrants. By the nature of our relatively mature markets, the introduction
of a viable new entrant will increase competitive intensity, leading to downward pricing pressure
on, and customer losses for, the prior market competitors. For example, during 2008 and 2009,
while we grew revenue on a consolidated basis, we lost video connections, customers and revenue in
the geographic areas where Verizon offered video service. While these declines did not have a
material impact on our consolidated results of operations, we cannot predict the extent to which
increased competition, particularly from large incumbents, will impact our results of operations in
the future.
We may be unable to successfully anticipate and respond to various competitive factors
affecting our industry, including regulatory changes that may affect our competitors differently
from us, new technologies and services that may be introduced, changes in consumer preferences,
demographic trends and discount pricing strategies by competitors, which could have a material
adverse impact on our results of operations and financial position.
We are subject to regulation by federal, state and local governments, which may impose costs and
restrictions.
As discussed in greater detail above, federal, state and local governments extensively
regulate the cable industry and the telephone services industry and are beginning to regulate
certain aspects of the Internet services industry. There are numerous proceedings pending before
the FCC, state PUCs and state and federal courts that may materially affect the way we do business.
For example, Congress, the FCC, and some states are considering various regulations and
legislation pertaining to “network neutrality,” digital carriage obligations, digital set top box
requirements, program access rights, digital telephone services, and changes to the pricing at
which we interconnect exchange traffic with other telephone companies, any of which may materially
affect our business operations and costs. With respect to VoIP services, the FCC is considering
whether it should impose additional VoIP E911 obligations on interconnected VoIP providers,
including a proposed requirement that interconnected VoIP providers automatically determine the
physical location of their customer rather than allowing customers to manually register their
location. Also, the FCC continues to evaluate alternative methods for assessing USF charges. We
cannot predict what actions the FCC or state regulators may take in the future, nor can we
determine the potential financial impact of those possible actions.
We also expect that new legislative enactments, court actions and regulatory proceedings will
continue to clarify and in some cases change the rights and obligations of cable operators,
telecommunications companies and other entities under federal, state, and local laws, possibly in
ways that we have not foreseen. Congress and state legislatures consider new legislative
requirements potentially affecting our businesses virtually every year and new proceedings before
the FCC, state PUCs and state and federal courts are initiated on a regular basis that may also
have an impact on the way that we do business.
Actions by local authorities may also affect our business. Local franchise authorities grant
franchises or other agreements that permit us to operate our cable and OVS systems, and we have to
renew or renegotiate these agreements from time to time. Local franchise authorities often demand
concessions or other commitments as a condition to renewal or transfer, and such concessions or
other commitments could be costly to us in the future. In addition, we could be materially
disadvantaged if we remain subject to legal constraints that do not apply equally to our
competitors, such as where local telephone companies that enter our markets to provide video
programming services are not subject to the local franchising requirements and other requirements
that apply to us. For example, the FCC has adopted rules and several states have enacted
legislation to ease the franchising process and enable state-wide franchising for new entrants.
While reduced franchising limitations could also benefit us if we were to expand our systems, the
chief beneficiaries of these rules are the larger, well funded traditional telephone carriers, such
as Verizon.
The results of these ongoing and future legislative, judicial and administrative actions may
materially affect our cost of business operations and profitability. See “Regulation” in Item 1 to
this Annual Report on Form 10-K.
18
Table of Contents
We depend on certain third party suppliers for equipment, software and outsourced services, and in
some cases, a single vendor in order to obtain economies of scale. If we are unable to receive
quality goods or services from these vendors on reasonable terms and on a timely basis, our ability
to offer services could be impaired, and our brand, growth, operations, and financial results could
be materially adversely affected.
We depend on third party suppliers and licensors to provide some of the hardware, software and
operational support functions underlying some of our services. We obtain these goods and services
from a limited number of vendors, and in certain cases, rely on a single vendor in order to
maximize our volume-based purchasing discounts. If demand exceeds these vendors’ capacity or if
these vendors experience operating or financial difficulties, or are otherwise unable to provide
the goods and services we need in a quality, timely manner and at reasonable prices, our ability to
provide some services might be materially adversely affected. The need to procure or develop
alternative sources of the affected goods or services might delay our ability to serve our
customers. These events could materially and adversely affect our ability to retain and attract
customers, and have a material negative impact on our operations, business, results of operations
and financial condition.
In the event of a substantial failure or disruption of our network or information systems, or loss
of key facilities, we may not be able to fully recover our services for an extended period, which
would adversely affect our financial position and future results of operations.
Our disaster recovery framework to control and address systems and key facilities risks may
not provide for timely recovery of our primary service delivery capability and information systems
functions in any of our key geographic markets in the event of a catastrophic event or loss of
major systems capabilities, including those arising from abusive or malicious Internet activities.
We may incur substantial costs, delays and customer complaints before restoring our primary
business if such a catastrophic failure was to occur. In the event of a disaster impairing our
primary service delivery and operational capabilities, we would expect to experience a substantial
negative effect on our results of operations and financial condition.
Programming costs have risen in past years and are expected to continue to rise, and we may not be
able to pass such programming costs through to our customers, which could adversely affect our cash
flow and operating margins.
The cost of obtaining programming is the largest operating cost associated with providing our
video service. These costs have increased each year, and we expect them to continue to increase,
especially the costs associated with sports programming. Programming costs may also be impacted by
certain consolidations as cable systems acquire certain programming channels. The terms of many of
our programming contracts are for multiple years and provide for future increases in the fees we
must pay. In addition, local over-the-air television stations are increasingly seeking substantial
fees for retransmission of their stations over our cable networks. Historically, we have absorbed
increased programming costs in large part through increased prices to our customers. We cannot
assure you that competitive and other marketplace factors will permit us to continue to pass
through these costs, particularly as an increasing amount of programming content is available via
the Internet at little or no cost. Despite our efforts to manage programming expenses, we cannot
assure you that the rising cost of programming will not adversely affect our cash flow and
operating margins. In addition, programming costs are generally related directly to the number of
subscribers to which the programming is provided. Larger cable and DBS systems generally pay lower
per subscriber programming costs than we do. This cost difference can cause us to suffer reduced
operating margins as prices decrease, while our competitors will not suffer similar margin
compression due to their generally lower costs. In addition, as programming agreements come up for
renewal, we cannot assure you that we will be able to renew these agreements on comparable or
favorable terms. To the extent that we are unable to reach acceptable agreements with programmers,
we
may be forced to remove programming from our line-up, which could result in a loss of
customers and materially adversely affect our results of operations and financial condition.
Our business is highly susceptible to changes in general economic conditions, and any significant
downturn in the U.S. economy as a whole, or in any geographic market in which we provide services,
could substantially impact our sales, customer churn, bad debt and collections, and overall results
of operations.
While our customers generally place a high value and priority on the services we provide,
customers could reevaluate their expenditures on these services in times of uncertainty and
hardship, which could cause them to cancel all or portions of our services, respond more quickly to
price-based promotions from our competitors, and delay or suspend the payment of their monthly
bills. As a result, given the prevailing economic conditions in the markets where we operate, and
in the event of a further downturn in general economic conditions, our results of operations could
be negatively impacted, and the impact could be more severe for us than for our larger competitors
or for those businesses that deliver products or services that customers deem to be higher in
priority. If general economic conditions worsen, we may not be able to continue to deliver
customer and revenue growth, or manage bad debt and collections effectively, any of which could
cause a material adverse impact on our operations, business, results of operations and financial
condition.
19
Table of Contents
Our inability to respond to technological developments and meet customer demand for new products
and services could limit our ability to compete effectively.
Our business is characterized by rapid technological change and the introduction of new
products and services, some of which are bandwidth-intensive. We cannot assure you that we will be
able to fund the capital expenditures necessary to keep pace with technological developments or
that we will successfully anticipate the demand of our customers for products and services
requiring new technology or bandwidth. Any inability to maintain and expand our upgraded systems
and provide advanced services in a timely manner, or to anticipate the demands of the marketplace,
could materially adversely affect our ability to attract and retain customers. Consequently, our
growth, financial condition and results of operations could suffer materially.
Turnover among our executive officers and key employees could result in our inability to continue
performing certain functions and completing certain initiatives in accordance with our existing
budgets and operating plans.
We depend on the performance of our executive officers and key sales, engineering, and
operations personnel, many of whom have significant experience in the cable and telecommunications
industries and substantial tenures with either our company or one of the companies we have
acquired. We experience turnover among our employees as a whole, and if we are not able to retain
our executive officers or other key employees, we could experience a material and adverse effect on
our financial condition and results of operations.
An ownership change could limit our ability to utilize our federal net operating loss
carryforwards.
As of December 31, 2009, we had approximately $1.5 billion of usable federal net operating
loss carryforwards for U.S. income tax purposes that begin to expire in 2022. Our ability to use
these net operating losses can be negatively impacted if there is an “ownership change” as defined
in Section 382 of the Internal Revenue Code. In general, this would occur if shareholders that
each own 5 percent or more of the Company in the aggregate were to own 50 percentage points more
than the lowest amount they owned in the previous three year period. In the event an “ownership
change” were to occur, our ability to utilize these net operating losses could be significantly
limited and could cause us to pay cash federal income taxes much sooner than currently anticipated.
We and our subsidiaries have had, and may in the future incur, a significant amount of
indebtedness, which could adversely affect our financial position and our ability to react to
changes in our business.
We currently have a significant amount of debt, and may (subject to applicable restrictions in
our debt instruments) incur additional debt in the future. As of December 31, 2009, our total
debt was approximately $735.3 million and our interest expense based on the aggregate debt
outstanding and interest rates in effect on such date, is anticipated to be approximately $37
million in 2010. Our credit agreement includes a variety of covenants that require us to dedicate
a significant portion of our cash flow from operating activities to make payments on our debt,
thereby reducing our funds available for working capital, capital expenditures, and other general
corporate expenses.
We have experienced negative cash flow in the past and may not be able to achieve or sustain
operating profitability in the future. In light of these losses, we cannot guarantee that we will
be able to reduce our level of indebtedness or generate sufficient cash flow to service our debt
and meet our capital expenditure requirements. If we cannot do so, we would need to seek
additional financing, reduce our capital expenditures or take other steps, such as disposing of
assets. We cannot assure you that financing would be available on acceptable terms or that asset
sales could be accomplished on acceptable terms.
The covenants in our credit agreement restrict our financial and operational flexibility.
Our credit agreement imposes operating and financial restrictions that affect our ability to,
among other things:
| • | incur additional debt; |
| • | create liens on our assets; |
| • | make particular types of investments or other restricted payments; |
| • | engage in transactions with affiliates; |
| • | acquire assets or make certain capital expenditures; |
| • | utilize proceeds from asset sales for purposes other than debt reduction, except for limited exceptions for reinvestment in our business; |
| • | merge or consolidate or sell substantially all of our assets; and |
| • | pay dividends or repurchase shares of our common stock. |
These requirements may affect our ability to finance future operations or to engage in other
beneficial business activities. These restrictions may also limit our flexibility in planning for,
or reacting to, changes in market conditions and cause us to be more vulnerable in the event of a
downturn in our business. If we violate any of these restrictions, we could be in default under
our credit agreement and our creditors could seek to accelerate our repayment obligations and/or
foreclose on our assets, either of which would materially and adversely affect our financial
position.
20
Table of Contents
Future sales of our common stock could adversely affect the price of our stock and our ability to
raise capital.
A significant portion of our outstanding common stock is held by institutions, which own large
blocks of our shares. Due to the relatively low trading volume in our stock, a decision by any of
these investors to sell all or a portion of their holdings could cause our stock price to drop
significantly, or cause significant volatility in our stock price. In addition, we have a
significant number of shares that we are obligated to issue or that will become available for
resale in the future, including warrants that are currently exercisable for 8,018,276 shares of
our common stock at a per share price of $16.72 (see Note 11 to the Consolidated Financial
Statements).
Failure to consummate our proposed
merger could negatively impact our stock price, business and financial results.
On March 5, 2010, we entered into a merger agreement with entities controlled
by a private equity fund associated with ABRY Partners. Consummation of the merger is subject to various conditions, including the receipt
of stockholder approval, regulatory approvals, separation of our Residential/SMB
and RCN Metro segments, and satisfaction of other customary closing conditions.
The announcement of the proposed merger, whether or not consummated, may result in a loss of key personnel and may disrupt our sales and
marketing or other key business activities, which may have an impact on our financial performance.
The merger agreement generally requires us to operate our business in the ordinary course pending consummation of the proposed merger, but
includes certain contractual restrictions on the conduct of our business that may affect
our ability to execute on our business strategies
and attain our financial goals. Until the proposed merger is consummated,
there may be continuing uncertainty for our employees, customers, suppliers and
other business partners, which could negatively impact our business and financial results.
We cannot predict whether
the closing conditions for the proposed merger set forth in
the merger agreement will be satisfied. As a result, we cannot assure you that the
proposed merger will be completed. If the closing conditions for the proposed merger
set forth in the merger agreement are not satisfied or waived pursuant to the
merger agreement, or if the transaction is not completed for any other reason,
the market price of our common stock may decline. In addition, if the proposed
merger does not occur, we may be required to pay a termination fee if the
merger agreement is terminated under certain circumstances, and we will nonetheless
remain liable for significant expenses that we have incurred related to the transaction.
| ITEM 1B. | UNRESOLVED STAFF COMMENTS |
None
| ITEM 2. | PROPERTIES |
Real Estate
As of December 31, 2009, we leased 104 facilities, including 90 technical and 14 non-technical
facilities, which encompassed approximately 659,000 and 329,000 square feet, respectively, to
support our operations. These leases are typically non-cancelable with terms ranging from one to
20 years. We also currently own seven technical facilities, which encompass approximately 58,700
square feet. Thirty-three of the leased facilities and three of the owned facilities are used by
our RCN Metro segment in their operations. We lease our corporate office space in Herndon, VA.
We believe that our properties are generally in good operating condition and are suitable for
our business operations.
| ITEM 3. | LEGAL PROCEEDINGS |
We are party to various legal proceedings that arise in the normal course of business. In the
present opinion of management, none of these proceedings, individually or in the aggregate, are
likely to have a material adverse effect on our consolidated financial position or consolidated
results of operations or cash flows. However, we cannot provide assurance that any adverse outcome
would not be material to our consolidated financial position or consolidated results of operations
or cash flows.
| ITEM 4. | RESERVED |
PART II
| ITEM 5. | MARKET FOR REGISTRANT’S COMMON EQUITY, RELATED STOCKHOLDER MATTERS AND ISSUER PURCHASES OF EQUITY SECURITIES |
Market Information
RCN’s shares are traded on the NASDAQ under the symbol “RCNI”.
21
Table of Contents
The tables below set forth, on a per share basis for the periods indicated, the closing high
and low bid prices for RCN’s common stock as reported on the NASDAQ. Such quotations reflect
inter-dealer prices, without retail mark-up, mark-down or commission and may not necessarily
represent actual transactions.
| Period | High Price | Low Price | ||||||
2009 |
||||||||
First Quarter |
$ | 6.00 | $ | 3.13 | ||||
Second Quarter |
$ | 6.26 | $ | 3.75 | ||||
Third Quarter |
$ | 9.85 | $ | 5.69 | ||||
Fourth Quarter |
$ | 11.05 | $ | 8.10 | ||||
| Period | High Price | Low Price | ||||||
2008 |
||||||||
First Quarter |
$ | 15.09 | $ | 9.85 | ||||
Second Quarter |
$ | 12.51 | $ | 10.48 | ||||
Third Quarter |
$ | 13.91 | $ | 10.82 | ||||
Fourth Quarter |
$ | 11.61 | $ | 5.04 | ||||
On
March 5, 2010, the last reported sale price of RCN’s common
stock was $15.15 per share and
the number of stockholders of record was six. This does not include those stockholders who hold
shares in street name accounts.
Purchases of Equity Securities
| (c) Total Number | ||||||||||||||||
| of Shares | (d) Approximate | |||||||||||||||
| Purchased as Part | Dollar Value of Shares | |||||||||||||||
| (b) Average | of Publicly | That May Yet Be | ||||||||||||||
| (a) Total Number of | Price Paid per | Announced | Repurchased Under | |||||||||||||
| Shares Purchased | Share | Program (1) | the Program (2) | |||||||||||||
Prior to 4th Qtr 2009 |
2,446,005 | 7,948,155 | ||||||||||||||
10.1.09 – 10.31.09 |
66,287 | $ | 9.06 | 2,512,292 | 7,347,563 | |||||||||||
11.1.09 – 11.30.09 |
74,523 | $ | 8.48 | 2,586,815 | 6,715,495 | |||||||||||
12.1.09 – 12.31.09 |
40,802 | $ | 9.25 | 2,627,617 | 6,337,941 | |||||||||||
| (1) | Our repurchase plan was established in 2007 and authorizes the repurchase of up to $25 million of our shares of common stock. The repurchase plan does not have a specified expiration date. | |
| (2) | The approximate dollar value of shares that may yet be repurchased under the program shown in the schedule above includes commissions paid. |
Dividends
Between our emergence from bankruptcy on December 21, 2004 and June 10, 2007, we did not
declare or pay a cash dividend on our common stock. Our debt agreements that existed during that
time period did not permit such dividends to be declared or paid. On June 11, 2007, in connection
with the refinancing of our senior debt, we paid a special cash dividend of $9.33 per share on all
issued and outstanding RCN common stock as of June 4, 2007, totaling approximately $347 million.
The total dividend paid in June 2007 excluded $4.5 million of dividends due upon vesting of
unvested restricted stock issued to employees prior to the dividend record date, the majority of
which has now been paid. The Company does not intend to pay additional dividends for the
foreseeable future.
22
Table of Contents
Description of RCN Corporation’s Equity Securities
As
contemplated in RCN’s 2004 Plan of Reorganization, RCN issued Convertible Notes, which, pursuant to their terms,
were convertible into approximately five million shares of RCN common stock, subject to certain
limitations. All such Convertible Notes were repurchased by RCN in May 2007 as part of our
recapitalization initiative. As part of the consideration for
the purchase of such Convertible Notes, RCN issued to former holders of such Convertible Notes
warrants to purchase 5,328,521 shares of RCN common stock at an exercise price of $25.16 per share
(subject to adjustment). Following the adjustments caused by the special cash dividend (see Note
11 to the Consolidated Financial Statements), the warrants are currently exercisable for
approximately 8,018,276 shares of common stock at an exercise price of $16.72. All of these
warrants were outstanding as of December 31, 2009 and expire on June 21, 2012.
As of December 31, 2009, RCN has reserved for issuance under the RCN Stock Compensation Plan
(the “Stock Plan”) 8,327,799 shares of our common stock, to be issued in connection with the
exercise of equity compensation grants made to RCN’s directors, officers, and employees. The
remaining information required by this item regarding securities authorized for issuance under
equity compensation plans is incorporated by reference to the information set forth in Item 12 of
this Form 10-K.
RCN STOCK PERFORMANCE
The graph below compares the cumulative total shareholder return on Common Stock for the five
years ended December 31, 2009, with the cumulative total return of the NASDAQ Composite and the
NASDAQ Telecommunications Index over the same period. The graph assumes $100 was invested on
December 21, 2004 in the Common Stock and $100 was invested on the same date in each of the NASDAQ
Composite and the NASDAQ Telecommunications Index. Note that historic stock price performance is
not necessarily indicative of future stock price performance.
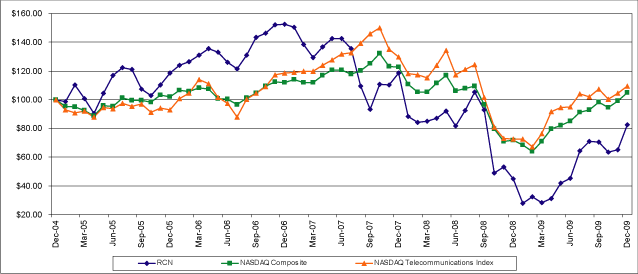
| ITEM 6. | SELECTED FINANCIAL DATA |
The table below presents the selected financial data from the Company’s audited Consolidated
Financial Statements for the years 2005 through 2009.
The information contained in the “Selected Financial Data” is not necessarily indicative of
the results of operations to be expected for future years, and should be read in conjunction with
“Management’s Discussion and Analysis of Financial Condition and Results of Operations,” included
in Item 7, and the Consolidated Financial Statements and related notes thereto included in Item 8
of this Form 10-K.
| 2009 | 2008 | 2007(1) | 2006(2) | 2005 | ||||||||||||||||
| (dollars in thousands, except per share amount) | ||||||||||||||||||||
Revenues |
$ | 763,770 | $ | 739,243 | $ | 636,097 | $ | 585,476 | $ | 530,412 | ||||||||||
Loss from continuing operations |
(28,618 | ) | (70,726 | ) | (169,642 | ) | (14,320 | ) | (138,731 | ) | ||||||||||
Basic loss from continuing
operations per common share |
$ | (0.80 | ) | $ | (1.91 | ) | $ | (4.58 | ) | $ | (0.39 | ) | $ | (3.85 | ) | |||||
Dividends declared per share |
— | — | 9.33 | — | — | |||||||||||||||
Total assets |
$ | 970,451 | $ | 1,016,763 | $ | 1,097,889 | $ | 975,381 | $ | 1,253,940 | ||||||||||
Total debt |
735,255 | 742,607 | 744,945 | 202,792 | 492,097 | |||||||||||||||
| (1) | The results of operations from NEON (see Item 7) are included in the above financial information from the date of acquisition (November 13, 2007) and all periods thereafter. | |
| (2) | The results of operations from Consolidated Edison Communications Holding Company, Inc. (“CEC”) are included in the above financial information from the date of acquisition (March 17, 2006) and all periods thereafter. |
23
Table of Contents
| ITEM 7. | MANAGEMENT’S DISCUSSION AND ANALYSIS OF FINANCIAL CONDITION AND RESULTS OF OPERATIONS |
The following discussion and analysis should be read together with RCN’s Consolidated
Financial Statements and related notes thereto beginning on page F-1. Reference is made to
“Cautionary Statements Regarding Forward-Looking Statements” on page 2 of this Annual Report on
Form 10-K (the “Annual Report”), which describes important factors that could cause actual results
to differ from expectations and non-historical information contained in this Annual Report.
Unless stated otherwise, as in the section titled “Discontinued Operations” under this Item 7,
all of the information contained in Management’s Discussion and Analysis of Financial Condition and
Results of Operations relates to continuing operations. Therefore, the results of operations from
our San Francisco and Los Angeles markets, as discussed below, are excluded for all periods covered
by this Annual Report.
Overview
RCN is a competitive broadband services provider, delivering all-digital and high-definition
video, high-speed internet and premium voice services to Residential and Small and Medium Business
(“SMB”) customers under the brand names of RCN and RCN Business Services, respectively. In
addition, through our RCN Metro Optical Networks business unit (“RCN Metro”), we deliver
fiber-based high-capacity data transport services to large commercial customers, primarily large
enterprises and carriers, targeting the metropolitan central business districts in our geographic
markets. We construct and operate our own networks, and our primary service areas include:
Washington, D.C., Philadelphia, Lehigh Valley (PA), New York City, Boston and Chicago.
Subsequent to the Company’s acquisition of NEON Communications Group, Inc. (“NEON”) in November
2007, management reorganized RCN’s business into two key segments: (i) Residential/SMB and (ii) RCN
Metro. There is substantial managerial, network, operational support and product overlap between
the Residential and SMB businesses and, as a result, we had historically reported these two
businesses as one segment. RCN Metro, however, is managed separately from the other two business
units, with separate network operations, engineering, and sales personnel, as well as separate
systems, processes, products, customers and financial measures. Management of the Company’s two
key businesses is unified only at the most senior executive levels of the Company. Therefore,
beginning with the results of operations for 2008, the financial results of the RCN Metro business
unit are reported as a separate segment in accordance with the requirements of FASB ASC Topic 280
and applicable SEC regulations. All prior period amounts in this Report have been restated to
present the results as two separate reportable segments. For financial and other information about
our segments, refer to Item 8, Note 15 to our Consolidated Financial Statements included in this
Annual Report.
All of the Company’s operations are in the United States. Our Residential/SMB segment, which
serves approximately 429,000 Residential and SMB customers generated approximately 75% of our
consolidated revenues and the RCN Metro segment generated approximately 25% for 2009.
Basis of Reporting
Following is a discussion of the key factors that have affected the Company’s business over
the last three fiscal years. This commentary should be read in conjunction with the Company’s
Consolidated Financial Statements, Selected Financial Data and the remainder of this Form 10-K.
Key Transactions
In November 2007, we completed the acquisition of NEON, a network transport services provider
to carrier and enterprise customers in the New England and mid-Atlantic regions. NEON had a fiber
optic network that consisted of approximately 4,800 route miles, over 230,000 fiber miles, 22
co-location
facilities, and more than 200 points of presence from Maine to Virginia. We paid a purchase
price of $5.15 per share of NEON common stock, or total consideration of approximately $255
million. Including transaction costs, the total purchase price for NEON was approximately $260
million. We funded the transaction with a combination of proceeds from an additional $200 million
term loan under our existing credit agreement, a draw of approximately $25 million under our
existing $75 million line of credit and cash on hand.
24
Table of Contents
In March 2007, we completed the sale of our San Francisco, California assets to an affiliate
of Astound Broadband LLC, a subsidiary of Wave Broadband LLC (“Wave”). Separately, we decided to
exit the Los Angeles, California market during 2007. Accordingly, the accompanying audited
consolidated results of operations and statements of cash flows for all periods presented in this
Annual Report include the results for these two markets as discontinued operations. There were
no assets and liabilities related to these markets on the consolidated balance sheets at December
31, 2009 and 2008.
In 2007, we completed a recapitalization initiative in which we repaid all of our then
outstanding debt, totaling approximately $199 million, and paid a special cash dividend of $9.33
per share, totaling approximately $347 million, utilizing the proceeds of a new $595 million
revolving credit and term loan agreement.
Critical Accounting Policies and Estimates
The preparation of the Consolidated Financial Statements in accordance with generally accepted
accounting principles in the United States (“U.S. GAAP”) requires management to make judgments,
estimates and assumptions that affect the reported amounts of assets and liabilities and disclosure
of contingent assets and liabilities at the date of the Consolidated Financial Statements and the
reported amounts of revenue and expenses during the reporting period. Management periodically
assesses the accuracy of these estimates and assumptions. Actual results could differ from those
estimates. Estimates are used when accounting for various items, including but not limited to
allowances for doubtful accounts; investments; derivative financial instruments; asset impairments;
certain acquisition-related liabilities; programming-related liabilities; revenue recognition;
depreciation and amortization; income taxes; exit and restructuring costs; and legal and other
contingencies. Estimates and assumptions are also used when determining the allocation of the
purchase price in a business combination to the fair value of assets and liabilities and
determining related useful lives.
Refer to Note 2 to our Consolidated Financial Statements for a more complete discussion of all
of the Company’s significant accounting policies.
Results of Operations
The comparability of our results of operations for 2008 with earlier periods is significantly
impacted by the acquisition of NEON in November 2007, the sale of our San Francisco, California
assets in March 2007, and the subsequent exit of our operations in the Los Angeles, California
market during 2007. The accompanying consolidated results of operations and statements of cash
flows for all periods presented in this Annual Report include the results for the two California
markets as discontinued operations. NEON results are included in our consolidated results
subsequent to the closing date of November 13, 2007. To provide better comparisons of operating
results in light of the NEON transaction, the discussion below provides certain pro forma amounts,
in addition to actual results, when comparing 2008 to 2007. Pro forma basis means that the results
are discussed as if NEON was owned throughout the periods presented including the impact of
adjustments made to eliminate certain deferred revenue amortization and transaction related costs
from historical NEON results.
The Consolidated Financial Statements include the accounts of RCN and its consolidated
subsidiaries. All intercompany transactions and balances among consolidated entities have been
eliminated.
25
Table of Contents
The financial information presented in the table below comprises the audited consolidated
financial information for 2009, 2008 and 2007.
| Year Ended December 31, | ||||||||||||
| 2009 | 2008 | 2007 | ||||||||||
| (dollars in thousands) | ||||||||||||
Revenues |
$ | 763,770 | $ | 739,243 | $ | 636,097 | ||||||
Costs and expenses: |
||||||||||||
Direct expenses |
275,240 | 264,219 | 224,770 | |||||||||
Selling, general and administrative
(including stock-based compensation of
$10,228, $13,335 and $33,206) |
279,916 | 294,100 | 288,426 | |||||||||
Exit costs and restructuring charges |
575 | 2,314 | 8,194 | |||||||||
Depreciation and amortization |
193,273 | 198,915 | 196,066 | |||||||||
Operating income (loss) |
14,766 | (20,305 | ) | (81,359 | ) | |||||||
Investment income |
395 | 2,880 | 9,424 | |||||||||
Interest expense |
(42,344 | ) | (53,301 | ) | (34,510 | ) | ||||||
Loss on the early extinguishment of debt |
— | — | (63,795 | ) | ||||||||
Other expense, net |
(363 | ) | — | (451 | ) | |||||||
Loss before income taxes |
(27,546 | ) | (70,726 | ) | (170,691 | ) | ||||||
Income tax expense (benefit) |
1,072 | — | (1,049 | ) | ||||||||
Net loss from continuing operations |
(28,618 | ) | (70,726 | ) | (169,642 | ) | ||||||
Income from discontinued operations, net of tax |
— | — | 1,684 | |||||||||
Gain on sale of discontinued operations, net of tax |
— | — | 15,921 | |||||||||
Net loss |
$ | (28,618 | ) | $ | (70,726 | ) | $ | (152,037 | ) | |||
Consolidated Operating Results
Consolidated Revenues
Consolidated revenue increased $24.5 million, or 3.3%, in 2009 compared to 2008, primarily due
to higher transport revenues in the RCN Metro segment and a slight increase in the average
number of customers from 2008 to 2009 in the Residential/SMB segment.
Consolidated revenue increased $103.1 million, or 16.2%, in 2008 compared to 2007, largely due
to the acquisition of NEON. In 2007, the Company recorded a $4.4 million benefit related to a
reciprocal compensation agreement. On a pro forma basis, and excluding the $4.4 million benefit,
consolidated revenue increased $43.2 million, or 6.2%, in 2008 as compared to the same period in
2007, primarily due to an increase in the number of customers in the Residential/SMB segment and
higher transport revenues in the RCN Metro segment.
Consolidated Direct Expenses
Consolidated direct expenses increased $11.0 million, or 4.2%, in 2009 compared to 2008.
Direct expenses include net benefits from favorable settlements with voice and data network
providers related to ordinary course network cost disputes totaling $4.0 million during 2009 and
$1.9 million during 2008. Excluding these benefits, consolidated direct expenses increased $13.1
million, or 4.9%, in 2009 compared to 2008, primarily due to an increase in the average programming
cost per subscriber in the Residential/SMB segment as well as added costs associated with the
increase in revenue in the RCN Metro segment.
Consolidated direct expenses increased $39.4 million, or 17.6%, in 2008 compared to 2007,
primarily due to the acquisition of NEON. On a pro forma basis, consolidated direct expenses
increased $14.2 million, or 5.7%, in 2008 compared to 2007 as a result of an increase in the
average programming cost per
subscriber in the Residential/SMB segment and an increase in customers and revenue in the RCN
Metro segment as well. Direct expenses also include net benefits from favorable settlements with voice and data network providers related to
ordinary course network cost disputes totaling $1.9 million and $2.2 million in 2008 and 2007, respectively.
Consolidated Selling, General and Administrative Expenses
Consolidated selling, general and administrative expenses (“SG&A”) decreased $14.2 million, or
4.8%, in 2009 compared to 2008. Excluding stock-based compensation, SG&A expense decreased $11.1
million, or 4.0%, in 2009 compared to 2008, primarily reflecting (i) the results of the investments
made in 2008 and 2009 to improve the long-term productivity and effectiveness of field operations,
and the marketing and sales functions in the Residential/SMB segment, which were partially offset
by increases in property tax and collections expense and (ii) synergies associated with
the integration of the NEON business acquired in November 2007 in the RCN Metro segment. In
addition, SG&A expenses decreased by $2.2 million in 2009, as compared to 2008, due to the
suspension of the Company’s matching contribution to the 401(k) plan in the beginning of the second
quarter of 2009.
Consolidated SG&A increased $5.7 million, or 2.0%, in 2008 compared to 2007, primarily due to
the acquisition of NEON partially offset by a decrease in stock-based compensation expense of $19.9
million. On a pro forma basis, and excluding stock-based compensation, SG&A increased by $1.2
million, or 0.4%, in 2008 compared to 2007, reflecting increases in bad debt expense, property
taxes and legal costs, partially offset by a decline in certain general and administrative
expenses, primarily due to the integration and synergies achieved through the NEON acquisition.
26
Table of Contents
Segment Operating Results
To measure the performance of our operating segments, we use operating income before
depreciation and amortization, stock-based compensation, exit costs and restructuring charges.
This measure eliminates the significant level of non-cash depreciation and amortization expense
that results from the capital-intensive nature of our businesses and from intangible assets
recognized in business combinations, as well as non-cash stock-based compensation and other special
items such as exit costs and other restructuring charges. We use this measure to evaluate our
consolidated operating performance and the performance of our operating segments, and to allocate
resources and capital. It is also a significant performance measure in our annual incentive
compensation programs. We believe that this measure is useful to investors because it is one of
the bases for comparing our operating performance with that of other companies in our industries,
although our measure may not be directly comparable to similar measures used by other companies.
Because we use this metric to measure our segment profit or loss, we reconcile it to operating
income, the most directly comparable financial measure calculated and presented in accordance with
U.S. GAAP in the business segment footnote to our consolidated financial statements (see Note 15).
You should not consider this measure a substitute for operating income (loss), net income (loss),
net cash provided by operating activities or other measures of performance or liquidity we have
reported in accordance with U.S. GAAP.
Residential/SMB Segment Operating Results
| Year Ended December 31 | ||||||||||||||||||||
| Fav(unfav) | Fav(unfav) | |||||||||||||||||||
| 2009 | 2008 | Var% | 2007 | Var % | ||||||||||||||||
| (in thousands) | ||||||||||||||||||||
Revenue: |
||||||||||||||||||||
Video |
$ | 311,860 | $ | 294,650 | 5.8 | % | $ | 271,330 | 8.6 | % | ||||||||||
Data |
140,816 | 142,704 | (1.3 | )% | 133,406 | 7.0 | % | |||||||||||||
Voice |
107,791 | 114,386 | (5.8 | )% | 117,477 | (2.6 | )% | |||||||||||||
Recip Comp/Other |
13,590 | 16,191 | (16.1 | )% | 24,050 | (32.7 | )% | |||||||||||||
Total Revenue |
574,057 | 567,931 | 1.1 | % | 546,263 | 4.0 | % | |||||||||||||
Direct expenses |
206,307 | 199,367 | (3.5 | )% | 190,093 | (4.9 | )% | |||||||||||||
Selling, general
and administrative
(excluding
stock-based
compensation) |
212,395 | 223,143 | 4.8 | % | 220,700 | (1.1 | )% | |||||||||||||
Operating income
before depreciation
and amortization,
stock-based
compensation, exit
costs and
restructuring
charges |
$ | 155,355 | $ | 145,421 | 6.8 | % | $ | 135,470 | 7.3 | % | ||||||||||
Reconciliation to Operating Loss
| 2009 | 2008 | 2007 | ||||||||||
| (in thousands) | ||||||||||||
Operating income before depreciation and
amortization, stock-based compensation,
exit costs and restructuring charges |
$ | 155,355 | $ | 145,421 | $ | 135,470 | ||||||
Less: Stock-based compensation |
7,676 | 10,364 | 28,205 | |||||||||
Less: Depreciation and amortization |
158,036 | 167,532 | 183,855 | |||||||||
Less: Exit costs and restructuring charges |
674 | 1,602 | 8,089 | |||||||||
Operating loss |
$ | (11,031 | ) | $ | (34,077 | ) | $ | (84,679 | ) | |||
Residential/SMB Metrics
| 2009 | 2008 | 2007 | ||||||||||
Video RGUs (1) |
364,000 | 366,000 | 358,000 | |||||||||
Data RGUs (1) |
312,000 | 302,000 | 285,000 | |||||||||
Voice RGUs (1) |
223,000 | 244,000 | 250,000 | |||||||||
Total RGUs (1) |
899,000 | 911,000 | 893,000 | |||||||||
Customers (2) |
429,000 | 428,000 | 416,000 | |||||||||
ARPC (3) |
$ | 110 | $ | 110 | $ | 109 | ||||||
| (1) | Revenue Generating Units (“RGUs”) are all video, high-speed data, and voice connections provided to residential households and SMB customers. Dial-up Internet and long distance voice services are not included. Additional telephone lines are each counted as an RGU, but additional room outlets for video service are not counted. For bulk arrangements in residential multiple dwelling units (“MDUs”), including dormitories, the number of RGUs is based on the number of video, high-speed data and voice connections provided and paid for in that MDU. Commercial structures such as hotels and offices are counted as one RGU regardless of how many units are in the structure. Delinquent accounts are generally disconnected and no longer counted as RGUs after a set period of time in accordance with our credit and disconnection policies. RGUs may include customers receiving some services for free or at a reduced rate in connection with promotional offers or bulk arrangements. RGUs provided free of charge under courtesy account arrangements are not counted, but additional services paid for are counted. |
27
Table of Contents
| (2) | A “Customer” is a residential household or SMB that has at least one paid video, high-speed data or local voice connection. Customers with only dial-up Internet or long distance voice service are not included. For bulk arrangements in residential MDUs, including dormitories, each unit for which service is provided and separately paid for is counted as a Customer. Commercial structures such as hotels and offices are counted as one Customer regardless of how many units are in the structure. Delinquent accounts are generally disconnected and no longer counted as Customers after a set period of time in accordance with our credit and disconnection policies. | |
| (3) | Average revenue per customer (“ARPC”) is total revenue for a given monthly period (excluding dial-up Internet, reciprocal compensation and commercial revenue) divided by the average number of Customers for the period. This definition of ARPC may not be similar to ARPC measures of other companies. |
Residential/SMB Revenues
Residential/SMB revenue increased $6.1 million, or 1.1% in 2009 compared to 2008. The
increase is primarily due to a slight increase in the average number
of customers from 2008 to 2009. Total RGUs decreased by approximately 12,000, or 1.3%, from December 31, 2008
to December 31, 2009, driven primarily by voice penetration losses, consistent with trends for
highly penetrated landline voice providers, partially offset by growth in data RGUs. Video RGUs
decreased slightly from December
31, 2008 to December 31, 2009. ARPC was flat at $110 in both 2009 and 2008, as growth in
average revenue per video RGU and increased high-speed data penetration was offset by declines in
voice penetration and average revenue per data RGU. The increase in average revenue per video RGU
was driven mainly by our annual video rate increase, which partially mitigates the impact of annual
increases in programming costs, as well as increased penetration of our digital set-top, HD and DVR
boxes. Our digital video penetration rate rose to 100% of video customers in the fourth quarter of
2009 from 87% in the fourth quarter of 2008, as we completed Project Analog Crush. The decrease in
average revenue per data RGU was primarily due to a shift towards lower-speed data plans, a trend
which has increased over the past year.
Residential/SMB revenue increased $21.7 million, or 4.0%, in 2008 compared to 2007. Excluding
a $4.4 million benefit related to a reciprocal compensation agreement recognized in 2007,
Residential/SMB revenue increased $26.1 million, or 4.8%, during 2008 as compared to 2007. The
increase is primarily due to an increase in the average number of customers and ARPC. Customers
increased by approximately 12,000, or 2.9%, from December 31, 2007 to December 31, 2008, primarily
due to increased sales opportunities generated through investments in new and rebuilt homes, and
increased focus on sales and marketing to SMB customers. Total RGUs grew by approximately 18,000,
or 2.0%, from December 31, 2007 to December 31, 2008, driven primarily by overall customer
increases, with data RGU growth outpacing video RGU growth. Voice RGUs declined consistent with
industry trends. ARPC increased from $109 for 2007 to $110 for 2008 due primarily to growth in
average revenue per video RGU and increased high-speed data penetration, partially offset by
declines in average revenue per voice and data RGU. The increase in average revenue per video RGU
was driven mainly by our annual video rate increase, as well as increased customer purchases of
value added products and services such as our digital set-top, HD and DVR boxes, digital
programming tier and premium channels. Our digital video penetration rate rose to 87% of video
customers in the fourth quarter of 2008 from 69% in the fourth quarter of 2007. The decrease in
average revenue per voice RGU was due to overall market pricing trends, where voice prices have
consistently decreased over the past several years. The decrease in average revenue per data RGU
was primarily due to an increase in the percentage of data RGUs representing lower-speed data
plans, a trend which has increased since RCN introduced these plans in 2007.
Residential/SMB Direct Expenses
Direct expenses increased $6.9 million, or 3.5%, in 2009 compared to 2008. Direct expenses
include a net benefit from favorable settlements with voice and data network providers on ordinary
course network cost disputes totaling $4.0 million during 2009 and $1.9 million during 2008.
Excluding these settlements, Residential/SMB direct expenses increased $9.0 million, or 4.5%, in 2009
compared to 2008. Increases in the average programming cost per subscriber resulted in an increase
in video direct costs for 2009 totaling $12.5 million as compared to 2008. Voice and data network
costs in 2009, excluding the impact of settlements with providers of our voice and data network
services, decreased by $3.5 million, or 10.9%, primarily due to
a reduction in voice RGUs and benefits achieved as a result of an ongoing network optimization initiative.
Direct expenses increased $9.3 million, or 4.9%, in 2008 compared to 2007 primarily due an
increase in the average programming cost per subscriber and higher average video RGUs. Direct
expenses for 2008 and 2007 include a net benefit of $1.9 million and $2.2 million, respectively, as
a result of favorable settlements with our voice and data network providers. Direct expenses for
2007 also include a charge of approximately $1.5 million for franchise fees identified during an
audit.
28
Table of Contents
Residential/SMB Selling, General and Administrative Expenses
SG&A decreased by $13.4 million, or 5.8%, in 2009 as compared to 2008. Excluding stock-based
compensation expense, SG&A decreased by $10.7 million, or 4.8%, in 2009 as compared to 2008,
reflecting decreases in costs related to technical and network operations, sales, legal and
litigation, billing, customer service and the suspension of the 401(k) match as discussed above,
partially offset by slight increases in bad debt expense, collections costs and property taxes.
The overall reduction in SG&A reflects the results of the investments made in 2008 and 2009 to
improve the long-term productivity and effectiveness of field operations, and sales and marketing
functions.
SG&A decreased by $15.4 million, or 6.2%, in 2008 as compared to 2007. Excluding stock-based
compensation expense, SG&A increased $2.4 million, or 1.1%, in 2008 as compared to 2007. For 2008,
the increase in SG&A expenses primarily reflects an increase in bad debt expense, legal costs and
property taxes, partially offset by reductions in facilities, customer care and other general and
administrative expenses.
RCN Metro Optical Networks Operating Results
| Year Ended December 31 | ||||||||||||||||||||
| Fav(unfav) | Fav(unfav) | |||||||||||||||||||
| 2009 | 2008 | Var% | 2007 | Var % | ||||||||||||||||
| (in thousands) | ||||||||||||||||||||
Revenue: |
||||||||||||||||||||
Transport Services |
$ | 145,226 | $ | 131,448 | 10.5 | % | $ | 60,707 | 116.5 | % | ||||||||||
Data and Internet Services |
5,240 | 2,581 | 103.0 | % | 2,875 | (10.2 | )% | |||||||||||||
Co-location |
11,790 | 12,091 | (2.5 | )% | 9,455 | 27.9 | % | |||||||||||||
Leased Services |
20,369 | 19,668 | 3.6 | % | 13,352 | 47.3 | % | |||||||||||||
Installation and Other |
7,088 | 5,524 | 28.3 | % | 3,445 | 60.3 | % | |||||||||||||
Total Revenue |
189,713 | 171,312 | 10.7 | % | 89,834 | 90.7 | % | |||||||||||||
Direct expenses |
68,933 | 64,852 | (6.3 | )% | 34,677 | (87.0 | )% | |||||||||||||
Selling, general and
administrative (excluding
stock-based compensation) |
57,293 | 57,622 | 0.6 | % | 34,520 | (66.9 | )% | |||||||||||||
Operating income before
depreciation and
amortization, stock-based
compensation, exit costs
and restructuring charges |
$ | 63,487 | $ | 48,838 | 30.0 | % | $ | 20,637 | 136.7 | % | ||||||||||
Reconciliation to Operating Loss
| 2009 | 2008 | 2007 | ||||||||||
| (in thousands) | ||||||||||||
Operating income before depreciation and
amortization, stock-based compensation,
exit costs and restructuring charges |
$ | 63,487 | $ | 48,838 | $ | 20,637 | ||||||
Less: Stock-based compensation |
2,552 | 2,971 | 5,001 | |||||||||
Less: Depreciation and amortization |
35,237 | 31,383 | 12,211 | |||||||||
Less: Exit costs and restructuring charges |
(99 | ) | 712 | 105 | ||||||||
Operating income |
$ | 25,797 | $ | 13,772 | 3,320 | |||||||
RCN Metro Revenues
Revenue increased $18.4 million, or 10.7%, in 2009 as compared to 2008, primarily due to
growth in transport services to our carrier and enterprise customers. RCN Metro had approximately
800 customers as of December 31, 2009. The top 20% of these customers had monthly revenue in
excess of $10,000 per customer, generating approximately 90% of RCN Metro’s total revenue, and the
top 3% of these customers had monthly revenue in excess of $100,000 per customer, representing
multiple locations and services purchased per customer, and generated approximately 60% of RCN
Metro’s total revenue. From a customer segment perspective, RCN
Metro generates approximately 30% of its revenue each from telecommunications carriers, national wireless providers and
financial services enterprise customers, and the remainder from other enterprise customers.
RCN Metro revenue increased $81.5 million, or 90.7%, in 2008 as compared to 2007, primarily
due to the acquisition of NEON. On a pro forma basis, revenue increased $17.2 million, or 11.1%,
in 2008 as compared to 2007, due primarily to growth in transport services to our carrier and
enterprise customers.
29
Table of Contents
While RCN Metro’s revenue is somewhat concentrated within certain industries and customers, we
attempt to mitigate any potential risk by performing detailed credit analyses on new customers and
by aggressively managing outstanding accounts receivable balances and customer payments. In
addition, our core product set often supports mission critical
customer applications (e.g., trading operations,
voice/data traffic aggregation, core network connectivity, etc.), which positions
us well relative to other suppliers.
RCN Metro Direct Expenses
Direct expenses increased $4.1 million, or 6.3%, in 2009 as compared to 2008, largely due to
added costs associated with the increase in revenue, including co-location costs and leased
circuits, partially offset by a reduction in building access fees.
Direct expenses increased $30.2 million, or 87.0%, in 2008 as compared to 2007, primarily due
to the acquisition of NEON. On a pro forma basis, direct expenses increased $4.9 million, or 8.2%,
for 2008, largely due to added costs associated with the increase in revenue, including leased
circuits, building access, rights-of-way and co-location costs.
RCN Metro Selling, General and Administrative Expenses
SG&A decreased $0.7 million, or 1.2%, in 2009 as compared to 2008. Excluding stock-based
compensation, SG&A decreased $0.3 million, or 0.6%, for 2009, primarily due to a reduction in
network operations expenses, as well facilities, bad debt and legal expenses partially offset by
increases in technical operations and property tax expenses. Excluding stock-based compensation,
the decrease in overall SG&A expenses, despite a significant increase in revenue of $18.4 million
during 2009, reflects the high operating leverage of our primarily on-net model, as well as
synergies associated with NEON’s integration.
SG&A increased $21.1 million, or 53.3%, in 2008 as compared to 2007. On a pro forma basis and
excluding stock-based compensation, SG&A decreased $1.3 million, or 2.2%, in 2008 as compared to
2007, primarily as a result of cost synergies realized through employee and other cost reductions
enabled by the integration of NEON, partially offset by increases in sales and marketing expenses.
Consolidated Depreciation and Amortization
Depreciation expense increased $8.1 million, or 4.5%, to $187.1 million in 2009 compared to
2008, due primarily to additional depreciation of approximately $19.1 million from assets placed
into service since December 31, 2008 and adjustments of $1.6 million (discussed below), offset by a
decline of approximately $13.2 million due to fixed assets that became fully depreciated since
December 31, 2008.
Depreciation expense in 2009 includes impairment adjustments totaling $4.5 million related to
equipment which has not been returned by former customers. Included in this impairment adjustment
is $1.6 million that relates to periods prior to January 1, 2009. Management believes the impact
of this error is immaterial to each of the applicable prior periods.
Depreciation
expense increased $3.6 million, or 2.1%, to $179.0 million in 2008 compared to
2007, reflecting additional expense of approximately $19.5 million associated with NEON, and
approximately $15.3 million from additional assets placed into service since December 31, 2007,
offset by a decline of approximately $30.5 million due to fixed
assets that became fully
depreciated since December 31, 2007.
Amortization
expense decreased $13.7 million, or 68.8%, to $6.2 million in 2009 as compared to
2008 primarily due to certain intangible assets becoming fully amortized as of December 31, 2008.
Amortization expense decreased $0.8 million, or 3.9%, to $19.9 million in 2008 compared to
2007. During 2008, the valuation of the tangible and intangible assets acquired in the NEON
transaction was completed by management and the preliminary values assigned to customer relationships and
internally developed software were reduced by $9.4 million and increased by $0.2 million,
respectively. As a result, a cumulative reduction to amortization expense was recognized in 2008
totaling $1.0 million. Excluding this adjustment, amortization would have increased by $1.0
million due to the intangible assets acquired in the NEON acquisition.
30
Table of Contents
Consolidated Exit Costs and Restructuring Charges
During 2009 and 2008, we recorded exit costs and restructuring charges of $0.6 million and
$2.3 million, respectively, primarily from employee termination benefits. In 2008, the employee
termination benefits were associated with a reduction in force and a voluntary separation program
completed in connection with plans to reduce operating expenses.
Total exit costs and restructuring charges were $8.2 million in 2007, consisting primarily of
exit costs, totaling $7.9 million as a result of our exiting or terminating property leases in
Pennsylvania, New Jersey and New York, and restructuring charges totaling $3.4 million, which were
primarily related to the outsourcing of our customer care operations. These charges were partially
offset by a $3.1 million settlement for damages incurred relating to space that was exited in 2002,
net of legal fees incurred. At the time the property was exited, the abandoned property, plant and
equipment was recorded in exit costs and restructuring charges and, therefore, the portion of the
settlement relating to these costs was recorded in exit costs and restructuring charges during
2007.
Consolidated Stock-Based Compensation
Total non-cash stock-based compensation expense recognized in 2009 was $10.2 million, a
decrease of $3.1 million, or 23.3%, compared to 2008. The decrease in stock-based compensation
expense was primarily due to the added expense recognized in 2008 as a result of the modification
made in 2007 in connection with the payment of the special cash dividend. These
reductions were partially offset by additional expense incurred related to restricted stock unit
grants made during 2009.
Total non-cash stock-based compensation expense recognized in 2008 was $13.3 million, a
decrease of $19.9 million, or 59.8%, compared to 2007. The decrease in stock-based compensation
expense was primarily due to a reduction in the amount of expense recognized as a result of the
modification made in 2007 in connection with the payment of the special cash dividend, as well as grants made in 2005, which became fully vested in mid 2008. These reductions
were partially offset by additional expense incurred related to option and restricted stock unit
grants made during 2008.
We expect to recognize approximately $10.4 million, $6.8 million and $2.7 million in
compensation expense based on outstanding grants under the Stock Plan at December 31, 2009 in 2010,
2011 and 2012, respectively.
Consolidated Other Income (Expense) Items
Consolidated Investment Income
Investment income decreased $2.5 million, or 86.3%, to $0.4 million in 2009 compared to the
same period in 2008. The decrease was due to lower yields from the Company’s short-term investments
due to decreases in short-term market rates.
Investment income decreased $6.5 million, or 69.4%, to $2.9 million in 2008 compared to the
same period in 2007. This decrease was primarily due to decreased yields from the Company’s
short-term investments as well as a lower weighted average cash and short-term investment balance.
Consolidated Interest Expense
Interest expense
decreased by $11.0 million, or 20.6%, to $42.3 million in 2009 compared to
the same period in 2008. The decrease in interest expense was primarily due to the decrease in
LIBOR.
Interest expense increased by $18.8 million, or 54.5%, to $53.3 million in 2008 compared to
the same period in 2007. The increase in interest expense was primarily due to the increase in our
weighted average debt balance, offset slightly by a reduction in our weighted average interest
rate.
Outstanding debt at December 31, 2009 was $735.3 million compared to $742.6 million at
December 31, 2008. The weighted average interest rate, including the effect of the swap agreements
(discussed in Item 7A) was 5.2% and 6.6% in 2009 and 2008, respectively.
Consolidated Loss on the Early Extinguishment of Debt
In connection with the repayment of our Former First-Lien Credit Agreement (see Note 9 to our
Consolidated Financial Statements) and successful tender offer and consent solicitation for our
Second-Lien Convertible Notes, we recognized a loss on extinguishment of debt of $63.8 million
during 2007, consisting of (i) the fair value of all new warrants issued, totaling $38.4 million,
(ii) the cash paid in excess of par value ($133 per $1,000 principal amount), totaling $16.6
million, and (iii) the write-off of deferred financing costs and professional fees, totaling $8.8
million.
31
Table of Contents
Consolidated Other Expense, Net
Other expense, net consisted mainly of translation gains and losses on a security deposit
designated in a foreign currency in 2009 and penalties and late fees in 2007.
Consolidated Discontinued Operations
On March 13, 2007, we completed the sale of our San Francisco, California market for cash
consideration of approximately $45 million and recorded an after-tax gain on this transaction of
$15.9 million. During 2007, we also exited the Los Angeles, California market. The revenues and
expenses from each of these properties, along with associated income taxes, have been removed from
continuing operations and reclassified into a single line item on the Consolidated Statements of
Operations as income from discontinued operations, net in each period presented.
Liquidity and Capital Resources
| December 31, | ||||||||
| 2009 | 2008 | |||||||
| (in thousands) | ||||||||
Cash, cash equivalents and short-term investments |
$ | 86,943 | $ | 63,684 | ||||
Debt (including current maturities and capital lease obligations) |
$ | 735,255 | $ | 742,607 | ||||
Subject to the risks outlined in our “Cautionary Statements Regarding Forward-Looking
Statements,” we expect to fund our ongoing investing and mandatory financing activities, excluding
the final maturity of our First-Lien Credit Facility in 2014, with cash on hand and cash flows from
operating activities. If our operating performance differs significantly from our forecasts, we
may be required to reduce our operating expenses and curtail capital spending, and we may not
remain in compliance with our debt covenants.
Operating Activities
Net cash provided by operating activities was $152.9 million in 2009, which reflects an
increase of $12.9 million over cash provided by operating activities in 2008. The increase
reflects improved earnings
from operations and lower interest payments, offset by changes in working capital, primarily
driven by the timing of vendor payments.
During 2009 and 2008, we made cash payments for interest totaling $40.1 million and $51.2
million, respectively. The decrease in interest payments was due primarily to the decrease in
LIBOR. We anticipate that our cash paid for interest will decrease slightly in the year ended
December 31, 2010 due to a lower weighted average debt balance.
Investing Activities
Net cash used in investing activities was $75.7 million in 2009 which reflected a $62.9
million reduction compared to 2008. This reduction reflects a $37.8 million decrease in
short-term
investments compared to an increase of $7.1 million in 2008 and a $25.0 million decrease
in additions to property, plant and equipment, partially offset
by smaller decreases in restricted investments and proceeds from sale of
property, plant and equipment as compared to 2008.
The decrease in additions to property, plant and equipment in 2009, as compared to 2008, was
primarily due to the completion of “Project Analog Crush” in each of our major metropolitan markets
(excluding Lehigh Valley) in 2008. “Project Analog Crush” was completed in our Lehigh Valley market
in 2009. Capital expenditures for 2010 are expected to be approximately $130 million, excluding
business or customer acquisitions, which we expect to fund with cash flow from continuing
operations as well as cash on hand. The decrease in short-term
investments in 2009 totaling $37.8 million
is due to the change in investment allocation from short-term investments to money market funds in
anticipation of the Company’s transition to a new money management service provider.
Net cash used in investing activities
was $138.7 million in 2008 reflecting $143.3 million in additions to property, plant and equipment and an increase
in short-term investments totaling $7.1 million, partially offset by $2.5 million in proceeds from the sale of
assets related to our discontinued California operations, $1.9 million in proceeds from sales of operating fixed
assets, and a $7.4 million decrease in restricted investments.
32
Table of Contents
Financing Activities
Net cash used in financing activities was $16.2 million in 2009, reflecting the purchase of
common stock of $8.0 million (consisting of $7.3 million related to our stock repurchase program
and $0.7 million of treasury shares resulting from the vesting of restricted shares), the repayment
of long-term debt of $7.4 million, and dividend payments of $0.8 million. Net cash used in
financing activities was $12.3 million in 2008, primarily reflecting the purchase of common stock
of $8.7 million (consisting of $7.7 million related to our stock repurchase program and $1.0
million of treasury shares resulting from the vesting of restricted shares), the repayment of
long-term debt of $7.3 million and dividend payments of $1.6 million, partially offset by $5.0
million in proceeds from a draw under our revolving credit facility.
Contractual Obligations and Commercial Commitments
The following table provides a summary of our contractual obligations and commercial
commitments at December 31, 2009. Additional detail about these items is included in the Notes to
our Consolidated Financial Statements.
| Payments Due By Period | ||||||||||||||||||||
| Less than | More than | |||||||||||||||||||
| Contractual Obligations | Total | 1 year | 1-3 years | 3-5 years | 5 years | |||||||||||||||
| (in thousands) | ||||||||||||||||||||
Total bank
borrowings (1) |
$ | 732,489 | $ | 25,784 | $ | 14,410 | $ | 692,295 | $ | — | ||||||||||
Capital lease obligations |
2,766 | 163 | 379 | 462 | 1,762 | |||||||||||||||
Total debt |
735,255 | 25,947 | 14,789 | 692,757 | 1,762 | |||||||||||||||
Interest on
long-term debt (2) |
198,106 | 39,719 | 89,486 | 67,359 | 1,542 | |||||||||||||||
Operating
leases (3)(5) |
84,711 | 16,223 | 26,066 | 20,596 | 21,826 | |||||||||||||||
Purchase
obligations (4)(5) |
196,257 | 40,555 | 52,552 | 29,805 | 73,345 | |||||||||||||||
Total contractual obligations |
$ | 1,214,329 | $ | 122,444 | $ | 182,893 | $ | 810,517 | $ | 98,475 | ||||||||||
| (1) | In addition to scheduled mandatory repayments under the First-Lien Credit Agreement, the Company is also required to repay 50% of Excess Cash Flow (as defined in the First-Lien Credit Agreement) if the Company’s Total Leverage Ratio for the period is greater than 3:00:1. Pursuant to this Excess Cash Flow provision, the Company expects to repay $18.6 million on or before April 15, 2010, related to the year ended December 31, 2009. | |
| (2) | Interest payments are based on interest rates in effect at December 31, 2009 and include payments on our interest rate swap agreements. | |
| (3) | Net of contractual sublease income of $1.9 million in total through 2015. | |
| (4) | Purchase obligations consist of agreements to purchase goods and services that are enforceable and legally binding on us and that specify all significant terms, including fixed or minimum quantities to be purchased, price provisions and timing. Our purchase obligations principally consist of contracts with telecommunications providers, and other contracts entered into in the normal course of business. Amounts reflected as liabilities in the consolidated balance sheet at December 31, 2009 are excluded from the table above. | |
| (5) | A total of $30.5 million of our purchase obligations and operating lease obligations are collateralized via letters of credit at December 31, 2009. |
Off Balance Sheet Arrangements
We do not have any off-balance sheet arrangements that are reasonably likely to have a current
or future effect on our financial condition, results of operations, liquidity, capital expenditures
or capital resources.
Description of Outstanding Debt
As of December 31, 2009, our total debt was approximately $735.3 million, including $2.8
million of capital leases. The following is a description of our debt and the significant terms
contained in the related agreements.
First-Lien Credit Agreement
The Company’s credit agreement with Deutsche Bank, as Administrative Agent, and certain
syndicated lenders (“First-Lien Credit Agreement”) provides for term loans to the Company in the
aggregate principal amount of $720 million, and a $75 million revolving line of credit, all of
which can be used as collateral for letters of credit. Approximately $40.1 million of the
revolving line of credit is currently utilized for outstanding letters of credit relating to our
surety bonds, real estate lease obligations, right-of-way obligations, and license and permit
obligations. As of December 31, 2009, the Company had drawn an additional $30 million under the
revolving line of credit and had $4.9 million of available borrowing capacity remaining. The
obligations of the Company under the First-Lien Credit Agreement are guaranteed by all of its
operating subsidiaries and are collateralized by substantially all of the Company’s assets.
33
Table of Contents
The term loan bears interest at the Administrative Agent’s prime lending rate plus an
applicable margin or at the Eurodollar rate plus an applicable margin, based on the type of
borrowing elected by the Company. The effective rate on outstanding debt at December 31, 2009 and
December 31, 2008 was 4.9% and 5.5%, respectively, including the effect of the interest rate swaps.
The First-Lien Credit Agreement requires the Company to maintain a Secured Leverage Ratio not
to exceed 4.00:1 through December 30, 2010. On December 31, 2010, the maximum permitted Secured
Leverage Ratio declines to 3.50:1, then declines to 3.25:1 on December 31, 2011 and 3.00:1 on
December 31, 2012 where it remains until maturity in May 2014. The First-Lien Credit Agreement
also contains certain covenants that, among other things, limit the ability of the Company and its
subsidiaries to incur indebtedness, create liens on their assets, make particular types of
investments or other restricted payments, engage in transactions with affiliates, acquire assets,
utilize proceeds from asset sales for purposes other than debt reduction (except for limited
exceptions for reinvestment in the business), merge or consolidate or sell substantially all of the
Company’s assets.
The Company is in compliance with all financial covenants under the First-Lien Credit
Agreement as of the date of this filing.
Recently Issued Accounting Pronouncements
See Note 2, “Summary of Significant Accounting Policies,” to our Consolidated Financial
Statements for a full description of recently issued accounting pronouncements including the date
of adoption and effects on results of operations and financial condition.
Inflation
The Company’s results of operations and financial condition have not been significantly
affected by inflation. The Company’s principal operating costs have not generally been subject to
significant inflationary pressures.
Letters of Credit
The Company had outstanding letters of credit in an aggregate face amount of $40.1 million at
December 31, 2009. These letters of credit utilize approximately 53% of the Company’s $75 million
revolving line of credit as collateral.
Subsequent Event
On March 5, 2010, the Company entered into an Agreement and Plan of Merger (the “Merger
Agreement”) with entities controlled by a private equity fund associated with ABRY Partners, LLC,
pursuant to which to those entities agreed to acquire the Company for total consideration of
approximately $1.2 billion, including the assumption of debt. The transaction is expected to be
completed in the second half of 2010, subject to receipt of stockholder approval, regulatory
approvals, including the receipt of required consents and approvals of the Federal Communications
Commission, as well as satisfaction of other customary closing conditions. The transaction is not
subject to any financing condition. Under the terms of the Merger Agreement, the Company may
solicit proposals from third parties for 40 days through April 14, 2010.
| ITEM 7A. | QUANTITATIVE AND QUALITATIVE DISCLOSURES ABOUT MARKET RISK |
At December 31, 2009, we held $15.1 million of short-term investments and $71.8 million of
cash and cash equivalents, primarily consisting of U.S. Treasury bills, government backed
obligations, and money market deposits. Our primary interest rate risk on short-term investments
and cash and cash equivalents results from changes in short-term (less than six months) interest
rates. However, this risk is largely offset by the fact that interest on our bank credit facility
borrowings is variable and is reset over periods of no more than six months unless agreed to by
each lender.
During 2007, the Company entered into three interest rate swap agreements with an initial
notional amount of $345 million to partially mitigate the variability of cash flows due to changes
in the Eurodollar rate, specifically related to interest payments on its term loans under the
First-Lien Credit Agreement. The interest rate swap agreements have a seven year term with an
amortizing notional amount which adjusts down on the dates payments are due on the underlying term
loans. Under the terms of the swap agreements, on specified dates, the Company makes payments
calculated using a fixed rate of 5.319% and receives payments equal to 3-month LIBOR. These
interest rate swap agreements qualify for hedge accounting because the swap terms match the
critical terms of the hedged debt. The Company has assessed, on a quarterly basis, that the swap
agreements are completely effective based on criteria listed in the authoritative guidance
pertaining to cash flow derivative instruments that are interest rate swaps. Accordingly, these
agreements had no net effect on the Company’s results of operations in 2009. At December 31, 2009
and 2008, the estimated fair values of these swap agreements were liabilities of $37.0 million and
$54.5 million, respectively, and the notional amount was $335.3 million and $339.2 million,
respectively. The Company uses derivative instruments as risk management tools and not for trading
purposes.
At December 31, 2009, the interest rate for the term loans issued pursuant to our First-Lien
Credit Agreement was LIBOR plus 2.25% (2.56% at December 31, 2009), and current borrowings totaled
$702.5 million. The effective interest rate was 4.87%, including the effect of the interest rate
swap agreements noted above. The interest rate for the revolving credit line under our First-Lien
Credit Agreement was LIBOR plus 2.00% (2.31% at December 31, 2009), and current borrowings totaled
$30.0 million. Assuming the current level of borrowings under the First-Lien Credit Agreement and
the effect of the swap agreements, an increase in LIBOR
of 100 basis points would result in an
increase in annual interest expense of approximately $4.0 million.
34
Table of Contents
See Note 2 to our Consolidated Financial Statements for discussions of our accounting
policies for derivative financial instruments and counterparty credit risk.
| ITEM 8. | FINANCIAL STATEMENTS AND SUPPLEMENTARY DATA |
RCN’s Consolidated Financial Statements are filed under this Item, beginning on page F-1 of
this Report.
| ITEM 9. | CHANGES IN AND DISAGREEMENTS WITH ACCOUNTANTS ON ACCOUNTING AND FINANCIAL DISCLOSURE |
None.
| ITEM 9A. | CONTROLS AND PROCEDURES |
As of the end of the period covered by this Annual Report, an evaluation was carried out under
the supervision and with the participation of RCN’s management, including our Chief Executive
Officer and Chief Financial Officer, of the effectiveness of the design and operation of RCN’s
“disclosure controls and procedures” (as defined in Rule 13a-15(e) under the Securities Exchange
Act of 1934) and “internal control over financial reporting”.
The evaluation of RCN’s disclosure controls and procedures and internal control over financial
reporting included a review of our objectives and processes, implementation by the Company and the
effect on the information generated for use in this Annual Report. In the course of this evaluation
and in accordance with Section 302 of the Sarbanes Oxley Act of 2002, we sought to identify
material weaknesses in our controls, to determine whether we had identified any acts of fraud
involving personnel who have a significant role in our internal control over financial reporting
that would have a material effect on our Consolidated Financial Statements, and to confirm that any
necessary corrective action, including process improvements, were being undertaken. Our evaluation
of our disclosure controls and procedures is done quarterly and management reports the
effectiveness of our controls and procedures in our periodic reports filed with the SEC. Our
internal control over financial reporting is also evaluated on an ongoing basis by RCN’s internal
auditors and by other personnel in RCN’s finance organization. The overall goals of these
evaluation activities are to monitor our disclosure controls and procedures and internal control
over financial reporting and to make modifications as necessary. We periodically evaluate our
processes and procedures and make improvements as required.
Because of its inherent limitations, disclosure controls and procedures and internal control
over financial reporting may not prevent or detect misstatements. In addition, projections of any
evaluation of effectiveness to future periods are subject to the risk that controls may become
inadequate because of changes in conditions or that the degree of compliance with the policies or
procedures may deteriorate. Management applies its judgment in assessing the benefits of controls
relative to their costs. Because of the inherent limitations in all control systems, no evaluation
of controls can provide absolute assurance that all control issues and instances of fraud, if any,
within the company have been detected. The design of any system of controls is based in part upon
certain assumptions about the likelihood of future events, and there can be no assurance that any
design will succeed in achieving its stated goals under all potential future conditions, regardless
of how remote.
Disclosure Controls and Procedures
Disclosure controls and procedures are designed with the objective of ensuring that (i)
information required to be disclosed in the Company’s reports filed under the Securities Exchange
Act of 1934 is recorded, processed, summarized and reported within the time periods specified in
the SEC’s rules and forms and (ii) information is accumulated and communicated to management,
including our Chief Executive Officer and Chief Financial Officer, as appropriate to allow timely
decisions regarding required disclosures. Our Chief Executive Officer and Chief Financial Officer
evaluated the effectiveness of our disclosure controls and procedures in place at the end of the
period covered by this Annual Report pursuant to Rule 13a-15(b) of the Exchange Act. Based on this
evaluation, the Chief Executive Officer and Chief Financial Officer concluded that RCN’s disclosure
controls and procedures (as defined in the Exchange Act Rule 13(a)-15(e)) were effective as of
December 31, 2009.
35
Table of Contents
Management’s Report on Internal Control over Financial Reporting
RCN’s management is responsible for establishing and maintaining adequate internal control
over financial reporting, as such term is defined in Exchange Act Rule 13a-15(f). Under the
supervision and with the participation of RCN management, including our Chief Executive Officer and
Chief Financial Officer, we conducted an evaluation of the effectiveness of our
internal control over financial reporting based on the framework in Internal Control —
Integrated Framework issued by the Committee of Sponsoring Organizations of the Treadway
Commission. Based on our evaluation under the framework in Internal Control — Integrated Framework,
our management concluded that our internal control over financial reporting was effective as of
December 31, 2009.
The Company’s internal control over financial reporting as of December 31, 2009 has been
audited by BDO Seidman, LLP, an independent registered public accounting firm, as stated in their
report which appears below in this Item.
Changes in Internal Control over Financial Reporting
There were no changes in our internal control over financial reporting that occurred during
the quarter ended December 31, 2009 that have materially affected, or are reasonably likely to
materially affect, our internal control over financial reporting.
Report of Independent Registered Public Accounting Firm
The Board of Directors and Stockholders
RCN Corporation
Herndon, Virginia
RCN Corporation
Herndon, Virginia
We have audited RCN Corporation’s internal control
over financial reporting as of December 31, 2009, based on criteria established
in Internal Control - Integrated Framework issued by the Committee of Sponsoring
Organizations of the Treadway Commission (the COSO criteria). RCN Corporation’s
management is responsible for maintaining effective internal control over financial
reporting and for its assessment of the effectiveness of internal control over financial reporting,
included in the accompanying Item 9A, Management's Report on Internal Control Over Financial Reporting. Our responsibility is to express
an opinion on the company's internal control over financial reporting based on our audit.
We conducted our audit in accordance
with the standards of the Public Company Accounting Oversight Board (United States).
Those standards require that we plan and perform the audit to obtain reasonable assurance about whether
effective internal control over financial reporting was maintained in all material respects. Our audit included
obtaining an understanding of internal control over financial reporting, assessing the risk that a material
weakness exists, and testing and evaluating the design and operating effectiveness of internal control based on the
assessed risk. Our audit also included performing such other procedures as we considered necessary in the circumstances.
We believe that our audit provides a reasonable basis for our opinion.
A company's internal control over financial
reporting is a process designed to provide reasonable assurance regarding the reliability of financial reporting and the
preparation of financial statements for external purposes in accordance with generally accepted accounting principles. A company's
internal control over financial reporting includes those policies and procedures that (1) pertain to the maintenance of records that,
in reasonable detail, accurately and fairly reflect the transactions and dispositions of the assets of the company; (2) provide reasonable
assurance that transactions are recorded as necessary to permit preparation of financial statements in accordance with generally accepted
accounting principles, and that receipts and expenditures of the company are being made only in accordance with authorizations of
management and directors of the company; and (3) provide reasonable assurance regarding prevention or timely detection of
unauthorized acquisition, use, or disposition of the company's assets that could have a material effect on the financial statements.
Because of its inherent limitations,
internal control over financial reporting may not prevent or detect misstatements.
Also, projections of any evaluation of effectiveness to future periods are subject
to the risk that controls may become inadequate because of changes in conditions,
or that the degree of compliance with the policies or procedures may deteriorate.
In our opinion,
RCN Corporation maintained, in all material respects, effective internal control
over financial reporting as of December 31, 2009, based on the COSO criteria.
We also have audited,
in accordance with the standards of the Public Company Accounting Oversight Board (United States), the consolidated balance sheet of
RCN Corporation as of December 31, 2009, and the related consolidated statements
of income, stockholders’ equity, and cash flows for the year ended December 31,
2009 and our report dated March 9, 2010 expressed an unqualified opinion thereon.
/s/ BDO Seidman, LLP
Bethesda, Maryland
March 9, 2010
March 9, 2010
| ITEM 9B. | OTHER INFORMATION |
None.
PART III
| ITEM 10. | DIRECTORS, EXECUTIVE OFFICERS AND CORPORATE GOVERNANCE |
Pursuant to General Instruction G(3) to Form 10-K, we intend to file an amendment to this Form 10-K containing the Part
III information with the Securities and Exchange Commission within 120 days of the end of the Company’s year ended
December 31, 2009.
| ITEM 11. | EXECUTIVE COMPENSATION |
Pursuant to General Instruction G(3) to Form 10-K, we intend to file an amendment to this Form 10-K containing the Part
III information with the Securities and Exchange Commission within 120 days of the end of the Company’s year ended
December 31, 2009.
| ITEM 12. | SECURITY OWNERSHIP OF CERTAIN BENEFICIAL OWNERS AND MANAGEMENT AND RELATED STOCKHOLDER MATTERS |
Pursuant to General Instruction G(3) to Form 10-K, we intend to file an amendment to this Form 10-K containing the Part
III information with the Securities and Exchange Commission within 120 days of the end of the Company’s year ended
December 31, 2009.
| ITEM 13. | CERTAIN RELATIONSHIPS AND RELATED TRANSACTIONS, AND DIRECTOR INDEPENDENCE |
Pursuant to General Instruction G(3) to Form 10-K, we intend to file an amendment to this Form 10-K containing the Part
III information with the Securities and Exchange Commission within 120 days of the end of the Company’s year ended
December 31, 2009.
| ITEM 14. | PRINCIPAL ACCOUNTING FEES AND SERVICES |
Pursuant to General Instruction G(3) to Form 10-K, we intend to file an amendment to this Form 10-K containing the Part
III information with the Securities and Exchange Commission within 120 days of the end of the Company’s year ended
December 31, 2009.
36
Table of Contents
PART IV
| ITEM 15. | EXHIBITS AND FINANCIAL STATEMENT SCHEDULES |
| (a) | The following documents are filed as part of this Annual Report: |
| (1) | Financial Statements. | ||
| A listing of the financial statements, notes and reports of independent registered public accountants required by Item 8 begins on page F-1 of this annual report. | |||
| (2) | Financial Statement Schedules | ||
| See Schedule II—Valuation and Qualifying Accounts on page F-30 | |||
| (3) | The index to the Exhibits begins on page E-1 of this Annual Report. |
37
Table of Contents
SIGNATURES
Pursuant to the requirements of Section 13 or 15(d) of the Securities Exchange Act of 1934,
the Registrant has duly caused this report to be signed on its behalf by the undersigned,
thereunto duly authorized.
| Date: March 9, 2010 | RCN Corporation |
|||
| By: | /s/ Peter D. Aquino | |||
| Peter D. Aquino | ||||
| President and Chief Executive Officer | ||||
Pursuant to the requirements of the Securities Exchange Act of 1934, this report has been
signed below by the following persons on behalf of the Registrant and in the capacities and
on the dates indicated.
| Name | Title | Date | ||
/s/ Peter D. Aquino
|
President and Chief Executive Officer, Director | March 9, 2010 | ||
/s/ Michael T. Sicoli
|
Executive Vice President and Chief Financial Officer | March 9, 2010 | ||
/s/ Leslie J. Sears
|
Senior Vice President and Controller | March 9, 2010 | ||
/s/ Jose A. Cecin, Jr.
|
Director | March 9, 2010 | ||
/s/ Kurt Cellar
|
Director | March 9, 2010 | ||
/s/ Benjamin C. Duster IV
|
Director | March 9, 2010 | ||
/s/ Lee S. Hillman
|
Non Executive Chairman, Director | March 9, 2010 | ||
/s/ Charles E. Levine
|
Director | March 9, 2010 | ||
/s/ Casimir Skrzypczak
|
Director | March 9, 2010 | ||
/s/ Daniel Tseung
|
Director | March 9, 2010 | ||
S-1
Table of Contents
EXHIBITS INDEX
(Exhibits are listed by numbers corresponding to the Exhibit Table of Item 601 in Regulation S-K).
| Exhibit No. | Description | |
| 3.1 | Amended and Restated Certificate of Incorporation of RCN Corporation,
dated as of December 21, 2004 (incorporated by reference to Exhibit 3.1
of RCN’s Current Report on Form 8-K filed on December 27, 2004 8-K). |
|
| 3.2 | Amended and Restated Bylaws of RCN Corporation (incorporated by reference
to Exhibit 3.2 of RCN’s Current Report on Form 8-K filed on December 27,
2004). |
|
| 4.1 | Registration Rights Agreement, dated as of December 21, 2004, by and
between RCN Corporation and the Stockholders listed on the signature
pages thereto (incorporated by reference to Exhibit 4.2 of RCN’s Current
Report on Form 8-K filed on December 27, 2004). |
|
| 4.2 | Warrant Agreement, dated as of May 25, 2007, by and RCN Corporation and
HSBC Bank USA National Association. (incorporated by reference to Exhibit
4.1 of RCN’s Current Report on Form 8-K filed on May 25, 2007). |
|
| 4.3 | Registration Rights Agreement, dated as of May 25, 2007, by and among RCN
Corporation, and the Holders, as defined therein (incorporated by
reference to Exhibit 4.2 of RCN’s Current Report on Form 8-K filed on May
25, 2007). |
|
| 10.1 | Dark Fiber IRU Agreement dated as of May 8, 1997 among Metropolitan Fiber
Systems/McCourt, Inc. and RCN Telecom Services of Massachusetts, Inc.
(incorporated by reference to Exhibit 10.2 to RCN’s Amendment No. 2 to
Form 10/A filed September 5, 1997 (Commission File No. 0-22825)). |
|
| 10.2 (**) | First Amendment dated as of November 28, 2006 between MCImetro Access
Transmission Services of Massachusetts, as successor-in-interest to
Metropolitan Fiber Systems McCourt, Inc. and RCN Telecom Services, Inc.
as successor-in-interest to RCN Telecom Services of Massachusetts, Inc.
amending the Dark Fiber IRU Agreement dated as of May 8, 1997 among
Metropolitan Fiber Systems/McCourt, Inc. and RCN Telecom Services of
Massachusetts, Inc. (incorporated by reference to Exhibit 10.20 of RCN’s
Annual Report on Form 10-K filed on March 15, 2007). |
|
| 10.3 | Dark Fiber IRU Agreement dated as of May 8, 1997 among Metropolitan Fiber
Systems of New York, Inc. and RCN Telecom Services of New York, Inc.
(incorporated by reference to Exhibit 10.3 to RCN’s Amendment No. 2 to
Form 10/A filed September 5, 1997 (Commission File No. 0-22825)). |
|
| 10.4 (**) | First Amendment to Dark Fiber IRU Agreement between Metropolitan Fiber
Systems of New York, Inc. and RCN Telecom Services, Inc. dated as of
December 5, 2007 (incorporated by reference to Exhibit 10.4 of RCN’s
Amendment No. 1 to Form 10-K/A filed on March 26, 2008). |
E-1
Table of Contents
| Exhibit No. | Description | |
| 10.5 | Second Amendment to Dark Fiber IRU Agreement between Metropolitan Fiber
Systems of New York, Inc. and RCN Telecom Services, Inc. dated as of June
18, 2008 (incorporated by reference to Exhibit 10.5 of RCN’s Annual
Report on Form 10-K filed on February 24, 2009). |
|
| 10.6 | Third Amendment to Dark Fiber IRU Agreement between Metropolitan Fiber
Systems of New York, Inc. and RCN Telecom Services, Inc. dated as of
November 18, 2008 (incorporated by reference to Exhibit 10.6 of RCN’s
Annual Report on Form 10-K filed on February 24, 2009). |
|
| 10.7 | Second Amended and Restated Operating Agreement of RCN-Becocom, LLC made
and effective as of June 19, 2002 (incorporated by reference to Exhibit
10.01 of RCN’s Current Report on Form 8-K filed on June 21, 2002). |
|
| 10.8 | Management Agreement dated as of June 17, 1997 among RCN Operating
Services, Inc. and RCN-Becocom, Inc. (incorporated herein by reference to
Exhibit 10.9 to RCN’s Amendment No. 2 to Form 10K/A filed September 5,
1997 (Commission File No. 0-22825)). |
|
| 10.9 | Construction and Indefeasible Right of Use Agreement dated as of June 17,
1997 between RCN-Becocom, Inc. and RCN-Becocom, LLC (incorporated herein
by reference to Exhibit 10.10 to RCN’s Amendment No. 2 to Form 10/A filed
September 5, 1997 (Commission File No. 0-22825)). |
|
| 10.10 | License Agreement dated as of June 17, 1997 between Boston Edison Company
and RCN-Becocom, Inc. (incorporated by reference to Exhibit 10.11 to
RCN’s Amendment No. 2 to Form 10/A filed September 5, 1997 (Commission
File No. 0-22825)). |
|
| 10.11 | Joint Investment and Non-Competition Agreement dated as of June 17, 1997
among RCN Telecom Services of Massachusetts, Inc., RCN-Becocom, Inc. and
RCN-BecoCom, LLC (incorporated by reference to Exhibit 10.12 to RCN’s
Amendment No. 2 to Form 10/A filed September 5, 1997 (Commission File No.
0-22825)). |
|
| 10.12 | Amended and Restated Operating Agreement of Starpower Communications,
L.L.C. by and between Pepco Communications, L.L.C. and RCN Telecom
Services of Washington, D.C. Inc. dated October 28, 1997(incorporated by
reference to Exhibit 10.13 to RCN’s Annual Report on Form 10-K for the
year ended December 31, 1997 (Commission File No. 0-22825)). |
|
| 10.13 | Form of Second Amended and Restated Agreement for the Provision of Fiber
Optic Facilities and Services between Northeast Utilities Service
Company, The Connecticut Light & Power Company, Western Massachusetts
Electric Company, Public Service Company of New Hampshire, and Neon
Optica, Inc. as Successor in Interest to Necom LLC as of December 23,
2002 - Phase One (incorporated by reference to Exhibit 10.11 of RCN’s
Amendment No. 1 to Form 10-K/A filed on March 26, 2008). |
|
| 10.14 | Form of Second Amended and Restated Agreement for the Provision of Fiber
Optic Facilities and Services between Northeast Utilities Service
Company, The Connecticut Light & Power Company, Western Massachusetts
Electric Company, Public Service Company of New Hampshire, and Neon
Optica, Inc. as Successor in Interest to Necom LLC as of December 23,
2002 - Phase Two (incorporated by reference to Exhibit 10.4 of RCN’s
Amendment No. 1 to Form 10-K/A filed on March 26, 2008). |
E-2
Table of Contents
| Exhibit No. | Description | |
| 10.15 | Form of Agreement Concerning the Reimbursement of Fees Among The
Connecticut Light & Power Company Western Massachusetts Electric Company,
Public Service Company of New Hampshire and Mode 1 Communications, Inc.
and Neon Optica, Inc. dated as of November 5, 2004. (incorporated by
reference to Exhibit 10.13 of RCN’s Amendment No. 1 to Form 10-K/A
filed on March 26, 2008). |
|
| 10.16 (**) | Master Service Agreement, dated as of September 27, 2007, by and between
RCN Telecom Services and Sitel Operating Corporation (incorporated by
reference to Exhibit 10.1 of RCN’s Quarterly Report on Form 10-Q filed on
November 8, 2007). |
|
| 10.17 | Credit Agreement, dated as of May 25, 2007, by and among RCN Corporation,
the various lenders party to the Credit Agreement, and Deutsche Bank
Trust Company Americas, as Administrative Agent (incorporated by
reference to Exhibit 10.1 of RCN’s Current Report on Form 8-K filed on
May 25, 2007). |
|
| 10.18 | Incremental Commitment Agreement, dated as of November 13, 2007, by and
among RCN Corporation, the various lenders party to the Credit Agreement,
and Deutsche Bank Trust Company Americas, as Administrative Agent
(incorporated by reference to Exhibit 10.1 of RCN’s Current Report on
Form 8-K filed on November 13, 2007). |
|
| 10.19 | Security Agreement, dated as of May 25, 2007, by and among RCN
Corporation, certain subsidiaries of RCN Corporation, and Deutsche Bank
Trust Company Americas, as First-Lien Collateral Agent (incorporated by
reference to Exhibit 10.2 of RCN’s Current Report on Form 8-K filed on May
25, 2007). |
|
| 10.20 | Pledge Agreement, dated as of May 25, 2007, by and among RCN Corporation,
certain subsidiaries of RCN Corporation, and Deutsche Bank Trust Company
Americas, as First-Lien Collateral Agent (incorporated by reference to
Exhibit 10.3 of RCN’s Current Report on Form 8-K filed on May 25, 2007). |
|
| 10.21 | Subsidiary Guaranty, dated as of May 25, 2007, by and among certain
subsidiaries of RCN Corporation and Deutsche Bank Trust Company Americas,
as Collateral Agent (incorporated by reference to Exhibit 10.4 of RCN’s
Current Report on Form 8-K filed on May 25, 2007). |
|
| 10.22*+ | RCN Corporation 2005 Stock Compensation Plan, as amended effective
December 29, 2009. |
|
| 10.23+ | RCN Amended and Restated Change of Control Severance Plan dated July 3,
2008 (incorporated by reference to Exhibit 10.1 to RCN’s Quarterly Report
on Form 10-Q filed on August 7, 2008). |
|
| 10.24*+ | RCN
Corporation 2009 Short-Term Incentive Plan. |
|
| 10.25+ | Amended Form Non-Qualified Option Agreement (incorporated by reference to
Exhibit 10.29 to RCN’s Amendment No. 1 to its Annual Report on Form 10-K
as filed on April 10, 2006). |
|
| 10.26+ | Amended Form Incentive Stock Option Agreement (incorporated by reference
to Exhibit 10.30 to RCN’s Amendment No. 1 to its Annual Report on Form
10-K as filed on April 10, 2006). |
|
| 10.27+ | Form Director Restricted Stock Agreement (incorporated by reference to
Exhibit 10.3 of RCN’s Current Report on Form 8-K, filed on January 6,
2006). |
E-3
Table of Contents
| Exhibit No. | Description | |
| 10.28+ | Amended Form Executive Restricted Stock Agreement (incorporated by
reference to Exhibit 10.20 of RCN’s Annual Report on Form 10-K filed on
March 15, 2007). |
|
| 10.29+ | Form of Director Restricted Stock Unit Agreement (incorporated by
reference to Exhibit 10.1 of RCN’s Current Report on Form 8-K filed on
February 7, 2008). |
|
| 10.30+ | Form of Deferral Election Form (incorporated by reference to Exhibit 10.2
of RCN’s Current Report on Form 8-K filed on February 7, 2008). |
|
| 10.31+ | Form of Executive Restricted
Stock Unit Agreement (incorporated by
reference to Exhibit 10.30 of RCN’s Amendment No. 1 to Form 10-K/A
filed on March 26, 2008). |
|
| 10.32+ | Form of Performance-Based Restricted Stock Unit Award Agreement
(incorporated by reference to Exhibit 10.1 of RCN’s Quarterly Report on
Form 10-Q filed on May 8, 2008). |
|
| 10.33+ | Form of Restricted Stock Unit Award for Officer — RSU Deferral Election
Form (incorporated by reference to Exhibit 10.2 of RCN’s Quarterly Report
on Form 10-Q filed on May 8, 2008). |
|
| 10.34+ | Amended and Restated Employment Agreement, effective as of December 21,
2007, by and between RCN Corporation and Peter D. Aquino (incorporated by
reference to Exhibit 10.1 of RCN’s Current Report on Form 8-K filed on
December 27, 2007). |
|
| 10.35*+ | Restricted
Stock Unit Agreement effective as of August 20, 2009 by and
between RCN Corporation and Peter D. Aquino. |
|
| 10.36*+ | Form of
Director Restricted Stock Unit Agreement. |
|
| 10.37*+ | Form
of Director Deferral Election Form. |
|
| 10.38*+ | Form of Executive
Officer Restricted Stock Unit Agreement. |
|
| 10.39+ | Employment Agreement effective as of September 28, 2009 by and between
RCN Corporation and José A, Cecin, Jr. (incorporated by reference to
Exhibit 10.1 of RCN’s Current Report on Form 8-K filed on October 1,
2009). |
|
| 10.40+ | Employment Agreement effective as of September 28, 2009 by and between
RCN Corporation and Michael T. Sicoli (incorporated by reference to
Exhibit 10.2 of RCN’s Current Report on Form 8-K filed on October 1,
2009). |
|
| 10.41*+ | Restricted Stock Unit Agreement effective as of September 28,
2009 by and between RCN Corporation and José A. Cecin. |
|
| 21.1 (*) | Subsidiaries of Registrant. |
|
| 23.1 (*) |
Consent of BDO Seidman, LLP, Independent Registered Public Accounting Firm. |
|
| 23.2 (*) | Consent of Friedman LLP, Independent Registered Public Accounting Firm. |
E-4
Table of Contents
| Exhibit No. | Description | |
| 31.1 (*) | Certification of Chief Executive Officer pursuant to Rules 13a-14 and
15d-14 promulgated under the Securities and Exchange Act of 1934, as
amended, as adopted pursuant to section 302 of the Sarbanes-Oxley Act of
2002. |
|
| 31.2 (*) | Certification of the Executive Vice President and Chief Financial Officer
pursuant to Rules 13a-14 and 15d-14 promulgated under the Securities and
Exchange Act of 1934, as amended, as adopted pursuant to section 302 of
the Sarbanes-Oxley Act of 2002. |
|
| 32.1 (*) | Certification of Chief Executive Officer pursuant to 18 U.S.C. Section
1350 as adopted pursuant to Section 906 of the Sarbanes-Oxley Act of
2002. |
|
| 32.2 (*) | Certification of Executive Vice President and Chief Financial Officer
pursuant to 18 U.S.C. Section 1350 as adopted pursuant to Section 906 of
the Sarbanes-Oxley Act of 2002. |
| * | Document attached. | |
| ** | Confidential treatment requested as to certain portions of the document, which portions have been omitted and filed separately with the Securities and Exchange Commission. | |
| + | Management compensatory plan or arrangement. |
E-5
Table of Contents
Index to Financial Statements
| Page | ||||
| F-2 | ||||
| F-4 | ||||
| F-5 | ||||
| F-6 | ||||
| F-7 | ||||
| F-8 | ||||
| F-30 | ||||
F-1
Table of Contents
REPORTS OF INDEPENDENT REGISTERED PUBLIC ACCOUNTING FIRMS
The Board of Directors and Stockholders
RCN Corporation
Herndon, Virginia
RCN Corporation
Herndon, Virginia
We have audited the accompanying consolidated balance sheet of RCN Corporation and
subsidiaries (the “Company”) as of December 31, 2009 and the related consolidated statements of
operations, stockholders’ equity, and cash flows for the year
then ended. In
connection with our audit of the financial statements, we have also audited the financial statement
schedule listed in the accompanying index. The financial statements and schedule are the
responsibility of the Company’s management. Our responsibility is to express an opinion on the
financial statements and schedule based on our audit.
We conducted our audit in accordance with the standards of the Public Company Accounting
Oversight Board (United States). Those standards require that we plan and perform the audit to
obtain reasonable assurance about whether the financial statements are free of material
misstatement. An audit includes examining, on a test basis, evidence supporting the amounts and
disclosures in the financial statements, assessing the accounting principles used and significant
estimates made by management, as well as evaluating the overall presentation of the financial
statements and schedule. We believe that our audit provides a reasonable basis for our opinion.
In
our opinion, the consolidated financial statements referred to above present fairly, in all material
respects, the financial position of RCN Corporation and subsidiaries at December 31, 2009, and the
results of its operations and its cash flows for the year then ended, in conformity
with accounting principles generally accepted in the United States of America.
Also, in our opinion, the financial statement schedule, when considered in relation to the
basic consolidated financial statements taken as a whole, presents fairly, in all material respects,
the information set forth therein.
We also have audited, in accordance with the standards of the Public Company Accounting
Oversight Board (United States), RCN Corporation’s internal control over financial reporting as of
December 31, 2009, based on criteria established in Internal Control — Integrated Framework issued
by the Committee of Sponsoring Organizations of the Treadway Commission (COSO) and our report dated
March 9, 2010 expressed an unqualified opinion thereon.
/s/
BDO Seidman, LLP
Bethesda, Maryland
March 9, 2010
F-2
Table of Contents
REPORT OF INDEPENDENT REGISTERED PUBLIC ACCOUNTING FIRM
The Board of Directors and Stockholders of RCN Corporation
Herndon, Virginia
Herndon, Virginia
We have audited the accompanying consolidated balance sheet of RCN Corporation and
subsidiaries (the “Company”) as of December 31, 2008 and the related statements of operations,
stockholders’ equity, and cash flows for the years ended December 31, 2008
and 2007. In connection with our audit
of the financial statements, we have also audited the financial statement schedule listed in the
accompanying index. The Company’s management is responsible for these financial statements and
schedule, for maintaining effective internal control over financial reporting, and for its
assessment of the effectiveness of internal control over financial reporting. Our responsibility is
to express an opinion on these financial statements and financial schedule based on our audits.
We conducted our audits in accordance with the standards of the Public Company Accounting
Oversight Board (United States). Those standards require that we plan and perform the audits to
obtain reasonable assurance about whether the financial statements are free of material
misstatement and whether effective internal control over financial reporting was maintained in all
material respects. Our audits of the financial statements included examining, on a test basis,
evidence supporting the amounts and disclosures in the financial statements, assessing the
accounting principles used and significant estimates made by management, and evaluating the overall
financial statement presentation. We believe that our audits provide a reasonable basis for our opinions.
In our opinion, the financial statements referred to above present fairly, in all material
respects, the financial position of RCN Corporation and subsidiaries as of December 31, 2008 and
the results of their operations and their cash flows for each of the years in the two-year period
ended December 31, 2008, in conformity with accounting principles generally accepted in the United
States of America.
Also, in our opinion, the financial statement schedule, when considered in relation to the
basic consolidated financial statements taken as a whole, present fairly, in all material respects,
the information set forth therein.
/s/ Friedman LLP
East Hanover, New Jersey
February 24, 2009
February 24, 2009
F-3
Table of Contents
RCN CORPORATION AND SUBSIDIARIES
CONSOLIDATED STATEMENTS OF OPERATIONS
(Dollars in thousands, except share and per share data)
| Year Ended December 31, | ||||||||||||
| 2009 | 2008 | 2007 | ||||||||||
Revenues |
$ | 763,770 | $ | 739,243 | $ | 636,097 | ||||||
Costs and expenses: |
||||||||||||
Direct expenses |
275,240 | 264,219 | 224,770 | |||||||||
Selling, general and administrative (including
stock-based compensation of $10,228, $13,335
and $33,206) |
279,916 | 294,100 | 288,426 | |||||||||
Exit costs and restructuring charges |
575 | 2,314 | 8,194 | |||||||||
Depreciation and amortization |
193,273 | 198,915 | 196,066 | |||||||||
Operating income (loss) |
14,766 | (20,305 | ) | (81,359 | ) | |||||||
Investment income |
395 | 2,880 | 9,424 | |||||||||
Interest expense |
(42,344 | ) | (53,301 | ) | (34,510 | ) | ||||||
Loss on early extinguishment of debt |
— | — | (63,795 | ) | ||||||||
Other expense, net |
(363 | ) | — | (451 | ) | |||||||
Loss from continuing operations before taxes |
(27,546 | ) | (70,726 | ) | (170,691 | ) | ||||||
Income tax expense (benefit) |
1,072 | — | (1,049 | ) | ||||||||
Net loss from continuing operations |
(28,618 | ) | (70,726 | ) | (169,642 | ) | ||||||
Income from discontinued operations, net of tax |
— | — | 1,684 | |||||||||
Gain on sale of discontinued operations, net of tax |
— | — | 15,921 | |||||||||
Net loss |
$ | (28,618 | ) | $ | (70,726 | ) | $ | (152,037 | ) | |||
Net loss per common share: |
||||||||||||
Basic and diluted: |
||||||||||||
Loss from continuing operations |
$ | (0.80 | ) | $ | (1.91 | ) | $ | (4.58 | ) | |||
Income from discontinued operations |
— | — | 0.05 | |||||||||
Gain on sale of discontinued operations |
— | — | 0.43 | |||||||||
Net loss |
$ | (0.80 | ) | $ | (1.91 | ) | $ | (4.11 | ) | |||
Weighted average shares outstanding, Basic and Diluted |
35,632,786 | 36,981,078 | 37,033,456 | |||||||||
The accompanying notes are an integral part of these consolidated financial statements.
F-4
Table of Contents
RCN CORPORATION AND SUBSIDIARIES
CONSOLIDATED BALANCE SHEETS
(Dollars in thousands)
| December 31, | ||||||||
| 2009 | 2008 | |||||||
ASSETS |
||||||||
Current Assets: |
||||||||
Cash and cash equivalents |
$ | 71,808 | $ | 10,778 | ||||
Short-term investments |
15,135 | 52,906 | ||||||
Accounts receivable, net of allowance for doubtful accounts of $6,932
and $3,770 |
65,734 | 63,597 | ||||||
Prepayments and other current assets |
14,727 | 11,446 | ||||||
Total current assets |
167,404 | 138,727 | ||||||
Property, plant and equipment, net of accumulated depreciation of
$839,998 and $672,821 |
654,678 | 718,026 | ||||||
Goodwill |
15,479 | 15,479 | ||||||
Intangible assets, net of accumulated amortization of $84,720 and $78,567 |
106,164 | 112,317 | ||||||
Long-term restricted investments |
11,666 | 15,371 | ||||||
Deferred charges and other assets |
15,060 | 16,843 | ||||||
Total assets |
$ | 970,451 | $ | 1,016,763 | ||||
LIABILITIES AND STOCKHOLDERS’ EQUITY |
||||||||
Current Liabilities: |
||||||||
Accounts payable |
$ | 25,667 | $ | 37,752 | ||||
Advanced billings and customer deposits |
33,908 | 34,246 | ||||||
Accrued expenses and other |
56,472 | 53,754 | ||||||
Accrued employee compensation and related expenses |
18,289 | 18,351 | ||||||
Accrued exit costs |
2,093 | 2,746 | ||||||
Current portion of long-term debt and capital lease obligations |
25,947 | 7,352 | ||||||
Total current liabilities |
162,376 | 154,201 | ||||||
Long-term debt and capital lease obligations, net of current maturities |
709,308 | 735,255 | ||||||
Other long-term liabilities |
90,633 | 110,936 | ||||||
Total liabilities |
962,317 | 1,000,392 | ||||||
Commitments and contingencies |
||||||||
Stockholders’ Equity: |
||||||||
Common stock, par value $0.01 per share, 100,000,000 shares
authorized, 35,616,512 and 36,631,222 shares issued and outstanding |
356 | 366 | ||||||
Additional paid in capital |
454,215 | 451,152 | ||||||
Treasury stock, 404,339 and 276,471 shares at cost |
(6,366 | ) | (5,702 | ) | ||||
Accumulated deficit |
(403,037 | ) | (374,419 | ) | ||||
Accumulated other comprehensive loss |
(37,034 | ) | (55,026 | ) | ||||
Total stockholders’ equity |
8,134 | 16,371 | ||||||
Total liabilities and stockholders’ equity |
$ | 970,451 | $ | 1,016,763 | ||||
The accompanying notes are an integral part of these consolidated financial statements.
F-5
Table of Contents
RCN CORPORATION AND SUBSIDIARIES
CONSOLIDATED STATEMENTS OF CASH FLOWS
(Dollars in thousands)
| Year Ended December 31, | ||||||||||||
| 2009 | 2008 | 2007 | ||||||||||
Cash flows from operating activities: |
||||||||||||
Net loss |
$ | (28,618 | ) | $ | (70,726 | ) | $ | (152,037 | ) | |||
Income from discontinued operations, net of tax |
— | — | (1,684 | ) | ||||||||
Gain on sale of discontinued operations |
— | — | (15,921 | ) | ||||||||
Net loss from continuing operations |
(28,618 | ) | (70,726 | ) | (169,642 | ) | ||||||
Adjustments to reconcile net loss to net cash provided by operating
activities: |
||||||||||||
Non-cash
stock-based compensation expense |
10,228 | 13,335 | 33,206 | |||||||||
Loss on early extinguishment of debt |
— | — | 63,795 | |||||||||
Amortization
of debt issuance costs |
1,687 | 1,685 | 740 | |||||||||
Deferred income taxes, net |
764 | — | (1,049 | ) | ||||||||
Depreciation and amortization |
193,273 | 198,915 | 196,066 | |||||||||
Provision for doubtful accounts |
16,387 | 16,384 | 10,880 | |||||||||
Exit costs and restructuring charges |
84 | (2,699 | ) | 2,460 | ||||||||
Net change in certain assets and liabilities, net of business
acquisitions: |
||||||||||||
Accounts receivable and unpaid revenues |
(18,933 | ) | (13,305 | ) | (12,560 | ) | ||||||
Accounts payable and accrued expenses |
(17,142 | ) | (117 | ) | (13,744 | ) | ||||||
Advanced billing and customer deposits |
(1,868 | ) | (7,670 | ) | 338 | |||||||
Other assets and liabilities |
(2,945 | ) | 4,169 | (1,802 | ) | |||||||
Net cash provided by continuing operations |
152,917 | 139,971 | 108,688 | |||||||||
Cash provided by discontinued operations |
— | — | 476 | |||||||||
Net cash provided by operating activities |
152,917 | 139,971 | 109,164 | |||||||||
Cash flows from investing activities: |
||||||||||||
Additions to property, plant and equipment |
(118,255 | ) | (143,252 | ) | (115,510 | ) | ||||||
Investment in acquisitions and intangibles, net of cash acquired |
— | — | (261,843 | ) | ||||||||
Decrease (increase) in short-term investments |
37,841 | (7,144 | ) | 12,268 | ||||||||
Proceeds from sales of property, plant and equipment |
974 | 1,850 | 1,955 | |||||||||
Proceeds from sale of discontinued operations and other assets |
— | 2,500 | 46,877 | |||||||||
Decrease in restricted investments |
3,705 | 7,396 | 754 | |||||||||
Net cash used in continuing operations |
(75,735 | ) | (138,650 | ) | (315,499 | ) | ||||||
Cash used in discontinued operations |
— | — | (243 | ) | ||||||||
Net cash used in investing activities |
(75,735 | ) | (138,650 | ) | (315,742 | ) | ||||||
Cash flows from financing activities: |
||||||||||||
Payments of long-term debt, including debt premium and capital
lease obligations |
(7,352 | ) | (7,338 | ) | (219,480 | ) | ||||||
Payment of debt issuance cost |
(16 | ) | (67 | ) | (13,944 | ) | ||||||
Proceeds from bank debt |
— | 5,000 | 745,000 | |||||||||
Dividend payments |
(819 | ) | (1,613 | ) | (348,380 | ) | ||||||
Proceeds from the exercise of stock options |
— | 397 | 5,793 | |||||||||
Cost of common shares repurchased |
(7,301 | ) | (7,722 | ) | (3,639 | ) | ||||||
Purchase of treasury stock |
(664 | ) | (993 | ) | (3,321 | ) | ||||||
Net cash (used in) provided by financing activities |
(16,152 | ) | (12,336 | ) | 162,029 | |||||||
Net increase (decrease) in cash and cash equivalents |
61,030 | (11,015 | ) | (44,549 | ) | |||||||
Cash and cash equivalents at beginning of period |
10,778 | 21,793 | 66,342 | |||||||||
Cash and cash equivalents at end of period |
$ | 71,808 | $ | 10,778 | $ | 21,793 | ||||||
The accompanying notes are an integral part of these consolidated financial statements.
F-6
Table of Contents
RCN CORPORATION AND SUBSIDIARIES
CONSOLIDATED STATEMENTS OF STOCKHOLDERS’ EQUITY
(Dollars in thousands, except share and per share data)
| Accumulated | ||||||||||||||||||||||||||||||||
| Treasury | Other | Total | ||||||||||||||||||||||||||||||
| Common Stock | Common Stock | Additional | Stock | Accumulated | Comprehensive | Stockholders’ | ||||||||||||||||||||||||||
| Class A Shares | Class A | Paid in Capital | Shares | Treasury Stock | Deficit | Loss | Equity | |||||||||||||||||||||||||
Balance December 31, 2006 |
37,455,912 | $ | 374 | $ | 722,589 | 56,758 | $ | (1,388 | ) | $ | (151,656 | ) | $ | 17 | $ | 569,936 | ||||||||||||||||
Net loss |
(152,037 | ) | (152,037 | ) | ||||||||||||||||||||||||||||
Foreign currency translation loss |
(73 | ) | (73 | ) | ||||||||||||||||||||||||||||
Change in fair value of interest rate swap |
(19,817 | ) | (19,817 | ) | ||||||||||||||||||||||||||||
Unrealized appreciation on investments |
35 | 35 | ||||||||||||||||||||||||||||||
Comprehensive loss |
$ | (152,037 | ) | $ | (19,855 | ) | $ | (171,892 | ) | |||||||||||||||||||||||
Issuance of restricted stock, net of forfeitures |
145,110 | 2 | (2 | ) | — | |||||||||||||||||||||||||||
Stock options exercised |
315,124 | 3 | 5,818 | 5,821 | ||||||||||||||||||||||||||||
Issuance of warrants |
38,450 | 38,450 | ||||||||||||||||||||||||||||||
Repurchase of common stock |
(261,600 | ) | (2 | ) | (3,639 | ) | (3,641 | ) | ||||||||||||||||||||||||
Purchase of treasury stock |
137,426 | (3,321 | ) | (3,321 | ) | |||||||||||||||||||||||||||
Stock-based compensation expense |
33,206 | 33,206 | ||||||||||||||||||||||||||||||
Dividends declared: $9.33 per common share |
(351,684 | ) | (351,684 | ) | ||||||||||||||||||||||||||||
Balance December 31, 2007 |
37,654,546 | $ | 377 | $ | 444,738 | 194,184 | $ | (4,709 | ) | $ | (303,693 | ) | $ | (19,838 | ) | $ | 116,875 | |||||||||||||||
Net loss |
(70,726 | ) | (70,726 | ) | ||||||||||||||||||||||||||||
Foreign currency translation loss |
(398 | ) | (398 | ) | ||||||||||||||||||||||||||||
Change in fair value of interest rate swap |
(34,653 | ) | (34,653 | ) | ||||||||||||||||||||||||||||
Unrealized depreciation on investments |
(137 | ) | (137 | ) | ||||||||||||||||||||||||||||
Comprehensive loss |
$ | (70,726 | ) | $ | (35,188 | ) | $ | (105,914 | ) | |||||||||||||||||||||||
Restricted stock activity, net of forfeitures |
(19,605 | ) | — | |||||||||||||||||||||||||||||
Stock options exercised |
32,081 | 397 | 397 | |||||||||||||||||||||||||||||
Repurchase of common stock |
(1,035,800 | ) | (11 | ) | (7,711 | ) | (7,722 | ) | ||||||||||||||||||||||||
Purchase of treasury stock |
82,287 | (993 | ) | (993 | ) | |||||||||||||||||||||||||||
Stock-based compensation expense |
13,335 | 13,335 | ||||||||||||||||||||||||||||||
Forfeited dividends |
393 | 393 | ||||||||||||||||||||||||||||||
Balance December 31, 2008 |
36,631,222 | $ | 366 | $ | 451,152 | 276,471 | $ | (5,702 | ) | $ | (374,419 | ) | $ | (55,026 | ) | $ | 16,371 | |||||||||||||||
Net loss |
(28,618 | ) | (28,618 | ) | ||||||||||||||||||||||||||||
Foreign
currency translation reversal |
470 | 470 | ||||||||||||||||||||||||||||||
Change in fair value of interest rate swap |
17,452 | 17,452 | ||||||||||||||||||||||||||||||
Unrealized depreciation on investments |
70 | 70 | ||||||||||||||||||||||||||||||
Comprehensive loss |
$ | (28,618 | ) | $ | 17,992 | $ | (10,626 | ) | ||||||||||||||||||||||||
Restricted stock activity, net of forfeitures |
315,507 | 3 | 3 | |||||||||||||||||||||||||||||
Repurchase of common stock |
(1,330,217 | ) | (13 | ) | (7,288 | ) | (7,301 | ) | ||||||||||||||||||||||||
Purchase of treasury stock |
127,868 | (664 | ) | (664 | ) | |||||||||||||||||||||||||||
Stock-based compensation expense |
10,228 | 10,228 | ||||||||||||||||||||||||||||||
Forfeited dividends |
123 | 123 | ||||||||||||||||||||||||||||||
Balance December 31, 2009 |
35,616,512 | $ | 356 | $ | 454,215 | 404,339 | $ | (6,366 | ) | $ | (403,037 | ) | $ | (37,034 | ) | $ | 8,134 | |||||||||||||||
The accompanying notes are an integral part of these consolidated financial statements.
F-7
Table of Contents
RCN CORPORATION
NOTES TO CONSOLIDATED FINANCIAL STATEMENTS
NOTE 1. ORGANIZATION AND DESCRIPTION OF BUSINESS
RCN Corporation (“RCN” or the “Company”) is a competitive broadband services provider,
delivering all-digital and high-definition video, high-speed internet and premium voice services to
Residential and Small and Medium Business (“SMB”) customers under the brand names of RCN and RCN
Business Services, respectively. In addition, the Company’s RCN Metro Optical Networks business
unit (“RCN Metro”) delivers fiber-based high-capacity data transport services to large
commercial customers, primarily large enterprises and carriers, targeting the metropolitan central
business districts in RCN’s geographic markets. The Company constructs
and operates its own networks, and its
primary service areas include: Washington, D.C., Philadelphia, Lehigh Valley (PA), New York City,
Boston and Chicago.
The Company has two principal business segments (i) Residential/SMB and (ii) RCN Metro. For
financial and other information about the Company’s segments, refer to Note 15.
In connection with the March 2007 sale of the San Francisco operations to Astound Broadband
LLC, a subsidiary of Wave Broadband LLC (“Wave”), and the Company’s exit from the Los Angeles
operations during 2007, the results for these businesses are presented in the consolidated
statements of operations as discontinued operations. At December 31, 2009 and December 31, 2008,
there were no current assets and current liabilities related to these discontinued operations in
the consolidated balance sheets. See Note 3 for a complete discussion of all acquisitions and
dispositions.
NOTE 2. SUMMARY OF SIGNIFICANT ACCOUNTING POLICIES
Basis of Presentation
The accompanying consolidated financial statements of the Company have been prepared in
accordance with rules and regulations of the Securities and Exchange Commission (“SEC”) for annual
reports on Form 10-K. The consolidated financial statements include the accounts of RCN and its
consolidated subsidiaries. All intercompany transactions and balances among consolidated entities
have been eliminated.
Use of Estimates and Assumptions
The preparation of consolidated financial statements in accordance with Accounting Principles
Generally Accepted in the United States (“U.S. GAAP”) requires that management make
estimates and assumptions that affect the reported amounts of assets and liabilities and disclosure
of contingent assets and liabilities at the date of the consolidated financial statements and the
reported amounts of revenue and expenses during the reporting period. Management periodically
assesses the accuracy of these estimates and assumptions. Actual results could differ from those
estimates. Estimates are used when accounting for various items, including but not limited to
allowances for doubtful accounts; investments; derivative financial instruments; asset impairments;
certain acquisition-related liabilities; programming-related liabilities; revenue recognition;
depreciation and amortization; income taxes; exit and restructuring costs; and legal and other
contingencies. Estimates and assumptions are also used when determining the allocation of the
purchase price in a business combination to the fair value of assets and liabilities and
determining related useful lives.
Revisions and Reclassifications
The Company has changed the classification of short-term securities totaling $30.1 million at
December 31, 2008 from cash and cash equivalents to short-term investments to conform to the
Company’s policy of classifying securities with original maturities of greater than three months at
the time of purchase as short-term investments.
Certain other immaterial reclassifications have been made to prior period amounts in order to
conform to the current year presentation.
F-8
Table of Contents
Cash and Cash Equivalents
The Company considers all highly liquid investments with an original maturity of three months
or less at the time of purchase to be cash equivalents. Cash equivalents consist of commercial
paper, government-backed obligations, and money market funds.
Short-term Investments
The Company’s entire portfolio of short-term investments is currently classified as “available
for sale” in accordance with Financial Accounting Standards Board (“FASB”) Accounting Standards
Codification (“ASC”) Topic 320 Investments — Debt and Equity Securities and is stated at fair value
as determined by quoted market values. Investments having maturities of more than three months but
not more than one year at the time of purchase are considered short-term and are classified as
current assets. The Company’s short-term investments consist of the following:
| December 31, | ||||||||
| 2009 | 2008 | |||||||
| (in thousands) | ||||||||
U.S. Treasuries |
$ | 4,911 | $ | 44,150 | ||||
Federal Agency |
10,224 | 7,065 | ||||||
Commercial paper |
— | 1,691 | ||||||
Total |
$ | 15,135 | $ | 52,906 | ||||
Concentration and Monitoring of Credit Risk
Financial instruments that potentially subject the Company to significant concentrations of
credit risk consist primarily of cash and cash equivalents, short-term investments, restricted
investments, accounts receivable, interest rate swap agreements, and undrawn revolving line of
credit commitments.
The Company invests its cash and cash equivalents and short-term investments in accordance
with the terms and conditions of its First-Lien Credit Agreement, which seeks to ensure both
liquidity and safety of principal. The Company’s policy limits investments to instruments issued by
the U.S. government and commercial institutions with strong investment grade credit ratings, and
places restrictions on the length of maturity. The Company monitors the third-party depository
institutions that hold its cash and cash equivalents, and short-term investments. As of December
31, 2009 and 2008, the Company held no direct investments in auction rate securities,
collateralized debt obligations, structured investment vehicles or non-government guaranteed
mortgage backed securities.
The Company’s restricted investments are either held in escrow or in deposit accounts with
institutions having strong investment grade credit ratings.
The Company’s trade receivables reflect a diverse customer base. Up front credit evaluation
and account monitoring procedures are used to minimize the risk of loss. As a result,
concentrations of credit risk are limited. The Company believes that its allowances for doubtful
accounts are adequate to cover these risks.
The Company has potential exposure to credit losses in the event of nonperformance by the
counterparties to its revolving line of credit specifically related to undrawn commitments,
including amounts utilized as collateral for letters of credit, and interest rate swap agreements.
The Company anticipates however, that the counterparties will be able to fully satisfy their
obligations under these agreements, given that they are very large, highly rated financial
institutions who are also key lenders under the Company’s First Lien Credit Agreement.
Accounts Receivable
The Company carries the accounts receivable at cost less an allowance for doubtful accounts.
Allowances for doubtful accounts are recorded as a selling, general and administrative expense. The
Company evaluates the adequacy of the allowance for doubtful accounts at least quarterly and
computes the allowance for doubtful accounts by applying an increasing percentage to accounts in
past due categories. This percentage is based on the history of actual write-offs. The Company
also performs a subjective review of specific large accounts to determine if an additional reserve
is necessary. The formula for calculating the allowance closely parallels the Company’s history of
actual write-offs net of recoveries.
F-9
Table of Contents
Long-Term Restricted Investments
The Company has cash balances held as collateral related to various insurance policies (mainly
general, auto liability, and workers compensation), and surety bonds primarily for franchise and
permit obligations. These investments are restricted and unavailable for use by the Company.
Property, Plant and Equipment
Additions to property, plant and equipment are
stated at cost or fair value, if acquired through an acquisition. Costs
associated with new customer installations and the additions of network equipment necessary to
provide advanced services are capitalized. Costs capitalized as part of initial customer
installations include material, labor, and certain indirect costs. Indirect costs pertain to the
Company’s personnel that assist in connecting the new service and primarily consist of employee
benefits and payroll taxes, and direct variable costs associated with the capitalizable activities
such as installation and construction, vehicle costs, and the cost of dispatch personnel. The
costs of disconnecting service at a customer’s dwelling or reconnecting service to a previously
installed dwelling are charged to expense in the period incurred. Costs for repairs and maintenance
are charged to expense as incurred, while plant and equipment replacement and betterments,
including replacement of cable drops from the pole to the dwelling, are capitalized.
Depreciation is recorded using the straight-line method over the estimated useful lives of the
various classes of depreciable property. Leasehold improvements are amortized over the lesser of
the life of the lease or the asset’s estimated useful life. Equipment held under capital leases is
stated at the lower of the fair value of the asset or the net present value of the minimum lease
payments at the inception of the lease. For assets held under capital leases, depreciation is
recorded using the straight-line method over the shorter of the estimated useful lives of the
leased assets or the related lease term. The significant components of property, plant and
equipment as well as average estimated lives are as follows:
| December 31, | ||||||||||
| Useful Life | 2009 | 2008 | ||||||||
| (in thousands) | ||||||||||
Telecommunications plant |
5 – 22.5 years | $ | 1,118,512 | $ | 1,022,514 | |||||
Indefeasible rights of use |
5 – 15 years | 139,757 | 139,529 | |||||||
Computer equipment |
3 – 5 years | 68,024 | 68,046 | |||||||
Buildings, leasehold improvements and land |
0 – 30 years | 91,462 | 88,832 | |||||||
Furniture, fixtures and vehicles |
3 – 10 years | 28,270 | 27,390 | |||||||
Construction materials and other |
3 – 10 years | 48,651 | 44,536 | |||||||
Total property, plant and equipment |
1,494,676 | 1,390,847 | ||||||||
Less: accumulated depreciation |
(839,998 | ) | (672,821 | ) | ||||||
Property, plant and equipment, net |
$ | 654,678 | $ | 718,026 | ||||||
Depreciation expense was $187.1 million, $179.0 million, and $175.4 million for 2009, 2008 and
2007 respectively.
Depreciation expense in 2009 includes impairment adjustments totaling $4.5 million related to
equipment which has not been returned by former customers. Included in this impairment adjustment
is $1.6 million that relates to periods prior to January 1, 2009. Management believes the impact
of this error is immaterial to each of the applicable prior periods.
The Company accounts for its long-lived assets in accordance with FASB ASC Topic 360 Property,
Plant and Equipment which requires that long-lived assets be evaluated whenever
events or changes in circumstances indicate that the carrying amount may not be recoverable or the
useful life has changed. Such indicators include significant technological changes, adverse
changes in relationships with local franchise authorities, adverse changes in market conditions
and/or poor operating results. The carrying value of a long-lived asset group is considered
impaired when the projected undiscounted future cash flows is less than its carrying value, and the
amount of impairment loss recognized is the difference between the estimated fair value and the
carrying value of the asset or asset group. Fair market value is determined primarily using the
projected future cash flows discounted at a rate commensurate with the risk involved. Significant
judgments in this area involve determining whether a triggering event has occurred, determining the
future cash flows for the assets involved and selecting the appropriate discount rate to be applied
in determining estimated fair value. In 2009, 2008 and 2007, there were no significant long-lived
asset impairment charges.
F-10
Table of Contents
Goodwill and Other Intangible Assets
Goodwill
Goodwill represents the excess of the acquisition cost of an acquired entity over the fair
value of the identifiable net assets acquired. In accordance with the provisions of FASB ASC Topic
350 Intangibles — Goodwill and Other (“ASC Topic 350”), goodwill is not amortized but is tested for
impairment on an annual basis or between annual tests if events occur or circumstances change that
would more likely than not reduce the fair value of a reporting unit below its carrying amount.
Goodwill at December 31, 2009 and 2008 totaled $15.5 million. The Company conducted an annual
impairment test of its goodwill during the fourth quarter of 2009. The Company used an income-based
approach and discounted the cash flows attributable to the RCN Metro reporting unit to estimate its
fair value. Several estimates were incorporated into this analysis, including projected net monthly
installed revenue, related operating and capital spending projections, cost of capital and
estimated terminal value. In addition, comparative market multiples were used to corroborate
discounted cash flow results. The impairment test indicated that the
goodwill was not impaired. To evaluate the sensitivity of the estimated fair value calculation of the Company’s RCN Metro reporting unit on the
annual impairment calculation for goodwill, the Company applied hypothetical 10%, 20% and 30% decreases to the
estimated fair value of the reporting unit. These hypothetical decreases of 10%, 20% and 30% would have no impact on
the goodwill impairment analysis.
Indefinite-Lived Intangibles
In accordance with the provisions of FASB ASC Topic 350, indefinite-lived intangible assets
are tested for impairment on an annual basis or between annual tests if events occur or
circumstances change that would indicate that the assets might be impaired. The Company’s
indefinite-lived intangible assets consist of certain franchise rights associated with the
Residential/SMB segment as well as certain rights-of-way acquired in the NEON transaction. The
Company conducted an annual impairment test of its indefinite-lived assets during the fourth
quarter of 2009 at the units of accounting level. The units of accounting were determined under
the provisions of FASB ASC Topic 350 to be the Company’s franchise rights in the Pennsylvania market and certain
rights-of-way acquired in the NEON transaction. The Company used an income-based approach and
discounted the cash flows attributable to the applicable franchise rights to estimate their fair
value. Several estimates and assumptions were incorporated into this analysis including existing
customers, expected penetration level of marketable homes within the franchised areas, expected
average revenue per customer, projected operating expenses, contributory asset charges, applicable
cost of capital, estimated terminal value and present value of tax benefits. The fair value of the
rights-of-way was estimated using a replacement cost approach using internal personnel involved in
the original construction and attainment of the rights-of-way. The impairment tests performed
indicated that the franchise rights and rights-of-way were not impaired. While management believes
the estimates used in the impairment tests of goodwill and the indefinite-lived intangibles are
reasonable, actual results may differ significantly from these assumptions, which could materially
affect the valuation. To evaluate the sensitivity of the fair value calculations of the Company’s identifiable indefinite-lived intangibles,
the Company applied hypothetical 10%, 20% and 30% decreases to the estimated fair value of each of the Company’s
identifiable indefinite-lived intangibles. These hypothetical 10%, 20% and 30% decreases in estimated fair value would
not have resulted in any impairment of the franchise rights, but would have resulted in impairment charges of
approximately $3.0 million, $7.0 million, and $10.0 million, respectively, for the rights-of-way.
Other Intangibles
The costs of other intangible assets, including trademarks, trade names, customer
relationships and software, are amortized over their estimated useful lives. Amortizable
intangible assets are tested for impairment based on undiscounted cash flows in accordance with
FASB ASC Topic 350 and, if impaired, are written down to fair value based on discounted cash flows.
See Note 6 for the ranges of useful lives of the amortizable intangible assets.
Asset Retirement Obligations
FASB ASC Topic 410 Asset Retirement and Environmental (“ASC Topic 410”) addresses financial
accounting and reporting for obligations associated with the retirement of tangible long-lived
assets and the associated asset retirement costs. FASB ASC Topic 410 requires recognition of a
liability for an asset retirement obligation in the period in which it is incurred at its estimated
fair value. Certain of the Company’s franchise and lease agreements contain provisions that
require the Company to restore facilities or remove property in the event that the franchise or
lease agreement is not renewed. The Company expects to continually renew its franchise agreements
and therefore, cannot estimate any liabilities associated with such agreements. A remote
possibility exists that franchise agreements could terminate unexpectedly, which could result in
the Company incurring significant expense in complying with the
restoration or removal provisions. There are no significant asset retirement-related liabilities recorded
in the Company’s consolidated financial statements.
Legal Contingencies
The Company is subject to legal, regulatory and other proceedings and claims that arise in the
ordinary course of business and, in certain cases, those that the Company assumes from an acquired
entity in a business combination. An estimated liability for those proceedings and claims arising
in the ordinary course of business is recorded based upon the probable and reasonably estimable
criteria contained in FASB ASC Topic 450 Contingencies. The Company reviews outstanding claims
with internal and external counsel to assess the probability and the estimates of loss as new
information becomes available, and adjusts its liabilities as appropriate.
F-11
Table of Contents
Revenue Recognition
Revenues are principally derived from fees associated with the Company’s video, telephone,
high-speed data and transport services and are recognized as earned when the services are rendered,
evidence of an arrangement exists, the fee is fixed and determinable and collection is probable.
Payments received in advance are deferred and recognized as revenue when the service is provided.
Installation fees charged to the Company’s residential and small business customers are less than
related direct selling costs and therefore, are recognized in the period the service is provided.
Installation fees charged to larger commercial customers are
generally recognized over the contract life which is not materially
different than the service life.
Reciprocal compensation revenue, the fees that local exchange carriers pay to terminate calls on
each other’s networks, is based upon calls terminated on the Company’s network at contractual
rates. Under the terms of applicable franchise agreements, the Company is generally required to
pay an amount based on gross video revenues to the local franchising authority. These fees are
normally passed through to the Company’s cable subscribers and accordingly, the fees are classified
as revenue with the corresponding cost included in direct expenses. Certain other taxes imposed on
revenue producing transactions, such as Universal Service Fund fees are also presented as revenue
and expense.
Sales of Multiple Products or Services
When the Company enters into sales contracts for the sale of multiple products or services, then the Company
evaluates whether it has fair value evidence for each deliverable in the transaction. If the Company has fair value
evidence for each deliverable of the transaction, then it accounts for each deliverable in the transaction separately,
based on the relevant revenue recognition accounting policies. For example, the Company sells video, high-speed data and voice services to subscribers in a bundled
package at a rate lower than if the subscriber purchases each product on an individual basis. Subscription revenues
received from such subscribers are allocated to each product in a pro-rata manner based on the fair value of each of
the respective services.
Direct Expenses
Direct expenses consist primarily of video programming costs, leased telecommunications services, voice
termination costs, franchise and regulatory fees, pole rental and right-of-way fees, co-location costs, building access
costs and revenue share payments.
Programming costs consist of the fees paid to suppliers of video content, which is generally obtained through
multiyear agreements and contains rates that are typically based on the number of authorized subscribers that receive
the programming content. At times, as these contracts expire, programming content continues to be provided based on
interim arrangements while the parties negotiate new contractual terms, sometimes with effective dates that affect
prior periods. While actual payments are generally made under the prior contract terms during the negotiation period,
the amount of programming expenses recorded during the negotiation period is based on management’s estimates of the
expected contractual terms to be ultimately negotiated. Programming costs are paid each month based on calculations
performed by the Company and are subject to periodic audits performed by the programmers. Certain programming
contracts contain launch incentives paid by the programmers. The Company records the launch incentives on a
straight-line basis over the life of the programming agreement as a reduction of programming expense. The deferred
amount of launch incentives is included in other long-term liabilities.
The Company accrues for the expected costs of leased telecommunications and voice termination services provided by
third party telecommunications providers in the period the services are rendered. Invoices received from the third
party telecommunications providers are often disputed due to billing discrepancies. The Company accrues for all
disputed invoiced amounts that are considered probable and estimable as contingent liabilities. Disputes that are
resolved in the Company’s favor are recorded as a reduction in direct expenses in the period the dispute is settled.
Because the time required to resolve these disputes is often more than one quarter, any benefits associated with the
favorable resolution of such disputes are often realized in periods subsequent to the accrual of the disputed invoice.
All other direct costs are expensed as incurred.
Selling, General and Administrative Expenses
Selling, general and administrative expenses include customer service, sales, marketing,
billing, network maintenance and repair, installation and provisioning, bad debt, rent and other overhead
costs. All personnel costs, including stock-based compensation but excluding certain retention and
severance benefits accounted for in accordance with FASB ASC Topic 420 Exit or Disposal Cost
Obligations (“ASC Topic 420”), are included in selling, general and administrative expense.
Non-Cash Stock-Based Compensation
The Company accounts for stock-based compensation in accordance with FASB ASC Topic 718
Compensation — Stock Compensation (“ASC Topic 718”), which requires the Company to measure the cost of employee
services received in exchange for an award of equity instruments based on the grant-date fair value
of the award (with limited exceptions) and recognize that cost over the period during which an
employee is required to provide service in exchange for the award—the requisite service period
(usually the vesting period). No compensation cost is recognized for equity instruments for which
employees do not render the requisite service.
F-12
Table of Contents
Exit and Restructuring Costs
Exit
and restructuring costs are recorded in accordance with FASB ASC
Topic 420. The Company
continuously monitors its organizational structure and associated operating expenses. Depending upon
events and circumstances, actions may be taken periodically to restructure the business.
Restructuring activities may include terminating employees, abandoning excess office space and
incurring other exit costs. Any resulting exit and restructuring costs depend on estimates made by
management based on its knowledge of the cost to terminate existing commitments and estimates of
termination benefits. These estimates could differ from actual
results. The Company monitors the initial
estimates periodically and records an adjustment for any significant changes in estimates.
The Company has exited numerous facilities, in whole or in part, over the last three years.
FASB ASC Topic 420 requires the Company to offset the present value of the remaining lease payments
for the exited property against estimated sublease rental income. Sublease assumptions frequently
change based on market conditions, which require the Company to adjust the projected cash flows
related to exited properties. Changes in assumptions are recognized in income when made. When the
Company terminates or buys out of a lease agreement, the payment is charged against the liability
and/or the remaining liability is reversed into income. The Company amortizes the liability for
these facilities as an offset to rent expense, which is included in selling, general and
administrative expense, over the remaining term of the lease.
Upon its emergence from bankruptcy, the Company recorded a liability in “fresh start
accounting” in accordance with the American Institute of Certified Public Accountants (“AICPA”)
statement of position No. 90-7 “Financial Reporting By Entities in Reorganization Under the
Bankruptcy Code” for the excess of cost over fair value on all of its leased
facilities. The liability for these facilities is amortized as an offset to rent expense over the
remaining term of the lease. When the Company exits a facility and accrues an exit cost liability,
it reverses the remaining “fresh start” reserve established for that property into exit costs and
restructuring charges. Similarly, when the Company renegotiates a lease on one of these properties
the reserve is reversed into exit costs and restructuring charges as the amended lease is assumed
to reflect market rates and terms.
Debt Issuance Costs
Debt financing costs are capitalized and amortized to interest expense over the term of the
underlying obligations using the straight-line method which approximates the effective interest
method.
Income Taxes
Income taxes are accounted for under the provisions of FASB ASC Topic 740 Income Taxes (“ASC
Topic 740”). Accordingly, deferred tax assets and liabilities are recognized for the estimated
future tax consequences attributable to differences between the financial statement carrying
amounts of existing assets and liabilities and their respective tax bases, and operating loss and
tax credit carryforwards. Deferred tax assets and liabilities are measured using enacted tax rates
in effect for the year in which those temporary differences are expected to be recovered or
settled. The measurement of net deferred tax assets is reduced by the amount of any tax benefit
that, based on available evidence, is not expected to be realized, and a corresponding valuation
allowance is established. The determination of the required valuation allowance against net
deferred tax assets was made without taking into account the deferred tax liabilities created from
the book and tax differences on indefinite-lived assets.
When the Company has claimed tax benefits that may be challenged by a tax authority, these
uncertain tax positions are accounted for under FASB ASC Topic 740. Under this accounting
guidance, tax benefits are recognized only for tax positions that are more likely than not to be
sustained upon examination by tax authorities. The amount recognized is measured as the largest
amount of benefit that is greater than 50 percent likely to be realized upon settlement. A
liability for unrecognized tax benefits is recorded for any tax benefits claimed in the Company’s
tax returns that do not meet these recognition and measurement
standards. As of December 31, 2009 and 2008, the Company has not recorded any liability for unrecognized tax benefits.
Derivative Instruments and Hedging Activities
In accordance with FASB ASC Topic 815 Derivatives and Hedging (“ASC Topic 815”), all
derivatives are recorded in the balance sheet as either an asset or liability and are measured at
fair value with the changes in fair value recognized currently in earnings unless specific hedge
accounting criteria are met. In May 2007, the Company entered into three interest rate swap
agreements with a notional amount of $345 million to partially mitigate the variability of cash
flows in interest payments due to changes in the LIBOR interest rate on its First-Lien Credit
Agreement. The Company designated the swap agreements as an accounting hedge under FASB ASC Topic
815. These interest rate swap agreements qualify for hedge accounting
because the swap terms match the critical terms of the hedged debt. Accordingly, gains and losses
on derivatives designated as cash flow hedges, to the extent they are effective, are recorded in
accumulated other comprehensive income (loss) and subsequently reclassified to interest expense
during the same period in which the hedged item affects earnings.
F-13
Table of Contents
Accumulated Other Comprehensive Income (Loss)
The Company has three primary components of other comprehensive income (loss): fair value of interest rate swaps,
foreign currency translation losses, and unrealized appreciation (depreciation) on investments. The following table
reflects the components of accumulated other comprehensive loss:
| 2009 | 2008 | 2007 | ||||||||||
| (in thousands) | ||||||||||||
Fair value of interest rate swaps |
$ | (37,018 | ) | $ | (54,470 | ) | $ | (19,817 | ) | |||
Foreign currency translation loss |
— | (471 | ) | (73 | ) | |||||||
Unrealized (depreciation) appreciation on investments |
(16 | ) | (85 | ) | 52 | |||||||
Accumulated other comprehensive loss |
$ | (37,034 | ) | $ | (55,026 | ) | $ | (19,838 | ) | |||
Recently Issued Accounting Pronouncements
In July 2009, the FASB“s Accounting Standards Codification™ (“Codification”) became
the single source of authoritative U.S. GAAP (other than rules and interpretive releases of the
SEC). The Codification is topically based with topics organized by
ASC number and updated Accounting Standards Updates (“ASU”).
ASUs replace accounting guidance that was historically issued as Statements of Financial Accounting
Standards (“SFAS”), FASB Interpretations (“FIN”), FASB Staff Positions (“FSP”), Emerging Issue Task
Force (“EITF”) Abstracts and other types of accounting standards. The Codification became effective
September 30, 2009 for the Company, and disclosures within this Annual Report on Form 10-K have
been updated to reflect the change.
In
January 2010, the FASB issued ASU 2010-6, Fair Value
Measurements and Disclosures, that amends existing disclosure
requirements under ASC Topic 820 by adding required disclosures about items transferring into and out of levels 1 and 2 in the
fair value hierarchy; adding separate disclosures about purchase, sales, issuances, and settlements
relative to level 3 measurements; and clarifying, among other things, the existing fair value
disclosures about the level of disaggregation. This ASU is effective for annual and interim reporting
periods beginning after December 15, 2009, except for the requirement to provide the Level 3 activity
between purchases, sales, issuances, and settlements on a gross basis. That requirement is effective
for fiscal years beginning after December 15, 2010, and for interim periods within those fiscal years.
This pronouncement is related to disclosure only and it is not anticipated to have a material impact
on the Company’s consolidated financial statements.
In October 2009, the FASB issued ASU 2009-13, Multiple-Deliverable Revenue Arrangements which
amends the criteria for when to evaluate individual delivered items in a multiple deliverable
arrangement and how to allocate the consideration received. This ASU is effective for fiscal
years beginning on or after June 15, 2010, which is January 1, 2011 for the Company. This ASU is
effective prospectively for revenue arrangements entered into or materially modified after
January 1, 2011. The Company is currently evaluating the impact that this new accounting guidance
will have on its consolidated financial statements.
In August 2009, the FASB issued ASU 2009-05 Measuring Liabilities at Fair Value to clarify how
entities should estimate the fair value of liabilities under ASC Topic 820. This ASU clarifies the
fair value measurements for a liability in an active market and the valuation techniques in the
absence of a Level 1 measurement. The Company has adopted this guidance in its consolidated
financial statements for the year ended December 31, 2009. The adoption of this ASU did not have a
material impact on the Company’s consolidated financial statements.
F-14
Table of Contents
In May 2009, the FASB issued guidance now included in ASC Topic 855 Subsequent Events. This
guidance establishes general standards of accounting for and disclosures of events that occur after
the balance sheet date but before the consolidated financial statements are issued or are available
to be issued. Among other items, the guidance requires the disclosure of the date through which an entity has evaluated subsequent events and the basis
for that date. In February 2010, the FASB amended its guidance on subsequent events to remove the requirement for SEC filers (as defined in ASU 2010-09) to disclose the date through which an entity has evaluated subsequent events.
The Company has adopted this guidance in its consolidated financial statements for
the year ended December 31, 2009.
In April 2009, the FASB issued guidance now included in ASC Topic 825 Financial Instruments.
The guidance requires that the fair value disclosures required for financial instruments be
included in interim financial statements. In addition, the guidance requires public companies to
disclose the method and significant assumptions used to estimate the fair value of those financial
instruments and to discuss any changes of method or assumptions, if any, during the reporting
period. The guidance was effective for the Company’s year ended December 31, 2009. This
pronouncement is related to disclosure only and did not have a material impact on the Company’s
consolidated financial statements.
In April 2009, the FASB issued guidance now included in ASC Topic 320 Investments - Debt and
Equity Securities that modifies the requirements for recognizing other-than-temporarily impaired debt securities and
revises the existing impairment model for such securities by modifying the current intent and
ability indicator in determining whether a debt security is other-than-temporarily impaired. The
adoption did not have a material impact on the Company’s consolidated financial statements.
NOTE 3. ACQUISITIONS AND DISPOSITIONS
NEON Communications Group, Inc.
On November 13, 2007 (the “Closing Date”), the Company completed the acquisition of NEON
Communications Group, Inc. (“NEON”). The cash purchase price paid was $5.15 per share, resulting
in total cash consideration of approximately $255 million. Including transaction costs, the total
purchase price for NEON was approximately $260 million.
The acquisition of NEON was accounted for under the purchase method of accounting, with the
Company as the acquirer in accordance with FASB ASC Topic 805 Business Combinations. The results
of operations from NEON are included in the accompanying consolidated financial statements from the
Closing Date through December 31, 2009. The following table summarizes, on an unaudited, pro forma
basis, the estimated combined results of operations of the Company for 2007 as though the
acquisition of NEON was completed at the beginning of 2007. These pro forma statements have been
prepared for comparative purposes only and are not intended to be indicative of what the Company’s
results would have been had the acquisition occurred at the beginning of the period presented or
the results which may occur in the future.
| 2007 | ||||
| (dollars in thousands, | ||||
| except per share data) | ||||
Revenues, net* |
$ | 702,394 | ||
Operating loss*(1) |
(95,408 | ) | ||
Net loss*(1) |
(197,330 | ) | ||
Net loss per common share, basic and diluted* |
(5.33 | ) | ||
| * | from continuing operations | |
| (1) | Includes non-recurring charges incurred by NEON (primarily deal-related costs), and stock-based compensation expense totaling $5.4 million during 2007. |
San Francisco and Los Angeles Operations
In March 2007, the Company completed the sale of its San Francisco operations for $45 million
in cash and recorded an after-tax gain on this transaction of $15.9 million. In addition, during
2007, the Company completely exited its operations in the Los Angeles, California market and sold
the building and certain other assets for net total proceeds of approximately $3.9 million and
recorded a de minimis after-tax gain on this transaction. The results of operations of its
California assets are shown as discontinued operations in the consolidated statements of
operations and include operating revenues totaling $6.8 million for 2007.
F-15
Table of Contents
NOTE 4. EXIT COSTS AND RESTRUCTURING CHARGES
Total exit costs and restructuring charges were comprised of the following:
| 2009 | 2008 | 2007 | ||||||||||
| (in thousands) | ||||||||||||
Exit costs for excess facilities |
$ | 84 | $ | 164 | $ | 7,875 | ||||||
Severance and retention |
491 | 2,150 | 3,443 | |||||||||
Recoveries, net |
— | — | (3,124 | ) | ||||||||
Total |
$ | 575 | $ | 2,314 | $ | 8,194 | ||||||
During
2009, the Company recorded exit costs and restructuring charges of $0.6 million,
consisting primarily of employee termination benefits. The Company recorded total exit costs and
restructuring charges of $2.3 million during 2008, primarily consisting of employee termination
benefits associated with a reduction in force and a voluntary separation program in connection with
plans to reduce operating expenses. The majority of these benefits were paid out by the date of
this filing.
Total exit costs and restructuring charges were $8.2 million in 2007, consisting primarily of
exit costs totaling $7.9 million as a result of exiting or terminating property leases in
Pennsylvania, New Jersey and New York and restructuring charges totaling $3.4 million, which were
primarily related to the outsourcing of the Company’s customer care operations. These charges were
partially offset by a $3.1 million settlement for damages incurred relating to space that was
exited in 2002 and are net of legal fees incurred. At the time the property was exited, the
abandoned property, plant and equipment was recorded in exit costs and restructuring charges and
therefore, the portion of the settlement relating to these costs was recorded in exit costs and
restructuring charges during 2007.
The following table presents the activity in the lease fair value and exit cost liability
accounts for 2008 and 2009:
| Exit Costs and | ||||||||||||
| Lease Fair | Restructuring | |||||||||||
| Value | Charges | Total | ||||||||||
| (in thousands) | ||||||||||||
Balance, December 31, 2007 |
$ | 3,345 | $ | 10,300 | $ | 13,645 | ||||||
Additional accrued costs |
— | 2,314 | 2,314 | |||||||||
Amortization |
(654 | ) | (2,207 | ) | (2,861 | ) | ||||||
Reversals / Settlements |
— | (4,694 | ) | (4,694 | ) | |||||||
Balance, December 31, 2008 |
2,691 | 5,713 | 8,404 | |||||||||
Additional accrued costs |
— | 575 | 575 | |||||||||
Amortization |
(621 | ) | (1,351 | ) | (1,972 | ) | ||||||
Reversals / Settlements |
— | (1,187 | ) | (1,187 | ) | |||||||
Balance, December 31, 2009 |
2,070 | 3,750 | 5,820 | |||||||||
Less: current portion |
550 | 1,543 | 2,093 | |||||||||
Long-term portion December 31, 2009 |
$ | 1,520 | $ | 2,207 | $ | 3,727 | ||||||
The current portion of these liabilities is included in accrued exit costs on the balance
sheet and the long-term portion is included in other long-term liabilities.
NOTE 5. FAIR VALUE OF FINANCIAL ASSETS AND LIABILITIES
In accordance with the authoritative guidance for fair value measurements and the fair value
election for financial assets and financial liabilities, a fair value measurement is determined based
on the assumptions that a market participant would use in pricing an asset or liability. A
three-tiered hierarchy was established that draws a distinction between market participant
assumptions based on (i) observable inputs such as quoted prices in active markets (Level 1),
(ii) inputs other than quoted prices in active markets that are observable either directly or
indirectly (Level 2) and (iii) unobservable inputs that require the Company to use present value
and other valuation techniques in the determination of fair value (Level 3). Financial assets and
liabilities are classified in their entirety based on the lowest level of input that is significant
to the fair value measure. The Company’s assessment of the significance of a particular input to
the fair value measurements requires judgment, and may affect the valuation of the assets and
liabilities being measured and their placement within the fair value hierarchy.
F-16
Table of Contents
The Company’s financial assets and liabilities measured at fair value on a recurring basis as
of December 31, 2009 were as follows:
| Level 1 | Level 2 | Level 3 | Total | |||||||||||||
| (in thousands) | ||||||||||||||||
Assets: |
||||||||||||||||
Cash and cash equivalents |
$ | 71,808 | $ | — | $ | — | $ | 71,808 | ||||||||
Short-term investments |
15,135 | — | — | 15,135 | ||||||||||||
Restricted investments |
11,666 | — | — | 11,666 | ||||||||||||
Total financial assets |
$ | 98,609 | $ | — | $ | — | $ | 98,609 | ||||||||
Liabilities: |
||||||||||||||||
Interest rate swap agreements |
$ | — | $ | 37,018 | $ | — | $ | 37,018 | ||||||||
Total financial liabilities |
$ | — | $ | 37,018 | $ | — | $ | 37,018 | ||||||||
For the interest rate swap agreements, fair value is
calculated using standard industry models
based on significant
observable market inputs such as swap rates, interest rates, and implied volatilities obtained from
the counterparties to the swap agreements. The Company performs an independent evaluation to validate the reasonableness of the fair value obtained.
Pursuant to the authoritative guidance which requires fair value disclosures for financial
instruments that are not currently reflected on the balance sheet at fair value, the Company’s term
loan borrowings under the First-Lien Credit Agreement have a fair value of $654.2 million as of
December 31, 2009, as
determined based on the bid and ask quotes for the related debt.
The carrying values of accounts receivable, accounts payable and accrued liabilities are
reasonable estimates of their fair values due to their short maturity.
NOTE 6. INTANGIBLE ASSETS
Intangible assets consisted of the following:
| December 31, 2009 | December 31, 2008 | |||||||||||||||||||
| Gross | Gross | |||||||||||||||||||
| Carrying | Accumulated | Carrying | Accumulated | |||||||||||||||||
| Useful Life | Amount | Amortization | Amount | Amortization | ||||||||||||||||
| (in thousands) | ||||||||||||||||||||
Amortizable intangible assets: |
||||||||||||||||||||
Customer relationships |
4 – 10 years | $ | 88,072 | $ | (70,676 | ) | $ | 88,072 | $ | (67,318 | ) | |||||||||
Trademarks/tradenames |
5 years | 13,573 | (13,573 | ) | 13,573 | (10,958 | ) | |||||||||||||
Software |
3 years | 540 | (471 | ) | 540 | (291 | ) | |||||||||||||
Subtotal |
102,185 | (84,720 | ) | 102,185 | (78,567 | ) | ||||||||||||||
Indefinite-lived intangible assets: |
||||||||||||||||||||
Franchise rights |
Indefinite | 54,842 | — | 54,842 | — | |||||||||||||||
Rights-of-way |
Indefinite | 33,857 | — | 33,857 | — | |||||||||||||||
Total intangible assets |
$ | 190,884 | $ | (84,720 | ) | $ | 190,884 | $ | (78,567 | ) | ||||||||||
Goodwill |
$ | 15,479 | $ | — | $ | 15,479 | $ | — | ||||||||||||
Activity related to the Company’s amortizable intangible assets, net was as follows:
| Resi/SMB | RCN Metro | Total | ||||||||||
| (in thousands) | ||||||||||||
Balance, December 31, 2007 |
$ | 23,422 | $ | 29,247 | $ | 52,669 | ||||||
Adjustments |
— | (9,160 | ) | (9,160 | ) | |||||||
Amortization |
(17,871 | ) | (2,020 | ) | (19,891 | ) | ||||||
Balance, December 31, 2008 |
5,551 | 18,067 | 23,618 | |||||||||
Amortization |
(2,981 | ) | (3,172 | ) | (6,153 | ) | ||||||
Balance, December 31, 2009 |
$ | 2,570 | $ | 14,895 | $ | 17,465 | ||||||
F-17
Table of Contents
Amortization expense was $6.2 million, $19.9 million, and $20.7 million for 2009, 2008 and
2007, respectively. During 2008, management completed the valuation of the tangible and intangible
assets acquired in the NEON transaction in November 2007 (see Note 3) and as a result, the fair
values initially assigned to the intangible assets were adjusted. Specifically, adjustments to increase the value assigned to internally developed software of
$0.2 million and reduce the value assigned to customer relationships by $9.4 million were recorded.
As a result of these adjustments, a cumulative reduction to amortization expense was recognized in
2008 totaling $1.0 million.
Expected amortization expense of finite-lived intangible assets over each of the next five
years is as follows:
| For the Year Ended December 31, | (in thousands) | |||
2010 |
$ | 2,810 | ||
2011 |
2,241 | |||
2012 |
2,241 | |||
2013 |
2,241 | |||
2014 |
2,241 | |||
Thereafter |
5,691 | |||
Total |
$ | 17,465 | ||
NOTE 7. DEFERRED CHARGES AND OTHER ASSETS
Deferred charges and other assets consisted of the following:
| December 31, | ||||||||
| 2009 | 2008 | |||||||
| (in thousands) | ||||||||
Debt issuance cost, net of accumulated amortization |
$ | 7,433 | $ | 9,104 | ||||
Security deposits |
3,215 | 3,368 | ||||||
Other long-term assets |
4,412 | 4,371 | ||||||
Total deferred charges and other assets |
$ | 15,060 | $ | 16,843 | ||||
NOTE 8. OTHER LONG-TERM LIABILITIES
Other long-term liabilities consisted of the following:
| December 31, | ||||||||
| 2009 | 2008 | |||||||
| (in thousands) | ||||||||
Interest rate swaps |
$ | 37,018 | $ | 54,470 | ||||
Deferred taxes |
36,918 | 36,154 | ||||||
Unearned revenue |
9,856 | 11,385 | ||||||
Exit costs |
2,207 | 3,588 | ||||||
Other deferred credits |
3,114 | 2,678 | ||||||
Lease cost/fair value reserve |
1,520 | 2,070 | ||||||
Dividend payable |
— | 591 | ||||||
Total other long-term liabilities |
$ | 90,633 | $ | 110,936 | ||||
F-18
Table of Contents
NOTE 9. LONG-TERM DEBT AND CAPITAL LEASE OBLIGATIONS
Long-term debt consisted of the following:
| December 31, | ||||||||
| 2009 | 2008 | |||||||
| (in thousands) | ||||||||
First-lien term loan |
$ | 702,489 | $ | 709,694 | ||||
Revolving line of credit |
30,000 | 30,000 | ||||||
Capital leases |
2,766 | 2,913 | ||||||
Total |
735,255 | 742,607 | ||||||
Due within
one year (1) |
25,947 | 7,352 | ||||||
Total long-term debt |
$ | 709,308 | $ | 735,255 | ||||
At December 31, 2009, contractual annual maturities of long-term debt and capital lease
obligations over the next five years are as follows (dollars in thousands):
| For the year ending December 31, | ||||
2010 (1) |
$ | 25,947 | ||
2011 |
7,385 | |||
2012 |
7,404 | |||
2013 |
37,425 | |||
2014 |
655,332 | |||
Thereafter |
1,762 | |||
Total |
$ | 735,255 | ||
| (1) | In addition to scheduled mandatory repayments under the First-Lien Credit Agreement, the Company is also required to repay 50% of Excess Cash Flow (as defined in the First-Lien Credit Agreement) if the Company’s Total Leverage Ratio for the period is greater than 3:00:1. Pursuant to this Excess Cash Flow provision, the Company expects to repay $18.6 million on or before April 15, 2010, related to the year ended December 31, 2009. |
The following is a description of the Company’s debt and the significant terms contained in
the related agreements.
First-Lien Credit Agreement
The Company’s credit agreement with Deutsche Bank, as Administrative Agent, and certain
syndicated lenders (“First-Lien Credit Agreement”) provides for term loans to the Company in the
aggregate principal amount of $720 million, and a $75 million revolving line of credit, all of
which can be used as collateral for letters of credit. Approximately $40.1 million of the
revolving line of credit is currently utilized for outstanding letters of credit relating to the Company’s
surety bonds, real estate lease obligations, right-of-way obligations, and license and permit
obligations. As of December 31, 2009, the Company had drawn an additional $30 million under the
revolving line of credit and had $4.9 million of available borrowing capacity remaining. The
obligations of the Company under the First-Lien Credit Agreement are guaranteed by all of its
operating subsidiaries and are collateralized by substantially all of the Company’s assets.
The term loan bears interest at the Administrative Agent’s prime lending rate plus an
applicable margin or at the Eurodollar rate plus an applicable margin, based on the type of
borrowing elected by the Company. The effective rate on outstanding debt at December 31, 2009 and
December 31, 2008 was 4.9% and 5.5%, respectively, including the effect of the interest rate swaps
discussed in Note 10.
The First-Lien Credit Agreement requires the Company to maintain a Secured Leverage Ratio not
to exceed 4.00:1 through December 30, 2010. On December 31, 2010, the maximum permitted Secured
Leverage Ratio declines to 3.50:1, then declines to 3.00:1 on December 31, 2012 where it remains
until maturity in May 2014. The First-Lien Credit Agreement also contains certain covenants that,
among other things, limit the ability of the Company and its subsidiaries to incur indebtedness,
create liens on their assets, make particular types of investments or other restricted payments,
engage in transactions with affiliates, acquire assets, utilize proceeds from asset sales for
purposes other than debt reduction (except for limited exceptions for reinvestment in the
business), merge or consolidate or sell substantially all of the Company’s assets.
The Company is in compliance with all financial covenants under the First-Lien Credit
Agreement as of the date of this filing.
F-19
Table of Contents
NOTE 10. DERIVATIVE INSTRUMENTS AND HEDGING ACTIVITIES
During May 2007, the Company entered into three interest rate swap agreements with an initial
notional amount of $345 million to partially mitigate the variability of cash flows due to changes
in the Eurodollar rate, specifically related to interest payments on its term loans under the
First-Lien Credit Agreement. The interest rate swap agreements have a seven year term with an
amortizing notional amount which adjusts down on the dates payments are due on the underlying term
loans. Under the terms of the swap agreements, on specified dates, the Company makes payments
calculated using a fixed rate of 5.319% and receives payments equal to 3-month LIBOR.
These interest rate swap agreements qualify for hedge accounting because the swap terms match
the critical terms of the hedged debt. The Company has assessed, on a quarterly basis that the swap
agreements are completely effective based on criteria listed in the authoritative guidance
pertaining to cash flow derivative instruments that are interest rate swaps. Accordingly, these
agreements had no net effect on the Company’s results of operations in 2009, 2008 and 2007. The Company uses derivative instruments as risk management tools and
not for trading purposes. As of December 31, 2009 and 2008, the estimated fair values of these swap
agreements were liabilities of $37.0 million and $54.5 million, respectively, and the notional
amount was $335.3 million and $339.2 million, respectively.
The following table summarizes the Company’s outstanding liability derivative instruments and
their effect on the consolidated balance sheet at December 31, 2009 (dollars in thousands):
| Derivatives Designated as Hedging | ||||||||||||
| Instruments | Type of Hedge | Balance Sheet Location | Fair Value of Hedge | |||||||||
Interest rate swap agreements |
Cash flow | Other long-term liabilities | $ | 37,018 | ||||||||
The effects of liability derivative instruments on the Company’s consolidated statement of operations
and other comprehensive income (loss) (“OCI”) for the year ending December 31, 2009 are as follows
(dollars in thousands):
| Gain Recognized in OCI on | Gain or (Loss) Reclassified | Gain or (Loss) Reclassified | ||||||||||
| Derivatives Designated as Hedging | Derivatives (Effective | from Accumulated OCI into | from Accumulated OCI into | |||||||||
| Instruments | Portion) | Income (Effective Portion) | Income (Ineffective Portion) | |||||||||
Interest rate swap agreements |
$ | 17,452 | $ | — | $ | — | ||||||
NOTE 11. STOCKHOLDERS’ EQUITY AND STOCK PLANS
Income (Loss) Per Share
Basic earnings per share (“EPS”) is computed by dividing the income available to common
stockholders by the average weighted number of shares of common stock outstanding during the
period.
The computation of weighted average shares outstanding for the dilutive EPS calculation
includes the number of additional shares of common stock that would be outstanding if all dilutive
potential common stock equivalents would have been issued. The Company incurred losses in 2009,
2008 and 2007 and accordingly, all potential common stock equivalents would have been anti-dilutive
so the average weighted common shares for the basic EPS computation is equal to the weighted
average common shares used for the diluted EPS computation.
The following table shows the securities outstanding that could potentially dilute basic EPS
in the future and the number of shares of common stock represented by, or underlying, such
securities.
| December 31, | ||||||||||||
| 2009 | 2008 | 2007 | ||||||||||
Options |
2,560,774 | 4,057,561 | 3,884,652 | |||||||||
Warrants |
8,018,276 | 8,018,276 | 8,018,276 | |||||||||
Unvested restricted stock units |
2,274,391 | 653,923 | — | |||||||||
Unvested restricted stock awards |
51,672 | 162,128 | 437,482 | |||||||||
Total |
12,905,113 | 12,891,888 | 12,340,410 | |||||||||
F-20
Table of Contents
Common
Stock, Warrants and Dividends
As
contemplated in RCN’s Plan of Reorganization, RCN issued Convertible Notes, which, pursuant to their terms,
were convertible into approximately five million shares of RCN common stock, subject to certain
limitations. All such Convertible Notes were repurchased by RCN in May 2007. As part of the
consideration for the purchase of such Convertible Notes, RCN issued to former holders of such
Convertible Notes warrants to purchase 5,328,521 shares of RCN common stock at an exercise price of
$25.16 per share (subject to adjustment). Following the adjustments caused by the special cash
dividend (discussed below), the warrants are currently exercisable for approximately 8,018,276
shares of common stock at an exercise price of $16.72. All of these warrants were outstanding as
of December 31, 2009 and expire on June 21, 2012.
Also in May 2007, the Company declared a dividend of $9.33 per share of outstanding common
stock (the “special dividend”), pursuant to which approximately $347.3 million was paid in June
2007, excluding an additional amount of $4.5 million in dividends to be paid upon vesting of
employee restricted stock granted prior to the dividend date. As of December 31, 2009,
approximately $0.5 million remains to be paid upon vesting of the employee restricted stock.
Pursuant to the warrant agreement, the adjustment to the price of the common stock due to the
dividend resulted in an adjustment to both the exercise price of the warrants and the number of
shares of common stock for which the warrants are exercisable. Immediately prior to the dividend
“ex” date, the warrants were exercisable for one share of common stock at a price of $25.16 per
share.
Stock Repurchase Program
During 2007, the Company’s Board of Directors authorized the repurchase of up to $25 million
of the Company’s common stock. To date, the Company has repurchased approximately 2.6 million
shares, of which 1,330,217 shares were repurchased in 2009 at a weighted average price of $5.49 totaling
$7.3 million. In 2008 the company repurchased 1,035,800 shares at an average price of
$7.46 totaling $7.7 million. All of these shares were retired. As of December 31, 2009,
approximately $6.3 million remains authorized for repurchases under the stock repurchase program.
Stock-Based Compensation
RCN’s 2005 Stock Compensation Plan (the “Stock Plan”) currently allows for the issuance of up
to 8,327,799 shares of the Company’s stock in the form of stock options, restricted stock and
restricted stock units to RCN’s directors, officers and employees. As of December 31, 2009, there
were approximately 1.3 million shares available for grant under the Stock Plan.
The Company recognizes compensation expense for stock-based compensation issued to or
purchased by employees, net of estimated forfeitures, using a fair value method. When estimating
forfeitures, the Company considers voluntary termination behavior as well as actual option
forfeitures. Any adjustments to the forfeiture rate result in a cumulative adjustment in
compensation cost in the period the estimate is revised. Compensation expense is recorded for
performance-based stock options, restricted stock awards (“RSAs”), and restricted stock units
(“RSUs”) based on the Company’s projected performance relative to the performance goals established
by the Board of Directors.
F-21
Table of Contents
Compensation expense recognized related to RSAs, RSUs and stock option awards are summarized
in the table below:
| 2009 | 2008 | 2007 | ||||||||||
| (in thousands) | ||||||||||||
Restricted stock awards |
$ | 2,082 | $ | 2,832 | $ | 10,093 | ||||||
Restricted stock units |
5,182 | 2,506 | — | |||||||||
Stock options |
2,964 | 7,997 | 23,113 | |||||||||
Total |
$ | 10,228 | $ | 13,335 | $ | 33,206 | ||||||
As of December 31, 2009, total unamortized stock-based compensation expense related to stock
options, restricted stock, and restricted stock units totaled $20.0 million. The unamortized
expense of $20.0 million will be recognized through the third quarter of 2012. The Company expects to recognize approximately $10.5 million,
$6.8 million and $2.7 million in compensation expense in 2010, 2011 and 2012, respectively, based
on outstanding grants under the Stock Plan as of December 31, 2009.
Stock Options
Stock options may be granted as either non-qualified stock options or incentive stock options.
Substantially all of the options become exercisable in three equal installments (generally annual vesting over a three-year period), and generally
expire seven years from the grant date. Certain executives have been awarded stock options which
are performance-based and vest over a three-year period subject to meeting performance goals
established by the Board of Directors.
The following table summarizes the Company’s option activity during 2009, 2008 and 2007:
| 2009 | 2008 | 2007 | ||||||||||||||||||||||||||
| Weighted Average | ||||||||||||||||||||||||||||
| Weighted | Remaining Contractual | Weighted | Weighted | |||||||||||||||||||||||||
| Number of | Average Exercise | Life | Number of | Average Exercise | Number of | Average Exercise | ||||||||||||||||||||||
| Shares | Price | (In Years) | Shares | Price | Shares | Price | ||||||||||||||||||||||
Awards Outstanding at January 1 |
4,057,561 | $ | 13.94 | 3,884,652 | $ | 15.49 | 2,963,674 | $ | 23.37 | |||||||||||||||||||
Granted |
383,975 | 9.05 | 1,362,702 | 11.10 | 330,677 | 14.39 | ||||||||||||||||||||||
Exercised |
— | — | (32,081 | ) | 12.36 | (315,130 | ) | 18.38 | ||||||||||||||||||||
Forfeited |
(1,880,762 | ) | 15.10 | (1,157,712 | ) | 15.97 | (422,368 | ) | 18.76 | |||||||||||||||||||
Special cash dividend adjustment |
— | — | 1,327,799 | 15.57 | ||||||||||||||||||||||||
Awards Outstanding at December 31 |
2,560,774 | $ | 12.35 | 4.02 | 4,057,561 | $ | 13.94 | 3,884,652 | $ | 15.49 | ||||||||||||||||||
Awards Exercisable at December 31 |
1,627,713 | $ | 13.44 | 3.02 | 2,552,767 | $ | 14.98 | 2,283,819 | $ | 15.77 | ||||||||||||||||||
The intrinsic value in the awards
outstanding was $3.4 million at December 31, 2009. There was no intrinsic
value in the awards exercisable at December 31, 2009. During 2008 and 2007, the
total intrinsic value of stock options exercised was $0.04 million and $2.1 million,
respectively and cash received from the stock options exercised was $0.4 million and $5.8
million, respectively. There were no stock options exercised in 2009.
In connection with the special cash dividend declared in May 2007 of $9.33 per share, the
Compensation Committee of the Board of Directors approved antidilution adjustments to outstanding
stock option awards pursuant to the equity-based compensation plans to take into account the
payment of the special cash dividend. Outstanding stock option awards were adjusted on June 12,
2007 (the ex-dividend date) by reducing the exercise price and increasing the number of shares
issuable upon the exercise of each option, in accordance with safe harbor provisions of
Section 409A of the Internal Revenue Code, such that the aggregate difference between the market
price and exercise price multiplied by the number of shares issuable upon exercise was
substantially the same immediately before and after the payment of the special cash dividend. The
antidilution modification made with respect to such options resulted in a decrease in the weighted
average exercise price from $23.69 to $15.58 and an increase in the aggregate number of shares
issuable upon exercise of such options by 1,327,799. Since the Stock Plan permits, but does not
require, antidilution modifications, FASB ASC Topic 718 requires a comparison of
the fair value of each award immediately prior to and after the date of modification, assuming the
value immediately prior to modification contains no antidilution protection, and the value
immediately after modification contains full antidilution protection. This comparison resulted in
an aggregate difference of $14.2 million despite the fact that the aggregate difference between the
market price and exercise price multiplied by the number of shares issuable upon exercise was
substantially the same immediately before and after the modification. As of December 31, 2009, all
of the additional expense as a result of the modification has been recognized.
F-22
Table of Contents
Stock Option Exchange Program
On June 2, 2009, RCN obtained stockholder approval for a stock option exchange program (“the
Program”) that permitted all of the current employees of RCN, except for the chief executive
officer, to exchange outstanding options issued under the Stock Plan for a lesser number of new
options with lower exercise prices. Under the Program, the exchange ratios were designed to result
in a fair value of the replacement options to be granted to be approximately equal to the fair
value of the options that were surrendered. The Program started on July 16, 2009 and ended on
August 12, 2009.
Pursuant
to the Program, RCN accepted for cancellation options to purchase 1,179,651 shares of
the Company’s common stock in exchange for new options to purchase 383,975 shares of the Company’s
common stock. The per share exercise price of the new options is $9.05, which was the closing
price of RCN’s common stock as quoted on the NASDAQ Global Select Market on August 12, 2009. These new options have a three-year vesting period with one-third of the new options vesting on each
anniversary of the grant date. Each of the new options has an expiration date that is seven years
from the exchange date. All new options will be subject to the terms and conditions of the Stock
Plan.
In accordance with the authoritative guidance for stock compensation awards classified as
equity, the exchange of options is characterized as a modification. Any difference between the fair
value of the new options over the fair value of the exchanged options results in additional non-cash compensation expense. No incremental stock
option expense was recognized in connection with the exchange because the fair value of the new
options, as determined based on the Lattice option pricing model, was equal to or lower than the
fair value of the exchanged options.
The following table summarizes additional information regarding outstanding and exercisable
options as of December 31, 2009:
| Options Outstanding | Options Exercisable | |||||||||||||||||||
| Weighted | Weighted | |||||||||||||||||||
| Number | Average | Average | Average | |||||||||||||||||
| Outstanding | Remaining | Exercise | Number | Exercise | ||||||||||||||||
| at | Contractual | Price per | Exercisable | Price per | ||||||||||||||||
| Exercise Price per Option | 12/31/2009 | Life (Years) | Option | at 12/31/2009 | Option | |||||||||||||||
$9.05 |
379,881 | 6.62 | — | |||||||||||||||||
$11.22 |
783,622 | 5.20 | 262,147 | |||||||||||||||||
$12.36 |
240,370 | 2.39 | 240,370 | |||||||||||||||||
$13.79 |
894,419 | 2.39 | 894,419 | |||||||||||||||||
$14.29 |
82,171 | 2.91 | 82,171 | |||||||||||||||||
$14.39 |
95,748 | 4.67 | 64,043 | |||||||||||||||||
$17.42 |
58,027 | 3.43 | 58,027 | |||||||||||||||||
$19.78 |
26,536 | 3.93 | 26,536 | |||||||||||||||||
$9.05 – $19.78 |
2,560,774 | 4.02 | $ | 12.35 | 1,627,713 | $ | 13.44 | |||||||||||||
During 2009, 2008, and 2007, the Company recorded compensation expense related to stock option
grants totaling $2.9 million, $8.0 million, and $23.1 million, respectively. Unamortized
stock-based compensation expense for stock option awards at December 31, 2009 totaled $2.6 million
and will be amortized through the third quarter of 2012.
The Company values its stock options using both the Black Scholes and Lattice Model valuation
methods. Expected volatility is based on the historical volatility of the price of RCN and several
similarly sized cable and telecommunications companies over the past seven years. The Company uses
historical information to estimate award exercises and forfeitures within the valuation model. The
expected term of awards is derived from an analysis of the historical average holding periods and
represents the period of time that options granted are expected to be outstanding. The risk-free
rate for periods within the contractual life of the option is based on the U.S. Treasury yield
curve in effect at the time of grant.
The following table summarizes the weighted average valuation assumptions used in the Black
Scholes valuation of the 2008 awards:
| 2008 | ||||
Dividend yield |
0 | % | ||
Expected volatility |
54.0 | % | ||
Risk-free interest rate |
2.5 | % | ||
Expected life (in years) |
4.5 | |||
The
weighted average fair value of options granted in 2008, valued using
the Black Scholes method, was $4.95.
F-23
Table of Contents
There were no awards granted in 2009 or 2007 that were valued using the Black Scholes
valuation method.
The following table summarizes the weighted average valuation assumptions used in the Lattice
valuation of the 2009, 2008 and 2007 awards:
| 2009 | 2008 | 2007 | ||||||||||
Dividend yield |
0 | % | 0 | % | 0 | % | ||||||
Expected volatility |
53.3 | % | 53.4 | % | 53.1 | % | ||||||
Risk-free interest rate |
3.3 | % | 2.7 | % | 4.3 | % | ||||||
Expected life (in years) |
3.4 | 3.4 | 4.1 | |||||||||
The
weighted average fair value of options granted in 2009, 2008 and
2007, valued using the Lattice method, was $3.45, $4.53 and $5.87,
respectively.
Restricted Stock Awards
Prior to 2008, the Company issued stock-based compensation to employees in the form of RSAs.
RSA awards entitle employees or directors to receive at the end of each vesting period (generally
annual vesting over a three-year period) one share of common stock for each RSA granted,
conditioned on continued employment or service as a director throughout each annual vesting period.
The fair value of each RSA granted is equal to the market price of the Company’s stock at the date
of grant.
The following table summarizes the Company’s RSA activity during 2009, 2008 and 2007:
| 2009 | 2008 | 2007 | ||||||||||||||||||||||
| Weighted | Weighted | Weighted | ||||||||||||||||||||||
| Average | Average | Average | ||||||||||||||||||||||
| Number of | Fair Value | Number of | Fair Value | Number of | Fair Value | |||||||||||||||||||
| Shares | per Share | Shares | per Share | Shares | per Share | |||||||||||||||||||
Nonvested, January 1 |
162,128 | $ | 27.57 | 437,482 | $ | 26.50 | 599,159 | $ | 25.25 | |||||||||||||||
Granted |
— | — | — | — | 220,000 | 27.27 | ||||||||||||||||||
Vested |
(104,477 | ) | 27.65 | (239,506 | ) | 25.59 | (362,731 | ) | 24.71 | |||||||||||||||
Forfeited |
(5,979 | ) | 27.99 | (35,848 | ) | 27.83 | (18,946 | ) | 30.10 | |||||||||||||||
Nonvested, December 31 |
51,672 | $ | 27.35 | 162,128 | $ | 27.57 | 437,482 | $ | 26.50 | |||||||||||||||
During 2009, 2008 and 2007, the Company recorded compensation expense related to RSA grants
totaling $2.1 million, $2.8 million and $10.1 million,
respectively. Compensation expense recorded for performance-based restricted stock is based on the Company’s
projected performance relative to the Board-established performance goals. Unamortized stock-based
compensation expense at December 31, 2009 for RSA grants totaled $0.3 million and will be amortized
through the first quarter of 2010.
Restricted Stock Units
Beginning in 2008, the Company issued stock-based compensation to employees in the form of
RSUs, which are grants of a contractual right to receive future value delivered in the form of RCN
common stock.
During 2009, the Compensation Committee approved grants of 1,828,558 RSUs to management and
employees which vest over a three-year period.
During this period the Compensation Committee also approved grants of 195,954 restricted
stock units to the Board of Directors which generally vest over a one-year period.
F-24
Table of Contents
The following table summarizes the Company’s RSU activity in 2009 and 2008:
| 2009 | 2008 | |||||||||||||||
| Weighted | Weighted | |||||||||||||||
| Average | Average | |||||||||||||||
| Number of | Fair Value | Number of | Fair Value | |||||||||||||
| Shares | per Share | Shares | per Share | |||||||||||||
Nonvested, January 1 |
653,923 | $ | 11.13 | — | $ | — | ||||||||||
Granted |
2,024,512 | 8.91 | 719,231 | 11.15 | ||||||||||||
Vested |
(321,486 | ) | 9.25 | (16,243 | ) | 11.97 | ||||||||||
Forfeited |
(82,558 | ) | 9.37 | (49,065 | ) | 11.22 | ||||||||||
Nonvested, December 31 |
2,274,391 | $ | 9.50 | 653,923 | $ | 11.13 | ||||||||||
Compensation expense for RSUs is recognized for the awards that are expected to vest. The
expense is based on the fair value of the awards on the date of grant recognized on a straight-line
basis over the requisite service period, which is generally a three-year period for employees and
one-year period for the Board of Directors. Compensation expense recorded for performance-based RSUs is based on the Company’s projected performance relative to
the Board-established performance goals. Certain RSUs granted to employees were
performance-based and vest subject to meeting performance goals established by the Board of
Directors.
In 2009 and 2008, the Company recorded compensation
expense related to RSU grants totaling $5.2 million and $2.5 million, respectively. At December 31,
2009, there was $17.1 million of unamortized stock-based compensation expense related to nonvested
RSUs which will be amortized through the third quarter of 2012.
NOTE 12. INCOME TAXES
The provision (benefit) for income taxes on income from continuing operations consisted of
the following:
| 2009 | 2008 | 2007 | ||||||||||
| (in thousands) | ||||||||||||
Current: |
||||||||||||
Federal |
$ | — | $ | — | $ | — | ||||||
State |
308 | — | — | |||||||||
Foreign |
— | — | — | |||||||||
| 308 | — | — | ||||||||||
Deferred: |
||||||||||||
Federal |
— | — | (408 | ) | ||||||||
State |
764 | — | (641 | ) | ||||||||
| 764 | — | (1,049 | ) | |||||||||
Total |
$ | 1,072 | $ | — | $ | (1,049 | ) | |||||
The Company’s 2009 provision for income
taxes was $1.1 million, $0.8 million of which is attributable to changes in the deferred tax
liability provided for the Company’s
indefinite-lived intangibles. The Company’s 2007 provision for income taxes was
a benefit of $1.0 million, all of which is attributable to changes in the
deferred tax liability provided for the Company’s indefinite-lived intangibles.
Deferred income taxes reflect temporary differences in the recognition of revenue and expense
for tax reporting and financial statement purposes. Temporary differences that gave rise to a
significant portion of deferred tax assets and liabilities were as follows:
| December 31, | ||||||||
| 2009 | 2008 | |||||||
| (in thousands) | ||||||||
Net operating loss carryforwards |
$ | 584,265 | $ | 582,388 | ||||
Capital loss carryforward |
7,283 | 7,283 | ||||||
Employee benefit plan |
5,953 | 2,667 | ||||||
Allowance for doubtful accounts |
2,873 | 1,541 | ||||||
Stock-based compensation |
13,318 | 16,504 | ||||||
Unearned revenue |
5,107 | 5,123 | ||||||
Other, net |
8,015 | 8,477 | ||||||
Subtotal |
626,814 | 623,983 | ||||||
Valuation allowance |
(578,127 | ) | (570,222 | ) | ||||
Total deferred tax assets |
48,687 | 53,761 | ||||||
Property, plant, and equipment |
(47,878 | ) | (53,443 | ) | ||||
Intangibles |
(37,727 | ) | (36,472 | ) | ||||
Total long-term deferred tax liabilities |
(85,605 | ) | (89,915 | ) | ||||
Net long-term deferred tax liabilities |
$ | (36,918 | ) | $ | (36,154 | ) | ||
F-25
Table of Contents
The provision (benefit) for income taxes on continuing operations varies from the amounts
computed by applying the U.S. federal statutory tax rate as a result of the following differences:
| 2009 | 2008 | 2007 | ||||||||||
| (in thousands) | ||||||||||||
Net loss |
$ | (28,618 | ) | $ | (70,726 | ) | $ | (152,037 | ) | |||
Total provision (benefit) for income taxes |
1,072 | — | (1,049 | ) | ||||||||
Loss before provision for income taxes |
$ | (27,546 | ) | $ | (70,726 | ) | $ | (153,086 | ) | |||
Federal income tax benefit at statutory rate |
$ | (9,641 | ) | $ | (24,754 | ) | $ | (53,580 | ) | |||
State income taxes, net of federal income tax provision |
964 | (4,328 | ) | (8,864 | ) | |||||||
Valuation allowance |
9,633 | 28,779 | 44,927 | |||||||||
Restructuring costs |
— | — | 15,282 | |||||||||
Nondeductible expenses |
116 | 303 | 746 | |||||||||
Reversal of stock-based compensation |
— | — | 440 | |||||||||
Total provision (benefit) for income taxes |
$ | 1,072 | $ | — | $ | (1,049 | ) | |||||
During 2009, the Company generated federal net operating losses (“NOLs”) of approximately $2.8
million resulting in a deferred tax asset of approximately $1.0 million. During 2008, the Company
generated federal NOLs of approximately $64.2 million resulting in a deferred tax asset of approximately $22.3 million. As of
December 31, 2009, the Company has federal NOL carryforwards of approximately $1.5 billion. The
federal NOLs will expire between 2022 and 2029. Use of the NOLs acquired from NEON and generated
prior to the Company’s emergence from bankruptcy are limited under the ownership change rules in
the U.S. Internal Revenue Code (“IRC”). These limitations have been applied in determining the
federal NOL and the related expiration periods detailed above. The utilization of the expected tax
benefit from property and equipment depreciation could also be impacted by the ownership change
rules of the IRC. In the table above, the change in the state valuation allowance for 2009
is included in State income taxes, net of federal income tax provision.
For 2007 and 2008, the change in the state valuation allowance is included in valuation allowance.
The Company’s ability to use the NOLs can be negatively impacted if there is a future
“ownership change” as defined in Section 382 of the IRC. In general, this would occur if certain
ownership changes related to the Company’s stock that are held by five percent or greater
stockholders, exceeds 50 percent measured over a rolling three year period. In the event an
“ownership change” were to occur, the Company’s ability to utilize the NOLs could
be significantly limited and could cause the Company to be a federal income tax cash payer much
sooner than currently anticipated.
The net change in the valuation allowance for deferred tax assets during 2009 was an increase
of $7.9 million and during 2008 was an increase of $38.9 million. The valuation allowance is
primarily related to deferred tax assets due to the uncertainty of realizing the full benefit of
the NOL carryforwards. In evaluating the amount of the valuation allowance needed, the Company
considers the prior operating results and future plans and expectations. The utilization period of
the NOL carryforwards and the turnaround period of other temporary differences are also considered.
The determination of the required valuation allowance against net deferred tax assets was made
without taking into account the deferred tax liabilities created from the book and tax differences
on indefinite-lived assets.
The Company adopted the provisions of FASB ASC 740-10 on January 1, 2007 which did not have a
material effect on the Company’s consolidated financial position or results of operations. The
statute of limitations for the Company’s U.S. federal income tax returns and certain state income
tax returns, including, among others, California, Illinois, New York and Virginia, remain open for
tax years 2006 and after.
NOTE 13. EMPLOYEE BENEFIT PLANS
The Company has a 401(k) savings plan that covers substantially all of its employees.
Participants in the savings plan may elect to contribute, on a pretax basis, a certain percentage
of their salary to the plan. Through March 2009, the Company matched a certain percentage of each
participant’s contributions in accordance with the provisions of the 401(k) plan. The expense
under the 401(k) plan related to the Company’s matching contribution was $0.5 million, $2.7 million
and $2.6 million for 2009, 2008 and 2007, respectively. The Company suspended the matching
contribution to the Company’s 401(k) plan in the beginning of March 2009.
F-26
Table of Contents
NOTE 14. COMMITMENTS AND CONTINGENCIES
Rent Expense
Total rental expense (net of sublease income of $1.5 million, $1.8 million and $1.2 million
for 2009, 2008 and 2007, respectively) primarily for facilities was $16.7 million, $16.9 million
and $15.1 million for 2009, 2008 and 2007, respectively.
At
December 31, 2009, approximate future minimum payments under
non-cancelable real estate leases,
net of contractual sublease income of $1.9 million in total through 2015, are as follows:
| Year | (in thousands) | |||
2010 |
$ | 16,223 | ||
2011 |
14,020 | |||
2012 |
12,046 | |||
2013 |
10,971 | |||
2014 |
9,625 | |||
Thereafter |
21,826 | |||
Letters of Credit
The Company had outstanding letters of credit in an aggregate face amount of $40.1 million at
December 31, 2009. These letters of credit utilize approximately 53% of the Company’s $75 million
revolving line of credit as collateral.
Guarantees
The Company is a guarantor on four leases for buildings that were used in the former San
Francisco, California operations totaling $10.9 million at December 31, 2009.
Self Insurance
The Company is self-insured on its largest employee medical plan, which covers approximately
57% of its employees, and for its casualty insurance coverage (subject to certain limitations).
The liabilities are established on an actuarial basis and totaled $4.9 million and $5.3 million at
December 31, 2009 and 2008, respectively. The liability is included in accrued expenses and other
liabilities on the consolidated balance sheets.
Litigation
The Company is party to various legal proceedings that arise in the normal course of
business. In the present opinion of management, none of these proceedings, individually or in the
aggregate, are likely to have a material adverse effect on the consolidated financial position or
consolidated results of operations or cash flows of the Company. However, management cannot
provide assurance that any adverse outcome would not be material to the Company’s consolidated
financial position or consolidated results of operations or cash flows.
F-27
Table of Contents
NOTE 15. FINANCIAL DATA BY BUSINESS SEGMENT
The Company’s reportable segments consist of (i) the Residential / SMB business units, and (ii) the
RCN Metro business unit. In evaluating the profitability of these segments, the components of net
income (loss) below operating income (loss) before depreciation and amortization, stock-based
compensation and any exit costs or restructuring charges are not separately evaluated by the
Company’s management. Assets are not allocated to segments for management reporting. Financial data
by business segment is as follows:
| Year Ended December 31, | ||||||||||||
| 2009 | 2008 | 2007 | ||||||||||
| (in thousands) | ||||||||||||
Net Operating Revenues:(1) |
||||||||||||
Residential/SMB(1) |
$ | 574,057 | $ | 567,931 | $ | 546,263 | ||||||
RCN Metro(1) |
189,713 | 171,312 | 89,834 | |||||||||
Total |
$ | 763,770 | $ | 739,243 | $ | 636,097 | ||||||
Operating Expenses:(2) |
||||||||||||
Residential/SMB(2) |
$ | 585,088 | $ | 602,008 | $ | 630,942 | ||||||
RCN Metro(2) |
163,916 | 157,540 | 86,514 | |||||||||
Total |
$ | 749,004 | $ | 759,548 | $ | 717,456 | ||||||
Operating Income before Depreciation &
Amortization, Stock-Based Compensation,
Exit Costs and Restructuring Charges: |
||||||||||||
Residential/SMB |
$ | 155,355 | $ | 145,421 | $ | 135,470 | ||||||
RCN Metro |
63,487 | 48,838 | 20,637 | |||||||||
Total |
$ | 218,842 | $ | 194,259 | $ | 156,107 | ||||||
Stock-Based Compensation: |
||||||||||||
Residential/SMB |
$ | 7,676 | $ | 10,364 | $ | 28,205 | ||||||
RCN Metro |
2,552 | 2,971 | 5,001 | |||||||||
Total |
$ | 10,228 | $ | 13,335 | $ | 33,206 | ||||||
Depreciation and Amortization: |
||||||||||||
Residential/SMB |
$ | 158,036 | $ | 167,532 | $ | 183,855 | ||||||
RCN Metro |
35,237 | 31,383 | 12,211 | |||||||||
Total |
$ | 193,273 | $ | 198,915 | $ | 196,066 | ||||||
Exit Costs and Restructuring Charges: |
||||||||||||
Residential/SMB |
$ | 674 | $ | 1,602 | $ | 8,089 | ||||||
RCN Metro |
(99 | ) | 712 | 105 | ||||||||
Total |
$ | 575 | $ | 2,314 | $ | 8,194 | ||||||
Operating (Loss) Income: |
||||||||||||
Residential/SMB |
$ | (11,031 | ) | $ | (34,077 | ) | $ | (84,679 | ) | |||
RCN Metro |
25,797 | 13,772 | 3,320 | |||||||||
Total |
$ | 14,766 | $ | (20,305 | ) | $ | (81,359 | ) | ||||
Additions to Property, Plant and Equipment: |
||||||||||||
Residential/SMB |
$ | 81,713 | $ | 112,883 | $ | 94,942 | ||||||
RCN Metro |
36,542 | 30,369 | 20,568 | |||||||||
Total |
$ | 118,255 | $ | 143,252 | $ | 115,510 | ||||||
| (1) | All revenues reported for the individual segments are from external customers. | |
| (2) | Operating expenses include stock-based compensation expense. |
NOTE 16. SUPPLEMENTAL SCHEDULE OF NON-CASH INVESTING AND FINANCING ACTIVITIES
The
table below summarizes the Company’s cash payments for interest and income taxes for 2009, 2008 and
2007:
| Supplemental Disclosures of Cash Flow Information | 2009 | 2008 | 2007 | |||||||||
| (in thousands) | ||||||||||||
Cash paid during the period for: |
||||||||||||
Interest, net of capitalized interest of $0 |
$ | 40,059 | $ | 51,213 | $ | 38,663 | ||||||
Income taxes |
$ | 300 | — | — | ||||||||
F-28
Table of Contents
In May 2007, the Company issued 5,328,521 warrants to purchase shares of common stock with an
exercise price equal to $25.16 (subject to adjustment) to the former holders of its Convertible
Notes. Following the adjustments caused by the special cash dividend, the warrants are currently
exercisable for approximately 1.50478 shares of common stock (8,018,276 total shares) at a price
per share of $16.72 (see Note 11).
NOTE 17. SELECTED FINANCIAL DATA (Unaudited)
Quarterly results of operations for 2009 and 2008 are as follows:
| 2009 | ||||||||||||||||||||
| 1st Quarter | 2nd Quarter | 3rd Quarter | 4th Quarter | Total | ||||||||||||||||
| (in thousands, except per share data) | ||||||||||||||||||||
Revenues |
$ | 189,228 | $ | 192,332 | $ | 191,921 | $ | 190,289 | $ | 763,770 | ||||||||||
Operating
income (2) |
879 | 2,534 | 4,689 | 6,664 | 14,766 | |||||||||||||||
Net loss |
(9,632 | ) | (9,401 | ) | (5,668 | ) | (3,917 | ) | (28,618 | ) | ||||||||||
Basic and Diluted: net loss per share |
$ | (0.27 | ) | $ | (0.26 | ) | $ | (0.16 | ) | $ | (0.11 | ) | $ | (0.80 | ) | |||||
| 2008 | ||||||||||||||||||||
| 1st Quarter | 2nd Quarter | 3rd Quarter | 4th Quarter | Total | ||||||||||||||||
| (in thousands, except per share data) | ||||||||||||||||||||
Revenues |
$ | 179,815 | $ | 184,352 | $ | 187,054 | $ | 188,022 | $ | 739,243 | ||||||||||
Operating (loss) income |
(12,845 | ) | (5,088 | ) | (2,631 | ) | 259 | (20,305 | ) | |||||||||||
Net loss |
(26,204 | ) | (16,651 | ) | (14,725 | ) | (13,146 | ) | (70,726 | ) | ||||||||||
Basic and Diluted: net loss per share (1) |
$ | (0.71 | ) | $ | (0.45 | ) | $ | (0.40 | ) | $ | (0.36 | ) | $ | (1.91 | ) | |||||
| (1) | As a result of rounding, the total of the four quarters’ earnings per share does not equal the earnings per share for the year. | |
| (2) | In the second quarter of 2009, the Company recorded an impairment adjustment totaling $4.5 million related to equipment which has not been returned by former customers. Included in this impairment adjustment is $1.6 million that relates to periods prior to January 1, 2009. |
NOTE 18. SUBSEQUENT EVENT
On March 5, 2010, the Company entered into an Agreement and Plan of Merger
(the “Merger Agreement”) with entities controlled by a private equity fund associated
with ABRY Partners, LLC, pursuant to which to those entities agreed to acquire the Company
for total consideration of approximately $1.2 billion, including the assumption of debt.
The transaction is expected to be completed in the second half of 2010, subject to receipt
of stockholder approval, regulatory approvals, including the receipt of required consents and
approvals of the Federal Communications Commission, as well as satisfaction of other customary
closing conditions. The transaction is not subject to any financing condition.
Under the terms of the Merger Agreement, the Company may solicit proposals from third
parties for 40 days through April 14, 2010.
F-29
Table of Contents
RCN CORPORATION AND SUBSIDIARIES
SCHEDULE II
VALUATION AND QUALIFYING ACCOUNTS AND RESERVES
FOR THE YEARS ENDED DECEMBER 31, 2009, 2008 AND 2007
FOR THE YEARS ENDED DECEMBER 31, 2009, 2008 AND 2007
| Additions | ||||||||||||||||||||
| Charged to | ||||||||||||||||||||
| Balance at | Charged to | Other | Accounts | Balance at | ||||||||||||||||
| Beginning | Cost and | Accounts | Written Off | End of | ||||||||||||||||
| of Period | Expense | (2) | (1) | Period | ||||||||||||||||
| (in thousands, except per share data) | ||||||||||||||||||||
Allowance for doubtful accounts receivable |
||||||||||||||||||||
December 31, 2009 |
$ | 3,770 | $ | 16,387 | $ | 3,240 | $ | 16,465 | $ | 6,932 | ||||||||||
December 31, 2008 |
4,298 | 16,384 | (334 | ) | 16,578 | 3,770 | ||||||||||||||
December 31, 2007 |
4,205 | 10,880 | 396 | 11,183 | 4,298 | |||||||||||||||
| (1) | Consists of write-offs, net of recoveries and collection fees in each year. | |
| (2) | Includes certain intercarrier compensation receivables fully reserved for at time of billing in 2009, as well as adjustments and additions for acquisitions in 2008 and 2007. |
F-30