Attached files
| file | filename |
|---|---|
| EX-23.1 - KENEXA CORP | v176546_ex23-1.htm |
| EX-31.2 - KENEXA CORP | v176546_ex31-2.htm |
| EX-21.1 - KENEXA CORP | v176546_ex21-1.htm |
| EX-31.1 - KENEXA CORP | v176546_ex31-1.htm |
| EX-32.1 - KENEXA CORP | v176546_ex32-1.htm |
UNITED
STATES
SECURITIES
AND EXCHANGE COMMISSION
WASHINGTON,
D.C. 20549
FORM
10-K
|
x
|
ANNUAL
REPORT PURSUANT TO SECTION 13 OR 15(d) OF THE SECURITIES EXCHANGE ACT
OF 1934
|
For the
fiscal year ended December 31, 2009
OR
|
¨
|
TRANSITION
REPORT PURSUANT TO SECTION 13 OR 15(d) OF THE SECURITIES EXCHANGE ACT OF
1934
|
For the
transition period
from
to
Commission
File number 000-51358
Kenexa
Corporation
(Exact
Name of Registrant as Specified in Its Charter)
|
Pennsylvania
|
23-3024013
|
|
|
(State
or other jurisdiction of incorporation or organization)
|
(I.R.S.
Employer Identification Number)
|
|
|
650
East Swedesford Road, Wayne, PA
|
19087
|
|
|
(Address
of Principal Executive Offices)
|
(Zip
Code)
|
|
Registrant’s
Telephone Number, Including Area Code: (610) 971-9171
Securities
registered pursuant to Section 12(b) of the Act:
Common
Stock, par value $0.01 per share
(Title
Class)
Indicate
by check mark if the registrant is a well-known seasoned issuer, as defined in
Rule 405 of the Securities Act. Yes ¨ No
x
Indicate
by check mark if the registrant is not required to file reports pursuant to
Section 13 of Section 15(d) of the Act. Yes
¨
No x
Indicate
by check mark whether the registrant (1) has filed all reports required to
be filed by Section 13 or 15(d) of the Securities Exchange Act of 1934
during the preceding 12 months (or for such shorter period that the
registrant was required to file such reports), and (2) has been subject to
such filing requirements for the past 90 days. Yes
x
No ¨
Indicate
by check mark whether the registrant has submitted electronically and posted on
its corporate Web site, if any, every Interactive Data File required to be
submitted and posted pursuant to Rule 405 of Regulation S-T (§232.405 of this
chapter) during the preceding 12 months (or for such shorter period that the
registrant was required to submit and post such
files). Yes ¨ No
¨
Indicate
by check mark if disclosure of delinquent filers pursuant to Item 405 of
Regulation S-K is not contained herein, and will not be contained, to the best
of registrant’s knowledge, in definitive proxy or information statements
incorporated by reference in Part III of this Form 10-K or any amendment to
this Form 10-K. ¨
Indicate
by check mark whether the registrant is a large accelerated filer, an
accelerated filer, a non-accelerated filer, or a smaller reporting company. See
definition of “large accelerated filer”, “accelerated filer” and “smaller
reporting company” in Rule 12b-2 of the Exchange Act. (Check one): Large
Accelerated Filer ¨
Accelerated Filer x
Non-accelerated Filer ¨
Smaller reporting company ¨
Indicate
by check mark whether the registrant is a shell company (as defined in rule
12b-2 of the Act). Yes ¨ No
x
The
aggregate market value of the voting stock held by non-affiliates of the
registrant on June 30, 2009 was approximately $181,145,474. Such aggregate
market value was computed by reference to the closing price of the common stock
as reported on the Nasdaq National Market on June 30, 2009. For purposes of
determining this amount only, the Registrant has defined affiliates of the
Registrant to include the executive officers and directors of Registrant and
holders of more than 10% of the Registrant’s common stock on June 30,
2009.
The
number of shares outstanding of the Registrant’s Common Stock, as of March 3,
2010 was 22,583,034.
DOCUMENTS
INCORPORATED BY REFERENCE
|
DOCUMENT
|
FORM
10-K
REFERENCE
|
|
|
Portions
of Proxy Statement for
2010
Annual Meeting of Shareholders
|
Part
III
|
1
KENEXA
CORPORATION
FORM
10-K
DECEMBER
31, 2009
|
Page
|
|||||
|
PART
I
|
|||||
|
Item 1.
|
Business
|
3 | |||
|
Item 1A.
|
Risk
Factors
|
16 | |||
|
Item 1B.
|
Unresolved
Staff Comments
|
30 | |||
|
Item 2.
|
Properties
|
30 | |||
|
Item 3.
|
Legal
Proceedings
|
31 | |||
|
Item 4.
|
Reserved
|
31 | |||
|
PART
II
|
|||||
|
Item 5.
|
Market
for Registrant’s Common Equity, Related Stockholder Matters and Issuer
Purchases of Equity Securities
|
32 | |||
|
Item 6.
|
Selected
Consolidated Financial Data
|
34 | |||
|
Item 7.
|
Management’s
Discussion and Analysis of Financial Condition and Results of
Operations
|
36 | |||
|
Item 7A.
|
Quantitative
and Qualitative Disclosures About Market Risk
|
63 | |||
|
Item 8.
|
Financial
Statements and Supplementary Data
|
64 | |||
|
Item 9.
|
Changes
in and Disagreements With Accountants on Accounting and Financial
Disclosure
|
103 | |||
|
Item 9A.
|
Controls
and Procedures
|
103 | |||
|
Item 9B.
|
Other
Information
|
105 | |||
|
PART III
|
|||||
|
Item 10.
|
Directors,
Executive Officers and Corporate Governance
|
106 | |||
|
Item 11.
|
Executive
Compensation
|
106 | |||
|
Item 12.
|
Security
Ownership of Certain Beneficial Owners and Management and Related
Stockholder Matters
|
106 | |||
|
Item 13.
|
Certain
Relationships, Related Transactions and Director
Independence
|
107 | |||
|
Item 14.
|
Principal
Accountant Fees and Services
|
107 | |||
|
PART IV
|
|||||
|
Item 15.
|
Exhibits
and Financial Statement Schedules
|
108 | |||
2
PART
I
This
Annual Report on Form 10-K and the documents incorporated herein contain
“forward-looking statements” within the meaning of Section 27A of the
Securities Act of 1933, as amended, and Section 21E of the Securities
Exchange Act of 1934, as amended. Those statements are therefore entitled to the
protection of the safe harbor provisions of these laws. These forward-looking
statements, which are usually accompanied by words such as “may,” “might,”
“will,” “should,” “could,” “intends,” “estimates,” “predicts,” “potential,”
“continue,” “believes,” “anticipates,” “plans,” “expects” and similar
expressions, involve risks and uncertainties, and relate to, without limitation,
statements about our market opportunities, our strategy, our competition, our
projected revenue and expense levels and the adequacy of our available cash
resources. There are important factors that could cause our actual results,
level of activity, performance or achievements to differ materially from those
expressed or forecasted in, or implied by, such forward-looking statements,
particularly those factors discussed in “Item 1A - Risk Factors” in this Annual
Report on Form 10-K.
Although
we believe that the expectations reflected in these forward-looking statements
are based upon reasonable assumptions, no assurance can be given that such
expectations will be attained or that any deviations will not be material. In
light of these risks, uncertainties and assumptions, the forward-looking events
and circumstances discussed in this Annual Report on Form 10-K may not
occur and our actual results could differ materially and adversely from those
anticipated or implied in the forward-looking statements. We disclaim any
obligation or undertaking to disseminate any update or revision to any
forward-looking statement contained herein to reflect any change in our
expectations with regard thereto or any change in events, conditions or
circumstances on which any such statement is based.
Company
Overview
We
provide software, proprietary content and services that enable organizations to
more effectively recruit and retain employees. Our solutions are built around a
suite of easily configurable software applications that automate talent
acquisition and employee performance management best practices. We offer the
software applications that form the core of our on-demand solutions, which
materially reduces the costs and risks associated with deploying traditional
enterprise applications. We complement our software applications with tailored
combinations of outsourcing services, proprietary content and consulting
services based on our 22 years of experience assisting customers in
addressing their Human Resource (HR) requirements. Together, our
software applications and services form complete and highly effective solutions
available from a single vendor. We believe that these solutions enable our
customers to improve the effectiveness of their talent acquisition programs,
increase employee productivity and retention, measure key HR metrics and make
their talent acquisition and employee performance management programs more
efficient.
We sell
our solutions to large and medium-sized organizations through our direct sales
force. As of December 31, 2009, we had a customer base of approximately
4,900 companies, including approximately 170 companies on the Fortune 500 list
published in May 2009. Our customer base includes companies that we billed for
services during the 12 months ended December 31, 2009 and does not
necessarily indicate an ongoing relationship with each such customer. Our top 80
customers contributed approximately 54.9%, 56.3%, and 53.5% of our total revenue
for the years ended December 31, 2009, 2008 and 2007,
respectively. Our customers typically purchase multi-year
subscriptions which provide us with a recurring revenue
stream. Historically, our customers have renewed more than 90% of the
aggregate value of multi-year subscriptions for our on-demand talent acquisition
and performance management solution contracts subject to
renewal. Recently however, the economic downturn has adversely
impacted this trend, resulting in lower annual renewals. During each
of the years ended December 31, 2009 and 2008, our customers renewed
approximately 80% and 75%, respectively, of the aggregate value of multi-year
subscriptions.
We derive
revenue primarily from two sources, subscription fees for our solutions and fees
for discrete professional services. During the years ended December 31,
2009, 2008 and 2007, subscription revenue comprised approximately 84.9%, 80.2%
and 81.7%, respectively, of our total revenue.
Company
History
We are a
Pennsylvania corporation. We began our operations under predecessor companies,
Insurance Services, Inc., or ISI, and International Holding Company, Inc., or
IHC, in 1987. In December 1999, we reorganized our corporate structure by
merging ISI and IHC with and into Raymond Karsan Associates, Inc., or RKA, a
Pennsylvania corporation and a wholly owned subsidiary of Raymond Karsan
Holdings, Inc., or RKH, a Pennsylvania corporation. Each of RKA and RKH were
newly created to consolidate the businesses of ISI and IHC. In April 2000, we
changed our name to TalentPoint, Inc. and we changed the name of RKA to
TalentPoint Technologies, Inc. In November 2000, we changed our name to Kenexa
Corporation, or Kenexa, and we changed the name of TalentPoint Technologies,
Inc. to Kenexa Technology, Inc., or Kenexa Technology. Currently, Kenexa
transacts business primarily through Kenexa Technology and its wholly owned
subsidiaries.
Our
principal executive offices are located at 650 East Swedesford Road, Second
Floor, Wayne, PA 19087.
Our telephone number is
(610) 971-9171. We maintain an Internet website at http://www.kenexa.com. We are not incorporating
by reference into this Annual Report on Form 10-K any material from our
website. The reference to our website is an inactive textual
reference to the uniform resource locator (URL) and is for your reference
only.
Recent
Events
During
the fourth quarter 2008, in response to the challenging macroeconomic
environment, the strengthening U.S. dollar relative to other currencies of
countries in which we do business, and the slowing or delaying of a number of
projects by our customers, we announced a restructuring program involving
reductions of approximately 200 employees and recorded severance and
outplacement benefit costs totaling $2.0 million. During the first
quarter of 2009, as a result of the continued deterioration in the economic
environment, we executed an additional reduction of approximately 159 employees
and recorded severance and outplacement benefit costs totaling $1.2
million.
During
the three months ended March 31, 2009, due to a 32.5% decline in our stock price
and market capitalization from the previous quarter, lower projected net income,
cash flow estimates and slower projected growth rates in our industry, we
reevaluated our goodwill impairment analysis. Our analysis was
performed to determine the implied fair value of our goodwill with neither the
write up or write down of any assets or liabilities, nor recording of any
additional unrecognized identifiable intangible assets. Based upon
our analysis we recorded a goodwill impairment charge of $33.3 million during
the quarter ended March 31, 2009. This goodwill impairment charge had no effect
on our cash balances.
On
January 20, 2009, we entered into an ownership interest transfer agreement (“the
agreement”) with Shanghai Runjie Management Consulting Company, (“R and J”) in
Shanghai, China for $1.3 million. The initial investment provided us
with a 46% ownership in the new entity Shanghai Kenexa Human Resources
Consulting Co., Ltd., (the “variable interest entity”) and a presence in China’s
human capital management market. The agreement also provided for a 1%
annual ownership increase based upon adjusted EBITDA, as defined, for each of
the years ended 2008, 2009 and 2010. In the third and fourth quarter
of 2009, based upon the 2008 operating results for R and J, we paid an
additional $0.2 million in total for an additional 1% ownership interest in the
variable interest entity. The variable interest entity was financed
with $0.3 million in initial equity contributions from us and R and J, and has
no borrowings for which its assets would be used as collateral. On
September 30, 2009, we provided $0.2 million of financing for the variable
interest entity. The creditors of the variable interest entity do not
have recourse to our other assets.
On May
21, 2009, we elected not to renew our secured credit agreement with PNC
Bank. We believe that our cash, short-term investments, UBS
Settlement Agreement (as described in Footnote 3 of the Notes to the
Consolidated Financial Statements) for our auction rate securities and
projected cash from operations will be sufficient to meet our liquidity needs
for at least the next twelve months.
On June
11, 2009 and July 16, 2009, two putative class actions were filed against Kenexa
Corporation and our Chief Executive Officer and Chief Financial Officer in the
United States District Court for the Eastern District of Pennsylvania,
purportedly on behalf of a class of our investors who purchased our publicly
traded securities between May 8, 2007 and November 7, 2007. The complaint filed
on July 16, 2009 has since been voluntarily dismissed. In the pending
action, Building Trades United Pension Trust Fund, individually and on behalf of
all others similarly situated alleges violations of Section 10(b) of the
Securities Exchange Act of 1934 ("Exchange Act"), Rule 10b-5 promulgated
thereunder and Section 20(a) of the Exchange Act in connection with various
public statements made by Kenexa. This action seeks unspecified damages,
attorneys’ fees and expenses.
4
Industry
Overview
Talent
acquisition is the sourcing, recruiting, screening and assessment of employees.
Employee performance management is the systematic process by which an
organization tracks, monitors and optimizes employee behavior and productivity,
and evaluates performance through employee reviews, appraisals and business
metrics.
Drivers
of Demand for Talent Acquisition and Employee Performance Management
Applications
According
to the Bureau of Economic Analysis, an agency of the U.S. Department of
Commerce, the amount spent on U.S. labor in 2009 was approximately $6.3
trillion, or approximately 49.5% of the total U.S. gross domestic product. We
believe that the drivers for human capital are affected by intense competition
for qualified employees as a result of an aging workforce, declining tenure of
employees, increased globalization, the increasing service component of the U.S.
economy and pressure on human resource departments to reduce costs.
Over the
past two decades, many organizations have implemented software systems that
systematize best practices and drive efficiency in most departments, including
enterprise resource planning systems (“ERP”), customer relationship management
systems and supply chain management systems. These software applications provide
a wide array of benefits that both assist revenue growth and eliminate expenses.
Based on our experience, however, we believe that the HR departments of many of
these organizations have only implemented HR information systems, which track
basic employee information for payroll and benefits purposes, or rudimentary
applicant tracking systems. Although these systems provide some level of
automation, they do little to increase the effectiveness of talent acquisition
and employee performance management programs. We believe that few organizations
have systemized best practices for talent acquisition and employee performance
management or have implemented software applications to support these processes
and provide HR professionals with critical analytics and metrics.
Our
experience indicates that, presently, many organizations' talent acquisition
functions consist of manual, paper-based processes, ad hoc outsourcing and
third-party or custom software applications with limited functionality. As a
result, we believe that they suffer from the following
shortcomings:
|
|
•
|
Inefficiency. Many organizations rely on
manual, paper-based processes and they cannot effectively manage the
massive number of candidates presented by today's many recruiting
resources, including unsolicited inquiries, internal referrals, career
fairs, campus recruiting, Internet job boards and third-party referrals,
among many others. As a result, they fail to identify high potential
candidates or fail to process those candidates in a timely
manner.
|
|
|
|
|
|
•
|
Redundancy. Many organizations do not
maintain easily searchable databases of processed candidates and they
often conduct redundant searches. A candidate who did not meet the
criteria for a certain position may meet the criteria for alternative or
future positions. Without an easily searchable database, a candidate may
be overlooked.
|
|
|
|
|
|
•
|
Ineffectiveness. Organizations generally do not
employ sophisticated screening and assessment mechanisms. As a result,
most hiring decisions are at best loosely based on objective indicators of
future success and fail to match high-potential candidates with roles or
positions that leverage their unique abilities and experience. This lowers
the probability that a new hire will succeed, and negatively impacts
employee productivity and
satisfaction.
|
|
|
|
|
|
•
|
Inconsistency. Many organizations screen
applications and resumes based on rudimentary criteria, and do not conduct
sophisticated and objective assessments and base hiring decisions
primarily on subjective, ad hoc interviews. This process lacks consistency
and objectivity. This inconsistency not only negatively impacts the
effectiveness of recruiting programs, but also may expose organizations to
regulatory liability.
|
|
|
|
|
|
•
|
High cost and
inflexibility. As a
result of their inflexibility and absence of a variable cost structure,
organizations must either maintain larger HR departments or purchase a
greater supply of third-party services in order to accomplish their
recruiting goals, significantly increasing the costs of their talent
acquisition programs.
|
5
Similarly,
we believe that many organizations have neither automated nor applied best
practices to employee performance management. In our experience, most
organizations’ employee performance management processes consist of annual
performance reviews and informal mentoring programs. We believe that effective
employee performance management requires a consistent, systematized process that
identifies employee strengths, weaknesses and issues in a timely manner,
continually aligns employee goals with the evolving goals of the organization,
monitors opportunities for internal advancement and enables management to
analyze employee data over time. We believe that the absence of effective
employee performance management systems and processes has the following negative
implications:
|
|
•
|
Failure to
retain top performers. The absence of systems and
processes to ensure the fulfillment, motivation and internal mobility of
key employees negatively impacts an organization's ability to retain its
top performing employees. Management may not have the opportunity to
rectify problems with valued employees before they depart from the
organization without a system to highlight these issues. Reducing employee
turnover can have a material impact on an organization’s
expenses.
|
|
|
|
|
|
•
|
Failure to
optimize productivity. Maximum productivity is
obtained when employees believe their roles match their evolving skill
sets, find their jobs challenging and have confidence in their upward
mobility. The absence of strong employee performance management systems
contributes to the failure to accomplish these goals, and even if
organizations succeed in retaining employees, they may not be able to
maintain maximum productivity from their
employees.
|
|
|
|
|
|
•
|
Failure to
remove poor performers. An employee who does not
fulfill his or her role effectively may have a recurring negative impact
on an organization. To the extent that a poor performer has managerial
responsibility, this negative impact on the organization expands
materially. Without systems that identify poor performers, organizations
may not be able to address weaknesses within their human capital in a
timely manner.
|
We
believe that the failure to employ sophisticated systems in their talent
acquisition and employee performance management processes inhibits organizations
from leveraging valuable data generated through these functions. This can
negatively impact organizations in several ways, including the failure both to
identify overall trends that could improve the efficiency and effectiveness of
its processes and to quickly identify problems that could lead to employee
turnover.
6
Emergence
of On-Demand Applications
Based on
our experience, we believe that organizations have become increasingly
dissatisfied with traditional enterprise software applications, resulting in the
growing adoption of the on-demand model for enterprise software. Historically,
organizations have purchased perpetual software licenses and deployed enterprise
software applications on-site within their IT environment. This traditional
method of purchasing and deploying enterprise software applications has left
many organizations questioning whether the benefits of these technologies
outweigh the following burdens:
|
|
•
|
Expensive and
time consuming implementation. A traditional enterprise
software application requires an organization to invest in ancillary IT
such as hardware systems, application servers, databases, storage, and
backup systems. In addition, the organization must employ consultants or
additional IT staff to integrate the application into increasingly
complicated IT environments and customize the application for specific
needs. The ancillary costs of a complex deployment can be multiples of the
perpetual license fee for the software application and can take several
months or even years to
complete.
|
|
|
•
|
Expensive
maintenance. Once
the software application has been deployed, the organization must make
further investments to maintain the application. In addition to the
maintenance fee paid to the software vendor, which is typically
approximately 20% of the perpetual license fee for all software used in
running the application, the organization must retain both an IT staff
capable of maintaining and upgrading the software as well as personnel to
train new users to operate the applications. Such upgrades must
be made to all applications required to run the software such as operating
system, databases, security patches, etc. We believe that because of the
expense that typical application upgrades significantly lag, denying end
users the benefits of new technologies and solution
functionalities.
|
|
|
•
|
Limited
incentives to ensure customer success. A typical perpetual software
license requires the customer to pay up-front a material amount for the
license, with a significantly smaller amount, typically approximately 20%,
paid annually for basic support and upgrades. This model leaves little
incentive for the software vendor to ensure a successful implementation
and on-going customer
satisfaction.
|
Developments
in technology have enabled software developers to offer enterprise software
applications on an on-demand basis. By leveraging the Internet, multi-tiered
architectures, advances in security and open standards for application
integration, software vendors can offer software applications to their customers
as a service, hosting the software on servers operated by the software vendor.
Customers, using an Internet browser, access the applications, which are
designed to be easily configured and integrated with a customer’s existing
applications.
The
on-demand model fundamentally changes both the purchasing and deployment of
enterprise software from a customer perspective. Rather than making large,
up-front investments in perpetual licenses, customers purchase limited term
subscriptions for on-demand software applications. Further, because only an
Internet browser is required to access on-demand software applications, which
can be easily configured to meet the buyer’s specific needs, organizations
eliminate the expense of ancillary technology and third-party services required
to implement, configure and maintain the enterprise application on-site.
Finally, the finite duration of customer subscriptions provides a strong
incentive to software vendors to ensure that the software provides the expected
benefits to the customer, resulting in consistent customer service. The
on-demand model also reduces research and development support costs for the
software developer. Because only limited versions of the software exist at any
one time, the on-demand model relieves the burden of maintaining and upgrading
historical versions of the software so that customers benefit from a steady
stream of the most recent features and technologies.
We
believe that talent acquisition and employee performance management applications
are particularly well-suited to the on-demand model. Talent acquisition and
employee performance management applications are generally purchased by an
organization’s HR department. Because the HR departments of most organizations
have little historical experience making capital expenditures for enterprise
software applications, we believe that providing these departments the
opportunity to license software applications on a subscription basis eliminates
a major impediment to the adoption of talent acquisition and employee
performance management applications.
7
Our
Solution
We are a
leading provider of integrated talent management solutions. Our solutions enable
organizations to implement systematic talent acquisition practices that ensure
the efficient, effective and consistent hiring of qualified and talented
individuals. Our solutions also provide employee performance management systems
that help to ensure that organizations retain and optimize the performance of
qualified individuals, identify employees who fail to perform, and identify
successors for critical positions. In addition, our solutions help organizations
manage learning and assessment opportunities and events to develop employees for
both current and desired future jobs. Finally, our solutions enable customers to
determine its workforce’s engagement level, and diagnose where changes in
behavior (for individual employees, managers and senior leaders) or HR programs
will improve organizational performance and business outcomes.
Our
solutions are built around a suite of easily configurable software applications
that automate and support talent management leading practices. We believe that
by delivering our products via Software as a Service (SaaS), we materially
reduce the costs and risks associated with traditional enterprise software
application implementations. We also believe that implementing feature-rich and
scalable, highly configurable on a real-time basis, talent acquisition and
employee performance management solutions that meet organizations’ specific
needs requires a combination of software, services and
domain-specific knowledge and expertise. Accordingly, we complement our software
applications with consulting services, outsourcing services and proprietary
content. Together, these components form solutions that enable our customers to
improve the quality of their hiring programs, increase employee productivity and
retention, enhance employee learning and development, increase employee
engagement, and make their integrated talent management programs more
cost-effective.
|
|
•
|
More
effective and consistent talent acquisition programs. Our talent acquisition
solutions are comprised of two major components that enable our customers
to increase the consistency and effectiveness of their recruiting
programs. The first component is our applicant tracking system, which
automates and streamlines the recruiting process. The second component is
our testing and assessment solutions, which ensures that candidates have
the desired knowledge, skills, behavior and experience necessary to be
successful in the desired position. Our talent acquisition solutions
enable our customers to:
|
|
|
•
|
expand the pool of qualified
applicants;
|
|
|
•
|
accurately communicate a powerful
employment brand that draws “best fit” candidates to the
organization;
|
|
|
•
|
identify high-potential
candidates more quickly;
|
|
|
•
|
accurately measure candidate
skills, aptitude and
experience;
|
|
|
•
|
create interviews focused on
necessary skills and qualities indicative of
success;
|
|
|
•
|
increase interview consistency
and objectivity;
|
|
|
•
|
identify training needs
immediately;
|
|
|
•
|
document compliance with
regulatory requirements; and
|
|
|
•
|
ensure cultural fit between
candidates and the
organization.
|
|
|
•
|
Greater
employee productivity and retention. Our employee performance
management solutions combine software, proprietary content and consulting
services to automate and systematize employee performance management
leading practices. Specifically, our solutions enable organizations to
automate goal setting, performance appraisal, succession planning, career
planning, and compensation management activities, manage learning and
development events, design and administer effective and consistent
employee surveys and implement productive mentoring programs. Our
solutions include tools that facilitate the development of action plans to
address weaknesses and cultivate strengths identified through these
processes. We complement the software components of our solutions with
consulting services that help to encourage and manage behavioral change
within an organization. As a result, we understand that our customers
experience greater employee productivity and improved employee retention
after implementing our solutions, and thus directly impact business
outcomes.
|
|
|
|
|
|
•
|
More
cost-effective talent acquisition and employee performance management
programs. We believe
that our solutions increase the cost-effectiveness of talent acquisition
and employee performance management programs in three ways. First, our
solutions automate these activities, enabling organizations to maintain
smaller HR departments and eliminate some third-party services. Second,
our solutions enable organizations to more effectively identify
high-potential candidates and retain qualified employees. Third, our
solutions provide management the opportunity to achieve economies of scale
by outsourcing non-core functions while also ensuring the application of
best HR practices and leading technology to these
functions.
|
8
|
|
•
|
Application
of analytics to talent acquisition and employee performance management
programs. Our
solutions enable organizations to use the data generated by their talent
acquisition and employee performance management programs in order to
improve these programs. Specifically, our solutions enable management to
identify overall trends that could improve the efficiency and
effectiveness of their processes. For example, we enable our customers to
identify their most productive recruiting channels, establish criteria
indicative of success in various roles and identify problems that could
lead to employee turnover.
|
|
|
•
|
Ease of
integration, configuration and deployment. We provide the software
applications that form the core of our solutions on an on-demand basis,
eliminating the material expenses and complexity of traditionally
purchased and deployed software applications. We combine this deployment
model with an intuitive user interface to facilitate rapid and widespread
adoption within the HR department. Our solutions are designed for ease of
use by non-technical staffing professionals, managers, candidates and
employees. We believe that these aspects of our solutions enable
organizations to quickly achieve the anticipated
benefits.
|
Our
objective is to be the leading global provider of human capital management
business solutions for global organizations with more than 5,000
employees. Key elements of our strategy include:
|
|
•
|
Focus on
strategic talent management solutions. Unlike some vendors that
provide broad suites of HR administrative software, we have focused on the
strategic HR functions that have the greatest potential to build and
improve the workforces of our customers. We believe that this focus has
enabled us to deliver solutions that meet the unique needs of our
customers in these areas. We also believe that this focus has helped us to
generate an increasingly recognized brand in these markets, which are
expected to grow at a materially faster rate than the broader Human
Capital Management (HCM) market over the next five years. We intend to
continue to broaden our footprint in the integrated talent management
space in order to leverage our increasingly recognized brand in these
markets and these positive market
dynamics.
|
|
|
•
|
Provide
innovative and industry-specific solutions to our customers. During the past three years, we
have introduced several new solutions, each in response to the unique
needs of our customers. We intend to continue to work closely with our
customers to further develop innovative solutions that increase the
effectiveness of their recruiting programs and contribute to greater
employee retention and productivity. We have also introduced specific
solutions for the following vertical industries: financial services and
banking, manufacturing, life sciences, biotechnology and pharmaceuticals,
retail, healthcare, hospitality, call centers, and education. We intend to
develop specific solutions for additional vertical
industries.
|
|
|
•
|
Cross-sell
additional solutions to and further penetrate current
customers. During
the year ended December 31, 2009, we renewed approximately 80% of the
aggregate value of multi-year subscriptions for our on-demand talent
acquisition and performance management solution contracts subject to
renewal. This renewal rate provides us with a strong base of recurring
revenue. We believe that our strong customer relationships provide us with
a meaningful opportunity to cross-sell additional solutions to our
existing customers and to achieve greater penetration within an
organization. We expect to continue to create innovative programs designed
to provide our employees with strong incentives to maximize the value we
provide to each of our
customers.
|
|
|
•
|
Continue to
leverage our global sourcing strategy to provide quality solutions
efficiently. We
established offices in Hyderabad, India in 2003. In January 2008 we
completed construction and opened our facility in Vizag,
India. We currently have approximately 312 employees working in
our offices in Hyderabad and Vizag. We believe our sourcing
strategy will continue to provide significant benefits to our customers
including cost benefits and year round customer service, 24 hours a day, 7
days a week.
|
|
|
•
|
Expand our
global presence and customer base. For the year ended
December 31, 2009 we have expanded our global presence to over 21
countries. Although our primary focus has been on the U.S. market, our
solutions are also well suited to addressing problems faced by
organizations outside the United States. In the future, we intend to
expand our distribution efforts in Europe, the Middle East and the
Asia/Pacific region. Although we have employed a direct sales force in the
United States, we intend to expand our international distribution through
direct sales and strategic partnerships. We believe that pursuing a
channel strategy enables us to limit the costs associated with
international expansion and acknowledges that different geographies
present different cultural challenges best addressed by a local sales
force.
|
|
|
Pursue
complementary acquisitions. We have completed 28
acquisitions of businesses since 1994. These acquisitions have helped us
to adapt our business to the evolving needs of our customers. We believe
that the HCM market is significantly fragmented. Many competing companies
have strong technology or vertical market expertise but lack the scale to
compete with the industry leaders in the long term. We continue to
identify similarly situated companies that we believe could broaden the
functionality and strength of our existing
solutions.
|
9
Our
Products and Services
We offer
unified business solutions that support hiring and retention for the entire
employee lifecycle.
Hiring
Solutions:
Recruitment Process
Outsourcing (“RPO”)
Our RPO
offering delivers a higher quality of candidate-fast. With operations around the
globe, we use technology and human ability to reach hard-to-find candidates and
deliver them real-time to recruiters. We understand organizations need us to
provide better recruiting for less, and use our global resources to drive cost
savings and improve their workforces. Kenexa RPO provides global recruitment
services for the largest companies in the world.
Recruitment
Technology
We
provide complete Recruitment Technology systems for the largest, most complex
organizations in the world. Our web-based technology provides everything
organizations need to locate and track talented candidates as they move through
the hiring process. Built using cutting-edge technologies, our Recruitment
Technology solutions deliver comprehensive support of recruiting processes,
giving companies visibility and access to critical hiring and retention
data.
Onboarding
Our
Onboarding solution is built on the belief that every new employee needs to have
the right information to be effective. Our solution offers forms management for
legal documents, workflow and electronic signatures. We help companies extend a
positive brand impression through ongoing communication and socialization that
reinforces their culture and business practices. This helps organizations reduce
the amount of time it takes employees to be fully competent in their
jobs—increasing productivity and return on investment.
Employee
Assessments
We offer
Employee Assessments that help organizations select and retain top performers
based on seven key areas that predict individual performance and
potential—experience, skills, abilities, personality, motivation, situational
judgment and culture fit. Our tools are delivered in the most usable
formats—online, interviews and assessment centers. All of our solutions can be
used as standalone systems or easily integrated with the quality and efficiency
of recruiting and selection processes. They allow organizations to make better
hiring and promotion decisions, and ensure that employees are a perfect fit in
the organization’s culture.
Skills
Tests
We offer
skills tests that improve the screening process by helping organizations quickly
identify and select the most talented candidates. Easy-to-use and administer,
Kenexa Prove It!® System
offers more than 1,000 validated assessments for specific job classifications,
including software, office/professional, call center, financial, healthcare,
industrial, legal and technical positions. Test results are received
instantly—ideal for selecting candidates in a fast-paced, competitive
environment.
Structured
Interviews
We offer
structured interviews that assess candidates with greater accuracy, objectivity
and consistency, while improving the fit of new hires within each organization's
culture. Kenexa Interview Builder® System
provides a powerful online structured interview reference library of more than
3,000 questions that increase interviewer confidence, efficiency, accuracy and
defensibility. With the ability to custom select behavioral, situational,
attitudinal and job knowledge questions, Interview Builder encourages candidates
to speak freely about their experiences and provides a broad spectrum of job
analysis tools, job description templates, interview guides and competency
profiles.
Employment
Branding
Our
Employment Branding offering applies the same consumer branding principles of
attracting and retaining customers to attracting and retaining top employees.
It’s a practice built on research that uncovers the strengths, weaknesses and
hidden elements of an organization’s culture. Employment Branding integrates
seamlessly with every Kenexa solution to create award-winning recruitment
campaigns, provide candidates with an engaging career site experience, uncover
the right media mix for sourcing, give insight into employee engagement and help
retain top performers.
10
Retention
Solutions:
Performance
Management
We offer
comprehensive Performance Management solutions that integrate performance
management, compensation management, career development, goal alignment and
succession planning. Our solutions enable companies to increase productivity,
streamline processes, increase accountability and enhance employee
engagement.
Employee
Surveys
We
deliver Employee Surveys that provide the measurements needed to further each
organization and improve business outcomes. With the industry’s best
psychologists and top HR experts, we believe we are the proven leader in survey
design, administration, reporting and behavior change. Our depth of experience,
proven track record, high client retention rate, industry leading normative data
and global footprint make us unique. Our tools and technology are intuitive and
customized for each organization, making them easy for survey champions,
employees and managers to use.
Learning
Management
Our
Learning Management solution enables organizations to deliver and track employee
learning. Our system is ideal for all types of training, including skills and
behavioral learning, new-hire orientation, leadership education and sales
training. We help companies tailor the delivery of learning management processes
by division, business unit and geography.
Leadership
Solutions
We
understand that leadership development efforts are not universal—they must be
tailored to each organization’s specific metrics and processes. Our Leadership
Solutions are designed to address core business needs by increasing the quality
of leadership in organizations. We offer Leadership Audit, Leadership
Assessments and Leadership Development solutions that align with each company’s
business strategies to help drive greater organizational performance and
success.
Technology,
Development and Operations
Technology
We
believe that the current market desires integrated talent management solutions
that deliver a high degree of business value by linking human capital management
solutions more directly to business outcomes. Available in a Software
as a Service (SaaS) context, extending a customer’s enterprise, this technology
must be easy to use and inexpensive to configure and integrate with the customer
enterprise. Kenexa solutions deliver this value by meeting the
diverse needs of key stakeholders (Executives, HR, line managers, and
employees), by supporting enterprise processes, and by integrating seamlessly
with a wide variety of internal and third party applications and
services.
Kenexa’s
technology strategy is a two-pronged approach: continued enhancement to our
common services and existing applications, which provide standard features and
functionally.
|
•
|
Common
Services. Kenexa
utilizes a Service Oriented Architecture (SOA) to integrate its
applications to other applications, vendors and customers. These common
services also include application functionality that can be leveraged
across multiple Kenexa applications, enables extension of best-of-breed
capabilities, and drives rapid code deployment across applications. The
benefit to Kenexa customers is that it enables us to bridge current
applications with future needs, and better meet the diverse needs of our
customer base.
|
|
•
|
Kenexa
2x™Products. This
solution set is a Platform as a Service (PaaS) and represents the next
generation of Kenexa development, via a fully integrated talent management
application on a unified data model, security infrastructure, and user
experience,
with a universal
talent record that enables organizations to aggregate all talent data
across the enterprise and spanning entire employee life
cycles. Kenexa 2x has been architected to use Common Services
for various functions and to integrate with Kenexa Recruiter ® BrassRing
category applications.
|
This
architecture enables us to meet the needs of our current customer base while
developing and deploying future capabilities with little to no customer impact,
and thus delivers a high degree of customer care.
Our
software is designed to support easy-to-use features such as dynamic workflows,
job templates and user configuration that enable customers to adapt the
application for their specific requirements. Dynamic workflows are designs that
facilitate business processes whereby one step in the process cannot be
completed until all prior steps have been completed.
11
Development
Innovation
is an important part of our business. We believe that three primary factors
drive our innovation: our employees, our domain experts and our customers. We
have a formalized system to cultivate participation from all of our employees in
research and development. We also leverage the experience of our research
scholars and domain experts, who produce white papers, case studies and thought
pieces which form the foundation for our innovation. Our research and
development team maintains a repository of ideas, and selected ideas are
presented to the market validation team. Market validated ideas progress to the
prototype stage. The executive team reviews prototypes and
selects those with the highest potential, which then enter the product
development phase. In addition to our employees and domain experts, some of the
key ideas are generated from customer feedback gathered during user group
meetings, customer symposiums, and advisory councils.
We follow
a development methodology that we believe allows us to develop projects quickly
and then proceed on a predictable, low risk path for high-quality results. We
conduct our product development through our global development
teams. We are in the process of transitioning from being an ISO
9001:2000 certified organization to a Capability Maturity Model Integration
(CMMI) certified organization. We intend to seek CMMI certification
in the coming years.
Operations
Our data
centers in Sterling, Virginia and Blanchardstown, Ireland serve as our hosting
facilities for our on-demand solutions. We also have data centers in
Massachusetts, Pennsylvania, Nebraska, England, and India. We seek to adhere to
industry standards and best practices in our global operations. Our goal is to
deliver world-class hosted solutions that are highly available, scalable and
reliable across our suite of Talent Management solutions. We believe that we
offer best-in-industry security to our customers and demonstrate this through a
number of security related certifications including CyberTrust Enterprise,
CyberTrust Application, TRUSTe, and SafeHarbor. We seek to deliver quality
service with service level guarantees to customers.
Our
Hosting Operations and Security teams include multiple Certified Information
Systems Security Professionals, or CISSPs, with training in the latest security
and availability threats. Our data centers are continuously and proactively
monitored by a comprehensive set of tools, personnel, as well as partnering with
a third party intrusion detection vendor, 24 hours a day, 7 days a
week. Our hosted data center has built-in power redundancy from multiple power
grids with uninterrupted power supplies backed up by N+1 diesel generators
designed to provide uninterrupted service to our customers. The hosted
infrastructure is designed with a focus on quality, reliability, scalability,
privacy and security.
Customers
As of
December 31, 2009, we had a customer base of approximately 4,900 companies
over a number of industries, including financial services and banking,
manufacturing, life sciences, biotechnology and pharmaceuticals, retail,
healthcare, hospitality, call centers, and education, including approximately
170 companies on the Fortune 500 list published in May 2009. Our customer base
includes companies that we billed for services during the year ended
December 31, 2009 and does not necessarily indicate an ongoing relationship
with each such customer. For the year ended December 31, 2009, we provided
our talent acquisition and employee performance management solutions on a
subscription basis to approximately 4,212 customers, with an average
subscription term of two years. The remainder of our customers in
2009 engaged us to provide discrete professional services and may not engage us
for future services once a project is completed. No single customer accounted
for more than 10% of our revenue in the year ended December 31,
2009.
Customer
Support
We
believe that superior customer support is critical to our customers. Our
customer support group assists our customers by answering questions and
troubleshooting issues involving our solutions. Customer support is available
24 hours a day, 7 days a week by telephone and Internet from a member
of our customer support team. Members of our customer support team receive
comprehensive training and orientation to ensure that our customers receive
high-quality support and service. Each of our customers is
assigned a single point of contact. When an issue is reported to us, our
customer support personnel follow a clearly defined escalation process to ensure
that mission-critical issues are resolved to the satisfaction of the
customer.
We
utilize our talent acquisition and employee performance management solutions to
recruit and manage our customer support personnel. We believe that applying
these solutions to our customer service department has resulted in a customer
support group with superior skills, competencies and aptitude for customer
service. As of December 31, 2009, our customer support group consisted of
776 employees. The majority of our customer support groups reside in the
following locations: Massachusetts, Nebraska, Pennsylvania, Texas, England,
Germany, India and Poland.
12
Sales
and Marketing
Our
target customers are large and medium-sized organizations with complex talent
acquisition and employee performance management needs. We sell our solutions to
both new and existing customers primarily through our direct sales force, which
is comprised of inside sales, telesales and field sales personnel. Our marketing
strategy focuses on building Kenexa’s value proposition in the marketplace,
increasing the productivity of our sales engine and establishing relationships
with industry influencers.
We
believe that our customer relationships provide us with a meaningful opportunity
to cross-sell additional solutions to our existing customers and to achieve
greater penetration within the organizations. We have established a program
intended to increase cross-selling into our largest customers, and we expect to
continue to create innovative programs designed to incent our employees and
maximize the value we provide to each of our customers.
Our
marketing initiatives are generally targeted toward specific vertical industries
or specific solutions. Our marketing programs primarily consist of:
|
•
|
participation
in and sponsorship of conferences, symposiums, regional user groups,
networks, tradeshows and industry
events;
|
|
•
|
direct
marketing campaigns;
|
|
•
|
advertising
in online media outlets, trade and mainstream
publications;
|
|
•
|
creation
of white papers, case studies, sales materials and thought leadership
papers;
|
|
•
|
leveraging
our website to provide product and company information, podcasts, social
media forums, and resources to professionals;
and
|
|
•
|
Focusing
public relations efforts on building and enhancing our brand in the
marketplace.
|
Employees
As of
December 31, 2009, we had 1,459 employees, consisting of 243 employees in
sales and marketing, 291 employees in development, 776 employees in delivery of
our solutions and 149 employees in general and administrative
positions. As of December 31, 2008, we had 1,535 employees,
consisting of 225 employees in sales and marketing, 411 employees in
development, 757 employees in delivery of our solutions and 142 employees in
general and administrative positions. None of our employees are
represented by a union. We consider our relationship with our employees to be
good and have not experienced any interruptions of our operations as a result of
labor disagreements.
13
Intellectual
Property
Our
intellectual property rights are important to our business. We rely on a
combination of patents, copyright, trade secret, trademark and other common laws
in the United States and other jurisdictions, as well as confidentiality
procedures, systems and contractual provisions to protect our proprietary
technology, processes and other intellectual property.
Although
we rely on patents, copyright, trade secret and trademark law, written
agreements and common law, we believe that the following factors are more
essential to establishing and maintaining a competitive advantage:
|
|
•
|
the technological skills of our
research and development
personnel;
|
|
|
•
|
the domain expertise of our
consultants and outsourcing service
professionals;
|
|
|
•
|
frequent enhancements to our
solutions;
|
|
|
•
|
continued expansion of our
proprietary content; and
|
|
|
•
|
high levels of customer
service.
|
Others
may develop products that are similar to our technology. We generally enter into
confidentiality and other written agreements with our employees and partners,
and through these and other written agreements, we attempt to control access to
and distribution of our software, documentation and other proprietary technology
and other information. However, despite our efforts to protect our proprietary
rights, third parties may, in an unauthorized manner, attempt to use, copy or
otherwise obtain and market or distribute our intellectual property rights or
technology or otherwise develop a product with the same functionality as our
software. Policing unauthorized use of our software and intellectual property
rights is difficult, and nearly impossible on a worldwide basis. Therefore, we
cannot be certain that the steps we have taken or will take in the future will
prevent misappropriation of our technology or intellectual property rights,
particularly in foreign countries where we do business or where our software is
sold or used, where the laws may not protect proprietary rights as fully as do
the laws of the United States or where enforcement of such laws is not common or
effective.
Substantial
litigation regarding intellectual property rights exists in the software
industry. From time to time, in the ordinary course of our business, we are
subject to claims relating to our intellectual property rights or those of
others, and we expect that third parties may commence legal proceedings or
otherwise assert intellectual property claims against us in the future,
particularly as we expand the complexity and scope of our business, the number of similar products increases and the functionality of
these products further overlap. We cannot be certain that no third party
intellectual property rights that exist could result in a claim against us in
the future. These actual and potential claims and any resulting litigation could
subject us to significant liability for damages. In addition, even if we
prevail, litigation could be time consuming and expensive to defend and could
affect our business materially and adversely. Any claims or litigation from
third parties may also limit our ability to use various business processes,
software and hardware, other systems, technologies or intellectual property
subject to these claims or litigation, unless we enter into license agreements
with the third parties. However, these agreements may be unavailable on
commercially reasonable terms or not available at all.
14
Competition
We have
experienced, and expect to continue to experience, intense competition from a
number of companies. We compete with niche point solution vendors, some of whom
are privately held, such as Peopleclick Authoria, iCIMS, Inc., Integrated
Performance Systems, Inc., Kronos, Pilat HR Solutions, Inc.,
Previsor, Inc., SHL Group plc, SuccessFactors, Inc., and Taleo
Corporation, which offer products that compete with one or more applications in
our suite of solutions. In some aspects of our business, we also compete with
established vendors of enterprise resource planning software with much greater
resources, such as Oracle Corporation (PeopleSoft), SAP AG and Lawson, Inc.
To a lesser extent, we compete with vendors of recruitment process outsourcing
services and survey services, including Accolo, Inc., Alexander Mann Solutions,
The Right Thing, and survey services such as The Gallup
Organization. We believe the principal competitive factors in our
industry include:
|
|
•
|
solution breadth and
functionality;
|
|
|
•
|
ease of deployment, integration
and configuration;
|
|
|
•
|
domain
expertise;
|
|
|
•
|
industry-specific
expertise;
|
|
|
•
|
service support, including
consulting services and outsourcing
services;
|
|
|
•
|
solution
price;
|
|
|
•
|
breadth of sales infrastructure;
and
|
|
|
•
|
breadth of customer
support.
|
We
believe that we generally compete favorably with respect to these
factors.
We may
face future competition in the talent acquisition and employee performance
management market from large, established companies, such as Oracle and SAP, as
well as from emerging companies. Barriers to entry into our industry are
relatively low, new software products are frequently introduced and existing
products are continually enhanced. In addition, we expect that there is likely
to be consolidation in our industry, which could lead to increased price
competition and other forms of competition. Established companies not only may
develop their own competitive products, but may also acquire or establish
cooperative relationships with current or future competitors, including
cooperative relationships between both larger, established and smaller public
and private companies.
In
addition, our ability to sell our solutions will depend, in part, on the
compatibility of our software with software provided by our competitors. Our
competitors could alter their products so that they will no longer be compatible
with our software or they could deny or delay access by us to advance software
releases, which would limit our ability to adapt our software to these new
releases. If our competitors were to bundle their products in this manner or
make their products non-compatible with ours, our ability to sell our solutions
might be harmed which could reduce our gross margins and operating income.
Securities
and Exchange Commission Filings
We file
annual reports on Form 10-K, quarterly reports on Form 10-Q and current reports
on Form 8-K and other information with the SEC. Members of the public
may read and copy materials that we file with the SEC at the SEC’s Public
Reference Room at 100 F Street, N.E., Washington, D.C. 20549. Members
of the public may also obtain information on the Public Reference Room by
calling the SEC at 1-800-732-0330. The SEC also maintains an Internet
web site that contains reports, proxy and information statements and other
information regarding issuers, including us, that file electronically with the
SEC. The address of that site is www.sec.gov. Our annual
reports on Form 10-K, quarterly reports on Form 10-Q and current reports on Form
8-K and other information filed by us with the SEC are available, without
charge, on our Internet web site, www.kenexa.com as soon as reasonably
practicable after they are filed electronically with the SEC.
15
ITEM 1A. Risk
Factors
We
operate in a market environment that involves significant risks, many of which
are beyond our control. The following risk factors may adversely impact our
results of operations, cash flows and the market price of our common stock.
Although we believe that we have identified and discussed below the key risk
factors affecting our business, there may be additional risks and uncertainties
that are not presently known or that are not currently believed to be
significant that may adversely affect our performance or financial
condition.
Our
business will suffer if our existing customers terminate or do not renew their
software subscriptions.
We expect
to continue to derive a significant portion of our revenue from renewals of
subscriptions for our talent acquisition and employee performance management
solutions. During the years ended December 31, 2009 and 2008, our customers
renewed approximately 80% and 75%, respectively, of the aggregate value of
multi-year subscriptions for our on-demand talent acquisition and performance
management solution contracts subject to renewal, a rate which is lower than the
approximately 90% rate at which our customers have historically renewed their
subscriptions with us. If our customers terminate their agreements, fail to
renew their agreements, renew their agreements upon less favorable terms to us,
defer existing agreements or fail to purchase new solutions from us, our revenue
may decline or our future revenue growth may be constrained.
Maintaining
the renewal rate of our existing subscriptions is critical to our future
success. Factors that may affect the renewal rate for our solutions
include:
|
|
•
|
the price, performance and
functionality of our
solutions;
|
|
|
•
|
the availability, price,
performance and functionality of competing products and
services;
|
|
|
•
|
the effectiveness of our support
services;
|
|
|
•
|
our ability to develop
complementary products and
services;
|
|
|
•
|
the
willingness of our customers to continue to invest their resources in our
solutions in light of other demands on those
resources;
|
|
|
•
|
the
macroeconomic environment.
|
Most of
our existing customers have entered into subscription agreements with us that
expire between one and three years from the initial contract date. Our customers
have the right to terminate their contracts under certain circumstances and are
not obligated to renew their subscriptions for our solutions after the
expiration of the initial terms of their subscription agreements. In addition,
our customers may negotiate terms which are less favorable to us upon renewal,
or may request that we license our software to them on a perpetual basis, which
may reduce recurring revenue from these customers. For example, some of our RPO
customers restructured their RPO agreements with us during 2009 as a result of
the economic downturn to decrease the amount of fixed fees and increase the
amount of variable fees pursuant to the agreement. Our future success
also depends in part on our ability to sell new solutions to our existing
customers.
If
the unemployment rate increases or fails to materially decrease, our business
may be harmed.
Demand
for our solutions depends in part on our customers’ ability to hire and retain
their employees. According to the U.S. Bureau of Labor Statistics,
the U.S. unemployment rate in January 2010 was 9.7%. It is unknown
whether unemployment will decrease, increase or remain constant throughout 2010
and beyond as a result of the general downturn in macroeconomic conditions in
the U.S. and globally. If the unemployment rate increases, or does
not materially decrease, our existing and potential new customers may no longer
consider improvement of their talent acquisition and employee performance
management systems to be a necessity and may have less of a need to hire and
retain employees, which could have a material adverse effect on our business,
results of operations and financial condition.
16
If
we fail to adequately protect our proprietary rights, our competitive advantage
could be impaired, we may lose valuable assets, experience reduced revenue and
incur costly litigation to protect our rights.
Our
intellectual property rights are important to our business, and our success is
dependent, in part, on protecting our proprietary software and technology and
our brand, marks and domain names. We rely on a combination of patent,
copyright, trademark, trade secret and other common laws in the United States
and other jurisdictions as well as confidentiality procedures and contractual
provisions to protect our proprietary technology, processes and other
intellectual property. It may be possible for unauthorized third parties to copy
our software and use information that we regard as proprietary to create
products and services that compete with ours, which could harm our competitive
position and cause our revenue to decline.
We have
three issued patents, and additionally we have four pending patent applications.
There is no guarantee that the U.S. Patent and Trademark Office will grant these
patents, or do so in a manner that gives us the protection that we seek.
We will not be able to protect our intellectual property if we are unable
to enforce our rights or if we do not detect unauthorized use of our
intellectual property. Existing intellectual property laws only afford limited
protection.
To the
extent that we expand our international activities, our exposure to unauthorized
copying and use of our software and proprietary information may increase despite
procedures and systems that control information access. Some license provisions
protecting against unauthorized use, copying, transfer and disclosure of our
licensed products may be unenforceable under the laws of certain jurisdictions
and foreign countries in which we operate. Further, the laws of some countries,
and in particular India, where we develop much of our intellectual property, do
not protect proprietary rights to the same extent as the laws of the United
States. For example, companies seeking to enforce proprietary rights in India
can experience substantial delays in prosecuting trademarks and in opposition
proceedings. In the event that we are unable to protect our intellectual
property rights, especially those rights that we develop in India, our business
would be materially and adversely affected.
Additional
litigation may be necessary in the future to enforce our intellectual property
rights and to protect our trade secrets. Litigation, whether successful or
unsuccessful, could result in substantial costs and diversion of management
resources, either of which could seriously harm our business.
Reductions in
information technology spending could limit our ability to grow our
business.
Our
operating results may vary based on changes in the information technology
spending of our customers. The revenue growth and profitability of our business
depend on the overall demand for enterprise application software and services.
We sell our solutions primarily to large organizations whose businesses
fluctuate with general economic and business conditions. As a result, decreased
demand for enterprise application software and services, and in particular
talent acquisition and employee performance management solutions, caused by a
weakening global economy, or otherwise, may cause a decline in our
revenue. Historically, corporate information technology spending has
been one of the first costs that businesses cut, especially during economic
downturns. In particular, software for talent acquisition and employee
performance management software may be viewed by some of our existing and
potential customers as a lower priority and may be among the first expenditures
reduced, especially during unfavorable economic conditions. As a result,
potential customers may decide to reduce their information technology budgets by
deferring or reconsidering product purchases, which would negatively impact our
operating results.
17
Because
we recognize revenue from the sale of our solutions ratably over the term of the
subscription period, a significant downturn in our business may not be
immediately reflected in our operating results.
A decline
in new or renewed subscriptions in any one quarter may not impact our financial
performance in that quarter, but will negatively affect our revenue in future
quarters. If a number of contracts expire and are not renewed in the same
quarter, our revenue could decline significantly in that quarter and in
subsequent quarters.
For the
years ended December 31, 2009, 2008 and 2007, we derived approximately
84.9%, 80.2% and 81.7%, respectively, of our total revenue, from the sale of
subscriptions for our solutions and expect that a significant portion of our
revenue for the foreseeable future will be derived from those subscriptions. We
recognize the associated revenue ratably over the term of the subscription
agreement, which is typically between one and three years. As a result, a
significant portion of the revenue that we report in each quarter reflects the
recognition of deferred revenue from subscription agreements entered into during
previous periods. Accordingly, the effect of significant declines in sales and
market acceptance of our solutions may not be reflected in our short-term
results of operations, making our results less indicative of our future
prospects.
Historically,
our customers have renewed more than 90% of the aggregate value of multi-year
subscriptions for our on-demand talent acquisition and performance management
solution contracts subject to renewal. However, our renewal rates
during the years ended December 31, 2009 and 2008 were approximately 80% and
75%, respectively. We cannot assure you that our renewal rate will
return to its historical levels, or that it will not decrease.
If our
revenue does not meet our expectations, we may not be able to curtail our
spending quickly enough and our cost of revenue, compensation and benefits and
product development would increase as a percentage of revenue. Our subscription
model also makes it difficult for us to rapidly increase our revenue through
additional sales in any one period, as revenue from new customers is recognized
over the applicable subscription term
.
Our
revenue is highly susceptible to changes in general economic conditions, and a
recession or other downturn in the U.S. economy, or in any geographic market in
which we provide services, could substantially impact sales of our services and
overall results of operations.
Our
operating results may vary based on changes in the information technology
spending of our customers. The revenue growth and profitability of our business
depend on the overall demand for enterprise application software and services.
We sell our solutions primarily to large organizations whose businesses
fluctuate with general economic and business conditions. Our customers may
reevaluate their expenditures on enterprise application software and services,
and in particular talent acquisition and employee performance management
solutions, especially given the recent financial crisis in today's economic
environment, which could cause them to cancel all or any portion of our services
or delay the payment of their bills for services previously performed by
us. As a result, in the event of a prolonged recession or even a less
severe downturn in general economic conditions, our results of operations could
be negatively impacted as a result of decreased demand for enterprise
application software and services, and in particular talent acquisition and
employee performance management solutions, and the impact could be more
pronounced for us than for those businesses that deliver products or services
that customers deem to be a higher priority. In particular, software for talent
acquisition and employee performance management software may be viewed by some
of our existing and potential customers as a lower priority and may be among the
first expenditures reduced as a result of unfavorable economic conditions. As a
result, potential customers may decide to reduce their information technology
budgets by deferring or reconsidering product purchases, which would negatively
impact our operating results. In addition, volatility and disruption of
financial markets could limit our customers’ ability to obtain adequate
financing or credit to purchase and pay for our services in a timely manner, or
to maintain operations, and result in a decrease in demand for our services that
could have a negative impact on our overall results of
operations.
18
Our
financial performance may be difficult to forecast as a result of our focus on
large customers and the long sales cycle associated with our
solutions.
Our sales
cycles are generally up to nine months and in some cases even longer. This long
sales cycle impedes our ability to accurately forecast the timing of sales in a
given period which could adversely affect our ability to meet our forecasts for
that period. We focus our sales efforts principally on large organizations with
complex talent acquisition and employee performance management requirements.
Accordingly, in any single quarter the majority of our revenue from sales to new
customers may be composed of large sales made to a relatively small number of
customers. Our failure to close a sale in any particular quarter may impede
revenue growth until the sale closes, if at all. As a result, substantial time
and cost may be spent attempting to close a sale that may not be successful. The
period between an initial sales contact and a contract signing is relatively
long due to several factors, including:
|
|
•
|
the need to educate potential
customers about the uses and benefits of our solutions and the on-demand
delivery model;
|
|
|
•
|
the discretionary nature of our
customers’ purchase and budget
cycles;
|
|
|
•
|
the competitive evaluation of our
solutions;
|
|
|
•
|
fluctuations in the talent
acquisition and employee performance management requirements of our
prospective customers;
|
|
|
•
|
potential economic downturns and
reductions in corporate IT
spending;
|
|
|
•
|
announcements or planned
introductions of new products or services by us or our competitors;
and
|
|
|
•
|
the lengthy purchasing approval
processes of our prospective
customers.
|
If
our efforts to attract new customers or to sell additional solutions to our
existing customers are not successful, our revenue growth will be adversely
affected.
To
increase our revenue, we must continually add new customers and sell additional
solutions to existing customers. If our existing and prospective customers do
not perceive our solutions to be of sufficiently high value and quality, we may
not be able to attract new customers or to increase sales to existing customers.
Our ability to attract new customers and to sell new solutions to existing
customers will depend in large part on the success of our sales and marketing
efforts. However, our existing and prospective customers may not be familiar
with some of our solutions, or may have traditionally used other products and
services for some of their talent acquisition and employee performance
management requirements. Our existing and prospective customers may develop
their own solutions to address their talent acquisition and employee performance
management requirements, purchase competitive product offerings or engage
third-party providers of outsourced talent acquisition and employee performance
management services. Additionally, some customers may require that we license
our software to them on a perpetual basis or that we allow them the contractual
right to convert from a term license to a perpetual license during the contract
term, which may reduce recurring revenue from these customers.
Our
quarterly operating results may fluctuate significantly, and these fluctuations
may cause our stock price to fall.
As a
result of fluctuations in our revenue and operating expenses, our quarterly
operating results may vary significantly. We may not be able to curtail our
spending quickly enough if our revenue falls short of our expectations. We
expect that our operating expenses will increase substantially in the future as
we expand our selling and marketing activities, increase our new product
development efforts and hire additional personnel. Our operating results may
fluctuate in the future as a result of the factors described below:
|
|
•
|
our ability to renew and increase
subscriptions sold to existing customers, attract new customers,
cross-sell our solutions and satisfy our customers’
requirements;
|
|
|
•
|
changes in our pricing
policies;
|
|
|
•
|
the introduction of new features
to our solutions;
|
|
|
•
|
the rate of expansion and
effectiveness of our sales
force;
|
|
|
•
|
the length of the sales cycle for
our solutions;
|
|
|
•
|
new product and service
introductions by our
competitors;
|
|
|
•
|
concentration of marketing
expenses for activities, such as trade shows and advertising
campaigns;
|
|
|
•
|
concentration of research and
development costs; and
|
|
|
•
|
concentration of expenses
associated with commissions earned on sales of subscriptions for our
solutions.
|
We
believe that period-to-period comparisons of our results of operations are not
necessarily meaningful as our future revenue and results of operations may vary
substantially. It is also possible that in future quarters our results of
operations will be below the expectations of securities market analysts and
investors. In either case, the price of our common stock could decline, possibly
materially.
19
Our
business may not continue to grow if the markets for our products do not
continue to grow.
Our
growth is dependent upon the continued adoption of on-demand software as a key
mechanism for delivering solutions in these markets. The rapidly evolving nature
of this market reduces our ability to accurately evaluate our future prospects
and forecast quarterly or annual performance. The adoption of on-demand talent
acquisition and employee performance management solutions, particularly among
organizations that have relied upon traditional software applications, requires
the acceptance of a new way of conducting business and exchanging and compiling
information. Because these markets are new and evolving, it is difficult to
predict with any assurance the future growth rate and size of these markets
which, in comparison with the overall market for enterprise software
applications, is relatively small.
Interruptions
or delays in service from our Web hosting facilities could impair the delivery
of our service and harm our business.
We
provide and manage our service through computer hardware and software that is
currently located in a Qwest Web hosting facility in Sterling, VA USA and
ServeCentric facility in Blanchardstown, Ireland. All Web hosting facilities are
vulnerable to damage or interruption from earthquakes, floods, fires, power
loss, telecommunications failures and similar events. These facilities are also
subject to break-ins, sabotage, intentional acts of terrorism, vandalism and
similar misconduct. Despite precautions that we take at these facilities, the
occurrence of a natural disaster, act of terrorism or other unanticipated
problem at any of these facilities could result in lengthy interruptions in our
service. Interruptions in our service may reduce our revenue, cause us to issue
credits or pay penalties, cause customers to terminate their subscriptions and
adversely affect our renewal rates. Our business will be harmed if our customers
and potential customers believe our service is unreliable or if our Disaster
Recovery Plan (DRP) fails to provide adequate disaster recovery
capabilities.
If
our security measures are breached and unauthorized access is obtained to
customer data, we may incur liabilities and customers may curtail or stop their
use of our solutions, which would harm our business, operating results and
financial condition.
Our
solutions involve the storage and transmission of confidential information of
customers and their existing and potential employees, and security breaches
could expose us to a risk of loss of, or unauthorized access to, this
information, resulting in possible litigation and possible liability. Although
we have never sustained such a breach, if our security measures were ever
breached as a result of third-party action, employee error, malfeasance or
otherwise, and, as a result, an unauthorized party obtained access to this
confidential data, our reputation could be damaged, our business may suffer and
we could incur significant liability. Techniques used to obtain unauthorized
access or to sabotage systems change frequently and generally are not discovered
until launched against a target. As a result, we may be unable to anticipate
these techniques or to implement adequate preventative measures. If an actual or
perceived breach of our security occurs, the market perception of our security
measures could be harmed and we could lose sales and customers.
To remain
competitive, we must continually improve and enhance the responsiveness,
functionality and features of our existing solutions and develop new solutions
that address the talent acquisition and employee performance management
requirements of organizations. If we are unable to successfully develop or
acquire new solutions or enhance our existing solutions, our revenue may decline
and our business and operating results will be adversely affected. If
we do not succeed in developing or introducing new or enhanced solutions in a
timely manner, they may not achieve the market acceptance necessary to generate
significant revenue.
In
addition, it is possible that evolving technology may enable new deployment
mechanisms that make our on-demand business model obsolete. To the extent that
we are not successful in continuing to develop our solutions in correlation with
evolving technology, we may not be successful in establishing or maintaining our
customer relationships.
Releases of new solutions and enhancements to existing
solutions may cause purchasing delays, which would harm our
revenue.
Our practice and the practice in the industry in which
we compete is to regularly develop and release new solutions and enhancements to
existing solutions. As a result, our future success could be hindered by delays
in our introduction of new solutions and/or enhancements of existing solutions,
delays in market acceptance of new solutions and/or enhancements of existing
solutions, and our, or our competitors’, announcement of new solutions and/or
solution enhancements or technologies that could replace or shorten the life
cycle of our existing solutions. In addition, clients may delay their purchasing
decisions in anticipation of our new or enhanced solutions or new or enhanced
solutions of our competitors. Delays in client purchasing decisions could
seriously harm our business and operating results. Moreover, significant delays
in the general availability of new releases or client dissatisfaction with new
releases could have a material adverse effect on our business, results of
operations, cash flow and financial condition.
20
We may not receive significant revenue as a result of
our current research and development efforts.
Developing and localizing software is expensive and the
investment in product development often involves a long payback cycle. We have
made and expect to continue to make significant investments in software research
and development and related product opportunities. Accelerated product
introductions and short product life cycles require high levels of expenditures
for research and development that could adversely affect our operating results
if not offset by corresponding revenue increases. We believe that we must
continue to dedicate a significant amount of resources to our research and
development efforts to maintain our competitive position. However, it is
difficult to estimate when, if ever, we will receive significant revenue as a
result of these investments.
The use of open
source software in our solutions may expose us to
additional risks and harm
our intellectual property.
Some of our solutions use or incorporate software
components that are subject to one or more open source licenses. Open source
software is typically freely accessible, usable and modifiable. Certain open
source software licenses require a user who intends to distribute the open
source software as a component of the user’s software to disclose publicly part
or all of the source code in the user’s software. In addition, certain open
source software licenses require the user of such software to make any
derivative works of the open source code available to others on unfavorable
terms or at no cost. This can subject previously proprietary software to open
source license terms.
While we monitor the use of all open source software in
our solutions, processes and technology and try to ensure that no open source
software is used in such a way as to require us to disclose the source code to
the related product or solution when we do not wish to do so, such use could
inadvertently occur. Additionally, if a third-party software provider has
incorporated certain types of open source software into software we license from
such third party for our solutions, we could, under certain circumstances, be
required to disclose the source code to our solutions. This could harm our
intellectual property position and have a material adverse effect on our
business, results of operations and financial condition.
Our ability to license our software
is highly dependent on the quality of our services offerings, and our failure to
offer high quality services could adversely affect our subscription revenue and
results of operations.
Once our software has been implemented and deployed, our
customers depend on us to provide them with ongoing support and resolution of
issues relating to our software. Therefore, a high level of service is critical
for the continued marketing and sale of our solutions. If we do not efficiently
and effectively implement and deploy our software products, or succeed in
helping our customers quickly resolve post-deployment issues, our ability to
sell software products to these customers would be adversely affected and our
reputation in the marketplace and with potential customers could
suffer.
If
we encounter barriers to the integration of our software or services with
software provided by our competitors or with the software used by our customers,
our revenue may decline and our research and development expenses may
increase.
In some
cases our software or services may need to be integrated with software provided
by our competitors. These competitors could alter their products in ways that
inhibit integration with our software, or they could deny or delay access by us
to such software releases, which would restrict our ability to provide our
services or adapt our software to facilitate integration with this software and
could result in lost sales opportunities. In addition, our software is designed
to be compatible with the most common third-party ERP systems. If the design of
these ERP systems changes, integration of our software with new systems would
require significant work and substantial allocation of our time and resources
and increase our research and development expenses.
Material
defects or errors in our software could affect our reputation, result in
significant costs to us and impair our ability to sell our solutions, which
would harm our business.
The
software applications forming part of our solutions may contain material defects
or errors, which could materially and adversely affect our reputation, result in
significant costs to us and impair our ability to sell our solutions in the
future. The costs incurred in correcting any material product defects or errors
may be substantial and would adversely affect our operating
results. After the release of our products, defects or errors may also be
identified from time to time by our internal team and by our customers. Such
defects or errors may occur in the future. Any defects that cause interruptions
to the availability of our solutions could result in:
|
|
•
|
lost or delayed market acceptance
and sales of our solutions;
|
|
|
•
|
loss of
customers;
|
|
|
•
|
product liability suits against
us;
|
|
|
•
|
diversion of development
resources;
|
|
|
•
|
injury to our reputation;
and
|
|
|
•
|
increased maintenance and
warranty costs.
|
If
we are unable to compete effectively with companies offering enterprise talent
acquisition and employee performance management solutions, our revenue may
decline.
We may
not have the resources or expertise to compete successfully in the future. If we
are unable to successfully compete, we could lose existing customers, fail to
attract new customers and our revenue would decline. The talent acquisition and
employee performance management solutions markets are rapidly evolving and
highly competitive, and we expect competition in these markets to persist and
intensify. Barriers to entry into our industry are low, new software products
are frequently introduced and existing products are continually enhanced. We
compete with niche point solution vendors such as PeopleClick Authoria, iCIMS,
Inc., Integrated Performance Systems, Inc., Kronos Incorporated, Pilat HR
Solutions, Inc., Previsor, Inc., SHL Group plc, SuccessFactors, Inc., and Taleo
Corporation that offer products that compete with one or more applications
contained in our solutions. In some aspects of our business, we also compete
with established vendors of enterprise resource planning, or ERP, software with much greater resources, such as Oracle
Corporation (PeopleSoft), SAP AG and Lawson, Inc. To a lesser extent, we compete
with vendors of recruitment process outsourcing services, including Accolo,
Inc., Alexander Mann Solutions, The Right Thing, and survey services such as The
Gallup Organization. In addition, many organizations have developed or may
develop internal solutions to address enterprise talent acquisition and employee
performance management requirements that may be competitive with our
solutions.
Some of
our competitors and potential competitors, especially vendors of ERP software,
have significantly greater financial, support, technical, development,
marketing, sales, service and other resources, larger installed customer bases,
longer operating histories, greater name recognition and more established
relationships than we have. In addition, ERP software competitors could bundle
their products with, or incorporate capabilities in addition to, talent
acquisition and employee performance management functions, such as automated
payroll and benefits, in products developed by themselves or others. Products
with such additional functions may be appealing to some customers because they
would reduce the number of different types of software or applications used to
run their businesses. Our niche competitors’ products may be more effective than
our solutions at performing particular talent acquisition and employee
performance management functions or may be more customized for particular
customer needs in a given market. Further, our competitors may be able to
respond more quickly than we can to changes in customer requirements or
regulatory changes.
22
We
may engage in future acquisitions or investments which present many risks, and
we may not realize the anticipated financial and strategic goals for any of
these transactions.
We have
focused on developing solutions for the enterprise talent acquisition and
employee performance management market. Our market is highly fragmented and in
the future we may acquire or make investments in complementary companies,
products, services or technologies. Acquisitions and investments involve a
number of difficulties that present risks to our business, including the
following:
|
|
•
|
we may be unable to achieve the
anticipated benefits from the acquisition or
investment;
|
|
|
•
|
we may have difficulty
integrating the operations and personnel of the acquired business, and may
have difficulty retaining the key personnel of the acquired
business;
|
|
|
•
|
we may have difficulty
incorporating the acquired technologies or products with our existing
solutions;
|
|
|
•
|
our ongoing business and
management's attention may be disrupted or diverted by transition or
integration issues and the complexity of managing geographically and
culturally diverse
locations;
|
|
|
•
|
we may lose customers of those
companies that we acquire for reasons such as a particular customer
desiring to have multiple service
vendors;
|
|
|
we may have difficulty
maintaining uniform standards, controls, procedures and policies across
locations; and
|
|
|
•
|
we may experience significant
problems or liabilities associated with product quality, technology and
legal contingencies.
|
The
factors noted above could have a material adverse effect on our business,
results of operations and financial condition or cash flows, particularly in the
case of a larger acquisition or multiple acquisitions in a short period of time.
From time to time, we may enter into negotiations for acquisitions or
investments that are not ultimately consummated. These negotiations could result
in significant diversion of management time, as well as out-of-pocket
costs.
The
consideration paid for an investment or acquisition may also affect our
financial results. If we were to proceed with one or more significant
acquisitions in which the consideration included cash, we could be required to
use a substantial portion of our available cash or obtain debt or equity
financing. To the extent that we issue shares of our capital stock or other
rights to purchase shares of our capital stock as consideration for an
acquisition or in connection with the financing of an acquisition, including
options or other rights, our existing shareholders may be diluted, and our
earnings per share may decrease. In addition, acquisitions may result in the
incurrence of debt, large one-time write-offs, including write-offs of acquired
in-process research and development costs, and restructuring charges.
Acquisitions in the future may require us to incur additional indebtedness to
finance our working capital and may also result in goodwill and other intangible
assets that are subject to impairment tests, which could result in future
impairment charges.
Mergers
or other strategic transactions involving our competitors could weaken our
competitive position or reduce our revenue.
We
believe that our industry is highly fragmented and that there is likely to be
consolidation, which could lead to increased price competition and other forms
of competition. Increased competition may cause pricing pressure and loss of
market share, either of which could have a material adverse effect on our
business, results of operations and financial condition. Our competitors may
establish or strengthen cooperative relationships with business process
outsourcing vendors, systems integrators, third-party consulting firms or other
parties. Established companies may not only develop their own products but may
also merge with or acquire our current competitors. In addition, we may face
competition in the future from large established companies, as well as from
emerging companies that have not previously entered the markets for talent
acquisition and employee performance management solutions or that currently do
not have products that directly compete with our solutions. It is also possible
that new competitors or alliances among competitors may emerge and rapidly
acquire significant market share or sell their products at significantly
discounted prices causing pricing pressure. In addition, our competitors may
announce new products, services or enhancements that better meet the price or
performance needs of customers or changing industry standards. If any of these
events occur, our revenues and profitability could significantly
decline.
23
Because
our products collect and analyze applicants’ and employees’ stored personal
information, concerns that our products do not adequately protect the privacy of
applicants and employees could inhibit sales of our products.
Some of
the features of our talent acquisition and employee performance management
applications depend on the ability to develop and maintain profiles of
applicants and employees for use by our customers. These profiles contain
personal information, including job experience, banking information, social
security numbers, home address and home telephone number. Typically, our
software applications capture this personal information when an applicant
creates a profile to apply for a job, is being on-boarded, and an employee
completes a performance review. Our software applications augment these profiles
over time by capturing additional data and collecting usage data. Although our
applications are designed to protect user privacy, privacy concerns nevertheless
may cause employees and applicants to resist providing the personal data
necessary to support our products. Any inability to adequately address privacy
concerns could inhibit sales of our products and seriously harm our business,
financial condition and operating results.
We
may face risks associated with our international operations that could impair
our ability to grow our revenue.
We
generate a significant portion of our revenue outside the United States. For
example, for the year ended December 31, 2009 and 2008, the percentage of
revenue generated from customers outside the United States was 20.9% and 26.4%
respectively. We intend to continue selling into our existing international
markets and to expand into international markets where we currently do not
conduct business, which will require significant management attention and
financial resources. If we are unable to continue to sell our products
effectively in the existing international markets and expand into additional
international markets, our ability to grow our business would be adversely
affected. Some of the key factors that may affect our ability to maintain and
expand our operations and sales in foreign countries include:
|
|
•
|
difficulties
in staffing and managing foreign operations, including our ability to
provide services to our customers;
|
|
|
•
|
building
and maintaining a competitive presence in existing and new
markets;
|
|
|
•
|
difficulty
enforcing contracts and collecting accounts receivable in some countries,
leading to longer collection
periods;
|
|
|
•
|
certification,
qualification and compliance requirements and expenses relating to our
products and business;
|
|
|
•
|
regulatory
requirements, including import and export
regulations;
|
|
|
•
|
changes
in currency exchange rates;
|
|
•
|
dependence
on third parties to market our solutions through foreign sales
channels;
|
|
|
•
|
reduced
protection for intellectual property rights in some
countries;
|
|
|
•
|
less
stringent adherence to ethical and legal standards by prospective
customers in some countries;
|
|
|
•
|
potentially
adverse tax treatment;
|
|
|
•
|
the
need to localize products for other languages and country-specific
business requirements and
regulations;
|
|
|
•
|
difficulty
competing with local vendors;
|
|
|
•
|
language
and cultural barriers; and
|
|
|
•
|
political
and economic instability.
|
24
Foreign
currency exchange rate risks may adversely affect our results of
operations.
Material
portions of our revenue and expenses are generated by our operations in foreign
countries, and we expect that our foreign operations will account for a material
portion of our revenue and expenses in the future. Substantially all of our
international expenses and revenue are denominated in foreign currencies, mostly
the Indian rupees, British pounds, EURO’s and Canadian dollars. For the year
ended December 31, 2009, we generated approximately 20.9% of our total revenue
and incurred approximately 20.2% of our total costs in foreign currencies. As a
result, our financial results could be affected by factors, such as changes in
foreign currency exchange rates or weak economic conditions in European markets
and other foreign markets in which we have operations. Fluctuations in the value
of those currencies in relation to the U.S. dollar have caused and will continue
to cause dollar-translated amounts to vary from one period to another. We also
incur currency transaction risk whenever one of our operating subsidiaries
enters into either a purchase or a sales transaction using a currency other than
the local currency in which it receives revenue and pays expenses. Given the
volatility of exchange rates, we may not be able to manage effectively our
currency translation or transaction risks, which may adversely affect our
financial condition and results of operations.
Changes
in the regulatory environment and general economic condition in India and
elsewhere could have a material adverse effect on our business.
Adverse
changes in the business or regulatory climate in India could have a material
adverse effect on our business. In addition, wages in India are increasing at a
faster rate than in the United States. In the event that wages continue to rise,
the cost benefit of operating in India and elsewhere may diminish. India has
also experienced significant inflation in the past and has been subject to civil
unrest and terrorism. There can be no assurance that these and other factors
will not have a material adverse effect on our business, results of operations
and financial condition.
We
may not be able to raise capital on terms that are favorable to us.
As of
December 31, 2009, we had cash and cash equivalents of $29.2 million
and short term investments of $29.6 million. Changes in our operating
plans, lower than anticipated revenue, increased expenses or other events, may
cause us to seek additional debt or equity financing. Financing may not be
available on acceptable terms, or at all, and our failure to raise capital when
needed could negatively impact our growth plans and our financial condition and
consolidated results of operations. Additional equity financing would be
dilutive to the holders of our common stock, and debt financing, if available,
may involve significant cash payment obligations and covenants or financial
ratios that restrict our ability to operate our business.
Our
results of operations may be adversely affected if we are subject to a
protracted infringement claim or a claim that results in a significant damage
award.
We expect that software product
developers, such as ourselves, will increasingly be subjected to infringement
claims as the number of products and competitors grows and the functionality of
products in different industry segments overlaps. Our competitors or other third
parties may challenge the validity or scope of our intellectual property rights.
A claim may also be made relating to technology that we acquire or
license from third parties. If we were subject
to a claim of infringement, regardless of the merit of the claim or our
defenses, the claim could:
|
|
•
|
require costly litigation to
defend and resolve, and the payment of substantial
damages;
|
|
|
•
|
require significant management
time and attention;
|
|
|
•
|
cause us to enter into
unfavorable royalty or license
agreements;
|
|
|
•
|
require us to discontinue the
sale of our solutions;
|
|
|
•
|
create negative publicity that
adversely affects the demand for our
solutions;
|
|
|
•
|
require us to indemnify our
customers; and/or
|
|
|
•
|
require us to expend additional
development resources to redesign our
software.
|
Litigation
could be costly for us to defend, have a negative effect on our operating
results and financial condition or require us to devote additional research and
development resources to change our software.
25
We
employ technology licensed from third parties for use in or with our solutions,
and the loss or inability to maintain these licenses on similar terms or errors
in the software we license could result in increased costs, or reduced service
levels, which would adversely affect our business.
We
include in the distribution of our solutions certain technology obtained under
licenses from other companies. We anticipate that we will continue to license
technology and development tools from third parties in the future. There may not
always be commercially reasonable software alternatives to the third-party
software that we currently license, or any such alternatives may be more
difficult or costly to replace than the third-party software that we currently
license. In addition, integration of our software with new third-party software
may require significant work and substantial allocation of our time and
resources. Also, to the extent we depend upon the successful operation of
third-party products in conjunction with our software, any undetected errors in
these third-party products could prevent the implementation or impair the
functionality of our software, delay new solution introductions and injure our
reputation. Our use of additional or alternative third-party software would
require us to enter into license agreements with third parties, which could
result in higher costs.
We have
grown significantly in recent years, and our management remains concentrated in
a small number of executive officers, most of whom have been employed with us
for at least five years. Our future success will depend to a significant extent
on the continued service of these executive officers, namely Nooruddin S.
Karsan, Troy A. Kanter, Donald F. Volk, James P. Restivo, and Archie L.
Jones, Jr. as well as our other key employees, software engineers and senior
technical and sales personnel. We have not entered into employment agreements
with any of our employees. The loss of the services of any of these individuals
or group of individuals could have a material adverse effect on our business,
financial condition and results of operations. Competition for qualified
personnel in the software industry is intense, and we compete for these
personnel with other software companies that have greater financial and other
resources than we do. If we lose the services of one or more of our executive
officers or other key personnel, or if one or more of them decide to join a
competitor or otherwise compete directly or indirectly with us, our business
could be harmed. Searching for replacements for key personnel could also divert
management’s time and attention and result in increased operating
expenses.
We
will not be able to maintain our revenue growth if we do not attract, train or
retain qualified sales personnel.
If we
fail to successfully maintain and expand our sales force, our future revenue and
profitability will be adversely affected. We depend on our direct sales force
for substantially all of our revenue and intend to make significant expenditures
in upcoming years to expand our sales force. Our future success will depend in
part upon the continued expansion and increased productivity of our sales force.
To the extent that we experience attrition in our direct sales force, we will
need to hire replacements. We face intense competition for sales personnel in
the software industry, and we may not be successful in hiring, training or
retaining our sales personnel in accordance with our plans. Even if we hire and
train a sufficient number of sales personnel, we may not generate enough
additional revenue to exceed the expense of hiring and training the new
personnel.
26
Failure
to implement the appropriate controls and procedures to manage our growth could
harm our growth, business, operating results and financial
condition.
We have
and may continue to have periods of growth in our operations, which has placed,
and may continue to place, a significant strain on our management,
administrative, operational, technical and financial infrastructure. We
increased our employee base from 522 employees in 2004 to 693 employees in 2005,
to 1,220 employees in 2006, to 1,373 employees in 2007, and to 1,535 employees
in 2008. In 2009 due to the challenging macroeconomic environment, the
strengthening U.S. dollar relative to other currencies of countries in which we
do business and the resulting slowing or delaying of a number of project
implementations we announced, during the fourth quarter 2008, a restructuring
program involving reductions of approximately 200 employees. As a result of the
continued deterioration in the economic environment we executed an additional
reduction of approximately 159 employees during the first quarter of
2009.
The
increase in employees during 2006 was primarily due to the addition of 44 and
338 employees that we acquired as part of our acquisition of Webhire and
BrassRing, respectively. The increase in employees during 2007 was primarily due
to the addition of 134 and 25 employees that we acquired as part of our
acquisition of Strategic Outsourcing Corporation and HRC Human Resources
Consulting GmbH, respectively. The increase in employees during 2008 was
primarily due to the addition of 135 employees that we acquired as a part of our
acquisition of Quorum International Holdings Limited (“Quorum”). To manage our
growth, we will need to continue to improve our operational, financial and
management processes and controls and reporting systems and procedures. This
effort may require us to make significant capital expenditures or to incur
significant expenses, and may divert the attention of our personnel from our
core business operations, any of which may adversely affect our financial
performance. If we fail to successfully manage our growth, our business,
operating results and financial condition may be adversely
affected.
Evolving
European Union regulations related to confidentiality of personal data may
adversely affect our business.
In order
to provide our solutions to our customers, we rely in part on our ability to
access our customers’ employee data. The European Union and other jurisdictions
have adopted various data protection regulations related to the confidentiality
of personal data. To date, these regulations have not restricted our business as
we have qualified for a safe harbor available for U.S. companies that collect
personal data from areas under the jurisdiction of the European Union. To the
extent that these regulations are modified in such a manner that our safe harbor
no longer applies, our ability to conduct business in the European Union may be
adversely affected.
Evolving
regulation of the Internet may increase our expenditures related to compliance
efforts, which may adversely affect our financial condition.
As
Internet commerce continues to evolve, increasing regulation by federal, state
and/or foreign agencies becomes more likely. We are particularly sensitive to
these risks because the Internet is a critical component of our business model.
For example, we believe that increased regulation is likely in the area of data
privacy, and laws and regulations applying to the solicitation, collection,
processing or use of personal or consumer information could affect our
customers’ ability to use and share data, potentially reducing demand for
solutions accessed via the Internet and restricting our ability to store,
process and share data with our customers via the Internet. In addition,
taxation of services provided over the Internet or other charges imposed by
government agencies or by private organizations for accessing the Internet may
also be imposed. Any regulation imposing greater fees for Internet use or
restricting information exchange over the Internet could result in a decline in
the use of the Internet and the viability of Internet-based services, which
could harm our business.
The
failure of our solutions to comply with employment laws may require us to
indemnify our customers, which may harm our business.
Some of
our customer contracts contain indemnification provisions that require us to
indemnify our customers against claims of non-compliance with employment laws
related to hiring. To the extent these claims are successful and exceed our
insurance coverages, these obligations would have a negative impact on our cash
flow, results of operation and financial condition.
27
Our
reported financial results may be adversely affected by changes in generally
accepted accounting principles.
Generally
accepted accounting principles in the United States are subject to
interpretation by the Financial Accounting Standards Board, or FASB, the
American Institute of Certified Public Accountants, the SEC, and various bodies
formed to promulgate and interpret appropriate accounting principles. A change
in these principles or interpretations could have a significant effect on our
historical or future financial results. For example, prior to January 1, 2006,
we were not required to record share-based compensation charges if the
employee’s stock option exercise price was equal to or exceeded the deemed fair
value of the underlying security at the date of grant. However, effective
January 1, 2006 we are required to record the fair value of stock options as an
expense in accordance with new accounting pronouncements.
Anti-takeover
provisions of Pennsylvania law and our articles of incorporation and bylaws
could delay and discourage takeover attempts that shareholders may consider to
be favorable.
Certain
provisions of our articles of incorporation and applicable provisions of the
Pennsylvania Business Corporation Law may make it more difficult for a third
party to, or prevent a third party from, acquiring control of us or effecting a
change in our board of directors and management. These provisions
include:
|
|
•
|
the classification of our board
of directors into three classes, with one class elected each
year;
|
|
|
•
|
prohibiting cumulative voting in
the election of directors;
|
|
|
•
|
the ability of our board of
directors to issue preferred stock without shareholder
approval;
|
|
|
•
|
our shareholders may only take
action at a meeting of our shareholders and not by written
consent;
|
|
|
•
|
prohibiting shareholders from
calling a special meeting of our
shareholders;
|
|
|
•
|
our shareholders must comply with
advance notice procedures in order to nominate candidates for election to
our board of directors or to place shareholders proposals on the agenda
for consideration at any meeting of our shareholders;
and
|
|
|
•
|
prohibiting us from engaging in
some types of business combinations with holders of 20% or more of our
voting securities without prior approval of our board of directors, unless
a majority of our disinterested shareholders approve the
transaction.
|
The
Pennsylvania Business Corporation Law further provides that because our articles
of incorporation provide for a classified board of directors, shareholders may
remove directors only for cause. These and other provisions of the Pennsylvania
Business Corporation Law and our articles of incorporation and bylaws could
delay, defer or prevent us from experiencing a change of control or changes in
our board of directors and management and may adversely affect our shareholders’
voting and other rights. Any delay or prevention of a change of control
transaction or changes in our board of directors and management could deter
potential acquirers or prevent the completion of a transaction in which our
shareholders could receive a substantial premium over the then current market
price for their shares of our common stock.
Since
November 2007, we have repurchased 3,125,651 shares of our common stock under
share repurchase plans at an average price per share of $17.80 and an aggregate
cost of $55.8 million. These shares were restored to original status and
accordingly are presented as authorized but not issued. Share repurchases may
not have the effects anticipated by our board of directors and may instead harm
the market price of our securities. Share repurchase plans may use a significant
portion of our cash reserves, and could limit our future flexibility to complete
acquisition transactions or fund other growth opportunities. In addition, the
share repurchases are subject to regulatory requirements. We may become subject
to lawsuits regarding the use of our cash for share repurchases or for the
failure to follow applicable regulatory requirements in connection with our
share repurchase program. Our repurchase plans will also likely result in an
increase in the share percentage ownership of our existing shareholders, and
such increase may trigger disclosure or other regulatory requirements for our
larger shareholders. As a result, certain shareholders may liquidate a portion
of their holdings. In addition, our repurchase plans may decrease our public
float as shares are repurchased by us on the open market pursuant to the plan
and may have a negative effect on our trading volume. Such outcomes may have a
negative impact on the liquidity of our common stock, the market price of our
common stock and could make it easier for others to acquire a larger percentage
of our voting securities.
28
The
market price of our common stock has been, and may continue to be, particularly
volatile, and our shareholders may be unable to resell their shares at a
profit.
The
market price of our common stock has been subject to significant fluctuations
and may continue to fluctuate or decline. From September 2008 through December
31, 2009, our common stock has been particularly volatile as the price of our
common stock has ranged from a high of $24.01 to a low of $3.66. In the past
several years, technology stocks have experienced high levels of volatility and
significant declines in value from their historic highs. Additionally, as a
result of the current global credit crisis and the concurrent economic downturn
in the U.S. and globally, there have been significant declines in the values of
equity securities generally in the U.S. and abroad. Factors that could cause
fluctuations in the trading price of our common stock include the
following:
|
|
•
|
price and volume fluctuations in
the overall stock market from time to
time;
|
|
|
•
|
significant volatility in the
market price and trading volume of software companies in general, and HR
software companies in
particular;
|
|
|
•
|
actual or anticipated changes in
our earnings or fluctuations in our operating
results;
|
|
|
•
|
general economic conditions and
trends;
|
|
|
•
|
major catastrophic
events;
|
|
|
•
|
the timing and magnitude of stock
repurchases pursuant to our stock repurchase
plan;
|
|
|
•
|
sales of large blocks of our
stock; or
|
|
|
•
|
departures of key
personnel.
|
In the
past, following periods of volatility in the market price of a company’s
securities, securities class action litigation has often been brought against
that company. If our stock price is volatile, we may become the target of
securities litigation. For example, we are currently party to a securities class
action lawsuit filed against us by a class of our investors who purchased our
publicly traded securities between May 8, 2007 and November 7, 2007. Securities
litigation, including the securities litigation we are currently subject to,
could result in substantial costs and divert our management’s attention and
resources from our business.
Our
investments in auction rate securities are subject to risks which may adversely
affect our liquidity and cause losses.
At December 31, 2009, we held $13.9
million of A, AA and AAA rated auction rate securities (“ARS”), the underlying
assets of which are generally student loans which are substantially backed by
the U.S. federal government. Auction rate securities are generally long-term
instruments that are intended to provide liquidity through a Dutch auction
process that resets the applicable interest rate at pre-determined calendar
intervals, allowing holders of these instruments to rollover their holdings and
continue to own their respective securities or liquidate their holdings by
selling the auction rate securities at par. Beginning in February 2008, auctions
failed for our holdings because sell orders for these securities exceeded the
amount of purchase orders. The funds associated with these failed auctions will
not be accessible until the issuer calls the security, a successful auction
occurs, a buyer is found outside the auction process, or the security matures.
In November 2008, we entered into an agreement (the “UBS Settlement
Agreement”) with UBS AG which provides us (1) with a “no net cost” loan up to
the par value of Eligible ARS until June 30, 2010, (2) the right to sell these
auction rate securities back to UBS AG at par, at our sole discretion, anytime
during the period from June 30, 2010 through July 2, 2012, and (3) UBS AG the
right to purchase these auction rate securities or sell them on our behalf at
par anytime through July 2, 2012. Based on the UBS Settlement Agreement, we
transferred these investments from available-for-sale to trading securities and
began recording the change in fair value of the ARS as gains or losses in
current period earnings.
Our ability to enforce the terms of our auction rate
settlement with UBS is subject to UBS’s continued viability
UBS has
experienced operational challenges including an executive management shakeup;
the largest annual loss ever reported by a Swiss company; the elimination of
11,000 jobs; and the need for a Swiss government bailout. All of these factors
could add to the worsening financial viability of the bank and cause it to
cancel any settlement agreements involving the extension of credit to its
customers. If UBS were to terminate its settlement agreement with its customers,
our liquidity would adversely be affected.
Unexpected changes in tax rates and
regulations could negatively impact our operating results.
We currently conduct significant
activities internationally. Our foreign subsidiaries accounted for 20.9% of our
total revenues during the year ended December 31, 2009, and 26.4% of our total
revenues during the year ended December 31, 2008. Our financial results may be
negatively impacted to the extent tax rates in foreign countries where we
operate increase and/or exceed those in the United States and as a result of the
imposition of withholding requirements on foreign earnings.
29
|
ITEM 1B.
|
Unresolved Staff
Comments.
|
Not
Applicable.
We lease
our headquarters in Wayne, Pennsylvania. The table below provides information
concerning our principal facilities, including the approximate square footage,
the approximate monthly rent and the lease expiration date of each facility. We
believe that our facilities are in good operating condition and will adequately
serve our needs for at least the next 12 months. We also anticipate that, if
required, suitable additional or alternative space will be available on
commercially reasonable terms, in office buildings we currently occupy or in
space nearby, to accommodate expansion of our operations.
|
Location
|
Approximate
Square
Footage
|
Monthly
Rent
|
Lease Expiration
|
||||||
|
Frisco,
Texas
|
26,656 | $ | 47,759 |
January
31, 2015
|
|||||
|
Hyderabad,
India
|
23,668 | $ | 15,094 |
February 14, 2011
|
|||||
|
Lincoln,
Nebraska
|
51,213 | $ | 80,481 |
April
30, 2015
|
|||||
|
London,
England
|
6,844 | $ | 15,017 |
March
18, 2011
|
|||||
|
Minneapolis,
Minnesota
|
15,474 | $ | 31,825 |
February
29, 2012
|
|||||
|
Shanghai,
China
|
9,197 | $ | 30,387 |
October
31, 2012
|
|||||
|
Vizag,
India
|
60,000 | $ | — |
Owned
|
|||||
|
Waltham,
Massachusetts
|
65,546 | $ | 92,310 |
April
29, 2011
|
|||||
|
Wayne,
Pennsylvania
|
36,635 | $ | 97,887 |
May
13,
2013
|
|||||
30
On August
27, 2007, a complaint was filed and served by Kenexa BrassRing, Inc. against
Taleo Corporation in the United States District Court for the District of
Delaware. Kenexa alleges that Taleo infringed Patent Nos. 5,999,939 and
6,996,561, and seeks monetary damages and an order enjoining Taleo from further
infringement.
On May 9,
2008, Kenexa BrassRing, Inc. filed a similar lawsuit against Vurv Technology,
Inc. in the United States District Court for the District of Delaware, alleging
that Vurv has infringed Patent Nos. 5,999,939 and 6,996,561, and seeks monetary
damages and an order enjoining further infringement. This lawsuit has been
consolidated with the Kenexa BrassRing, Inc. versus Taleo Corporation
lawsuit.
On June
25, 2008, Kenexa Technology, Inc. filed suit in the United States District Court
of Delaware against Taleo Corporation for tortious interference with contract,
unfair competition, unfair trade practices and unjust enrichment. On August 28,
2009, Taleo filed an amended answer and counterclaim against Kenexa BrassRing,
Inc. asserting copyright infringement against Kenexa by the users accessing the
Taleo system on behalf of Kenexa’s recruitment process outsourcing customers.
Kenexa seeks monetary damages and to enjoin the actions of Taleo. Taleo seeks
monetary damages and to enjoin the actions of Kenexa.
On
November 7, 2008, Vurv Technology LLC, sued Kenexa Corporation, Kenexa
Technology, Inc., and two former employees of Vurv, who now work for Kenexa , in
the United States District Court for the Northern District of Georgia. In this
action, Vurv asserts claims for breach of contract, computer trespass and theft,
misappropriation of trade secrets, interference with contract and civil
conspiracy. Vurv seeks unspecified monetary damages and injunctive
relief.
On June
11, 2009 and July 16, 2009, two putative class actions were filed against Kenexa
Corporation and our Chief Executive Officer and Chief Financial Officer in the
United States District Court for the Eastern District of Pennsylvania,
purportedly on behalf of a class of our investors who purchased our publicly
traded securities between May 8, 2007 and November 7, 2007. The complaint filed
on July 16, 2009 has since been voluntarily dismissed. In the pending action,
Building Trades United Pension Trust Fund, individually and on behalf of all
others similarly situated alleges violations of Section 10(b) of the Securities
Exchange Act of 1934 ("Exchange Act"), Rule 10b-5 promulgated thereunder and
Section 20(a) of the Exchange Act in connection with various public statements
made by Kenexa. This action seeks unspecified damages, attorneys’ fees and
expenses.
On July
17, 2009, Kenexa BrassRing, Inc. and Kenexa Recruiter, Inc. filed suit against
Taleo Corporation, a current Taleo employee and a former Taleo employee in
Massachusetts Superior Court. Kenexa amended the complaint on August 27, 2009
and added Vurv Technology LLC, two former employees of Taleo and two current
employees of Taleo. Kenexa asserts claims for breach of contract and the implied
covenant of good faith and fair dealing, unfair trade practices, computer theft,
misappropriation of trade secrets, tortious interference, unfair competition,
and unjust enrichment. Kenexa seeks monetary damages and injunctive
relief.
We are
involved in claims from time to time which arise in the ordinary course of
business. In the opinion of management, we have made adequate provision for
potential liabilities, if any, arising from any such matters. However,
litigation is inherently unpredictable, and the costs and other effects of
pending or future litigation, governmental investigations, legal and
administrative cases and proceedings (whether civil or criminal), settlements,
judgments and investigations, claims and changes in any such matters, could have
a material adverse effect on our business, financial condition and operating
results.
31
PART
II
|
ITEM 5.
|
Market
for Registrant’s Common Equity, Related Stockholder Matters And Issuer
Purchases of Equity Securities
|
Market
Information and Dividends
Our
common stock has been quoted on The Nasdaq Stock Market, LLC under the symbol
“KNXA” since June 24, 2005. Prior to that date, there was no public market
for our common stock. The following table sets forth, for the periods indicated,
the high and low sales prices of our common stock reported by The Nasdaq Stock
Market, LLC.
|
Common Stock Price
|
||||||||
|
High
|
Low
|
|||||||
|
Year
Ended December 31, 2008:
|
||||||||
|
First
Quarter
|
$ | 22.81 | $ | 16.07 | ||||
|
Second
Quarter
|
$ | 21.71 | $ | 17.41 | ||||
|
Third
Quarter
|
$ | 24.01 | $ | 14.77 | ||||
|
Fourth
Quarter
|
$ | 16.04 | $ | 4.68 | ||||
|
Year
Ended December 31, 2009:
|
||||||||
|
First
Quarter
|
$ | 8.37 | $ | 3.66 | ||||
|
Second
Quarter
|
$ | 14.20 | $ | 5.27 | ||||
|
Third
Quarter
|
$ | 15.40 | $ | 9.48 | ||||
|
Fourth
Quarter
|
$ | 14.77 | $ | 10.39 | ||||
On March
3, 2010, the last reported sale price of our common stock on The Nasdaq Stock
Market, LLC was $11.16 per share. As of March 3, 2010, there were approximately
70 holders of record of our common stock.
We have
not declared or paid any cash dividends on our common stock since our inception.
We intend to retain future earnings, if any, to finance the operation and
expansion of our business and do not anticipate paying any cash dividends in the
foreseeable future. Consequently, shareholders will need to sell shares of our
common stock to realize a return on their investment, if any.
Unregistered
Sales of Equity Securities and Use of Proceeds
Not
Applicable.
32
STOCK
PERFORMANCE GRAPH AND CUMULATIVE TOTAL RETURN
The
following graph shall not be deemed incorporated by reference into any of our
filings under the Securities Act of 1933 or the Securities Exchange Act of 1934,
except to the extent we specifically incorporate it by reference
therein.
Prior to
June 28, 2005, we were not publicly traded and there was no public market for
our securities. The graph below compares the cumulative total return of our
common stock with that of the Nasdaq Composite Index, the Nasdaq Computer &
Data Processing Index and the S&P Smallcap 600 Index from June 28, 2005 (the
date shares of our common stock began to trade publicly) through December 31,
2009. The graph assumes that you invested $100 at the close of market on June
28, 2005 in shares of our common stock and invested $100 on May 31, 2005 (the
last day of the completed calendar month immediately preceding June 28, 2005) in
each of these indexes, and in each case assumes the reinvestment of dividends.
The comparisons in this graph are provided in accordance with Securities and
Exchange Commission disclosure requirements and are not intended to forecast or
be indicative of the future performance of shares of our common
stock.
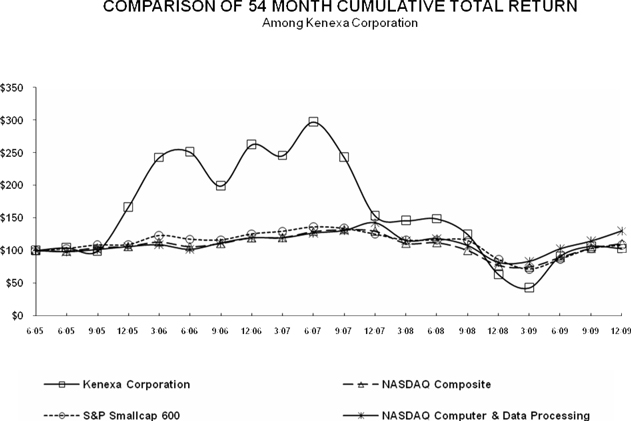
33
ITEM
6. Selected Consolidated Financial Data
SELECTED
CONSOLIDATED FINANCIAL DATA
The
selected consolidated financial data set forth below are derived from our
consolidated financial statements and should be read in conjunction with our
consolidated financial statements and related notes appearing elsewhere in this
Annual Report on Form 10-K and "Management's Discussion and Analysis of
Financial Condition and Results of Operations" section of this Annual Report on
Form 10-K. The consolidated statements of operations data for each of the years
ended December 31, 2009, 2008 and 2007 and the consolidated balance sheet data
as of December 31, 2009 and 2008 are derived from, and qualified by reference
to, our audited consolidated financial statements and related notes appearing
elsewhere in this filing. The consolidated statements of operations data for
each of the years ended December 31, 2006 and 2005 and the consolidated balance
sheet data as of December 31, 2007, 2006 and 2005 are derived from our audited
consolidated financial statements not included in this filing. All of the
historical consolidated financial data set forth below gives retroactive effect
to a 0.8-for-1 reverse stock split of our common stock on June 27, 2005. Our
historical results are not necessarily indicative of results for any future
period.
|
For the year ended December 31,
|
||||||||||||||||||||
|
2009
|
2008
|
2007
|
2006
|
2005
|
||||||||||||||||
|
(in thousands, except share and per share data)
|
||||||||||||||||||||
|
Consolidated
Statements of Operations Data:
|
||||||||||||||||||||
|
Revenues:
|
||||||||||||||||||||
|
Subscription
|
$ | 133,854 | $ | 163,420 | $ | 148,662 | $ | 90,470 | $ | 50,974 | ||||||||||
|
Other
|
23,815 | 40,312 | 33,264 | 21,637 | 14,667 | |||||||||||||||
|
Total
revenues
|
157,669 | 203,732 | 181,926 | 112,107 | 65,641 | |||||||||||||||
|
Cost
of revenues
|
53,371 | 61,593 | 50,920 | 31,712 | 18,782 | |||||||||||||||
|
Gross
profit
|
104,298 | 142,139 | 131,006 | 80,395 | 46,859 | |||||||||||||||
|
Operating
expenses:
|
||||||||||||||||||||
|
Sales
and marketing
|
35,182 | 40,780 | 35,324 | 25,134 | 16,133 | |||||||||||||||
|
General
and administrative
|
40,801 | 48,884 | 39,332 | 24,520 | 15,116 | |||||||||||||||
|
Research
and development
|
9,757 | 15,555 | 17,737 | 8,618 | 3,986 | |||||||||||||||
|
Depreciation
and amortization
|
14,264 | 12,088 | 7,584 | 3,487 | 2,112 | |||||||||||||||
|
Restructuring
charges
|
— | 1,979 | — | — | — | |||||||||||||||
|
Goodwill
impairment charge
|
33,329 | 167,011 | — | — | — | |||||||||||||||
|
Total
operating expenses
|
133,333 | 286,297 | 99,977 | 61,759 | 37,347 | |||||||||||||||
|
(Loss)
income from operations
|
(29,035 | ) | (144,158 | ) | 31,029 | 18,636 | 9,512 | |||||||||||||
|
Interest
(expense) income
|
(44 | ) | 1,395 | 3,098 | 1,560 | 566 | ||||||||||||||
|
Investment
loss
|
(12 | ) | — | — | — | — | ||||||||||||||
|
Interest
expense on mandatory redeemable preferred shares (1)
|
— | — | — | — | 3,396 | |||||||||||||||
|
(Loss)
income from operations before income tax
|
(29,091 | ) | (142,763 | ) | 34,127 | 20,196 | 6,682 | |||||||||||||
|
Income
tax (benefit) expense
|
1,927 | (38,071 | ) | 10,579 | 4,303 | 591 | ||||||||||||||
|
Net
(loss) income
|
(31,018 | ) | (104,692 | ) | 23,548 | 15,893 | 6,091 | |||||||||||||
|
Accretion
of redeemable class B common shares and class C common
shares
|
— | — | — | — | 41,488 | |||||||||||||||
|
Income
allocated to noncontrolling interests
|
(61 | ) | — | — | — | — | ||||||||||||||
|
Net
income (loss) applicable to common shareholders’
|
$ | (31,079 | ) | $ | (104,692 | ) | $ | 23,548 | $ | 15,893 | $ | (35,397 | ) | |||||||
|
Basic
(loss) income per share:
|
||||||||||||||||||||
|
Net
(loss) income per share applicable to common shareholders -
basic
|
$ | (1.38 | ) | $ | (4.60 | ) | $ | 0.94 | $ | 0.80 | $ | (3.06 | ) | |||||||
|
Weighted
average shares used to compute net (loss) income applicable to common
shareholders - basic
|
22,532,719 | 22,779,694 | 24,926,468 | 19,911,775 | 11,578,885 | |||||||||||||||
|
Net
(loss) income per share applicable to common shareholders -
diluted
|
$ | (1.38 | ) | $ | (4.60 | ) | $ | 0.93 | $ | 0.78 | $ | (3.06 | ) | |||||||
|
Weighted
average shares used to compute net (loss) income applicable to common
shareholders - diluted
|
22,532,719 | 22,779,694 | 25,327,004 | 20,425,794 | 11,578,885 | |||||||||||||||
34
SELECTED
CONSOLIDATED FINANCIAL DATA
|
For the year ended December 31,
|
||||||||||||||||||||
|
2009
|
2008
|
2007
|
2006
|
2005
|
||||||||||||||||
|
(in thousands)
|
||||||||||||||||||||
|
Consolidated
Balance Sheet Data:
|
||||||||||||||||||||
|
Cash
and cash equivalents
|
$ | 29,221 | $ | 21,742 | $ | 38,032 | $ | 42,502 | $ | 43,499 | ||||||||||
|
Short-term
investments
|
29,570 | 4,512 | 58,423 | — | — | |||||||||||||||
|
Long-term
investments
|
— | 16,513 | — | — | — | |||||||||||||||
|
Total
assets
|
202,343 | 218,465 | 347,889 | 267,459 | 73,899 | |||||||||||||||
|
Short-term
debt, net
|
— | — | — | 20,000 | — | |||||||||||||||
|
Capital
lease obligations, short-term
|
211 | 143 | 140 | 229 | 219 | |||||||||||||||
|
Deferred
revenue
|
49,964 | 38,638 | 35,076 | 31,251 | 12,588 | |||||||||||||||
|
Capital
lease obligations, long-term
|
259 | 108 | 94 | 145 | 185 | |||||||||||||||
|
Term
loan, long-term
|
— | — | — | 45,000 | — | |||||||||||||||
|
Other liabilities
(2)
|
1,981 | 1,319 | 138 | 225 | 163 | |||||||||||||||
|
Class
A common stock
|
226 | 225 | 240 | 209 | 174 | |||||||||||||||
|
Total
shareholders’ equity
|
130,138 | 156,536 | 287,648 | 147,161 | 50,742 | |||||||||||||||
|
(1)
|
We
adopted SFAS 150 effective July 1, 2003, which required us to record the
mandatory redeemable preferred stock at fair value at the date of adoption
and reflect the difference between carrying value and fair value as a
cumulative effect of a change in accounting principle. Changes in fair
value after the initial adoption date are treated as interest expense.
Dividends on mandatory redeemable preferred stock are also treated as
interest expense. The interest and change in accounting principle charges
to net income were discontinued with the redemption of our series A
preferred stock and series B preferred stock in connection with the
completion of our initial public offering in June
2005.
|
|
(2)
|
Amount in 2009 and
2008 consists of ASC 740 income tax liabilities related to
uncertain tax positions of $1,890 and $1,256, respectively. See
Critical Accounting Policies and Estimates, Accounting for Income taxes
for further discussion.
|
35
ITEM
7. Management’s Discussion and Analysis of
Financial Condition and Results of Operations
You
should read the following discussion and analysis of our financial condition and
results of operations in conjunction with the “Selected Consolidated Financial
Data” section and our consolidated financial statements and related notes
appearing elsewhere in this Annual Report on Form 10-K. In addition to
historical information, this discussion and analysis contains forward-looking
statements based on current expectations that involve risks, uncertainties and
assumptions, such as our plans, objectives, expectations and intentions. Our
actual results and the timing of events may differ materially from those
anticipated in these forward-looking statements as a result of various factors,
including those set forth in the “Item 1A-Risk Factors” section and elsewhere in
this Annual Report on Form 10-K.
Overview
We
provide business solutions for human resources which include a comprehensive
suite of on-demand software applications and complementary services, including
outsourcing services and consulting, to help global organizations recruit high
performing individuals and to foster optimal work environments to increase
employee productivity and retention. We employ a large force of organizational
and industrial psychologists and statisticians who study the science of human
behavior and its impact on business outcomes. This research is the foundation of
our suite of software applications and supporting services that enable our
customers to improve business results through human resources. Based on our 22
years of experience assisting customers in addressing their human resource
requirements we believe our software applications and services form solutions
that enable our customers to improve the effectiveness of their talent
acquisition programs, increase employee productivity and retention, measure key
HR metrics and make their talent acquisition and employee performance management
program more efficient.
Since
1999, we have focused on providing talent acquisition and employee performance
management solutions on a subscription basis and currently generate a
significant portion of our revenue from these subscriptions. Our customers
typically purchase multi-year subscriptions with an average length of
approximately two years. For the years ended December 2009 and 2008 subscription
revenue represented approximately 84.9% and 80.2% of our total revenue,
respectively. We generate the remainder of our revenue from discrete
professional services that are not provided as part of an integrated solution on
a subscription basis. These subscription-based solutions provide us with a
recurring revenue stream and we believe represent a more compelling opportunity
in terms of growth and profitability than discrete professional
services.
We sell
our solutions to large and medium-sized organizations through our direct sales
force. As of December 31, 2009, we had a customer base of approximately 4,900
companies, including approximately 170 companies on the Fortune 500 list
published in May 2009. Our customer base includes companies that we billed for
services during the year ended December 31, 2009 and does not necessarily
indicate an ongoing relationship with each such customer. Our top 80 customers
contributed approximately $86.5 million, or 54.9%, of our total revenue for the
year ended December 31, 2009.
In
October 2009, unemployment in the United States peaked at 10.1% which will
likely adversely affect our business in 2010 and may affect our business
thereafter. However, the extent or degree to which we may be affected by these
events is extremely difficult to predict. The uncertain economic prospects being
experienced by our customers will likely translate into slower growth, or
contraction, for us, since a substantial portion of our business is dependent
upon our customers’ hiring and human capital needs. However, we believe that, by
optimizing our internal resources for the current business conditions, we can
minimize these adverse effects and emerge from this economic crisis with a
return to our historic operating margins.
Due to the economic downturn some
of our customers, facing uncertainty and cost pressures in their own businesses,
have indicated that they are waiting to purchase our products and are otherwise
increasingly seeking purchasing terms and conditions that are less favorable to
us. As a
result, during the year ended December 31, 2009 and 2008, our customers renewed
approximately 80% and 75%, respectively, of the aggregate value of multi-year
subscriptions for our on-demand talent acquisition and performance management
solution contracts subject to renewal during the period rather than our
historical renewal rate of approximately 90%. As the business
environment improves we expect renewal rates to improve to the 90% range from a
long-term perspective.
36
Background
We
commenced operations in 1987 as a provider of recruiting services to a wide
variety of industries. In 1993, we offered our first automated talent
acquisition system and by 1997 we had expanded our business to provide employee
research, employee performance management technology and consulting services. In
late 1997, responding to a growing demand from our customers, we began to
provide comprehensive human capital management services integrated with
on-demand software. Between 1994 and 1998, we acquired 15 businesses that
collectively enabled us to offer comprehensive Human Capital Management (“HCM”)
services integrated with on-demand technology.
Over the
past eleven years, we have pursued a strategy designed to focus our business on
talent acquisition and employee performance management solutions and reduce our
strategic focus on discrete professional services that generated less
predictable revenue streams and lower margins. To that end:
|
|
•
|
in
1999, we exited our temporary staffing
business;
|
|
|
•
|
in
2000 and 2001, we acquired four businesses which enhanced our screening
and behavioral assessment solutions and skills testing
technologies;
|
|
|
•
|
since
2002, we reduced our strategic focus on position-specific recruiting
services;
|
|
|
•
|
in 2003, we
discontinued our Oracle implementation business and discontinued and sold
our pharmaceutical training
division;
|
|
|
•
|
in
2005, we expanded our presence in North America and enhanced our customer
base through our acquisition of Scottworks Solutions,
Inc.;
|
|
|
•
|
in 2006, we enhanced
our talent acquisition solutions and customer base through our
acquisitions of Webhire, Inc., Knowledge
Workers Inc., Gantz-Wiley Research Consulting Group Inc., Psychometric
Services Limited., and BrassRing
Inc.;
|
|
|
•
|
in 2007, we enhanced
our talent acquisition solutions and customer base through our
acquisitions of Strategic Outsourcing
Corporation and HRC Human Resources Consulting
GmbH,
|
|
•
|
in
2008, we expanded our global footprint in the talent acquisition space
through our acquisition of Quorum International Holdings Limited;
and
|
|
•
|
in
2009, we entered into an ownership interest transfer agreement with
Shanghai Runjie Management Consulting Company to gain presence in China’s
human capital management market.
|
As a
result of our shift in strategic focus in 2000, we have focused on providing
talent acquisition and employee performance management solutions on a
subscription basis and currently generate a significant portion of our revenue
from these subscriptions. We generate the remainder of our revenue from discrete
professional services that are not provided as part of an integrated solution on
a subscription basis. Subscription-based solutions provide us with a recurring
revenue stream and we believe represent a more compelling opportunity in terms
of growth and profitability than discrete professional services. In 2000,
revenue derived from subscriptions for these solutions comprised approximately
54.4% of our total revenue. Since 2005, subscription revenue has represented
approximately 80% of our total revenue. For the years ended December 2009 and
2008 subscription revenue represented approximately 84.9% and 80.2% of our total
revenue, respectively. This shift to subscription based services has been driven
by our customer’s adoption of the on-demand model for software delivery and need
for solutions that improve employee recruiting and retention; we expect that
trend to continue.
From our
inception through 2001, our operations were funded primarily through internally
generated cash flows and our line of credit, as well as private placements of
our securities to institutional investors. On June
29, 2005, we completed our initial public offering and listed our common stock
for trading on the Nasdaq Stock Market.
37
Recent
Events
During
the fourth quarter 2008, in response to the challenging macroeconomic
environment, the strengthening U.S. dollar relative to other currencies of
countries in which we do business, and the slowing or delaying of a number of
projects by our customers, we announced a restructuring program involving
reductions of approximately 200 employees and recorded severance and
outplacement benefit costs totaling $2.0 million. During the first
quarter of 2009, as a result of the continued deterioration in the economic
environment, we executed an additional reduction of approximately 159 employees
and recorded severance and outplacement benefit costs totaling $1.2
million.
During
the three months ended March 31, 2009 and December 31, 2008, due to a 32.5% and
49.5%, respectively,
decline in our stock price and market capitalization from the previous
quarter, lower projected net income, cash flow estimates and slower projected
growth rates in our industry, we reevaluated our goodwill impairment analysis.
Our analysis was performed to determine the implied fair value of our goodwill
with neither the write up nor write down of any assets or liabilities, nor
recording of any additional unrecognized identifiable intangible assets. Based
upon our analysis we recorded a goodwill impairment charge of $33.3 million and
$167.0 million during the three months ended March 31, 2009 and December 31,
2008, respectively. This goodwill impairment charge had no effect on our cash
balances.
On January 20, 2009, we entered into an
ownership interest transfer agreement with Shanghai Runjie Management Consulting
Company, (“R and J”) in Shanghai, China for $1.3 million. The initial investment
provided us with a 46% ownership in the new entity Shanghai Kenexa Human
Resources Consulting Co., Ltd., (the “variable interest entity”) and a presence
in China’s human capital management market. The agreement with R and J also
provided for a 1% annual ownership increase based upon adjusted EBITDA, as
defined, for each of the years ended 2008, 2009 and 2010. In the third and
fourth quarter of 2009, based upon the 2008 operating results for R and J, we
paid an additional $0.2 million for an additional 1% ownership interest in the
variable interest entity. The variable interest entity was financed with $0.3
million in initial equity contributions from us and R and J, and has no
borrowings for which its assets would be used as collateral. On September 30,
2009 we provided $0.2 million of financing for the variable interest entity. The
creditors of the variable interest entity do not have recourse to our other
assets.
On May
21, 2009, we elected not to renew our secured credit agreement with PNC Bank. We
believe that our cash, short-term investments, UBS Settlement Agreement for our
auction rate securities and projected cash from operations will be sufficient to
meet our liquidity needs for at least the next twelve months.
On June
11, 2009 and July 16, 2009, two putative class actions were filed against Kenexa
Corporation and our Chief Executive Officer and Chief Financial Officer in the
United States District Court for the Eastern District of Pennsylvania,
purportedly on behalf of a class of our investors who purchased our publicly
traded securities between May 8, 2007 and November 7, 2007. The complaint filed
on July 16, 2009 has since been voluntarily dismissed. In the pending action,
Building Trades United Pension Trust Fund, individually and on behalf of all
others similarly situated alleges violations of Section 10(b) of the Securities
Exchange Act of 1934 ("Exchange Act"), Rule 10b-5 promulgated thereunder and
Section 20(a) of the Exchange Act in connection with various public statements
made by Kenexa. This action seeks unspecified damages, attorneys’ fees and
expenses.
Sources
of Revenue
We derive
revenue primarily from two sources: (1) subscription revenue for our solutions,
which is comprised of subscription fees from customers accessing our on-demand
software, consulting services, outsourcing services and proprietary content, and
from customers purchasing additional support that is not included in the basic
subscription fee; and (2) fees for discrete professional services.
Our
customers primarily purchase renewable subscriptions for our solutions. The
typical term is one to three years, with some terms extending up to five years.
The majority of our subscription agreements are not cancelable for convenience
although our customers have the right to terminate their contracts for cause if
we fail to provide the agreed upon services or otherwise breach the agreement. A
customer does not generally have a right to a refund of any advance payments if
the contract is cancelled. Due to the current economic slowdown, a greater
number of our customers are delaying or seeking to revise the terms and
conditions of our service agreements. As a result, during the year ended
December 31, 2009 our customers renewed approximately 80% of the aggregate value
of multi-year subscriptions for our on-demand talent acquisition and performance
management solution contracts subject to renewal during the period rather than
our historical renewal rate of approximately 90%. As the business environment
improves we expect renewal rates to improve to the 90% range from a long-term
perspective.
38
Consistent
with our historical practices, revenue derived from subscription fees is
recognized ratably over the term of the subscription agreement. We generally
invoice our customers in advance in quarterly installments and typical payment
terms provide that our customers pay us within 30 days of invoice. Amounts that
have been invoiced are recorded in accounts receivable prior to the receipt of
payment and in deferred revenue to the extent revenue recognition criteria have
not been met. As of December 31, 2009, deferred revenue increased by $11.4
million or 29.5% to $50.0 million from $38.6 million at December 31, 2008. The
increase in deferred revenue is a result of the increase in sales of our
multiple elements or bundled arrangements. We generally price our solutions
based on the number of software applications and services included and the
number of customer employees. Accordingly, subscription fees are generally
greater for larger organizations and for those that subscribe for a broader
array of software applications and services.
We derive
other revenue from the sale of discrete professional services, and translation
services as well as from out-of-pocket expenses. The majority of our other
revenue is derived from discrete professional services, which primarily consist
of consulting and training services. This revenue is recognized differently
depending on the type of service provided as described in greater detail below
under “Critical Accounting Policies and Estimates.”
For the
year ended December 31, 2009, approximately 79.1% of our total revenue was
derived from sales in the United States. Revenue that we generated from
customers in the United Kingdom and Germany was approximately 7.1% and 2.6%,
respectively, for the year ended December 31, 2009. Revenue for other countries
amounted to an aggregate of 11.2%. Other than the countries listed, no other
country represented more than 2.0% of our total revenue for the year ended
December 31, 2009. The increase in our percentage revenue derived from sales in
the United States is primarily due to decreased foreign sales.
Cost
of Revenue
Our cost
of revenue primarily consists of compensation, employee benefits and
out-of-pocket travel-related expenses for our employees and independent
contractors who provide consulting or other professional services to our
customers. Additionally, our application hosting costs, amortization of
third-party license royalty costs, technical support personnel costs, overhead
allocated based on headcount and reimbursed expenses are also recorded as cost
of revenue. Many factors affect our cost of revenue, including changes in the
mix of products and services, pricing trends, changes in the amount of
reimbursed expenses and fluctuations in our customer base. Because cost as a
percentage of revenue is higher for professional services than for software
products, an increase in the services component of our solutions or an increase
in discrete professional services as a percentage of our total revenue would
reduce gross profit as a percentage of total revenue. As our revenues begin to
increase, we expect our cost of revenue to increase proportionately, subject to
pricing pressure related to economic conditions and slightly influenced by the
mix of services and software. To the
extent new customers are added, we expect that the cost of services, as a
percentage of revenue, will be greater than those services associated with
existing customers
Operating
Expenses
We
classify our operating expenses as follows:
Sales and Marketing. Sales
and marketing expenses primarily consist of personnel and related costs for
employees engaged in sales and marketing, including salaries, commissions, and
other variable compensation, travel expenses and costs associated with trade
shows, advertising and other marketing efforts and allocated overhead. We
expense our sales commissions at the time the related revenue is recognized, and
we recognize revenue from our subscription agreements ratably over the terms of
the agreements. Over the past several years, our sales and marketing expense has
increased in absolute terms and as a percentage of total revenue. Although we
believe that our investment in sales and marketing commencing in 2003 resulted
in significant revenue growth during 2004 through 2008, based on recent economic
conditions we have reduced our sales and marketing expenditures to adjust for
expected lower rates of growth projections. Consistent with our past
practice, we intend to continue to invest in sales and marketing to pursue new
customers and expand relationships with existing customers at levels we deem
appropriate given our current economic conditions. We expect our sales and
marketing expense to increase from current levels, mainly due to increased staff
expense and continued emphasis on our rebranding effort.
General and Administrative.
General and administrative expenses primarily consist of personnel and related
costs for our executive, finance, human resources and administrative personnel,
professional fees and other corporate expenses and allocated overhead. We expect
general and administrative expenses to increase in the short term as we incur
additional professional fees in connection with our patent infringement matter,
however, in the longer term based upon the current state of the economy, we
believe that general and administrative expenses will remain the same or
slightly decrease in dollar amount and remain constant as a percentage of total
revenue in 2010.
Research and Development.
Research and development expenses primarily consist of personnel and related
costs, including salaries, and employee benefits, for software engineers,
quality assurance engineers, product managers, technical sales engineers and
management information systems personnel and third party consultants. Our
research and development efforts have been devoted primarily to new product
offerings and enhancements and upgrades to our existing products. We believe
that research and development expenses will increase in dollar amount in
2010.
39
Key
Performance Indicators
The
following tables summarize the key performance indicators that we consider to be
material in managing our business, in thousands (other than percentages):
|
|
For the Year Ended December 31,
|
|||||||||||
|
|
2009
|
2008
|
2007
|
|||||||||
|
Total
Revenue
|
|
$ |
157,669
|
$ |
203,732
|
$ |
181,926
|
|||||
|
Subscription
revenue as a percentage of total revenue
|
|
84.9
|
%
|
80.2
|
%
|
81.7
|
%
|
|||||
|
Non-GAAP
income from operations
|
|
15,915
|
36,563
|
37,590
|
||||||||
|
Net
cash provided by operating activities
|
|
35,520
|
32,465
|
38,563
|
||||||||
|
|
For the Year Ended December 31,
|
|||||||||||
|
|
2009
|
2008
|
2007
|
|||||||||
|
Deferred
revenue
|
|
$
|
49,964
|
$
|
38,638
|
$
|
35,076
|
|||||
The
following is a discussion of significant terms used in the tables
above.
Subscription
revenue as a percentage of total revenue. Subscription revenue as a
percentage of total revenue can be derived from our consolidated statements of
operations. This performance indicator illustrates the evolution of our business
towards subscription-based solutions, which provides us with a recurring revenue
stream and which we believe to be a more compelling revenue growth and
profitability opportunity. We expect that the percentage of subscription revenue
will be within a target range of 78% to 82% of our total revenues in
2010.
40
Non-GAAP income
from operations. Non-GAAP income from operations is derived from income
(loss) from operations adjusted for noncash or nonrecurring expenses. We believe
that measuring our operations, using non-GAAP income from operations provides
more useful information to management and investors regarding certain financial
and business trends relating to our financial condition and ongoing results. We
use these measures to compare our performance to that of prior periods for trend
analyses, for purposes of determining executive incentive compensation, and for
budget and planning purposes. These measures are used in monthly financial
reports prepared for management and in quarterly financial reports presented to
our Board of Directors. We believe that the use of these non-GAAP financial
measures provides an additional tool for investors to use in evaluating ongoing
operating results and trends and in comparing its financial measures with other
companies in our industry, many of which present similar non-GAAP financial
measures to investors.
We do not
consider such non-GAAP measures in isolation or as an alternative to such
measures determined in accordance with GAAP. The principal limitation of such
non-GAAP financial measures is that they exclude significant expenses that are
required by GAAP to be recorded. In addition, they are subject to inherent
limitations as they reflect the exercise of judgments by management about which
charges are excluded from the non-GAAP financial measures.
In order
to compensate for these limitations, we present our non-GAAP financial measures
in connection with our GAAP results. We urge investors to review the
reconciliation of our non-GAAP financial measures to the comparable GAAP
financial measures included below, and not to rely on any single financial
measure to evaluate our business.
|
For the year ended December 31,
|
||||||||||||
|
2009
|
2008
|
2007
|
||||||||||
|
(unaudited)
|
(unaudited)
|
(unaudited)
|
||||||||||
|
Income
(loss) from operations
|
$ | (29,035 | ) | $ | (144,158 | ) | $ | 31,029 | ||||
|
Share-based
compensation expense
|
5,364 | 5,761 | 3,793 | |||||||||
|
Amortization
of intangibles associated with acquisitions
|
4,475 | 5,456 | 2,646 | |||||||||
|
Professional
fees associated with variable interest
entity
|
687 | — | — | |||||||||
|
Severance
expense
|
1,156 | — | — | |||||||||
|
Restructuring
charges & legal fees associated with restructure
charges
|
— | 2,493 | — | |||||||||
|
One
time consulting fee related to R&D carryback
|
— | — | 122 | |||||||||
|
Goodwill
impairment charge
|
33,329 | 167,011 | — | |||||||||
|
Noncontrolling
interests
|
(61 | ) | — | — | ||||||||
|
Non-GAAP
income from operations
|
$ | 15,915 | $ | 36,563 | $ | 37,590 | ||||||
The
Company’s non-GAAP financial measures as set forth in the table above exclude
the following:
Share-based
compensation. Share-based compensation consists of expenses for stock options
and stock awards that we began recording in accordance with SFAS 123(R) during
the first quarter of 2006. Share-based compensation was $5.4 million, $5.8
million and $3.8 million for the years ending December 31, 2009, 2008 and 2007,
respectively. Share-based compensation expenses are excluded in our non-GAAP
financial measures because share-based compensation amounts are difficult to
forecast. This is due in part to the magnitude of the charges which depends upon
the volume and timing of stock option grants, which are unpredictable and can
vary dramatically from period to period, and external factors such as interest
rates and the trading price and volatility of our common stock. We believe that
this exclusion provides meaningful supplemental information regarding our
operating results because these non-GAAP financial measures facilitate the
comparison of results for future periods with results from past periods. The
dilutive effect of all outstanding options is included in the calculation of
diluted earnings per share on both a GAAP and a non-GAAP basis.
Amortization
of intangibles associated with acquisitions. In accordance with GAAP, operating
expenses include amortization of acquired intangible assets which are amortized
over the estimated useful lives of such assets. Amortization of acquired
intangible assets was $4.5 million, $5.5 million and $2.6 million for the years
ending December 31, 2009, 2008 and 2007, respectively. Amortization of acquired
intangible assets is excluded from our non-GAAP financial measures because we
believe that such exclusion facilitates comparisons to its historical operating
results and to the results of other companies in the same industry, which have
their own unique acquisition histories.
41
Professional
fees related to our Chinese expansion. The company incurred professional fees in
connection with its Chinese expansion in the amount of $0.7 million during the
first quarter of 2009. The Company believes that such exclusion facilitates
comparisons to its historical operating results and to the results of other
companies in the same industry, which have their own unique acquisition
histories.
Severance
expenses. We incurred charges in the amount of $1.2 million in relation to
additional severance expenses in the first quarter of 2009. These charges were
excluded them from its non-GAAP income to facilitate a more meaningful
comparison to the prior year’s results.
Expenses
related to restructuring charges and related legal fees. We incurred charges in
the amount of $2.5 million in relation to the restructuring in the fourth
quarter of 2008. Such
charges consisted of severance and outplacement benefit costs of $2.0 million
and certain legal fees of $0.5 million in relation to the termination of
approximately 200 employees.
Research
and development (“R&D”) credits and the related consulting fees incurred to
identify those credits. R&D credits in 2008 relate to R&D activities
performed during the entire year of 2008, and reduce the Company’s tax expense.
These tax credits totaling $0.5 million were claimed in the Company’s fourth
quarter tax filing and are reflected in the Company’s December 31, 2008
financial statements. The R&D tax credit is excluded from the Company’s
non-GAAP financial measures in the current quarter to facilitate a more
meaningful comparison to the prior year’s results.
Goodwill
impairment charge. We recorded a non-cash goodwill impairment charge in the
first quarter of 2009 of $33.3 million and $167.0 million in the fourth quarter
of 2008 of as a result of a substantial decrease in our stock price, reflecting
the impact of the unprecedented turmoil in world economies and the resultant
impact on our operations.
Noncontrolling
Interest. Non Controlling interest of $0.1 million includes income from
operations due to our variable
interest entity partner and is excluded from the calculation of non-GAAP
net income from operations because it is unrelated to our ownership in the
venture.
Net cash provided
by operating activities. Net cash provided by operating activities is
taken from our consolidated statement of cash flows and represents the amount of
cash generated by our operations that is available for investing and financing
activities. Generally, our net cash provided by operating activities has
exceeded our operating income primarily due to the positive impact of deferred
revenue, the add-back of non-cash goodwill impairment charges and more recently
due to the collection of accounts receivables. It is possible that this trend
may vary as business conditions change.
42
Deferred
revenue. We generate revenue primarily from multi-year subscriptions for
our on-demand talent acquisition and employee performance management solutions.
We recognize revenue from these subscription agreements ratably over the hosting
period, which is typically one to three years. We generally invoice our
customers in quarterly or monthly installments in advance. Deferred revenue,
which is included in our consolidated balance sheets, is the amount of invoiced
subscriptions in excess of the amount recognized as revenue. Deferred revenue
represents, in part, the amount that we will record as revenue in our
consolidated statements of operations in future periods. As the subscription
component of our revenue has grown and customer willingness to pay us in advance
for their subscriptions has increased, the amount of deferred revenue on our
balance sheet has grown. It is possible that this trend may vary as business
conditions change.
The
following table reconciles beginning and ending deferred revenue for each of the
periods shown:
|
For the Year Ended December 31,
|
||||||||||||
|
2009
|
2008
|
2007
|
||||||||||
|
(in thousands)
|
||||||||||||
|
Deferred
revenue at the beginning of the year
|
$ | 38,638 | $ | 35,076 | $ | 31,251 | ||||||
|
Total
invoiced subscriptions during the year
|
145,180 | 166,982 | 152,367 | |||||||||
|
Deferred
revenue from acquisition
|
— | — | 120 | |||||||||
|
Subscription
revenue recognized during the year
|
(133,854 | ) | (163,420 | ) | (148,662 | ) | ||||||
|
Deferred
revenue at end of year
|
$ | 49,964 | $ | 38,638 | $ | 35,076 | ||||||
Critical
Accounting Policies and Estimates
Our
discussion and analysis of our financial condition and consolidated results of
operations are based upon our consolidated financial statements, which have been
prepared in accordance with generally accepted accounting principles in the
United States. The preparation of our consolidated financial statements requires
us to make estimates and assumptions that affect the reported amounts of assets,
liabilities, revenue and expenses and related disclosure of contingent assets
and liabilities. On an on-going basis, we evaluate our estimates, including
those related to uncollectible accounts receivable and accrued expenses. We base
these estimates on historical experience and various other assumptions that we
believe to be reasonable under the circumstances, the results of which form the
basis for making judgments about the carrying values of assets and liabilities
that are not readily apparent from other sources. Our actual results may differ
from these estimates.
We
believe that the following critical accounting policies affect our more
significant estimates and judgments used in the preparation of our consolidated
financial statements:
Revenue
Recognition
We derive
our revenue from two sources: (1) subscription revenues for solutions,
which are comprised of subscription fees from customers accessing our on-demand
software, consulting services, outsourcing services and proprietary content, and
from customers purchasing additional support beyond the standard support that is
included in the basic subscription fee; and (2) other fees for professional
services, translation services and reimbursed out-of-pocket expenses. Because we
provide our solutions as a service, we follow the provisions of Financial
Accounting Standards Board (“FASB”) ASC 605-10, “Revenue Recognition” and
FASB ASC 605-25 “Multiple
Element Arrangements”. We recognize revenue when all of the following
conditions are met:
|
|
•
|
there is persuasive evidence of
an arrangement;
|
|
|
•
|
the service has been provided to
the customer;
|
|
|
•
|
the collection of the fees is
probable; and
|
|
|
•
|
the amount of fees to be paid by
the customer is fixed or
determinable.
|
Subscription Fees and Support
Revenues. Subscription fees and support revenues are recognized ratably
over the lives of the contracts. Amounts that have been invoiced are
recorded in accounts receivable and in deferred revenue or revenue, depending on
whether the revenue recognition criteria have been met.
Other Revenue. Other revenue
consists of discrete professional services, translation services and
reimbursable out-of-pocket expenses. Discrete professional services, when sold
with subscription and support offerings, are accounted for separately since
these services have value to the customer on a stand-alone basis and there is
objective and reliable evidence of fair value of the delivered
elements. Our arrangements do not contain general rights of
return. Additionally, when professional services are sold with other
elements, the consideration from the revenue arrangement is allocated among the
separate elements based upon the relative fair value. Revenues from professional
services are recognized based upon proportional performance as value is
delivered to the customer.
In
determining whether revenues from professional services can be accounted for
separately from subscription revenue, we consider the following factors for each
agreement: availability of professional services from other vendors, whether
objective and reliable evidence of the fair value exists of the undelivered
elements, the nature and the timing of when the agreement was signed in
comparison to the subscription agreement start date and the contractual
dependence of the subscription service on the customer's satisfaction with the
other services. If the professional service does not qualify for separate
accounting, we recognize the revenue ratably over the remaining term of the
subscription contract. In these situations we defer the direct and incremental
costs of the professional service over the same period as the revenue is
recognized.
In
accordance with FASB ASC 605-45, “Principal Agent
Considerations,” we record reimbursements received for out-of-pocket
expenses as revenue and not netted with the applicable costs. These
items primarily include travel, meals and certain telecommunication
costs. Reimbursed expenses for the years ended December 31,
2009, 2008, and 2007, totaled $2.2 million, $4.7 million and $3.5 million,
respectively.
44
Allowance
for Doubtful Accounts
We
maintain an allowance for doubtful accounts for estimated losses resulting from
customers’ inability to pay us. The provision is based on our historical
experience and for specific customers that, in our opinion, are likely to
default on our receivables from them. In order to identify these customers, we
perform ongoing reviews of all customers that have breached their payment terms,
as well as those that have filed for bankruptcy or for whom information has
become available indicating a significant risk of non-recoverability. We rely on
historical trends of bad debt as a percentage of total revenue and apply these
percentages to the accounts receivable associated with new customers and
evaluate these customers over time. To the extent that our future collections
differ from our assumptions based on historical experience, the amount of our
bad debt and allowance recorded may be different.
Self-Insurance
We are
self-insured for the majority of our health insurance costs, including claims
filed and claims incurred but not reported subject to certain stop loss
provisions. We estimate our liability based upon management’s judgment and
historical experience. We also rely on the advice of consulting administrators
in determining an adequate liability for self-insurance
claims. Self-insurance accruals totaled approximately
$0.6 million as of and for the periods ended December 31, 2009 and
2008. We continuously review the adequacy of our insurance coverage. Material
differences may result in the amount and timing of insurance expense if actual
experience differs significantly from management's estimates.
Capitalized
Software Development Costs
In
accordance with FASB ASC 985, “Software”, and FASB ASC 350,
“Intangibles-Goodwill and
Other”, costs incurred in the preliminary stages of a development project
are expensed as incurred. Once an application has reached the
development stage, internal and external costs, if direct and incremental, will
be capitalized until the software is substantially complete and ready for its
intended use. Capitalization ceases upon completion of all substantial testing.
We also capitalize costs related to specific upgrades and enhancements when it
is probable the expenditures will result in additional functionality.
Maintenance and training cost are expensed as incurred. Internal use
software is amortized on a straight-line basis over its estimated useful life,
generally three years. Management evaluates the useful lives of these assets on
an annual basis and tests for impairments whenever events or changes in
circumstances occur that could impact the recoverability of these assets. There
were no impairments to internal software in any of the periods covered in this
report.
45
Goodwill
and Other Identified Intangible Asset Impairment
Since
2002, we have recorded goodwill in accordance with the provisions of FASB ASC
350, “Intangibles-Goodwill and
Other,” which requires us to annually review the carrying value of
goodwill for impairment. If goodwill becomes impaired, some or all of
the goodwill would be written off as a charge to operations. This
comparison is performed annually or more frequently if circumstances change that
would more likely than not reduce the fair value of the reporting unit below its
carrying amount.
During
the quarter ended December 31, 2008 we reevaluated our goodwill, due to adverse
changes in the economic climate, a 49.5% decline in our market capitalization
from October 1, 2008 (our annual
testing date), and a downward revision in our earnings guidance for the
quarter and year ended December 31, 2008. These factors signaled a
triggering event, which required us to determine whether and to what extent our
goodwill may have been impaired as of December 31, 2008. The
first step of this analysis requires the estimation of our fair value, as an
entity, and is calculated based on the observable market capitalization with a
range of estimated control premiums as well as discounted future estimated cash
flows. This step yielded an estimated fair value for us which was
less than our carrying value including goodwill at December 31,
2008. The next step entails performing an analysis to determine
whether the carrying amount of goodwill on our balance sheet exceeds our implied
fair value. The implied fair value of our goodwill, for this step was
determined in the same manner as goodwill recognized in a business
combination. Our estimated fair value was allocated to our assets and
liabilities, including any unrecognized identifiable intangible assets, as if we
had been acquired in a business combination with our estimated fair value
representing the price paid to acquire it. The allocation process
performed on the test date was only for purposes of determining the implied fair
value of goodwill with neither the write up or write down of any assets or
liabilities, nor recording any additional unrecognized identifiable intangible
assets as part of this process as of December 31, 2008. Based on the
analysis, we determined that the implied fair value of goodwill was $32.4
million, resulting in a goodwill impairment charge of $167.0
million. The goodwill impairment charge had no effect on our cash
balances.
During the quarter ended March 31, 2009
we reevaluated our goodwill
due to continued adverse changes in the economic climate, a 32.5% decline in our
market capitalization from December 31, 2008 through March 31, 2009 and a
downward revision in internal projections. These factors
signaled a triggering event, which required us to determine whether and to what
extent our goodwill may have been impaired as of March 31, 2009. The allocation process
performed on the test date was only for purposes of determining the implied fair
value of goodwill with no assets or liabilities written up or down, nor any
additional unrecognized identifiable intangible assets recorded as part of this
process. Based on the analysis, a goodwill impairment charge of $33.3
million was recorded to write off the remaining balance of our goodwill for the
quarter ended March 31, 2009. The goodwill impairment charge had no effect on
the Company’s cash balances
46
We hold
investments in auction rate securities having contractual maturities of greater
than one year and interest rate reset features of between 7 and 35 days. These
auction rate securities were priced and initially traded as short-term
investments because of the interest rate reset feature. During 2008,
as a result of the deterioration in the credit markets, our auction rate
securities failed to trade at auctions due to insufficient bids from
buyers. The credit market crisis led to uncertainty surrounding the
liquidity of our auction rate security investments and required us to reclassify
our auction rate securities to long-term investments. In June 2009,
due to our ability to liquidate these securities within the next twelve months,
we reclassified our auction rate securities to short-term investments on our
Consolidated Balance Sheet.
Our
auction rate securities, which have a par value of $15.3 million at December 31,
2009, were acquired through UBS AG. Due to the failure of the auction
rate market in early 2008, UBS AG and other major banks entered into discussions
with government agencies to provide liquidity to owners of auction rate
securities. In November 2008, we entered into an agreement (the “UBS Settlement
Agreement”) with UBS AG which provides us (1) with a “no net cost”
loan up to the par value of Eligible ARS until June 30, 2010, (2) the
right to sell these auction rate securities back to UBS AG at par, at our sole
discretion, anytime during the period from June 30, 2010 through
July 2, 2012, and (3) UBS AG the right to purchase these auction rate
securities or sell them on our behalf at par anytime through July 2, 2012
(See Note 3 to the Consolidated Financial Statements). Following the
execution of the UBS Settlement Agreement, we determined that we no longer had
the intent to hold the ARS until either maturity or recovery of the ARS
market. Based on this unusual circumstance related to the signing of the
UBS Settlement Agreement, we transferred these investments from
available–for-sale to trading securities and began recording the change in fair
value of the ARS as gains or losses in current period earnings.
Contemporaneous
with the determination to transfer the ARS to trading securities, we elected to
measure the value of our option to put the securities (“put option”) to UBS AG
under the fair value option of FASB ASC 825, “Financial
Instruments”. As a result, at December 31, 2008, we recorded a
non-operating gain representing the estimated fair value of the put option and a
corresponding long-term asset of approximately $2.2 million. At
December 31, 2009, the put option’s estimated fair value decreased to $1.4
million resulting in a non-operating loss of $0.8 million for the twelve months
ended December 31, 2009. The estimated fair value of the put option as of
December 31, 2009 was based in part on an expected life of six months and a
discount rate of 0.85%. In
June 2009, due to our ability to exercise our put option within the next twelve
months, we reclassified our put option to other current assets on our
consolidated balance sheet. As a result of the transfer of the ARS from
available-for-sale to trading investment securities noted above, we also
recorded a non-operating gain for the twelve months ended December 31, 2009 of
approximately $0.8 million. The recording of the loss relating to the
decrease in the fair value of the put option and the recognition of the gain in
the ARS resulted in an overall net loss of less than $0.1 million for the year
ended December 31, 2009.
We
anticipate that any future changes in the fair value of our put option under the
UBS Settlement Agreement will partially be offset by the changes in the fair
value of the related auction rate securities. Our option to put the securities
under the UBS Settlement Agreement will continue to be measured at fair value
utilizing Level 3 inputs as defined by FASB ASC 820, “Fair Value Measurement and
Disclosure”, until the earlier of its maturity or exercise.
The fair
values of our auction rate securities are estimated utilizing a discounted cash
flow analysis or other types of valuation models as of December 31, 2009 rather
than at par. These analyses are highly judgmental and consider, among other
items, the likelihood of redemption, credit quality, duration, insurance wraps
and expected future cash flows. These securities are also compared, when
possible, to other observable market data with similar characteristics to the
securities held by us. Any changes in fair value for our auction rate
securities, which we attribute to market liquidity issues rather than credit
issues, are recorded in our statement of operations.
Accounting
for Income Taxes
We are
subject to income taxes in the U.S. and various foreign countries. We
record an income tax provision for the anticipated tax consequences of operating
results reportable to each taxing jurisdiction in compliance with enacted tax
legislation. We
account for income taxes in accordance with FASB ASC 740, “Income Taxes”, which requires
that deferred tax assets and liabilities be recognized using enacted tax rates
for the effect of temporary differences between the book and tax basis of
recorded assets and liabilities. ASC 740 also requires that deferred
tax assets be reduced by a valuation allowance if it is more likely than not
that some portion or all of the deferred tax asset will not be
realized.
The
realization of the deferred tax assets is evaluated quarterly by assessing the
valuation allowance and by adjusting the amount of the allowance, if necessary.
The factors used to assess the likelihood of realization are the forecast of
future taxable income and available tax planning strategies that could be
implemented to realize the net deferred tax assets. We have used tax-planning
strategies to realize or renew net deferred tax assets in order to avoid the
potential loss of future tax benefits. In addition, we operate within
multiple taxing jurisdictions and are subject to audit in each jurisdiction.
These audits can involve complex issues that may require an extended period of
time to resolve. In our opinion, adequate provisions for income taxes have been
made for all periods.
Our
determination of the level of valuation allowance at December 31, 2009 is based
on an estimated forecast of future taxable income which includes many judgments
and assumptions primarily related to revenue, margins, operating expenses, tax
planning strategies and tax attributes in multiple taxing
jurisdictions. Accordingly, it is at least reasonably possible that
future changes in one or more of these assumptions may lead to a change in
judgment regarding the level of valuation allowance required in future
periods.
47
Accounting
for Share-Based Compensation
Share-based compensation expense
recognized during the period is based on the value of the number of awards that
are expected to vest multiplied by the fair value. We use a
Black-Scholes option-pricing model to calculate the fair value of our
share-based awards. The calculation of the fair value of the awards using the
Black-Scholes option-pricing model is affected by our stock price on the date of
grant as well as assumptions regarding the following:
|
|
•
|
Volatility is a measure of the
amount by which the stock price is expected to fluctuate each year during
the expected life of the award and is based on a weighted average of peer
companies, comparable indices and our stock volatility. An increase in the
volatility would result in an increase in our
expense.
|
|
|
•
|
The expected term represents the
period of time that awards granted are expected to be outstanding and is
currently based upon an average of the contractual life and the vesting
period of the options. With the passage of time actual behavioral patterns
surrounding the expected term will replace the current methodology.
Changes in the future exercise behavior of employees or in the vesting
period of the award could result in a change in the expected term. An
increase in the expected term would result in an increase to our
expense.
|
|
|
•
|
The risk-free interest rate is
based on the U.S. Treasury yield curve in effect at time of grant. An
increase in the risk-free interest rate would result in an increase in our
expense.
|
|
|
•
|
The estimated forfeiture rate is
the rate at which awards are expected to expire before they become fully
vested and exercisable. An increase in the forfeiture rate would result in
a decrease to our expense.
|
In
certain instances where market based, performance share awards are granted, we
use the Monte Carlo valuation model to calculate the fair value. This
approach utilizes a two-stage process, which first simulates potential outcomes
for our shares using the Monte Carlo simulation. The first stage of
the Monte Carlo simulation requires a variety of assumptions about both the
statistical properties of our shares as well as potential reactions to such
share price movements by our management. Such assumptions include the
natural logarithm of our stock price, a random log-difference using the Russell
2000 stock index and a random variable using the specific deviations of our
returns relative to the returns dictated by the CAPM model. The
second stage employs the Black-Scholes model to value the various outcomes
predicted by the Monte Carlo simulation. The resulting fair value, on
the date of the grant (measurement date), is being recognized over the vesting
period using the straight-line method.
48
Consolidated
Historical Results of Operations
The
following table sets forth certain consolidated historical results of operations
data and expressed as a percentage of total revenue for the periods indicated.
Period-to-period comparisons of our financial results are not necessarily
meaningful and you should not rely on them as an indication of future
performance.
|
Kenexa
Corporation Consolidated Statements of Operations
(in
thousands, except for percentages)
|
||||||||||||||||||||||||
|
For the Year Ended
December 31,
|
||||||||||||||||||||||||
|
2009
|
2008
|
2007
|
||||||||||||||||||||||
|
Amount
|
Percent of
Revenues
|
Amount
|
Percent of
Revenues
|
Amount
|
Percent of
Revenues
|
|||||||||||||||||||
|
Revenues:
|
||||||||||||||||||||||||
|
Subscription
revenue
|
$ | 133,854 | 84.9 | % | $ | 163,420 | 80.2 | % | $ | 148,662 | 81.7 | % | ||||||||||||
|
Other
revenue
|
23,815 | 15.1 | % | 40,312 | 19.8 | % | 33,264 | 18.3 | % | |||||||||||||||
|
Total
revenues
|
157,669 | 100.0 | % | 203,732 | 100.0 | % | 181,926 | 100.0 | % | |||||||||||||||
|
Cost
of revenues
|
53,371 | 33.9 | % | 61,593 | 30.2 | % | 50,920 | 28.0 | % | |||||||||||||||
|
Gross
profit
|
104,298 | 66.1 | % | 142,139 | 69.8 | % | 131,006 | 72.0 | % | |||||||||||||||
|
Operating
expenses:
|
||||||||||||||||||||||||
|
Sales
and marketing
|
35,182 | 22.3 | % | 40,780 | 20.0 | % | 35,324 | 19.4 | % | |||||||||||||||
|
General
and administrative
|
40,801 | 25.9 | % | 48,884 | 24.0 | % | 39,332 | 21.6 | % | |||||||||||||||
|
Research
and development
|
9,757 | 6.2 | % | 15,555 | 7.6 | % | 17,737 | 9.7 | % | |||||||||||||||
|
Depreciation
and amortization
|
14,264 | 9.0 | % | 12,088 | 5.9 | % | 7,584 | 4.2 | % | |||||||||||||||
|
Restructuring
charges
|
— | — | % | 1,979 | 1.0 | % | — | — | ||||||||||||||||
|
Goodwill
impairment charge
|
33,329 | 21.1 | % | 167,011 | 82.0 | % | — | — | ||||||||||||||||
|
Total
operating expenses
|
133,333 | 84.5 | % | 286,297 | 140.5 | % | 99,977 | 55.0 | % | |||||||||||||||
|
(Loss)
income from operations
|
(29,035 | ) | (18.4 | ) % | (144,158 | ) | (70.8 | )% | 31,029 | 17.1 | % | |||||||||||||
|
Interest
income (expense), net
|
(44 | ) | — | % | 1,395 | 0.7 | % | 3,098 | 1.7 | % | ||||||||||||||
|
(Loss)
gain on change in fair market value of ARS and put option,
net
|
(12 | ) | — | % | — | — | % | — | — | % | ||||||||||||||
|
(Loss)
income before income tax
|
(29,091 | ) | (18.4 | ) % | (142,763 | ) | (70.1 | )% | 34,127 | 18.8 | % | |||||||||||||
|
Income
tax (benefit) expense
|
1,927 | 1.2 | % | (38,071 | ) | (18.7 | )% | 10,579 | 5.8 | % | ||||||||||||||
|
Net
(loss) income
|
(31,018 | ) | (19.6 | ) % | (104,692 | ) | (51.4 | )% | 23,548 | 12.9 | % | |||||||||||||
|
Income
allocated to noncontrolling interests
|
(61 | ) | (0.1 | ) % | — | — | % | — | — | % | ||||||||||||||
|
Net
income (loss) available to common shareholders’
|
$ | (31,079 | ) | (19.5 | ) % | $ | (104,692 | ) | (51.4 | ) % | $ | 23,548 | 12.9 | % | ||||||||||
Geographic
Information
The
following table summarizes the distribution of revenue by geographic region as
determined by billing address for the years ended December 31, 2009, 2008 and
2007.
|
For the year ended
December 31, 2009
|
For the year ended
December 31, 2008
|
For the year ended
December 31, 2007
|
||||||||||||||||||||||
|
Country
|
Revenue
|
Revenue as a
percentage of
total revenue
|
Revenue
|
Revenue as a
percentage of
total revenue
|
Revenue
|
Revenue as a
percentage of
total revenue
|
||||||||||||||||||
|
United
States
|
$ | 124,652 | 79.1 | % | $ | 149,225 | 73.6 | % | $ | 155,247 | 85.3 | % | ||||||||||||
|
United
Kingdom
|
11,156 | 7.1 | % | 17,729 | 8.7 | % | 10,741 | 5.9 | % | |||||||||||||||
|
Other
European Countries
|
7,818 | 4.9 | % | 11,660 | 5.5 | % | 5,389 | 3.0 | % | |||||||||||||||
|
Germany
|
4,073 | 2.6 | % | 9,765 | 4.8 | % | 2,832 | 1.5 | % | |||||||||||||||
|
The
Netherlands
|
1,755 | 1.1 | % | 3,196 | 1.6 | % | 2,706 | 1.5 | % | |||||||||||||||
|
Canada
|
2,808 | 1.8 | % | 5,539 | 2.7 | % | 2,526 | 1.4 | % | |||||||||||||||
|
Other
|
5,407 | 3.4 | % | 6,618 | 3.1 | % | 2,485 | 1.4 | % | |||||||||||||||
|
Total
|
$ | 157,669 | 100.0 | % | $ | 203,732 | 100.0 | % | $ | 181,926 | 100.0 | % | ||||||||||||
49
Comparison
of Years Ended December 31, 2009 and 2008
Revenues
Total
revenue decreased by $46.0 million or 22.6% to $157.7 million for the year
ended December 31, 2009 from $203.7 million for the year ended
December 31, 2008. Our subscription revenue decreased by $29.5 million
to $133.9 million for the year ended December 31, 2009 from
$163.4 million for the year ended December 31, 2008. Subscription
revenue represented approximately 84.9% of our total revenue for the year ended
December 31, 2009 compared to 80.2% of our total revenue for the year ended
December 31, 2008. The decrease in revenue is attributable primarily to the
effects arising from the global economic recession, increased pricing pressures,
high unemployment, and reduced demand for our products and services and the
effects of delayed revenue recognition associated with sales of our multiple
element or bundled arrangements. Based upon the current market
conditions, we expect our subscription-based and other revenues to increase in
2010 over the prior year due to stabilization in the unemployment rate, slightly
improved business environment and continued acceptance of our talent management
solutions on-demand model.
Cost
of Revenues
Cost of
revenue decreased by $8.2 million or 13.3% to $53.4 million for the year
ended December 31, 2009 from $61.6 million for the year ended
December 31, 2008. As a percentage of revenue, cost of revenue
increased 3.7% to 33.9% for the year ended December 31, 2009 compared to
30.2% for the year ended December 31, 2008 due to decreased revenues in
2009. The $8.2 million decrease in the cost of revenue was primarily due to
reduced staff expense, reimbursable expense and third party fees, including
marketing and agency costs, of approximately $5.0 million, $2.5 million and $0.7
million, respectively, compared to the same period in 2008. Many
factors affect our cost of revenue, including changes in the mix of products and
services, the number of initial implementations versus recurring engagements,
pricing trends, changes in the amount of reimbursed expenses and fluctuations in
our customer base. As our overall revenue increases, we expect our
cost of revenue will increase proportionately, subject to pricing pressure
related to economic conditions and slightly influenced by the mix of services
and software. To the extent new customers are added, we expect that the cost of
services, as a percentage of revenue, will be greater than those services
associated with existing customers.
Sales
and Marketing
Sales and
marketing expense decreased by $5.7 million or 13.7% to $35.1 million for
the year ended December 31, 2009 compared to $40.8 million for the
year ended December 31, 2008. The $5.7 million decrease was primarily due
to reduced staff related expense, commissions, travel expenses and reserve for
bad debt of approximately $0.7 million, $1.4 million, $1.1 million, and $3.1
million, respectively, partially offset by an increase in other expenses of $0.6
million, compared to the same period in 2008. As a percentage of
total revenue, sales and marketing expense increased by 2.3% to 22.3% for the
year ended December 31, 2009 from 20.0% for the year ended
December 31, 2008 due to decreased revenue. Consistent with our
past practice, we intend to continue to invest in sales and marketing to pursue
new customers and expand relationships with existing customers at levels we deem
appropriate given our current economic conditions. We expect our
sales and marketing expense to increase from current levels, mainly due to
increased staff expense, including variable compensation and continued emphasis
on our rebranding effort.
General
and Administrative
General
and administrative expense decreased by $8.1 million or 16.5% to
$40.8 million for the year ended December 31, 2009 compared to
$48.9 million for the year ended December 31, 2008. The
$8.1 million decrease was primarily due to reduced staff related expense,
bonus, share-based compensation and travel expenses of approximately $2.8
million, $1.7 million, $0.6 million and $1.4 million,
respectively. In addition, phone, entertainment and infrastructure
expenses such as supplies, insurance and other expenses contributed
approximately $0.5 million, $0.4 million, and $0.7 million, respectively, of the
decrease in expense compared to the same period in 2008. As a
percentage of total revenue, general and administrative expense increased by
1.9% to 25.9% for the year ended December 31, 2009 compared to 24.0% for
the year ended December 31, 2008 due to decreased revenues in
2009. In the short term, we expect general and administrative expense
to increase as we incur additional professional fees in connection with our
patent infringement matter, however, in the longer term based upon the current
state of the economy, we believe that general and administrative expenses will
remain the same or slightly increase in dollar amount and remain constant as a
percentage of total revenue in 2010.
50
Research
and Development
Research
and development expense decreased by $5.8 million or 37.3% to $9.8 million for
the year ended December 31, 2009 compared to $15.6 million for the
year ended December 31, 2008. The $5.8 million decrease in research
and development expense was primarily due to reduced staff related expense and
an increase in capitalized software development costs. Capitalized
software development costs increased by $1.5 million or 18.3% to $9.7 million
for the year ended December 31, 2009 from $8.2 million for the year ended
December 31, 2008. The increase in capitalized software development
costs was directly attributable to an increase in the software development
projects qualifying for capitalization, pursuant to ASC 350-40, “Internal-Use Software”, and a
decrease of research and development expenses. The increase in
capitalized software development costs was due in part to greater use of third
party software developers. As a percentage of total revenue, research
and development expense decreased 1.4% to 6.2% for the year ended
December 31, 2009 compared to 7.6% the year ended December 31,
2008. A small portion of our research and development expense relates
to the efforts of our Kenexa Research Institute scientists, which is more fixed
in nature. This cost structure will result in future research and development
expense being more constant. We expect research and development
expenses to remain flat or increase slightly as we continue to execute on our
strategies which include furthering the common services enterprise architecture,
introducing Kenexa 2x modules, and continuing to develop feature
enhancements.
Depreciation
and Amortization
Depreciation
and amortization expense increased $2.3 million or 18.0% to $14.3 million
for the year ended December 31, 2009 compared to $12.0 million for the
year ended December 31, 2008. The $2.3 million increase was due
in part to increased amortization expense associated with our acquisitions and
increased depreciation expense associated with our capitalized software and our
capital purchases including our building in Vizag. In the future, we
expect depreciation and amortization expense to increase as we place our
software development into service and due to recent capital
purchases.
Goodwill
Impairment
During
the quarter ended March 31, 2009 we reevaluated our goodwill due to continued adverse changes in the
economic climate, a 32.5% decline in our market capitalization from December 31,
2008 through March 31, 2009 and a downward revision in internal
projections. These factors signaled a triggering event, which
required us to determine whether and to what extent our goodwill may have been
impaired as of March 31, 2009. We reviewed our goodwill
by comparing the carrying values to the estimated fair values of the
enterprise. Fair value is based on our estimate of the future
discounted cash flows to be generated by the enterprise and our market
capitalization. Such cash flows consider factors such as future operating
income, historical trends, as well as demand and competition. Comparable company
multiples are based upon public companies in sectors relevant to our business
based on our knowledge of the industry. Changes in the underlying business could
affect these estimates, which in turn could affect our assessment of the
recoverability of goodwill. Based on the analysis a goodwill
impairment charge of $33.3 million for was recorded to write off the remaining
balance of our goodwill for the quarter ended March 31, 2009.. The
goodwill impairment charge had no effect on our cash balances. See
Critical Accounting Policies and Estimates for additional details.
Interest
Income
Net
interest expense was less than $0.1 million for the year ended December 31,
2009 compared to $1.4 million net interest income for the year ended
December 31, 2008. The $1.4 million decrease is due primarily to
significantly lower rates of interest in 2009 and 2008 and the write off of
deferred financing fees as a
result of the termination of our Credit Agreement with PNC
Bank.
51
Income
Tax Expense
An income
tax expense of $1.9 million was recorded on a loss from operations of $29.0 for
the year ended December 31, 2009 as compared with an income tax benefit of
$38.1 million for the year ended December 31, 2008. The current year
income tax expense is primarily attributable to an increase in the valuation
allowance of $7.0 million on federal, state and foreign net operating losses and
the recognition of a goodwill impairment loss of $33.3 million that is only
partially deductible for U.S. tax purposes.
Webhire
and BrassRing were two domestic companies which we acquired in 2006. During the
year ended December 31, 2007, Webhire and BrassRing each made retroactive
elections under Section 338(g) of the Internal Revenue Code with the effect
of increasing the tax basis of certain acquired intangible assets to equal the
deemed purchase price of these assets. We are amortizing the increased tax basis
of these acquired intangibles over a 15-year period for federal and state income
tax purposes. The amortization of these intangibles gives rise to
temporary differences between the book basis and tax basis of these
assets.
The
goodwill impairment loss claimed in 2009 included certain intangible assets
recorded by Webhire and BrassRing during their respective
acquisitions. These intangibles are characterized as component-1
goodwill as we expect to recognize tax deductions as we amortize the tax basis
of these assets over their remaining useful lives. The portion of impaired
goodwill that has no tax basis is considered to be component-2
goodwill. We have allocated the impairment charge of $33.3 million
between component-1 goodwill ($20.3 million) and component-2 goodwill ($13.0
million) and recorded a deferred tax asset computed on the difference between
the book and tax bases of component-1 goodwill.
Changes
to deferred income taxes are generally based on management's evaluation of our
positive and negative evidence bearing upon the realizability of its deferred
tax assets and the determination that it is more likely than not that we will
realize a portion of the benefits of federal and state tax assets. In
assessing the need for a valuation allowance, management considers all available
information within each taxing jurisdiction, including past operating results,
estimates of future taxable income and the feasibility of tax planning
strategies. Any changes in management’s assessment of the amount of deferred tax
assets that may be realized will result in an adjustment to its valuation
allowance with a corresponding increase or decrease to income tax expense in the
period in which such determination is made.
Comparison
of Years Ended December 31, 2008 and 2007
Revenues
Total revenue increased by $21.8
million or 12.0% to $203.7 million for the year ended December 31,
2008 from $181.9 million for the year ended December 31, 2007. Our
subscription revenue increased by $14.7 million to $163.4 million for
the year ended December 31, 2008 from $148.7 million for the year
ended December 31, 2007. Subscription revenue represented approximately
80.2% of our total revenue for the year ended December 31, 2008 compared to
81.7% of our total revenue for the year ended December 31, 2007. The
increase in revenue is attributable primarily to an increase in sales volumes of
our talent management solutions and the continued acceptance of our on-demand
model. Revenue generated by Quorum comprised approximately 7.9% of the increase
in our total revenue for the year ended December 31, 2008 compared to the
prior year. Our other revenue increased by $7.1 million to
$40.3 million for the year ended December 31, 2008 from
$33.2 million for the year ended December 31, 2007. This increase was
mostly due to an increase in demand for our consulting services which resulted
from an increase in our subscription-based revenues.
Cost
of Revenues
Cost of
revenue increased by $10.7 million or 21.0% to $61.6 million for the year
ended December 31, 2008 from $50.9 million for the year ended
December 31, 2007. As a percentage of revenue, cost of revenue increased
2.2% to 30.2% for the year ended December 31, 2008 compared to 28.0% for
the year ended December 31, 2007. The $10.7 million increase in the cost of
revenue was primarily due to increased salaries, overhead, direct costs and
other expense of $7.1 million, $1.2 million, $1.1 million and $1.3 million,
respectively. Our increased salaries were due in part to the addition
of 100 employees from the acquisition of Quorum in 2008.
52
Sales
and Marketing
Sales and
marketing expense increased by $5.5 million or 15.6% to $40.8 million for
the year ended December 31, 2008 compared to $35.3 million for the
year ended December 31, 2007. The $5.5 million increase was due in part to
an increase of staff related expense of approximately $5.6 million, partially
offset by a decrease in performance bonuses, commissions and travel expenses of
approximately $3.7 million from the prior year. The net $1.9 million increase in
salaries was due partially to the addition of 24 employees from our Quorum
acquisition and 39 employees hired for our existing business in
2008. In addition, reserve for bad debt and advertising and marketing
expense contributed approximately $2.4 million and $1.2 million to the increase
in sales and marketing expense for the year ended December 31, 2008 over
the prior year. The increase in bad debt was mainly attributed to
three customers. As a percentage of total revenue, S&M expense
increased to 20.0% for the year ended December 31, 2008 from 19.4% for the
year ended December 31, 2007 due to increased expense.
General
and Administrative
General and administrative expense
increased by $9.5 million or 24.1% to $48.9 million for the year ended
December 31, 2008 compared to $39.4 million for the year ended
December 31, 2007. The $9.5 million increase was due in part to an
increase in professional fees, rent and utilities expense, and share-based
compensation expense which contributed $2.6 million, $1.6 million, and $1.8
million, respectively, to the increase in general and administrative expense for
the year ended December 31, 2008 compared to the prior year. In addition
increased travel, phone and license expense contributed approximately $0.9
million, $0.8 million and $0.4 million in expense for the year ended December
31, 2008 compared to the prior year. The remainder of the increase of
$1.4 million was attributable to increases in infrastructure expenses such as
supplies, insurance and other expenses of $1.0 million and salary and bonus
expenses of $0.4 million. As a percentage of total revenue, general and
administrative expense increased by 2.4% to 24.0% for the year ended
December 31, 2008 compared to 21.6% for the year ended December 31,
2007.
Research
and Development
Research
and development expense decreased by $2.1 million or 11.9% to $15.6 million for
the year ended December 31, 2008 from $17.7 million for the year ended
December 31, 2007. The $2.1 million decrease in research and
development expense was directly attributable to increased capitalized software
development costs during 2008. Capitalized software development costs
increased by $5.5 million or 203.7% to $8.2 million for the year ended December
31, 2008 from $2.7 million for the year ended December 31, 2007. The
increase in capitalized software development costs represents 52.6% and 15.3% of
research and development expense for the years ended December 31, 2008 and 2007,
respectively and was directly attributable to an increase in the software
development projects qualifying for capitalization, pursuant to ASC 350-40,
“Internal-Use
Software”. This increase was due in part to greater use of
third party software developers. As a percentage of total revenue,
research and development expense decreased from 9.7% to 7.6% for the year ended
December 31, 2008 compared to the year ended December 31, 2007 due to
increased capitalized software development costs.
Depreciation
and Amortization
Depreciation and amortization expense
increased $4.4 million or 57.9% to $12.0 million for the year ended
December 31, 2008 compared to $7.6 million for the year ended
December 31, 2007. The $4.4 million increase was due in part to
increased amortization expense associated with our recent acquisitions and
increased depreciation expense associated with our capitalized software and our
capital purchases including our building in Vizag.
Restructuring
expense
During the quarter ended December 31,
2008 in response to the weakness of our macroeconomic environment and widespread
deterioration in our business climate we announced a restructuring program
involving staff reductions of approximately 200 employees which included
severance and outplacement benefit costs totaling approximately $2.0
million.
53
Goodwill
Impairment
During
the quarter ended December 31, 2008, due to adverse changes in the economic
climate, a 49.5% decline in the our market capitalization from
October 1, 2008, and a downward revision in our earnings guidance for the
quarter and year ended December 31, 2008, we reevaluated our goodwill impairment
analysis. Pursuant to FASB ASC 350, “Assets-Intangibles-Goodwill and
Other”, these factors signaled a triggering event, which required us to
determine whether and to what extent our goodwill was impaired as of
December 31, 2008. The first step of this analysis required the
estimation of our fair value, as an entity, and is calculated based on the
observable market capitalization with a range of estimated control premiums as
well as discounted future estimated cash flows. This step yielded an estimated
fair value for us which was less than our carrying value including goodwill at
December 31, 2008. The next step entailed performing an analysis to determine
whether the carrying amount of goodwill on our balance sheet exceeded our
implied fair value. The implied fair value of our goodwill, for this step was
determined in the same manner as goodwill recognized in a business combination.
Our estimated fair value was allocated to our assets and liabilities, including
any unrecognized identifiable intangible assets, as if we had been acquired in a
business combination with our estimated fair value representing the price paid
to acquire it. The allocation process performed on the test date was only for
purposes of determining the implied fair value of goodwill with neither the
write up or write down of any assets or liabilities, nor recording of any
additional unrecognized identifiable intangible assets as part of this process,
but did cause us to be out of compliance with the covenants under our credit
facility pursuant as of December 31, 2008. Based on the analysis, we determined
that the implied fair value of the Kenexa’s goodwill was $32.4 million,
resulting in a goodwill impairment charge of $167.0 million. The goodwill
impairment charge had no effect on our cash balances.
Interest
Income
Interest
income decreased $1.7 million or 54.8% for the year ended December 31,
2008 to $1.4 million for the year ended December 31, 2008 from
$3.1 million for the year ended December 31, 2007. The
$1.7 million decrease was due primarily to lower cash balances and lower
rates of interest in 2008.
Income
Tax Expense
An income
tax benefit on continuing operations of $38.1 million was recorded for the year
ended December 31, 2008 as compared with an income tax expense of
$10.6 million for the year ended December 31, 2007. This income tax
benefit was primarily attributable to the recognition of a deferred tax asset of
$42.3 million relating to a goodwill impairment loss that was deductible for
U.S. tax purposes. Changes to deferred income taxes are generally based on
management's evaluation of our positive and negative evidence bearing upon the
realizability of its deferred tax assets and the determination that it is more
likely than not that we will realize a portion of the benefits of federal and
state tax assets.
Webhire,
which we acquired in January 2006, had a net operating loss carryforward
balance of approximately $48.0 million for federal purposes as of
September 30, 2005. BrassRing, which we acquired in
November 2006, had a net operating loss carryforward balance of
approximately $78.0 million for federal purposes as of December 31,
2006. Based upon the uncertainty of our ability to utilize these acquired net
operating losses, we recorded a valuation allowance of approximately $12.0
million during the year ended December 31, 2006.
During
the year ended December 31, 2007, Webhire and BrassRing made retroactive
elections under Section 338(g) of the Internal Revenue Code with the effect
of increasing the tax basis of acquired intangible assets to the deemed purchase
price of these assets. We will amortize the increased tax basis of acquired
intangibles over a 15-year period for federal and state income tax
purposes. Separate gains equal to the respective increases in tax basis
were included in the pre-acquisition taxable incomes of each acquired company.
Webhire and BrassRing each had sufficient net operating loss carryforwards to
fully offset the income recognized on the deemed sale of assets for regular
federal income tax purposes. However, under the federal alternative minimum
tax rules, net operating loss carryforwards may not offset more than 90% of
income taxable under this measure. We have therefore paid alternative minimum
tax on these gains of approximately $0.5 million. Concurrent with the
recognition of these gains, certain of the acquired net operating losses were
deemed to expire. Accordingly, we reduced the deferred tax assets associated
with these acquired net operating losses and the related valuation allowances by
offsetting amounts of approximately $12.0 million.
54
Since we
were formed in 1987, we have financed our operations primarily through
internally generated cash flows, our revolving credit facilities and the
issuance of equity. As of December 31, 2009, we had cash and cash
equivalents of $29.2 million and short term investments of
$29.6 million. In addition, we had no debt and approximately
$0.5 million in capital equipment leases.
Our cash
provided from operations was $35.5 million, $32.5 million and $38.6 million for
the years ended December 31, 2009, 2008 and 2007, respectively. Cash
used in investing activities was $28.2 million, $18.1 million and $86.3 million
for the years ended December 31, 2009, 2008 and 2007,
respectively. Cash (used in) and provided by financing activities was
$(0.2) million, $(29.7) million and $42.3 million for the years ended
December 31, 2009, 2008 and 2007, respectively. All of these
effects in 2009 resulted in an increase in our cash and cash equivalents of $7.5
million for the year ended December 31, 2009. While our investing and
financing activities have been significant over the past three years, we expect
positive cash flow from operations to continue in future periods.
As of
December 31, 2009, we held auction rate securities with a fair value of $13.9
million and par value of $15.3 million. Our auction rate securities portfolio
includes investments rated A, AA and AAA and are comprised of federally and
privately insured student loans. The auction rate securities we hold have
continued to fail to trade at recent auctions due to insufficient bids from
buyers. This limits the short-term liquidity of these instruments and may limit
our ability to liquidate and fully recover the carrying value of our auction
rate securities if we needed to convert some or all to cash in the near term.
Despite the current lack of liquidity in the auction rate security market, we
believe our current cash and cash equivalent balances and cash from operations
will be sufficient to fund our operations.
Our
auction rate securities were acquired through UBS AG. Due to the
failure of the auction rate market in early 2008, UBS and other major banks
entered into agreements with governmental agencies to provide liquidity to
owners of auction rate securities. In November 2008, we entered into an
agreement with UBS which provides us (1) with a “no net cost” loan up to the par
value of Eligible ARS until September 30, 2010, (2) the right to sell these
auction rate securities back to UBS AG at par, at our sole discretion, anytime
during the period from June 30, 2010 through July 2, 2012, and
(3) provides UBS AG the right to purchase these auction rate securities or
sell them on our behalf at par anytime through July 2, 2012. (See Note 3 to
our Consolidated Financial Statements included in this Annual Report on Form
10-K for more information).
On May
31, 2009, we elected not to renew our secured credit agreement with our bank and
as a result, no longer have a revolving credit facility or other debt financing
arrangement. We believe that our cash and short-term investments, our
UBS Settlement Agreement for our auction rate securities and our projected cash
from operations will be sufficient to meet our liquidity needs for at least the
next twelve months.
On April
2, 2008, we acquired Quorum International Holdings Limited (“Quorum”), a
provider of recruitment process outsourcing services based in London, England,
for a purchase price of approximately $27.9 million, in cash, to broaden our
presence in the global recruitment market. The total cost of the
acquisition, including legal, accounting, and other professional fees of $1.3
million, was approximately $29.2 million. In addition, the
acquisition agreement contains an earnout provision which provides for the
payment of additional consideration by the Company based upon the gross profit
of Quorum for the twelve month period ending June 30, 2009 and June 30,
2010. Formulaically, the earnout is 3.86 times Quorum’s gross profit less
the amount of base consideration, as defined in the agreement. Based
upon the results for the twelve month period through June 30, 2009, it was
determined that an earnout payment was due to the former shareholders of Quorum
and as such, we accrued additional consideration of $1.2 million. The
related liability has been accrued in the financial statements at December 31,
2009. The additional consideration was paid in cash during the first
quarter of 2010. In addition, as of December 31, 2009, the June 30,
2010 earnout amount was substantially uncertain, and, as such, the estimated
earn out range is not possible to disclose. The Company evaluates the
earnout provisions contained in the acquisition agreement at each financial
statement reporting date.
On
February 20, 2008, our board of directors authorized a stock repurchase plan
providing for the repurchase of up to 3,000,000 shares of our common
stock. In connection with our November 8, 2007 and February 20, 2008
stock repurchase plans, we repurchased 1.7 million and shares of our common
stock at an average price of $18.01 per share and an aggregate cost of $30.3
million for the year ended December 31, 2008. For the period ended
December 31, 2009, there were no repurchases under the stock repurchase
plans. As of December 31, 2009, there was 1,847,349 shares available
for repurchase under the stock repurchase plan.
55
Operating
Activities
Net cash
provided by operating activities was $35.5 million, $32.5 million and $38.6
million for the years ended December 31, 2009, 2008 and 2007,
respectively.
Our
largest source of operating cash flows is cash collections from our customers
following the purchase and renewal of their software subscriptions. Payments
from customers for subscription agreements are generally received near the
beginning of the contract term, which can vary from one to three years in
length. We also generate significant cash from our recruitment process
outsourcing services and to a lesser extent our consulting services. Our primary
uses of cash from operating activities are for personnel related expenditures as
well as payments related to taxes and leased facilities.
Net cash
provided by operating activities for the year ended December 31, 2009
resulted primarily from a net loss of approximately $31.0 million, an increase
in deferred tax benefits of $0.4 million and other changes in working capital of
$5.0 million, offset by a non-cash charge to goodwill impairment of $33.3
million, other non-cash charges of $19.6 million, accounts and unbilled
receivables of $7.8 million and deferred revenue of $11.2 million.
Net cash
provided by operating activities for the year ended December 31, 2008
resulted primarily from a net loss of approximately $104.7 million, an increase
in deferred tax benefits of $46.5 million and other changes in working capital
of $8.4 million, partially offset by a non-cash charge to goodwill impairment of
$167.0 million, other non-cash charges of $20.9 million, and deferred revenue of
$4.2 million.
Net cash
provided by operating activities for the year ended December 31, 2007
resulted primarily from net income of approximately $23.5 million, non-cash
charges to net income of $12.3 million, deferred revenue of $3.7 million and
other changes in working capital of $0.4 million offset by a $1.3 million
reduction in taxes payable resulting from our adoption of FAS 123R in
2006.
During 2008, we completed a
restructuring plan to decrease costs by reducing our workforce across our
organization and by consolidating facilities where the workforce reductions
resulted in excess office space. This restructuring plan was designed to
decrease costs by reducing our workforce throughout the company of approximately
200 employees. We recorded restructuring and other charges and made
payments of $2.0 million during fiscal 2008. As a result of the
continued deterioration in the economic environment during the first quarter of
2009, we executed an additional reduction in force resulting in the elimination
of approximately 159 employees, as a result we incurred severance and
outplacement benefit costs totaling $1.2 million.
Investing
Activities
Net cash
used in investing activities was $28.2 million, $18.1 million and $86.3 million
for the years ended December 31, 2009, 2008 and 2007,
respectively. Cash flows used in investing activities consisted primarily
of adjustments for earnouts, taxes, escrow payments, acquisitions and additional
capital equipment as follows:
|
Years ended
December 31,
|
||||||||||||
|
2009
|
2008
|
2007
|
||||||||||
|
Scottworks
acquisition
|
$ | — | $ | 0.1 | $ | — | ||||||
|
Webhire
acquisition
|
— | — | 5.0 | |||||||||
|
Knowledge
Workers acquisition
|
— | 0.1 | — | |||||||||
|
Gantz
Wiley Research acquisition
|
— | 0.6 | 0.7 | |||||||||
|
BrassRing
acquisition
|
— | — | 11.7 | |||||||||
|
Psychometrics
acquisition
|
— | 3.4 | 0.3 | |||||||||
|
StraightSource
acquisition
|
3.1 | 2.0 | 9.9 | |||||||||
|
HRC
acquisition
|
0.2 | 0.2 | 2.4 | |||||||||
|
Quorum
acquisition
|
0.6 | 27.7 | — | |||||||||
|
Investment
in variable interest entity
|
1.1 | — | — | |||||||||
|
Cash
held in escrow for acquisitions
|
— | (1.6 | ) | (14.9 | ) | |||||||
|
Capitalized
software and purchases of computer hardware
|
15.3 | 20.8 | 12.7 | |||||||||
|
Purchases
of available-for-sale securities
|
14.9 | 20.5 | 133.7 | |||||||||
|
Sales
of available-for-sale securities
|
(3.7 | ) | (55.7 | ) | (75.2 | ) | ||||||
|
Sales
of trading securities
|
(3.3 | ) | — | — | ||||||||
|
Total
Cash flows from investing activities
|
$ | 28.2 | $ | 18.1 | $ | 86.3 | ||||||
56
Financing
Activities
Net cash
used in financing activities was $0.2 million and $29.7 million for the years
ended December 31, 2009 and 2008, respectively. Net cash
provided by financing activities was $42.3 million for the year ended
December 31, 2007.
For the
year ended December 31, 2009, net cash used in financing activity resulted
primarily from our variable interest entity of $0.2 million, repayments of
capital lease obligations and notes payable of $0.4 million, partially offset by
net proceeds from stock option exercises of $0.1 million, and share issuance
from our employee stock purchase plan of $0.3 million.
For the
year ended December 31, 2008, net cash used in financing activity resulted
primarily from repurchases of our common shares of $30.3 million, repayments of
capital lease obligations and notes payable of $0.3 million, partially offset by
net proceeds from stock option exercises of $0.4 million, excess tax benefits
from share-based payment arrangements of $0.2 million, and share issuance from
our employee stock purchase plan of $0.3 million.
For the
year ended December 31, 2007, net cash provided by financing activity
resulted primarily from net proceeds from our public offering of $130.4 million,
net proceeds from stock option exercises of $1.6 million, excess tax benefits
from share-based payment arrangements of $1.3 million, share issuance from our
employee stock purchase plan of $0.2 million, partially offset by deferred
financing costs of $0.1 million, repayments of borrowings under our line of
credit of $65.0 million, repurchases of our common shares of $25.5 million,
repayments of capital lease obligations of $0.2 million, and net repayments of
notes payable of $0.4 million.
57
Unaudited
Quarterly Statements of Operations
The
following tables present our unaudited quarterly results of operations for each
of the eight quarters in the period ended December 31, 2009 and our
unaudited quarterly results of operations expressed as a percentage of our total
revenue for the same periods. You should read the following tables in
conjunction with our audited consolidated financial statements and related notes
appearing in this annual report on Form 10-K. We have prepared the unaudited
information on a basis consistent with our audited consolidated financial
statements and have included all adjustments, which, in the opinion of
management, are necessary to fairly present our operating results for the
quarters presented. Our historical unaudited quarterly results of operations are
not necessarily indicative of results for any future quarter or for a full
year.
|
Consolidated Statements of Operations
|
||||||||||||||||||||||||||||||||
|
For the Three Months Ended
|
||||||||||||||||||||||||||||||||
|
December 31,
2009
|
September 30,
2009
|
June 30,
2009
|
March 31,
2009
|
December 31,
2008
|
September 30,
2008
|
June 30,
2008
|
March 31,
2008
|
|||||||||||||||||||||||||
|
(unaudited
and in thousands, except per share data)
|
||||||||||||||||||||||||||||||||
|
Revenues:
|
||||||||||||||||||||||||||||||||
|
Subscription
revenue
|
$ | 33,327 | $ | 33,221 | $ | 34,041 | $ | 33,265 | $ | 37,565 | $ | 43,031 | $ | 43,668 | $ | 39,156 | ||||||||||||||||
|
Other
revenue
|
5,732 | 7,093 | 5,424 | 5,566 | 7,493 | 10,995 | 12,773 | 9,051 | ||||||||||||||||||||||||
|
Total
revenues
|
39,059 | 40,314 | 39,465 | 38,831 | 45,058 | 54,026 | 56,441 | 48,207 | ||||||||||||||||||||||||
|
Cost
of revenues
|
12,909 | 13,129 | 13,637 | 13,696 | 14,854 | 16,461 | 17,173 | 13,105 | ||||||||||||||||||||||||
|
Gross
profit
|
26,150 | 27,185 | 25,828 | 25,135 | 30,204 | 37,565 | 39,268 | 35,102 | ||||||||||||||||||||||||
|
Operating
expenses:
|
||||||||||||||||||||||||||||||||
|
Sales
and marketing
|
9,153 | 9,083 | 8,241 | 8,705 | 9,605 | 10,298 | 10,988 | 9,889 | ||||||||||||||||||||||||
|
General
and administrative
|
9,829 | 10,182 | 9,917 | 10,873 | 11,397 | 12,649 | 12,845 | 11,993 | ||||||||||||||||||||||||
|
Research
and development
|
2,200 | 2,453 | 2,536 | 2,568 | 2,950 | 3,756 | 4,307 | 4,542 | ||||||||||||||||||||||||
|
Depreciation
and amortization
|
4,180 | 3,582 | 3,274 | 3,228 | 3,322 | 3,337 | 3,278 | 2,151 | ||||||||||||||||||||||||
|
Restructuring
charges
|
— | — | — | — | 1,979 | — | — | — | ||||||||||||||||||||||||
|
Goodwill
impairment charge
|
— | — | — | 33,329 | 167,011 | — | — | — | ||||||||||||||||||||||||
|
Total
operating expenses
|
25,362 | 25,300 | 23,968 | 58,703 | 196,264 | 30,040 | 31,418 | 28,575 | ||||||||||||||||||||||||
|
Income
(loss) from operations
|
788 | 1,885 | 1,860 | (33,568 | ) | (166,060 | ) | 7,525 | 7,850 | 6,527 | ||||||||||||||||||||||
|
Interest
income (expense), net
|
142 | (28 | ) | (221 | ) | 63 | 179 | 255 | 320 | 641 | ||||||||||||||||||||||
|
(Loss)
gain on change in fair market value of ARS and put option,
net
|
(66 | ) | 102 | 247 | (295 | ) | — | — | — | — | ||||||||||||||||||||||
|
Income
(loss) before income tax
|
864 | 1,959 | 1,886 | (33,800 | ) | (165,881 | ) | 7,780 | 8,170 | 7,168 | ||||||||||||||||||||||
|
Income
tax expense (benefit)
|
509 | 361 | 575 | 482 | (45,026 | ) | 2,356 | 2,205 | 2,394 | |||||||||||||||||||||||
|
Net
income (loss)
|
$ | 355 | $ | 1,598 | $ | 1,311 | $ | (34,282 | ) | $ | (120,855 | ) | $ | 5,424 | $ | 5,965 | $ | 4,774 | ||||||||||||||
|
Income
allocated to noncontrolling interests
|
(61 | ) | — | — | — | — | — | — | — | |||||||||||||||||||||||
|
Net
income (loss) available to common shareholders’
|
294 | $ | 1,598 | $ | 1,311 | $ | (34,282 | ) | $ | (120,855 | ) | $ | 5,424 | $ | 5,965 | $ | 4,774 | |||||||||||||||
|
Net
income (loss) per share - basic
|
$ | 0.01 | $ | 0.07 | $ | 0.06 | $ | (1.52 | ) | $ | (5.36 | ) | $ | 0.24 | $ | 0.26 | $ | 0.20 | ||||||||||||||
|
Net
income (loss) per share - diluted
|
$ | 0.01 | $ | 0.07 | $ | 0.06 | $ | (1.52 | ) | $ | (5.36 | ) | $ | 0.24 | $ | 0.26 | $ | 0.20 | ||||||||||||||
58
|
Consolidated
Statements of Operations
|
||||||||||||||||||||||||||||||||
|
For
the Three Months Ended
|
||||||||||||||||||||||||||||||||
|
December 31,
2009
|
September 30,
2009
|
June 30,
2009
|
March 31,
2009
|
December 31,
2008
|
September 30,
2008
|
June 30,
2008
|
March 31,
2008
|
|||||||||||||||||||||||||
|
Revenues:
|
||||||||||||||||||||||||||||||||
|
Subscription
revenue
|
85.3 | % | 82.4 | % | 86.3 | % | 85.7 | % | 83.4 | % | 79.6 | % | 77.4 | % | 81.2 | % | ||||||||||||||||
|
Other
revenue
|
14.7 | % | 17.6 | % | 13.7 | % | 14.3 | % | 16.6 | % | 20.4 | % | 22.6 | % | 18.8 | % | ||||||||||||||||
|
Total
revenues
|
100.0 | % | 100.0 | % | 100.0 | % | 100.0 | % | 100.0 | % | 100.0 | % | 100.0 | % | 100.0 | % | ||||||||||||||||
|
Cost
of revenues
|
33.1 | % | 32.6 | % | 34.6 | % | 35.3 | % | 33.0 | % | 30.5 | % | 30.4 | % | 27.2 | % | ||||||||||||||||
|
Gross
profit
|
66.9 | % | 67.4 | % | 65.4 | % | 64.7 | % | 67.0 | % | 69.5 | % | 69.6 | % | 72.8 | % | ||||||||||||||||
|
Operating
expenses:
|
||||||||||||||||||||||||||||||||
|
Sales
and marketing
|
23.4 | % | 22.5 | % | 20.9 | % | 22.4 | % | 21.3 | % | 19.1 | % | 19.5 | % | 20.5 | % | ||||||||||||||||
|
General
and administrative
|
25.2 | % | 25.3 | % | 25.1 | % | 28.0 | % | 25.3 | % | 23.4 | % | 22.8 | % | 24.9 | % | ||||||||||||||||
|
Research
and development
|
5.6 | % | 6.1 | % | 6.4 | % | 6.6 | % | 6.5 | % | 7.0 | % | 7.6 | % | 9.4 | % | ||||||||||||||||
|
Depreciation
and amortization
|
10.7 | % | 8.9 | % | 8.3 | % | 8.3 | % | 7.4 | % | 6.2 | % | 5.8 | % | 4.5 | % | ||||||||||||||||
|
Restructuring
charges
|
— | — | — | — | 4.4 | % | — | — | — | |||||||||||||||||||||||
|
Goodwill
Impairment charge
|
— | — | — | 85.8 | % | 370.7 | % | — | — | — | ||||||||||||||||||||||
|
Total
operating expenses
|
64.9 | % | 62.8 | % | 60.7 | % | 151.1 | % | 435.6 | % | 55.7 | % | 55.7 | % | 59.3 | % | ||||||||||||||||
|
Income
from operations
|
2.0 | % | 4.7 | % | 4.7 | % | (86.4 | ) % | (368.5 | ) % | 13.8 | % | 13.9 | % | 13.5 | % | ||||||||||||||||
|
Interest
(income) expense
|
0.4 | % | (0.1 | )% | (0.6 | ) % | 0.2 | % | (0.4 | )% | (0.6 | )% | 0.6 | % | 1.3 | % | ||||||||||||||||
|
(Loss)
gain on change in fair market value of ARS and put option,
net
|
(0.2 | ) | 0.3 | 0.6 | % | (0.8 | ) % | — | — | — | — | |||||||||||||||||||||
|
Income
before income tax
|
2.2 | % | 4.9 | % | 4.7 | % | (87.0 | ) % | (368.1 | )% | 14.4 | % | 14.5 | % | 14.8 | % | ||||||||||||||||
|
Income
tax (benefit) expense
|
1.3 | % | 0.9 | % | 1.5 | % | 1.2 | % | (99.9 | )% | 4.4 | % | 3.9 | % | 5.0 | % | ||||||||||||||||
|
Net
income (loss)
|
0.9 | % | 4.0 | % | 3.2 | % | (88.2 | ) % | (268.2 | ) % | 10.0 | % | 10.6 | % | 9.8 | % | ||||||||||||||||
|
Income
allocated to noncontrolling interests
|
(0.2 | ) % | — | — | — | — | — | — | — | |||||||||||||||||||||||
|
Net
income (loss) available to common shareholders’
|
0.7 | % | 4.0 | % | 3.2 | % | (88.2 | ) % | (268.2 | ) % | 10.0 | % | 10.6 | % | 9.8 | % | ||||||||||||||||
59
Comparison
of Unaudited Quarterly Results
Revenues
Total
revenue increased throughout the second quarter of 2008 due to purchases of our
solutions by new customers, purchases of additional solutions by existing
customers and contract renewals, however as the economic conditions deteriorated
during the latter half of 2008, total revenues
declined. Subscription-based and other revenues decreased in 2009
over the prior year due to a greater number of customers delaying or revising
the terms and conditions of our service agreements, the strengthening US dollar,
the loss of RPO customers, and a loss of consulting engagements.
Cost
of Revenues
Cost of
revenue for the quarters presented has fluctuated between 27.2% and 35.3% based
on the mix of sales between subscription revenue and other revenue. Cost of
revenue was highest as a percentage of total revenue for the three months ended
March 31, 2009. As our overall revenue fluctuates, we expect our cost
of revenue to change proportionately, subject to pricing pressure related to
economic conditions and slightly influenced by the mix of services and software.
To the extent new customers are added, the cost of services, as a percentage of
revenue, will be greater than those services associated with existing
customers.
Sales
and Marketing
Following our acquisitions in 2008 and
our rebranding initiatives in 2009 sales and marketing increased slightly from
approximately 19.1% to 23.4% of our total revenues for those
periods. During 2008, sales and marketing expenses increased in terms
of absolute dollars as a result of increased marketing programs and variable
compensation programs. During 2009, based on economic conditions we
reduced our sales and marketing expenditures to adjust for expected lower rates
of growth projections. In the future, we intend to continue to invest
in sales and marketing to pursue new customers, expand relationships with
existing customers and market and advertise our new brand to existing and
potential customers at levels we deem appropriate given our current economic
conditions.
General
and Administrative
General
and administrative expenses have increased as a percentage of revenues from
approximately 22.8% during 2008 to 28.0% through March 31, 2009 due to our
restructuring programs which resulted in severance and outplacement benefit
costs. In absolute dollar terms over the eight quarters presented
general and administrative expenses have fluctuated due to our restructuring
programs and professional fees in connection with our patent infringement
matter. During the last nine
months of 2009 as our revenues and corporate activities remained relatively
flat, our general and administrative expense as a percentage of revenues held
steady at approximately 25.2%. In the longer term based upon the current
state of the economy, we believe that general and administrative expenses will
remain the same or slightly increase in dollar amount and remain constant or
decrease as a percentage of total revenue in 2010.
Research
and development expenses have decreased as a percentage of revenues from 9.4% in
March 31, 2008 to 5.6% during December 31, 2009 due to an increase in
capitalized software development costs during 2008 and 2009. The
increase capitalized software development costs was due in part to greater use
of third party software developers and improved precision of their time and
activity reporting.
Restructuring
expense
During the quarter ended December 31,
2008 in response to the challenging macroeconomic environment, the strengthening
U.S. dollar relative to other currencies of countries in which we do business,
and the resulting slowing or delaying of a number of project implementations we
announced a restructuring program involving staff reductions of approximately
200 employees which included severance and outplacement benefit costs totaling
approximately $2.0 million. As a result of the continued
deterioration in the economic environment during the first quarter of 2009, we
executed an additional reduction in force resulting in the elimination of
approximately 159 employees and incurring $1.2 million in severance and
outplacement benefit costs.
60
Goodwill
Impairment
During the three months ended March 31,
2009 and December 31, 2008 we reviewed the carrying values of goodwill by
comparing the carrying values to the estimated fair values of the enterprise.
The fair value is based on management’s estimate of the future discounted cash
flows to be generated by the enterprise and our market capitalization. Such cash
flows consider factors such as future operating income, historical trends, as
well as demand and competition. Comparable company multiples are based upon
public companies in sectors relevant to our business based on our knowledge of
the industry. Changes in the underlying business could affect these estimates,
which in turn could affect our assessment of the recoverability of
goodwill. Due to adverse changes in the economic climate, a decline
in our market capitalization from October 1, 2008, and a downward revision in
earnings guidance, we reevaluated our goodwill impairment
analysis. Based on the analysis, a goodwill impairment charge of
$33.3 million and $167.0 million for the three months ended March 31, 2009 and
December 31, 2008, respectively, was recorded. The goodwill impairment charge
had no effect on our cash balances.
Contractual
Obligations and Commitments
The
following table summarizes our contractual obligations at December 31,
2009:
|
Payments due by period
|
||||||||||||||||||||
|
Total
|
Less than
1 year
|
1-3 years
|
3-5 years
|
More than
5 years
|
||||||||||||||||
|
Capital
Lease Obligations
|
$ | 476 | $ | 215 | $ | 261 | $ | — | $ | — | ||||||||||
|
Operating
Lease Obligations
|
21,158 | 7,532 | 8,953 | 4,311 | 362 | |||||||||||||||
|
Total
|
$ | 21,634 | $ | 7,747 | $ | 9,214 | $ | 4,311 | $ | 362 | ||||||||||
The
amounts listed above for capital lease obligations represent payments that we
are required to make for equipment. If we fail to remain current with our
obligations for any of these capital leases, we would be in default, and our
continued failure to cure such a default would cause our remaining obligations
under the defaulted capital lease to become immediately due.
The
amounts listed above for operating leases represent our leases for office space,
copiers and other operating obligations. If we fail to make rent payments on any
of these operating leases when due, we will be required to pay all remaining
rent payments on the leases.
We had no
off-balance sheet arrangements for the periods presented in this Annual Report
on Form 10-K.
61
Adoption
of new accounting pronouncements
Effective July 1, 2009, we adopted
“The FASB Accounting
Standards Codification and the Hierarchy of Generally Accepted Accounting
Principles”. This standard
establishes only two levels of GAAP, authoritative and non-authoritative. The
FASB Accounting Standards Codification (the “Codification”) became the source of
authoritative, non-governmental GAAP, except for rules and interpretive
releases of the SEC, which are sources of authoritative GAAP for SEC
registrants. All other non-grandfathered, non-SEC accounting literature not
included in the Codification became non-authoritative. We began using the new
guidelines and numbering system prescribed by the Codification when referring to
GAAP in the third quarter of fiscal 2009. As the Codification was not intended
to change or alter existing GAAP, it did not have any impact on our consolidated
financial statements.
In May
2009, the FASB adopted Codification Topic 855, “Subsequent Events,” which
codifies the guidance regarding the disclosure of events subsequent to the
balance sheet date. The statement established general standards of
accounting for and disclosure of events that occur after the balance sheet date
but before financial statements are issued or are available to be issued. ASC
855 is effective for interim or annual financial periods ending after June 15,
2009, and shall be applied prospectively. The adoption ASC 855 did not have a
material impact on the Company’s financial statements.
In April 2009, the FASB issued ASC 805
“Business
Combinations,” which amends
ASC 805 by establishing a model to account for certain pre-acquisition
contingencies. Under ASC 805, an acquirer is required to recognize at fair value
an asset acquired or a liability assumed in a business combination that arises
from a contingency if the acquisition-date fair value of that asset or liability
can be determined during the measurement period. If the acquisition-date fair
value cannot be determined, then the acquirer should follow the recognition
criteria in ASC 450, “Contingencies”. In the first quarter of 2009, we adopted
ASC 805 and will apply its provisions when applicable.
In December 2007, the FASB issued ASC
810-10, “Consolidation-Overall” and
ASC 805, “Business
Combinations". Changes for business combination transactions pursuant to
ASC 805 include, among others, expensing of acquisition-related transaction
costs as incurred, the recognition of contingent consideration arrangements at
their acquisition date fair value and capitalization of in-process research and
development assets acquired at their acquisition date fair value. Changes in
accounting for noncontrolling (minority) interests pursuant to ASC 810-10
include, among others, the classification of noncontrolling interest as a
component of consolidated shareholders’ equity and the elimination of "minority
interest" accounting in results of operations. ASC 805 is required to be adopted
and was effective for fiscal years beginning on or after December 15, 2008. The
adoption of ASC 805 will impact the accounting for the Company's future
acquisitions. The adoption of ASC 810-10 did not have a material
impact on our consolidated financial position, results of operations or cash
flows.
In February 2007, the FASB issued ASC
825, “Financial
Instruments,” which permits
the Company to choose to measure many financial instruments and certain other
items at fair value. The Company adopted ASC 825 as of January 1, 2008. The
adoption did not impact the Company’s consolidated financial statements on the
date of adoption. However, during the fourth quarter of 2008, the
Company elected to measure at fair value the put option related to its UBS
Settlement Agreement.
In September 2006, the FASB issued ASC
820, “Fair Value
Measurements and Disclosures”, which defines fair value, establishes a
framework for measuring fair value, and also expands disclosures about fair
value measurements. FASB ASC 820 is effective for periods beginning after
November 15, 2007. The Company adopted this standard with respect to its
financial assets effective January 1, 2008. In February 2008, the FASB
amended certain provisions of ASC 820 delaying its effective date for one year
for all nonfinancial assets and nonfinancial liabilities, except those that are
recognized or disclosed at fair value in the financial statements on a recurring
basis (at least annually). See Footnote 3 of the Notes to the Consolidated
Financial Statements for further detail regarding the impact of our adoption of
ASC 820 for financial assets.
62
New
Accounting Pronouncements
In October 2009, the FASB issued
Accounting Standards Update (“ASU”) No. 2009-13, “Revenue Recognition:
Multiple-Deliverable Revenue Arrangements-a consensus of the FASB Emerging
Issues Task Force”, which
eliminates the use of the residual method for allocating consideration, as well
as the criteria that requires objective and reliable evidence of fair value of
undelivered elements in order to separate the elements in a multiple-element arrangement. By
removing the criterion requiring the use of objective and reliable evidence of
fair value in separately accounting for deliverables, the recognition of revenue
will more closely align with certain revenue arrangements. The standard also
will replace the term "fair value" in the revenue allocation guidance with
"selling price" to clarify that the allocation of revenue is based on
entity-specific assumptions rather than assumptions of a marketplace
participant. ASU No. 2009-13 is effective for revenue arrangements entered
or materially modified in fiscal years beginning on or after June 15, 2010.
The Company is currently assessing the potential impact of this standard to
determine if its adoption will have a material impact on the financial condition
or results of operations of the Company.
In June 2009, the FASB issued new
accounting guidance for variable interest entities. This guidance was codified
under ASU 2009-17 in December 2009 and includes: (1) the elimination of the
exemption from consolidation for qualifying special purpose entities, (2) a new
approach for determining the primary beneficiary of a variable interest entity
(“VIE”), which requires that the primary beneficiary have both (i) the power to
control the most significant activities of the VIE and (ii) either the
obligation to absorb losses or the right to receive benefits that could
potentially be significant to the VIE, and (3) the requirement to continually
reassess who should consolidate a VIE. The new guidance is effective for annual
reporting periods that begin after November 15, 2009 and applies to all existing
and new VIEs. The Company is currently evaluating the impact of adopting this
new guidance. This guidance was codified in December 2009 under ASU
2009-17.
ITEM
7A. Quantitative and Qualitative Disclosures About Market Risk
Market
risk represents the risk of loss that may impact our financial position due to
adverse changes in financial market prices and rates. Our market risk exposure
is primarily a result of fluctuations in interest rates and foreign currency
exchange rates. We do not hold or issue financial instruments for trading
purposes.
Foreign
Currency Exchange Risk
In 2009,
approximately 79.1% of our total revenue was comprised of sales to customers in
the United States. A key component of our business strategy is to expand our
international sales efforts, which will expose us to foreign currency exchange
rate fluctuations. A 10% increase in the value of the U.S. dollar during 2009,
relative to each of our non-U.S. generated sales would have resulted in reduced
annual revenues of less than 2% for the year ended December 31,
2009.
The
financial position and operating results of our foreign operations are
consolidated using the local currency as the functional currency. Local currency
assets and liabilities are translated at the rate of exchange to the U.S. dollar
on the balance sheet date, and the local currency revenue and expenses are
translated at average rates of exchange to the U.S. dollar during the period.
The related translation adjustments to shareholders’ equity were a decrease of
$0.9 million and $3.9 million during 2009 and 2008, respectively, and are
included in other comprehensive income (loss). The foreign currency translation
adjustment is not adjusted for income taxes as it relates to an indefinite
investment in a non-U.S. subsidiary.
Interest
Rate Risk
The
primary objective of our investment activities is to preserve principal while
maximizing income without significantly increasing risk. Some of the securities
in which we invest may be subject to market risk. This means that a change in
prevailing interest rates may cause the principal amount of the investment to
fluctuate. To minimize this risk in the future, we intend to maintain
our portfolio of cash equivalents and short-term investments in a variety of
securities, including commercial paper, money market funds, government and
non-government debt securities and certificates of deposit. Our cash
equivalents, which consist solely of money market funds, are not subject to
market risk because the interest paid on these funds fluctuates with the
prevailing interest rate. We believe that a 10% change in interest rates would
not have had a significant effect on our interest income for the year ended
December 31, 2009.
63
ITEM
8. Financial Statements and Supplementary Data
|
Report
of Independent Registered Public Accounting Firm
|
65
|
|
Consolidated Financial
Statements :
|
|
|
Consolidated
Balance Sheets as of December 31, 2009 and 2008
|
66
|
|
Consolidated
Statements of Operations for the years ended December 31, 2009, 2008 and
2007
|
67
|
|
Consolidated
Statements of Shareholders’ Equity for the years ended December 31, 2009,
2008 and 2007
|
68
|
|
Consolidated
Statements of Cash Flows for the years ended December 31, 2009, 2008 and
2007
|
69
|
|
Notes to Consolidated Financial
Statements
|
70
|
64
Board of
Directors and Shareholders
Kenexa
Corporation
We have
audited the accompanying consolidated balance sheets of Kenexa Corporation and
Subsidiaries (collectively, Kenexa Corporation) (a Pennsylvania corporation) as
of December 31, 2009 and 2008, and the related consolidated
statements of operations, shareholders’ equity, comprehensive income (loss) and
cash flows for each of the three years in the period ended December 31,
2009. These
financial statements are the responsibility of the Kenexa Corporation’s
management. Our
responsibility is to express an opinion on these financial statements based on
our audits.
We
conducted our audits in accordance with the standards of the Public Company
Accounting Oversight Board (United States). Those standards require
that we plan and perform the audit to obtain reasonable assurance about whether
the financial statements are free of material misstatement. An audit includes
examining, on a test basis, evidence supporting the amounts and disclosures in
the financial statements. An audit also includes
assessing the accounting principles used and significant estimates made by
management, as well as evaluating the overall financial statement
presentation. We
believe that our audits provide a reasonable basis for our opinion.
In our
opinion, the consolidated financial statements referred to above present fairly,
in all material respects, the financial position of Kenexa Corporation and
Subsidiaries as of December 31, 2009 and 2008, and the results of their
operations and their cash flows for each of the three years in the period
ended December 31, 2009, in conformity with accounting principles generally
accepted in the United States of America.
We also
have audited, in accordance with the standards of the Public Company Accounting
Oversight Board (United States), Kenexa Corporation’s internal control over
financial reporting as of December 31, 2009, based on criteria established in
Internal Control—Integrated
Framework issued by the Committee of Sponsoring Organizations of the
Treadway Commission (COSO)
and our report dated March 9, 2010 expressed an unqualified
opinion.
/s/ Grant
Thornton LLP
Philadelphia,
PA
March 9,
2010
65
Consolidated
Balance Sheets
(in
thousands, except share data)
|
December 31,
2009
|
December 31,
2008
|
|||||||
|
Assets
|
||||||||
|
Current
Assets
|
||||||||
|
Cash
and cash equivalents
|
$ | 29,221 | $ | 21,742 | ||||
|
Short-term
investments
|
29,570 | 4,512 | ||||||
|
Accounts
receivable, net of allowance for doubtful accounts of $2,090 and
$3,755
|
26,782 | 33,518 | ||||||
|
Unbilled
receivables
|
4,457 | 5,849 | ||||||
|
Income
tax receivable
|
1,704 | 1,238 | ||||||
|
Deferred
income taxes
|
8,685 | 4,615 | ||||||
|
Prepaid
expenses and other current assets
|
8,428 | 3,745 | ||||||
|
Total
Current Assets
|
108,847 | 75,219 | ||||||
|
Long-term
investments
|
— | 16,513 | ||||||
|
Property
and equipment, net of accumulated depreciation
|
19,530 | 20,175 | ||||||
|
Software,
net of accumulated amortization
|
17,337 | 11,025 | ||||||
|
Goodwill
|
3,204 | 32,366 | ||||||
|
Intangible
assets, net of accumulated amortization
|
9,143 | 13,414 | ||||||
|
Deferred
income taxes, non-current
|
34,879 | 39,465 | ||||||
|
Deferred
financing costs, net of accumulated amortization
|
— | 364 | ||||||
|
Other
long-term assets
|
9,403 | 9,924 | ||||||
|
Total
assets
|
$ | 202,343 | $ | 218,465 | ||||
|
Liabilities
and Shareholders’ Equity
|
||||||||
|
Current
liabilities
|
||||||||
|
Accounts
payable
|
$ | 5,727 | $ | 6,448 | ||||
|
Notes
payable, current
|
16 | 40 | ||||||
|
Commissions
payable
|
671 | 559 | ||||||
|
Accrued
compensation and benefits
|
4,820 | 4,010 | ||||||
|
Other
accrued liabilities
|
6,376 | 8,834 | ||||||
|
Deferred
revenue
|
49,964 | 38,638 | ||||||
|
Capital
lease obligations
|
211 | 143 | ||||||
|
Total
current liabilities
|
67,785 | 58,672 | ||||||
|
Capital
lease obligations, less current portion
|
259 | 108 | ||||||
|
Notes
payable, less current portion
|
— | 41 | ||||||
|
Deferred
income taxes
|
850 | 1,789 | ||||||
|
Other
liabilities
|
1,981 | 1,319 | ||||||
|
Total
liabilities
|
70,875 | 61,929 | ||||||
|
Commitments
and Contingencies
|
||||||||
|
Temporary
equity
|
||||||||
|
Noncontrolling
interest
|
1,330 | — | ||||||
|
Shareholders’
Equity
|
||||||||
|
Preferred
stock, par value $0.01; 10,000,000 shares authorized; no shares issued or
outstanding
|
— | — | ||||||
|
Common
stock, par value $0.01; 100,000,000 shares authorized; 22,561,883 and
22,504,924 shares issued and outstanding,
respectively
|
226 | 225 | ||||||
|
Additional
paid-in-capital
|
275,127 | 269,365 | ||||||
|
Accumulated
deficit
|
(141,712 | ) | (110,633 | ) | ||||
|
Accumulated
other comprehensive loss
|
(3,503 | ) | (2,421 | ) | ||||
|
Total
shareholders’ equity
|
130,138 | 156,536 | ||||||
|
Total
liabilities and shareholders’ equity
|
$ | 202,343 | $ | 218,465 | ||||
See notes
to consolidated financial statements.
66
Consolidated
Statements of Operations
(in
thousands, except share and per share data)
|
Year
Ended December 31,
|
||||||||||||
|
2009
|
2008
|
2007
|
||||||||||
|
Revenues:
|
||||||||||||
|
Subscription
|
$ | 133,854 | $ | 163,420 | $ | 148,662 | ||||||
|
Other
|
23,815 | 40,312 | 33,264 | |||||||||
|
Total
revenues
|
157,669 | 203,732 | 181,926 | |||||||||
|
Cost
of revenues
|
53,371 | 61,593 | 50,920 | |||||||||
|
Gross
profit
|
104,298 | 142,139 | 131,006 | |||||||||
|
Operating
expenses:
|
||||||||||||
|
Sales
and marketing
|
35,182 | 40,780 | 35,324 | |||||||||
|
General
and administrative
|
40,801 | 48,884 | 39,332 | |||||||||
|
Research
and development
|
9,757 | 15,555 | 17,737 | |||||||||
|
Depreciation
and amortization
|
14,264 | 12,088 | 7,584 | |||||||||
|
Restructuring
charges
|
— | 1,979 | — | |||||||||
|
Goodwill
impairment charge
|
33,329 | 167,011 | — | |||||||||
|
Total
operating expenses
|
133,333 | 286,297 | 99,977 | |||||||||
|
(Loss)
income from operations
|
(29,035 | ) | (144,158 | ) | 31,029 | |||||||
|
Interest
(expense) income, net
|
(44 | ) | 1,395 | 3,098 | ||||||||
|
Loss
on change in fair market value of ARS and put option, net
|
(12 | ) | — | — | ||||||||
|
(Loss)
income before income taxes
|
(29,091 | ) | (142,763 | ) | 34,127 | |||||||
|
Income
tax (benefit) expense
|
1,927 | (38,071 | ) | 10,579 | ||||||||
|
Net
(loss) income
|
$ | (31,018 | ) | $ | (104,692 | ) | $ | 23,548 | ||||
|
Income
allocated to noncontrolling interests
|
(61 | ) | — | — | ||||||||
|
Net
(loss) income available to common shareholders’
|
$ | (31,079 | ) | $ | (104,692 | ) | $ | 23,548 | ||||
|
Basic
net (loss) income per share
|
$ | (1.38 | ) | $ | (4.60 | ) | $ | 0.94 | ||||
|
Weighted
average shares used to compute net (loss) income available to common
shareholders’ per share – basic
|
22,532,719 | 22,779,694 | 24,926,468 | |||||||||
|
Diluted
net (loss) income per share
|
$ | (1.38 | ) | $ | (4.60 | ) | $ | 0.93 | ||||
|
Weighted
average shares used to compute net (loss) income available to common
shareholders’ per share – diluted
|
22,532,719 | 22,779,694 | 25,327,004 | |||||||||
See notes
to consolidated financial statements.
67
Kenexa
Corporation and Subsidiaries
Consolidated
Statements of Shareholders’ Equity
(in
thousands)
|
Class
A
common
|
Additional
paid-in
|
Accumulated
|
Accumulated
other
comprehensive
|
Total
shareholders’
|
Comprehensive
|
|||||||||||||||||||
|
stock
|
capital
|
(deficit)
|
(loss)
income
|
equity
|
(loss)
income
|
|||||||||||||||||||
|
Balance,
December 31, 2006
|
$ | 209 | $ | 176,345 | $ | (29,489 | ) | $ | 96 | $ | 147,161 | $ | 16,019 | |||||||||||
|
Common
stock repurchase
|
(15 | ) | (25,467 | ) | — | — | (25,482 | ) | — | |||||||||||||||
|
Gain
on currency translation adjustments
|
— | — | — | 1,415 | 1,415 | 1,415 | ||||||||||||||||||
|
Unrealized
loss on short-term investments
|
— | — | — | (104 | ) | (104 | ) | (104 | ) | |||||||||||||||
|
Share-based
compensation expense
|
— | 3,793 | — | — | 3,793 | — | ||||||||||||||||||
|
Excess
tax benefits from share-based payment arrangements
|
— | 1,284 | — | — | 1,284 | — | ||||||||||||||||||
|
Option
exercises
|
2 | 1,558 | — | — | 1,560 | — | ||||||||||||||||||
|
Employee
stock purchase plan
|
— | 251 | — | — | 251 | — | ||||||||||||||||||
|
Public
stock offering, net
|
43 | 130,355 | — | — | 130,398 | — | ||||||||||||||||||
|
Common
Stock Issuance for Gantz Wiley earnout
|
— | 650 | — | — | 650 | — | ||||||||||||||||||
|
Common
Stock Issuance for Straight Source Acquisition
|
1 | 3,173 | — | — | 3,174 | — | ||||||||||||||||||
|
Net
income
|
— | — | 23,548 | — | 23,548 | 23,548 | ||||||||||||||||||
|
Balance,
December 31, 2007
|
$ | 240 | $ | 291,942 | $ | (5,941 | ) | $ | 1,407 | $ | 287,648 | $ | 24,859 | |||||||||||
|
Common
stock repurchase
|
(17 | ) | (30,260 | ) | — | — | (30,277 | ) | — | |||||||||||||||
|
Loss
on currency translation adjustments
|
— | — | — | (3,861 | ) | (3,861 | ) | (3,861 | ) | |||||||||||||||
|
Unrealized
gain on short-term investments
|
— | — | — | 33 | 33 | 33 | ||||||||||||||||||
|
Share-based
compensation expense
|
— | 5,761 | — | — | 5,761 | — | ||||||||||||||||||
|
Excess
tax benefits from share-based payment arrangements
|
— | 169 | — | — | 169 | — | ||||||||||||||||||
|
Option
exercises
|
1 | 366 | — | — | 367 | — | ||||||||||||||||||
|
Employee
stock purchase plan
|
— | 338 | — | — | 338 | — | ||||||||||||||||||
|
Common
Stock Issuance for Straight Source earnout
|
1 | 1,049 | — | — | 1,050 | — | ||||||||||||||||||
|
Net
loss
|
— | — | (104,692 | ) | — | (104,692 | ) | (104,692 | ) | |||||||||||||||
|
Balance,
December 31, 2008
|
$ | 225 | $ | 269,365 | $ | (110,633 | ) | $ | (2,421 | ) | $ | 156,536 | $ | (108,520 | ) | |||||||||
|
Loss
on currency translation adjustments
|
— | — | — | (925 | ) | (925 | ) | (925 | ) | |||||||||||||||
|
Unrealized
gain on short-term investments
|
— | — | — | (157 | ) | (157 | ) | (157 | ) | |||||||||||||||
|
Share-based
compensation expense
|
— | 5,364 | — | — | 5,364 | — | ||||||||||||||||||
|
Option
exercises
|
— | 70 | — | — | 70 | — | ||||||||||||||||||
|
Employee
stock purchase plan
|
1 | 328 | — | — | 329 | — | ||||||||||||||||||
|
Income
allocated to noncontrolling interest
|
— | — | (61 | ) | — | (61 | ) | (61 | ) | |||||||||||||||
|
Net
loss available to common shareholders
|
— | — | (31,018 | ) | — | (31,018 | ) | (31,018 | ) | |||||||||||||||
|
Balance,
December 31, 2009
|
$ | 226 | $ | 275,127 | $ | (141,712 | ) | $ | (3,503 | ) | $ | 130,138 | $ | (32,161 | ) | |||||||||
See notes
to consolidated financial statements.
68
Consolidated
Statements of Cash Flows
(in
thousands)
|
Year
ended December 31,
|
||||||||||||
|
2009
|
2008
|
2007
|
||||||||||
|
Cash
flows from operating activities
|
||||||||||||
|
Net
(loss) income
|
$ | (31,018 | ) | $ | (104,692 | ) | $ | 23,548 | ||||
|
Adjustments
to reconcile net (loss) income to net cash provided by operating
activities
|
||||||||||||
|
Depreciation
and amortization
|
14,264 | 12,088 | 7,584 | |||||||||
|
Loss
on change in fair market value of ARS and put option, net
|
12 | — | — | |||||||||
|
Non-cash
interest expense
|
— | — | 22 | |||||||||
|
Goodwill
impairment charge
|
33,329 | 167,011 | — | |||||||||
|
Share-based
compensation expense
|
5,364 | 5,761 | 3,793 | |||||||||
|
Excess
tax benefits from share-based payment arrangements
|
— | (169 | ) | (1,284 | ) | |||||||
|
Amortization
of deferred financing costs
|
364 | 299 | 734 | |||||||||
|
Bad
debt (recoveries) expense
|
(400 | ) | 2,702 | 329 | ||||||||
|
Deferred
income (benefit) taxes
|
(423 | ) | (46,509 | ) | 4,752 | |||||||
|
Changes
in assets and liabilities
|
||||||||||||
|
Accounts
and unbilled receivables
|
7,845 | 294 | 307 | |||||||||
|
Prepaid
expenses and other current assets
|
(3,454 | ) | (243 | ) | 389 | |||||||
|
Income
tax receivable
|
(467 | ) | (1,238 | ) | (2,008 | ) | ||||||
|
Other
long-term assets
|
(1,536 | ) | (3,075 | ) | (1,042 | ) | ||||||
|
Accounts
Payable
|
(815 | ) | 286 | (708 | ) | |||||||
|
Accrued
compensation and other accrued liabilities
|
480 | (5,080 | ) | (855 | ) | |||||||
|
Commissions
payable
|
112 | (466 | ) | (649 | ) | |||||||
|
Deferred
revenue
|
11,215 | 4,242 | 3,698 | |||||||||
|
Other
liabilities
|
648 | 1,256 | (47 | ) | ||||||||
|
Net
cash provided by operating activities
|
35,520 | 32,465 | 38,563 | |||||||||
|
Cash
flows from investing activities
|
||||||||||||
|
Capitalized
software and purchases of property and equipment
|
(15,349 | ) | (20,783 | ) | (12,701 | ) | ||||||
|
Purchase
of available-for-sale securities
|
(14,884 | ) | (20,495 | ) | (133,746 | ) | ||||||
|
Sales
of available-for-sale securities
|
3,715 | 55,706 | 75,220 | |||||||||
|
Sale
of trading securities
|
3,275 | — | — | |||||||||
|
Acquisitions
and variable interest entity, net of cash acquired
|
(4,971 | ) | (34,174 | ) | (29,959 | ) | ||||||
|
Net
cash released from escrow for acquisitions
|
— | 1,628 | 14,890 | |||||||||
|
Net
cash used in investing activities
|
(28,214 | ) | (18,118 | ) | (86,296 | ) | ||||||
|
Cash
flows from financing activities
|
||||||||||||
|
Repayments
under line of credit and term loan
|
— | — | (65,000 | ) | ||||||||
|
Repayments
of notes payable
|
(73 | ) | (40 | ) | (363 | ) | ||||||
|
Collections
of notes receivable
|
— | — | — | |||||||||
|
Proceeds
from common stock issued through Employee Stock Purchase
Plan
|
329 | 338 | 251 | |||||||||
|
Purchase
of additional interest in variable interest entity
|
(206 | ) | — | — | ||||||||
|
Repurchase
of common stock
|
— | (30,277 | ) | (25,482 | ) | |||||||
|
Excess
tax benefits from share-based payment arrangements
|
— | 169 | 1,284 | |||||||||
|
Net
proceeds from public offering
|
— | — | 130,398 | |||||||||
|
Deferred
financing costs
|
— | — | (102 | ) | ||||||||
|
Net
proceeds from option exercises
|
70 | 367 | 1,560 | |||||||||
|
Repayment
of capital lease obligations
|
(290 | ) | (232 | ) | (222 | ) | ||||||
|
Net
cash (used in) provided by financing activities
|
(170 | ) | (29,675 | ) | 42,324 | |||||||
|
Effect
of exchange rate changes on cash and cash equivalents
|
343 | (962 | ) | 939 | ||||||||
|
Net
increase (decrease) in cash and cash equivalents
|
7,479 | (16,290 | ) | (4,470 | ) | |||||||
|
Cash
and cash equivalents at beginning of year
|
21,742 | 38,032 | 42,502 | |||||||||
|
Cash
and cash equivalents at end of year
|
$ | 29,221 | $ | 21,742 | $ | 38,032 | ||||||
|
Year
ended December 31,
|
||||||||||||
|
2009
|
2008
|
2007
|
||||||||||
|
Supplemental
disclosures of cash flow information
|
||||||||||||
|
Cash
paid during the period for:
|
||||||||||||
|
Interest
expense
|
$ | 191 | $ | 200 | $ | 821 | ||||||
|
Income
taxes
|
$ | 5,395 | $ | 5,089 | $ | 6,564 | ||||||
|
Non-cash
investing and financing activities
|
||||||||||||
|
Capital
lease obligations incurred
|
$ | 513 | $ | 260 | $ | 91 | ||||||
|
Common
stock consideration for Gantz Wiley earnout
|
$ | — | $ | — | $ | 650 | ||||||
|
Common
stock consideration for StraightSource acquisition
|
$ | — | $ | 1,050 | $ | 3,174 | ||||||
See notes
to consolidated financial statements.
69
Kenexa
Corporation and Subsidiaries
(All
amounts in thousands, except share and per share data, unless noted
otherwise)
Kenexa
Corporation, and its subsidiaries (collectively the "Company" or “Kenexa”),
commenced operations in 1987 as a provider of recruiting services to a wide
variety of industries. In 1993, the Company offered its first
automated talent management system. Between 1994 to 2009 the Company
acquired 28 businesses that enabled it to offer comprehensive human capital
management, or HCM, services integrated with web-based
technology. The Company’s business solutions include a comprehensive
suite of on-demand software applications and complementary services, including
outsourcing services and consulting, to help global organizations recruit high
performing individuals and to foster optimal work environments to increase
employee productivity and retention.
The
Company began its operations in 1987 under its predecessor companies, Insurance
Services, Inc., or ISI, and International Holding Company, Inc., or
IHC. In December 1999, the Company reorganized its corporate structure by
merging ISI and IHC with and into Raymond Karsan Associates, Inc., or RKA,
a Pennsylvania corporation and a wholly owned subsidiary of Raymond Karsan
Holdings, Inc., or RKH, a Pennsylvania corporation. Each of RKA and RKH
were newly created to consolidate the businesses of ISI and IHC. In
April 2000, the Company changed its name to TalentPoint, Inc. and
changed the name of RKA to TalentPoint Technologies, Inc. In
November 2000, the Company changed its name to Kenexa Corporation, and
changed the name of TalentPoint Technologies, Inc. to Kenexa
Technology, Inc., or Kenexa Technology. Currently, Kenexa transacts
business primarily through Kenexa Technology. While the Company has several
product lines, our chief decision makers determine resource allocation decisions
and assess and evaluate periodic performance under one operating
segment.
2.
Summary of Significant Accounting Policies
In June
2009, the FASB issued ASU 2009-01, “Amendments based on Statement of
Financial Accounting Standards No. 168 - The FASB Accounting Standards
Codification™ and the
Hierarchy of Generally Accepted Accounting Principles”, to codify in ASC
105, “Generally Accepted
Accounting Principles”, FASB Statement 168, “The FASB Accounting Standards
Codification™ and the
Hierarchy of Generally Accepted Accounting Principles”, which was issued
to establish the Codification as the sole source of authoritative U.S. GAAP
recognized by the FASB, excluding SEC guidance, to be applied by nongovernmental
entities. The guidance in ASC 105 is effective for financial statements issued
for interim and annual periods ending after September 15, 2009. The Company
has revised its references to pre-Codification GAAP and noted no impact on the
financial condition or results of operations of the Company.
Principles
of Consolidation
The
consolidated financial statements of the Company include the accounts of Kenexa
Corporation and its subsidiaries and Variable interest entity described in note
number five. All significant intercompany accounts and transactions
have been eliminated in consolidation.
Use
of Estimates
The
preparation of financial statements in conformity with accounting principles
generally accepted in the United States of America requires management to make
estimates and assumptions that affect the reported amounts of assets and
liabilities, disclosure of contingent assets and liabilities at the date of the
financial statements and the reported amounts of revenues and expenses during
the reporting period. Actual results could differ from those estimates, and such
differences may be material to the Company’s consolidated financial
statements.
70
Kenexa
Corporation and Subsidiaries
Notes
to Consolidated Financial Statements (Continued)
(All
amounts in thousands, except share and per share data, unless noted
otherwise)
2.
Summary of Significant Accounting Policies (continued)
Reclassifications
Certain
reclassifications have been made to the prior period consolidated financial
statements to conform to the current period
presentation. Reclassifications to the December 31, 2008 consolidated
balance sheet include a transfer of $7,185 relating to software in development
from property and equipment to software and a transfer of $1,256 of tax
liabilities from other accrued liabilities to other liabilities.
Fair
Value of Financial Instruments
The
carrying amounts of the Company’s financial assets and liabilities, including
cash and cash equivalents, accounts receivable, short-term investments,
put option and accounts payable at December 31, 2009 and 2008 approximate
fair value of these instruments.
Concentration
of Credit Risk
Financial
instruments which potentially expose the Company to concentration of credit risk
consist primarily of accounts receivable and the UBS Settlement Agreement.
Credit risk arising from receivables is mitigated due to the large number of
customers comprising the Company's customer base and their dispersion across
various industries. The Company does not require
collateral. The customers are concentrated primarily in the Company's
U.S. market area. At December 31, 2009 and 2008, there were no
customers that represented more than 10% of the net accounts receivable balance.
In addition, there were no customers that individually exceeded 10% of the
Company's revenues for the years ended December 31, 2009 and 2008.
As
discussed in Note 3, the Company has the right to sell its auction rate
securities back to UBS AG. The ability of the Company to sell those
securities is dependent on the liquidity of UBS at the time of the
sale.
Cash
and Cash Equivalents
Cash and
cash equivalents consist of highly liquid investments with remaining maturities
of three months or less at the time of purchase. Cash which is
restricted for lease deposits is included in other assets. Cash
balances are maintained at several banks. Accounts located in the United States
are insured by the Federal Deposit Insurance Corporation ("FDIC") up to $100
(which has been temporarily increased to $250 through December 31, 2013).
Certain operating cash accounts may periodically exceed the FDIC
limits.
Cash and
cash equivalents in foreign denominated currencies which are held in foreign
banks totaled $7,994 and $6,935 and represented 27.4% and 31.9% of our total
cash and cash equivalents balance at December 31, 2009 and 2008,
respectively.
Foreign
Currency Translation
The
financial position and operating results of the Company’s foreign operations are
consolidated using the local currency as the functional currency. Local currency
assets and liabilities are translated at the rate of exchange to the U.S. dollar
on the balance sheet date, and the local currency revenues and expenses are
translated at average rates of exchange to the U.S. dollar during the period.
The operations of the variable interest entity in China are translated from
Chinese renminbis, which is fixed at approximately 6.8 renminbis to one U.S.
dollar. The related translation adjustments are reported in the shareholders’
equity section of the balance sheet and resulted in a net reduction in
shareholders’ equity of $925 and $3,861 for the years ended December 31, 2009
and 2008, respectively. The foreign currency translation adjustment
is not adjusted for income taxes as it relates to an indefinite investment in a
non-U.S. subsidiary.
71
Kenexa
Corporation and Subsidiaries
Notes
to Consolidated Financial Statements (Continued)
(All
amounts in thousands, except share and per share data, unless noted
otherwise)
2.
Summary of Significant Accounting Policies (continued)
Comprehensive
(Loss) Income
Comprehensive
(loss) income consists of losses or gains on foreign currency translations and
unrealized losses and gains on available-for-sale investment securities and
noncontrolling interest income in addition to reported net income or
loss.
Investments
Investments
at December 31, 2009 and 2008 include floating rate letter of credit backed
securities, municipal bonds and auction rate securities. The
maturities of these securities may range from 1 day to approximately 1 year and
are rated A, AA to AAA by various rating agencies. Certain
investments are recorded at fair value based on current market rates and are
classified as available-for-sale. Changes in the fair value are
included in accumulated other comprehensive (loss) income in the accompanying
consolidated financial statements. Other investments, which include
auction rate securities are recorded at fair value using a discounted cash flow
model and are classified as trading securities. Changes in the fair
value are included in the statement of operations in the accompanying
consolidated financial statements. Both the cost and realized gains
and losses of these securities are calculated using the specific identification
method.
Investment
income
Investment
income includes changes in the fair value of auction rate securities and put
option related to the UBS Settlement Agreement. See Footnote 3 of the
Notes to the Consolidated Financial Statements for further details.
Prepaid
Expenses and Other Assets
Prepaid
expenses and other current assets as of December 31, 2009 and 2008 are as
follows:
|
Year
ended December 31,
|
||||||||
|
2009
|
2008
|
|||||||
|
Prepaid
expenses
|
$ | 4,845 | $ | 2,918 | ||||
|
Deferred
implementation costs (1)
|
2,096 | 730 | ||||||
|
UBS
Settlement Agreement
|
1,374 | — | ||||||
|
Other
current assets
|
113 | 97 | ||||||
|
Total
prepaid expense and other current assets
|
$ | 8,428 | $ | 3,745 | ||||
|
|
(1)
|
Deferred
implementation costs represent internal payroll and other costs incurred
in connection with the customization of the sites associated with our
internet hosting arrangements. These costs are deferred over the
implementation period which precedes the hosting period, typically three
to four months, and are expensed ratably over the same period as revenue
recognition, when the hosting period commences, typically four to five
years.
|
72
Kenexa
Corporation and Subsidiaries
Notes
to Consolidated Financial Statements (Continued)
(All
amounts in thousands, except share and per share data, unless noted
otherwise)
2.
Summary of Significant Accounting Policies (continued)
Other
long-term assets
Other
long-term assets as of December 31, 2009 and 2008 are as follows:
|
Year
ended December 31,
|
||||||||
|
2009
|
2008
|
|||||||
|
Acquisition
related escrow balances (1)
|
$ | 1,397 | $ | 1,440 | ||||
|
Security
deposits
|
1,529 | 1,966 | ||||||
|
Deferred
implementation costs
|
6,263 | 3,314 | ||||||
|
UBS
Settlement Agreement
|
— | 2,219 | ||||||
|
Other
long-term assets
|
214 | 985 | ||||||
|
Total
other long-term assets
|
$ | 9,403 | $ | 9,924 | ||||
|
(1)
|
Upon
completion of the escrow term and settlement of any outstanding claims,
all remaining escrow balances are reclassified to additional purchase
price consideration for the respective
acquisition.
|
Self-Insurance
The
Company is self-insured for the majority of its health insurance costs,
including claims filed and claims incurred but not reported subject to certain
stop loss provisions. The Company estimated the liability based upon
management's judgment and historical experience. At December 31, 2009 and
2008, self-insurance accruals totaled $556 and $560,
respectively. Management continuously reviews the adequacy of the
Company's stop loss insurance coverage. Material differences may result in the
amount and timing of health insurance expense if actual experience differs
significantly from management's estimates.
401(k)
Plan
The
Company sponsors a 401(k) defined contribution plan which is available for
participation to all eligible employees. Company contributions to the plan are
subject to the board of director's election to make a contribution each
year. Company contributions, if elected by the board of directors,
are allocated to the participants' accounts based upon the percentage of each
participant's contributions to the plan during the given year to the total of
all participant contributions. For the years ended December 31, 2009 and 2007,
the Company's board of directors elected to make a matching contribution of $298
and $655 or 10% and 20% of employee contributions, respectively. For
the year ended December 31, 2008, a matching contribution was not
elected.
73
Kenexa
Corporation and Subsidiaries
Notes
to Consolidated Financial Statements (Continued)
(All
amounts in thousands, except share and per share data, unless noted
otherwise)
2.
Summary of Significant Accounting Policies (continued)
Property
and Equipment
Property
and equipment are stated at cost. Equipment under capital lease is
stated at the lower of the fair market value at the date of acquisition or net
present value of the minimum lease payments at inception of the lease.
Depreciation and amortization expense are recognized on a straight-line basis
over the assets' estimated useful lives or, if shorter, the lease terms for
leasehold improvements. Estimated useful lives are generally 7 years for
office furniture, and 3 to 5 years for computer equipment and software.
Reviews are regularly performed if facts and circumstances exist that indicate
that the carrying amount of assets may not be recoverable or that the useful
life is shorter than originally estimated. Costs of maintenance and
repairs are charged to expense as incurred. When property and equipment or
leasehold improvements are sold or otherwise disposed of, the fixed asset
account and related accumulated depreciation account are relieved and any gain
or loss is included in results of operations. Costs of software not yet placed
into service are accumulated as software in development. Upon placement into
service, the costs of the assets are transferred to
software. Construction costs not yet placed into service are
accumulated as building construction in progress. Upon placement into service,
the costs of the assets are transferred to building. In January 2008,
the building was placed into service and, accordingly, all costs of the building
have been transferred out of construction in progress. The building
is being depreciated over 30 years.
In
accordance with FASB ASC 605, “Revenue Recognition-Multiple Element
Arrangements”, the Company applies FASB ASC 350, “Intangibles-Goodwill and Other,
Internal-Use Software”. The costs incurred in the preliminary
stages of development are expensed as incurred. Once an application has reached
the development stage, internal and external costs, if direct and incremental,
are capitalized until the software is substantially complete and ready for its
intended use. Capitalization ceases upon completion of all substantial testing.
The Company also capitalizes costs related to specific upgrades and enhancements
when it is probable the expenditures will result in additional
functionality. Maintenance and training costs are expensed as
incurred. Internal use software is amortized on a straight-line basis over its
estimated useful life, generally three years. Management evaluates
the useful lives of these assets on an annual basis and tests for impairments
whenever events or changes in circumstances occur that could impact the
recoverability of these assets. There were no impairments to internal software
in any of the periods covered in these consolidated financial
statements.
The
Company capitalized internal-use software costs for the years ended
December 31, 2009, 2008 and 2007 of $9,665, $8,137 and $3,321,
respectively. Amortization of capitalized internal-use software costs for the
years ended December 31, 2009, 2008 and 2007 was $3,623, $1,629 and $1,163,
respectively.
74
Kenexa
Corporation and Subsidiaries
Notes
to Consolidated Financial Statements (Continued)
(All
amounts in thousands, except share and per share data, unless noted
otherwise)
2.
Summary of Significant Accounting Policies (continued)
Goodwill
Since
2002, the Company has recorded goodwill in accordance with the provisions of
FASB ASC, 350, “Intangibles-Goodwill and
Other”, which discontinued the amortization of existing goodwill and
instead requires the Company to annually review the carrying value of goodwill
for impairment. Prior to 2007, the Company evaluated the carrying value of its
goodwill under two reporting units within its single segment. During
2007, the Company combined those two reporting units into a single reporting
unit to be in alignment with its organizational and management structure which
was evaluated and restructured as part of the integration of our acquired
businesses. As a result, in 2007 and 2008 goodwill was evaluated at
the enterprise or Company level. Following its investment in the
variable interest entity in China in 2009, the Company reverted back to
evaluating the carrying value of goodwill under two reporting units within a
single segment. The Company conducted its 2009 annual evaluation of
goodwill for impairment and determined that there was no impairment at
October 1, 2009 and December 31, 2009.
Due to a
downward revision in internal projections, continued adverse changes in the
economic climate, a decline in the Company’s market capitalization of 49.5% from
October 1, 2008 (the Company’s annual testing date) through December 31, 2008
and an additional 32.5% from December 31, 2008 through March 31,
2009. These events signified triggering events and required the
determination as to whether, and to what extent, the Company’s goodwill may have
been impaired. As a result, the Company completed in consecutive
quarters its goodwill impairment analyses during the year ended December 31,
2008 and the quarter ended March 31, 2009.
The first
step of each analysis required the estimation of fair value of the Company and
was calculated primarily based on the observable market capitalization with a
range of estimated control premiums as well as discounted future estimated cash
flows. This step yielded an estimated fair value of the Company which was less
than the Company’s carrying value (including goodwill) at each test date,
December 31, 2008 and March 31, 2009. The next step entailed performing an
analysis to determine whether the carrying amount of goodwill on the Company’s
balance sheet exceeded its implied fair value. The implied fair value of the
Company’s goodwill for this step was determined in a similar manner as goodwill
recognized in a business combination. That is, the estimated fair value of the
Company was allocated to its assets and liabilities, including any unrecognized
identifiable intangible assets, as if the Company had been acquired in a
hypothetical business combination with the estimated fair value of the Company
representing the price paid to acquire it. The allocation process performed on
each test date was only for purposes of determining the implied fair value of
goodwill with no assets or liabilities written up or down, nor any additional
unrecognized identifiable intangible assets recorded as part of this process.
Based on these analyses, management recorded goodwill impairment charges of
$167,011 for the quarter and year ended December 31, 2008 and $33,329 for the
quarter ended March 31, 2009. The goodwill impairment charges had no effect on
the Company’s cash balances.
75
Kenexa
Corporation and Subsidiaries
Notes
to Consolidated Financial Statements (Continued)
(All
amounts in thousands, except share and per share data, unless noted
otherwise)
The
changes in the carrying amount of goodwill, which include adjustments for
earnouts, taxes, escrow adjustments, acquisitions, variable interest entity and
impairment charges, for the years ended December 31, 2009, 2008 and 2007 are as
follows:
|
Balance
as of December 31, 2006
|
$ | 143,371 | ||
|
Acquisitions
or adjustments:
|
||||
|
Webhire
|
7,942 | |||
|
Knowledge
Workers
|
(796 | ) | ||
|
Gantz
Wiley Research
|
(81 | ) | ||
|
BrassRing
|
13,059 | |||
|
Psychometrics
Services Ltd.
|
516 | |||
|
StraightSource
(2007 acquisition)
|
5,700 | |||
|
HRC
Human Resources Consulting GmbH (2007 acquisition)
|
3,791 | |||
|
Balance
as of December 31, 2007
|
$ | 173,502 | ||
|
Acquisitions
or adjustments:
|
||||
|
ScottWorks
|
85 | |||
|
Webhire
|
311 | |||
|
Knowledge
Workers
|
100 | |||
|
Gantz
Wiley Research
|
398 | |||
|
BrassRing
|
(121 | ) | ||
|
Psychometrics
Services Ltd.
|
3,383 | |||
|
StraightSource
|
6,051 | |||
|
HRC
Human Resources Consulting GmbH
|
330 | |||
|
Quorum
International Holding Limited (2008 acquisition)
|
15,338 | |||
|
Impairment
charge
|
(167,011 | ) | ||
|
Balance
as of December 31, 2008
|
$ | 32,366 | ||
|
Acquisitions
or adjustments:
|
||||
|
Impairment
charge
|
(33,329 | ) | ||
|
StraightSource
|
125 | |||
|
HRC
Human Resources Consulting GmbH
|
215 | |||
|
Quorum
International Holding Limited
|
2,315 | |||
|
Shanghai
Runjie Management Consulting Company (variable interest
entity)
|
1,512 | |||
|
Balance
as of December 31, 2009
|
$ | 3,204 |
Long
Lived Assets
In
connection with the Company’s goodwill impairment analysis for each of the
periods ended December 31, 2009 and 2008, the Company evaluated its long-lived
assets, including certain identifiable intangible assets, for potential
impairment by comparing the carrying amount of any asset to future net cash
flows expected to be generated by the asset, pursuant to FASB ASC 360-10-35,
“Impairment or Disposal of
Long-Lived Assets,” and determined that no such assets were
impaired. Given the general current economic climate, it is possible
that the estimated future cash flows of the asset groupings will be reduced,
which may result in an impairment in future periods. If such assets
are considered to be impaired, the impairment is measured by the amount by which
the carrying amount of the assets exceeds the fair value of the
assets.
76
Kenexa
Corporation and Subsidiaries
Notes
to Consolidated Financial Statements (Continued)
(All
amounts in thousands, except share and per share data, unless noted
otherwise)
2.
Summary of Significant Accounting Policies (continued)
Intangible
Assets
Intangible
assets consist of intellectual property, non-compete agreements, customer lists
and trademarks. Intellectual property, non-compete agreements and
trademarks are amortized on a straight-line basis over their estimated useful
lives or contract periods, generally ranging from 3 to 20 years. Customer lists
are amortized based on the attrition rate of our customers. The amounts were
based, in part, on an analysis of the incremental cash flows expected to be
derived from the customer lists using historic retention rates and an
appropriate discount rate. Accumulated amortization of intangible assets was
$13,713, $9,443 and $4,091 as of December 31, 2009, 2008 and 2007, respectively.
Amortization expense related to these intangible assets was $4,475, $5,168 and
$2,412 for 2009, 2008 and 2007, respectively.
Intangible
Assets subject to amortization at December 31, 2009 and 2008 consist of the
following:
|
Gross Carrying Value
|
Accumulated Amortization
|
Weighted
Average
Amortization
Period
(in years)
|
||||||||||||||||||
|
2009
|
2008
|
2009
|
2008
|
|||||||||||||||||
|
Description
|
||||||||||||||||||||
|
Customer
lists
|
$ | 18,700 | $ | 18,911 | $ | 10,067 | $ | 6,500 | 5.8 | |||||||||||
|
Intellectual
property and non-compete
|
2,413 | 2,204 | 1,957 | 1,264 | 0.2 | |||||||||||||||
|
Trademarks
|
91 | 91 | 37 | 27 | 11.9 | |||||||||||||||
|
Fully
amortized intangibles
|
1,652 | 1,652 | 1,652 | 1,652 | ||||||||||||||||
|
Total
|
$ | 22,856 | $ | 22,858 | $ | 13,713 | $ | 9,443 | 6.1 | |||||||||||
Intangible
Assets estimated amortization expense for each of the next five years is as
follows:
|
Year
Ending December 31,
|
Amortization Expense
|
|||
|
2010
|
$ | 2,897 | ||
|
2011
|
1,988 | |||
|
2012
|
1,322 | |||
|
2013
|
963 | |||
|
2014
|
671 | |||
Guarantees
The
Company’s software license agreements typically provide for indemnifications of
customers for intellectual property infringement claims. The Company
also warrants to customers, when requested, that the Company’s software products
operate substantially in accordance with standard specifications for a limited
period of time. The Company has not incurred significant obligations
under customer indemnification or warranty provisions historically, and does not
expect to incur significant obligations in the future. Accordingly,
the Company does not maintain accruals for potential customer indemnification or
warranty-related obligations.
77
Kenexa
Corporation and Subsidiaries
Notes
to Consolidated Financial Statements (Continued)
(All
amounts in thousands, except share and per share data, unless noted
otherwise)
2.
Summary of Significant Accounting Policies (continued)
Revenue
Recognition
The
Company derives its revenue from two sources: (1) subscription revenue for
solutions, which is comprised of subscription fees from customers accessing the
Company’s on-demand software, consulting services, outsourcing services and
proprietary content, and from customers purchasing additional support beyond the
standard support that is included in the basic subscription fee; and
(2) other fees for discrete professional services. Because the Company
provides its solutions as a service, the Company follows the provisions of FASB
ASC 605-10, “Revenue
Recognition” and FASB ASC 605-25 “Multiple Elements Arrangements”.
We recognize revenue when all of the following conditions are
met:
|
•
|
There
is persuasive evidence of an arrangement;
|
|
|
•
|
The
service has been provided to the customer;
|
|
|
•
|
The
collection of the fees is probable; and
|
|
|
•
|
The
amount of fees to be paid by the customer is fixed or
determinable.
|
Subscription
fees and support revenues are recognized on a monthly basis over the lives of
the contracts. Amounts that have been invoiced are recorded in accounts
receivable and in deferred revenue or revenue, depending on whether the revenue
recognition criteria have been met.
Discrete
professional services and other revenues, when sold with subscription and
support offerings, are accounted for separately since these services have value
to the customer on a stand-alone basis and there is objective and reliable
evidence of fair value of the undelivered elements. The Company's arrangements
do not contain general rights of return. Additionally, when
professional services are sold with other elements, the consideration from the
revenue arrangement is allocated among the separate elements based upon the
relative fair value. Professional services and other revenues are
recorded as follows: Consulting revenues are recognized based upon proportional
performance as value is delivered to the customer.
In
determining whether revenues from professional services can be accounted for
separately from subscription revenue, the Company considers the following
factors for each agreement: availability from other vendors, whether objective
and reliable evidence of fair value exists of the undelivered elements, the
nature and the timing of when the agreement was signed in comparison to the
subscription agreement start date and the contractual dependence of the
subscription service on the customer's satisfaction with the other services. If
the professional service does not qualify for separate accounting, the Company
recognizes the revenue ratably over the remaining term of the subscription
contract. In these situations the Company defers the direct and incremental
costs of the professional service over the same period as the revenue is
recognized.
Deferred
revenue represents payments received or accounts receivable from the Company's
customers for amounts billed in advance of subscription services being
provided.
The
Company records expenses billed to customers in accordance with FASB ASC
605-45, “Revenue
Recognition-Principal Agent Considerations,” which requires that
reimbursements received for out-of-pocket expenses be classified as revenues and
not as cost reductions. These items primarily include travel, meals
and certain telecommunication costs. For the years ended December 31, 2009, 2008
and 2007 reimbursed expenses totaled $2,218, $4,700 and $3,469,
respectively.
78
Kenexa
Corporation and Subsidiaries
Notes
to Consolidated Financial Statements (Continued)
(All
amounts in thousands, except share and per share data, unless noted
otherwise)
2.
Summary of Significant Accounting Policies (continued)
Allowance
for Doubtful Accounts
The
Company records an allowance for doubtful accounts based on specifically
identified amounts that management believes to be uncollectible. The Company
also records an additional allowance based on certain percentages of aged
receivables, which is determined based on historical experience and management's
assessment of the general financial conditions affecting the Company's customer
base. If actual collections experience changes, revisions to the allowance may
be required. Activity in the allowance for doubtful accounts is as
follows:
|
Year
|
Balance at
January 1,
|
Bad debt expense
(recoveries)
|
Acquired
reserves
|
Recoveries /
(Write offs)
|
Balance at
December 31,
|
|||||||||||||||
|
2009
|
$ | 3,755 | $ | (400 | ) | $ | — | $ | (1,265 | ) | $ | 2,090 | ||||||||
|
2008
|
1,158 | 2,702 | — | (105 | ) | 3,755 | ||||||||||||||
|
2007
|
975 | 329 | — | (146 | ) | 1,158 | ||||||||||||||
Share-based
Compensation Expense
On
January 1, 2006, the Company adopted FASB ASC 718, “Compensation-Stock Compensation
using the Modified Prospective Approach” (“MPA”). The MPA requires that
compensation expense be recorded for restricted stock and all unvested stock
options as of January 1, 2006. Following the adoption, the
Company recognized the cost of previously granted share-based awards on a
straight-line basis over the remaining vesting period. The
compensation expense for new share-based awards with a service condition that
cliff vest, is recognized on a straight-line basis over the award’s requisite
service period. For those awards with a service condition that have
graded vesting, compensation expense is calculated using the graded-vesting
attribution method. This method entails recognizing expense on
a straight-line basis over the requisite service period for each separately
vesting portion as if the grant consisted of multiple awards, each with the same
service inception date but different requisite service periods. This
method accelerates the recognition of compensation expense. In
accordance with FASB ASC 718, the pool of excess tax benefits available to
absorb tax deficiencies was determined using the alternative transition
method.
The fair
value of market based, performance vesting share awards granted is calculated
using a Monte Carlo valuation model that results
in a factor applied to the fair market value of the Company's common stock on
the date of the grant (measurement date), and is recognized over a four year
explicit service period using the straight-line method. Since the
award requires both the completion of four years of service and the share price
reaching predetermined levels as defined in the option agreement, compensation
cost will be recognized over the four year explicit service
period. If the employee terminates prior to the four-year requisite
service period, compensation cost will be reversed even if the market condition
has been satisfied by that time.
Advertising
Advertising
costs are expensed when incurred. Advertising costs for the years ended
December 31, 2009, 2008 and 2007 were $373, $670 and $554,
respectively.
79
Kenexa
Corporation and Subsidiaries
Notes
to Consolidated Financial Statements (Continued)
(All
amounts in thousands, except share and per share data, unless noted
otherwise)
2.
Summary of Significant Accounting Policies (continued)
Income
Taxes
The
Company files a consolidated income tax return with its subsidiaries for federal
tax purposes and on various bases depending on applicable taxing statutes for
state and local as well as foreign tax purposes. Deferred income
taxes are provided using the asset and liability method for temporary
differences between the financial statement and tax bases of assets and
liabilities using enacted tax rates in effect for the year in which the
differences are expected to reverse. Valuation allowances are established when
necessary to reduce deferred tax assets to the amounts which are more likely
than not expected to be realized.
Other
Taxes
Non-income
taxes such as sales and value-added tax are presented on a net basis within
general and administrative expense, on the statement of operations.
(Loss)
Earnings Per Share
The
Company follows FASB ASC 260, “Earnings Per Share,” which
requires companies that are publicly held or have complex capital structures to
present basic and diluted earnings per share on the face of the statement of
operations. Earnings (loss) per share is based on the weighted
average number of shares and common stock equivalents outstanding during the
period. In the calculation of diluted earnings per share, shares
outstanding are adjusted to assume conversion of the exercise of options if they
are dilutive. In the calculation of basic earnings per share,
weighted average numbers of shares outstanding are used as the
denominator. Common stock equivalents of stock options issued and
outstanding were excluded in the computation of diluted earnings per share for
the years ended December 31, 2009 and 2008 since their effect was
antidilutive. A summary of the computation is presented in the table
below.
Basic and
diluted earnings (loss) per share are computed as follows:
|
For
the year ended December 31,
|
||||||||||||
|
2009
|
2008
|
2007
|
||||||||||
|
Numerator:
|
||||||||||||
|
Net
(loss) income available to common shareholders’
|
$ | (31,079 | ) | $ | (104,692 | ) | $ | 23,548 | ||||
|
Denominator:
|
||||||||||||
|
Weighted
average shares used to compute net (loss) income available to common
shareholders’ per common share - basic
|
22,532,719 | 22,779,694 | 24,926,468 | |||||||||
|
Effect
of dilutive stock options
|
— | — | 400,536 | |||||||||
|
Weighted
average shares used to compute net (loss) income available to common
shareholders’ per common share – dilutive
|
22,532,719 | 22,779,694 | 25,327,004 | |||||||||
|
Basic
net (loss) income per share
|
$ | (1.38 | ) | $ | (4.60 | ) | $ | 0.94 | ||||
|
Diluted
net (loss) income per share
|
$ | (1.38 | ) | $ | (4.60 | ) | $ | 0.93 | ||||
|
Total
antidilutive stock options issued and outstanding
|
1,979,856 | 1,771,800 | 608,800 | |||||||||
80
Kenexa
Corporation and Subsidiaries
Notes
to Consolidated Financial Statements (Continued)
(All
amounts in thousands, except share and per share data, unless noted
otherwise)
2.
Summary of Significant Accounting Policies (continued)
Adoption
of New Accounting Pronouncements
Effective
July 1, 2009, we adopted “The FASB Accounting Standards
Codification and the Hierarchy of Generally Accepted Accounting
Principles”.
This standard establishes only two levels of GAAP, authoritative and
non-authoritative. The FASB Accounting Standards Codification (the
“Codification”) became the source of authoritative, non-governmental GAAP,
except for rules and interpretive releases of the SEC, which are sources of
authoritative GAAP for SEC registrants. All other non-grandfathered, non-SEC
accounting literature not included in the Codification became non-authoritative.
We began using the new guidelines and numbering system prescribed by the
Codification when referring to GAAP in the third quarter of fiscal 2009. As the
Codification was not intended to change or alter existing GAAP, it did not have
any impact on our consolidated financial statements.
In May
2009, the FASB adopted Codification Topic 855, “Subsequent Events,” which
codifies the guidance regarding the disclosure of events subsequent to the
balance sheet date. The statement established general standards of
accounting for and disclosure of events that occur after the balance sheet date
but before financial statements are issued or are available to be issued. ASC
855 is effective for interim or annual financial periods ending after June 15,
2009, and shall be applied prospectively. The adoption ASC 855 did not have a
material impact on the Company’s financial statements.
In April
2009, the FASB issued ASC 805 “Business Combinations,” which
amends ASC 805 by establishing a model to account for certain pre-acquisition
contingencies. Under ASC 805, an acquirer is required to recognize at fair value
an asset acquired or a liability assumed in a business combination that arises
from a contingency if the acquisition-date fair value of that asset or liability
can be determined during the measurement period. If the acquisition-date fair
value cannot be determined, then the acquirer should follow the recognition
criteria in ASC 450, “Contingencies”. In the first quarter of 2009, we adopted
ASC 805 and will apply its provisions when applicable.
In
December 2007, the FASB issued ASC 810-10, “Consolidation-Overall” and ASC 805, “Business Combinations”. Changes
for business combination transactions pursuant to ASC 805 include, among others,
expensing of acquisition-related transaction costs as incurred, the recognition
of contingent consideration arrangements at their acquisition date fair value
and capitalization of in-process research and development assets acquired at
their acquisition date fair value. Changes in accounting for noncontrolling
(minority) interests pursuant to ASC 810-10 include, among others, the
classification of noncontrolling interest as a component of consolidated
shareholders’ equity and the elimination of "minority interest" accounting in
results of operations. ASC 805 is required to be adopted and was effective for
fiscal years beginning on or after December 15, 2008. The
adoption of ASC 805 and ASC 810-10 impacted the Company’s accounting related to
the consolidation of its variable interest entity in 2009 and will impact the
accounting for the Company's future acquisitions.
In
February 2007, the FASB issued ASC 825, “Financial Instruments,”
which permits the Company to choose to measure many financial instruments and
certain other items at fair value. The Company adopted ASC 825 as of
January 1, 2008. The adoption did not impact the Company’s
consolidated financial statements on the date of adoption. However,
during the fourth quarter of 2008, the Company elected to measure at fair value
the put option related to its UBS Settlement Agreement.
In
September 2006, the FASB issued ASC 820, “Fair Value Measurements and
Disclosures,”
which defines
fair value, establishes a framework for measuring
fair value, and also expands disclosures about fair value measurements. FASB ASC
820 is effective for periods beginning after November 15, 2007. The Company
adopted this standard with respect to its financial assets effective
January 1, 2008. In February 2008, the FASB amended certain
provisions of ASC 820 delaying its effective date for one year for all
nonfinancial assets and nonfinancial liabilities, except those that are
recognized or disclosed at fair value in the financial statements on a recurring
basis (at least annually). See Footnote 3 of the Notes to the Consolidated
Financial Statements for further detail regarding the impact of our adoption of
ASC 820 for financial assets.
81
Kenexa
Corporation and Subsidiaries
Notes
to Consolidated Financial Statements (Continued)
(All
amounts in thousands, except share and per share data, unless noted
otherwise)
2.
Summary of Significant Accounting Policies (continued)
New
Accounting Pronouncements
In
October 2009, the FASB issued Accounting Standards Update (“ASU”)
No. 2009-13, “Revenue
Recognition: Multiple-Deliverable Revenue Arrangements—a consensus of the FASB
Emerging Issues Task Force,” which eliminates the use of the residual
method for allocating consideration, as well as the criteria that requires
objective and reliable evidence of fair value of undelivered elements in order
to separate the elements in a multiple-element
arrangement. By removing the criterion requiring the use of objective and
reliable evidence of fair value in separately accounting for deliverables, the
recognition of revenue will more closely align with certain revenue
arrangements. The standard also will replace the term "fair value" in the
revenue allocation guidance with "selling price" to clarify that the allocation
of revenue is based on entity-specific assumptions rather than assumptions of a
marketplace participant. ASU No. 2009-13 is effective for revenue
arrangements entered or materially modified in fiscal years beginning on or
after June 15, 2010. The Company is currently assessing the potential
impact of this standard to determine if its adoption will have a material impact
on the financial condition or results of operations of the
Company.
In June
2009, the FASB issued new accounting guidance for variable interest entities.
This guidance was codified under ASU 2009-17 in December 2009 and includes: (1)
the elimination of the exemption from consolidation for qualifying special
purpose entities, (2) a new approach for determining the primary beneficiary of
a variable interest entity (“VIE”), which requires that the primary beneficiary
have both (i) the power to control the most significant activities of the VIE
and (ii) either the obligation to absorb losses or the right to receive benefits
that could potentially be significant to the VIE, and (3) the requirement to
continually reassess who should consolidate a VIE. The new guidance is effective
for annual reporting periods that begin after November 15, 2009 and applies to
all existing and new VIEs. The Company is currently evaluating the impact of
adopting this new guidance. This guidance was codified in December 2009 under
ASU 2009-17.
82
Kenexa
Corporation and Subsidiaries
Notes
to Consolidated Financial Statements (Continued)
(All
amounts in thousands, except share and per share data, unless noted
otherwise)
3. Investments
Short-term
investments
The
following is a summary of our short-term investments at December 31, 2009 and
December 31, 2008:
As of
December 31, 2009:
|
Cost
|
Unrealized
Gains/(Loss)
|
Accrued
Interest
|
Fair Market
Value
|
|||||||||||||
|
Available
for Sale securities
|
||||||||||||||||
|
Municipal
securities
|
$ | 15,627 | $ | (89 | ) | $ | 118 | $ | 15,656 | |||||||
|
Trading
Securities
|
||||||||||||||||
|
Auction
rate securities
|
$ | 13,737 | $ | 177 | — | $ | 13,914 | |||||||||
|
Total
short-term investments
|
$ | 29,364 | $ | 88 | 118 | $ | 29,570 | |||||||||
As of
December 31, 2008:
|
Cost
|
Unrealized
Loss
|
Accrued
Interest
|
Fair Market
Value
|
|||||||||||||
|
Short-term
investments:
|
||||||||||||||||
|
Municipal
securities
|
$ | 4,510 | $ | (32 | ) | $ | 34 | $ | 4,512 | |||||||
|
Total
short-term investments:
|
$ | 4,510 | $ | (32 | ) | $ | 34 | $ | 4,512 | |||||||
Unrealized
gains and losses from fixed-income, available for sale securities are primarily
attributable to changes in interest rates. The Company does not
believe any unrealized losses represent an other-than-temporary impairment based
on the evaluation of available evidence as of December 31, 2009. For
the years ended December 31, 2009 and December 31, 2008, contractual maturities
of our short-term investments were one year or less.
83
Kenexa
Corporation and Subsidiaries
Notes
to Consolidated Financial Statements (Continued)
(All
amounts in thousands, except share and per share data, unless noted
otherwise)
3. Investments
(continued)
Due to
the failure of the auction rate market in early 2008, UBS AG and other major
banks entered into discussions with government agencies to provide liquidity to
owners of auction rate securities. In November 2008, the Company entered into an
agreement (the “UBS Settlement Agreement”) with UBS AG which provided (1) the
Company with a “no net cost” loan up to the par value of Eligible ARS until June
30, 2010, and (2) the Company, the right to sell these auction
rate securities back to UBS AG at par, at the Company’s sole discretion, anytime
during the period from June 30, 2010 through July 2, 2012, and
(3) UBS AG the right to purchase these auction rate securities or sell them
on the Company’s behalf at par anytime through July 2,
2012. Following the execution of the UBS Settlement Agreement, the
Company determined that it no longer had the intent to hold the ARS until either
the maturity or recovery of the ARS market. Based upon this unusual circumstance
related to the execution of the UBS Settlement Agreement, the Company
transferred these investments from available-for-sale to trading investment
securities and began recording the change in fair value of the ARS as gains and
losses in current statement of operations. As of December 31, 2009,
the auction rate securities, which were acquired through UBS AG, had a par value
of $15,300.
Contemporaneous
with the determination to transfer the ARS to trading securities, the Company
elected to measure the value of its option to put the securities (“put option”)
to UBS AG under the fair value option of ASC 825, “Financial
Instruments”. As a result, the Company recorded at December
31, 2008 a non-operating gain representing the estimated fair value of the put
option and a corresponding long-term asset of approximately
$2,219. At December 31, 2009, the put option’s estimated fair value
decreased to $1,374, resulting in a non-operating loss of $845 for the twelve
months ended December 31, 2009. The estimated fair value of the put
option as of December 31, 2009 was based in part on an expected life of six
months and a discount rate of 0.85%. In June 2009, due to our ability to
exercise our put option within the next twelve months, we reclassified the
estimated fair value of the put option to other current assets on the
consolidated balance sheet.
Based
upon the results of the discounted cash flow analysis, the Company determined
that the fair value of its investment in ARS should be discounted approximately
$2,219 to $16,513 at December 31, 2008, with any other-than temporary impairment
in the fair value of the ARS offset substantially by the fair value
recognized for the rights provided in the settlement agreement. As a
result of the transfer of the ARS from available-for-sale to trading investment
securities noted above, the Company also recorded a non-operating gain for the
twelve months ended December 31, 2009 of approximately $833. The recording of
the loss relating to the decrease in the fair value of the put option and the
recognition of the gain in the ARS resulted in an overall net loss of
approximately $12 for the year ended December 31, 2009.
The
Company adjusted the fair value of its ARS investment portfolio using a
discounted cash flow model to determine the estimated fair value of its ARS
investments as of December 31, 2009. The ranges of assumptions used in
preparing the discounted cash flow model include level three inputs, as defined
in ASC 825, and are presented in the following table:
|
Input
description
|
Minimum
|
Maximum
|
||||||
|
Maximum
auction rate (interest rate)
|
0.47 | % | 0.54 | % | ||||
|
Liquidity
risk premium
|
4.00 | % | 5.00 | % | ||||
|
Probability
of earned maximum rate until maturity
|
0.01 | % | 0.19 | % | ||||
|
Probability
of default
|
1.44 | % | 20.73 | % | ||||
The
Company adopted the provisions of ASC 820-10 effective January 1, 2008, which
defines fair value as price that would be received to sell an asset or paid to
transfer a liability in an orderly transaction between market participants at
the measurement date.
84
Kenexa
Corporation and Subsidiaries
Notes
to Consolidated Financial Statements (Continued)
(All
amounts in thousands, except share and per share data, unless noted
otherwise)
3. Investments
(continued)
The
Company has investments that are valued in accordance with the provisions of ASC
820, “Fair Value Measurements
and Disclosure”. Under this standard, fair value is defined as the price
that would be received to sell an asset or paid to transfer a liability in an
orderly transaction between market participants at the measurement
date. ASC 820, Fair Value Measurements and Disclosure establishes a
hierarchy for inputs used in measuring fair value that maximizes the use of
observable inputs and minimizes the use of unobservable inputs by requiring that
the most observable inputs be used when available. The hierarchy is broken down
into three levels based on the reliability of inputs as follows:
|
•
|
Level
1—Valuations based on quoted prices in active markets for identical assets
that the Company has the ability to
access.
|
|
•
|
Level
2—Valuations based inputs on other than quoted prices included within
level 1, for which all significant inputs are observable, either directly
or indirectly.
|
|
•
|
Level
3—Valuations based on inputs that are unobservable and significant to the
overall fair value measurement.
|
On
December 31, 2009, the fair value for the Company’s investments was determined
based upon the inputs presented below:
|
Description
|
Total
|
Quoted prices in
active markets for
identical assets
(Level 1)
|
Significant other
observable inputs
(Level 2)
|
Significant
unobservable
inputs (Level 3)
|
||||||||||||
|
Municipal
Bonds
|
$ | 15,656 | $ | 15,656 | — | — | ||||||||||
|
Auction
rate securities
|
$ | 13,914 | — | — | $ | 13,914 | ||||||||||
|
Total investments:
|
$ | 29,570 | $ | 15,656 | — | $ | 13,914 | |||||||||
A
reconciliation of the beginning and ending balances for the auction rate
securities using significant unobservable inputs (Level 3) for the period ended
December 31, 2009 is presented below:
|
Auction rate
securities
|
||||
|
Balance
at December 31, 2007
|
$ | 29,900 | ||
|
Total
net realized losses
|
||||
|
included
in earnings
|
(1,191 | ) | ||
|
Purchases,
issuances and settlements
|
(12,196 | ) | ||
|
Balance
at December 31, 2008
|
$ | 16,513 | ||
|
Total
net realized gains
|
||||
|
included
in earnings
|
833 | |||
|
Settlements
|
(3,432 | ) | ||
|
Balance
at December 31, 2009
|
$ | 13,914 | ||
Based on
the size of this investment, the Company’s ability to access cash and other
short-term investments, and expected operating cash flows, the Company does not
anticipate the illiquidity of this investment will affect its
operations.
85
Kenexa
Corporation and Subsidiaries
Notes
to Consolidated Financial Statements (Continued)
(All
amounts in thousands, except share and per share data, unless noted
otherwise)
4.
Acquisitions
Quorum
International Holdings Limited
On April
2, 2008, the Company acquired all of the outstanding stock of Quorum
International Holdings Limited (“Quorum”), a provider of recruitment process
outsourcing services based in London, England, for a purchase price of
approximately $27,950, in cash, of which $19,753 was paid in April 2008 and
$8,197 was paid in July 2008. The total cost of the acquisition,
including legal, accounting, and other professional fees of $1,237, was
approximately $29,187, including acquired intangibles of $8,633, with estimated
useful lives between 3 and 10 years. In addition, the acquisition
agreement contains an earnout provision which provides for the payment of
additional consideration by the Company based upon the gross profit of Quorum
for the twelve month period ending June 30, 2009 and June 30, 2010.
Formulaically, the earnout is 3.86 times Quorum’s gross profit less the amount
of base consideration, as defined in the agreement. Pursuant to FASB ASC
805, “Business
Combinations,” the Company accrues contingent purchase consideration when
the outcome of the contingency is determinable beyond a reasonable
doubt. Based upon the results for the twelve month period through
June 30, 2009, it was determined that an earnout payment was due to the former
shareholders of Quorum and as such, the additional consideration of $1,167 was
accrued for in the financial statements at December 31, 2009. The
additional consideration was paid in cash during the first quarter of
2010. In addition, as of December 31, 2009, the June 30, 2010 earnout
amount was substantially uncertain, and, as such, the estimated earnout range is
not possible to disclose. The Company evaluates the earnout
provisions contained in the acquisition agreement at each financial statement
reporting date. In connection with the acquisition, €500 or approximately
$717, of the purchase price was deposited into an escrow account and recorded in
other long-term assets, to cover any claims for indemnification made by the
Company against Quorum under the acquisition agreement. The escrow
agreement will remain in place for approximately two years from the acquisition
date, and any funds remaining in the escrow account at the end of the two year
period will be distributed to the former stockholders of Quorum. The
Company expects that the acquisition of Quorum will broaden its presence in the
global recruitment market. The purchase price has been allocated to
the assets acquired and liabilities assumed based upon management’s best
estimate of fair value with any excess over the net tangible and intangible
assets acquired allocated to goodwill. Quorum’s results of
operations were included in the Company’s consolidated financial statements
beginning on April 2, 2008.
86
Kenexa
Corporation and Subsidiaries
Notes
to Consolidated Financial Statements (Continued)
(All
amounts in thousands, except share and per share data, unless noted
otherwise)
5.
Variable Interest Entity
On
January 20, 2009, the Company entered into an ownership interest transfer
agreement (“the agreement”) with Shanghai Runjie Management Consulting Company,
(“R and J”) in Shanghai, China. In conjunction with the
agreement, the Company paid $1,337 to provide an initial equity contribution and
to compensate the former owners of R and J, who transferred their existing
business into a new entity, Shanghai Kenexa Human Resources Consulting Co.,
Ltd., (the “variable interest entity”). The initial payment
provided the Company with a 46% ownership in the variable interest entity, and a
presence in China’s human capital management market. The former
owners of R and J are required to transfer 1% additional ownership interests (in
1% increments up to 49% over a two year period), with consideration to be paid
by the Company based upon adjusted EBITDA, as defined. In the fourth
quarter of 2009, based upon the 2008 operating results for R and J, the Company
paid an additional $206 for an additional 1% ownership interest in the variable
interest entity. At December 31, 2009, the Company had a 47%
ownership interest in the variable interest entity.
Consideration
for the ownership interest transfer in the third quarter was
determined as the greater of 1) the amount of registered capital attributable to
a 1% ownership interest or 2) an amount denominated in Chinese Yuan Renminbi
(“RMB¥”) equal to the result of 47% times four and one half times the Adjusted
EBITDA of the variable interest entity for the calendar year ended December 31,
2008, plus 1% of the variable interest entity’s free cash flow as of March 31,
2008, minus the amount of the initial investment or RMB¥ 8,145 or $1,224. The
additional transfers of ownership interests for 2010 and 2011 will be determined
formulaically the same as above and will be adjusted only for any increase in
actual ownership percentage by the Company.
Under the
terms of the variable interest entity agreement, the Company has the right to
acquire R and J’s remaining interest in the variable interest entity at any time
after the earlier of the termination of the general manager’s employment by the
variable interest entity or during the first three months of any calendar year
beginning on or after January 1, 2013 (call rights). The purchase
price for the remaining ownership interest is based upon the outstanding
ownership interest multiplied by the sum of the amount of free cash flow plus
four and one half times the Adjusted EBITDA, as defined. R and J may also
require the Company to purchase its interest in the variable interest entity at
any time after the earlier of the Company’s acquisition of more than fifty
percent of the variable interest entity or January 1, 2011 (put
rights).
In
accordance with ASC 810, “Variable Interest Entities”,
the new entity qualified for consolidation as it was determined to be a variable
interest entity and the Company as its primary beneficiary. The
determination of the primary beneficiary was based, in part, upon a qualitative
assessment which included the Company’s commitment to finance the variable
interest entity’s ongoing operations, the level of involvement in the variable
interest entity’s operations, the use of the Company’s brand by the variable
interest entity, and the lack of equity “at risk” by R and J given its put
rights. The variable interest entity is consolidated in the Company’s
financial statements because of the Company’s implicit guarantee to provide
financing and as well as its significant involvement in the day-to-day
operations. The equity interests of R and J not owned by the
Company are reported as a noncontrolling interest in the Company’s December 31,
2009 accompanying consolidated balance sheet. All inter-company
transactions are eliminated (see Note 2 – Summary of Significant Accounting
Policies.)
The
variable interest entity was financed with $307 in initial equity contributions
from the Company and R and J, and has no borrowings for which its assets would
be used as collateral. Following the formation of the variable
interest entity, the Company completed a valuation of the concern, which
resulted in the recording of net tangible assets, intangible assets and goodwill
of $314, $1,100 and $1,512, respectively in the consolidated balance
sheet. On September 30, 2009, the Company provided $160 of
financing for the variable interest entity in the form of an intercompany
loan. The creditors of the variable interest entity do
not have
recourse to other assets of the Company.
Pursuant
to ASC 480 “Distinguishing
Liabilities from Equity” (formerly Emerging Issues Task Force Abstracts
Topic No. D-98, “Classification and Measurement of Redeemable Securities”, due
to the put rights included in the agreement, the Company has presented the
estimated fair value of R and J’s 53% ownership interest in the variable
interest entity amounting to $1,330 at December 31, 2009 in noncontrolling
interest and classified the amount as mezzanine equity (temporary equity) on the
consolidated balance sheet.
87
Kenexa
Corporation and Subsidiaries
Notes
to Consolidated Financial Statements (Continued)
(All
amounts in thousands, except share and per share data, unless noted
otherwise)
6.
Property, Equipment and Software
A summary
of property, equipment and capitalized software and related accumulated
depreciation and amortization as of December 31, 2009 and 2008 is as
follows:
|
December
31,
|
||||||||
|
2009
|
2008
|
|||||||
|
Equipment
|
$ | 17,748 | $ | 15,112 | ||||
|
Software
|
28,397 | 13,999 | ||||||
|
Office
furniture and fixtures
|
2,455 | 2,370 | ||||||
|
Leasehold
improvements
|
2,735 | 2,744 | ||||||
|
Land
|
714 | 643 | ||||||
|
Building
|
7,828 | 6,771 | ||||||
|
Software
in development
|
3,083 | 7,185 | ||||||
| 62,960 | 48,824 | |||||||
|
Less
accumulated depreciation and amortization
|
26,093 | 17,624 | ||||||
| $ | 36,867 | $ | 31,200 | |||||
Depreciation
and amortization expense is excluded from cost of revenues.
Equipment
and office furniture and fixtures included assets under capital leases totaling
$2,621 and $2,612 at December 31, 2009 and 2008, respectively. Depreciation and
amortization expense, including amortization of assets under capital leases, was
$9,789, $6,920 and $5,172 for the years ended December 31, 2009, 2008 and 2007,
respectively.
Pursuant
to FASB ASC 360, “Property,
Plant and Equipment,” the Company reviewed its fixed assets and
determined that the fair value exceeded the carrying value, and therefore did
not record any fixed asset impairment as of December 31, 2009.
88
Kenexa
Corporation and Subsidiaries
Notes
to Consolidated Financial Statements (Continued)
(All
amounts in thousands, except share and per share data, unless noted
otherwise)
7.
Other Accrued Liabilities
Other
accrued liabilities consist of the following:
|
December 31,
|
||||||||
|
2009
|
2008
|
|||||||
|
Accrued
professional fees
|
$ | 1,031 | $ | 131 | ||||
|
Straight
line rent accrual
|
2,084 | 1,904 | ||||||
|
Other
taxes payable
|
118 | 450 | ||||||
|
Income
taxes payable
|
837 | 2,293 | ||||||
|
Other
liabilities
|
1,139 | 1,056 | ||||||
|
Contingent
purchase price
|
1,167 | 3,000 | ||||||
|
Total
other accrued liabilities
|
$ | 6,376 | $ | 8,834 | ||||
8.
Line of Credit
On May
21, 2009, based upon its current liquidity needs, the Company elected not to
renew its secured credit agreement with PNC Bank, as administrative agent, and
several other lenders named therein (the “Credit Agreement”). The Credit
Agreement, which became effective November 13, 2006, provided (i) a $50 million
revolving credit facility, including a sublimit of up to $2 million for letters
of credit and (ii) a $50 million term loan. The Company and each of
its U.S. subsidiaries guaranteed the obligations of the Company under the Credit
Agreement. The Credit Agreement also required the Company to pay a
monthly commitment fee based on the unused portion of the revolving credit
facility. At May 21, 2009, the Company had no outstanding balance on
the Credit Agreement. Unless renewed, the Credit Agreement would have expired on
its own terms on March 26, 2010. No early termination penalties were
incurred in connection with the termination of the Credit
Agreement. In connection with the termination of the Credit
Agreement, the Company wrote off $289 of deferred financing fees during the
quarter ended June 30, 2009. As a result of the termination of the
Credit Agreement, the Company does not have a revolving credit facility or other
debt financing arrangement.
89
Kenexa
Corporation and Subsidiaries
Notes
to Consolidated Financial Statements (Continued)
(All
amounts in thousands, except share and per share data, unless noted
otherwise)
9.
Income Taxes
|
For the years ended December 31,
|
||||||||||||
|
2009
|
2008
|
2007
|
||||||||||
|
Current
|
||||||||||||
|
Federal
|
$ | 417 | $ | 4,542 | $ | 4,866 | ||||||
|
Foreign
|
1,080 | 2,777 | 308 | |||||||||
|
State
and local
|
853 | 616 | 422 | |||||||||
|
Total
current
|
$ | 2,350 | $ | 7,935 | $ | 5,596 | ||||||
|
Deferred
|
||||||||||||
|
Federal
|
$ | 378 | $ | (39,325 | ) | $ | 3,517 | |||||
|
Foreign
|
(811 | ) | (696 | ) | 836 | |||||||
|
State
and local
|
10 | (5,985 | ) | 630 | ||||||||
|
Total
deferred
|
(423 | ) | (46,006 | ) | 4,983 | |||||||
|
Total
income tax (benefit) provision
|
$ | 1,927 | $ | (38,071 | ) | $ | 10,579 | |||||
A
reconciliation of the Company’s effective income tax rate to the U.S. statutory
federal income tax rate of 35% is as follows:
|
For the years ended December 31,
|
||||||||||||
|
2009
|
2008
|
2007
|
||||||||||
|
U.S.
statutory federal tax rate
|
(35.0 | )% | (35.0 | )% | 35.0 | % | ||||||
|
Foreign
tax differential
|
0.8 | % | (1.9 | )% | (1.5 | )% | ||||||
|
Domestic
production deduction
|
— | % | — | % | (0.5 | )% | ||||||
|
Nondeductible
goodwill impairment
|
15.8 | % | 12.1 | % | — | % | ||||||
|
State
income taxes
|
(1.6 | )% | (2.4 | )% | 2.0 | % | ||||||
|
Officer’s
life insurance
|
— | % | — | % | 0.1 | % | ||||||
|
Other
nondeductible expenses
|
0.5 | % | 0.1 | % | 0.7 | % | ||||||
|
Change
in valuation allowance
|
23.9 | % | 0.5 | % | — | % | ||||||
|
Research
and development credit
|
(0.9 | )% | (0.4 | )% | (2.7 | )% | ||||||
|
Non-taxable
interest
|
(0.5 | )% | (0.3 | )% | (3.2 | )% | ||||||
|
Provision
to return true-up
|
3.7 | % | 0.6 | % | 1.1 | % | ||||||
|
Income
tax (benefit) expense
|
6.7 | % | (26.7 | )% | 31.0 | % | ||||||
90
Kenexa
Corporation and Subsidiaries
Notes
to Consolidated Financial Statements (Continued)
(All
amounts in thousands, except share and per share data, unless noted
otherwise)
9.
Income Taxes (continued)
Deferred
income taxes reflect the net tax effects of temporary differences between the
carrying amount of assets and liabilities for financial reporting purposes and
the amounts used for income tax purposes. Components of the Company’s
net deferred tax assets and liabilities as of December 31, 2009 and 2008
were as follows:
|
December 31,
|
||||||||
|
2009
|
2008
|
|||||||
|
Deferred
tax assets
|
||||||||
|
Foreign
net operating loss carryforwards
|
$ | 2,129 | $ | 2,209 | ||||
|
Accrued
expenses
|
879 | 43 | ||||||
|
Federal
and state net operating loss carryforwards
|
1,397 | 877 | ||||||
|
AMT
tax carryforward
|
166 | 166 | ||||||
|
Deferred
revenue
|
6,616 | 3,178 | ||||||
|
Accounts
receivable allowance
|
514 | 799 | ||||||
|
Stock
options
|
5,927 | 4,092 | ||||||
|
Depreciation
and amortization
|
— | 1,636 | ||||||
|
Goodwill
|
38,379 | 36,309 | ||||||
|
Capitalized
R&D tax credits
|
314 | 262 | ||||||
|
Section
481(a) adjustment
|
549 | 361 | ||||||
|
Other
|
60 | 121 | ||||||
|
Total
deferred tax assets
|
$ | 56,930 | $ | 50,053 | ||||
|
Deferred
tax liabilities
|
||||||||
|
Capitalized
R&D
|
(3,648 | ) | (423 | ) | ||||
|
Other
accrued expenses
|
(333 | ) | (481 | ) | ||||
|
Depreciation
and amortization
|
(1,493 | ) | — | |||||
|
Amortization
of intangibles and goodwill
|
(1,282 | ) | (5,529 | ) | ||||
|
Total
deferred tax liabilities
|
(6,756 | ) | (6,433 | ) | ||||
|
Net
deferred tax asset
|
50,174 | 43,620 | ||||||
|
Valuation
allowance
|
(7,460 | ) | (1,329 | ) | ||||
|
Net
deferred tax asset (liability)
|
$ | 42,714 | $ | 42,291 | ||||
91
Kenexa
Corporation and Subsidiaries
Notes
to Consolidated Financial Statements (Continued)
(All
amounts in thousands, except share and per share data, unless noted
otherwise)
9. Income Taxes (continued)
At
December 2009, the Company has remaining Federal net operating loss
carryforwards from acquisitions of $2,021 with an expiration date of 2025. These
acquired operating loss carryovers are subject to Internal Revenue Code section
382 loss limitations. The Company also has $11,342 of state net operating loss
carryovers available from domestic affiliates and $8,546 of net operating loss
carryovers available from foreign affiliates. These state losses have
various expiration dates not in excess of 20 years while the foreign losses have
no expiration date. Based on the uncertainty of fully utilizing these
NOLs the Company has recorded valuation allowances as of December 31, 2009 of
$4,567, $1,561 and $1,332 for Federal, state and foreign purposes,
respectively. In 2009, the Company released $838 of its foreign
valuation allowance and simultaneously wrote off a fully reserved acquired
foreign net operating loss that was determined to be nondeductible.
At
December 2008, the Company has remaining Federal net operating loss
carryforwards from acquisitions of $2,253 with an expiration date of 2025. The
Company also has net operating loss carryforwards available from foreign
acquisitions of $7,731. These losses have no expiration
date. Based on the uncertainty of fully utilizing these NOLs the
Company has recorded a valuation allowance as of December 31, 2008 of
$4,417. The Company also has state NOL carryforwards of
$2,266.
Activity
in the valuation allowance account for the years ended December 31, 2009, 2008
and 2007 is presented in the table below:
|
Beginning
Balance
|
Increase in
valuation
allowance
|
Acquired
valuation
allowance
|
Release
of
valuation
allowance
|
338g
election
|
Ending
Balance
|
|||||||||||||||||||
|
2009
|
$ | (1,329 | ) | $ | (6,969 | ) | $ | — | $ | 838 | $ | — | $ | (7,460 | ) | |||||||||
|
2008
|
(653 | ) | — | (676 | ) | — | — | (1,329 | ) | |||||||||||||||
|
2007
|
(12,634 | ) | — | (653 | ) | 796 | 11,838 | (653 | ) | |||||||||||||||
The
determination of the level of valuation allowance at December 31, 2009 is based
on an estimated forecast of future taxable income which includes many judgments
and assumptions primarily related to revenue, margins, operating expenses, tax
planning strategies and tax attributes in multiple taxing
jurisdictions. Accordingly, it is at least reasonably possible that
future changes in one or more of these assumptions may lead to a change in
judgment regarding the level of valuation allowance required in future
periods.
In 2005,
the Company was granted a tax holiday from the government of India for its
development center located in Hyderabad, India. This tax holiday was
granted for a five year period, was subsequently extended via statute for an
additional year and is scheduled to expire in 2010. The income tax benefit
on this holiday is $83, $65 and $362 in 2009, 2008 and 2007, respectively. In
2008, the Company was granted a separate tax holiday from the Indian government
covering the activities of its new development center in Vizag,
India. This tax holiday was granted for a period of 10 years and will
expire in 2018. The income tax benefit on this holiday is $236 and
$309 in 2009 and 2008, respectively.
92
Kenexa
Corporation and Subsidiaries
Notes
to Consolidated Financial Statements (Continued)
(All
amounts in thousands, except share and per share data, unless noted
otherwise)
9.
Income Taxes (continued)
The
Company does not provide for U.S. deferred income taxes or tax benefits on the
undistributed earnings or losses of its non-U.S. subsidiaries because earnings
are permanently reinvested and, in the opinion of management, will continue to
be reinvested indefinitely. At December 31, 2009, the Company had not
provided for deferred income tax expense for cumulative income of individual
international subsidiaries of $18,202. Should these earnings be
distributed in the form of dividends or otherwise, the Company would be subject
to both U.S. income taxes and withholding taxes in various international
jurisdictions. Determination of the related amount of unrecognized deferred U.S.
income tax liability is not practicable because of the complexities associated
with its hypothetical calculation. In the event of the repatriation
of foreign earnings, the Company believes that it would be in a position to
claim sufficient foreign tax credits for U.S. federal income taxes purposes to
offset a significant amount of potential tax liability.
During
the third quarter of 2009, the Internal Revenue Service completed its
examination of the Company’s federal income tax returns for the years 2006 and
2007 and issued a final Revenue Agent’s Report (RAR.) The Company
agreed with all of the adjustments contained in the RAR and during the fourth
quarter of 2009, received written notification from the IRS that the final
examination report had been accepted. The resolution of the
examination resulted in the disallowance of tax credits previously claimed by
the Company, the loss of which did not have a material impact on the financial
condition of the Company.
During
2007, the Company filed separate elections under Section 338(g) of the Internal
Revenue Code to treat the acquisitions of Webhire and BrassRing as the purchase
of assets for tax purposes. These elections allow the tax basis in acquired
assets to be valued at their relative fair market values on the respective dates
of purchase. As a result of these elections, certain deferred tax assets
of Webhire and BrassRing totaling $2,942 and $342, respectively were reduced and
reclassified to goodwill following the elimination of certain tax attributes,
including previously recorded net operating loss
carryforwards.
The
amount of unrecognized tax benefits as of December 31, 2009, determined in
accordance with the provisions of ACS 740 increased by $634. A
reconciliation of the beginning and ending amounts of unrecognized tax benefits
is as follows:
|
Beginning
Balance December 31, 2007
|
$ | — | ||
|
Additions
for tax positions
|
1,256 | |||
|
Ending
balance December 31, 2008
|
$ | 1,256 | ||
|
Additions
based on tax positions related to the current year
|
844 | |||
|
Reductions
for positions of prior years, including impacts due to a lapse in
statute
|
(11 | ) | ||
|
Settlements
|
(199 | ) | ||
|
Ending
balance December 31, 2009
|
$ | 1,890 |
The
additions to the unrecognized tax benefits related to the current and prior
years are primarily attributable to various transfer pricing and related
valuation matters, certain tax incentives and credits, acquisition matters,
apportionment of state taxable income and other foreign matters. The
settlements and reductions to the unrecognized tax benefits for tax positions of
prior years are primarily attributable to the conclusion of the IRS
examination. The liability of $1,890 can be reduced by $195 of
offsetting tax benefits associated with the correlative effects of potential
transfer pricing adjustments, state income taxes and timing
adjustments. The net amount of $1,695, if recognized, would have a
favorable impact on the Company’s effective tax rate.
Our
policy is to recognize interest and penalties on unrecognized tax benefits in
the provision for income taxes in the consolidated statements of
operations. During the year ended December 31, 2009, the Company
recognized $69 in interest and penalties, and in 2008, the Company recognized
$101 in interest and penalties.
With
certain limited exceptions, the Company is no longer subject to U.S. federal
income tax audits for tax years through 2007 and state and local or non-U.S.
income tax audits by taxing authorities for tax years through
2004. However, net operating loss and tax credit carryovers from all
years continue to be subject to examinations and adjustments for at least three
years following the year in which the attributes are used. The
Company is currently under examination by certain state taxing authorities for
tax years 2005 and 2006. Although the outcome of tax audits is
difficult to predict with certainty, the Company believes that adequate amounts
of tax and interest have been provided for any adjustments that may result from
tax examinations.
93
Kenexa
Corporation and Subsidiaries
Notes
to Consolidated Financial Statements (Continued)
(All
amounts in thousands, except share and per share data, unless noted
otherwise)
10.
Commitments and Contingencies
Leasing
Arrangements
The
Company leases certain of its facilities and equipment under various operating
and capital leases. Equipment under capital leases consists primarily of
computer equipment and furniture and fixtures. These leases generally have terms
of three to five years, bear interest up to 13.0% per annum and are
collateralized by the underlying equipment. Operating leases primarily consist
of leases for office space and equipment. Future minimum lease payments for each
of the following five years are:
|
Capital
Leases
|
Operating
Leases
|
|||||||
|
2010
|
$ | 215 | $ | 7,532 | ||||
|
2011
|
204 | 5,164 | ||||||
|
2012
|
57 | 3,789 | ||||||
|
2013
|
— | 2,624 | ||||||
|
2014
|
— | 1,687 | ||||||
|
Total
minimum lease payments
|
$ | 476 | $ | 20,796 | ||||
|
Less
amount representing interest
|
6 | |||||||
|
Present
value of minimum payments under capital leases
|
470 | |||||||
|
Less
current portion
|
211 | |||||||
| $ | 259 | |||||||
Rent
expense was $7,496, $7,174 and $5,824 for the years ended December 31, 2009,
2008 and 2007, respectively. Most of the Company’s capital and
operating leases contain automatic renewal terms, bargain purchase options or
escalation clauses but the leases are expensed on a straight-line
basis.
Severance
arrangement
On
November 26, 2006, the Company entered into a separation agreement and general
release with its former Chief Operating Officer who resigned from his positions
as an officer and a director of the Company and each of its subsidiaries,
effective on the close of business on November 30, 2006. The
separation agreement provided that the Company continue to pay the former
officer his base salary of $250 per year through November 29, 2008. In
addition, until May 29, 2010, the Company will provide the former officer with
continued participation in the medical insurance coverage plans of the Company,
or the economic equivalent of the employer portion of the premium for such
plans. Pursuant to the separation agreement, the former officer received
$397 under the Company’s 2006 bonus plan. In addition, previously
unvested options to purchase 28,333 shares of the Company’s common stock held by
the former officer became immediately exercisable, and all other unvested stock
options granted to the former officer by the Company were forfeited on the
separation date.
Also,
pursuant to the separation agreement, the former officer provided the Company
and its subsidiaries and affiliates with a general release, and the former
officer agreed to certain restrictive covenants, including confidentiality and
non-disparagement, and non-competition and non-solicitation for a period of two
years after the separation date, as such, the company recognized the severance
expense over the non compete term.
94
Kenexa
Corporation and Subsidiaries
Notes
to Consolidated Financial Statements (Continued)
(All
amounts in thousands, except share and per share data, unless noted
otherwise)
10.
Commitments and Contingencies (continued)
Litigation
On August
27, 2007, a complaint was filed and served by Kenexa BrassRing, Inc. against
Taleo Corporation in the United States District Court for the District of
Delaware. Kenexa alleges that Taleo infringed Patent Nos. 5,999,939
and 6,996,561, and seeks monetary damages and an order enjoining Taleo from
further infringement.
On May 9,
2008, Kenexa BrassRing, Inc. filed a similar lawsuit against Vurv Technology,
Inc. in the United States District Court for the District of Delaware, alleging
that Vurv has infringed Patent Nos. 5,999,939 and 6,996,561, and seeks monetary
damages and an order enjoining further infringement. This lawsuit has been
consolidated with the Kenexa BrassRing, Inc. versus Taleo Corporation
lawsuit.
On June
25, 2008, Kenexa Technology, Inc. filed suit in the United States District Court
of Delaware against Taleo Corporation for tortious interference with contract,
unfair competition, unfair trade practices and unjust enrichment. On August 28,
2009, Taleo filed an amended answer and counterclaim against Kenexa BrassRing,
Inc. asserting copyright infringement against Kenexa by the users accessing the
Taleo system on behalf of Kenexa’s recruitment process outsourcing customers.
Kenexa seeks monetary damages and to enjoin the actions of
Taleo. Taleo seeks monetary damages and to enjoin the actions of
Kenexa.
On
November 7, 2008, Vurv Technology LLC, sued Kenexa Corporation, Kenexa
Technology, Inc., and two former employees of Vurv, who now work for Kenexa , in
the United States District Court for the Northern District of
Georgia. In this action, Vurv asserts claims for breach of contract,
computer trespass and theft, misappropriation of trade secrets, interference
with contract and civil conspiracy. Vurv seeks unspecified monetary
damages and injunctive relief.
On June
11, 2009 and July 16, 2009, two putative class actions were filed against Kenexa
Corporation and our Chief Executive Officer and Chief Financial Officer in the
United States District Court for the Eastern District of Pennsylvania,
purportedly on behalf of a class of our investors who purchased our publicly
traded securities between May 8, 2007 and November 7, 2007. The complaint filed
on July 16, 2009 has since been voluntarily dismissed. In the pending
action, Building Trades United Pension Trust Fund, individually and on behalf of
all others similarly situated alleges violations of Section 10(b) of the
Securities Exchange Act of 1934 ("Exchange Act"), Rule 10b-5 promulgated
thereunder and Section 20(a) of the Exchange Act in connection with various
public statements made by Kenexa. This action seeks unspecified damages,
attorneys’ fees and expenses.
On July
17, 2009, Kenexa BrassRing, Inc. and Kenexa Recruiter, Inc. filed suit
against Taleo Corporation, a current Taleo employee and a former Taleo
employee in Massachusetts Superior Court. Kenexa amended the
complaint on August 27, 2009 and added Vurv Technology LLC, two former employees
of Taleo and two current employees of Taleo. Kenexa asserts
claims for breach of contract and the implied covenant of good faith and fair
dealing, unfair trade practices, computer theft, misappropriation of trade
secrets, tortious interference, unfair competition, and unjust
enrichment. Kenexa seeks monetary damages and injunctive
relief.
The
Company is involved in claims, including those identified above, which arise in
the ordinary course of business. In the opinion of management, the Company has
made adequate provision for potential liabilities, if any, arising from any such
matters. However, litigation is inherently unpredictable, and the
costs and other effects of pending or future litigation, governmental
investigations, legal and administrative cases and proceedings (whether civil or
criminal), settlements, judgments and investigations, claims and changes in any
such matters, could have a material adverse effect on the Company’s business,
financial condition and operating results.
95
Kenexa
Corporation and Subsidiaries
Notes
to Consolidated Financial Statements (Continued)
(All
amounts in thousands, except share and per share data, unless noted
otherwise)
Rollforward
of Shares
The
Company’s common shares issued and repurchased during the years ended December
31, 2009, 2008 and 2007 are as follows:
|
Common Shares
|
||||
|
Class A
|
||||
|
December
31, 2006 ending balance
|
20,897,777 | |||
|
Repurchase
of shares
|
(1,448,091 | ) | ||
|
Shares
issued in public offering
|
4,312,500 | |||
|
Stock
option exercises
|
136,673 | |||
|
Employee
Stock Purchase Plan
|
10,152 | |||
|
Restricted
shares issued
|
16,200 | |||
|
Shares
issued for acquisition
|
107,235 | |||
|
December
31, 2007 ending balance
|
24,032,446 | |||
|
Repurchase
of shares
|
(1,677,560 | ) | ||
|
Stock
option exercises
|
67,021 | |||
|
Employee
Stock Purchase Plan
|
27,141 | |||
|
Shares
issued for earnout
|
55,876 | |||
|
December
31, 2008 ending balance
|
22,504,924 | |||
|
Stock
option exercises
|
14,747 | |||
|
Employee
Stock Purchase Plan
|
42,212 | |||
|
December
31, 2009 ending balance
|
22,561,883 | |||
Refer to
the accompanying consolidated statements of shareholders’ equity and this note
for further discussion.
96
Kenexa
Corporation and Subsidiaries
Notes
to Consolidated Financial Statements (Continued)
(All
amounts in thousands, except share and per share data, unless noted
otherwise)
11.
Equity (continued)
Stock
and Voting Rights
Undesignated
Preferred Stock
The
Company has 10,000,000 shares of $0.01 par value undesignated preferred stock
authorized, with no shares issued or outstanding at December 31, 2009 or
2008. These shares have preferential rights in the event of liquidation and
payment of dividends.
Common
Stock
At
December 31, 2009 and 2008, the Company had 100,000,000 authorized shares
of common stock. At December 31, 2009 and 2008 22,561,883 and
22,504,924 shares of common stock respectively, were
outstanding. Each share of common stock has one-for-one voting
rights.
Authorized
but not issued shares
On
November 8, 2007, our board of directors authorized a stock repurchase plan
providing for the repurchase of up to 2,000,000 shares of our common stock, of
which 1,448,091 shares were repurchased at an aggregate cost of $25,482 as of
December 31, 2007. These shares were restored to original status
prior to December 31, 2007 and accordingly are presented as authorized but not
issued. The timing, price and volume of repurchases were based on
market conditions, relevant securities laws and other factors. As of
December 31, 2007 the amount of shares available for repurchase under the stock
repurchase plan was 551,909. Through January 24, 2008, the remaining
551,909 shares available for repurchase under the stock repurchase plan were
repurchased at an aggregate cost of $9,848.
On
February 20, 2008, our board of directors authorized a stock repurchase plan
providing for the repurchase of up to 3,000,000 shares of the Company’s common
stock, of which 1,125,651 shares were repurchased at an aggregate cost of
$20,429 as of December 31, 2008. These shares were restored to
original status prior to December 31, 2008 and accordingly are presented as
authorized but not issued. The timing, price and volume of
repurchases were based on market conditions, relevant securities laws and other
factors. As of December 31, 2008 the amount of shares available for
repurchase under the stock repurchase plan was 1,874,349. For the
year ended, December 31, 2009 no repurchases were made under the stock
repurchase plan.
97
Kenexa
Corporation and Subsidiaries
Notes
to Consolidated Financial Statements (Continued)
(All
amounts in thousands, except share and per share data, unless noted
otherwise)
12.
Stock Plans
Stock
Option Plan
The
Company’s 2005 Equity Incentive Plan (the “2005 Option Plan”), which was adopted
by the Company’s Board of Directors (the “Board”) in March 2005 and was approved
by the Company’s shareholders in June 2005, provides for the granting of stock
options to employees and directors at the discretion of the Board or a committee
of the Board. The 2005 Option Plan replaced the Company’s 2000 Stock
Option Plan (the “2000 Option Plan”). The purpose of stock options is
to recognize past services rendered and to provide additional incentive in
furthering the continued success of the Company. Stock options
granted under both the 2005 Option Plan and the 2000 Stock Option Plan expires
between the fifth and tenth anniversary of the date of grant and generally vest
on the third anniversary of the date of grant. Unexercised stock
options may expire up to 90 days after an employee's termination for
options granted under the 2000 Option Plan.
As of
December 31, 2009, there were options to purchase 3,173,907 shares of common
stock outstanding under the 2005 Option Plan. The Company is
authorized to issue up to an aggregate of 4,842,910 shares of its common stock
pursuant to stock options granted under the 2005 Option Plan. As of December 31,
2009, there were a total of 1,031,506 shares of common stock not subject to
outstanding options and available for issuance under the 2005 Option
Plan.
FASB ASC
718, “Compensation-Stock
Compensation”, requires companies to estimate the fair value of
share-based payment awards on the date of grant using an option-pricing
model. In 2009 and 2008, the fair value of each grant was estimated
using the Black-Scholes valuation model. Expected volatility was
based upon a weighted average of peer companies and the Company’s stock
volatility. The expected life was determined based upon an average of
the contractual life and vesting period of the options. The estimated
forfeiture rate was based upon an analysis of historical
data. The risk-free rate was based on U.S. Treasury zero coupon
bond yields for periods commensurate with the expected term at the time of
grant.
Compensation
expense, for awards with a service condition that cliff vest, is recognized on a
straight-line basis over the award’s requisite service
period. For those awards with a service condition that have a
graded vest, compensation expense is calculated using the graded-vesting
attribution method. This method entails recognizing expense on
a straight-line basis over the requisite service period for each separately
vesting portion as if the grant consisted of multiple awards, each with the same
service inception date but different requisite service periods. This
method accelerates the recognition of compensation expense.
The fair
value of market based, performance vesting share awards granted is calculated
using a Monte Carlo valuation model that simulates various potential outcomes of
the option grant and values each outcome using the Black-Scholes valuation model
which yields a fair market value of the Company's common stock on the date of
the grant (measurement date). This amount is recognized over the
vesting period, using the straight-line method. Since the award requires both
the completion of 4 years of service and the share price reaching predetermined
levels as defined in the option agreement, compensation cost will be recognized
over the 4 year explicit service period. If the employee terminates
prior to the four-year requisite service period, compensation cost will be
reversed even if the market condition has been satisfied by that time. The total
grant date fair value of the options granted during 2008 using the Monte Carlo
valuation model was $1,026.
98
Kenexa
Corporation and Subsidiaries
Notes
to Consolidated Financial Statements (Continued)
(All
amounts in thousands, except share and per share data, unless noted
otherwise)
12.
Stock Plans (continued)
The
following table provides the assumptions used in determining the fair value of
the market and service based awards for the year ended December 31, 2009, 2008
and 2007, respectively.
|
Years ended December 31,
|
||||||||||||||||
|
2009
|
2008
|
2008
|
2007
|
|||||||||||||
|
Service based
awards
|
Service based
awards
|
Market based
awards
|
Service based
awards
|
|||||||||||||
|
Expected
volatility
|
62.70 – 69.38 | % | 56.23 – 57.52 | % | 60.98 | % | 47.26 – 54.95 | % | ||||||||
|
Expected
dividends
|
0 | 0 | 0 | 0 | ||||||||||||
|
Expected
term (in years)
|
3 - 6.25 | 3.75 | 10 | 4 – 5 | ||||||||||||
|
Risk-free
rate
|
1.36 - 3.09 | % | 1.87 – 2.77 | % | 3.45 | % | 2.5 – 4.6 | % | ||||||||
A summary
of the status of the Company’s stock options as of December 31, 2009 and 2008
and changes during the period then ended is as follows:
|
Options & Restricted Stock Outstanding
|
Options Exercisable
|
|||||||||||||||||||
|
Shares available
for Grant
|
Shares
|
Wtd. Avg.
Exercise
Price
|
Shares
|
Wtd. Avg.
Exercise
Price
|
||||||||||||||||
|
Balance
at December 31, 2007
|
2,702,346 | 1,601,035 | $ | 21.18 | 241,335 | $ | 14.96 | |||||||||||||
|
Granted
– options
|
(1,084,600 | ) | 1,084,600 | 11.87 | — | — | ||||||||||||||
|
Exercised
options and vested restricted stock
|
— | (83,221 | ) | 4.41 | — | — | ||||||||||||||
|
Forfeited
or expired
|
114,760 | (114,760 | ) | 29.28 | — | — | ||||||||||||||
|
Balance
at December 31, 2008
|
1,732,506 | 2,487,654 | $ | 17.33 | 447,854 | $ | 14.01 | |||||||||||||
|
Granted
– options
|
(756,000 | ) | 756,000 | 6.12 | — | — | ||||||||||||||
|
Exercised
options
|
— | (14,747 | ) | 4.72 | — | — | ||||||||||||||
|
Forfeited
or expired
|
55,000 | (55,000 | ) | 22.76 | — | — | ||||||||||||||
|
Balance
at December 31, 2009
|
1,031,506 | 3,173,907 | $ | 14.63 | 696,407 | $ | 17.68 | |||||||||||||
The total
intrinsic value of options outstanding, exercisable and exercised as of and for
the period ended December 31, 2009 was $10,758, $750 and $116,
respectively. The weighted average fair value for options granted
during the period ended December 31, 2009, 2008 and 2007 was $3.50, $5.67 and
$14.91, respectively. The weighted-average remaining contractual term
of options outstanding and exercisable at December 31, 2009 was 5.53 and 2.97,
respectively.
Between
January 1, 2009 and December 31, 2009, the Company granted options to
certain employees to purchase an aggregate of 756,000 shares of the Company's
common stock at a weighted exercise price of $6.12 per share. The Company
granted the options at prevailing market prices ranging from $4.74 to $13.38 per
share.
Between
January 1, 2008 and December 31, 2008, the Company granted options to
certain employees to purchase an aggregate of 1,084,600 shares of the Company's
common stock at a weighted exercise price of $11.87 per share. The Company
granted the options at prevailing market prices ranging from $5.11 to $21.80 per
share.
Between
January 1, 2007 and December 31, 2007, the Company granted options to
certain employees to purchase an aggregate of 539,400 shares of the Company's
common stock at a weighted exercise price of $35.40 per share. The Company
granted the options at prevailing market prices ranging from $29.94 to $36.87
per share.
On August
14, 2007, the Company granted to each non-employee member of the Board of
Directors 2,700 shares of restricted stock, or, an aggregate of 16,200 shares of
restricted stock, which vested on May 19, 2008. The grant date fair
value of the restricted stock was $31.46.
99
Kenexa
Corporation and Subsidiaries
Notes
to Consolidated Financial Statements (Continued)
(All
amounts in thousands, except share and per share data, unless noted
otherwise)
12.
Stock Plans (continued)
The
following table summarizes information about stock options outstanding at
December 31, 2009:
|
Options Outstanding
|
Options Exercisable
|
|||||||||||||||||||
|
Range of Exercise Prices
|
Number
Outstanding
|
Weighted Average
Remaining
Contract Life
(Years)
|
Weighted
Average
Exercise
Price
|
Number
Exercisable
|
Weighted
Average
Exercise
Price
|
|||||||||||||||
|
$3.68
- $7.37
|
1,194,051 | 8.65 | $ | 4.91 | 81,051 | $ | 4.62 | |||||||||||||
|
$7.38
- $11.06
|
152,000 | 5.44 | $ | 9.38 | — | $ | — | |||||||||||||
|
$11.07
- $14.74
|
640,856 | 5.12 | $ | 12.51 | 197,856 | $ | 13.52 | |||||||||||||
|
$14.75
- $18.43
|
102,000 | 1.41 | $ | 17.51 | 102,000 | $ | 17.51 | |||||||||||||
|
$18.44
- $22.12
|
527,000 | 2.99 | $ | 19.27 | 201,500 | $ | 19.66 | |||||||||||||
|
$25.80
- $29.49
|
32,000 | 1.45 | $ | 27.25 | 32,000 | $ | 27.25 | |||||||||||||
|
$29.50
- $33.18
|
103,000 | 3.92 | $ | 31.99 | 82,000 | $ | 32.22 | |||||||||||||
|
$33.19
- $36.87
|
423,000 | 2.25 | $ | 35.50 | — | $ | — | |||||||||||||
|
$3.68
- $36.87
|
3,173,907 | 5.53 | $ | 14.63 | 696,407 | $ | 17.68 | |||||||||||||
As of
December 31, 2009, there was $3,941 of total unrecognized compensation cost
related to unvested share-based compensation arrangements granted under the 2005
Option Plan. That cost is expected to be recognized over a
weighted-average period of 1.47 years.
A summary
of the status of the Company’s unvested share options and restricted stock as of
December 31, 2009 and 2008 is presented below:
|
Unvested Shares
|
Shares
|
Wtd. Avg.
Grant Date
Fair Value
|
||||||
|
Unvested
at December 31, 2007
|
1,359,700 | $ | 10.73 | |||||
|
Granted
- options
|
1,084,600 | 5.67 | ||||||
|
Vested
|
(293,000 | ) | 8.98 | |||||
|
Forfeited
or expired
|
(111,500 | ) | 12.31 | |||||
|
Unvested
at December 31, 2008
|
2,039,800 | $ | 8.24 | |||||
|
Granted
- options
|
756,000 | 3.50 | ||||||
|
Vested
|
(279,000 | ) | 9.21 | |||||
|
Forfeited
or expired
|
(39,300 | ) | 11.11 | |||||
|
Unvested
at December 31, 2009
|
2,477,500 | $ | 6.34 | |||||
In
accordance with FASB ASC 718, “Compensation-Stock
Compensation,” excess tax benefits, associated with the expense
recognized for financial reporting purposes, realized upon the exercise of stock
options are presented as a financing cash inflow rather than as a reduction of
income taxes paid in our consolidated statement of cash flows. In
addition, the Company classifies share-based compensation within cost of
revenues, sales and marketing, general and administrative expenses and research
and development corresponding to the same line as the cash compensation paid to
respective employees, officers and non-employee directors.
100
Kenexa
Corporation and Subsidiaries
Notes
to Consolidated Financial Statements (Continued)
(All
amounts in thousands, except share and per share data, unless noted
otherwise)
12.
Stock Plans (continued)
The
following table shows total share-based compensation expense included in the
accompanying Consolidated Statement of Operations:
|
Year ended December 31,
|
||||||||||||
|
2009
|
2008
|
2007
|
||||||||||
|
Cost
of revenues
|
$ | 369 | $ | 341 | $ | 391 | ||||||
|
Sales
and marketing
|
1,092 | 961 | 1,006 | |||||||||
|
General
and administrative
|
3,456 | 4,032 | 2,204 | |||||||||
|
Research
and development
|
447 | 427 | 192 | |||||||||
|
Pre-tax
share-based compensation
|
$ | 5,364 | $ | 5,761 | $ | 3,793 | ||||||
|
Income
tax benefit
|
1,391 | 1,813 | 1,407 | |||||||||
|
Share-based
compensation expense, net
|
$ | 3,973 | $ | 3,948 | $ | 2,386 | ||||||
Employee
Stock Purchase Plan
The
Employee Stock Purchase Plan, which was approved in May 2006, enables
substantially all U.S. and foreign employees to purchase shares of our common
stock at a 5% discounted offering price off the closing market price of our
common stock on the Nasdaq National Market, LLC on the offering
date. We have granted rights to purchase up to 500,000 common shares
to our employees under the Plan. The Plan is not considered a compensatory plan
in accordance with FASB ASC 718 and requires no compensation expense to be
recognized. Shares of our common stock purchased under the employee
stock purchase plan were 42,212, 27,141 and 10,152 for the years ended December
31, 2009, 2008 and 2007, respectively.
13.
Related Party
In 2006,
the Company purchased certain intangibles and property, plant and equipment for
$300 from a software development consulting company previously managed by our
current Chief Knowledge Officer, James P. Restivo. The assets in
connection with the purchase were amortized and depreciated over a two year
period ending in 2008.
One of
the Company's directors, Barry M. Abelson, is a partner in the law firm of
Pepper Hamilton LLP. This firm has represented the Company since 1997. For the
years ended December 31, 2009, 2008 and 2007, the Company paid Pepper
Hamilton LLP net of insurance coverage $258, $389, and $1,477, respectively, for
general legal matters. The decrease in payments to Pepper Hamilton LLP for
the year ended December 31, 2009 as compared to previous years resulted from a
reduction in transactional and acquisitions related services performed during
the current year. For the year ended 2007, a majority of the payments
resulted from services performed in conjunction with our secondary offerings,
various acquisitions during 2007, credit facility arrangements and other
corporate matters. The amount payable to Pepper Hamilton as of December
31, 2009 and 2008 was $202 and $75, respectively.
101
Kenexa
Corporation and Subsidiaries
Notes
to Consolidated Financial Statements (Continued)
(All
amounts in thousands, except share and per share data, unless noted
otherwise)
14.
Geographic Information
The
following table summarizes the distribution of revenue by geographic region as
determined by billing address for the years ended December 31, 2009, 2008 and
2007.
|
For the year ended
December 31, 2009
|
For the year ended
December 31, 2008
|
For the year ended
December 31, 2007
|
||||||||||||||||||||||
|
Country
|
Revenue
|
Revenue as a
percentage of
total revenue
|
Revenue
|
Revenue as a
percentage of
total revenue
|
Revenue
|
Revenue as a
percentage of
total revenue
|
||||||||||||||||||
|
United
States
|
$ | 124,652 | 79.1 | % | $ | 149,225 | 73.6 | % | $ | 155,247 | 85.3 | % | ||||||||||||
|
United
Kingdom
|
11,156 | 7.1 | % | 17,729 | 8.7 | % | 10,741 | 5.9 | % | |||||||||||||||
|
Other
European Countries
|
7,818 | 4.9 | % | 11,660 | 5.5 | % | 5,389 | 3.0 | % | |||||||||||||||
|
Germany
|
4,073 | 2.6 | % | 9,765 | 4.8 | % | 2,832 | 1.5 | % | |||||||||||||||
|
The
Netherlands
|
1,755 | 1.1 | % | 3,196 | 1.6 | % | 2,706 | 1.5 | % | |||||||||||||||
|
Canada
|
2,808 | 1.8 | % | 5,539 | 2.7 | % | 2,526 | 1.4 | % | |||||||||||||||
|
Other
|
5,407 | 3.4 | % | 6,618 | 3.1 | % | 2,485 | 1.4 | % | |||||||||||||||
|
Total
|
$ | 157,669 | 100.0 | % | $ | 203,732 | 100.0 | % | $ | 181,926 | 100.0 | % | ||||||||||||
The
following table summarizes the distribution of assets by geographic region as of
December 31, 2009 and 2008.
|
December 31, 2009
|
December 31, 2008
|
|||||||||||||||
|
Country
|
Assets
|
Assets as a
percentage of total
assets
|
Assets
|
Assets as a
percentage of total
assets
|
||||||||||||
|
United
States
|
$ | 161,351 | 79.7 | % | $ | 146,850 | 67.2 | % | ||||||||
|
United
Kingdom
|
14,125 | 7.0 | % | 43,634 | 20.0 | % | ||||||||||
|
India
|
9,943 | 4.9 | % | 9,099 | 4.2 | % | ||||||||||
|
Germany
|
4,381 | 2.2 | % | 9,976 | 4.6 | % | ||||||||||
|
Ireland
|
4,182 | 2.1 | % | 1,133 | 0.5 | % | ||||||||||
|
China
|
2,962 | 1.5 | % | % | ||||||||||||
|
Canada
|
2,574 | 1.3 | % | 3,332 | 1.5 | % | ||||||||||
|
Other
|
2,825 | 1.3 | % | 4,441 | 2.0 | % | ||||||||||
|
Total
|
$ | 202,343 | 100.0 | % | $ | 218,465 | 100.0 | % | ||||||||
102
ITEM
9. Changes in and Disagreements with Accountants on Accounting and Financial
Disclosure
Not
Applicable
ITEM
9A. Controls and Procedures
Under the
supervision and with the participation of our management, including our
principal executive officer and principal financial officer, we conducted an
evaluation of the effectiveness of the design and operation of our disclosure
controls and procedures, as defined in Rules 13a-15(e) and 15d-15(e) under the
Securities Exchange Act of 1934 as of the end of the period covered by this
report, or the Evaluation Date. Based upon the evaluation, our
principal executive officer and principal financial officer concluded that our
disclosure controls and procedures were effective as of the Evaluation
Date. Disclosure controls and procedures are controls and procedures
designed to reasonably ensure that information required to be disclosed in our
reports filed under the Exchange Act, such as this report, is recorded,
processed, summarized and reported within the time periods specified in the
SEC's rules and forms. Disclosure controls and procedures include
controls and procedures designed to reasonably ensure that such information is
accumulated and communicated to our management, including our chief executive
officer and chief financial officer, as appropriate to allow timely decisions
regarding required disclosure.
Internal
Control over Financial Reporting
(a)
Management’s
Annual Report on Internal Control over Financial Reporting
Our
management is responsible for establishing and maintaining adequate internal
control over financial reporting to provide reasonable assurance regarding the
reliability of our financial reporting and the preparation of financial
statements for external purposes in accordance with generally accepted
accounting principles. Internal control over financial reporting
includes those policies and procedures that (i) pertain to the maintenance of
records that in reasonable detail accurately and fairly reflect the transactions
and dispositions of our assets, (ii) provide reasonable assurance that
transactions are recorded as necessary to permit preparation of financial
statements in accordance with generally accepted accounting principles, and that
our receipts and expenditures are being made only in accordance with
authorizations of our management and directors, and (iii) provide reasonable
assurance regarding prevention or timely detection of unauthorized acquisition,
use or disposition of our assets that could have a material effect on the
financial statements.
Management
assessed our internal control over financial reporting as of December 31, 2009,
the end of our fiscal year. Management based its assessment on
criteria established in Internal Control—Integrated Framework issued by the
Committee of Sponsoring Organizations of the Treadway
Commission. Management’s assessment included evaluation of such
elements as the design and operating effectiveness of key financial reporting
controls, process documentation, accounting policies, and our overall control
environment.
Based on
its assessment, management has concluded that our internal control over
financial reporting was effective as of the end of the fiscal year to provide
reasonable assurance regarding the reliability of financial reporting and the
preparation of financial statements for external reporting purposes in
accordance with generally accepted accounting principles. The results
of management’s assessment were reviewed with the Audit Committee of the Board
of Directors.
Grant
Thornton, LLP independently assessed the effectiveness of our internal control
over financial reporting and has issued its opinion, which is included
below.
(b) Report
of Independent Registered Public Accounting Firm
103
Report
of Independent Registered Public Accounting Firm
On
Internal Control over Financial Reporting
Board of
Directors and Shareholders
Kenexa
Corporation
We have
audited Kenexa Corporation and Subsidiaries’ (collectively, Kenexa Corporation)
(a Pennsylvania corporation) internal control over financial reporting as of
December 31, 2009, based on criteria established in Internal Control—Integrated
Framework issued by the Committee of Sponsoring Organizations of the
Treadway Commission (COSO). Kenexa Corporation’s management is responsible for
maintaining effective internal control over financial reporting and for its
assessment of the effectiveness of internal control over financial reporting,
included in the accompanying Management’s Report on Internal Control over
Financial Reporting. Our responsibility is to express an opinion on
Kenexa Corporation’s internal control over financial reporting based on our
audit.
We
conducted our audit in accordance with the standards of the Public Company
Accounting Oversight Board (United States). Those standards require that we plan
and perform the audit to obtain reasonable assurance about whether effective
internal control over financial reporting was maintained in all material
respects. Our audit included obtaining an understanding of internal control over
financial reporting, assessing the risk that a material weakness exists, testing
and evaluating the design and operating effectiveness of internal control based
on the assessed risk, and performing such other procedures as we considered
necessary in the circumstances. We believe that our audit provides a reasonable
basis for our opinion.
A
company’s internal control over financial reporting is a process designed to
provide reasonable assurance regarding the reliability of financial reporting
and the preparation of financial statements for external purposes in accordance
with generally accepted accounting principles. A company’s internal control over
financial reporting includes those policies and procedures that (1) pertain to
the maintenance of records that, in reasonable detail, accurately and fairly
reflect the transactions and dispositions of the assets of the company; (2)
provide reasonable assurance that transactions are recorded as necessary to
permit preparation of financial statements in accordance with generally accepted
accounting principles, and that receipts and expenditures of the company are
being made only in accordance with authorizations of management and directors of
the company; and (3) provide reasonable assurance regarding prevention or timely
detection of unauthorized acquisition, use, or disposition of the company’s
assets that could have a material effect on the financial
statements.
Because
of its inherent limitations, internal control over financial reporting may not
prevent or detect misstatements. Also, projections of any evaluation of
effectiveness to future periods are subject to the risk that controls may become
inadequate because of changes in conditions, or that the degree of compliance
with the policies or procedures may deteriorate. In our opinion,
Kenexa Corporation maintained, in all material respects, effective internal
control over financial reporting as of December 31, 2009, based on criteria
established in Internal
Control—Integrated Framework issued by COSO.
We also
have audited, in accordance with the standards of the Public Company Accounting
Oversight Board (United States), the consolidated balance sheets of Kenexa
Corporation and Subsidiaries, as of December 31, 2009 and 2008 and the related
consolidated statements of operations, shareholders’ equity, comprehensive
income (loss) and cash flows for each of the three years in the
period ended December 31, 2009 and our report dated
March 9, 2010 expressed an unqualified opinion.
/s/ Grant
Thornton LLP
Philadelphia,
Pennsylvania
March 9,
2010
104
(c) Change
in Internal Control over Financial Reporting
There have been no changes in internal
control over financial reporting identified in connection with management’s
evaluation that occurred during the last fiscal quarter ended December 31, 2009,
that have materially affected, or are reasonably likely to materially affect,
our internal control over financial reporting.
ITEM
9B. Other Information
Not
Applicable
105
PART
III
ITEM
10. Directors, Executive Officers and Corporate Governance
We
incorporate by reference the information contained under the captions “Board of
Directors”, “Structure and Practices of the Board of Directors”,
“Section 16(a) Beneficial Ownership Reporting Compliance” and “Executive
Compensation and Executive Officers” in our Definitive Proxy Statement for our
2010 annual meeting of shareholders, to be filed within 120 days after the
end of the year covered by this Report pursuant to Regulation 14A under the
Securities Exchange Act of 1934, as amended (the “2010 Proxy
Statement”).
We have
adopted a written code of business conduct and ethics, known as our Corporate
Code of Conduct, which applies to all of our directors, officers and employees,
including our principal executive officer and our principal financial and
accounting officer. Our Corporate Code of Conduct is available on our Internet
website, www.kenexa.com. Any amendments to our Corporate Code of Conduct or
waivers from the provisions of the Corporate Code of Conduct for our principal
executive officer and our principal financial and accounting officer will be
disclosed on our Internet website within four business days following the date
of such amendment or waiver.
ITEM 11. Executive
Compensation
We
incorporate by reference the information contained under the captions “Executive
Compensation and Executive Officers”, “Compensation Committee Report” and
“Structure and Practices of the Board of Directors” in our 2010 Proxy
Statement.
ITEM 12. Security Ownership of
Certain Beneficial Owners and Management and Related Stockholder
Matters
We
incorporate by reference the information contained under the caption “Security
Ownership of Certain Beneficial Owners and Management” in our 2010 Proxy
Statement.
Equity
Compensation Plan Information as of December 31, 2009.
The
following table sets forth, as of December 31, 2009, information concerning
equity compensation plans under which our securities are authorized for
issuance. The table does not reflect grants, awards, exercises,
terminations or expirations since that date. The following table
excludes 500,000 shares of our common stock which was issued or is available for
issuance pursuant to our 2006 Employee Stock Purchase Plan, which was approved
by our shareholders in May 2006. As of December 31, 2009, there were
420,495 shares available for issuance pursuant to our 2006 Employee Stock
Purchase Plan. All share amounts and exercise prices have been
adjusted to reflect stock splits that occurred after the date on which any
particular underlying plan was adopted to the extent applicable. All
of the equity compensation plans pursuant to which we are currently granting
equity awards have been approved by our shareholders.
|
Plan Category
|
Number of
securities to be
issued upon
exercise of
outstanding options
|
Weighted-average
exercise price of
outstanding options
|
Number of securities
remaining available for
future issuance under
equity compensation
plans (1)
|
||||
|
Equity Compensation
Plans approved by shareholders
|
2,988,500
|
14.91
|
1,031,506
|
||||
|
Equity
Compensation Plans not approved by shareholders
|
185,407
|
10.07
|
|||||
(1)
Excludes
number of securities to be issued upon exercise of outstanding
options.
For a
description of the material features of our equity compensation plans, see Note
11 to our consolidated financial statements.
106
ITEM 13. Certain Relationships,
Related Transactions and Director Independence
We
incorporate by reference the information contained under the caption “Certain
Relationships and Related Party Transactions” and “Structure and Practices of
the Board of Directors” in our 2010 Proxy Statement.
ITEM 14. Principal Accountant Fees
and Services
We
incorporate by reference the information contained under the caption Proposal
No. 2 “Ratification of Selection of Independent Registered Public Accounting
Firm” in our 2010 Proxy Statement.
107
PART
IV
|
(a)
|
Documents
filed as part of this report:
|
1. Financial
Statements. The financial statements as set forth under Item 8 of this Annual
Report on Form 10-K are incorporated herein.
2. Financial
Statement Schedules. All financial statement schedules have been omitted because
they are not applicable, not required, or the information is shown in the
financial statements or related notes.
3. Exhibits.
See (b) below.
|
(b)
|
Exhibits:
|
|
Exhibit
Number
|
Description of Document
|
|
|
2.1
|
Agreement
and Plan of Merger, dated as of December 21, 2005, among Kenexa
Corporation, Kenexa Technology, Inc., Kenexa Acquisition Corp., Webhire,
Inc., and Gazaway L. Crittenden, solely as the representative of the
Equityholders (incorporated by reference to Exhibit 2.1 filed with the
Company’s Current Report on Form 8-K dated December 22,
2005)
|
|
|
2.2
|
Equity
Purchase Agreement and Agreement and Plan of Merger, dated as of October
5, 2006, among Kenexa Corporation, Kenexa Technology, Inc., Birmingham
Acquisition Corp., BrassRing LLC, BrassRing Inc., Gannett Satellite
Information Network, Inc., BRLLC Holdings Inc., Tribune National Marketing
Company, Accel VI L.P., Accel Internet Fund II, L.P., Accel Keiretsu VI
L.P., Accel Investors ‘98 L.P., Accel VI-S L.P., Accel Investors ‘98-S
L.P., James W. Breyer, and Gerald M. Rosberg solely as the representative
of the stockholders of BRINC and the selling members of BRLLC
(incorporated by reference to Exhibit 2.1 filed with the Company’s Current
Report on Form 8-K dated October 6, 2006)
|
|
|
3.1
|
Amended
and Restated Articles of Incorporation of Kenexa Corporation (incorporated
by reference to Exhibit 3.1 filed with the Company’s Quarterly Report on
Form 10-Q dated November 9, 2007)
|
|
|
3.2
|
Amended
and Restated Bylaws of Kenexa Corporation (incorporated by reference to
Exhibit 3.2 filed with the Company’s Quarterly Report on Form 10-Q dated
November 9, 2007)
|
|
|
4.1
|
Form
of Specimen Common Stock Certificate of Kenexa Corporation (incorporated
by reference to Exhibit 4.1 filed with Amendment No. 4 to the Company’s
Registration Statement on Form S-1 dated June 20, 2005, Registration No.
333-124028)
|
|
|
10.1*
|
Kenexa
Corporation 2000 Stock Option Plan (incorporated by reference to Exhibit
10.1 filed with the Company’s Registration Statement on Form S-1 dated
April 12, 2005, Registration No. 333-124028)
|
|
|
10.2*
|
Form
of Non-Qualified Stock Option Agreement under the Kenexa Corporation 2000
Stock Option Plan (incorporated by reference to Exhibit 10.2 filed with
the Company’s Registration Statement on Form S-1 dated April 12, 2005,
Registration No. 333-124028)
|
|
|
10.3*
|
Kenexa
Corporation 2005 Equity Incentive Plan (incorporated by reference to
Exhibit 10.3 filed with the Company’s Registration Statement on Form S-1
dated April 12, 2005, Registration No. 333-124028)
|
|
|
10.4*
|
Form
of Non-Qualified Stock Option Award Agreement under the 2005 Equity
Incentive Plan (Director) (incorporated by reference to Exhibit 10.4 filed
with the Company’s Registration Statement on Form S-1 dated April 12,
2005, Registration No. 333-124028)
|
|
|
10.5*
|
Form
of Non-Qualified Stock Option Award Agreement under the 2005 Equity
Incentive Plan (Employee) (incorporated by reference to Exhibit 10.5 filed
with the Company’s Registration Statement on Form S-1 dated April 12,
2005, Registration No. 333-124028)
|
|
|
10.6*
|
Kenexa
Corporation Amended and Restated 2006 Employee Stock Purchase Plan
(incorporated by reference to Exhibit 10.1 filed with the Company’s
Current Report on Form 8-K dated October 20, 2006)
|
|
|
10.7
|
Agreement
of Lease between Liberty Property Limited Partnership and Raymond Karsan
Associates dated July 1, 1996 (incorporated by reference to Exhibit 10.10
filed with the Company’s Registration Statement on Form S-1 dated April
12, 2005, Registration No. 333-124028)
|
|
|
10.8
|
First
Amendment to Agreement of Lease dated August 14, 2002 between Liberty
Property Limited Partnership and Kenexa Corporation (incorporated by
reference to Exhibit 10.11 filed with the Company’s Registration Statement
on Form S-1 dated April 12, 2005, Registration No.
333-124028)
|
|
|
10.9
|
Second
Amendment to Agreement of Lease dated November 8, 2002 between Liberty
Property Limited Partnership and Kenexa Corporation (incorporated by
reference to Exhibit 10.12 filed with the Company’s Registration Statement
on Form S-1 dated April 12, 2005, Registration No.
333-124028)
|
|
|
10.10*
|
Form
of Indemnification Agreements between Kenexa Corporation and each of its
directors and certain officers (incorporated by reference to Exhibit 10.23
filed with the Company’s Registration Statement on Form S-1 dated April
12, 2005, Registration No. 333-124028)
|
|
|
10.11*
|
Form of
Restricted Stock Award Agreement under the 2005 Equity Incentive Plan
(Non-Employee Director) (incorporated by reference to Exhibit 10.1 filed
with the Company’s Current Report on Form 8-K dated August 14,
2007.)
|
|
|
21.1
|
Subsidiaries
of Kenexa Corporation
|
|
|
23.1
|
Consent
of Grant Thornton LLP
|
|
|
31.1
|
Certification
by Chief Executive Officer Pursuant to Rule
13a-14(a)/15d-14(a)
|
|
|
31.2
|
Certification
by Chief Financial Officer Pursuant to Rule
13a-14(a)/15d-14(a)
|
|
|
32.1
|
Certification
Furnished Pursuant to 18 U.S.C. Section 1350 as Adopted Pursuant to
Section 906 of the Sarbanes-Oxley Act of
2002
|
|
*
|
Management
contracts and compensatory plans and arrangements required to be filed as
exhibits pursuant to Item 15(a)(3) of this Annual Report on Form
10-K.
|
|
(c)
|
None.
|
108
SIGNATURES
Pursuant
to the requirements of the Securities Exchange Act of 1934, the registrant has
duly caused this report to be signed on its behalf by the undersigned, thereunto
duly authorized, on March 9, 2010.
Kenexa
Corporation
|
/s/
Nooruddin S. Karsan
|
||
|
Nooruddin
S. Karsan
|
||
|
Chairman
of the Board and Chief Executive Officer (Principal Executive
Officer)
|
||
|
/s/
Donald F. Volk
|
||
|
Donald
F. Volk
|
||
|
Chief
Financial Officer (Principal Financial and Accounting
Officer)
|
||
Pursuant
to the requirements of the Securities Exchange Act of 1934, as amended, this
report has been signed by the following persons on March 9, 2010 in the
capacities indicated:
|
Signature
|
Title
|
|
|
/s/
Nooruddin S. Karsan
Nooruddin
S. Karsan
|
Chairman
of the Board and Chief Executive Officer and
Director
(Principal Executive Officer)
|
|
|
/s/
Donald F. Volk
Donald
F. Volk
|
Chief
Financial Officer (Principal Financial and
Accounting
Officer)
|
|
|
/s/
Troy A. Kanter
Troy
A. Kanter
|
President,
Chief Operating Officer and Director
|
|
|
/s/
Barry M. Abelson
Barry
M. Abelson
|
Director
|
|
|
/s/
Renee B. Booth
Renee
B. Booth
|
Director
|
|
|
/s/
Joseph A. Konen
Joseph
A. Konen
|
Director
|
|
|
/s/
John A. Nies
John
A. Nies
|
Director
|
|
|
/s/
Richard J. Pinola
Richard
J. Pinola
|
Director
|
|
|
/s/
Rebecca Maddox
Rebecca
Maddox
|
Director
|
109
|
Exhibit
Number
|
Description of Document
|
|
|
2.1
|
Agreement
and Plan of Merger, dated as of December 21, 2005, among Kenexa
Corporation, Kenexa Technology, Inc., Kenexa Acquisition Corp., Webhire,
Inc., and Gazaway L. Crittenden, solely as the representative of the
Equityholders (incorporated by reference to Exhibit 2.1 filed with the
Company’s Current Report on Form 8-K dated December 22,
2005)
|
|
|
2.2
|
Equity
Purchase Agreement and Agreement and Plan of Merger, dated as of October
5, 2006, among Kenexa Corporation, Kenexa Technology, Inc., Birmingham
Acquisition Corp., BrassRing LLC, BrassRing Inc., Gannett Satellite
Information Network, Inc., BRLLC Holdings Inc., Tribune National Marketing
Company, Accel VI L.P., Accel Internet Fund II, L.P., Accel Keiretsu VI
L.P., Accel Investors ‘98 L.P., Accel VI-S L.P., Accel Investors ‘98-S
L.P., James W. Breyer, and Gerald M. Rosberg solely as the representative
of the stockholders of BRINC and the selling members of BRLLC
(incorporated by reference to Exhibit 2.1 filed with the Company’s Current
Report on Form 8-K dated October 6, 2006)
|
|
|
3.1
|
Amended
and Restated Articles of Incorporation of Kenexa Corporation (incorporated
by reference to Exhibit 3.1 filed with the Company’s Quarterly Report on
Form 10-Q dated November 9, 2007)
|
|
|
3.2
|
Amended
and Restated Bylaws of Kenexa Corporation (incorporated by reference to
Exhibit 3.2 filed with the Company’s Quarterly Report on Form 10-Q dated
November 9, 2007)
|
|
|
4.1
|
Form
of Specimen Common Stock Certificate of Kenexa Corporation (incorporated
by reference to Exhibit 4.1 filed with Amendment No. 4 to the Company’s
Registration Statement on Form S-1 dated June 20, 2005, Registration No.
333-124028)
|
|
|
10.1*
|
Kenexa
Corporation 2000 Stock Option Plan (incorporated by reference to Exhibit
10.1 filed with the Company’s Registration Statement on Form S-1 dated
April 12, 2005, Registration No. 333-124028)
|
|
|
10.2*
|
Form
of Non-Qualified Stock Option Agreement under the Kenexa Corporation 2000
Stock Option Plan (incorporated by reference to Exhibit 10.2 filed with
the Company’s Registration Statement on Form S-1 dated April 12, 2005,
Registration No. 333-124028)
|
|
|
10.3*
|
Kenexa
Corporation 2005 Equity Incentive Plan (incorporated by reference to
Exhibit 10.3 filed with the Company’s Registration Statement on Form S-1
dated April 12, 2005, Registration No. 333-124028)
|
|
|
10.4*
|
Form
of Non-Qualified Stock Option Award Agreement under the 2005 Equity
Incentive Plan (Director) (incorporated by reference to Exhibit 10.4 filed
with the Company’s Registration Statement on Form S-1 dated April 12,
2005, Registration No. 333-124028)
|
|
|
10.5*
|
Form
of Non-Qualified Stock Option Award Agreement under the 2005 Equity
Incentive Plan (Employee) (incorporated by reference to Exhibit 10.5 filed
with the Company’s Registration Statement on Form S-1 dated April 12,
2005, Registration No. 333-124028)
|
|
|
10.6*
|
Kenexa
Corporation Amended and Restated 2006 Employee Stock Purchase Plan
(incorporated by reference to Exhibit 10.1 filed with the Company’s
Current Report on Form 8-K dated October 20, 2006)
|
|
|
10.7
|
Agreement
of Lease between Liberty Property Limited Partnership and Raymond Karsan
Associates dated July 1, 1996 (incorporated by reference to Exhibit 10.10
filed with the Company’s Registration Statement on Form S-1 dated April
12, 2005, Registration No. 333-124028)
|
|
|
10.8
|
First
Amendment to Agreement of Lease dated August 14, 2002 between Liberty
Property Limited Partnership and Kenexa Corporation (incorporated by
reference to Exhibit 10.11 filed with the Company’s Registration Statement
on Form S-1 dated April 12, 2005, Registration No.
333-124028)
|
|
|
10.9
|
Second
Amendment to Agreement of Lease dated November 8, 2002 between Liberty
Property Limited Partnership and Kenexa Corporation (incorporated by
reference to Exhibit 10.12 filed with the Company’s Registration Statement
on Form S-1 dated April 12, 2005, Registration No.
333-124028)
|
|
|
10.10
|
Form
of Indemnification Agreements between Kenexa Corporation and each of its
directors and certain officers (incorporated by reference to Exhibit 10.23
filed with the Company’s Registration Statement on Form S-1 dated April
12, 2005, Registration No. 333-124028)
|
|
|
10.11*
|
Form of
Restricted Stock Award Agreement under the 2005 Equity Incentive Plan
(Non-Employee Director) (incorporated by reference to Exhibit 10.1 filed
with the Company’s Current Report on Form 8-K dated August 14,
2007.)
|
|
|
21.1
|
Subsidiaries
of Kenexa Corporation
|
|
|
23.1
|
Consent
of Grant Thornton LLP
|
|
|
31.1
|
Certification
by Chief Executive Officer Pursuant to Rule
13a-14(a)/15d-14(a)
|
|
|
31.2
|
Certification
by Chief Financial Officer Pursuant to Rule
13a-14(a)/15d-14(a)
|
|
|
32.1
|
Certification
Furnished Pursuant to 18 U.S.C. Section 1350 as Adopted Pursuant to
Section 906 of the Sarbanes-Oxley Act of
2002
|
* Management
contracts and compensatory plans and arrangements required to be filed as
exhibits pursuant to Item 15(a)(3) of this Annual Report on Form
10-K.
110