Attached files
Table of Contents
UNITED STATES
SECURITIES AND EXCHANGE COMMISSION
Washington, D.C. 20549
FORM 10-K
(Mark One)
| x | ANNUAL REPORT PURSUANT TO SECTION 13 OR 15(d) OF THE SECURITIES EXCHANGE ACT OF 1934 |
For the fiscal year ended December 31, 2009
OR
| ¨ | TRANSITION REPORT PURSUANT TO SECTION 13 OR 15(d) OF THE SECURITIES EXCHANGE ACT OF 1934 |
For the transition period from to
Commission File Number: 001-33448
JMP Group Inc.
(Exact name of registrant as specified in its charter)
| Delaware | 20-1450327 | |
| (State or other jurisdiction of incorporation or organization) |
(I.R.S. Employer Identification No.) |
600 Montgomery Street, Suite 1100, San Francisco, California 94111
(Address of principal executive offices)
Registrant’s telephone number: (415) 835-8900
Securities registered pursuant to Section 12(b) of the Act:
| (Title of Each Class) |
(Name of Each Exchange on Which Registered) | |
| Common Stock, par value $0.001 per share | New York Stock Exchange |
Securities registered pursuant to Section 12(g) of the Act:
None
Indicate by check mark if the registrant is a well-known seasoned issuer, as defined in Rule 405 of the Securities Act. Yes ¨ No x
Indicate by check mark if the registrant is not required to file reports pursuant to Section 13 or 15(d) of the Act. Yes ¨ No x
Indicate by check mark whether the registrant (1) has filed all reports required to be filed by Section 13 or 15(d) of the Securities Exchange Act of 1934 during the preceding 12 months (or for such shorter period that the registrant was required to file such reports), and (2) has been subject to such filing requirements for the past 90 days. Yes x No ¨
Indicate by check mark whether the registrant has submitted electronically and posted on its corporate Web site, if any, every Interactive Data File required to be submitted and posted pursuant to Rule 405 of Regulation S-T during the preceding 12 months (or for such shorter period that the registrant was required to submit and post such files). Yes ¨ No ¨
Indicate by check mark if disclosure of delinquent filers pursuant to Item 405 of Regulation S-K is not contained herein, and will not be contained, to the best of registrant’s knowledge, in definitive proxy or information statements incorporated by reference in Part III of this Form 10-K or any amendment to this Form 10-K. ¨
Indicate by check mark whether the registrant is a large accelerated filer, an accelerated filer, a non-accelerated filer, or a smaller reporting company. See the definitions of “large accelerated filer,” “accelerated filer,” and “smaller reporting company” in Rule 12b-2 of the Exchange Act.
Large Accelerated Filer ¨ Accelerated Filer x Non-Accelerated Filer ¨ Smaller Reporting Company ¨
Indicate by check mark whether the registrant is a shell company (as defined in Rule 12b-2 of the Act). Yes ¨ No x
The aggregate market value of the common stock held by non-affiliates of the registrant on the last business day of the registrant’s most recently completed second fiscal quarter, based upon the closing sale price of the registrant’s common stock on June 30, 2009 as reported on The New York Stock Exchange was $122,255,605.
As of February 26, 2010 there were 21,670,457 shares of the registrant’s common stock outstanding.
Documents incorporated by reference:
Portions of the registrant’s definitive proxy statement to be delivered to stockholders in connection with the 2010 annual meeting of stockholders to be held in June 2010 are incorporated by reference in this Form 10-K.
Table of Contents
| PART I |
||||
| Item 1. |
6 | |||
| Item 1A. |
15 | |||
| Item 1B. |
40 | |||
| Item 2. |
40 | |||
| Item 3. |
40 | |||
| Item 4. |
40 | |||
| PART II |
||||
| Item 5. |
Market for Registrant’s Common Equity, Related Stockholder Matters and Issuer Purchases of Equity Securities | 41 | ||
| Item 6. |
43 | |||
| Item 7. |
Management’s Discussion and Analysis of Financial Condition and Results of Operations | 46 | ||
| Item 7A. |
84 | |||
| Item 8. |
86 | |||
| Item 9. |
Changes in and Disagreements With Accountants on Accounting and Financial Disclosure | 135 | ||
| Item 9A. |
135 | |||
| Item 9B. |
135 | |||
| PART III |
||||
| Item 10. |
136 | |||
| Item 11. |
136 | |||
| Item 12. |
Security Ownership of Certain Beneficial Owners and Management and Related Stockholder Matters | 136 | ||
| Item 13. |
Certain Relationships and Related Transactions, and Director Independence |
136 | ||
| Item 14. |
136 | |||
| PART IV |
||||
| Item 15. |
137 | |||
| 138 | ||||
| 139 | ||||
| EX-31.1: CERTIFICATION |
||||
| EX-31.2: CERTIFICATION |
||||
| EX-32.1: CERTIFICATION |
||||
| EX-32.2: CERTIFICATION |
||||
2
Table of Contents
SPECIAL NOTE REGARDING FORWARD-LOOKING STATEMENTS
We make forward-looking statements, as defined by the “safe harbor” provisions of the Private Securities Litigation Reform Act of 1995, in this Form 10-K that are subject to risks and uncertainties. When we use the words “will likely result,” “if,” “in the event,” “may,” “shall,” “will,” “believe,” “expect,” “anticipate,” “project,” “intend,” “estimate,” “goal,” “objective,” or similar expressions, we intend to identify forward-looking statements. These forward-looking statements include information about possible or assumed future results of our business, financial condition, liquidity, results of operations, plans and objectives. They also include statements concerning anticipated revenues, income or loss, capital expenditures, dividends, capital structure or other financial terms. The statements we make regarding the following subject matters are forward-looking by their nature:
| • | the opportunity to grow our investment banking and sales and trading businesses because of the prevalent demand for our services in our six target industries; |
| • | the opportunity to increase our representation of corporate clients as buyers and to grow our mergers and acquisitions and strategic advisory businesses; |
| • | our ability to utilize our expertise to gain new business and benefit from increased trading in the financial services and real estate industries; |
| • | the performance of our investment banking and sales and trading businesses because of declining demand for our services or a decline in the market for securities of companies in our six target industries; |
| • | the possibility of generating stable or growing investment banking revenues due to our ability to engage in multiple types of transactions; |
| • | the growth of our mergers and acquisitions and other strategic advisory business derived from our positions as a lead manager or senior co-manager of public and private securities offerings; |
| • | our plans to continue to provide our equity research and sales and trading products and services to smaller-capitalization companies to benefit institutional investors; |
| • | the characteristics of the asset management business, including its comparatively high margins, the recurring nature of its fee-based revenues, and its dependence on intellectual capital and our belief that this makes the asset management business less susceptible to competitive threats from larger financial institutions; |
| • | the ongoing emergence of small asset managers and institutional investment managers that rely on outside sources to provide equity research; |
| • | a heightened demand for alternative asset management products and services; |
| • | our ability to increase the number of companies under coverage by our equity research analysts; |
| • | our ability to increase assets under management and develop new asset management products; |
| • | our plans to launch additional hedge fund products, alternative and other asset management collective investment vehicles and structured finance products; |
| • | our plans to generate principal investing opportunities from our investment banking and asset management relationships; |
| • | our ability to attract, incentivize and retain top professionals and to retain valuable relationships with our clients; |
| • | plans to grow our businesses both through internal expansion and through strategic investments, acquisitions, or joint ventures; |
3
Table of Contents
| • | our expectations regarding the impact of the trend toward alternative trading systems and downward pricing pressure in the sales and trading business on trading commissions and spreads; |
| • | the nature of the competition faced in the investment banking and financial services industries and our expectations regarding trends and changes with respect to competing entities; |
| • | our belief that continued future growth will require implementation of enhanced communications and information systems and the training of personnel or the hiring of an outsourced provider to operate such systems; |
| • | the impact of changes in interest rates on the value of interest-bearing assets in which we invest; |
| • | our plans for the use of the principal restricted cash at JMP Credit to buy additional loans or pay down CLO notes; |
| • | that the past performance of our funds are not indicative of our future performance; |
| • | the emergence of investment opportunities that offer attractive risk-adjustment returns on our investable assets; |
| • | our ability to take advantage of market opportunities as they arise in 2010 based on the strength of our capital position and the low level of leverage that we have traditionally employed in our business model; |
| • | our ability to satisfy our funding needs with existing internal and external financial sources; |
| • | the ability of our funds to raise capital in the long and short term; |
| • | our ability to depend on follow-on offerings, PIPEs and registered direct offerings to generate corporate finance revenues; |
| • | our ability to avoid restrictions imposed by the Investment Company Act of 1940; |
| • | that we do not anticipate any tax adjustments that will result in a material adverse affect on the our financial condition; |
| • | the impact of Securities and Exchange Commission rules enacted as of September 18, 2008 restricting management’s ability to conduct short sales; |
| • | the impact of additional rulemaking by the Securities and Exchange Commission with respect to soft dollar practices on our brokerage or asset management business; |
| • | our expectations regarding the likelihood of increased scrutiny of financial services firms from regulators; |
| • | the impact of recent pronouncements by the Financial Accounting Standards Board on our financial position or operations; |
| • | the impact of existing claims and currently known threats against us on our business or financial condition; |
| • | our intention to declare dividends, our ability to do so without borrowing funds and our expected dividend rate; and |
| • | that we believe that our available liquidity and current level of equity capital will be adequate to meet our liquidity and regulatory capital requirements for the next twelve months. |
The forward-looking statements are based on our beliefs, assumptions and expectations of future performance, taking into account the information currently available to us. These forward-looking statements may include projections of our future financial performance based on our growth strategies and anticipated trends in our business. These statements are only predictions based upon our current expectations and projections about future events. There are important factors that could cause our actual results, level of activity, performance or
4
Table of Contents
achievements to differ materially from the results, level of activity, performance or achievements expressed or implied by the forward-looking statements. In particular, you should consider the numerous risks provided under Item 1A—“Risk Factors” in this Form 10-K. These risks are not exhaustive. Other sections of this Form 10-K may include additional factors which could adversely impact our business and financial performance. Moreover, we operate in a very competitive and rapidly changing environment. New risk factors emerge from time to time and it is not possible for us to predict all risk factors, nor can we assess the impact of all factors or the effect which any factor, or combination of factors, may have on our business. Actual results may differ materially from those contained in any forward-looking statements.
Although we believe the expectations reflected in the forward-looking statements are reasonable, we cannot guarantee future results, levels of activity, performance or achievements. You should not rely upon forward-looking statements as predictions of future events. We undertake no duty to update any of these forward-looking statements after the date of this Form 10-K to conform prior statements to actual results or revised expectations unless otherwise required by law.
5
Table of Contents
| Item 1. | Business |
Overview
We are a full-service investment banking, asset management and corporate credit management firm. We provide investment banking, sales and trading, and equity research services to corporate and institutional clients, and alternative asset management products and services to institutional investors and high net-worth individuals and management of collateralized loan obligations.
We focus our efforts on small and middle-market companies in the following six growth industries: business services, consumer, financial services, healthcare, real estate, and technology. Our specialization in these areas has enabled us to develop recognized expertise and to cultivate extensive industry relationships. As a result, we have established our firm as a key advisor for our corporate clients, a trusted resource for institutional investors, and an effective investment manager for our asset management clients. We currently serve clients nationwide from our headquarters in San Francisco and from additional offices in New York, Boston, Chicago and Atlanta.
We provide our corporate clients with a wide variety of services, including strategic advice and capital raising solutions, sales and trading support, and equity research coverage. We provide institutional investors with capital markets intelligence and objective, informed investment recommendations about individual equities that are not widely followed. We believe that our concentration on small and middle-market companies, as well as our broad range of product offerings, positions us as a leader in what has traditionally been an underserved and high-growth market.
The selection of our six target industries, the development of multiple products and services and the establishment of our three revenue-producing business lines—investment banking, equity sales and trading, and asset management—has created a diversified business model, especially when compared to that of our more specialized competitors. We have been able to balance more volatile revenue streams derived from our investment banking business and our incentive-based asset management fees with the more stable revenue streams tied to sales and trading commissions and base asset management fees. In addition, our target industries have historically performed, in certain respects, counter-cyclically to one another, allowing us to win business and generate revenues in various economic and capital markets conditions. In 2009, as part of our ongoing efforts to diversify our asset management business, we acquired a corporate credit business that operates as a manager of collateralized loan obligations.
Principal Business Lines
JMP Group Inc. (the “Company”) conducts its primary business activities through three wholly-owned or majority-owned subsidiaries: JMP Securities LLC (“JMP Securities”), our broker-dealer operation; Harvest Capital Strategies LLC (“HCS”), our asset management arm—an SEC-registered investment adviser; and JMP Credit Corporation (“JMP Credit”), our corporate credit operation and a new addition to our business lines in 2009.
JMP Securities is a U.S. registered broker-dealer under the Securities Exchange Act of 1934, as amended, and is a member of the Financial Industry Regulatory Authority (“FINRA”). JMP Securities operates as an introducing broker and does not hold funds or securities for, or owe any money or securities to, customers and does not carry accounts for customers. All customer transactions are cleared through another broker-dealer on a fully disclosed basis. JMP Securities provides equity research, sales and trading to institutional brokerage clients and capital raising and strategic advisory services to corporate clients. As of December 31, 2009, JMP Securities had 186 full-time employees, including 40 in equity research, 57 in sales and trading, 53 in investment banking and 36 in operations and administration.
HCS is a registered investment advisor under the Investment Advisers Act of 1940, as amended, and provides investment management services for sophisticated investors through investment partnerships and other
6
Table of Contents
entities managed by HCS. During the fiscal year ended December 31, 2009, HCS actively managed a family of six hedge funds, two funds of hedge funds and one externally advised REIT. As of December 31, 2009, HCS had 26 full-time employees.
Effective April 7, 2009, through our majority-owned subsidiary JMP Credit, we completed the acquisition of 100% of the membership interests of Cratos Capital Partners, LLC and its subsidiaries, including Cratos Capital Management, LLC (collectively, “Cratos”), a manager of collateralized loan obligations, together with certain securities of Cratos CLO I, Ltd. (the “CLO”). As of December 31, 2009, JMP Credit had 12 full-time employees.
Investment Banking
Our investment banking professionals provide capital raising, mergers and acquisitions transaction and other strategic advisory services to corporate clients. Dedicated industry coverage groups serve each of our six target industries, enabling our investment bankers to develop expertise in specific markets and to form close relationships with corporate executives, private equity investors, venture capitalists and other key industry participants. We offer our clients a high level of attention from senior personnel and have designed our organizational structure so that the investment bankers who are responsible for securing and maintaining client relationships also actively participate in providing all related transaction execution services to those clients.
By focusing consistently on our target sectors—business services, consumer, financial services, healthcare, real estate, and technology—we have developed a comprehensive understanding of the unique challenges and demands involved in executing corporate finance and strategic advisory assignments in these sectors. A significant portion of our corporate finance revenues is earned from small and mid-capitalization public companies, and the balance is earned from private companies. Some of our clients retain us for our advisory and capital raising capabilities during an accelerated growth phase as a private company and then continue to work with us through an initial public offering or company sale process. We maintain exceptional client focus both during and following a transaction, leading to a true advisory relationship and a pattern of assisting companies with multiple transactions.
Corporate Finance
We assist our publicly traded and privately held corporate clients with capital raising activities, which include the underwriting of a wide range of equity and debt securities, including common, preferred and convertible securities. Our public equity underwriting capabilities include initial public offerings and follow-on equity offerings. We also act as an agent in private placements of equity and debt securities and arrange private investments in public equity (“PIPE”) transactions as well as privately negotiated, registered direct stock offerings on behalf of our public company clients. We typically place securities with our client base of institutional investors, private equity and venture capital funds and high net-worth individuals.
Because our corporate clients are generally considered high-growth companies, they are frequently in need of new capital. Many of our client relationships develop early, when a client company is still private, in which case we may facilitate private placements of the clients’ securities. Thereafter, if our client prepares for an initial public offering, we are generally considered to act as an underwriter of that stock offering. Our ability to structure innovative private offerings and to identify the likely buyers of such offerings makes us a valuable advisor for many small and middle-market companies, as does our industry specialization. We expect that, while the environment for initial public offerings may not be consistently favorable in the future, we should be able to depend on follow-on offerings, PIPEs, registered direct offerings and private placements to continue to generate corporate finance revenues.
Mergers and Acquisitions and Other Strategic Advisory
We work with corporate clients on a broad range of key strategic matters, including mergers and acquisitions, divestitures and corporate restructurings, valuations of businesses and assets, and fairness opinions
7
Table of Contents
and special committee assignments. Because we serve clients at various stages of their corporate development—from emerging growth companies to mature private and public companies—the values of these transactions range in size.
We provide our advice to senior executives and boards of directors of client companies in connection with transactions that are typically of significant strategic and financial importance to these companies. We believe that our success as a strategic advisor stems from our ability to structure and execute complex transactions that create long-term stockholder value.
Because of our focus on innovative and fast-growing companies, we are most often an advisor in company sale transactions, although we are taking steps to create equilibrium in our advisory business and expect, in addition, to increasingly represent corporate clients as buyers over time. We believe that our position as a lead manager or senior co-manager of public and private equity offerings will facilitate the growth of our mergers and acquisitions and strategic advisory businesses, as companies that have been issuers of securities become more mature and pursue acquisitions or other exit events for their investors.
Sales and Trading
Our sales and trading operation distributes our equity research product and communicates our proprietary investment recommendations to our institutional investors. In addition, our sales and trading staff executes equity trades on behalf of our clients and markets the securities of companies for which we act as an underwriter.
We have established a broad institutional client base rooted in longstanding relationships, which have been developed through a consistent focus on the investment and trading objectives of our clients. Our sales and trading professionals work closely with our equity research staff to provide insight and differentiated investment advice to approximately 550 institutional clients nationwide.
We believe that our sales and trading clients turn to us for timely, informed investment advice. Our equity research features proprietary themes and actionable ideas about industries and companies that are not widely evaluated by many other investment banks. In recent years, many investment banks have reduced their equity research coverage and market-making activities dedicated to companies with market capitalizations below certain thresholds. Additionally, with the recent failure or consolidation of several very large investment banking firms, the amount of market-making activity, liquidity and research coverage provided by broker-dealers for smaller stocks has significantly decreased. However, we continue to commit sales and trading resources to smaller-capitalization companies with the belief that institutional investors require and value such specialized knowledge and service.
Our sales and trading personnel are also central to our ability to market equity offerings and provide after-market support. Our capital markets group manages the syndication, marketing, execution and distribution of equity and debt offerings. Our syndicate activities include managing the marketing and order-taking process for underwritten transactions and conducting after-market stabilization and initial market-making. Our syndicate staff is also responsible for developing and maintaining relationships with the syndicate departments of other investment banks.
Equity Research
Our research department is charged with developing proprietary investment themes, anticipating secular and cyclical changes, and producing action-oriented reports that will assist our clients with their investment decisions. Our analysts cultivate primary sources of information in order to refine their quantitative and qualitative assessments. Our objective is to provide clients with a clear understanding of industry-specific and company-specific issues that can impact their portfolio returns.
8
Table of Contents
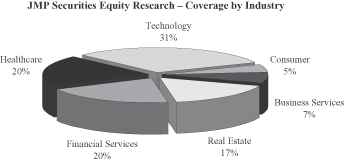
Our equity research focuses on our six target industries—business services, consumer, financial services, healthcare, real estate and technology—and on the following sectors underlying each industry:
| Business Services
• Business and Professional Services
• Financial Processing and Outsourcing |
Consumer
• E-Commerce
• Lifestyle Retailing and Products
• Hardline Retailing |
Financial Services
• Brokers and Asset Managers • Commercial Banks • Consumer Finance • Mortgage Finance • Specialty Finance | ||
|
Healthcare
• Biotechnology
• Healthcare Facilities
• Healthcare IT
• Healthcare Services
• Medical Devices |
Real Estate
• Hotels and Resorts
• Housing and Housing Supply Chain
• Property Services
• Real Estate Technology
• REITs |
Technology
• Clean Technology
• Communications Equipment
• Internet
• Semiconductors
• Software
• Enterprise Infrastructure |
As of December 31, 2009, our research department included 23 publishing research analysts providing investment recommendations on 286 public companies. Approximately 49% of the stocks under coverage had market capitalizations of less than $1.0 billion and were divided among our target sectors as follows:
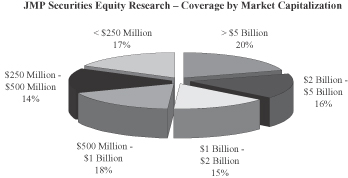
While many larger firms have restructured their research departments due to economic and regulatory pressures and have significantly reduced coverage of companies below certain market-capitalization thresholds, we continue to devote the majority of our resources to smaller-capitalization companies. The number of investment funds and the total assets under management committed to small-cap and mid-cap stocks has grown
9
Table of Contents
considerably during the last decade. However, managers of these funds are now presented with ever fewer sources of independent investment research. We continue to provide objective investment recommendations on small and middle-market companies, and we believe that our institutional investor clients depend on us for this informed, fundamental research.
Asset Management
Through HCS, during 2009 we actively managed a family of six hedge funds, two funds of hedge funds and one externally advised REIT. As of December 31, 2009, we had a total of $563.6 million in client assets under management (including assets of employees and portfolio managers) and had an additional $43.3 million of our own capital invested in these vehicles. In addition, as of December 31, 2009 we had invested $3.6 million in funds managed by third parties.
In January 2008, we and certain affiliated entities completed the acquisition of 1.0 million shares of Series A Cumulative Redeemable Convertible preferred stock of New York Mortgage Trust, Inc. (“NYMT”), a publicly traded real estate investment trust (“REIT”) engaged in the investment management of mortgage-backed securities and high credit quality residential adjustable rate mortgage loans, at a price per share of $20.00, for a total of $20.0 million. The investment was comprised of $5.0 million from JMP Group Inc., $5.0 million from certain funds managed by HCS, and $10.0 million from JMP Realty Trust (“JMPRT”), which was an affiliated REIT managed by HCS. In February 2008, JMP Group Inc. purchased NYMT common stock for an aggregate amount of $4.5 million in a $60.0 million private investment in public equity (“PIPE”) transaction executed by NYMT. In addition, we have entered into an advisory agreement between HCS and NYMT to manage certain non-agency assets. On January 2, 2009, all of the assets and liabilities of JMPRT were transferred to Harvest Mortgage Opportunities Partners (“HMOP”), which is a hedge fund managed by HCS.
The objective of our multiple strategies is to diversify both revenue and risk while maintaining the attractive economics of the alternative asset model. We view asset management as an attractive business due to its high margins and the recurring nature of its fee-based revenues as well as its dependence on intellectual capital, which we believe is less susceptible to competitive threats from larger financial institutions.
In the course of advising clients on strategic or private capital raising transactions, our investment bankers may identify instances in which we could commit our own capital to transactions for which we are acting as an agent. In addition, opportunities to deploy equity and debt capital are frequently brought to the attention of our asset management professionals. As a result, in the past we have made, and expect that in the future we may make, principal investments in selected cases and may be able to earn attractive returns on the capital committed.
Corporate Credit
JMP Credit serves as the investment manager to a collateralized loan obligation (“CLO”) vehicle originally funded in May 2007. As of December 31, 2009, the CLO had a diversified portfolio of 111 corporate loans with an aggregate par amount of $464.1 million and restricted cash available to lend of $31.0 million. For the period from April 7, 2009, the date of the CLO acquisition by us, through December 31, 2009, JMP Credit earned management fees of $1.9 million or 50 bps annualized on gross assets under management. As we consolidate the CLO, in accordance with U.S. Generally Accepted Accounting Principles (“GAAP”), the management fees are eliminated on consolidation.
Industry Concentration in Financial Services and Real Estate Sectors
Although we have taken significant steps since 2001 to diversify and broaden our industry focus, two of the Company’s core franchises remain centered on the specialty finance and real estate industries. These two industries have suffered considerably since the second half of 2007 as turmoil in the U.S. and global economy has roiled the financial services and real estate sectors, in particular. Nevertheless, we believe that we have been negotiating this difficult period effectively and believe that market conditions in these sectors may work to our advantage if we are able to leverage our expertise to gain new business in the future.
10
Table of Contents
Before we undertook our diversification efforts, our investment banking business generated 100% of its revenues from the financial services and homebuilding sectors. Due to the growth of healthcare investment banking revenues in 2009, 59.0% of investment banking revenues were derived from the financial services and homebuilding sectors. Our additional focus on industries such as software, Internet, life sciences, medical devices and healthcare services has counterbalanced our efforts in our original industry groups. In addition to broadening our industry concentration, we have worked in recent years to expand our investment banking product offerings so that we are not solely dependent on the public capital markets for our business opportunities. In 2009, we derived 59.3% of investment banking revenues from sources other than the public capital markets, including M&A and strategic advisory fees and private capital raising fees.
Competition
All areas of our business are subject to a high level of competition. The principal competitive factors influencing our business include the ability of our professionals, industry expertise, client relationships, business reputation, market focus and product capabilities, and quality and price of our products and services.
Since the mid-1990s, there has been substantial consolidation among U.S. and global financial institutions. In particular, a number of large commercial banks, insurance companies and other diversified financial services firms have merged with other financial institutions or have established or acquired broker-dealers. During 2008, we witnessed the unprecedented, nearly simultaneous failure or near-collapse of a number of very large financial institutions, which led to the acquisition of several of the most sizeable U.S. investment banking firms, consolidating the financial industry to an even greater extent. Currently, our competitors are other investment banks, brokerage firms, merchant banks and financial advisory firms. Our focus on our six target industries also subjects us to direct competition from a number of specialty securities firms and smaller investment banking boutiques that specialize in providing services to these industries.
The industry trend toward consolidation has significantly increased the capital base and geographic reach of many of our competitors. Although our larger and better-capitalized competitors have suffered from the dislocation in the investment banking and financial services industry, they may be more able than we are to respond to changes in the investment banking industry, to recruit and retain skilled professionals, to finance acquisitions, to fund internal growth and to compete for market share generally. Many of these firms have the ability to offer a wider range of products than we do, including loans, deposit-taking and insurance, in addition to brokerage, asset management and investment banking services, all of which may enhance their competitive position relative to us. These firms also have the ability to support investment banking and securities products with commercial banking, insurance and other financial services revenues in an effort to gain market share, which could result in downward pricing pressure in our businesses. In particular, the trend in the equity underwriting business toward multiple book runners and co-managers has increased the competitive pressure in the investment banking industry and may lead to lower average transaction fees.
We face a high level of competition in recruiting and retaining experienced and qualified professionals. The success of our business and our ability to continue to compete effectively will depend significantly upon our continued ability to retain and incentivize our existing professionals and attract new professionals.
As we seek to expand our asset management business, we face competition in the pursuit of investors for our investment funds, in the identification and completion of investments in attractive portfolio companies or securities, and in the recruitment and retention of skilled asset management professionals.
Net interest income from our corporate credit business depends, in large part, on our ability to acquire loans at favorable spreads over our borrowing costs. A number of entities compete with us to make the types of investments that we make. We compete with other CLO managers, business development companies, public and private funds, commercial and investment banks and commercial finance companies. Some competing entities have recently raised, or are expected to raise, significant amounts of capital, and may have investment objectives that overlap with ours, which may create competition for investment opportunities. Some competitors may have a
11
Table of Contents
lower cost of funds than us and access to financing sources that are not available to us. In addition, some of our competitors may have higher risk tolerances or different risk assessments, which could allow them to consider a wider variety of investments and establish more relationships than us.
Employees
As of December 31, 2009, we had 224 employees, including 74 managing directors. We believe that our managing directors and other professionals have been attracted to our firm because of our focused industry coverage, our entrepreneurial culture and our dedication to providing growth companies and growth investors with exceptional client service, objective advice and innovative solutions. None of our employees are subject to any collective bargaining agreements, and we believe our relationship with our employees to be satisfactory.
Risk Management and Compliance
As an investment bank, risk is an inherent part of our business. Global markets, by their nature, are prone to uncertainty and subject participants to a variety of risks. The principal risks we face are market, liquidity, credit, legal, reputational and operational risks. We believe that we apply quantitative analysis and sound practical judgment before engaging in transactions to ensure that appropriate risk mitigants are in place. We accomplish this objective by carefully considering the amount of capital allocated to each of our businesses, establishing trading limits, setting credit limits for individual counterparties and, to the extent that we make principal investments, committing capital to transactions where we believe we have the advantage of industry or company-specific expertise. As part of our corporate credit and principal investment activities, we conduct due diligence before making any significant capital commitment in order to assess the risk inherent in a transaction and all significant investments must be approved by our investment committee and/or board of directors. All of our participations in underwritten offerings are required to be approved by our commitment committee. Our focus is balancing risk and return. We seek to achieve adequate returns from each of our businesses commensurate with the risks they assume. Nonetheless, the effectiveness of our approach to managing risks can never be completely assured. For example, unexpected large or rapid movements or disruptions in one or more markets or other unforeseen developments could have an adverse effect on our results of operations and financial condition. The consequences of these developments can include losses due to adverse changes in our principal investments, marketable security values, decreases in the liquidity of trading positions, increases in our credit exposure to customers and counterparties, and increases in general systemic risk.
Regulation
As a participant in the financial services industry, we are subject to complex and extensive regulation of most aspects of our business by U.S. federal and state regulatory agencies, self-regulatory organizations and securities exchanges. The laws, rules and regulations comprising the regulatory framework are constantly changing, as are the interpretation and enforcement of existing laws, rules and regulations. The effect of any such changes cannot be predicted and may direct the manner of our operations and affect our profitability.
Our broker-dealer subsidiary, JMP Securities, is subject to regulations governing every aspect of the securities business, including the execution of securities transactions; capital requirements; record-keeping and reporting procedures; relationships with customers, including the handling of cash and margin accounts; the experience of and training requirements for certain employees; and business procedures with firms that are not members of regulatory bodies.
JMP Securities is registered as a securities broker-dealer with the SEC and is a member of the FINRA. The FINRA is a self-regulatory body composed of members such as our broker-dealer subsidiary that have agreed to abide by the rules and regulations of the FINRA. The FINRA may expel, fine and otherwise discipline member firms and their employees. JMP Securities is also licensed as a broker-dealer in each of the 50 states, requiring us to comply with the laws, rules and regulations of each state. Each state may revoke the license to conduct a securities business, fine and otherwise discipline broker-dealers and their employees.
12
Table of Contents
JMP Securities is also subject to the SEC’s Uniform Net Capital Rule, Rule 15c3-1, which may limit our ability to make withdrawals of capital from our broker-dealer subsidiary. The Uniform Net Capital Rule sets the minimum level of net capital a broker-dealer must maintain and also requires that a portion of its assets be relatively liquid. In addition, JMP Securities is subject to certain notification requirements related to withdrawals of excess net capital.
We are also subject to the USA PATRIOT Act of 2001, which imposes obligations regarding the prevention and detection of money-laundering activities, including the establishment of customer due diligence and customer verification, and other compliance policies and procedures. The conduct of research analysts is also the subject of rule-making by the SEC, the FINRA and the federal government through the Sarbanes-Oxley Act. These regulations require certain disclosures by, and restrict the activities of, research analysts and broker-dealers, among others. Failure to comply with these requirements may result in monetary, regulatory and, in the case of the USA PATRIOT Act, criminal penalties.
Our asset management subsidiary, HCS, is an SEC-registered investment adviser, and accordingly subject to regulation by the SEC. Requirements under the Investment Advisors Act of 1940 include record-keeping, advertising and operating requirements, and prohibitions on fraudulent activities.
Various regulators, including the SEC, the FINRA and state securities regulators and attorneys general, are conducting both targeted and industry-wide investigations of certain practices relating to the financial services industry, including marketing, sales practices, valuation practices, asset managers, and market and compensation arrangements. These investigations, which have been highly publicized, have involved mutual fund companies, broker-dealers, hedge funds, investors and others.
In addition, the SEC staff has conducted studies with respect to soft dollar practices in the brokerage and asset management industries and proposed interpretive guidance regarding the scope of permitted brokerage and research services in connection with soft dollar practices.
Accounting, Administration and Operations
Our accounting, administration and operations personnel are responsible for financial controls, internal and external financial reporting, compliance with regulatory and legal requirements, office and personnel services, management information and telecommunications systems and the processing of our securities transactions. We use a third-party service provider for payroll processing and servicing of asset-backed securities issued, and our clearing operations are currently performed by Ridge Clearing & Outsourcing Solutions, Inc. All of our data processing functions are performed by our management information systems personnel. We believe that our continued future growth will require implementation of new and enhanced communications and information systems and training of our personnel or the hiring of an outsourced provider to operate such systems. Any difficulty or significant delay in the implementation or operation of new systems or the training of personnel could harm our ability to manage growth.
Available Information
JMP Group Inc. is required to file current, annual and quarterly reports, proxy statements and other information required by the Exchange Act with the Securities and Exchange Commission. You may read and copy any document JMP Group Inc. files with the SEC at the SEC’s Public Reference Room located at 100 F Street, N.E., Washington, DC 20549. Information on the operation of the Public Reference Room may be obtained by calling the SEC at 1-800-SEC-0330. In addition, the SEC maintains an Internet website at http://www.sec.gov, from which interested persons can electronically access JMP Group Inc.’s SEC filings.
JMP Group Inc. will make available free of charge through its Internet site, http://www.jmpg.com, its annual reports on Form 10-K, quarterly reports on Form 10-Q, current reports on Form 8-K, proxy statements,
13
Table of Contents
Forms 3, 4 and 5 filed by or on behalf of directors, executive officers and certain large stockholders, and any amendments to those documents filed or furnished pursuant to the Exchange Act. These filings will become available as soon as reasonably practicable after such material is electronically filed with or furnished to the SEC.
JMP Group Inc. also makes available in the investor relations section of its website and will provide to shareholders in print form upon request (i) its corporate governance guidelines, (ii) its code of business conduct and ethics, and (iii) the charters of the audit, compensation, and corporate governance and nominating committees of its board of directors. These documents, as well as the information on the website of JMP Group Inc., are not intended to be part of this annual report.
14
Table of Contents
| Item 1A. | Risk Factors |
Risks Related to Our Business
Recent turmoil in the global financial markets has negatively impacted and may continue to negatively impact our ability to generate business and revenues and may cause significant fluctuations in our stock price.
The stock and credit markets have experienced extreme volatility and disruption since mid-2007. In particular, during the fourth quarter of 2008, the market volatility and disruption reached unprecedented levels. While the market has become more stable in 2009, there remains a significant amount of uncertainty about a global economic recovery. Concerns over the availability and the cost of credit, the U.S. mortgage market, a declining real estate market, volatile energy prices, consumer confidence, unemployment, and geopolitical issues have contributed to this increased volatility and diminished expectations for the economy and the markets in the future. The markets produced downward pressure on stock prices and credit availability has contracted significantly for issuers in general. We continued to suffer a downturn in our investment banking business due to reduced activity by businesses in capital raising transactions and declines in their stock prices. The number of our investment banking transactions has fallen from an average of 74 per annum from 2005 through 2007 to an average of 45 per annum from 2008 through 2009.
The continuation or worsening of current market conditions may cause us to face some or all of the following risks:
| • | Our opportunity to act as underwriter or placement agent could be adversely affected by a reduction in the number and size of capital raising transactions or by competing government sources of equity. |
| • | The number and size of mergers and acquisitions transactions or other strategic advisory services where we act as adviser could be adversely affected by continued uncertainties in valuations related to asset quality and creditworthiness, volatility in the equity markets, and diminished access to financing. |
| • | The market downturn could lead to a decline in the volume of transactions that we execute for our customers and, therefore, to a decline in the revenue we receive from commissions and spreads. |
| • | We may experience losses in securities trading activities or as a result of write-downs in the value of securities that we own as a result of deteriorations in the businesses or creditworthiness of the issuers of such securities. |
| • | We may experience losses or write downs in the realizable value of our principal investments due to the inability of companies we invest in to repay their borrowings. |
| • | Our access to liquidity and the capital markets could be limited, preventing us from making principal investments and restricting our sales and trading businesses. |
| • | We may incur unexpected costs or losses as a result of the bankruptcy or other failure of companies for which we have performed investment banking services to honor ongoing obligations such as indemnification or expense reimbursement agreements. |
| • | Sudden sharp declines in market values of securities can result in illiquid markets and the failure of counterparties to perform their obligations, which could make it difficult for us to sell securities, hedge securities positions, and invest funds under management. |
| • | As an introducing broker to clearing firms, we are responsible to the clearing firm and could be held liable for the defaults of our customers, including losses incurred as the result of a customer’s failure to meet a margin call. Although we review credit exposure to specific customers, default risk may arise from events or circumstances that are difficult to detect or foresee. When we allow customers to purchase securities on margin, we are subject to risks inherent in extending credit. This risk increases when a market is rapidly declining and the value of the collateral held falls below the amount of a customer’s indebtedness. If a customer’s account is liquidated as the result of a margin call, we are liable to our clearing firm for any deficiency. |
15
Table of Contents
| • | Competition in our investment banking, sales, and trading businesses could intensify as a result of the increasing pressures on financial services companies and larger firms competing for transactions and business that historically would have been too small for them to consider. |
| • | The market downturn could result in lower prices for securities, which may result in reduced management fees calculated as a percentage of assets under management. |
| • | Market declines could increase claims and litigation, including arbitration claims from customers. |
| • | Our industry could face increased regulation as a result of legislative or regulatory initiatives. Compliance with such regulation may increase our costs and limit our ability to pursue business opportunities. |
| • | Government intervention may not succeed in improving the financial and credit markets and may have negative consequences for our business. |
It is difficult to predict how long the current economic conditions will continue, whether they will deteriorate and which of our business lines will be adversely affected. If one or more of the foregoing risks occurs, our revenues are likely to decline and, if we were unable to reduce expenses at the same pace, our profit margins would erode.
We focus principally on specific sectors of the economy, and deterioration in the business environment in these sectors or a decline in the market for securities of companies within these sectors could harm our business.
We focus principally on six target industries: business services, consumer, financial services, healthcare, real estate, and technology. Volatility in the business environment in these industries or in the market for securities of companies within these industries could adversely affect our financial results and the market value of our common stock. The business environment for companies in some of these industries has been subject to high levels of volatility in recent years, and our financial results have consequently been subject to significant variations from year to year. Over the last five years, the mix of our investment banking revenues has shifted from over 70% combined in financial services and real estate (slightly weighted in favor of the real estate sector) to 59% of total investment banking revenues in financial services and real estate in 2009. The life sciences sector has risen to 23% of total investment banking revenues in 2009 with the remaining 18% approximately of revenues being split amongst healthcare, software and technology. The market for securities in each of our target industries may also be subject to industry-specific risks. For example, we have research, investment banking and principal investments focused in the areas of financial services, real estate and mortgage-related securities. These sectors have been impacted negatively by disruption in the financial markets and downturn in the general economy and the real estate market. During this current downturn in the economy, several banks and securities firms in the United States and elsewhere failed or were acquired by other financial institutions, often in distressed sales. In addition, declines in the housing market, with falling home prices and increasing foreclosures, have adversely affected the credit performance of mortgage loans and have resulted in material write downs of asset values by financial institutions.
As an investment bank focused principally on specific growth sectors of the economy, we also depend significantly on private company transactions for sources of revenues and potential business opportunities. Most of these private company clients are initially funded and controlled by venture capital funds and private equity firms. To the extent that the pace of these private company transactions slows or the average transaction size declines due to a decrease in venture capital and private equity financings, difficult market conditions in our target industries or other factors, our business and results of operations may be harmed.
Underwriting and other corporate finance transactions, strategic advisory engagements and related sales and trading activities in our target industries represent a significant portion of our business. This concentration of activity in our target industries exposes us to the risk of declines in revenues in the event of downturns in these industries.
16
Table of Contents
Our ability to retain our senior professionals and recruit additional professionals is critical to the success of our business, and our failure to do so may adversely affect our reputation, business, results of operations and financial condition.
Our people are our most valuable resource. Our ability to obtain and successfully execute the transactions that generate a significant portion of our revenues depends upon the reputation, judgment, business generation capabilities and project execution skills of our senior professionals, particularly our managing directors and the members of our executive committee. The reputations and relationships of our senior professionals with our clients are a critical element in obtaining and executing client engagements. Turnover in the investment banking industry is high and we encounter intense competition for qualified employees from other companies in the investment banking industry as well as from businesses outside the investment banking business, such as hedge funds and private equity funds. To the extent we continue to have annual compensation and benefits expense targets, we may not be able to retain our professionals or recruit additional professionals at compensation levels that are within our target range for compensation and benefits expense. If we were to lose the services of any of our investment bankers, senior equity research, sales and trading professionals, asset managers, or executive officers to a new or existing competitor or otherwise, we may not be able to retain valuable relationships and some of our clients could choose to use the services of a competitor instead of our services. If we are unable to retain our senior professionals or recruit additional professionals, our reputation, business, results of operations and financial condition will be adversely affected. Further, new business initiatives and efforts to expand existing businesses generally require that we incur compensation and benefits expense before generating additional revenues.
We face strong competition from larger firms, some of which have greater resources and name recognition than we do, which may impede our ability to grow our business.
The investment banking industry is intensely competitive, and we expect it to remain so. We compete on the basis of a number of factors, including client relationships, reputation, the abilities of our professionals, market focus and the relative quality and price of our services and products. We have experienced intense price competition in our various businesses. Pricing and other competitive pressures in investment banking, including the trends toward multiple book runners, co-managers and multiple financial advisors handling transactions, could adversely affect our revenues, even if the size and number of our investment banking transactions may increase.
We are a relatively small investment bank with 224 employees as of December 31, 2009, and net revenues of $149.5 million for the year ended December 31, 2009. Many of our competitors have a broader range of products and services, greater financial and marketing resources, larger customer bases, greater name recognition, more senior professionals to serve their clients’ needs, greater global reach and more established relationships with clients than we have. These larger and better capitalized competitors may be better able to respond to changes in the investment banking industry, compete for skilled professionals, finance acquisitions, fund internal growth and compete for market share generally. These firms have the ability to support investment banking with commercial banking, insurance and other financial services in an effort to gain market share, which has resulted, and could further result, in pricing pressure in our businesses. In particular, the ability to provide commercial financing has become an important advantage for some of our larger competitors and, because we do not provide such financing, we may be unable to compete as effectively for clients in a significant part of the investment banking industry. In addition, if the number of capital markets and financial advisory transactions continues to decline in response to current economic conditions, larger investment banking firms may seek to enter into engagements with smaller companies and for smaller transactions that traditionally would have been considered too small for these firms.
If we are unable to compete effectively with our competitors, our business, results of operations and financial condition will be adversely affected.
17
Table of Contents
We face strong competition from middle-market investment banks.
We compete with specialized investment banks to provide financial and investment banking services to small and middle-market companies. Middle market investment banks provide access to capital and strategic advice to small and middle-market companies in our target industries. We compete with those investment banks on the basis of a number of factors, including client relationships, reputation, the abilities of our professionals, market focus and the relative quality of our products and services. Competition in the middle-market may further intensify if larger Wall Street investment banks expand their focus to this sector of the market. Increased competition could reduce our market share from investment banking services and our ability to generate fees at historical levels.
Our stock price has been volatile and it may continue to be volatile in the future.
The market price of our common stock could be subject to significant fluctuations due to factors such as:
| • | changes in book value due to principal investment valuations; |
| • | actual or anticipated fluctuations in our financial condition or results of operations; |
| • | failure to meet the expectations of securities analysts; |
| • | a decline in the stock prices of peer companies; |
| • | a discount in the trading multiple of our common stock relative to that of common stock of certain of our peer companies due to perceived risks associated with our smaller size; |
| • | the success or failure of potential acquisitions, our operating strategies and our perceived prospects and those of the financial services industry in general; |
| • | the realization of any of the other risks described in this section; |
| • | sales of substantial amounts of our common stock by our employees or other stockholders, or the possibility of such sales; and |
| • | changes in our dividend policy. |
We currently have on file with the SEC an effective “universal” shelf registration statement on Form S-3, which enables us to sell, from time to time, our common stock and other securities covered by the registration statement in one or more public offerings. Sales of substantial amounts of our common stock or other securities covered by the registration statement may adversely affect the price of our common stock. Declines in the price of our common stock may adversely affect our ability to recruit and retain key employees, including our managing directors and other key professional employees. In addition, we may not be able to access the capital markets for future principal transactions.
Our financial results from investment banking activities may fluctuate substantially from period to period, which may impair our stock price.
We have experienced, and expect to experience in the future, significant variations from period to period in our revenues and results of operations from investment banking activities. Future variations in investment banking revenues may be attributable in part to the fact that our investment banking revenues are typically earned upon the successful completion of a transaction, the timing of which is uncertain and beyond our control. In most cases, we receive little or no payment for investment banking engagements that do not result in the successful completion of a transaction. As a result, our business is highly dependent on market conditions as well as the decisions and actions of our clients and interested third parties. For example, a client’s acquisition transaction may be delayed or terminated because of a failure to agree upon final terms with the counterparty, failure to obtain necessary regulatory consents or board or stockholder approvals, failure to secure necessary financing, adverse market conditions or unexpected financial or other problems in the business of a client or a counterparty. If the parties fail to complete a transaction on which we are advising or an offering in which we are participating,
18
Table of Contents
we will earn little or no revenue from the contemplated transaction. In addition, we pay significant expenses related to a contemplated transaction regardless of whether or not the contemplated transaction generates revenues. This risk may be intensified by our focus on growth companies in the business services, consumer, financial services, healthcare, real estate and technology industries, which have been adversely affected by the current economic turmoil. According to data from Dealogic, a provider of global investment banking analysis and systems, the number of mergers and acquisition transactions in the U.S. decreased from approximately 8,500 in 2007 to approximately 6,600 in 2008 and further decreased to approximately 5,000 in 2009. The number of capital raising transactions decreased from 739 in 2007 to 306 in 2008 and then increased to 702 in 2009. Our investment banking revenues would be adversely affected in the event that the trend in mergers and acquisitions continues or the number of capital raising transactions again declines. As a result, we may not achieve steady and predictable earnings on a quarterly basis, which could in turn adversely affect our stock price.
Further, because a significant portion of our revenue is derived from investment banking fees and commissions, severe market fluctuations, weak economic conditions, a decline in stock prices, trading volumes or liquidity could significantly harm our profitability in the following ways:
| • | the number and size of transactions for which we provide underwriting and merger and acquisition advisory services may decline; |
| • | the value of the securities we hold in inventory as assets, which we often purchase in connection with market-making and underwriting activities, may decline; and |
| • | the volume of trades we would execute for our clients may decrease. |
To the extent our clients, or counterparties in transactions with us, are more likely to suffer financial setbacks in a volatile stock market environment, our risk of loss during these periods would increase.
Our corporate finance and strategic advisory engagements are singular in nature and do not generally provide for subsequent engagements.
Our investment banking clients generally retain us on a short-term, engagement-by-engagement basis in connection with specific corporate finance, merger and acquisition transactions and other strategic advisory services, rather than on a recurring basis under long-term contracts. As these transactions are typically singular in nature and our engagements with these clients may not recur, we must seek new engagements when our current engagements are successfully completed or are terminated. As a result, high activity levels in any period are not necessarily indicative of continued high levels of activity in any subsequent period. If we are unable to generate a substantial number of new engagements that generate fees from new or existing clients, our business, results of operations and financial condition could be adversely affected.
Pricing and other competitive pressures may impair the revenues of our sales and trading business.
We derive a significant portion of our revenues from our sales and trading business, which accounted for 23%, 49%, and 36% of our net revenues for the years ended December 31, 2009, 2008 and 2007 respectively. Along with other investment banking firms, we have experienced intense price competition in this business in recent years. In particular, the ability to execute trades electronically and through alternative trading systems has increased the downward pressure on trading commissions and spreads. We expect this trend toward alternative trading systems and downward pricing pressure in the business to continue. We believe we may experience competitive pressures in these and other areas in the future as some of our competitors seek to obtain market share by competing on the basis of price or by using their own capital to facilitate client trading activities. In addition, we face pressure from our larger competitors, which may be better able to offer a broader range of complementary products and services to clients in order to win their trading business. As we are committed to maintaining and improving our comprehensive research coverage in our target sectors to support our sales and trading business, we may be required to make substantial investments in our research capabilities to remain competitive. If we are unable to compete effectively in these areas, the revenues of our sales and trading business may decline, and our business, results of operations and financial condition may be harmed.
19
Table of Contents
Some of our large institutional sales and trading clients in terms of brokerage revenues have entered into arrangements with us and other investment banking firms under which they separate payments for research products or services from trading commissions for sales and trading services, and pay for research directly in cash, instead of compensating the research providers through trading commissions (referred to as “soft dollar” practices). In addition, we have entered into certain commission sharing arrangements in which institutional clients execute trades with a limited number of brokers and instruct those brokers to allocate a portion of the commission directly to us or other broker-dealers for research or to an independent research provider. If more of such arrangements are reached between our clients and us, or if similar practices are adopted by more firms in the investment banking industry, it may further increase the competitive pressures on trading commissions and spreads and reduce the value our clients place on high quality research. Conversely, if we are unable to make similar arrangements with other investment managers that insist on separating trading commissions from research products, volumes and trading commissions in our sales and trading business also would likely decrease.
Larger and more frequent capital commitments in our trading and underwriting businesses increase the potential for significant losses.
There is a trend toward larger and more frequent commitments of capital by financial services firms in many of their activities. For example, in order to win business, investment banks are increasingly committing to purchase large blocks of stock from publicly traded issuers or significant stockholders, instead of the more traditional marketed underwriting process in which marketing is typically completed before an investment bank commits to purchase securities for resale. We may participate in this trend and, as a result, we may be subject to increased risk. Furthermore, we may suffer losses as a result of the positions taken in these transactions even when economic and market conditions are generally favorable for others in the industry.
We may increasingly commit our own capital as part of our trading business to facilitate client sales and trading activities. The number and size of these transactions may adversely affect our results of operations in a given period. We may also incur significant losses from our sales and trading activities due to market fluctuations and volatility in our results of operations. To the extent that we own assets, i.e., have long positions, in any of those markets, a downturn in the value of those assets or in those markets could result in losses. Conversely, to the extent that we have sold assets we do not own, i.e., have short positions, in any of those markets, an upturn in those markets could expose us to potentially large losses as we attempt to cover our short positions by acquiring assets in a rising market.
The asset management business is intensely competitive.
Over the past several years, the size and number of asset management funds, including hedge funds and private equity funds, has continued to increase. If this trend continues, it is possible that it will become increasingly difficult for our funds to raise capital. More significantly, the allocation of increasing amounts of capital to alternative investment strategies by institutional and individual investors leads to a reduction in the size and duration of pricing inefficiencies. Many alternative investment strategies seek to exploit these inefficiencies and, in certain industries, this drives prices for investments higher, in either case increasing the difficulty of achieving targeted returns. In addition, if interest rates were to rise or there were to be a prolonged bull market in equities, the attractiveness of our funds relative to investments in other investment products could decrease. Competition is based on a variety of factors, including:
| • | investment performance; |
| • | investor perception of the drive, focus and alignment of interest of an investment manager; |
| • | quality of service provided to and duration of relationship with investors; |
| • | business reputation; and |
| • | level of fees and expenses charged for services. |
20
Table of Contents
According to a Hedge Fund Research Inc. report published in January 2010, the hedge fund industry experienced net investor redemptions of approximately $131.0 billion in 2009. How long this lack of confidence in the performance of hedge funds will continue remains to be seen, however it is possible that it will become increasingly difficult for our funds to raise capital in the short term.
We compete in the asset management business with a large number of investment management firms, private equity fund sponsors, hedge fund sponsors and other financial institutions. A number of factors serve to increase our competitive risks, as follows:
| • | investors may develop concerns that we will allow a fund to grow to the detriment of its performance; |
| • | some of our competitors have greater capital, lower targeted returns or greater sector or investment strategy specific expertise than we do, which creates competitive disadvantages with respect to investment opportunities; |
| • | some of our competitors may perceive risk differently than we do which could allow them either to outbid us for investments in particular sectors or, generally, to consider a wider variety of investments; |
| • | there are relatively few barriers to entry impeding new asset management firms, and the successful efforts of new entrants into our various lines of business, including former “star” portfolio managers at large diversified financial institutions as well as such institutions themselves, will continue to result in increased competition; and |
| • | other industry participants in the asset management business continuously seek to recruit our best and brightest investment professionals away from us. |
These and other factors could reduce our earnings and revenues and adversely affect our business. In addition, if we are forced to compete with other alternative asset managers on the basis of price, we may not be able to maintain our current base management and incentive fee structures. We have historically competed primarily on the performance of our funds, and not on the level of our fees relative to those of our competitors. However, there is a risk that fees in the alternative investment management industry will decline, without regard to the historical performance of a manager, including our managers. Fee reductions on our existing or future funds, without corresponding decreases in our cost structure, would adversely affect our revenues and distributable earnings.
Poor investment performance may decrease assets under management and reduce revenues from and the profitability of our asset management business.
Revenues from our asset management business are primarily derived from asset management fees. Asset management fees are comprised of base management and incentive fees. Management fees are typically based on assets under management, and incentive fees are earned on a quarterly or annual basis only if the return on our managed accounts exceeds a certain threshold return, or “highwater mark,” for each investor. We will not earn incentive fee income during a particular period, even when a fund had positive returns in that period, if we do not generate cumulative performance that surpasses a highwater mark. If a fund experiences losses, we will not earn incentive fees with regard to investors in that fund until its returns exceed the relevant highwater mark.
In addition, investment performance is one of the most important factors in retaining existing investors and competing for new asset management business. Investment performance may be poor as a result of the current or future difficult market or economic conditions, including changes in interest rates or inflation, terrorism or political uncertainty, our investment style, the particular investments that we make, and other factors. Poor investment performance may result in a decline in our revenues and income by causing (i) the net asset value of the assets under our management to decrease, which would result in lower management fees to us, (ii) lower investment returns, resulting in a reduction of incentive fee income to us, and (iii) investor redemptions, which would result in lower fees to us because we would have fewer assets under management.
21
Table of Contents
To the extent our future investment performance is perceived to be poor in either relative or absolute terms, the revenues and profitability of our asset management business will likely be reduced and our ability to grow existing funds and raise new funds in the future will likely be impaired.
The historical returns of our funds may not be indicative of the future results of our funds.
The historical returns of our funds should not be considered indicative of the future results that should be expected from such funds or from any future funds we may raise. Our rates of returns reflect unrealized gains, as of the applicable measurement date, which may never be realized due to changes in market and other conditions not in our control that may adversely affect the ultimate value realized from the investments in a fund. The returns of our funds may have also benefited from investment opportunities and general market conditions that may not repeat themselves, and there can be no assurance that our current or future funds will be able to avail themselves of profitable investment opportunities. Furthermore, the historical and potential future returns of the funds we manage also may not necessarily bear any relationship to potential returns on our common stock.
Our asset management clients may generally redeem their investments, which could reduce our asset management fee revenues.
Our asset management fund agreements generally permit investors to redeem their investments with us after an initial “lockup” period during which redemptions are restricted or penalized. However, any such restrictions may be waived by us. Thereafter, redemptions are permitted at quarterly or annual intervals. If the return on the assets under our management does not meet investors’ expectations, investors may elect to redeem their investments and invest their assets elsewhere, including with our competitors. Our management fee revenues correlate directly to the amount of assets under our management; therefore, redemptions may cause our fee revenues to decrease. Investors may decide to reallocate their capital away from us and to other asset managers for a number of reasons, including poor relative investment performance, changes in prevailing interest rates which make other investments more attractive, changes in investor perception regarding our focus or alignment of interest, dissatisfaction with changes in or a broadening of a fund’s investment strategy, changes in our reputation, and departures or changes in responsibilities of key investment professionals. For these and other reasons, the pace of redemptions and corresponding reduction in our assets under management could accelerate. In the future, redemptions could require us to liquidate assets under unfavorable circumstances, which would further harm our reputation and results of operations.
The recent crisis in the global credit markets has adversely affected and may continue to adversely affect our CLO investments.
The global economy has been affected by a crisis in the credit markets and has experienced a general downturn. Among the sectors particularly challenged by the current crisis in the global credit markets are the CLO and leveraged finance markets. In the current environment, liquidity in the credit markets has been reduced, resulting in an increase in credit spreads and a decline in ratings, performance and market values for leveraged loans. We have significant exposure to these markets through our investments in Cratos CLO I, Ltd. (the “CLO”) that issued notes to investors secured by a pool of corporate loans. We invested in deeply subordinated securities issued by the CLO, representing highly leveraged investments in the underlying collateral, which increases both the opportunity for higher returns as well as the magnitude of losses when compared to the other investors that rank more senior to us in right of payment. As a result of our subordinated position in the CLO, we and our investors are at greater risk of suffering losses.
The CLO market in which we invest has experienced an increase in downgrades, defaults and declines in market value and defaults in respect of leveraged loans in their collateral. The CLO has to comply with certain asset coverage tests, such as the amount of discounted obligations and “CCC” rating agency classified obligations it can hold. During any time the CLO exceeds such a limit, our ability as the CLO manager, to sell assets and reinvest available principal proceeds into substitute assets is restricted. In addition, defaulted obligations, discounted assets (those purchased below 85% of their par value) and assets rated “CCC” or lower in
22
Table of Contents
excess of applicable limits in the CLO’s investment criteria are not given full par credit for purposes of calculation of the CLO overcollateralization (“OC”) tests. As a result, many CLOs are failing or may in the future fail one or more of their overcollateralization tests. If this were to occur for our CLO, it could cause a diversion of cash flows away from us as holders of the subordinated CLO securities in favor of investors more senior than us in right of repayment, until the relevant overcollateralization tests are satisfied. Our CLO was in violation of the most junior OC test in 2009, and we were required to use a substantially all of the residual cash flows to buy additional collateral or to pay down the most senior note holders rather than distribute the money to us as owners of the subordinated notes. If the CLO continues to violate the most junior OC test, or any more senior tests, we will continue to see a diversion of cash flows away from us until the violation is cured. In the most extreme case, if the CLO were in violation of the most senior OC test, the most senior note holders would have the ability to declare an event of default and cause an acceleration all principal and interest outstanding on the notes. In addition, it is possible that the CLO’s collateral will be depleted before we realize a return on our CLO investments.
Although the credit markets in general and the leveraged loan market in particular, improved significantly in the second half of 2009, we were still in violation of our most junior overcollateralization test as of the end of the year. If we do not achieve compliance with this test we will continue to pay down the most senior CLO notes with our residual cash flow in the CLO.
The ability of the CLO to make interest payments to the holders of its senior notes is highly dependent upon the performance of the CLO collateral. If the collateral was to experience a significant decrease in cash flow due to an increased default level, the CLO may be unable to pay interest to the holders of the senior notes which would allow such holders to declare an event of default under the indenture governing the transaction and accelerate all principal and interest outstanding on the senior notes.
There can be no assurance that market conditions giving rise to these types of consequences will not occur, subsist or become more acute in the future.
We invest our own principal capital in equities and debt that expose us to a significant risk of capital loss.
We use a portion of our own capital in a variety of principal investment activities, each of which involves risks of illiquidity, loss of principal and revaluation of assets. At December 31, 2009, our gross principal investments included $59.1 million invested in other investments, of which $36.2 million was related to our family of funds, $15.0 million to New York Mortgage Trust, Inc. (“NYMT”) convertible preferred stock, $2.3 million to equity securities of private companies, $3.6 million to funds managed by third-parties, and $2.0 million to a joint venture. We also had $5.9 million invested in marketable securities in long positions, which includes our investments in NYMT common stock of $4.3 million, and $1.0 million invested through short positions on marketable securities. In addition, we have investments in private companies through loans and lines of credit, which as of December 31, 2009, are carried at $1.6 million net of reserves for credit losses. The companies in which we invest may rely on new or developing technologies or novel business models, or concentrate on markets which are or may be disproportionately impacted by pressures in the financial services and/or mortgage and real estate sectors, have not yet developed and which may never develop sufficiently to support successful operations, or their existing business operations may deteriorate or may not expand or perform as projected. As a result, we have suffered losses in the past and we may suffer losses from our principal investment activities in the future.
We have made and may make principal investments in relatively high-risk, illiquid assets that often have significantly leveraged capital structures, and we may fail to realize any profits from these activities for a considerable period of time or lose some or all of the principal amount we invest in these activities.
We may purchase equity securities and, to a lesser extent, debt securities, in venture capital, seed and other high risk financings of early-stage, pre-public or “mezzanine stage”, distressed situations and turnaround companies, as well as funds or other collective investment vehicles. We risk the loss of capital we have invested in these activities.
23
Table of Contents
We may use our capital, including on a leveraged basis in principal investments in both private company and public company securities that may be illiquid and volatile. The equity securities of a privately-held entity in which we make a principal investment are likely to be restricted as to resale and may otherwise be highly illiquid, potentially permanently so in the case of fund or similar investments. We expect that there will be restrictions on our ability to resell the securities of any such company that we acquire for a period of at least six months after we acquire those securities. Thereafter, a public market sale may be subject to volume limitations or dependent upon securing a registration statement for an initial and potentially secondary public offering of the securities. We may make principal investments that are significant relative to the overall capitalization of the investee company and resales of significant amounts of these securities might be subject to significant limitations and adversely affect the market and the sales price for the securities in which we invest. In addition, our principal investments may involve entities or businesses with capital structures that have significant leverage. The large amount of borrowing in the leveraged capital structure increases the risk of losses due to factors such as rising interest rates, downturns in the economy or deteriorations in the condition of the investment or its industry. In the event of defaults under borrowings, the assets being financed would be at risk of foreclosure, and we could lose our entire investment.
Even if we make an appropriate investment decision based on the intrinsic value of an enterprise, we cannot assure you that general market conditions will not cause the market value of our investments to decline. For example, an increase in interest rates, a general decline in the stock markets, or other market and industry conditions adverse to companies of the type in which we invest and intend to invest could result in a decline in the value of our investments or a total loss of our investment.
We may experience write downs of our investments and other losses related to the valuation of our investments and volatile and illiquid market conditions.
We have exposure to volatile or illiquid securities, including investments in companies which have and may hold mortgage-related products, such as residential and commercial mortgage-backed securities, mortgage loans, and other mortgage and real estate-related securities. We continue to have exposure to these markets and products and as market conditions continue to evolve the fair value of these mortgage-related instruments could deteriorate.
In addition, in our principal investment activities, our concentrated holdings, illiquidity and market volatility may make it difficult to value certain of our investment securities. Subsequent valuations, in light of factors then prevailing, may result in significant changes in the values of these securities in future periods. In addition, at the time of any sales and settlements of these securities, the price we ultimately realize will depend on the demand and liquidity in the market at that time and may be materially lower than their current fair value. Any of these factors could require us to take write downs in the value of our investment and securities portfolio, which may have an adverse effect on our results of operations in future periods.
Our businesses, profitability and liquidity may be adversely affected by deterioration in the credit quality of, or defaults by, third parties who owe us money, securities or other assets or whose securities or obligations we hold.
The amount and duration of our credit exposures have been increasing over the past year, as have the breadth and size of the entities to which we have credit exposures. We are exposed to the risk that third parties that owe us money, securities or other assets will not perform their obligations. These parties may default on their obligations to us due to bankruptcy, lack of liquidity, operational failure or other reasons. Declines in the market value of securities can result in the failure of buyers and sellers of securities to fulfill their settlement obligations, and in the failure of our clients to fulfill their credit obligations. During market downturns, counterparties to us in securities transactions may be less likely to complete transactions. In addition, particularly during market downturns, we may face additional expenses defending or pursuing claims or litigation related to counterparty or client defaults.
24
Table of Contents
Our businesses may be adversely affected by the disruptions in the credit markets, including reduced access to credit and liquidity and higher costs of obtaining credit.
Historically, we have satisfied our need for funding from internally generated funds, the net proceeds from our 2007 initial public offering, and our revolving credit facility with City National Bank. As a result of the low level of leverage that we have traditionally employed in our business model, we have not been forced to significantly curtail our business activities as a result of lack of credit sources and we believe that our capital resources are currently sufficient to continue to support our current business activities. In the event existing internal and external financial resources do not satisfy our needs, we would have to seek additional outside financing. The availability of outside financing will depend on a variety of factors, such as our financial condition and results of operations, the availability of acceptable collateral, market conditions, the general availability of credit, the volume of trading activities, and the overall availability of credit to the financial services industry.
Widening credit spreads, as well as significant declines in the availability of credit, could adversely affect our ability to borrow on an unsecured basis. Disruptions in the credit markets could make it harder and more expensive to obtain funding for our businesses. If our available funding is limited or we are forced to fund our operations at a higher cost, these conditions may require us to curtail our business activities and increase our cost of funding, both of which could reduce our profitability, particularly in our businesses that involve investing and taking principal positions.
Liquidity, or ready access to funds, is essential to financial services firms, including ours. Failures of financial institutions have often been attributable in large part to insufficient liquidity. Liquidity is of particular importance to our sales and trading business, and perceived liquidity issues may affect the willingness of our clients and counterparties to engage in sales and trading transactions with us. Our liquidity could be impaired due to circumstances that we may be unable to control, such as a general market disruption or an operational problem that affects our sales and trading clients, third parties or us. Further, our ability to sell assets may be impaired if other market participants are seeking to sell similar assets at the same time.
Our clients engaging us with respect to mergers and acquisitions often rely on access to the secured and unsecured credit markets to finance their transactions. The lack of available credit and the increased cost of credit could adversely affect the size, volume and timing of our clients’ merger and acquisition transactions—particularly large transactions—and adversely affect our investment banking business and revenues.
We are subject to net capital and other regulatory capital requirements; failure to comply with these rules would significantly harm our business.
JMP Securities LLC, our broker-dealer subsidiary, is subject to the net capital requirements of the SEC, the Financial Industry Regulatory Authority (“FINRA”) and various self-regulatory organizations of which it is a member. These requirements typically specify the minimum level of net capital a broker-dealer must maintain and also mandate that a significant part of its assets be kept in relatively liquid form. Failure to maintain the required net capital may subject a firm to limitation of its activities, including suspension or revocation of its registration by the SEC and suspension or expulsion by the FINRA and other regulatory bodies, and ultimately may require its liquidation. Failure to comply with the net capital rules could have material and adverse consequences, such as:
| • | limiting our operations that require intensive use of capital, such as underwriting or trading activities; or |
| • | restricting us from withdrawing capital from our subsidiaries, when our broker-dealer subsidiary has more than the minimum amount of required capital. This, in turn, could limit our ability to implement our business and growth strategies, pay interest on and repay the principal of our debt and/or repurchase our shares. |
25
Table of Contents
In addition, a change in the net capital rules or the imposition of new rules affecting the scope, coverage, calculation, or amount of net capital requirements, or a significant operating loss or any large charge against net capital, could have similar adverse effects.
Furthermore, JMP Securities LLC is subject to laws that authorize regulatory bodies to block or reduce the flow of funds from it to JMP Group Inc. As a holding company, JMP Group Inc. depends on dividends, distributions and other payments from its subsidiaries to fund dividend payments and to fund all payments on its obligations, including debt obligations. As a result, regulatory actions could impede access to funds that JMP Group Inc. needs to make payments on obligations, including debt obligations, or dividend payments. In addition, because JMP Group Inc. holds equity interests in the firm’s subsidiaries, its rights as an equity holder to the assets of these subsidiaries may not materialize, if at all, until the claims of the creditors of these subsidiaries are first satisfied.
There are contractual, legal and other restrictions that may prevent us from paying cash dividends on our common stock and, as a result, you may not receive any return on investment unless you sell your common stock for a price greater than the price for which you paid.
Although we have paid a quarterly dividend on our common stock since our initial public offering, there can be no assurance that in the future sufficient cash will be available to pay such dividends and our board of directors may at any time modify or revoke our current dividend policy. Any decision to declare and pay dividends in the future will be made at the discretion of our board of directors and will depend on, among other things, our results of operations, financial condition, cash requirements, contractual restrictions and other factors that our board of directors may deem relevant. We do not intend to borrow funds in order to pay dividends. In addition, JMP Group Inc., the entity from which we make our dividend payments, is a holding company that does not conduct any business operations of its own, and therefore, it is dependent upon cash dividends and other transfers from our subsidiaries to make dividend payments on its common stock. The amounts available to us to pay cash dividends are restricted by existing and future debt agreements. In general, under the credit agreement governing our revolving line of credit and term loan with City National Bank, which expires on December 31, 2013, JMP Group LLC (our wholly owned subsidiary through which we own JMP Securities and Harvest Capital Strategies) is restricted under certain circumstances from paying dividends or making other distributions to us if an event of default has occurred under that agreement. SEC regulations also provide that JMP Securities may not pay cash dividends to us if certain minimum net capital requirements are not met. In addition, Delaware law permits the declaration of dividends only to the extent of our surplus (which is defined as total assets at fair market value minus total liabilities, minus statutory capital), or if there is no surplus, out of our net profits for the then current and/or immediately preceding fiscal years. In the event we do not pay cash dividends on our common stock as a result of these restrictions, you may not receive any return on an investment in our common stock unless you sell your common stock for a price greater than the price for which you paid.
We may incur losses as a result of ineffective risk management processes and strategies.
We seek to monitor and control our risk exposure through operational and compliance reporting systems, internal controls, management review processes and other mechanisms. Our investing and trading processes seek to balance our ability to profit from investment and trading positions with our exposure to potential losses. While we employ limits and other risk mitigation techniques, those techniques and the judgments that accompany their application cannot anticipate economic and financial outcomes or the specifics and timing of such outcomes. Thus, we may, in the course of our investment and trading activities, incur losses, which may be significant.
In addition, we are investing our own capital in our funds and funds of funds as well as principal investing activities, and limitations on our ability to withdraw some or all of our investments in these funds or liquidate our investment positions, whether for legal, reputational, illiquidity or other reasons, may make it more difficult for us to control the risk exposures relating to these investments.
26
Table of Contents
Our risk management policies and procedures may leave us exposed to unidentified or unanticipated risks.
Our risk management strategies and techniques may not be fully effective in mitigating our risk exposure in all market environments or against all types of risk.
We are exposed to the risk that third parties that owe us money, securities or other assets will not perform their obligations. These parties may default on their obligations to us due to bankruptcy, lack of liquidity, operational failure, and breach of contract or other reasons. We are also subject to the risk that our rights against third parties may not be enforceable in all circumstances. As an introducing broker, we could be held responsible for the defaults or misconduct of our customers. These may present credit concerns, and default risks may arise from events or circumstances that are difficult to detect, foresee or reasonably guard against. In addition, concerns about, or a default by, one institution could lead to significant liquidity problems, losses or defaults by other institutions, which in turn could adversely affect us. If any of the variety of instruments, processes and strategies we utilize to manage our exposure to various types of risk are not effective, we may incur losses.
Our operations and infrastructure and those of the service providers upon which we rely may malfunction or fail.
Our businesses are highly dependent on our ability to process, on a daily basis, a large number of transactions across diverse markets, and the transactions we process have become increasingly complex. The inability of our systems to accommodate an increasing volume of transactions could also constrain our ability to expand our businesses. If any of these systems do not operate properly or are disabled, or if there are other shortcomings or failures in our internal processes, people or systems, we could suffer impairments, financial loss, a disruption of our businesses, liability to clients, regulatory intervention or reputational damage.
We have outsourced certain aspects of our technology infrastructure, administration and general service providers, including data centers, disaster recovery systems, and wide area networks, as well as some trading applications. We are dependent on our providers to manage and monitor those functions. A disruption of any of the outsourced services would be out of our control and could negatively impact our business. We have experienced disruptions on occasion, none of which has been material to our operations and results. However, there can be no guarantee that future disruptions with these providers will not occur.
We also face the risk of operational failure or termination of relations with any of the clearing agents, exchanges, clearing houses or other financial intermediaries we use to facilitate our securities transactions. Any such failure or termination could adversely affect our ability to effect transactions and to manage our exposure to risk.
In addition, our ability to conduct business may be adversely impacted by a disruption in the infrastructure that supports our businesses and the communities in which we are located. This may affect, among other things, our financial, accounting or other data processing systems. This may include a disruption involving electrical, communications, transportation or other services used by us or third parties with which we conduct business, whether due to fire, earthquakes or other natural disasters, power or communications failure, act of terrorism or war or otherwise. Nearly all of our employees in our primary locations in San Francisco, New York City, Boston and Chicago work in close proximity to each other. Although we have a formal disaster recovery plan in place, if a disruption occurs in one location and our employees in that location are unable to communicate with or travel to other locations, our ability to service and interact with our clients may suffer, and we may not be able to implement successfully contingency plans that depend on communication or travel.
Our operations also rely on the secure processing, storage and transmission of confidential and other information in our computer systems and networks. Although we take protective measures and endeavor to modify them as circumstances warrant, our computer systems, software and networks may be vulnerable to unauthorized access, computer viruses or other malicious code and other events that could have a security impact. If one or more of such events occur, this could jeopardize our or our clients’ or counterparties’
27
Table of Contents
confidential and other information processed and stored in, and transmitted through, our computer systems and networks, or otherwise cause interruptions or malfunctions in our, our clients’, our counterparties’ or third parties’ operations. We may be required to expend significant additional resources to modify our protective measures, to investigate and remediate vulnerabilities or other exposures or to make required notifications, and we may be subject to litigation and financial losses that are either not insured or not fully covered through any insurance maintained by us.
We are subject to risks in using prime brokers and custodians.
Our asset management subsidiary and its managed funds depend on the services of prime brokers and custodians to settle and report securities transactions. In the event of the insolvency of a prime broker or custodian, our funds might not be able to recover equivalent assets in whole or in part as they will rank among the prime broker’s and the custodian’s unsecured creditors in relation to assets which the prime broker or custodian borrows, lends or otherwise uses. In addition, cash held by our funds with the prime broker or custodian will not be segregated from the prime broker’s or custodian’s own cash, and the funds will therefore rank as unsecured creditors in relation thereto.
The demands of running a public company could require our senior management to devote more time to regulatory and other requirements.
Following our initial public offering in May 2007, we became subject to significant additional regulatory and reporting requirements, including under the Securities Exchange Act of 1934, as amended, the Sarbanes-Oxley Act and the NYSE listed company rules. Our senior management is required to devote more of their time to meeting these additional requirements. Since inception, our senior management has been actively involved in the revenue generating activities of our operations. For example, Joseph Jolson, our chief executive officer, continues to manage Harvest Opportunity Partners II, L.P. and its related funds. In the future, the demands of managing a public company may require Mr. Jolson to be less actively involved in these responsibilities and to rely on others to a greater extent for these responsibilities. If our senior management is required to devote more time to the additional requirements of managing a public company, and we are unable to successfully transition some or all of the direct revenue generating responsibilities of our senior management to other suitable professionals, our reputation, business, results of operations and financial condition may be harmed.
Strategic investments or acquisitions and joint ventures, or our entry into new business areas, may result in additional risks and uncertainties in our business.
We intend to grow our core businesses both through internal expansion and through strategic investments, acquisitions or joint ventures. When we make strategic investments, acquisitions or enter into joint ventures, we face numerous risks and uncertainties in combining or integrating the relevant businesses and systems. In addition, conflicts or disagreements between us and the other members of a venture may negatively impact our businesses. In addition, future acquisitions or joint ventures may involve the issuance of additional shares of our common stock, which may dilute your ownership in our firm. Furthermore, any future acquisitions of businesses or facilities by us could entail a number of risks, including:
| • | problems with the effective integration of operations; |
| • | the inability to maintain key pre-acquisition business relationships and integrate new relationships; |
| • | increased operating costs; |
| • | exposure to unanticipated liabilities; |
| • | risks of misconduct by employees not subject to our control; |
| • | difficulties in realizing projected efficiencies, synergies and cost savings; and |
| • | exposure to new or unknown liabilities. |
28
Table of Contents
Any future growth of our business, such as further expansion of our asset management or principal investment activities, may require significant resources and/or result in significant unanticipated losses, costs or liabilities. In addition, expansions, acquisitions or joint ventures may require significant managerial attention, which may be diverted from our other operations. These capital, equity and managerial commitments may impair the operation of our businesses.
Risks Related to Our Investment in New York Mortgage Trust, Inc.
As discussed further in Item 8. Note 2 to our consolidated financial statements, on January 18, 2008, we (including certain unconsolidated affiliates) made an investment in convertible preferred stock of New York Mortgage Trust, Inc. (“NYMT”), a publicly traded real estate investment trust engaged in the investment management of mortgage-backed securities and high credit quality residential adjustable rate mortgage loans. Such investment by JMP Group Inc. and affiliated entities was $20.0 million in total, comprised of $5.0 million by JMP Group Inc., $5.0 million by certain funds managed by Harvest Capital Strategies LLC, and $10.0 million by JMP Realty Trust, Inc. (“JMPRT”). JMPRT’s investment in NYMT was transferred to Harvest Mortgage Opportunities Partners (“HMOP”) on January 2, 2009. In addition, JMP Group Inc. invested $4.5 million in the common stock of NYMT on February 14, 2008 through a private investment public equity (PIPE) transaction.
The risks related to our investment in NYMT are set forth in NYMT’s Exchange Act public filings and include but are not limited to the following:
Declines in the market values of assets in NYMT’s investment portfolio may adversely affect periodic reported results and credit availability, which may reduce earnings and, in turn, cash available for distribution to NYMT stockholders.
The market value of the interest-bearing assets in which NYMT invests, most notably RMBS and purchased prime ARM loans and any related hedging instruments, may move inversely with changes in interest rates. NYMT anticipates that increases in interest rates will tend to decrease its net income and the market value of its interest-bearing assets. Substantially all of the RMBS and CLO within NYMT’s investment portfolio is classified for accounting purposes as “available for sale.” Changes in the market values of trading securities will be reflected in earnings and changes in the market values of available for sale securities will be reflected in NYMT’s stockholders’ equity. As a result, a decline in market values may reduce the book value of NYMT’s assets. Moreover, if the decline in market value of an available for sale security is other than temporary, such decline will reduce earnings.
A decline in the market value of NYMT RMBS and other interest-bearing assets, such as the decline NYMT experienced during the market disruption in March 2008, may adversely affect NYMT, particularly in instances where NYMT has borrowed money based on the market value of those assets. If the market value of those assets declines, the lender may require NYMT to post additional collateral to support the loan, which would reduce NYMT’s liquidity and limit NYMT’s ability to leverage its assets.
In addition, if NYMT were, or anticipates being, unable to post the additional collateral, NYMT would have to sell the assets at a time when it might not otherwise choose to do so. In the event that NYMT does not have sufficient liquidity to meet such requirements, lending institutions may accelerate indebtedness, increase interest rates and terminate NYMT’s ability to borrow, any of which could result in a rapid deterioration of NYMT’s financial condition and cash available for distribution to its stockholders. Moreover, if NYMT liquidates the assets at prices lower than the amortized cost of such assets, it will incur losses.
NYMT may change its investment strategy, operating policies and/or asset allocations without stockholder consent, any of which could result in losses.
NYMT may change its investment strategy, operating policies and/or asset allocation with respect to investments, acquisitions, leverage, growth, operations, indebtedness, capitalization and distributions at any time without the consent of NYMT’s stockholders, which may result in riskier investments. For example, during 2009,
29
Table of Contents
NYMT commenced investments pursuant to an alternative investment strategy adopted by its management that was focused on a broad range of real estate- and financial-related assets that differ in structure, risk and potential return, among other things, from the Agency RMBS that NYMT had focused its investment efforts on since 2007. NYMT will continue to consider a broad range of assets for investment, including those outside of its targeted asset class, that it believe will be accretive to earnings and may allow it to utilize all or a portion of an approximately $62.2 million net operating loss carry-forward. The assets NYMT may acquire in the future are comprised of a broad range of asset classes and types and may be different than NYMT’s historical investments. A change in NYMT’s investment strategy may increase its exposure to interest rate and/or credit risk, default risk and real estate market fluctuations. Furthermore, a change in NYMT’s asset allocation could result in its making investments in asset categories different from its historical investments and in which it has limited or no investment experience. These changes could result in a decline in earnings or losses which could adversely affect NYMT’s financial condition, results of operations, the market price of its common stock or its ability to pay dividends.
Continued adverse developments in the residential mortgage market, and the economy generally, may adversely affect NYMT’s business, particularly the ability of NYMT to acquire RMBS and the value of the RMBS that NYMT holds in its portfolio as well as its ability to finance or sell its RMBS.
In recent years, the residential mortgage market in the United States has experienced a variety of difficulties and changed economic conditions, including declining home values, heightened defaults, credit losses and liquidity concerns. News of potential and actual security liquidations as a result of those economic difficulties has increased the volatility of many financial assets, including RMBS. These disruptions materially adversely affected the performance and market value in recent years of the RMBS in NYMT’s portfolio and prime ARM loans held in securitization trusts, as well as other interest-earning assets that NYMT may consider acquiring in the future. Securities backed by residential mortgage loans originated in 2006 and 2007 have had higher and earlier than expected rates of delinquencies. In addition, while most economists believe the recession ended in the fourth quarter of 2009, housing prices continue to fall in certain areas around the country while unemployment rates have risen sharply during the past year, which will further increase the risk for higher delinquency rates. Many RMBS and other interest-earning assets have been downgraded by rating agencies in recent years, and rating agencies may further downgrade these securities in the future. Lenders have imposed additional and more stringent equity requirements necessary to finance these assets, particularly in the case of non-Agency securities, and frequent impairments based on mark-to-market valuations have generated substantial collateral calls in the industry. As a result of these difficulties and changed economic conditions, many companies operating in the mortgage specialty finance sectors have failed and others, including Fannie Mae and Freddie Mac, continue to face serious operating and financial challenges. While the U.S. Federal Reserve has taken certain actions in an effort to ameliorate the current market conditions, and the U.S. Treasury and the Federal Housing Finance Agency, or FHFA, which is the federal regulator now assigned to oversee Fannie Mae and Freddie Mac, are also taking actions, despite reported stabilization in some sectors, these efforts may ultimately be ineffective. As a result of these factors, among others, the market for these securities may be adversely affected for a significant period of time.
During the past two years, housing prices and appraisal values in many states have declined or stopped appreciating, after extended periods of significant appreciation. A continued decline or an extended flattening of those values may result in additional increases in delinquencies and losses on residential mortgage loans generally, particularly with respect to second homes and investor properties and with respect to any residential mortgage loans, the aggregate loan amounts of which (including any subordinate liens) are close to or greater than the related property values.
Fannie Mae and Freddie Mac guarantee the payments of principal and interest on the Agency RMBS in NYMT’s portfolio even if the borrowers of the underlying mortgage loans default on their payments. However, rising delinquencies and market perception can still negatively affect the value of NYMT’s Agency RMBS or create market uncertainty about their true value. While the market disruptions have been most pronounced in the
30
Table of Contents
non-Agency RMBS market, the impact has extended to Agency RMBS. During a significant portion of 2008, the value of Agency RMBS were unstable and relatively illiquid compared to prior periods.
Agency RMBS guaranteed by Fannie Mae and Freddie Mac are not supported by the full faith and credit of the United States. Fannie Mae and Freddie Mac have suffered significant losses and, despite significant steps taken by the U.S. government to stabilize these entities, Fannie Mae and Freddie Mac could default on their guarantee obligations, which would materially and adversely affect the value of NYMT’s RMBS or other Agency indebtedness in which we may invest in the future. The U.S. Treasury plans to release a preliminary report on the future of Fannie Mae and Freddie Mac in the near future, which report may recommend the abolishment of Fannie Mae and Freddie Mac in favor of a new system.
NYMT generally post its Agency RMBS, and it may in the future post non-Agency RMBS, as collateral for NYMT’s borrowings under repurchase agreements. Any decline in their value, or perceived market uncertainty about their value, would make it more difficult for NYMT to obtain financing on favorable terms or at all, or to maintain NYMT’s compliance with the terms of any financing arrangements. The value of RMBS may decline for several reasons, including, for example, rising delinquencies and defaults, increases in interest rates, falling home prices and credit uncertainty at Fannie Mae or Freddie Mac. In addition, in recent years, repurchase lenders have been requiring higher levels of collateral to support loans collateralized by RMBS than they have in the past, making borrowings more difficult and expensive. At the same time, market uncertainty about residential mortgage loans in general could continue to depress the market for RMBS, which means that it may be more difficult for NYMT to sell RMBS on favorable terms or at all. Further, a decline in the value of RMBS, particularly Agency RMBS, could subject NYMT to margin calls, for which it may have insufficient liquidity to support, resulting in forced sales of its assets at inopportune times. If market conditions result in a decline in available purchasers of RMBS or the value of NYMT’s RMBS, NYMT’s financial position and results of operations could be adversely affected.
The conservatorship of Fannie Mae and Freddie Mac and related efforts, along with any changes in laws and regulations affecting the relationship between Fannie Mae and Freddie Mac and the U.S. government, may adversely affect NYMT’s business.
The payments NYMT expects to receive on the Agency RMBS it holds in its portfolio and in which it invests depend upon a steady stream of payments on the mortgages underlying the securities and are guaranteed by Ginnie Mae, Fannie Mae and Freddie Mac. Ginnie Mae is part of a U.S. government agency and its guarantees are backed by the full faith and credit of the United States. Fannie Mae and Freddie Mac are U.S. government-sponsored enterprises, but their guarantees are not backed by the full faith and credit of the United States.
Since 2007, Fannie Mae and Freddie Mac have reported substantial losses and a need for substantial amounts of additional capital. In response to the deteriorating financial condition of Fannie Mae and Freddie Mac and the recent credit market disruption, Congress and the U.S. Treasury undertook a series of actions to stabilize these government-sponsored entities and the financial markets, generally, including placing Fannie Mae and Freddie Mac into conservatorship on September 7, 2008. The conservatorship of Fannie Mae and Freddie Mac and certain other actions taken by the U.S. Treasury and U.S. Federal Reserve were designed to boost investor confidence in Fannie Mae’s and Freddie Mac’s debt and mortgage-backed securities. The U.S. government program includes contracts between the U.S. Treasury and each government-sponsored enterprise to seek to ensure that each enterprise maintains a positive net worth. Each contract had an original capacity of $200.0 billion, but now has no cap. Each contract provides for the provision of cash by the U.S. Treasury to the government-sponsored enterprise if FHFA determines that its liabilities exceed its assets. Freddie Mac has drawn $60.0 billion and Fannie Mae has drawn $51.0 billion under these contracts. Both Fannie Mae and Freddie Mac have indicated they will need to request additional draws this year, and it is possible the draw request will not be granted. Although the U.S. government has described some specific steps and reforms that it intends to take as part of the conservatorship process, efforts to stabilize these entities may not be successful and the outcome and impact of these events remain highly uncertain.
31
Table of Contents
Although the U.S. government has committed capital to Fannie Mae and Freddie Mac, there can be no assurance that the capital infusions will be adequate for their needs. If the financial support is inadequate, these companies could continue to suffer losses and could fail to honor their guarantees and other obligations. In June 2009, as part of the Obama administration’s far reaching financial industry recovery proposal, the U.S. Treasury announced that it and the Department of Housing and Urban Development, in consultation with other government agencies, plans to engage in a wide-ranging initiative to develop recommendations on the future of Fannie Mae and Freddie Mac, and the Federal Home Loan Bank System. The future roles of Fannie Mae and Freddie Mac could be significantly reduced and the nature of their guarantees could be considerably limited relative to historical measurements. A preliminary report on these future roles is expected to be released by the U.S. Treasury in the near future. Any changes to the nature of the guarantees provided by Fannie Mae and Freddie Mac could redefine what constitutes Agency RMBS and could have broad adverse implications for the market and for NYMT’s business.
The U.S. Treasury’s RMBS purchase program is expected to end in the first quarter of 2010. The U.S. Treasury will have purchased $220.0 billion in RMBS when this program ends. The U.S. Treasury can hold its portfolio of RMBS to maturity and, based on mortgage market conditions, may make adjustments to the portfolio. This flexibility may adversely affect the pricing and availability for RMBS, particularly Agency RMBS. It is also possible that the U.S. Treasury could decide to purchase Agency securities in the future, which could create additional demand that would negatively affect the pricing of RMBS that NYMT seeks to acquire.
The U.S. Treasury could also stop providing credit support to Fannie Mae and Freddie Mac in the future. The problems faced by Fannie Mae and Freddie Mac resulting in their being placed into conservatorship have stirred debate among some federal policy makers regarding the continued role of the U.S. government in providing liquidity for mortgage loans. The U.S. Treasury plans to release a preliminary report of the future of Fannie Mae and Freddie Mac in February 2010. Each of Fannie Mae and Freddie Mac could be dissolved and the U.S. government could determine to stop providing liquidity support of any kind to the mortgage market. If Fannie Mae or Freddie Mac were eliminated, NYMT would not be able, or if their structures were to change radically, NYMT might not be able, to acquire Agency RMBS from these companies, which would adversely affect its current business model.
NYMT’s income also could be negatively affected in a number of ways depending on the manner in which related events unfold. For example, the current credit support provided by the U.S. Treasury to Fannie Mae and Freddie Mac, and any additional credit support it may provide in the future, could have the effect of lowering the interest rates NYMT expects to receive from the Agency RMBS in its portfolio and in which it invests, thereby tightening the spread between the interest NYMT earns on its portfolio of targeted assets and its cost of financing that portfolio. A reduction in the supply of Agency RMBS could also negatively affect the pricing of the Agency RMBS held in NYMT’s portfolio and in which it invests by reducing the spread between the interest NYMT earns on its portfolio of targeted assets and its cost of financing that portfolio.
As indicated above, recent legislation has changed the relationship between Fannie Mae and Freddie Mac and the U.S. government. Future legislation could further change the relationship between Fannie Mae and Freddie Mac and the U.S. government, and could also nationalize or eliminate such entities entirely. In January 2010, House Financial Services Committee Chairman, Barney Frank, was reported to have indicated that his Committee would recommend abolishing Fannie Mae and Freddie Mac in their current form in favor of a whole new system of housing finance. Any law affecting these government-sponsored enterprises may create market uncertainty and have the effect of reducing the actual or perceived credit quality of securities issued or guaranteed by Fannie Mae or Freddie Mac. As a result, such laws could increase the risk of loss on investments in Fannie Mae and/or Freddie Mac Agency RMBS. It also is possible that such laws could adversely impact the market for RMBS and spreads at which such securities trade. All of the foregoing could materially adversely affect NYMT’s business, operations and financial condition.
32
Table of Contents
Mortgage loan modification programs and future legislative action may adversely affect the value of, and the returns, on the interest-earning assets in which NYMT invests.
In late 2008, the U.S. government, through the Federal Housing Authority and the Federal Deposit Insurance Corporation, or FDIC, commenced implementation of programs designed to provide homeowners with assistance in avoiding residential mortgage loan foreclosures. The programs involve, among other things, modifications of mortgage loans to reduce the principal amount of the loans or the rate of interest payable on the loans, or to extend the payment terms of the loans. In addition, members of the U.S. Congress have indicated support for additional legislative relief for homeowners, including an amendment of the bankruptcy laws to permit the modification of mortgage loans in bankruptcy proceedings. These loan modification programs, as well as future legislative or regulatory actions, including amendments to the bankruptcy laws, that result in the modification of outstanding mortgage loans may adversely affect the value of, and the returns on, the interest-earning assets in which NYMT invests, including through prepayments on the mortgage loans underlying its RMBS and the mortgage loans held in its securitization trusts.
Loan delinquencies on NYMT’s prime ARM loans held in securitization trusts may increase as a result of significantly increased monthly payments required from ARM borrowers after the initial fixed period.
The scheduled increase in monthly payments on certain adjustable rate mortgage loans held in NYMT’s securitization trusts may result in higher delinquency rates on those mortgage loans and could have a material adverse affect on NYMT’s net income and results of operations. This increase in borrowers’ monthly payments, together with any increase in prevailing market interest rates, may result in significantly increased monthly payments for borrowers with adjustable rate mortgage loans. Borrowers seeking to avoid these increased monthly payments by refinancing their mortgage loans may no longer be able to fund available replacement loans at comparably low interest rates or at all. A decline in housing prices may also leave borrowers with insufficient equity in their homes to permit them to refinance their loans or sell their homes. In addition, these mortgage loans may have prepayment premiums that inhibit refinancing.
NYMT may be required to repurchase loans if it breached representations and warranties from loan sale transactions, which could harm its profitability and financial condition.
Loans from NYMT’s discontinued mortgage lending operations that were sold to third parties under agreements include numerous representations and warranties regarding the manner in which the loan was originated, the property securing the loan and the borrower. If these representations or warranties are found to have been breached, NYMT may be required to repurchase the loan. NYMT may be forced to resell these repurchased loans at a loss, which could harm NYMT’s profitability and financial condition.
The mortgage loans NYMT may invest directly in and those underlying NYMT’s CMBS and RMBS are subject to delinquency, foreclosure and loss, which could result in losses to NYMT.
NYMT’s investment strategy permits it to consider a broad range of asset types, including CMBS, non-Agency RMBS and other mortgage assets, including mortgage loans. Commercial mortgage loans are secured by multi-family or commercial property. They are subject to risks of delinquency and foreclosure, and risks of loss that are greater than similar risks associated with loans made on the security of single-family residential property. The ability of a borrower to repay a loan secured by an income-producing property typically is dependent primarily upon the successful operation of the property rather than upon the existence of independent income or assets of the borrower. If the net operating income of the property is reduced, the borrower’s ability to repay the loan may be impaired. Such income can be affected by many factors.
Residential mortgage loans are secured by single-family residential property. They are subject to risks of delinquency and foreclosure, and risks of loss. The ability of a borrower to repay a loan secured by a residential property depends on the income or assets of the borrower. Many factors may impair borrowers’ abilities to repay their loans. ABS are bonds or notes backed by loans or other financial assets.
33
Table of Contents
In the event of any default under a mortgage loan held directly by NYMT, NYMT will bear a risk of loss of principal to the extent of any deficiency between the value of the collateral and the principal and accrued interest of the mortgage loan. This could impair NYMT’s cash flow from operations. In the event of the bankruptcy of a mortgage loan borrower, the loan will be deemed secured only to the extent of the value of the underlying collateral at the time of bankruptcy (as determined by the bankruptcy court). The lien securing the mortgage loan will be subject to the avoidance powers of the bankruptcy trustee or debtor-in-possession to the extent the lien is unenforceable under state law.
Foreclosure of a mortgage loan can be expensive and lengthy. This could impair NYMT’s anticipated return on the foreclosed mortgage loan. Moreover, RMBS represent interests in or are secured by pools of residential mortgage loans and CMBS represent interests in or are secured by a single commercial mortgage loan or a pool of commercial mortgage loans. To the extent a foreclosure or loss occurs on the underlying mortgage loan, NYMT will receive less principal and interest from that security in the future. Accordingly, the CMBS and non-Agency RMBS NYMT may invest in are subject to all of the risks of the underlying mortgage loans.
NYMT’s investments in subordinated CMBS or RMBS could subject NYMT to increased risk of losses.
NYMT may also invest in securities that represent subordinated tranches of CMBS or non-Agency RMBS. In general, losses on an asset securing a mortgage loan included in a securitization will be borne first by the equity holder of the property, then by any cash reserve fund or letter of credit provided by the borrower, and then by the first loss subordinated security holder. In the event of default and the exhaustion of any equity support, reserve fund, letter of credit—and any classes of securities junior to those in which NYMT invests—NYMT may not be able to recover all of its investment in the securities it purchases. In addition, if the underlying mortgage portfolio has been overvalued by the originator, or if the values subsequently decline and, as a result, less collateral is available to satisfy delinquent interest and principal payments due on the related CMBS or RMBS, the securities in which NYMT invests may effectively become the first loss position behind the more senior securities, which may result in significant losses to NYMT.
The prices of lower credit quality securities are generally less sensitive to interest rate changes than more highly rated investments, but more sensitive to adverse economic downturns or individual issuer developments. A projection of an economic downturn, for example, could cause a decline in the price of lower credit quality securities because the ability of obligors of mortgages underlying mortgage-backed securities to make principal and interest payments or to refinance may be impaired. In this case, existing credit support in the securitization structure may be insufficient to protect NYMT against loss of its principal on these securities.
NYMT may invest in high yield or subordinated and lower rated securities that have greater risks of loss than other investments, which could adversely affect its business, financial condition and cash available for dividends.
NYMT may invest in high yield or subordinated or lower rated securities, which involve a higher degree of risk than other investments. Numerous factors may affect a company’s ability to repay its high yield or subordinated securities, including the failure to meet its business plan, a downturn in its industry or negative economic conditions. These securities may not be secured by mortgages or liens on assets. NYMT’s right to payment and security interest with respect to such securities may be subordinated to the payment rights and security interests of the senior lender. Therefore, NYMT may be limited in its ability to enforce its rights to collect these loans and to recover any of the loan balance through a foreclosure of collateral.
34
Table of Contents
Continued adverse developments in the residential mortgage market and financial markets, including recent mergers, acquisitions or bankruptcies of potential repurchase agreement counterparties, as well as defaults, credit losses and liquidity concerns, could make it difficult for NYMT to borrow money to fund its investment strategy or continue to fund its investment portfolio on a leveraged basis, on favorable terms or at all, which could adversely affect NYMT’s profitability.
NYMT relies on the availability of financing to acquire Agency RMBS and to fund its investment portfolio on a leveraged basis. Since March 2008, there have been several announcements of proposed mergers, acquisitions or bankruptcies of investment banks and commercial banks that have historically acted as repurchase agreement counterparties. This has resulted in a fewer number of potential repurchase agreement counterparties operating in the market and reduced financing capacity. In addition, many commercial banks, investment banks and insurance companies have announced extensive losses from exposure to the residential mortgage market. These losses have reduced financial industry capital, leading to reduced liquidity for some institutions. Institutions from which NYMT seeks to obtain financing may have owned or financed RMBS which have declined in value and caused them to suffer losses as a result of the recent downturn in the residential mortgage market. If these conditions persist, these institutions may be forced to exit the repurchase market, merge with another counterparty, become insolvent or further tighten their lending standards or increase the amount of equity capital or haircut required to obtain financing. Moreover, because NYMT’s equity market capitalization places it at the low end of market capitalization among all mortgage REITs, continued adverse developments in the residential mortgage market may cause some of NYMT’s lenders to reduce or terminate its access to future borrowings before those of its competitors. Any of these events could make it more difficult for NYMT to obtain financing on favorable terms or at all. NYMT’s profitability will be adversely affected if it is unable to obtain cost-effective financing for its investments.
Failure to procure adequate debt financing, or to renew or replace existing debt financing as it matures, would adversely affect NYMT’s results and may, in turn, negatively affect the value of NYMT’s common stock and NYMT’s ability to distribute dividends.
NYMT uses debt financing as a strategy to increase its return on investment securities in its investment portfolio. However, NYMT may not be able to achieve its desired debt-to-equity ratio for a number of reasons, including the following:
| • | NYMT’s lenders do not make debt financing available to NYMT at acceptable rates; or |
| • | NYMT’s lenders require that NYMT pledges additional collateral to cover its borrowings, which it may be unable to do. |
The dislocations in the residential mortgage market and credit markets have led lenders, including the financial institutions that provide financing for NYMT’s investment securities, to heighten their credit review standards, and, in some cases, to reduce or eliminate loan amounts available to borrowers. As a result, NYMT cannot assure you that any, or sufficient, debt funding will be available to NYMT in the future on terms that are acceptable to NYMT. In the event that NYMT cannot obtain sufficient funding on acceptable terms, there may be a negative impact on the value of NYMT’s common stock and its ability to make distributions, and you may lose part or all of your investment.
Furthermore, because NYMT relies primarily on short-term borrowings to finance its investment securities, NYMT’s ability to achieve its investment objective depends not only on its ability to borrow money in sufficient amounts and on favorable terms, but also on its ability to renew or replace on a continuous basis its maturing short-term borrowings. As of December 31, 2009, substantially all of NYMT’s borrowings under repurchase agreements bore maturities of 30 days or less. If NYMT is not able to renew or replace maturing borrowings, NYMT will have to sell some or all of its assets, possibly under adverse market conditions.
35
Table of Contents
The repurchase agreements that NYMT uses to finance its investments may require it to provide additional collateral, which could reduce its liquidity and harm its financial condition.
NYMT intends to use repurchase agreements to finance its investments. If the market value of the loans or securities pledged or sold by NYMT to a funding source decline in value, NYMT may be required by the lending institution to provide additional collateral or pay down a portion of the funds advanced, but NYMT may not have the funds available to do so. Posting additional collateral to support its repurchase agreements will reduce NYMT’s liquidity and limit its ability to leverage its assets. In the event NYMT does not have sufficient liquidity to meet such requirements, lending institutions can accelerate NYMT’s indebtedness, increase NYMT’s borrowing rates, liquidate NYMT’s collateral at inopportune times and terminate NYMT’s ability to borrow. This could result in a rapid deterioration of NYMT’s financial condition and possibly require it to file for protection under the U.S. Bankruptcy Code.
Risks Related to Our Industry
Difficult market conditions could adversely affect our business in many ways.
Difficult market and economic conditions, the level and volatility of interest rates, investor sentiment and political events have in the past adversely affected and may in the future adversely affect our business and profitability in many ways. Weakness in equity markets and diminished trading volume of securities could adversely impact our sales and trading business. Industry-wide declines in the size and number of underwritings and mergers and acquisitions transactions also would likely have an adverse effect on our revenues. In addition, reductions in the trading prices for equity securities also tend to reduce the transaction value of investment banking transactions, such as underwriting and mergers and acquisitions transactions, which in turn may reduce the fees we earn from these transactions. As we may be unable to reduce expenses correspondingly, our net income and net income margins may decline.
Significantly expanded corporate governance and public disclosure requirements may result in fewer initial public offerings and discourage companies from engaging in capital market transactions, which may reduce the number of investment banking opportunities available to pursue.
Highly-publicized financial scandals in recent years have led to investor concerns over the integrity of the U.S. financial markets, and have prompted the U.S. Congress, the SEC, the NYSE and NASDAQ to significantly expand corporate governance and public disclosure requirements. To the extent that private companies, in order to avoid becoming subject to these new requirements, decide to forgo initial public offerings, our equity underwriting business may be adversely affected. In addition, provisions of the Sarbanes-Oxley Act and the corporate governance rules imposed by self-regulatory organizations have diverted the attention of many companies away from capital market transactions, including securities offerings and acquisition and disposition transactions. In particular, companies that either are or are planning to become public companies are incurring significant expenses in complying with the SEC and reporting requirements relating to internal control over financial reporting, and companies that disclose material weaknesses in such controls under the new standards may have greater difficulty accessing the capital markets. These factors, in addition to adopted or proposed accounting and disclosure changes, may have an adverse effect on our business.
Financial services firms have been subject to increased scrutiny over the last several years, increasing the risk of financial liability and reputational harm resulting from adverse regulatory actions.
Firms in the financial services industry have been operating in a difficult regulatory environment which we expect will become even more stringent in light of recent well-publicized failures of regulators to detect and prevent fraud. The industry has experienced increased scrutiny from a variety of regulators, including the SEC, the NYSE, the FINRA and state attorneys general. Penalties and fines sought by regulatory authorities have increased substantially over the last several years. This regulatory and enforcement environment has created uncertainty with respect to a number of transactions that had historically been entered into by financial services firms and that were generally believed to be permissible and appropriate. We may be adversely affected by
36
Table of Contents
changes in the interpretation or enforcement of existing laws and rules by these governmental authorities and self-regulatory organizations. Each of the regulatory bodies with jurisdiction over us has regulatory powers dealing with many aspects of financial services, including, but not limited to, the authority to fine us and to grant, cancel, restrict or otherwise impose conditions on the right to carry on particular businesses. For example, a failure to comply with the obligations imposed by the Securities Exchange Act of 1934, as amended, on broker-dealers and the Investment Advisers Act on investment advisers, including record-keeping, advertising and operating requirements, disclosure obligations and prohibitions on fraudulent activities, or by the Investment Company Act of 1940, could result in investigations, sanctions and reputational damage. We also may be adversely affected as a result of new or revised legislation or regulations imposed by the SEC, other United States or foreign governmental regulatory authorities or the FINRA or other self-regulatory organizations that supervise the financial markets. Substantial legal liability or significant regulatory action against us could have adverse financial effects on us or cause reputational harm to us, which could harm our business prospects.
In addition, financial services firms are subject to numerous conflicts of interests or perceived conflicts. The SEC and other federal and state regulators have increased their scrutiny of potential conflicts of interest. We have adopted various policies, controls and procedures to address or limit actual or perceived conflicts and regularly review and update our policies, controls and procedures. However, appropriately addressing conflicts of interest is complex and difficult and our reputation could be damaged if we fail, or appear to fail, to appropriately address conflicts of interest. Our policies and procedures to address or limit actual or perceived conflicts may also result in increased costs and additional operational personnel. Failure to adhere to these policies and procedures may result in regulatory sanctions or litigation against us. For example, the research operations of investment banks have been and remain the subject of heightened regulatory scrutiny which has led to increased restrictions on the interaction between equity research analysts and investment banking professionals at securities firms. Several securities firms in the United States reached a global settlement in 2003 and 2004 with certain federal and state securities regulators and self-regulatory organizations to resolve investigations into the alleged conflicts of interest of research analysts, which resulted in rules that have imposed additional costs and limitations on the conduct of our business.
Asset management businesses have experienced a number of highly publicized regulatory inquiries which have resulted in increased scrutiny within the industry and new rules and regulations for mutual funds, investment advisors and broker-dealers. Although we do not act as an investment advisor to mutual funds, we are registered as an investment advisor with the SEC and the regulatory scrutiny and rulemaking initiatives may result in an increase in operational and compliance costs or the assessment of significant fines or penalties against our asset management business, and may otherwise limit our ability to engage in certain activities. In addition, the SEC staff has conducted studies with respect to soft dollar practices in the brokerage and asset management industries and proposed interpretive guidance regarding the scope of permitted brokerage and research services in connection with soft dollar practices. The SEC staff has indicated that it is considering additional rulemaking in this and other areas, and we cannot predict the effect that additional rulemaking may have on our asset management or brokerage business or whether it will be adverse to us. For example, the SEC recently instituted a permanent ban on “naked” short sales. In addition, Congress is currently considering imposing new requirements on entities that securitize assets, which could affect our credit activities. It is impossible to determine the extent of the impact of any new laws, regulations or initiatives that may be proposed, or whether any of the proposals will become law. Compliance with any new laws or regulations could make compliance more difficult and expensive and affect the manner in which we conduct business.
Our exposure to legal liability is significant, and damages and other costs that we may be required to pay in connection with litigation and regulatory inquiries, and the reputational harm that could result from legal action against us, could adversely affect our businesses.
Many aspects of our business subject us to substantial risks of potential liability to customers and to regulatory enforcement proceedings by state and federal regulators. We face significant legal risks in our businesses and, in recent years, the volume of claims and amount of damages sought in litigation and regulatory proceedings against financial institutions have been increasing. Dissatisfied clients regularly make claims against
37
Table of Contents
securities firms and their brokers and investment advisers for, among others, negligence, fraud, unauthorized trading, suitability, churning, failure to supervise, breach of fiduciary duty, employee errors, intentional misconduct, unauthorized transactions, improper recruiting activity, and failures in the processing of securities transactions. These types of claims expose us to the risk of significant loss. Acts of fraud are difficult to detect and deter, and we cannot assure investors that our risk management procedures and controls will prevent losses from fraudulent activity. Additional risks include potential liability under securities or other laws for materially false or misleading statements made in connection with securities offerings and other transactions, employment claims, potential liability for “fairness opinions” and other advice we provide to participants in strategic transactions and disputes over the terms and conditions of complex trading arrangements. Generally, pursuant to applicable agreements, investors in our funds do not have legal recourse against us or Harvest Capital Strategies LLC for underperformance or errors of judgment in connection with the funds, nor will any act or omission be a breach of duty to the fund or limited partner unless it constituted gross negligence or willful violation of law. At any point in time, the aggregate amount of existing claims against us could be material. While we do not expect the outcome of any existing claims against us to have a material adverse impact on our business, financial condition, or results of operations, we cannot assure you that these types of proceedings will not materially and adversely affect us. We do not carry insurance that would cover payments regarding these liabilities, with the exception of fidelity coverage with respect to certain fraudulent acts of our employees. In addition, our by-laws provide for the indemnification of our officers, directors, and employees to the maximum extent permitted under Delaware law. In the future, we may be the subject of indemnification assertions under these documents by our officers, directors or employees who have or may become defendants in litigation. These claims for indemnification may subject us to substantial risks of potential liability.
As an investment banking and asset management firm, we depend to a large extent on our reputation for integrity and high-caliber professional services to attract and retain clients. As a result, if a client is not satisfied with our services, it may be more damaging to our business than to other businesses. Moreover, our role as advisor to our clients on important underwriting or mergers and acquisitions transactions involves complex analysis and the exercise of professional judgment, including rendering “fairness opinions” in connection with mergers and acquisitions and other transactions. Therefore, our activities may subject us to the risk of significant legal liabilities to our clients and aggrieved third parties, including stockholders of our clients who could bring securities class actions against us. Our investment banking engagements typically include broad indemnities from our clients and provisions to limit our exposure to legal claims relating to our services, however, there can be no assurance that these provisions will protect us or be enforceable in all cases. As a result, we may incur significant legal and other expenses in defending against litigation and may be required to pay substantial damages for settlements and adverse judgments. We have in the past been, currently are and may in the future be subject to such securities litigation. Substantial legal liability or significant regulatory action against us could harm our results of operations or cause reputational harm to us, which could adversely affect our business and prospects. In addition to the foregoing financial costs and risks associated with potential liability, the defense of litigation has increased costs associated with attorneys’ fees. The amount of outside attorneys’ fees incurred in connection with the defense of litigation could be substantial and might materially and adversely affect our results of operations as such fees occur. Securities class action litigation in particular is highly complex and can extend for a protracted period of time, thereby substantially increasing the costs incurred to resolve this litigation.
Our failure to deal appropriately with conflicts of interest could damage our reputation and adversely affect our business.
As we have expanded the number and scope of our businesses, we increasingly confront potential conflicts of interest relating to our and our funds’ and clients’ investment and other activities. Certain of our funds have overlapping investment objectives, including funds which have different fee structures, and potential conflicts may arise with respect to our decisions regarding how to allocate investment opportunities among ourselves and those funds. For example, a decision to acquire material non-public information about a company while pursuing an investment opportunity for a particular fund gives rise to a potential conflict of interest when it results in our having to restrict the ability of the Company or other funds to take any action.
38
Table of Contents
In addition, there may be conflicts of interest regarding investment decisions for funds in which our officers, directors and employees, who have made and may continue to make significant personal investments in a variety of funds, are personally invested. Similarly, conflicts of interest may exist or develop regarding decisions about the allocation of specific investment opportunities between the Company and the funds.
We also have potential conflicts of interest with our investment banking and institutional clients including situations where our services to a particular client or our own proprietary or fund investments or interests conflict or are perceived to conflict with a client. It is possible that potential or perceived conflicts could give rise to investor or client dissatisfaction or litigation or regulatory enforcement actions. Appropriately dealing with conflicts of interest is complex and difficult and our reputation could be damaged if we fail, or appear to fail, to deal appropriately with one or more potential or actual conflicts of interest. Regulatory scrutiny of, or litigation in connection with, conflicts of interest would have a material adverse effect on our reputation, which would materially adversely affect our business in a number of ways, including as a result of redemptions by our investors from our hedge funds, an inability to raise additional funds and a reluctance of counterparties to do business with us.
Misconduct by our employees or by the employees of our business partners could harm us and is difficult to detect and prevent.
There have been a number of highly publicized cases involving fraud or other misconduct by employees in the financial services industry in recent years, and we run the risk that employee misconduct could occur at our firm. For example, misconduct could involve the improper use or disclosure of confidential information, which could result in regulatory sanctions and serious reputational or financial harm. It is not always possible to deter misconduct and the precautions we take to detect and prevent this activity may not be effective in all cases. Our ability to detect and prevent misconduct by entities with whom we do business may be even more limited. We may suffer reputational harm for any misconduct by our employees or those entities with whom we do business.
We may be required to make payments under certain indemnification agreements.
Prior to our initial public offering and the corporate reorganization, we entered into agreements that provide for the indemnification of our members, managing directors, executive officers and certain other persons authorized to act on our behalf against certain losses that may arise out of our initial public offering or the corporate reorganization, certain liabilities of our managing directors relating to the time they were members of JMP Group LLC, and certain tax liabilities of our members that may arise in respect of periods prior to this offering when we operated as a limited liability company. We may be required to make payments under these indemnification agreements, which could adversely affect our financial condition.
If we were deemed an investment company under the Investment Company Act of 1940, applicable restrictions could make it impractical for us to continue our business as contemplated and could have an adverse effect on our business.
We are not an investment company under the Investment Company Act of 1940. However, if we were to cease operating and controlling the business and affairs of JMP Securities LLC and Harvest Capital Strategies LLC or if either of these subsidiaries were deemed to be an investment company, our interest in those entities could be deemed an investment security for purposes of the Investment Company Act of 1940. We intend to conduct our operations so that we will not be deemed an investment company. However, if we were to be deemed an investment company, restrictions imposed by the Investment Company Act of 1940, including limitations on our capital structure and our ability to transact with affiliates, could make it impractical for us to continue our business as contemplated and would harm our business and the price of our common stock.
39
Table of Contents
Our historical financial information may not permit you to predict our costs of operations.
Some of the historical consolidated financial information in this Form 10-K does not reflect the added costs that we expect to incur as a public company or the resulting changes that have occurred in our capital structure and operations. Because we historically operated through partnerships and limited liability companies prior to our transition to a corporation in connection with our initial public offering, we paid little or no taxes on profits and experienced lower expenses related to regulatory and reporting requirements.
| Item 1B. | Unresolved Staff Comments |
None.
| Item 2. | Properties |
We occupy four principal offices, with our headquarters located in San Francisco, other offices in New York, Boston and Chicago, and additional space in the state of Georgia, all of which are leased. Our San Francisco headquarters is located at 600 Montgomery Street and comprises approximately 50,430 square feet of leased space, pursuant to lease agreements expiring in 2011. In New York, we lease approximately 9,940 square feet at 450 Park Avenue pursuant to a lease agreement expiring in 2011. Our Boston office is located at 265 Franklin Street and consists of approximately 2,490 square feet of leased space pursuant to a lease agreement expiring in 2011. In Chicago, we lease approximately 2,500 square feet at 190 South LaSalle Street pursuant to a lease agreement expiring 2015. In the state of Georgia, we lease approximately 150 square feet in Atlanta at 3340 Peachtree Road NE pursuant to a sublease agreement expiring in 2010 and lease approximately 29,962 square feet in Alpharetta at 3440 Preston Ridge Road pursuant to a lease agreement expiring in 2012. We sublease 23,169 square feet of the total space in Alpharetta to third parties.
| Item 3. | Legal Proceedings |
We are involved in a number of judicial, regulatory and arbitration matters arising in connection with our business. The outcome of matters we are involved in cannot be determined at this time, and the results cannot be predicted with certainty. There can be no assurance that these matters will not have a material adverse effect on our results of operations in any future period and a significant judgment could have a material adverse impact on our financial condition, results of operations and cash flows. We may in the future become involved in additional litigation in the ordinary course of our business, including litigation that could be material to our business. However, we do not believe that we have any material legal or regulatory proceedings currently pending or threatened against us.
We review the need for any loss contingency reserves and establish reserves when, in the opinion of management, it is probable that a matter would result in liability and the amount of loss, if any, can be reasonably estimated. Generally, with respect to matters we are involved in, in view of the inherent difficulty of predicting the outcome of these matters, particularly in cases in which claimants seek substantial or indeterminate damages, it is not possible to determine whether a liability has been incurred or to reasonably estimate the ultimate or minimum amount of that liability until the case is close to resolution, in which case no reserve is established until that time.
| Item 4. | Reserved |
None.
40
Table of Contents
PART II
| Item 5. | Market for Registrant’s Common Equity, Related Stockholder Matters and Issuer Purchases of Equity Securities |
Market Information and Dividend Policy
Our common stock is traded on the NYSE under the symbol “JMP.” The following table sets forth, for the years ended December 31, 2009 and 2008, the high and low sales prices per share of our common stock, as quoted on the NYSE.
| Sales Price | ||||||
| High | Low | |||||
| Year Ended December 31, 2009 |
||||||
| First quarter |
$ | 5.45 | $ | 3.90 | ||
| Second quarter |
7.77 | 4.35 | ||||
| Third quarter |
10.95 | 7.28 | ||||
| Fourth quarter |
10.45 | 8.16 | ||||
| Sales Price | ||||||
| High | Low | |||||
| Year Ended December 31, 2008 |
||||||
| First quarter |
$ | 8.15 | $ | 5.97 | ||
| Second quarter |
7.65 | 6.43 | ||||
| Third quarter |
7.29 | 5.00 | ||||
| Fourth quarter |
5.73 | 3.41 | ||||
As of December 31, 2009, there were approximately 155 holders of record of our common stock.
The Company currently intends to pay quarterly cash dividends on all outstanding shares of common stock. We do not plan to pay dividends on unvested shares of restricted stock.
The Company’s board of directors declared the following dividends in the years ended December 31, 2009 and 2008:
| Year Ended December 31, 2009 | ||||||||||
| Declaration Date |
Dividend Per Share |
Record Date | Total Amount |
Payment Date | ||||||
| March 3, 2009 |
$ | 0.01 | March 20, 2009 | $ | 205,054 | April 3, 2009 | ||||
| May 5, 2009 |
$ | 0.01 | May 22, 2009 | $ | 207,501 | June 5, 2009 | ||||
| August 4, 2009 |
$ | 0.01 | August 21, 2009 | $ | 207,561 | September 4, 2009 | ||||
| November 4, 2009 |
$ | 0.01 | November 20, 2009 | $ | 215,336 | December 4, 2009 | ||||
| Year Ended December 31, 2008 | ||||||||||
| Declaration Date |
Dividend Per Share |
Record Date | Total Amount |
Payment Date | ||||||
| March 10, 2008 |
$ | 0.05 | March 28, 2008 | $ | 1,026,224 | April 11, 2008 | ||||
| May 8, 2008 |
$ | 0.05 | May 30, 2008 | $ | 1,016,384 | June 13, 2008 | ||||
| August 6, 2008 |
$ | 0.05 | August 29, 2008 | $ | 998,877 | September 12, 2008 | ||||
| November 3, 2008 |
$ | 0.05 | November 28, 2008 | $ | 989,857 | December 12, 2008 | ||||
41
Table of Contents
Issuer Purchases of Equity Securities
The following table summarizes the stock repurchases for the fourth quarter of 2009:
| Period |
Total Number of Shares Purchased |
Average Price Paid Per Share |
Total Number of Shares Purchased as Part of Publicly Announced Plans or Programs |
Maximum Number of Shares that May Yet Be Purchased Under the Plans or Programs (1) | ||||||
| October 1, 2009 to October 31, 2009 |
— | $ | — | — | 1,213,394 | |||||
| November 1, 2009 to November 30, 2009 |
526,400 | (2) | $ | 8.16 | 526,400 | 686,994 | ||||
| December 1, 2009 to December 31, 2009 |
— | $ | — | — | 686,994 | |||||
| Total |
526,400 | 526,400 | ||||||||
| (1) | A 1.5 million share repurchase program authorized in August and November 2007 was fully executed as of January 18, 2008. On March 10, 2008 and March 3, 2009, the Company’s board of directors authorized the repurchase of an additional 2.0 million shares during the subsequent eighteen months and the repurchase of an additional 0.5 million shares during the subsequent twelve months, respectively. |
| (2) | For certain restricted stock units, the number of shares issued upon settlement of the restricted stock units was net of the statutory tax withholding requirements that we paid on behalf of our employees. The total number of shares purchased in November 2009 represents the net shares that were not issued to employees in connection with the settlement of restricted stock units, and therefore such shares were deemed to have been purchased by the Company. |
Information relating to compensation plans under which our equity securities are authorized for issuance is set forth in Part III, Item 12 of this Form 10-K.
42
Table of Contents
| Item 6. | Selected Financial Data |
SELECTED CONSOLIDATED FINANCIAL DATA
The following selected consolidated financial and other data of JMP Group Inc. should be read together with “Management’s Discussion and Analysis of Financial Condition and Results of Operations,” and the consolidated financial statements and accompanying notes included elsewhere in this Form 10-K.
The selected consolidated statements of financial condition data as of December 31, 2009 and 2008 and the selected consolidated statements of operations data for each of the three years in the period ended December 31, 2009 have been derived from our audited consolidated financial statements and accompanying notes included elsewhere in this Form 10-K and should be read together with those consolidated financial statements and accompanying notes.
The selected consolidated statements of financial condition data as of December 31, 2006 and 2005 and the selected consolidated statement of operations data for the year ended December 31, 2005 have been derived from audited consolidated financial statements not included in this Form 10-K.
Prior to May 16, 2007, the Company had conducted its business through a multi-member Delaware limited liability company, JMP Group LLC, or the Predecessor, pursuant to its Third Amended and Restated Limited Liability Company Operating Agreement dated as of August 18, 2004, as amended, or the Operating Agreement. One of JMP Group LLC’s members, JMP Holdings Inc., was established in August 2004 to enable investors to invest through a corporate entity in the membership interests of JMP Group LLC. Shares of common stock of JMP Holdings were issued in a private offering in August 2004. JMP Holdings’ only significant asset until May 16, 2007 was its investment in JMP Group LLC, comprised of the member interests of JMP Group LLC purchased with the net proceeds received from issuance of JMP Holdings’ common stock.
In connection with its initial public offering, JMP Holdings changed its name to JMP Group Inc., and effective May 16, 2007, members of JMP Group LLC exchanged the outstanding membership interests of JMP Group LLC for shares of common stock of JMP Group Inc. As a result of the exchange, JMP Group LLC became JMP Group Inc.’s wholly-owned subsidiary and JMP Group Inc., or the Successor, completed its initial public offering on May 16, 2007.
| (In thousands, except per share data and selected data and operating metrics) |
December 31, 2009 |
December 31, 2008 |
January 1, 2007 through May 15, 2007 |
May 16, 2007 through December 31, 2007 |
December 31, 2006 |
December 31, 2005 |
||||||||||||||||||
| Successor | Successor | Predecessor | Successor | Predecessor | Predecessor | |||||||||||||||||||
| Statement of Operation Data |
||||||||||||||||||||||||
| Revenues |
||||||||||||||||||||||||
| Investment banking |
$ | 39,924 | $ | 27,249 | $ | 16,055 | $ | 33,222 | $ | 44,060 | $ | 62,880 | ||||||||||||
| Brokerage |
34,004 | 35,731 | 12,987 | 21,835 | 30,185 | 23,536 | ||||||||||||||||||
| Asset management fees |
20,148 | 11,369 | 1,218 | 3,830 | 4,531 | 8,538 | ||||||||||||||||||
| Principal transactions |
18,517 | (4,657 | ) | 541 | 2,404 | 4,288 | (2,006 | ) | ||||||||||||||||
| Gain on sale and payoff of loans |
22,268 | — | — | — | — | — | ||||||||||||||||||
| Gain on repurchase of asset-backed securities issued |
4,705 | — | — | — | — | — | ||||||||||||||||||
| Gain on bargain purchase |
1,179 | — | — | — | — | — | ||||||||||||||||||
| Net dividend income |
2,520 | 3,174 | 399 | 1,449 | 678 | 151 | ||||||||||||||||||
| Other income |
2,593 | 1,158 | 326 | 534 | 373 | 334 | ||||||||||||||||||
| Non-interest revenues |
145,858 | 74,024 | 31,526 | 63,274 | 84,115 | 93,433 | ||||||||||||||||||
| Interest income |
35,370 | 2,392 | 732 | 2,007 | 2,571 | 1,228 | ||||||||||||||||||
| Interest expense |
(25,924 | ) | (408 | ) | (570 | ) | (160 | ) | (1,566 | ) | (933 | ) | ||||||||||||
| Net interest income |
9,446 | 1,984 | 162 | 1,847 | 1,005 | 295 | ||||||||||||||||||
| Provision for loan losses |
(5,821 | ) | (2,896 | ) | — | — | — | — | ||||||||||||||||
| Total net revenues after provision for loan losses |
149,483 | 73,112 | 31,688 | 65,121 | 85,120 | 93,728 | ||||||||||||||||||
43
Table of Contents
| (In thousands, except per share data and selected data and operating metrics) |
December 31, 2009 |
December 31, 2008 |
January 1, 2007 through May 15, 2007 |
May 16, 2007 through December 31, 2007 |
December 31, 2006 |
December 31, 2005 | |||||||||||||||
| Successor | Successor | Predecessor | Successor | Predecessor | Predecessor | ||||||||||||||||
| Non-interest Expenses |
|||||||||||||||||||||
| Compensation and benefits |
105,179 | 65,746 | 18,393 | 45,618 | 50,136 | 60,145 | |||||||||||||||
| Income allocation and accretion—Redeemable Class A member interests (1) |
— | — | 117,418 | — | 10,664 | 12,983 | |||||||||||||||
| Administration |
5,050 | 5,887 | 1,771 | 3,371 | 4,204 | 3,362 | |||||||||||||||
| Brokerage, clearing and exchange fees |
5,284 | 5,063 | 1,689 | 3,366 | 4,133 | 3,170 | |||||||||||||||
| Other |
13,626 | 13,262 | 3,947 | 8,516 | 12,167 | 10,146 | |||||||||||||||
| Total non-interest expenses |
129,139 | 89,958 | 143,218 | 60,871 | 81,304 | 89,806 | |||||||||||||||
| Income (loss) before income tax expense |
20,344 | (16,846 | ) | (111,530 | ) | 4,250 | 3,816 | 3,922 | |||||||||||||
| Income tax expense (benefit) |
7,663 | (5,701 | ) | — | (2,537 | ) | — | — | |||||||||||||
| Net income (loss) |
12,681 | (11,145 | ) | (111,530 | ) | 6,787 | 3,816 | 3,922 | |||||||||||||
| Less: Net income (loss) attributable to noncontrolling interests (2) |
1,871 | (498 | ) | 167 | 247 | 428 | — | ||||||||||||||
| Net income (loss) attributable to JMP Group Inc. (3) |
$ | 10,810 | $ | (10,647 | ) | $ | (111,697 | ) | $ | 6,540 | $ | 3,388 | $ | 3,922 | |||||||
| Net (loss) income per common share: |
|||||||||||||||||||||
| Basic |
$ | 0.52 | $ | (0.53 | ) | $ | — | $ | 0.30 | $ | — | $ | — | ||||||||
| Diluted |
$ | 0.49 | $ | (0.53 | ) | $ | — | $ | 0.30 | $ | — | $ | — | ||||||||
| Dividends declared and paid per common share: |
$ | 0.04 | $ | 0.20 | $ | — | $ | 0.075 | $ | — | $ | — | |||||||||
| Weighted average common shares outstanding: |
|||||||||||||||||||||
| Basic |
20,791 | 20,211 | — | 21,830 | — | — | |||||||||||||||
| Diluted |
22,137 | 20,211 | — | 21,916 | — | — | |||||||||||||||
| Net (loss) per unit-Class A common interests: (3)(4) |
|||||||||||||||||||||
| Basic |
$ | — | $ | — | $ | (23.84 | ) | $ | — | $ | 0.91 | $ | 1.04 | ||||||||
| Diluted |
$ | — | $ | — | $ | (23.84 | ) | $ | — | $ | 0.89 | $ | 1.04 | ||||||||
| Weighted average units outstanding—Class A common interests: (4) |
|||||||||||||||||||||
| Basic |
— | — | 2,385 | — | 1,435 | 1,474 | |||||||||||||||
| Diluted |
— | — | 2,385 | — | 1,468 | 1,474 | |||||||||||||||
| Net (loss) per unit—Class B common interests: (3)(4) |
|||||||||||||||||||||
| Basic |
$ | — | $ | — | $ | (23.84 | ) | $ | — | $ | 0.91 | $ | 1.04 | ||||||||
| Diluted |
$ | — | $ | — | $ | (23.84 | ) | $ | — | $ | 0.89 | $ | 1.04 | ||||||||
| Weighted average units outstanding—Class B common interests: (4) |
|||||||||||||||||||||
| Basic |
— | — | 2,300 | — | 2,300 | 2,300 | |||||||||||||||
| Diluted |
— | — | 2,300 | — | 2,353 | 2,300 | |||||||||||||||
| December 31, 2009 |
December 31, 2008 |
December 31, 2007 |
December 31, 2006 |
December 31, 2005 | |||||||||||
| Successor | Successor | Successor | Predecessor | Predecessor | |||||||||||
| Statement of Financial Condition Data |
|||||||||||||||
| Total assets |
$ | 574,721 | $ | 152,846 | $ | 184,711 | $ | 103,699 | $ | 91,923 | |||||
| Asset-backed securities issued |
326,632 | — | — | — | — | ||||||||||
| Note payable |
9,045 | 8,681 | — | — | — | ||||||||||
| Redeemable Class A member interests |
— | — | — | 12,914 | 11,517 | ||||||||||
| Total liabilities |
449,069 | 39,774 | 54,506 | 51,208 | 45,275 | ||||||||||
| Total equity |
125,652 | 113,072 | 130,205 | 52,491 | 46,648 | ||||||||||
44
Table of Contents
| December 31, 2009 |
December 31, 2008 |
December 31, 2007 |
December 31, 2006 |
December 31, 2005 |
||||||||||||||||
| Successor | Successor | Successor | Predecessor | Predecessor | ||||||||||||||||
| Selected Data and Operating Metrics (Unaudited) |
||||||||||||||||||||
| Number of employees—end of period |
224 | 191 | 202 | 187 | 169 | |||||||||||||||
| Number of employees—average |
211 | 198 | 194 | 181 | 162 | |||||||||||||||
| Net revenues after provision for loan losses per employee |
$ | 708 | $ | 369 | $ | 499 | $ | 470 | $ | 579 | ||||||||||
| Compensation and benefits as a % of net revenues after provision for loan losses (5) |
68.2 | % | 84.6 | % | 58.7 | % | 58.9 | % | 64.2 | % | ||||||||||
| Companies covered by research analysts |
286 | 200 | 213 | 279 | 294 | |||||||||||||||
| Number of completed investment banking transactions |
56 | 35 | 71 | 75 | 75 | |||||||||||||||
| (1) | Prior to our initial public offering we were organized as a limited liability company and issued to employee members Redeemable Class A member interests, which were entitled to their pro rata share of our income. Our Third Amended and Restated Limited Liability Company Agreement, as amended, provided that each employee member may elect to redeem their Redeemable Class A member interests upon resignation from us. Because of this repurchase feature, the Redeemable Class A member interests were classified as a liability in our statement of financial condition. As a result of the liability classification, the pro rata share of income allocated to the Redeemable Class A member interests based on ownership percentages and any changes in the redemption amount of the Redeemable Class A member interests were recorded as expense in our statement of income. |
| (2) | Noncontrolling interest relate to the interest of third parties in Harvest Mortgage Opportunities Partners, JMP Realty Trust (through December 31, 2008), in two asset management funds, Harvest Consumer Partners (through November 30, 2008), Harvest Technology Partners (through July 31, 2008) and in Opportunity Acquisition Corp (through December 31, 2009). |
| (3) | Prior to our initial public offering we were a limited liability company and our earnings did not reflect the income taxes we pay as a corporation. |
| (4) | We issued 2,300,000 units of Class B common interests in a private offering in August 2004, which represented 15.5% of our outstanding membership interests. Because there is a direct relationship between the number of Class B common interests outstanding and the ownership percentage in our equity, we were able to determine the number of units associated with the Class A common interests outstanding. As a result, we were able to determine earnings per share, based on an implied number of Class A common interests and an existing number of Class B common interests outstanding. We have reflected this implied number of units for purposes of determining earnings per share in all periods presented. |
| (5) | Compensation and benefits include salaries, performance-based cash payments and equity awards to our managing directors and other employees, but excludes compensation expense of $3.2 million, $3.9 million and $7.2 million for the years ended December 31, 2009, 2008 and 2007, respectively, related to equity awards granted or vested in connection with our initial public offering. |
45
Table of Contents
| Item 7. | Management’s Discussion and Analysis of Financial Condition and Results of Operations |
The following discussion should be read together with our consolidated financial statements and the accompanying notes contained elsewhere in this Form 10-K. In addition to historical information, the following discussion contains forward-looking statements that involve risks and uncertainties. Our actual results and the timing of events may differ significantly from those projected in such forward-looking statements due to a number of factors, including those discussed in Item 1A—“Risk Factors” and elsewhere in this Form 10-K.
We are a full-service investment banking and asset management firm headquartered in San Francisco. We have a diversified business model with a focus on small and middle-market companies and provide:
| • | investment banking, including corporate finance, mergers and acquisitions and other strategic advisory services, to corporate clients; |
| • | sales and trading, and related brokerage services to institutional investors; |
| • | proprietary equity research in our six target industries; |
| • | asset management products and services to institutional investors, high net-worth individuals and for our own account; and |
| • | management of collateralized loan obligations. |
Corporate Reorganization
Prior to May 16, 2007, the Company had conducted its business through a multi-member Delaware limited liability company, JMP Group LLC, or the Predecessor, pursuant to its Third Amended and Restated Limited Liability Company Operating Agreement dated as of August 18, 2004, as amended, or the Operating Agreement. One of JMP Group LLC’s members, JMP Holdings Inc., was established in August 2004 to enable investors to invest through a corporate entity in the membership interests of JMP Group LLC. Shares of common stock of JMP Holdings were issued in a private offering in August 2004. JMP Holdings’ only significant asset until May 16, 2007 was its investment in JMP Group LLC, comprised of the member interests of JMP Group LLC purchased with the net proceeds received from issuance of JMP Holdings’ common stock.
In connection with its initial public offering, JMP Holdings changed its name to JMP Group Inc., and effective May 16, 2007, members of JMP Group LLC exchanged the outstanding membership interests of JMP Group LLC for shares of common stock of JMP Group Inc. As a result of the exchange, JMP Group LLC became JMP Group Inc.’s wholly-owned subsidiary and JMP Group Inc., or the Successor, completed its initial public offering on May 16, 2007.
Pro Forma Combined Predecessor and Successor Financial Results for Fiscal Year Ended December 31, 2007
Our audited financial statements present our historical financial results for the Predecessor from January 1, 2007 to May 15, 2007 and for the Successor from May 16, 2007 to December 31, 2007 to reflect the periods before and after the reorganization on May 16, 2007. In our MD&A, we have included a discussion below regarding our results of operations and cash flows for each of the 2007 periods before and after the reorganization. Despite the separate presentation of the Predecessor and the Successor in 2007, there were no material changes to the actual operations or customer relationships of our business as a result of the reorganization and the initial public offering of the Successor.
To enhance the analysis of our operating results and cash flows for the annual periods presented, in addition to a discussion of each of the 2007 periods before and after the reorganization, we have included a discussion of the operating results and cash flows of the Predecessor and Successor on a pro forma combined basis for the year ended December 31, 2007. The pro forma combined presentation consists of the mathematical addition of the pre-reorganization results of operations and statements of cash flow of the Predecessor for the period from
46
Table of Contents
January 1, 2007 to May 15, 2007 plus the results of operations and statements of cash flow of the Successor for the period from May 16, 2007 to December 31, 2007. There are no other adjustments made in the pro forma combined presentation. A reconciliation showing the mathematical combination of our operating results and cash flows for such periods is included below under the headings “Historical Results of Operations” and “Liquidity and Capital Resources.”
Management believes that the pro forma combined presentation for the twelve-month period ended December 31, 2007 of each line item provides additional information investors can use to conduct a meaningful comparison of our operating results and cash flows between periods. When evaluating our results of operations and financial performance, our management views the year ended December 31, 2007 as a single measurement period, rather than the two separate periods, because the core operations of the company have not changed as a result of the reorganization. Despite the change in corporate form that resulted from the reorganization, we have maintained continuity of the operations of the Predecessor. Management believes that a discussion and analysis of the pro forma combined period in our MD&A would provide investors with useful information upon which to assess our operating performance because the results of operations for a twelve-month period correspond to how we reported our results in the past and how we will report our results in the future. The presentation of the pro forma combined period enables investors to compare our 2007 financial results (periods in which we operated as both an LLC and a corporation) with our 2008 and 2009 results (a period in which we operated as a corporation). This comparison of twelve-month periods enables us to analyze, and enhances an investor’s understanding of, the financial statement impact of our change in corporate form from an LLC to a corporation.
Overview
Our results for 2009 reflected an improved operating environment, including a rise in equity prices, lower volatility levels and improved credit markets and liquidity. Investment banking net revenues increased significantly compared with 2008 driven by an improved equity market. Our net brokerage revenues decreased slightly from the prior year due to lower trading volume. Our asset management revenues increased significantly reflecting improved performance by most of our family of funds.
On February 13, 2009, we entered into a business arrangement with China Merchants Securities Co. (HK), Ltd., one of China’s largest securities brokerage and investment banking firms, through a $2.0 million investment in HuaMei Capital Company, Inc. (HuaMei) to expand our investment banking capabilities in China. Through HuaMei, we can provide investment banking services to U.S. and Chinese companies seeking to execute cross-border transactions on both sides of the Pacific. As of December 31, 2009, no revenue has yet been generated from our investment in HuaMei.
Effective April 7, 2009, through our majority-owned subsidiary JMP Credit, we completed the acquisition of 100% of the membership interests of Cratos Capital Partners, LLC and its subsidiaries, including Cratos Capital Management, LLC (collectively, “Cratos”), an alternative asset manager of collateralized loan obligations, together with certain securities of Cratos CLO I, Ltd. (the “CLO”). As a result of this acquisition, our net interest income and gain on sale of loans increased significantly in 2009.
Our business, by its nature, does not produce predictable earnings. Our results in any given period can be materially affected by conditions in global financial markets and economic conditions generally. For a further discussion of the factors that may affect our future operating results, see “Risk Factors” in Part I, Item 1A of our Annual Report on Form 10-K.
Components of Revenues
We derive revenues primarily from fees earned from our investment banking business, net commissions on our trading activities in our sales and trading business, asset management fees in our asset management business and interest income on collateralized loan obligations we manage. We also generate revenues from principal transactions, interest, dividends, and other income.
47
Table of Contents
Investment Banking
We earn investment banking revenues from underwriting securities offerings, arranging private placements and providing advisory services in mergers and acquisitions and other strategic advisory assignments.
Underwriting Revenues
We earn underwriting revenues from securities offerings in which we act as an underwriter, such as initial public offerings and follow-on equity offerings. Underwriting revenues include management fees, underwriting fees and selling concessions. We record underwriting revenues, net of related syndicate expenses, at the time the underwriting is completed. In syndicated underwritten transactions, management estimates our share of transaction-related expenses incurred by the syndicate, and we recognize revenues net of such expense. On final settlement by the lead manager, typically 90 days from the trade date of the transaction, we adjust these amounts to reflect the actual transaction-related expenses and our resulting underwriting fee. We receive a higher proportion of total fees in underwritten transactions in which we act as a lead manager.
Strategic Advisory Revenues
Our strategic advisory revenues primarily include success fees on closed merger and acquisition transactions, as well as retainer fees, earned in connection with advising both buyers’ and sellers’ transactions. We also earn fees for related advisory work and other services such as providing fairness opinions and valuation analyses. We record strategic advisory revenues when the transactions or the services (or, if applicable, separate components thereof) to be performed are substantially completed, the fees are determinable and collection is reasonably assured.
Private Placement Revenues
We earn agency placement fees in non-underwritten transactions such as private placements of equity securities, private investments in public equity (“PIPE”) transactions, Rule 144A private offerings and trust preferred securities offerings. We record private placement revenues on the closing date of these transactions.
Since our investment banking revenues are generally recognized at the time of completion of each transaction or the services to be performed, these revenues typically vary between periods and may be considerably affected by the timing of the closing of significant transactions.
Brokerage Revenues
Our brokerage revenues include commissions paid by customers from brokerage transactions in exchange-listed and over-the-counter, or OTC, equity securities. Commissions are recognized on a trade date basis. Brokerage revenues also include net trading gains and losses that result from market-making activities and from our commitment of capital to facilitate customer transactions. Our brokerage revenues may vary between periods, in part depending on commission rates, trading volumes and our ability to continue to deliver research and other value-added services to our clients. The ability to execute trades electronically, through the Internet and through other alternative trading systems has increased pressure on trading commissions and spreads. We expect this trend toward alternative trading systems and pricing pressures in our brokerage business to continue. We are, to some extent, compensated through brokerage commissions for the value of research and other value added services we deliver to our clients. These “soft dollar” practices have been the subject of discussion among regulators, the investment banking community and our sales and trading clients. In particular, commission sharing arrangements have been adopted by some large institutional investors. In these arrangements, these institutional investors concentrate their trading with fewer “execution” brokers and pay a fixed amount for execution with an additional amount set aside for payments to other firms for research or other brokerage services. Accordingly, we may experience reduced (or eliminated) trading volume with such investors but may be compensated for our research and sales efforts through allocations of the designated amounts. Depending on
48
Table of Contents
the extent to which we adopt this practice and depending on our ability to reach arrangements on terms acceptable to us, this trend would likely impair the revenues and profitability of our commission business by negatively affecting both volumes and trading commissions in our commission business.
Asset Management Fees
Asset management fees include base management fees and incentive fees earned from managing investment partnerships sponsored by us and investment accounts owned by clients. Base management fees earned by us are generally based on the fair value of assets under management and the fee schedule for each fund and account. We also earn incentive fees that are based upon the performance of investment funds and accounts. Such fees are based on a percentage of the excess of an investment return over a specified highwater mark or hurdle rate over a defined performance period.
As of December 31, 2009, the contractual base management fees earned from each of these investment funds ranged between 1% and 2% of assets under management. The contractual incentive fees were generally (i) 20%, subject to high-water marks, for the hedge funds; (ii) 5% to 20%, subject to high-water marks or a performance hurdle rate, for the funds of funds; and (iii) 25%, subject to a performance hurdle rate, for Harvest Mortgage Opportunities Partners (“HMOP”) and New York Mortgage Trust, Inc. (“NYMT”).
Our asset management revenues are subject to fluctuations due to a variety of factors that are unpredictable, including the overall condition of the economy and the securities markets as a whole and our core sectors. These conditions can have a material effect on the inflows and outflows of assets under management, and the performance of our asset management funds. For example, a significant portion of the performance-based or incentive revenues that we recognize are based on the value of securities held in the funds we manage. The value of these securities includes unrealized gains or losses that may change from one period to another.
The following tables present certain information with respect to the investment funds managed by Harvest Capital Strategies (“HCS”) (formerly JMP Asset Management LLC, which changed its name to HCS effective September 29, 2008):
| Net Assets at | Company’s Share of Net Assets at | |||||||||||
| December 31, 2009 |
December 31, 2008 |
December 31, 2009 |
December 31, 2008 | |||||||||
| Funds Managed by HCS: |
||||||||||||
| Hedge Funds: |
||||||||||||
| Harvest Opportunity Partners II |
$ | 73,894,769 | $ | 62,169,209 | $ | 10,438,481 | $ | 7,760,076 | ||||
| Harvest Small Cap Partners |
336,082,941 | 234,051,639 | 8,740,793 | 13,780,667 | ||||||||
| Harvest Consumer Partners |
12,117,347 | 5,521,880 | 5,590,016 | 2,407,121 | ||||||||
| Harvest Technology Partners |
22,395,376 | 11,581,561 | 7,457,477 | 5,818,212 | ||||||||
| Harvest Mortgage Opportunities Partners (1) |
10,543,931 | — | 7,089,590 | — | ||||||||
| Harvest Global Select Partners |
5,558,850 | — | 1,086,404 | — | ||||||||
| Funds of Funds: |
||||||||||||
| JMP Masters Fund |
97,931,200 | 96,037,447 | 2,932,534 | 2,701,021 | ||||||||
| JMP Emerging Masters Fund (2) |
— | 10,633,335 | — | 977,052 | ||||||||
| REITs: |
||||||||||||
| JMP Realty Trust (1) |
— | 15,829,296 | — | 7,841,833 | ||||||||
| New York Mortgage Trust (3) |
48,413,824 | 48,413,824 | N/A | N/A | ||||||||
| Total funds managed by HCS |
$ | 606,938,238 | $ | 484,238,191 | $ | 43,335,295 | $ | 41,285,982 | ||||
| (1) | The Company’s share of net assets in JMPRT was consolidated in the Company’s Statement of Financial Condition at December 31, 2008. On January 2, 2009, all of the assets and liabilities of JMPRT were |
49
Table of Contents
| transferred to HMOP. The Company’s share of net assets in HMOP was consolidated in the Company’s Statement of Financial Condition at December 31, 2009. |
| (2) | JMP Emerging Masters Fund was liquidated and its assets were distributed to its partners on December 31, 2009. |
| (3) | The portion of the net assets of New York Mortgage Trust, Inc. (“NYMT”) that is subject to the management fee calculation. In connection with its investment in NYMT, in January 2008, the Company entered into an advisory agreement between HCS and NYMT. |
| Year Ended December 31, 2009 | ||||||||||||
| Company’s Share of Change in Fair Value |
HCS Management Fee | HCS Incentive Fee | TWR (1) | |||||||||
| Successor | Successor | Successor | Successor | |||||||||
| Hedge Funds: |
||||||||||||
| Harvest Opportunity Partners II |
$ | 2,793,975 | $ | 587,467 | $ | 1,421,589 | 31.6 | % | ||||
| Harvest Small Cap Partners |
1,889,431 | 5,798,198 | 9,200,555 | 14.6 | % | |||||||
| Harvest Consumer Partners |
884,359 | 58,570 | 133,308 | 23.3 | % | |||||||
| Harvest Technology Partners |
1,660,934 | 126,005 | 298,034 | 25.5 | % | |||||||
| Harvest Mortgage Opportunities Partners (2) |
1,998,477 | 205,660 | — | 24.6 | % | |||||||
| Harvest Global Select Partners |
86,404 | 44,155 | 61,019 | 6.7 | % | |||||||
| Funds of Funds: |
||||||||||||
| JMP Masters Fund |
231,512 | 955,083 | — | 12.5 | % | |||||||
| JMP Emerging Masters Fund (3) |
22,948 | 98,503 | — | 5.9 | % | |||||||
| REITs: |
||||||||||||
| New York Mortgage Trust |
4,046,470 | 746,260 | 524,730 | N/A | ||||||||
| Totals |
$ | 13,614,510 | $ | 8,619,901 | $ | 11,639,235 | N/A | |||||
| (1) | Time-weighted rate of return, or TWR, for the hedge funds and funds of hedge funds. TWR is a measure of the compound rate of growth in a portfolio and eliminates the effect of varying cash inflows by assuming a single investment at the beginning of a period and measuring the growth or loss of market value to the end of that period. |
| (2) | Effective May 1, 2009, revenues earned from HMOP are consolidated and then allocated to noncontrolling interest in consolidation in the Company’s Statements of Operations. |
| (3) | JMP Emerging Masters Fund was liquidated and its assets were distributed to its partners on December 31, 2009. |
| Year Ended December 31, 2008 | |||||||||||||
| Company’s Share of Change in Fair Value |
HCS Management Fee | HCS Incentive Fee | TWR (1) | ||||||||||
| Successor | Successor | Successor | Successor | ||||||||||
| Hedge Funds: |
|||||||||||||
| Harvest Opportunity Partners II |
$ | (84,379 | ) | $ | 685,761 | $ | 38,777 | -1.3 | % | ||||
| Harvest Small Cap Partners |
2,607,572 | 2,852,707 | 5,856,132 | 19.4 | % | ||||||||
| Harvest Consumer Partners (2) |
55,489 | 27,659 | 2,010 | 1.9 | % | ||||||||
| Harvest Technology Partners (2) |
189,429 | 37,247 | 21,730 | 7.2 | % | ||||||||
| Funds of Funds: |
|||||||||||||
| JMP Masters Fund |
(666,095 | ) | 904,618 | 33,573 | -21.7 | % | |||||||
| JMP Emerging Masters Fund (3) |
(116,803 | ) | 104,274 | 9,276 | -11.0 | % | |||||||
| REITs: |
|||||||||||||
| JMP Realty Trust (2) |
(987,694 | ) | 257,380 | — | N/A | ||||||||
| New York Mortgage Trust |
$ | (4,288,211 | ) | 664,896 | — | N/A | |||||||
| Totals |
$ | (3,290,692 | ) | $ | 5,534,542 | $ | 5,961,498 | N/A | |||||
50
Table of Contents
| (1) | Time-weighted rate of return, or TWR, for the hedge funds and funds of hedge funds. TWR is a measure of the compound rate of growth in a portfolio and eliminates the effect of varying cash inflows by assuming a single investment at the beginning of a period and measuring the growth or loss of market value to the end of that period. |
| (2) | Revenues earned from HTP, HCP and JMPRT were consolidated and then allocated to noncontrolling interest in the Company’s Statements of Operations, through July 31, 2008, November 30, 2008 and January 1, 2009, respectively. HTP and HCP were deconsolidated effective August 1, 2008 and December 1, 2008, respectively. All of the assets and liabilities of JMPRT were transferred to HMOP on January 2, 2009. |
| (3) | JMP Emerging Masters Fund was liquidated and its assets were distributed to its partners on December 31, 2009. |
| Year Ended December 31, 2007 | ||||||||||||||||||||||
| Company’s Share of Change in Fair Value |
HCS Management Fee | HCS Incentive Fee | TWR (1) | |||||||||||||||||||
| January 1, 2007 through May 15, 2007 |
May 16, 2007 through December 31, 2007 |
January 1, 2007 through May 15, 2007 |
May 16, 2007 through December 31, 2007 |
January 1, 2007 through May 15, 2007 |
May 16, 2007 through December 31, 2007 |
January 1, 2007 through December 31, 2007 |
||||||||||||||||
| Predecessor | Successor | Predecessor | Successor | Predecessor | Successor | Successor | ||||||||||||||||
| Hedge Funds: |
||||||||||||||||||||||
| Harvest Opportunity |
$ | 46,774 | $ | (5,693 | ) | $ | 466,787 | $ | 625,548 | $ | — | $ | 2,480 | -0.4 | % | |||||||
| Harvest Small Cap Partners |
481,461 | 1,563,964 | 90,988 | 354,288 | 226,956 | 893,377 | 28.7 | % | ||||||||||||||
| Harvest Consumer Partners (2) |
28,146 | (72,625 | ) | 7,458 | 12,840 | 4,522 | 409 | -0.3 | % | |||||||||||||
| Harvest Technology Partners (2) |
34,628 | 199,097 | 4,828 | 10,763 | 8,835 | 18,077 | 17.9 | % | ||||||||||||||
| Harvest Value Income Plus (3) |
38,676 | (26,761 | ) | 56,980 | 72,093 | — | 5,825 | -7.1 | % | |||||||||||||
| Funds of Funds: |
||||||||||||||||||||||
| JMP Masters Fund |
50,842 | 233,131 | 286,346 | 592,187 | 20,223 | 1,002,418 | 17.3 | % | ||||||||||||||
| JMP Emerging Masters Fund (4) |
— | 93,855 | 36,854 | 67,152 | 2,012 | 90,265 | 19.6 | % | ||||||||||||||
| REIT: |
||||||||||||||||||||||
| JMP Realty Trust (2) |
14,373 | 87,953 | 22,512 | 125,345 | — | 22,465 | N/A | |||||||||||||||
| Totals |
$ | 694,900 | $ | 2,072,921 | $ | 972,753 | $ | 1,860,216 | $ | 262,548 | $ | 2,035,316 | N/A | |||||||||
| (1) | Time-weighted rate of return, or TWR, for the hedge funds and funds of hedge funds. TWR is a measure of the compound rate of growth in a portfolio and eliminates the effect of varying cash inflows by assuming a single investment at the beginning of a period and measuring the growth or loss of market value to the end of that period. |
| (2) | Revenues earned from HTP, HCP and JMPRT were consolidated and then eliminated in consolidation in the Company’s Statements of Operations, net of noncontrolling interest through July 31, 2008, November 30, 2008 and January 1, 2009, respectively. HTP and HCP were deconsolidated effective August 1, 2008 and December 1, 2008, respectively. All of the assets and liabilities of JMPRT were transferred to HMOP on January 2, 2009. |
| (3) | On December 31, 2007, HVIP was liquidated and its assets were distributed to its partners. |
| (4) | JMP Emerging Masters Fund was liquidated and its assets were distributed to its partners on December 31, 2009. |
51
Table of Contents
With the acquisition of Cratos, we earn management fees at JMP Credit as the asset manager of collateralized loan obligations. During the period from April 7, 2009 through December 31, 2009, we earned management fees of $1.9 million or 50 bps annualized on gross assets under management. At December 31, 2009, gross assets under management were $495.1 million. As we consolidate the CLO, the management fees are eliminated on consolidation in accordance with U.S. GAAP.
Principal Transactions
Principal transaction revenues includes realized and unrealized net gains and losses resulting from our principal investments, which includes investments in equity and other securities for our own account and as the general partner of funds managed by us, warrants we may receive from certain investment banking assignments, as well as limited partner investments in private funds managed by third parties. In addition, we invest a portion of our capital in a portfolio of equity securities managed by HCS and in side-by-side investments in the funds managed by us. In certain cases, we also co-invest alongside our institutional clients in private transactions resulting from our investment banking business.
Gain on Sale and Payoff of Loans
Gain on sale and payoff of loans consists of gains from the sale and payoff of loans collateralizing asset-backed securities at JMP Credit. Gains are recorded when the proceeds exceed the carrying value of the loan.
Gain on Repurchase of Asset-Backed Securities Issued
Gain on repurchase of asset-backed securities issued (“ABS”) primarily consists of gains from repurchases of our ABS from third parties. Gains are recorded when the repurchase price is less than the carrying value of the ABS.
Gain on Bargain Purchase
A bargain purchase gain was recognized upon the acquisition of Cratos by JMP Credit on April 7, 2009. This represents the difference between the fair value of net assets acquired and the consideration given to the sellers.
Net Dividend Income
Net dividend income comprises dividends from our investments offset by dividend expense for paying short positions in our principal investment portfolio.
Other Income
Other income includes loan restructuring fees at JMP Credit and revenues from fee sharing arrangements with, and fees earned to raise capital for third-party investment partnerships, or funds.
Interest Income
Interest income primarily consists of interest income earned on loans collateralizing asset backed securities issued and loans held for investment. Interest income on loans comprises the stated coupon as a percentage of the face amount receivable as well as accretion of accretable or purchase discounts and deferred fees and costs. Interest income is recorded on the accrual basis in accordance with the terms of the respective loans unless such loans are placed on non-accrual status.
52
Table of Contents
Interest Expense
Interest expense primarily consists of interest expense incurred on asset-backed securities issued and notes payable. Interest expense on asset-backed securities is the stated coupon payable as a percentage of the principal amount as well as amortization of the liquidity discount which was recorded at the acquisition date of Cratos. Interest expense is recorded on the accrual basis in accordance with the terms of the respective asset-backed securities issued and note payable.
Provision for Loan Losses
Loans held for investment are net of reserves recognized on our loan notes and non-revolving credit agreements at our JMP Capital LLC subsidiary (collectively loans held for investment) and loans collateralizing ABS (at JMP Credit) to record them at their estimated net realizable value. The Company maintains an allowance for loan losses that is intended to estimate loan losses inherent in its loan portfolio. A provision for loan losses is charged to expense to establish the allowance for loan losses. The allowance for loan losses is maintained at a level, in the opinion of management, sufficient to offset estimated losses inherent in the loan portfolio as of the date of the financial statements. The appropriateness of the allowance and the allowance components are reviewed quarterly. The Company’s estimate of each allowance component is based on observable information and on market and third party data that the Company believes are reflective of the underlying loan losses being estimated.
The Company provides an allowance for loans that are considered impaired. A loan is considered impaired when it is probable that the Company will be unable to collect all amounts due according to the contractual terms of the loan agreement. The Company measures impairment of a loan based upon either the present value of expected future cash flows discounted at the loan’s effective interest rate, the loan’s observable market price or the fair value of the collateral securing the loan if the loan is collateral dependent, depending on the circumstances and the Company’s collection strategy. For those loans held by Cratos at the date of acquisition by JMP Credit, and deemed impaired at that date or a subsequent date, allowance for loan losses is calculated considering two further factors. For loans deemed impaired at the date of acquisition if there is a further decline in expected future cash flows, this reduction is recognized as a specific reserve in the current quarter in accordance with above. For those loans deemed impaired subsequent to the acquisition date, if the net realizable value is lower than the current carrying value then the carrying value is reduced and the difference is booked as provision for loan losses. If the total discount from unpaid principal balance to carrying value is larger than the expected loss at the date of assessment, no provision for loan losses is recognized.
In addition, the Company provides an allowance on a loan by loan basis at JMP Credit that were purchased after the Cratos acquisition. The Company employs internally developed and third party estimation tools for measuring credit risk (loan ratings, probability of default, and exposure at default), which are used in developing an appropriate allowance for loan losses. The Company performs periodic detailed reviews of its loan portfolio to identify risks and to assess the overall collectibility of loans.
Loans which are deemed to be uncollectible are charged off and the charged-off amount is deducted from the allowance.
Components of Expenses
We classify our expenses as compensation and benefits, income allocation and accretion—Redeemable Class A member interests, administration, brokerage, clearing and exchange fees and other expenses. A significant portion of our expense base is variable, including compensation and benefits, brokerage and clearance, communication and technology and travel and business development expenses.
53
Table of Contents
Compensation and Benefits
Compensation and benefits is the largest component of our expenses and includes employees’ base pay, performance bonuses, sales commissions, related payroll taxes, medical and benefits expenses, as well as expenses for contractors, temporary employees and equity-based compensation. Our employees receive a substantial portion of their compensation in the form of individual performance-based bonuses. As is the widespread practice in our industry, we pay bonuses on an annual basis, which for senior professionals typically make up a large portion of their total compensation. Bonus payments may have a greater impact on our cash position and liquidity in the periods in which they are paid than would otherwise be reflected in our Consolidated Statements of Operations. We accrue for the estimated amount of these bonus payments ratably over the applicable service period.
Compensation is accrued using specific ratios of total compensation and benefits to total revenues based on revenue categories, as adjusted if, in management’s opinion such adjustments are necessary and appropriate to maintain competitive compensation levels.
Income Allocation and Accretion—Redeemable Class A Member Interests
While we were operating as a limited liability company, redeemable Class A member interests were issued to our former employee members and such interests were entitled to share in our income. Each holder of the Redeemable Class A member interest was a party to our Third Amended and Restated Limited Liability Company Agreement, as amended, which provided that an employee member could have elected to redeem his or her Redeemable Class A member interests without our consent in connection with such person’s resignation from us. Because of this repurchase feature, the Redeemable Class A member interests were classified as a liability and measured at each balance sheet date based on the redemption amounts for the Redeemable Class A member interests. The redemption amount for a former employee member was the amount we would have been required to pay to that former employee member upon resignation to redeem all of his or her Redeemable Class A member interests, and was equal to the capital account of such former employee member as maintained by us.
Redeemable Class A member interests were accounted for as stock-based compensation and classified as a liability. As a result, the share of our income allocated to Redeemable Class A member interests, based on the membership percentage owned, and any additional changes in the redemption amount of Redeemable Class A member interests was recorded as “Income allocation and accretion—Redeemable Class A member interests” in our consolidated statements of operations.
In connection with the reorganization, the Redeemable Class A member interests were exchanged for shares of our common stock and reclassified from liability to equity. The liability-to-equity exchange of the Redeemable Class A member interests required the Predecessor to mark the liability for the Redeemable Class A member interests to its fair market value and to record a non-cash expense related to the change in value at the date of the reorganization. The Predecessor accounted for the exchange in its consolidated financial statements as follows:
| • | The Predecessor recorded a one-time non-cash expense as a component of “Income allocation and accretion—Redeemable Class A member interests” equal to $112.9 million, which represents the difference between (a) the equity amount recorded for the shares of common stock issued in exchange for the Redeemable Class A member interests and (b) the carrying amount of the Redeemable Class A member interests prior to the reorganization; and then |
| • | The Predecessor recorded additional equity equal to $111.2 million for the 10,109,957 shares of common stock exchanged for the Redeemable Class A member interests based on the initial public offering price of $11.00 per share. |
Administration
Administration expense primarily includes the cost of hosted conferences, non-capitalized systems and software expenditures, insurance, business tax (non-income), office supplies, recruiting and regulatory fees.
54
Table of Contents
Brokerage, Clearing and Exchange Fees
Brokerage, clearing and exchange fees include the cost of floor and electronic brokerage and execution, securities clearance, and exchange fees. We currently clear our securities transactions through Ridge Clearing. Changes in brokerage, clearing and exchange fees fluctuate largely in line with the volume of sales and trading activity.
Other Expenses
Other operating expenses primarily include travel and business development, market data, occupancy, legal and accounting professional fees, depreciation and CLO administration expense at JMP.
Noncontrolling Interest
Noncontrolling interest for the year ended December 31, 2009 includes the interest of third parties in JMP Credit and Harvest Mortgage Opportunities Partners (“HMOP”), and Opportunity Acquisition Corp. (“SPAC”), partially-owned subsidiaries consolidated on our books. SPAC was liquidated on December 31, 2009 with no distribution of assets to the noncontrolling interest holders due to its accumulated loss. Noncontrolling interest for the years ended December 31, 2008 and 2007 relates to the interest of third parties in SPAC, JMP Realty Trust (“JMPRT”), and in two of our asset management funds, Harvest Consumer Partners (“HCP”) and Harvest Technology Partners (“HTP”). JMPRT was a real estate investment trust that was formed in June 2006. Because of the ownership and external management position, we consolidated JMPRT and recorded a noncontrolling interest through December 31, 2008. On January 2, 2009, all of the assets and liabilities of JMPRT were transferred to HMOP, a newly-formed hedge fund managed by HCS. The partnership agreements for HMOP provide for the right of the limited partners to remove the general partners by a simple majority vote of the non-affiliated limited partners. The Company follows the authoritative guidance under GAAP regarding the determination of whether a general partner, or the general partners as a group, controls a limited partnership or similar entity when the limited partners have certain rights. Such guidance applies when a general partner controls a limited partnership and is required to consolidate the limited partnership in its financial statements. Under the guidance, the general partner in a limited partnership is presumed to control the limited partnership regardless of the extent of the general partners’ ownership interest in the limited partnership. If the limited partners have either (a) the substantive ability to liquidate the limited partnership or otherwise remove the general partner without cause or (b) substantive participating rights, the general partner does not control the limited partnership. The partnership agreements for HMOP provide for the right of the limited partners to remove the general partner by a simple majority vote of the non-affiliated limited partners. Because of these substantive kick-out rights, the Company, as the general partner, did not control HMOP and therefore did not consolidate HMOP from January 2, 2009 through April 30, 2009. During the quarter ended June 30, 2009, several non-affiliated limited partners redeemed their interest in HMOP, and the remaining limited partners were no longer deemed to have substantive kick-out rights. As a result, the Company consolidated HMOP in its consolidated financial statements effective May 1, 2009.
HCS is the general partner of HCP and HTP. As of December 31, 2007 and during part of 2008 due to our ownership and resulting control by HCS and related parties, management believes that limited partners did not have substantive rights to remove the general partner, and, therefore, these two funds were consolidated in the financial statements and noncontrolling interest was recorded. During 2008, additional limited partners invested in HTP and HCP, and effective August 1, 2008 for HTP and December 1, 2008 for HCP, the limited partners had substantive rights to remove the general partner and the funds were deconsolidated as of those respective dates.
55
Table of Contents
Historical Results of Operations
The following table sets forth our historical results of operations for the years ended December 31, 2009, 2008 and 2007 and is not necessarily indicative of the results to be expected for any future period.
For purpose of comparing the years ended December 31, 2008 and 2007 discussed herein, we have aggregated the Predecessor period from January 1, 2007 through May 15, 2007 and the Successor period from May 16, 2007 through December 31, 2007, without further adjustment.
| Year Ended December 31, | Change from 2008 to 2009 |
||||||||||||||
| 2009 | 2008 | ||||||||||||||
| (in millions) | Successor | Successor | $ | % | |||||||||||
| Revenues |
|||||||||||||||
| Investment banking |
$ | 39,924 | $ | 27,249 | $ | 12,675 | 46.5 | % | |||||||
| Brokerage |
34,004 | 35,731 | (1,727 | ) | -4.8 | % | |||||||||
| Asset management fees |
20,148 | 11,369 | 8,779 | 77.2 | % | ||||||||||
| Principal transactions |
18,517 | (4,657 | ) | 23,174 | N/A | ||||||||||
| Gain on sale and payoff of loans |
22,268 | — | 22,268 | N/A | |||||||||||
| Gain on repurchase of asset-backed securities issued |
4,705 | — | 4,705 | N/A | |||||||||||
| Gain on bargain purchase |
1,179 | — | 1,179 | N/A | |||||||||||
| Net dividend income |
2,520 | 3,174 | (654 | ) | -20.6 | % | |||||||||
| Other income |
2,593 | 1,158 | 1,435 | 123.9 | % | ||||||||||
| Non-interest revenues |
145,858 | 74,024 | 71,834 | 97.0 | % | ||||||||||
| Interest income |
35,370 | 2,392 | 32,978 | 1378.7 | % | ||||||||||
| Interest expense |
(25,924 | ) | (408 | ) | (25,516 | ) | 6253.9 | % | |||||||
| Net interest income |
9,446 | 1,984 | 7,462 | 376.1 | % | ||||||||||
| Provision for loan losses |
(5,821 | ) | (2,896 | ) | (2,925 | ) | 101.0 | % | |||||||
| Total net revenues after provision for loan losses |
149,483 | 73,112 | 76,371 | 104.5 | % | ||||||||||
| Non-interest Expenses |
|||||||||||||||
| Compensation and benefits |
105,179 | 65,746 | 39,433 | 60.0 | % | ||||||||||
| Administration |
5,050 | 5,887 | (837 | ) | -14.2 | % | |||||||||
| Brokerage, clearing and exchange fees |
5,284 | 5,063 | 221 | 4.4 | % | ||||||||||
| Other |
13,626 | 13,262 | 364 | 2.7 | % | ||||||||||
| Total non-interest expenses |
129,139 | 89,958 | 39,181 | 43.6 | % | ||||||||||
| Income (loss) before income tax expense |
20,344 | (16,846 | ) | 37,190 | N/A | ||||||||||
| Income tax expense (benefit) |
7,663 | (5,701 | ) | 13,364 | N/A | ||||||||||
| Net income (loss) |
12,681 | (11,145 | ) | 23,826 | N/A | ||||||||||
| Less: Net income (loss) attributable to noncontrolling interests |
1,871 | (498 | ) | 2,369 | N/A | ||||||||||
| Net income (loss) attributable to JMP Group Inc. |
$ | 10,810 | $ | (10,647 | ) | $ | 21,457 | N/A | |||||||
56
Table of Contents
| Year Ended December 31, 2007 | |||||||||||||||||||||||
| Year Ended December 31, 2008 |
January 1, 2007 through May 15, 2007 |
May 16, 2007 through December 31, 2007 |
Pro Forma Combined Predecessor/ Successor |
Change from 2007 to 2008 |
|||||||||||||||||||
| (in millions) | Successor | Predecessor | Successor | $ | % | ||||||||||||||||||
| Revenues |
|||||||||||||||||||||||
| Investment banking |
$ | 27,249 | $ | 16,055 | $ | 33,222 | $ | 49,277 | $ | (22,028 | ) | -44.7 | % | ||||||||||
| Brokerage |
35,731 | 12,987 | 21,835 | 34,822 | 909 | 2.6 | % | ||||||||||||||||
| Asset management fees |
11,369 | 1,218 | 3,830 | 5,048 | 6,321 | 125.2 | % | ||||||||||||||||
| Principal transactions |
(4,657 | ) | 541 | 2,404 | 2,945 | (7,602 | ) | N/A | |||||||||||||||
| Gain on sale and payoff of loans |
— | — | — | — | — | N/A | |||||||||||||||||
| Gain on repurchase of asset-backed securities issued |
— | — | — | — | — | N/A | |||||||||||||||||
| Gain on bargain purchase |
— | — | — | — | — | N/A | |||||||||||||||||
| Net dividend income |
3,174 | 399 | 1,449 | 1,848 | 1,326 | 71.8 | % | ||||||||||||||||
| Other income |
1,158 | 326 | 534 | 860 | 298 | 34.7 | % | ||||||||||||||||
| Non-interest revenues |
74,024 | 31,526 | 63,274 | 94,800 | (20,776 | ) | -65.9 | % | |||||||||||||||
| Interest income |
2,392 | 732 | 2,007 | 2,739 | (347 | ) | -12.7 | % | |||||||||||||||
| Interest expense |
(408 | ) | (570 | ) | (160 | ) | (730 | ) | 322 | -44.1 | % | ||||||||||||
| Net interest income |
1,984 | 162 | 1,847 | 2,009 | (25 | ) | -1.2 | % | |||||||||||||||
| Provision for loan losses |
(2,896 | ) | — | — | — | (2,896 | ) | N/A | |||||||||||||||
| Total net revenues after provision for loan losses |
73,112 | 31,688 | 65,121 | 96,809 | (23,697 | ) | -24.5 | % | |||||||||||||||
| Non-interest Expenses |
|||||||||||||||||||||||
| Compensation and benefits |
65,746 | 18,393 | 45,618 | 64,011 | 1,735 | 2.7 | % | ||||||||||||||||
| Income allocation and accretion—Redeemable Class A member interests |
— | 117,418 | — | 117,418 | (117,418 | ) | -100.0 | % | |||||||||||||||
| Administration |
5,887 | 1,771 | 3,371 | 5,142 | 745 | 14.5 | % | ||||||||||||||||
| Brokerage, clearing and exchange fees |
5,063 | 1,689 | 3,366 | 5,055 | 8 | 0.2 | % | ||||||||||||||||
| Other |
13,262 | 3,947 | 8,516 | 12,463 | 799 | 6.4 | % | ||||||||||||||||
| Total non-interest expenses |
89,958 | 143,218 | 60,871 | 204,089 | (114,131 | ) | -55.9 | % | |||||||||||||||
| Income (loss) before income tax expense |
(16,846 | ) | (111,530 | ) | 4,250 | (107,280 | ) | 90,434 | -84.3 | % | |||||||||||||
| Income tax expense (benefit) |
(5,701 | ) | — | (2,537 | ) | (2,537 | ) | (3,164 | ) | 124.7 | % | ||||||||||||
| Net income (loss) |
(11,145 | ) | (111,530 | ) | 6,787 | (104,743 | ) | 93,598 | -89.4 | % | |||||||||||||
| Less: Net income (loss) attributable to noncontrolling interests |
(498 | ) | 167 | 247 | 414 | (912 | ) | N/A | |||||||||||||||
| Net income (loss) attributable to JMP Group Inc. |
$ | (10,647 | ) | $ | (111,697 | ) | $ | 6,540 | $ | (105,157 | ) | $ | 94,510 | -89.9 | % | ||||||||
Year Ended December 31, 2009, Compared to Year Ended December 31, 2008
Overview
Total net revenues after provision for loan losses increased $76.4 million, or 104.5%, from $73.1 million for the year ended December 31, 2008 to $149.5 million for the year ended December 31, 2009, driven by an increase in non-interest revenues of $71.8 million and an increase in net interest income of $7.5 million, offset by an increase in provision for loan losses of $2.9 million.
57
Table of Contents
Non-interest revenues increased $71.8 million, or 97.0%, primarily due to a $23.2 million increase in principal transaction revenues, a $12.7 million increase in investment banking revenues, $8.8 million increase in asset management revenues, a $22.3 million increase in gain on sale and payoff of loans and a $4.7 million increase in gain on repurchase of asset-backed securities issued.
Net interest income increased $7.4 million, or 376.1%, from $2.0 million for the year ended December 31, 2008 to $9.4 million for the year ended December 31, 2009. The increase was primarily due to the acquisition of Cratos, which resulted in $9.1 million of net interest income recorded at JMP Credit. Net interest income for the remainder of the Company fell from $2.0 million to $0.3 million primarily due to lower interest received on cash balances during the year ended December 31, 2009 compared to the year ended December 31, 2008.
Provision for loan losses increased $2.9 million, or 101.0%, from $2.9 million for the year ended December 31, 2008 to $5.8 million for the year ended December 31, 2009 due to a $4.4 million increase in the provision recorded against loans collateralizing ABS issued at JMP Credit, offset by a $1.5 million decrease in the provision recorded against loans held for investment.
Total non-interest expenses increased $39.1 million, or 43.6%, from $90.0 million for the year ended December 31, 2008 to $129.1 million for the year ended December 31, 2009, primarily due to an increase in compensation and benefits of $39.4 million offset by a decrease in administration expense of $0.8 million and an increase in other expenses of $0.5 million.
Net income (loss) attributable to JMP Group Inc. increased $21.4 million from net loss of $10.6 million for the year ended December 31, 2008 to net income of $10.8 million for the year ended December 31, 2009, and includes a $13.4 million increase in income tax expense from tax benefit of $5.7 million for the year ended December 31, 2008 to tax expense of $7.7 million for the year ended December 31, 2009.
Revenues
Investment Banking
Investment banking revenues increased $12.7 million, or 46.5%, from $27.2 million for the year ended December 31, 2008 to $39.9 million for the same period in 2009, and decreased as a percentage of total net revenues after provision for loan losses from 37.3% to 26.7%, respectively. The increase in revenues reflects a higher level of activity in our public equity underwriting, private placement and strategic advisory businesses. Public equity underwriting revenues increased by $7.2 million, or 78.0%, from $9.1 million for the year ended December 31, 2008 to $16.3 million for the year ended December 31, 2009. We executed 30 public equity underwriting transactions in 2009 compared to 16 in 2008. We acted as a lead manager on four transactions in 2009 compared to none in 2008. Private placement revenues increased $2.3 million, or 31.2%, from $7.4 million for the year ended December 31, 2008 to $9.7 million for the year ended December 31, 2009. We executed 10 private placement transactions in 2009 compared to five in 2008. Our strategic advisory revenues increased $3.2 million, or 30.3%, from $10.8 million for the year ended December 31, 2008 to $14.0 million for the year ended December 31, 2009. We executed 16 strategic advisory transactions in 2009 compared to 14 in 2008.
Brokerage Revenues
Brokerage revenues decreased $1.7 million, or 4.8%, from $35.7 million for the year ended December 31, 2008 to $34.0 million for the year ended December 31, 2009. The decrease was the result of lower gross commissions. Brokerage revenues decreased as a percentage of total revenues, from 48.9% for the year ended December 31, 2008 to 22.7% for the year ended December 31, 2009.
Asset Management Fees
Asset management fees increased $8.7 million, or 77.2%, from $11.4 million for the year ended December 31, 2008 to $20.1 million for the year ended December 31, 2009. Asset management fees include base
58
Table of Contents
management fees and incentive fees for our funds under management. Base management fees increased $3.1 million or 56.7% from $5.4 million for the year ended December 31, 2008 to $8.5 million for year ended December 31, 2009. Incentive fees increased $5.6 million or 96.0% from $6.0 million for the year ended December 31, 2008 to $11.6 million for the year ended December 31, 2009. The increase in base management fees is the result of an increase in client assets under management from $443.0 million as of December 31, 2008 to $563.6 million as of December 31, 2009. This was primarily due to the performance of Harvest Small Cap Partners in 2008 and 2009, which enabled it to raise additional capital and increase client assets under management from $220.3 million at December 31, 2008 to $327.3 million at December 31, 2009. The increase in incentive fees is due to stronger performance of our family of funds, in particular the performance of Harvest Small Cap Partners fund which earned incentive fees of $9.2 million in 2009 compared to $5.9 million in 2008. As a percentage of total net revenues after provision for loan losses, asset management fees decreased from 15.6% for the year ended December 31, 2008 to 13.5% for the year ended December 31, 2009.
Principal Transactions
Principal transaction revenues increased $23.2 million from a loss of $4.7 million for the year ended December 31, 2008 to a gain of $18.5 million for the year ended December 31, 2009. The increase was primarily due to a $17.1 million increase in equity and other security transaction revenues from a loss of $6.8 million for the year ended December 31, 2008 to a gain of $10.3 million for the year ended December 31 2009. In addition, gain on investments in partnerships increased $6.5 million from $2.0 million for the year ended December 31, 2008 to $8.5 million for the year ended December 31, 2009. The increase in equity and other security transaction revenues was largely due to unrealized gain on our convertible preferred security and equity security investments in NYMT, which reflected a loss of $6.5 million for the year ended December 31, 2008 compared to a gain of $5.6 million for the year ended December 31, 2009.
Gain on Sale and Payoff of Loans
Gain on sale and payoff of loans increased $22.3 million from zero for the year ended December 31, 2008 to $22.3 million for the year ended December 31, 2009, with all of the gain generated at JMP Credit. During the year ended December 31, 2009, 23 loans were sold or repaid (including one partially sold), resulting in a net gain of $22.3 million. Of the total net gain of $22.3 million, $14.0 million was related to 10 loan repayments, where the borrowers repaid the loans at a premium to our carrying value, and the remaining $8.3 million was related to 13 loan sales, most of which were sold at a premium to our carrying value. We expect some further gains in future periods, however these revenues are highly unpredictable as we are not actively marketing the loans collateralized by asset-backed securities for sale.
Gain on Repurchase of Asset-Backed Securities Issued
Gain on repurchase of ABS issued increased $4.7 million from zero for the year ended December 31, 2008 to $4.7 million for the year ended December 31, 2009, with all of the gain generated at JMP Credit. In May and July 2009, we repurchased in the open market $0.8 million and $4.0 million of face value, respectively, of our ABS at a discount resulting in a gain of $4.2 million. In addition, on December 29, 2009, we repurchased a zero-coupon note with $3.0 million unpaid principal balance that was issued to one of the previous owners of Cratos at acquisition (contingent consideration) for $1.8 million. The note was repurchased at a discount to our carrying value resulting in a gain of $0.5 million. These gains are not expected to recur at these levels in future periods, unless the market price of our ABS issued falls significantly from our carrying value as of December 31, 2009 and we can take advantage of opportunistic repurchases.
Gain on Bargain Purchase
Upon the acquisition of Cratos by JMP Credit on April 7, 2009, a bargain purchase gain of $1.2 million was recorded which reflects the difference between the fair value of net assets acquired of $7.5 million and the GAAP consideration given to the sellers of $6.3 million. In accordance with the authoritative guidance under GAAP on business combinations, this gain was booked to current period revenues.
59
Table of Contents
Net Dividend Income
Net dividend income decreased $0.7 million, or 20.6%, from $3.2 million for the year ended December 31, 2008 to $2.5 million for the year ended December 31, 2009. The decrease was primarily due to lower net dividends in our principal investment portfolio.
Other Income
Other income increased $1.4 million, or 123.9%, from $1.2 million for the year ended December 31, 2008 to $2.6 million for the year ended December 31, 2009. The increase comprised loan restructuring fees of $0.8 million at JMP Credit and a $0.6 million increase in revenues from fee sharing arrangements with, and fees earned to raise capital for, third-party investment partnerships or funds.
Interest Income
Interest income increased $33.0 million from $2.4 million for the year ended December 31, 2008 to $35.4 million for the year ended December 31, 2009. The increase was due to the acquisition of Cratos and primarily $34.5 million of interest income at JMP Credit, offset by a fall in interest income at the remainder of the Company of $1.5 million due to lower interest received on cash balances.
At JMP Credit, total interest income for the year ended December 31, 2009 was $34.5 million. This was comprised of interest earned on our 112 performing loans of $14.3 million, accretion of purchase discounts and other deferred fees of $1.0 million and non-cash accretion of the liquidity discounts on our loans of $19.2 million. The annualized weighted average interest rate on the loans was 5.00 % with a spread to weighted average LIBOR of 4.34% for the year ended December 31, 2009. We did not recognize any interest income for the 17 impaired loans with a weighted average loan balance of $95.1 million that were on non-accrual status during the year.
Interest Expense
Interest expense increased $25.5 million from $0.4 million for the year ended December 31, 2008 to $25.9 million for the same period in 2009. The increase was due primarily to the acquisition of Cratos and $25.4 million of interest expense at JMP Credit. At JMP Credit, total interest expense for the year ended December 31, 2009 was $25.4 million. This was comprised of interest on ABS issued of $4.6 million, non-cash amortization of the liquidity discount on the ABS issued of $20.6 million, and other interest expense of $0.2 million, which was primarily related to non-cash amortization of the liquidity discount on the $3.0 million zero-coupon note issued to one of the previous owners of Cratos at acquisition (contingent consideration). The annualized weighted average cost of funds for the ABS issued during the year ended December 31, 2009 was 1.39% with a spread to weighted average LIBOR of 0.72%.
Provision for Loan Losses
Provision for loan losses increased $2.9 million from $2.9 million for the year ended December 31, 2008 to $5.8 million for the same period in 2009. The increase was primarily due to $4.4 million recorded in 2009 against loans collateralizing ABS issued at JMP Credit, offset by a $1.5 million decrease in provision against loans held for investment. Of the $4.4 million recorded at JMP Credit, $4.0 million was additional provision recorded in 2009 as specific reserves against impaired loans, in addition to the credit discount recorded against impaired loans at the acquisition date of Cratos to record those loans at their net realizable value. Provision of $0.4 million was recorded as pooled reserve against performing loans as of December 31, 2009.
60
Table of Contents
Expenses
Compensation and Benefits
Compensation and benefits, which includes employee payroll, taxes and benefits, performance-based cash bonus and commissions as well as equity-based compensation to our employees, increased $39.5 million, or 60.0%, from $65.7 million for the year ended December 31, 2008 to $105.2 million for the year ended December 31, 2009. For the year ended December 31, 2009, due to revenues produced by the JMP Credit CLO that have not yet resulted in cash flow to JMP as they are reinvested in the CLO securitization structure, $13.3 million of compensation and benefits expense related to these revenues has been expensed but deferred to be paid at a future date when those cash flows are received.
Employee payroll, taxes and benefits, and consultant fees, increased $2.8 million, or 10.0%, from $27.8 million for the year ended December 31, 2008 to $30.6 million for the year ended December 31, 2009 primarily due to the acquisition of Cratos in April 2009 as well as increases in base salaries in May 2008.
Performance-based bonus and commissions increased $38.0 million, or 141.6%, from $26.8 million for the year ended December 31, 2008 to $64.8 million for the year ended December 31, 2009 primarily due to an increase in net revenues after provision for loan losses of $76.4 million, or 104.5%, from $73.1 million for the year ended December 31, 2008 to $149.5 million for the year ended December 31, 2009.
Equity-based compensation decreased $1.4 million, or 12.2%, from $11.1 million for the year ended December 31, 2008 to $9.7 million for the year ended December 31, 2009 primarily due to a decrease in expense related to restricted stock units (“RSUs”) of $1.3 million. The total equity-based compensation expense for the years ended December 31, 2009 and 2008 included $3.2 million and $3.9 million of expense related to RSUs granted in connection with the initial public offering, respectively, and $6.6 million and $7.2 million of expense related to RSUs granted after the initial public offering, respectively. The expense related to RSUs granted in connection with the initial public offering decreased $0.7 million as a result of the scheduled vesting of 25% of such RSUs in May 2009. The expense related to RSUs granted after the initial public offering decreased a net $0.6 million from two opposing factors. There was a decrease in the scheduled amortization expense of $2.7 million due to a decrease in the number of outstanding RSUs from 2.3 million units at December 31, 2008 to 1.4 million units at December 31, 2009, offset by an increase in one-time expense related to acceleration of the vesting of certain RSUs of $2.1 million. On December 22, 2008, the Company accelerated the vesting of 990,862 RSUs that were granted under our 2007 bonus compensation program and recognized $2.6 million of amortization expense from future periods in the year ended December 31, 2008. On November 2, 2009, the Company accelerated the vesting of 1,295,000 RSUs that were granted in the first quarters of 2008 and 2009 and recognized $4.7 million of amortization expense from future periods in the year ended December 31, 2009. The acceleration on November 2, 2009 was to align the terms of existing RSUs with those of future RSUs, which will have performance-based vesting conditions instead of service-based vesting conditions.
Compensation and benefits as a percentage of revenues decreased from 89.9% of total net revenues after provision for loan losses for the year ended December 31, 2008 to 70.4% for the year ended December 31, 2009. The percentage was higher for 2008 because our target compensation to revenue ratios were adjusted by management to maintain competitive compensation levels to employees. Excluding expense from RSUs granted in connection with the initial public offering of $3.9 million and $3.2 million for the years ended December 31, 2008 and 2009, respectively, as a percentage of total net revenues after provision for loan losses, compensation and benefits decreased from 84.6% to 68.2%.
Administration
Administration expenses decreased $0.8 million, or 14.2%, from $5.9 million for the year ended December 31, 2008 to $5.1 million for the year ended December 31, 2009. The decrease was primarily due to lower conferences expense in 2009 compared to 2008. As a percentage of total net revenues after provision for loan losses, administration expense decreased from 8.1% for the year ended December 31, 2008 to 3.4% for the year ended December 31, 2009.
61
Table of Contents
Brokerage, Clearing and Exchange Fees
Brokerage, clearing and exchange fees increased $0.2 million, or 4.4%, from $5.1 million for the year ended December 31, 2008 to $5.3 million for the year ended December 31, 2009. The increase was primarily due to higher trading services costs in the year ended December 31, 2009, compared to the year ended December 31, 2008. As a percentage of total net revenues after provision for loan losses, brokerage, clearing and exchange fees decreased from 6.9% for the year ended December 31, 2008 to 3.5% for the year ended December 31, 2009.
Other Expenses
Other expenses increased $0.3 million, or 2.7%, from $13.3 million for the year ended December 31, 2008 to $13.6 million for the year ended December 31, 2009. The increase was primarily due to a $0.5 million increase in occupancy, a $0.5 million increase in professional fees and a $0.6 million increase in CLO administration expense at JMP Credit, offset by a $1.1 million decrease in travel and business development expense. As a percentage of total net revenues after provision for loan losses, other expenses decreased from 18.1% for the year ended December 31, 2008 to 9.1% for the year ended December 31, 2009.
Net Income (Loss) Attributable to Noncontrolling Interests
Net income (loss) attributable to noncontrolling interests increased $2.4 million from net loss of $0.5 million for the year ended December 31, 2008 to net income of $1.9 million for the year ended December 31, 2009 primarily due to the acquisition of JMP Credit.
Provision for Income Taxes
For the years ended December 31, 2009 and 2008, we recorded tax expense of $7.7 million and tax benefit of $5.7 million, respectively. The tax benefit for the year ended December 31, 2008 included an adjustment of $0.3 million to the $4.0 million one-time tax benefit recorded in 2007 in connection with our reorganization.
The effective tax rate for the year ended December 31, 2009 and 2008 was 37.7% and 34.9%, respectively. Excluding the one-time tax benefit described above, the effective tax rate for the year ended December 31, 2008 was 32.7%.
Year Ended December 31, 2008 Compared to Year Ended December 31, 2007
Overview
Total net revenues after provision for loan losses decreased $23.7 million, or 24.5%, from $96.8 million for the year ended December 31, 2007 to $73.1 million for the year ended December 31, 2008. The decrease was primarily due to a decrease in investment banking revenue of $22.0 million, principal transaction revenues of $7.6 million, of which $6.5 million is related to unrealized losses from our convertible preferred security and equity security investments in NYMT, and an increase in provision for loan losses of $2.9 million, partially offset by an increase in asset management fee revenue of $6.3 million, brokerage revenue of $0.9 million and net dividend income of $1.3 million.
Total non-interest expenses decreased by $114.1 million, or 55.9%, from $204.1 million for the year ended December 31, 2007 to $90.0 million for the year ended December 31, 2008, primarily due to a decrease in income allocation and accretion/(dilution) expense of $117.4 million resulting from a one-time non-cash expense associated with the exchange of Redeemable Class A member interests into shares of our common stock in connection with the reorganization at the time of our initial public offering.
Net loss attributable to JMP Group Inc. decreased $94.6 million from a loss of $105.2 million for the year ended December 31, 2007 to net loss of $10.6 million for the year ended December 31, 2008, primarily as a result of the of the aforementioned decrease in expenses.
62
Table of Contents
Revenues
Investment Banking
Investment banking revenues decreased $22.0 million, or 44.7%, from $49.3 million for the year ended December 31, 2007 to $27.2 million for the same period in 2008 and decreased as a percentage of total net revenues after provision for loan losses from 50.9% to 37.3%, respectively. The decrease in revenues reflects a lower level of activity in our public equity underwriting and private placement businesses, as well as a decrease in strategic advisory revenues. Public equity underwriting revenues decreased by $10.3 million, or 53.0%, from $19.4 million for the year ended December 31, 2007 to $9.1 million for the year ended December 31, 2008, primarily due to highly volatile capital markets conditions throughout the year ended December 31, 2008, which caused a significant decline in new equity issuance by U.S. companies during the period. We executed 16 public equity underwriting transactions in the year ended December 31, 2008 compared to 35 in the year ended December 31, 2007. In addition, we acted as the lead manager on one public equity underwriting transaction in the year ended December 31, 2008 compared to eight in the year ended December 31, 2007, which included our own initial public offering (for which we recognized no revenue; the underwriting fees were instead recorded as additional paid-in capital). Private placement revenues decreased $2.4 million, or 24.4%, from $9.7 million for the year ended December 31, 2007 to $7.4 million for the year ended December 31, 2008. While the number of private placement transactions executed decreased from 17 in the year ended December 31, 2007 to five in the year ended December 31, 2008, average revenues per transaction increased $0.9 million, or 157.0%, from $0.6 million for the year ended December 31, 2007 to $1.5 million for the year ended December 31, 2008. Our strategic advisory revenues decreased $9.3 million, or 46.5%, from $20.1 million for the year ended December 31, 2007 to $10.8 million for the year ended December 31, 2008, due to a lower level of activity as well as a decrease in the average revenues per transaction executed in the year ended December 31, 2008 compared to in the year ended December 31, 2007. We executed 14 strategic advisory transactions in the year ended December 31, 2008 compared to 19 in the year ended December 31, 2007.
Brokerage Revenues
Brokerage revenues increased by $0.9 million, or 2.6%, from $34.8 million for the year ended December 31, 2007 to $35.7 million for the year ended December 31, 2008. The increase was a result of higher gross commission income for the year ended December 31, 2008 compared to the year ended December 31, 2007. The increase in commissions resulted from increased trading activity with existing and new institutional clients during the period. Brokerage revenues increased as a percentage of total net revenues after provision for loan losses, from 36.0% for the year ended December 31, 2007 to 48.9% for the year ended December 31, 2008.
Asset Management Fees
Asset management fees increased by $6.3 million, or 125.2%, from $5.0 million for the year ended December 31, 2007 to $11.4 million for the year ended December 31, 2008. Asset management fees include base management fees and incentive fees for our funds under management, both of which increased from the year ended December 31, 2007 to the year ended December 31, 2008. The increase in base management fees from $2.8 million for the year December 31, 2007 to $5.5 million for the year ended December 31, 2008 is the result of an increase in client assets under management from $237.3 million as of December 31, 2007 to $443.0 million as of December 31, 2008. This was primarily due to the attractive performance of Harvest Small Cap Partners during 2008, which enabled it to raise additional capital and increase assets under management by $171.0 million, when most other hedge funds were experiencing redemptions. The increase in incentive fees from $2.2 million for the year ended December 31, 2007 to $5.9 million for the year ended December 31, 2008 is the result of improved performance of our families of funds, in particular of Harvest Small Cap Partners. As a percentage of total net revenues after provision for loan losses, asset management fees increased from 5.2% for the year ended December 31, 2007 to 15.6% for the same period in 2008.
63
Table of Contents
Principal Transactions
Principal transaction revenues decreased $7.6 million from a gain of $2.9 million for the year ended December 31, 2007 to a loss of $4.7 million for the year ended December 31, 2008. The decrease was primarily due to a loss of $6.8 million from our equity security investments during the year ended December 31, 2008, mostly related to a $6.5 million unrealized loss from our convertible preferred security and equity security investments in NYMT, offset by net unrealized gain of $2.0 million from our partnership interests in the hedge funds and funds of funds managed by HCS, which are accounted for using the equity method of accounting.
Net Dividend Income
Net dividend income increased $1.3 million, or 71.8%, from $1.9 million for the year ended December 31, 2007 to $3.2 million for the year ended December 31, 2008 primarily due to the dividend earned from our investment in NYMT convertible preferred securities.
Other Income
Other income increased $0.3 million, or 34.7%, from $0.9 million for the year ended December 31, 2007 to $1.2 million for the year ended December 31, 2008 primarily from revenue sharing arrangements with, and fees earned to raise capital for third-party investment partnerships or funds.
Interest Income
Interest income decreased $0.3 million from $2.7 million for the year ended December 31, 2007 to $2.4 million for the year ended December 31, 2008 primarily due to a decrease in interest earned on proceeds from our initial public offering that were invested in short duration AAA rated securities.
Interest Expense
Interest expense decreased $0.3 million from $0.7 million for the year ended December 31, 2007 to $0.4 million for the year ended December 31, 2008. The decrease was primarily attributable to the discontinuation of interest payments to Redeemable Class A members as a result of the reorganization.
Provision for Loan Losses
Provision for loan losses increased $2.9 million from zero for the year ended December 31, 2007 to $2.9 million for the year ended December 31, 2008. The increase was related to loss provision recorded on one loan note advanced in 2007 and one advanced in 2008 on a non revolving credit agreement. The aggregate principal amount of these two advances was $5.0 million as of December 31, 2008.
Expenses
Compensation and Benefits
Compensation and benefits, which includes employee payroll, performance-based cash bonus and commissions as well as equity-based compensation to our employees and managing directors, increased $1.7 million, or 2.7%, from $64.0 million for the year ended December 31, 2007 to $65.7 million for the year ended December 31, 2008.
Employee payroll increased $4.3 million, or 18.3%, from $23.5 million for the year ended December 31, 2007 to $27.8 million for the year ended December 31, 2008 primarily due to increases in base salaries from May 1, 2008.
64
Table of Contents
Performance-based cash bonus and commission decreased $5.4 million, or 16.7%, from $32.3 million for the year ended December 31, 2007 to $26.8 million for the year ended December 31, 2008 due to lower revenues in 2008.
Equity-based compensation increased $2.9 million, or 33.7%, from $8.3 million for the year ended December 31, 2007 to $11.1 million for the year ended December 31, 2008 primarily due to $2.6 million of restricted stock units (“RSUs”) amortization expense from future periods recognized in 2008 caused by the acceleration of the vesting of the restricted stock units granted as part of our 2007 annual bonus compensation program. The total equity-based compensation expense for the year ended December 31, 2008 included $3.9 million recognized for RSUs granted in connection with the initial public offering and $7.2 million recognized for RSUs granted after the initial public offering. Of the $7.2 million in expense recognized for RSUs granted after the initial public offering, $6.2 million was related to RSUs granted as part of our 2007 annual bonus compensation program and $1.0 million was related to four year cliff vesting RSUs granted in 2007 and 2008 under the 2007 Equity Incentive Plan.
Compensation and benefits as a percentage of revenues increased from 66.1% of total net revenues after provision for loan losses for the year ended December 31, 2007 to 89.9% for the same period in 2008. Excluding expense from equity-based awards as a result of the initial public offering of $7.2 million and $3.9 million for the years ended December 31, 2007 and 2008, respectively, as a percentage of revenues, compensation and benefits increased from 58.7% of total net revenues after provision for loan losses for the year ended December 31, 2007 to 84.6% for the same period in 2008.
Income Allocation and Accretion/(Dilution)
Income allocation and accretion/(dilution) decreased from $117.4 million for the year ended December 31, 2007 to zero for the year ended December 31, 2008. The decrease was due to our reorganization as a C-corporation in connection with our initial public offering as of May 16, 2007 and future periods will no longer reflect this expense.
Administration
Administration expenses increased $0.8 million, or 14.5%, from $5.1 million for the year ended December 31, 2007 to $5.9 million for the year ended December 31, 2008. The increase was primarily due to higher expenses associated with being a public company, as well as higher conferences expenses. Administration expense increased from 5.3% of total net revenues after provision for loan losses for the year ended December 31, 2007 to 8.1 % for the same period in 2008.
Brokerage, Clearing and Exchange Fees
Brokerage, clearing and exchange fees were $5.1 million for both of the years ended December 31, 2008 and 2007. As a percentage of total net revenues after provision for loan losses, our brokerage, clearing and exchange fees increased from 5.2 % for the year ended December 31, 2007 to 6.9% for the year ended December 31, 2008.
Other Expenses
Other expenses increased $0.8 million, or 6.4%, from $12.5 million for the year ended December 31, 2007 to $13.3 million for the year ended December 31, 2008. The increase in other expenses was due primarily to a $0.6 million increase in professional fees, consisting primarily of increased legal expenses, as well as audit and accounting expenses from being a public company. As a percentage of total net revenues after provision for loan losses, other expenses increased from 12.9% for the year ended December 31, 2007 to 18.1% for the same period in 2008.
65
Table of Contents
Net Income (Loss) Attributable to Noncontrolling Interests
Noncontrolling interests relate to third-party interests in JMPRT and two of our hedge funds, HCP (through November 30, 2008) and HTP (through July 31, 2008), as well as Opportunity Acquisition Corp. Net income (loss) attributable to noncontrolling interests decreased $0.9 million from net income of $0.4 million for the year ended December 31, 2007 to net loss of $0.5 for the year ended December 31, 2008, primarily due to a reduction in net income (loss) of JMPRT as well as deconsolidation of HTP and HCP on August, 1, 2008 and December 1, 2008, respectively.
Provision for Income Taxes
Prior to the completion of our initial public offering on May 16, 2007, we were a limited liability company treated as a partnership for income tax purposes, therefore all of our income and losses were reportable by the individual members. The U.S. federal and state income taxes payable by the members based upon their share of our net income have not been reflected in the accompanying financial statements for the periods prior to the initial public offering. We were, however, subject to state and local unincorporated tax and franchise tax.
In connection with our initial public offering and reorganization, we are subject to federal and state income taxes on all taxable income earned subsequent to May 15, 2007. Additionally, in connection with the reorganization, we recognized a one-time tax benefit of $4.0 million in connection with the establishment of net deferred tax asset items of $10.2 million. In calculating the one-time tax benefit amount and associated deferred tax asset items, the Company made reasonable estimates of its share of the 2006 taxable income and 2007 taxable income attributed to the period from January 1 through May 15, 2007 of the partnerships in which it has a direct or indirect interest. These estimates may change as additional information becomes available; as a result, the net one-time tax benefit amount may change. During the year ended December 31, 2008, the Company adjusted the one-time tax benefit of $4.0 million by $0.3 million in additional tax benefit. For the year ended December 31, 2008 and for the period May 16, 2007 to December 31, 2007, we recorded a total tax benefit of $5.7 million and $2.5 million, respectively. Excluding the tax benefit adjustment of $0.3 million and $4.0 million, we recorded a tax benefit of $5.4 million for the year ended December 31, 2008 and a tax provision of $1.5 million and for the period May 16, 2007 to December 31, 2007, respectively.
The effective tax rate for the year ended December 31, 2008 and for the period May 16, 2007 to December 31, 2007 was 32.7% and 38.7%, respectively, excluding the prior year one-time tax benefit adjustment. Including the prior year one-time tax benefit adjustment, the effective tax for the year ended December 31, 2008 and for the period May 16, 2007 to December 31, 2007 was 34.9% and (63.4%), respectively.
Period from January 1, 2007 through May 15, 2007
Revenues
Investment Banking
Investment banking revenues were $16.1 million or 50.7% of total net revenues after provision for loan losses for the period ended May 15, 2007 and 32.6% of the total investment banking revenues for the twelve month pro forma combined Predecessor/Successor period ended December 31, 2007. Public equity underwriting revenues were $5.8 million or 36.3% of total investment banking revenues for the period ended May 15, 2007. We executed 12 public equity underwriting transactions in the period including 1 transaction where we acted as the lead manager (on our own initial public offering for which we recognized no revenue; the underwriting fees were instead recorded as additional paid-in capital). Private placement revenues were $5.3 million, or 32.9% of total investment banking revenues for the period. Average private placement transactions revenues per transaction were $0.7 million for the period. Our strategic advisory revenues were $4.9 million from 5 transactions, or 30.8% of total investment banking revenues for the period.
66
Table of Contents
Brokerage Revenues
Brokerage revenues were $13.0 million, or 41.0% of total net revenues after provision for loan losses for the period ended May 15, 2007 and 37.3 % of the total brokerage revenues for the twelve month pro forma combined Predecessor/Successor period ended December 31, 2007.
Asset Management Fees
Asset management fee revenues were $1.2 million, or 3.8% of total net revenues after provision for loan losses for the period ended May 15, 2007 and 24.1% of the total asset management fee revenues for the twelve month pro forma combined Predecessor/Successor period ending December 31, 2007. Asset management fees included base management fees of $1.0 million and incentive fees of $0.2 million for our funds under management for the period ended May 15, 2007.
Principal Transactions
Principal transaction revenues of $0.5 million were comprised of $0.7 million of realized and unrealized gains from the Company’s investment of its own capital in the hedge funds and fund of funds managed by HCS and the realized and unrealized loss of $0.2 million from equity investments in publicly traded securities. This $0.5 million was 1.7% of total net revenues after provision for loan losses for the period ended May 15, 2007 and 18.4% of the total principal transaction revenues for the twelve month pro forma combined Predecessor/Successor period ended December 31, 2007.
Net Dividend Income
Net dividend income was $0.4 million, or 1.3% of total net revenues after provision for loan losses for the period ended May 15, 2007 and 21.6% of the total net dividend income for the twelve month pro forma combined Predecessor/Successor period ended December 31, 2007.
Other Income
Other income was $0.3 million, or 1.0% of total net revenues after provision for loan losses for the period ended May 15, 2007 and 37.9% of the total other income for the twelve month pro forma combined Predecessor/Successor period ended December 31, 2007.
Interest Income
Interest income was $0.7 million, or 2.3% of total net revenues after provision for loan losses for the period ended May 15, 2007 and 26.7% of the total interest income for the twelve month pro forma combined Predecessor/Successor period ended December 31, 2007.
Interest Expense
Interest expense was $0.6 million, or 1.8% of total net revenues after provision for loan losses for the period ended May 15, 2007 and 78.1% of the total interest expense for the twelve month pro forma combined Predecessor/Successor period ended December 31, 2007. Interest expense for this period was primarily comprised of interest paid to Redeemable Class A members on their capital contributions.
Expenses
Compensation and Benefits
Compensation and benefits, which includes employee payroll, performance-based cash bonus and commissions as well as equity-based compensation to our employees and managing directors, was $18.4 million, or 12.8% of total non-interest expenses for the period ended May 15, 2007 and 28.7% of the total compensation and benefits expense for the twelve month pro forma combined Predecessor/Successor period ended December 31, 2007.
67
Table of Contents
Employee payroll expense was $8.3 million, or 45.0% of compensation and benefits expense for the period ended May 15, 2007. Performance-based cash bonus and commission was $9.3 million, or 50.6% of compensation and benefits expense for the period ended May 15, 2007. Equity-based compensation was $0.8 million, or 4.4% of compensation and benefits expense for the period ended May 15, 2007 related to stock options.
Compensation and benefits as a percentage of revenues was 58.0% of total net revenues after provision for loan losses for the period ended May 15, 2007. Excluding expense from equity-based awards as a result of the initial public offering, as a percentage of revenues, compensation and benefits was 57.8% of total net revenues after provision for loan losses for the period ended May 15, 2007.
Income Allocation and Accretion/ (Dilution)
Income allocation and accretion/(dilution) was $117.4 million for the period ended May 15, 2007 due to a one-time non-cash expense associated with the exchange of Redeemable Class A member interests into shares of our common stock in connection with the reorganization at the time of our initial public offering.
Administration
Administration expense was $1.8 million, or 1.2% of total non-interest expenses and 5.6% of total net revenues after provision for loan losses for the period ended May 15, 2007.
Brokerage, Clearing and Exchange Fees
Brokerage, clearing and exchange fees were $1.7 million, or 1.2% of total non-interest expenses and 5.3% of total net revenues after provision for loan losses for the period ended May 15, 2007.
Other Expenses
Other expenses were $3.9 million, or 2.8% of total non-interest expenses and 12.5% of total net revenues after provision for loan losses for the period ended May 15, 2007. The majority of other expenses were travel and business development of $1.2 million, communications and technology of $1.4 million, occupancy of $0.7 million and professional fees of $0.4 million.
Net Income (Loss) Attributable to Noncontrolling Interests
Net income attributable to noncontrolling interests of $0.2 million relates to the consolidation of JMPRT and two of our hedge funds, HCP and HTP.
Provision for Income Taxes
Prior to the completion of our initial public offering on May 16, 2007, we were a limited liability company treated as a partnership for income tax purposes, therefore all of our income and losses were reportable by the individual members. The U.S. federal and state income taxes payable by the members based upon their share of our net income have not been reflected in the accompanying financial statements for the periods prior to the initial public offering. We were, however, subject to state and local unincorporated tax and franchise tax.
68
Table of Contents
Period from May 16, 2007 through December 31, 2007
Revenues
Investment Banking
Investment banking revenues were $33.2 million, or 51.0% of total net revenues after provision for loan losses for the period from May 16, 2007 through December 31, 2007 and 67.4% of the total investment banking revenues for the twelve month pro forma combined Predecessor/Successor period ended December 31, 2007. Public equity underwriting revenues were $13.6 million or 41.0% of total investment banking revenues for the period from May 16, 2007 through December 31, 2007. We executed 23 public equity underwriting transactions in the period including 7 transactions where we acted as the lead manager. Private placement revenues were $4.5 million, or 13.4% of total investment banking revenues and average private placement transactions revenues per transaction were $0.5 million for the period from May 16, 2007 through December 31, 2007. Our strategic advisory revenues were $15.2 million from 14 transactions, or 45.6% of total investment banking revenues for the period from May 16, 2007 through December 31, 2007.
Brokerage Revenues
Brokerage revenues were 21.8 million, or 33.5% of total net revenues after provision for loan losses for the period from May 16, 2007 through December 31, 2007 and 62.7% of the total brokerage revenues for the twelve month pro forma combined Predecessor/Successor period ended December 31, 2007.
Asset Management Fees
Asset management fee revenues were $3.8 million, or 5.9% of total net revenues after provision for loan losses for the period from May 16, 2007 through December 31, 2007 and 75.9% of the total asset management fee revenues for the twelve month pro forma combined Predecessor/Successor period ended December 31, 2007. Asset management fees included base management fees of $1.8 million and incentive fees of $2.0 million for our funds under management for the period from May 16, 2007 through December 31, 2007.
Principal Transactions
Principal transaction revenues of $2.4 million were comprised of $1.8 million of realized and unrealized gains from the Company’s investment of its own capital in the hedge funds and fund of funds managed by HCS and the realized and unrealized gains of $0.6 million from equity investments in publicly held securities. During the period, using some of the proceeds from the initial public offering the Company invested an additional $12.3 million in the hedge funds and fund of funds managed by HCS. The $2.4 million of principal transaction revenues was 3.7% of total net revenues after provision for loan losses for the period from May 16, 2007 through December 31, 2007 and 81.6% of the total principal transaction revenues for the twelve month pro forma combined Predecessor/Successor period ended December 31, 2007.
Net Dividend Income
Net dividend income was $1.4 million, or 2.2% of total net revenues after provision for loan losses for the period ended May 15, 2007 and 78.4% of the total net dividend income for the twelve month pro forma combined Predecessor/Successor period ended December 31.
Other Income
Other income was $0.5 million, or 0.8% of total net revenues after provision for loan losses for the period ended May 15, 2007 and 62.1% of the total other income for the twelve month pro forma combined Predecessor/Successor period ended December 31, 2007.
69
Table of Contents
Interest Income
Interest income was $2.0 million, or 3.1% of total net revenues after provision for loan losses for the period ended May 15, 2007 and 73.3% of the total interest income for the twelve month pro forma combined Predecessor/Successor period ended December 31, 2007.
Interest Expense
Interest expense was $0.2 million, or 0.2% of total net revenues after provision for loan losses for the period ended May 15, 2007 and 21.9% of the total interest expense for the twelve month pro forma combined Predecessor/Successor period ended December 31, 2007.
Expenses
Compensation and Benefits
Compensation and benefits, which includes employee payroll, performance-based cash bonus and commissions as well as equity-based compensation to our employees and managing directors, was $45.6 million, or 74.9% of total non-interest expenses for the period from May 16, 2007 through December 31, 2007 and 71.3% of the total compensation and benefits expense for the twelve month pro forma combined Predecessor/Successor period ended December 31, 2007.
Employee payroll expense was $15.2 million, or 33.3% of compensation and benefits expense for the period from May 16, 2007 through December 31, 2007. Performance-based cash bonus and commission was $22.9 million, or 50.3% of compensation and benefits expense for the period from May 16, 2007 through December 31, 2007. Equity-based compensation was $7.5 million, or 16.4% of compensation and benefits expense for the period from May 16, 2007 through December 31, 2007 primarily due to $3.1 million of stock option expense related to acceleration at the time of the initial public offering and $4.0 million of restricted stock unit expense related to RSUs granted in connection with the initial public offering.
Compensation and benefits as a percentage of revenues was 70.1% of total net revenues after provision for loan losses for the period from May 16, 2007 through December 31, 2007. Excluding expense from equity-based awards as a result of the initial public offering, as a percentage of revenues, compensation and benefits was 64.0% of total net revenues after provision for loan losses for the period from May 16, 2007 through December 31, 2007.
Income Allocation and Accretion/ (Dilution)
Income allocation and accretion/(dilution) was zero for the period from May 16, 2007 through December 31, 2007 due to the reorganization on May 16, 2007, whereby our Redeemable Class A member interests were exchanged into shares of our common stock and therefore future periods no longer reflect this expense.
Administration
Administration expense was $3.4 million, or 5.5% of total non-interest expenses and 5.2% of total net revenues after provision for loan losses for the period from May 16, 2007 through December 31, 2007.
Brokerage, Clearing and Exchange Fees
Brokerage, clearing and exchange fees were $3.4 million, or 5.5% of total non-interest expenses and 5.2% of total net revenues after provision for loan losses for the period from May 16, 2007 through December 31, 2007.
70
Table of Contents
Other Expenses
Other expenses were $8.5 million, or 14.0% of total non-interest expenses and 13.1% of total net revenues after provision for loan losses for the period from May 16, 2007 through December 31, 2007. The majority of other expenses were travel and business development of $1.9 million, communications and technology of $2.5 million, occupancy of $1.2 million and professional fees of $2.0 million.
Net Income (Loss) Attributable to Noncontrolling Interests
Net income attributable to noncontrolling interests of $0.2 million relates to the consolidation of JMPRT and two of our hedge funds, HCP and HTP.
Provision for Income Taxes
Due to the reorganization in connection with our initial public offering, we became subject to federal and state income taxes on all taxable income earned subsequent to May 15, 2007. Additionally, in connection with the reorganization, we recognized a one-time tax benefit of $4.0 million in connection with the establishment of net deferred tax asset items of $10.2 million. In calculating the one-time tax benefit amount and associated deferred tax asset items, the Company made reasonable estimates of its share of the 2006 taxable income and 2007 taxable income attributed to the period from January 1 through May 15, 2007 of the partnerships in which it has a direct or indirect interest. Including the one-time tax benefit, during the period from May 16, 2007 through December 31, 2007 we recorded a total tax benefit of $2.5 million.
The effective tax rate for the period from May 16, 2007 through December 31, 2007, including the one-time tax benefit, was (63.4%).
Financial Condition, Liquidity and Capital Resources
In the section that follows, we discuss the significant changes in the components of our balance sheet, cash flows and capital and liquidity for the year ended December 31, 2009 to demonstrate where our capital is invested and the financial condition of the Company.
Acquisition of Cratos
On April 7, 2009, we invested $4.0 million of cash and granted $3.0 million original par amount, with a $2.3 million estimated fair value, of contingent consideration (a zero coupon note) to acquire 100% of the membership interests and net assets of $7.5 million of Cratos. As we purchased 100% of the subordinated securities of the Cratos CLO as part of the acquisition, in accordance with the authoritative guidance under GAAP on accounting for consolidation of variable interest entities, we are the primary beneficiary and are required to consolidate all of the assets and liabilities of the CLO securitization structure even though it is a bankruptcy remote entity with no recourse to us.
71
Table of Contents
The table below details the total assets and liabilities at fair value consolidated for GAAP upon the acquisition.
| Assets: |
|||
| Cash and cash equivalents |
$ | 1,910,523 | |
| Restricted cash and deposits |
44,359,080 | ||
| Loans collateralizing asset-backed securities issued |
280,499,632 | ||
| Interest receivable |
1,136,896 | ||
| Deferred tax asset |
50,121,928 | ||
| Other assets |
254,387 | ||
| Total assets |
$ | 378,282,446 | |
| Liabilities: |
|||
| Asset-backed securities issued |
$ | 316,513,000 | |
| Interest payable |
1,209,588 | ||
| Other liabilities |
2,349,830 | ||
| Deferred tax liability |
50,703,100 | ||
| Total liabilities |
$ | 370,775,518 | |
| Net assets acquired, at fair value |
$ | 7,506,928 |
The contingent consideration of $3.0 million with a fair value of $2.3 million at the acquisition was repurchased by JMP Credit on December 29, 2009 for $1.8 million at a discount to our carrying value resulting in a gain of $0.5 million.
The CLO securitization entity is non-recourse to us. Our maximum loss of capital as of December 31, 2009 is the original April 7, 2009 investment of $4.0 million plus the $1.8 million paid to repurchase the contingent consideration, plus any earnings related to JMP Credit since the acquisition date. However, for U.S. federal tax purposes, the CLO is treated as a disregarded entity such that the taxable income earned in the CLO is taxable to us. If the CLO is in violation of certain coverage tests, mainly any of its overcollateralization ratios, residual cash flows otherwise payable to us as owners of the subordinated notes would be required to be used to buy additional collateral or repay indebtedness senior to us in the securitization. This could require us to pay income tax on earnings prior to the residual cash flow distributions to us.
The CLO must comply with certain asset coverage tests, such as test that restrict the amount of discounted obligations and obligations rated “CCC” or lower it can hold. During any time the CLO exceeds such a limit, our ability, as CLO manager, to sell assets and reinvest available principal proceeds into substitute assets is restricted. In addition, defaulted obligations, discounted assets (those purchased below 85% of their par value) and assets rated “CCC” or lower in excess of applicable limits in the CLO’s investment criteria are not given full par credit for purposes of calculation of the CLO overcollateralization (“OC”) tests. For example, due to a number of these factors, in August and November 2009, the CLO was in violation of its Class E OC test. In order to remedy the deficiency, we were required to use $6.8 million of the CLO’s residual cash flows to pay down Class A note holders, rather than distribute the funds to us as owners of the CLO’s subordinated notes. If the CLO continues to violate the Class E test, or any more senior tests, we will continue paying down the most senior notes with the residual cash flows until the violation is cured. In the most extreme case, if the CLO were in violation of the most senior OC test, the Class A note holders would have the ability to declare an event of default and cause an acceleration all principal and interest outstanding on the notes.
For financial reporting purposes, the loans and asset-backed securities are consolidated on our balance sheet. The loans are reported at their cost adjusted for amortization of liquidity discount and credit reserves, both of which were recorded at the Cratos acquisition date, purchase discounts and allowance for loan losses. The asset-backed securities are recorded net of liquidity discount only. At December 31, 2009, we had $328.0 million of
72
Table of Contents
loans collateralizing asset-backed securities, net, $34.7 million of restricted cash and $1.0 million of interest receivable funded by $326.6 million of asset-backed securities issued, net, and interest payable of $0.5 million. These assets and liabilities represented 63.3% of total assets and 72.9% of total liabilities respectively, reported on our consolidated statement of financial condition at December 31, 2009.
The tables below summarize the loans held by the CLO grouped by range of outstanding balance, industry and Moody’s Investors Services, Inc. (“Moody’s”) rating category as of December 31, 2009.
| As of December 31, 2009 | |||||||
| Range of Outstanding Balance | Number of Loans | Maturity Date | Total Principal | ||||
| $0 - $500,000 |
7 | 03/2014 - 03/2017 | $ | 3,471,250 | |||
| $500,001 - $2,000,000 |
18 | 12/2011 - 12/2015 | 24,722,497 | ||||
| $2,000,001 - $5,000,000 |
55 | 5/2011 - 2/2016 | 198,895,190 | ||||
| $5,000,001 - $10,000,000 |
28 | 11/2010 - 10/2014 | 202,078,572 | ||||
| +$10,000,000 |
3 | 12/2009 - 10/2012 | 32,292,218 | ||||
| Total |
111 | $ | 461,459,727 | ||||
| As of December 31, 2009 | ||||||||
| Industry | Number of Loans | Outstanding Balance | % of Outstanding Balance |
|||||
| Healthcare, Education & Childcare |
14 | $ | 57,190,398 | 12.4 | % | |||
| Diversified/Conglomerate Service |
6 | 42,347,983 | 9.2 | % | ||||
| Personal, Food & Misc Services |
6 | 38,638,115 | 8.4 | % | ||||
| Electronics |
7 | 26,531,814 | 5.7 | % | ||||
| Printing & Publishing |
4 | 23,989,679 | 5.2 | % | ||||
| Telecommunications |
6 | 23,098,154 | 5.0 | % | ||||
| Insurance / Finance |
5 | 22,915,174 | 5.0 | % | ||||
| Utilities / Oil & Gas |
6 | 21,781,938 | 4.7 | % | ||||
| Personal & Non-Durable Consumer Products |
6 | 21,298,015 | 4.6 | % | ||||
| Retail Store |
6 | 21,211,025 | 4.6 | % | ||||
| Aerospace & Defense |
6 | 20,461,579 | 4.4 | % | ||||
| Cargo Transport / Personal Transportation |
3 | 19,498,949 | 4.2 | % | ||||
| Chemicals, Plastics and Rubber |
6 | 18,532,152 | 4.0 | % | ||||
| Hotels, Motels, Inns and Gaming |
4 | 18,182,511 | 3.9 | % | ||||
| Broadcasting & Entertainment |
3 | 16,496,033 | 3.6 | % | ||||
| Beverage, Food & Tobacco |
6 | 15,880,415 | 3.4 | % | ||||
| Leisure, Amusement, Motion Pictures & Entertainment |
4 | 11,146,283 | 2.4 | % | ||||
| Other |
13 | 42,259,510 | 9.3 | % | ||||
| Total |
111 | $ | 461,459,727 | 100.0 | % | |||
73
Table of Contents
| As of December 31, 2009 | ||||||||
| Moody’s Rating Category | Number of Loans | Outstanding Balance | % of Outstanding Balance |
|||||
| Baa3 |
2 | $ | 6,954,775 | 1.5 | % | |||
| Ba1 |
9 | 28,242,174 | 6.1 | % | ||||
| Ba2 |
9 | 26,418,002 | 5.7 | % | ||||
| Ba3 |
15 | 44,374,036 | 9.6 | % | ||||
| B1 |
17 | 51,355,389 | 11.1 | % | ||||
| B2 |
28 | 106,325,328 | 23.0 | % | ||||
| B3 |
21 | 137,531,088 | 29.8 | % | ||||
| Caa1 |
5 | 23,849,836 | 5.2 | % | ||||
| Caa2 |
3 | 26,310,858 | 5.7 | % | ||||
| Caa3 |
1 | 539,612 | 0.1 | % | ||||
| D |
1 | 9,558,629 | 2.2 | % | ||||
| Total |
111 | $ | 461,459,727 | 100.0 | % | |||
Other Factors Affecting Our Liquidity and Capital Resources
As of December 31, 2009, we had net liquid assets of $72.0 million, consisting of cash and cash equivalents, proceeds from short sales on deposit, receivable from clearing broker, marketable securities owned, and general partner investments in hedge funds managed by HCS, net of marketable securities sold but not yet purchased, accrued compensation, note payable and noncontrolling interest. We had an undrawn $18.9 million revolving line of credit with City National Bank (the “Lender”) at December 31, 2009. During the year ended December 31, 2009, we drew down $2.1 million on the revolving line of credit to fund the investment in HuaMei Capital Company, Inc. and $4.0 million to fund the purchase of Cratos. The $4.0 million drawn down to fund the purchase of Cratos was repaid during the year ended December 31, 2009.
Prior to our initial public offering, we satisfied our capital and liquidity requirements primarily through member contributions from our managing directors and internally generated cash from operations. Since our initial public offering, we have satisfied our capital and liquidity requirements primarily through the net proceeds from the initial public offering and internally generated cash from operations. On May 16, 2007, we completed our initial public offering of common stock, raising $73.1 million in net proceeds. The net proceeds of our initial public offering were used, in part, to make distributions in May 2007 to the Predecessor’s employee members, in the amount of $17.5 million. We are using the remaining net proceeds for general corporate purposes, including supporting and expanding our existing business lines. Most of our operating cash flow is generated from our investment banking and brokerage revenues and is invested in cash and cash equivalents, marketable securities or other investments, and partnerships for which HCS is the investment manager.
Most of our financial instruments, other than loans collateralizing asset-backed securities issued, loans held for investment and asset-backed securities issued, are recorded at fair value or amounts that approximate fair value. At December 31, 2009 and December 31, 2008, the Company had Level 3 assets (assets whose fair value was determined using unobservable inputs that are not corroborated by market data) of $23.9 million and $18.2 million which represented 4.2% and 11.9% of total assets, respectively. The decrease in the percentage of Level 3 assets to the total assets was primarily due to an increase in total assets from $152.8 million at December 31, 2008 to $574.7 million at December 31, 2009 mainly due to the acquisition of Cratos in April 2009. In the third quarter of 2009, we reclassified our limited partner investment in a mortgage fund of $2.0 million from Level 2 to Level 3, as the fund invested further cash in residential mortgage loans during the year.
74
Table of Contents
A condensed table of cash flows for the years ended December 31, 2009, 2008 and 2007 is presented below. We have aggregated the Predecessor period from January 1, 2007 through May 15, 2007 and the Successor period from May 16, 2007 through December 31, 2007, without further adjustment, for purposes of comparison with the same periods in 2009 and 2008.
| Year Ended December 31, |
Change from 2008 to 2009 |
||||||||||||||
| 2009 | 2008 | ||||||||||||||
| (in thousands) | Successor | Successor | $ | % | |||||||||||
| Cash flows provided by (used in) operations |
$ | 39,893 | $ | (22,632 | ) | $ | 62,525 | 276.3 | % | ||||||
| Cash flows provided by (used in) investing activities |
3,856 | (29,153 | ) | 33,009 | 113.2 | % | |||||||||
| Cash flows (used in) financing activities |
(14,330 | ) | (1,080 | ) | (13,250 | ) | -1227.1 | % | |||||||
| Total cash flows |
$ | 29,419 | $ | (52,865 | ) | $ | 82,284 | 155.6 | % | ||||||
| Year Ended December 31, 2007 | Change from 2007 to 2008 |
||||||||||||||||||||||
| Year Ended December 31, 2008 |
January 1, 2007 through May 15, 2007 |
May 16, 2007 through December 31, 2007 |
Pro Forma Combined Predecessor/ Successor |
||||||||||||||||||||
| (in thousands) | Successor | Predecessor | Successor | $ | % | ||||||||||||||||||
| Cash flows provided by (used in) operations |
$ | (22,632 | ) | $ | (29,821 | ) | $ | 28,320 | $ | (1,501 | ) | $ | (21,131 | ) | -1407.8 | % | |||||||
| Cash flows (used in) investing activities |
(29,153 | ) | (509 | ) | (14,780 | ) | (15,289 | ) | (13,864 | ) | -90.7 | % | |||||||||||
| Cash flows provided by (used in) financing activities |
(1,080 | ) | 8,020 | 55,506 | 63,526 | (64,606 | ) | N/A | |||||||||||||||
| Total cash flows |
$ | (52,865 | ) | $ | (22,310 | ) | $ | 69,046 | $ | 46,736 | $ | (99,601 | ) | N/A | |||||||||
JMP Securities, our wholly-owned subsidiary and a registered securities broker-dealer, is subject to the net capital requirements of the SEC’s Uniform Net Capital Rule. We use the basic method permitted by the Uniform Net Capital Rule to compute net capital, which generally requires that the ratio of aggregate indebtedness to net capital shall not exceed 15 to 1. SEC regulations also provide that equity capital may not be withdrawn or cash dividends paid if certain minimum net capital requirements are not met. JMP Securities had net capital of $45.3 million and $39.8 million, which were $43.7 million and $38.7 million in excess of the required net capital of $1.6 million and $1.1 million at December 31, 2009 and December 31, 2008, respectively. JMP Securities’ ratio of aggregate indebtedness to net capital was 0.26 to 1 and 0.24 to 1 at December 31, 2009 and December 31, 2008, respectively.
The timing of bonus compensation payments to our employees may significantly affect our cash position and liquidity from period to period. While our employees and managing directors are generally paid semi-monthly during the year, bonus compensation, which makes up a larger portion of total compensation, is generally paid once a year during the first two months of the following year. In February 2009, we paid out $18.9 million of cash bonuses for 2008, excluding employer payroll tax expense.
The Company currently intends to declare quarterly cash dividends on all outstanding shares of common stock. The Company currently does not plan to pay dividends on unvested shares of restricted stock. In March, May, August and November 2009, the Company’s board of directors declared a quarterly cash dividend of $0.01 per share of common stock which the Company paid in April, June, September and December 2009, for the fourth quarter of 2008 and the first three quarters of 2009, respectively.
The Company’s board of directors authorized in August and November 2007 a 1.5 million share repurchase program, which was fully executed as of January 18, 2008. On March 10, 2008 and March 3, 2009, the Company’s
75
Table of Contents
board of directors authorized the repurchase of an additional 2.0 million shares during the subsequent eighteen months and the repurchase of an additional 0.5 million shares during the subsequent twelve months, respectively.
During the year ended December 31, 2009, the Company repurchased 716,528 shares of the Company’s common stock at an average price of $7.54 per share for an aggregate purchase price of $5,404,016. The repurchases made during the year ended December 31, 2009 included 689,428 shares deemed to have been repurchased in connection with employee stock plans, whereby the Company’s shares were issued on a net basis to employees for the payment of applicable statutory withholding taxes and therefore such withheld shares are deemed to be purchased by the Company.
Because of the nature of our investment banking and sales and trading businesses, liquidity is important to us. Accordingly, we regularly monitor our liquidity position, including our cash and net capital positions. We believe that our available liquidity, including undrawn $18.9 million line of credit, and current level of equity capital, combined with the net proceeds to us from the initial public offering and funds anticipated to be provided by our operating activities, will be adequate to meet our liquidity and regulatory capital requirements for at least the next twelve months.
Cash Flows for the Year Ended December 31, 2009
Cash increased by $29.4 million during the year ended December 31, 2009, primarily as a result of cash provided by operating activities.
Our operating activities provided $39.9 million of cash from the net income of $12.7 million adjusted for the cash provided by the change in operating assets and liabilities of $47.0 million, reduced by non-cash revenue and expense items of $19.8 million. The non-cash revenue and expense items included gain on sale and payoff of loans of $22.3 million, gain on repurchase of asset-backed securities issued of $4.7 million, gain on bargain purchase of $1.2 million and provision for loan losses of $4.5 million.
Our investing activities provided $3.9 million of cash, which primarily due to cash provided by sales and payoff of loans collateralizing ABS of $93.3 million, repayments on loans collateralizing ABS of $53.4 million, net change in restricted cash reserved for lending activities of $9.0 million, and sales of other investments of $13.4 million, offset by cash used in funding of loans collateralizing ABS of $156.1 million, purchases of other investments of $7.5 million and purchase of Cratos of $2.1 million (net of cash owned by Cratos at acquisition).
Our financing activities used $14.3 million of cash primarily due to cash provided by two draw downs on our revolving note with City National Bank (CNB) totaling $6.1 million and sales of asset-backed securities issued of $1.0 million, offset by repayment of asset- backed securities issued of $6.8 million, repurchase of our common stock for treasury of $5.4 million, repayments on and repurchase of a note payable (contingent consideration payable) of $1.8 million, scheduled repayments on a term loan of $1.7 million, repayment of one of the draw downs on our revolving note of $4.0 million and dividends paid to noncontrolling interests of $1.3 million.
We had total restricted cash of $36.6 million comprised primarily of $34.7 million of restricted cash at JMP Credit on December 31, 2009. This balance was comprised of $3.7 million in interest received from loans in the CLO and $31.0 million in principal cash. The interest and fees will be restricted until the next payment date to note holders of the CLO. The principal restricted cash will be used to buy additional loans or pay down CLO notes.
Cash Flows for the Year Ended December 31, 2008
Cash decreased by $52.9 million during the year ended December 31, 2008, primarily as a result of cash used in operating and investing activities.
Our operating activities used $22.6 million of cash from the net loss of $11.1 million, adjusted for the cash used in the change in operating assets and liabilities of $17.2 million and non-cash revenue and expense items of $5.7 million. The decrease in operating assets and liabilities was primarily due to the payout of $26.9 million in 2007 bonuses in February 2008.
76
Table of Contents
Our investing activities used $29.1 million, which consisted mostly of $19.7 million of net purchases of other investments, the funding of $8.0 million in loans receivable and $7.0 million in cash attributable to the deconsolidation of an investment. During the year of 2008, we invested $15.0 million in Series A Cumulative Redeemable Convertible Preferred stock of NYMT, as well as $4.5 million in NYMT common stock as part of the PIPE transaction executed by NYMT on February 18, 2008.
Our financing activities used $1.1 million of cash primarily from $6.9 million used for repurchase of our common stock for treasury and $4.0 million of cash dividends paid to our shareholders, offset by $8.7 million provided by issuance of long-term note payable and $1.4 million of capital contributions from noncontrolling interest members.
Cash Flows for the Year Ended December 31, 2007
Cash increased by $46.7 million during the year ended December 31, 2007, primarily as a result of cash provided by financing activities.
Our operating activities used $1.5 million of cash from the combined net loss of $104.7 million, adjusted for the cash provided by the change in operating assets and liabilities of $96.2 million and by non-cash revenue and expense items of $7.0 million. The increase in operating assets and liabilities was primarily due to the increase of Redeemable Class A member interests in connection with our initial public offering, as well as the payout of 2006 year-end bonuses in the first half of 2007.
Our investing activities used $15.3 million, which consisted mostly of $13.0 million of net purchases of other investments, including $9.5 million invested in quasi-government agency securities.
Our financing activities provided $63.5 million of cash primarily due to the net proceeds from our initial public offering.
Cash Flows for the period from January 1, 2007 to May 15, 2007
Cash decreased by $22.3 million during the period ended May 15, 2007, primarily as a result of cash used by operating activities.
Our operating activities used $29.8 million of cash from the net loss of $111.5 million, adjusted for the cash provided by the change in operating assets and liabilities of $81.3 million and by non-cash revenue and expense items of $0.4 million. The increase in operating assets and liabilities was primarily due to the increase in value of Redeemable Class A member interests of $98.7 million in connection with our initial public offering, partially offset by the payout of 2006 year-end bonuses of $15.2 million in February 2007.
Our investing activities used $0.5 million and our financing activities provided $8.0 million of cash primarily due to the proceeds of $14.5 million from the issuance of notes payable partially offset by $6.7 million of distributions to Class A and Class B common interest holders.
Cash Flows for the period from May 16, 2007 to December 31, 2007
Cash increased by $69.0 million during the period ended December 31, 2007, primarily as a result of cash provided by financing activities.
Our operating activities provided $28.3 million of cash from the net income of $6.8 million, adjusted for the cash provided by the change in operating assets and liabilities of $15.0 million and by non-cash revenue and expense items of $6.5 million. The cash flows from the change in operating assets and liabilities was primarily due to an increase in marketable securities of $8.3 million, an increase in restricted cash, deposits and other assets of $8.3 million offset by an increase in accrued compensation of $18.9 million, an increase in securities sold under repurchase agreements of $9.1 million and an increase in short securities positions of $1.9 million.
77
Table of Contents
Our investing activities used $14.8 million, primarily for the purchase of $12.3 million of other investments and our financing activities provided $55.5 million of cash, primarily due to the proceeds of $73.1 million from our initial public offering, partially offset by a repayment of note payable of $14.5 million.
Contractual Obligations and Commitments
The following table provides a summary of our contractual obligations and commitments as of December 31, 2009:
| Payments Due by Period: | |||||||||||||||
| (in thousands) | Total | Less than 1 year |
1-3 years | 3-5 years | More than 5 years | ||||||||||
| Note payable |
$ | 6,945 | $ | 1,736 | $ | 3,473 | $ | 1,736 | $ | — | |||||
| CLO Notes due 2021 |
434,478 | — | — | — | 434,478 | ||||||||||
| Contractual interest payments (1) |
49,721 | 4,493 | 8,830 | 8,673 | 27,725 | ||||||||||
| Operating lease obligations |
4,990 | 2,606 | 2,269 | 110 | 5 | ||||||||||
| Lawsuit settlement payable (2) |
658 | 531 | 127 | — | — | ||||||||||
| Commitments to lend (3) |
14,174 | 14,174 | — | — | — | ||||||||||
| Commitments under standby letters of credit (4) |
1,756 | 1,756 | — | — | — | ||||||||||
| Total payments |
$ | 512,722 | $ | 25,296 | $ | 14,699 | $ | 10,519 | $ | 462,208 | |||||
| (1) | Estimated future interest payments related to note payable and CLO Notes based on applicable interest rates as of December 31, 2009. |
| (2) | The amounts represent scheduled principal payments on a $1.5 million note issued at JMP Credit in connection with a lawsuit that was settled in 2007. |
| (3) | Unsettled trades to purchase loans at JMP Credit. The funds appropriated to such unsettled trades are included in restricted cash on the consolidated statement of financial condition at December 31, 2009. |
| (4) | Conditional commitments issued by JMP Credit to guarantee the performance by a borrower to a third party. The cash collateral supporting these standby letters of credit is included in restricted cash on the consolidated statement of financial condition at December 31, 2009. |
Off-Balance Sheet Arrangements
In connection with the Cratos CLO, the Company had unfunded commitments to lend of $3.4 million and standby letters of credit of $1.8 million as of December 31, 2009.
Unfunded commitments are agreements to lend to a borrower, provided that all conditions have been met. Commitments generally have fixed expiration dates or other termination clauses and may require payment of a fee. Since certain commitments may expire without being drawn upon, the total commitment amounts do not necessarily represent future cash requirements. The Company evaluates each borrower’s creditworthiness on a case by case basis.
Standby letters of credit are conditional commitments issued by the Company to guarantee the performance by a borrower to a third party. The Company’s exposure to credit loss in the event of nonperformance by the other party to the financial instrument for standby letters of credit is represented by the contractual amount of those instruments. The Company uses the same credit policies in making commitments and conditional obligations as it does for on balance sheet instruments. The credit risk involved in issuing letters of credit is essentially the same as that involved in extending loans to borrowers.
We had no other material off-balance sheet arrangements as of December 31, 2009. However, as described below under “Qualitative and Quantitative Disclosures About Market Risk—Credit Risk,” through indemnification provisions in our clearing agreements with our clearing broker, customer activities may expose us to off-balance sheet credit risk, which we seek to mitigate through customer screening and collateral requirements.
78
Table of Contents
Critical Accounting Policies and Estimates
The preparation of our consolidated financial statements requires us to make estimates and assumptions that affect the reported amounts of assets and liabilities and of revenues and expenses during the reporting periods. We base our estimates and assumptions on historical experience and on various other factors that we believe are reasonable under the circumstances. The use of different estimates and assumptions could produce materially different results. For example, if factors such as those described in “Risk Factors” cause actual events to differ from the assumptions we used in applying the accounting policies, our results of operations, financial condition and liquidity could be adversely affected.
Our significant accounting policies are summarized in Note 2 to our consolidated financial statements included elsewhere in this report. On an ongoing basis, we evaluate our estimates and assumptions, particularly as they relate to accounting policies that we believe are most important to the presentation of our financial condition and results of operations. We regard an accounting estimate or assumption to be most important to the presentation of our financial condition and results of operations where:
| • | the nature of the estimate or assumption is material due to the level of subjectivity and judgment necessary to account for highly uncertain matters or the susceptibility of such matters to change; and |
| • | the impact of the estimate or assumption on our financial condition or operating performance is material. |
Using the foregoing criteria, we consider the following to be our critical accounting policies:
Valuation of Financial Instruments
The Company adopted the amended accounting principles related to fair value measurements as of January 1, 2008 which establishes a consistent framework for measuring fair value in accordance with generally accepted accounting principles and expands disclosures with respect to fair value measurements. The amended accounting principles related to fair value measurement apply to all financial instruments that are being measured and reported on a fair value basis. This includes those items currently reported in marketable securities owned, at fair value, other investments and marketable securities sold, not yet purchased, at fair value on the consolidated statements of financial condition. Fair value is defined as the price that would be received to sell an asset or paid to transfer a liability in an orderly transaction between market participants at the measurement date.
Most of our financial instruments, other than loans collateralizing asset-backed securities issued, loans held for investment and asset-backed securities issued, are recorded at fair value or amounts that approximate fair value. Marketable securities owned, Other investments, including warrant positions and investments in partnerships in which HCS is the general partner, and Marketable securities sold, but not yet purchased, are stated at fair value, with related changes in unrealized appreciation or depreciation reflected in the line item Principal transactions in the accompanying Consolidated Statements of Operations.
Fair value our financial instruments is generally obtained from quoted market prices, broker or dealer price quotations, or alternative pricing methodologies that we believe offer reasonable levels of price transparency. To the extent that certain financial instruments trade infrequently or are non-marketable securities and, therefore, do not have readily determinable fair values, we estimate the fair value of these instruments using various pricing models and the information available to us that we deem most relevant. Among the factors considered by us in determining the fair value of financial instruments are discounted anticipated cash flows, the cost, terms and liquidity of the instrument, the financial condition, operating results and credit ratings of the issuer or underlying company, the quoted market price of publicly traded securities with similar duration and yield, the Black-Scholes Options Valuation methodology adjusted for active market and other considerations on a case-by-case basis and other factors generally pertinent to the valuation of financial instruments.
79
Table of Contents
Marketable securities owned and securities sold, but not yet purchased, consist of U.S. listed and OTC equity securities, as well as quasi-government agency securities. Other investments consist principally of investments in private investment funds managed by us or our affiliates, as well as cash paid for a subscription in a private investment fund. Such investments held by non-broker-dealer entities are accounted for under the equity method based on our share of the earnings (or losses) of the investee. The financial position and operating results of the private investment funds are generally determined on an estimated fair value basis as set forth in the AICPA Audit and Accounting Guide: Investment Companies. Generally, securities are valued (i) at their last published sale price if they are listed on an established exchange or (ii) if last sales prices are not published, at the highest closing “bid” price (for securities held “long”) and the lowest closing “asked” price (for “short” positions) as recorded by the composite tape system or such principal exchange, as the case may be. Where the general partner determines that market prices or quotations do not fairly represent the value of a security in the investment fund’s portfolio (for example, if a security is a restricted security of a class that is publicly traded) the general partner may assign a different value. The general partner will determine the estimated fair value of any assets that are not publicly traded.
Also included in other investments are NYMT convertible preferred stock and warrants on public and private common stock. The valuation of the investment in NYMT convertible preferred stock is based on a fair value estimate using the Black-Scholes credit adjusted valuation model on Bloomberg. The warrants on public and private common stock are generally received as a result of investment banking transactions and are valued at estimated fair value as determined by management. Warrants owned are valued at the date of issuance and marked-to-market as unrealized gains and losses until realized. Estimated fair value is determined using the Black-Scholes Options Valuation methodology adjusted for active market and other considerations on a case-by-case basis.
The Company follows the authoritative guidance included in GAAP on the fair value option which provides companies with an option to report selected financial assets and financial liabilities at fair value. It requires entities to display the fair value of those assets and liabilities for which the company has chosen to use fair value on the face of the balance sheet. The election to use the fair value option is available at specified election dates, such as when an entity first recognizes a financial asset or financial liability or upon entering into a firm commitment. Subsequent changes in fair value must be recorded in the Consolidated Statements of Operations. Additionally, the guidance allows for a one-time election for existing positions upon adoption, with the transition adjustment recorded to beginning retained earnings.
We elected to apply the fair value option to our investments in NYMT convertible preferred and common stock. The primary reason for electing the fair value option was to measure these investments on the same basis as our other equity securities, all of which are stated at fair value.
During the year ended December 31, 2009, the Company recorded unrealized gain of $5.6 million on the above investments in NYMT primarily in response to the improved performance of NYMT’s stock during the period.
In certain cases, we may continue to apply the equity method of accounting to those investments which are strategic in nature or are closely related to our principal business activities, where we have a significant degree of involvement in the cash flows or operations of the investee.
80
Table of Contents
The following tables summarize our marketable securities and other investments, as presented in our Consolidated Statements of Financial Condition, by valuation methodology as of December 31, 2009:
| Marketable Securities Sold, But Not Yet Purchased, at Market Value (2) |
Other Investments (3) | |||||||||||||||||||||||||||||||||||||||
| (in thousands) | Marketable Securities Owned, at Market Value (1) |
General Partner in Hedge Funds |
General Partner in Fund of Funds |
Limited Partner in Private Equity Fund |
Limited Partner Investment in Mortgage Fund |
Investment in NYMT Convertible Preferred Stock |
Equity Securities |
Total Other Investments |
Total Marketable Securities and Other Investments |
|||||||||||||||||||||||||||||||
| Fair values based on: |
||||||||||||||||||||||||||||||||||||||||
| Quoted market prices |
$ | 5,899 | $ | 1,047 | $ | — | $ | — | $ | — | $ | — | $ | — | $ | — | $ | — | $ | 6,946 | ||||||||||||||||||||
| Black Scholes credit adjusted valuation |
— | — | — | — | — | — | 15,000 | — | 15,000 | 15,000 | ||||||||||||||||||||||||||||||
| Observable market based inputs |
— | — | 33,313 | — | — | — | — | — | 33,313 | 33,313 | ||||||||||||||||||||||||||||||
| Valuation determined by third party general partners |
— | — | — | 2,933 | 2,476 | 1,147 | — | — | 6,556 | 6,556 | ||||||||||||||||||||||||||||||
| Comparable public company metrics discounted for private company market illiquidity |
— | — | — | — | — | — | — | 2,321 | 2,321 | 2,321 | ||||||||||||||||||||||||||||||
| Totals |
5,899 | 1,047 | 33,313 | 2,933 | 2,476 | 1,147 | 15,000 | 2,321 | 57,190 | 64,136 | ||||||||||||||||||||||||||||||
| Fair values based on: |
||||||||||||||||||||||||||||||||||||||||
| Quoted market prices |
100.0 | % | 100.0 | % | 0.0 | % | 0.0 | % | 0.0 | % | 0.0 | % | 0.0 | % | 0.0 | % | 0.0 | % | 10.8 | % | ||||||||||||||||||||
| Black Scholes credit adjusted valuation |
0.0 | % | 0.0 | % | 0.0 | % | 0.0 | % | 0.0 | % | 0.0 | % | 26.2 | % | 0.0 | % | 26.2 | % | 23.4 | % | ||||||||||||||||||||
| Observable market based inputs |
0.0 | % | 0.0 | % | 58.3 | % | 0.0 | % | 0.0 | % | 0.0 | % | 0.0 | % | 0.0 | % | 58.3 | % | 52.0 | % | ||||||||||||||||||||
| Valuation determined by third party general partners |
0.0 | % | 0.0 | % | 0.0 | % | 5.1 | % | 4.3 | % | 2.0 | % | 0.0 | % | 0.0 | % | 11.4 | % | 10.2 | % | ||||||||||||||||||||
| Comparable public company metrics discounted for private company market illiquidity |
0.0 | % | 0.0 | % | 0.0 | % | 0.0 | % | 0.0 | % | 0.0 | % | 0.0 | % | 4.1 | % | 4.1 | % | 3.6 | % | ||||||||||||||||||||
| Totals |
100.0 | % | 100.0 | % | 58.3 | % | 5.1 | % | 4.3 | % | 2.0 | % | 26.2 | % | 4.1 | % | 100.0 | % | 100.0 | % | ||||||||||||||||||||
| (1) | Marketable securities owned consist mainly of U.S. listed and OTC equity securities, as well as quasi-government agency securities. |
| (2) | Marketable securities sold, but not yet purchased consist mainly of U.S. listed and OTC equity securities. |
| (3) | Other investments consist of general partnership interests in hedge funds and funds of hedge funds managed by HCS, limited partnership interests in private investment funds managed by third parties that invest in predominately private securities, investment in NYMT convertible preferred stock and warrants in public and private common stock. |
Asset Management Investment Partnerships
Investments in partnerships include our general partnership interests in investment partnerships. Such investments are held by our asset management subsidiary and are accounted for under the equity method based on our proportionate share of the earnings (or losses) of the investment partnership. In accordance with the AICPA Audit and Accounting Guide for investment companies, these interests are carried at estimated fair value based on our capital accounts in the underlying partnerships. The net assets of the investment partnerships consist primarily of investments in marketable and non-marketable securities. The underlying investments held by such partnerships are valued based on quoted market prices or estimated fair value if there is no public market. Such estimates of fair value of the partnerships’ non-marketable investments are ultimately determined by our affiliate in its capacity as general partner. Due to the inherent uncertainty of valuation, fair values of these non-marketable investments may differ from the values that would have been used had a ready market existed for these investments, and the differences could be material. Adjustments to carrying value are
81
Table of Contents
made, if required by GAAP, if there are third-party transactions evidencing a change in value. Downward adjustments are also made, in the absence of third-party transactions, if the general partner determines that the expected realizable value of the investment is less than the carrying value.
We earn base management fees from the investment partnerships that we manage generally based on the net assets of the underlying partnerships. In addition, we are entitled to allocations of the appreciation and depreciation in the fair value of the underlying partnerships from our general partnership interests in the partnerships. Such allocations are based on the terms of the respective partnership agreements.
We are also entitled to receive incentive fee allocations from the investment partnerships when the return exceeds a specified highwater mark or hurdle rate over a defined performance period. Incentive fees are recorded after the quarterly or annual investment performance period is complete and may vary depending on the terms of the fee structure applicable to an investor.
Loans Collateralizing Asset-backed Securities Issued
Loans collateralizing asset-backed securities issued are commercial loans securitized and owned at the Cratos CLO. The loans consist of those loans within the CLO securitization structure at the acquisition date of Cratos and loans purchased or originated into the CLO subsequent to the Cratos acquisition date.
Loans acquired during the purchase and resulting consolidation of Cratos were recorded at their fair value as of the acquisition date, which then became the new basis of the loans. Any unamortized deferred fees or costs that existed prior to the acquisition were written off at that date.
For those loans deemed impaired as of the date of the acquisition, the total discount from unpaid principal balance to fair value consists of a nonaccretable credit discount and an accretable liquidity (or market value) discount. For the remaining loans acquired through the purchase of Cratos the discount to fair value was all accretable liquidity discount as the discount was not attributable to credit quality. For both types of loans the accretable portion of the discount is recognized into interest income as an adjustment to the yield of the loan over the contractual life of the loan using the interest method.
The Company continues to estimate the cash flows expected to be collected over the life of the loans acquired through the purchase of Cratos. If, upon subsequent evaluation, the Company believes it is unable to collect all cash flows expected at the acquisition date plus additional cash flows expected to be collected arising from changes in estimate after the acquisition, the loan is considered impaired for purposes of applying the authoritative guidance under GAAP on loss contingencies or, if applicable, the authoritative guidance under GAAP on loan impairment . Loans considered impaired at the acquisition date of Cratos can only continue to be assessed in accordance with the authoritative guidance under GAAP on loan impairment. If based on current information and events, it is probable that there is a significant increase in cash flows previously expected to be collected or if actual cash flows are significantly greater than cash flows previously expected, the Company will first reduce any remaining valuation allowance (or allowance for loan losses) for the loan established after its acquisition for the increase in the present value of cash flows expected to be collected. Then the Company will recalculate the amount of accretable yield for the loan as the excess of the revised cash flows expected to be collected over the sum of (a) the initial investment less (b) cash collected less (c) write-downs plus (d) amount of yield accreted to date. The Company will adjust the amount of accretable yield by reclassification from nonaccretable discount. The adjustment is accounted for as a change in estimate, with the amount of periodic accretion adjusted over the remaining life of the loan. The resulting yield is then used as the effective interest rate in any subsequent accounting.
Loans purchased or originated into the CLO after the acquisition date of Cratos, are stated at the principal amount outstanding net of deferred fees, deferred costs and the allowance for loan losses. Net nonrefundable loan fees and related direct costs associated with the origination or purchase of loans are deferred and included in loans. The net deferred fees or costs are recognized as an adjustment to interest income over the contractual life of the loans using a method which approximates the interest method. Remaining amounts are recognized into
82
Table of Contents
income when the related loans are paid off or sold. Any discount from purchased loans is accreted into interest income as a yield adjustment over the contractual life of the loan.
The accrual of interest on loans is discontinued when principal or interest payments are 90 days or more past due or when, in the opinion of management, reasonable doubt exists as to the full collection of principal and/or interest. When loans are placed on nonaccrual status, all interest previously accrued but not collected is reversed against current period interest income. Any reversals of income from previous years are recorded against the allowance for loan losses. When the Company receives a cash interest payment on a non-accrual loan, it is applied as a reduction of the principal balance. Non-accrual loans are returned to accrual status when the borrower becomes current as to principal and interest and have demonstrated a sustained period of payment performance. The amortization of loan fees is discontinued on nonaccrual loans and may be considered for write-off. Depending on the terms of the loan, a fee may be charged upon a prepayment which is recognized in the period of the prepayment. Syndication and structuring fees are recognized in the period the service is completed as non-interest income.
Allowance for Loan Losses
The Company maintains an allowance for loan losses that is intended to estimate loan losses inherent in its loan portfolio. A provision for loan losses is charged to expense to establish the allowance for loan losses. The allowance for loan losses is maintained at a level, in the opinion of management, sufficient to off set estimated losses inherent in the loan portfolio as of the date of the financial statements. The appropriateness of the allowance and the allowance components are reviewed quarterly. The Company’s estimate of each allowance component is based on observable information and on market and third party data that the Company believes are reflective of the underlying loan losses being estimated.
In accordance with the authoritative guidance under GAAP on loss contingencies, the Company provides a base allowance on a loan by loan basis for loans at JMP Credit that are not impaired and were purchased after the Cratos acquisition The Company employs internally developed and third party estimation tools for measuring credit risk (loan ratings, probability of default, and exposure at default), which are used in developing an appropriate allowance for loan losses. The Company performs periodic detailed reviews of its loan portfolio to identify risks and to assess the overall collectability of loans.
In accordance with the authoritative guidance under GAAP on loan impairment, any required impairment allowances are included in the allowance for loan losses. A loan is considered impaired when it is probable that the Company will be unable to collect all amounts due according to the contractual terms of the loan agreement. The Company measures impairment of a loan based upon either the present value of expected future cash flows discounted at the loan’s effective interest rate, the loan’s observable market price or the fair value of the collateral securing the loan if the loan is collateral dependent, depending on the circumstances and the Company’s collection strategy. For those loans held by Cratos at the date of acquisition by JMP Credit, and deemed impaired at that date or a subsequent date, loan loss provisions are calculated considering two further factors. For loans deemed impaired at the date of acquisition if there is a further decline in expected future cash flows, this reduction is recognized as specific loan loss provision in the current quarter in accordance with above. For those loans deemed impaired subsequent to the acquisition date, if the net realizable value is lower than the current carrying value then that reduction from the carrying value is booked as provision for loan losses. Therefore at the date of assessment, if the total discount from unpaid principal balance to carrying value is larger than the expected loss, no provision for loan losses is recognized for those loans acquired at Cratos but deemed impaired subsequent to their acquisition.
Loans which are deemed to be uncollectible are charged off and deducted from the allowance. The provision for loan losses and recoveries on loans previously charged off are added to the allowance.
Asset-backed Securities Issued
Asset-backed securities issued (ABS) were issued to third parties from the Cratos CLO securitization structure which the Company consolidates for financial reporting purposes as of the April 7, 2009 acquisition date. At the
83
Table of Contents
acquisition date, the ABS were recorded at fair value derived by management from third party pricing marks. A liquidity discount was recognized to record the ABS at the reduced fair value from the principal balance outstanding. The liquidity discount is amortized into interest expense over the maturity of the ABS using the interest method.
Income Taxes
The Company accounts for income taxes in accordance with the authoritative guidance under GAAP on income taxes which requires the recognition of deferred tax assets and liabilities based upon the temporary differences between the financial reporting and tax bases of assets and liabilities. Valuation allowances are established when necessary to reduce the deferred tax assets when it is more likely than not that a portion or all of the deferred tax assets will not be realized. The Predecessor, JMP Group LLC, was a limited liability company and was treated as a partnership for federal and state income tax purposes. Therefore, the Predecessor was not subject to federal and state income taxes, and accordingly, did not provide for the federal and state income taxes in the financial statements, but it was liable for state and local unincorporated business tax or franchise tax.
The Company adopted the accounting principles related to uncertainty in income taxes on May 16, 2007, the date the Company became subject to federal and state income taxes. Its adoption did not have a material impact on the Company’s financial condition or results of operations. Under the guidance, the Company recognizes a tax benefit from an uncertain position only if it is more likely than not that the position is sustainable, based solely on its technical merits and consideration of the relevant taxing authority’s widely understood administrative practices and precedents. If this threshold is met, the Company measures the tax benefit as the largest amount of benefit that is greater than fifty percent likely of being realized upon ultimate settlement.
Recent Accounting Pronouncements
For a description of recent accounting pronouncements affecting the Company, refer to Note 3 in the accompanying consolidated financial statements.
| Item 7A. | Quantitative and Qualitative Disclosures About Market Risk |
Market Risk
Market risk represents the risk of loss that may result from the change in value of a financial instrument due to fluctuations in its market price. Market risk may be exacerbated in times of trading illiquidity when market participants refrain from transacting in normal quantities and/or at normal bid-offer spreads. Our exposure to market risk is directly related to our role as a financial intermediary in customer trading and to our market-making and investment activities. Market risk is inherent in financial instruments.
Even though we trade in equity securities as an active participant in both listed and OTC markets and we make markets in over two hundred stocks, we typically maintain very few securities in inventory overnight to minimize market risk. In addition, we act as agent rather than principal whenever we can and may use a variety of risk management techniques and hedging strategies in the ordinary course of our trading business to manage our exposures. Historically, in connection with our principal investments in publicly-traded equity securities, we have engaged in short sales of equity securities to offset the risk of purchasing other equity securities. In the future, we may utilize other hedging strategies such as equity derivative trades, although we have not engaged in derivative transactions in the past.
In connection with our sales and trading business, management evaluates the amount of risk in specific trading activities and determines our tolerance for such activities. Management monitors risks in its trading activities by establishing limits for the trading desk and reviewing daily trading results, inventory aging, and securities concentrations. Typically, market conditions are evaluated and transaction details and securities positions are reviewed. These activities seek to ensure that trading strategies are within acceptable risk tolerance parameters. Activities include price verification procedures, position reconciliations and reviews of transaction bookings. We believe these procedures, which stress timely communications between traders, trading management and senior management, are important elements of the risk management process.
84
Table of Contents
Equity Price Risk
Equity price risk represents the potential loss in value due to adverse changes in the level or volatility of equity prices. We are exposed to equity price risk through our trading activities in both listed and OTC equity markets and security positions in our principal investment portfolio. We attempt to reduce the risk of loss inherent in our inventory of equity securities by establishing position limits, monitoring inventory turnover and entering into hedging transactions designed to mitigate our market risk profile.
Our marketable securities owned include long positions in equity securities that were recorded at a fair value of $5.9 million as of December 31, 2009. Our marketable securities sold but not yet purchased consist of short positions in equity securities and were recorded at a fair value of $1.0 million as of December 31, 2009. The net potential loss in fair value for our marketable equity securities portfolio as of December 31, 2009, using a hypothetical 10% decline in prices, is estimated to be approximately $0.5 million. In addition, as of December 31, 2009, we have invested $43.3 million of our own capital in our funds, which are invested primarily in publicly traded equity securities. The net potential loss in fair value for our investments at December 31, 2009, using a hypothetical 10% decline in the funds’ investment portfolios, is estimated to be approximately $4.3 million.
Interest Rate Risk
Interest rate risk represents the potential loss from adverse changes in market interest rates. As we may hold U.S. Treasury securities and other fixed income securities and may incur interest-sensitive liabilities from time to time, we are exposed to interest rate risk arising from changes in the level and volatility of interest rates and in the shape of the yield curve.
Credit Risk
Our broker-dealer subsidiary places and executes customer orders. The orders are then settled by an unrelated clearing organization that maintains custody of customers’ securities and provides financing to customers.
Through indemnification provisions in our agreement with our clearing organization, customer activities may expose us to off-balance-sheet credit risk. We may be required to purchase or sell financial instruments at prevailing market prices in the event a customer fails to settle a trade on its original terms or in the event cash and securities in customer margin accounts are not sufficient to fully cover customer obligations. We seek to control the risks associated with brokerage services for our customers through customer screening and selection procedures as well as through requirements that customers maintain margin collateral in compliance with governmental and self-regulatory organization regulations and clearing organization policies.
Credit risk also includes the risk that we will not fully collect the principal we have invested in loans receivable due to borrower defaults. While we feel that our origination and underwriting of these loans will help to mitigate the risk of significant borrower defaults on these loans, we cannot assure you that all borrowers will continue to satisfy their payment obligations under these loans, thereby avoiding default.
Inflation Risk
Because our assets are generally liquid in nature, they are not significantly affected by inflation. However, the rate of inflation affects such expenses as employee compensation and communications charges, which may not be readily recoverable in the prices of services we offer. To the extent inflation results in rising interest rates and has other adverse effects on the securities markets, it may adversely affect our combined financial condition and results of operations in certain businesses.
85
Table of Contents
| Item 8. | Financial Statements and Supplementary Data |
Management’s Report on Internal Control Over Financial Reporting
The management of JMP Group Inc. is responsible for establishing and maintaining adequate internal control over financial reporting to provide reasonable assurance regarding the reliability of our financial reporting and the preparation of financial statements for external reporting purposes in accordance with U.S. generally accepted accounting principles.
Management assessed the effectiveness of the Company’s internal control over financial reporting as of December 31, 2009. This assessment was based on criteria for effective internal control over financial reporting described in “Internal Control—Integrated Framework,” issued by the Committee of Sponsoring Organizations of the Treadway Commission. Based on this assessment, management concluded that, as of December 31, 2009, the Company maintained effective internal control over financial reporting.
The effectiveness of the Company’s internal control over financial reporting as of December 31, 2009, has been audited by PricewaterhouseCoopers LLP, the Company’s independent registered public accounting firm, as stated in its report appearing on page 87, which expressed an unqualified opinion on the effectiveness of the Company’s internal control over financial reporting as of December 31, 2009.
86
Table of Contents
REPORT OF INDEPENDENT REGISTERED PUBLIC ACCOUNTING FIRM
To the Board of Directors and Stockholders of
JMP Group Inc.
In our opinion, the accompanying consolidated statements of financial conditions and the related consolidated statements of operations, changes in shareholders’ and members’ equity and cash flows present fairly, in all material respects, the financial position of JMP Group Inc. and its subsidiaries at December 31, 2009 and December 31, 2008, and the results of their operations and their cash flows for the year ended December 31, 2009 (successor), the year ended December 31, 2008 (successor), the period from May 16, 2007 to December 31, 2007 (successor) and the period from January 1, 2007 to May 15, 2007 (predecessor) in conformity with accounting principles generally accepted in the United States of America. Also in our opinion, the Company maintained, in all material respects, effective internal control over financial reporting as of December 31, 2009, based on criteria established in Internal Control—Integrated Framework issued by the Committee of Sponsoring Organizations of the Treadway Commission (COSO). The Company’s management is responsible for these financial statements, for maintaining effective internal control over financial reporting and for its assessment of the effectiveness of internal control over financial reporting, included in the accompanying Management’s Report on Internal Control over Financial Reporting. Our responsibility is to express opinions on these financial statements and on the Company’s internal control over financial reporting based on our audits (which were integrated audits in 2009 and 2008). We conducted our audits in accordance with the standards of the Public Company Accounting Oversight Board (United States). Those standards require that we plan and perform the audits to obtain reasonable assurance about whether the financial statements are free of material misstatement and whether effective internal control over financial reporting was maintained in all material respects. Our audits of the financial statements included examining, on a test basis, evidence supporting the amounts and disclosures in the financial statements, assessing the accounting principles used and significant estimates made by management, and evaluating the overall financial statement presentation. Our audit of internal control over financial reporting included obtaining an understanding of internal control over financial reporting, assessing the risk that a material weakness exists, and testing and evaluating the design and operating effectiveness of internal control based on the assessed risk. Our audits also included performing such other procedures as we considered necessary in the circumstances. We believe that our audits provide a reasonable basis for our opinions.
A company’s internal control over financial reporting is a process designed to provide reasonable assurance regarding the reliability of financial reporting and the preparation of financial statements for external purposes in accordance with generally accepted accounting principles. A company’s internal control over financial reporting includes those policies and procedures that (i) pertain to the maintenance of records that, in reasonable detail, accurately and fairly reflect the transactions and dispositions of the assets of the company; (ii) provide reasonable assurance that transactions are recorded as necessary to permit preparation of financial statements in accordance with generally accepted accounting principles, and that receipts and expenditures of the company are being made only in accordance with authorizations of management and directors of the company; and (iii) provide reasonable assurance regarding prevention or timely detection of unauthorized acquisition, use, or disposition of the company’s assets that could have a material effect on the financial statements.
Because of its inherent limitations, internal control over financial reporting may not prevent or detect misstatements. Also, projections of any evaluation of effectiveness to future periods are subject to the risk that controls may become inadequate because of changes in conditions, or that the degree of compliance with the policies or procedures may deteriorate.
/s/ PricewaterhouseCoopers LLP
San Francisco, CA
March 8, 2010
87
Table of Contents
Consolidated Statements of Financial Condition
| December 31, 2009 | December 31, 2008 | |||||||
| Successor | ||||||||
| Assets |
||||||||
| Cash and cash equivalents |
$ | 75,680,197 | $ | 46,261,959 | ||||
| Restricted cash and deposits (includes cash on deposit with clearing broker of $255,336 at December 31, 2009 and December 31, 2008) |
36,628,213 | 6,929,501 | ||||||
| Receivable from clearing broker |
1,609,421 | 1,878,078 | ||||||
| Investment banking fees receivable, net of allowance for doubtful accounts of $0 and $78,579 at December 31, 2009 and December 31, 2008 |
2,705,812 | 1,647,761 | ||||||
| Marketable securities owned, at fair value |
5,899,446 | 19,838,480 | ||||||
| Incentive fee receivable |
2,630,856 | 1,479,741 | ||||||
| Other investments (of which $57,189,982 and $47,954,255 at fair value at December 31, 2009 and December 31, 2008) |
59,189,982 | 47,954,255 | ||||||
| Loans held for investment, net of allowance for loan losses |
1,592,036 | 5,725,867 | ||||||
| Loans collateralizing asset-backed securities issued, net of allowance for loan losses |
327,966,994 | — | ||||||
| Interest receivable |
1,045,650 | 72,194 | ||||||
| Fixed assets, net |
1,345,280 | 1,207,014 | ||||||
| Deferred tax assets |
51,499,302 | 11,062,174 | ||||||
| Other assets |
6,928,288 | 8,789,068 | ||||||
| Total assets |
$ | 574,721,477 | $ | 152,846,092 | ||||
| Liabilities and Equity |
||||||||
| Liabilities: |
||||||||
| Marketable securities sold, but not yet purchased, at fair value |
$ | 1,047,461 | $ | 5,677,683 | ||||
| Accrued compensation |
43,025,802 | 21,349,724 | ||||||
| Asset-backed securities issued |
326,631,612 | — | ||||||
| Interest payable |
524,822 | 17,663 | ||||||
| Note payable |
9,044,680 | 8,680,850 | ||||||
| Deferred tax liability |
48,220,184 | 224,204 | ||||||
| Other liabilities |
20,574,841 | 3,823,892 | ||||||
| Total liabilities |
449,069,402 | 39,774,016 | ||||||
| Commitments and Contingencies |
||||||||
| JMP Group Inc. Stockholders’ Equity |
||||||||
| Common stock, $0.001 par value, 100,000,000 shares authorized; 22,069,741 shares issued at December 31, 2009 and December 31, 2008; 21,533,583 and 20,470,125 shares outstanding at December 31, 2009 and December 31, 2008 |
22,070 | 22,070 | ||||||
| Additional paid-in capital |
126,125,406 | 125,939,747 | ||||||
| Treasury stock (at cost, 536,158 and 1,599,616 shares at December 31, 2009 and December 31, 2008) |
(4,359,773 | ) | (10,710,981 | ) | ||||
| Accumulated deficit |
(1,151,770 | ) | (10,129,777 | ) | ||||
| Total JMP Group Inc. stockholders’ equity |
120,635,933 | 105,121,059 | ||||||
| Noncontrolling Interest |
5,016,142 | 7,951,017 | ||||||
| Total equity |
125,652,075 | 113,072,076 | ||||||
| Total liabilities and equity |
$ | 574,721,477 | $ | 152,846,092 | ||||
See accompanying notes to consolidated financial statements
88
Table of Contents
Consolidated Statements of Operations
| Year Ended December 31, 2009 |
Year Ended December 31, 2008 |
January 1, 2007 through May 15, 2007 |
May 16, 2007 through December 31, 2007 |
|||||||||||||
| Successor | Successor | Predecessor | Successor | |||||||||||||
| Revenues |
||||||||||||||||
| Investment banking |
$ | 39,924,382 | $ | 27,249,421 | $ | 16,054,815 | $ | 33,221,615 | ||||||||
| Brokerage |
34,004,005 | 35,731,188 | 12,986,710 | 21,835,349 | ||||||||||||
| Asset management fees |
20,148,109 | 11,368,966 | 1,218,467 | 3,829,996 | ||||||||||||
| Principal transactions |
18,517,422 | (4,657,068 | ) | 541,251 | 2,404,351 | |||||||||||
| Gain on sale and payoff of loans |
22,268,091 | — | — | — | ||||||||||||
| Gain on repurchase of asset-backed securities issued |
4,704,760 | — | — | — | ||||||||||||
| Gain on bargain purchase |
1,179,279 | — | — | — | ||||||||||||
| Net dividend income |
2,520,484 | 3,174,249 | 399,053 | 1,448,689 | ||||||||||||
| Other income |
2,592,897 | 1,157,831 | 326,105 | 533,768 | ||||||||||||
| Non-interest revenues |
145,859,429 | 74,024,587 | 31,526,401 | 63,273,768 | ||||||||||||
| Interest income |
35,369,806 | 2,392,124 | 732,395 | 2,007,281 | ||||||||||||
| Interest expense |
(25,924,278 | ) | (408,498 | ) | (569,901 | ) | (160,044 | ) | ||||||||
| Net interest income |
9,445,528 | 1,983,626 | 162,494 | 1,847,237 | ||||||||||||
| Provision for loan losses |
(5,821,409 | ) | (2,896,149 | ) | — | — | ||||||||||
| Total net revenues after provision for loan losses |
149,483,548 | 73,112,064 | 31,688,895 | 65,121,005 | ||||||||||||
| Non-interest Expenses |
||||||||||||||||
| Compensation and benefits |
105,179,159 | 65,745,840 | 18,393,339 | 45,617,518 | ||||||||||||
| Income allocation and accretion—Redeemable Class A member interests |
— | — | 117,418,274 | — | ||||||||||||
| Administration |
5,050,439 | 5,886,781 | 1,770,553 | 3,371,302 | ||||||||||||
| Brokerage, clearing and exchange fees |
5,284,323 | 5,062,582 | 1,689,174 | 3,365,797 | ||||||||||||
| Travel and business development |
2,396,264 | 3,472,505 | 1,197,440 | 1,930,058 | ||||||||||||
| Communications and technology |
3,892,437 | 3,837,198 | 1,389,647 | 2,474,681 | ||||||||||||
| Occupancy |
2,447,737 | 1,905,248 | 699,774 | 1,184,173 | ||||||||||||
| Professional fees |
3,589,045 | 3,064,865 | 375,969 | 2,054,182 | ||||||||||||
| Depreciation |
745,571 | 963,095 | 525,734 | 688,490 | ||||||||||||
| Other |
554,326 | 19,646 | (241,084 | ) | 184,678 | |||||||||||
| Total non-interest expenses |
129,139,301 | 89,957,760 | 143,218,820 | 60,870,879 | ||||||||||||
| Income (loss) before income tax expense |
20,344,247 | (16,845,696 | ) | (111,529,925 | ) | 4,250,126 | ||||||||||
| Income tax expense (benefit) |
7,662,501 | (5,700,952 | ) | — | (2,536,614 | ) | ||||||||||
| Net income (loss) |
12,681,746 | (11,144,744 | ) | (111,529,925 | ) | 6,786,740 | ||||||||||
| Less: Net income (loss) attributable to noncontrolling interests |
1,871,494 | (498,404 | ) | 167,388 | 246,930 | |||||||||||
| Net income (loss) attributable to JMP Group Inc. |
$ | 10,810,252 | $ | (10,646,340 | ) | $ | (111,697,313 | ) | $ | 6,539,810 | ||||||
| Net income (loss) attributable to JMP Group Inc. per common share: |
||||||||||||||||
| Basic |
$ | 0.52 | $ | (0.53 | ) | $ | 0.30 | |||||||||
| Diluted |
$ | 0.49 | $ | (0.53 | ) | $ | 0.30 | |||||||||
| Weighted average common shares outstanding: |
||||||||||||||||
| Basic |
20,790,776 | 20,210,888 | 21,829,544 | |||||||||||||
| Diluted |
22,137,491 | 20,210,888 | 21,916,158 | |||||||||||||
| Net (loss) per unit—Class A common interests: |
||||||||||||||||
| Basic |
$ | (23.84 | ) | |||||||||||||
| Diluted |
$ | (23.84 | ) | |||||||||||||
| Weighted average units outstanding—Class A common interests: |
||||||||||||||||
| Basic |
2,384,881 | |||||||||||||||
| Diluted |
2,384,881 | |||||||||||||||
| Net (loss) per unit—Class B common interests: |
||||||||||||||||
| Basic |
$ | (23.84 | ) | |||||||||||||
| Diluted |
$ | (23.84 | ) | |||||||||||||
| Weighted average units outstanding—Class B common interests: |
||||||||||||||||
| Basic |
2,300,000 | |||||||||||||||
| Diluted |
2,300,000 | |||||||||||||||
See accompanying notes to consolidated financial statements
89
Table of Contents
Consolidated Statements of Changes in Equity
| JMP Group Inc. Members' Equity | Noncontrolling Interest |
Total Equity | ||||||||||||||||||
| Class A Common Interests |
Class B Common Interests |
Additional Paid-In Capital |
Retained Earnings (Accumulated Deficit) |
|||||||||||||||||
| Predecessor: |
||||||||||||||||||||
| Balance, December 31, 2006 |
11,861,848 | 31,650,177 | 268,635 | 2,971,152 | 5,739,459 | 52,491,271 | ||||||||||||||
| Net income (loss) |
— | — | — | (111,697,313 | ) | 167,388 | (111,529,925 | ) | ||||||||||||
| Additonal paid-in capital—stock-based compensation |
— | — | 816,248 | — | — | 816,248 | ||||||||||||||
| Contributions of Class A common members |
401,172 | — | — | — | — | 401,172 | ||||||||||||||
| Redeemable Class A member interests—liability to equity exchange for treasury |
111,209,527 | — | — | — | — | 111,209,527 | ||||||||||||||
| Distributions paid to Class A and Class B common interests |
— | — | — | (6,679,874 | ) | — | (6,679,874 | ) | ||||||||||||
| Capital contributions from noncontrolling interest holders |
— | — | — | — | 200,000 | 200,000 | ||||||||||||||
| Sale of subsidiary shares to noncontrolling interest holders |
— | — | — | — | 20,800 | 20,800 | ||||||||||||||
| Balance, May 15, 2007 |
$ | 123,472,547 | $ | 31,650,177 | $ | 1,084,883 | $ | (115,406,035 | ) | $ | 6,127,647 | $ | 46,929,219 | |||||||
| JMP Group Inc. Stockholders' Equity | Noncontrolling Interest |
Total Equity | |||||||||||||||||||||||
| Common Stock | Common Treasury Stock Amount |
Additional Paid-In Capital |
Retained Earnings (Accumulated Deficit) |
||||||||||||||||||||||
| Shares | Amount | ||||||||||||||||||||||||
| Successor: |
|||||||||||||||||||||||||
| Balance, May 16, 2007 |
1,012,999 | $ | 1,013 | $ | — | $ | 14,227,555 | $ | 560,064 | $ | 6,127,647 | $ | 20,916,279 | ||||||||||||
| Net income |
— | — | — | — | 6,539,810 | 246,930 | 6,786,740 | ||||||||||||||||||
| Additonal paid-in capital—stock-based compensation |
44,642 | 45 | — | 7,453,841 | — | — | 7,453,886 | ||||||||||||||||||
| Issuance of common stock for membership interests |
13,787,036 | 13,787 | — | 26,225,681 | — | — | 26,239,468 | ||||||||||||||||||
| Net proceeds from issuance of common sotck in initial public offering |
7,199,864 | 7,200 | — | 73,094,845 | — | — | 73,102,045 | ||||||||||||||||||
| Cash dividends paid to shareholders |
— | — | — | — | (1,638,796 | ) | — | (1,638,796 | ) | ||||||||||||||||
| Purchases of shares of common stock for treasury |
— | — | (10,884,218 | ) | — | — | — | (10,884,218 | ) | ||||||||||||||||
| Dividends paid to noncontrolling interest holders |
— | — | — | — | — | (1,352,899 | ) | (1,352,899 | ) | ||||||||||||||||
| Capital contributions from noncontrolling interest holders |
— | — | — | — | — | 9,583,014 | 9,583,014 | ||||||||||||||||||
| Balance, December 31, 2007 |
22,044,541 | 22,045 | (10,884,218 | ) | 121,001,922 | 5,461,078 | 14,604,692 | 130,205,519 | |||||||||||||||||
| Net loss |
— | — | — | — | (10,646,340 | ) | (498,404 | ) | (11,144,744 | ) | |||||||||||||||
| Additonal paid-in capital—stock-based compensation |
25,200 | 25 | — | 11,119,673 | — | — | 11,119,698 | ||||||||||||||||||
| Cash dividends paid to shareholders |
— | — | — | (4,031,342 | ) | — | (4,031,342 | ) | |||||||||||||||||
| Purchases of shares of common stock for treasury |
— | — | (6,921,784 | ) | — | — | — | (6,921,784 | ) | ||||||||||||||||
| Reissuance of shares of common stock from treasury |
— | — | 7,095,021 | (6,181,848 | ) | (913,173 | ) | — | — | ||||||||||||||||
| Dividends paid to noncontrolling interest holders |
(224,254 | ) | (224,254 | ) | |||||||||||||||||||||
| Capital contributions from noncontrolling interest holders |
1,416,757 | 1,416,757 | |||||||||||||||||||||||
| Deconsolidation of subsidiaries |
— | — | — | — | — | (7,347,774 | ) | (7,347,774 | ) | ||||||||||||||||
| Balance, December 31, 2008 |
22,069,741 | $ | 22,070 | $ | (10,710,981 | ) | $ | 125,939,747 | $ | (10,129,777 | ) | $ | 7,951,017 | $ | 113,072,076 | ||||||||||
| Net income |
— | — | — | — | 10,810,252 | 1,871,494 | 12,681,746 | ||||||||||||||||||
| Additonal paid-in capital—stock-based compensation |
— | — | — | (480,726 | ) | — | — | (480,726 | ) | ||||||||||||||||
| Additonal paid-in capital—excess tax benefit related to stock-based compensation |
— | — | — | 666,385 | — | — | 666,385 | ||||||||||||||||||
| Cash dividends paid to shareholders |
— | — | — | — | (835,452 | ) | — | (835,452 | ) | ||||||||||||||||
| Purchases of shares of common stock for treasury |
— | — | (5,404,016 | ) | — | — | — | (5,404,016 | ) | ||||||||||||||||
| Reissuance of shares of common stock from treasury |
— | — | 11,755,224 | — | (996,793 | ) | — | 10,758,431 | |||||||||||||||||
| Sale of subsidiary shares to noncontrolling interest holders |
— | — | — | — | — | 373,705 | 373,705 | ||||||||||||||||||
| Dividends paid to noncontrolling interest holders |
— | — | — | — | — | (1,284,359 | ) | (1,284,359 | ) | ||||||||||||||||
| Reorganization/dissolution of subsidiaries |
— | — | — | — | — | (3,895,715 | ) | (3,895,715 | ) | ||||||||||||||||
| Balance, December 31, 2009 |
22,069,741 | $ | 22,070 | $ | (4,359,773 | ) | $ | 126,125,406 | $ | (1,151,770 | ) | $ | 5,016,142 | $ | 125,652,075 | ||||||||||
See accompanying notes to consolidated financial statements
90
Table of Contents
Consolidated Statements of Cash Flows
| Year Ended December 31, 2009 |
Year Ended December 31, 2008 |
January 1, 2007 through May 15, 2007 |
May 16, 2007 through December 31, 2007 |
|||||||||||||
| Successor | Successor | Predecessor | Successor | |||||||||||||
| Cash flows from operating activities: |
||||||||||||||||
| Net income (loss) |
$ | 12,681,746 | $ | (11,144,744 | ) | $ | (111,529,925 | ) | $ | 6,786,740 | ||||||
| Adjustments to reconcile net income to net cash (used in) provided by in operating activities: |
||||||||||||||||
| Provision for doubtful accounts |
— | 19,646 | (241,079 | ) | 111,368 | |||||||||||
| Provision for loan losses |
5,821,409 | 2,896,149 | — | — | ||||||||||||
| Amortization of deferred loan fees |
(977,045 | ) | (69,483 | ) | — | — | ||||||||||
| Accretion of liquidity discount, net |
1,561,308 | — | — | — | ||||||||||||
| Loan origination and commitment fees |
— | 260,000 | — | — | ||||||||||||
| Gain on sale and payoff of loans |
(22,268,091 | ) | — | — | — | |||||||||||
| Gain on repurchase of asset-backed securities issued |
(4,704,760 | ) | — | — | — | |||||||||||
| Change in other investments: |
||||||||||||||||
| Fair value |
(10,779,010 | ) | 2,424,016 | (430,177 | ) | 1,276,526 | ||||||||||
| Incentive fees reinvested in general partnership interests |
(4,734,454 | ) | (3,666,029 | ) | (226,953 | ) | (465,343 | ) | ||||||||
| Depreciation and amortization of fixed assets |
745,571 | 963,095 | 525,734 | 688,490 | ||||||||||||
| Stock-based compensation expense |
9,759,075 | 11,119,698 | 816,249 | 7,453,886 | ||||||||||||
| Deferred income taxes |
6,977,680 | (8,211,744 | ) | — | (2,536,614 | ) | ||||||||||
| Gain on bargain purchase |
(1,179,279 | ) | — | — | — | |||||||||||
| Net change in operating assets and liabilities: |
||||||||||||||||
| Decrease in interest receivable |
163,440 | 62,157 | 3,331 | 16,592 | ||||||||||||
| (Increase) decrease in receivables |
(1,940,509 | ) | 3,687,738 | 1,417,767 | 1,694,908 | |||||||||||
| Decrease (increase) in marketable securities |
8,687,847 | (1,040,627 | ) | (3,953,001 | ) | (8,318,572 | ) | |||||||||
| Decrease (increase) in restricted cash (excluding restricted cash reserved for lending activities), deposits and other assets |
8,683,694 | (4,632,665 | ) | (1,271,797 | ) | (8,284,908 | ) | |||||||||
| Decrease (increase) in marketable securities sold, but not yet purchased |
(4,630,222 | ) | 2,323,639 | 1,561,160 | 1,911,964 | |||||||||||
| (Decrease) in interest payable |
(702,429 | ) | — | — | — | |||||||||||
| (Decrease) increase in securities sold under agreements to repurchase |
— | (9,135,000 | ) | — | 9,135,000 | |||||||||||
| Increase (decrease) in accrued compensation and other liabilities |
36,726,617 | (8,487,845 | ) | (15,189,481 | ) | 18,849,944 | ||||||||||
| Increase in Redeemable Class A member interests |
— | — | 98,696,930 | — | ||||||||||||
| Net cash provided by (used in) operating activities |
39,892,588 | (22,631,999 | ) | (29,821,242 | ) | 28,319,981 | ||||||||||
| Cash flows from investing activities: |
||||||||||||||||
| Purchases of fixed assets |
(723,837 | ) | (312,665 | ) | (60,416 | ) | (385,850 | ) | ||||||||
| Investment in subsidiary |
(2,089,477 | ) | — | — | — | |||||||||||
| Purchases of other investments |
(7,486,372 | ) | (19,686,450 | ) | (700,000 | ) | (12,288,858 | ) | ||||||||
| Sales of other investments |
13,358,268 | 5,161,783 | 251,696 | 270,084 | ||||||||||||
| Funding of loans collateralizing asset-backed securities issued |
(156,084,749 | ) | — | — | — | |||||||||||
| Funding of loans held for investment |
— | (7,956,770 | ) | — | (3,000,000 | ) | ||||||||||
| Sale and payoff of loans collateralizing asset-backed securities issued |
93,300,692 | — | — | — | ||||||||||||
| Principal payments on loans collateralizing asset-backed securities issued |
53,397,096 | — | — | — | ||||||||||||
| Principal payments on loans held for investment |
270,162 | 322,000 | — | 625,000 | ||||||||||||
| Repayment of note receivable |
— | 335,272 | — | — | ||||||||||||
| Net change in restricted cash reserved for lending activities |
9,011,591 | — | — | — | ||||||||||||
| Cash associated with consolidation / deconsolidation of subsidiaries |
902,475 | (7,016,482 | ) | — | — | |||||||||||
| Net cash provided by (used in) investing activities |
3,855,849 | (29,153,312 | ) | (508,720 | ) | (14,779,624 | ) | |||||||||
91
Table of Contents
JMP Group Inc.
Consolidated Statements of Cash Flows—(Continued)
| Year Ended December 31, 2009 |
Year Ended December 31, 2008 |
January 1, 2007 through May 15, 2007 |
May 16, 2007 through December 31, 2007 |
|||||||||||||
| Successor | Successor | Predecessor | Successor | |||||||||||||
| Cash flows from financing activities: |
||||||||||||||||
| Proceeds from issuance of note payable |
6,100,000 | 8,680,850 | 14,500,000 | — | ||||||||||||
| Repayment of note payable |
(5,736,170 | ) | — | — | (14,500,000 | ) | ||||||||||
| Repayment and repurchase of contingent consideration payable |
(1,898,792 | ) | — | — | — | |||||||||||
| Proceeds from initial public offering, net of expenses |
— | — | — | 73,102,045 | ||||||||||||
| Sale of asset-back securities issued |
996,000 | — | — | — | ||||||||||||
| Repurchase of asset-backed securities issued |
(555,127 | ) | — | — | — | |||||||||||
| Repayment of asset-backed securities issued |
(6,761,918 | ) | — | — | — | |||||||||||
| Distributions paid to Class A and Class B common interests |
— | — | (6,679,874 | ) | — | |||||||||||
| Cash dividends paid to stockholders |
(835,452 | ) | (4,031,342 | ) | — | (1,638,796 | ) | |||||||||
| Purchases of shares of common stock for treasury |
(5,404,016 | ) | (6,921,784 | ) | — | (10,884,218 | ) | |||||||||
| Capital contributions of noncontrolling interest members and shareholders |
300,000 | 1,416,757 | 200,000 | 9,583,014 | ||||||||||||
| Dividends paid to noncontrolling interest shareholders |
(1,284,359 | ) | (224,254 | ) | (155,660 | ) | ||||||||||
| Proceeds from exercises of stock options |
83,250 | — | — | — | ||||||||||||
| Excess tax benefit related to stock-based compensation |
666,385 | — | — | — | ||||||||||||
| Net cash (used in) provided by financing activities |
(14,330,199 | ) | (1,079,773 | ) | 8,020,126 | 55,506,385 | ||||||||||
| Net increase (decrease) in cash and cash equivalents |
29,418,238 | (52,865,084 | ) | (22,309,836 | ) | 69,046,742 | ||||||||||
| Cash and cash equivalents, beginning of period |
46,261,959 | 99,127,043 | 52,328,804 | 30,080,301 | ||||||||||||
| Cash and cash equivalents, end of period |
$ | 75,680,197 | $ | 46,261,959 | $ | 30,018,968 | $ | 99,127,043 | ||||||||
| Supplemental disclosures of cash flow information: |
||||||||||||||||
| Cash paid during the period for interest |
$ | 5,776,454 | $ | 357,706 | $ | 1,033,937 | $ | 173,788 | ||||||||
| Cash paid during the period for taxes |
$ | 730,000 | $ | 6,729,517 | $ | — | $ | 380,821 | ||||||||
| Non-cash investing and financing activities: |
||||||||||||||||
| Issuance of Class A common interests |
$ | — | $ | — | $ | 401,172 | $ | — | ||||||||
| Issuance of JMPRT common stock |
$ | — | $ | — | $ | 20,800 | $ | — | ||||||||
| Dividends distributed by JMPRT to noncontrolling interest shareholders in the form of participation interest |
$ | — | $ | — | $ | — | $ | 1,197,238 | ||||||||
| Reissuance of shares of common stock from treasury related to vesting of restricted stock units and excercise of stock options |
$ | 6,404,549 | $ | 5,629,230 | $ | — | $ | — | ||||||||
| Fair value of noncash assets acquired in the Cratos acquisition |
$ | 376,371,923 | $ | — | $ | — | $ | — | ||||||||
| Fair value of noncash liabilities assumed in the Cratos acquisition |
$ | 370,775,518 | $ | — | $ | — | $ | — | ||||||||
| Membership interest in LSC III, LLC (“LSC”) received in full satisfaction of a non-revolving credit note |
$ | 2,434,953 | $ | — | $ | — | $ | — | ||||||||
See accompanying notes to consolidated financial statements
92
Table of Contents
Notes to Consolidated Financial Statements
December 31, 2009, 2007 and 2006
1. Organization and Description of Business
JMP Group Inc., together with its subsidiaries (collectively, the “Company” or “Successor”), is an independent investment banking and asset management firm headquartered in San Francisco. JMP Group Inc. completed its initial public offering on May 16, 2007, and also completed a corporate reorganization (the “Reorganization”), which is described in greater detail in the Registration Statement on Form S-1 (File No. 333-140689) (the “Registration Statement”) filed with the Securities and Exchange Commission (“SEC”) in connection with the initial public offering. The Company conducts its brokerage business through its wholly-owned subsidiary, JMP Securities LLC (“JMP Securities”), its asset management business through its wholly-owned subsidiary, Harvest Capital Strategies LLC (“HCS”) (formerly JMP Asset Management LLC, which changed its name to HCS effective September 29, 2008), its corporate credit business through its majority-owned indirect subsidiary, JMP Credit Corporation (“JMP Credit”), and certain principal investments through its wholly-owned subsidiary JMP Capital LLC (“JMP Capital”). JMP Securities is a U.S. registered broker-dealer under the Securities Exchange Act of 1934, as amended, and is a member of the Financial Industry Regulatory Authority (“FINRA”). JMP Securities operates as an introducing broker and does not hold funds or securities for, or owe any money or securities to, customers and does not carry accounts for customers. All customer transactions are cleared through another broker-dealer on a fully disclosed basis. HCS is a registered investment advisor under the Investment Advisers Act of 1940, as amended, and provides investment management services for sophisticated investors in investment partnerships and other entities managed by HCS.
Prior to May 16, 2007 the Company had conducted its business through a multi-member Delaware limited liability company, JMP Group LLC (the “Predecessor”), pursuant to its Third Amended and Restated Limited Liability Company Operating Agreement dated as of August 18, 2004, as amended (the “Operating Agreement”). One of JMP Group LLC’s members, JMP Holdings Inc. (“JMP Holdings”), was established in August 2004 to enable investors to invest through a corporate entity in the membership interests of JMP Group LLC. Shares of common stock of JMP Holdings were issued in a private offering in August 2004. JMP Holdings’ only significant asset until May 16, 2007 was its investment in JMP Group LLC, comprised of the member interests of JMP Group LLC, which had been purchased with the net proceeds received from issuance of JMP Holdings’ common stock.
In connection with its initial public offering, JMP Holdings changed its name to JMP Group Inc., and effective May 16, 2007 (the “Reorganization Date”), members of JMP Group LLC exchanged the outstanding membership interests of JMP Group LLC for shares of common stock of JMP Group Inc. As a result of the exchange, JMP Group LLC became JMP Group Inc.’s wholly-owned subsidiary, and JMP Group Inc. completed its initial public offering on May 16, 2007.
Effective April 7, 2009, the Company, through its majority-owned indirect subsidiary JMP Credit, completed the acquisition of 100% of the membership interests of Cratos Capital Partners, LLC and its subsidiaries, including Cratos Capital Management, LLC (collectively, “Cratos”), an alternative asset manager of collateralized loan obligations, together with certain securities of Cratos CLO I, Ltd. (the “CLO”). Certain members of Cratos hold noncontrolling interests in JMP Credit. As a result of the acquisition, the Company now operates in three reportable business segments: Broker-Dealer, Asset Management and Corporate Credit. Please refer to Note 4 and Note 23 for further information on the acquisition and our business segments.
93
Table of Contents
2. Summary of Significant Accounting Policies
Basis of Presentation
These financial statements and accompanying notes present the consolidated financial condition of the Successor as of December 31, 2009 and December 31, 2008. Consolidated results of operations and cash flows are presented for the Successor for the years ended December 31, 2009 and 2008 and for the period from May 16, 2007 to December 31, 2007 (post-Reorganization) and for the Predecessor for the period January 1, 2007 through May 15, 2007 (pre-Reorganization). The Reorganization in connection with the initial public offering resulted in a combination of the Predecessor (JMP Group LLC) and JMP Holdings Inc. (now JMP Group Inc.), whose financial statements had not been combined with those of the Predecessor prior to May 16, 2007 for reporting purposes. Therefore, the Successor’s consolidated financial statements as of and after May 16, 2007 include the accounts of both JMP Group LLC and JMP Group Inc. The consolidated accounts of the Predecessor include the wholly-owned subsidiaries, JMP Securities and HCS, the indirectly wholly-owned subsidiary, JMP Capital LLC (“JMP Capital”), through which the Company conducts certain principal investing activities, and the partially-owned subsidiaries, JMP Realty Trust (“JMPRT”), Harvest Consumer Partners (“HCP”) and Harvest Technology Partners (“HTP”). The consolidated accounts of the Successor include the wholly-owned subsidiaries, JMP Securities and HCS, the indirectly majority-owned subsidiaries, JMP Credit (effective April 7, 2009) and Harvest Mortgage Opportunities Partners (“HMOP”) (effective May 1, 2009), the indirectly wholly-owned subsidiary, JMP Capital, and the partially-owned subsidiaries, JMPRT (through January 1, 2009), HCP (through November 30, 2008), HTP (through July 31, 2008) and Opportunity Acquisition Corp., a special purpose acquisition corporation, or “SPAC”, formed for the purpose of acquiring one or more businesses through a merger, capital stock exchange, stock purchase, asset acquisition, or other similar business combination. The Company was the sponsor of the SPAC. The SPAC was liquidated on December 31, 2009 with no distribution of assets to the Company or noncontrolling interest holders due to its accumulated loss. All material intercompany accounts and transactions have been eliminated in consolidation.
The Company follows the authoritative accounting guidance for the consolidation of variable interest entities (VIEs). Such guidance applies to certain entities (called VIEs) in which equity investors do not have the characteristics of a controlling financial interest or do not have sufficient equity at risk for the entity to finance its activities without additional subordinated financial support from other parties. When the Company enters into a transaction with a VIE, the Company determines if it is the primary beneficiary of the VIE by performing a qualitative analysis of the VIE that includes a review of, among other factors, its capital structure, contractual terms, related party relationships, the Company’s fee arrangements and the design of the VIE. Upon acquisition of Cratos, the Company performed this analysis and concluded that the CLO managed by Cratos is a VIE and that Cratos Capital Partners LLC, which owns 100% of the subordinated notes in the CLO and performs ongoing management responsibilities for the CLO, is deemed the primary beneficiary. As a result, the Company consolidates the assets and liabilities of the Cratos CLO securitization entity, and the underlying loans owned by the CLO entity are shown on our consolidated statements of financial condition under loans collateralizing asset-backed securities issued and the asset-backed securities (“ABS”) issued to third parties are shown under ABS issued.
Noncontrolling interest on the consolidated statements of financial condition at December 31, 2009 relates to the interest of third parties in JMP Credit and HMOP, indirectly majority-owned subsidiaries consolidated on our books. Noncontrolling interest on the consolidated statements of financial condition at December 31, 2008 relates to the interest of third parties in JMPRT and SPAC.
JMPRT is a real estate investment trust that was formed in June 2006. As of December 31, 2008, the Company owned 49.5% of JMPRT and certain employees owned 20.1%. Because of its ownership and management position, the Company consolidated JMPRT and recorded a noncontrolling interest through December 31, 2008. On January 2, 2009, all of the assets and liabilities within JMPRT were transferred to HMOP, a hedge fund managed by HCS. HMOP is a Delaware limited partnership organized for the purposes of investing in real estate-related assets which may include investments in residential or commercial mortgages or
94
Table of Contents
loans, real estate and other assets, loans and participation in loans of all types, other specialty mortgage products, and securities. HCS is the general partner of HMOP. In connection with the above asset and liability transfer, the Company exchanged its interest in JMPRT for an interest in HMOP. No gain or loss was recognized from this exchange. The partnership agreements for HMOP provide for the right of the limited partners to remove the general partner by a simple majority vote of the non-affiliated limited partners. Because of these substantive kick-out rights, the Company, as the general partner, did not control HMOP and therefore did not consolidate HMOP from January 2, 2009 through April 30, 2009. During the quarter ended June 30, 2009, several non-affiliated limited partners redeemed their interest in HMOP, and the remaining limited partners were no longer deemed to have substantive kick-out rights. As a result, the Company consolidates HMOP in its consolidated financial statements effective May 1, 2009. The change in noncontrolling interest as a result of the transfer of assets and liabilities from JMPRT to HMOP and the consolidation of HMOP is presented as “reorganization of a subsidiary” in our Consolidated Statement of Changes in Equity.
HCP had been consolidated in the Company’s financial statements, with a noncontrolling interest being recorded, since its inception in January 2006 through November 30, 2008, due to the Company’s and related parties’ ownership and resulting control of HCP. As a result of the admission of additional non-affiliated limited partners, effective December 1, 2008 HCP was deconsolidated from the Company’s financial statements and the investment in HCP is accounted for under the equity method of accounting.
HTP had been consolidated in the Company’s financial statements, with a noncontrolling interest being recorded, since its inception in January 2006 through July 31, 2008, due to the Company’s and related parties’ ownership and resulting control of HTP. As a result of the admission of additional non-affiliated limited partners, effective August 1, 2008 HTP was deconsolidated from the Company’s financial statements and the investment in HTP is accounted for under the equity method of accounting.
In addition to HTP and HCP, HCS currently manages several other asset management limited partnerships and is a general partner of each. The partnership agreements for these asset management funds provide for the right of the limited partners to remove the general partners by a simple majority vote of the non-affiliated limited partners. Because of these substantive kick-out rights, the Company, as the general partner, does not control these asset management funds and therefore does not consolidate those funds. The Company’s investments in these funds are accounted for under the equity method of accounting.
On January 18, 2008, JMP Group Inc. and certain unconsolidated affiliates made an investment in convertible preferred stock of New York Mortgage Trust, Inc. (“NYMT”), a publicly traded real estate investment trust engaged in the investment management of mortgage-backed securities and high credit quality residential adjustable rate mortgage loans. Such investment by JMP Group Inc. and affiliated entities was $20.0 million in total, comprised of $5.0 million by JMP Group Inc., $5.0 million by certain funds managed by HCS, and $10.0 million by JMPRT. JMPRT’s investment in NYMT was transferred to HMOP on January 2, 2009. In addition, JMP Group Inc. invested $4.5 million in the common stock of NYMT on February 14, 2008 via a private investment in public equity (PIPE) transaction. At December 31, 2009, JMP Group Inc. owned approximately 6.3% of NYMT’s common stock. In addition, JMP Group Inc. and affiliated entities collectively owned 1.0 million shares of NYMT’s Series A Preferred Stock at December 31, 2009. The Series A Preferred Stock is convertible into shares of NYMT’s common stock based on a conversion price of $8.00 per share of common stock, which represents a conversion rate of two and one-half (2 1/2) shares of common stock for each share of Series A Preferred Stock. The Series A Preferred Stock matures on December 31, 2010, at which time any outstanding shares must be redeemed by NYMT at the $20.00 per share liquidation preference. Because of its current ownership and management position, the Company does not consolidate NYMT. The Company accounts for its investment in NYMT using the fair value option. See Note 24 for the summarized financial information of NYMT.
On July 31, 2009, the Company received 100% of the membership interest in LSC III, LLC (“LSC”) in full satisfaction of a $2.4 million non-revolving credit note. LSC is an investment partnership and owns shares of
95
Table of Contents
common and preferred stock of two privately-held companies which had an aggregate fair value of $2.3 million at December 31, 2009. The Company is the sole member of LSC and therefore has a controlling financial interest in LSC. As a result, the Company consolidates LSC in its consolidated financial statements effective July 31, 2009.
Use of Estimates
The preparation of consolidated financial statements in conformity with accounting principles generally accepted in the United States of America (“GAAP”) requires the use of estimates and assumptions that affect both the reported amounts of assets and liabilities and the disclosure of contingent assets and liabilities at the date of the financial statements, as well as the reported amounts of revenues and expenses during the reporting period. Actual results may differ from those estimates.
Revenue Recognition
Investment banking revenues
Investment banking revenues consist of underwriting revenues, strategic advisory revenues and private placement fees, and are recorded when the underlying transaction is completed under the terms of the relevant agreement. Underwriting revenues arise from securities offerings in which the Company acts as an underwriter and include management fees, selling concessions and underwriting fees, net of related syndicate expenses. Management fees and selling concessions are recorded on the trade date, which is typically the day of pricing an offering (or the following day) and underwriting fees, net of related syndicate expenses, at the time the underwriting is completed and the related income is reasonably determinable. For these transactions, management estimates the Company’s share of the transaction-related expenses incurred by the syndicate, and recognizes revenues net of such expense. On final settlement, typically 90 days from the trade date of the transaction, these amounts are adjusted to reflect the actual transaction-related expenses and the resulting underwriting fee. Expenses associated with such transactions are deferred until the related revenue is recognized or the engagement is otherwise concluded. If management determines that a transaction is likely not to be completed, deferred expenses related to that transaction are expensed at that time. Strategic advisory revenues primarily include success fees on closed merger and acquisition transactions, as well as retainer fees, earned in connection with advising on both buyers’ and sellers’ transactions. Fees are also earned for related advisory work and other services such as providing fairness opinions and valuation analyses. Strategic advisory revenues are recorded when the transactions or the services (or, if applicable, separate components thereof) to be performed are substantially complete, the fees are determinable and collection is reasonably assured. Private placement fees are related to non-underwritten transactions such as private placements of equity securities, private investments in public equity (“PIPE”), Rule 144A private offerings and trust preferred securities offerings and are recorded on the closing date of the transaction. Unreimbursed expenses associated with strategic advisory and private placement transactions, net of client reimbursements, are recorded in the Consolidated Statements of Operations within various expense captions other than compensation expense.
Brokerage revenues
Brokerage revenues consist of (i) commissions resulting from equity securities transactions executed as agent or principal and are recorded on a trade date basis, (ii) related net trading gains and losses from market making activities and from the commitment of capital to facilitate customer orders and (iii) fees paid for equity research. The Company currently generates revenues from research activities through three types of arrangements. First, through what is commonly known as a “soft dollar” practice, a portion of a client’s commissions may be compensation for the value of access to our research. Those commissions are recognized on a trade date basis, as the Company has no further obligation. Second, a client may issue a cash payment directly to the Company for access to research. Third, the Company has entered into certain commission-sharing or tri-party arrangements in which institutional clients execute trades with a limited number of brokers and instruct those brokers to allocate a portion of the commission to the Company or to issue a cash payment to the Company.
96
Table of Contents
In these commission-sharing or tri-party arrangements, the amount of the fee is determined by the client on a case-by-case basis and agreed to by the Company. An invoice is then sent to the payor. For the second and third type of arrangements, revenue is recognized and an invoice is sent once an arrangement exists, access to research has been provided, a specific amount is fixed or determinable, and collectability is reasonably assured. None of these arrangements obligate clients to a fixed amount of fees for research, either through trading commissions or direct or indirect cash payments, nor do they obligate the Company to provide a fixed quantity of research or execute a fixed number of trades. Furthermore, the Company is not obligated under any arrangement to make commission payments to third parties on behalf of clients.
Asset Management Fees
Asset management fees consist of base management fees and incentive fees. The Company recognizes base management fees on a monthly basis over the period in which the investment services are performed. Base management fees earned by the Company are generally based on the fair value of assets under management and the fee schedule for each fund and account. Base management fees are calculated at the investor level using their quarter-beginning capital balance adjusted for any contributions or withdrawals. The Company also earns incentive fees that are based upon the performance of investment funds and accounts. Such fees are either a specified percentage of the total investment return of a fund or account or a percentage of the excess of an investment return over a specified highwater mark or hurdle rate over a defined performance period. For most funds, the highwater mark is calculated using the greatest value of a partner’s capital account as of the end of any performance period, increased for contributions and decreased for withdrawals. Incentive fees are recognized as revenue at the end of the specified performance period. The performance period used to determine the incentive fee is quarterly for the hedge funds, HMOP and NYMT, and annually for the funds of hedge funds managed by HCS. Generally the incentive fees are reinvested in the investment funds in which we hold a general partner investment. The incentive fees are not subject to any contingent repayments to investors or any other clawback arrangements.
Principal transactions
Principal transaction revenues include realized and unrealized net gains and losses resulting from our principal investments in equity and other securities for the Company’s account and in equity-linked warrants received from certain investment banking assignments, as well as limited partner investments in private funds managed by third parties and our investment in NYMT. Principal transaction revenues also include earnings (or losses) attributable to investment partnership interests held by our asset management subsidiary, HCS, which are accounted for using the equity method of accounting.
The Company’s principal transaction revenues for these categories for the years ended December 31, 2009, 2008 and 2007 are as follows:
| Year Ended December 31, 2009 |
Year Ended December 31, 2008 |
January 1, 2007 through May 15, 2007 |
May 16, 2007 through December 31, 2007 |
|||||||||||||
| Successor | Successor | Predecessor | Successor | |||||||||||||
| Equity and other securities |
$ | 10,293,532 | $ | (6,766,367 | ) | $ | (135,301 | ) | $ | 659,496 | ||||||
| Warrants and other investments |
(219,852 | ) | 124,085 | 11,904 | (25,009 | ) | ||||||||||
| Investment partnerships |
8,443,742 | 1,985,214 | 664,648 | 1,769,864 | ||||||||||||
| Total principal transaction revenues |
$ | 18,517,422 | $ | (4,657,068 | ) | $ | 541,251 | $ | 2,404,351 | |||||||
Gain on Sale and Payoff of Loans
Gain on sale and payoff of loans consists of gains from the sale and payoff of loans collateralizing asset-backed securities at JMP Credit Corporation. Gains are recorded when the proceeds exceed our carrying value of the loan.
97
Table of Contents
Gain on Repurchase of Asset-Backed Securities Issued
Gain on repurchase of asset-backed securities issued consists of gains from repurchases of our ABS from third parties. Gains are recorded when the repurchase price is less than the carrying value of the ABS.
Gain on Bargain Purchase
A bargain purchase gain was recognized upon the acquisition of Cratos by JMP Credit Corporation on April 7, 2009. This represents the difference between the fair value of net assets acquired and the consideration to the sellers.
Interest Income
Interest income primarily relates to income earned on loans. Interest income on loans comprises the stated coupon as a percentage of the face amount receivable as well as accretion of accretable or purchase discounts and deferred fees and costs, see Loans held for investment and Loans collateralizing asset-backed securities issued for more information. Interest income is recorded on the accrual basis in accordance with the terms of the respective loans unless such loans are placed on non-accrual status.
Interest Expense
Interest expense primarily relates to expense incurred on asset-backed securities issued and note payable. Interest expense on asset-backed securities issued is the stated coupon as a percentage of the principal amount payable as well as amortization of liquidity discount which was recorded at the acquisition date of Cratos, see Asset-backed securities issued for more information. Interest expense is recorded on the accrual basis in accordance with the terms of the respective asset-backed securities issued and note payable.
Cash and Cash Equivalents
The Company considers highly liquid investments with original maturities or remaining maturities upon purchase of three months or less to be cash equivalents. The Company holds cash in financial institutions in excess of the FDIC insured limits. The Company periodically reviews the financial condition of the financial institutions and assesses the credit risk.
Restricted Cash and Deposits
Restricted cash and deposits include principal and interest payments that are collateral for the asset-backed securities issued by Cratos. They also include proceeds from short sales deposited with brokers that cannot be removed unless the securities are delivered, cash collateral supporting standby letters of credit issued by JMP Credit, cash on deposit for operating leases, and cash on deposit with JMP Securities’ clearing broker.
Restricted cash consisted of the following at December 31, 2009 an 2008:
| December 31, 2009 | December 31, 2008 | |||||
| Principal and interest payments held as collateral for asset-backed securities issued |
$ | 33,349,398 | $ | — | ||
| Cash collateral supporting standby letters of credit |
1,339,870 | — | ||||
| Proceeds from short sales |
1,047,461 | 5,677,682 | ||||
| Deposit with clearing broker |
255,336 | 255,336 | ||||
| Deposits for operating leases |
636,148 | 996,483 | ||||
| $ | 36,628,213 | $ | 6,929,501 | |||
98
Table of Contents
Receivable from Clearing Broker
The Company clears customer transactions through another broker-dealer on a fully disclosed basis. At both December 31, 2009 and December 31, 2008, the receivable from clearing broker consisted solely of commissions related to securities transactions.
Investment Banking Fees Receivable
Investment banking fees receivable include receivables relating to the Company’s investment banking or advisory engagements. The Company records an allowance for doubtful accounts on these receivables on a specific identification basis. The allowance for doubtful accounts related to investment banking fee receivable was zero and $78,579 at December 31, 2009 and 2008, respectively. The following table summarizes activities in the allowance for doubtful accounts for the years ended December 31, 2009 and 2008 as well as for the period from January 1, 2007 through May 15, 2007 and the period from May 16, 2007 through December 31, 2007.
| Allowance for Doubtful Accounts |
Balance at Beginning of Period |
Additions Charged to Expenses |
Deductions (Charge-Off, net of Recoveries) |
Balance at End of Period | ||||||||||||
| Year ended December 31, 2009 |
Successor | $ | 78,579 | $ | — | $ | (78,579 | ) | $ | — | ||||||
| Year ended December 31, 2008 |
Successor | 156,004 | 19,646 | (97,071 | ) | 78,579 | ||||||||||
| May 16, 2007 through December 31, 2007 |
Successor | 23,730 | 184,682 | (52,408 | ) | 156,004 | ||||||||||
| January 1, 2007 through May 15, 2007 |
Predecessor | 294,905 | (241,082 | ) | (30,093 | ) | 23,730 | |||||||||
Fair Value of Financial Instruments
The Company adopted amended accounting principles related to fair value measurements as of January 1, 2008. The amendment establishes a consistent framework for measuring fair value in accordance with “GAAP and expands disclosures with respect to fair value measurements. The amendment applies to all financial instruments that are being measured and reported on a fair value basis. This includes those items currently reported in marketable securities owned, at fair value, other investments and marketable securities sold, not yet purchased, at fair value on the consolidated statements of financial condition. Fair value is defined as the price that would be received to sell an asset or paid to transfer a liability in an orderly transaction between market participants at the measurement date. See Note 5 of the Notes to the consolidated financial statements for the disclosures related to the fair value of our marketable securities and other investments.
Most of the Company’s financial instruments, other than loans collateralizing asset-backed securities issued, loans held for investment, asset-backed securities issued and investment in HuaMei Capital Company, Inc., are recorded at fair value or amounts that approximate fair value. In February 2009, the Company made a $2.0 million investment in HuaMei Capital Company, Inc. (“HuaMei”) to expand its investment banking capabilities in China. HuaMei is a joint venture of China Merchants Securities; MVC Capital, Inc., a publicly traded business development company managed by The Tokarz Group Advisers LLC; and HuaMei Capital founders. The Company accounts for its investment in HuaMei under the equity method of accounting.
Marketable securities owned, Other investments, excluding investment in HuaMei Capital Company, Inc., and Marketable securities sold, but not yet purchased, are stated at fair value, with related changes in unrealized appreciation or depreciation reflected in the line item Principal transactions in the accompanying Consolidated Statements of Operations.
Fair value of the Company’s financial instruments is generally obtained from quoted market prices, broker or dealer price quotations, or alternative pricing methodologies that the Company believes offer reasonable levels of price transparency. To the extent that certain financial instruments trade infrequently or are non-marketable securities and, therefore, do not have readily determinable fair values, the Company estimates the fair value of these instruments using various pricing models and the information available to the Company that it deems most
99
Table of Contents
relevant. Among the factors considered by the Company in determining the fair value of financial instruments are discounted anticipated cash flows, the cost, terms and liquidity of the instrument, the financial condition, operating results and credit ratings of the issuer or underlying company, the quoted market price of publicly traded securities with similar duration and yield, the Black-Scholes Options Valuation methodology adjusted for active market and other considerations on a case-by-case basis and other factors generally pertinent to the valuation of financial instruments.
Marketable securities owned and securities sold, but not yet purchased, consist of U.S. listed and over-the-counter (“OTC”) equity securities. Other investments consist principally of investments in private investment funds managed by the Company or its affiliates and an investment in a private investment fund managed by a third party. Such investments held by non-broker-dealer entities are accounted for under the equity method based on the Company’s share of the earnings (or losses) of the investee. The financial position and operating results of the private investment funds are generally determined on an estimated fair value basis as set forth in the AICPA Audit and Accounting Guide : Investment Companies. Generally, securities are valued (i) at their last published sale price if they are listed on an established exchange or (ii) if last sales prices are not published, at the highest closing “bid” price (for securities held “long”) and the lowest closing “asked” price (for “short” positions) as recorded by the composite tape system or such principal exchange, as the case may be. Where the general partner determines that market prices or quotations do not fairly represent the value of a security in the investment fund’s portfolio (for example, if a security is a restricted security of a class that is publicly traded) the general partner may assign a different value. The general partner will determine the estimated fair value of any assets that are not publicly traded.
Also included in other investments are convertible preferred stock of NYMT, and warrants on public and private common stock. The investment in NYMT convertible preferred stock is based on a fair value estimate using the Black-Scholes credit adjusted valuation model on Bloomberg. The warrants on public and private common stock are generally received as a result of investment banking transactions and are valued at estimated fair value as determined by management. Warrants owned are valued at the date of issuance and marked-to-market as of each reporting period. Estimated fair value is determined using the Black-Scholes Options Valuation methodology adjusted for active market and other considerations on a case-by-case basis.
The Company follows the authoritative guidance included in GAAP on the fair value option which provides companies with an option to report selected financial assets and financial liabilities at fair value. The election to use the fair value option is available at specified election dates, such as when an entity first recognizes a financial asset or financial liability or upon entering into a firm commitment. Subsequent changes in fair value must be recorded in the Consolidated Statements of Operations. We elected to apply the fair value option to our investments in NYMT convertible preferred and common stock. The primary reason for electing the fair value option was to measure these investments on the same basis as our other equity securities, all of which are stated at fair value.
Dividends received during the years ended December 31, 2009 and 2008 on NYMT stock of $1.9 million and $1.8 million, respectively, were recorded in net dividend income on our Consolidated Statements of Operations. For the years ended December 31, 2009 and 2008, the Company recorded unrealized gains of $5.6 million and unrealized loss of $6.5 million, respectively, on the above investments in NYMT primarily due to the improved performance of NYMT’s stock during the period. The unrealized gains on our investments in NYMT are reported in Principal Transactions in the Consolidated Statements of Operations.
Loans Held for Investment
Loans held for investment are carried at their unpaid principal balance, net of any allowance for credit losses or deferred loan origination or commitment fees. For loans held for investment, we establish and maintain an allowance for credit losses based on management’s estimate of credit losses in our loans as of each reporting date. The Company records the allowance against loans held for investment on a specific identification basis.
100
Table of Contents
Loans are charged off against the reserve for credit losses if the principal is deemed not recoverable within a reasonable timeframe. Loan origination and commitment fees are deferred and recognized into Interest income in the Consolidated Statements of Operations over the life of the related loan. The Company does not accrue interest on loans which are in default for more than 90 days and loans which we expect full principal payments may not be received.
Loans Collateralizing Asset-Backed Securities Issued
Loans collateralizing asset-backed securities issued are commercial loans securitized and owned by the Cratos CLO. Loans acquired through the acquisition and resulting consolidation of Cratos were recorded at their fair value as of the acquisition date. Any unamortized deferred fees or costs related to the loans that existed prior to the acquisition were written off at that date.
For those loans deemed impaired as of the date of the acquisition, the total discount from outstanding principal balance to fair value consists of a nonaccretable credit discount and in most cases an accretable liquidity (or market value) discount. For the remaining loans acquired through the purchase of Cratos, any discounts to fair value were recorded as accretable liquidity discounts as they were not attributable to credit quality. For both types of loans, the accretable portion of the discount is recognized into interest income as an adjustment to the yield of the loan over the contractual life of the loan using the interest method.
The Company continues to estimate the cash flows expected to be collected over the life of the loans acquired through the purchase of Cratos. If, upon subsequent evaluation, the Company believes it is unable to collect all cash flows expected at the acquisition date plus additional cash flows expected to be collected arising from changes in the estimate after the acquisition, the loan is considered impaired. Loans considered impaired at the acquisition date of Cratos continue to be assessed in accordance with the authoritative guidance under GAAP on loan impairment. If based on current information and events, it is probable that there is a significant increase in cash flows previously expected to be collected or if actual cash flows are significantly greater than cash flows previously expected, the Company will first reduce any remaining credit discounts (including allowances for loan losses) and, to the extent necessary, any liquidity discounts for the loans established after its acquisition for the increase in the present value of cash flows expected to be collected. Then the Company will recalculate the amount of accretable yield for the loan as the excess of the revised cash flows expected to be collected over the sum of (a) the initial investment less (b) cash collected less (c) write-downs plus (d) amount of yield accreted to date. The Company will adjust the amount of accretable yield by reclassification from nonaccretable discount. The adjustment is accounted for as a change in estimate, with the amount of periodic accretion adjusted over the remaining life of the loan. The resulting yield is then used as the effective interest rate in any subsequent accounting.
Loans purchased or originated after the acquisition date of Cratos are stated at the principal amount outstanding net of deferred fees, deferred costs and the allowance for loan losses. Net deferred fees or costs are recognized as an adjustment to interest income over the contractual life of the loans using the interest method. Remaining amounts are recognized into income when the related loans are paid off or sold. Any discount from principal amount of purchased loans is accreted into interest income as a yield adjustment over the contractual life of the loan.
The accrual of interest on loans is discontinued when principal or interest payments are 90 days or more past due or when, in the opinion of management, reasonable doubt exists as to the full collection of principal and/or interest. When loans are placed on nonaccrual status, all interest previously accrued but not collected is reversed against current period interest income. Any reversals of income from previous years are recorded against the allowance for loan losses. When the Company receives a cash interest payment on a non-accrual loan, it is applied as a reduction of the principal balance. Non-accrual loans are returned to accrual status when the borrower becomes current as to principal and interest and has demonstrated a sustained period of payment performance. The amortization of loan fees is discontinued on nonaccrual loans and may be considered for write-off. Depending on the terms of the loan, a fee may be charged upon a prepayment which is recognized in the period of the prepayment. Syndication and structuring fees are recognized in the period the service is completed as other income.
101
Table of Contents
Allowance for Loan Losses
The Company maintains an allowance for loan losses that is intended to estimate loan losses inherent in its loan portfolio. A provision for loan losses is charged to expense to establish the allowance for loan losses. The allowance for loan losses is maintained at a level, in the opinion of management, sufficient to off set estimated losses inherent in the loan portfolio as of the date of the financial statements. The appropriateness of the allowance and the allowance components are reviewed quarterly. The Company’s estimate of each allowance component is based on observable information and on market and third party data that the Company believes are reflective of the underlying loan losses being estimated.
The Company provides an allowance for loans that are considered impaired. A loan is considered impaired when it is probable that the Company will be unable to collect all amounts due according to the contractual terms of the loan agreement. The Company measures impairment of a loan based upon either the present value of expected future cash flows discounted at the loan’s effective interest rate, the loan’s observable market price or the fair value of the collateral securing the loan if the loan is collateral dependent, depending on the circumstances and the Company’s collection strategy. For those loans held by Cratos at the date of acquisition by JMP Credit, and deemed impaired at that date or a subsequent date, allowance for loan losses is calculated considering two further factors. For loans deemed impaired at the date of acquisition if there is a further decline in expected future cash flows, this reduction is recognized as a specific reserve in the current quarter in accordance with above. For those loans deemed impaired subsequent to the acquisition date, if the net realizable value is lower than the current carrying value then the carrying value is reduced and the difference is booked as provision for loan losses. If the total discount from unpaid principal balance to carrying value is larger than the expected loss at the date of assessment, no provision for loan losses is recognized.
In addition, the Company provides an allowance on a loan by loan basis at JMP Credit that were purchased after the Cratos acquisition. The Company employs internally developed and third party estimation tools for measuring credit risk (loan ratings, probability of default, and exposure at default), which are used in developing an appropriate allowance for loan losses. The Company performs periodic detailed reviews of its loan portfolio to identify risks and to assess the overall collectibility of loans.
Loans which are deemed to be uncollectible are charged off and the charged-off amount is deducted from the allowance.
Asset-Backed Securities Issued
Asset-backed securities (“ABS”) represent securities issued to third parties from the CLO when the CLO structure formed in 2007. The Company consolidates the CLO for financial reporting purposes as of the April 7, 2009 acquisition date. At the acquisition date, the ABS were recorded at fair value which comprised principal balance outstanding less liquidity discount. The liquidity discount will be amortized into interest expense over the expected remaining lives of the ABS using the interest method.
Fixed Assets
Fixed assets represent furniture and fixtures, computer and office equipment, certain software costs and leasehold improvements, which are stated at cost less accumulated depreciation and amortization. Depreciation is computed on the straight-line basis over the estimated useful lives of the respective assets, ranging from three to five years.
Leasehold improvements are capitalized and amortized over the shorter of the respective lease terms or the estimated useful lives of the improvements.
The Company capitalizes certain costs of computer software developed or obtained for internal use and amortizes the amount over the estimated useful life of the software, generally not exceeding three years.
102
Table of Contents
Income Taxes
The Company recognizes deferred tax assets and liabilities based upon the temporary differences between the financial reporting and tax bases of its assets and liabilities. Valuation allowances are established when necessary to reduce the deferred tax assets when it is more likely than not that a portion or all of the deferred tax assets will not be realized.
The Company adopted the accounting principles related to uncertainty in income taxes on May 16, 2007, the date the Company became subject to federal and state income taxes. Its adoption did not have a material impact on the Company’s financial condition or results of operations. Under the guidance, the Company recognizes a tax benefit from an uncertain position only if it is more likely than not that the position is sustainable, based solely on its technical merits and consideration of the relevant taxing authority’s widely understood administrative practices and precedents. If this threshold is met, the Company measures the tax benefit as the largest amount of benefit that is greater than fifty percent likely of being realized upon ultimate settlement.
Stock-Based Compensation
The Company recognizes compensation cost for stock-based awards at their fair value on the date of grant and records compensation expense over the service period for awards expected to vest. Such grants are recognized as expense, net of estimated forfeitures.
Stock-based compensation includes restricted stock units and stock options granted under the Company’s 2007 Equity Incentive Plan, and stock options granted under the Company’s 2004 Equity Incentive Plan.
In accordance with generally accepted valuation practices for stock-based awards issued as compensation, the Company uses the Black-Scholes option-pricing model to calculate the fair value of option awards, although such models were originally developed to estimate the fair value of freely tradable, fully transferable options without vesting restrictions, which significantly differ from the Company’s stock options and restricted stock units. The Black-Scholes model requires subjective assumptions regarding variables such as future stock price volatility, dividend yield and expected time to exercise, which greatly affect the calculated values.
Treasury Stock
The Company accounts for treasury stock under the cost method, using an average cost flow assumption, and includes treasury stock as a component of shareholders’ equity.
Reclassification
Certain balances from prior years have been reclassified in order to conform to the current year presentation. The reclassifications had no impact on the Company’s financial position, net income or cash flows. Please see Note 23 for the effect of reclassifications on segments.
3. Recent Accounting Pronouncements
Accounting Standards Update (“ASU”) 2010-06, Fair Value Measurements and Disclosures (Topic 820): Improving Disclosures about Fair Value Measurements. In January 2010, the Financial Accounting Standards Board (the “FASB”) issued ASU 2010-06 which provides amendments to ASC Subtopic 820-10 that will provide more robust disclosures about (1) the different classes of assets and liabilities measured at fair value, (2) the valuation techniques and inputs used, (3) the activity in Level 3 fair value measurements, and (4) the transfers between Levels 1, 2, and 3. ASU 2010-06 is effective for annual and interim periods beginning after December 15, 2009, except for the requirement to provide the Level 3 activity on a gross basis which is effective for annual periods beginning after December 15, 2010 and for interim periods within those fiscal years. The Company will adopt ASU 2010-06 in the first quarter of 2010. The Company does not expect the adoption to have a material impact on our consolidated financial position or results of operations.
103
Table of Contents
ASU 2010-02, Consolidation (Topic 810): Accounting and Reporting of Decreases in Ownership of a Subsidiary – a Scope Clarification. In January 2010, the FASB issued ASU 2010 which provides amendments to ASC Subtopic 810-10 and related guidance within U.S. GAAP to clarify the scope of the decrease in ownership provisions of the Subtopic and related guidance. The amendments in this ASU also clarify that the decrease in ownership guidance does not apply to certain transactions even if they involve businesses. ASU 2010-02 is effective beginning in the period an entity adopts Statements of Financial Accounting Standards (“SFAS”) No. 160 (now included in Subtopic 810-10). The Company adopted SFAS No. 160 on January 1, 2009, and therefore applied the amendments in ASU 2010-02 retrospectively to the first quarter of 2009. The Company’s adoption of ASU 2010-02 did not impact on our consolidated financial position or results of operations.
ASU 2009-17, Consolidation (Topic 810): Improvements to Financial Reporting by Enterprises Involved in Variable Interest Entities. In December 2009, the FASB issued ASU 2009-17 which amends the FASB Accounting Standards Codification for the issuance of SFAS No. 167, Amendments to FASB Interpretation No. 46(R). The amendments in this ASU replace the quantitative-based risks and rewards calculation for determining which reporting entity, if any, has a controlling financial interest in a variable interest entity with an approach focused on identifying which reporting entity has the power to direct the activities of a variable interest entity that most significantly impact the entity’s economic performance and (1) the obligation to absorb losses of the entity or (2) the right to receive benefits from the entity. ASU 2009-17 is effective for annual and interim periods beginning after November 15, 2009. The Company will adopt ASU 2009-17 in the first quarter of 2010. The Company does not expect the adoption to have a material impact on our consolidated financial position or results of operations.
ASU 2009-16, Transfers and Servicing (Topic 860): Accounting for Transfers of Financial Assets. In December 2009, the FASB issued ASU 2009-16 which amends the FASB Accounting Standards Codification for the issuance of SFAS No. 166, Accounting for Transfers of Financial Assets—an amendment of FASB Statement No. 140. The amendments in this ASU improve financial reporting by eliminating the exceptions for qualifying special-purpose entities from the consolidation guidance and the exception that permitted sale accounting for certain mortgage securitizations when a transferor has not surrendered control over the transferred financial assets. In addition, the amendments require enhanced disclosures about the risks that a transferor continues to be exposed to because of its continuing involvement in transferred financial assets. Comparability and consistency in accounting for transferred financial assets will also be improved through clarifications of the requirements for isolation and limitations on portions of financial assets that are eligible for sale accounting. ASU 2009-16 is effective for annual and interim periods beginning after November 15, 2009. The Company will adopt ASU 2009-16 in the first quarter of 2010. The Company does not expect the adoption to have a material impact on our consolidated financial position or results of operations.
ASU 2009-12, Fair Value Measurements and Disclosures (Topic 820): Investments in Certain Entities that Calculate Net Asset Per Share (or Equivalent). In September 2009, the FASB issued ASU 2009-12 which amends ASC Subtopic 820-10, Fair Value Measurements and Disclosures—Overall, to provide guidance on the fair value measurement of investments in certain entities that calculate net asset value per share (or its equivalent). ASU 2009-12 is effective for annual and interim periods ending after December 15, 2009. The Company adopted ASU 2009-12 in the fourth quarter of 2009. The Company’s adoption of ASU 2009-12 did not have a material impact on our consolidated financial position or results of operations.
4. Acquisition
Effective April 7, 2009, the Company, through its majority-owned indirect subsidiary JMP Credit, completed the acquisition of 100% of the membership interests of Cratos Capital Partners, LLC and its subsidiaries, including Cratos Capital Management, LLC (collectively, “Cratos”), an alternative asset manager of collateralized loan obligations, together with 100% of the subordinated securities of Cratos CLO I, Ltd. (the “CLO”). The results of operations of Cratos from April 7, 2009 to December 31, 2009 have been included in the statement of operations of the Company for the year ended December 31, 2009. The CLO was, at the acquisition
104
Table of Contents
date, a diversified portfolio of approximately $467.0 million par amount of first lien corporate loans for which Cratos serves as investment adviser. The Company acquired control of Cratos through acquiring Cratos Capital Partners LLC (which holds the subordinated securities) with the intent of expanding its business in alternative asset management.
The acquisition was accounted for under the acquisition method of accounting, which requires the purchase price to be allocated to assets and liabilities based on their estimated fair value at the acquisition date. The excess of the value of the net assets acquired over the purchase price was recorded as a gain on bargain purchase and is shown as a separate component of revenues in the Company’s Consolidated Statement of Operations. The following table represents the allocation of the purchase price to the acquired net assets and resulting gain on bargain purchase:
| Amount of cash paid |
$ | 4,000,000 | ||
| Fair value of contingent consideration (1) |
2,253,944 | |||
| Discount on noncontrolling interest |
73,705 | |||
| Total purchase price |
6,327,649 | |||
| Allocation of the purchase price |
||||
| Cratos member’s deficit |
(13,595,538 | ) | ||
| Pre-tax adjustments to reflect assets and liabilities at fair value: |
||||
| Loans collateralizing asset-backed securities issued |
(113,224,756 | ) | ||
| Fixed assets |
(34,252 | ) | ||
| Deferred financing costs |
(6,881,314 | ) | ||
| Other assets |
(54,916 | ) | ||
| Accrued interest payable |
7,180 | |||
| Asset -backed securities issued |
138,399,679 | |||
| Pre-tax total adjustments |
18,211,621 | |||
| Deferred income taxes |
(581,172 | ) | ||
| After tax total adjustments |
17,630,449 | |||
| Other acquisition adjustments |
||||
| Contingent liability to seller (1) |
(2,253,944 | ) | ||
| Working capital line payoff |
5,799,666 | |||
| Noncontrolling interest at fair value |
(73,705 | ) | ||
| Fair value of net assets acquired |
7,506,928 | |||
| Bargain purchase gain resulting from Cratos acquisition |
$ | (1,179,279 | ) | |
| (1) | Contingent consideration / liability to seller—JMP Credit issued a $3.0 million zero-coupon note to one of the previous owners of Cratos. The note was payable only from the first $3.0 million of cash flows derived from the subordinated notes held by JMP Credit. The note was recorded at its fair value of $2.3 million as of the acquisition date with the difference from the face value of $0.7 million recorded as a liquidity discount on the acquisition date. The liquidity discount was amortized into interest expense over the expected life of the note which is the sole component of interest expense related to the zero-coupon note. On December 29, 2009, JMP Credit repurchased the note for $1.8 million, which is at a discount to the carrying value resulting in a gain of $0.5 million. The Company recorded interest expense on the note of $0.1 million for the year ended December 31, 2009. |
105
Table of Contents
The following condensed statement of net assets acquired reflects the fair values assigned to the assets and liabilities of Cratos as of the acquisition date:
| Assets: |
|||
| Cash and cash equivalents |
$ | 1,910,523 | |
| Restricted cash and deposits |
44,359,080 | ||
| Loans collateralizing asset-backed securities issued |
280,499,632 | ||
| Interest receivable |
1,136,896 | ||
| Deferred tax asset |
50,121,928 | ||
| Other assets |
254,387 | ||
| Total assets |
$ | 378,282,446 | |
| Liabilities: |
|||
| Asset-backed securities issued |
$ | 316,513,000 | |
| Interest payable |
1,209,588 | ||
| Other liabilities |
2,349,830 | ||
| Deferred tax liability |
50,703,100 | ||
| Total liabilities |
$ | 370,775,518 | |
| Net assets acquired, at fair value |
$ | 7,506,928 |
The following unaudited pro forma condensed combined statements of income present the combined results of the Company’s operations with Cratos as if the acquisition had occurred on January 1, 2008.
| Year Ended December 31, | |||||||
| 2009 | 2008 | ||||||
| Pro forma revenues |
$ | 148,417,525 | $ | 35,937,817 | |||
| Pro forma net income |
9,006,948 | (36,555,764 | ) | ||||
| Pro forma net income per share—basic |
$ | 0.43 | $ | (1.81 | ) | ||
| Pro forma net income per share—diluted |
$ | 0.41 | $ | (1.81 | ) | ||
In the unaudited pro forma results, amortization of liquidity discounts on loans collateralizing asset-backed securities issued and on asset-backed securities issued (which were recognized at the acquisition date) has been recorded into pro forma revenues from January 1, 2008. In addition the gain on bargain purchase upon the acquisition was reflected as if it occurred in the first quarter of 2008 pro forma revenues.
5. Marketable Securities and Other Investments
Other Investments at Fair Value
Fair value is the price that would be received to sell an asset or paid to transfer a liability in an orderly transaction between market participants at the measurement date. In determining fair value, the Company uses various methods including market, income and cost approaches. Based on these approaches, the Company often utilizes certain assumptions that market participants would use in pricing the asset or liability, including assumptions about risk and or the risks inherent in the inputs to the valuation technique. These inputs can be readily observable, market corroborated, or generally unobservable firm inputs. The Company utilizes valuation techniques that maximize the use of observable inputs and minimize the use of unobservable inputs. Based on the observability of the inputs used in the valuation techniques, the Company provides the following information according to the fair value hierarchy. The fair value hierarchy ranks the quality and reliability of the information used to determine fair values. Financial instrument assets and liabilities carried at fair value have been classified and disclosed in one of the following three categories:
| Level 1 | Quoted market prices in active markets for identical assets or liabilities. | |
| Level 2 | Observable market based inputs or unobservable inputs that are corroborated by market data. | |
| Level 3 | Unobservable inputs that are not corroborated by market data. | |
106
Table of Contents
Level 1 primarily consists of financial instruments whose value is based on quoted market prices such as U.S. listed and OTC equity securities, as well as quasi-government agency securities, all of which are carried at fair value.
Level 2 includes those financial instruments that are valued using models or other valuation methodologies. These models are primarily industry-standard models that consider various assumptions, including discounted anticipated cash flows, the cost, terms and liquidity of the instrument, the financial condition, operating results and credit ratings of the issuer or underlying company, the quoted market price of publicly traded securities with similar duration and yield, time value, yield curve, prepayment speeds, default rates, loss severity, as well as other measurements. Substantially all of these assumptions are observable in the marketplace, can be derived from observable data or are supported by observable levels at which transactions are executed in the marketplace. Included in this category is the general partner investment in hedge funds, where the underlying hedge funds are mainly invested in publicly traded stocks whose value is based on quoted market prices.
Level 3 is comprised of financial instruments whose fair value is estimated based on internally developed models or methodologies utilizing significant inputs that are generally less readily observable from objective sources. A description of the valuation techniques utilized for the fair value of the financial instruments in this category is as follows:
| • | General partner investment in funds of funds and limited partner investment in mortgage and private equity fund: determined by net asset value provided by third party general partners; |
| • | Investment in NYMT convertible preferred stock: determined by the Company using the Black-Scholes credit adjusted valuation model on Bloomberg; |
| • | Warrants: determined by the Company using the Black-Scholes Options Valuation model, and |
| • | Equity securities: LSC investment in private companies, determined by the Company using comparable public company metrics discounted for private company market illiquidity. |
At each reporting period, all assets and liabilities for which the fair value measurement is based on significant unobservable inputs are classified as “Level 3.”
The following tables provide fair value information related to the Company’s financial assets and liabilities at December 31, 2009 and 2008:
| Assets at Fair Value as of December 31, 2009 | ||||||||||||
| Level 1 | Level 2 | Level 3 | Total | |||||||||
| Financial instruments owned, at fair value: |
||||||||||||
| Marketable securities owned: |
||||||||||||
| Equity securities |
$ | 5,899,446 | $ | — | $ | — | $ | 5,899,446 | ||||
| Total marketable securities owned |
$ | 5,899,446 | $ | — | $ | — | $ | 5,899,446 | ||||
| Other investments: |
||||||||||||
| General partner investment in hedge funds |
$ | — | $ | 33,313,171 | $ | — | $ | 33,313,171 | ||||
| General partner investment in funds of funds |
— | — | 2,932,534 | 2,932,534 | ||||||||
| Total general partner investment in funds |
— | 33,313,171 | 2,932,534 | 36,245,705 | ||||||||
| Limited partner investment in private equity fund |
— | — | 2,475,907 | 2,475,907 | ||||||||
| Limited partner investment in mortgage fund |
— | — | 1,147,417 | 1,147,417 | ||||||||
| Investment in NYMT convertible preferred stock |
— | — | 15,000,000 | 15,000,000 | ||||||||
| Private equity securities |
— | — | 2,320,953 | 2,320,953 | ||||||||
| Total other investments |
$ | — | $ | 33,313,171 | $ | 23,876,811 | $ | 57,189,982 | ||||
107
Table of Contents
| Assets at Fair Value as of December 31, 2008 | ||||||||||||
| Level 1 | Level 2 | Level 3 | Total | |||||||||
| Financial instruments owned, at fair value: |
||||||||||||
| Marketable securities owned: |
||||||||||||
| Equity securities |
$ | 11,976,235 | $ | — | $ | — | $ | 11,976,235 | ||||
| Quasi-government agency securities |
7,862,245 | — | — | 7,862,245 | ||||||||
| Total marketable securities owned |
$ | 19,838,480 | $ | — | $ | — | $ | 19,838,480 | ||||
| Other investments: |
||||||||||||
| General partner investment in hedge funds |
$ | — | $ | 29,766,076 | $ | — | $ | 29,766,076 | ||||
| General partner investment in funds of funds |
— | — | 3,678,073 | 3,678,073 | ||||||||
| Total general partner investment in funds |
— | 29,766,076 | 3,678,073 | 33,444,149 | ||||||||
| Limited partner investment in private equity fund |
— | — | 2,516,115 | 2,516,115 | ||||||||
| Investment in NYMT convertible preferred stock |
— | — | 11,686,650 | 11,686,650 | ||||||||
| Warrants |
— | — | 307,341 | 307,341 | ||||||||
| Total other investments |
$ | — | $ | 29,766,076 | $ | 18,188,179 | $ | 47,954,255 | ||||
| Liabilities at Fair Value as of December 31, 2009 | ||||||||||||
| Level 1 | Level 2 | Level 3 | Total | |||||||||
| Financial instruments sold, but not yet purchased, at fair value: |
||||||||||||
| Marketable securities sold, but not yet purchased |
$ | 1,047,461 | $ | — | $ | — | $ | 1,047,461 | ||||
| Liabilities at Fair Value as of December 31, 2008 | ||||||||||||
| Level 1 | Level 2 | Level 3 | Total | |||||||||
| Financial instruments sold, but not yet purchased, at fair value: |
||||||||||||
| Marketable securities sold, but not yet purchased |
$ | 5,677,683 | $ | — | $ | — | $ | 5,677,683 | ||||
The following tables provide a reconciliation of the beginning and ending balances for the assets at fair value using significant unobservable inputs (Level 3) for the years ended December 31, 2009 and 2008:
| Balance as of December 31, 2008 |
Purchases/ (sales), net |
Total gains (losses)— realized and unrealized |
Transfers in/(out) of Level 3 |
Balance as of December 31, 2009 |
Unrealized gains/(losses) included in earnings related to assets still held at reporting date |
|||||||||||||||||
| General partner investment in funds of funds |
$ | 3,678,073 | $ | (1,026,525 | ) | $ | 280,985 | $ | — | $ | 2,932,533 | $ | 254,460 | |||||||||
| Limited partner investment in private equity fund |
2,516,115 | (71,600 | ) | 31,392 | — | 2,475,907 | 62,505 | |||||||||||||||
| Limited partner investment in mortgage fund |
— | (1,050,583 | ) | 198,000 | 2,000,000 | (3) | 1,147,417 | 115,023 | ||||||||||||||
| Investment in NYMT convertible preferred stock |
11,686,650 | 655,600 | (1) | 2,657,750 | — | 15,000,000 | 2,657,750 | |||||||||||||||
| Warrants |
307,341 | 73,506 | (380,847 | ) | — | — | — | |||||||||||||||
| Private equity securities |
— | 2,434,953 | (2) | (114,000 | ) | — | 2,320,953 | (114,000 | ) | |||||||||||||
| Total Level 3 assets |
$ | 18,188,179 | $ | 1,015,351 | $ | 2,673,280 | $ | 2,000,000 | $ | 23,876,810 | $ | 2,975,738 | ||||||||||
| (1) | Investment in NYMT convertible preferred stock held by JMPRT at December 31, 2008 of $7.8 million was removed from the Company’s assets in connection with the transfer of JMPRT assets and liabilities to HMOP effective January 2, 2009. The Company did not consolidate HMOP in its consolidated financial statements from January 2, 2009 through April 30, 2009. Effective May 1, 2009, the Company consolidates HMOP in its consolidated financial statements. As a result, the investment in NYMT convertible preferred stock held by HMOP was added to the Company’s assets at the fair value of $8.5 million as of May 1, 2009 and is included in the Company’s Level 3 assets as of December 31, 2009. |
108
Table of Contents
| (2) | On July 31, 2009, the Company received 100% of the membership interest in LSC III, LLC (“LSC”) in full satisfaction of a $2.4 million non-revolving credit note. LSC is an investment partnership and owns shares of common and preferred stock of two privately-held companies which had an aggregate fair value of $2.4 million at July 31, 2009. The Company is the sole member of LSC and therefore has a controlling financial interest in LSC. As a result, the Company consolidates LSC in its consolidated financial statements effective July 31, 2009. The two investments owned by LSC were recorded at fair value as of July 31, 2009 and are included in the Company’s Level 3 assets as of December 31, 2009. |
| (3) | In the third quarter of 2009, the Company’s limited partner investment in a mortgage fund was transferred from Level 2 to Level 3 within the fair value hierarchy due to reduced observability of the inputs used to value the fund’s underlying investments. |
| Balance as of December 31, 2007 |
Purchases/ (sales), net |
Total gains (losses)— realized and unrealized |
Transfers in/(out) of Level 3 |
Balance as of December 31, 2008 |
Unrealized gains/(losses) included in earnings related to assets still held at reporting date |
|||||||||||||||
| General partner investment in funds of funds |
$ | 4,460,971 | $ | — | $ | (782,898 | ) | $ | — | $ | 3,678,073 | $ | (782,898 | ) | ||||||
| Limited partner investment in private equity fund |
2,282,582 | 205,600 | 27,933 | — | 2,516,115 | 27,933 | ||||||||||||||
| Investment in NYMT convertible preferred stock |
— | 15,000,000 | (3,313,350 | ) | — | 11,686,650 | (3,313,350 | ) | ||||||||||||
| Warrants |
300,503 | — | 6,838 | — | 307,341 | 6,838 | ||||||||||||||
| Total Level 3 assets |
$ | 7,044,056 | $ | 15,205,600 | $ | (4,061,477 | ) | $ | — | $ | 18,188,179 | $ | (4,061,477 | ) | ||||||
Total gains and losses represent the total gains and/or losses (realized and unrealized) recorded for the Level 3 assets and are reported in Principal Transactions in the accompanying Consolidated Statements of Operations.
Purchases/sales represent the net amount of Level 3 assets that were either purchased or sold during the period. The amounts were recorded at fair value at the date of the transaction.
Net transfers in/out of Level 3 represent existing financial assets that were previously categorized at a higher level. Transfers into or out of Level 3 result from changes in the observability of fair value inputs used in determining fair values for different types of financial assets.
The amount of unrealized gains and losses included in earnings attributable to the change in unrealized gains and losses relating to Level 3 assets still held at the end of the period were reported in Principal Transactions in the accompanying Consolidated Statements of Operations. The change in unrealized gains and losses are partially offset by realized gains and losses during the period.
Included in other investments are investments in partnerships in which one of the Company’s subsidiaries is the investment manager and general partner. The Company accounts for these investments using the equity method as described in Note 2. The Company’s proportionate share of those investments is included in the table above. In addition, other investments include warrants, and two investments in funds managed by third parties.
6. Loans Held for Investment
Loans held for investment at December 31, 2009 is comprised of principal investments in the form of two loan notes and advances on one non-revolving credit note commitment. At December 31, 2008, loans held for investment was comprised of principal investments in the form of two loan notes and advances on two non-revolving credit note commitments.
109
Table of Contents
Loan notes include a participation interest in a loan made by JMPRT to a client during 2007. The loan is collateralized by real estate related assets, and bears interest at the rate of 20.0% per annum, payable monthly in arrears. The principal of the loan was due and payable on December 1, 2007, but was extended until September 2008 for an additional fee at the borrower’s option and in connection with a partial repayment. At September 30, 2008, the loan balance of $855,763 was in default and the Company recorded a loan loss provision of $427,882 in the third quarter of 2008 and $100,000 in the fourth quarter of 2009. Recovery of the loan is being sought through bankruptcy court proceedings from which the Company believes it will be able to recover at the net realizable value of the loan.
In addition, in the third quarter of 2008, the Company made a $4.2 million loan to a private commercial mortgage originator in the form of a note and warrants. The loan was placed on non-accrual status on April 1, 2009. Accordingly, the interest payments of $0.2 million received subsequent to that date were applied to the principal balance, reducing the outstanding principal balance to $4.0 million at December 31, 2009. The loan was recorded net of loan loss reserves of $3.8 million and $2.4 million at December 31, 2009 and 2008, respectively, and a deferred loan fee of $0.2 million at both December 31, 2009 and 2008.
The Company had also advanced as of December 31, 2008 an aggregate of $3.8 million on two non-revolving credit note commitments with an original aggregate amount of $7.0 million. In July 2009, one of the two non-revolving credit notes matured. As of the maturity date, the net carrying value of the credit was $2.4 million. As permitted by the terms of the credit agreement, at maturity, the borrower conveyed collateral to the Company in full satisfaction of the credit note. The collateral received was the membership interest in LSC III, LLC (see Note 5). As of December 31, 2009, the Company had a $1.3 million advance on a $2.0 million original commitment, $0.7 million of which expired in October 2009. The advance bears interest at rate of 16.0% per annum and is due in 2011. As of December 31, 2009, the Company had no remaining credit commitments.
The loan notes and non-revolving credit note commitments bear interest at rates from 15.0% to 20.0% per annum with maturity dates ranging from current to four years. At December 31, 2009 and December 31, 2008, $4.8 million and $3.4 million of the aggregate amount of loans held for investment were on non-accrual status, respectively.
The following table presents components of loans held for investment, net on the Consolidated Statements of Financial Condition at December 31, 2009 and December 31, 2008:
| December 31, 2009 | December 31, 2008 | |||||||
| Loans held for investment |
$ | 6,057,418 | $ | 8,812,533 | ||||
| Allowance for loan losses |
(4,285,365 | ) | (2,896,149 | ) | ||||
| Deferred loan fees |
(180,017 | ) | (190,517 | ) | ||||
| Total loans held for investment, net |
$ | 1,592,036 | $ | 5,725,867 | ||||
A summary of the activity in the allowance for loan losses for the year ended December 31, 2009 and 2008 was as follows:
| Year Ended December 31, | ||||||||
| 2009 | 2008 | |||||||
| Balance at beginning of period |
$ | (2,896,149 | ) | $ | — | |||
| Provision for loan losses |
(1,439,216 | ) | (2,896,149 | ) | ||||
| Loans charged off, net of recoveries |
50,000 | — | ||||||
| Balance at end of period |
$ | (4,285,365 | ) | $ | (2,896,149 | ) | ||
The Company determined the fair value of loans held for investment to be $1.7 million and $6.0 million as of December 31, 2009 and December 31, 2008 respectively, using anticipated cash flows, discounted at an appropriate market credit adjusted interest rate.
110
Table of Contents
7. Loans Collateralizing Asset-backed Securities Issued
Loans collateralizing asset-backed securities issued are commercial loans securitized and owned by the Cratos CLO. The loans consist of those loans within the CLO securitization structure at the acquisition date of Cratos and loans purchased or originated into the CLO subsequent to the Cratos acquisition date. The following table presents the components of loans collateralizing asset-backed securities issued, net at December 31, 2009:
| December 31, 2009 | ||||
| Loans collateralizing asset-backed securities |
$ | 461,459,727 | ||
| Allowance for loan losses |
(1,994,328 | ) | ||
| Liquidity discount |
(91,543,852 | ) | ||
| Credit discount |
(35,105,261 | ) | ||
| Deferred loan fees, net |
(4,849,292 | ) | ||
| Total loans collateralizing asset-backed securities, net |
$ | 327,966,994 | ||
A loan is considered to be impaired when, based on current information, it is probable that the Company will be unable to collect all amounts due in accordance with the contractual terms of the original loan agreement, including scheduled principal and interest payments. There were $74.4 million of impaired loans as of December 31, 2009, with allocated specific reserves of $1.6 million and credit discount of $35.1 million. In addition, the Company evaluates pools of homogeneous loans based on portfolio classification and risk assessment to determine the inherent loss in these portfolios. Based on such evaluation, we recorded pooled reserves of $0.4 million during the year ended December 31, 2009 on loans purchased into the CLO subsequent to the Cratos acquisition.
A summary of the activity in the allowance for loan losses for the year ended December 31, 2009 is as follows:
| Year Ended December 31, 2009 |
||||
| Balance at beginning of period |
$ | — | ||
| Provision for loan losses: |
||||
| Specific reserve |
(3,969,224 | ) | ||
| Pooled reserve |
(412,968 | ) | ||
| Reversal due to sale, payoff or repayment of loans |
2,387,864 | |||
| Balance at end of period |
$ | (1,994,328 | ) | |
111
Table of Contents
Loans recorded upon the acquisition of Cratos at fair value reflect a liquidity discount and a credit discount. In addition, most loans purchased subsequent to the acquisition were purchased at discount to their principal value, reflecting deferred loan fees. The tables below summarize the activity in the loan principal, liquidity discount, credit discount and deferred fees for the impaired loans and non-impaired loans for the year ended December 31, 2009:
Impaired loans:
| Year Ended December 31, 2009 | ||||||||||||||||||||
| Principal | Allowance for Loan Losses |
Liquidity Discount |
Credit Discount |
Carrying Value, Net |
||||||||||||||||
| Balance at beginning of period |
$ | — | $ | — | $ | — | $ | — | $ | — | ||||||||||
| Cratos acquisitions (April 7, 2009) |
96,466,473 | — | (18,599,270 | ) | (51,492,789 | ) | 26,374,414 | |||||||||||||
| Repayments |
(6,761,349 | ) | 493,750 | — | 747,109 | (5,520,490 | ) | |||||||||||||
| Amortization of discount |
— | — | 2,779,072 | — | 2,779,072 | |||||||||||||||
| Provision for loan losses |
— | (3,969,224 | ) | — | — | (3,969,224 | ) | |||||||||||||
| Sales and payoff |
(34,158,044 | ) | 1,894,114 | 7,331,018 | 7,966,646 | (16,966,266 | ) | |||||||||||||
| Transfers to/from non-impaired loans, net |
18,822,348 | — | (9,921,651 | ) | 7,673,773 | 16,574,470 | ||||||||||||||
| Balance at end of period |
$ | 74,369,428 | $ | (1,581,360 | ) | $ | (18,410,831 | ) | $ | (35,105,261 | ) | $ | 19,271,976 | |||||||
Non-impaired loans:
| Year Ended December 31, 2009 | ||||||||||||||||||||
| Principal | Allowance for Loan Losses |
Liquidity Discount |
Deferred Loan Fees |
Carrying Value, Net |
||||||||||||||||
| Balance at beginning of period |
$ | — | $ | — | $ | — | $ | — | $ | — | ||||||||||
| Cratos acquisitions (April 7, 2009) |
363,701,586 | — | (109,576,369 | ) | — | 254,125,217 | ||||||||||||||
| Purchases / funding |
162,611,950 | — | — | (6,527,201 | ) | 156,084,749 | ||||||||||||||
| Repayments |
(47,876,606 | ) | — | — | — | (47,876,606 | ) | |||||||||||||
| Amortization of discount |
— | — | 16,448,885 | 966,545 | 17,415,430 | |||||||||||||||
| Provision for loan losses |
— | (412,968 | ) | — | — | (412,968 | ) | |||||||||||||
| Sales and payoff |
(73,496,667 | ) | — | 18,718,969 | 711,364 | (54,066,334 | ) | |||||||||||||
| Transfers to/from impaired loans, net |
(17,849,964 | ) | — | 1,275,494 | — | (16,574,470 | ) | |||||||||||||
| Balance at end of period |
$ | 387,090,299 | $ | (412,968 | ) | $ | (73,133,021 | ) | $ | (4,849,292 | ) | $ | 308,695,018 | |||||||
The Company determined the fair value of loans collateralizing asset-backed securities to be $374.5 million as of December 31, 2009, using anticipated cash flows, discounted at an appropriate market credit adjusted interest rate.
At December 31, 2009, $74.4 million of the aggregate principal amount of loans collateralizing asset-backed securities were on non-accrual status. The Company did not recognize any interest income for 17 impaired loans with a weighted average loan balance of $95.1 million that were on non-accrual status during the year.
112
Table of Contents
8. Fixed Assets
At December 31, 2009 and 2008, fixed assets consisted of the following:
| December 31, 2009 | December 31, 2008 | |||||||
| Furniture and fixtures |
$ | 1,619,600 | $ | 1,363,429 | ||||
| Computer and office equipment |
3,770,926 | 3,247,255 | ||||||
| Leasehold improvements |
2,374,283 | 2,320,339 | ||||||
| Software |
540,245 | 490,194 | ||||||
| Less: accumulated depreciation |
(6,959,774 | ) | (6,214,203 | ) | ||||
| Total fixed assets, net |
$ | 1,345,280 | $ | 1,207,014 | ||||
Depreciation expense for the years ended December 31, 2009 and 2008 was $745,571 and $963,095, respectively. Depreciation expense for the period from January 1, 2007 through May 15, 2007 and the period from May 16, 2007 through December 31, 2007 was $525,734 and $688,490, respectively.
9. Note Payable
Note payable consists of the revolving and term loans related to the Company’s credit facility with City National Bank (the “Lender”) entered into on August 3, 2006. The Company had a revolving loan of $2.1 million and a term loan of $6.9 million outstanding at December 31, 2009 and a term loan of $8.7 million outstanding at December 31, 2008.
On December 31, 2008, the Company entered into Amendment Number Three to Credit Agreement (the “Third Amendment”), which amends certain provisions of the Credit Agreement, dated as of August 3, 2006, by and between the Company and the Lender, as amended by Amendment Number One to Credit Agreement, dated as of December 17, 2007 and as further amended by Amendment Number Two to Credit Agreement, dated as of March 27, 2008 (collectively, the “Credit Agreement”).
The Third Amendment converted the Company’s outstanding revolving loans of $8.7 million into a single term loan as of December 31, 2008. The term loan will be repaid in equal quarterly payments of $434,043 which commenced on March 31, 2009 and continues through December 31, 2013 and bears interest at the prime rate or LIBOR plus 2.25%. The Third Amendment also provided that of the original $30.0 million revolving line of credit, $21.0 million remains available under the revolving portion of the Credit Agreement and the annual interest rate provisions of the Credit Agreement are increased from the prime rate minus 1.25% to the prime rate and from LIBOR plus 1.25% to LIBOR plus 2.25%. The Lender will continue to provide revolving loans of up to $21.0 million through December 31, 2010, on which date the then existing revolving loans will convert into term loans.
During the first and second quarter of 2009, the Company drew down $2.1 million on the revolving line of credit to fund the HuaMei investment and $4.0 million to fund the purchase of Cratos, respectively. The $4.0 million drawn down to fund the purchase of Cratos was repaid during the second quarter of 2009. In addition, the Company made a scheduled repayment of $1.7 million on the term loan during 2009. The Company had undrawn amounts of $18.9 million and $21.0 million under the revolving line of credit with the Lender at December 31, 2009 and 2008, respectively. Each draw bears interest at the prime rate or LIBOR plus 2.25%.
113
Table of Contents
The following table shows the repayment schedules for the principal portion of the term loan at December 31, 2009:
| December 31, 2009 | |||
| 2010 |
$ | 1,736,170 | |
| 2011 |
1,736,170 | ||
| 2012 |
1,736,170 | ||
| 2013 |
1,736,170 | ||
| 2014 |
— | ||
| Thereafter |
— | ||
| $ | 6,944,680 | ||
The Credit Agreement contains financial and other covenants, including, but not limited to, limitations on debt, liens and investments, as well as the maintenance of certain financial covenants. A violation of any one of these covenants could result in a default under the facility, which would permit the bank to terminate our note and require the immediate repayment of any outstanding principal and interest. The Third Amendment modified the financial covenants in the Credit Agreement to remove both the minimum requirement of Net Income (as defined in the Credit Agreement) and the minimum requirement of EBITDA (as defined in the Credit Agreement). The Third Amendment also removed the Fixed Charge Coverage Ratio (as defined in the Credit Agreement) and added a new financial covenant regarding the Company’s liquidity. At December 31, 2009, the Company was in compliance with the loan covenants.
In connection with the Third Amendment, the Company paid to the Lender an amendment fee of $74,202. The term loan is collateralized by a pledge of the Company’s assets, including its interests in each of JMP Securities and HCS.
114
Table of Contents
10. Asset-backed Securities Issued
On May 17, 2007, Cratos CLO I Ltd. completed a $500.0 million aggregate principal amount of notes (the “Notes”) on-balance sheet debt securitization and obtained $455.0 million of third-party financing. The Notes will be repaid from the cash flows generated by the loan portfolio owned by Cratos CLO I Ltd. The Notes were issued in seven separate classes as set forth in the table below. The Company owns all of the unsecured subordinated notes and $13.7 million of Class C, D and E notes. These unsecured subordinated notes and the Class C, D and E notes owned by the Company are eliminated upon consolidation of JMP Credit, and therefore, are not reflected on the Company’s consolidated statement of financial condition at December 31, 2009.
| ($ in millions) | Notes Originally Issued |
Outstanding Principal Balance December 31, 2009 |
Liquidity Discount December 31, 2009 |
Net Outstanding Balance December 31, 2009 |
Interest Rate Spread to LIBOR |
Ratings (Moody’s/ S&P) (1) | ||||||||||||||
| Class A Senior Secured Floating Rate Revolving Notes due 2021 |
$ | 326.0 | $ | 319.2 | $ | (38.3 | ) | $ | 280.9 | 0.26%-0.29 | % | Aaa/AAA | ||||||||
| Class B Senior Secured Floating Rate Notes due 2021 |
30.0 | 30.0 | (9.6 | ) | 20.4 | 0.50 | % | Aa2/AA | ||||||||||||
| Class C Senior Secured Deferrable Floating Rate Notes due 2021 |
35.0 | 35.0 | (22.8 | ) | 12.2 | 1.10 | % | Baa1/A | ||||||||||||
| Class D Secured Deferrable Floating Rate Notes due 2021 |
34.0 | 34.0 | (22.5 | ) | 11.5 | 2.40 | % | Ba1/BBB | ||||||||||||
| Class E Secured Deferrable Floating Rate Notes due 2021 |
30.0 | 30.0 | (21.4 | ) | 8.6 | 5.00 | % | B3/BB | ||||||||||||
| Total secured notes sold to investors |
$ | 455.0 | $ | 448.2 | $ | (114.6 | ) | $ | 333.6 | |||||||||||
| Unsecured subordinated notes due 2021 |
45.0 | 45.0 | (39.9 | ) | 5.1 | |||||||||||||||
| Total notes for the CLO I offering |
$ | 500.0 | $ | 493.2 | $ | (154.5 | ) | $ | 338.7 | |||||||||||
| Consolidation elimination |
N/A | (58.7 | ) | 46.6 | (12.1 | ) | ||||||||||||||
| Total asset-backed securities issued |
N/A | $ | 434.5 | $ | (107.9 | ) | $ | 326.6 | ||||||||||||
| (1) | These ratings are unaudited and were the current ratings as of December 31, 2009 and are subject to change from time to time. |
The secured notes and subordinated notes are limited recourse obligations payable solely from cash flows of the CLO I loan portfolio and related collection and payment accounts pledged as security. Payment on the Class A-1 notes rank equal, or pari passu, in right of payment with payments on the Class A-2 notes and payment on the Class A-1 and Class A-2 notes rank senior in right of payment to the other secured notes and the subordinated notes. Payment on the Class B, Class C, Class D and Class E notes generally rank subordinate in right of payment to any other class of notes which has an earlier alphabetical designation. The subordinated notes are subordinated in right of payment to all other classes of notes and will not accrue interest. Interest on the secured notes is payable quarterly at a per annum rate equal to LIBOR plus the applicable spread set forth in the table above. Payment of interest on the Class C, Class D and Class E notes is payable only to the extent proceeds are available therefore under the applicable payment priority provisions. As of December 31, 2009, all interest on the secured notes was current. To the extent proceeds are not so available, interest on the Class C, Class D and Class E notes will be deferred. Cratos CLO I, Ltd. is also required to pay a commitment fee of 0.18% on the unused portion of the funding commitments of the Class A-1 notes. The secured notes are secured by the CLO I loan portfolio and the funds on deposit in various related collection and payment accounts. The terms of the debt
115
Table of Contents
securitization subject the loans included in the CLO I loan portfolio to a number of collateral quality, portfolio profile, interest coverage and overcollateralization tests. Total interest expense related to the asset-backed securities issued for the year ended December 31, 2009 was $25.2 million, which comprised cash coupon of $4.6 million and liquidity discount amortization of $20.6 million. As of December 31, 2009, accrued interest payable on the Notes was $0.5 million.
The Notes recorded upon the acquisition of Cratos at fair value reflect a liquidity discount. The activity in the note principal and liquidity discount for the year ended December 31, 2009 comprised the following:
| Year Ended December 31, 2009 | ||||||||||||
| Principal | Liquidity Discount | Net | ||||||||||
| Balance at beginning of period |
$ | — | $ | — | $ | — | ||||||
| Cratos acquisitions (April 7, 2009) |
440,950,000 | (124,437,000 | ) | 316,513,000 | ||||||||
| Repayments |
(6,761,918 | ) | — | (6,761,918 | ) | |||||||
| Post-acquisition purchases (1) |
(4,760,000 | ) | — | (4,760,000 | ) | |||||||
| Sales |
5,050,000 | (4,054,000 | ) | 996,000 | ||||||||
| Amortization of discount |
— | 20,644,530 | 20,644,530 | |||||||||
| Balance at end of period |
$ | 434,478,082 | $ | (107,846,470 | ) | $ | 326,631,612 | |||||
| (1) | In May and July 2009, the Company repurchased in the open market $0.8 million and $4.0 million of face value, respectively, of the ABS issued at a discount resulting in a gain of $4.2 million. |
The Company determined the fair value of asset-backed securities issued to be $361.1 million as of December 31, 2009.
11. Redeemable Class A Member Interests
Redeemable Class A member interests were issued to employees of the Predecessor or its subsidiaries, and were entitled to share in the operating profits of the Predecessor. Redeemable Class A member interests were identical in nature to Class A common interests issued to non-employee Class A common members, except that Class A common members were not subject to insider rules, as defined in the Operating Agreement. These insider rules provided, among other items, that the Predecessor could redeem the employee member’s interest in the Predecessor at any time, in whole or in part. In addition, the employee member could redeem his or her Redeemable Class A member interests in whole upon his or her resignation from providing services to the Predecessor. In either such case (and excluding terminations for cause or upon events of default), the redemption price would be either of the following at the Predecessor’s election: (i) the capital account balance of the employee member or (ii) the percent of “liquidation value” represented by such interest based on a valuation formula. Redeemable Class A member interests and Class A common interests combined represented a fixed percentage equal to 84.5% of the Predecessor’s membership interests. Increases and decreases in Redeemable Class A member interests resulted in offsetting decreases and increases in Class A common interests. As a result, Redeemable Class A member interests represented a variable percentage of the Predecessor’s total membership interests. Redeemable Class A member interests represented 68.3% and 74.8% of the Predecessor’s membership interests as of May 15, 2007 and December 31, 2006, respectively.
Redeemable Class A member interests were accounted for as stock-based compensation. Each holder of Redeemable Class A member interests was a party to the Operating Agreement, which provided that an employee member could elect to redeem all, but not less than all, of their Redeemable Class A member interests without the Predecessor’s consent in connection with such person’s resignation from the Predecessor. Because the redemption feature permitted the employee to avoid bearing the risks and rewards normally associated with equity share ownership for a reasonable period of time and gave the Predecessor no discretion to avoid transferring its cash or assets to the employee if the employee elected redemption, the Redeemable Class A
116
Table of Contents
member interests were classified as a liability by the Predecessor. The liability amount for the Redeemable Class A member interests was measured at each balance sheet date based on the redemption amounts for the Class A member interests. The redemption amount for an employee member was the amount the Predecessor was required to pay to an employee member upon resignation to redeem all his Redeemable Class A member interests as provided by the Operating Agreement. Management determined that member interests would be redeemed at an amount equal to the capital account of such employee member as maintained by the Predecessor. The pro rata share of the Predecessor’s income allocated to Redeemable Class A member interests and any additional changes in the redemption amount of Redeemable Class A member interests were recorded as “Income allocation and accretion—Redeemable Class A member interests” in the Predecessor’s Consolidated Statements of Operations.
The following table summarizes the activity for the Redeemable Class A member interests for the period from January 1 through May 15, 2007:
| Balance, December 31, 2006 |
$ | 12,913,769 | ||
| Contributions |
2,375,442 | |||
| Redemptions |
(3,479,800 | ) | ||
| Income allocation and accretion |
117,418,274 | |||
| Distributions |
(18,018,158 | ) | ||
| Liability to equity exchange |
(111,209,527 | ) | ||
| Balance, May 15, 2007 |
$ | — | ||
In connection with the Reorganization, the Redeemable Class A member interests were exchanged for shares of the Company’s common stock and reclassified from liability to equity. The liability-to-equity exchange of the Redeemable Class A member interests required the Predecessor to mark the liability for the Redeemable Class A member interests to its fair market value and to record a non-cash expense related to the change in value. The Predecessor accounted for the exchange in its consolidated financial statements as follows:
| • | The Predecessor recorded a one-time non-cash expense as a component of “Income allocation and accretion—Redeemable Class A member interests” equal to $112.9 million, which represented the difference between (a) the equity amount recorded for the shares of common stock issued in exchange for the Redeemable Class A member interests and (b) the carrying amount of the Redeemable Class A member interests prior to the Reorganization; and then |
| • | The Predecessor recorded additional equity equal to $111.2 million for the 10,109,957 shares of common stock exchanged for the Redeemable Class A member interests based on the initial public offering price of $11.00 per share. |
12. Stockholders’ and Members’ Equity
Membership Classes and Capital Accounts Prior to the Reorganization
A capital account was maintained for each member of JMP Group LLC until the Reorganization on May 16, 2007. The account was increased by capital contributions, allocable share of net profit and any items of income or gain and decreased by distributions, allocable share of net loss and any items of expense or loss.
Class A Common Interests
Class A common interests were issued to non-employee members, some of whom converted their Series A Convertible Preferred Units into Class A common interests in April 2004, and were entitled to share in the operating profits of the Predecessor. Class A common interests and Redeemable Class A member interests combined represented a fixed percentage equal to 84.5% of the Predecessor’s membership interests. Increases and decreases in Class A common interests resulted in offsetting decreases and increases in Redeemable Class A
117
Table of Contents
member interests. As a result, Class A common interests represented a variable percentage of the Predecessor’s total membership interests. Class A common interests represented 16.2% and 9.7% of the Predecessor’s membership interests as of May 15, 2007 and December 31, 2006, respectively.
Class B Common Interests
On August 18, 2004, the Predecessor issued Class B common interests in a private offering to qualified institutional buyers and accredited investors. The Class B common interests outstanding were equal to 15.5% of the total outstanding membership interests of the Predecessor at the closing of the private offering. Class B common interests were identical in nature to Class A common interests, except for: (i) the anti-dilution provision, which provided that the Class B membership interests would not be reduced by additional issuances of Class A common interests or Redeemable Class A member interests, and (ii) demand registration rights which gave the holders of Class B common interests an annual vote to cause a corporate conversion of the Predecessor, which would have resulted in registration of the converted common interests with the SEC with subsequent listing on a national exchange or the over-the-counter market. Class B common interests represented 15.5% of the Predecessor’s membership interests as of May 15, 2007 and December 31, 2006.
Common Stock
Shares of JMP Holdings Inc. common stock were originally sold in a private offering in August 2004 to enable certain non-employee investors to invest through a corporate entity in the membership interests of JMP Group LLC. JMP Holdings in turn owned, as a member of JMP Group LLC, Class B common interests on a one-for-one basis for each share of common stock. Effective May 16, 2007, in connection with the Company’s initial public offering, the members of JMP Group LLC exchanged the outstanding membership interests of JMP Group LLC for shares of common stock of JMP Holdings, and JMP Holdings changed its name to JMP Group Inc. In the initial public offering, the Company sold and issued 7,199,864 shares of its common stock, raising $73.1 million of proceeds, net of the Company’s direct offering costs.
During the years ended December 31, 2009 and 2008, the Company’s board of directors declared dividends per common share of $0.01 and $0.05, respectively. The Company’s board of directors declared a dividend per common share of $0.025 and $0.05 on August 7, 2007 and November 6, 2007, respectively.
Stock Repurchase Program
The Company’s board of directors authorized in August and November 2007 a 1.5 million share repurchase program, which was fully executed as of January 18, 2008. On March 10, 2008 and March 3, 2009, the Company’s board of directors authorized the repurchase of an additional 2.0 million shares during the subsequent eighteen months and the repurchase of an additional 0.5 million shares during the subsequent twelve months, respectively. During the year ended December 31, 2009, the Company repurchased 716,528 shares of the Company’s common stock at an average price of $7.54 per share for an aggregate purchase price of $5,404,016. The repurchases made during the year ended December 31, 2009 included 689,428 shares deemed to have been repurchased in connection with employee stock plans, whereby the Company’s shares were issued on a net basis to employees for the payment of applicable statutory withholding taxes and therefore such withheld shares are deemed to be purchased by the Company.
The timing and amount of any future repurchases will be determined by JMP management based on its evaluation of market conditions, the relative attractiveness of other capital deployment activities, regulatory considerations and other factors. Any open market stock repurchase activities will be conducted in compliance with the safe harbor provisions of Rule 10b-18 of the Securities Exchange Act of 1934, as amended, or in privately negotiated transactions. Repurchases of common stock may also be made under an effective Rule 10b5-1 plan which permits common stock to be repurchased when the Company may otherwise be prohibited from doing so under insider trading laws. This repurchase program may be suspended or discontinued at any time.
118
Table of Contents
13. Stock-Based Compensation
On March 26, 2007, the board of directors adopted the JMP Group Inc. 2007 Equity Incentive Plan (“JMP Group 2007 Plan”), which was approved by the stockholders on April 12, 2007. JMP Group Inc. authorized the issuance of 4,000,000 shares of its common stock under this Plan. This amount is increased by any shares JMP Group Inc. purchases on the open market, or through any share repurchase or share exchange program, as well as any shares that may be returned to the JMP Group 2007 Plan or the JMP Group LLC 2004 Equity Incentive Plan (“JMP Group 2004 Plan”) as a result of forfeiture, termination or expiration of awards; not to exceed a maximum aggregate number of shares of 2,960,000 shares under the JMP Group 2004 Plan. The Company will issue shares upon exercises or vesting from authorized but unissued shares or from treasury stock.
Stock Options
On July 18, 2006, a total of 50,000 options to purchase Class B common interests were granted to two employees who were not members of the Predecessor. The options have an exercise price of $12.50 per share, an exercise period of seven years and will vest and become exercisable 25% at each of the four subsequent anniversaries of the grant date. The fair value of the employee option grants has been estimated on the date of grant using the Black-Scholes Option Valuation methodology with the following assumptions: expected life of options of 4.70 years, risk-free interest rate of 5.10%, dividend yield of 4.4% and volatility of 28.0%. The dividend estimate was based on the recurring base dividend and special dividend estimated for 2006 and deemed to be representative for future periods. The Predecessor used the volatility of comparable public companies to estimate the volatility. The fair value of the options granted in July 2006 is $2.03 for each option or $101,500 for all options granted.
On December 19, 2006, a total of 1,370,000 options to purchase Class B common interests were granted to a number of employee members and non-members of the Predecessor. The options have an exercise price of $12.50 per share, and an exercise period of seven years. These options became vested and immediately exercisable on an accelerated basis in connection with the Reorganization. The fair value of each employee option grant was estimated on the grant date as $3.01 by using the Black-Scholes Option Valuation methodology with the following assumptions: expected life of options of 4.75 years, risk-free interest rate of 4.67%, dividend yield of 4.0% and volatility of 31.2%. The dividend estimate was based on the recurring base dividend and special dividend estimated for 2006 and deemed to be representative for future periods. The Predecessor used the volatility of comparable public companies to estimate the volatility.
In January 2007, a total of 75,000 options to purchase Class B common interests were granted to several members and non-member employees of the Predecessor. The options have an exercise price of $12.50 per share, and an exercise period of seven years. These options became vested and immediately exercisable on an accelerated basis in connection with the Reorganization. The fair value of each employee option was estimated on the grant date as $3.01 by using the Black-Scholes Option Valuation methodology with the following assumptions: expected life of options of 4.75 years, risk-free interest rate of 4.67%, expected dividend yield of 4.0% and volatility of 31.2%.
In connection with the Reorganization, all outstanding options to purchase Class B common interests were exchanged into options of the Successor’s common stock and the Company accelerated the vesting of 1,335,000 stock options granted in December 2006 and January 2007.
119
Table of Contents
The following table summarizes the stock option activity for the years ended December 31, 2009, 2008 and 2007:
| Year Ended December 31, | ||||||||||||||||||
| 2009 | 2008 | 2007 | ||||||||||||||||
| Shares Subject to Option |
Weighted Average Exercise Price |
Shares Subject to Option |
Weighted Average Exercise Price |
Shares Subject to Option |
Weighted Average Exercise Price | |||||||||||||
| Balance, beginning of year |
2,086,990 | $ | 11.40 | 2,384,890 | $ | 11.47 | 2,639,940 | $ | 11.45 | |||||||||
| Granted |
— | — | — | — | 75,000 | 12.50 | ||||||||||||
| Exercised |
(8,325 | ) | 10.00 | — | — | — | — | |||||||||||
| Forfeited |
(6,475 | ) | 10.00 | (31,450 | ) | 10.00 | (239,038 | ) | 11.15 | |||||||||
| Expired |
(133,875 | ) | 13.17 | (266,450 | ) | 12.20 | (91,012 | ) | 12.33 | |||||||||
| Balance, end of period |
1,938,315 | $ | 11.28 | 2,086,990 | $ | 11.40 | 2,384,890 | $ | 11.47 | |||||||||
| Options exercisable at end of period |
1,925,815 | $ | 11.28 | 1,826,393 | $ | 11.56 | 1,844,745 | $ | 11.85 | |||||||||
The following table summarizes the stock options outstanding as well as stock options vested and exercisable as of December 31, 2009 and 2008:
| As of December 31, 2009 | ||||||||||||||||||||
| Options Outstanding | Options Vested and Exercisable | |||||||||||||||||||
| Range of Exercise Prices |
Number Outstanding |
Weighted Average Remaining Contractual Life in Years |
Weighted Average Exercise Price |
Aggregate Intrinsic Value |
Number Exercisable |
Weighted Average Remaining Contractual Life in Years |
Weighted Average Exercise Price |
Aggregate Intrinsic Value | ||||||||||||
| $10.00 – $12.50 |
1,938,315 | 4.93 | $ | 11.28 | $ | — | 1,925,815 | 4.94 | $ | 11.28 | $ | — | ||||||||
| As of December 31, 2008 | ||||||||||||||||||||
| Options Outstanding | Options Vested and Exercisable | |||||||||||||||||||
| Range of Exercise Prices |
Number Outstanding |
Weighted Average Remaining Contractual Life in Years |
Weighted Average Exercise Price |
Aggregate Intrinsic Value |
Number Exercisable |
Weighted Average Remaining Contractual Life in Years |
Weighted Average Exercise Price |
Aggregate Intrinsic Value | ||||||||||||
| $10.00 – $15.00 |
2,086,990 | 5.80 | $ | 11.40 | $ | — | 1,826,393 | 5.66 | $ | 11.56 | $ | — | ||||||||
The Successor and the Predecessor recognize stock-based compensation expense for stock options over the graded vesting period of the options using the accelerated attribution method, resulting in compensation expense as follows:
| Year Ended December 31, 2009 |
Year Ended December 31, 2008 |
January 1, 2007 through May 15, 2007 |
May 16, 2007 through December 31, 2007 | |||||||||
| Successor | Successor | Predecessor | Successor | |||||||||
| Compensation expense recognized related to stock options |
$ | 18,229 | $ | 38,729 | $ | 740,120 | $ | 3,251,904 | ||||
Included in compensation expense in the table above is stock-based compensation expense of $3,211,835 that the Successor recognized in connection with the initial public offering in May 2007, resulting from the acceleration of the vesting of 1,335,000 stock options. The Company recognized income tax expense (benefits) of ($7,428), $274,192 and ($1,522,006) related to stock options for the years ended December 31, 2009, 2008
120
Table of Contents
and 2007, respectively. During the year ended December 31, 2009, 8,325 shares of stock options were exercised with the aggregate intrinsic value of $7,926. There were no stock options exercised during the years ended December 31, 2008 and 2007. As a result, the Company did not recognize any current income tax benefits from exercise of stock options during these periods.
As of December 31, 2009, there was $3,439 of unrecognized compensation expense related to stock options expected to be recognized over a weighted average period of 0.58 years.
Restricted Stock Units
Under the JMP Group 2007 Equity Award Plan, the Company has granted restricted stock units (“RSUs”) to employees and non-employee directors at no cost to the recipient. An RSU entitles the recipient to receive a share of common stock after the applicable restrictions lapse. These awards are generally subject to vesting schedules and continued employment with the Company. Some of these awards are also subject to post vesting lockup restrictions. In the event of a change in control or corporate transactions, or if the vesting of all or certain of the RSUs are otherwise accelerated, the RSUs will vest immediately prior to the effective date of such an event.
On January 16, 2008, the Company awarded 1,558,246 RSUs to all eligible employees as part of the Company’s 2007 annual bonus compensation process. The total fair value of these awards on grant date was $9,128,218. The fair value per unit was based on the market value of the underlying stock on grant date, discounted for post vesting restrictions and future dividends not expected to be received by unvested RSUs over the vesting period. The valuation methodology included an initial assumed expected dividend yield of 3.0%, and a risk-free discount rate of 2.57%. Discounts for post-vesting restrictions were calculated using the Finnerty Model, which was developed to estimate the impact of transfer restrictions on stock prices based on empirical studies.
These RSUs were awarded in three separate tranches. The first tranche of 773,210 units were scheduled to vest 50% on each of the first and second anniversary of the grant date, and the second tranche of 170,104 units were scheduled to vest 50% on the second anniversary and 25% on each of the third and fourth anniversary of the grant date. On December 22, 2008, the Company’s Board of Directors approved amendments to, and the immediate acceleration of these units. These units are subject to a lockup period until January 15, 2012. The third tranche of 614,930 units were not accelerated and will vest 100% on the fourth anniversary of the grant date and is subject to a lockup period until January 15, 2014.
On May 8, 2008, the Company awarded 36,000 RSUs to two new outside directors. Of these units, 33% vested immediately on grant date, with the remaining balance vesting 33% on each of the two subsequent anniversaries. The fair value of theses units was $6.80 per share and was calculated based on the market value of the underlying stock on grant date, discounted for future dividends expected not to be received by unvested RSUs over the vesting period. There is no lockup period for these units.
In 2008, a total of 75,233 additional RSUs were granted to employees. 60,000 of these units will vest on the fourth anniversary of the grant date. The remaining units consist of one tranche of 11,818 units which were accelerated on December 22, 2008 and are subject to a lock-up period until August 15, 2012, and one tranche of 3,415 units which will vest 25%, 35% and 40% on the second, third and fourth anniversary of the grant date and are not subject to lock-up. The fair values of these units were calculated based on the market values of the underlying stock on the respective grant dates, discounted for future dividends expected not to be received by unvested RSUs over the vesting period.
On December 22, 2008, the Company’s Board of Directors approved amendments to, and the immediate acceleration of the vesting of 990,862 RSUs that were granted in 2007 and 2008 to 78 employees, including each of the Company’s named executive officers, under the Company’s 2007 Equity Incentive Plan. These vested RSUs remain subject to the terms and conditions of the applicable restricted stock unit agreement, which include lockup provisions and potential forfeiture if the holder breaches certain covenants, including non-competition covenants.
121
Table of Contents
On February 5, 2009, as a part of the 2008 annual compensation program, the Company also granted 800,000 RSUs to certain employees for long term incentive purposes. These units will vest on the fourth anniversary of grant date and are not subject to a lockup period. Separately, the Company awarded 31,950 RSUs to new hire employees on the same date, with the same vesting terms. The total fair value of both awards on grant date was $3,519,149. The fair value per unit was based on the market value of the underlying stock on grant date, discounted for future dividends not expected to be received by unvested RSUs over the vesting period.
On February 5, 2009, as a part of the 2008 annual compensation program, the Company granted 87,076 restricted shares to certain employees. These shares vested immediately with a two-year restricted period subject to non-competition, non-solicitation and certain other covenants. The total fair value of this grant was $435,382 and the fair value per unit was based on the market value of the underlying stock on grant date.
On November 2, 2009, the Company’s Board of Directors approved amendments to, and the immediate acceleration of the vesting of 1,295,000 RSUs that were granted in the first quarters of 2008 and 2009 to 28 employees, including each of the Company’s named officers, under the Company’s 2007 Equity Incentive Plan. The acceleration was to align the terms of existing RSUs with those of future RSUs, which are anticipated to have performance-based vesting conditions instead of service-based vesting conditions. These accelerated RSUs remain subject to the terms and conditions of the applicable restricted stock unit agreements, which include lockup provisions and potential forfeiture if the holder breaches certain covenants, including non-competition covenants. In connection with the above vesting, the Company was deemed to have repurchased 526,400 shares of its common stock, mainly to allow employees to tender shares for the payment of the statutory minimum withholding taxes.
The following table summarizes the RSU activity for the years ended December 31, 2009, 2008 and 2007:
| Year Ended December 31, | ||||||||||||||||||
| 2009 | 2008 | 2007 | ||||||||||||||||
| Restricted Stock Units |
Weighted Average Grant Date Fair Value |
Restricted Stock Units |
Weighted Average Grant Date Fair Value |
Restricted Stock Units |
Weighted Average Grant Date Fair Value | |||||||||||||
| Balance, beginning of year |
2,265,292 | $ | 8.94 | 1,943,336 | $ | 10.30 | — | $ | — | |||||||||
| Granted |
987,948 | 4.77 | 1,669,477 | 5.84 | 2,096,438 | 10.30 | ||||||||||||
| Vested |
(1,684,585 | ) | 6.03 | (1,022,062 | ) | 6.26 | (44,642 | ) | 10.00 | |||||||||
| Forfeited |
(176,104 | ) | 8.38 | (325,459 | ) | 9.55 | (108,460 | ) | 10.43 | |||||||||
| Balance, end of period |
1,392,551 | $ | 9.59 | 2,265,292 | $ | 8.94 | 1,943,336 | $ | 10.30 | |||||||||
The aggregate fair value of RSUs vested during the years ended December 31, 2009, 2008 and 2007 was $13,072,064, $5,047,315 and $468,502, respectively.
The Company recognizes compensation expense over a graded vesting period using the accelerated attribution method. The following table provides compensation expenses recognized on RSUs for the years ended December 31, 2009, 2008 and 2007:
| Year Ended December 31, 2009 |
Year Ended December 31, 2008 |
January 1, 2007 through May 15, 2007 |
May 16, 2007 through December 31, 2007 | |||||||||
| Successor | Successor | Predecessor | Successor | |||||||||
| Compensation expense recognized related to RSUs |
$ | 9,740,846 | $ | 11,080,957 | $ | 76,129 | $ | 4,201,980 | ||||
122
Table of Contents
Included in the table above is compensation expense related to RSUs awarded in connection with the initial public offering date of $3,159,447, $3,900,188 and $3,992,583 and compensation expense related to RSUs awarded after the initial public offering of $6,581,399, $7,180,769 and $285,526 for the years ended December 31, 2009, 2008 and 2007, respectively. Compensation expense related to RSUs awarded after the initial public offering included additional compensation expense related to future periods of $4,745,206 and $2,567,408 for the years ended December 31, 2009 and 2008, respectively, as a result of the accelerated vesting of RSUs described above. The Company recognized income tax benefits of $3,969,005, $3,964,015 and $1,743,158 related to RSUs for the years ended December 31, 2009, 2008 and 2007, respectively.
As of December 31, 2009 and 2008, there was $4,651,439 and $11,848,379 of unrecognized compensation expense related to RSUs expected to be recognized over a weighted average period of 1.43 years and 2.50 years, respectively.
14. Net Income (Loss) per Share of Common Stock and Net Income (Loss) per Unit Attributable to Class A and Class B Common Interests
Basic net income (loss) per share for the Company is calculated by dividing net income (loss) by the weighted average number of common shares outstanding for the reporting period. Diluted net income (loss) per share is calculated by adjusting the weighted average number of outstanding shares to reflect the potential dilutive impact as if all potentially dilutive stock options or RSUs were exercised or converted under the treasury stock method.
Basic net income (loss) per unit for the Predecessor is calculated by dividing net income (loss) attributable to Class A and Class B common interests by the weighted average number of units of Class A and Class B common interests outstanding for the reporting period. Diluted net income (loss) per unit is computed similarly, except that it reflects the potential dilutive impact that would occur if potentially dilutive securities were exercised or converted into membership interests. To determine an average market price for applying the treasury stock method, the Predecessor estimated the fair market value of the Predecessor’s Class B common interests based on trades of Class B common interests between third parties and earnings multiples of publicly traded comparables.
123
Table of Contents
The computations of basic and diluted net income (loss) per share and basic and diluted net income (loss) per unit for the years ended December 31, 2009, 2008 and 2007 are shown in the table below:
| Year Ended December 31, 2009 |
Year Ended December 31, 2008 |
January 1, 2007 through May 15, 2007 |
May 16, 2007 through December 31, 2007 | |||||||||||||||
| Successor | Successor | Predecessor | Successor | |||||||||||||||
| Class A Common |
Class B Common |
|||||||||||||||||
| Numerator: |
||||||||||||||||||
| Net (loss) income |
$ | 10,810,252 | $ | (10,646,340 | ) | $ | (56,860,528 | ) | $ | (54,836,785 | ) | $ | 6,539,810 | |||||
| Denominator: |
||||||||||||||||||
| Basic weighted average Class A and Class B common units outstanding |
2,384,881 | 2,300,000 | ||||||||||||||||
| Basic weighted average shares outstanding |
20,790,776 | 20,210,888 | 21,829,544 | |||||||||||||||
| Effect of potential dilutive securities: |
||||||||||||||||||
| Restricted stock units |
1,346,715 | — | — | — | 86,614 | |||||||||||||
| Diluted weighted average Class A and Class B common units outstanding |
2,384,881 | 2,300,000 | ||||||||||||||||
| Diluted weighted average shares outstanding |
22,137,491 | 20,210,888 | 21,916,158 | |||||||||||||||
| Net (loss) per unit attributable to Class A and Class B common interests |
||||||||||||||||||
| Basic |
$ | (23.84 | ) | $ | (23.84 | ) | ||||||||||||
| Diluted |
$ | (23.84 | ) | $ | (23.84 | ) | ||||||||||||
| Net (loss) income per share |
||||||||||||||||||
| Basic |
$ | 0.52 | $ | (0.53 | ) | $ | 0.30 | |||||||||||
| Diluted |
$ | 0.49 | $ | (0.53 | ) | $ | 0.30 | |||||||||||
Stock options to purchase 2,013,151 shares of common stock for the year ended December 31, 2009 were anti-dilutive and, therefore, were not included in the computation of diluted weighted-average common units or diluted weighted-average common shares outstanding.
Stock options to purchase 2,242,828 shares of common stock for the year ended December 31, 2008 were anti-dilutive and, therefore, were not included in the computation of diluted weighted-average common units or diluted weighted-average common shares outstanding. In addition, restricted stock units for 3,285,568 shares of common stock for the year ended December 31, 2008 were anti-dilutive and, therefore, were not included in the computation of diluted weighted-average common shares outstanding.
Stock options to purchase 2,473,869 shares of common stock for the period May 16 through December 31, 2007, respectively, as well as 1,474,677 Class B common interests for the period January 1 through May 15, 2007, were anti-dilutive and, therefore, were not included in the computation of diluted weighted-average common units or diluted weighted-average common shares outstanding.
124
Table of Contents
15. Employee Benefits
All salaried employees of the Company are eligible to participate in the JMP Group 401(k) Plan after three months of employment. Participants may contribute up to the limits set by the United States Internal Revenue Service. There were no contributions by the Company during the years ended December 31, 2009, 2008 and 2007.
16. Income Taxes
Prior to the Reorganization, all income and losses of JMP Group LLC, the Predecessor, were reportable by the individual members of JMP Group LLC in accordance with the Internal Revenue Code of the United States. The U.S. federal and state income taxes payable by the members based upon their share of JMP Group LLC’s net income have not been reflected in the accompanying financial statements for periods prior to the Reorganization. JMP Holdings Inc., being a C-corporation from its inception in August 2004, was subject to U.S. federal and state income taxes on its taxable income and accounted for income taxes in its separate financial statements. The Company recognizes deferred tax assets and liabilities based upon the temporary differences between the financial reporting and tax bases of the Company’s assets and liabilities. Valuation allowances are established when necessary to reduce the deferred tax assets when it is more likely than not that a portion or all of the deferred tax assets will not be realized.
As a result of the Reorganization, JMP Group Inc. (formerly JMP Holdings Inc.) succeeded to the business of the Predecessor. The Company is subject to U.S. federal and state income taxes on all taxable income earned subsequent to May 15, 2007 by JMP Group LLC and its subsidiaries. As a result of the Reorganization, upon the change of tax status of JMP Group LLC from a partnership to a wholly-owned disregarded entity of the Company, the Company recognized a one-time tax benefit of $4,084,993 in connection with the establishment of net deferred tax items of $10,169,354. For the year ended December 31, 2008, the Company recorded a total tax benefit of $5,700,952 which included a benefit adjustment of $353,805 to the $4,084,993 one-time tax benefit recorded in 2007.
The components of the Company’s income tax expense (benefit) for the years ended December 31, 2009 and 2008 and for the period from May 16, 2007 through December 31, 2007 is as follows:
| Year ended December 31, 2009 |
Year ended December 31, 2008 |
May 16, 2007 through December 31, 2007 |
|||||||||
| Federal |
$ | 361,692 | $ | 1,987,814 | $ | — | |||||
| State |
323,129 | 522,978 | — | ||||||||
| Total current income tax expense |
684,821 | 2,510,792 | — | ||||||||
| Federal |
5,844,564 | (6,469,206 | ) | (2,131,542 | ) | ||||||
| State |
1,133,116 | (1,742,538 | ) | (405,072 | ) | ||||||
| Total deferred income tax expense (benefit) |
6,977,680 | (8,211,744 | ) | (2,536,614 | ) | ||||||
| Total income tax expense (benefit) |
$ | 7,662,501 | $ | (5,700,952 | ) | $ | (2,536,614 | ) | |||
125
Table of Contents
A reconciliation of the statutory U.S. federal income tax rate to the Successor’s effective tax rate for the years ended December 31, 2009 and 2008 and for the period from May 16, 2007 through December 31, 2007 is as follows:
| Year ended December 31, 2009 |
Year ended December 31, 2008 |
May 16, 2007 through December 31, 2007 |
|||||||
| Tax at federal statutory tax rate |
35.00 | % | 35.00 | % | 35.00 | % | |||
| State income tax, net of federal tax benefit |
5.75 | % | 5.75 | % | 5.75 | % | |||
| Adjustment for permanent items |
(1.85 | )% | (0.26 | )% | (1.10 | )% | |||
| Rate before one-time events |
38.90 | % | 40.49 | % | 39.65 | % | |||
| Deferred tax asset written off related to options and RSUs |
— | (5.14 | )% | 2.62 | % | ||||
| Adjustment for prior year taxes |
(0.39 | )% | (1.21 | )% | (3.59 | )% | |||
| Deferred tax recognized upon JMP Group LLC’s tax status change |
— | 2.16 | % | (102.05 | )% | ||||
| Income tax expense of JMPRT (1) |
— | (1.43 | )% | — | |||||
| California state enterprise zone tax credit |
(0.69 | )% | — | — | |||||
| Adjustment to deferred tax recognized on JMP Credit contingent consideration (Note 4) |
(0.09 | )% | — | — | |||||
| HCS interest in partnerships adjustments |
(0.07 | )% | — | — | |||||
| Effective tax rate (benefit) |
37.66 | % | 34.87 | % | (63.37 | )% | |||
| (1) | JMPRT is not consolidated for tax reporting purposes and files its own federal and state tax returns. |
As of December 31, 2009 and 2008, the components of deferred tax assets and liabilities are as follows:
| December 31, 2009 |
December 31, 2008 | ||||||
| Deferred tax assets: |
|||||||
| Accrued compensation and related expenses |
$ | 5,550,062 | $ | 102,933 | |||
| Equity based compensation |
4,572,354 | 4,807,904 | |||||
| Depreciation and amortization |
297,887 | 351,782 | |||||
| Reserves and allowances |
3,199,352 | 1,265,708 | |||||
| Net unrealized capital losses |
424,689 | 3,294,800 | |||||
| Net operating loss |
— | — | |||||
| Interest in HMOP/JMPRT (1) |
(618,656 | ) | 515,798 | ||||
| Interest on loans on non-accrual status |
1,751,473 | — | |||||
| Liquidity discount at JMP Credit |
35,999,582 | — | |||||
| Other |
322,559 | 274,841 | |||||
| Total deferred tax assets |
51,499,302 | 10,613,766 | |||||
| Deferred tax liabilities: |
|||||||
| Investments in partnerships |
(2,630,396 | ) | 224,204 | ||||
| Repurchase of asset-backed securities issued |
(1,646,666 | ) | |||||
| Liquidity discount at JMP Credit |
(43,943,122 | ) | — | ||||
| Other |
— | — | |||||
| Total deferred tax liabilities |
(48,220,184 | ) | 224,204 | ||||
| Valuation allowance |
— | — | |||||
| Net deferred tax assets |
$ | 3,279,118 | $ | 10,837,970 | |||
| (1) | HMOP and JMPRT are consolidated for financial reporting purposes but not for tax reporting purposes. |
126
Table of Contents
The Company determined that a valuation allowance against deferred tax assets was not necessary as of December 31, 2009 and 2008 based on the assessment of future ordinary income and capital gains and that the deferred tax assets will, more-likely-than-not, be realized.
The Company has analyzed the filing positions in its federal and state income tax returns for all open tax years, which are 2006 through 2009 for federal income tax purposes and 2005 through 2009 for state income tax purposes. The Company does not anticipate any tax adjustments that will result in a material adverse effect on the Company’s financial condition, results of operations, or cash flow. Therefore, the Company did not record a cumulative effect adjustment related to the adoption of the amended accounting principles related to the accounting for uncertainty in income taxes, and no liabilities for uncertain income tax positions have been recorded pursuant to the amended accounting principles.
The Company’s policy for recording interest and penalties associated with the tax audits or unrecognized tax benefits, if any, is to record such items as a component of income before taxes. Penalties, if incurred, would be recorded in “administration” and interest paid or received would be recorded in “interest and dividend expense” in the Consolidated Statements of Operations.
17. Commitments and Contingencies
The Company leases office space in California, Illinois, Georgia, Massachusetts and New York under various operating leases. Rental expense for the years ended December 31, 2009 and 2008 was $2,447,737 and, $1,905,248, respectively. Rental expense for the period of January 1, 2007 through May 15, 2007 and the period of May 16, 2007 through December 31, 2007 was $699,774 and $1,184,173, respectively.
The California, Chicago and New York leases included a period of free rent at the start of the lease for seven months, six months and three months, respectively. Rent expense is recognized over the entire lease period uniformly net of the free rent savings. The aggregate minimum future commitments of these leases are:
| 2010 |
$ | 2,605,893 | |
| 2011 |
2,186,894 | ||
| 2012 |
82,744 | ||
| 2013 |
54,097 | ||
| 2014 |
55,451 | ||
| Thereafter |
4,716 | ||
| $ | 4,989,795 | ||
In connection with its underwriting activities, JMP Securities enters into firm commitments for the purchase of securities in return for a fee. These commitments require JMP Securities to purchase securities at a specified price. Securities underwriting exposes JMP Securities to market and credit risk, primarily in the event that, for any reason, securities purchased by JMP Securities cannot be distributed at anticipated price levels. At December 31, 2009 and 2008, JMP Securities had no open underwriting commitments.
The marketable securities owned and the restricted cash as well as the cash held by the clearing broker, may be used to maintain margin requirements. At December 31, 2009 and December 31, 2008, the Company had $255,336 of cash on deposit with JMP Securities’ clearing broker. Furthermore, the marketable securities owned may be hypothecated or borrowed by the clearing broker.
Unfunded commitments are agreements to lend to a borrower, provided that all conditions have been met. As of December 31, 2009, the Company had unfunded commitments of $3.4 million in the Corporate Credit segment.
127
Table of Contents
18. Regulatory Requirements
JMP Securities is subject to the SEC’s Uniform Net Capital Rule (Rule 15c3-1), which requires the maintenance of minimum net capital, as defined, and requires that the ratio of aggregate indebtedness to net capital, both as defined, shall not exceed 15 to 1. JMP Securities had net capital of $45,339,067 and $39,761,064, which were $43,698,567 and $38,681,564 in excess of the required net capital of $1,640,500 and $1,079,500 at December 31, 2009 and 2008, respectively. JMP Securities’ ratio of aggregate indebtedness to net capital was 0.26 to 1 and 0.24 to 1 at December 31, 2009 and 2008, respectively.
Since all customer transactions are cleared through another broker-dealer on a fully disclosed basis, JMP Securities is not required to maintain a separate bank account for the exclusive benefit of customers in accordance with Rule 15c3-3 under the Exchange Act.
19. Related Party Transactions
The Company earns base management fees and incentive fees from serving as investment advisor for various entities, including corporations, partnerships and offshore investment companies. The Company also owns an investment in most of these entities. As of December 31, 2009 and 2008, the aggregate fair value of the Company’s investments in these entities was $55.5 million and $46.5 million, respectively, which consisted of general partner investments in hedge funds of $33.3 million and $29.8 million, respectively, general partner investments in funds of funds of $2.9 million and $3.7 million, respectively, and investments in NYMT convertible preferred and common stock of $19.3 million and $13.0 million, respectively. Base management fees earned from these entities were $8.5 million, $5.4 million and $2.8 million for the years ended December 31, 2009, 2008 and 2007, respectively. Also, the Company earned incentive fees of $11.6 million, $6.0 million and $2.2 million from these entities for the years ended December 31, 2009, 2008 and 2007, respectively. As of December 31, 2009 and 2008, the Company had inventive fees receivable from these entities of $2.6 million and $1.5 million, respectively.
20. Guarantees
JMP Securities has agreed to indemnify its clearing broker for losses that the clearing broker may sustain from the accounts of customers introduced by JMP Securities. Should a customer not fulfill its obligation on a transaction, JMP Securities may be required to buy or sell securities at prevailing market prices in the future on behalf of its customer. JMP Securities’ obligation under the indemnification has no maximum amount. All unsettled trades at December 31, 2009 had settled with no resulting material liability to the Company. For the years ended December 31, 2009, 2008 and 2007, the Company had no material loss due to counterparty failure, and has no obligations outstanding under the indemnification arrangement as of December 31, 2009.
The Company is engaged in various investment banking and brokerage activities whose counterparties primarily include broker-dealers, banks and other financial institutions. In the event counterparties do not fulfill their obligations, the Company may be exposed to risk. The risk of default depends on the creditworthiness of the counterparty or issuer of the instrument. It is the Company’s policy to review, as necessary, the credit standing of each counterparty with which it conducts business.
21. Litigation
Due to the nature of its business, the Company is subject to various threatened or filed legal actions. For example, because we act as an underwriter or a financial advisor in the ordinary course of our business, we have in the past been, currently are and may in the future be subject to class action claims that seek substantial damages.
In addition, defending employment and other claims against us could require the expenditure of substantial resources. Litigation is inherently uncertain and the ultimate resolution of such litigation could be determined by factors outside of our control. Management, after consultation with legal counsel, believes that the currently known actions or threats will not result in any material adverse effect on the Company’s financial condition, results of operations or cash flows.
128
Table of Contents
22. Financial Instruments with Off-Balance Sheet Risk, Credit Risk or Market Risk
The majority of the Company’s transactions, and consequently the concentration of its credit exposure, is with its clearing broker. The clearing broker is also a significant source of short-term financing for the Company, which is collateralized by cash and securities owned by the Company and held by the clearing broker. The Company’s securities owned may be pledged by the clearing broker. The receivable from the clearing broker represents amounts receivable in connection with the trading of proprietary positions.
The Company is also exposed to credit risk from other brokers, dealers and other financial institutions with which it transacts business. In the event that counterparties do not fulfill their obligations, the Company may be exposed to credit risk.
The Company’s trading activities include providing securities brokerage services to institutional clients. To facilitate these customer transactions, the Company purchases proprietary securities positions (“long positions”) in equity securities. The Company also enters into transactions to sell securities not yet purchased (“short positions”), which are recorded as liabilities on the Consolidated Statements of Financial Condition. The Company is exposed to market risk on these long and short securities positions as a result of decreases in market value of long positions and increases in market value of short positions. Short positions create a liability to purchase the security in the market at prevailing prices. Such transactions result in off-balance sheet market risk as the Company’s ultimate obligation to satisfy the sale of securities sold, but not yet purchased may exceed the amount recorded in the Consolidated Statements of Financial Condition. To mitigate the risk of losses, these securities positions are marked to market daily and are monitored by management to assure compliance with limits established by the Company.
In connection with the Cratos CLO, the Company is party to financial instruments with off-balance sheet risk in the normal course of business to meet the financing needs of its customers. These financial instruments include unfunded commitments to lend and standby letters of credit. The instruments involve, to varying degrees, elements of credit and interest rate risk in excess of the amount recognized in the consolidated balance sheet of the Company.
Unfunded commitments are agreements to lend to a borrower, provided that all conditions have been met. Commitments generally have fixed expiration dates or other termination clauses and may require payment of a fee. Since certain commitments may expire without being drawn upon, the total commitment amounts do not necessarily represent future cash requirements. The Company evaluates each borrower’s creditworthiness on a case by case basis.
Standby letters of credit are conditional commitments issued by the Company to guarantee the performance by a borrower to a third party. The Company’s exposure to credit loss in the event of nonperformance by the other party to the financial instrument for standby letters of credit is represented by the contractual amount of those instruments. The Company uses the same credit policies in making commitments and conditional obligations as it does for on balance sheet instruments. The credit risk involved in issuing letters of credit is essentially the same as that involved in extending loans to borrowers. As of December 31, 2009, the Company had unfunded commitments of $3.4 million and standby letters of credit of $1.8 million in the Corporate Credit segment.
23. Business Segments
Prior to the acquisition of Cratos in April 2009, the Company’s business results were categorized into the following two segments: Broker-Dealer and Asset Management. After the acquisition of Cratos, the Company’s business results are categorized into the following three business segments: Broker-Dealer, Asset Management and Corporate Credit. The Broker-Dealer segment includes a broad range of services, such as underwriting and acting as a placement agent for public and private capital raising transactions and financial advisory services in M&A, restructuring and other strategic transactions. The Broker-Dealer segment also includes institutional
129
Table of Contents
brokerage services and equity research services to our institutional investor clients. The Asset Management segment includes the management of a broad range of pooled investment vehicles, including the Company’s hedge funds, funds of funds, JMPRT (through December 31, 2008) and HMOP (since January 1, 2009) as well as the Company’s principal investments in public and private securities. The Corporate Credit segment includes the management of collateralized loan obligations and certain principal investments through JMP Capital. With the disclosure of this new segment, the results of operations and assets of JMP Capital, which for 2008 financial statements were reported in the Asset Management segment, are now reported in the Corporate Credit segment as they are more closely aligned with those newly acquired operations. For the comparative 2008 periods shown below JMP Capital has therefore been included in the Corporate Credit segment.
The accounting policies of the segments are consistent with those described in the Significant Accounting Policies in Note 2.
Revenue generating activities between segments are eliminated from the segment results for reporting purposes. These activities include fees paid by the Broker-Dealer segment to the Asset Management segment for the management of its investment portfolio as well as fees paid by the Corporate Credit segment to the Asset Management segment for co-management of its investment portfolio.
The Company’s segment information for the years ended December 31, 2009, 2008 and 2007 was prepared using the following methodology:
| • | Revenues and expenses directly associated with each segment are included in determining segment operating income. |
| • | Revenues and expenses not directly associated with a specific segment are allocated based on the most relevant measures applicable, including revenues, headcount and other factors. |
| • | Each segment’s operating expenses include: a) compensation and benefits expenses that are incurred directly in support of the segments and b) other operating expenses, which include expenses for premises and occupancy, professional fees, travel and entertainment, communications and information services, equipment and indirect support costs (including compensation and other operating expenses related thereto) for administrative services. |
| • | Corporate operating expenses for the period from January 1, 2007 through May 15, 2007 include income allocation and accretion—Redeemable Class A member interests and interest expense payable on Redeemable Class A member interests. These expenses are not allocated to the segments, because Redeemable Class A member interests are capital to the Company as a whole and the income allocation is based on the Company’s consolidated results. |
The Company evaluates segment results based on revenue and segment operating income before noncontrolling interest and taxes.
130
Table of Contents
Segment Operating Results
Management believes that the following information provides a reasonable representation of each segment’s contribution to revenues, income and assets:
| Year Ended December 31, 2009 |
Year Ended December 31, 2008 |
January 1, 2007 through May 15, 2007 |
May 16, 2007 through December 31, 2007 | ||||||||||||
| Successor | Successor | Predecessor | Successor | ||||||||||||
| Broker-Dealer |
|||||||||||||||
| Net revenues after provision for loan losses |
$ | 83,180,875 | $ | 62,251,106 | $ | 29,993,751 | $ | 58,515,138 | |||||||
| Non-interest expenses |
84,008,983 | 75,820,931 | 23,889,527 | 56,068,992 | |||||||||||
| Segment income (loss) before income tax expense |
$ | (828,108 | ) | $ | (13,569,825 | ) | $ | 6,104,224 | $ | 2,446,146 | |||||
| Segment assets |
$ | 84,810,485 | $ | 86,417,528 | N/A | $ | 104,127,162 | ||||||||
| Asset Management |
|||||||||||||||
| Net revenues after provision for loan losses |
$ | 32,202,279 | $ | 12,792,885 | $ | 2,239,725 | $ | 6,605,867 | |||||||
| Non-interest expenses |
29,499,293 | 14,213,711 | 1,911,019 | 4,801,887 | |||||||||||
| Segment income (loss) before income tax expense |
$ | 2,702,986 | $ | (1,420,826 | ) | $ | 328,706 | $ | 1,803,980 | ||||||
| Segment assets |
$ | 74,174,090 | $ | 61,403,418 | N/A | $ | 80,584,101 | ||||||||
| Corporate Credit |
|||||||||||||||
| Net revenues after provision for loan losses |
$ | 34,100,394 | $ | (1,931,927 | ) | $ | — | $ | — | ||||||
| Non-interest expenses |
15,631,025 | (76,882 | ) | — | — | ||||||||||
| Segment income (loss) before income tax expense |
$ | 18,469,369 | $ | (1,855,045 | ) | $ | — | $ | — | ||||||
| Segment assets |
$ | 415,736,902 | $ | 5,025,146 | $ | — | $ | — | |||||||
| Corporate |
|||||||||||||||
| Net revenues after provision for loan losses |
$ | — | $ | — | $ | (544,581 | )(1) | $ | — | ||||||
| Operating expenses |
— | — | 117,418,274 | — | |||||||||||
| Segment (loss) before income tax expense |
$ | — | $ | — | $ | (117,962,855 | ) | $ | — | ||||||
| Consolidated Entity |
|||||||||||||||
| Net revenues after provision for loan losses |
$ | 149,483,548 | $ | 73,112,064 | $ | 31,688,895 | $ | 65,121,005 | |||||||
| Non-interest expenses |
129,139,301 | 89,957,760 | 143,218,820 | 60,870,879 | |||||||||||
| Income (loss) before income tax expense |
$ | 20,344,247 | $ | (16,845,696 | ) | $ | (111,529,925 | ) | $ | 4,250,126 | |||||
| Total assets |
$ | 574,721,477 | $ | 152,846,092 | N/A | $ | 184,711,263 | ||||||||
| (1) | Represents interest paid to Redeemable Class A members on their capital contributions |
131
Table of Contents
24. Summarized financial information for equity method investments and NYMT
The table below presents summarized financial information of the hedge funds and funds of funds which the Company accounts for under the equity method.
| December 31, 2009 | December 31, 2008 | |||||
| Net Assets | Net Assets | |||||
| Harvest Opportunity Partners II |
$ | 73,894,769 | $ | 62,169,209 | ||
| Harvest Small Cap Partners |
336,082,941 | 234,051,639 | ||||
| Harvest Consumer Partners (1) |
12,117,347 | 5,521,880 | ||||
| Harvest Technology Partners (1) |
22,395,376 | 11,581,561 | ||||
| Harvest Global Select Partners |
5,558,850 | — | ||||
| Year Ended December 31, 2009 |
Year Ended December 31, 2008 |
Year Ended December 31, 2007 | ||||||||||||||||||||
| Net Realized and Unrealized Gains |
Net Investment Income (Loss) |
Net Realized and Unrealized Gains |
Net Investment Income (Loss) |
Net Realized and Unrealized Gains |
Net Investment Income (Loss) | |||||||||||||||||
| Harvest Opportunity Partners II |
$ | 19,817,716 | $ | (908,620 | ) | $ | (3,517,166 | ) | $ | 1,559,419 | $ | (2,927,707 | ) | $ | 2,239,235 | |||||||
| Harvest Small Cap Partners |
62,827,318 | (14,836,366 | ) | 39,578,724 | (6,958,363 | ) | 9,731,533 | 156,806 | ||||||||||||||
| Harvest Consumer Partners (1) |
2,247,721 | (148,547 | ) | 132,136 | (49,230 | ) | — | — | ||||||||||||||
| Harvest Technology Partners (1) |
4,305,006 | (328,323 | ) | 445,078 | (25,208 | ) | — | — | ||||||||||||||
| Harvest Global Select Partners |
591,375 | (188,569 | ) | — | — | — | — | |||||||||||||||
| (1) | HTP and HCP were consolidated subsidiaries through July 31, 2008 and through November 30, 2008, respectively, and therefore were not included in the above table for the year ended December 31, 2007. HTP and HCP were deconsolidated effective August 1, 2008 and December 1, 2008, respectively, and were equity-method investments at December 31, 2008. As such, the Company included HTP and HCP in the above table for the years ended December 31, 2008 and 2009. |
132
Table of Contents
The tables below present summarized financial information of NYMT at December 31, 2009 and 2008 as well as for the years ended December 31, 2009 and 2008.
| Year Ended December 31, | ||||||||
| (In thousands) | 2009 | 2008 | ||||||
| Statement of Operations Data: |
||||||||
| Interest income—investment securities and loans held in securitization trusts |
$ | 31,095 | $ | 44,123 | ||||
| Interest expense—investment securities and loans held in securitization trusts |
8,572 | 30,351 | ||||||
| Provision for loan losses |
(2,262 | ) | (1,462 | ) | ||||
| Realized gain (loss) on securities and related hedges |
3,282 | (19,977 | ) | |||||
| Impairment loss on investment securities |
(119 | ) | (5,278 | ) | ||||
| Income (loss) from continuing operations |
10,884 | (25,764 | ) | |||||
| Net income (loss) |
11,670 | (24,107 | ) | |||||
| December 31, 2009 | December 31, 2008 | |||||||
| Statement of Financial Condition Data: |
||||||||
| Investment securities—available for sale at fair value (including pledged assets of $91,071 and $456,506 at December 31,2009 and 2008, respectively) |
$ | 176,691 | $ | 477,416 | ||||
| Mortgage loans held in securitization trusts (net) |
276,176 | 346,972 | ||||||
| Total assets |
488,814 | 853,300 | ||||||
| Financing arrangements, portfolio investments |
85,106 | 402,329 | ||||||
| Collateralized debt obligations |
266,754 | 335,646 | ||||||
| Convertible preferred debentures (net) |
19,851 | 19,702 | ||||||
| Total liabilities |
425,827 | 814,052 | ||||||
25. Subsequent Events
On February 4, 2010, the Company granted 905,628 RSUs to certain employees for long term incentive purposes. These units have Company performance-based vesting conditions and will vest when the Company performance target set for such RSUs is met. The maximum aggregate fair value of this grant, assuming the highest level of performance conditions is probable, was $7.2 million based on the market value of the underlying stock on grant date.
On February 16, 2010, as a part of the 2009 annual compensation program, the Company granted 131,341 restricted shares to certain employees. These shares vested immediately with a two-year restricted period during which the holders are subject to non-competition, non-solicitation and certain other covenants. Fifty-percent of such holders’ shares will be released from restriction on each of December 31, 2010 and 2011. The aggregate fair value of this grant was $1.1 million, and the fair value per unit was based on the market value of the underlying stock on grant date.
On February 10, 2010, a loan held for investment with an outstanding principal balance of $4.2 million but fully reserved as of December 31, 2009 was converted into non-voting preferred equity of a newly formed entity which succeeded to the assets of the former borrower entity.
On March 2, 2010, the Company’s board of directors declared a cash dividend of $0.01 per share of common stock for the fourth quarter of 2009 to be paid on April 2, 2010 to common shareholders of record on March 19, 2010.
133
Table of Contents
26. Selected Quarterly Financial Data (Unaudited)
The following represents the Company’s unaudited quarterly results for the years ended December 31, 2009 and 2008. These quarterly results were prepared in accordance with GAAP and reflect all adjustments that are in the opinion of management, necessary for a fair statement of the results.
| Three Months Ended March 31, 2009 |
Three Months Ended June 30, 2009 |
Three Months Ended September 30, 2009 |
Three Months Ended December 31, 2009 | |||||||||
| Total net revenues after provision for loan losses |
$ | 24,196,468 | $ | 37,474,816 | $ | 41,718,997 | $ | 46,093,267 | ||||
| Non-interest expenses: |
||||||||||||
| Compensation and benefits |
18,800,515 | 22,740,160 | 29,308,305 | 34,330,179 | ||||||||
| Other expenses |
5,309,054 | 6,373,605 | 5,850,891 | 6,426,592 | ||||||||
| Total non-interest expenses |
24,109,569 | 29,113,765 | 35,159,196 | 40,756,771 | ||||||||
| Income before income tax expense |
86,899 | 8,361,051 | 6,559,801 | 5,336,496 | ||||||||
| Income tax expense |
52,428 | 3,559,939 | 2,879,018 | 1,171,116 | ||||||||
| Net income |
34,471 | 4,801,112 | 3,680,783 | 4,165,380 | ||||||||
| Less: Net income attributable to the noncontrolling interest |
526 | 514,927 | 712,007 | 644,034 | ||||||||
| Net income attributable to JMP Group Inc. |
33,945 | 4,286,185 | 2,968,776 | 3,521,346 | ||||||||
| Net income attributable to JMP Group Inc. per common share: |
||||||||||||
| Basic |
$ | 0.00 | $ | 0.21 | $ | 0.14 | $ | 0.17 | ||||
| Diluted |
$ | 0.00 | $ | 0.20 | $ | 0.13 | $ | 0.16 | ||||
| Three Months Ended March 31, 2008 |
Three Months Ended June 30, 2008 |
Three Months Ended September 30, 2008 |
Three Months Ended December 31, 2008 |
||||||||||||
| Total net revenues after provision for loan losses |
$ | 19,535,937 | $ | 21,512,306 | $ | 15,296,627 | $ | 16,767,194 | |||||||
| Non-interest expenses: |
|||||||||||||||
| Compensation and benefits |
12,589,219 | 13,834,582 | 17,724,046 | 21,597,992 | |||||||||||
| Other expenses |
6,483,923 | 6,626,597 | 5,811,880 | 5,289,521 | |||||||||||
| Total non-interest expenses |
19,073,142 | 20,461,179 | 23,535,926 | 26,887,513 | |||||||||||
| Income (loss) before income tax expense |
462,795 | 1,051,127 | (8,239,299 | ) | (10,120,319 | ) | |||||||||
| Income tax expense (benefit) |
(159,574 | ) | 645,676 | (2,971,386 | ) | (3,215,668 | ) | ||||||||
| Net income (loss) |
622,369 | 405,451 | (5,267,913 | ) | (6,904,651 | ) | |||||||||
| Less: Net income (loss) attributable to the noncontrolling interest |
(56,431 | ) | 210,981 | (369,208 | ) | (283,746 | ) | ||||||||
| Net income (loss) attributable to JMP Group Inc. |
678,800 | 194,470 | (4,898,705 | ) | (6,620,905 | ) | |||||||||
| Net income (loss) attributable to JMP Group Inc. per common share: |
|||||||||||||||
| Basic |
$ | 0.03 | $ | 0.01 | $ | (0.24 | ) | $ | (0.33 | ) | |||||
| Diluted |
$ | 0.03 | $ | 0.01 | $ | (0.24 | ) | $ | (0.33 | ) | |||||
134
Table of Contents
| Item 9. | Changes in and Disagreements With Accountants on Accounting and Financial Disclosure |
None.
| Item 9A. | Controls and Procedures |
Our management, with the participation of the Chairman and Chief Executive Officer and the Chief Financial Officer (our principal executive officer and principal financial officer, respectively), has evaluated our disclosure controls and procedures as of the end of the year covered by this report.
Based on that evaluation, our Chairman and Chief Executive Officer and Chief Financial Officer have concluded that, as of the end of the year covered by this report, our disclosure controls and procedures are effective to provide reasonable assurance that information required to be disclosed by us in the reports filed or submitted by us under the Securities Exchange Act of 1934, is recorded, processed, summarized and reported within the time periods specified in the SEC’s rules and forms, and include controls and procedures designed to ensure that information required to be disclosed by us in such reports is accumulated and communicated to our management, including the Chairman and Chief Executive Officer and the Chief Financial Officer, as appropriate, to allow timely decisions regarding required disclosure.
There was no change in our internal control over financial reporting that occurred during the three months ended December 31, 2009 that has materially affected, or is reasonably likely to materially affect, our internal control over financial reporting.
Our management report on internal control over financial reporting is contained in Part II, Item 8 of this annual report on Form 10-K and is incorporated herein by reference.
| Item 9B. | Other Information |
None.
135
Table of Contents
PART III
| Item 10. | Directors, Executive Officers and Corporate Governance |
The information required by this item will be contained in the sections of our Proxy Statement for the 2010 Annual Meeting of Stockholders, captioned “Board of Directors,” “Compensation of Directors,” and “Section 16(a) Beneficial Ownership Reporting Compliance,” which is incorporated herein by reference.
| Item 11. | Executive Compensation |
Information with respect to this item will be contained in the sections of our Proxy Statement for the 2010 Annual Meeting of Stockholders, captioned “Executive Compensation” which is incorporated herein by reference.
| Item 12. | Security Ownership of Certain Beneficial Owners and Management and Related Stockholder Matters |
Information with respect to this item will be contained in the sections of our Proxy Statement for the 2010 Annual Meeting of Stockholders, captioned “Ownership of Certain Beneficial Owners and Management” and “Equity Compensation Plan Information” which is incorporated herein by reference.
| Item 13. | Certain Relationships and Related Transactions, and Director Independence |
Information with respect to this item will be contained in the sections of our Proxy Statement for the 2010 Annual Meeting of Stockholders, captioned “Related Party Transactions” and “Director Independence” which is incorporated herein by reference.
| Item 14. | Principal Accountant Fees and Services |
Information with respect to this item will be contained in the sections of our Proxy Statement for the 2010 Annual Meeting of Stockholders, captioned “Fees Paid to Independent Registered Public Accounting Firm” which is incorporated herein by reference.
136
Table of Contents
PART IV
| Item 15. | Exhibits and Financial Statement Schedules |
(a) Documents filed as part of this Form 10-K:
| 1. | Consolidated Financial Statements |
The consolidated financial statements required to be filed in the Form 10-K are listed below. The required financial statements appear on pages 88 through 134 herein. In addition, pursuant to Exchange Act Rule 12b-23, the Company incorporates the financial statements and supplementary data of New York Mortgage Trust, Inc. by reference to Exhibit 99.1 filed with this Form 10-K.
INDEX TO CONSOLIDATED FINANCIAL STATEMENTS
| 87 | ||
| Consolidated Statements of Financial Condition as of December 31, 2009 and 2008 |
88 | |
| 89 | ||
| 90 | ||
| 91 | ||
| 93 | ||
| 2. | Financial Statement Schedules |
Separate financial statement schedules have been omitted either because they are not applicable or because the required information is included in the consolidated financial statements.
| 3. | Exhibits |
See the Exhibit Index beginning on page 139 for a list of the exhibits being filed or furnished with or incorporated by reference into this Annual Report on Form 10-K.
137
Table of Contents
Pursuant to the requirements of Section 13 or 15(d) of the Securities Exchange Act of 1934, the Registrant has duly caused this report to be signed on its behalf by the undersigned thereunto duly authorized.
Date: March 8, 2010
| JMP Group Inc. | ||
| Registrant | ||
| By: | /S/ JOSEPH A. JOLSON | |
| Joseph A. Jolson | ||
| Chairman and Chief Executive Officer | ||
Pursuant to the requirements of the Securities Exchange Act of 1934, this report has been signed below by the following persons on behalf of the Registrant and in the capacities and on the dates indicated.
Date: March 8, 2010
| Signature |
Title | |
| /S/ JOSEPH A. JOLSON Joseph A. Jolson |
Director, Chairman and Chief Executive Officer (principal executive officer) | |
| /S/ THOMAS B. KILIAN Thomas B. Kilian |
Chief Financial Officer (principal financial and accounting officer) | |
| /S/ HARRIS S. BARTON Harris S. Barton |
Director | |
| /S/ CRAIG R. JOHNSON Craig R. Johnson |
Director | |
| /S/ KENNETH M. KARMIN Kenneth M. Karmin |
Director | |
| /S/ MARK L. LEHMANN Mark L. Lehmann |
Director | |
| /S/ CARTER D. MACK Carter D. Mack |
Director | |
| /S/ H. MARK LUNENBURG H. Mark Lunenburg |
Director | |
| /S/ EDWARD J. SEBASTIAN Edward J. Sebastian |
Director | |
| /S/ GLENN H. TONGUE Glenn H. Tongue |
Director | |
138
Table of Contents
| Exhibit |
Description | |
| 2.1 | Reorganization and Exchange Agreement (incorporated by reference to Exhibit 2.1 to the Registrant’s registration statement on Form S-1/A (No. 333-140689) filed on May 8, 2007). | |
| 2.2 | Cratos Purchase Agreement dated March 31, 2009 (incorporated by reference to Exhibit to the Registrant’s quarterly report with respect to the quarter ended June 30, 2009 on Form 10-Q filed on August 6, 2009). | |
| 3.1 | Fourth Amended and Restated Certificate of Incorporation of JMP Group Inc. (incorporated by reference to Exhibit 3.1 to the Registrant’s quarterly report with respect to the quarter ended March 31, 2007 on Form 10-Q filed on June 21, 2007). | |
| 3.2 | Amended and Restated Bylaws of JMP Group Inc. (incorporated by reference to Exhibit 3.2 to the Registrant’s quarterly report with respect to the quarter ended March 31, 2007 on Form 10-Q filed on June 21, 2007). | |
| 4.1 | Form of Certificate Representing Shares of Common Stock (incorporated by reference to Exhibit 4.1 to the Registrant’s registration statement on Form S-1/A (No. 333-140689) filed on April 19, 2007). | |
| 10.1 | Amendment Number Three to Credit Agreement, dated As of December 31, 2008 (incorporated by referenced to Exhibit 10.1 to the Registrant’s current report on Form 8-K filed on January 7, 2009) | |
| 10.1.1 | Form of Restricted Stock Unit Award Agreement (incorporated by reference to Exhibit 10.1.1 to the Registrant’s registration statement on Form S-1/A (No. 333-140689) filed on May 8, 2007). | |
| 10.2 | Form of Partners’ Exchange Agreement (incorporated by reference to Exhibit 10.2 to the Registrant’s registration statement on Form S-1/A (No. 333-140689) filed on May 8, 2007). | |
| 10.3 | Credit Agreement Dated August 3, 2006 (incorporated by reference to Exhibit 10.3 to the Registrant’s registration statement on Form S-1/A (No. 333-140689) filed on March 27, 2007). | |
| 10.5 | Form of Indemnification Agreement (incorporated by reference to Exhibit 10.5 to the Registrant’s registration statement on Form S-1/A (No. 333-140689) filed on March 27, 2007). | |
| 10.8 | Lease Agreement, Dated December 18, 2003 (incorporated by reference to Exhibit 10.8 to the Registrant’s registration statement on Form S-1 (No. 333-140689) filed on February 14, 2007). | |
| 10.8.1 | First Amendment Letter to Lease Dated May 10, 2004 (incorporated by reference to Exhibit 10.8.1 to the Registrant’s registration statement on Form S-1/A (No. 333-140689) filed on May 8, 2007). | |
| 10.9 | Sublease, Dated December 18, 2003 (incorporated by reference to Exhibit 10.9 to the Registrant’s registration statement on Form S-1 (No. 333-140689) filed on February 14, 2007). | |
| 10.9.1 | Consent to Sublease, Dated December 18, 2003 (incorporated by reference to Exhibit 10.9.1 to the Registrant’s registration statement on Form S-1 (No. 333-140689) filed on February 14, 2007). | |
| 10.9.2 | Letter Amendment to Consent to Sublease, Dated May 10, 2004 (incorporated by reference to Exhibit 10.9.2 to the Registrant’s registration statement on Form S-1 (No. 333-140689) filed on February 14, 2007). | |
| 10.10 | JMP Group Inc. 2007 Senior Executive Bonus Plan (incorporated by reference to Exhibit 10.10 to the Registrant’s registration statement on Form S-1/A (No. 333-140689) filed on May 8, 2007). | |
| 10.11 | JMP Group LLC 2004 Equity Incentive Plan (incorporated by reference to Exhibit 10.11 to the Registrant’s registration statement on Form S-1/A (No. 333-140689) filed on May 8, 2007). | |
| 10.12 | Form of Stock Pledge Agreement (incorporated by reference to Exhibit 10.12 to the Registrant’s registration statement on Form S-1/A (No. 333-140689) filed on May 8, 2007). | |
139
Table of Contents
| Exhibit |
Description | |
| 10.13.1 | Notice of Restricted Stock Unit Agreement (Principal Portion of Award) (incorporated by referenced to Exhibit 10.13.1 to the Registrant’s quarterly report with respect to the quarter ended March 31, 2008 on Form 10-Q filed May 9, 2008) | |
| 10.13.2 | Notice of Restricted Stock Unit Agreement (Discount Portion of Award) (incorporated by referenced to Exhibit 10.13.2 to the Registrant’s quarterly report with respect to the quarter ended March 31, 2008 on Form 10-Q filed May 9, 2008) | |
| 10.13.3 | Notice of Restricted Stock Unit Agreement (Four-Year Cliff) (incorporated by referenced to Exhibit 10.13.3 to the Registrant’s quarterly report with respect to the quarter ended March 31, 2008 on Form 10-Q filed May 9, 2008) | |
| 10.13.4 | Form of 2008 Compensation Program Election Form and Participation Agreement (incorporated by referenced to Exhibit 10.13.4 to the Registrant’s Current Report on Form 8-K filed February 5, 2009) | |
| 10.13.5 | Form of Restricted Stock Bonus Award Agreement (incorporated by referenced to Exhibit 10.13.4 to the Registrant’s Current Report on Form 8-K filed February 5, 2009) | |
| 10.14 | Summary of Compensation Arrangements with Executive Officers (incorporated by referenced to Exhibit 10.1 to the Registrant’s quarterly report with respect to the quarter ended March 31, 2009 on Form 10-Q filed May 8, 2009) | |
| 10.15 | Amendment Number Two to Credit Agreement (CNB) (incorporated by referenced to Exhibit 10.15 to the Registrant’s quarterly report with respect to the quarter ended March 31, 2008 on Form 10-Q filed May 9, 2008) | |
| 10.16* | Amendment Number One to Credit Agreement (CNB) | |
| 21* | List of Subsidiaries of JMP Group Inc. | |
| 23.1* | Consent of PricewaterhouseCoopers LLP | |
| 23.2* | Consent of Deloitte & Touche LLP | |
| 23.3* | Consent of Grant Thornton LLP | |
| 31.1* | Certification of Chief Executive Officer pursuant to Section 302 of the Sarbanes-Oxley Act of 2002. | |
| 31.2* | Certification of Chief Financial Officer pursuant to Section 302 of the Sarbanes-Oxley Act of 2002. | |
| 32.1* | Certification of Chief Executive Officer pursuant to Section 906 of the Sarbanes-Oxley Act of 2002. | |
| 32.2* | Certification of Chief Financial Officer pursuant to Section 906 of the Sarbanes-Oxley Act of 2002. | |
| 99.1* | Financial statements and supplementary data of New York Mortgage Trust, Inc. | |
| * | Filed herewith |
140