Attached files
| file | filename |
|---|---|
| 8-K - CURRENT REPORT ON FORM 8-K - DELTA AIR LINES, INC. | delta_8k-030910.htm |
| EX-99.2 - INVESTOR UPDATE - DELTA AIR LINES, INC. | delta_8k-ex9902.htm |
Exhibit 99.1

Delta: A Solid
Flight Plan
Ed
Bastian, President
March
9, 2010

1
This presentation
contains various projections and other forward-looking statements which
represent Delta’s estimates or expectations regarding future events. All forward-looking
statements involve a number of assumptions, risks and uncertainties, many of which are
beyond Delta’s control, that could cause the actual results to differ materially from the
projected results. Factors which could cause such differences include, without limitation,
business, economic, competitive, industry, regulatory, market and financial uncertainties
and contingencies, as well as the “Risk Factors” discussed in Delta’s Form 10-K filed with
the SEC on February 24, 2010. Caution should be taken not to place undue reliance on
Delta’s forward-looking statements, which represent Delta’s views only as of the date of this
presentation, and which Delta has no current intention to update.
In this
presentation, we will discuss certain non-GAAP financial measures. You can
find the
reconciliations of those measures to comparable GAAP measures on our website at
delta.com.
reconciliations of those measures to comparable GAAP measures on our website at
delta.com.
Safe
Harbor

2
Delta: A Solid
Flight Plan
At
market fuel prices, Delta was the only
profitable network carrier in 2009
profitable network carrier in 2009
Well
positioned for 2010
Creating
a financially successful
airline for the long term
airline for the long term
Strong financial
foundation, premium revenue
opportunities, low cost structure and merger
synergies position Delta to take full advantage of
economic recovery
opportunities, low cost structure and merger
synergies position Delta to take full advantage of
economic recovery
Strong
financial foundation is
unique in the industry
unique in the industry
Minimal capital
requirements enable cash
investment in product quality and in balance
sheet improvement
investment in product quality and in balance
sheet improvement

3
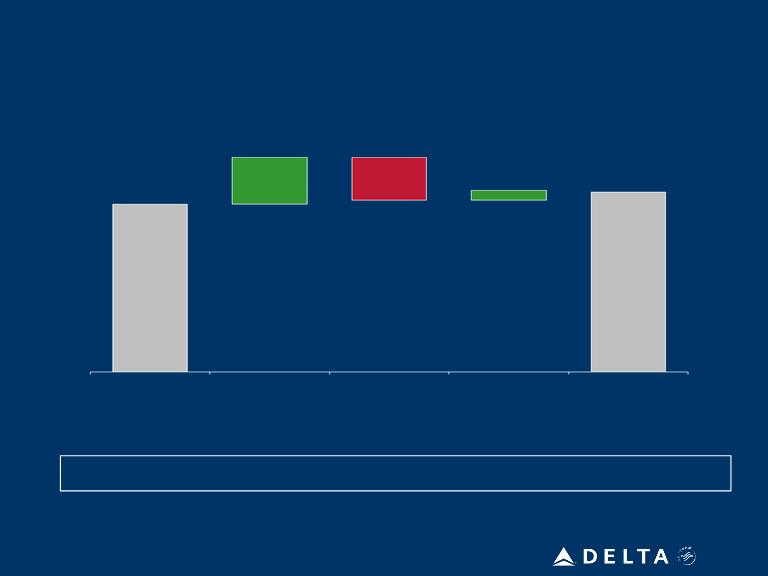
Delta’s
Performance Is Distinguished From Its Peers
2009
Pre-Tax Income,
at Market Fuel Prices ($M)
at Market Fuel Prices ($M)
2009
EBITDAR,
at Market Fuel Prices ($M)
at Market Fuel Prices ($M)
Note: All
results exclude special items. Results
adjusted to a common fuel price of $1.80 per gallon.
At
market fuel prices, Delta was the only profitable network carrier in
2009
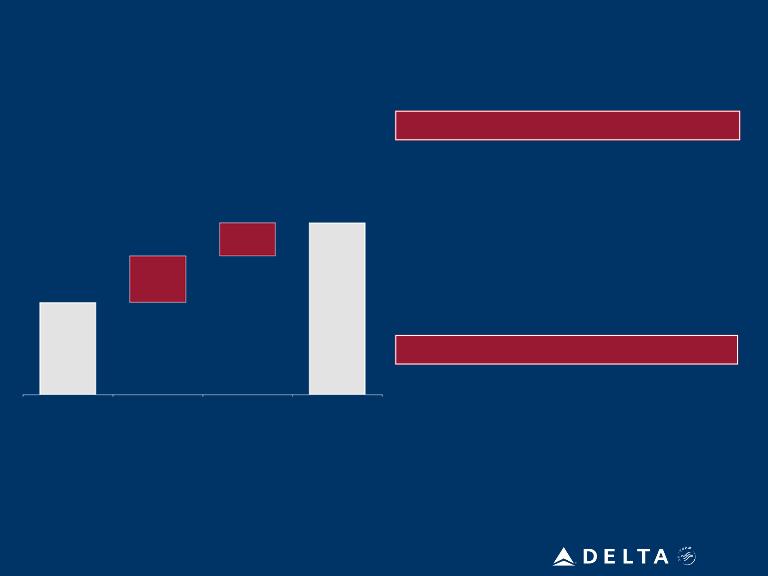
Liquidity Key to
Weathering the Economic Storm
Note:
Liquidity balance includes cash, short term securities and revolving credit
facilities.
Unrestricted
Liquidity December 2008 vs. December 2009 ($B)
Unrestricted
Liquidity
Balance
12/31/08
Unrestricted
Liquidity
Balance
12/31/09
Net
Debt
Issuance
$5.4
$5.0
$0.3
Net
Investing
($1.3)
$1.4
Operating
Cash
Flow
Positive free cash
flow despite $6 billion revenue decline
4

5
Unit
Revenue Momentum is Building
Improvement driven
by prior year comparisons, capacity discipline and
economic
recovery
recovery
Passenger
Unit Revenue - YoY Change
(23%)
16%
Note: Forecasted
value for March 2010

6
Corporate Sales
Trends Improving
Ticket
Volume
Revenue
Mar Apr May Jun Jul Aug Sep Oct Nov Dec Jan Feb
34%
32%
2009 2009 2009 2009 2009 2009 2009 2009 2009 2009 2010 2010

7
Delivering on
Merger
Benefits
Benefits
Moving Forward in
2010
$6
billion in free cash flow over next three
years to delever balance sheet
years to delever balance sheet
Strengthening
the
Balance Sheet
Balance Sheet
Generating a
Revenue
Premium
Premium
Integration
substantially complete and on
track to deliver $2 billion in run-rate
synergies by the end of 2011
track to deliver $2 billion in run-rate
synergies by the end of 2011
Drive
industry-leading revenue from
superior network and product
superior network and product

8
• Complete
rebranding of Northwest regional aircraft
• Resolve open
employee representation for flight
attendants and airport workers
attendants and airport workers
• Drive revenue
premium
Integration Of The
Airlines Substantially Complete
Remaining
Integration Items
• Single operating
certificate received
• Reservations
system integrated
• Single revenue
management system
• Frequent flyer
programs integrated
• First joint
cockpit crew
• Expanded
trans-Atlantic joint venture with AF/KLM
• Completed airport
consolidation and rebranding
Merger
Accomplishments
On
track to hit full synergy run-rate by end of 2011
9
Targeting $600
Million in New 2010 Synergies
Revenue
- $350 million
Cost
- $250 million
• Expand fleet
movements across
network
network
• S-curve
benefits
• Integrated revenue
management
technology
technology
• First fully
coordinated schedule with Air
France/KLM
France/KLM
• Improved vendor
terms from renegotiated
contracts
contracts
• Discontinued
freighter flying
• Continued
consolidation of headquarters
functions
functions
• Elimination of
duplicate technology platforms
Single operating
certificate, technology integration unlock significant value
2009
Synergies
Synergies
$700M
Revenue
Cost
2010
Synergies
Synergies
Incremental
Synergies
$250M
$350M
$1.3B

10
Delta: Generating
Revenue Premium
• Optimize fleet
allocations
• Integrated revenue
management technology
• Corporate and
agency sales contracting
• S-curve market
benefits
Targeted
market initiatives
provide additional revenue growth
opportunities
provide additional revenue growth
opportunities
• New York
strategy
• Pacific network
restructuring
Aggressive
capture of merger
synergies
synergies
• Broaden current
alliance relationships
• Attract new
partners
Expanding
global alliances to
build out the network footprint
build out the network footprint

11
Realigning Delta’s
Fleet Drives Network Synergies
SLC
MSP
A320
M90
Ability to
maximize fleet allocations drives incremental value
A320s
moved to
SLC hub, will allow
access to East
Coast markets
SLC hub, will allow
access to East
Coast markets
M90s
moved to MSP
hub, where missions do
not require longer
range aircraft
hub, where missions do
not require longer
range aircraft
International
cross fleeting
builds on successful 2009
routes by adding:
builds on successful 2009
routes by adding:
Atlanta-Paris
Detroit-Frankfurt
New York
(JFK)-Athens
New York (JFK)-Tel
Aviv
Memphis-Amsterdam
12
JFK
ATL
CDG
AMS
DTW
MSP
MEM
CVG
SLC
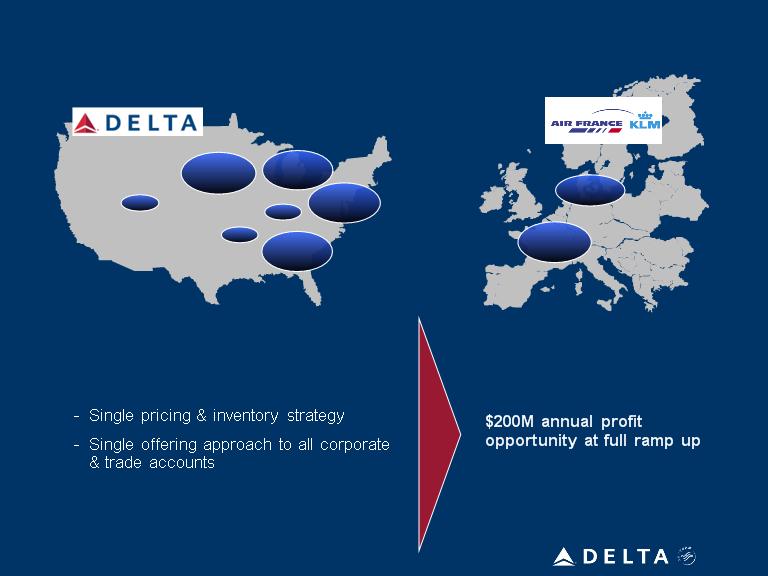
• First fully
coordinated DL/AF/KL summer
schedule will enhance JV profitability in 2010
schedule will enhance JV profitability in 2010
- Fully leveraged
hubs & beyond network
• Joint revenue
management
• Capitalizing on
point-of-sale presence in each
region
region
Leveraging
Trans-Atlantic Joint Venture To
Maximize Profits
Maximize Profits
13
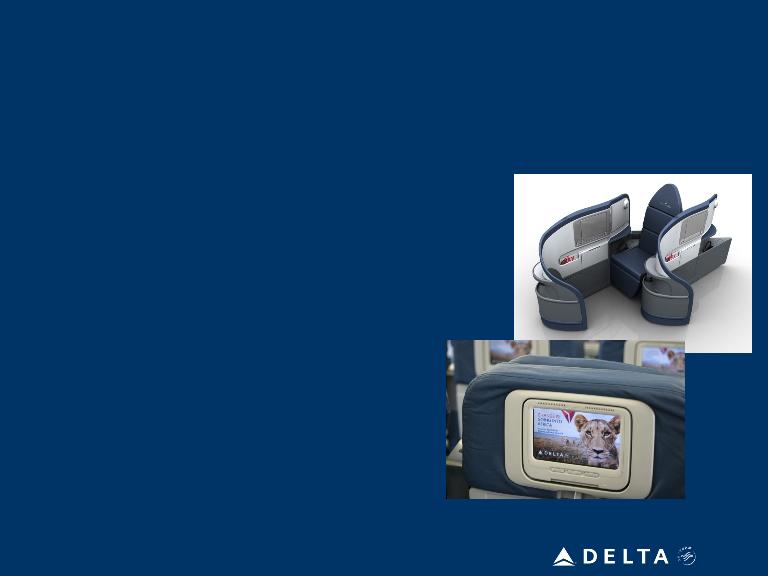
Investing in
Customer Experience, Not Re-Fleeting
Operating cash
funds $1B investment in customer experience and fleet efficiency
• All international
widebody aircraft to
have full flat-bed seats in
BusinessElite
have full flat-bed seats in
BusinessElite
• Expanding in-seat
audio and video on
demand for customers on all wide-
body aircraft
demand for customers on all wide-
body aircraft
• Adding First Class
cabins to all 70-
seat regional jets
seat regional jets
• Completing
conversions of pre-
merger Northwest aircraft to Delta
interiors
merger Northwest aircraft to Delta
interiors
• Installing
winglets on more than 170
additional aircraft to improve fuel
efficiency
additional aircraft to improve fuel
efficiency
• New SkyClub
locations

14
Targeting Flat
Unit Costs Excluding Fuel in 2010
Consolidated
CASM ex Fuel (¢)
8.25
8.28
2009
2010
Key
cost synergies/productivity initiatives
• Improved vendor
contract terms
• Further
streamlining overhead and technology
• Airport
efficiencies
• Savings from
grounding older, less efficient
aircraft
aircraft
• Incremental
benefits of 2009 actions (i.e., freighter
grounding, aligning staffing levels)
grounding, aligning staffing levels)
Expected
cost pressures
• Engine maintenance
volume
• Investments in
employees
• Customer and
product investment initiatives
Benefits from cost
synergies and productivity offset cost pressures
Note: All
figures exclude special items
Mainline
CASM ex Fuel (¢)
7.40
7.40
2009
2010

Managing Fuel
Price Risk Through Systematic
Hedging
Hedging
Downside
Participation
76%
78%
86%
91%
83%
Note: Hedging
portfolio data as of March 5, 2010
• Use of call options
will allow for downside price participation but will
protect against upward cost pressures
protect against upward cost pressures
Avg.
Crude Call
Projected fuel
price
$2.22
$2.33
$2.43
$2.45
$2.36
15
Collars
Swaps
Call
options
47%
49%
29%
20%
36%

16
Free
Cash Flow Will Drive Balance Sheet Delevering
Operating Cash
Flow
Capital
Expenditures
$3 -
$4 billion
Total
Three Year Projection
2010
- 2012
$9 -
$10 billion
Adjusted Net Debt
($B)
12/31/09
12/31/12
Free
Cash Flow
~$6
billion
Strong operating
cash flow, coupled with minimal capital requirements

17
Revenue Strength
Driving Improved March Quarter Expectations
|
|
|
March
quarter 2010
|
|
January
26
guidance |
|
|
Operating
margin
|
1 -
2%
|
|
Breakeven
|
|
|
|
Fuel
price
|
$2.22
|
|
$2.22
|
|
|
|
Total
unrestricted liquidity
|
$5.5
billion
|
|
$5.6
billion
|
|
|
|
|
|
|
|
|
|
|
|
|
March
quarter 2010 vs.
March quarter 2009 |
|
|
|
|
Consolidated
non-fuel
unit
cost
|
Up 1 -
2%
|
|
Flat to up
2%
|
|
|
|
|
|
|
|
|
|
|
System
capacity
|
Down 4 -
5%
|
|
Down 3 -
5%
|
|
|
|
|
Domestic
|
Down 2 -
3%
|
|
Down 1 -
3%
|
|
|
|
International
|
Down 7 -
8%
|
|
Down 5 -
7%
|
|
February storms
net impact expected to be $30 million for the quarter
Note: Fuel
price is net of hedge
impact, and includes approximately $0.24 for taxes, transportation, and option
premiums

18
Progress Being
Made … More Work To Do
Encouraged with
ability to withstand economic headwinds, but improvements
remain to achieve our shareholder return goals
remain to achieve our shareholder return goals
10
- 12% operating margin
$2.5
- $3.0 billion in operating
cash flows
cash flows
Minimize
capital reinvestment
requirements
requirements
Delever
the balance sheet
Generate
10% return on invested capital

Non-GAAP Financial
Measures
Delta
completed its merger with Northwest Airlines on October 29, 2008. Accordingly,
Delta’s financial results prepared in accordance with accounting
principles generally accepted in the U.S. (GAAP) include the results of Northwest Airlines for 2009.Under GAAP, Delta does not include in its financial
results the results of Northwest Airlines prior to the completion of the merger. Accordingly, Delta’s financial results under GAAP for 2008 include the
results of Northwest Airlines for the period from October 30, 2008 through December 31, 2008. This impacts the comparability of Delta’s financial
statements under GAAP for 2009 and 2008.
Year-over-year
comparisons in certain presentations assume the 2008 financial statements were
prepared on a combined basis, excluding special
items. “Combined basis” means the company combines the financial results of Delta and Northwest as if the merger had occurred prior to the beginning
of the applicable period. Delta believes presenting this financial information on a combined basis provides a more meaningful basis for comparing
Delta’s year-over-year financial performance than the GAAP financial information.
Delta is
unable to reconcile certain forward-looking projections to GAAP as the nature or
amount of special items cannot be estimated at this time.
Delta
excludes special items and fuel hedge losses because management believes the
exclusion of these items is helpful to investors to evaluate the
company's recurring operational performance.
company's recurring operational performance.
Earnings
before interest, taxes, depreciation, amortization and aircraft rent (EBITDAR)
has been presented as management believes it is helpful to
investors in utilizing EBITDAR as a proxy for operating cash flow on a period over period basis.
investors in utilizing EBITDAR as a proxy for operating cash flow on a period over period basis.
Delta
presents net investing activities and net debt issuance because management
believes this metric is helpful to investors to evaluate the
company's
investing and financing activities.
investing and financing activities.
Delta
presents consolidated and Mainline cost per available seat mile (CASM) excluding
fuel expense and related taxes because management believes
the volatility in fuel prices impacts the comparability of year-over-year financial performance. Consolidated and Mainline CASM exclude ancillary
businesses not associated with the generation of a seat mile. These businesses include expenses related to Delta’s providing maintenance services
(MRO), staffing services and dedicated freight operations as well as Delta’s vacation wholesale operations.
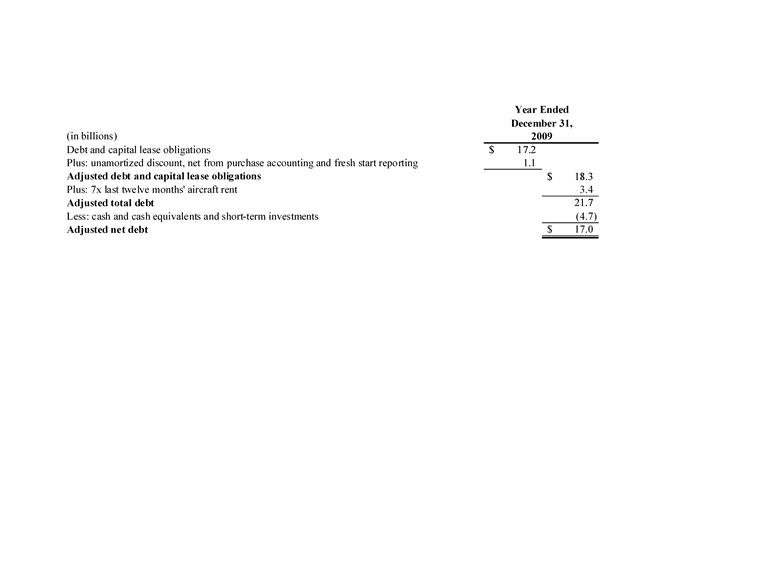
Delta
uses adjusted total debt, including aircraft rent, in addition to long-term
adjusted debt and capital leases, to present estimated financial
obligations.
Delta reduces adjusted total debt by cash and cash equivalents and short-term investments, to present the amount of additional assets needed to satisfy
the debt.
Delta reduces adjusted total debt by cash and cash equivalents and short-term investments, to present the amount of additional assets needed to satisfy
the debt.
The
non-GAAP financial measures should be considered in addition to results prepared
in accordance with GAAP, but should not be considered a
substitute for or superior to GAAP results.
substitute for or superior to GAAP results.

Pre-Tax
Income

EBITDAR

Net
Investing

Net
Debt Issuance

Revenue

Non-Fuel
CASM

Mainline Non-Fuel
CASM
Adjusted Net
Debt