Attached files
| file | filename |
|---|---|
| EX-21 - SUBSIDIARIES OF TESCO CORPORATION - TESCO CORP | tesco21.htm |
| EX-23 - CONSENT OF PRICEWATERHOUSECOOPERS LLP - TESCO CORP | tesco23.htm |
| EX-31.2 - SECTION 302 CERTIFICATION OF CFO - TESCO CORP | tesco312.htm |
| EX-31.1 - SECTION 302 CERTIFICATION OF CEO - TESCO CORP | tesco311.htm |
| EX-10.21 - SHORT TERM INCENTIVE PLAN 2010 - TESCO CORP | tesco1021.htm |
| EX-32 - SECTION 906 CERTIFCATIONS OF CEO AND CFO - TESCO CORP | tesco32.htm |
UNITED
STATES
SECURITIES
AND EXCHANGE COMMISSION
Washington, D.C.
20549
Form 10-K
|
þ
|
ANNUAL
REPORT PURSUANT TO SECTION 13 OR 15(d) OF THE SECURITIES EXCHANGE ACT
OF 1934
|
For the
Fiscal Year Ended December 31, 2009
|
¨
|
TRANSITION
REPORT PURSUANT TO SECTION 13 OR 15(d) OF THE SECURITIES EXCHANGE ACT
OF 1934
|
For the
transition period from
to
Commission
file number: 001-34090

Tesco
Corporation
(Exact
name of registrant as specified in its charter)
|
Alberta
|
76-0419312
|
|
(State
or Other Jurisdiction
of
Incorporation or Organization)
|
(I.R.S.
Employer
Identification
No.)
|
|
3993
West Sam Houston Parkway North
Suite 100
Houston,
Texas
|
77043-1221
|
|
(Address
of Principal Executive Offices)
|
(Zip
Code)
|
713-359-7000
(Registrant’s
telephone number, including area code)
Securities
to be registered pursuant to Section 12(b) of the Act:
|
Title
of Each Class
|
Name
of Each Exchange on Which Registered
|
|
|
Common
Shares, without par value
|
Nasdaq Global Market
|
Securities
registered pursuant to Section 12(g) of the Act:
None
Indicate
by check mark if the registrant is a well-known seasoned issuer, as defined in
Rule 405 of the Securities Act. Yes
¨ No
þ
Indicate
by check mark if the registrant is not required to file reports pursuant to
Section 13 or 15(d) of the
Act. Yes ¨ No þ
Indicate
by check mark whether the registrant (1) has filed all reports required to
be filed by Section 13 or 15(d) of the Securities Exchange Act of 1934
during the preceding 12 months (or for such shorter period that the
registrant was required to file such reports), and (2) has been subject to
such filing requirements for the past
90 days. Yes þ No ¨
Indicate
by check mark if disclosure of delinquent filers pursuant to Item 405 of
Regulation S-K is not contained herein, and will not be contained, to the
best of registrant’s knowledge, in definitive proxy or information statements
incorporated by reference in Part III of this Form 10-K or any
amendment to this Form 10-K. þ
Indicate
by check mark whether the registrant is a large accelerated filer, an
accelerated filer, a non-accelerated filer, or a smaller reporting company. See
the definitions of “large accelerated filer,” “accelerated filer” and “smaller
reporting company” in Rule 12b-2 of the Exchange Act. (Check one):
|
Large
accelerated filer ¨
|
Accelerated
filer þ
|
|
Non-accelerated
filer ¨ (Do not check if
a smaller reporting company)
|
Smaller
reporting company ¨
|
Indicate
by check mark whether registrant is a shell company (as defined in
Rule 12b-2 of the Exchange
Act). Yes ¨ No þ
Aggregate
market value of the voting and non-voting common equity held by nonaffiliates of
the registrant: $298,560,301. This figure is estimated as of June 30, 2009, at
which date the closing price of the registrant’s shares on the Nasdaq Global
Market was $7.94 per share.
Number of
shares of Common Stock outstanding as of February 25,
2010: 37,752,911
DOCUMENTS
INCORPORATED BY REFERENCE
Listed
below is the document parts of which are incorporated herein by reference and
the part of this report into which the document is incorporated: Proxy Statement
for 2010 Annual Meeting of Stockholders—Part III
|
Page
|
||||
|
PART I
|
||||
|
Item 1.
|
1
|
|||
|
Item 1A.
|
8
|
|||
|
Item 1B.
|
14
|
|||
|
Item 2.
|
15
|
|||
|
Item 3.
|
16
|
|||
|
Item 4.
|
17
|
|||
|
PART II
|
||||
|
Item 5.
|
18
|
|||
|
Item
6.
|
20
|
|||
|
Item
7.
|
23
|
|||
|
Item 7A.
|
43
|
|||
|
Item
8.
|
44
|
|||
|
Item 9.
|
44
|
|||
|
Item
9A.
|
44
|
|||
|
Item 9B.
|
45
|
|||
|
PART III
|
||||
|
Item 10.
|
46
|
|||
|
Item 11.
|
46
|
|||
|
Item 12.
|
46
|
|||
|
Item 13.
|
46
|
|||
|
Item 14.
|
46
|
|||
|
PART IV
|
||||
|
Item 15.
|
47
|
PART
I
|
ITEM 1.
|
Background
Tesco
Corporation (“TESCO” or the “Company”) is a global leader in the design,
manufacture and service delivery of technology based solutions for the upstream
energy industry. We seek to change the way wells are drilled by delivering safer
and more efficient solutions that add real value by reducing the costs of
drilling for and producing oil and gas. Our product and service offerings
consist mainly of equipment sales and services to drilling contractors and oil
and gas operating companies throughout the world. In addition to our top drive
sales and service business, our service offerings include proprietary
technology, including TESCO CASING DRILLING®
(“CASING DRILLING”), TESCO’s Casing Drive System (“CDS™” or “CDS”) and
TESCO’s Multiple Control Line Running System (“MCLRS™” or “MCLRS”). TESCO® is a
registered trademark in Canada and the United States. TESCO CASING DRILLING® is a
registered trademark in the United States. CASING DRILLING® is a
registered trademark in Canada and CASING DRILLING™ is a trademark in the United
States. Casing Drive System™, CDS™, Multiple Control Line Running System™ and
MCLRS™ are trademarks in Canada and the United States.
TESCO was
created on December 1, 1993 through the amalgamation of Shelter Oil and Gas
Ltd., Coexco Petroleum Inc., Forewest Industries Ltd. and Tesco Corporation. The
amalgamated corporation continued under the name Tesco Corporation, which is
organized under the laws of Alberta, Canada. Unless the context indicates
otherwise, a reference in this Form 10-K to “TESCO”, “the Company”, “we” or “us”
includes Tesco Corporation and its subsidiaries.
Our
principal executive offices are located at 3993 West Sam Houston Parkway North,
Suite 100, Houston, Texas 77043; our telephone number is (713) 359-7000;
and our Internet website address is www.tescocorp.com. Our annual
reports on Form 10-K, quarterly reports on Form 10-Q and current reports on Form
8-K, and all amendments thereto, are available free of charge on our Internet
website. These reports are posted on our website as soon as reasonably
practicable after such reports are electronically filed in the United States
(“U.S.”) with the U.S. Securities and Exchange Commission (“SEC”) and in Canada
on the System for Electronic Document Analysis and Retrieval (“SEDAR”). Our Code
of Conduct Policy is also posted on our website. Our common stock is traded on
the Nasdaq Global Market under the symbol “TESO.”
Basis
of Presentation
These
Consolidated Financial Statements have been prepared by management in accordance
with accounting principles generally accepted in the United States of America
(“U.S. GAAP”). The consolidated financial statements include the accounts of the
Company and its majority owned domestic and foreign subsidiaries. All
significant intercompany transactions and balances have been eliminated in
consolidation. Although we are a U.S. registrant with the SEC, TESCO is
organized under the laws of Alberta and is therefore subject to the Business
Corporation Act (Alberta). TESCO is also a reporting issuer (or the equivalent)
in each of the provinces of Canada and is subject to securities legislation in
each of those jurisdictions.
Foreign
Currency Translation
Unless
indicated otherwise, all amounts stated in this Form 10-K are denominated in
U.S. dollars. All references to US$ or $ are to U.S. dollars and references to
C$ are to Canadian dollars.
For
foreign operations where the local currency is the functional currency,
specifically the Company’s Canadian operations, assets and liabilities
denominated in foreign currencies are translated into U.S. dollars at
end-of-period exchange rates, and the resulting translation adjustments are
reported, net of their related tax effects, as a component of Accumulated
Comprehensive Income in Stockholders’ Equity. Assets and liabilities denominated
in currencies other than the functional currency are remeasured into the
functional currency prior to translation into U.S. dollars, and the resulting
exchange gains and losses are included in income in the period in which they
occur. Income and expenses are translated into U.S. dollars at the average
exchange rates in effect during the period.
The
reporting currency affects the presentation in our Consolidated Financial
Statements, but not the underlying accounting records, which are maintained in
the functional currency of our business units. The financial results for our
Canadian operations have been translated into U.S. dollars as described in Note
3 of the Consolidated Financial Statements included in Part II, Item 8,
“Financial Statements and Supplementary Data.”
Segments
Our four
business segments are: Top Drive, Tubular Services, CASING DRILLING and Research
and Engineering. Prior to December 31, 2008, we organized our activities into
three business segments: Top Drives, Casing Services and Research and
Engineering. Effective December 31, 2008, we segregated our Casing Services
segment into Tubular Services and CASING DRILLING and our financial and
operating data for the year ended December 31, 2007 has been recast in this
Annual Report on Form 10-K to be presented consistently with this
structure.
The Top
Drive business is comprised of top drive sales, top drive rentals and
after-market sales and service. The Tubular Services business includes both our
proprietary and conventional Tubular Services. The CASING DRILLING segment
consists of our proprietary CASING DRILLING technology. The Research and
Engineering segment is comprised of our research and development activities
related to our proprietary Tubular Services, CASING DRILLING technology and Top
Drive model development. For financial information regarding each segment,
including revenues from external customers and a measure of profit or loss,
refer to Part II, Item 7, “Management’s Discussion and Analysis of
Financial Condition and Results of Operations.”
For
segment operating results and geographic information, see Note 13 to the
Consolidated Financial Statements included in Part II, Item 8, “Financial
Statements and Supplementary Data.”
Top
Drive Segment
Our Top
Drive segment sells equipment and provides services to drilling contractors and
oil and gas operating companies throughout the world. We provide top drive
rental services on a day-rate basis for land and offshore drilling rigs, and we
provide after-market sales and service for our customers.
We
primarily manufacture top drives that are used in drilling operations to rotate
the drill string while suspended from the derrick above the rig floor. Our top
drives offer portability and flexibility, permitting drilling companies to
conduct top drive drilling for all or any portion of a well. We offer for sale a
range of portable and permanently installed top drive products that includes
both hydraulically and electrically powered machines capable of delivering 400
to 1,350 horsepower, with a rated lifting capacity of 150 to 750 tons. With each
top drive we sell, we offer the services of top drive technicians who provide
customers with training, installation and support services.
We offer
six distinct model series of top drive systems, using hydraulic, permanent
magnet alternating current (“AC”) and induction AC technology. We believe that
we are industry leaders in the development and provision of permanent magnet
technology in both portable and permanently installed top drive systems. This
technology provides very high power density, allowing for high performance and
low weight. We use AC induction technology and late generation power electronics
in our smaller horsepower systems, such as our EMI machines, allowing the end
user to specify its preferred power electronics and motor combination and
permitting us to select components from a larger vendor base. EMI top drive
units are available with 150 and 250 ton load path configurations. We also
developed our EXI system in response to market demands for a high performance
compact electric top drive system, commonly required on modern fast moving rigs
frequently used in pad drilling operations. The EXI system has a load path
rating of 350 tons and generates 600 horsepower at the quill. The HXI is a new
generation of our current hydraulic HMI system, incorporating a full suite of
operational features and providing a significant gain in performance at the
quill. The HXI machine has a load path rating of 250 tons and has a 700
horsepower self-contained diesel driven hydraulic power unit.
In
addition to our top drive sales, we rent top drives on a day-rate basis for land
and offshore drilling rigs. Our rental fleet offers a range of systems that can
be installed in practically any mast configuration, including workover rigs. Our
fleet is composed principally of hydraulically powered top drive systems, with
power ratings of 460 to 1,350 horsepower and load path ratings of 150 to 750
tons, each equipped with its own independent diesel engine driven hydraulic
power unit. This unique combination permits a high level of portability and
installation flexibility.
Our top
drive rental fleet is deployed strategically around the world to be available to
customers on a timely basis. The geographic distribution of the 117-unit fleet
at December 31, 2009 included the following regions (in order of the size
of our rental fleet in each region): the United States, South America, Mexico,
Asia Pacific, Canada, Russia and the Middle East. Our fleet is highly
transportable and we mobilize the top drive units to meet customer requests.
Demand for our top drive rental services is directly tied to active rig count.
According to data published by Baker Hughes in December 2009, operating rig
count in the U.S. declined by approximately 35% from December 2008, and declined
over 40% from peak operations in mid-2008. International operating rig count
sustained better than the U.S. In response to these operating conditions, we
redeployed over 10% of our U.S. fleet to international locations during 2009,
including the Middle East, Latin America, Russia and Asia.
TESCO
also provides after-market sales and services to our installed customer base
around the globe. We maintain regional stocks of high-demand parts in order to
expedite top quality, original replacement parts for top drive systems. Our
service offerings include the commissioning of all new units and recertification
of working units including top drives, power units and various other top drive
product and component repairs. Our field-experienced personnel are available for
the rig up and installation of all units – both rentals and customer-owned
units. Our personnel also provide onsite training and top drive supervision. In
addition, technicians are available to perform ongoing maintenance
contracts.
Tubular
Services Segment
Our
Tubular Services business segment includes a suite of proprietary offerings, as
well as conventional casing and tubing running services. Casing is steel pipe
that is installed in oil, gas or geothermal wells to maintain the
structural and pressure integrity of the well bore, isolate water bearing
surface sands, prevent communication between subsurface strata, and provide
structural support of the wellhead and other casing and tubing strings in the
well. Most operators and drilling contractors install casing using service
companies, like ours, who use specialized equipment and personnel trained for
this purpose. Wells can have from two to ten casing strings installed of various
sizes. These jobs encompass wells from vertical holes to high angle extended
reach wells and include both onshore and offshore applications.
Our
proprietary service offerings use certain components of our CASING DRILLING
technology, in particular the patented Casing Drive System (“CDS”), to provide a
safer and more automated method for running casing and, if required, reaming the
casing into the hole. The CDS is a tool which facilitates running and reaming
casing into a well bore on any rig equipped with a top drive. This tool offers
improved safety and efficiency over traditional methods by eliminating
operations that are associated with high risk of personal injury. It also
increases the likelihood that the casing can be run to casing point on the first
attempt, offers the ability to simultaneously rotate and reciprocate the casing
string as required while circulating drilling fluid, and requires fewer people
on the rig for casing running operations.
We also
offer installation service of deep water smart well completion equipment using
our Multiple Control Line Running System (“MCLRS”) proprietary and patented
technology. We believe this technology substantially improves the quality of the
installation of high-end well completions by eliminating damage and splices to
control and injection lines. We also believe this technology improves the speed
and safety of the completion process by splitting the work area between
personnel making up the tubing and personnel installing completion
equipment.
CASING
DRILLING Segment
TESCO’s
CASING DRILLING process uses oilfield casing in place of drill pipe to
simultaneously drill and case the well, reducing both drilling time and the
chance of unscheduled drilling events. CASING DRILLING technology minimizes the
use of conventional drill pipe and drill collars and enables the operators to
eliminate pipe trips and case the interval while drilling. This avoids well bore
exposure during tripping and mitigates associated risks such as borehole
collapse, lost circulation problems, and stuck tools or pipe.
The
CASING DRILLING retrievable bottomhole assembly, which is comprised of the drill
bit and other downhole tools, such as drilling motors, rotary steerable drilling
systems, measurement–while–drilling and logging–while–drilling equipment, are
lowered via wireline, drill pipe or a tubing string inside the casing and
latched to the bottom joint of casing, retaining the ability to maintain the
circulation of drilling fluid at all times. Tools are recovered in a similar
fashion, by use of wireline, or alternatively drill pipe or a tubing string.
Since the casing remains on bottom in the well at all times, wellbore integrity
is preserved, and the risk of a well control incident is reduced. Because the
well is cased as it is drilled, the potential for unintentional sidetracking is
significantly reduced. The risk of tool loss in the hole is also
reduced.
Research
and Engineering Segment
As a
technology driven company, we continue to invest significantly in research and
development activities, primarily related to our proprietary technologies in
Tubular Services, CASING DRILLING and top drive model development. We hold
rights, through patents and patent license agreements, to patented and/or patent
pending technologies for the innovations that have significant potential
application to our core businesses. Our patent portfolio currently includes 114
issued patents and 137 pending patent applications. We will continue to invest
in the development, commercialization and enhancements of our proprietary
technologies.
Seasonality
Our
business is subject to seasonal cycles, associated with winter-only,
summer-only, dry-season or regulatory-based access to drilling locations. The
most significant of these occur in Canada and Russia, where traditionally the
first and fourth calendar quarters of each year are the busiest as the
contractor fleet can access drilling locations that are only accessible when
frozen. However, we feel we have limited exposure to this issue because as of
December 31, 2009, approximately 10% of our top drive rental fleet operated
in Canada and Russia.
In certain
Asia Pacific and South American regions, we are subject to decline in activities
due to seasonal rains. Further, seasonal variations in the demand for
hydrocarbons and accessibility of certain drilling locations in North America
can affect our business, as our activity follows the active drilling rig count
reasonably closely. We actively manage our highly mobile rental fleet around the
world to minimize the impact of geographically specific
seasonality.
Customers
Our
customers for top drive sales and after-market sales and service primarily
consist of drilling contractors, rig builders and equipment brokers and
occasionally include major and independent oil and gas companies and national
oil companies who wish to own and manage their own top drive systems. Our
customers for our rental fleet include drilling contractors, major and
independent oil and gas companies and national oil companies. Demand for our top
drive products depends primarily upon capital spending of drilling contractors
and oil and gas companies and the level of drilling activity. Our top drive
business is distributed globally with 48% of our top drive revenues generated
from the North American markets (excluding Mexico) and 52% from international
markets.
Our
Tubular Services and CASING DRILLING customers also primarily consist of oil and
gas operating companies, including major and independent companies, national oil
companies and, on occasion, drilling contractors that have contractual
obligations to provide tubular running and handling services. Demand for our
Tubular Services and CASING DRILLING services strongly depends upon capital
spending of oil and gas companies and the level of drilling activity. Our
Tubular Services business is primarily focused in the North American markets
(excluding Mexico) where 66% of our 2009 Tubular Services revenues were
generated with the remaining 34% from international markets. Our CASING DRILLING
business is distributed globally with approximately 46% of our 2009 CASING
DRILLING revenues generated in North American markets (excluding Mexico) and 54%
from international markets.
Inventory
Our
inventory consists primarily of completed top drives and component parts,
proprietary, specialized tubular services and casing tool parts, spare parts,
work in process, and raw materials to support our ongoing manufacturing
operations and our installed base of specialized equipment used throughout the
world. Customers rely on us to stock these specialized items to ensure that
their equipment can be repaired and serviced in a timely manner. We maintain a
supply of high-demand, fast-moving parts in regional locations to provide prompt
service to our global customer base. We also have a global distribution center
that manages an inventory of long lead time items and semi-finished goods to
support our after-market sales and service business and our manufacturing
operations.
Inventory
costs for manufactured equipment are stated at the lower of cost or market using
specific identification. Inventory costs for spare parts are stated at the lower
of cost or market using the average cost method. We also perform an obsolescence
review on our slow-moving and excess inventories and establish reserves based on
such factors as usage of inventory on-hand, technical obsolescence and market
conditions, as well as future expectations related to our manufacturing sales
backlog, our installed asset base and the development of new
products.
The
recent global economic downturn, coupled with the global financial and credit
market disruptions, has had a significant negative impact on the oil and gas
industry. These events have contributed to a sharp decline in crude oil and
natural gas prices and a sharp drop in demand. This decreased demand is evident
in our top drive sales backlog; we ended 2009 with a backlog of 11 units, with a
total value of $16.1 million, compared to a backlog of 65 top drive units at
December 31, 2008, with a total value of $56.9 million. We considered the
long-term effects of the economic downturn as we evaluated the carrying value of
our global inventory in connection with the completion of our 2010 operating
forecasts. This analysis included part-by-part evaluation of inventory turnover,
obsolescence due to technological advances and projected sales estimates based
on the current operating environment and the timing of forecasted economic
recovery. Based on this analysis, we recorded a charge of $14.4 million to
reflect the net realizable value of that inventory. Please refer to Part II,
Item 7, “Management’s Discussion and Analysis of Financial Condition and Results
of Operations.”
Raw
Materials
We
procure raw materials and components from many different vendors located
throughout the world. A portion of these components are electrical in nature,
including permanent magnet motors, induction motors and drives. We also purchase
hydraulic components, such as motors, from certain suppliers located in the
United States. In order to manufacture many of our proprietary parts, we require
substantial quantities of steel. We select our component sources from, and
establish supply relationships with, vendors who are prepared to develop
components and systems that allow us to produce high performance, reliable
and compact machines. For both our electric and hydraulic top drive systems we
source key components, such as AC motors, power electronics, and hydraulic
systems, from vendors who have developed these components for
commercial, often non-oilfield applications, and who have adapted them for
service conditions specific to our applications. Consequently, our ability
to maintain timely deliveries and to provide long term support of certain models
may depend on the supply of these components and systems. We attempt to minimize
risks associated with this dependency through the development of supply
agreements to maintain acceptable levels of ready components.
Backlog
We
believe that top drive backlog is a leading indicator of how our business will
be affected by changes in the global macro-economic environment. We consider a
product sale order as backlog when the customer has signed a purchase contract,
submitted the purchase order and, if required by the purchase agreement, paid a
non-refundable deposit. As a result of the weakened economic and industry
conditions in 2009, we experienced a lower order rate and ended the year with a
backlog of 11 units, with a total value of $16.1 million, compared to a backlog
of 65 top drive units at December 31, 2008, with a total value of $56.9 million.
While we have seen a recent increase in sales activity, our customers have
maintained their focus on lowering project costs and, accordingly, we have
adjusted our sales prices on selected product offerings. We believe that for our
top drive business, a backlog of two quarters of production is reasonable and
allows us to effectively manage our supply chain and workforce, yet be
responsive to our client base.
In
response to declining demand for our top drives due to industry and operating
conditions, we downsized our manufacturing operations substantially during 2009.
We have maintained a core team, which can continue to deliver a reasonable
number of top drives each month to meet current and expected demand. Our current
manufacturing capacity allows us to build up to four to six top drive units per
month, depending on system complexity, down from 2008’s peak production levels
of 12 to 16 units per month. Our manufacturing operations are flexible, and we
will continue to manage our production levels to meet demand. We believe that
our top drive business needs to maintain manufacturing inventory of one to two
quarters of production to limit our exposure in the event that the sales market
softens and allows us to effectively manage our supply chain and
workforce.
Revenue
from services is recognized as the services are rendered, based upon agreed
daily, hourly or job rates. Accordingly, we have no backlog for
services.
Competitive
Conditions
We were
the first top drive manufacturer to provide portable top drives for land
drilling rigs, thereby accelerating the growth of the onshore top drive market.
We estimate that approximately 60% of land drilling rigs are currently
equipped with top drive systems, including the former Soviet Union and China
where few rigs operate with top drives today. By contrast, we estimate that
approximately 95% of offshore rigs are equipped with top drives. We believe that
significant further market potential exists for our top drive drilling system
technology, including both portable and permanently installed applications.
Further, where many top drive systems approach the end of their useful lives and
are inefficient or may not have legacy parts available, we believe that a market
for replacement systems will be created. This represents an important
opportunity for us.
Our
primary competitors in the sale of top drive systems are National Oilwell Varco,
Inc. (“NOV”) and Canrig Drilling Technology Ltd., a subsidiary of Nabors
Industries Ltd. We have the second largest customer installed base and are the
number two global provider of top drives, following NOV. Of the three major top
drive system providers, we are the only company that maintains a sizeable fleet
of assets solely for the purposes of rental. Competition in the sale of top
drive systems takes place primarily on the basis of the features and capacities
of the equipment, the quality of the services and technical support offered,
delivery lead time and, to a varying extent, price.
The
conventional tubular services market consists principally of several large,
global operators and a large number of small and medium-sized operators that
typically operate in limited geographic areas where the market is highly
fragmented. The largest global competitors in this market are Weatherford
International, Inc. (“Weatherford International”), Franks International, Inc.
and BJ Services Company. Competition in the conventional tubular services market
takes place primarily on the basis of the quality of the services offered, the
quality and utility of the equipment provided, the proximity of the service
provider and equipment to the work site and, to a certain extent, on
price.
We are
aware of competitive technology similar to our CDS tool. We believe that we
continue to be the market leader in this technology. Other companies offering
similar technology include NOV, Weatherford International and Franks
International, Inc. Our CDS system is easily and quickly installed on any top
drive system and we have the advantage of being able to offer skilled and
trained personnel at the field level who have specialized knowledge of top drive
drilling system operations.
We are
not currently aware of any commercially or technically viable direct competition
for our proprietary CASING DRILLING retrievable process, services or products,
although several of our competitors are known to have developed prototypes that
are similar, and in some cases have deployed them in a field environment. We
continue to be the only company offering customers a broad range of tool sizes
and the possibility of using casing to drill directional wells combined with
specialized equipment that can be readily retrieved when the drilling is
complete.
We
believe that the that primary competition to our CASING DRILLING process is the
traditional drill pipe drilling process and, to a lesser extent, other
methods for casing while drilling that do not involve a retrievable bottom hole
assembly. Such alternative methods of casing while drilling offer limited
applications because of the cutting structure, and they cannot be combined with
directional tools which facilitate the drilling of directional (i.e.
non-vertical) wells. While we offer such alternative (i.e.
non-retrievable) methods in addition to our proprietary CASING DRILLING
process, we believe that Weatherford International has the largest share of the
non-retrievable portion of the market, although Baker Hughes is supplying an
increasing number of EZCaseTM bits
(a trademark held by Baker Hughes) which our CASING DRILLING team is using on
behalf of the operators.
Intellectual
Property
We pursue
patent protection in appropriate jurisdictions for the innovations that have
significant potential application to our core businesses. We hold patents and
patent applications in the United States, Canada, Europe, Norway, and various
other countries. We also hold rights, through patent license agreements, to
other patented and/or patent pending technologies. Our patent portfolio
currently includes 114 issued patents and 137 pending patent
applications.
We
generally retain all intellectual property rights to our technology through
non-disclosure and technology ownership agreements with our employees,
suppliers, consultants and other third parties with whom we do
business.
The
overall design of our portable top drive assembly is protected by patents that
will continue in force for several more years. Various specific aspects of the
design of the top drive and related equipment are also patented, including the
torque track system that improves operational handling by absorbing the torque
generated by our top drive.
Our CASING DRILLING method
and retrievable apparatus are protected by patents that will continue in force
for several more years. In addition, we have patents that protect the
combination of the retrievable drill bit assembly with a rotary steerable tool.
Our CDS is protected by patents on some of the gripping tools and on the “link
tilt” system, which is a method used to handle casing.
We hold
numerous patents related to the installation and utilization of certain
accessories for casing for purposes of casing rotation. Various other related
methods and tools are patent protected as well.
Please
see Part I, Item 1A “Risk Factors— We have been party to patent
infringement claims and we may not be able to protect or enforce our
intellectual property rights.” In addition, for a discussion of legal
proceedings involving our intellectual property, please see Part I, Item 3
“Legal Proceedings.”
Environmental
Matters
We are
subject to numerous environmental, legal, and regulatory requirements related to
our operations worldwide. In the United States, these laws and regulations
include, among others:
|
·
|
the
Comprehensive Environmental Response, Compensation, and Liability
Act;
|
|
·
|
the
Resources Conservation and Recovery Act;
|
|
·
|
the
Clean Air Act;
|
|
·
|
the
Federal Water Pollution Control Act; and
|
|
·
|
the
Toxic Substances Control Act.
|
In
addition to the federal laws and regulations, states and other countries where
we do business may have numerous environmental, legal, and regulatory
requirements by which we must abide. We evaluate and address the environmental
impact of our operations by assessing and remediating contaminated properties in
order to comply with environmental, legal, and regulatory requirements and to
avoid future liabilities. On occasion, we are involved in specific environmental
claims, including the remediation of properties we own or have operated, as well
as efforts to meet or correct compliance-related matters. Our Quality, Health,
Safety and Environment group has programs in place to maintain environmental
compliance and to prevent the occurrence of environmental
contamination.
We do not
expect costs related to these remediation activities to have a material adverse
effect on our consolidated financial position, results of operations or cash
flows. During 2009, we completed the sale of a building and land located in
Canada. We incurred approximately $0.1 million and $0.9 million during the years
ended December 31, 2009 and 2008, respectively, in soil remediation costs to
prepare the property for sale. These costs were capitalized and added to the
property’s net book value. Other than these expenditures, we did not incur any
material costs in 2009, 2008 or 2007 as a result of environmental protection
requirements, nor do we anticipate environmental protection requirements to have
any material financial or operational effects on our capital expenditures,
earnings or competitive position in future years.
Employees
As of
December 31, 2009, the total number of employees of TESCO and its
subsidiaries worldwide was 1,301. We believe that our relationship with our
employees is good. We work to maintain a high level of employee satisfaction and
we believe our employee compensation systems are competitive.
|
ITEM 1A.
|
Our
business, financial condition, results of operations and cash flows are
subject to various risks, including the following:
Risks
Associated with the Global Economy
The
current global economic environment may continue to impact industry
fundamentals, and the related decrease in demand for drilling rigs could cause
current downturn in the oil and gas industry to continue. Such a condition could
have a material adverse impact on our business.
An
extended deterioration in the global economic environment may impact
fundamentals that are critical to our industry, such as the global demand for,
and consumption of, oil and natural gas. Reduced demand for oil and natural gas
generally results in lower oil and natural gas prices and prolonged weakness in
the economy could impact the economics of planned drilling projects, resulting
in curtailment, reduction, delay or postponement for an indeterminate period of
time. Any long-term reduction in oil and natural gas prices will reduce oil and
natural gas drilling and production activity and result in a corresponding
decline in the demand for our products and services, which could adversely
affect the demand for sales, rentals or services of our top drive units and for
our Tubular Services and CASING DRILLING businesses. These reductions could
adversely affect the future net realizability of assets, including inventory,
fixed assets goodwill and other intangible assets.
We
are exposed to risks associated with turmoil in the financial
markets.
U.S. and
global credit and equity markets have recently undergone significant disruption,
making it difficult for many businesses to obtain financing on acceptable terms.
In addition, equity markets are continuing to experience wide fluctuations in
value. As a result, an increasing number of financial institutions and insurance
companies have reported significant deterioration in their financial condition.
While we intend to finance our operations with existing cash, cash flow from
operations and borrowing under our existing credit facility, we may require
additional financing to support our growth. If any of the significant lenders,
insurance companies or other financial institutions are unable to perform their
obligations under our credit agreements, insurance policies or other contracts,
and we are unable to find suitable replacements on acceptable terms, our results
of operations, liquidity and cash flows could be adversely
affected.
We also
face challenges relating to the impact of the disruption in the global financial
markets on other parties with whom we do business, such as our customers and
vendors. Many of our customers access the credit markets to finance their oil
and natural gas drilling and production activity. Companies that planned to
finance exploration or development projects through the capital markets may be
forced to curtail, reduce, postpone or delay drilling activity, and also may
experience an inability to pay suppliers, including us. Such reductions or
delays could negatively impact our revenues, cash flows and earnings. The
inability of these parties to obtain financing on acceptable terms could impair
their ability to perform under their agreements with us and lead to various
negative effects on the Company, including business disruption, decreased
revenues and increases in bad debt write-offs. A sustained decline in the
financial stability of these parties could have an adverse impact on our
business and results of operations.
The
occurrence or threat of terrorist attacks could materially impact our
business.
The
occurrence or threat of future terrorist attacks could adversely affect the
economies of the United States and other developed countries. A lower level of
economic activity could result in a decline in energy consumption, which could
cause a decrease in spending by oil and gas companies for exploration and
development. In addition, these risks could trigger increased volatility in
prices for crude oil and natural gas which could also adversely affect spending
by oil and gas companies. A decrease in spending for any reason could adversely
affect the markets for our products and thereby adversely affect our revenue and
margins and limit our future growth prospects. Moreover, these risks could cause
increased instability in the financial and insurance markets and adversely
affect our ability to access capital and to obtain insurance coverage that we
consider adequate or are required to obtain by our contracts with third
parties.
We
face risks related to natural disasters and pandemic diseases, which could
materially and adversely disrupt our operations and affect travel required for
our worldwide operations.
A portion
of our business involves the movement of people and certain parts and supplies
to or from foreign locations. Any restrictions on travel or shipments to
and from foreign locations, due to the occurrence of natural disasters such as
earthquakes, floods or hurricanes, or an epidemic or outbreak of diseases,
including the recent H1N1 Flu, in these locations could significantly disrupt
our operations and decrease our ability to provide services to our customers. In
addition, our local workforce could be affected by such an occurrence or
outbreak which could also significantly disrupt our operations and decrease our
ability to provide services to our customers.
Risks
Associated with the Oil and Gas Industry
We
face risks due to the cyclical nature of the energy industry and the
corresponding credit risk of our customers.
Changing
political, economic or military circumstances throughout the energy producing
regions of the world can impact the market price of oil and gas for extended
periods of time. As most of our accounts receivable are with customers involved
in the oil and gas industry, any significant change in such circumstances could
result in financial exposure in relation to affected customers.
Fluctuations
in the demand for and prices of oil and gas would negatively impact our
business.
Fluctuations
in the demand for and prices of oil and gas impact the levels of drilling
activity by our customers and potential customers. The prices are primarily
determined by supply, demand, government regulations relating to oil and gas
production and processing, and international political events, none of which can
be accurately predicted. In times of declining activity, not only is there less
opportunity for us to sell our products and services but there is increased
competitive pressure that tends to reduce prices and therefore
margins.
Possible
legislation and regulations related to global warming and climate change could
have an adverse effect on our operations and the demand for oil and natural
gas.
In
December 2009, the U.S. Environmental Protection Agency (“EPA”) officially
published its findings that emissions of carbon dioxide, which is a byproduct of
the burning of refined oil products, and methane, which is a primary component
of natural gas, and other “greenhouse gases” present an endangerment to human
health and the environment because emissions of such gases are, according to the
EPA, contributing to warming of the Earth’s atmosphere and other climatic
changes. These findings by the EPA allow the agency to proceed with the
adoption and implementation of regulations that would restrict emissions of
greenhouse gases under existing provisions of the federal Clean Air Act.
In September 2009, the EPA had proposed two sets of regulations in anticipation
of finalizing its findings that would require a reduction in emissions of
greenhouse gases from motor vehicles and that could also lead to the imposition
of greenhouse gas emission limitations in Clean Air Act permits for certain
stationary sources. In addition, the EPA issued a final rule in September
2009 requiring the reporting of greenhouse gas emissions from specified large
greenhouse gas emission sources in the United States beginning in 2011 for
emissions occurring in 2010. The adoption and implementation of any
regulations imposing reporting obligations on, or limiting emissions of
greenhouse gases from, our equipment and operations could require us to incur
increased costs to reduce emissions of greenhouse gases associated with our
operations and could adversely affect demand for the oil and natural
gas.
In
addition, in June 2009, the U.S. House of Representatives passed the “American
Clean Energy and Security Act of 2009” (“ACESA”), which would establish an
economy-wide cap-and-trade program to reduce U.S. emissions of greenhouse gases,
including carbon dioxide and methane. ACESA would require a 17% reduction
in greenhouse gas emissions from 2005 levels by 2020, and just over an 80%
reduction of such emissions by 2050. Under this legislation, the EPA would
issue a capped and steadily declining number of tradable emissions allowances to
certain major sources of greenhouse gas emissions so that such sources could
continue to emit greenhouse gases into the atmosphere. The cost of these
allowances would be expected to escalate significantly over time. The net
effect of ACESA would be to impose increasing costs on the combustion of
carbon-based fuels such as oil, refined petroleum products, and natural
gas. The U.S. Senate has begun work on its own legislation for restricting
domestic greenhouse gas emissions, and the Obama administration has indicated
its support of legislation to reduce greenhouse gas emissions through an
emission allowance system. In addition, several states have considered
initiatives to regulate emissions of greenhouse gases, primarily through the
planned development of greenhouse gas emissions inventories and/or regional
greenhouse gas cap and trade programs. Although it is not possible at this
time to predict when the U.S. Senate may act on climate change legislation or
how any bill passed by the Senate would be reconciled with ACESA, any future
federal or state laws or regulations that may be adopted to address greenhouse
gas emissions could require us to incur increased operating costs and could
adversely affect the demand for the oil and natural gas.
Our
revenues and earnings are subject to fluctuations period over period and are
difficult to forecast.
Our
revenues and earnings may vary significantly from quarter to quarter depending
upon:
|
·
|
the
level of drilling activity worldwide, as well as the particular geographic
focus of the activity;
|
|
·
|
the
variability of customer orders, which are particularly unpredictable in
international markets;
|
|
·
|
the
levels of inventories of our products held by end-users and
distributors;
|
|
·
|
the
mix of our products sold or leased and the margins on those
products;
|
|
·
|
new
products offered and sold or leased by us or our
competitors;
|
|
·
|
weather
conditions or other natural disasters that can affect our operations or
our customers’ operations;
|
|
·
|
changes
in oil and gas prices and currency exchange rates, which in some cases
affect the costs and prices for our products;
|
|
·
|
the
level of capital equipment project orders, which may vary with the level
of new rig construction and refurbishment activity in the
industry;
|
|
·
|
changes
in drilling and exploration plans which can be particularly volatile in
international markets;
|
|
·
|
the
variability of customer orders or a reduction in customer orders, which
may leave us with excess or obsolete inventories; and
|
|
·
|
the
ability to manufacture and timely deliver customer orders, particularly in
the top drive segment due to the increasing size and complexity of our
models.
|
In
addition, our fixed costs cause our margins to decrease when demand is low and
service capacity is underutilized.
Any
significant consolidation or loss of end-user customers could have a negative
impact on our business.
Exploration
and production company operators and drilling contractors have undergone
substantial consolidation in recent years. Additional consolidation is probable.
In addition, many oil and gas properties could be transferred over time to
different potential customers.
Consolidation
of drilling contractors results in fewer end-users for our products and could
result in the combined contractor standardizing its equipment preferences in
favor of a competitor’s products.
Merger
activity among both major and independent oil and gas companies also affects
exploration, development and production activity, as these consolidated
companies attempt to increase efficiency and reduce costs. Generally, only the
more promising exploration and development projects from each merged entity are
likely to be pursued, which may result in overall lower post-merger exploration
and development budgets. Moreover, some end-users prefer not to use relatively
new products or premium products in their drilling operations.
We
operate in an intensively competitive industry and if we fail to compete
effectively our business will suffer.
Competitive
risks may include decisions by existing competitors to attempt to increase
market share by reducing prices and decisions by customers to adopt competing
technologies. The drilling industry is driven primarily by cost minimization.
Our strategy is aimed at reducing drilling costs through the application of new
technology. Our competitors, many of whom have a more diverse product line and
access to greater amounts of capital, have the ability to compete against the
cost savings generated by our technology by reducing prices and by introducing
competing technologies. Our competitors may also have the ability to offer
bundles of products and services to customers that we do not offer. We have
limited resources to sustain a prolonged price war and maintain the investment
required to continue the commercialization and development of our new
technologies.
To
compete in our industry, we must continue to develop new technologies and
products.
The
markets for our products and services are characterized by continual
technological developments and we have identified our products as providing
technological advantages over other competitive products. As a result,
substantial improvements in the scope and quality of product function and
performance can occur over a short period of time. If we are not able to develop
commercially competitive products in a timely manner in response to changes in
technology, our business may be adversely affected. Our future ability to
develop new products depends on our ability to:
|
·
|
design
and commercially produce products that meet the needs of our
customers,
|
|
·
|
successfully
market new products, and
|
|
·
|
obtain
and maintain patent protection.
|
We may
encounter resource constraints, technical barriers, or other difficulties that
would delay introduction of new products and services in the future. Our
competitors may introduce new products or obtain patents before we do and
achieve a competitive advantage. Additionally, the time and expense invested in
product development may not result in commercial applications.
For example, from time to time, we have
incurred significant losses in the development of new technologies which were
not successful for various commercial or technical reasons. If we are unable to
successfully implement technological or research and engineering type
activities, our growth prospects may be reduced and our future revenues may be
materially and adversely affected. Moreover, we may experience operating losses
after new products are introduced and commercialized because of high start-up
costs, unexpected manufacturing costs or problems, or lack of demand.
Risks
Associated with our Business
We
have been party to patent infringement claims and we may not be able to protect
or enforce our intellectual property rights.
In three
separate actions, we were sued by VARCO I/P, Inc. (“Varco”), Franks
International, Inc. and Weatherford International, who have alleged that our CDS
tool and other equipment and processes violate certain of their patents. See
Part I, Item 3 “Legal Proceedings.” We believe that these suits are without
merit and we intend to continue to defend ourselves vigorously. In the event
that we are not successful in defending ourselves in one or more of these
matters, it may have a material adverse effect on our Tubular Services and
CASING DRILLING segments and, therefore, on our business. In addition, in the
future we may be subject to other infringement claims and if any of our products
were found to be infringing, our consolidated financial results may be adversely
affected.
Some of
our products and the processes used to produce them have been granted U.S. and
international patent protection, or have patent applications pending.
Nevertheless, patents may not be granted from our applications and, if patents
are issued, the claims allowed may not be sufficient to protect our technology.
Recent changes in U.S. patent law may have the effect of making certain of our
patents more likely to be the subject of claims for invalidation.
Our
competitors may be able to independently develop technology that is similar to
ours without infringing on our patents. This is especially true internationally
where the protection of intellectual property rights may not be as effective. In
addition, obtaining and maintaining intellectual property protection
internationally may be significantly more expensive than doing so domestically.
We may have to spend substantial time and money defending our patents. After our
patents expire, our competitors will not be legally constrained from marketing
products substantially similar to ours.
We
are subject to legal proceedings and may, in the future, be subject to
additional legal proceedings.
We are
currently involved in legal proceedings described in Part I, Item 3 “Legal
Proceedings.” From time to time, we may become subject to additional legal
proceedings which may include contract, tort, intellectual property, tax,
regulatory compliance and other claims. We are also subject to complaints or
allegations from former, current or prospective employees from time to time,
alleging violations of employment-related laws. Lawsuits or claims could result
in decisions against us which could have a material adverse effect on our
financial condition, results of operations or cash flows.
Restrictions
imposed by our credit agreement may limit our ability to finance future
operations or capital needs.
The amount of
borrowings available under our credit agreement is limited by the maintenance of
certain financial ratios. Decreases in our financial performance could prohibit
us from borrowing available amounts under our revolver or could force us to make
repayments of outstanding total debt in order to remain in compliance with our
credit agreements. These restrictions may negatively impact our ability to
finance future operations, implement our business strategy or fund our capital
needs. Compliance with these financial ratios may be affected by events
beyond our control, including the risks and uncertainties described in the other
risk factors discussed elsewhere in this report.
Our
debt and other financing obligations restrict our ability to take certain
actions and require the maintenance of certain financial ratios; failure to
comply with these requirements could result in acceleration of our
debt.
Our debt
and other financing obligations contain restrictive covenants. A breach of any
of these covenants could preclude us or our subsidiaries from issuing letters of
credit, from borrowing under our credit agreements and could accelerate our debt
and other financing obligations and those of our subsidiaries. If this were to
occur, we might not be able to repay such debt and other financing obligations.
Additionally, our credit agreements are collateralized by equity interests in
our subsidiaries. A breach of the covenants under these agreements could permit
the lenders to exercise their rights to foreclose on these collateral
interests.
We
have outstanding debt that is not contracted at market rates.
Our
credit facility contains provisions for interest rates on borrowings and
commitment fees that were established prior to the credit crisis and probably
could not be replaced at the same value in today’s market. If we needed to
replace our credit facility in today’s uncertain bank loan market, for any
reason, including an event of default on our part, we may be unable to negotiate
lending terms at the same rates, or for the same borrowing capacity, that we
currently hold. Any change in the terms of our fees or borrowing capacity could
adversely affect our liquidity and results of operations.
At this
time it is difficult to forecast the future state of the bank loan market. As a
result of the uncertain state of various financial institutions and the credit
markets generally, we may be unable to maintain our current borrowing capacity
in the event of bank or banks failure to fund any commitments under the current
credit facility, and we may not be able to refinance our bank facility in the
same amount and on the same terms as we currently hold, which could negatively
impact our liquidity and results of operations.
We
provide warranties on our products and if our products fail to operate properly
our business will suffer.
We
provide warranties as to the proper operation and conformance to specifications
of the equipment we manufacture. Our products are often deployed in harsh
environments including subsea applications. The failure of these products to
operate properly or to meet specifications may increase our costs by requiring
additional engineering resources and services, replacement of parts and
equipment or monetary reimbursement to a customer. We have in the past
experienced quality problems with raw material vendors, which required us to
recall and replace certain equipment and components. We have also in the past
received warranty claims and we expect to continue to receive them in the
future. Such claims may exceed the reserve we have set aside for them. To the
extent that we incur substantial warranty claims in any period because of
quality issues with our products, our reputation, ability to obtain future
business and earnings could be materially and adversely affected.
Concentration
of our revenue and management in the United States involves risk.
In 2009
approximately 45% of our revenue was obtained from operations in the U.S.
(compared to 52% during 2008). The concentration of revenue and management
functions in the U.S. involves certain risks, including the
following:
|
·
|
increased
vulnerability to fluctuations in the U.S. economy; in particular, a severe
economic downturn or prolonged recession in the U.S. could have a greater
impact on our ability to do business than would otherwise be the
case;
|
|
·
|
fluctuations
in the valuation of the U.S. dollar, particularly in relation to the
Canadian dollar, may negatively impact our financial results. Future
devaluation of the U.S. dollar could increase our Canadian manufacturing
costs and our cost of doing business outside of the U.S. in general and it
may not be possible to raise the prices and rates we charge customers in
U.S. dollars to compensate for these increased costs, or to hedge our
exposure to devaluation of the U.S. dollar through currency swaps and
other financial instruments; and
|
|
·
|
the
U.S. limits the number of visas available to non-U.S. professionals and
executives who wish to work in the U.S. The potential inability to obtain
such a visa may prevent us from transferring our non-U.S. employees to the
U.S., or may restrict our ability to recruit qualified international
executives to fill management positions at our corporate
headquarters.
|
Our business
operations in countries outside the United States are subject to a number of
U.S. federal laws and regulations, including restrictions imposed by the Foreign
Corrupt Practices Act as well as trade sanctions administered by the Office of
Foreign Assets Control and the Commerce Department.
Our business
operations in countries outside the United States are subject to a number of
U.S. federal laws and regulations, including restrictions imposed by the
Foreign Corrupt Practices Act (“FCPA”) as well as trade sanctions administered
by the Office of Foreign Assets Control (“OFAC”) and the Commerce
Department. If we fail to comply with these laws and regulations, we
could be exposed to claims for damages, financial penalties, reputational harm,
and incarceration of our employees or restrictions on our operations, which
could have a material adverse effect on our financial condition, results of
operations or cash flows.
Our
foreign operations and investments involve special risks.
We sell
products and provide services in parts of the world where the political and
legal systems are very different from those in the United States and Canada. In
places like Russia, Latin America, the Middle East and Asia/Pacific, we may have
difficulty or extra expense in navigating the local bureaucracies and legal
systems. We may face challenges in enforcing contracts in local courts or be at
a disadvantage when we have a dispute with a customer that is an agency of the
state. We may be at a disadvantage to competitors that are not subject to the
same international trade and business practice restrictions that U.S. and
Canadian laws impose on us.
While
diversification is desirable, it can expose us to risks related to cultural,
political and economic factors of foreign jurisdictions which are beyond our
control. As a general rule, we have elected not to carry political risk
insurance against these risks. Such risks include the following:
|
·
|
loss
of revenue, property and equipment as a result of hazards such as wars or
insurrection;
|
|
·
|
the
effects of currency fluctuations and exchange controls, such as
devaluation of foreign currencies and other economic
problems;
|
|
·
|
changes
or interpretations in laws, regulations and policies of foreign
governments, including those associated with changes in the governing
parties, nationalization, and expropriation; and
|
|
·
|
protracted
delays in securing government consents, permits, licenses, or other
regulatory approvals necessary to conduct our
operations.
|
We
are subject to foreign exchange and currency risks.
We operate
internationally, giving rise to exposure to market risks from changes in foreign
currency exchange rates to the extent that transactions are not denominated in
U.S. Dollars. We typically endeavor to denominate all of our
contracts in U.S. Dollars to mitigate exposure to fluctuations in foreign
currencies. However, inflation and future devaluations in foreign
currencies could adversely impact our operations and financial
results. A portion of our accounts receivable as of December 31, 2009
was denominated in Venezuelan currency. Effective January 11, 2010,
the Venezuelan government devalued its currency and moved to a two-tier exchange
structure. We expect this devaluation will have an impact to our results of
operations for the upcoming quarterly period ended March 31, 2010.
Our
profitability is driven to a large extent by our ability to deliver the products
we manufacture in a timely manner.
Disruptions
to our production schedule may adversely impact our ability to meet delivery
commitments. If we fail to deliver products according to contract terms, we may
suffer financial penalties and a diminution of our commercial reputation and
future product orders.
We
rely on the availability of raw materials, component parts and finished products
to produce our products.
We buy
raw materials, components and precision machining or sub-assembly services from
many different vendors located in Canada, the United States, Europe, South East
Asia and the Middle East. The price and lead times for some products have
fluctuated along with the general changes of steel prices around the world. We
also source a substantial amount of electrical components, including permanent
magnet motors and drives as well as a substantial amount of hydraulic
components, including hydraulic motors, from suppliers located in the U.S. The
inability of suppliers to meet performance, quality specifications and delivery
schedules could cause delays in manufacturing and make it difficult or
impossible for us to meet outstanding orders or accept new orders for the
manufacture of the affected equipment.
The
design of some of our equipment is based on components provided by specific sole
source manufacturers.
Some of
our products have been designed around components which are only available from
one source of supply. In some cases, a manufacturer has developed or modified
the design of a component at our request, and consequently we are the only
purchaser of such items. If the manufacturer of such an item should go out of
business or cease or refuse to manufacture the component in question, or raise
the price of such components unduly, we may have to identify alternative
components and redesign portions of our equipment. This could cause delays in
manufacturing and make it difficult or impossible for us to meet outstanding
orders or accept new orders for the manufacture of the affected
equipment.
Our
business requires the retention and recruitment of a skilled workforce and key
employees, and the loss of such employees could result in the failure to
implement our business plans.
As a
technology-based company, we depend upon skilled engineering and other
professionals in order to engage in product innovation and ensure the effective
implementation of our innovative technology, especially CASING DRILLING. We
compete for these professionals, not only with other companies in the same
industry, but with oil and gas service companies generally and other industries.
In periods of high energy and industrial manufacturing activity, demand for the
skills and expertise of these professionals increases, which can make the hiring
and retention of these individuals more difficult and expensive. Failure to
recruit and retain such individuals may result in our inability to maintain a
competitive advantage over other companies and loss of customer
satisfaction.
The loss
or incapacity of certain key employees for any reason, including our President
and Chief Executive Officer, Julio M. Quintana, could have a negative impact on
our ability to implement our business plan due to the specialized knowledge
these individuals possess.
Our
business relies on the skills and availability of trained and experienced trades
and technicians to provide efficient and necessary services to us and our
customers. Hiring and retaining such individuals are critical to the success of
our business plan. Retention of staff and the prevention of injury to staff are
essential in order to provide high level of service.
Our
products and services are used in hazardous conditions, and we are subject to
risks relating to potential liability claims.
Most of
our products are used in hazardous drilling and production applications where an
accident or a failure of a product can have catastrophic consequences. For
example, the unexpected failure of a top drive to rotate a drill string during
drilling operations could result in the loss of control over a well, leading to
blowout and the discharge of pollutants into the environment. Damages arising
from an occurrence at a location where our products are used have in the past
and may in the future result in the assertion of potentially large claims
against us.
While we
attempt to limit our exposure to such risks through contracts with our
customers, these measures may not protect us against liability for certain kinds
of events, including blowouts, cratering, explosions, fires, loss of well
control, loss of hole, damaged or lost drilling equipment, damage or loss from
inclement weather or natural disasters, and losses resulting from business
interruption. Our insurance coverage generally provides that we assume a portion
of the risk in the form of a self-insured retention, and may not be adequate in
risk coverage or policy limits to cover all losses or liabilities that we may
incur. The occurrence of an event not fully insured or indemnified against, or
the failure of a customer or insurer to meet its indemnification or insurance
obligations, could result in substantial losses. Moreover, we may not be able in
the future to maintain insurance at levels of risk coverage or policy limits
that we deem adequate. Any significant claims made under our policies will
likely cause our premiums to increase. Any future damages caused by our products
or services that are not covered by insurance, are in excess of policy limits or
are subject to substantial deductibles, could reduce our earnings and cash
available for operations.
Environmental
compliance and remediation costs and the costs of environmental liabilities
could exceed our estimates.
The
energy industry is affected by changes in public policy, federal, state and
local laws and regulations. The adoption of laws and regulations curtailing
exploration and development drilling for oil and gas for economic, environmental
and other policy reasons may adversely affect our operations due to our
customers having limited drilling and other opportunities in the oil and gas
exploration and production industry. The operations of our customers, as well as
our properties, are subject to increasingly stringent laws and regulations
relating to environmental protection, including laws and regulations governing
air emissions, water discharges, waste management and workplace
safety.
We
have identified material weaknesses in our internal controls.
Our
management has concluded that our disclosure controls and procedures and
internal control over financial reporting were not effective as of
December 31, 2009. As a result, this Form 10-K includes an
adverse opinion from PricewatehouseCoopers LLP, our independent registered
public accounting firm, on our internal control over financial reporting. A
description of the material weakness in our internal controls over financial
reporting is included in Item 9A, “Controls and Procedures,” in this Form
10-K.
A
material weakness is a deficiency, or a combination of deficiencies, in internal
control over financial reporting, such that there is a reasonable possibility
that a material misstatement of the company's annual or interim financial
statements will not be prevented or detected on a timely basis.
The
material weakness resulted in misstatements of the deferred tax assets, the
income tax provision, foreign exchange gains and losses, cumulative translation
adjustments accounts and related financial disclosures. The material
weakness also resulted in restatements of the Company’s condensed consolidated
financial statements as of and for each of the quarters ended March 31, 2009,
June 30, 2009 and September 30, 2009 and resulted in audit adjustments to the
Company's consolidated financial statements as of and for the year ended
December 31, 2009. Additionally, inadequate internal control over financial
reporting could cause investors to lose confidence in our reported financial
information, which could have a negative effect on the trading of our
securities.
|
ITEM 1B.
|
UNRESOLVED STAFF
COMMENTS.
|
None.
|
ITEM 2.
|
The
following table details our principal facilities, including (i) all
properties which we own, and (ii) those leased properties which serve as
corporate or regional headquarters.
|
Location
|
Approximate
Square Footage (Buildings)
|
Owned or
Leased
|
Description
|
||||
|
Houston,
Texas
|
26,500
|
Leased
|
Corporate
headquarters.
|
||||
|
Houston,
Texas
|
67,800
|
Owned
|
Headquarters
for North American operations in Top Drive, Tubular Services and CASING
DRILLING segments, and our U.S. regional operations base which also
provides equipment repair and maintenance for U.S. and certain overseas
operations.
|
||||
| Kilgore, Texas | 21,900 | Owned | Regional operations base for the Tubular Services segment in East Texas and Northern Louisiana. | ||||
|
Lafayette, Louisiana
|
43,300
|
Owned
|
Regional
operations base for the Tubular Services segment in southern Louisiana and
the Gulf of Mexico.
|
||||
|
Calgary,
Alberta, Canada
|
85,000
|
Owned
|
Manufacturing
of top drives and other equipment.
|
||||
|
Buenos
Aires, Argentina
|
4,300
|
Leased
|
Regional
headquarters for Latin America, including Mexico.
|
||||
|
Aberdeen,
Scotland
|
22,700
|
Leased
|
Regional
headquarters for Europe, including the former Soviet Union, and West
Africa.
|
||||
|
Dubai,
United Arab Emirates
|
3,800
|
Leased
|
Regional
headquarters for the Middle East, North Africa, and East
Africa.
|
||||
|
Jakarta,
Indonesia
|
7,700
|
Leased
|
Regional
headquarters for the Asia Pacific region, including India, China, Japan,
Australia and New Zealand.
|
||||
In
addition, we lease operational facilities at locations in Texas, Colorado,
Pennsylvania, Arkansas, North Dakota and Wyoming. Each of these locations
supports operations in its local area, primarily for the Tubular Services
segment.
Outside
the U.S., we lease additional operating facilities in Canada, Mexico, Venezuela,
Colombia, Ecuador, Argentina, Brazil, Norway, Russia, Dubai, Singapore,
Indonesia, Australia and New Zealand. The majority of these facilities support
the Top Drive, Tubular Services and CASING DRILLING segments.
Our
existing equipment and facilities are considered by management to be adequate to
support our operations.
|
ITEM 3.
|
LEGAL PROCEEDINGS.
|
In the
normal course of our business, we are subject to legal proceedings brought by or
against us and our subsidiaries. None of these proceedings involves a claim for
damages exceeding ten percent of the current assets of TESCO and its
subsidiaries on a consolidated basis.
The
estimates below represent management’s best estimates based on consultation with
internal and external legal counsel. There can be no assurance as to the
eventual outcome or the amount of loss we may suffer as a result of these
proceedings.
Varco
I/P, Inc. (“Varco”) filed suit against TESCO in April 2005 in the U.S. District
Court for the Western District of Louisiana, alleging that our CDS infringes
certain of Varco’s U.S. patents. Varco seeks monetary damages and an injunction
against further infringement. We filed a countersuit against Varco in June 2005
in the U.S. District Court for the Southern District of Texas, Houston Division
seeking invalidation of the Varco patents in question. In July 2006, the
Louisiana case was transferred to the federal district court in Houston, and as
a result, the issues raised by Varco have been consolidated into a single
proceeding in which we are the plaintiff. We also filed a request with the U.S.
Patent and Trademark Office (“USPTO”) for reexamination of the patents on which
Varco’s claim of infringement is based. The USPTO accepted the Varco patents for
reexamination, and the district court stayed the patent litigation pending the
outcome of the USPTO reexamination. In May 2009, the USPTO issued a final action
rejecting all of the Varco patent claims that TESCO had contested. Varco has
appealed this decision with the USPTO. The outcome and amount of any future
financial impacts from this litigation are not determinable at this
time.
Frank’s
International, Inc. and Frank’s Casing Crew and Rental Tools, Inc. (“Franks”)
filed suit against TESCO in the U.S. District Court for the Eastern District of
Texas, Marshall Division, on January 10, 2007, alleging that its Casing
Drive System infringes two patents held by Franks. TESCO filed a response
denying the Franks allegation and asserting the invalidity of its patents. In
May 2008, Franks withdrew its claims with respect to one of the patents, and, in
July 2008, TESCO filed a request with the USPTO for reexamination of the other
patent. In September 2008, the USPTO ordered a reexamination of that patent.
During 2009, TESCO, Franks, and a third party from whom TESCO had a license
agreed on terms of a settlement, pursuant to which TESCO paid $1.8 million to
Franks and $0.4 million to the third party. Under the terms of the settlement,
TESCO received from the third party a release of any royalty obligation under
the license and received from Franks a fully-paid, perpetual, world-wide
nonexclusive license under the two patents at issue. Franks requested the court
to dismiss its lawsuit with prejudice. TESCO accrued and paid this $2.2 million
settlement during the year ended December 31, 2009.
Weatherford
International, Inc. and Weatherford/Lamb Inc. (“Weatherford”) filed suit against
TESCO in the U.S. District Court for the Eastern District of Texas, Marshall
Division, on December 5, 2007, alleging that various TESCO technologies
infringe 10 different patents held by Weatherford. Weatherford seeks monetary
damages and an injunction against further infringement. The TESCO technologies
referred to in the claim include the CDS, the CASING DRILLING system and method,
a float valve, and the locking mechanism for the controls of the tubular
handling system. We have filed a general denial seeking a judicial determination
that we do not infringe the patents in question and/or that the patents are
invalid. In November 2008, we filed requests with the USPTO, seeking
invalidation of substantially all of the Weatherford patent claims in the suit.
The trial is set for May 2011. The outcome and amount of any future financial
impacts from this litigation are not determinable at this time.
We have
been advised by the Mexican tax authorities that they believe significant
expenses incurred by our Mexican operations from 1996 through 2002 are not
deductible for Mexican tax purposes. Between 2002 and 2008, formal reassessments
disallowing these deductions were issued for each of these years, all of which
we appealed to the Mexican court system. We have obtained final court rulings
deciding all years in dispute in our favor, except for 1996 as discussed below,
and 2001 and 2002, both of which are currently before the Mexican Tax Court. The
outcome of such appeals is uncertain. However, we recorded an accrual of $0.3
million during 2008 for our anticipated exposure on these issues ($0.2 million
related to interest and penalties was included in Other Income and $0.1 million
was included in Income Tax Expense). We continue to believe that the basis for
these reassessments was incorrect, and that the ultimate resolution of those
outstanding matters that remain will likely not have a material adverse effect
on our financial position, results of operations or cash flows.
In May
2002, we paid a deposit of $3.3 million with the Mexican tax authorities in
order to appeal the reassessment for 1996. In 2007, we requested and received a
refund of approximately $3.7 million (the original deposit amount of $3.3
million plus $0.4 million in interest). In 2007, we reversed an accrual for
taxes, interest and penalties ($1.4 million related to interest and penalties
was included in Other Income and $0.7 million benefit in Income Tax Expense).
With the return of the $3.3 million deposit, the Mexican tax authorities issued
a resolution indicating that we were owed an additional $3.4 million in interest
but this amount had been retained by the tax authorities to satisfy a second
reassessment for 1996. We believe the second reassessment is invalid, and we
appealed it to the Mexican Tax Court. In January 2009, the Tax Court issued a
decision accepting our arguments in part, which is subject to further appeal.
Due to uncertainty regarding the ultimate outcome, we have not recognized the
additional interest in dispute as an asset.
In July
2006, we received a claim for withholding tax, penalties and interest related to
payments over the periods from 2000 to 2004 in a foreign jurisdiction. We
disagree with this claim and are currently litigating this matter. In November
2009, we received a favorable decision from a lower level court regarding
payments made during 2000, which is subject to appeal. At
June 30, 2006, we accrued our estimated pre-tax exposure on this matter of
$3.8 million, with $2.6 million included in other expense and $1.2 million
included in interest expense. During 2008 and 2009, we accrued an additional
$0.2 million and $0.2 million, respectively, of interest expense related to this
claim.
In August
2008, we received a claim in Mexico for $1.1 million in fines and penalties
related to the exportation of certain temporarily imported equipment that
remained in Mexico beyond the authorized time limit for its return. We disagree
with this claim and are currently litigating the matter. In December 2009, we
received a decision from the Mexican Tax Court in our favor, which is subject to
further appeal. The ultimate outcome of this litigation is
uncertain.
In
February 2009, we received notification of a regulatory review of our payroll
practices in one of our North American business districts. The review was
concluded during 2009 without a material financial impact to the
Company.
In August
2009, we filed suit against several competitors in the U.S. District Court for
the Southern District of Texas – Houston Division, including Weatherford
International, Inc. (“Weatherford Inc.”). The suit claims
infringement of two TESCO patents related to our CDS. Weatherford Inc. has
petitioned for and been granted a reexamination of the Tesco patents by the
USPTO. That reexamination is ongoing. The outcome of this
examination and any resulting financial impact, if any, is
uncertain.
A former
employee of one of TESCO’s U.S. subsidiaries filed suit in the U.S. District
Court for the Southern District of Texas—Houston Division on January 29,
2009 on behalf of a number of similarly situated claimants, alleging we failed
to comply with certain wage and hour regulations under the U.S. Fair Labor
Standards Act. The lawsuit was dismissed on July 22, 2009 on the basis that
several of the plaintiffs were bound to arbitrate their claims against us
pursuant to the TESCO Dispute Resolution Program (“Plan”). Five plaintiffs not
covered by the Plan re-filed their lawsuit on July 30, 2009 in the same
court and those plaintiffs covered by the Plan initiated arbitration proceedings
with the American Arbitration Association. Additional plaintiffs were
subsequently added to each of these actions for a total of 48 plaintiffs. In
December 2009, we agreed in mediation to settle the claims of all plaintiffs for
a total of approximately $2.3 million. The settlement agreement has been
executed by all plaintiffs. During 2009, we accrued the entire $2.3 million
settlement related to these claims.
In December
2009, we received an administrative subpoena from the Department of the
Treasury, Office of Foreign Assets Control regarding a past shipment of oilfield
equipment made from our Canadian manufacturing facility in 2006 to Sudan. We are
reviewing the matter and have provided a timely response to the subpoena. The
outcome of our internal review and any future financial impact resulting from
this matter are not determinable at this time.
|
ITEM 4.
|
SUBMISSION OF MATTERS TO A VOTE OF SECURITY
HOLDERS.
|
Not
used.
PART
II
|
ITEM 5.
|
MARKET FOR REGISTRANT’S COMMON EQUITY, RELATED STOCKHOLDER
MATTERS AND ISSUER PURCHASES OF EQUITY
SECURITIES.
|
Our
outstanding shares of common stock, without par, are traded on The Nasdaq Global
Market (“NASDAQ”) under the symbol “TESO.” Until June 30, 2008, TESCO’s common
stock was also traded on the Toronto Stock Exchange (“TSX”) under the symbol
“TEO.” Effective June 30, 2008, the Company voluntarily delisted its shares from
the TSX. The following table outlines the share price trading range and volume
of shares traded by quarter for 2009 and 2008.
|
Nasdaq
Global Market
|
Toronto
Stock Exchange
|
|||||||||||||||||||||||
|
Share Price Trading Range
|
Share Price Trading Range
|
|||||||||||||||||||||||
|
High
|
Low
|
Share
Volume
|
High
|
Low
|
Share
Volume
|
|||||||||||||||||||
|
($
per share)
|
(in thousands)
|
(C$
per share)
|
(in thousands)
|
|||||||||||||||||||||
|
2009
|
||||||||||||||||||||||||
|
1st
Quarter
|
10.34 | 6.25 | 10,327 | n/a | n/a | n/a | ||||||||||||||||||
|
2nd
Quarter
|
11.41 | 7.55 | 12,521 | n/a | n/a | n/a | ||||||||||||||||||
|
3rd
Quarter
|
10.28 | 6.38 | 19,848 | n/a | n/a | n/a | ||||||||||||||||||
|
4th
Quarter
|
13.29 | 7.59 | 12,298 | n/a | n/a | n/a | ||||||||||||||||||
|
2008
|
||||||||||||||||||||||||
|
1st
Quarter
|
30.10 | 18.88 | 16,338 | 29.84 | 19.08 | 3,737 | ||||||||||||||||||
|
2nd
Quarter
|
36.76 | 23.56 | 18,508 | 37.49 | 24.09 | 3,987 | ||||||||||||||||||
|
3rd
Quarter
|
35.20 | 20.11 | 16,253 | n/a | n/a | n/a | ||||||||||||||||||
|
4th
Quarter
|
20.73 | 4.75 | 19,814 | n/a | n/a | n/a | ||||||||||||||||||
As of
February 25, 2010, there were approximately 246 holders of record of TESCO
common stock, including brokers and other nominees.
We have
not declared or paid any dividends since 1993 and do not expect to declare or
pay dividends in the near future. Any decision to pay dividends on our Common
Shares will be made by our Board of Directors on the basis of our earnings,
financial requirements and other relevant conditions existing at the time.
Pursuant to our Amended and Restated Credit Agreement, we are currently
prohibited from paying dividends to shareholders.
Performance
Graph
The
following performance graph and table compares the yearly percentage change in
the cumulative shareholder return for the five year period commencing on
December 31, 2004 and ending on December 31, 2009 on our common shares
(assuming a $100 investment was made on December 31, 2004) with the total
cumulative return of the S&P 500 Composite Index and the Philadelphia Oil
Service Sector Index (“OSX”) assuming reinvestment of dividends.
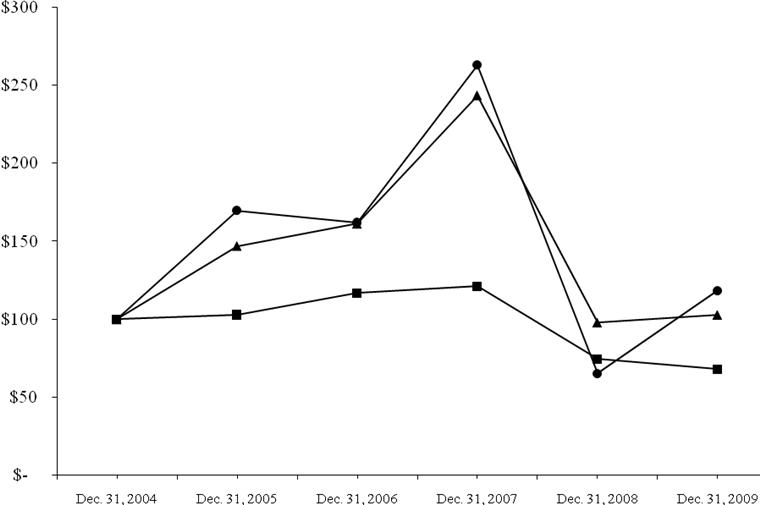
|
Dec.
31, 2004
|
Dec.
31, 2005
|
Dec.
31, 2006
|
Dec.
31, 2007
|
Dec.
31, 2008
|
Dec.
31, 2009
|
|||||||||||||||||||
|
● Tesco
Corp.
|
$ | 100 | $ | 170 | $ | 162 | $ | 263 | $ | 66 | $ | 118 | ||||||||||||
|
■ S
& P 500
|
$ | 100 | $ | 103 | $ | 117 | $ | 121 | $ | 75 | $ | 68 | ||||||||||||
|
▲ OSX
|
$ | 100 | $ | 147 | $ | 161 | $ | 243 | $ | 98 | $ | 103 | ||||||||||||
|
ITEM 6.
|
SELECTED FINANCIAL
DATA.
|
TESCO
CORPORATION AND CONSOLIDATED SUBSIDIARIES
SELECTED
CONSOLIDATED FINANCIAL DATA
|
Note
(a)
|
||||||||||||||||||||
|
Years
Ended December 31,
|
||||||||||||||||||||
|
2009
|
2008
|
2007
|
2006
|
2005
|
||||||||||||||||
|
(In
millions, except share and per share amounts)
|
||||||||||||||||||||
|
STATEMENTS
OF (LOSS) INCOME DATA:
|
||||||||||||||||||||
|
Revenues
|
||||||||||||||||||||
|
-Top
Drives
|
$ | 224.9 | $ | 341.4 | $ | 289.1 | $ | 219.2 | $ | 125.8 | ||||||||||
|
-Tubular
Services
|
118.3 | 166.5 | 158.7 | 143.3 | 53.1 | |||||||||||||||
|
-CASING
DRILLING(b)
|
13.3 | 27.0 | 14.6 | 23.7 | 23.9 | |||||||||||||||
| 356.5 | 534.9 | 462.4 | 386.2 | 202.8 | ||||||||||||||||
|
Operating
Income (Loss)
|
||||||||||||||||||||
|
-Top
Drives
|
49.5 | 106.8 | 80.5 | 66.9 | 23.5 | |||||||||||||||
|
-Tubular
Services
|
(2.9 | ) | 22.5 | 23.7 | 33.1 | 19.1 | ||||||||||||||
|
-CASING
DRILLING
|
(21.0 | ) | (12.6 | ) | (14.1 | ) | (6.7 | ) | (0.1 | ) | ||||||||||
|
-Research
and Engineering
|
(7.4 | ) | (11.0 | ) | (12.0 | ) | (6.0 | ) | (3.9 | ) | ||||||||||
|
-Corporate
and Other
|
(33.0 | ) | (30.9 | ) | (29.9 | ) | (26.4 | ) | (20.9 | ) | ||||||||||
| (14.8 | ) | 74.8 | 48.2 | 60.9 | 17.7 | |||||||||||||||
|
Interest
Expense, net
|
0.9 | 4.2 | 3.2 | 3.2 | 1.4 | |||||||||||||||
|
Other
(Income) Expense
|
1.9 | (0.1 | ) | 2.9 | 4.1 | 1.9 | ||||||||||||||
|
(Loss)
Income Before Income Taxes
|
(17.6 | ) | 70.7 | 42.1 | 53.6 | 14.4 | ||||||||||||||
|
Income
Taxes
|
(12.3 | ) | 20.8 | 10.0 | 23.3 | 6.3 | ||||||||||||||
|
(Loss)
Income Before Cumulative Effect of Accounting Change
|
(5.3 | ) | 49.9 | 32.1 | 30.3 | 8.1 | ||||||||||||||
|
Cumulative
Effect of Accounting Change, net of income taxes(c)
|
–– | –– | –– | 0.2 | –– | |||||||||||||||
|
Net
(loss) income
|
$ | (5.3 | ) | $ | 49.9 | $ | 32.1 | $ | 30.5 | $ | 8.1 | |||||||||
|
Weighted
Average Number of Common Shares Outstanding
|
||||||||||||||||||||
|
Basic
|
37,597,668 | 37,221,495 | 36,604,338 | 35,847,266 | 35,173,264 | |||||||||||||||
|
Diluted
|
37,597,668 | 37,832,554 | 37,403,932 | 36,593,409 | 35,628,543 | |||||||||||||||
|
(Loss)
Income per Weighted Average Share of Common Stock
|
||||||||||||||||||||
|
Basic:
|
||||||||||||||||||||
|
Before
Cumulative Effect of Accounting Change
|
$ | (0.14 | ) | $ | 1.34 | $ | 0.88 | $ | 0.85 | $ | 0.23 | |||||||||
|
Cumulative
Effect of Accounting Change(c)
|
–– | –– | –– | –– | –– | |||||||||||||||
| $ | (0.14 | ) | $ | 1.34 | $ | 0.88 | $ | 0.85 | $ | 0.23 | ||||||||||
|
Diluted:
|
||||||||||||||||||||
|
Before
Cumulative Effect of Accounting Change
|
$ | (0.14 | ) | $ | 1.32 | $ | 0.86 | $ | 0.83 | $ | 0.23 | |||||||||
|
Cumulative
Effect of Accounting Change(c)
|
–– | –– | –– | –– | –– | |||||||||||||||
| $ | (0.14 | ) | $ | 1.32 | $ | 0.86 | $ | 0.83 | $ | 0.23 | ||||||||||
|
Cash
Dividends per Common Share
|
$ | –– | $ | –– | $ | –– | $ | –– | $ | –– | ||||||||||
|
BALANCE
SHEET DATA:
|
||||||||||||||||||||
|
Total
Assets
|
$ | 442.6 | $ | 499.9 | $ | 471.5 | $ | 372.2 | $ | 310.3 | ||||||||||
|
Debt
and Capital Leases
|
8.6 | 49.6 | 80.8 | 44.5 | 41.3 | |||||||||||||||
|
Shareholders’
Equity
|
362.2 | 351.9 | 303.6 | 241.9 | 203.5 | |||||||||||||||
|
CASH
FLOW DATA:
|
||||||||||||||||||||
|
Cash
Flow From Operating Activities
|
$ | 63.3 | $ | 77.0 | $ | 25.3 | $ | 4.9 | $ | 14.8 | ||||||||||
|
Cash
Flows (Used In) From Investing Activities
|
(3.8 | ) | (58.5 | ) | (64.4 | ) | (33.2 | ) | (26.6 | ) | ||||||||||
|
Cash
Flows (Used In) From Financing Activities
|
(40.7 | ) | (19.5 | ) | 48.9 | 9.7 | 30.2 | |||||||||||||
|
OTHER
DATA:
|
||||||||||||||||||||
|
Adjusted
EBITDA(d)
|
$ | 42.4 | $ | 114.5 | $ | 79.1 | $ | 85.0 | $ | 36.7 | ||||||||||
|
Net
Cash (Debt)
(e)
|
31.3 | (29.0 | ) | (57.7 | ) | (29.6 | ) | (5.9 | ) | |||||||||||
NOTE: Our
consolidated financial statements for the three years ended December 31,
2009, which are discussed in the following notes, are included in this Form 10-K
under Item 8. The 2008 and 2007 financial data has been revised as
discussed in Revisions to Previously Issued Financial Statements in Item
7.
|
(a)
|
The
financial statements for the years ended December 31, 2007 and 2008
included herein have been revised for adjustments related to foreign
currency translation adjustments, tax return to provision adjustments and
accruals primarily related to compensation programs and litigation
reserves. We do not consider the aforementioned changes to the
Consolidated Financial Statements to be material and therefore have not
labeled the Consolidated Financial Statements as "restated." See further
discussion in Note 2 of the Consolidated Financial Statements included in
Part II, Item 8 “Financial Statements and Supplementary
Data.”
|
|
(b)
|
Included
in CASING DRILLING revenues for the years ended December 31, 2005 and 2006
are $18.3 million and $9.0 million, respectively, of revenues from
contract CASING DRILLING rig activities which were discontinued in late
2006. During the years ended December 31, 2007, 2008 and 2009, we did not
provide contract drilling rig services.
|
|
(c)
|
Effective
January 1, 2006, we changed our method of accounting for our
stock-based compensation program. We elected to adopt the modified
prospective application method provided by the accounting guidance, under
which, we use the same fair value methodology but are required to estimate
the pre-vesting forfeiture rate beginning on the date of grant. On
January 1, 2006, we recorded a one-time cumulative benefit of $0.2
million, after-tax, to record an estimate of future forfeitures on
outstanding unvested awards at the date of adoption.
|
|
(d)
|
Our
management evaluates our performance based on non-GAAP measures, of which
a primary performance measure is Adjusted EBITDA which consists of
earnings (net income or loss) available to common shareholders before
cumulative effect of accounting change, net interest expense, income
taxes, non-cash stock compensation expense, non-cash impairments,
depreciation and amortization and other non-cash items. This measure may
not be comparable to similarly titled measures employed by other companies
and is not a measure of performance calculated in accordance with U.S.
GAAP. The measure should not be considered in isolation or as a substitute
for operating income, net income or loss, cash flows provided by
operating, investing or financing activities, or other cash flow data
prepared in accordance with U.S. GAAP. The amounts included in the
Adjusted EBITDA calculation, however, are derived from amounts included in
the historical Consolidated Statements of Income data.
We
believe Adjusted EBITDA is useful to an investor in evaluating our
operating performance because it is widely used by investors in our
industry to measure a company’s operating performance without regard to
items such as income taxes, net interest expense, depreciation and
amortization, and non-cash stock compensation expense which can vary
substantially from company to company depending upon accounting methods
and book value of assets, financing methods, capital structure and the
method by which assets were acquired; it helps investors more meaningfully
evaluate and compare the results of our operations from period to period
by removing the impact of our capital structure (primarily interest) and
asset base (primarily depreciation and amortization) and actions that do
not affect liquidity (stock compensation expense) from our operating
results; and it helps investors identify items that are within our
operational control. Depreciation and amortization charges, while a
component of operating income, are fixed at the time of the asset purchase
in accordance with the depreciable lives of the related asset and as such
are not a directly controllable period operating charge.
|
|
Adjusted
EBITDA is derived from our Consolidated Statements of Income as follows
(in millions):
|
|
Years
Ended December 31,
|
||||||||||||||||||||
|
2009
|
2008
|
2007
|
2006
|
2005
|
||||||||||||||||
|
Net
(Loss) Income
|
$ | (5.3 | ) | $ | 49.9 | $ | 32.1 | $ | 30.5 | $ | 8.1 | |||||||||
|
Income
Taxes
|
(12.3 | ) | 20.8 | 10.0 | 23.3 | 6.3 | ||||||||||||||
|
Depreciation
and Amortization
|
36.7 | 33.3 | 27.3 | 22.5 | 17.3 | |||||||||||||||
|
Net
Interest Expense
|
0.9 | 4.2 | 3.2 | 3.2 | 1.4 | |||||||||||||||
|
Stock
Compensation Expense—non-cash
|
4.4 | 6.3 | 6.5 | 5.7 | 3.6 | |||||||||||||||
|
Impairment
of Inventory and Assets—non-cash
|
18.0 | –– | –– | –– | –– | |||||||||||||||
|
Cumulative
Effect of Accounting Change, net of income taxes
|
–– | –– | –– | (0.2 | ) | –– | ||||||||||||||
|
Adjusted
EBITDA
|
$ | 42.4 | $ | 114.5 | $ | 79.1 | $ | 85.0 | $ | 36.7 | ||||||||||
|
(e)
|
Net
Cash (Debt) represents the amount that Cash and Cash Equivalents exceeds
(or is less than) total Debt of the Company. Net Cash (Debt) is not a
calculation based upon U.S. GAAP. The amounts included in the Net Cash
(Debt) calculation, however, are derived from amounts included in our
historical Consolidated Balance Sheets. In addition, Net Cash (Debt)
should not be considered as an alternative to operating cash flows or
working capital as a measure of liquidity. We have reported Net Cash
(Debt) because we regularly review Net Cash (Debt) as a measure of the
Company’s liquidity. However, the Net Cash (Debt) measure presented in
this document may not always be comparable to similarly titled measures
reported by other companies due to differences in the components of the
calculation. Net Cash (Debt) is derived from the Consolidated Balance
Sheets as follows (in millions):
|
|
Years
Ended December 31,
|
||||||||||||||||||||
|
2009
|
2008
|
2007
|
2006
|
2005
|
||||||||||||||||
|
Cash
and Cash Equivalents
|
$ | 39.9 | $ | 20.6 | $ | 23.1 | $ | 14.9 | $ | 35.4 | ||||||||||
|
Current
Portion of Long Term Debt
|
–– | (10.2 | ) | (10.0 | ) | (10.0 | ) | (0.4 | ) | |||||||||||
|
Long
Term Debt
|
(8.6 | ) | (39.4 | ) | (70.8 | ) | (34.5 | ) | (40.9 | ) | ||||||||||
|
Net
Cash (Debt)
|
$ | 31.3 | $ | (29.0 | ) | $ | (57.7 | ) | $ | (29.6 | ) | $ | (5.9 | ) | ||||||
|
ITEM 7.
|
MANAGEMENT’S DISCUSSION AND ANALYSIS OF FINANCIAL CONDITION
AND RESULTS OF OPERATIONS.
|
FORWARD-LOOKING
INFORMATION AND RISK FACTORS
This
annual report on Form 10-K contains forward-looking statements within the
meaning of Canadian and United States securities laws, including the United
States Private Securities Litigation Reform Act of 1995. From time to time, our
public filings, press releases and other communications (such as conference
calls and presentations) will contain forward-looking statements.
Forward-looking information is often, but not always, identified by the use of
words such as “anticipate”, “believe”, “expect”, “plan”, “intend”, “forecast”,
“target”, “project”, “may”, “will”, “should”, “could”, “estimate”, “predict” or
similar words suggesting future outcomes or language suggesting an outlook.
Forward-looking statements in this annual report on Form 10-K include, but are
not limited to, statements with respect to expectations of our prospects, future
revenues, earnings, activities and technical results.
Forward-looking
statements and information are based on current beliefs as well as assumptions
made by, and information currently available to, us concerning our anticipated
financial performance, business prospects, strategies and regulatory
developments. Although management considers these assumptions to be reasonable
based on information currently available to it, they may prove to be incorrect.
The forward-looking statements in this annual report on Form 10-K are made as of
the date it was issued and we do not undertake any obligation to update publicly
or to revise any of the included forward-looking statements, whether as a result
of new information, future events or otherwise, except as required by applicable
law.
By their
very nature, forward-looking statements involve inherent risks and
uncertainties, both general and specific, and risks that outcomes implied by
forward-looking statements will not be achieved. We caution readers not to place
undue reliance on these statements as a number of important factors could cause
the actual results to differ materially from the beliefs, plans, objectives,
expectations and anticipations, estimates and intentions expressed in such
forward-looking statements.
These
risks and uncertainties include, but are not limited to, changes in the global
economy and credit markets, the impact of changes in oil and natural gas prices
and worldwide and domestic economic conditions on drilling activity and demand
for and pricing of our products and services, other risks inherent in the
drilling services industry (e.g. operational risks, potential delays or changes
in customers’ exploration or development projects or capital expenditures, the
uncertainty of estimates and projections relating to levels of rental
activities, uncertainty of estimates and projections of costs and expenses,
risks in conducting foreign operations, the consolidation of our customers, and
intense competition in our industry); risks, including litigation risks,
associated with our intellectual property and risks associated with the
performance of our technology and other risks set forth in Part I, Item 1A,
“Risk Factors.” These risks and uncertainties may cause our actual results,
levels of activity, performance or achievements to be materially different from
those expressed or implied by any forward-looking statements. When relying on
our forward-looking statements to make decisions, investors and others should
carefully consider the foregoing factors and other uncertainties and potential
events. The forward-looking statements in this document are provided for the
limited purpose of enabling current and potential investors to evaluate an
investment in TESCO. Readers are cautioned that such statements may not be
appropriate, and should not be used for other purposes.
Copies of
our Canadian public filings are available at www.tescocorp.com and at
www.sedar.com. Our U.S.
public filings are available at www.tescocorp.com and at
www.sec.gov.
OVERVIEW
The
following review of TESCO’s financial condition and results of operations should
be read in conjunction with our financial statements and related notes included
in this Form 10-K. Unless indicated otherwise, all dollar amounts in this annual
report on Form 10-K are denominated in United States (U.S.) dollars. All
references to US$ or to $ are to U.S. dollars and references to C$ are to
Canadian dollars.
Certain
reclassifications have been made to prior years’ presentation to conform to the
current year presentation.
Business
TESCO is
a global leader in the design, manufacture and service delivery of technology
based solutions for the upstream energy industry. We seek to change the way
wells are drilled by delivering safer and more efficient solutions that add real
value by reducing the costs of drilling for and producing oil and gas. Our
product and service offerings consist mainly of equipment sales and services to
drilling contractors and oil and gas operating companies throughout the world.
In addition to our top drive sales and service business, our service offerings
include proprietary technology, including TESCO CASING DRILLING®
(“CASING DRILLING”), TESCO’s Casing Drive System (“CDS™” or “CDS”) and
TESCO’s Multiple Control Line Running System (“MCLRS™” or “MCLRS”). TESCO® is a
registered trademark in Canada and the United States. TESCO CASING DRILLING® is a
registered trademark in the United States. CASING DRILLING® is a
registered trademark in Canada and CASING DRILLING™ is a trademark in the United
States. Casing Drive System™, CDS™, Multiple Control Line Running System™ and
MCLRS™ are trademarks in Canada and the United States.
Our four
business segments are: Top Drive, Tubular Services, CASING DRILLING and Research
and Engineering. Prior to December 31, 2008, we organized our activities into
three business segments: Top Drives, Casing Services and Research and
Engineering. Effective December 31, 2008, we segregated our Casing Services
segment into Tubular Services and CASING DRILLING and our financial and
operating data for the year ended December 31, 2007 has been recast to be
presented consistently with this structure.
The Top
Drive business is comprised of top drive sales, top drive rentals and
after-market sales and service. The Tubular Services business includes both our
proprietary and conventional Tubular Services. The CASING DRILLING segment
consists of our proprietary CASING DRILLING technology. The Research and
Engineering segment is comprised of our research and development activities
related to our proprietary Tubular Services and CASING DRILLING technology and
Top Drive model development. For a detailed description of these business
segments, see Part I, Item 1, “Business.”
Business
Environment
A global
economic crisis hit the financial and credit markets in late 2008 which led to a
significant global economic slowdown. Major central banks have responded
vigorously, but credit and financial markets have not yet fully recovered, and a
credit-driven worldwide economic recession deepened during the second quarter of
2009. Higher oil and gas prices over the past several years led to high levels
of exploration and development drilling in many oil and gas basins around the
globe by 2008, but activity slowed sharply in 2009 with lower oil and gas prices
and tightening credit availability. Current conditions point to continued slow
economic activity through 2010 with ongoing wide-ranging volatility in oil and
gas prices. Many oil and gas operators reliant on external financing to fund
their drilling programs have significantly curtailed their drilling activity,
which appears to have had the greatest impact on gas drilling across North
America (excluding Mexico). In addition, international rig count has also
exhibited modest declines. One of the key indicators of our business is the
number of active drilling rigs and this number has varied widely in recent
months. The average annual number of active drilling rigs is as
follows:
|
Average
Rig Count(1)
Years
Ended December 31,
|
||||||
|
2009
|
2008
|
2007
|
||||
|
United
States
|
1,086
|
1,878
|
1,763
|
|||
|
Canada
|
221
|
379
|
342
|
|||
|
Latin
America (including Mexico)
|
356
|
384
|
354
|
|||
|
Europe,
Africa and Middle East (including Russia)
|
398
|
443
|
408
|
|||
|
Asia
Pacific (including China)
|
243
|
252
|
241
|
|||
|
Worldwide
average
|
2,304
|
3,336
|
3,108
|
|||
__________________________________
|
(1)
|
Source:
Baker Hughes
|
During
2009, North American average rig activity continued its sharp decline from 2008
peak levels with a modest recovery beginning late in the year. We believe that
2010 will be a year in which drilling activity in the United States and Canada
will continue to recover from early 2009 levels, and drilling activity in other
areas of the world will rebound more strongly than in the U.S.
Drilling
activity for the last three years has been and the forecast for 2010 is as
follows:
|
Wells
Drilled (1)
For
the Years Ended December 31,
|
||||||||
|
2010
|
2009
|
2008
|
2007
|
|||||
|
(forecast)(1)
|
||||||||
|
U.S.
|
42,749
|
37,204
|
54,749
|
49,195
|
||||
|
Canada
|
9,510
|
8,010
|
18,661
|
18,011
|
||||
|
Latin
America (including Mexico)
|
5,589
|
4,531
|
5,243
|
4,681
|
||||
|
Europe,
N. Africa, Middle East (including Russia)
|
11,107
|
10,519
|
11,429
|
10,156
|
||||
|
Far
East (including China)
|
23,709
|
23,655
|
22,490
|
20,236
|
||||
|
Worldwide
|
92,664
|
83,919
|
112,572
|
102,279
|
||||
__________________________________
|
(1)
|
Source:
report released by World Oil on January 25,
2010
|
The
current outlook for the global economy varies widely, but generally points
toward a modest recovery in 2010. In particular, the U.S. and Canadian rig
activity is projected to increase approximately 15% from average 2009 levels
according to World Oil. International demand is expected to improve more than
U.S. demand, but this is contingent on increased commodity pricing.
Outlook
Current
global macro-economic conditions make any projections difficult and uncertain.
However, we believe top drive backlog is a leading indicator of how our business
will be affected by changes in the global macro-economic environment. As a
result of the weakened economic and industry conditions in 2009 and limited
liquidity resulting from tightened credit markets, our customers reduced their
top drive orders and purchases, and we ended the year with a backlog of 11
units, with a total value of $16.1 million, compared to a backlog of 65 top
drive units at December 31, 2008, with a total value of $56.9 million. Based
upon 2009 drilling levels and current economic forecasts, we expect our order
rate to moderately increase in 2010 compared to our 2009 net orders of 25 new
top drive units. While we have seen a recent increase in sales activity, our
customers have maintained their focus on lowering project costs and,
accordingly, we have adjusted our sales prices on selected product
offerings.
We expect
international demand for our top drive rental services to continue to sustain
better than U.S. demand. Thus, we may continue to shift the location of several
fleet units during 2010 to meet market demand. We will re-route our units in a
manner that minimizes disruptions to our rental operations.
Over the
long term, we believe that our top drive business needs to maintain
manufacturing inventory of two quarters of production to limit our exposure to
fluctuations in sales markets and to allow effective management of our supply
chain and workforce. In addition, we must maintain additional inventory of long
lead time items and semi-finished goods to support our after-market sales and
service business and our manufacturing operations. We considered the long-term
effects of the economic downturn as we evaluated the carrying value of our
global inventory in connection with the completion of our 2010 operating
forecasts. This analysis included part-by-part evaluation of inventory turnover
and projected sales estimates based on the current operating environment and the
timing of forecasted economic recovery. Based on this analysis, we recorded a
charge of $14.4 million to reflect the net realizable value of that inventory.
This was recorded in the Top Drive segment ($5.4 million), the Tubular Services
segment ($2.0 million) and the CASING DRILLING segment ($7.0
million).
We
continue to develop relationships with new and existing customers in both our
Tubular Services and CASING DRILLING segments. For Tubular Services, we expect
our CDS proprietary casing business and MCLRS activities to grow moderately in
2010 compared to 2009 and our conventional casing activities to recover more
slowly as we continue to focus our efforts on the expansion of our proprietary
casing service offerings. In addition, we continue to expand our tubular
services activities in selected international locations to further expand our
global footprint. With respect to our CASING DRILLING business, we plan to
maintain our existing infrastructure around the world while optimizing headcount
in locations with higher demand and streamlining internal processes. We remain
confident that our CASING DRILLING business will be a valuable part of our
future operations.
As
described in “Overview—Business Environment,” our operating activities continue
to shift to international locations (as a percentage of revenue and operating
income). We intend to continue our focus on international opportunities,
especially with the anticipated modest rate of recovery in drilling activity in
the United States and Canada during 2010.
REVISIONS
TO PREVIOUSLY ISSUED FINANCIAL STATEMENTS
In February
2009, Canada enacted a new tax law that allowed for the filing of Tesco’s
Canadian income tax return on a U.S. dollar basis. The effect of the new tax law
and Tesco’s election for adoption was required to be reflected in Tesco's
consolidated financial statements for the first quarter of 2009. As
such, Tesco recorded a $1.6 million income tax benefit, which thereby increased
net income, during the first quarter of 2009 to account for this change in tax
law. We have determined that the $1.6 million income tax benefit was calculated
in error and that an additional $2.9 million income tax benefit should have been
recorded during the first quarter of 2009. In addition,
$0.4 million of foreign exchange loss should not have been recorded in Tesco’s
income statement in the first three quarters of 2009. This error resulted
from the incorrect re-measurement and translation into U.S. dollars of one of
the Company’s foreign assets. As a result of these errors, we have
restated the condensed consolidated financial statements and filed amended
Quarterly Reports on Form 10-Q for the quarterly periods ended March 31, 2009,
June 30, 2009 and September 30, 2009.
Additionally,
we have identified certain immaterial errors that originated in prior
periods. We considered the impact of the misstatements on each of the
quarterly periods affected and on a cumulative basis and concluded the
items were not material to our annual results for the years ended December 31,
2008 and 2007. However, the correction of the results would have been
material to our interim results for each of the quarters and the annual results
in the year ended December 31, 2009. As a result of this evaluation
and based on the accounting guidance, we have revised our consolidated financial
statements for the years ended December 31, 2008 and 2007 to reflect the
cumulative impact of this correction. We do not consider the aforementioned
changes to the consolidated financial statements to be material.
The
following tables summarize the effects of the restatements and the revision of
the immaterial errors on the Consolidated Financial Statements as of and for the
years ended December 31, 2008 and 2007 (in thousands):
|
Balance
Sheet
as
of
December
31, 2008
|
|||||||||||||
|
December
31,
2008
as
previously reported
|
Adjustments
|
December
31,
2008
as
revised
|
|||||||||||
|
Inventories,
net
|
$ | 96,013 | $ | (821 | ) | (a) | $ | 95,192 | |||||
|
Property,
Plant and Equipment, net
|
208,968 | 56 | (a) | 209,024 | |||||||||
|
Deferred
Income Taxes - Current
|
10,996 | (80 | ) | (d) | 10,916 | ||||||||
| Prepaid and Other Assets | 13,533 | 6,157 | (e) | 19,690 | |||||||||
|
Deferred
Income Taxes - Non-Current
|
9,066 | 1,373 | (d) | 10,439 | |||||||||
|
Income
Taxes Payable
|
8,297 | (244 | ) | (d) | 8,053 | ||||||||
|
Accrued
and Other Current Liabilities
|
16,228 | 7,085 | (a,b,e,f) | 23,313 | |||||||||
|
Contributed
Surplus
|
15,708 | (806 | ) | (f) | 14,902 | ||||||||
|
Retained
Earnings
|
142,752 | (795 | ) | 141,957 | |||||||||
|
Accumulated
Comprehensive Income
|
22,186 | 1,445 | (c,d) | 23,631 | |||||||||
|
Statement
of Income
for
the Year Ended
December
31, 2008
|
|||||||||||||
|
December
31,
2008
as
previously reported
|
Adjustments
|
December
31,
2008
as
revised
|
|||||||||||
|
Cost
of Sales and Services
|
$ | 399,197 | $ | 780 | (a) | $ | 399,977 | ||||||
|
Selling,
General and Administrative
|
49,005 | 64 | (b) | 49,069 | |||||||||
|
Foreign
Exchange (Gains) Losses
|
(374 | ) | 560 | (c) | 186 | ||||||||
| Income Before Income Taxes | 72,176 | (1,404 | ) | 70,772 | |||||||||
|
Income
Tax Provision
|
19,270 | 1,579 | (d) | 20,849 | |||||||||
| Net Income | 52,906 | (2,983 | ) | 49,923 | |||||||||
| Earnings per share: | |||||||||||||
| Basic | $ | 1.42 | $ | (0.08 | ) | $ | 1.34 | ||||||
| Diluted | $ | 1.40 | $ | (0.08 | ) | $ | 1.32 | ||||||
|
Statement
of Cash Flows
for
the Year Ended
December 31, 2008
|
|||||||||||||
|
December
31,
2008
as
previously reported
|
Adjustments
|
December
31,
2008
as
revised
|
|||||||||||
|
Net
cash provided by operating activities
|
$ | 76,747 | $ | 280 | (a) | $ | 77,027 | ||||||
|
Net
cash used in investing activities
|
(58,176 | ) | (280 | ) | (a) | (58,456 | ) | ||||||
|
Net
cash (used in) provided by financing activities
|
(19,520 | ) | –– | (19,520 | ) | ||||||||
|
Statement
of Income
for
the Year Ended
December
31, 2007
|
|||||||||||||
|
December
31,
2007
as
previously reported
|
Adjustments
|
December
31,
2007
as
revised
|
|||||||||||
|
Cost
of Sales and Services
|
$ | 357,844 | $ | 488 | (a) | $ | 358,332 | ||||||
|
Selling,
General and Administrative
|
44,003 | (119 | ) | (b) | 43,884 | ||||||||
| Income Before Income Taxes | 42,465 | (369 | ) | 42,096 | |||||||||
|
Income
Tax Provision
|
10,163 | (134 | ) | (d) | 10,029 | ||||||||
| Net Income | 32,302 | (235 | ) | 32,067 | |||||||||
The
restatement and the revision of the immaterial errors had no impact on cash
provided by operating activities, cash used in investing activities or cash used
in financing activities for the year ended December 31, 2007.
|
(a)
|
We
did not properly accrue certain costs related to litigation reserves,
workers compensation, depreciation and payroll taxes for the years ended
December 31, 2008 or 2007. As a result of these errors, Cost of Sales and
Services was misstated. We recorded an increase of $0.8 million and $0.5
million for the years ended December 31, 2008 and 2007, respectively, with
corresponding adjustments to Inventories, net, Property, Plant and
Equipment, net and Accrued and Other Current Liabilities to correct this
misstatement.
|
|
(b)
|
We
did not properly record certain costs for the years ended December 31,
2008 or 2007 related to compensation. As a result of this error, Selling,
General & Administrative expenses were misstated. We recorded an
increase to expense of $0.1 million and a decrease to expense of $0.1
million for the years ended December 31, 2008 and 2007, respectively, with
corresponding adjustments to Accrued and Other Current Liabilities to
correct this misstatement.
|
|
(c)
|
We
did not properly record foreign exchange losses during the year ended
December 31, 2008 related to the re-measurement of certain intercompany
accounts. As a result of this error, Foreign Exchange Losses (Gains) were
overstated by $0.6 million. We recorded an increase to expense of $0.6
million during the year ended December 31, 2008 with a corresponding
increase to Accumulated Comprehensive Income to correct this
misstatement.
|
|
(d)
|
We
did not properly record the foreign exchange impact for deferred tax
balances for the years ended December 31, 2008 or 2007. We recorded an
increase to the tax provision of $1.6 million and a decrease to the tax
provision of $0.1 million for the years ended December 31, 2008 and 2007,
respectively, with corresponding adjustments to Deferred Income Taxes and
Accumulated Comprehensive Income to correct these misstatements. These
adjustments also reflect the tax effect of the pre-tax errors noted above,
with corresponding adjustments to Income Taxes Payable and Deferred Income
Taxes.
|
|
(e)
|
The
December 31, 2008 balance for outstanding prepaid Value Added Taxes was
misclassified on the balance sheet. Accordingly, we corrected this error
by increasing Prepaid and Other Assets by $6.2 million and increasing
Accrued and Other Current Liabilities by $6.2 million.
|
|
(f)
|
Canadian
dollar-denominated stock option awards previously issued to non-Canadian
employees qualify for liability classification due to our voluntary
delisting from the TSX effective June 30, 2008. The fair value of these
awards was approximately $0.8 million and is included in Accrued and Other
Current Liabilities with a corresponding adjustment to Contributed
Surplus.
|
RESULTS
OF OPERATIONS
Years
Ended December 31, 2009 and 2008
Revenues
for the year ended December 31, 2009 were $356.5 million, compared to
$534.9 million in 2008, a decrease of $178.4 million, or 33%. This decrease is
primarily due to a $116.5 million decrease in the Top Drive segment, a $48.2
million decrease in the Tubular Services segment and a $13.7 million decrease in
the CASING DRILLING segment. Results for each business segment are discussed in
further detail below.
Operating
(Loss) Income for the year ended December 31, 2009 was a loss of $14.8
million, compared to income of $74.8 million in 2008, a decrease of $89.6
million. This decrease is primarily due to lower revenues in all of our
segments, decreased margins due to severe pricing pressures associated with the
current economic and market conditions, $14.4 million of impairment charges
incurred to reduce the carrying amount of our global inventory to net realizable
value, $3.6 million of impairments for fixed assets held for sale, $6.0 million
in expenses for litigation reserves and $4.0 million in severance and relocation
costs. Results for each business segment are discussed in further detail
below.
Net
(Loss) Income for the year ended December 31, 2009 was a loss of $5.3
million, or $0.14 per diluted share, compared to income of $49.9 million in
2008, or $1.32 per diluted share, a decrease of $55.2 million. This decrease
primarily results from decreased operating income discussed above and a $1.2
million increase in Foreign Currency Losses from a loss of $0.2 million in
2008 to a loss of $1.4 million in 2009 due to the comparative strengthening of
the Canadian dollar versus the U.S. dollar during 2009, offset by a $2.6 million
decrease in interest expense due to lower average debt balances and decreased
interest rates during 2009.
Revenues
and Operating (Loss) Income by segment and Net (Loss) Income for the years ended
December 31, 2009 and 2008 were as follows (in thousands):
|
Years
Ended December 31,
|
|||||||||||||||
|
2009
|
2008
|
||||||||||||||
|
%
of Revenues
|
%
of Revenues
|
%
Change
|
|||||||||||||
|
REVENUES
|
|||||||||||||||
|
Top
Drive
|
|||||||||||||||
|
-Sales
|
$
|
91,398
|
$
|
164,160
|
|||||||||||
|
-Rental
services
|
83,845
|
111,959
|
|||||||||||||
|
-After-market
support
|
49,610
|
65,313
|
|||||||||||||
|
Total
Top Drive
|
224,853
|
63
|
341,432
|
64
|
(34
|
) | |||||||||
|
Tubular
Services
|
|||||||||||||||
|
-Conventional
|
22,859
|
79,417
|
|||||||||||||
|
-Proprietary
|
95,440
|
87,046
|
|||||||||||||
|
Total
Tubular Services
|
118,299
|
33
|
166,463
|
31
|
(29
|
) | |||||||||
|
-CASING
DRILLING
|
13,326
|
4
|
27,047
|
5
|
(51
|
) | |||||||||
|
Total
Revenues
|
$
|
356,478
|
100
|
$
|
534,942
|
100
|
(33
|
) | |||||||
|
OPERATING
(LOSS) INCOME
|
|||||||||||||||
|
Top
Drive
|
$
|
49,532
|
22
|
$
|
106,822
|
31
|
(54)
|
) | |||||||
|
Tubular
Services
|
(2,942
|
) |
(2
|
) |
22,474
|
14
|
(113
|
) | |||||||
|
CASING
DRILLING
|
(21,013
|
) |
(158
|
) |
(12,605
|
) |
(47
|
) |
(67
|
) | |||||
|
Research
and Engineering
|
(7,431
|
) |
n/a
|
(11,049
|
) |
n/a
|
33
|
||||||||
|
Corporate
and Other
|
(32,945
|
) |
n/a
|
(30,795
|
) |
n/a
|
(7
|
) | |||||||
|
Total
Operating Income
|
$
|
(14,799
|
) |
(4
|
) |
$
|
74,847
|
14
|
(120
|
) | |||||
|
NET
(LOSS) INCOME
|
$
|
(5,265
|
) |
(1
|
) |
$
|
49,923
|
9
|
(111
|
) | |||||
Top
Drive Segment
Our Top
Drive segment is comprised of top drive sales, after-market sales and support
and top drive rental activities.
Revenues—Revenues for the
year ended December 31, 2009 decreased $116.5 million, or 34%, compared to
2008, primarily driven by a $72.7 million decrease in top drive sales, a $28.1
million decrease in top drive rental services and a $15.7 million decrease in
top drive after-market support.
Revenues from
top drive sales decreased $72.7 million, or 44%, to $91.4 million as compared to
2008 in connection with the current downturn in the drilling industry. During
2009, we sold 90 top drive units, of which 79 were new units and 11 were used
units. During 2008, we sold 137 top drive units, of which 118 were new units and
19 were used units. The selling price per unit varies significantly depending on
the model, whether the unit was previously operated in our rental fleet and
whether a power unit was included in the sale. When top drive units in our
rental fleet are sold, the sales proceeds are included in revenues and the net
book value of the equipment sold is included in cost of sales and services.
Revenues related to the sale of used units sold in 2009 and 2008 were $10.4
million and $20.1 million, respectively.
Revenues from top drive
rental service activities decreased $28.1 million, or 25%, to $83.8 million as
compared to 2008, primarily due to a decrease in the number of rental operating
days during 2009, particularly in North America where, according to Baker
Hughes, active drilling activity declined in excess of 30% over the past 12
months. Demand for our top drive rental services is directly tied to active rig
count; on a year-over-year basis, we estimate that the worldwide active rig
count has declined in excess of 20%. The number of top drive operating days and
average daily operating rates for 2009 and 2008 and the number of rental units
in our fleet at year-end 2009 and 2008 were as follows:
|
Years
Ended December 31,
|
|||||||
|
2009
|
2008
|
||||||
|
Number
of operating days
|
18,218 | 23,171 | |||||
|
Average
daily operating rates
|
$ | 4,294 | $ | 4,427 | |||
|
Number
of units in rental fleet, end of year
|
117 | 126 | |||||
We define
an operating day as a day that a unit in our rental fleet is under contract and
operating. We do not include stand-by days in our definition of an operating
day.
A
stand-by day is a day in which we are paid an amount, which may be less than the
full contract rate, to have a top drive rental unit available to a customer but
that unit is not operating. In 2009, stand-by revenues from rental services
decreased $3.8 million to $5.6 million due to decreased operating demand for our
top drive rental units.
In
addition to selling top drive units, we provide after-market sales and service
to support our installed base. Revenues from after-market sales and service
decreased $15.7 million to $49.6 million for 2009 as compared to $65.3 million
in 2008, primarily due to the current year’s decline in active rig count and
drilling activities. The steep drop in rig count substantially decreased the
available number operating top drives in need of repairs, thus shrinking the
market for after-market sales and service. In an effort to minimize costs, many
drilling contractors also began to perform their own maintenance on units we
have historically maintained. Accordingly, our customers have decreased their
demand for after-market parts and maintenance and repair services. This decrease
in demand has also resulted in pricing pressures and thus, decreased revenues
per job.
Operating Income—Top Drive
Operating Income for the year ended December 31, 2009 decreased $57.3
million to $49.5 million compared to 2008. This decrease was primarily driven by
the decrease in the number of top drive units sold in 2009 compared to 2008 (90
units in 2009 compared to 137 units in 2008), a $3.8 million legal settlement
and $1.3 million in severance costs. Operating margins were negatively impacted
by pricing pressures on our after-market sales and service businesses, as
described above. Additionally, we performed an analysis of our Top Drive
inventory parts in connection with our current backlog, continued depressed
demand for drilling and related services and operating forecasts. Based on this
analysis, we recorded a charge of $5.4 million to reflect the net realizable
value of our Top Drive inventory. These charges were partially offset by a $1.6
million gain on the sale of certain ancillary Top Drive equipment and a $1.3
million gain on the sale of a building and property located in
Canada.
Tubular
Services Segment
Revenues—Revenues for the
year ended December 31, 2009 decreased $48.2 million, or 29%, to $118.3
million as compared to 2008. The decrease in revenues reflects a $56.6 million,
or 71%, decrease in conventional casing running revenues, offset by an increase
of approximately $8.4 million, or 10%, in proprietary revenues.
Our
conventional business is primarily conducted in North America and has been
severely impacted by the decline in active rig count discussed above. We provide
equipment and personnel for the installation of tubing and casing, including
power tongs, pick-up/lay-down units, torque monitoring services, connection
testing services and power swivels for new well construction and in work-over
and re-entry operations. Our conventional Tubular Services business generated
revenues of $22.9 million in 2009, a decrease of $56.6 million from 2008,
primarily due to declining industry operating conditions during 2009 and our
shift in job focus from conventional to proprietary services. During 2009, we
continued to gain market acceptance of our services that use our proprietary and
patented technology.
Our
proprietary tubular services business generated revenues of $95.4 million in
2009, an increase of $8.4 million, or 10%, from 2008, which is primarily due to
our proprietary job activity. Our proprietary job count increased from 1,971 in
2008 to 2,554 in 2009 and is a reflection of increased utilization of our CDS
tools. Most of the U.S. drilling activity in 2009 was in several shale
formations that require directional and horizontal drilling techniques, which
are a good application for our proprietary service offerings. While the number
of jobs performed has increased, revenues per job has been negatively impacted
by pricing pressures. In certain cases, we strategically lowered our prices to
obtain multi-well projects. Our revenues related to the sale of CDS and related
equipment and revenues from MCLRS projects decreased by approximately $6.2
million and $1.6 million, respectively, from 2008 as a result of depressed
economic conditions affecting capital spending in North America and throughout
the world.
Operating Income
(Loss)—Tubular Services’ operating income for the year ended
December 31, 2009 decreased $25.4 million to a loss of $2.9 million
compared to 2008. The decrease was primarily driven by decreased revenues and
depressed margins resulting from pricing pressures as discussed above, $1.8
million in impairments of assets held for sale and severance costs of $0.4
million. Additionally, we performed an analysis of our Tubular Services
inventory parts in connection with our operating activities for the past two
years and operating forecasts. Based on this analysis, we recorded a charge of
$2.0 million to reflect the net realizable value of our Tubular Services
inventory.
CASING
DRILLING Segment
Revenues—Revenues for 2009
were $13.3 million compared to $27.0 million in 2008, a decrease of $13.7
million or 51%. The decrease in 2009 was attributable to a decline in available
work, particularly in Latin America and the U.S., in connection with current
industry operating conditions.
Operating Income
(Loss)—CASING DRILLING’s operating loss for the year ended
December 31, 2009 increased $8.4 million to $21.0 million compared to a
loss of $12.6 million in 2008. During the year ended December 31, 2009, we
performed an analysis of our CASING DRILLING inventory to determine excess or
slow moving items based on our operating activities and projections of future
demand. Due to the ongoing technological advances in our CASING DRILLING
technology, combined with the usage forecasts inherent in the analysis, we
recorded a charge of $7.0 million to reflect the net realizable value of our
CASING DRILLING inventory. Operating losses were also negatively impacted by
$1.8 million in impairments of assets held for sale, a $0.5 million loss on the
sale of operating assets and severance costs of $0.2 million, partially offset
by reduced management and overhead expenses. We continue to establish the
infrastructure needed to supply our CASING DRILLING services in locations around
the world.
Research
and Engineering Segment
Research
and Engineering’s operating expenses are comprised of activities related to the
design and enhancement of our top drive models and proprietary equipment and
were $7.4 million for 2009, a decrease of $3.6 million from 2008’s operating
expenses of $11.0 million. This decrease is primarily due to decreased product
development activities on our top drive models and our focus on reducing costs
during 2009. We will continue to invest in the development, commercialization
and enhancements of our proprietary technologies.
Corporate
and Other
Corporate
and Other expenses primarily consist of the corporate level general and
administrative expenses and certain operating level selling and marketing
expenses. Corporate and Other’s operating loss for the year ended
December 31, 2009 increased $2.1 million to a $33.0 million loss compared
to 2008. This increase is primarily due to $2.2 million in legal settlements and
$1.4 million in severance costs, partially offset by a $3.8 million decrease in
bonus accruals and a $1.5 million decrease in marketing expenses during the
current year’s period. In addition, our non-cash stock compensation expense
decreased $0.9 million during the current period related to performance stock
units, which declined in value in response to the current year’s operating
levels.
Net
(Loss) Income (in
thousands):
|
2009
|
2008
|
||||||||||||
|
%
of Revenues
|
%
of Revenues
|
||||||||||||
|
OPERATING
(LOSS) INCOME
|
$
|
(14,799
|
) |
(4
|
) |
$
|
74,847
|
14
|
|||||
|
Interest
Expense
|
1,891
|
1
|
4,503
|
1
|
|||||||||
|
Interest
Income
|
(958
|
) |
––
|
(349
|
) |
––
|
|||||||
|
Foreign
Exchange Losses (Gains)
|
1,360
|
––
|
186
|
––
|
|||||||||
|
Other
Expense (Income)
|
513
|
––
|
(265
|
) |
––
|
||||||||
|
Income
Taxes
|
(12,340
|
) |
(4
|
) |
20,849
|
4
|
|||||||
|
NET
(LOSS) INCOME
|
$
|
(5,265
|
) |
(1
|
) |
$
|
49,923
|
9
|
|||||
Interest Expense— Interest
expense for 2009 decreased $2.6 million compared to the previous year. This
decrease was a result of decreased debt and a 293-basis point decrease in the
weighted average interest rate during the current year due to market conditions.
During the year ended December 31, 2009, average daily debt balances were $37.2
million; approximately $31.1 million lower than 2008.
Interest Income—Interest
income for 2009 increased $0.6 million to $1.0 million, primarily due to $0.8
million in interest received on an overpayment of prior years’ U.S. federal
income taxes.
Foreign Exchange Losses (Gains)
— Foreign exchange losses were $1.4 million in 2009 and $0.2 million in
2008, primarily due to the comparative weakening of the Canadian dollar versus
the U.S. dollar.
Other Income—Other Income
includes non-operating income and expenses, including investment activities. The
following is a detail of the significant items that are included in Other
Expense (Income) for 2009 and 2008 (in thousands):
|
Years
Ended December 31,
|
|||||||
|
2009
|
2008
|
||||||
|
Accrued
penalties assessed by taxing authorities
|
697 | –– | |||||
|
Other
|
(184 | ) | (265 | ) | |||
|
Other
Expense (Income)
|
$ | 513 | $ | (265 | ) | ||
For a
description of these items, see Notes 3, 9 and 11 to the Consolidated Financial
Statements included in Part II, Item 8, “Financial Statements and
Supplementary Data.”
Income Taxes—TESCO is an
Alberta, Canada corporation. We conduct business and are taxed on profits earned
in a number of jurisdictions around the world. Our income tax expense is
provided based on the laws and rates in effect in the countries in which
operations are conducted or in which TESCO and/or its subsidiaries are
considered residents for income tax purposes. Income tax expense as a percentage
of pre-tax earnings fluctuates from year to year based on the level of profits
earned in each jurisdiction in which we operate and the tax rates applicable to
such profits.
Our effective
tax rate for 2009 was 70% compared to 30% in 2008. The 2009 effective tax rate
reflects the recognition of a $4.5 million tax benefit associated with a
Canadian tax law change that occurred during the first quarter of 2009, a $0.3
million tax benefit for research and development credits generated during 2009,
a $1.5 million tax benefit associated with a reduction in the valuation
allowance established against foreign subsidiary net operating loss
carryforwards and cumulative net tax benefits of $3.8 million related to
earnings or losses generated in jurisdictions with statutory tax rates higher or
lower than the Canadian federal and provincial statutory tax rates. The 2009
effective tax rate also includes a $0.4 million charge related to an audit
assessment received in a foreign jurisdiction and $0.7 million of tax expense
associated with a reduction in deferred tax assets attributable to a change in
the period in which we expect to utilize such assets.
The 2008 effective
tax rate reflects a $0.8 million tax benefit for research and development
credits generated during 2008 offset by a $1.2 million charge related to
valuation allowances established against foreign subsidiary losses, a $2.1
million charge related to foreign exchange gains, and a $1.1 million charge
related to a reduction in deferred tax assets attributable to a change in the
period in which we expect to utilize such assets.
No
provision is made for taxes that may be payable on the repatriation of
accumulated earnings in our foreign subsidiaries on the basis that these
earnings will continue to be used to finance the activities of these
subsidiaries.
For a
further description of income tax matters, see Note 9 to the Consolidated
Financial Statements included in Part II, Item 8, “Financial Statements and
Supplementary Data.”
Years
Ended December 31, 2008 and 2007
Revenues
for the year ended December 31, 2008 was $534.9 million, compared to $462.4
million in 2007, an increase of $72.5 million, or 16%. This increase is
primarily due to a $52.3 million increase in the Top Drive segment, a $12.4
million increase in CASING DRILLING revenues and a $7.8 million increase in the
Tubular Services segment.
Operating
Income for the year ended December 31, 2008 was $74.8 million, compared to
$48.2 million in 2007, an increase of $26.6 million. This increase is primarily
attributable to increased operating income in the Top Drive and in the Tubular
Services segments, decreased losses from our CASING DRILLING segment and
decreased costs in our Research and Engineering segment, partially offset by
increased Corporate and Other expenses. Results for each business segment are
discussed in further detail below.
Net
Income for the year ended December 31, 2008 was $49.9 million, or $1.32 per
diluted share, compared to $32.1 million in 2007, or $0.86 per diluted share, an
increase of $17.9 million. This increase primarily results from increased
operating income discussed above and a $2.7 million change in foreign
currency losses from a loss of $2.9 million in 2007 to a loss of $0.2
million in 2008 due to the strengthening of the U.S. dollar during 2008,
partially offset by a $0.8 million decrease in interest income due to interest
received on a Mexican tax deposit during 2007.
Revenues
and operating income by segment and net income for the years ended
December 31, 2008 and 2007 were as follows (in thousands):
|
Years
Ended December 31,
|
|||||||||||||||
|
2008
|
2007
|
||||||||||||||
|
%
of Revenues
|
%
of Revenues
|
%
Change
|
|||||||||||||
|
REVENUES
|
|||||||||||||||
|
Top
Drive
|
|||||||||||||||
|
-Sales
|
$
|
164,160
|
$
|
127,592
|
29
|
||||||||||
|
-After-Market
Support
|
65,313
|
51,872
|
26
|
||||||||||||
|
-Rental
Services
|
111,959
|
109,681
|
2
|
||||||||||||
|
Total
Top Drive
|
341,432
|
64
|
289,145
|
63
|
18
|
||||||||||
|
Tubular
Services (1)
|
|||||||||||||||
|
-Conventional(2)
|
79,417
|
92,923
|
(15
|
) | |||||||||||
|
-Proprietary(2)
|
87,046
|
65,732
|
32
|
||||||||||||
|
Total
Tubular Services
|
166,463
|
31
|
158,655
|
34
|
5
|
||||||||||
|
CASING
DRILLING
|
27,047
|
5
|
14,578
|
3
|
86
|
||||||||||
|
Total
Revenues
|
$
|
534,942
|
100
|
$
|
462,378
|
100
|
16
|
||||||||
|
OPERATING
INCOME(3)
|
|||||||||||||||
|
Top
Drive
|
$
|
106,822
|
31
|
$
|
80,477
|
28
|
33
|
||||||||
|
Tubular
Services
|
22,474
|
14
|
23,654
|
15
|
(5
|
) | |||||||||
|
CASING
DRILLING
|
(12,605
|
) |
(47
|
) |
(14,082
|
) |
(97
|
) |
10
|
||||||
|
Research
and Engineering
|
(11,049
|
) |
n/a
|
(12,011
|
) |
n/a
|
8
|
||||||||
|
Corporate
and Other
|
(30,795
|
) |
n/a
|
(29,887
|
) |
n/a
|
(3
|
) | |||||||
|
Total
Operating Income
|
$
|
74,847
|
14
|
$
|
48,151
|
10
|
55
|
||||||||
|
NET
INCOME
|
$
|
49,923
|
9
|
$
|
32,067
|
7
|
56
|
||||||||
|
(1)
|
At
the end of 2008, we commenced the presentation of our Tubular Services
business and CASING DRILLING as two separate segments. Accordingly, we
have reclassified prior year revenues of approximately $14.6 million and
prior year operating losses of approximately $14.1 million from the former
Casing Services segment to the CASING DRILLING segment to conform to
current year presentation.
|
||
|
(2)
|
At
the end of 2007, we commenced the presentation of Tubular Services
revenues according to two categories: conventional and proprietary. Prior
to January 1, 2008, MCLRS and certain part sales and services were
included with conventional services. However, since these activities use
proprietary and patented technology, we now include them with our
proprietary information. Accordingly, we have reclassified prior year
revenues of approximately $15.3 million related to these sales from
conventional to proprietary to conform to our current year
presentation.
|
||
| (3) |
We
incur costs directly and indirectly associated with our revenues at a
business unit level. Direct costs include expenditures specifically
incurred for the generation of revenues, such as personnel costs on
location or transportation, maintenance and repair, and depreciation of
our revenue-generating equipment. Overhead costs, such as field
administration and field operations support, are not directly associated
with the generation of revenue within a particular business segment. In
prior years, we allocated total overhead costs at a consolidated level
based on a percentage of global revenues. During 2008, we identified and
captured, where appropriate, the specific operating segments in which we
incurred overhead costs at the business unit level. Using this
information, we reclassified our prior year segment operating results to
conform to the current year presentation. These reclassifications resulted
in an increase of $12.3 million in operating income in the Top Drive
segment and a corresponding decrease of $12.3 million in the Tubular
Services segment for the year ended December 31,
2007.
|
Top
Drive Segment
Our Top
Drive segment is comprised of top drive sales, after-market sales and support
and top drive rental activities.
Revenues—Revenues for the
year ended December 31, 2008 increased $52.3 million compared to 2007,
primarily driven by a $36.6 million increase in top drive sales, a $13.4 million
increase in top drive after-market support and a $2.3 million increase in top
drive rental services.
Revenues
from top drive sales increased $36.6 million, or 29%, to $164.1 million as
compared to 2007, primarily the result of the sale of 137 units in 2008 compared
to 122 units during 2007. During 2008, we sold 137 top drive units, of which 118
were new units and 19 were used units. During 2007, we sold 122 top drive units,
of which 102 were new units and 20 were used units. The selling price per unit
varies significantly depending on the model, whether the unit was previously
operated in our rental fleet and whether a power unit was included in the sale.
When top drive units in our rental fleet are sold, the sales proceeds are
included in revenues and the net book value of the equipment sold is included in
cost of sales and services. Revenues related to the sale of used units sold in
2008 and 2007 were $20.1 million and $18.9 million, respectively.
In
addition to selling top drive units, we provide after-market sales and service
to support our installed base. Revenues from top drive after-market support
increased $13.4 million, or 26%, to $65.3 million as compared to 2007, primarily
due to the increase in our third party installed base and our efforts to expand
this service.
Revenues
from top drive rental activities increased $2.3 million, or 2%, to $112.0
million as compared to 2007, primarily due to an increase in the number of
operating days, slightly offset by a decline in standby revenues. The increase
in rental days was due to the increased size and utilization rates for our
rental fleet, but offset by downtime associated with used units being removed
from operations to be prepared for sale. We sold 19 used units from our rental
fleet in 2008, and added 35 units. We also experienced downtime between when the
new units were manufactured and when the new units were mobilized for
operations. The number of top drive operating days and average daily operating
rates for 2008 and 2007 and the number of rental units in our fleet at year-end
2008 and 2007 were as follows:
|
Years
Ended December 31,
|
|||||||
|
2008
|
2007
|
||||||
|
Number
of operating days
|
23,171 | 23,086 | |||||
|
Average
daily operating rates
|
$ | 4,427 | $ | 4,310 | |||
|
Number
of units in rental fleet, end of year
|
126 | 110 | |||||
We define
an operating day as a day that a unit in our rental fleet is under contract and
operating. We do not include stand-by days in our definition of an operating
day.
A
stand-by day is a day in which we are paid an amount, which may be less than the
full contract rate, to have a top drive rental unit available to a customer but
that unit is not operating. In 2008, stand-by revenues from rental services
decreased $1.1 million to $9.4 million due to increased operating demand for our
top drive rental units.
Operating Income—Top Drive
Operating Income for the year ended December 31, 2008 increased $26.3
million to $106.8 million compared to 2007. This increase was primarily driven
by the increase in the number of top drive units sold in 2008 compared to 2007
(137 units in 2008 compared to 122 units in 2007), higher sales margins on our
used top drive sales and growth in our high-margin aftermarket sales and
services. Partially offsetting this increase in 2008 were lower margins in our
rental business due to costs related to revitalizing our fleet in North America,
start-up costs related to new contracts in certain international markets,
particularly Mexico, and increased maintenance, refurbishment and
recertification costs due to the high utilization of our rental
fleet.
Tubular
Services Segment
Revenues—Revenues for the
year ended December 31, 2008 increased $7.8 million to $166.5 million as
compared to 2007. The increase in revenues reflects an increase of approximately
$21.3 million, or 32%, in proprietary revenues, offset by a $13.5 million, or
15%, decrease in conventional casing running revenues as we shifted our focus to
gaining market share and market acceptance of our proprietary product
offerings.
Tubular
services proprietary revenues are principally generated from our casing and
tubing business, utilizing our proprietary casing running technology and the
sale of our CDS units and related equipment. Additionally, our proprietary
Tubular Service business includes the installation service of deep water smart
well completion equipment using our MCLRS, a proprietary and patented technology
which improves the quality of the installation of high-end well completions.
Prior to January 1, 2008, MCLRS and certain part sales and services were
included with conventional services. Since MCLRS is a proprietary and patented
technology, we now include this and related activity with our proprietary
information. Accordingly, we have reclassified prior year revenues related to
MCLRS from conventional to proprietary. Our proprietary tubular services
business generated revenues of $87.1 million in 2008, an increase of $21.4
million, or 32%, from 2007, which is primarily due to our proprietary job
activity as our job count increased from 1,406 in 2007 to 1,971 in 2008. The
proprietary job count increase is a reflection of our increased utilization of
our CDS tools. In addition, our proprietary Casing Drive System fleet which
increased from 177 units at December 31, 2007 to 239 units at
December 31, 2008. Our revenues related to the sale of CDS and related
equipment decreased by approximately $5.7 million from 2007. MCLRS revenues also
decreased $5.2 million to $7.8 million in 2008 compared to 2007 as we focused
our services on international opportunities.
Our
conventional Tubular Service business provides equipment and personnel for the
installation of tubing and casing, including power tongs, pick-up/lay-down
units, torque monitoring services, connection testing services and power swivels
for new well construction and in work-over and re-entry operations. Our
conventional Tubular Services business generated revenues of $79.4 million in
2008, a decrease of $13.5 million from 2007, primarily due to our shift in job
focus from conventional to proprietary services.
Operating Income—Tubular
Services’ operating income for the year ended December 31, 2008 decreased
$1.2 million to $22.5 million compared to 2007. The decrease was primarily
driven by increased depreciation expenses and fuel prices. Our operating income
was also affected by costs associated with closing some non-producing districts
and the start-up costs of international projects.
CASING
DRILLING Segment
Revenues—Revenues for 2008
were $27.0 million compared to $14.6 million in 2007, an increase of $12.4
million or 86%. The revenue increase in 2008 was attributable to significant
international revenue growth in both Latin America and the Middle East as well
as continued revenue growth in North America.
Operating Income—CASING
DRILLING’s operating loss for the year ended December 31, 2008 decreased
$1.5 million to $12.6 million compared to $14.1 million in 2007. Operating
margins improved from a loss of 97% in 2007 to a loss of 47% in 2008, primarily
due to increased revenues earned. We continue to establish the infrastructure
needed to supply our CASING DRILLING services in locations around the
world.
Research
and Engineering Segment
Research
and Engineering’s operating expenses are comprised of our activities related to
the design and enhancement of our top drive models and proprietary equipment and
were $11.0 million for 2008, a decrease of $1.0 million from 2007’s operating
expenses of $12.0 million. This decrease is primarily due to normalization of
expenditures from 2007, when we focused on development and market production of
a new generation of hydraulic and electric top drives.
Corporate
and Other
Corporate
and Other is primarily comprised of the corporate level general and
administrative expenses and corporate level selling and marketing expenses.
Corporate and Other’s operating loss for the year ended December 31, 2008
increased $0.9 million to a $30.9 million loss compared to 2007. This increase
is primarily due to a $0.5 million in legal expenses due to the status of our
ongoing legal cases, and a $1.7 million increase in salaries and incentive
compensation based on the company’s financial performance during 2008, partially
offset by decreased computer expenses.
Net
Income (in
thousands):
|
Years
Ended December 31,
|
|||||||||||||
|
2008
|
2007
|
||||||||||||
|
%
of Revenues
|
%
of Revenues
|
||||||||||||
|
OPERATING
INCOME
|
$
|
74,847
|
14
|
$
|
48,151
|
10
|
|||||||
|
Interest
Expense
|
4,503
|
1
|
4,324
|
1
|
|||||||||
|
Interest
Income
|
(349)
|
––
|
(1,150)
|
––
|
|||||||||
|
Foreign
Exchange Losses
|
186
|
––
|
2,899
|
––
|
|||||||||
|
Other
Income
|
(265)
|
––
|
(18)
|
––
|
|||||||||
|
Income
Taxes
|
20,849
|
4
|
10,029
|
2
|
|||||||||
|
NET
INCOME
|
$
|
49,923
|
9
|
$
|
32,067
|
7
|
|||||||
Interest Expense— Interest
expense for 2008 increased $0.2 million compared to the previous year. During
the year ended December 31, 2008, average daily debt balances were $67.8
million, approximately $18.3 million higher than 2007. This increase was a
result of increased debt, an increase in amortization of financial items due to
credit facility fees and an increase in interest for tax contingencies, but was
partially offset by a 225-basis point decrease in the weighted average interest
rate during the current year due to market conditions, resulting in slightly
higher interest expense during the current year period.
Interest Income—Interest
income for 2008 decreased $0.8 million to $0.3 million, primarily due to $0.4
million in interest received on a Mexico tax deposit during 2007.
Foreign Exchange (Gains)
Losses— Foreign exchange (gains) losses increased $2.7 million from a
loss of $2.9 million in 2007 to a loss of $0.2 million in 2008. This change
is primarily due to the comparative weakening of the Canadian dollar between the
two periods, offset by a $0.8 million loss on settling certain foreign currency
contracts during 2008. During the year ended December 31, 2007, we entered into
a series of 25 bi-weekly foreign currency forward contracts with notional
amounts aggregating C$43.8 million. During 2008, we terminated these bi-weekly
foreign currency forward contracts and recognized a loss of $0.6 million. We
replaced them with 14 foreign monthly currency forward contracts that we
subsequently terminated during 2008, recognizing a loss from inception of $0.2
million. We were not party to foreign currency forward contracts as of December
31, 2008. For further discussion regarding our foreign exchange losses, please
see Part II, Item 7A, “Quantitative and Qualitative Disclosures About Market
Risk.”
Other Income—Other Income
includes non-operating income and expenses, including investment activities.
Following is a detail of the significant items that are included in Other
(Income) Expense for 2008 and 2007 (in thousands):
|
Years
Ended December 31,
|
||||||||
|
2008
|
2007
|
|||||||
|
Expiration
of Turnkey Warrants
|
$ | –– | $ | 1,176 | ||||
|
Reversal
of accrued interest and penalties related to Mexico tax
claim
|
–– | (1,341 | ) | |||||
|
Other
|
(265 | ) | 147 | |||||
|
Other
Income
|
$ | (265 | ) | $ | (18 | ) | ||
For a
description of these items, see Notes 3, 9 and 11 to the Consolidated Financial
Statements included in Part II, Item 8, “Financial Statements and
Supplementary Data.”
Income Taxes—TESCO is an
Alberta, Canada corporation. We conduct business and are taxable on profits
earned in a number of jurisdictions around the world. Our income tax expense is
provided based on the laws and rates in effect in the countries in which
operations are conducted or in which TESCO and/or its subsidiaries are
considered residents for income tax purposes. Income tax expense as a percentage
of pre-tax earnings fluctuates from year to year based on the level of profits
earned in each jurisdiction in which we operate and the tax rates applicable to
such profits.
Our effective
tax rate for 2008 was 30% compared to 24% in 2007. The 2008 effective tax rate
reflects a $0.8 million tax benefit for research and development credits
generated during 2008 offset by a $1.2 million charge related to valuation
allowances established against foreign subsidiary losses, a $2.1 million charge
related to foreign exchange gains, and a $1.1 million charge related to a
reduction in deferred tax assets attributable to a change in the period in which
we expect to utilize such assets. The 2007 effective tax rate reflects a $2.2
million tax benefit related to foreign exchange losses offset by a $1.7 million
charge associated with a reduction in deferred tax assets attributable to a
change in the period in which we except to utilize such assets.
No provision
is made for taxes that may be payable on the repatriation of accumulated
earnings in our foreign subsidiaries on the basis that these earnings will
continue to be used to finance the activities of these
subsidiaries.
For a
further description of income tax matters, see Note 9 to the Consolidated
Financial Statements included in Part II, Item 8, “Financial Statements and
Supplementary Data.”
LITIGATION
AND CONTINGENCIES
In the
normal course of our business, we are subject to legal proceedings brought by or
against us and our subsidiaries. As described in Part I, Item 3, “Legal
Proceedings” and in Notes 9 and 11 of the Consolidated Financial Statements
included in Part II, Item 8, “Financial Statements and Supplementary Data,”
we are currently subject to litigation regarding certain competitor patents tax
assessments and employment issues. Our estimates of exposure related to this
litigation represent our best estimates based on consultation with internal and
external legal counsel. There can be no assurance as to the eventual outcome or
the amount of loss we may suffer as a result of these proceedings. We do not
believe that any such proceedings, either individually or in the aggregate, will
have a material adverse effect on our consolidated financial position, results
of operations or cash flows.
LIQUIDITY
AND CAPITAL RESOURCES
Our net
cash and cash equivalents or debt position as of December 31, 2009 and 2008
was as follows (in thousands):
|
Years
Ended December 31,
|
||||||||
|
2009
|
2008
|
|||||||
|
Cash
|
$ | 39,930 | $ | 20,619 | ||||
|
Current
portion of long term debt
|
–– | (10,171 | ) | |||||
|
Long
term debt
|
(8,600 | ) | (39,400 | ) | ||||
|
Net
Cash (Debt)
|
$ | 31,330 | $ | (28,952 | ) | |||
The
conversion from a Net Debt position to a Net Cash position during 2009 was
primarily the result of collecting accounts receivable that were outstanding as
of December 31, 2008, partially offset by using cash collected to fund our
operations and using our cash provided by operations to reduce our outstanding
debt balances by $41.0 million. We have reported Net Cash (Debt) because we
regularly review Net Cash (Debt) as a measure of our performance. However, the
measure presented in this document may not always be comparable to similarly
titled measures reported by other companies due to differences in the components
of the measurement.
Our
current credit agreement (the “Credit Agreement”) provides for up to $145
million in revolving loans including up to $15 million of swingline loans
(collectively, the “Revolver”) and a term loan which had a balance of $10.0
million as of December 31, 2008 with required quarterly payments through October
31, 2009. The Credit Agreement has a term of five years and all outstanding
borrowings on the Revolver will be due and payable on June 5, 2012. In March
2008, we entered into a second amendment to the Credit Agreement in order to
increase the limit on permitted capital expenditures during the quarters ending
March 31, June 30 and September 30, 2008 from 70% to 85% of consolidated EBITDA
(as defined in the Credit Agreement). Amounts available under the Revolver are
reduced by letters of credit issued under the Credit Agreement not to exceed $20
million in the aggregate of all undrawn amounts and amounts that have yet to be
disbursed under all existing letters of credit. Amounts available under the
swingline loans may also be reduced by letters of credit or by means of a credit
to a general deposit account of the applicable borrower. As of December 31,
2009, we had $6.2 million in letters of credit outstanding under our credit
facility and $130.2 million available under the Revolver. The availability
of future borrowings may be limited in order to maintain certain financial
ratios required under the covenants.
The
Credit Agreement contains covenants that we consider usual and customary for an
agreement of this type, including a leverage ratio, a minimum net worth, and a
fixed charge coverage ratio. Pursuant to the terms of the Credit Agreement, we
are prohibited from incurring any additional indebtedness outside the existing
Credit Facility, in excess of $15 million, paying cash dividends to shareholders
and other restrictions which are standard to the industry. The Credit Agreement
is secured by substantially all our assets. All of our direct and indirect
material subsidiaries in the United States and Canada are guarantors of any
borrowings under the Credit Agreement. Additionally, our capital expenditures
are limited to 70% of consolidated EBITDA plus net proceeds from asset sales.
The capital expenditure limit decreases to 60% of consolidated EBITDA plus net
proceeds from asset sales for fiscal quarters ending after June 30,
2010.
During
2009, our capital expenditures were $17.3 million, down from 2008 expenditures
of $79.6 million. In 2008, we established a top drive fleet revitalization
initiative, under which we sold 19 used top drives from the rental fleet and
replaced them with 35 new units. The remaining decrease in our capital
expenditures during 2009 was due to our control over spending in response to
operating conditions throughout the year. We project our capital expenditures
for 2010 to be between $20 to $30 million based on current market
conditions. The planned increase from our 2009 capital spending levels is
directly related to our forecasted rate of industry recovery from 2009
conditions, along with our 2010 strategy to judiciously apply our capital
spending in markets that will perform in spite of the worldwide economic
slowdown.
As of
December 31, 2009, we believe that we are in compliance with our debt
covenants in the Credit Agreement. For further description of the Amended Credit
Agreement, see Note 7 to the Consolidated Financial Statements in this Form 10-K
(Financial Statements and Supplementary Data).
Outstanding
borrowings under our revolving credit facility were $8.6 million as of December
31, 2009 and our term loan was paid in full by the October 31, 2009 maturity
date. Our credit facility is maintained by a syndicate of seven banks, none of
which have indicated any insolvency issues to us.
The
recent global economic downturn, coupled with the global financial and credit
market disruptions, have had a significant negative impact on the oil and gas
industry. These events have contributed to a sharp decline in crude oil and
natural gas prices, weakened markets and a sharp drop in demand. In response to
these conditions, we evaluated the carrying value of our global inventory. This
analysis included part-by-part evaluation of inventory turnover and projected
sales estimates based on the current operating environment and the timing of
forecasted economic recovery. Based on this analysis, we recorded a charge of
$14.4 million to reflect the net realizable value of that inventory. This
impairment charge was recorded in our operating segments as follows: Top Drive
($5.4 million), Tubular Services ($2.0 million) and CASING DRILLING ($7.0
million).
Our
investment in working capital, excluding cash and current portion of long term
debt, decreased $20.8 million to $112.4 million at December 31, 2009 from
$133.3 million at December 31, 2008. The decrease during 2009 was primarily
attributable to collections of outstanding accounts receivable and the inventory
impairment charge discussed above, offset by a decrease in our accounts
payable.
Following
is the calculation of working capital, excluding cash and current portion of
long term debt, at December 31, 2009 and 2008 (in thousands):
|
Years
Ended December 31,
|
||||||||
|
2009
|
2008
|
|||||||
|
Current
Assets
|
$ | 211,700 | $ | 244,164 | ||||
|
Current
Liabilities
|
(59,325 | ) | (100,447 | ) | ||||
|
Working
Capital
|
152,375 | 143,717 | ||||||
|
Less:
|
||||||||
|
Cash
and Cash Equivalents
|
(39,930 | ) | (20,619 | ) | ||||
|
Current
Portion of Long Term Debt
|
–– | 10,171 | ||||||
|
Working
Capital, Excluding Cash and Current Portion of Long Term
Debt
|
$ | 112,445 | $ | 133,269 | ||||
We
believe that during 2010, cash generated from operations and amounts available
under our existing credit facilities will be sufficient to fund our working
capital needs and capital expenditures.
Contractual
Obligations
The
following is a summary of our significant future contractual obligations by year
as of December 31, 2009 (in thousands):
|
Payments
Due by Period
|
||||||||||||||||||||
|
Total
|
Less Than
1 Year
|
1-3
Years
|
3-5
Years
|
More Than
5 Years
|
||||||||||||||||
|
Long
term debt obligations
|
$ | 8,600 | $ | –– | $ | 8,600 | $ | –– | $ | –– | ||||||||||
|
Operating
lease obligations
|
13,050 | 4,406 | 4,797 | 1,901 | 1,946 | |||||||||||||||
|
Interest
|
1,073 | 444 | 629 | –– | –– | |||||||||||||||
|
Manufacturing
purchase commitments
|
11,356 | 11,356 | –– | –– | –– | |||||||||||||||
| $ | 34,079 | $ | 16,206 | $ | 14,026 | $ | 1,901 | $ | 1,946 | |||||||||||
Future
interest payments were forecast based upon the applicable rate in effect at
December 31, 2009 of 1.99% for the Secured Revolver.
Major
Customers and Credit Risk
Our
accounts receivable are principally with major international and state oil and
gas service and exploration and production companies and are subject to normal
industry credit risks. We perform ongoing credit evaluations of customers and
grant credit based upon past payment history, financial condition and
anticipated industry conditions. Customer payments are regularly monitored and a
provision for doubtful accounts is established based upon specific situations
and overall industry conditions. Many of our customers are located in
international areas that are inherently subject to risks of economic, political
and civil instabilities, including the effects of currency fluctuations and
exchange controls, such as devaluation of foreign currencies and other economic
problems, which may impact our ability to collect those accounts receivable.
During 2009, the economic downturn and related credit crisis created significant
pressures on our customers. In response to these conditions, we monitored
customers who were at-risk for non-payment and, as a result, lowered available
credit extended to those customers or established alternative arrangements,
including increased deposit requirements or payment schedules.
For the
years ended December 31, 2009, 2008 and 2007, no single customer represented
more than 10% of total revenues.
ENVIRONMENTAL
MATTERS
During
2009, we completed the sale of a building and land located in Canada. We
incurred approximately $0.1 million and $0.9 million during the years ended
December 31, 2009 and 2008, respectively, in soil remediation costs to prepare
the property for sale. These costs were capitalized as an increase in the
property’s net book value. Other than these expenditures, we did not incur any
material costs in 2009, 2008 or 2007 as a result of environmental protection
requirements, nor do we anticipate environmental protection requirements to have
any material financial or operational effects on our capital expenditures,
earnings or competitive position in future years.
TRANSACTIONS
WITH RELATED PARTIES
Bennett
Jones LLP
Our
primary outside counsel in Canada is Bennett Jones LLP. One of our directors is
counsel at Bennett Jones LLP. During each of the years 2009, 2008 and 2007, we
paid approximately $0.1 million, $0.4 million and $0.4 million, respectively,
for services from Bennett Jones LLP, excluding reimbursement by us of patent
filing fees and other expenses. We believe that the rates we paid Bennett Jones
LLP for services are on terms similar to those that would have been available
from other third parties.
SIGNIFICANT
ACCOUNTING POLICIES
The
preparation and presentation of our financial statements requires management to
make estimates that significantly affect the results of operations and financial
position reflected in the financial statements. In making these estimates,
management applies accounting policies and principles that it believes will
provide the most meaningful and reliable financial reporting. Management
considers the most significant of these estimates and their impact to
be:
Foreign Currency
Translation—The U.S. dollar is the functional currency for most of our
worldwide operations. For foreign operations where the local currency is the
functional currency, specifically our Canadian operations, assets and
liabilities denominated in foreign currencies are translated into U.S. dollars
at end-of-period exchange rates, and the resultant translation adjustments are
reported, net of their related tax effects, as a component of accumulated
comprehensive income in shareholders’ equity. Monetary assets and liabilities
denominated in currencies other than the functional currency are remeasured into
the functional currency prior to translation into U.S. dollars, and the
resultant exchange gains and losses are included in income in the period in
which they occur. Income and expenses are translated into U.S. dollars at the
average exchange rates in effect during the period. Our primary exposure with
respect to foreign currency exchange rate risk is the change in the U.S.
dollar/Canadian dollar exchange rate. Historically, this exchange rate has
fluctuated within approximately 20% of the U.S. dollar, and we have recognized a
corresponding foreign exchange gain or loss. We cannot accurately predict the
amount or variability of future exchange rate fluctuations. Accordingly, the
amount of gains or losses recognized in the future may vary significantly from
historically reported amounts.
Revenue Recognition—We
recognize revenues from product sales when the earnings process is complete and
collectability is reasonably assured when title and risk of loss of the
equipment is transferred to the customer, with no right of return. Revenues in
the Top Drive segment may be generated from contractual arrangements that
include multiple deliverables. Revenues from these arrangements are recognized
as each item or service is delivered based on their relative fair value and when
the delivered items or services have stand-alone value to the customer. For
revenues other than product sales, we recognize revenues as the services are
rendered based upon agreed daily, hourly or job rates.
We
provide product warranties on equipment sold pursuant to manufacturing contracts
and provide for the anticipated cost of such warranties in cost of sales when
sales revenue is recognized. The accrual of warranty costs is an estimate based
upon historical experience and upon specific warranty issues as they arise. We
periodically review our warranty provision to assess its adequacy in the light
of actual warranty costs incurred. The key factors with respect to estimating
our product warranty accrual are our assumptions regarding the quantity and
estimated cost of potential warranty exposure. Historically, our warranty
expense has fluctuated based on the identification of specifically identified
technical issues, and warranty expense does not necessarily move in concert with
sales levels. In the past, we have not recognized a material adjustment from our
original estimates of potential warranty costs. However, because the warranty
accrual is an estimate, it is reasonably possible that future warranty issues
could arise that could have a significant impact on our financial
statements.
Deferred Revenues—We
generally require customers to pay a non-refundable deposit for a portion of the
sales price for top drive units with their order. These customer deposits are
deferred until the customer takes title and risk of loss of the
product.
Accounting for Stock-Based
Compensation—We recognize compensation expense on stock-based awards to
employees, directors and others. For those awards that we intend to settle in
stock, compensation expense is based on the calculated fair value of each
stock-based award at its grant date, the estimation of which may require us to
make assumptions about the future volatility of our stock price, rates of
forfeiture, future interest rates and the timing of grantees’ decisions to
exercise their options. Certain of our stock options awarded prior to our
voluntary delisting from the Toronto Stock Exchange effective June 30, 2008 were
denominated in Canadian dollars and have been determined to be liability
classified awards. Accordingly, they are remeasured at fair value at the end of
each reporting period, which may result in volatility in future compensation
expense. The fair value of option awards is estimated using the Black-Scholes
option pricing model. Key assumptions in the Black-Scholes option pricing model,
some of which are based on subjective expectations, are subject to change. A
change in one or more of these assumptions would impact the expense associated
with future grants. These assumptions bear the risk of change as they require
significant judgment and they have inherent uncertainties that management may
not be able to control. These key assumptions include the weighted average
risk-free interest rate, the expected life of options, the volatility of our
common shares and the weighted average expected forfeiture rate. We base our
assumptions on our historical experience; however, future activity may vary
significantly from our estimates.
Allowance for Doubtful Accounts
Receivable—We perform ongoing credit evaluations of customers and grant
credit based upon past payment history, financial condition and anticipated
industry conditions. Customer payments are regularly monitored and a provision
for doubtful accounts is established based upon specific situations and overall
industry conditions. Many of our customers are located in international areas
that are inherently subject to risks of economic, political and civil
instabilities, which may impact management’s ability to collect those accounts
receivable. The main factors in determining the allowance needed for accounts
receivable are customer bankruptcies, delinquency, and management’s estimate of
ability to collect outstanding receivables based on the number of days
outstanding. We make assumptions regarding current market conditions and how
they may affect our customers’ ability to pay outstanding receivables. These
assumptions are based on the length of time that a receivable remains unpaid,
our historical experiences with the customers, the financial condition of the
individual customers and the international areas in which they operate.
Historically, our estimates have not differed materially from the ultimate
amounts recognized for bad debts. However, these allowances are based on
estimates. If actual results are not consistent with our assumptions and
judgments used, we may be exposed to additional write offs of accounts
receivable that could be material to our results of operations.
Excess and Obsolete Inventory
Provisions—Our inventory consists primarily of specialized tubular
services and casing tool parts, spare parts, work in process, and raw materials
to support our ongoing manufacturing operations and our installed base of
specialized equipment used throughout the world. Customers rely on us to stock
these specialized items to ensure that their equipment can be repaired and
serviced in a timely manner. Our estimated carrying value of inventory therefore
depends upon demand driven by oil and gas drilling activity, which depends in
turn upon oil and gas prices, the general outlook for economic growth worldwide,
available financing for our customers, political stability in major oil and gas
producing areas and the potential obsolescence of various types of equipment we
sell, among other factors. Quantities of inventory on hand are reviewed
periodically to ensure they remain active part numbers and the quantities on
hand are not excessive based on usage patterns and known changes to equipment or
processes. Our primary exposure with respect to estimating our provision for
excess and obsolete inventory is our assumption regarding the projected quantity
usage patterns. These estimates are based on historical usage and operating
forecasts and are reviewed for reasonableness on a periodic basis. In response
to 2009’s economic and industry conditions, we evaluated the carrying value of
our global inventory. This analysis included part-by-part evaluation of
inventory turnover and projected sales estimates based on the current operating
environment and the timing of forecasted economic recovery. Based on this
analysis, we recorded a charge of $14.4 million to reflect the net realizable
value of that inventory. Significant or unanticipated changes in business
conditions and/or changes in technologies could impact the amount and timing of
any additional provision for excess or obsolete inventory that may be
required.
Impairment of Intangible and Other
Long-Lived Assets and Goodwill —Long-lived assets, which include
property, plant and equipment, goodwill and intangible and other assets,
comprise a substantial portion of our assets. The carrying value of these assets
is reviewed for impairment on an annual basis or whenever events or changes in
circumstances indicate that their carrying amounts may not be recoverable. This
requires us to forecast future cash flows to be derived from the utilization of
these assets based upon assumptions about future business conditions or
technological developments. Significant, unanticipated changes in circumstances
could make these assumptions invalid and require changes to the carrying value
of our long-lived assets.
Long-lived
assets, such as property, plant and equipment, and intangible assets are
reviewed for impairment when events or changes in circumstances indicate that
the carrying value of the assets contained in our financial statements may not
be recoverable. When evaluating long-lived assets and intangible assets for
potential impairment, we first compare the carrying value of the asset to the
asset’s estimated, future net cash flows (undiscounted and without interest
charges). If the estimated future cash flows are less than the carrying value of
the asset, we calculate and recognize an impairment loss. If we recognize an
impairment loss, the adjusted carrying amount of the asset will be its new cost
basis. For a depreciable long-lived asset, the new cost basis will be
depreciated over the remaining useful life of that asset. Restoration of a
previously recognized impairment loss is prohibited.
Our
impairment loss calculations require management to apply judgments in estimating
future cash flows and asset fair values, including forecasting useful lives of
the assets held and used and estimating future operating activities. We had no
impairment charges on long-lived assets held and used during the years ended
December 31, 2009 or 2008. If actual results are not consistent with our
assumptions and judgments used in estimating future cash flows and asset fair
values, we may be exposed to impairment losses that could be material to our
results of operations.
During
the year ended December 31, 2009, we made the decision to sell certain operating
assets within the next 12 months. These fixed assets had a carrying amount of
$3.9 million, and were written down to their estimated realizable value of $0.3
million during the year ended December 31, 2009. The estimated realizable fair
value was derived from quotations received from independent third parties. The
resulting impairment charge of $3.6 million is included in Cost of Sales and
Services in the accompanying Consolidated Statements of Income for the year
ended December 31, 2009.
We test
consolidated goodwill for impairment using a fair value approach at the
reporting unit level and perform our goodwill impairment test annually or upon
the occurrence of a triggering event. Goodwill impairment exists when the
estimated fair value of goodwill is less than its carrying value.
For
purposes of our analysis, we estimate the fair value for the reporting unit
based on discounted cash flows (the income approach). The income approach is
dependent on a number of significant management assumptions including markets
and market share, sales volumes and prices, costs to produce, capital spending,
working capital changes, terminal value multiples and the discount rate. The
discount rate is commensurate with the risk inherent in the projected cash flows
and reflects the rate of return required by an investor in the current economic
conditions. Based on our analysis performed for the year ended December 31,
2009, if we were to increase the discount rate by 300 basis points while keeping
all other assumptions constant, there would be no impairment in the reporting
unit. Inherent in our projections are key assumptions relative to how long the
current downward cycle might last. Furthermore, the financial and credit market
volatility directly impacts our fair value measurement through our
weighted-average cost of capital that we use to determine our discount rate.
During times of volatility, significant judgment must be applied to determine
whether credit changes are a short term or long term trend. While we believe the
assumptions made are reasonable and appropriate, we will continue to monitor
these, and update our impairment analysis if the cycle downturn continues for
longer than expected.
If actual
results are not consistent with our assumptions and judgments used in estimating
future cash flows and asset fair values, we may be exposed to additional
impairment losses that could be material to our results of
operations.
Income Taxes—We use the
liability method which takes into account the differences between financial
statement treatment and tax treatment of certain transactions, assets and
liabilities. Deferred tax assets and liabilities are recognized for the future
tax consequences attributable to differences between the financial statement
carrying amounts of existing assets and liabilities and their respective tax
bases. By their nature, tax laws are often subject to interpretation. In those
cases where a tax position is open to interpretation, differences of opinion can
result in differing conclusions as to the amount of tax benefits to be
recognized. Valuation allowances are established to reduce deferred tax assets
when it is more likely than not that some portion or all of the tax asset will
not be realized. Estimates of future taxable income and ongoing tax planning
have been considered in assessing the utilization of available tax losses and
credits. Unforeseen events and industry conditions may impact forecasts of
future taxable income which, in turn, can affect the carrying value of the
deferred tax assets and liabilities and impact our future reported earnings. The
level of evidence and documentation necessary to support a position prior to
being given recognition and measurement within the financial statements is a
matter of judgment that depends on all available evidence. A change in our
forecast of future taxable income, or changes in circumstances, assumptions and
clarification of uncertain tax regimes may require changes to any valuation
allowances associated with our deferred tax assets, which could have a material
effect on net income.
RECENT
ACCOUNTING PRONOUNCEMENTS
In
January 2010, the Financial Accounting Standards Board (“FASB”) issued an
update to existing accounting standards to improve disclosures regarding fair
value measurements and, thus, increase the transparency in financial reporting.
The update provides that a reporting entity should disclose separately the
amounts of significant transfers in and out of Level 1 and Level 2 fair value
measurements and describe the reasons for the transfers; and in the
reconciliation for fair value measurements using significant unobservable
inputs, a reporting entity should present separately information about
purchases, sales, issuances, and settlements. In addition, the update clarifies
the requirements of the existing disclosures as follows: (1) For purposes of
reporting fair value measurement for each class of assets and liabilities, a
reporting entity needs to use judgment in determining the appropriate classes of
assets and liabilities; and (2) A reporting entity should provide disclosures
about the valuation techniques and inputs used to measure fair value for both
recurring and nonrecurring fair value measurements. The update is effective for
interim and annual reporting periods beginning after December 15, 2009, except
for the disclosures about purchases, sales, issuances, and settlements in the
roll forward of activity in Level 3 fair value measurements. Those disclosures
are effective for fiscal years beginning after December 15, 2010, and for
interim periods within those fiscal years. Early application is permitted. We
will adopt these provisions and the adoption is not expected to have a material
impact on the consolidated financial statements.
In June
2009, the FASB issued updated guidance that allows for more flexibility in
determining the value of separate elements in revenue arrangements with multiple
deliverables. This guidance modifies the requirements for determining whether a
deliverable can be treated as a separate unit of accounting by removing the
criteria that verifiable and objective evidence of fair value exists for the
undelivered elements. All entities must adopt no later than the beginning of
their first fiscal year beginning on or after June 15, 2010. Upon adoption,
entities may choose between the prospective application for transactions entered
into or materially modified after the date of adoption, or the retroactive
application for all revenue arrangements for all periods presented. Disclosures
will be required when changes in either those judgments or the application of
this guidance significantly affect the timing or amount of revenue recognition.
We will adopt these provisions on January 1, 2011 and the adoption is not
expected to have a material impact on the consolidated financial
statements.
In June
2009, the FASB issued new accounting guidance that clarifies the characteristics
that identify a variable interest entity (“VIE”) and changes how a reporting
entity identifies a primary beneficiary that would consolidate the VIE from a
quantitative risk and rewards calculation to a qualitative approach based on
which variable interest holder has controlling financial interest and the
ability to direct the most significant activities that impact the VIE’s economic
performance. This guidance requires the primary beneficiary assessment to
be performed on a continuous basis. It also requires additional disclosures
about an entity’s involvement with VIE, restrictions on the VIE’s assets and
liabilities that are included in the reporting entity’s consolidated balance
sheet, significant risk exposures due to the entity’s involvement with the VIE,
and how its involvement with a VIE impacts the reporting entity’s consolidated
financial statements. This update is effective for fiscal years beginning after
November 15, 2009. We will adopt these provisions on January 1, 2010 and
the adoption is not expected to have a material impact on the consolidated
financial statements.
In June
2009, the FASB issued new accounting guidance that enhances the information
provided to financial statement users to provide greater transparency about
transfers of financial assets and a transferor’s continuing involvement, if any,
with transferred financial assets. Under this Statement, many types of
transferred financial assets that would have been derecognized previously are no
longer eligible for derecognition. This Statement requires enhanced disclosures
about the risks to which a transferor continues to be exposed due to its
continuing involvement in transferred financial assets. This Statement also
clarifies and improves certain provisions in previously issued statements that
have resulted in inconsistencies in the application of the principles on which
that Statement is based. These updates are effective for annual reporting
periods beginning after November 15, 2009, for interim periods within that first
annual reporting period and for interim and annual reporting periods thereafter.
Earlier application is prohibited. We will adopt these provisions on January 1,
2010 and the adoption is not expected to have a material impact on the
consolidated financial statements.
In May
2009, the FASB issued new accounting guidance which establishes general
standards of accounting for and disclosures of events that occur after the
balance sheet date but before the financial statements are issued or are
available to be issued. It requires the disclosure of the date through which an
entity has evaluated subsequent events. We adopted the new disclosure
requirements in our financial statements issued for the period ended June 30,
2009 and the adoption did not have a material impact on the consolidated
financial statements.
In April
2009, the FASB issued new guidance that requires registrants to disclose the
fair value of all financial instruments for interim reporting periods and in its
financial statements for annual reporting periods, whether recognized or not
recognized in the statement of financial position. We adopted the updated
guidance for the interim reporting period ended March 31, 2009 and the
adoption did not have a material impact on our consolidated financial
statements.
SHARE
CAPITAL
We have
an unlimited number of Common Shares authorized for issuance. At
February 25, 2010, there were 37,752,911 Common Shares issued and
outstanding. At December 31, 2009, there were 1,767,036 outstanding options
and 850,751 restricted stock awards exercisable into Common Shares.
|
ITEM 7A.
|
QUANTITATIVE AND QUALITATIVE DISCLOSURES ABOUT
MARKET RISK.
|
From time
to time, we use derivative financial instruments in the management of our
foreign currency and interest rate exposures. We do not use derivative financial
instruments for trading or speculative purposes and account for all such
instruments using the fair value method. Currency exchange exposures on foreign
currency denominated balances and anticipated cash flows may be managed by
foreign exchange forward contracts when it is deemed appropriate. Exposures
arising from changes in prevailing levels of interest rates relative to the
contractual rates on our debt may be managed by entering into interest rate swap
agreements when it is deemed appropriate.
We were
not party to any derivative financial instruments during the year ended
December 31, 2009.
The
carrying value of cash, investments in short-term commercial paper and other
money market instruments, accounts receivable, accounts payable and accrued
liabilities approximate their fair value due to the relatively short-term period
to maturity of the instruments.
The fair
value of our long term debt depends primarily on current market interest rates
for debt issued with similar maturities by companies with risk profiles similar
to us. The fair value of our debt related to our credit facility at December 31,
2009 was approximately $8.2 million. A one percent change in interest rates
would increase or decrease interest expense $0.1 million annually based on
amounts outstanding at December 31, 2009.
Our
accounts receivable are principally with oil and gas service and exploration and
production companies and are subject to normal industry credit risks. The recent
volatility in the capital and credit markets could have a significant impact on
our industry and us directly. Please see Part I, Item 1A, “Risk Factors,” for
further discussion of these recent risks.
|
ITEM 8.
|
FINANCIAL STATEMENTS AND SUPPLEMENTARY
DATA.
|
The
financial statements and supplementary data required by this item are included
in Part IV, Item 15 of this Form 10-K and are presented beginning on page
F-1.
|
ITEM 9.
|
CHANGES IN AND DISAGREEMENTS WITH ACCOUNTANTS ON
ACCOUNTING AND FINANCIAL
DISCLOSURE.
|
None.
ITEM
9A. CONTROLS
AND PROCEDURES.
Evaluation
of Disclosure Controls and Procedures
We
maintain disclosure controls and procedures designed to provide reasonable
assurance that information required to be disclosed in the SEC reports we file
or submit under the Securities Exchange Act of 1934, as amended (the “Exchange
Act”) is recorded, processed, summarized and reported within the time period
specified by the SEC’s rules and forms and that such information is accumulated
and communicated to management, including our Chief Executive Officer and Chief
Financial Officer, to allow timely decisions regarding required disclosure. As
of December 31, 2009, our Chief Executive Officer and Chief Financial Officer
participated with our management in evaluating the effectiveness of our
disclosure controls and procedures (as defined in Rules 13a-15(e) and 15d-15(e)
under the Exchange Act). Our Chief Executive Officer and Chief Financial Officer
have concluded that, as of December 31, 2009, our disclosure controls and
procedures were not effective due to a material weakness in our internal control
over financial reporting, as described below.
Management’s
Report on Internal Control Over Financial Reporting
A
company’s internal control over financial reporting is a process designed by, or
under the supervision of, a public company’s Chief Executive Officer and Chief
Financial Officer, or persons performing similar functions, and effected by the
board of directors, management and other personnel, to provide reasonable
assurance regarding the reliability of financial reporting and the preparation
of financial statements for external purposes in accordance with generally
accepted accounting principles (“GAAP”). A company’s internal control over
financial reporting includes those policies and procedures that: (i) pertain to
the maintenance of records that, in reasonable detail, accurately and fairly
reflect the transactions and dispositions of the assets of the company, (ii)
provide reasonable assurance that transactions are recorded as necessary to
permit preparation of financial statements in accordance with GAAP and that
receipts and expenditures are being made only in accordance with authorizations
of management and directors of the company, and (iii) provide reasonable
assurance regarding prevention or timely detection of unauthorized acquisition,
use or disposition of the company’s assets that could have a material effect on
the financial statements.
Because
of its inherent limitations, internal control over financial reporting may not
prevent or detect misstatements. Also, projections of any evaluation of
effectiveness to future periods are subject to the risk that controls may become
inadequate because of changes in conditions, or that the degree of compliance
with the policies or procedures may deteriorate.
Management
is responsible for establishing and maintaining adequate internal control over
financial reporting. Our management, with the participation of our Chief
Executive Officer and Chief Financial Officer, has assessed the effectiveness of
our internal control over financial reporting as of December 31, 2009. In making
this assessment, our management used the criteria established in Internal Control—Integrated
Framework issued by the Committee of Sponsoring Organizations of the
Treadway Commission (“COSO”).
A
material weakness is a deficiency, or a combination of deficiencies, in internal
control over financial reporting, such that there is a reasonable possibility
that a material misstatement of the company's annual or interim financial
statements will not be prevented or detected on a timely basis.
We did
not maintain effective control over accounting for income taxes with respect to
non-routine and atypical transactions as of December 31,
2009. Specifically, an effective control was not operating to ensure
that accounting changes were completely and accurately recorded on a timely
basis for the adoption of a new tax law in Canada during the first quarter
2009. Additionally, this control was not sufficiently designed to
ensure that deferred taxes denominated in a currency other than the functional
currency were appropriately calculated and re-measured on a timely basis. This
control deficiency resulted in misstatements of the deferred tax assets, the
income tax provision, foreign exchange gains and losses, cumulative translation
adjustments accounts and related financial disclosures. This control
deficiency also resulted in restatements of the Company’s condensed consolidated
financial statements as of and for each of the quarters ended March 31, 2009,
June 30, 2009 and September 30, 2009 and resulted in audit adjustments to the
Company's consolidated financial statements as of and for the year ended
December 31, 2009. Additionally, this control deficiency could
result in misstatements of the aforementioned accounts and disclosures that
would result in a material misstatement of the consolidated financial statements
that would not be prevented or detected. Accordingly, our management
has determined that this control deficiency constitutes a material
weakness.
Because
of this material weakness, management concluded that the Company did not
maintain effective internal control over financial reporting as of December 31,
2009, based on criteria in Internal Control-Integrated
Framework issued by the COSO.
The
effectiveness of our internal control over financial reporting as of December
31, 2009 has been audited by PricewaterhouseCoopers LLP, our independent
registered public accounting firm, as stated in their report which is included
herein.
Changes
in Internal Control over Financial Reporting
There
were no changes in our internal control over financial reporting during the
quarter and year ended December 31, 2009 that materially affected, or is
reasonably likely to materially affect, our internal control over financial
reporting.
Remediation
Plan
Subsequent
to December 31, 2009, our management has taken immediate action to begin
remediating the material weakness identified by thoroughly reviewing the tax
provision process and existing controls to identify areas in need of improvement
to increase the efficiency and effectiveness of our internal controls over the
accounting for income taxes. Specifically, we plan to establish and
design controls to identify and properly account for significant changes or
events impacting the Company’s tax accounts, such as significant changes to tax
laws including the following:
|
·
|
In
addition to its performance on an annual basis, the Company will prepare a
tax basis balance sheet and related reconciliation upon the occurrence of
significant changes or events impacting the Company’s tax accounts, such
as significant changes in tax laws, during the quarter in which such
events occur.
|
|
·
|
Increasing
the use of expert outside service providers to review the tax implications
of such events when determined to be
necessary.
|
|
·
|
Automation
through the general ledger system of the re-measurement of the Company's
Canadian deferred tax accounts denominated in a currency other than the
local function currency.
|
We
believe the remediation measures described above will remediate the material
weakness identified and strengthen our internal control over financial
reporting. We are committed to continuing to improve our internal
control processes and will continue to review our financial reporting controls
and procedures. As we continue to evaluate and work to improve our
internal control over financial reporting, we may identify additional measures
to address the material weakness or determine to modify certain of the
remediation procedures described above. Our management, with the
oversight of our audit committee, will continue to take steps to remedy the
known material weakness as expeditiously as possible and enhance the overall
design and capability of our control environment.
|
ITEM 9B.
|
OTHER INFORMATION.
|
None.
PART
III
Items 9
through 13 will be included in TESCO’s Proxy Statement for our 2010 Annual
Meeting of the Shareholders, and are incorporated herein by
reference.
|
ITEM 10.
|
DIRECTORS AND EXECUTIVE OFFICERS AND CORPORATE
GOVERNANCE.
|
The
information required by this Item will be included under the section captioned
“Election of Directors (Proposal 1)” in our Proxy Statement for the 2010 Annual
Meeting of Shareholders, which information is incorporated into this Annual
Report by reference.
|
ITEM 11.
|
EXECUTIVE
COMPENSATION.
|
The
information required by this Item will be included under the sections captioned
“Compensation Discussion and Analysis” and “Certain Relationships and Related
Transactions” in our Proxy Statement for the 2010 Annual Meeting of
Shareholders, which information is incorporated into this Annual Report by
reference.
|
ITEM 12.
|
SECURITY OWNERSHIP OF CERTAIN BENEFICIAL OWNERS AND
MANAGEMENT AND RELATED STOCKHOLDER
MATTERS.
|
The
information required by this Item will be included under the section captioned
“Security Ownership of Certain Beneficial Owners and Management” in our Proxy
Statement for the 2010 Annual Meeting of Shareholders, which information is
incorporated into this Annual Report by reference.
|
ITEM 13.
|
CERTAIN RELATIONSHIPS AND RELATED
TRANSACTIONS AND DIRECTOR
INDEPENDENCE.
|
The
information required by this Item will be included under the section captioned
“Certain Relationships and Related Transactions” in our Proxy Statement for the
2010 Annual Meeting of Shareholders, which information is incorporated into this
Annual Report by reference.
|
ITEM 14.
|
PRINCIPAL ACCOUNTANT FEES AND
SERVICES.
|
Information
required by this Item will be included under the section captioned “Ratification
of the Appointment of the Independent Auditors (Proposal 2)” in our Proxy
Statement for the 2010 Annual Meeting of Shareholders, which information is
incorporated into this Annual Report by reference.
PART
IV
|
ITEM 15.
|
EXHIBITS AND FINANCIAL STATEMENT
SCHEDULES
|
|
(a)
|
The following documents are filed
as part of this report:
|
||||
| (1) | Financial Statements | ||||
|
Page
No.
|
|||||
|
Report
of Independent Registered Public Accounting Firm
|
F-2
|
||||
|
Consolidated
Balance Sheets - December 31, 2009 and 2008
|
F-3
|
||||
|
Consolidated
Statements of Income for each of the three years in the period ended
December 31, 2009
|
F-4
|
||||
|
Consolidated
Statements of Shareholders’ Equity and Comprehensive Income for each of
three years in the period ended December 31, 2009
|
F-5
|
||||
|
Consolidated
Statements of Cash Flows for each of the three years in the period ended
December 31, 2009
|
F-6
|
||||
|
Notes
to Consolidated Financial Statements
|
F-7
|
||||
|
(2)
|
Financial
Statement Schedules
|
||||
|
Page
No.
|
|||||
|
Schedule
II—Valuation and Qualifying Accounts
|
F-33
|
||||
|
(b)
|
Exhibits
|
|
Exhibit
No.
|
Description
|
||
|
3.1*
|
Restated
Articles of Amalgamation of Tesco Corporation, dated May 29, 2007
(incorporated by reference to Exhibit 3.1 to Tesco Corporation’s Current
Report on Form 8-K filed with the SEC on June 1, 2007)
|
||
|
3.2*
|
Amended
and Restated By-laws of Tesco Corporation (incorporated by reference to
Exhibit 3.1 to Tesco Corporation’s Current Report on Form 8-K filed with
the SEC on May 22, 2007)
|
||
|
4.1*
|
Form
of Common Share Certificate for Tesco Corporation (incorporated by
reference to Exhibit 4.3 to Tesco Corporation’s Registration Statement on
Form S-8 filed with the SEC on November 13, 2008)
|
||
|
4.2 *
|
Shareholder
Rights Plan Agreement between Tesco Corporation and Computershare Trust
Company of Canada, as Rights Agent, Amended and Restated as of May 20,
2008 (incorporated by reference to Exhibit 10.1 to Tesco Corporation’s
Current Report on Form 8-K filed with the SEC on May 22,
2008)
|
||
|
10.1*
|
Amended
and Restated Credit Agreement dated as of June 5, 2007 by and among Tesco
Corporation, Tesco US Holding LP, the lender parties thereto and JP Morgan
Chase Bank, NA (incorporated by reference to Exhibit 10.1 to Tesco
Corporation’s Current Report on Form 8-K filed with the SEC on June 7,
2007)
|
||
|
10.2*
|
Amendment
to Credit Agreement dated December 21, 2007 by and among Tesco
Corporation, Tesco US Holding LP, the lender parties thereto and JP Morgan
Chase Bank, NA (incorporated by reference to Exhibit 10.1 to Tesco
Corporation’s Current Report on Form 8-K filed with the SEC on December
26, 2007)
|
||
|
10.3*
|
Second
Amendment to Credit Agreement dated as of March 19, 2008 by and among
Tesco Corporation, Tesco US Holding LP, the lender parties thereto and JP
Morgan Chase Bank, NA (incorporated by reference to Exhibit 10.1 to Tesco
Corporation’s Current Report on Form 8-K filed with the SEC on March 20,
2008)
|
||
|
10.4*
|
Lease
between NK IV Tech, Ltd. and Tesco Corporation (US), for the lease of the
corporate headquarters of Tesco Corporation, dated July 6, 2006
(incorporated by reference to Exhibit 10.9 to Tesco Corporation’s Annual
Report on Form 10-K filed with the SEC on March 29,
2007)
|
||
| Exhibit No | Description | ||
|
10.5*+
|
Form
of Director Indemnity Agreement (incorporated by reference to Exhibit 10.1
to Tesco Corporation’s Current Report on Form 8-K filed with the SEC on
April 6, 2009)
|
||
|
10.6*+
|
Form
of Officer Indemnity Agreement (incorporated by reference to Exhibit 10.2
to Tesco Corporation’s Current Report on Form 8-K filed with the SEC on
April 6, 2009)
|
||
|
10.7*+
|
Employment
Agreement effective December 31, 2008 by and between Tesco Corporation and
Julio M. Quintana (incorporated by reference to Exhibit 10.1 to Tesco
Corporation’s Current Report on Form 8-K filed with the SEC on August 29,
2008)
|
||
| 10.8*+ |
Employment
Agreement effective August 18, 2008 by and between Tesco Corporation and
Robert L. Kayl (incorporated by reference to Exhibit 10.1 to Tesco
Corporation’s Current Report on Form 8-K filed with the SEC on September
5, 2008)
|
||
| 10.9*+ |
Employment
Agreement effective December 31, 2007 between Tesco Corporation and
Jeffrey Foster (incorporated by reference to Exhibit 10.3 to Tesco
Corporation’s Current Report on Form 8-K filed with the SEC on
January 2, 2008)
|
||
| 10.10*+ |
Employment
Agreement effective December 31, 2007 between Tesco Corporation and James
Lank (incorporated by reference to Exhibit 10.13 to Tesco Corporation’s
Annual Report on Form 10-K filed with the SEC on February 27,
2009)
|
||
|
10.11*+
|
Employment
Agreement effective May 11, 2009 by and between Tesco Corporation and
Fernando Assing (incorporated by reference to Exhibit 10.4 to Tesco
Corporation’s Current Report on Form 10-Q filed with the SEC on August 7,
2009)
|
||
|
10.12*+
|
First
Amendment to the Amended and Restated Employment Agreement effective March
15, 2009 by and between Tesco Corporation and Julio M. Quintana
(incorporated by reference to Exhibit 10.1 to Tesco Corporation’s Current
Report on Form 8-K filed with the SEC on March 17,
2009)
|
||
|
10.13*+
|
First
Amendment to the Employment Agreement effective March 15, 2009 by and
between Tesco Corporation and Robert L. Kayl (incorporated by reference to
Exhibit 10.2 to Tesco Corporation’s Current Report on Form 8-K filed with
the SEC on March 17, 2009)
|
||
|
10.14*+
|
First
Amendment to the Employment Agreement effective March 15, 2009 by and
between Tesco Corporation and Jeffrey Foster (incorporated by reference to
Exhibit 10.3 to Tesco Corporation’s Current Report on Form 8-K filed with
the SEC on March 17, 2009)
|
||
|
10.15*+
|
First
Amendment to the Employment Agreement effective March 15, 2009 by and
between Tesco Corporation and James Lank (incorporated by reference to
Exhibit 10.5 to Tesco Corporation’s Current Report on Form 8-K filed with
the SEC on March 17, 2009)
|
||
|
10.16*+
|
Amended
and Restated Tesco Corporation 2005 Incentive Plan (incorporated by
reference to Exhibit 10.1 to Tesco Corporation’s Current Report on Form
8-K filed
with the SEC on May 22, 2007)
|
||
|
10.17*+
|
Form
of Instrument of Grant under Amended and Restated Tesco Corporation 2005
Incentive Plan incorporated by reference to Exhibit 10.16 to Tesco
Corporation’s Annual Report on Form 10-K filed with the SEC on February
27, 2008)
|
||
|
10.18*+
|
Tesco
Corporation Employee Stock Savings Plan (incorporated by reference to
Exhibit 10.2 to Tesco Corporation’s Current Report on Form 8-K filed with
the SEC on May 22, 2007)
|
||
|
10.19*+
|
Tesco
Corporation Short Term Incentive Plan 2008 (incorporated by reference to
Exhibit 10.20 to Tesco Corporation’s Annual Report on Form 10-K filed with
the SEC on February 27, 2008)
|
||
|
10.20*+
|
Tesco
Corporation Short Term Incentive Plan 2009 (incorporated by reference to
Exhibit 10.19 to Tesco Corporation’s Annual Report on Form 10-K filed with
the SEC on February 27, 2009)
|
||
|
10.21+
|
Tesco
Corporation Short Term Incentive Plan 2010
|
||
|
10.22*+
|
Form
of Amendment to PSU Award (incorporated by reference to Exhibit 10.3 to
Tesco Corporation’s Current Report on Form 8-K filed with the SEC on April
6, 2009)
|
||
| Exhibit No. | Description | ||
|
24
|
Power
of Attorney (included on signature page)
|
||
|
14*
|
Tesco
Corporation Code of Conduct (incorporated by reference to Exhibit 14.1 to
Tesco Corporation’s Current Report on Form 8-K filed with the SEC on
September 17, 2009)
|
||
|
21
|
Subsidiaries
of Tesco Corporation
|
||
|
23
|
Consent
of Independent Registered Public Accounting Firm, PricewaterhouseCoopers
LLP
|
||
| 31.1 | Rule 13a-14(a)/15d-14(a) Certification, executed by Julio M. Quintana, President and Chief Executive Officer of Tesco Corporation | ||
| 31.2 | Rule 13a-14(a)/15d-14(a) Certification, executed by Robert L. Kayl, Senior Vice President and Chief Financial Officer of Tesco Corporation | ||
| 32 | Certification pursuant to 18 U.S.C. Section 1350, as adopted pursuant to Section 906 of the Sarbanes-Oxley Act of 2002, executed by Julio M. Quintana, President and Chief Executive Officer of Tesco Corporation and Robert L. Kayl, Senior Vice President and Chief Financial Officer of Tesco Corporation | ||
|
*
|
Incorporated
by reference
|
|
+
|
Management
contract or compensatory plan or
arrangement.
|
SIGNATURES
Pursuant
to the requirements of Section 13 or 15(d) of the Securities Exchange Act
of 1934, the registrant has duly caused this report to be signed on its behalf
by the undersigned, thereunto duly authorized.
|
TESCO
CORPORATION
|
|||
|
By:
|
/s/
Julio M. Quintana
|
||
|
Julio
M. Quintana
President
and Chief Executive Officer
|
|||
|
Date: March
5, 2010
|
|||
POWER
OF ATTORNEY
KNOW ALL
PERSONS BY THESE PRESENTS, that each person whose signature appears below
constitutes and appoints Julio M. Quintana and James A. Lank, and each of them,
acting individually, as his attorney-in-fact, each with full power of
substitution and resubstitution, for him and in his name, place and stead, in
any and all capacities, to sign any and all amendments to this annual report on
Form 10-K and other documents in connection herewith and therewith, and to
file the same, with all exhibits thereto, with the Securities and Exchange
Commission, granting unto said attorneys-in-fact and agents, and each of them,
full power and authority to do and perform each and every act and thing
requisite and necessary to be done in connection herewith and therewith and
about the premises, as fully to all intents and purposes as he might or could do
in person, hereby ratifying and confirming all that said attorneys-in-fact and
agents, or any of them, or their or his substitute or substitutes, may lawfully
do or cause to be done by virtue hereof.
Pursuant
to the requirements of the Securities Exchange Act of 1934, this report has been
signed below by the following persons on behalf of the registrant and in the
capacities and on the dates indicated.
|
Signature
|
Title
|
Date
|
|
|
/s/
Julio M. Quintana
|
President
and Chief Executive Officer and Director
(Principal
Executive Officer)
|
March
5, 2010
|
|
|
Julio
M. Quintana
|
|||
|
/s/
Robert L. Kayl
|
Senior
Vice President and Chief Financial Officer
(Principal
Financial Officer)
|
March 5,
2010
|
|
|
Robert
L. Kayl
|
|||
| /s/ John M. Dodson | Principal Accounting Officer | March 5, 2010 | |
| John M. Dodson | |||
|
/s/
Norman W. Robertson
|
Chairman
of the Board
|
March
5, 2010
|
|
|
Norman
W. Robertson
|
|||
|
/s/
Fred J. Dyment
|
Director
|
March
5, 2010
|
|
|
Fred
J. Dyment
|
|||
|
/s/
Gary L. Kott
|
Director
|
March
5, 2010
|
|
|
Gary
L. Kott
|
|||
|
/s/
R. Vance Milligan
|
Director
|
March
5, 2010
|
|
|
R.
Vance Milligan
|
|||
|
/s/
Michael W. Sutherlin
|
Director
|
March
5, 2010
|
|
|
Michael
W. Sutherlin
|
|||
|
/s/
Clifton T. Weatherford
|
Director
|
March
5, 2010
|
|
|
Clifton
T. Weatherford
|
|||
INDEX TO FINANCIAL STATEMENTS OF TESCO
CORPORATION
AND
CONSOLIDATED SUBSIDIARIES
|
Page
|
||
|
F-2
|
||
|
F-3
|
||
|
F-4
|
||
|
F-5
|
||
|
F-6
|
||
|
F-7
|
||
|
F-36
|
Report of Independent Registered Public Accounting
Firm
To the
Board of Directors and Shareholders of Tesco
Corporation:
In our
opinion, the consolidated financial statements listed in the index appearing
under Item 15(a)(1) present fairly, in all material respects, the financial
position of Tesco Corporation and its subsidiaries at December 31, 2009 and
2008, and the results of their operations and their cash flows for each of the
three years in the period ended December 31, 2009 in conformity with accounting
principles generally accepted in the United States of America. In
addition, in our opinion, the financial statement schedule listed in the index
appearing under Item 15(a)(2) presents fairly, in all material respects, the
information set forth therein when read in conjunction with the related
consolidated financial statements. Also in our opinion, the Company
did not maintain, in all material respects, effective internal control over
financial reporting as of December 31, 2009, based on criteria established in
Internal Control - Integrated
Framework issued by the Committee of Sponsoring Organizations of the
Treadway Commission (COSO) because a material weakness in internal control over
financial reporting related to accounting for income taxes with respect to
non-routine and atypical transactions described in management's report existed
as of that date. A material weakness is a deficiency, or a
combination of deficiencies, in internal control over financial reporting, such
that there is a reasonable possibility that a material misstatement of the
annual or interim financial statements will not be prevented or detected on a
timely basis. The material weakness referred to above is described in
Management's Report on Internal Control Over Financial Reporting appearing under
Item 9A. We considered this material weakness in determining the
nature, timing, and extent of audit tests applied in our audit of the 2009
consolidated financial statements and our opinion regarding the effectiveness of
the Company’s internal control over financial reporting does not affect our
opinion on those consolidated financial statements. The Company's
management is responsible for these financial statements and financial statement
schedule, for maintaining effective internal control over financial reporting
and for its assessment of the effectiveness of internal control over financial
reporting included in management's report referred to above. Our
responsibility is to express opinions on these financial statements, on the
financial statement schedule, and on the Company's internal control over
financial reporting based on our integrated audits. We conducted our
audits in accordance with the standards of the Public Company Accounting
Oversight Board (United States). Those standards require that we plan
and perform the audits to obtain reasonable assurance about whether the
financial statements are free of material misstatement and whether effective
internal control over financial reporting was maintained in all material
respects. Our audits of the financial statements included examining,
on a test basis, evidence supporting the amounts and disclosures in the
financial statements, assessing the accounting principles used and significant
estimates made by management, and evaluating the overall financial statement
presentation. Our audit of internal control over financial reporting
included obtaining an understanding of internal control over financial
reporting, assessing the risk that a material weakness exists, and testing and
evaluating the design and operating effectiveness of internal control based on
the assessed risk. Our audits also included performing such other
procedures as we considered necessary in the circumstances. We believe that our
audits provide a reasonable basis for our opinions.
A
company’s internal control over financial reporting is a process designed to
provide reasonable assurance regarding the reliability of financial reporting
and the preparation of financial statements for external purposes in accordance
with generally accepted accounting principles. A company’s internal
control over financial reporting includes those policies and procedures that
(i) pertain to the maintenance of records that, in reasonable detail,
accurately and fairly reflect the transactions and dispositions of the assets of
the company; (ii) provide reasonable assurance that transactions are
recorded as necessary to permit preparation of financial statements in
accordance with generally accepted accounting principles, and that receipts and
expenditures of the company are being made only in accordance with
authorizations of management and directors of the company; and
(iii) provide reasonable assurance regarding prevention or timely detection
of unauthorized acquisition, use, or disposition of the company’s assets that
could have a material effect on the financial statements.
Because
of its inherent limitations, internal control over financial reporting may not
prevent or detect misstatements. Also, projections of any evaluation
of effectiveness to future periods are subject to the risk that controls may
become inadequate because of changes in conditions, or that the degree of
compliance with the policies or procedures may deteriorate.
/s/
PricewaterhouseCoopers
Houston, Texas
March 4, 2010
TESCO CORPORATION
CONSOLIDATED
BALANCE SHEETS
(In
Thousands, except share amounts)
| December 31, | |||||||
|
2009
|
2008
|
||||||
| ASSETS | |||||||
| CURRENT ASSETS | |||||||
|
Cash
and Cash Equivalents
|
$ | 39,930 | $ | 20,619 | |||
|
Accounts
Receivable Trade, net
|
53,970 | 97,747 | |||||
|
Inventories,
net
|
74,339 | 95,192 | |||||
|
Prepaid
Income Taxes
|
10,945 | –– | |||||
|
Deferred
Income Taxes
|
13,836 | 10,916 | |||||
|
Prepaid
and Other Assets
|
18,680 | 19,690 | |||||
|
Total
Current Assets
|
211,700 | 244,164 | |||||
|
Property,
Plant and Equipment, net
|
183,025 | 209,024 | |||||
|
Goodwill
|
29,394 | 28,746 | |||||
|
Deferred
Income Taxes
|
12,986 | 10,439 | |||||
|
Intangible
and Other Assets
|
5,450 | 7,545 | |||||
|
TOTAL
ASSETS
|
$ | 442,555 | $ | 499,918 | |||
|
LIABILITIES &
SHAREHOLDERS’ EQUITY
|
|||||||
|
CURRENT
LIABILITIES
|
|||||||
|
Current
Portion of Long Term Debt
|
$ | –– | $ | 10,171 | |||
|
Accounts
Payable
|
15,992 | 38,946 | |||||
|
Deferred
Revenues
|
14,007 | 16,638 | |||||
|
Warranty
Reserves
|
2,251 | 3,326 | |||||
|
Income
Taxes Payable
|
–– | 8,053 | |||||
|
Accrued
and Other Current Liabilities
|
27,075 | 23,313 | |||||
|
Total
Current Liabilities
|
59,325 | 100,447 | |||||
|
Long
Term Debt
|
8,600 | 39,400 | |||||
|
Deferred
Income Taxes
|
12,471 | 8,197 | |||||
|
Total
Liabilities
|
80,396 | 148,044 | |||||
|
COMMITMENTS
AND CONTINGENCIES (Note 11)
|
|||||||
|
SHAREHOLDERS’
EQUITY
|
|||||||
|
First
Preferred Shares; no par value; unlimited shares authorized; none issued
and outstanding at December 31, 2009 or 2008
|
–– | –– | |||||
|
Second
Preferred Shares; no par value; unlimited shares authorized; none issued
and outstanding at December 31, 2009 or 2008
|
–– | –– | |||||
|
Common
Shares; no par value; unlimited shares authorized; 37,749,606 and
37,513,861 shares issued and outstanding at December 31, 2009 and
2008, respectively
|
175,087 | 171,384 | |||||
|
Contributed
Surplus
|
14,879 | 14,902 | |||||
|
Retained
Earnings
|
136,692 | 141,957 | |||||
|
Accumulated
Comprehensive Income
|
35,501 | 23,631 | |||||
|
Total
Shareholders’ Equity
|
362,159 | 351,874 | |||||
|
TOTAL
LIABILITIES & SHAREHOLDERS’ EQUITY
|
$ | 442,555 | $ | 499,918 | |||
The
accompanying notes are an integral part of these consolidated financial
statements.
TESCO CORPORATION
CONSOLIDATED
STATEMENTS OF INCOME
(In
Thousands, except per share and share information)
|
For
the Years Ended December 31,
|
||||||||||||
|
2009
|
2008
|
2007
|
||||||||||
|
REVENUE
|
||||||||||||
|
Products
|
$ | 148,565 | $ | 236,277 | $ | 191,927 | ||||||
|
Services
|
207,913 | 298,665 | 270,451 | |||||||||
| 356,478 | 534,942 | 462,378 | ||||||||||
|
OPERATING
EXPENSES
|
||||||||||||
|
Cost
of Sales and Services
|
||||||||||||
|
Products
|
113,591 | 153,301 | 148,666 | |||||||||
|
Services
|
206,520 | 246,676 | 209,666 | |||||||||
| 320,111 | 399,977 | 358,332 | ||||||||||
|
Selling,
General and Administrative
|
43,735 | 49,069 | 43,884 | |||||||||
|
Research
and Engineering
|
7,431 | 11,049 | 12,011 | |||||||||
|
Total
Operating Expenses
|
371,277 | 460,095 | 414,227 | |||||||||
|
OPERATING
(LOSS) INCOME
|
(14,799 | ) | 74,847 | 48,151 | ||||||||
|
OTHER
EXPENSE
|
||||||||||||
|
Interest
expense
|
1,891 | 4,503 | 4,324 | |||||||||
|
Interest
income
|
(958 | ) | (349 | ) | (1,150 | ) | ||||||
|
Foreign
exchange losses
|
1,360 | 186 | 2,899 | |||||||||
|
Other
expense (income)
|
513 | (265 | ) | (18 | ) | |||||||
|
Total
Other Expense
|
2,806 | 4,075 | 6,055 | |||||||||
|
(LOSS)
INCOME BEFORE INCOME TAXES
|
(17,605 | ) | 70,772 | 42,096 | ||||||||
|
INCOME
TAX (BENEFIT) PROVISION
|
(12,340 | ) | 20,849 | 10,029 | ||||||||
|
NET
(LOSS) INCOME
|
$ | (5,265 | ) | $ | 49,923 | $ | 32,067 | |||||
|
(Loss)
Earnings per share:
|
||||||||||||
|
Basic
|
$ | (0.14 | ) | $ | 1.34 | $ | 0.88 | |||||
|
Diluted
|
$ | (0.14 | ) | $ | 1.32 | $ | 0.86 | |||||
|
Weighted
average number of shares:
|
||||||||||||
|
Basic
|
37,597,668 | 37,221,495 | 36,604,338 | |||||||||
|
Diluted
|
37,597,668 | 37,832,554 | 37,403,932 | |||||||||
The
accompanying notes are an integral part of these consolidated financial
statements.
TESCO CORPORATION
CONSOLIDATED
STATEMENTS OF SHAREHOLDERS’ EQUITY AND
COMPREHENSIVE
INCOME
(In
Thousands, except share amounts)
|
Common
Stock Shares
|
Common
Shares
|
Contributed
Surplus
|
Retained
Earnings
|
Accumulated
Comprehensive Income
|
Total
|
|||||||||||||||||||
|
Balances
at December 31, 2006
|
36,019,246 | $ | 139,266 | $ | 13,348 | $ | 59,967 | $ | 29,271 | $ | 241,852 | |||||||||||||
|
Components
of Comprehensive Income
|
||||||||||||||||||||||||
|
Net
Income
|
— | — | — | 32,067 | — | 32,067 | ||||||||||||||||||
|
Currency
Translation Adjustment
|
— | — | — | — | 11,841 | 11,841 | ||||||||||||||||||
|
Unrealized
Losses on Securities, net of tax
|
— | — | — | — | (404 | ) | (404 | ) | ||||||||||||||||
|
Reclassification
Adjustment for Losses on Securities, Included in Net Income, net of
tax
|
— | — | — | — | 567 | 567 | ||||||||||||||||||
|
Total
Comprehensive Income
|
44,071 | |||||||||||||||||||||||
|
Stock
Compensation Expense
|
6,521 | 6,521 | ||||||||||||||||||||||
|
Issuances
and Exercises under Stock Plans
|
825,517 | 15,066 | (3,897 | ) | — | — | 11,169 | |||||||||||||||||
|
Balances
at December 31, 2007
|
36,844,763 | 154,332 | 15,972 | 92,034 | 41,275 | 303,613 | ||||||||||||||||||
|
Components
of Comprehensive Income
|
||||||||||||||||||||||||
|
Net
Income
|
— | — | — | 49,923 | — | 49,923 | ||||||||||||||||||
|
Currency
Translation Adjustment
|
— | — | — | — | (17,644 | ) | (17,644 | ) | ||||||||||||||||
|
Total
Comprehensive Income
|
32,279 | |||||||||||||||||||||||
|
Fair
value adjustment for liability-based stock option awards
|
— | — | (806 | ) | — | — | (806 | ) | ||||||||||||||||
|
Stock
Compensation Expense
|
6,285 | 6,285 | ||||||||||||||||||||||
|
Issuance
and Exercises under Stock Plans
|
669,098 | 17,052 | (6,549 | ) | — | — | 10,503 | |||||||||||||||||
|
Balances
at December 31, 2008
|
37,513,861 | 171,384 | 14,902 | 141,957 | 23,631 | 351,874 | ||||||||||||||||||
|
Components
of Comprehensive Income
|
||||||||||||||||||||||||
|
Net
Loss
|
— | — | — | (5,265 | ) | — | (5,265 | ) | ||||||||||||||||
|
Currency
Translation Adjustment
|
— | — | — | — | 11,870 | 11,870 | ||||||||||||||||||
|
Total
Comprehensive Income
|
6,605 | |||||||||||||||||||||||
|
Fair
value adjustment for liability-based stock option awards
|
— | — | (941 | ) | — | — | (941 | ) | ||||||||||||||||
|
Stock
Compensation Expense
|
4,430 | 4,430 | ||||||||||||||||||||||
|
Issuance
and Exercises under Stock Plans
|
235,745 | 3,703 | (3,512 | ) | — | — | 191 | |||||||||||||||||
|
Balances
at December 31, 2009
|
37,749,606 | $ | 175,087 | $ | 14,879 | $ | 136,692 | $ | 35,501 | $ | 362,159 | |||||||||||||
The
accompanying notes are an integral part of these consolidated financial
statements.
TESCO CORPORATION
CONSOLIDATED
STATEMENTS OF CASH FLOWS
(In
Thousands)
|
For the Years Ended December
31,
|
|||||||||||
|
2009
|
2008
|
2007 | |||||||||
|
OPERATING
ACTIVITIES
|
|||||||||||
|
Net
(Loss) Income
|
$ | (5,265 | ) | $ | 49,923 | $ | 32,067 | ||||
|
Adjustments
to Reconcile Net (Loss) Income to
|
|||||||||||
|
Cash
Provided by Operating Activities:
|
|||||||||||
|
Depreciation
and amortization
|
36,733 | 33,274 | 27,257 | ||||||||
|
Stock
compensation expense
|
4,430 | 6,285 | 6,521 | ||||||||
|
Deferred
income taxes
|
(1,950 | ) | 986 | 2,042 | |||||||
|
Amortization
of financial items
|
601 | 693 | 419 | ||||||||
|
Gain
on sale of operating assets
|
(2,743 | ) | (16,247 | ) | (15,180 | ) | |||||
|
Impairment
of assets held for sale
|
3,559 | — | — | ||||||||
|
Write-off of
inventory balances and adjustments to inventory reserves
|
14,400 | — | — | ||||||||
|
Changes
in components of working capital, net of acquisition
|
|||||||||||
|
Decrease
(increase) in accounts receivable trade
|
44,358 | (11,866 | ) | (4,877 | ) | ||||||
|
Decrease
(increase) in inventories
|
14,093 | 7,309 | (19,597 | ) | |||||||
|
Decrease
in income taxes recoverable
|
(10,945 | ) | 2,735 | — | |||||||
|
Increase
in prepaid and other current assets
|
4,116 | (9,855 | ) | (3,396 | ) | ||||||
|
(Decrease)
increase in accounts payable
|
(21,817 | ) | (5,630 | ) | 20,192 | ||||||
|
Increase
(decrease) in accrued and other current liabilities
|
(7,429 | ) | 13,791 | (18,326 | ) | ||||||
|
(Decrease)
increase in income taxes payable
|
(8,857 | ) | 7,066 | (858 | ) | ||||||
|
Other,
net
|
11 | (1,437 | ) | (1,001 | ) | ||||||
|
Net
cash provided by operating activities
|
63,295 | 77,027 | 25,263 | ||||||||
|
INVESTING
ACTIVITIES
|
|||||||||||
|
Additions
to property, plant and equipment
|
(17,282 | ) | (79,605 | ) | (65,033 | ) | |||||
|
Proceeds
on sale of operating assets
|
13,680 | 20,926 | 20,998 | ||||||||
|
Acquisitions
of business, net of cash acquired
|
— | –– | (21,505 | ) | |||||||
|
Other,
net
|
(194 | ) | 223 | 1,109 | |||||||
|
Net
cash used in investing activities
|
(3,796 | ) | (58,456 | ) | (64,431 | ) | |||||
|
FINANCING
ACTIVITIES
|
|||||||||||
|
Issuances
of debt
|
10,000 | 52,071 | 102,085 | ||||||||
|
Repayments
of debt
|
(50,969 | ) | (80,963 | ) | (65,791 | ) | |||||
|
Proceeds
from exercise of stock options
|
544 | 8,436 | 12,460 | ||||||||
|
Debt
issuance costs
|
— | (100 | ) | (511 | ) | ||||||
|
Excess
tax benefit associated with equity based compensation
|
(308 | ) | 1,036 | 651 | |||||||
|
Net
cash (used in) provided by financing activities
|
(40,733 | ) | (19,520 | ) | 48,894 | ||||||
|
Effect
of foreign exchange losses on cash balances
|
545 | (1,504 | ) | (1,577 | ) | ||||||
|
Net
Increase (Decrease) in Cash and Cash Equivalents
|
19,311 | (2,453 | ) | 8,149 | |||||||
|
Net
Cash and Cash Equivalents, beginning of period
|
20,619 | 23,072 | 14,923 | ||||||||
|
Net
Cash and Cash Equivalents, end of period
|
$ | 39,930 | $ | 20,619 | $ | 23,072 | |||||
|
Supplemental
Cash Flow Information
|
|||||||||||
|
Cash
paid during the period for interest
|
$ | 1,166 | $ | 3,390 | $ | 2,939 | |||||
|
Cash
paid during the period for income taxes
|
$ | 14,884 | $ | 9,152 | $ | 13,749 | |||||
|
Cash
receipts during the period for interest
|
$ | 709 | $ | 323 | $ | 3,557 | |||||
|
Cash
receipts during the period for income taxes
|
$ | 6,804 | $ | 391 | $ | 4,467 | |||||
The
accompanying notes are an integral part of these consolidated financial
statements.
TESCO
CORPORATION
Notes
to the Consolidated Financial Statements
Note 1—Organization and Basis of Presentation
Nature
of Operations
Tesco
Corporation (“TESCO” or the “Company”) is a global leader in the design,
manufacture and service delivery of technology based solutions for the upstream
energy industry. Tesco seeks to change the way people drill wells by delivering
safer and more efficient solutions that add real value by reducing the costs of
drilling for and producing oil and gas. Our product and service offerings
include proprietary technology, including TESCO CASING DRILLING®
(“CASING DRILLING”), TESCO’s Casing Drive System (“CDS™” or “CDS”) and
TESCO’s Multiple Control Line Running System (“MCLRS™” or “MCLRS”). TESCO® is a
registered trademark in Canada and the United States. TESCO CASING DRILLING® is a
registered trademark in the United States. CASING DRILLING® is a
registered trademark in Canada and CASING DRILLING™ is a trademark in the United
States. Casing Drive System™, CDS™, Multiple Control Line Running System™ and
MCLRS™ are trademarks in Canada and the United States.
Basis
of Presentation
These
Consolidated Financial Statements have been prepared by management in accordance
with accounting principles generally accepted in the United States of America
(“U.S. GAAP”).
Unless
indicated otherwise, all amounts in these Consolidated Financial Statements are
denominated in United States (“U.S.”) dollars. All references to US$ or $ are to
U.S. dollars and references to C$ are to Canadian dollars.
The
consolidated financial statements include the accounts of the Company and its
domestic and foreign subsidiaries, all of which are wholly owned. All
significant intercompany transactions and balances have been eliminated in
consolidation.
The
Company incurs costs directly and indirectly associated with its revenues at a
business unit level. Direct costs include expenditures specifically incurred for
the generation of revenue, such as personnel costs on location, transportation,
maintenance and repair, and depreciation of its revenue-generating equipment.
Overhead costs, such as field administration and field operations support, are
not directly associated with the generation of revenue within a particular
business segment. In years prior to 2008, the Company allocated total overhead
costs at a consolidated level based on a percentage of global revenues. During
2008, the Company identified and captured, where appropriate, the specific
operating segments in which the Company incurred overhead costs at the business
unit level. Using this information, the Company reclassified 2007 segment
operating results to conform to current presentation.
The
Company is organized under the laws of Alberta and is therefore subject to the
Business Corporation
Act (Alberta). The Company is also a reporting issuer (or the equivalent)
in each of the provinces of Canada. Effective December 31, 2006, the Company
became a U.S. registrant and a domestic filer with the SEC. Through December 31,
2007, the Company filed its financial statements with a reconciliation of its
financial statements under U.S. GAAP to Canadian generally accepted accounting
principles. This reconciliation is no longer included, as it is no longer
required by Canada’s National Instrument 52-102, “Continuous Disclosure
Obligations.”
Use
of Estimates
The
preparation of financial statements in conformity with U.S. GAAP requires
management to make estimates and assumptions that affect the reported amounts of
assets and liabilities and disclosures of contingent assets and liabilities at
the date of the financial statements, and the reported amounts of revenues and
expenses during the reporting period. The significant estimates made by
management in the accompanying consolidated financial statements include
reserves for inventory obsolescence, valuation of goodwill, valuation and useful
lives of intangible assets and long-lived assets, allowance for doubtful
accounts, determination of income taxes, contingent liabilities, stock based
compensation, purchase price allocations, warranty provisions and investment
valuations. Management makes these estimates based on its judgment of the likely
outcome of future events and there is a risk that the actual outcome will be
different than expected and that such differences will have a material financial
effect on future reported results.
Note
2––Revisions to Previously Issued Financial Statements
In February 2009, Canada
enacted a new tax law that allowed for the filing of Tesco’s Canadian income tax
return on a U.S. dollar basis. The effect of the new tax law and Tesco’s
election for adoption was required to be reflected in Tesco's consolidated
financial statements for the first quarter of 2009. As such, Tesco
recorded a $1.6 million income tax benefit, which thereby increased net income,
during the first quarter of 2009 to account for this change in tax law. The
Company has determined that the $1.6 million income tax benefit was calculated
in error and that an additional $2.9 million income tax benefit should have been
recorded during the first quarter of 2009. In
addition, $0.4 million of foreign exchange loss should not have been recorded in
Tesco’s income statement in the first three quarters of 2009. This
error resulted from the incorrect re-measurement and translation into U.S.
dollars of one of the Company’s foreign assets. As a result of these
errors, the Company has restated the condensed consolidated financial statements
and filed amended Quarterly Reports on Form 10-Q for the quarterly periods ended
March 31, 2009, June 30, 2009 and September 30, 2009.
Additionally, the
Company has identified certain immaterial errors that originated in prior
periods. The Company considered the impact of the misstatements on
each of the quarterly periods affected and on a cumulative basis and concluded
the items were not material to our annual results for the years ended December
31, 2008 and 2007. However, the correction of the results would have
been material to the Company’s interim results for each of the quarters and the
annual results in the year ended December 31, 2009. As a result of
this evaluation and based on the accounting guidance, the Company has revised
its consolidated financial statements for the years ended December 31, 2008 and
2007 to reflect the cumulative impact of this correction. The Company does not
consider the aforementioned changes to the consolidated financial statements to
be material.
The
following tables summarize the effects of the restatement and the revision of
the immaterial errors on the Consolidated Financial Statements as of and for the
years ended December 31, 2008 and 2007 (in thousands):
|
Balance
Sheet
as
of
December
31, 2008
|
|||||||||||||
|
December
31,
2008
as
previously reported
|
Adjustments
|
December
31,
2008
as
revised
|
|||||||||||
|
Inventories,
net
|
$ | 96,013 | $ | (821 | ) | (a) | $ | 95,192 | |||||
|
Property,
Plant and Equipment, net
|
208,968 | 56 | (a) | 209,024 | |||||||||
|
Deferred
Income Taxes - Current
|
10,996 | (80 | ) | (d) | 10,916 | ||||||||
| Prepaid and Other Assets | 13,533 | 6,157 | (e) | 19,690 | |||||||||
|
Deferred
Income Taxes - Non-Current
|
9,066 | 1,373 | (d) | 10,439 | |||||||||
|
Income
Taxes Payable
|
8,297 | (244 | ) | (d) | 8,053 | ||||||||
|
Accrued
and Other Current Liabilities
|
16,228 | 7,085 | (a,b,e,f) | 23,313 | |||||||||
|
Contributed
Surplus
|
15,708 | (806 | ) | (f) | 14,902 | ||||||||
|
Retained
Earnings
|
142,752 | (795 | ) | 141,957 | |||||||||
|
Accumulated
Comprehensive Income
|
22,186 | 1,445 | (c,d) | 23,631 | |||||||||
|
Statement
of Income
for
the Year Ended
December
31, 2008
|
|||||||||||||
|
December
31,
2008
as
previously reported
|
Adjustments
|
December
31,
2008
as
revised
|
|||||||||||
|
Cost
of Sales and Services
|
$ | 399,197 | $ | 780 | (a) | $ | 399,977 | ||||||
|
Selling,
General and Administrative
|
49,005 | 64 | (b) | 49,069 | |||||||||
|
Foreign
Exchange (Gains) Losses
|
(374 | ) | 560 | (c) | 186 | ||||||||
| Income Before Income Taxes | 72,176 | (1,404 | ) | 70,772 | |||||||||
|
Income
Tax Provision
|
19,270 | 1,579 | (d) | 20,849 | |||||||||
| Net Income | 52,906 | (2,983 | ) | 49,923 | |||||||||
| Earnings per share: | |||||||||||||
| Basic | $ | 1.42 | $ | (0.08 | ) | $ | 1.34 | ||||||
| Diluted | $ | 1.40 | $ | (0.08 | ) | $ | 1.32 | ||||||
|
Statement
of Cash Flows
for
the Year Ended
December 31, 2008
|
|||||||||||||
|
December
31,
2008
as
previously reported
|
Adjustments
|
December
31,
2008
as
revised
|
|||||||||||
|
Net
cash provided by operating activities
|
$ | 76,747 | $ | 280 | (a) | $ | 77,027 | ||||||
|
Net
cash used in investing activities
|
(58,176 | ) | (280 | ) | (a) | (58,456 | ) | ||||||
|
Net
cash (used in) provided by financing activities
|
(19,520 | ) | –– | (19,520 | ) | ||||||||
|
Statement
of Income
for
the Year Ended
December
31, 2007
|
|||||||||||||
|
December
31,
2007
as
previously reported
|
Adjustments
|
December
31,
2007
as
revised
|
|||||||||||
|
Cost
of Sales and Services
|
$ | 357,844 | $ | 488 | (a) | $ | 358,332 | ||||||
|
Selling,
General and Administrative
|
44,003 | (119 | ) | (b) | 43,884 | ||||||||
| Income Before Income Taxes | 42,465 | (369 | ) | 42,096 | |||||||||
|
Income
Tax Provision
|
10,163 | (134 | ) | (d) | 10,029 | ||||||||
| Net Income | 32,302 | (235 | ) | 32,067 | |||||||||
The
restatement and the revision of the immaterial errors had no impact on cash
provided by operating activities, cash used in investing activities or cash used
in financing activities for the year ended December 31, 2007.
|
(a)
|
The
Company did not properly record certain costs related to litigation
reserves, workers compensation, depreciation and payroll taxes for
the years ended December 31, 2008 or 2007. As a result of these errors,
Cost of Sales and Services was misstated. The Company recorded an increase
of $0.8 million and $0.5 million for the years ended December 31, 2008 and
2007, respectively, with corresponding adjustments to Inventories, net,
Property, Plant and Equipment, net and Accrued and Other Current
Liabilities to correct this misstatement.
|
|
(b)
|
The
Company did not properly accrue certain costs for the years ended December
31, 2008 or 2007 related to compensation. As a result of this error,
Selling, General & Administrative expenses were misstated. The Company
recorded an increase to expense of $0.1 million and a decrease to expense
of $0.1 million for the years ended December 31, 2008 and 2007,
respectively, with corresponding adjustments to Accrued and Other Current
Liabilities to correct this misstatement.
|
|
(c)
|
The
Company did not properly record foreign exchange losses during the year
ended December 31, 2008 related to the re-measurement of certain
intercompany accounts. As a result of this error, Foreign Exchange Losses
(Gains) were overstated by $0.6 million. The Company recorded an increase
to expense of $0.6 million during the year ended December 31, 2008 with a
corresponding increase to Accumulated Comprehensive Income to correct this
misstatement.
|
|
(d)
|
The
Company did not properly record the foreign exchange impact for deferred
tax balances for the years ended December 31, 2008 or 2007. The Company
recorded an increase to the tax provision of $1.6 million and a decrease
to the tax provision of $0.1 million for the years ended December 31, 2008
and 2007, respectively, with corresponding adjustments to Deferred Income
Taxes and Accumulated Comprehensive Income to correct these
misstatements. These adjustments also reflect the tax effect of the
pre-tax errors noted above, with corresponding adjustments to Income Taxes
Payable and Deferred Income Taxes.
|
|
(e)
|
The
December 31, 2008 balance for outstanding prepaid Value Added Taxes was
misclassified on the balance sheet. Accordingly, the Company corrected
this error by increasing Prepaid and Other Assets by $6.2 million and
increasing Accrued and Other Current Liabilities by $6.2
million.
|
|
(f)
|
Canadian
dollar-denominated stock option awards previously issued to non-Canadian
employees qualify for liability classification due to the Company's
voluntary delisting from the TSX effective June 30, 2008. The fair value
of these awards was approximately $0.8 million and is included in Accrued
and Other Current Liabilities with a corresponding adjustment to
Contributed Surplus.
|
Note
3—Summary of Significant Accounting Policies
Revenue
Recognition
The Company
recognizes revenues when the earnings process is complete and collectability is
reasonably assured. TESCO recognizes revenues when title and risk of loss of the
equipment are transferred to the customer, with no right of return. Revenue in
the Top Drive segment may be generated from contractual arrangements that
include multiple deliverables. Revenue from these arrangements is recognized as
each item or service is delivered based on their relative fair value and when
the delivered items or services have stand-alone value to the customer. For
project management services, service and repairs and rental activities, TESCO
recognizes revenues as the services are rendered based upon agreed daily, hourly
or job rates.
The
Company provides product warranties on equipment sold pursuant to manufacturing
contracts and provides for the anticipated cost of its warranties in cost of
sales when sales revenue is recognized. The accrual of warranty costs is an
estimate based upon historical experience and upon specific warranty issues as
they arise. The Company periodically reviews its warranty provision to assess
its adequacy in light of actual warranty costs incurred. Because the warranty
accrual is an estimate, it is reasonably possible that future warranty issues
could arise that could have a significant impact on the Company’s financial
statements.
Market
for Common Stock
TESCO’s
common stock is traded on the Nasdaq Global Market (“NASDAQ”) under the symbol
“TESO.” Until June 30, 2008, TESCO’s common stock was also traded on the Toronto
Stock Exchange (“TSX”) under the symbol “TEO.” Effective June 30, 2008, the
Company voluntarily delisted its shares from the TSX.
Foreign
Currency Translation
The U.S.
dollar is the functional currency for all of the Company’s worldwide operations
except for its Canadian operations. For foreign operations where the local
currency is the functional currency, specifically the Company’s Canadian
operations, assets and liabilities denominated in foreign currencies are
translated into U.S. dollars at end-of-period exchange rates, and the resulting
translation adjustments are reported, net of their related tax effects, as a
component of Accumulated Comprehensive Income in Stockholders’ Equity. Assets
and liabilities denominated in currencies other than the functional currency are
remeasured into the functional currency prior to translation into U.S. dollars,
and the resulting exchange gains and losses are included in income in the period
in which they occur. Income and expenses are translated into U.S. dollars at the
average exchange rates in effect during the period. The effects of foreign
currency transactions were losses of $1.4 million, $0.2 million and $2.9 million
in the years 2009, 2008 and 2007, respectively.
Deferred
Revenues
The
Company generally requires customers to pay a non-refundable deposit for a
portion of sales price for top drive units with their order. These customer
deposits are deferred until the customer takes title and risk of loss of the
product.
Cash
and Cash Equivalents
Cash and
Cash Equivalents include investments in highly liquid instruments with original
maturities of less than three months, which are readily convertible to known
amounts of cash, subject to insignificant risk of changes in value and held to
meet operating requirements. At both December 31, 2009 and 2008, Cash and
Cash Equivalents consisted entirely of bank balances.
Allowance
for Doubtful Accounts
The
Company maintains allowances for doubtful accounts for estimated losses
resulting from the inability of the Company’s customers to make required
payments. The primary factors used in determining the allowance needed for
accounts receivable are customer bankruptcies, delinquency and management’s
estimate of ability to collect outstanding receivables based on the number of
days outstanding. At December 31, 2009 and 2008, the allowance for doubtful
accounts on Trade Accounts Receivable was $1.5 million and $3.2 million,
respectively.
Inventories
Inventories
primarily consist of manufactured equipment and spare parts for after-market
sales and services for TESCO manufactured equipment. During the manufacturing
process, the Company values its inventories (work in progress and finished
goods) primarily using standard costs, which approximate actual costs, and such
costs include raw materials, direct labor and manufacturing overhead
allocations.
Inventory
costs for manufactured equipment are stated at the lower of cost or market using
specific identification. Inventory costs for spare parts are stated at the lower
of cost or market using the average cost method. The Company performs
obsolescence reviews on its slow-moving and excess inventories and establishes
reserves based on such factors as usage of inventory on-hand, technical
obsolescence and market conditions, as well as future expectations related to
its manufacturing sales backlog, its installed base and the development of new
products. In response to 2009 economic and industry operating conditions, the
Company evaluated the carrying value of its global inventory. This analysis
included part-by-part evaluation of inventory turnover and projected sales
estimates based on the current operating environment and the timing of
forecasted economic recovery. Based on this analysis, the Company recorded a
charge of $14.4 million to reflect the net realizable value of that
inventory.
At
December 31, 2009 and 2008, inventories, net of reserves for excess and
obsolete inventories, by major classification were as follows (in
thousands):
| December 31, | ||||||||
|
2009
|
2008
|
|||||||
|
Raw
materials
|
$ | 34,056 | $ | 26,049 | ||||
|
Work
in progress
|
2,328 | 2,648 | ||||||
|
Finished
goods
|
37,955 | 66,495 | ||||||
| $ | 74,339 | $ | 95,192 | |||||
Reserves
for excess and obsolete inventory included in the Consolidated Balance Sheets at
December 31, 2009 and 2008 were $7.1 million and $3.0 million,
respectively. During 2009 and 2008, the Company applied $2.2 million and $0.6
million, respectively, of its reserve for excess and obsolete inventory for
inventory write downs.
Property,
Plant and Equipment
Property,
plant and equipment is carried at cost. Maintenance and repairs are expensed as
incurred. The costs of replacements, betterments and renewals are capitalized.
When properties and equipment, other than top drive units in the Company’s
rental fleet, are sold, retired or otherwise disposed of, the related cost and
accumulated depreciation are removed from the books and the resulting gain or
loss is recognized in the accompanying Consolidated Statements of Income. When
top drive units in the Company’s rental fleet are sold, the sales proceeds are
included in revenues and the net book value of the equipment sold is included in
Cost of Sales and Services in the accompanying Consolidated Statements of
Income.
Drilling
equipment includes related manufacturing costs and overhead. The net book value
of used top drive rental equipment sold included in Cost of Sales and Services
in the accompanying Consolidated Statements of Income was $5.2 million,
$2.3 million and $5.1 million for the years ended December 31, 2009,
2008 and 2007, respectively.
At
December 31, 2009 and 2008, property, plant and equipment, at cost, by
major category were as follows (in thousands):
| December 31, | ||||||||
|
2009
|
2008
|
|||||||
|
Land,
buildings and leaseholds
|
$ | 18,466 | $ | 19,531 | ||||
|
Drilling
equipment
|
258,852 | 262,672 | ||||||
|
Manufacturing
equipment
|
6,148 | 7,517 | ||||||
|
Office
equipment and other
|
16,811 | 22,884 | ||||||
|
Capital
work in progress
|
4,990 | 8,780 | ||||||
| 305,267 | 321,384 | |||||||
|
Less:
Accumulated depreciation
|
(122,242 | ) | (112,360 | ) | ||||
| $ | 183,025 | $ | 209,024 | |||||
Property,
plant and equipment are assessed for impairment whenever changes in facts and
circumstances indicate a possible significant deterioration in the future cash
flows expected to be generated by an asset group. If, upon review, the sum of
the undiscounted pretax cash flows is less than the carrying value of the asset
group, the carrying value is written down to estimated fair value. Individual
assets are grouped for impairment purposes at the lowest level for which there
are identifiable cash flows that are largely independent of the cash flows of
other groups of assets. The fair value of impaired assets is determined based on
quoted market prices in active markets, if available, or upon the present values
of expected future cash flows using discount rates commensurate with the risks
involved in the asset group. Long-lived assets committed by management for
disposal within one year are accounted for at the lower of amortized cost or
fair value, less expected costs to sell.
Depreciation
and amortization expense is included in the Consolidated Statements of Income as
follows (in thousands):
|
Years
Ended December 31,
|
|||||||||
|
2009
|
2008
|
2007
|
|||||||
|
Cost
of sales and services
|
$ | 35,458 | $ | 32,244 | $ | 26,020 | |||
|
Selling,
general and administrative expense
|
1,275 | 1,030 | 1,237 | ||||||
| $ | 36,733 | $ | 33,274 | $ | 27,257 | ||||
Depreciation
and amortization of property, plant and equipment, including capital leases and
intangible assets, is computed on the following basis:
|
Asset
Category
|
Description
|
Method
|
Rate
|
|||
|
Land,
buildings and leaseholds
|
Buildings
Leasehold
improvements
|
Straight
line
Straight
line
|
20
years
Lease
term
|
|||
|
Drilling
equipment
|
Top
Drive rental units
Tubular
Services equipment
CASING
DRILLING equipment
Support
equipment
|
Usage
Straight
line
Straight
line
Straight
line
|
2,600
days
5 –
10 years
5 –
10 years
5 –
10 years
|
|||
|
Manufacturing
equipment
|
Straight
line
|
5 –
10 years
|
||||
|
Office
equipment and other
|
Computer hardware and software
Furniture
and equipment
Vehicles
|
Straight
line
Straight
line
Straight
line
|
2 –
5 years
3 –
5 years
3 –
5 years
|
Assets
Held for Sale
During 2009, the Company completed
the sale of a building and land located in Canada. The Company incurred
approximately $0.1 million and $0.9 million in soil remediation costs during the
years ended December 31, 2009 and 2008, respectively, to prepare the property
for sale that were capitalized and reported as an increase in the property’s net
book value. The property had a carrying value of $2.4 million, net of
accumulated depreciation and was included in Property, Plant and Equipment in
the accompanying Consolidated Balance Sheets.
During
2009, the Company made the decision to sell operating assets located in North
America, Europe and the Asia Pacific region within the next 12 months for an
amount expected to be less than their current carrying amount. As a
result, the Company recorded a pre-tax impairment loss of approximately $3.6
million to write down the fixed assets to their estimated realizable value of
$0.3 million as of December 31, 2009. The impairment loss is included in the
Tubular Services segment ($1.8 million) and the CASING DRILLING segment ($1.8
million) as a part of Cost of Sales and Services in the accompanying
Consolidated Statements of Income for the year ended December 31,
2009. The Company ceased depreciating the assets at the time they
were classified as held for sale and has reflected the current carrying amount
in Property, Plant and Equipment in the accompanying Consolidated Balance
Sheet.
Investments
The
Company’s securities are considered available-for-sale and are reported at fair
value based upon quoted market prices in the accompanying Consolidated Balance
Sheets. Unrealized gains and losses arising from the revaluation of
available-for-sale securities are included, net of applicable deferred income
taxes, in Accumulated Comprehensive Income within Shareholders’ Equity. Realized
gains and losses on sales of investments based on specific identification of
securities sold are included in Other Expense in the Consolidated Statements of
Income.
The
Company held no investments in securities during the years ended December 31,
2009 or 2008. In 2005, the Company received warrants to purchase one million
shares of Turnkey E&P Inc. common stock at C$6.00 which expired on
December 13, 2007 without being exercised. As a result, the Company
recognized a $1.2 million realized loss in 2007, which is included in Other
Expense in the accompanying Consolidated Statements of Income.
Goodwill
and Other Intangible Assets
Goodwill,
which represents the value of businesses acquired by the Company in excess of
the fair market value of all of the identifiable tangible and intangible net
assets of the acquired businesses at the time of their acquisition, is carried
at the lower of cost or fair value. The Company’s goodwill has an indefinite
useful life and is subject to an annual impairment test in the fourth quarter of
each year or the occurrence of a triggering event. Any resulting impairment loss
is charged to income and disclosed separately in the Consolidated Statements of
Income.
In
connection with its annual goodwill impairment assessment performed in the
fourth quarter of 2009, the Company performed a step one impairment analysis
under the provisions of existing accounting standards. Management utilized a
discounted cash flow methodology to estimate the fair value of the Company’s
Tubular Services segment. In completing its step one analysis, management used a
five-year projection of discounted cash flows, plus a terminal value determined
using the constant growth method to estimate the fair value of the Tubular
Services segment. For purposes of the analysis, the Company made significant
management assumptions including sales volumes and prices, costs of products and
services, capital spending, working capital changes, terminal value multiples
and the discount rate. The discount rate is commensurate with the risk inherent
in the projected cash flows and reflects the rate of return required by an
investor in the current economic conditions. Inherent in the Company’s
projections are key assumptions relative to how long the current downward
economic cycle might last. Furthermore, the financial and credit market
volatility directly impacts the fair value measurement through the
weighted-average cost of capital that was used to determine the discount rate.
During times of volatility, significant judgment must be applied to determine
whether credit changes are a short term or long term trend. Based on the results
of the step one impairment test, management concluded that no impairment was
indicated during the years ended December 31, 2009, 2008 or 2007. If a future
impairment loss is recognized, it will be charged to income and disclosed
separately in the Consolidated Statements of Income.
The
Company has capitalized certain identified intangible assets, primarily customer
relationships, patents and non-compete agreements, based on their estimated fair
value at the date acquired. The customer relationship intangible assets are
amortized on a straight-line basis over their weighted average estimated useful
life of four years, the patents are amortized on a straight-line basis over an
estimated useful life of 10 to 14 years, and the non-compete agreements are
amortized on a straight-line basis over the weighted average term of the
agreements of five years. These amortizable intangible assets are reviewed at
least annually for impairment or when circumstances indicate their carrying
value may not be recoverable based on a comparison of fair value to carrying
value. No impairment losses were incurred during the years ended December 31,
2009, 2008 or 2007. If a future impairment loss is recognized, it will be
charged to income and disclosed separately in the Consolidated Statements of
Income.
For a
description of the change in Goodwill and Other Intangible Assets during 2009
and 2008, see Note 10 below.
Derivative
Financial Instruments
As a
result of its worldwide operations, the Company is exposed to market risks from
changes in interest and foreign currency exchange rates, which may affect its
operating results and financial position. The Company manages its risks from
fluctuations in interest and foreign currency exchange rates through its normal
operating and financing activities. However, from time to time, the Company may
manage its interest and foreign exchange rate risks through the use of
derivative financial instruments. The Company does not use derivative financial
instruments for trading or speculative purposes.
During
the year ended December 31, 2007, the Company entered into a series of 25
bi-weekly foreign currency forward contracts with notional amounts aggregating
C$43.8 million. Based on quoted market prices as of December 31, 2007 for
contracts with similar terms and maturity dates, the Company recorded an asset
of $0.1 million to record these foreign currency forward contracts at fair value
at December 31, 2007, and to recognize the unrealized gain. During 2008,
the Company terminated these bi-weekly foreign currency forward contracts and
recognized a loss of $0.6 million, which is included in Foreign exchange losses
in the accompanying Consolidated Statements of Income. The Company replaced
these by entering into a series of 14 monthly foreign currency forward contracts
with notional amounts aggregating C$50.8 million. The Company subsequently
settled two of these contracts and terminated the remaining 12 contracts, and
recognized a loss of $0.2 million, which is included in Foreign exchange (gains)
losses in the accompanying Consolidated Statements of Income. In the
Consolidated Statement of Cash Flows, cash receipts or payments related to these
exchange contracts are classified consistent with the cash flows from the
transaction being hedged. The Company was not party to any derivative financial
instruments as of December 31, 2009 or December 31, 2008.
Fair
Value Measurement
The
Company measures and reports its financial assets and liabilities at fair value,
which is defined as the price that would be received to sell an asset or paid to
transfer a liability (an exit price) in the principal or most advantageous
market for the asset or liability in an orderly transaction between market
participants on the measurement date. To obtain fair values, observable market
prices are used if available. In some instances, observable market prices are
not readily available for certain financial instruments and fair value is
determined using present value or other techniques appropriate for a particular
financial instrument. These techniques involve some degree of judgment and as a
result are not necessarily indicative of the amounts the Company would realize
in a current market exchange. The use of different assumptions or estimation
techniques may have a material effect on the estimated fair value amounts. These
valuation techniques are based on observable and unobservable inputs. Observable
inputs reflect readily obtainable data from independent sources, while
unobservable inputs reflect the Company’s market assumptions. The Company uses a
three-level hierarchy for disclosure to show the extent and level of judgment
used to estimate fair value measurements:
Level 1 Inputs—Quoted prices
for identical instruments in active markets.
Level 2 Inputs—Quoted prices
for similar instruments in active markets; quoted prices for identical or
similar instruments in markets that are not active; and model-derived valuations
whose inputs are observable or whose significant value drivers are
observable.
Level 3 Inputs—Instruments
with primarily unobservable value drivers.
The following
table provides a summary of the changes in Level 3 assets and liabilities
measured at fair value on a recurring basis during the year ended December 31,
2008 (in thousands):
|
Balance
at December 31, 2007
|
Total
Gains (Losses) (realized)
|
Purchases,
Sales, Other
Settlements and
Issuances,
net
|
Net Transfers
In and/or Out
of
Level 3
|
Balance
at December 31, 2008
|
||||||||||||||||
|
Derivatives
|
$ | 82 | $ | (820 | ) | $ | 738 | $ | –– | $ | –– | |||||||||
Pursuant
to existing accounting guidance, the Company uses a market approach to value the
assets and liabilities for outstanding derivative contracts which consists
solely of foreign currency forward contracts as discussed in Note 1 above.
These contracts are valued using current market information in the form of
foreign currency spot rates as of the reporting date. The Company recognizes the
unrealized net gains or losses on these contracts on the accrual basis in
Foreign exchange losses in the Consolidated Statements of Income. The Company
was not a party to any derivative financial instruments as of December 31, 2009
or December 31, 2008.
During
the year ended December 31, 2009, the Company made the decision to sell
operating assets within the next 12 months. These fixed assets had a carrying
amount of $3.9 million, and were written down to their estimated realizable
value of $0.3 million during the year ended December 31, 2009. The estimated
realizable fair value was derived from observable market prices in the form of
quotations received from independent third parties (“Level 2” inputs). The
resulting impairment charge of $3.6 million is included in Cost of Sales and
Services in the accompanying Consolidated Statements of Income for the year
ended December 31, 2009. The following table presents the Company’s assets
carried at fair value and the basis for determining their fair values (in
thousands):
|
As
of
December
31, 2009
|
Quoted
Prices in
Active
Markets
for
IdenticalAssets
|
Significant
Other
Observable
Inputs
|
Significant
Unobservable
Inputs
|
Total
Losses
|
||||||||||||||||
|
Assets
held for sale
|
$ | 254 | $ | — | $ | 254 | — | $ | 3,559 | |||||||||||
Debt
Issue Costs
The
Company has incurred debt issue costs which are amortized over the life of the
debt term. At December 31, 2009 and 2008, net capitalized debt issue costs
were $0.3 million and $0.9 million, respectively, and are included in Intangible
and Other Assets in the accompanying Consolidated Balance Sheets.
Accrued
and Other Current Liabilities
Accrued and Other Current
Liabilities in the accompanying Consolidated Balance Sheets is comprised of the
following (in thousands):
|
Year
Ended
December
31, 2009
|
Year
Ended
December
31, 2008
|
|||||||
|
Legal
and other reserves
|
$ | 8,617 | $ | 5,356 | ||||
|
Accrued
compensation
|
7,807 | 10,694 | ||||||
|
Other
taxes (non-income)
|
7,051 | 3,356 | ||||||
|
Fair
value of stock awards
|
1,765 | 806 | ||||||
|
Other
|
1,835 | 3,101 | ||||||
|
Balance—end
of period
|
$ | 27,075 | $ | 23,313 | ||||
Accounting
for Operating Leases
The
Company has entered into non-cancelable operating lease agreements primarily
involving office space. Certain of these leases contain escalating lease
payments and the Company recognizes expense on a straight line basis which is
more representative of the time pattern in which the leased property is
physically employed. In certain instances the Company is also entitled to
reimbursements for part or all of leasehold improvements made and records a
deferred credit for such reimbursements which is amortized over the remaining
life of the lease term as a reduction in lease expense.
Research
and Engineering Expenses
The
Company expenses research and engineering costs when incurred. Payments received
from third parties, including payments for the use of equipment prototypes,
during the research or development process are recognized as a reduction in
research and engineering expense when the payments are received.
Severance
Costs
During
the years ended December 31, 2009 and 2008, the Company eliminated approximately
490 and 100 employee positions due to a review of its personnel structure and
recorded $3.7 million and $1.1 million, respectively, in termination benefits
associated with the reductions. These severance costs were recorded in Cost of
Sales and Services ($1.8 million and $0.9 million for the years ended December
31, 2009 and 2008, respectively), Research and Engineering expense ($0.4 million
and $0.1 million for the years ended December 31, 2009 and 2008, respectively)
and Selling, General and Administrative expense ($1.5 million and $0.1 million
for the years ended December 31, 2009 and 2008, respectively) in the
accompanying Consolidated Statements of Income based on the respective functions
performed by those employees who were terminated during the period. These costs
were recorded in the Company’s operating segments as follows (in
thousands):
|
Year
Ended
December
31, 2009
|
Year
Ended
December
31, 2008
|
|||||||
|
Top
Drive
|
$ | 1,319 | $ | 646 | ||||
|
Tubular
Services
|
398 | 325 | ||||||
|
Casing
Drilling
|
157 | 12 | ||||||
|
Research
and Engineering
|
417 | 58 | ||||||
|
Corporate
and Other
|
1,403 | 77 | ||||||
|
Total
Severance Costs
|
$ | 3,694 | $ | 1,118 | ||||
Accrued
severance costs were included in Accrued and Other Current Liabilities in the
accompanying Consolidated Balance Sheets as follows (in thousands):
|
Year
Ended
December
31, 2009
|
Year
Ended
December
31, 2008
|
|||||||
|
Balance—beginning
of period
|
$ | –– | $ | –– | ||||
|
Charged
to expense
|
3,694 | 1,118 | ||||||
|
Payments
|
(3,099 | ) | (1,118 | ) | ||||
|
Balance—end
of period
|
$ | 595 | $ | ––- | ||||
Environmental
Costs
The cost
of preventative environmental programs is expensed when incurred. When a
clean-up program becomes likely, and it is probable the Company will incur
clean-up costs and those costs can be reasonably estimated, the Company accrues
remediation costs for known environmental liabilities. During 2009, the Company
completed the sale of a building and land located in Canada. The Company
incurred approximately $0.1 million and $0.9 million in soil remediation costs
during the years ended December 31, 2009 and 2008, respectively, that were
capitalized and reported as an increase in the property’s net book
value.
Income
Taxes
The
liability method is used to account for income taxes. Deferred tax assets and
liabilities are determined based on differences between financial reporting and
tax bases of assets and liabilities and are measured using the enacted tax rates
and laws that will be in effect when the differences are expected to reverse.
The effect of a change in tax rates on deferred income tax assets or liabilities
is recognized in the period that the change occurs. A valuation allowance for
deferred tax assets is recorded when it is more likely than not that some or all
of the benefit from the deferred tax asset will not be realized. Estimates of
future taxable income and ongoing tax planning have been considered in assessing
the utilization of available tax losses and credits. Changes in circumstances,
assumptions and clarification of uncertain tax regimes may require changes to
any valuation allowances associated with the Company’s deferred tax
assets.
Stock-Based
Compensation
On May 18,
2007, the Company’s shareholders approved amendments to its 2005 Incentive Plan
to, among other things, provide for a variety of forms of equity compensation
awards to be granted to employees, directors and other persons. As a result, the
Company changed the method by which it provides stock-based compensation to its
employees by reducing the number of stock options granted and instead issuing
restricted stock awards as a form of compensation. The Company has granted two
different types of restricted stock awards: restricted stock units (“RSU”s)
which are subject to time based vesting criteria and performance share units
(“PSU”s) which contain both time and performance based criteria. Both RSUs and
PSUs may be settled by delivery of shares or the payment of cash equal to the
market value of TESCO shares that would otherwise be deliverable at the time of
settlement at the discretion of the Company. For further description of the
Company’s stock-based compensation plan, see Note 8 below.
The Company
measures stock-based compensation cost for equity-classified awards as of grant
date or the employee start date for pre-employment grants, based on the
estimated fair value of the award less an estimated rate for pre-vesting
forfeitures, and recognizes compensation expense on a graded basis over the
vesting period. Compensation expense is recognized with an offsetting credit to
Contributed Surplus, which is then transferred to Common Shares when the award
is distributed or the option is exercised. Consideration received on the
exercise of stock options is credited to Common Shares. For stock option grants,
the Company uses a Black-Scholes valuation model to determine the estimated fair
value.
Canadian
dollar-denominated stock option awards issued to non-Canadian employees qualify
for liability classification due to the Company’s voluntary delisting from the
TSX effective June 30, 2008. Accordingly, the fair value of these awards is
included in Accrued and Other Current Liabilities in the accompanying
Consolidated Balance Sheet as of December 31, 2009 and 2008, and the liability
is adjusted to fair value at the end of each reporting period. At December 31,
2009 and 2008, the fair value of these awards was approximately $1.8 million and
$0.8 million, respectively.
Stock
compensation expense is recorded in Cost of Sales and Services, Research and
Engineering expense and Selling, General and Administrative expense in the
accompanying Consolidated Statements of Income based on the respective functions
for those employees receiving stock option grants. Stock compensation expense is
included in the Consolidated Statements of Income as follows (in
thousands):
|
Years
Ended December 31,
|
|||||||||||
|
2009
|
2008
|
2007
|
|||||||||
|
Cost
of Sales and Services
|
$ | 814 | $ | 1,368 | $ | 1,836 | |||||
|
Research
and Engineering
|
268 | 485 | 777 | ||||||||
|
Selling,
General and Administrative
|
3,348 | 4,432 | 3,908 | ||||||||
| $ | 4,430 | $ | 6,285 | $ | 6,521 | ||||||
During
the year ended December 31, 2009, the Company recorded a reversal of
approximately $0.9 million in stock compensation expense related to performance
stock units in response to the current year’s operating results.
Per
Share Information
Per share
information is computed using the weighted average number of common shares
outstanding during the year. Diluted per share information is calculated,
including the dilutive effect of stock options which are determined using the
treasury stock method. The treasury stock method assumes that the proceeds that
would be obtained upon exercise of “in the money” options would be used to
purchase common shares at the average market price during the period. No
adjustment to diluted earnings per share is made if the result of this
calculation is anti-dilutive.
The
following table reconciles basic and diluted weighted average shares (in
thousands):
|
December
31,
|
||||||||||
|
2009
|
2008
|
2007
|
||||||||
|
Basic
Weighted Average Number of Shares Outstanding
|
37,598
|
37,222
|
36,604
|
|||||||
|
Dilutive
Effect of Stock Options
|
––
|
611
|
800
|
|||||||
|
Diluted
Weighted Average Number of Shares Outstanding
|
37,598
|
37,833
|
37,404
|
|||||||
|
Anti-dilutive
Options Excluded from Calculation due to exercise prices
|
5,269
|
1,420
|
360
|
|||||||
|
Anti-dilutive
Options Excluded from Calculation due to reported net loss
|
714
|
––
|
––
|
|||||||
For the
year ended December 31, 2009, the weighted average diluted shares outstanding
excluded 714,108 shares because the Company reported a loss during the period,
and including them would have had an anti-dilutive effect on loss per
share.
Recent
Accounting Pronouncements
In
January 2010, the Financial Accounting Standards Board (“FASB”) issued an
update to existing accounting standards to improve disclosures regarding fair
value measurements and, thus, increase the transparency in financial reporting.
The update provides that a reporting entity should disclose separately the
amounts of significant transfers in and out of Level 1 and Level 2 fair value
measurements and describe the reasons for the transfers; and in the
reconciliation for fair value measurements using significant unobservable
inputs, a reporting entity should present separately information about
purchases, sales, issuances, and settlements. In addition, the update clarifies
the requirements of the existing disclosures as follows: (1) For purposes of
reporting fair value measurement for each class of assets and liabilities, a
reporting entity needs to use judgment in determining the appropriate classes of
assets and liabilities; and (2) A reporting entity should provide disclosures
about the valuation techniques and inputs used to measure fair value for both
recurring and nonrecurring fair value measurements. The update is effective for
interim and annual reporting periods beginning after December 15, 2009, except
for the disclosures about purchases, sales, issuances, and settlements in the
roll forward of activity in Level 3 fair value measurements. Those disclosures
are effective for fiscal years beginning after December 15, 2010, and for
interim periods within those fiscal years. Early application is permitted. The
Company will adopt these provisions and the adoption is not expected to have a
material impact on the consolidated financial statements.
In June
2009, the FASB issued updated guidance that allows for more flexibility in
determining the value of separate elements in revenue arrangements with multiple
deliverables. This guidance modifies the requirements for determining whether a
deliverable can be treated as a separate unit of accounting by removing the
criteria that verifiable and objective evidence of fair value exists for the
undelivered elements. All entities must adopt no later than the beginning of
their first fiscal year beginning on or after June 15, 2010. Upon adoption,
entities may choose between the prospective application for transactions entered
into or materially modified after the date of adoption, or the retroactive
application for all revenue arrangements for all periods presented. Disclosures
will be required when changes in either those judgments or the application of
this guidance significantly affect the timing or amount of revenue recognition.
The Company will adopt these provisions on January 1, 2011 and the adoption is
not expected to have a material impact on the consolidated financial
statements.
In June
2009, the FASB issued new accounting guidance that clarifies the characteristics
that identify a variable interest entity (“VIE”) and changes how a reporting
entity identifies a primary beneficiary that would consolidate the VIE from a
quantitative risk and rewards calculation to a qualitative approach based on
which variable interest holder has controlling financial interest and the
ability to direct the most significant activities that impact the VIE’s economic
performance. This guidance requires the primary beneficiary assessment to
be performed on a continuous basis. It also requires additional disclosures
about an entity’s involvement with VIE, restrictions on the VIE’s assets and
liabilities that are included in the reporting entity’s consolidated balance
sheet, significant risk exposures due to the entity’s involvement with the VIE,
and how its involvement with a VIE impacts the reporting entity’s consolidated
financial statements. This update is effective for fiscal years beginning after
November 15, 2009. The Company will adopt these provisions on January 1,
2010 and the adoption is not expected to have a material impact on the
consolidated financial statements.
In June
2009, the FASB issued new accounting guidance that enhances the information
provided to financial statement users to provide greater transparency about
transfers of financial assets and a transferor’s continuing involvement, if any,
with transferred financial assets. Under this Statement, many types of
transferred financial assets that would have been derecognized previously are no
longer eligible for derecognition. This Statement requires enhanced disclosures
about the risks to which a transferor continues to be exposed due to its
continuing involvement in transferred financial assets. This Statement also
clarifies and improves certain provisions in previously issued statements that
have resulted in inconsistencies in the application of the principles on which
that Statement is based. These updates are effective for annual reporting
periods beginning after November 15, 2009, for interim periods within that first
annual reporting period and for interim and annual reporting periods thereafter.
Earlier application is prohibited. The Company will adopt these provisions on
January 1, 2010 and the adoption is not expected to have a material impact on
the consolidated financial statements.
In May
2009, the FASB issued new accounting guidance which establishes general
standards of accounting for and disclosures of events that occur after the
balance sheet date but before the financial statements are issued or are
available to be issued. It requires the disclosure of the date through which an
entity has evaluated subsequent events. The Company adopted the new disclosure
requirements of its financial statements issued for the period ended June 30,
2009 and the adoption did not have a material impact on the consolidated
financial statements.
In April
2009, the FASB issued new guidance that requires that a registrant to disclose
the fair value of all financial instruments for interim reporting periods and in
its financial statements for annual reporting periods, whether recognized or not
recognized in the statement of financial position. The Company adopted the
updated guidance for the interim reporting period ended March 31, 2009 and
the adoption did not have a material impact on the Company’s consolidated
financial statements as the Statement required additional disclosures but no
change in accounting policy. See “Fair Value Measurement” above.
Note
4—Accumulated Comprehensive Income
Accumulated
Comprehensive Income is defined as a change in the equity of a business
enterprise during a period from transactions and other events and circumstances
from non-owner sources, including foreign currency translation adjustments and
unrealized gains (losses) on investments. The Company presents its comprehensive
income in its Consolidated Statements of Shareholders’ Equity and Comprehensive
Income.
The
following table summarizes the components of Accumulated Comprehensive Income
(in thousands):
|
Foreign
Currency Translation Adjustment
|
Unrealized
Gains (Losses) on Securities, net
|
Accumulated
Comprehensive Income
|
|||||||||
|
Balance
December 31, 2006
|
$ | 29,434 | $ | (163 | ) | $ | 29,271 | ||||
|
Foreign
currency translation adjustment
|
11,841 | — | 11,841 | ||||||||
|
Unrealized
loss on investments
|
— | (595 | ) | (595 | ) | ||||||
|
Reclassification
adjustment for investment loss included in net income
|
— | 956 | 956 | ||||||||
|
Income
tax effect
|
— | (198 | ) | (198 | ) | ||||||
|
Balance
December 31, 2007
|
41,275 | — | 41,275 | ||||||||
|
Foreign
currency translation adjustment
|
(17,644 | ) | — | (17,644 | ) | ||||||
|
Balance
December 31, 2008
|
23,631 | — | 23,631 | ||||||||
|
Foreign
currency translation adjustment
|
11,870 | — | 11,870 | ||||||||
|
Balance
December 31, 2009
|
$ | 35,501 | $ | — | $ | 35,501 | |||||
Note
5—Acquisitions
During
the second half of 2007, the Company acquired four businesses that provide
conventional casing running and tubular services. One of these businesses is
based in Colorado and services the Rockies region, including the Piceance Basin
and the remaining three businesses are based in Alberta, Canada and service
northwest Alberta and northeast British Columbia regions. The combined purchase
price of these acquisitions was approximately $21.5 million. These acquisitions
were funded by the Company’s Revolver (defined below). All of these assets and
operating results are included in the Tubular Services business segment. These
acquisitions expanded and strengthened the Company’s position in these regions
and provided expansion opportunities for the Company’s proprietary Casing Drive
System for casing running and opportunities to expand its CASING DRILLING
offering.
The
assets and liabilities acquired in these acquisitions were valued based upon
appraisals of the tangible and intangible assets acquired. During 2008, the
Company finalized its goodwill valuation related to one of these acquisitions
and reduced the carrying amount of goodwill by $0.1 million. The remaining
change in the carrying amount of goodwill of $1.0 million is due to the effect
of foreign currency exchange rates.
The
Company’s valuation of the assets acquired, liabilities assumed and total
consideration paid for these acquisitions is as follows (in
thousands):
|
Assets
Assumed:
|
||||
|
Accounts
receivable
|
$ | 914 | ||
|
Property,
plant and equipment
|
2,601 | |||
|
Goodwill
|
12,484 | |||
|
Intangibles
|
5,506 | |||
|
Liabilities
Assumed:
|
||||
|
Current
liabilities
|
— | |||
|
Total
Consideration Paid
|
$ | 21,505 | ||
Goodwill
related to these acquisitions was assigned to the Tubular Services segment and
approximately $11.1 million of the goodwill acquired as a result of these
acquisitions is amortizable for income tax purposes. The $5.5 million of
acquired intangible assets in these acquisitions relate to customer
relationships which have a weighted average estimated useful life of seven years
and non-compete agreements which have a weighted average term of five
years.
Note
6—Fair Value of Financial Instruments
During
the year ended December 31, 2007, the Company entered into a series of 25
bi-weekly foreign currency forward contracts with notional amounts aggregating
C$43.8 million. Based on quoted market prices as of December 31, 2007
for contracts with similar terms and maturity dates, the Company recorded an
asset of $0.1 million to record these foreign currency forward contracts at
fair market value at December 31, 2007, and to recognize the related
unrealized gain. During the year ended December 31, 2008, the Company terminated
these bi-weekly foreign currency forward contracts and recognized a loss of $0.6
million, which is included in Foreign exchange (gains) losses in the
Consolidated Statements of Income, and replaced them with a series of 14 monthly
foreign currency forward contracts with notional amounts aggregating
C$50.8 million. The Company subsequently settled two of these contracts and
terminated the remaining 12 contracts, and recognized a loss of $0.2 million for
the year ended December 31, 2008, which is included in Foreign exchange (gains)
losses in the accompanying Consolidated Statements of Income. In the
Consolidated Statement of Cash Flows, cash receipts or payments related to these
exchange contracts are classified consistent with the cash flows from the
transaction being hedged. The Company was not party to any derivative financial
instruments as of December 31, 2009 or December 31, 2008.
The
carrying value of cash, investments in short-term commercial paper and other
money market instruments, accounts receivable, accounts payable and accrued
liabilities approximate their fair value due to the relatively short-term period
to maturity of the instruments.
The fair
value of the Company’s long term debt depends primarily on current market
interest rates for debt issued with similar maturities by companies with risk
profiles similar to TESCO. The fair value of its debt related to the Company’s
credit facility at December 31, 2009 is estimated to be $8.2
million.
Note
7—Long Term Debt
Long term debt consists of the
following (in thousands):
|
December
31,
|
||||||||
|
2009
|
2008
|
|||||||
|
Secured
Revolver, maturity date of June 5, 2012, 1.5% and 1.99% interest rate
at December 31, 2009 and 2008, respectively
|
$ | 8,600 | $ | 39,400 | ||||
|
Secured
Term Loan, maturity date of October 31, 2009, 4.44% interest rate at
December 31, 2008
|
–– | 10,018 | ||||||
|
Other
|
–– | 153 | ||||||
|
Total
Long Term Debt
|
8,600 | 49,571 | ||||||
|
Less—Current
Portion of Long Term Debt
|
–– | 10,171 | ||||||
|
Non-Current
Portion of Long Term Debt
|
$ | 8,600 | $ | 39,400 | ||||
On June
5, 2007, TESCO and Tesco US Holding LP, an indirect, wholly-owned subsidiary of
TESCO, entered into a $125 million amended and restated credit agreement
with Amegy Bank, N.A., The Bank of Nova Scotia, Natixis, Comerica Bank,
Trustmark National Bank, Bank of Texas, N.A. and JPMorgan Chase Bank, N.A., as
administrative agent for the lenders. The $125 million facility consisted of a
$100 million revolver and a $25 million term loan. On December 21, 2007,
TESCO and Tesco US Holding LP entered into an amendment to the $125 million
amended and restated credit agreement (collectively, with the $125 million
amended and restated credit agreement dated June 5, 2007, the “Amended
Credit Agreement”) with the Company’s existing lenders and JPMorgan Chase Bank,
N.A., as administrative agent to increase the Amended Credit Facility revolver
from $100 million to $145 million. The Amended Credit Agreement provides for up
to $145 million in revolving loans and swingline loans (collectively, the
“Revolver”). Under the Revolver, Tesco US Holding LP may borrow up to $145
million in revolving loans, while either Tesco US Holding LP or TESCO may borrow
up to $15 million in swingline loans, provided that the aggregate amount of
revolving loans and swingline loans may not exceed $145 million in outstanding
principal. The Secured Term Loan terms and maturity date remained unchanged.
Amounts outstanding under the Secured Term Loan issued under the Prior Credit
Agreement were due in $2.5 million quarterly installments with the last
installment payment paid on the loan’s maturity date of October 31,
2009.
The
Amended Credit Agreement has a term of five years and all outstanding borrowings
on the $145 million Revolver will be due and payable on June 5, 2012.
Amounts available under the Revolver are reduced by letters of credit issued
under the Amended Credit Agreement not to exceed $20 million in the aggregate of
all undrawn amounts and amounts that have yet to be disbursed under all existing
letters of credit. Amounts available under the swingline loans may also be
reduced by letters of credit or by means of a credit to a general deposit
account of the applicable borrower. At December 31, 2009, the Company had
$6.2 million in letters of credit outstanding under the Revolver.
The
Amended Credit Agreement had original covenants that the Company considers usual
and customary for an agreement of this type, including a leverage ratio, a
minimum net worth, and a fixed charge coverage ratio. Pursuant to the terms of
the Amended Credit Agreement, the Company is prohibited from incurring other
additional indebtedness over $15 million, paying cash dividends to shareholders
and other restrictions which are standard to the industry. The Amended Credit
Agreement is secured by substantially all of the Company’s assets and all of the
Company’s direct and indirect material subsidiaries in the United States and
Canada are guarantors of borrowings under the Amended Credit Agreement.
Additionally, the Company’s capital expenditures are limited to 70% of
consolidated EBITDA (as defined in the Amended Credit Agreement) plus net
proceeds from asset sales. In March 2008, the Company entered into a second
amendment to the Amended Credit Agreement in order to increase the limit on
permitted capital expenditures during the quarters ending March 31, June 30 and
September 30, 2008 from 70% to 85% of consolidated EBITDA plus proceeds from
sales of assets. For the quarters ending December 31, 2008 through June 30, 2010
the capital expenditure limitation returns to 70% of EBITDA plus proceeds from
the sale of assets. The capital expenditure limit decreases to 60% of
consolidated EBITDA plus net proceeds from asset sales for fiscal quarters
ending after June 30, 2010. As of December 31, 2009, the Company
believes it was in compliance with the debt covenants in the Amended Credit
Agreement.
In
addition to regularly scheduled payment obligations, the occurrence of certain
circumstances will trigger an obligation to prepay certain of the Company’s term
loans owing under the Amended Credit Agreement by an amount equal to 50% of the
net cash proceeds realized by the Company from any (i) asset sale or event
of loss, upon the occurrence of certain conditions; (ii) issuance or other
sale of any equity interest in the Company or any of its subsidiaries in excess
of $10 million after the effective date of the Amended Credit Agreement; or
(iii) subordinated indebtedness incurred by the Company or any of its
affiliates. In addition, repayment of borrowings under the Amended Credit
Agreement is subject to acceleration upon the occurrence of events of default
that the Company considers usual and customary for an agreement of this
type.
Rates for
revolving and term loans under the Amended Credit Agreement are based, at Tesco
US Holding LP’s election, on an interest rate tied to a Eurodollar rate or
JPMorgan Chase Bank, N.A.’s prime rate. With respect to Eurodollar loans, the
rate is determined as follows: the sum of (i) Adjusted LIBOR (as defined in
the Amended Credit Agreement) plus (ii) the Applicable Rate (as defined in
the Amended Credit Agreement), which is 1.00 percent based on the Company’s
leverage ratio at December 31, 2009. With respect to non-Eurodollar loans,
the rate is set by the alternate base rate, which is determined by taking the
greater of (i) the prime rate for U.S. dollar loans announced by JPMorgan
Chase Bank, N.A. in New York or (ii) the sum of the weighted average
overnight federal funds rate published by the Federal Reserve Bank of New York
plus 0.50 percent. Swingline loans will bear interest as determined by the
alternate base rate described above.
Based on
the Company’s leverage ratio at December 31, 2009, the Company is required
to pay a facility fee of 0.20 percent per annum of the aggregate unused
commitments under the Amended Credit Agreement. A letter of credit fee equal to
the Applicable Rate (as defined in the Amended Credit Agreement) multiplied by
the outstanding face amount of any letter of credit issued under the Amended
Credit Agreement is also required to be paid by the Company.
The
scheduled repayments of the Company’s debt for the next five years and
thereafter are as follows (in thousands):
|
Years
Ended December 31:
|
||||
|
2010
|
$ | –– | ||
|
2011
|
–– | |||
|
2012
|
8,600 | |||
|
2013
|
— | |||
|
2014
|
— | |||
|
Thereafter
|
— | |||
| $ | 8,600 | |||
Note
8—Shareholders’ Equity and Stock-Based Compensation
The
Company has authorized an unlimited number of first preferred and second
preferred shares, none of which are issued or outstanding.
The
Company has authorized an unlimited number of common shares without par
value.
Stock-Based
Compensation
In May
2007, the Company amended and restated its incentive plan, now called the
Amended and Restated Tesco Corporation 2005 Incentive Plan (the “Restated
Plan”). The maximum number of shares of common stock that may be issued in
connection with awards under the Restated Plan may not exceed 10% of the issued
and outstanding shares of the Company’s common stock. The plan authorizes the
grant of awards to eligible directors, officers, employees and other persons.
Under the terms of the Company’s Restated Plan, 3,774,961 shares of common stock
were authorized as of December 31, 2009 for the grant of stock-based
compensation to eligible directors, officers, employees and other persons. As of
December 31, 2009, the Company had approximately 882,974 shares available
for future grants.
The
Company measures stock-based compensation cost as of the grant date based on the
estimated fair value of the award less an estimated rate for pre-vesting
forfeitures, and recognizes compensation expense on a graded basis over the
vesting period. Compensation expense is recognized with an offsetting credit to
Contributed Surplus, which is then transferred to Common Shares when the award
is distributed or the option is exercised. For stock option grants, the Company
uses a Black-Scholes valuation model to determine the estimated fair
value.
Stock
Options
Prior to
May 2007, the Company granted stock options denominated only in Canadian
dollars. Under the Restated Plan, stock options and other stock based awards may
be denominated in Canadian dollars or U.S. dollars, at the Company’s discretion.
On June 30, 2008, the Company voluntarily delisted from the Toronto Stock
Exchange. Canadian dollar-denominated stock option awards issued to non-Canadian
employees qualify for liability classification due to the Company’s voluntary
delisting from the TSX effective June 30, 2008. Accordingly, the fair value of
these awards is included in Accrued and Other Current Liabilities in the
accompanying Consolidated Balance Sheet as of December 31, 2009 and 2008, and
the liability is adjusted to fair value at the end of each reporting period. At
December 31, 2009 and 2008, the fair value of these awards was approximately
$1.8 million and $0.8 million, respectively.
With all
shares of common stock being traded on the NASDAQ, the Company plans to
denominate all future grants of equity-based awards in U.S. dollars. Options
granted by the Company have historically vested equally over a three year period
and expired no later than seven years from the date of grant, although the Board
of Directors may choose different parameters in the future. The exercise price
of stock options under the plan may not be less than the fair value on the date
of the grant, as defined in the Restated Plan.
The
following summarizes option activity for the options issued in Canadian dollars
during the years ended December 31, 2009, 2008 and 2007:
|
2009
|
2008
|
2007
|
|||||||||||||||||||||
|
No.
of Options
|
Weighted-
average
exercise
price
|
No.
of Options
|
Weighted-
average
exercise
price
|
No.
of Options
|
Weighted-
average
exercise
price
|
||||||||||||||||||
|
Outstanding—beginning
of year
|
831,954 | $ | C | 20.69 | 1,593,962 | $ | C | 18.62 | 2,374,804 | $ | C | 15.38 | |||||||||||
|
Granted
|
––
|
$ | C |
––
|
46,300 | $ | C | 24.44 | 458,000 | $ | C | 27.74 | |||||||||||
|
Exercised
|
(20,000 | ) | $ | C | 9.89 | (626,535 | ) | $ | C | 14.87 | (825,517 | ) | $ | C | 14.68 | ||||||||
|
Forfeited
|
(151,385 | ) | $ | C | 20.88 | (181,773 | ) | $ | C | 23.58 | (413,325 | ) | $ | C | 17.95 | ||||||||
|
Outstanding—end
of year
|
660,569 | $ | C | 20.97 | 831,954 | $ | C | 20.69 | 1,593,962 | $ | C | 18.62 | |||||||||||
|
Exercisable—end
of year
|
575,913 | $ | C | 20.47 | 529,363 | $ | C | 18.42 | 770,262 | $ | C | 13.91 | |||||||||||
The
intrinsic value of options exercisable at December 31, 2009, 2008 and 2007
was zero, zero and C$11.1 million, respectively. The value of
outstanding vested options as of December 31, 2009, 2008 and 2007 was C$11.8
million, C$9.9 million and C$11.7 million, respectively. The weighted
average grant-date fair value of options granted during 2008 was C$11.21 per
share and during 2007 was C$9.68 per share. No options were granted in Canadian
dollars during 2009.
Details
of the exercise prices and expiry dates of Canadian dollar options outstanding
at December 31, 2009 are as follows:
|
Options
outstanding
|
Intrinsic
Value
|
Weighted-
average
years
to
expiry
|
Weighted-
average
exercise price
|
Vested
options
|
Weighted-
average
exercise price
|
|||||||||||||||||||||
| $ | C | 9.89 - 14.00 | 128,065 | $ | C | 288 | 1.9 | $ | C | 11.18 | 128,065 | $ | C | 11.18 | ||||||||||||
| $ | C | 14.00 - 18.00 | 13,200 | $ | C |
––
|
2.6 | $ | C | 15.01 | 13,200 | $ | C | 15.01 | ||||||||||||
| $ | C | 18.00 - 24.00 | 301,136 | $ | C |
––
|
3.3 | $ | C | 20.85 | 300,146 | $ | C | 20.84 | ||||||||||||
| $ | C | 24.00 - 36.63 | 218,168 | $ | C |
––
|
4.4 | $ | C | 28.68 | 134,502 | $ | C | 29.02 | ||||||||||||
No
options were issued in U.S. dollars during the year ended December 31,
2007. The following summarizes option activity for the options issued in U.S.
dollars during the years ended December 31, 2009 and 2008:
|
2009
|
2008
|
||||||||||
|
No.
of
options
|
Weighted-
average
exercise
price
|
No.
of
options
|
Weighted-
average
exercise
price
|
||||||||
|
Outstanding—beginning
of year
|
647,100
|
$
|
13.15
|
––
|
$
|
––
|
|||||
|
Granted
|
578,100
|
$
|
10.24
|
674,000
|
$
|
13.65
|
|||||
|
Exercised
|
(24,033
|
) |
$
|
7.51
|
––
|
$
|
–
|
||||
|
Forfeited
|
(94,700
|
) |
$
|
11.48
|
(26,900
|
) |
$
|
25.65
|
|||
|
Outstanding—end
of year
|
1,106,467
|
$
|
11.89
|
647,100
|
$
|
13.15
|
|||||
|
Exercisable—end
of year
|
179,645
|
$
|
13.70
|
––
|
$
|
––
|
|||||
The
intrinsic value of options exercisable at December 31, 2009 in U.S. dollars
was zero. The value of outstanding vested options as of December 31, 2009
was $2.5 million. No options granted in U.S. dollars were exercisable
during 2008, and accordingly, the intrinsic value of options exercisable at
December 31, 2008 and the intrinsic value of options exercised during 2008
were $11.8 million. The weighted average grant-date fair value of options
granted during 2009 was $5.57 per share and during 2008 was $6.30 per
share.
Details
of the exercise prices and expiry dates of U.S. dollar options outstanding at
December 31, 2009 are as follows:
|
Options
outstanding
|
Intrinsic
Value
|
Weighted-
average
years
to
expiry
|
Weighted-
average
exercise price
|
Vested
options
|
Weighted-
average
exercise price
|
|||||||||||||||
| $ | 7.00 - 11.00 |
957,567
|
$
|
3,592
|
6.5
|
$
|
9.16
|
129,019
|
$
|
7.51
|
||||||||||
| $ | 11.00 - 24.00 |
––
|
$
|
––
|
––
|
$
|
––
|
––
|
$
|
––
|
||||||||||
| $ | 24.00 - 36.21 |
148,900
|
$
|
––
|
5.3
|
$
|
29.48
|
50,626
|
$
|
29.48
|
||||||||||
The
assumptions used in the Black-Scholes option pricing model were:
|
2009
|
2008
|
2007
|
||||||||||||||||||
|
C$
Options
|
US$
Options
|
C$
Options
|
US$
Options
|
C$
Options
|
||||||||||||||||
|
Weighted
average risk-free interest rate
|
2.69 | % | 2.31 | % | 3.50 | % | 2.87 | % | 4.01 | % | ||||||||||
|
Expected
dividend
|
$ | -0- | $ | -0- | $ | -0- | $ | -0- | $ | -0- | ||||||||||
|
Expected
option life (years)
|
1.7 | 4.5 | 4.5 | 4.5 | 4.5 | |||||||||||||||
|
Weighted
average expected volatility
|
83 | % | 67 | % | 51 | % | 56 | % | 34 | % | ||||||||||
|
Weighted
average expected forfeiture rate
|
11 | % | 9 | % | 17 | % | 9 | % | 11 | % | ||||||||||
Restricted
Stock
Beginning in
2007, the Company began granting two different types of stock-based awards: RSU
awards which vest equally in three annual installments from date of grant and
entitle the grantee to receive the value of one share of TESCO common stock upon
vesting, and PSU awards which vest in full after three years and include a
performance measure. PSU awards entitle the grantee to receive the value of one
share of TESCO common stock for each PSU, subject to adjustment based on the
performance measure. The PSU performance objective multiplier can range from
zero when threshold performance is not met to a maximum of 2.5 times the initial
award. Both RSU awards and PSU awards may be settled by delivery of shares or
the payment of cash based on the market value of a TESCO share at the time of
settlement at the discretion of the Company.
The following
summarizes restricted stock activity during the years ended December 31, 2009,
2008 and 2007:
|
Canadian
Dollars
|
|||||||||||||||||||||||
|
2009
|
2008
|
2007
|
|||||||||||||||||||||
|
No.
of Options
|
Weighted-
average
grant
price
|
No.
of Options
|
Weighted-
average
grant
price
|
No.
of Options
|
Weighted-
average
grant
price
|
||||||||||||||||||
|
Outstanding—beginning
of year
|
119,407 | $ | C | 33.10 | 141,100 | $ | C | 36.15 | –– | $ | C | –– | |||||||||||
|
Granted
|
––
|
$ | C |
––
|
35,600 | $ | C | 24.67 | 153,500 | $ | C | 36.19 | |||||||||||
|
Exercised
|
(39,277 | ) | $ | C | 32.99 | (31,159 | ) | $ | C | 36.22 | –– | $ | C | –– | |||||||||
|
Forfeited
|
(37,302 | ) | $ | C | 35.70 | (26,134 | ) | $ | C | 34.38 | (12,400 | ) | $ | C | 36.63 | ||||||||
|
Outstanding—end
of year
|
42,828 | $ | C | 30.93 | 119,407 | $ | C | 33.10 | 141,100 | $ | C | 36.15 | |||||||||||
|
U.S.
Dollars
|
|||||||||||
|
2009
|
2008
|
||||||||||
|
No.
of Options
|
Weighted-
average
grant
price
|
No.
of Options
|
Weighted-
average
grant
price
|
||||||||
|
Outstanding—beginning
of year
|
625,200
|
$
|
12.22
|
––
|
$
|
––
|
|||||
|
Granted
|
404,700
|
$
|
10.28
|
644,300
|
$
|
12.60
|
|||||
|
Exercised
|
(130,174
|
) |
$
|
13.31
|
––
|
$
|
––
|
||||
|
Forfeited
|
(91,803
|
) |
$
|
12.16
|
(19,100
|
) |
$
|
25.12
|
|||
|
Outstanding—end
of year
|
807,923
|
$
|
11.08
|
625,200
|
$
|
12.22
|
|||||
The
weighted average grant-date fair value of restricted stock granted during 2009
in U.S. dollars was $10.28 per share. The weighted average grant-date fair value
of restricted stock granted during 2008 in U.S. dollars and Canadian dollars was
$12.60 per share and C$24.67 per share, respectively, and the weighted average
grant-date fair value of restricted stock granted during 2007 was C$36.19 per
share. The weighted average expected forfeiture rate for RSU awards is 14% and
for PSU awards is 5%.
Note
9—Income Taxes
Tesco
Corporation is an Alberta (Canada) corporation. The Company and its subsidiaries
conduct business and are taxed on profits earned in a number of jurisdictions
around the world. Income taxes have been provided based on the laws and rates in
effect in the countries in which operations are conducted or in which TESCO or
its subsidiaries are considered resident for income tax purposes.
Deferred
tax assets and liabilities are recognized for the estimated future tax effects
of temporary differences between the tax basis of an asset or liability and its
basis as reported in the consolidated financial statements. The measurement of
deferred tax assets and liabilities is based on enacted tax laws and rates
currently in effect in the jurisdictions in which the Company has
operations.
Deferred
tax assets and liabilities are classified as current or non-current according to
the classification of the related asset or liability for financial reporting.
The components of the net deferred tax asset (liability) were as follows
(in thousands):
|
December
31,
|
||||||||
|
2009
|
2008
|
|||||||
|
Deferred
tax assets:
|
||||||||
|
Current:
|
||||||||
|
Canada:
|
||||||||
|
Loss
carryforwards
|
$ | 3,711 | $ | 3,044 | ||||
|
Tax
credit carryforwards
|
–– | 2,467 | ||||||
|
Accrued
liabilities and reserves
|
4,487 | 4,213 | ||||||
|
United
States:
|
||||||||
|
Accrued
liabilities and reserves
|
5,612 | 2,440 | ||||||
|
Other
International:
|
||||||||
|
Loss
carryforwards
|
846 | –– | ||||||
|
Accrued
liabilities and reserves
|
102 | 83 | ||||||
|
Current
deferred tax assets
|
14,758 | 12,247 | ||||||
|
Less:
Valuation allowance
|
(922 | ) | (1,331 | ) | ||||
|
Total
current deferred tax assets
|
$ | 13,836 | $ | 10,916 | ||||
|
Non-current:
|
||||||||
|
Canada:
|
||||||||
|
Loss
carryforwards
|
$ | 2,255 | $ | 4,176 | ||||
|
Property,
plant and equipment
|
8,491 | 5,118 | ||||||
|
Tax
credit carryforwards
|
2,121 | 671 | ||||||
|
United
States:
|
||||||||
|
Stock
options
|
2,491 | 2,164 | ||||||
|
Other
International:
|
||||||||
|
Loss
carryforwards
|
985 | 1,747 | ||||||
|
Non-current
deferred tax assets
|
16,343 | 13,876 | ||||||
|
Less:
Valuation allowance
|
(866 | ) | (1,273 | ) | ||||
|
Total
non-current deferred tax assets
|
$ | 15,477 | $ | 12,603 | ||||
|
Deferred
tax liabilities:
|
||||||||
|
Non-current
deferred tax assets (liabilities):
|
||||||||
|
United
States:
|
||||||||
|
Property,
plant and equipment
|
(14,596 | ) | (10,156 | ) | ||||
|
Other
international:
|
||||||||
|
Property,
plant and equipment
|
(366 | ) | (205 | ) | ||||
|
Total
non-current deferred tax liabilities
|
(14,962 | ) | (10,361 | ) | ||||
|
Net
deferred tax assets
|
$ | 14,351 | $ | 13,158 | ||||
Since the
Company and its subsidiaries are taxable in a number of jurisdictions around the
world, income tax expense as a percentage of pre-tax earnings fluctuates from
year to year based on the level of profits earned in these jurisdictions and the
tax rates applicable to such profits.
The
combined Canadian federal and Alberta provincial income tax rate for 2009 was
29%. The combined rates in 2008 and 2007 were 29.5% and 32.1%
respectively.
The
Company’s income before income taxes consisted of the following (in
thousands):
|
December
31,
|
||||||||||||
|
2009
|
2008 |
2007
|
||||||||||
| Canada | $ | 6,473 | $ | 18,370 | $ | 12,845 | ||||||
| United States | (44,936 | ) | 10,030 | 26,018 | ||||||||
|
Other
international
|
20,858 | 42,372 | 3,233 | |||||||||
|
Income
(loss) before taxes
|
$ | (17,605 | ) | 70,772 | $ | 42,096 | ||||||
The
Company’s income tax provision (benefit) consisted of the following (in
thousands):
|
December
31,
|
||||||||||||
|
2009
|
2008
|
2007
|
||||||||||
|
Current:
|
||||||||||||
|
Canada
|
$ | 344 | $ | 907 | $ | 323 | ||||||
|
United
States
|
(15,856 | ) | 6,838 | 5,310 | ||||||||
|
Other
international
|
5,122 | 12,118 | 2,354 | |||||||||
|
Total
current
|
(10,390 | ) | 19,863 | 7,987 | ||||||||
|
Deferred:
|
||||||||||||
|
Canada
|
(1,791 | ) | 1,135 | (1,089 | ) | |||||||
|
United
States
|
524 | (149 | ) | 3,173 | ||||||||
|
Other
international
|
(683 | ) | –– | (42 | ) | |||||||
|
Total
deferred
|
(1,950 | ) | 986 | 2,042 | ||||||||
|
Income
tax provision/(benefit)
|
$ | (12,340 | ) | $ | 20,849 | $ | 10,029 | |||||
A
reconciliation of the statutory rate and the effective income tax rate is as
follows:
|
December
31,
|
|||||||||
|
2009
|
2008
|
2007
|
|||||||
|
Statutory
tax rate
|
29.0
|
%
|
29.5
|
%
|
32.1
|
%
|
|||
|
Effect
of:
|
|||||||||
|
Tax
rates applied to earnings not attributed to Canada-US
|
21.6
|
(4.1
|
) |
(1.5
|
) | ||||
|
Change
in future tax rates
|
(3.8
|
) |
1.6
|
4.1
|
|||||
|
Non-deductible
and permanent items
|
(10.4
|
) |
(1.4
|
) |
1.2
|
||||
|
Change
in valuation allowance
|
8.0
|
1.7
|
(2.0
|
) | |||||
|
Tax
reserves and audit resolutions
|
(2.2
|
) |
0.5
|
(2.0
|
) | ||||
|
Research
and development tax credits
|
2.0
|
(1.1
|
) |
(1.9
|
) | ||||
|
Changes
in tax laws
|
25.5
|
––
|
––
|
||||||
|
Provision
to return adjustments
|
0.6
|
0.2
|
(0.8
|
) | |||||
|
Impact
of foreign exchange gain/(loss)
|
––
|
3.0
|
(5.2
|
) | |||||
|
Other
|
(0.2
|
) |
(0.4
|
) |
(0.2
|
) | |||
|
Total
|
70.1
|
%
|
29.5
|
%
|
23.8
|
%
|
|||
The Company’s
effective tax rate for 2009 was 70% compared to 30% in 2008. The 2009 effective
tax rate reflects the recognition of a $4.5 million tax benefit associated with
a Canadian tax law change that occurred during the first quarter of 2009, a $0.3
million tax benefit for research and development credits generated during 2009,
a $1.5 million tax benefit associated with a reduction in the valuation
allowance established against foreign subsidiary net operating loss
carryforwards and cumulative net tax benefits of $3.8 million related to
earnings or losses generated in jurisdictions with statutory tax rates higher or
lower than the Canadian federal and provincial statutory tax rates. The 2009
effective tax rate also includes a $0.4 million charge related to an audit
assessment received in a foreign jurisdiction, $0.7 million of tax expense
associated with a reduction in deferred tax assets attributable to a change in
the period in which the Company expects to utilize such assets and a
$1.8 million charge related to nondeductible expenses.
The 2008
effective tax rate reflects a $0.8 million tax benefit for research and
development credits generated during 2008 offset by a $1.2 million charge
related to valuation allowances established against foreign subsidiary losses, a
$2.1 million charge related to foreign exchange gains, and a $1.1 million charge
related to a reduction in deferred tax assets attributable to a change in the
period in which the Company expects to utilize such assets. The 2007 effective
tax rate reflects a $2.2 million tax benefit related to foreign exchange losses
offset by a $1.7 million charge associated with a reduction in deferred tax
assets attributable to a change in the period in which the Company expects to
utilize such assets.
During
2009, the Company utilized $11.2 million of its non-capital loss carryforwards
in Canada. During 2009, the Company also generated $0.7 million of non-capital
loss carryforwards in Canada through an election to convert foreign tax credits
into non-capital losses. At December 31, 2009, the Company had
$29.5 million of Canadian non-capital loss carryforwards remaining. These losses
can be carried forward seven to ten years, depending on the date generated, and
applied to reduce future taxable income. The loss carryforwards at
December 31, 2009 expire as follows (in thousands):
|
Year
of
expiration:
|
Amount
of
loss:
|
||||
| 2010 |
|
$ | 17,420 | ||
| 2014 |
|
$ | 11,426 | ||
| 2020 |
|
$ | 680 | ||
Based on
the Company’s recent history of generating taxable income to utilize its loss
carryforwards, expected future income and potential tax planning strategies, the
Company expects to fully utilize these loss carryforwards. Therefore, there is
no valuation allowance offsetting the deferred tax asset for these
losses.
Certain
of the Company’s foreign subsidiaries file separate tax returns and have
incurred losses in foreign jurisdictions. At December 31, 2009, the Company
has $5.7 million of such loss carryforwards. Due to insufficient earnings
history in the selected jurisdictions where such losses were generated, the
Company does not expect to fully utilize these losses. Therefore,
a valuation allowance has been established against the deferred tax assets for
these losses in certain jurisdictions. The valuation allowance at
December 31, 2009 was $0.4 million.
During
2009, the Company generated $0.4 million of foreign tax credits for taxes paid
on foreign branch operations that are creditable against the Company’s Canadian
taxes. The Company estimates that it will not be able to utilize a portion of
these foreign tax credits in either 2009 or future tax years to offset its tax
liability. Therefore, a valuation allowance of $0.2 million was established
against the foreign tax credits generated in 2009. The valuation
allowance that exists against the foreign tax credit carryforward balance at
December 31, 2009 is $1.2 million.
No
provision is made for taxes that may be payable on the repatriation of
accumulated earnings in foreign subsidiaries on the basis that these earnings
will continue to be used to finance the activities of these subsidiaries. It is
not practicable to determine the amount of unrecognized deferred income taxes
associated with these unremitted earnings.
At
December 31, 2008, the Company had an accrual for uncertain tax positions
of $1.2 million, the balance of which was not materially changed during 2009.
This liability is offset by the Company’s net income tax receivables and, as of
December 31, 2008 and 2009, was included in Prepaid Income Taxes and Income
Taxes Payable, respectively, in the accompanying Consolidated Balance Sheets as
the Company anticipates that these uncertainties will be resolved in the next 12
months. The resolution of these uncertainties should not have a material impact
on the Company’s effective tax rate, results of operations or cash
flows.
A
reconciliation of the beginning and ending accrual for uncertain tax positions
is as follows (in thousands):
|
December
31,
|
||||||||||||
|
2009
|
2008
|
2007
|
||||||||||
|
Balance,
beginning of year
|
$ | 1,181 | $ | 568 | $ | 1,445 | ||||||
|
Decreases
in tax positions for prior years
|
(56 | ) | — | (277 | ) | |||||||
|
Increase
in tax positions for prior years
|
43 | 613 | — | |||||||||
|
Increases
in tax positions for current year
|
— | — | 155 | |||||||||
|
Settlements
|
— | — | (755 | ) | ||||||||
|
Lapse
in statute of limitations
|
— | — | — | |||||||||
|
Balance,
end of year
|
$ | 1,168 | $ | 1,181 | $ | 568 | ||||||
The
Company recognizes interest related to uncertain tax positions in interest
expense and penalties related to uncertain tax positions are recognized in Other
Expense. At December 31, 2009 and 2008, the Company had accrued $0.3
million for the potential payment of interest and penalties on uncertain tax
positions.
TESCO and
its subsidiaries are subject to Canada federal and provincial income tax and
have concluded substantially all Canada federal and provincial tax matters for
tax years through 2001. TESCO and its subsidiaries are also subject to U.S.
federal and state income tax and have concluded substantially all U.S. federal
income tax matters for tax years through 2005. One U.S. subsidiary has been
audited through the tax year ended December 31, 2005. During the 12
months ended December 31, 2009, an audit of the Company’s consolidated tax
return for the year 2006 was concluded with no impact to the Company’s financial
position, results of operations or cash flows.
TESCO has
been advised by the Mexican tax authorities that they believe significant
expenses incurred by the Company’s Mexican operations from 1996 through 2002 are
not deductible for Mexican tax purposes. Between 2002 and 2008, formal
reassessments disallowing these deductions were issued for each of these years,
all of which the Company appealed to the Mexican court system. TESCO has
obtained final court rulings deciding all years in dispute in the Company’s
favor, except for 1996 (discussed below), and 2001 and 2002, both of which are
currently before the Mexican Tax Court. The outcome of such appeals is
uncertain. However, TESCO recorded an accrual of $0.3 million during 2008 for
the Company’s anticipated exposure on these issues ($0.2 million related to
interest and penalties was included in Other Income and $0.1 million was
included in Income Tax Expense). TESCO continues to believe that the basis for
these reassessments was incorrect, and that the ultimate resolution of those
outstanding matters that remain will likely not have a material adverse effect
on the Company’s financial position, results of operations or cash
flows.
In May
2002, TESCO paid a deposit of $3.3 million with the Mexican tax authorities in
order to appeal the reassessment for 1996. In 2007, the Company requested and
received a refund of approximately $3.7 million (the original deposit amount of
$3.3 million plus $0.4 million in interest). Therefore, in 2007, the Company
reversed an accrual for taxes, interest and penalties ($1.4 million related to
interest and penalties was included in Other Income and $0.7 million benefit in
Income Tax Expense). With the return of the $3.3 million deposit, the Mexican
tax authorities issued a resolution indicating that TESCO was owed an additional
$3.4 million in interest but this amount had been retained by the tax
authorities to satisfy a second reassessment for 1996. The Company believes the
second reassessment is invalid, and has appealed it to the Mexican Tax Court. In
January 2009, the Tax Court issued a decision accepting the Company’s arguments
in part, which is subject to further appeal. Due to uncertainty regarding the
ultimate outcome, TESCO has not recognized the additional interest in dispute as
an asset.
In
addition to the material jurisdictions above, other state and foreign tax
filings remain open to examination. TESCO believes that any assessment
on these filings will not have a material impact to the Company’s financial
position, results of operations or cash flows. TESCO believes that appropriate
provisions for all outstanding issues have been made for all jurisdictions and
all open years. However, audit outcomes and the timing of audit settlements are
subject to significant uncertainty. Therefore, additional provisions on
tax-related matters could be recorded in the future as revised estimates are
made or the underlying matters are settled or otherwise resolved.
Note
10—Goodwill and Other Intangible Assets
The
Company’s goodwill has an indefinite useful life and is subject to at least an
annual impairment test in the fourth quarter of each year or the occurrence of a
triggering event. For 2009 and 2008, the Company completed its annual
assessment, which indicated no impairment.
All of
the Company’s goodwill has been assigned to the Tubular Services segment, and
approximately $11.1 million is amortizable for income tax purposes. The change
in the carrying amount of goodwill is as follows:
|
December
31,
|
||||||
|
2009
|
2008
|
|||||
|
Gross
balance, beginning of year
|
$ | 28,746 | $ | 29,829 | ||
|
Effect
of foreign currency exchange rates
|
648 | (1,083 | ) | |||
|
Gross
balance, end of year
|
$ | 29,394 | $ | 28,746 | ||
The
Company tests consolidated goodwill for impairment using a fair value approach
at the reporting unit level. Goodwill impairment exists when the estimated fair
value of goodwill is less than its carrying value.
For
purposes of the analysis, the Company estimates the fair value for the reporting
unit based on discounted cash flows (the income approach). The income approach
is dependent on a number of significant management assumptions including markets
and market share, sales volumes and prices, costs to produce, capital spending,
working capital changes, terminal value multiples and the discount rate. The
discount rate is commensurate with the risk inherent in the projected cash flows
and reflects the rate of return required by an investor in the current economic
conditions. The Company had no impairment charges related to goodwill
during the years ended December 31, 2009, 2008 or 2007.
Based on
the analysis performed for the year ended December 31, 2009, if the Company
were to increase the discount rate by 300 basis points while keeping all other
assumptions constant, there would be no impairment in the reporting unit.
Inherent in our projections are key assumptions relative to how long the current
downward cycle might last. Furthermore, the financial and credit market
volatility directly impacts our fair value measurement through estimated
weighted-average cost of capital that the Company uses to determine our discount
rate. During times of volatility, significant judgment must be applied to
determine whether credit changes are a short term or long term trend. While the
Company believes the assumptions made are reasonable and appropriate, it will
continue to monitor these, and update the impairment analysis if the cycle
downturn continues for longer than expected.
The
Company’s intangible assets are recorded at their estimated fair value at the
date acquired and are amortized on a straight-line basis over their estimated
useful lives. The Company’s intangible assets primarily consist of customer
relationships, patents and non-compete agreements related to acquisitions in
2007 (see Note 5 above) and acquisitions in 2005. Intangible assets related to
customer relationships have a weighted average estimated useful life of four
years, patents have a weighted average estimated useful life of 13 years and
non-compete agreements have a weighted average term of five years. The carrying
amount and accumulated amortization of intangible assets at December 31,
2009 and 2008 were as follows (in thousands):
|
2009
|
2008
|
|||||||||||||||
|
Gross
Carrying Amount
|
Accumulated
Amortization
|
Gross
Carrying Amount
|
Accumulated
Amortization
|
|||||||||||||
|
Amortized
intangible assets
|
||||||||||||||||
|
Customer
relationships
|
$ | 5,566 | $ | (3,929 | ) | $ | 6,070 | $ | (3,037 | ) | ||||||
|
Patents
|
2,521 | (769 | ) | 2,470 | (545 | ) | ||||||||||
|
Non-compete
agreements
|
3,061 | (1,585 | ) | 2,396 | (727 | ) | ||||||||||
|
Other
|
64 | (3 | ) | — | — | |||||||||||
| $ | 11,212 | $ | (6,286 | ) | $ | 10,936 | $ | (4,309 | ) | |||||||
Amortization
of intangibles was $2.0 million in 2009, $1.9 million in 2008 and $1.3 million
in 2007, and is included in Cost of Sales and Services in the accompanying
Consolidated Statements of Income. Estimated amortization expense for each of
the next five years through December 31, 2014 is $1.2 million,
$1.1 million, $0.8 million, $0.4 million, and $0.2 million,
respectively.
Note
11—Commitments and Contingencies
Legal
Contingencies
The
Company, in the normal course of its business, is subject to legal proceedings
brought against it and its subsidiaries. The estimates below represent
management’s best estimates based on consultation with internal and external
legal counsel. There can be no assurance as to the eventual outcome or the
amount of loss the Company may suffer as a result of these
proceedings.
The
amount of loss the Company may suffer as a result of these proceedings is not
generally reasonably estimable until settlement is reached or judgment obtained.
Management does not believe that any such proceedings currently underway against
the Company, either individually or in the aggregate, will have a material
adverse effect on the Company’s consolidated financial position, results of
operations or cash flows.
Varco
I/P, Inc. (“Varco”) filed suit against TESCO in April 2005 in the U.S. District
Court for the Western District of Louisiana, alleging that our CDS infringes
certain of Varco’s U.S. patents. Varco seeks monetary damages and an injunction
against further infringement. The Company filed a countersuit against Varco in
June 2005 in the U.S. District Court for the Southern District of Texas, Houston
Division seeking invalidation of the Varco patents in question. In July 2006,
the Louisiana case was transferred to the federal district court in Houston, and
as a result, the issues raised by Varco have been consolidated into a single
proceeding in which the Company is the plaintiff. The Company also filed a
request with the U.S. Patent and Trademark Office (“USPTO”) for reexamination of
the patents on which Varco’s claim of infringement is based. The USPTO accepted
the Varco patents for reexamination, and the district court stayed the patent
litigation pending the outcome of the USPTO reexamination. In May 2009, the
USPTO issued a final action rejecting all of the Varco patent claims that TESCO
had contested. Varco has appealed this decision with the USPTO. The outcome and
amount of any future financial impacts from this litigation are not determinable
at this time.
Frank’s
International, Inc. and Frank’s Casing Crew and Rental Tools, Inc. (“Franks”)
filed suit against TESCO in the U.S. District Court for the Eastern District of
Texas, Marshall Division, on January 10, 2007, alleging that its Casing
Drive System infringes two patents held by Franks. TESCO filed a response
denying the Franks allegation and asserting the invalidity of its patents. In
May 2008, Franks withdrew its claims with respect to one of the patents, and, in
July 2008, TESCO filed a request with the USPTO for reexamination of the other
patent. In September 2008, the USPTO ordered a reexamination of that patent.
During 2009, TESCO, Franks, and a third party from whom TESCO had a license
agreed on terms of a settlement, pursuant to which TESCO paid $1.8 million to
Franks and $0.4 million to the third party. Under the terms of the settlement,
TESCO received from the third party a release of any royalty obligation under
the license and received from Franks a fully-paid, perpetual, world-wide
nonexclusive license under the two patents at issue. Franks requested the court
to dismiss its lawsuit with prejudice. TESCO accrued and paid this $2.2 million
settlement during the year ended December 31, 2009.
Weatherford
International, Inc. and Weatherford/Lamb Inc. (“Weatherford”) filed suit against
TESCO in the U.S. District Court for the Eastern District of Texas, Marshall
Division, on December 5, 2007, alleging that various TESCO technologies
infringe 10 different patents held by Weatherford. Weatherford seeks monetary
damages and an injunction against further infringement. The TESCO technologies
referred to in the claim include the CDS, the CASING DRILLING system and method,
a float valve, and the locking mechanism for the controls of the tubular
handling system. The Company has filed a general denial seeking a judicial
determination that it does not infringe the patents in question and/or that the
patents are invalid. In November 2008, the Company filed requests with the
USPTO, seeking invalidation of substantially all of the Weatherford patent
claims in the suit. The trial is set for May 2011. The outcome and amount of any
future financial impacts from this litigation are not determinable at this
time.
The
Company has been advised by the Mexican tax authorities that they believe
significant expenses incurred by our Mexican operations from 1996 through 2002
are not deductible for Mexican tax purposes. Between 2002 and 2008, formal
reassessments disallowing these deductions were issued for each of these years,
all of which the Company appealed to the Mexican court system. The Company has
obtained final court rulings deciding all years in dispute in our favor, except
for 1996 (discussed below), and 2001 and 2002, both of which are currently
before the Mexican Tax Court. The outcome of such appeals is uncertain. However,
the Company recorded an accrual of $0.3 million during 2008 for our anticipated
exposure on these issues ($0.2 million related to interest and penalties was
included in Other Income and $0.1 million was included in Income Tax Expense).
The Company continues to believe that the basis for these reassessments was
incorrect, and that the ultimate resolution of those outstanding matters that
remain will likely not have a material adverse effect on our financial position,
results of operations or cash flows.
In May
2002, the Company paid a deposit of $3.3 million with the Mexican tax
authorities in order to appeal the reassessment for 1996. In 2007, the Company
requested and received a refund of approximately $3.7 million (the original
deposit amount of $3.3 million plus $0.4 million in interest). Therefore, in
2007 the Company reversed an accrual for taxes, interest and penalties ($1.4
million related to interest and penalties was included in Other Income and $0.7
million benefit in Income Tax Expense). With the return of the $3.3 million
deposit, the Mexican tax authorities issued a resolution indicating that the
Company was owed an additional $3.4 million in interest but this amount had been
retained by the tax authorities to satisfy a second reassessment for 1996. The
Company believes the second reassessment is invalid, and the Company appealed it
to the Mexican Tax Court. In January 2009, the Tax Court issued a decision
accepting our arguments in part, which is subject to further appeal. Due to
uncertainty regarding the ultimate outcome, The Company has not recognized the
additional interest in dispute as an asset.
In July
2006, the Company received a claim for withholding tax, penalties and interest
related to payments over the periods from 2000 to 2004 in a foreign
jurisdiction. The Company disagrees with this claim and is currently litigating
this matter. In November 2009, the Company received a favorable decision from a
lower level court regarding payments made during 2000, which is subject to
appeal. At June 30, 2006 the Company accrued its estimated
pre-tax exposure on this matter at $3.8 million, with $2.6 million included in
other expense and $1.2 million included in interest expense. During 2008 and
2009, the Company accrued an additional $0.2 million and $0.2 million,
respectively, of interest expense related to this claim.
In August
2008, the Company received a claim in Mexico for $1.1 million in fines and
penalties related to the exportation of certain temporarily imported equipment
that remained in Mexico beyond the authorized time limit for its return. The
Company disagrees with this claim and is currently litigating the matter. In
December 2009, the Company received a decision from the Mexican Tax Court in our
favor, which is subject to further appeal. The ultimate outcome of this
litigation is uncertain.
In
February 2009, the Company received notification of a regulatory review of our
payroll practices in one of our North American business districts. The review
was concluded during 2009 without a material financial impact to the
Company.
In August
2009, the Company filed suit against several competitors in the U.S. District
Court for the Southern District of Texas – Houston Division, including
Weatherford International, Inc. (“Weatherford Inc.”). The suit claims
infringement of two TESCO patents related to our CDS. Weatherford Inc. has
petitioned for and been granted a reexamination of the Tesco patents by the
USPTO. That reexamination is ongoing. The outcome of this
examination and any resulting financial impact, if any, is
uncertain.
A former
employee of one of TESCO’s U.S. subsidiaries filed suit in the U.S. District
Court for the Southern District of Texas—Houston Division on January 29,
2009 on behalf of a number of similarly situated claimants, alleging the Company
failed to comply with certain wage and hour regulations under the U.S. Fair
Labor Standards Act. The lawsuit was dismissed on July 22, 2009 on the
basis that several of the plaintiffs were bound to arbitrate their claims
against us pursuant to the TESCO Dispute Resolution Program (“Plan”). Five
plaintiffs not covered by the Plan re-filed their lawsuit on July 30, 2009
in the same court and those plaintiffs covered by the Plan initiated arbitration
proceedings with the American Arbitration Association. Additional
plaintiffs were subsequently added to each of these actions for a total of 48
plaintiffs. In December 2009, the Company agreed in mediation to settle the
claims of all plaintiffs for a total of approximately $2.3 million. The
settlement agreement has been executed by all plaintiffs. During 2009, the
Company accrued the entire $2.3 million settlement related to these
claims.
In December
2009, the Company received an administrative subpoena from the Department of the
Treasury, Office of Foreign Assets Control regarding a past shipment of oilfield
equipment made from its Canadian manufacturing facility in 2006 to Sudan. The
Company is reviewing the matter and has provided a timely response to the
subpoena. The outcome of this internal review and any future financial impact
resulting from this matter are not determinable at this time.
Other
Contingencies
The
Company is contingently liable under letters of credit and similar instruments
that it is required to provide from time to time in connection with the
importation of equipment to foreign countries and to secure its performance on
certain contracts. At December 31, 2009 the total exposure to the Company
under outstanding letters of credit was $7.1 million.
Product
Warranties
In late
2006, the Company identified technical problems associated with the Company’s
new EMI 400 top drives. In addition to its standard accrual for warranty work
associated with top drive sales, the Company accrued an additional $0.8 million
to correct the identified technical problem with the EMI 400 units and such cost
was included in Cost of Sales and Services in the accompanying Consolidated
Statements of Income. As a result of substantially correcting the technical
problems associated with its EMI 400 top drives, during 2007 the Company
reversed $1.3 million of its warranty accrual related to this issue. In 2005,
the Company provided an additional warranty reserve of $6.6 million, net of
amounts which are contractually recoverable from the manufacturer of the steel
forgings, related to the replacement of load path parts of certain equipment
sold to customers and in TESCO’s top drive rental fleet. In 2007, the Company,
as a result of substantially completing the replacement of load path parts in
customers and TESCO’s rental fleet, reversed $0.9 million of its remaining
warranty accrual for this issue. These warranty accrual reversals were included
in Cost of Sales and Services in the accompanying Consolidated Statements of
Income. The Company continues to monitor its activities for warranty work to
ensure accrued amounts are reasonable.
The following
is a reconciliation of changes in the Company’s warranty accrual for the twelve
months ended December 31, 2009 and the year ended December 31, 2008 (in
thousands):
| For the Years Ended December 31, | ||||||||
|
2009
|
2008
|
|||||||
|
Balance—beginning
of period
|
$ | 3,326 | $ | 3,045 | ||||
|
Charged
to expense, net
|
(85 | ) | 1,684 | |||||
|
Charged
to other accounts(a)
|
88 | (129 | ) | |||||
|
Deductions
|
(1,078 | ) | (1,274 | ) | ||||
|
Balance—end
of period
|
$ | 2,251 | $ | 3,326 | ||||
|
(a)
|
Represents
currency translation adjustments and
reclassifications.
|
Commitments
The
Company has future minimum lease commitments under non-cancelable operating
leases with initial or remaining terms of one year or more as of
December 31, 2009 as follows (in thousands):
|
Payment
Due by Period
|
|||||||||||||||||||||||||||
|
Total
|
2010
|
2011
|
2012
|
2013
|
2014
|
Thereafter
|
|||||||||||||||||||||
| Long term debt obligations | $ | 8,600 | $ | — | $ | — | $ | 8,600 | $ | — | $ | — | $ | — | |||||||||||||
|
Operating
lease obligations
|
13,050 | 4,406 | 2,870 | 1,927 | 1,234 | 667 | 1,946 | ||||||||||||||||||||
|
Interest
|
1,073 | 444 | 629 | — | — | — | — | ||||||||||||||||||||
|
Purchase
commitments
|
11,356 | 11,356 | — | — | — | — | — | ||||||||||||||||||||
| $ | 34,079 | $ | 16,206 | $ | 3,499 | $ | 10,527 | $ | 1,234 | $ | 667 | $ | 1,946 | ||||||||||||||
Rent
expense during 2009, 2008 and 2007 was $4.8 million, $7.3 million and $4.7
million, respectively.
Note
12—Transactions with Related Parties
Bennett
Jones LLP
The
Company’s primary outside counsel in Canada is Bennett Jones LLP. One of the
Company’s directors is counsel at Bennett Jones LLP. During each of the years
2009, 2008 and 2007, the Company paid approximately $0.1 million, $0.4 million
and $0.4 million, respectively, for services from Bennett Jones LLP, excluding
reimbursement by the Company of patent filing fees and other expenses. TESCO
believes that the rates it paid Bennett Jones LLP for services are on terms
similar to those that would have been available from other third
parties.
Note
13—Segment Information
Business
Segments
Our four
business segments are: Top Drive, Tubular Services, CASING DRILLING and Research
and Engineering. Prior to December 31, 2008, the Company organized its
activities into three business segments: Top Drives, Casing Services and
Research and Engineering. Effective December 31, 2008, the Company segregated
its Casing Services segment into Tubular Services and CASING DRILLING and our
financial and operating data for the year ended December 31, 2007 has been
recasted to be presented consistently with this structure.
The Top
Drive business is comprised of top drive sales, top drive rentals and
after-market sales and service. The Tubular Services business includes both our
proprietary and conventional Tubular Services. The CASING DRILLING segment
consists of our proprietary CASING DRILLING technology. The Research and
Engineering segment is comprised of our research and development activities
related to Tubular Services technology and Top Drive model
development.
These
segments report their results of operations to the level of operating income.
Certain functions, including certain sales and marketing activities and
corporate general and administrative expenses, are provided centrally from the
corporate office. The costs of these functions, together with other (income)
expense and income taxes, are not allocated to these segments. Assets are
allocated to the Top Drive, Tubular Services, CASING DRILLING or Research and
Engineering segments to which they specifically relate. All of the Company’s
goodwill has been allocated to the Tubular Services segment. The Company’s chief
operating decision maker is not provided a measure of assets by business segment
and as such this information is not presented.
The
Company incurs costs directly and indirectly associated with its revenues at a
business unit level. Direct costs include expenditures specifically incurred for
the generation of revenue, such as personnel costs on location, transportation,
maintenance and repair, and depreciation of the Company’s revenue-generating
equipment. Overhead costs, such as field administration and field operations
support, are not directly associated with the generation of revenue within a
particular business segment. In years prior to 2008, the Company allocated total
overhead costs at a consolidated level based on a percentage of global revenues.
Beginning in 2008, the Company was able to identify and capture, where
appropriate, the specific operating segments in which it incurred its overhead
costs at the business unit level. Using this information, the Company has
reclassified 2007 segment operating results to conform to the current year
presentation. These reclassifications resulted in an increase of $12.3 million
in operating income for the Top Drive segment, and a corresponding decrease of
$12.3 million for the Tubular Services segment.
Significant
financial information relating to these segments is as follows (in
thousands):
|
Year
Ended December 31, 2009
|
||||||||||||||||||||||||
|
Top
Drive
|
Tubular
Services
|
CASING
DRILLING
|
Research
& Engineering
|
Corporate
and Other
|
Total
|
|||||||||||||||||||
|
Revenues
|
$ | 224,853 | $ | 118,299 | $ | 13,326 | $ | — | $ | — | $ | 356,478 | ||||||||||||
|
Depreciation
and Amortization
|
7,980 | 20,720 | 4,614 | 69 | 3,350 | 36,733 | ||||||||||||||||||
|
Operating
Income (Loss)
|
49,532 | (2,942 | ) | (21,013 | ) | (7,431 | ) | (32,945 | ) | (14,799 | ) | |||||||||||||
|
Other
expense
|
2,806 | |||||||||||||||||||||||
|
Loss
before income taxes
|
$ | (17,605 | ) | |||||||||||||||||||||
|
Year
Ended December 31, 2008
|
||||||||||||||||||||||||
|
Top
Drive
|
Tubular
Services
|
CASING
DRILLING
|
Research
& Engineering
|
Corporate
and Other
|
Total
|
|||||||||||||||||||
|
Revenues
|
$ | 341,432 | $ | 166,463 | $ | 27,047 | $ | — | $ | — | $ | 534,942 | ||||||||||||
|
Depreciation
and Amortization
|
8,468 | 18,332 | 4,123 | 97 | 2,254 | 33,274 | ||||||||||||||||||
|
Operating
Income (Loss)
|
106,822 | 22,474 | (12,605 | ) | (11,049 | ) | (30,795 | ) | 74,847 | |||||||||||||||
|
Other
expense
|
4,075 | |||||||||||||||||||||||
|
Income
before income taxes
|
$ | 70,772 | ||||||||||||||||||||||
|
Year
Ended December 31, 2007
|
||||||||||||||||||||||||
|
Top
Drive
|
Tubular
Services
|
CASING
DRILLING
|
Research
& Engineering
|
Corporate
and Other
|
Total
|
|||||||||||||||||||
|
Revenues
|
$ | 289,145 | $ | 158,655 | $ | 14,578 | $ | — | $ | — | $ | 462,378 | ||||||||||||
|
Depreciation
and Amortization
|
9,452 | 15,427 | 1,141 | 98 | 1,139 | 27,257 | ||||||||||||||||||
|
Operating
Income (Loss)
|
80,477 | 23,654 | (14,082 | ) | (12,011 | ) | (29,887 | ) | 48,151 | |||||||||||||||
|
Other
expense
|
6,055 | |||||||||||||||||||||||
|
Income
before income taxes
|
$ | 42,096 | ||||||||||||||||||||||
Geographic
Areas
The
Company attributes revenues to geographic regions based on the location of the
customer. Generally, for service activities, this will be the region in which
the service activity occurs and, for equipment sales, this will be the region in
which the customer’s purchasing office is located. The Company’s Revenues
occurred and Property, Plant, Equipment, net were located in the following
areas of the world (in thousands):
|
Year
Ended December 31, 2009
|
||||||||
|
Revenue
|
Property,
Plant and Equipment, net
|
|||||||
|
United
States
|
$ | 158,831 | $ | 69,411 | ||||
|
Latin
America, including Mexico
|
67,518 | 41,405 | ||||||
|
Asia
Pacific
|
44,117 | 22,850 | ||||||
|
Canada
|
33,083 | 14,007 | ||||||
|
Europe,
Africa and Middle East
|
52,929 | 35,352 | ||||||
|
Total
|
$ | 356,478 | $ | 183,025 | ||||
|
Year
Ended December 31, 2008
|
||||||||
|
Revenue
|
Property,
Plant and Equipment, net
|
|||||||
|
United
States
|
$ | 276,374 | $ | 94,950 | ||||
|
Latin
America, including Mexico
|
76,559 | 40,041 | ||||||
|
Asia
Pacific
|
65,716 | 27,402 | ||||||
|
Canada
|
56,888 | 16,673 | ||||||
|
Europe,
Africa and Middle East
|
59,405 | 29,958 | ||||||
|
Total
|
$ | 534,942 | $ | 209,024 | ||||
|
Year
Ended December 31, 2007
|
||||||||
|
Revenue
|
Property,
Plant and Equipment, net
|
|||||||
|
United
States
|
$ | 281,703 | $ | 100,639 | ||||
|
Latin
America, Including Mexico
|
41,649 | 20,747 | ||||||
|
Asia
Pacific
|
51,501 | 16,520 | ||||||
|
Canada
|
59,916 | 20,965 | ||||||
|
Europe,
Africa and Middle East
|
27,609 | 10,717 | ||||||
|
Total
|
$ | 462,378 | $ | 169,588 | ||||
Major
Customers and Credit Risk
The
Company’s accounts receivable are principally with major international and state
oil and gas service and exploration and production companies and are subject to
normal industry credit risks. The Company performs ongoing credit evaluations of
customers and grants credit based upon past payment history, financial condition
and anticipated industry conditions. Customer payments are regularly monitored
and a provision for doubtful accounts is established based upon specific
situations and overall industry conditions. Many of the Company’s customers are
located in international areas that are inherently subject to risks of economic,
political and civil instabilities, which may impact management’s ability to
collect those accounts receivable. The main factors in determining the allowance
needed for accounts receivable are customer bankruptcies, delinquency, and
management’s estimate of ability to collect. Bad debt expense is included in
Selling, General and Administrative Expense in the accompanying Consolidated
Statements of Income.
For the
years ended December 31, 2009, 2008 and 2007, no single customer
represented more than 10% of total revenue.
Note
14—Selected Quarterly Financial Data (Unaudited)
The
following table presents unaudited quarterly financial data for 2009 and 2008
(in thousands, except for per share amounts):
|
For
the 2009 quarterly period ended
|
||||||||||||||||
|
March
31
(Restated)
Note 2
|
June
30
(Restated)
Note 2
|
September
30
(Restated)
Note 2
|
December
31
|
|||||||||||||
|
Revenue
|
(a) | $ | 110,184 | $ | 88,427 | $ | 72,609 | $ | 85,258 | |||||||
|
Operating
Income (Loss)
|
(b) | $ | 4,531 | $ | (7,802 | ) | $ | 2,375 | $ | (13,903 | ) | |||||
|
Net
Income (Loss)
|
(c) | $ | 7,510 | $ | (4,194 | ) | $ | 395 | $ | (8,976 | ) | |||||
|
EPS
|
(d) | |||||||||||||||
|
Basic
|
$ | 0.20 | $ | (0.11 | ) | $ | 0.01 | $ | (0.24 | ) | ||||||
|
Diluted
|
$ | 0.20 | $ | (0.11 | ) | $ | 0.01 | $ | (0.24 | ) | ||||||
For the
reasons set forth in Note 2 to the consolidated financial statements, all
quarterly periods in 2009 presented above, except for the quarter ended December
31, 2009, have been restated. The effect of these restatements on the
quarterly statements of income was as follows:
|
(a)
|
Revenues
were not impacted by the restatements.
|
|
(b)
|
Operating
income for the quarters ended March 31, 2009, June 30, 2009 and September
30, 2009 was increased (decreased) by $0.5 million, $(0.6) million and
$0.7 million, respectively.
|
|
(c)
|
Net
income for the quarters ended March 31, 2009, June 30, 2009 and September
30, 2009 was increased (decreased) by $3.1 million, $(0.6) million and
$0.7 million, respectively.
|
|
(d)
|
Basic
EPS for the quarters ended March 31, 2009, June 30, 2009 and September 30,
2009 was increased (decreased) by $0.08, $(0.01) and $0.02, respectively.
Diluted EPS for the quarters ended March 31, 2009, June 30, 2009 and
September, 2009 was increased (decreased) by $0.08, $(0.01) and $0.02,
respectively.
|
|
For
the 2008 quarterly period ended
|
||||||||||||||||
|
March
31
|
June
30
|
September
30
|
December
31
|
|||||||||||||
|
Revenue
|
(a) | $ | 129,368 | $ | 126,157 | $ | 140,021 | $ | 139,396 | |||||||
|
Operating
Income
|
(b) | $ | 16,254 | $ | 16,672 | $ | 24,838 | $ | 17,083 | |||||||
|
Net
Income
|
(c) | $ | 10,551 | $ | 12,446 | $ | 17,169 | $ | 9,757 | |||||||
|
EPS
|
(d) | |||||||||||||||
|
Basic
|
$ | 0.29 | $ | 0.34 | $ | 0.46 | $ | 0.26 | ||||||||
|
Diluted
|
$ | 0.28 | $ | 0.33 | $ | 0.45 | $ | 0.26 | ||||||||
For the
reasons set forth in Note 2 to the consolidated financial statements, all
periods in 2008 presented above have been revised. The effect of these
revisions on the quarterly statements of income was as follows:
|
(a)
|
Revenues
were not impacted by the revisions.
|
|
(b)
|
Operating
income for the quarters ended March 31, 2008, June 30, 2008, September 30,
2008 and December 31, 2008 was increased (decreased) by $(0.2) million,
$(0.3) million, $(0.6) million and $0.2 million, respectively.
|
|
(c)
|
Net
income for the quarters ended March 31, 2008, June 30, 2008, September 30,
2008 and December 31, 2008 was decreased by $0.1 million, $0.2 million,
$0.4 million and $2.2 million, respectively.
|
|
(d)
|
Basic
EPS for the quarters ended March 31, 2008 and June 30, 2008 were not
impacted by the revisions. Basic EPS for the quarters ended
September 30, 2008 and December 31, 2008 was decreased by $0.06 and $0.05,
respectively. Diluted EPS for the quarters ended March 31, 2008, June 30,
2008, September 30, 2008 and December 31, 2008 was decreased by $0.01,
$0.01, $0.01 and $0.05, respectively.
|
Schedule
II
VALUATION AND QUALIFYING ACCOUNTS
For
the Years Ended December 31, 2009, 2008 and 2007
|
Additions
|
||||||||||||||||||||
|
Balance
At Beginning of Year
|
Charged
to Cost and Expenses (c)
|
Charged
to Other Accounts (a)
|
Deductions
(b)
|
Balance
At End of Year
|
||||||||||||||||
|
(in
thousands)
|
||||||||||||||||||||
|
2009
|
||||||||||||||||||||
|
Allowance
for Doubtful Accounts
|
$ | 3,195 | $ | 312 | $ | 38 | $ | (2,006 | ) | $ | 1,539 | |||||||||
|
Inventory
Reserves
|
3,032 | 6,434 | (166 | ) | (2,157 | ) | 7,143 | |||||||||||||
|
Warranty
Reserves
|
3,326 | (85 | ) | 88 | (1,078 | ) | 2,251 | |||||||||||||
|
Allowance
for Uncollectible Deposits(d)
|
3,385 | –– | –– | –– | 3,385 | |||||||||||||||
|
Deferred
Tax Asset Valuation Allowance
|
2,604 | 277 | –– | (1,093 | ) | 1,788 | ||||||||||||||
|
2008
|
||||||||||||||||||||
|
Allowance
for Doubtful Accounts
|
$ | 1,885 | $ | 3,989 | $ | 150 | $ | (2,829 | ) | $ | 3,195 | |||||||||
|
Inventory
Reserves
|
1,667 | 2,275 | (353 | ) | (557 | ) | 3,032 | |||||||||||||
|
Warranty
Reserves
|
3,045 | 1,684 | (129 | ) | (1,274 | ) | 3,326 | |||||||||||||
|
Allowance
for Uncollectible Deposits(d)
|
3,385 | –– | –– | –– | 3,385 | |||||||||||||||
|
Deferred
Tax Asset Valuation Allowance
|
2,042 | 562 | –– | –– | 2,604 | |||||||||||||||
|
2007
|
||||||||||||||||||||
|
Allowance
for Doubtful Accounts
|
$ | 2,983 | $ | 1,200 | $ | 45 | $ | (2,343 | ) | $ | 1,885 | |||||||||
|
Inventory
Reserves
|
3,874 | (37 | ) | 571 | (2,741 | ) | 1,667 | |||||||||||||
|
Warranty
Reserves
|
9,391 | 1,647 | 1,296 | (9,289 | ) | 3,045 | ||||||||||||||
|
Allowance
for Uncollectible Deposits(d)
|
— | 3,385 | — | — | 3,385 | |||||||||||||||
|
Deferred
Tax Asset Valuation Allowance
|
3,063 | (1,021 | ) | — | — | 2,042 | ||||||||||||||
|
(a)
|
Represents
currency translation adjustments and
reclasses.
|
|
(b)
|
Primarily
represents the elimination of accounts receivable and inventory deemed
uncollectible or worthless and providing warranty services to
customers.
|
|
(c)
|
Negative
amounts represent net recoveries of previously written-off receivables or
changes to inventory and warranty reserve estimates. In 2007, the Company
reversed $2.2 million in warranty reserves as described in Note 11 of the
Consolidated Financial Statements included in Part II, Item 8,
“Financial Statements and Supplementary
Data.”
|
|
(d)
|
Relates
to interest earned but unpaid on deposits held by Mexican tax authorities
for which the Company is uncertain of
recovery.
|
F -
36