Attached files
| file | filename |
|---|---|
| EX-31.2 - EXHIBIT 31.2 - OTELCO INC. | ex31-2.htm |
| EX-32.2 - EXHIBIT 32.2 - OTELCO INC. | ex32-2.htm |
| EX-21.1 - EXHIBIT 21.1 - OTELCO INC. | ex21-1.htm |
| EX-12.1 - EXHIBIT 12.1 - OTELCO INC. | ex12-1.htm |
| EX-32.1 - EXHIBIT 32.1 - OTELCO INC. | ex32-1.htm |
| EX-31.1 - EXHIBIT 31.1 - OTELCO INC. | ex31-1.htm |
| EX-10.13 - EXHIBIT 10.13 - OTELCO INC. | ex10-13.htm |
| EX-10.14 - EXHIBIT 10.14 - OTELCO INC. | ex10-14.htm |
UNITED
STATES
SECURITIES
AND EXCHANGE COMMISSION
Washington,
D.C. 20549
Form
10-K
|
x
|
ANNUAL
REPORT PURSUANT TO SECTION 13 OR 15(d) OF THE SECURITIES EXCHANGE ACT OF
1934
|
|
For
the Fiscal Year Ended December 31, 2009
|
|
|
OR
|
|
|
o
|
TRANSITION
REPORT PURSUANT TO SECTION 13 OR 15(d) OF THE SECURITIES EXCHANGE ACT
OF 1934
|
For
the Transition Period from to
Commission
File Number: 1-32362
|
OTELCO
INC.
(Exact
Name of Registrant as Specified in Its Charter)
|
||
|
Delaware
|
52-2126395
|
|
|
(State
or Other Jurisdiction of
Incorporation
or Organization)
|
(I.R.S.
Employer
Identification
No.)
|
|
|
505
Third Avenue East, Oneonta, Alabama
|
35121
|
|
|
(Address
of Principal Executive Offices)
|
(Zip
Code)
|
|
|
205-625-3574
|
||
|
(Registrant’s
Telephone Number, Including Area Code)
|
||
|
Securities
registered pursuant to Section 12(b) of the Act:
|
||
|
Title
of Each Class
|
Name
of Each Exchange on Which Registered
|
|
|
Income
Deposit Securities, each representing shares of
Class
A Common Stock and Senior Subordinated
Notes
due 2019
|
The
NASDAQ Stock Market LLC
|
|
Securities registered pursuant to Section 12(g) of
the Act: None
Indicate
by check mark if the registrant is a well-known seasoned issuer, as defined in
Rule 405 of the Securities Act. Yes o No
x
Indicate
by check mark if the registrant is not required to file reports pursuant to
Section 13 or Section 15(d) of the Act. Yes o No
x
Indicate
by check mark whether the registrant (1) has filed all reports required to be
filed by Section 13 or 15(d) of the Securities Exchange Act of 1934 during the
preceding 12 months (or for such shorter period that the registrant was required
to file such reports), and (2) has been subject to such filing requirements for
the past 90 days. Yes x No
o
Indicate
by check mark whether the registrant has submitted electronically and posted on
its corporate Web site, if any, every Interactive Data File required to be
submitted and posted pursuant to Rule 405 of Regulation S-T during the
preceding 12 months (or for such shorter period that the registrant was
required to submit and post such files). Yes o No
o
Indicate
by check mark if disclosure of delinquent filers pursuant to Item 405 of
Regulation S-K is not contained herein, and will not be contained, to the best
of registrant’s knowledge, in definitive proxy or information statements
incorporated by reference in Part III of this Form 10-K or any amendment to this
Form 10-K. x
Indicate
by check mark whether the registrant is a large accelerated filer, an
accelerated filer, a non-accelerated filer, or a smaller reporting company. See
the definitions of “large accelerated filer,” “accelerated filer” and “smaller
reporting company” in Rule 12b-2 of the Exchange Act. (Check one):
|
Large
accelerated filer o
|
Accelerated
filer x
|
Non-accelerated
filer o
|
Smaller
reporting company o
|
|
|
(Do
not check if a smaller reporting company)
|
Indicate
by check mark whether the registrant is a shell company (as defined in Rule
12b-2 of the Exchange Act). Yes o No
x
As
of June 30, 2009, the aggregate market value of the registrant’s Income Deposit
Securities (IDSs) held by non-affiliates of the registrant was $139.3 million
based on the closing sale price as reported on NASDAQ. Each IDS represents one
share of Class A Common Stock, par value $0.01 per share, and $7.50 principal
amount of senior subordinated notes due 2019. In determining the market value of
the registrant’s IDSs held by non-affiliates, IDSs beneficially owned by
directors, officers and holders of more than 10% of the registrant’s IDSs have
been excluded. This determination of affiliate status is not necessarily a
conclusive determination for other purposes.
As
of March 8, 2010, the registrant had 12,676,733 shares of Class A Common Stock,
par value $0.01 per share, and 544,671 shares of Class B Common Stock, par value
$0.01 per share, outstanding.
DOCUMENTS
INCORPORATED BY REFERENCE
Certain
information required in Part III of this report is incorporated by reference
from the registrant’s proxy statement to be filed pursuant to Regulation 14A
with respect to the registrant’s 2010 annual meeting of
stockholders.
OTELCO
INC.
TABLE
OF CONTENTS
i
Unless
the context otherwise requires, the words “we”, “us”, “our”, the “Company” and
“Otelco” refer to Otelco Inc., a Delaware corporation.
FORWARD-LOOKING
STATEMENTS
The
report contains forward-looking statements that are subject to risks and
uncertainties. Forward-looking statements give our current expectations relating
to our financial condition, results of operations, plans, objectives, future
performance and business. These statements may include words such as
“anticipate,” “estimate,” “expect,” “project,” “plan,” “intend,” “believe” and
other words and terms of similar meaning in connection with any discussion of
the timing or nature of future operating or financial performance or other
events. These forward-looking statements are based on assumptions that we have
made in light of our experience in the industry in which we operate, as well as
our perceptions of historical trends, current conditions, expected future
developments and other factors we believe are appropriate under the
circumstances. Although we believe that these forward-looking statements are
based on reasonable assumptions, you should be aware that many factors could
affect our actual financial condition or results of operations and cause actual
results to differ materially from those in the forward-looking statements. These
factors include, among other things, those discussed under the caption “Risk
Factors” in Item 1A.
History
We were
formed in Delaware in 1998 for the purpose of operating and acquiring rural
local exchange carriers, or RLECs. Since 1999, we have acquired ten RLEC
businesses, four of which serve contiguous territories in north central Alabama;
three of which serve territories adjacent to either Portland or Bangor, Maine;
one each which serve a portion of central Missouri, southern West Virginia and
western Massachusetts. We provide competitive services through several
subsidiaries in these territories. In addition, we acquired three facilities
based competitive local exchange carriers, or CLECs, which offer services as a
single entity in Maine and New Hampshire. The Company completed an initial
public offering of income deposit securities, or IDSs, in December 2004 at which
time it converted from a Delaware limited liability company into a Delaware
corporation and changed its name to Otelco Inc. In July 2007, the Company
completed an additional offering of 3,000,000 IDS units.
The
following table shows the aggregate number of our voice and data access lines
(which together are access line equivalents) and other services we offer such as
wholesale network connections, television, and other Internet customers as of
December 31, 2009:
|
Voice
and data access line equivalents
|
100,356 | |||
|
Wholesale
network connections
|
132,324 | |||
|
Cable
television customers
|
4,195 | |||
|
Other
Internet customers
|
9,116 |
The RLEC
companies we acquired can trace their history as local communications providers
to the introduction of telecommunications services in the areas they serve. We
are able to leverage our long-standing relationship with our local service
customers by offering them a broad suite of telecommunications and information
services, such as long distance, Internet/data access and, in some areas, cable
or satellite television, thereby increasing customer loyalty and revenue per
access line.
Our RLECs
have historically experienced relatively stable operating results and strong
cash flows and operate in supportive regulatory environments. Each RLEC
qualifies as a rural telephone company under the Federal Communications Act of
1934, or the Communications Act, so we are currently exempt from certain costly
interconnection requirements imposed on incumbent or historical local telephone
companies, or incumbent local exchange carriers, by the Communications Act.
While this exemption helps us maintain our strong competitive position, we do
have direct competition in portions of our RLEC market, primarily where another
cable provider also serves the same market. The cost of operations and capital
investment requirements for new entrants is high, discouraging such
investments.
In Maine
and New Hampshire, our facilities based CLEC serves primarily business
customers, utilizing our 296 mile fiber backbone network. In eleven years of
operations, the CLEC has grown to provide more than 32,000 voice and data access
lines.
Otelco
Telephone. On January 5, 1999, through Otelco Telephone LLC,
or Otelco Telephone, we acquired certain telecommunications businesses from
Oneonta Telephone Company, Inc., a rural local exchange carrier that serves a
portion of Blount county in Alabama. In connection with the transaction, we
acquired 8,127 voice and data access lines.
Hopper. On
September 30, 1999, we acquired Hopper Telecommunications Company, Inc., or
Hopper, a rural local exchange carrier that serves portions of Blount and Etowah
counties in Alabama. In connection with the transaction, we acquired 3,827 voice
and data access lines.
Brindlee
Mountain. On July 19, 2000, we acquired Brindlee Mountain
Telephone Company, or Brindlee, a rural local exchange carrier that serves
portions of Marshall, Morgan, Blount and Cullman counties in Alabama. In
connection with the transaction, we acquired 14,013 voice and data access
lines.
Blountsville. On
June 30, 2003, we acquired Blountsville Telephone Company, Inc., or
Blountsville, a rural local exchange carrier that serves a portion of Blount
county in Alabama. In connection with the transaction, we acquired 4,080 access
lines.
2
Mid-Missouri. On
December 21, 2004, we acquired Mid-Missouri Telephone Company, or Mid-Missouri,
a rural local exchange carrier that serves portions of Cooper, Moniteau, Morgan,
Pettis and Saline counties in central Missouri. In connection with the
transaction, we acquired approximately 4,585 voice and data access lines. In
addition, we provide Internet services in areas surrounding our
territory.
Mid-Maine. On July
3, 2006, we acquired Mid-Maine Communications, Inc., or Mid-Maine, a rural local
exchange carrier that serves portions of Penobscot, Somerset and Piscataquis
counties adjacent to Bangor, Maine and a competitive local exchange carrier,
serving customers adjacent to its fiber network along the I-95 corridor in
Maine. In connection with the transaction, we acquired approximately 22,413
voice and data access lines. In addition, we provide dial-up Internet services
throughout Maine.
Country Road. On
October 31, 2008, we acquired Pine Tree Holdings, Inc., Granby Holdings, Inc.
and War Holdings, Inc., which we collectively refer to as the CR Companies, from
Country Road Communications LLC. The three holding companies had four RLEC
operating subsidiaries: War Acquisition Corp., or War, serves areas in and
around War, West Virginia; The Granby Telephone and Telegraph Co. of Mass., or
Granby, serves areas in and around Granby, Massachusetts; and Saco River
Telegraph and Telephone Company, or Saco River, and The Pine Tree Telephone and
Telegraph Company, or Pine Tree, which collectively serve areas in and around
Buxton, Hollis, Waterboro, Gray and New Gloucester, Maine (adjacent to
Portland). There are also two CLEC subsidiaries providing services primarily to
business customers in Maine and New Hampshire – CRC Communications of Maine,
Inc. and Communications Design Acquisition Corporation, which we collectively
refer to as Pine Tree Networks. In connection with the transaction, we acquired
approximately 29,112 voice and data access lines and 93,994 wholesale network
connections.
The
following table reflects the percentage of total revenues derived from each of
our service offerings for the year ended December 31, 2009:
Revenue
Mix
|
Source
of Revenue
|
||||
|
Local
services
|
46.7 | % | ||
|
Network
access
|
32.1 | |||
|
Cable
television
|
2.4 | |||
|
Internet
|
13.5 | |||
|
Transport
services
|
5.3 | |||
|
Total
|
100.0 | % | ||
Local
Services
We are
the sole provider of wireline telephone services in seven of the ten RLEC
territories we serve. In the remaining three territories, the incumbent cable
provider also offers local services. Local services enable customers to
originate and receive telephone calls. The amount that we can charge a customer
for certain basic services in Alabama, Maine, Massachusetts, Missouri and West
Virginia is regulated by the Alabama Public Service Commission, or APSC; the
Maine Public Utilities Commission, or MPUC; the Massachusetts Department of
Telecommunications and Cable, or MDTC; the Missouri Public Service Commission,
or MPSC; and the West Virginia Public Service Commission, or WVPSC. We also have
authority to provide service in New Hampshire from the New Hampshire Public
Utilities Commission, or NHPUC. The regulatory involvement in pricing varies by
state and by type of service. Increasingly, bundled services involve less
regulation.
Revenue
derived from local services includes monthly recurring charges for voice access
lines providing local dial tone and calling features, including caller
identification, call waiting, call forwarding and voicemail. We also receive
revenue for providing long distance services to our customers, billing and
collection services for other carriers under contract, and directory
advertising. We provide local services on a retail basis to residential and
business customers. With the high level of acceptance of local service bundles,
a growing percentage of our customers receive a broad range of services,
including long distance, for a single, fixed monthly price.
We also
offer long distance telephone services to our local telephone customers who do
not purchase a local service bundle. We resell long distance services purchased
from various long distance providers. At December 31, 2009, customers
representing approximately 60% of our regulated access lines subscribed to our
long distance services. We intend to continue to expand our long distance
business within our rural local exchange carrier territories, principally
through bundling services for our local telephone customers.
3
In Maine and New Hampshire, our CLEC
provides communications services tailored to business customers, including
specialized data and voice network configurations, to support their unique
business requirements. Our fiber network in Maine allows us to offer our
customers affordable and reliable voice and data solutions to support their
business requirements and applications, which is a significant differentiator
for our Company in the competitive local exchange carrier environment in which
it operates. In connection with the acquisition of the CR Companies, the Company
acquired a multi-year contract with a large multiple system operator (“MSO”) for
the provision of wholesale network connections to the MSO’s customers in Maine
and New Hampshire. Various terms of the agreement were amended at the time of
the acquisition, including extending the contract through 2012. The customer
represented approximately 9.1% of the consolidated revenue for
2009.
We derive
revenue from other telephone related services, including leasing, selling,
installing, and maintaining customer premise telecommunications equipment and
the publication of local telephone directories in certain of our rural local
exchange carrier territories. We also provide billing and collection services
for interexchange carriers through negotiated billing and collection agreements
for certain types of toll calls placed by our local customers.
Network
Access
Network
access revenue relates primarily to services provided by us to long distance
carriers (also referred to as interexchange carriers) in connection with their
use of our facilities to originate and terminate interstate and intrastate long
distance, or toll, telephone calls. As toll calls are generally billed to the
customer originating the call, network access charges are applied in order to
compensate each telecommunications company providing services relating to the
call. Network access charges apply to both interstate and intrastate calls. Our
network access revenues also include revenues we receive from wireless carriers
for terminating their calls on our networks pursuant to our interconnection
agreements with those wireless carriers. Blountsville, Hopper, Mid-Maine,
Mid-Missouri, Pine Tree and War also receive Universal Service Fund High Cost
Loop, or USF HCL, revenue which is included in our reported network access
revenue.
Intrastate Access
Charges. We generate intrastate access revenue when a long
distance call involving a long distance carrier is originated and terminated
within the same state. The interexchange carrier pays us an intrastate access
payment for either terminating or originating the call. We record the details of
the call through our carrier access billing system. Our access charges for our
intrastate access services are set by the APSC, the MPUC, the MDTC, the MPSC,
the NHPUC, and the WVPSC for Alabama, Maine, Massachusetts, Missouri, New
Hampshire and West Virginia, respectively.
Interstate Access
Charges. We generate interstate access revenue when a long
distance call originates from an area served by one of our local exchange
carriers and terminates outside of that state, or vice versa. We bill interstate
access charges in a manner similar to intrastate access charges. Our RLEC
interstate access charges are regulated by the Federal Communications
Commission, or FCC, through our participation in tariffs filed by the National
Exchange Carriers Association, or NECA. The FCC regulates the prices local
exchange carriers charge for access services in two ways: price caps and
rate-of-return. All of our rural local exchange carriers are rate-of-return
carriers for purposes of interstate network access regulation. Interstate access
revenue for rate-of-return carriers is based on an FCC regulated rate-of-return
currently authorized up to 11.25% on investment and recovery of operating
expenses and taxes, in each case solely to the extent related to interstate
access.
Federal Universal Service Fund High
Cost Loop Revenue. Blountsville, Hopper, Mid-Maine,
Mid-Missouri, Pine Tree and War recover a portion of their costs through the USF
HCL, which is regulated by the FCC and administered by the Universal Service
Administrative Company, or USAC, a non-profit organization. Based on historic
and other information, a nationwide average cost per loop is determined by USAC.
Any incumbent local exchange carrier whose individual cost per loop exceeds the
nationwide average by more than 15% qualifies for USF HCL support. Although all
of our rural local exchange carriers have been designated as eligible
telecommunications carriers, or ETCs, Otelco Telephone, Brindlee, Granby and
Saco River do not receive USF HCL support because their cost per loop does not
exceed the national average by more than fifteen percent. The USF HCL, which is
funded by assessments on all United States telecommunications carriers as a
percentage of their revenue from end-users of interstate and international
service, distributes funds to our participating RLECs based upon their
respective costs for providing local services. USF HCL payments are received
monthly.
Transition Service Fund
Revenue. Otelco Telephone, Hopper, Brindlee, and Blountsville
recover a portion of their costs through the Transition Service Fund, or TSF,
which is administered by the APSC. All interexchange carriers originating or
completing calls in Alabama contribute to the TSF on a monthly basis, with the
amount of each carrier’s contribution calculated based upon its relative
originating and terminating minutes of use compared to the aggregate originating
and terminating minutes of use for all telecommunications carriers participating
in the TSF. The TSF reduces the vulnerability of our Alabama rural local
exchange carriers to a loss of access and interconnection revenue. TSF payments
are received monthly.
4
Maine Universal Service
Fund. Mid-Maine recovers a portion of its costs through the
Maine Universal Service Fund, or MUSF, which is administered by the
MPUC. All local and interexchange carriers in Maine contribute to the
MUSF on a monthly basis, with the amount of each carrier’s contribution
calculated based upon a percentage of retail intrastate revenues. The
MUSF was created to support RLEC universal service goals in response to
legislative mandates to reduce intrastate access rates.
Cable
Television Services
We
provide cable television services over networks with 750 MHz of transmission
capacity in the towns of Bunceton and Pilot Grove in Missouri, and in portions
of Blount and Etowah counties in Alabama. Our cable television packages offer
from 17 to 191 channels, depending upon the location in which the services are
offered. In December 2007, we upgraded our Alabama system to provide high
definition and digital video recording capability to our subscribers. In
December 2008, we completed the first phase of an Internet Protocol TV (IPTV)
expansion of our service in Alabama, offering a full set of programs to a
portion of the Blountsville service area. During 2009, we added three
communities within our Alabama service area. We are a licensed installer of
satellite television and have deployed these services to customers in our
Missouri territory.
Internet
Services
We
provide three forms of Internet access data lines to our customers: bulk
broadband data access to support large corporate users; digital high-speed data
lines in varying capacity speeds for business and residential use; and
residential dial-up connectivity. Digital high-speed Internet access is provided
via digital subscriber line, or DSL, cable modems or wireless broadband,
depending upon the location in which the service is offered and via dedicated
fiber connectivity to larger business customers. We charge our Internet
customers a flat rate for unlimited Internet usage and a premium for higher
speed Internet services. We are able to provide digital high-speed Internet data
lines to over 90% of our RLEC access lines and all of our CLEC lines. We intend
to expand the availability of our high-speed Internet services as warranted by
customer demand by installing additional DSL equipment at certain switching
locations. In Maine and Missouri, we provide dial-up Internet services
throughout the state.
Transport
Services
Our CLECs
receive monthly recurring revenues for the rental of fiber to transport data and
other telecommunications services in Maine from businesses and
telecommunications carriers along their fiber route. In 2009, we expanded this
network to over 296 miles.
Network
Assets
Our
telephone networks include carrier grade advanced switching capabilities
provided by traditional digital as well as software based switches; fiber rings
and routes; and network software supporting specialized business applications,
all of which meet industry standards for service integrity, redundancy,
reliability and flexibility. Our networks enable us to provide switched wireline
telephone services and other calling features; long distance services; digital
Internet access services through DSL and cable modems and dedicated circuits;
and specialized customer specific applications.
Our cable
television networks in Alabama and Missouri have been upgraded to a transmission
capacity of 750 MHz. Our cable television system in Alabama was upgraded in 2007
to deliver digital signals, high-definition program content and digital video
recording capability. IPTV capability was added in 2008 and its coverage
expanded to additional communities in 2009.
Sales,
Marketing & Customer Service
In Maine
and New Hampshire, our CLEC competes with the incumbent carriers throughout each
state, utilizing both an employee and agent sales force. Service configurations
are tailored to meet specific customer requirements, utilizing customer designed
voice and data telecommunications configurations. Increased service monitoring
for business customers is provided through a state of the art network operations
center and serves as a differentiator for our offers. Currently, we plan to
introduce the Otelco Inc. brand to replace the existing Mid-Maine and Pine Tree
brand names in our markets in 2010.
5
Our RLEC
marketing approach emphasizes locally managed, customer-oriented sales,
marketing and service. We believe that we are able to differentiate ourselves
from any competition by providing a superior level of service in our
territories. Each of our RLECs has a long history in the communities it serves,
which has helped to enhance our reputation among local residents by fostering
familiarity with our products and level of service. To demonstrate our
commitment to the markets we serve, we maintain local offices in most of the
population centers within our service territories. While customers have the
option of paying their bills by mail, credit card or automatic withdrawal from
their bank account, many elect to pay their monthly bill in person at the local
office. This provides us with an opportunity to directly market our services to
our existing customers. These offices typically are staffed by local residents
and provide sales and customer support services in the community. Local offices
facilitate a direct connection to the community, which we believe improves
customer satisfaction and enhances our reputation with local residents. We also
build upon our strong reputation by participating in local activities, such as
local fund raising and charitable events for schools and community organizations
and by airing local interest programs on our local access community cable
channels.
In order
to capitalize on the strong branding of each of our rural local exchange
carriers, while simultaneously establishing and reinforcing the “Otelco” brand
name across our service territories, we identify both the historical name of the
RLEC and Otelco on our marketing materials and other customer communications.
Part of our strategy is to increase customer loyalty and strengthen our brand
name by deploying new technologies and by offering comprehensive bundling of
services, including digital high-speed Internet access, cable and satellite
television, long distance and a full array of calling features. In addition, our
ability to provide our customers with a single, unified bill for all of our
services is a major competitive advantage and helps to enhance customer
loyalty.
Competition
Local
Services
We
believe that many of the competitive threats now confronting larger telephone
companies are not as significant in our RLEC service areas. The demographic
characteristics of rural telecommunications markets generally require
significant capital investment to offer competitive wireline telephone services
with low potential revenues. For instance, the per minute cost of operating both
telephone switches and interoffice facilities is higher in rural areas than in
urban areas, because rural local exchange carriers typically have fewer, more
geographically dispersed customers and lower calling volumes. Furthermore, the
distance from the telephone switch to the customer is typically longer in rural
areas, which results in increased distribution facilities costs that tend to
discourage wireline telephone competitors from entering territories serviced by
rural local exchange carriers. As a result, rural local exchange carriers
generally do not face the threat of significant wireline telephone competition
except in markets where a cable company provides existing services. We face
current or future direct competition from cable providers in portions of four of
our ten RLEC territories. New market entrants, such as providers of satellite
broadband or voice over electric lines and indirect competition such as voice
over Internet protocol, or VoIP, may gain traction in the future.
We
currently qualify for the rural exemption from certain interconnection
obligations which support industry competition, including obligations to provide
services for resale at discounted wholesale prices and to offer unbundled
network elements. If the APSC, MPUC, MDTC, NHPUC, MPSC or WVPSC terminates this
exemption for our rural local exchange carriers, we may face competition from
resellers and other wireline carriers.
In our
markets, we face competition from wireless carriers. We have experienced a
decrease in access lines as a result of customers switching their residential
wireline telephone service to a wireless service. We have also experienced an
increase in network access revenue associated with terminating wireless calls on
our telephone network. The introduction of residential bundled offerings
including unlimited calling appears to have shifted additional minutes back from
wireless. A portion of the wireless technology threat to our business is reduced
due in part to the topography of our telephone territories and current
inconsistent wireless coverage. However, as wireless carriers continue to employ
new technologies, we may experience increased competition from these
carriers.
The long
distance market remains competitive in all of our rural local exchange carrier
territories. We compete with major national and regional interexchange carriers,
including AT&T and Verizon, as well as wireless carriers, and other service
providers. However, we believe that our position as the rural local exchange
carrier in our territories, our long-standing local presence in our territories
and our ability to provide a single, unified bill for all of our services, are
major competitive advantages. At December 31, 2009, more than 60% of our
regulated access lines subscribed to our long distance services. The majority of
our CLEC customers have also selected us for their long distance services as
part of their overall package of services.
6
In
addition, under the Communications Act, a competitor can obtain USF HCL support
if a state public service commission (or the FCC in certain instances)
determines that it would be in the public interest and designates such
competitor as an ETC. While access to USF HCL support by our competitors
currently would not reduce our current USF HCL revenue, such economic support
could facilitate competition in our RLEC territories, particularly from wireless
carriers. The FCC is currently considering ways to reform USF HCL which could
impact amounts paid to and received from, as well as eligibility for payments
from, USF HCL.
In Maine
and New Hampshire, we operate as a facilities based competitive local exchange
carrier in a number of the larger metropolitan areas primarily currently served
by FairPoint Communications as the incumbent local exchange carrier. There are
other competitors who serve these markets today as both facilities based and
resale carriers. Our focus has been on the small to medium size business
customer with multiple locations and enterprise telecommunications requirements,
where we offer a combination of knowledge, experience and competitive pricing to
meet their specialized needs.
Cable
Television Services
We offer
cable television services in select areas of our territories and are a licensed
agent for a satellite provider. In 2008, we installed IPTV capability in the
Alabama territory not currently served by our cable operations. No provider has
overbuilt cable facilities in the areas we currently serve. In our Alabama
territory, Charter Communications, Inc. provides cable service, passing about
30% of our subscribers. In Maine, Time Warner Cable provides cable service,
passing approximately 60% of our RLEC subscribers. In addition, in all of our
cable television territories, we compete against digital broadcast satellite
providers including Dish Network and DirecTV.
Internet
Services
Competition
in the provision of RLEC data lines and Internet services currently comes from
alternative digital high-speed Internet service providers. Competitors vary on a
market-to-market basis and include Charter Communications, Inc., Time Warner
Cable, and a number of small, local competitors. At December 31, 2009, we
provided data access lines to approximately 41% of our rural access lines. In
Maine and Missouri, we also provide high-speed data lines and dial-up Internet
services to approximately 9,100 subscribers outside of our rural telephone
services territory. Our CLEC customers are provided a variety of data access
options, based on their individual requirements.
Transport
Services
Other
local telephone companies, long distance carriers, cable providers, utilities,
governments, and industry associations deploy and sell fiber capacity to users.
Existing and newly deployed capacity could be made available, impacting market
pricing. Multi-year contracts generally protect existing relationships and
provide revenue stability. The cost of and time required for deploying new fiber
can be a deterrent to adding capacity. We have expanded our fiber network in
Maine to reach additional locations and serve incremental
customers.
Information
Technology and Support Systems
We have
integrated software systems that function as operational support and customer
care/billing systems. One system serves our Alabama and Missouri local exchange
subscribers, one serves our additional Internet subscribers in Missouri, and one
serves our Maine, Massachusetts, New Hampshire and West Virginia subscribers.
The systems include automated provisioning and service activation, mechanized
line records and trouble reporting. These services are provided through the use
of licensed third-party software. By utilizing integrated software systems, we
are able to reduce individual company costs and standardize functions resulting
in greater efficiencies and profitability.
Each
system allows us to provide a single, unified bill for all our services which we
believe is a significant competitive advantage. Additionally, the systems
provide us an extensive database that enables us to gather detailed marketing
information in our service territories. This capability allows us to market new
services as they become available to particular customers. The Company has
implemented all currently established safeguards to Customer Proprietary Network
Information (CPNI) as established by the FCC for telecommunications providers
and is compliant with the “red flag” provisions of the Fair and Accurate Credit
Transactions Act.
Environment
We are
subject to various federal, state and local laws relating to the protection of
the environment. We believe that we are in compliance in all material respects
with all such laws. The environmental compliance costs incurred by us to date
have not been material, and we currently have no reason to believe that such
costs will become material in the foreseeable future.
7
Employees
As of
December 31, 2009, we employed 292 full-time and 7 part-time employees. None of
our employees are members of, or are represented by, any labor union or other
collective bargaining unit. We consider our relations with our employees to be
good.
Available
Information
Under the
Securities Exchange Act of 1934, we are required to file with or furnish to the
Securities and Exchange Commission, or SEC, annual, quarterly and current
reports, proxy and information statements and other information. You may read
and copy any document we file with or furnish to the SEC at the SEC’s Public
Reference Room at 100 F Street, N.E., Washington, D.C. 20549. Please call the
SEC at 1-800-SEC-0330 for further information about the Public Reference Room.
The SEC maintains a web site at http://www.sec.gov that
contains reports, proxy and information statements, and other information
regarding issuers that file electronically with the SEC. We file electronically
with the SEC.
We make
available, free of charge, through the investor relations section of our web
site, our reports on Forms 10-K, 10-Q and 8-K, and amendments to those reports,
as soon as reasonably practicable after they are filed with the SEC. The address
for our web site is
http://www.OtelcoInc.com.
Our Code
of Ethics applies to all of our employees, officers and directors, including our
chief executive officer and our chief financial officer and principal accounting
officer. The full text of the Code of Ethics is available at the investor
relations section of our web site, http://www.OtelcoInc.com. We
intend to disclose any amendment to, or waiver from, a provision of the Code of
Ethics that applies to our chief executive officer or chief financial officer
and principal accounting officer in the investor relations section of our web
site.
The
information contained on our web site is not part of, and is not incorporated
in, this or any other report we file with or furnish to the SEC.
In
evaluating our business, every investor should carefully consider the following
risks. Our business, financial condition or results of operation could be
materially adversely affected by any of the following risks.
Our
Business is Geographically Concentrated and Dependent on Regional Economic
Conditions.
Our
business is conducted primarily in north central Alabama, Maine, New Hampshire,
western Massachusetts, central Missouri and southern West Virginia and,
accordingly, our business is dependent upon the general economic conditions of
these regions. There can be no assurance that future economic conditions in
these regions, including the current global economic recession, will not impact
demand for our services or cause residents to relocate to other regions, which
may adversely impact our business, revenue and cash flow.
The
Telecommunications Industry has Experienced Increased Competition.
Although
we have historically experienced limited wireline telephone competition in many
of our RLEC territories, the market for telecommunications services is highly
competitive. Certain competitors benefit from brand recognition and financial,
personnel, marketing and other resources that are significantly greater than
ours. We cannot predict the number of competitors that will emerge, especially
as a result of existing or new federal and state regulatory or legislative
actions. Increased competition from existing and new entities could have an
adverse effect on our business, revenue and cash flow.
In all of
our markets, we face competition from wireless carriers, including the potential
for customers to export existing wireline telephone numbers to wireless service.
Our unlimited calling bundles provide our customers with an alternative to using
cell phones. As wireless carriers continue to build-out their networks and add
products and services aimed at the fixed wireless market, we may experience
increased competition, which could have an adverse effect on our business,
revenue and cash flow.
The
current and potential competitors in our RLEC territories include cable
television companies; competitive local exchange carriers and other providers of
telecommunications and data services, including Internet and VoIP service
providers; wireless carriers; satellite television companies; alternate access
providers; neighboring incumbent local exchange carriers; long distance
companies and electric utilities that may provide services competitive with
those products and services that we provide or intend to provide.
8
In Maine
and New Hampshire, our competitive local exchange carrier operations may
encounter a change in the competitive landscape that would impact its continued
ability to grow and/or retain customers, sustain current pricing plans, and
control the cost of access to incumbent carrier customers.
Although
our long distance operations have historically been modest in relation to our
competitors, we have expanded our long distance business within our territories,
primarily through bundling long distance with other local services and providing
a single bill for these services. Our existing long distance competitors,
including those with significantly greater resources than us, could respond to
such initiatives and new competitors may enter the market with attractive
offerings. There can be no assurance that our local services revenue, including
long distance services, will not decrease in the future as competition and/or
the cost of providing services increase.
We
May Not be Able to Integrate New Technologies and Provide New Services in a
Cost-Efficient Manner.
The
telecommunications industry is subject to rapid and significant changes in
technology, frequent new service introductions and evolving industry standards.
We cannot predict the effect of these changes on our competitive position, our
capital expenditure requirements, our profitability or the industry generally.
Technological developments may reduce the competitiveness of our networks and
require additional capital expenditures or the procurement of additional
products that could be expensive and time consuming. In addition, new products
and services arising out of technological developments may reduce the
attractiveness of our services. If we fail to adapt successfully to
technological advances or fail to obtain access to new technologies, we could
lose customers and be limited in our ability to attract new customers and/or
sell new services to our existing customers. In addition, delivery of new
services in a cost-efficient manner depends upon many factors, and we may not
generate the revenue anticipated from such services.
Disruptions
in Our Networks and Infrastructure May Cause Us to Lose Customers and Incur
Additional Expenses.
To be
successful, we will need to continue to provide our customers with reliable and
timely service over our networks. We face the following risks to our networks
and infrastructure:
|
●
|
our
territories could have significant weather events which physically damage
access lines;
|
|
●
|
our
rural geography creates the risk of security breaches, break-ins and
sabotage;
|
|
●
|
power
surges and outages, computer viruses or hacking, and software or hardware
defects which are beyond our control;
and
|
|
●
|
unusual
spikes in demand or capacity limitations in our or our suppliers’
networks.
|
Disruptions
may cause interruptions in service or reduced capacity for customers, either of
which could cause us to lose customers and/or incur expenses, and thereby
adversely affect our business, revenue and cash flow. In addition, the APSC,
MPUC, MDTC, MPSC, NHPUC and/or WVPSC could require us to issue credits on
customer bills for such service interruptions, further impacting revenue and
cash. Wholesale network contracts could impose service level penalties for
service disruptions.
Our
Success Depends on a Small Number of Key Personnel.
Our
success depends on the personal efforts of a small group of skilled employees
and senior management. The rural nature of our service area provides for a
smaller pool of skilled telephone employees and increases the challenge of
hiring employees. The loss of key personnel could have a material adverse effect
on our financial performance.
We
Provide Services to Our Customers Over Access Lines, and if We Lose Access
Lines, Our Business and Results of Operations May Be Adversely
Affected.
Our
business generates revenue by delivering voice and data services over access
lines. We have experienced net voice access line loss in our RLEC territories
due to challenging economic conditions, wireless substitution, loss of second
lines when we sell data access lines for Internet and increased competition.
RLEC voice access lines declined by approximately 6.4% during 2009. We expect to
continue to experience net voice access line loss in our rural markets, which
will be partially offset by increases in data access lines. If voice access line
losses are not substantially offset by data access line gains, it could
adversely affect our business and results of operations.
9
Our
Performance Is Subject to a Number of Other Economic and Non-Economic Factors,
Which We May Not Be Able to Predict Accurately.
There are
factors that may be beyond our control that could affect our operations and
business. Such factors include adverse changes in the conditions in the specific
markets for our products and services, the conditions in the broader market for
telecommunications services and the conditions in the domestic and global
economies, generally.
Although
our performance is affected by the general condition of the economy, not all of
our services are affected equally. Voice access revenue is generally linked to
relatively consistent variables such as population changes, housing starts and
general economic activity levels in the areas served. Data access and cable
television revenue is generally related to more variable factors such as
changing levels of discretionary spending on entertainment, the adoption of
e-commerce and other on-line activities by our current or prospective customers.
It is not possible for management to accurately predict all of these factors and
the impact of such factors on our performance.
Changes
in the competitive, technological and regulatory environments may also impact
our ability to increase revenue and/or earnings from the provision of local
wireline services. We may therefore have to place increased emphasis on
developing and realizing revenue through the provision of new and enhanced
services with higher growth potential. In such a case, there is a risk that
these revenue sources as well as our cost savings efforts through further
efficiency gains will not grow or develop at a fast enough pace to offset
slowing growth in local services. It is also possible that as we invest in new
technologies and services, demand for those new services may not develop. There
can be no assurance that we will be able to successfully expand our service
offerings through the development of new services, and our efforts to do so may
have a material adverse effect on our financial performance.
Changes
in the Regulation of the Telecommunications Industry Could Adversely Affect Our
Business, Revenue or Cash Flow.
We
operate in an industry that is regulated at the federal, state and local level.
The majority of our revenue has historically been supported by and subject to
regulation. Certain federal and state regulations and local franchise
requirements have been, are currently, and may in the future be, the subject of
judicial proceedings, legislative hearings and administrative proposals. Such
proceedings may relate to, among other things, the rates we may charge for our
local, network access and other services, the manner in which we offer and
bundle our services, the terms and conditions of interconnection, federal and
state universal service funds (including USF HCL), unbundled network elements
and resale rates, and could change the manner in which telecommunications
companies operate. We cannot predict the outcome of these proceedings or the
impact they will have on our business, revenue and cash flow.
Governmental
Authorities Could Decrease Network Access Charges or Rates for Local Services,
Which Would Adversely Affect Our Revenue.
Approximately
10.8% of our revenue for the year ended December 31, 2009 was derived from
interstate network access charges paid by long distance carriers for use of our
facilities to originate and terminate interstate and intrastate telephone calls.
The interstate network access rates that we can charge are regulated by the FCC,
and the intrastate network access rates that we can charge are regulated by the
regulatory commissions in each state in which we operate. Those rates may change
from time to time. The FCC has reformed and continues to reform the federal
network access charge system. It is unknown at this time what additional
changes, if any, the FCC or state regulatory commissions may adopt. Such
regulatory developments could adversely affect our business, revenue and cash
flow.
The local
services rates and intrastate access fees charged by our rural local exchange
carriers are regulated by state regulatory commissions which have the power to
grant and revoke authorization to companies to provide telecommunications
services and to impose other conditions and penalties. If we fail to comply with
regulations set forth by the state regulatory commissions, we may face
revocation of our authorizations in a state or other conditions and penalties.
It is possible that new plans would require us to reduce our rates, forego
future rate increases, provide greater features as part of our basic service
plan or limit our rates for certain offerings. We cannot predict the ultimate
impact, if any, of such changes on our business, revenue and cash
flow.
Our RLECs
operating in Maine, Missouri and West Virginia charge rates for local services
and intrastate access service based in part upon a rate-of-return authorized by
the state regulatory commissions. These authorized rates are subject to audit at
any time and may be reduced if the regulatory commission finds them excessive.
If any company is ordered to reduce its rates or if its applications to increase
rates are denied or delayed, our business, revenue and cash flow may be
negatively impacted.
10
NECA may
file revisions to its average schedule formula each year which are subject to
FCC approval. Five of our companies participate in average schedule rates. The
level of funding and future changes in the average schedule settlement rates are
not currently known with certainty and could be higher or lower.
A
Reduction in Universal Service Fund High Cost Loop Support Would Adversely
Affect Our Business, Revenue and Cash Flow.
Six of
our RLECs receive federal USF HCL revenue to support their high cost of
operations. Such support payments represented approximately 7.4% of our revenue
for the year ended December 31, 2009, and were based upon each participating
rural local exchange carrier’s average cost per loop as compared to the national
average cost per loop. These support payments fluctuate based upon the
historical costs of our participating rural local exchange carriers as compared
to the national average cost per loop. Each year, the average cost per loop has
increased, putting pressure on the USF HCL funds received by our companies to
the extent that our costs do not increase at the same rate. If our participating
rural local exchange carriers are unable to receive support from the USF HCL, or
if such support is reduced, our business, revenue and cash flow would be
negatively affected.
On May
16, 2006, the FCC released an order extending the current high-cost universal
support rules until the FCC adopts changes, if any, to these rules. The outcome
of any future FCC proceedings and other regulatory or legislative changes could
affect the amount of USF HCL support that we receive, and could have an adverse
effect on our business, revenue and cash flow. If a wireless or other
telecommunications carrier receives ETC status in our service areas or even
outside of our service areas, the amount of support we receive from the USF HCL
could decline under current rules, and under some proposed USF HCL rule changes,
could be significantly reduced.
USAC
serves as the administrative agent to collect data and distribute funds for USF.
In 2006, it began conducting High Cost Beneficiary audits, designed to ensure
compliance with FCC rules and program requirements and to assist in program
compliance. Carriers are chosen from a random sample of each type of ETC,
including average schedule and cost companies, incumbents and competitors, rural
and non-rural, from various states. Audits are designed to ensure proper
designation of a carrier as ETC, accuracy of data submissions, documentation of
accounting procedures, physical inventory of assets, true-up of projected data,
and samples of detailed documentation (e.g., invoices, continuing property
records). Audits of Blountsville, Hopper, Otelco Telephone and Brindlee Mountain
Telephone, during 2007 and 2008, have been completed and no material action is
pending. Granby was selected for audit in January 2008. The audit firm
subsequently withdrew from the audit and USAC has not replaced the auditor.
These audits are being conducted widely across our industry as directed by the
FCC. Currently, there is no guidance on the likelihood of the continuation of
the audit process currently available.
If
We Were to Lose Our Protected Status Under Interconnection Rules, We Would Incur
Additional Administrative and Regulatory Expenses and Face More
Competition.
As a
“rural telephone company” under the Communications Act, each of our RLECs is
exempt from the obligation to lease its unbundled facilities to competitive
local exchange carriers, to offer retail services at wholesale prices for
resale, to permit competitive co-location at its facilities and to comply with
certain other requirements applicable to larger incumbent local exchange
carriers. However, we eventually may be required to comply with these
requirements in some or all of our service areas if: (i) we receive a bona fide
request from a telecommunications carrier; and (ii) the state regulatory
commissions, as applicable, determine that it is in the public interest to
impose such requirements. In addition, we may be required to comply with some or
all of these requirements in order to achieve greater pricing flexibility from
state regulators. If we are required to comply
with these requirements, we could incur additional administrative and regulatory
expenses and face more competition which could adversely affect our business,
revenue and cash flow.
Our
Current Dividend Policy May Negatively Impact Our Ability to Maintain or Expand
Our Network Infrastructure and Finance Capital Expenditures or
Operations.
Our board
of directors has adopted a dividend policy pursuant to which substantially all
of the cash generated by our business in excess of operating needs, interest and
principal payments on indebtedness, and capital expenditures sufficient to
maintain our network infrastructure, would in general be distributed as regular
quarterly cash dividends to the holders of our Class A common stock and not
retained by us. As a result, we may not have a sufficient amount of cash to fund
our operations in the event of a significant business downturn, finance growth
of our network or unanticipated capital expenditure needs. We may have to forego
growth opportunities or capital expenditures that would otherwise be necessary
or desirable if we do not find alternative sources of financing or if we do not
modify our dividend policy. If we do not have sufficient cash for these
purposes, our financial condition and our business will suffer or our board of
directors may change our dividend policy. Our Class B common stockholders have
notified us of their intent to exchange their Class B shares for income deposit
securities during 2010, which will increase the number of Class A shares with a
resultant increase in dividend cost within the current policy.
11
We
Are Subject to Restrictive Debt Covenants That Limit Our Business Flexibility By
Imposing Operating and Financial Restrictions on Our Operations.
The
agreements governing our indebtedness impose significant operating and financial
restrictions on us. These restrictions prohibit or limit, among other
things:
|
●
|
the
incurrence of additional indebtedness and the issuance of preferred stock
and certain redeemable capital
stock;
|
|
●
|
the
making of certain types of restricted payments, including investments and
acquisitions;
|
|
●
|
specified
sales of assets;
|
|
●
|
specified
transactions with affiliates;
|
|
●
|
the
creation of a number of liens;
|
|
●
|
consolidations,
mergers and transfers of all or substantially all of our assets;
and
|
|
●
|
our
ability to change the nature of our
business.
|
None.
Our
property consists primarily of land and buildings; central office, Internet and
cable equipment; computer software; telephone lines; and related equipment. Our
telephone lines include aerial and underground cable, conduit, poles and wires.
Our central office equipment includes digital and software defined switches,
Internet and other servers and related peripheral equipment. We own
substantially all our real property in Alabama and Missouri, including our
corporate office. We primarily lease property in Maine, Massachusetts and West
Virginia, including our primary office locations in Bangor, New Gloucester and
Portland, Maine; Granby, Massachusetts; and War, West Virginia. We also lease
certain other real property, including land in Oneonta, Alabama, pursuant to a
long-term, renewable lease. A small portion of our Alabama cable television
service equipment is located on this leased property. As of December 31, 2009,
our property and equipment consisted of the following:
|
(In
Thousands)
|
||||
|
Land
|
$ | 1,105 | ||
|
Buildings
and improvements
|
11,354 | |||
|
Telephone
equipment
|
205,839 | |||
|
Cable
television equipment
|
9,628 | |||
|
Furniture
and equipment
|
2,889 | |||
|
Vehicles
|
5,554 | |||
|
Computer
software and equipment
|
13,315 | |||
|
Internet
equipment
|
3,426 | |||
|
Total
property and equipment
|
253,110 | |||
|
Accumulated
depreciation
|
(184,081 | ) | ||
|
Net
property and equipment
|
$ | 69,029 | ||
12
Our
senior credit facility is secured by substantially all of the assets of our
subsidiaries that are guarantors of the senior credit facility. As of December
31, 2009, the subsidiary guarantors represent $57.8 million of the $69.0 million
in net property and equipment.
From time
to time, we may be involved in various claims, legal actions and regulatory
proceedings incidental to and in the ordinary course of business, including
administrative hearings of the APSC, MPUC, MDTC, MPSC, NHPUC, and WVPSC relating
primarily to rate making and customer service requirements. Currently, none of
the legal proceedings are expected to have a material adverse effect on our
business.
The
following table sets forth the names and positions of our executive officers and
certain other officers, and their ages as of December 31, 2009.
|
Name
|
Age
|
Position
|
||
|
Michael
D. Weaver
|
57
|
President,
Chief Executive Officer and Director
|
||
|
Curtis
L. Garner, Jr.
|
62
|
Chief
Financial Officer
|
||
|
Dennis
Andrews
|
53
|
Senior
Vice President and General Manager, Alabama
|
||
|
Jerry
C. Boles
|
57
|
Vice
President and Controller
|
||
|
Gary
B. Romig
|
59
|
Vice
President and General Manager, Missouri
|
||
|
Nicholas
A. Winchester
|
40
|
Senior
Vice President and General Manager, New England
|
||
|
Robert
J. Souza
|
56
|
Vice
President of Operations, New
England
|
Michael D. Weaver has served
as our President, Chief Executive Officer and a Director since January 1999.
Prior to this time, he spent 10 years with Oneonta Telephone Co., Inc., the
predecessor to Otelco Telephone, serving as Chief Financial Officer from 1990 to
1998 and General Manager from January 1998 to January 1999.
Curtis L. Garner, Jr. has
served as our Chief Financial Officer since February 2004. Prior to this
position, he provided consulting services to a number of businesses and
not-for-profit organizations from October 2002. He served PTEK
Holdings, Inc. from November 1997 through September 2002 (including one year as
a consultant), first as President of one of its divisions, and later as Chief
Administrative Officer for another division. Prior thereto, he spent 26 years at
AT&T Corp., retiring in 1997 as the Chief Financial Officer of the Southern
and Southwestern Regions of AT&T Corp.’s consumer long distance
business.
Dennis Andrews was appointed
Senior Vice President and General Manager of our Alabama division in August
2006. He served as our Vice President and General Manager, Brindlee and
Blountsville since November 2005 and Vice President — Regulatory
Affairs since July 2000. Prior to this position, he spent 21 years at Brindlee
where he held several positions, including Vice President — Finance,
General Manager, Operations Manager and Accounting Department
Manager.
Jerry C. Boles has served as
our Vice President and Controller since he joined the Company in January 1999.
Prior to joining Otelco, he was controller for McPherson Oil Company for 14
years. He also worked in public accounting for 10 years, is licensed as a CPA by
the state of Alabama, and is a member in good standing of the American Institute
of Certified Public Accountants.
Gary B. Romig has served as
our Vice President and General Manager of our Missouri division since its
acquisition in December 2004. He served as Co-President of Mid-Missouri for five
years prior to the acquisition by Otelco. He joined Mid-Missouri in May 1973 and
has been involved in all aspects of the outside plant operation.
Nicholas A. Winchester joined
Otelco in July 2006 as the Senior Vice President and General Manager of our New
England division (previously known as our Maine division). He served as the
President of Mid-Maine when it was acquired by Otelco. From 1998 through 2005,
he served in various leadership positions in the sales organization, building
the successful competitive sales team for Mid-Maine.
13
Robert J. Souza joined Otelco
in October 2008 as the Vice President of Operations for New England. He served
as President for the CR Companies from 2001 until they were acquired by Otelco
in October 2008. Prior to that role, he served as Operations Manager for Saco
River, having joined that company in 1983. His 34 years experience in the
industry includes three years with Ooltewah-Collegedale Telephone Company in
Tennessee and five years with New England Telephone in Maine.
Officers
are not elected for a fixed term of office but hold their position until a
successor is named.
14
Market
Information
We have
outstanding two separate classes of common stock, our Class A common stock, par
value $0.01 per share, and our Class B common stock, par value $0.01 per
share.
Our IDSs,
each representing one share of Class A common stock and $7.50 principal amount
of senior subordinated notes due 2019, began trading on the American Stock
Exchange, or AMEX, under the symbol “OTT” and on the Toronto Stock Exchange, or
TSX, under the symbol “OTT.un” on December 16, 2004. On June 30, 2008, the
Company voluntarily withdrew its listing on the AMEX and began trading on the
NASDAQ Global Market, or NASDAQ, continuing to use the symbol “OTT”. During this
period, our IDSs continued to trade on the TSX. The high and low for the IDSs on
the AMEX and NASDAQ, as applicable, during the quarters indicated are as
follows:
|
High
($US)
|
Low
($US)
|
|||||||
|
2009
|
||||||||
|
Fourth
Quarter
|
$ | 15.76 | $ | 12.74 | ||||
|
Third
Quarter
|
$ | 13.34 | $ | 10.90 | ||||
|
Second
Quarter
|
$ | 13.24 | $ | 9.41 | ||||
|
First
Quarter
|
$ | 9.55 | $ | 7.70 | ||||
|
2008
|
||||||||
|
Fourth
Quarter
|
$ | 14.27 | $ | 6.79 | ||||
|
Third
Quarter
|
$ | 16.50 | $ | 12.50 | ||||
|
Second
Quarter
|
$ | 17.23 | $ | 13.61 | ||||
|
First
Quarter
|
$ | 18.20 | $ | 14.00 | ||||
There is
no established trading market for our Class B common stock. The Class B common
stock became exchangeable for IDS units on a one-for-one basis without a
financial test after December 21, 2009. On December 30, 2009, the holders of the
Class B shares notified the Company of their desire to exchange their Class B
shares for IDS units in accordance with the Investor Rights Agreement dated as
of December 21, 2004.
Holders
As of
March 8, 2010, there were approximately 14,500 record holders of our IDSs.
Holders of our IDSs have the right to separate the IDSs into the shares of Class
A common stock and senior subordinated notes represented thereby. As of the date
of this report, no holder has elected to separate the IDSs.
As of
March 8, 2010, there were approximately 10 record holders of our Class B common
stock.
Dividends
The board
of directors declared and the Company paid dividends of $0.17625 per Class A
common share each quarter in 2007, 2008 and 2009 for a total of $0.705 per share
for each year. The dividend in the fourth quarter of 2006 was paid on January 2,
2007. For 2007, $0.02 of the dividend was considered qualified for holder tax
purposes and the balance was considered a non-taxable return of capital. For
2008 and 2009, all of the dividends were considered a non-taxable return of
capital. The Company has paid dividends each quarter since the completion of its
initial public offering in December 2004.
The
payment of dividends on our Class B common stock is prohibited by our
certificate of incorporation. As such, we have never declared or paid cash
dividends on our Class B common stock, nor do we intend to declare or pay cash
dividends on our Class B common stock. Class B stockholders have requested that
their Class B shares be exchanged for IDS units during 2010.
15
Our board
of directors has adopted a dividend policy for our Class A common stock pursuant
to which, in the event and to the extent we have any available cash for
distribution to the holders of shares of our Class A common stock and subject to
applicable law and the terms of our credit facility, the indenture governing our
senior subordinated notes and any other then outstanding indebtedness of ours,
our board of directors will declare cash dividends on our Class A common stock.
Our dividend policy reflects a basic judgment that our stockholders would be
better served by distributing available cash in the form of dividends rather
than retaining it. Under this dividend policy, cash generated by our business in
excess of operating needs, interest and principal payments on indebtedness,
capital expenditures and income taxes, if any, would in general be distributed
as regular quarterly dividends to the holders of our Class A common stock rather
than retained by us as cash on our consolidated balance sheet. In determining
our expected dividend levels, we review and analyze, among other things, our
operating and financial performance; the anticipated cash requirements
associated with our capital structure; our anticipated capital expenditure
requirements; our expected other cash needs; the terms of our debt instruments,
including our credit facility; other potential sources of liquidity; and various
other aspects of our business. If these factors change, the board would need to
reassess our dividend policy.
As
described more fully below, holders of our Class A common stock may not receive
any dividends as a result of the following factors:
|
●
|
nothing
requires us to pay dividends;
|
|
●
|
while
our current dividend policy contemplates the distribution of our available
cash, this policy could be modified or revoked at any
time;
|
|
●
|
even
if our dividend policy were not modified or revoked, the actual amount of
dividends distributed under the policy and the decision to make any
distribution is entirely at the discretion of our board of
directors;
|
|
●
|
the
amount of dividends distributed is subject to covenant restrictions in our
indenture and our credit facility;
|
|
●
|
the
amount of dividends distributed is subject to state law
restrictions;
|
|
●
|
our
stockholders have no contractual or other legal right to dividends;
and
|
|
●
|
we
may not have enough cash to pay dividends due to changes to our operating
earnings, working capital requirements and anticipated cash
needs.
|
Dividends
on our Class A common stock will not be cumulative. Consequently, if dividends
on our Class A common stock are not declared and/or paid at the targeted levels,
our stockholders will not be entitled to receive such payments in the
future.
If we
have any remaining cash after the payment of dividends as contemplated above,
our board of directors will, in its sole discretion, decide to use that cash to
fund capital expenditures or acquisitions, repay indebtedness, pay additional
dividends or for general corporate purposes.
Restrictions
on Payment of Dividends
The
indenture governing our senior subordinated notes restricts our ability to
declare and pay dividends on our common stock as follows:
|
●
|
we
may only pay dividends in any given fiscal quarter equal to 100% of our
excess cash for the period from and including the first fiscal quarter
beginning after the date of the indenture to the end of our most recently
ended fiscal quarter for which internal financial statements are available
at the time of such payment. “Excess Cash” means with respect to any
period, Adjusted EBITDA, as defined in the indenture, minus the sum of (i)
cash interest expense, (ii) capital expenditures and (iii) cash income tax
expense, in each case, for such
period;
|
|
●
|
we
may not pay dividends if our interest coverage ratio, which is defined as
Adjusted EBITDA divided by consolidated interest expense, is below 1.4
times;
|
|
●
|
we
may not pay any dividends if not permitted under any of our senior
indebtedness;
|
16
|
●
|
we
may not pay any dividends while interest on the senior subordinated notes
is being deferred or, after the end of any interest deferral, so long as
any deferred interest has not been paid in full;
and
|
|
●
|
we
may not pay any dividends if a default or event of default under the
indenture governing the senior subordinated notes has occurred and is
continuing.
|
Our
credit facility does not allow us to pay dividends on our common stock unless we
maintain:
|
●
|
a
“fixed charge coverage ratio” (defined as our Consolidated EBITDA, as
defined in the credit facility, for any period of four consecutive fiscal
quarters divided by the sum of certain capital expenditures, cash income
taxes, the aggregate amount of cash interest expense and scheduled
principal payments for such period) of not less than 1.14 times;
and
|
|
●
|
a
“senior leverage ratio” (defined as senior secured debt as of the last day
of any period divided by our Consolidated EBITDA, as defined in the credit
facility, for any period of four consecutive fiscal quarters) of not more
than 3.85 times.
|
In
addition, our credit facility does not allow us to pay dividends on our common
stock if and for as long as (a) interest payments on our senior subordinated
notes are required to be deferred pursuant to the terms of the credit facility,
(b) any default or event of default exists under the credit facility, (c)
deferred interest or interest on deferred interest is outstanding under our
senior subordinated notes, (d) a compliance certificate for the prior fiscal
quarter has not been timely delivered or (e) there is insufficient excess cash,
as defined in the credit facility.
Securities
Authorized for Issuance under Equity Compensation Plans
No
securities have been issued under any equity compensation plan and no such plan
is currently in place.
Recent
Sales of Unregistered Securities
During
the fiscal year ended December 31, 2009, we did not issue any unregistered
securities.
Beginning
on December 21, 2006, and subject to a financial test relating to our Adjusted
EBITDA (as such term is defined in the indenture governing our senior
subordinated notes) that no longer applies from December 21, 2009, and certain
other conditions, at the option of the holders of our Class B common stock, such
holders may exchange one share of Class B common stock for one IDS, subject to
compliance with law and applicable agreements. On December 30, 2009, the holders
of the Class B shares notified the Company of their desire to exchange their
Class B shares for IDS units in accordance with the Investor Rights Agreement
dated as of December 21, 2004.
Performance
Graph
The
following graph compares the cumulative total stockholder return (stock price
appreciation plus reinvested dividends) for our Class A shares (represented by
IDSs) with the cumulative total return (including reinvested dividends) of the
Russell 2000 Index (“R2000”) and the Standard &
Poor’s — Telecommunications Services Index (“S&P-TS”), assuming a
$100 investment on December 31, 2004 through December 31, 2009:
17
COMPARISON
OF 5 YEAR CUMULATIVE TOTAL RETURN*
Among
Otelco Inc., The Russell 2000 Index
And The
S&P Telecommunication Services Index
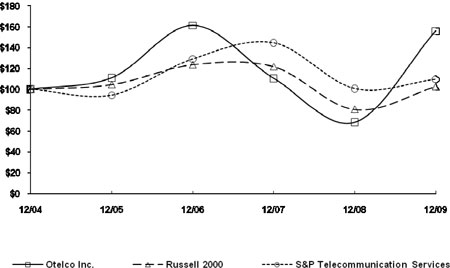
*$100
invested on 12/31/04 in stock or index, including reinvestment of
dividends.
Fiscal
year ending December 31.
Copyright©
2010 S&P, a division of The McGraw-Hill Companies Inc. All rights
reserved.
Cumulative
Stockholder Returns on $100 Invested:
| 12/04 | 12/05 | 12/06 | 12/07 | 12/08 | 12/09 | |||||||||||||||||||
|
Otelco
Inc.
|
100.00 | 111.03 | 161.07 | 110.43 | 68.49 | 155.78 | ||||||||||||||||||
|
Russell
2000
|
100.00 | 104.55 | 123.76 | 121.82 | 80.66 | 102.58 | ||||||||||||||||||
|
S&P
Telecommunication Services
|
100.00 | 94.37 | 129.10 | 144.52 | 100.45 | 109.42 |
The
following table sets forth our selected consolidated financial and other
information. The consolidated financial information as of December 31, 2008 and
2009 and for each of the three years in the period ended December 31, 2009 has
been derived from, and should be read together with, our audited consolidated
financial statements and the accompanying notes included in Item 8 of this
report. The consolidated financial information as of December 31, 2005, 2006 and
2007 and for each of the two years in the period ended December 31, 2006 has
been derived from our audited consolidated financial statements not included in
this report. The consolidated financial information set forth should be read in
conjunction with, and is qualified in its entirety by reference to,
“Management’s Discussion and Analysis of Financial Condition and Results of
Operations” in Item 7 and our audited consolidated financial statements and
related notes in Item 8 of this report.
18
|
At
and For The Year Ended December 31,
|
||||||||||||||||||||
|
2005
|
2006(1)
|
2007
|
2008(1)
|
2009
|
||||||||||||||||
|
(In
Thousands Except Per Share Amounts)
|
||||||||||||||||||||
|
Income
Statement Data
|
||||||||||||||||||||
|
Revenues:
|
||||||||||||||||||||
|
Local
services
|
$ | 17,376 | $ | 21,371 | $ | 26,102 | $ | 30,014 | $ | 48,441 | ||||||||||
|
Network
access
|
21,873 | 23,481 | 25,671 | 27,281 | 33,297 | |||||||||||||||
|
Cable
television
|
2,087 | 2,191 | 2,184 | 2,389 | 2,489 | |||||||||||||||
|
Internet
|
5,636 | 8,669 | 11,517 | 12,449 | 14,027 | |||||||||||||||
|
Transport
services
|
— | 1,877 | 4,275 | 4,982 | 5,501 | |||||||||||||||
|
Total
|
$ | 46,972 | $ | 57,589 | $ | 69,749 | $ | 77,115 | $ | 103,755 | ||||||||||
|
Income
from operations
|
$ | 19,439 | $ | 19,803 | $ | 19,265 | $ | 21,087 | $ | 21,927 | ||||||||||
|
Income
(loss) before income tax
|
$ | 3,246 | $ | 2,802 | $ | (195 | ) | $ | 243 | $ | (4,484 | ) | ||||||||
|
Net
income (loss) available to common stockholders
|
$ | 1,792 | $ | 1,161 | $ | 179 | $ | 214 | $ | (3,118 | ) | |||||||||
|
Net
income (loss) per share
|
||||||||||||||||||||
|
Basic
|
$ | 0.19 | $ | 0.12 | $ | 0.02 | $ | 0.02 | $ | (0.25 | ) | |||||||||
|
Diluted
|
$ | 0.12 | $ | 0.12 | $ | (0.10 | ) | $ | (0.03 | ) | $ | (0.25 | ) | |||||||
|
Dividends
declared per share
|
$ | 0.71 | $ | 0.71 | $ | 0.71 | $ | 0.71 | $ | 0.71 | ||||||||||
|
Balance
Sheet Data
|
||||||||||||||||||||
|
Cash
and cash equivalents
|
$ | 5,569 | $ | 14,402 | $ | 12,810 | $ | 13,542 | $ | 17,731 | ||||||||||
|
Property
and equipment, net
|
44,556 | 60,494 | 54,610 | 75,407 | 69,029 | |||||||||||||||
|
Total
assets
|
192,126 | 243,852 | 232,486 | 355,541 | 337,528 | |||||||||||||||
|
Long-term
notes payable (including current portion)
|
161,075 | 201,075 | 170,020 | 278,800 | 273,717 | |||||||||||||||
|
(1)
|
During
fiscal 2006 and 2008, we acquired Mid-Maine and the CR Companies,
respectively, each containing one or more RLECs and CLECs. More
information about each acquisition can be found in Item 1 of this
report.
|
Overview
General
Since
1999, we have acquired and operate ten RLECs serving subscribers in north
central Alabama, central Maine, western Massachusetts, central Missouri and
southern West Virginia. We are the sole wireline telephone services provider for
many of the rural communities we serve. We also operate a CLEC serving
subscribers in Maine and New Hampshire. Our services include local and long
distance telephone services, network access, other telephone related services,
cable television (in some markets) and Internet access. We view, manage and
evaluate the results of operations from the various telecommunications products
and services as one company and therefore have identified one reporting segment
as it relates to providing segment information. As of December 31, 2009, we
operated approximately 100,356 access line equivalents and supply an additional
132,324 wholesale network connections.
Our core
business is providing local and long distance telecommunications services,
wholesale access to the local and long distance network, and network access to
other wireline, long distance and wireless carriers for calls originated or
terminated on our network. Our core business generated approximately 78.8% of
our total revenues in 2009. We also provide cable and satellite television
service in some markets and digital high-speed data lines and dial-up Internet
access in all of our markets.
The
following discussion and analysis should be read in conjunction with our
financial statements and the related notes and other financial information
appearing elsewhere in this report, including in Item 8. The following
discussion and analysis relates to our financial condition and results of
operations on a consolidated basis, including the acquisition of the CR
Companies as of October 31, 2008.
19
Impact
of Indebtedness Levels on our Results of Operations and Liquidity
As a
result of the significant amount of debt we have outstanding through our senior
credit facility, the senior subordinated note portion of the outstanding IDSs,
and the senior subordinated notes sold separately (not in the form of IDSs), our
interest expense remains at a significantly high level. In February 2009, we
entered into interest rate swap agreements to cover the majority of borrowings
under the senior credit facility to protect against interest rate swings through
February 2012. In August 2009, we made a voluntary prepayment of $5.0
million to reduce our senior credit facility. Our current senior credit facility
matures on October 31, 2013, when it must be refinanced.
Our board
of directors has adopted a dividend policy for our Class A common stock pursuant
to which, in the event and to the extent we have any available cash for
distribution to the holders of shares of our Class A common stock and subject to
applicable law and terms of our then existing indebtedness, our board of
directors will declare cash dividends on our Class A common stock. The cash
requirements of this dividend policy are in addition to our high levels of
indebtedness and related debt service requirements discussed above. We expect
the cash requirements to be funded through cash flow generated from the
operations of our business. We also have access to a $15.0 million revolving
credit facility to supplement our liquidity position as needed.
There can
be no assurance that we will have sufficient cash in the future to pay dividends
on our Class A common stock at the historical rate or at all. If we do not
generate sufficient cash from our operating activities in the future to pay
dividends, we may have to reduce or eliminate dividends or rely on cash provided
by financing activities in order to fund dividend payments, if such financing is
available. However, if we use working capital or borrowings under our credit
facility to fund dividends, we would have less cash available for future
dividends and we may not have sufficient cash to pursue growth opportunities
such as the introduction of new services and the acquisition of other
telecommunications companies, or to respond to unanticipated events such as the
failure of a portion of our switching or network facilities. If we do not have
sufficient cash to finance growth opportunities or capital expenditures that
would otherwise be necessary or desirable, and cannot find alternative sources
of financing, our financial condition and our business will suffer. The expected
exchange in 2010 of our Class B shares for IDSs will increase the number of
Class A shares outstanding by 544,671 and increase long-term notes payable by
$4.1 million.
Our
current dividend policy, our high indebtedness levels and related debt service
requirements and our capital expenditure requirements will significantly limit
any cash available from operations for other uses for the foreseeable
future.
Revenue
Sources
We derive
our revenues from five sources:
|
●
|
Local
services. We receive revenues from providing local
exchange telecommunications services in our ten rural territories, from
the wholesale network services in New England, and on a competitive basis
throughout Maine and New Hampshire. These revenues include monthly
subscription charges for basic service, calling beyond the local territory
on a fixed price and on a per minute basis, local private line services
and enhanced calling features, such as voicemail, caller identification,
call waiting and call forwarding. We also provide billing and collections
services for other carriers under contract and receive revenues from
directory advertising. A growing portion of our rural subscribers take
bundled service plans which include multiple services, including unlimited
domestic calling, for a flat monthly
fee.
|
|
●
|
Network access
services. We receive revenues from charges established
to compensate us for the origination, transport and termination of calls
of long distance, wireless and other interexchange carriers. These include
subscriber line charges imposed on end users and switched and special
access charges paid by carriers. Switched access charges for long distance
services within Alabama, Massachusetts, Maine, Missouri, New Hampshire and
West Virginia are based on rates approved by the APSC, MDTC, MPUC, MPSC,
NHPUC and WVPSC, respectively, where appropriate. Switched and special
access charges for interstate and international services are based on
rates approved by the FCC.
|
|
●
|
Cable television
services. We offer basic, digital, high-definition,
digital video recording and pay per view cable television services to a
portion of our telephone service territory in both Alabama and Missouri,
including Internet Protocol television (“IPTV”) in Alabama. We are a
reseller of satellite services for
DirecTV.
|
20
|
●
|
Internet
services. We receive revenues from monthly recurring
charges for digital high-speed data lines, dial-up Internet access and
ancillary services such as web hosting and computer virus
protection.
|
|
●
|
Transport
Services. We receive monthly recurring revenues for the
rental of fiber to transport data and other telecommunications services in
Maine.
|
Access
Line and Customer Trends
The
number of voice and data access lines served is a fundamental factor in
determining revenue stability for a telecommunications provider. Reflecting a
general trend in the RLEC industry, the number of rural voice access lines we
serve has been decreasing when normalized for territory acquisitions. We expect
that this trend will continue, and may be further impacted by the effect of the
economy on our customers. These trends will be partially offset by the growth of
data access lines, also called digital high-speed Internet access service. Our
CLEC voice and data access lines have grown as we continue to successfully
penetrate our chosen markets. Our ability to continue this growth and our
response to the rural trends will have an important impact on our future
revenues. Our primary strategy consists of leveraging our strong incumbent
market position, selling additional services to our rural customer base and
providing better service and support levels than the incumbent carrier to our
competitive customer base.
|
Year
Ended December 31,
|
||||||||||||
|
2007
|
2008
|
2009
|
||||||||||
|
Key
Operating Statistics
|
||||||||||||
|
RLEC
access lines:
|
||||||||||||
|
Voice
lines
|
36,687 | 51,530 | 48,215 | |||||||||
|
Data
lines
|
12,160 | 18,709 | 20,066 | |||||||||
|
RLEC
access line equivalents (1)
|
48,847 | 70,239 | 68,281 | |||||||||
|
CLEC
access lines:
|
||||||||||||
|
Voice
lines
|
16,973 | 26,558 | 28,647 | |||||||||
|
Data
lines
|
2,571 | 3,246 | 3,428 | |||||||||
|
CLEC
access line equivalents (1)
|
19,544 | 29,804 | 32,075 | |||||||||
|
Otelco
access line equivalents (1)
|
68,391 | 100,043 | 100,356 | |||||||||
|
Wholesale
network connections
|
– | 98,187 | 132,324 | |||||||||
|
Cable
television customers
|
4,169 | 4,082 | 4,195 | |||||||||
|
Other
internet customers (2)
|
15,249 | 11,864 | 9,116 | |||||||||
|
(1)
|
We
define access line equivalents as voice access lines and data access lines
(including cable modems, digital subscriber lines, and dedicated data
access trunks).
|
|
(2)
|
Includes
dial-up Internet customers of 12,731, 9,213 and 6,439 and digital
high-speed data customer of 1,148, 1,468 and 1,891 for 2007, 2008 and 2009
respectively that are outside of our traditional service territories and
dial-up Internet customers of 1,370, 1,183 and 786 for 2007, 2008 and 2009
respectively that are in our traditional service
territories.
|
The
primary reasons for the increase in access line equivalents in 2008 was the
acquisition of the CR Companies on October 31, 2008 and the continuing growth in
our CLEC customers in Maine. For 2009, CLEC access line equivalents grew 2,271
or 7.6%, more than offsetting a decline of 1,958 or 2.8% in RLEC access line
equivalents. We are the primary long distance provider for our customers,
serving over 60% of our RLEC customer base and virtually all of our CLEC
customers. The expansion of IPTV in our Alabama markets contributed to the 2.8%
increase in television customers. We have also installed over 100 DirecTV
customers in Missouri.
We will
continue our strategy of growing our penetration of the competitive markets in
Maine and New Hampshire while maintaining revenues by cross-selling to our
existing RLEC customer base, using bundled service packages including unlimited
long distance and adding new services as they become available. Our growth in
data access lines to provide digital high-speed Internet access will continue as
customers increase the use of available content and new services.
We
provide dial-up Internet on a statewide basis in Maine and Missouri. We expect
that our dial-up Internet customers will continue to migrate to data access
lines as growth in broadband services continues. In Missouri, we provide data
access lines for digital high-speed Internet in selected areas outside of our
telephone service territory. This service offering had 1,148, 1,468 and
1,891customers in 2007, 2008 and 2009, respectively, of the Other internet
customers noted in the table above.
21
The
following is a discussion of the major factors affecting our access line
count:
Cyclical Economic and Industry
Factors. We believe that changes in global economic conditions
have and will continue to have an impact on voice access line count. This impact
has accelerated in 2009 with the increase in unemployment. The rural nature of
much of the territory we serve delayed the impact on our customer base but the
continued negative economy has reached and continues to impact all parts of our
business.
Competition. There
are currently no wireline telephone competitors operating within the majority of
our RLEC territories. Where wireline competition exists, it comes from the
incumbent cable company and has a negative impact on voice access lines. We have
also experienced access line losses to wireless carrier substitution, though the
impact is reduced due in part to the topography of our telephone territories and
current inconsistent wireless coverage. We have responded to competition by
offering bundled service packages which include unlimited domestic calling;
features like voice mail and caller ID; data access lines, and where possible,
television services. These service bundles are designed to meet the broader
communications needs of our customers at industry competitive prices. There are
a number of established competitive providers in our Maine and New Hampshire
CLEC markets. The effectiveness of our sales force is critical to the continued
growth in this market. The acquisition of the CR Companies enhanced our service
area, market coverage, and network capacity, allowing for continued growth in a
down economy.
Acquisitions. In
2008, we purchased the CR Companies, consisting of RLEC companies in Maine,
Massachusetts and West Virginia and CLEC companies in Maine. The integration of
this acquisition is complete.
Our
Rate and Pricing Structure
Our CLEC
pricing is based on market requirements. We combine varying services to meet
individual customer requirements, including technical support and provide
multi-year contracts which are both market sensitive for the customer and
profitable for us. The MPUC and NHPUC impose certain requirements on
all CLECs operating in their markets for reporting and for interactions with the
various incumbent local exchange and interexchange carriers. These requirements
provide significant latitude in pricing services.
Our RLECs
operate in five states and are regulated in varying degrees by the respective
state regulatory authorities. The impact on pricing flexibility varies by state.
In Maine, our Saco River and Pine Tree subsidiaries have obtained authority to
implement pricing flexibility while remaining under rate-of-return regulation.
Our rates for other services we provide, including cable, long-distance, and
dial-up and high-speed Internet access, are not price regulated. The market for
competitive services, such as wireless, also impacts the ability to adjust
prices. With the increase of bundled services offerings, including unlimited
long distance, pricing for individual services takes on reduced importance to
revenue stability. We expect this trend to continue into the immediate
future.
Alabama
and Maine have state service funds which were implemented over the last 15 years
as part of balancing local service pricing and long distance access rates. These
funds were intended to neutralize the revenue impact on state RLECs from pricing
shifts implemented to reduce access rates over time. The Alabama Transition
Service Fund and the Maine Universal Service Fund provided total compensation of $5.9 million, representing 5.7%
of our total revenue for the year ended December 31, 2009. We do not expect
material changes in the amount of revenue we receive from these
funds.
Categories
of Operating Expenses
Our
operating expenses are categorized as cost of services; selling, general and
administrative expenses; and depreciation and amortization.
Cost of
services. This includes expenses for salaries, wages and
benefits relating to plant operation, maintenance, sales and customer service;
other plant operations, maintenance and administrative costs; network access
costs; and costs of services for long distance, cable television, Internet
access and directory services.
Selling, general and administrative
expenses. This includes expenses for salaries, wages and
benefits and contract service payments (e.g., legal fees) relating to
engineering, financial, human resources and corporate operations; information
management expenses, including billing; allowance for uncollectible accounts;
expenses for travel, lodging and meals; internal and external communications
costs; accounting; insurance premiums; stock exchange and banking fees; and
postage.
22
Depreciation and
amortization. This includes depreciation of our
telecommunications, cable and Internet networks and equipment, and amortization
of intangible assets. Certain of these amortization expenses continue to be
deductible for tax purposes.
Our
Ability to Control Operating Expenses
We strive
to control expenses in order to maintain our strong operating margins. As our
revenue shifts to non-regulated services and CLEC customers, operating margins
decrease reflecting the lower margins associated with these services. We expect
to control expenses while we continue to grow our business.
Results
of Operations
The
following table sets forth our results of operations as a percentage of total
revenues for the periods indicated. All results include acquisitions as of the
date acquired.
|
Year
Ended December 31,
|
||||||||||||
|
2007
|
2008
|
2009
|
||||||||||
|
Revenues
|
||||||||||||
|
Local
services
|
37.4 | % | 38.9 | % | 46.7 | % | ||||||
|
Network
access
|
36.8 | 35.4 | 32.1 | |||||||||
|
Cable
television
|
3.1 | 3.1 | 2.4 | |||||||||
|
Internet
|
16.5 | 16.1 | 13.5 | |||||||||
|
Transport
services
|
6.2 | 6.5 | 5.3 | |||||||||
|
Total
revenues
|
100.0 | % | 100.0 | % | 100.0 | % | ||||||
|
Operating
expenses
|
||||||||||||
|
Cost
of services and products
|
36.9 | % | 37.9 | % | 39.7 | % | ||||||
|
Selling,
general and administrative expenses
|
14.9 | 14.6 | 13.7 | |||||||||
|
Depreciation
and amortization
|
20.6 | 20.2 | 25.5 | |||||||||
|
Total
operating expenses
|
72.4 | 72.7 | 78.9 | |||||||||
|
Income
from operations
|
27.6 | 27.3 | 21.1 | |||||||||
|
Other
income (expense)
|
||||||||||||
|
Interest
expense
|
(30.7 | ) | (28.3 | ) | (24.5 | ) | ||||||
|
Change
in fair value of derivatives
|
1.4 | 0.4 | (1.3 | ) | ||||||||
|
Other
income
|
1.4 | 0.9 | 0.4 | |||||||||
|
Total
other expenses
|
(27.9 | ) | (27.0 | ) | (25.4 | ) | ||||||
|
Income
before income tax
|
(0.3 | ) | 0.3 | (4.3 | ) | |||||||
|
Income
tax benefit
|
0.6 | 0.0 | 1.3 | |||||||||
|
Net
income (loss) available to common stockholders
|
0.3 | % | 0.3 | % | (3.0 | )% | ||||||
Year
ended December 31, 2009 compared to year ended December 31, 2008
Total
Revenues. Total revenues grew 34.5% in 2009 to $103.8 million
from $77.1 million in 2008. The table below provides the components of our
revenues for 2009 compared to 2008.
23
|
Year
Ended December 31,
|
Change
|
|||||||||||||||
|
2008
|
2009
|
Amount
|
Percent
|
|||||||||||||
|
(Dollars
in Thousands)
|
||||||||||||||||
|
Local
services
|
$ | 30,014 | $ | 48,441 | $ | 18,427 | 61.4 | % | ||||||||
|
Network
access
|
27,282 | 33,297 | 6,015 | 22.0 | ||||||||||||
|
Cable
television
|
2,389 | 2,489 | 100 | 4.2 | ||||||||||||
|
Internet
|
12,449 | 14,027 | 1,578 | 12.7 | ||||||||||||
|
Transport
services
|
4,981 | 5,501 | 520 | 10.4 | ||||||||||||
|
Total
|
$ | 77,115 | $ | 103,755 | $ | 26,640 | 34.5 | |||||||||
Local
service. Local service revenue in 2009 grew 61.4% to $48.4
million from $30.0 million in 2008. This increase was attributable to an
increase of $17.2 million from the acquisition of the CR Companies and $2.8
million from growth in the combined CLEC business in New England. RLEC revenue,
including bundled services such as long distance, decreased $1.1 million,
reflecting the decline in voice access lines. Billing and collecting declined $0.3 million and directory
advertising revenue declined $0.2 million. Of the 4.7% of our Alabama and
Missouri voice access lines lost, 93.5% were offset by increased penetration of
our digital high-speed data lines for Internet service. The acceptance by our
customers of service bundles including unlimited calling plans continues to
grow.
Network
access. Network access revenue in 2009 increased 22.0% to
$33.3 million from $27.3 million in 2008. This increase was attributable to an
increase of $7.5 million from the acquisition of the CR Companies and $0.3
million from growth in the combined CLEC business in New England. This growth
was partially offset by decreases of $0.8 million in USF HCL reimbursement
primarily in one cost company; $0.7 million in Missouri access fees; and $0.3
million from interexchange carrier traffic and end user associated
fees.
Cable
television. Cable television revenue in 2009 increased 4.2% to
$2.5 million from $2.4 million in 2008. The growth in IPTV, high definition
television and digital video recording services and subscribers in Alabama
accounted for the increase.
Internet. Internet
revenue in 2009 increased 12.7% to $14.0 million from $12.4 million in 2008.
This increase was attributable to an increase of $1.9 million from the
acquisition of the CR Companies and $0.4 million from the addition of new
high-speed Internet data lines in Alabama and Missouri, partially offset by a
decrease of $0.7 million associated with the loss of dial-up Internet customers
we serve outside of our territory, primarily in Maine where we are not able to
offer them a high-speed data line alternative.
Transport
services. Transport services revenue in 2009 increased 10.4%
to $5.5 million from $5.0 million in 2008. The continued growth in Wide Area
Network over our expanded fiber backbone network and wholesale revenue from CLEC
customers in Maine drove this increase.
Operating
expenses. Operating expenses for 2009 increased 46.1% to $81.8
million from $56.0 million in 2008. This increase was primarily attributable to
the acquisition of the CR Companies and the cost of increased CLEC and
high-speed Internet data lines.
|
Year
Ended December 31,
|
Change
|
|||||||||||||||
|
2008
|
2009
|
Amount
|
Percent
|
|||||||||||||
|
(Dollars
in Thousands)
|
||||||||||||||||
|
Cost
of services
|
$ | 29,192 | $ | 41,179 | $ | 11,987 | 41.1 | % | ||||||||
|
Selling,
general and administrative expenses
|
11,228 | 14,164 | 2,936 | 26.1 | ||||||||||||
|
Depreciation
and amortization
|
15,608 | 26,486 | 10,878 | 69.7 | ||||||||||||
|
Total
|
$ | 56,028 | $ | 81,829 | $ | 25,801 | 46.1 | |||||||||
Cost of
services. Cost of services increased 41.1% to $41.2 million in
2009 from $29.2 million in 2008. This increase was attributable to an increase
of $12.0 million from the acquisition of the CR Companies and growth in the
combined CLEC business in New England, including synergies associated with the
acquisition. Pole rental and television expense in Alabama, including one-time
items, increased $0.7 million, offset by a reduction of $0.2 million in
directory costs and $0.5 million in operational synergies.
24
Selling, general and administrative
expenses. Selling, general and administrative expenses
increased 26.1% to $14.2 million in 2009 from $11.2 million in 2008. The
acquisition of the CR Companies increased these expenses by $2.7 million,
including increased allowance for doubtful accounts associated with a vendor’s
bankruptcy filing in Maine and higher legal expense for regulatory matters.
Operational taxes and employee costs increased $0.2 million.
Depreciation and
amortization. Depreciation and amortization increased 69.7% to
$26.5 million in 2009 from $15.6 million in 2008. The acquisition of the CR
Companies accounted for $11.6 million of the increase, including $8.0 million in
amortization of intangible assets. The balance consisted of decreased
depreciation of $0.2 million associated with the investment in the balance of
our companies and a decrease in amortization of a non-competition intangible
asset of $0.5 million.
|
Year
Ended December 31,
|
Change
|
|||||||||||||||
|
2008
|
2009
|
Amount
|
Percent
|
|||||||||||||
|
(Dollars
in Thousands)
|
||||||||||||||||
|
Interest
expense
|
$ | (21,808 | ) | $ | (25,416 | ) | $ | 3,608 | 16.5 | % | ||||||
|
Change
in fair value of derivatives
|
324 | (1,354 | ) | (1,678 | ) |
NM
|
||||||||||
|
Other
income
|
640 | 359 | (281 | ) | (43.9 | ) | ||||||||||
|
Income
tax (expense) benefit
|
(29 | ) | 1,367 | 1,396 |
NM
|
|||||||||||
Interest
expense. Interest expense in 2009 increased 16.5% to $25.4
million from $21.8 million in 2008. Interest on senior debt increased $5.0
million on higher outstanding senior debt associated with the acquisition of the
CR Companies and higher margin associated with the expanded credit facility
Non-cash interest caplet expense associated with the recognition of the cost of
the five year interest rate cap purchased at the time of the initial public
offering increased approximately $0.1 million. There was a decrease of $1.5
million in loan cost amortization, primarily reflecting the extinguishment of
loan costs in 2008 associated with the expanded credit facility.
Change in fair value of
derivatives. The derivative value associated with the exchange
option for our Class B common stock must be fair valued each quarter until
December 21, 2009, at which point it no longer has value. In
addition, $14.4 million of our $80 million 3% LIBOR rate cap was considered
ineffective in hedging our senior debt through October 31, 2008 and therefore an
investment. The combined changes accounted for the decrease of $0.1 million. We
have two interest rate swap agreements to hedge our exposure to changes in
interest rate costs associated with our senior credit facility. From an
accounting perspective, the documentation for both swaps does not meet the
technical requirements to allow the swaps to be considered highly effective as
hedging instruments and therefore the swaps do not qualify for hedge
accounting. During 2009, these swap agreements must be considered as investments
and the decline in value of $1.6 million is reflected as a change in fair value
of derivatives. Over the life of the swaps, the cumulative change in value will
be zero. See —Liquidity and Capital Resources below for additional
explanation.
Other
income. Other income in 2009 decreased 43.9% to $0.4 million
from $0.6 million in 2008. This decrease was primarily attributable to one-time
gains in 2008 related to the gain on termination of a lease and the redemption
of the remaining Rural Telephone Bank stock associated with its dissolution
partially offset by a settlement with a contractor in 2008 for a net difference
of $0.1 million. A decrease in interest income on our invested cash partially
offset by an increase in dividends from CoBank accounted for $0.1
million.
Income
taxes. Provision for income taxes in 2009 was a benefit of
$1.4 million compared to an expense of less than $0.1 million for 2008. In
calculating the effective tax rate, the change in fair value of the derivatives
associated with the Class B common stock exchangeable for Class A common stock
and our two interest rate swaps are excluded as permanent differences. This can
cause the effective rate to vary between periods. The effective income tax rate
was 11.9% and 30.5% for 2008 and 2009, respectively.
Net income
(loss). As a result of the foregoing, there was a net loss in
2009 of $3.1 million compared to net income in 2008 of $0.2
million.
25
Year
ended December 31, 2008 compared to year ended December 31, 2007
Total
Revenues. Total revenues grew 10.6% in 2008 to $77.1 million
from $69.7 million in 2007. The table below provides the components of our
revenues for 2008 compared to 2007. The increase is primarily related to the
acquisition of the CR Companies.
|
Year
Ended December 31,
|
Change
|
|||||||||||||||
|
2007
|
2008
|
Amount
|
Percent
|
|||||||||||||
|
(Dollars
in Thousands)
|
||||||||||||||||
|
Local
services
|
$ | 26,102 | $ | 30,014 | $ | 3,912 | 15.0 | % | ||||||||
|
Network
access
|
25,671 | 27,281 | 1,610 | 6.3 | ||||||||||||
|
Cable
television
|
2,184 | 2,389 | 205 | 9.4 | ||||||||||||
|
Internet
|
11,517 | 12,449 | 932 | 8.1 | ||||||||||||
|
Transport
services
|
4,275 | 4,982 | 707 | 16.5 | ||||||||||||
|
Total
|
$ | 69,749 | $ | 77,115 | $ | 7,366 | 10.6 | |||||||||
Local
services. Local service revenue in 2008 grew 15.0% to $30.0
million from $26.1 million in 2007. This increase was attributable to an
increase of $3.5 million from the acquisition of the CR Companies and an
increase of $0.7 million in Maine CLEC revenue, partially offset by a reduction
of $0.3 million from access line loss by our other rural local exchange
carriers. The acceptance of bundled services,
including unlimited calling plans, continues to grow as a percentage of our
customer base.
Network
access. Network access revenue in 2008 grew 6.3% to $27.3
million from $25.7 million in 2007. This increase was attributable to an
increase of $1.6 million from the acquisition of the CR Companies and an
increase of $0.3 million in switched access, partially offset by a decrease of
$0.2 million from end user associated fees and $0.1 million associated with
special access, interexchange carrier traffic, and USF HCL
reimbursement.
Cable
television. Cable television revenue in 2008 increased 9.4% to
$2.4 million from $2.2 million in 2007. The increase was primarily due to the
introduction of high definition and digital video recording services, an
increase in pay per view services and satellite television
commissions.
Internet. Internet
revenue in 2008 increased 8.1% to $12.4 million from $11.5 million in 2007. This
increase was attributable to an increase of $0.4 million from the acquisition of
the CR Companies and $1.2 million from the addition of new data lines for
digital high-speed Internet customers, increased customer bandwidth and new
related services, partially offset by a decrease of $0.7 million associated with
the loss of dial-up Internet customers to data lines, including those we serve
outside of our territory in Missouri.
Transport
services. Transport services revenue in 2008 increased 16.5%
to $5.0 million from $4.3 million in 2007. The increase reflects the expansion
of our fiber network in Maine to 231 miles and continued growth in services
provided over that network.
Operating
expenses. Operating expenses in 2008 increased 11.0% to $56.0
million from $50.5 million in 2007. The increase is primarily related to the
acquisition of the CR Companies and increased CLEC customers in
Maine.
|
Year
Ended December 31,
|
Change
|
|||||||||||||||
|
2007
|
2008
|
Amount
|
Percent
|
|||||||||||||
|
(Dollars
in Thousands)
|
||||||||||||||||
|
Cost
of services
|
$ | 25,719 | $ | 29,192 | $ | 3,473 | 13.5 | % | ||||||||
|
Selling,
general and administrative expenses
|
10,419 | 11,228 | 809 | 7.8 | ||||||||||||
|
Depreciation
and amortization
|
14,346 | 15,608 | 1,262 | 8.8 | ||||||||||||
|
Total
|
$ | 50,484 | $ | 56,028 | $ | 5,544 | 11.0 | |||||||||
Cost of
services. The cost of services increased 13.5% to $29.2
million in 2008 from $25.7 million in 2007. The acquisition of the CR Companies
accounted for an increase of $2.7 million. Growth in the Maine CLEC revenue
increased cost $0.3 million; digital cable and satellite costs increased $0.2
million; Internet costs increased $0.2 million; and long distance resale costs
increased $0.2 million, partially offset by other network savings of $0.1
million.
26
Selling, general and administrative
expenses. Selling, general and administrative expenses
increased 7.8% to $11.2 million in 2008 from $10.4 million in 2007. The
acquisition of the CR Companies accounted for an increase of $0.6 million. The
balance of the increase reflects higher employee wages, human resources and
cable engineering costs and bad debt, partially offset by lower insurance and
operating and property taxes in the remainder of the Company.
Depreciation and
amortization. Depreciation and amortization increased 8.8% to
$15.6 million in 2008 from $14.3 million in 2007. The acquisition of the CR
Companies accounted for an increase of $2.5 million, including amortization of
non-compete, plant acquisition, and other intangibles, partially offset by a
decrease of $1.2 million in the remainder of the Company, including a decrease
of $0.5 million in amortization of intangible assets.
|
Year
Ended December 31,
|
Change
|
|||||||||||||||
|
2007
|
2008
|
Amount
|
Percent
|
|||||||||||||
|
(Dollars
in Thousands)
|
||||||||||||||||
|
Interest
expense
|
$ | (21,378 | ) | $ | (21,808 | ) | $ | 430 | 2.0 | % | ||||||
|
Change
in fair value of derivatives
|
970 | 324 | (646 | ) | (66.6 | ) | ||||||||||
|
Other
income
|
948 | 640 | (308 | ) | (32.5 | ) | ||||||||||
|
Income
tax (expense) benefit
|
374 | (29 | ) | (403 | ) |
NM
|
||||||||||
Interest
expense. Interest expense increased 2.0% to $21.8 million in
2008 from $21.4 million in 2007. Interest on senior debt declined $1.4 million
on lower interest rates, lower average margins for the year and lower average
outstanding balance for the year when compared to 2007. The interest
on the senior subordinated debt increased $1.5 million associated with the full
year effect of the additional July 2007 IDS offering. Non-cash interest caplet
expense associated with the recognition of the cost of the five year interest
rate cap purchased at the time of the initial public offering increased
approximately $0.1 million. The write-off of $1.2 million in loan costs
associated with the amendment of the senior debt facility related to the
acquisition of the CR Companies was offset by a reduction of $1.2 million in
lower loan cost amortization. An additional $0.2 million in loan cost
amortization was associated with the amended senior debt facility.
Change in fair value of
derivatives. The derivative value associated with the exchange
option for our Class B common stock must be fair valued each quarter until
conversion occurs, not later than December 21, 2009. The reduction in maximum
time to exchange, the change in price of the IDSs and the underlying Class A
common stock, changes in the interest rates in the market and the expected time
for exchange all impact the fair value of the derivative. The combination of
these factors decreased the value of the derivative by $0.7 million when
compared with the end of 2007. The balance of the change reflected the change in
value of the $80 million 3% LIBOR rate cap which is effective through December
2009.
Other
income. Other income decreased 32.5% to $0.6 million in 2008
from $0.9 million in 2007. There was a one-time gain of $0.2 million on a fiber
lease termination and an additional Rural Telephone Bank stock redemption.
Interest income decreased $0.4 million as interest rates associated with
invested cash declined in the market. The ineffective portion of our interest
rate cap produced $0.1 million less in 2008 than in 2007.
Income
taxes. Income tax expense in 2008 was less than $0.1 million
compared to an income tax benefit of $0.4 million in 2007. Our 2008 effective
income tax rate reflects the impact of acquiring the CR Companies and their
impact on state and federal income taxes. In calculating the effective tax rate,
the change in fair value of the derivative associated with the Class B common
stock convertible into Class A common stock is excluded as a permanent
difference. This can cause the effective rate to vary based on the level of
income before taxes and generate swings in the effective tax rate. Additional
detail on income taxes may be found in note 11 to the consolidated financial
statements found in Item 8 of this report on Form 10-K.
Net income. As a
result of the foregoing, net income in 2008 was $0.2 million, unchanged from
2007.
Liquidity
and Capital Resources
Our
liquidity needs arise primarily from: (i) interest payments related to our
credit facility and our senior subordinated notes; (ii) capital expenditures;
(iii) working capital requirements; and (iv) dividend payments on our Class A
common stock.
27
Cash
flows from operating activities for 2009 amounted to $27.9 million compared to
$18.7 million for 2008. The change is primarily related to the acquisition
of the CR Companies.
Cash used
in investing activities for 2009 amounted to $9.8 million compared to $117.9
million for 2008. In 2008, the acquisition of the CR Companies used $108.7
million. The acquisition and construction of property and equipment reflected
cash used in investing activities of $9.6 million in 2009 when compared to $9.2
million in 2008. The Company also used $0.2 million to acquire certain wholesale
customers in the Alabama territory.
Cash
provided from financing activities for 2008 generated $99.9 million compared to
cash used for financing activities for 2009 of $13.9 million. In 2008, the
Company borrowed $108.9 million in long-term notes payable as part of the
transaction to purchase the CR Companies. In 2008 and 2009, the Company declared
and paid dividends amounting to $8.9 million to the holders of its Class A
common stock. In addition, the Company made a voluntary prepayment of $5.0
million on its senior debt due in October 2013.
Total
capital expenditures in 2009 were $9.6 million, up $0.4 million from $9.2
million in 2008, reflecting the acquisition of the CR Companies; additions to
the Maine fiber network and related switching; the addition of a soft switch in
Missouri; and continued buildout of the IPTV system in Alabama. The Company was
cautious, particularly in the first half of the year, in adding and replacing
capacity given the soft economy. Our business continues to invest approximately
10% of revenue each year in business infrastructure.
We
currently have outstanding $168.5 million under the term loan portion of our
second amended and restated credit facility that matures in October 2013,
reflecting a $5.0 million voluntary prepayment made by the Company in August
2009. Borrowings under the term loan bear interest at three-month
LIBOR plus a margin that can range from 3.5% to 4.25% (At December 31, 2009, the
rate was 0.25% LIBOR plus 4.0% margin). The second amended and restated credit
facility requires us to have interest rate protection equal to at least half of
our senior debt outstanding through October 31, 2010. In February 2009, the
Company executed two interest rate swap agreements as the fixed rate
counterparty to hedge its exposure to changes in interest rate costs associated
with its senior credit facility. Both swap agreements hedge the 3 month LIBOR
rate. The first agreement is effective February 9, 2009 for three years with a
notional amount of $90 million and a fixed interest rate of 1.85%. The second
agreement is effective February 9, 2010 for two years with a notional amount of
$60 million and a fixed interest rate of 2.0475%. From an accounting
perspective, the documentation for both swaps does not meet the technical
requirements of Accounting Standards Codification (“ASC”) 815, Derivatives and Hedging (“ASC
815”), to allow the swaps to be considered highly effective as hedging
instruments.
We also
have outstanding an aggregate of $103.6 million senior subordinated notes due
2019 which bear interest at a rate of 13%, payable quarterly. The holders of our
Class B common stock have requested that their shares be exchanged for IDSs in
2010 as the financial testing requirements expired in December 2009. At the time
of exchange, the IDSs will represent an additional $4.1 million in aggregate
principal amount of senior subordinated notes due in 2019.
In
addition, we currently have a $15.0 million revolving credit facility, which
bears interest at a variable rate. No borrowings were outstanding under this
facility at December 31, 2009 or at any time since its inception. We are charged
a 0.5% fee on the unused balance, payable quarterly.
Our
credit facility has material covenants based upon Consolidated EBITDA, as
defined in the credit facility, and our senior subordinated notes have material
covenants based upon Adjusted EBITDA, as defined in the indenture. In our credit
facility, covenants relating to our senior leverage and fixed charge ratios are
calculated based upon Consolidated EBITDA. In the indenture for the senior
subordinated notes, our ability to pay dividends on our common stock is
dependent in large part on our Adjusted EBITDA. In addition, our ability to
incur debt under the indenture for the senior subordinated notes and the credit
facility is based on our ability to meet a specified leverage ratio. If we are
unable to meet the leverage ratio, our liquidity would be adversely affected to
the extent that we intend to rely on additional debt to enhance our
liquidity.
The
following table provides a summary of the extent to which cash generated from
operations is reinvested in our operations, used to pay interest on our senior
debt and senior subordinated notes or distributed as dividends to our
stockholders for 2007, 2008 and 2009.
28
|
Year
Ended December 31,
|
||||||||||||
|
2007
|
2008
|
2009
|
||||||||||
|
(Dollars
in Thousands)
|
||||||||||||
|
Cash
generation
|
||||||||||||
|
Revenue
|
$ | 69,749 | $ | 77,115 | $ | 103,755 | ||||||
|
Other
income
|
948 | 640 | 359 | |||||||||
|
Cash
received from operations
|
$ | 70,697 | $ | 77,755 | $ | 104,114 | ||||||
|
Cost
of services and products
|
$ | 25,719 | $ | 29,192 | $ | 41,179 | ||||||
|
Selling,
general and administrative expenses
|
10,419 | 11,229 | 14,164 | |||||||||
|
Cash
consumed by operations
|
$ | 36,138 | $ | 40,421 | $ | 55,343 | ||||||
|
Cash
generated from operations
|
$ | 34,559 | $ | 37,334 | $ | 48,771 | ||||||
|
Cash
utilization
|
||||||||||||
|
Capital
investment in operations
|
$ | 6,572 | $ | 9,244 | $ | 9,596 | ||||||
|
Senior
debt interest and fees
|
6,029 | 4,581 | 9,589 | |||||||||
|
Interest
on senior subordinated notes
|
11,962 | 13,465 | 13,465 | |||||||||
|
Dividends
|
7,880 | 8,937 | 8,937 | |||||||||
|
Cash
utilized by the Company
|
$ | 32,443 | $ | 36,227 | $ | 41,587 | ||||||
|
Percentage
of cash utilized of cash generated
|
93.9 | % | 97.0 | % | 85.3 | % | ||||||
We
anticipate that operating cash flow, together with borrowings under our credit
facility, will be adequate to meet our currently anticipated operating and
capital expenditure requirements for at least the next 12 months. However, our
current dividend policy, our indebtedness levels and related debt service
requirements and our capital expenditure requirements will significantly limit
any cash available from operations for other uses for the foreseeable future. We
may not retain a sufficient amount of cash to finance growth opportunities or
unanticipated capital expenditure needs or to fund our operations in the event
of a significant business downturn. We may have to forego growth opportunities
or capital expenditures that would otherwise be necessary or desirable if we do
not find alternative sources of financing. If we do not have sufficient cash for
these purposes, our financial condition and our business will
suffer.
Obligations
and Commitments
The
following table discloses aggregate information about our contractual
obligations as of December 31, 2009, including scheduled interest and principal
for the periods in which payments are due (in millions):
29
|
Total
|
Less
Than
1 year |
1 – 3
years
|
3 – 5
Years
|
More
Than
5 years |
||||||||||||||||
|
Amended
and restated credit facility
|
||||||||||||||||||||
|
Term
|
$ | 168.5 | $ | — | $ | — | $ | 168.5 | $ | — | ||||||||||
|
Revolver(1)
|
— | — | — | — | — | |||||||||||||||
|
Senior
subordinated notes
(2)
|
107.7 | — | — | — | 107.7 | |||||||||||||||
|
Expected
interest expense
(3)
|
180.2 | 24.0 | 48.7 | 37.5 | 70.0 | |||||||||||||||
|
Total
contractual cash obligations
|
$ | 456.4 | $ | 24.0 | $ | 48.7 | $ | 206.0 | $ | 177.7 | ||||||||||
|
(1)
|
We
have a $15.0 million revolving credit facility with an October 2013
maturity available. No amounts were drawn on this facility on December 31,
2009 or during 2009. The Company pays a commitment fee of 0.50% per annum,
payable quarterly in arrears, on the unused portion of the revolver
loan.
|
|
(2)
|
Includes
$4.1 million liquidation value of Class B common stock exchangeable for
senior subordinated notes and interest on those notes beginning December
31, 2009, the date the Class B common stock can be exchanged by holders
for IDSs on a one-for-one basis without passing a financial test. Once the
Class B common stock is exchanged for IDSs, the annual interest on the
senior subordinated debt would be $0.5 million.
|
|
(3)
|
Expected
interest payments to be made in future periods reflect anticipated
interest payments related to our $168.5 million senior credit facility and
our $107.7 million senior subordinated notes at 13.0%, including those
associated with our IDSs and those sold separately, and, beginning
December 31, 2009, those associated with the Class B common stock
exchange. Interest on the senior credit facility reflects a LIBOR three
month rate of from 1.5% to 2.7% plus a margin of 4.0%, reflecting the
impacts of interest rate hedging. We have assumed in the presentation
above that we will hold the senior credit facility until maturity in 2013
and the senior subordinated notes until maturity in 2019. No interest
payment is included for the revolving credit facility because of the
variability and timing of advances and repayments
thereunder.
|
Off-Balance
Sheet Arrangements
The
Company has no off-balance sheet arrangements.
Critical
Accounting Policies and Accounting Estimates
The
process of preparing financial statements requires the use of estimates on the
part of management. These estimates are based on our historical experience
combined with management’s understanding of current facts and circumstances.
Certain of our accounting policies are considered critical as they are both
important to the portrayal of our financial statements and require significant
or complex judgment on the part of management. The following is a summary of
certain policies considered critical by management.
Regulatory
Accounting. We follow the accounting for regulated
enterprises, which is now part of ASC 980, Regulated Operations, for our
local exchange carriers. This accounting practice recognizes the
economic effects of rate regulation by recording costs and a return on
investment as such amounts are recovered through rates authorized by regulatory
authorities. Accordingly, ASC 980 requires us to depreciate telecommunications
property and equipment over the useful lives approved by regulators, which could
be different than the useful lives that would otherwise be determined by
management. ASC 980 also requires deferral of certain costs and
obligations based upon approvals received from regulators to permit recovery of
such amounts in future years. Criteria that would give rise to the
discontinuance of accounting in accordance with ASC 980 include (i) increasing
competition restricting our ability to establish prices that allow us to recover
specific costs and (ii) significant changes in the manner in which rates are set
by regulators from cost-based regulation to another form of
regulation. We periodically review these criteria to determine
whether the continuing application of ASC 980 is appropriate for our rural local
exchange carriers.
We are
subject to reviews and audits by regulatory agencies. The effect of
these reviews and audits, if any, will be recorded in the period in which they
become known and determinable.
Intangible Assets and
Goodwill. Intangible assets consist primarily of the value of
customer related intangibles, non-compete agreements and long-term customer
contracts. Goodwill represents the excess of total acquisition cost over the
assigned value of net identifiable tangible and intangible assets acquired
through various business combinations. Due to the regulatory accounting required
by ASC 980, we did not record acquired regulated telecommunications property and
equipment at fair value as required by ASC 805, Business Combinations,
through 2004. In accordance with 47 CFR 32.2000, the federal regulation
governing acquired telecommunications property and equipment, such property and
equipment is accounted for at original cost, and depreciation and amortization
of property and equipment acquired is credited to accumulated
depreciation.
30
For the
acquisition of the CR Companies, property has been recorded at fair value in
accordance with ASC 805, resulting in a plant acquisition adjustment for several
of the subsidiaries of the CR companies in 2008. We have acquired identifiable
intangible assets associated with the territories it serves through its
acquisitions of various companies, including non-compete agreements with the
former CEOs of two acquired businesses; the customer lists of its various
businesses; and a multi-year contract to provide telecommunications services to
a large multi-services operator in New England. Any excess of the total purchase
price over the amounts assigned to tangible and definable assets is recorded as
goodwill.
Revenue
Recognition. Local service revenue for monthly recurring
local services is billed in advance to a portion of our customers and in arrears
to the balance of the customers. We record our revenue for charges
that have not yet been invoiced to our customers as unbilled revenue when
services are rendered. The Company records revenue billed in advance
as advance billings and defers recognition until such revenue is
earned. Long distance service is billed to customers in arrears based
on actual usage except when it is included in service bundles. We
record unbilled long distance revenue as unbilled revenue when services are
rendered. In bundles, unlimited usage is billed in arrears at a flat
rate.
Network
access revenue is derived from several sources. Revenue for interstate access
services is received through tariffed access charges filed by the NECA with the
FCC on behalf of the NECA member companies for our regulated subsidiaries. These
access charges are billed by the Company to interstate interexchange carriers
and pooled with like-revenues from all NECA member companies. A portion of the
pooled access charge revenue received by the Company is based upon its actual
cost of providing interstate access service, plus a return on the investment
dedicated to providing that service. The balance of the pooled access charge
revenue received by the Company is based upon the nationwide average schedule
costs of providing interstate access services. Rates for our competitive
subsidiaries are set by FCC rule to be no more than the interconnecting
interstate rate of the predominant local carrier. Revenue for intrastate access
service is received through tariffed access charges billed by the Company to the
originating intrastate carrier using access rates filed with the appropriate
state regulatory commissions and are retained by the Company. Revenue for the
intrastate/interLATA access service is received through tariffed access charges
as filed with the APSC, MDTC, MPSC, MPUC, NHPUC and WVPSC. These access charges
are billed to the intrastate carriers and are retained by the Company. Revenue
for terminating and originating long distance service is received through
charges for providing usage of the local exchange network. Toll revenues are
recognized when services are rendered.
Cable
television, Internet and transport service revenues are recognized when services
are rendered. Operating revenues from the lease of dark fiber covered by
indefeasible rights-of-use (IRU) agreements are recorded as
earned. In some cases, the entire lease payment is received at
inception of the lease and recognized ratably over the lease term after
recognition of expenses associated with lease inception. The Company
has deferred revenue in the consolidated balance sheet as of December 31, 2008
and 2009 of $739,736 and $698,352, respectively.
Long-Lived
Assets. We review our long-lived assets for impairment at each
balance sheet date and whenever events or changes in circumstances indicate that
the carrying amount of an asset should be assessed. To determine if an
impairment exists, we estimate the future undiscounted cash flows expected to
result from the use of the asset being reviewed for impairment. If the sum of
these expected future cash flows is less than the carrying amount of the asset,
we recognize an impairment loss in accordance with guidance included in ASC 360,
Property, Plant, and
Equipment. The amount of the impairment recognized is
determined by estimating the fair value of the assets and recording a loss for
the excess of the carrying value over the fair value.
Accounting Treatment for Class B
Common Stock. In connection with our initial public offering,
we issued shares of Class B common stock. Our Class B common stock is
exchangeable at the holder’s option for IDSs registered under the Securities Act
of 1933. Each share of Class B common stock will be exchangeable for one IDS,
subject to certain adjustments. As of December 2009, there is
no longer a financial test required to be met in connection with an exchange and
the Class B shareholders have requested that their shares be exchanged into IDS
units.
We
accounted separately for the embedded exchange feature of the Class B common
stock as a derivative liability. We have recorded the fair market value of the
embedded derivative liability with an immediate charge to retained earnings,
resulting in a reduction to permanent equity at each balance sheet date. The
derivative liability ceased to exist on December 31, 2009. Upon any actual exchange of Class B common stock for IDSs, the
pro rata portion of the Class B common exchangeable for senior subordinated
notes of such exchange will be reduced and the newly issued senior subordinated
notes will be recorded at fair value. Any difference in these amounts would
either reduce or increase additional paid-in capital. If the then fair value
(i.e., market price) of the senior subordinated notes is above or below the par
value of the senior subordinated notes, we will amortize any premium or accrete
any discount on a non-cash basis on our consolidated statements of income from
the date that the exchange is made and record it as a permanent debt obligation
of our Company through the maturity date of the senior subordinated notes
whereby the carrying value of the senior subordinated notes at maturity would
equal the par value of the senior subordinated notes. Following any exchange of
a share of Class B common stock for IDSs, the portion of such exchange (the
permanent equity portion of the Class B common stock) representing the exchange
into shares of Class A common stock would be reallocated as par and additional
paid-in capital to the Class A common stock issued upon the
exchange.
31
When the
exchange occurs, the portion of the Class B common stock included in temporary
equity will be reclassified to debt and the associated interest payments will be
included in interest expense. Diluted earnings per share of Class A common stock
assumes all shares of Class B common stock are converted into the equivalent
number of IDSs.
Income Taxes. The
Company accounts for income taxes using the asset and liability approach in
accordance with guidance included in ASC 740, Income Taxes. The
asset and liability approach requires the recognition of deferred tax
liabilities and assets for the expected future tax consequences of temporary
differences between the carrying amounts and the tax basis of assets and
liabilities. A valuation allowance is provided when it is more likely than not
that some portion or all of the deferred tax assets will not be
realized.
The
provision for income taxes consists of an amount for the taxes currently payable
and a provision for the tax consequences deferred to future
periods.
Accounting for Interest Rate
Hedges. Our primary objective for holding derivative financial
instruments is to manage future interest rate risk. We use derivative
financial instruments to reduce our exposure to interest rate volatility.
Coincident with our initial public offering, we entered into a 3%, three month
LIBOR, five year interest rate cap agreement on $80 million in connection with
the floating rate term loan under our credit facility which expired on December
21, 2009. The interest rate cap agreement was considered an effective
hedge for accounting purposes, and thus qualified for hedge accounting and was
accounted for at fair value under guidance in ASC 815. When our
senior debt was reduced to $64.6 million from July 2007 through October 2008,
the portion of the rate cap above the term loan amount became an investment. It
was marked to fair value each quarter and any change in the value was reflected
in the income statement.
In
February 2009, the Company executed two interest rate swap agreements as the
fixed rate counterparty to hedge its exposure to changes in interest rate costs
associated with its senior credit facility. Both swap agreements hedge the 3
month LIBOR rate. The first agreement is effective February 9, 2009 for three
years with a notional amount of $90 million and a fixed interest rate of 1.85%.
The second agreement is effective February 9, 2010 for two years with a notional
amount of $60 million and a fixed interest rate of 2.0475%. From an accounting
perspective, the documentation for both swaps does not meet the technical
requirements of ASC 815 to allow the swaps to be considered highly effective as
hedging instruments and therefore the swaps do not qualify for hedge
accounting. The
relevant loan margin currently is 4.0%, based on amendments to the
agreement.
We
reflect a charge to interest expense for the portion of the interest rate cap
hedge that has expired in each period. Changes in the fair value of the interest
rate swaps are reflected in the change in fair value of derivatives in each
respective period. Over the life of the swaps, the cumulative change in value
will be zero. See —Liquidity and Capital Resources above for additional
explanation.
Recently
Adopted Accounting Pronouncements
In June
2009, the FASB issued ASC 105, Generally Accepted Accounting
Principles, or ASC 105. ASC 105 established the FASB Standards
Accounting Codification (“Codification”) as the single source of authoritative
U.S. generally accepted accounting principles (“GAAP”) recognized by the FASB to
be applied to nongovernmental entities, other than guidance issued by the
Securities and Exchange Commission (“SEC”). The Codification
reorganized existing U.S. accounting standards issued by the FASB and other
related standard setters into a single source of authoritative accounting
principles, arranged by topic. The guidance is effective for
financial statements issued for interim reporting periods ending after September
15, 2009. The adoption of the Codification changed the Company’s
references to U.S. GAAP accounting standards but did not impact our consolidated
financial statements.
In April
2009, the FASB issued guidance, which is now part of ASC 825, Financial
Instruments. This guidance requires disclosures about fair
value of financial instruments for interim reporting periods and is effective
for interim reporting periods ending after June 15, 2009. The
adoption of this guidance did not have a material impact on our consolidated
financial statements.
32
In April
2009, the FASB issued guidance, which is now part of ASC 820, Fair Value Measurements and
Disclosures. This guidance provides for estimating fair value
when the volume and level of activity for the asset or liability have
significantly decreased. This guidance is effective for interim
reporting periods ending after June 15, 2009. The adoption of this
guidance did not have a material impact on our consolidated financial
statements.
In April
2009, the FASB issued guidance, which is now part of ASC 320, Investments–Debt and Equity
Securities. This amends the other-than-temporary impairment
guidance for debt securities to make the guidance more operational and to
improve the presentation and disclosure of other-than-temporary impairments on
debt and equity securities in the financial statements. This guidance
is effective for interim reporting periods ending after June 15,
2009. The adoption of this guidance did not have a material impact on
our consolidated financial statements.
In April
2009, the FASB issued revised guidance, which is now part of ASC 805, Business
Combinations. The revised guidance addresses the initial
recognition, measurement and subsequent accounting for assets and liabilities
arising from contingencies in a business combination, and requires that such
assets acquired or liabilities assumed be initially recognized at fair value at
the acquisition date if fair value can be determined during the measurement
period. If the acquisition-date fair value cannot be determined, the
asset acquired or liability assumed arising from a contingency is recognized
only if certain criteria are met. The revised guidance also requires
that a systematic and rational basis for subsequently measuring and accounting
for the assets or liabilities be developed depending on their
nature. This guidance is effective for assets or liabilities arising
from contingencies in business combinations for which the acquisition date is on
or after the beginning of the first annual reporting period beginning on or
after December 15, 2008. The adoption of this guidance did not have a
material impact on our consolidated financial statements.
In May
2009, the FASB issued guidance, which is now part of ASC 855, Subsequent
Events. The guidance establishes general standards for
accounting for and disclosure of events that occur after the balance sheet date
but before financial statements are available to be issued (“subsequent
events”). More specifically, the guidance sets forth the period after
the balance sheet date during which management of a reporting entity should
evaluate events or transactions that may occur for potential recognition in the
financial statements, identifies the circumstances under which an entity should
recognize events or transactions occurring after the balance sheet date in its
financial statements and the disclosures that should be made about events or
transactions that occur after the balance sheet date. ASC 855
provides largely the same guidance on subsequent events which previously existed
only in auditing literature. The guidance is effective for interim
reporting periods ending after June 15, 2009. The adoption of ASC 855
required additional disclosures but did not have an impact on our consolidated
financial statements.
In August
2009, the FASB issued Accounting Standards Update (“ASU”) 2009-05, Measuring Liabilities at Fair
Value, or ASU 2009-05, an update to ASC 820, Fair Value Measurements and
Disclosures. ASU 2009-05 provides amendments to reduce
potential ambiguity in financial reporting when measuring the fair value of
liabilities. Among other provisions, this update provides
clarification that in circumstances, in which a quoted price in an active market
for the identical liability is not available, a reporting entity is required to
measure fair value using one or more of the valuation techniques described in
the update. ASU 2009-05 is effective for interim reporting periods
ending after August 2009. The adoption of this update did not have a
material impact on our consolidated financial statements.
In February 2010, the FASB issued ASU
2010-09, Amendments to Certain
Recognition and Disclosure Requirements, or ASU 2010-09, an update to ASC
855, Subsequent
Events. ASU 2010-09 removes the requirement for an SEC filer
to disclose a date through which subsequent events have been evaluated in both
issued and revised financial statements. Revised financial statements
include financial statements revised as a result of either correction of an
error or retrospective application of U.S. GAAP. The FASB also
clarified that if the financial statements have been revised, then an entity
that is not an SEC filer should disclose both the date that the financial
statements were issued or available to be issued. The FASB believes
these amendments remove potential conflicts with the SEC’s
literature. ASU 2010-09 is effective upon issuance except for the use
of the issued date for conduit debt obligors, which is effective for interim or
annual periods ending after June 15, 2010. The adoption of this
update did not have a material impact on our consolidated financial
statements.
Recent
Accounting Pronouncements
In
October 2009, the FASB issued ASU 2009-13, Multiple-Deliverable Revenue
Arrangements – a consensus of the FASB Emerging Issues Task Force, or ASU
2009-13, an update to ASC 605, Revenue
Recognition. ASU 2009-13 provides application guidance on
whether multiple deliverables exist, how the deliverables should be separated,
and how the consideration should be allocated to one or more units of
accounting. ASU 2009-13 establishes a selling price hierarchy for
determining the selling price of a deliverable. The selling price
used for each deliverable will be based on vendor-specific objective evidence,
if available, third-party evidence if vendor-specific evidence is not available,
or estimated selling price if neither vendor-specific or third-party evidence is
available. The Company will be required to apply this guidance
prospectively for revenue arrangements entered into or materially modified for
the fiscal year beginning on or after June 15, 2010; however, earlier
application is permitted. The Company has not determined the impact
that this update may have on its consolidated financial statements.
33
In
January 2010, the FASB issued ASU 2010-06, Improving Disclosures about Fair
Value Measurements, or ASU 2010-06, an update to ASC 820, Fair Value Measurements and
Disclosures. ASU 2010-06 provides more robust disclosures
about (1) the different classes of assets and liabilities measured at fair
value, (2) the valuation techniques and inputs used, (3) the activity in Level 3
fair value measurements, and (4) the transfers between Levels 1, 2, and
3. The new disclosures and clarifications of existing disclosures are
effective for interim and annual reporting periods beginning after December 15,
2009, except for the disclosures about purchases, sales, issuances, and
settlements in the roll forward of activity in Level 3 fair value
measurements. Those disclosures are effective for fiscal years
beginning after December 15, 2010, and for interim periods within those fiscal
years. The Company has not determined the impact that this update may
have on its consolidated financial statements.
Our
short-term excess cash balance is invested in short-term commercial paper. We do
not invest in any derivative or commodity type instruments, although our two
interest rate swap agreements are technically not effective hedges and therefore
do not qualify for hedge accounting. The change in fair value of the swaps
is charged or credited to income as a change in fair value of derivatives. Over
the life of the swaps, the cumulative change in value will be zero.
Accordingly, we are subject to minimal market risk on our
investments.
We have
the ability to borrow up to $15.0 million under a revolving loan facility. The
interest rate is variable and, accordingly, we are exposed to interest rate
risk, primarily from a change in LIBOR or a base rate. Currently, we have no
loans drawn under this facility.
34
OTELCO
INC.
CONSOLIDATED
FINANCIAL STATEMENTS
|
Page
|
||||
|
Reports
of Independent Registered Public Accounting Firm
|
36
|
|||
|
Consolidated
Balance Sheets
|
38
|
|||
|
Consolidated
Statements of Operations
|
39
|
|||
|
Consolidated
Statements of Changes in Stockholders’ Equity
|
40
|
|||
|
Consolidated
Statements of Cash Flows
|
41
|
|||
|
Notes
to Consolidated Financial Statements
|
42
|
|||
35
REPORT
OF INDEPENDENT REGISTERED PUBLIC ACCOUNTING FIRM
To the
Board of Directors and Stockholders
of Otelco
Inc.
Oneonta,
Alabama
We have
audited the accompanying consolidated balance sheets of Otelco Inc. as of
December 31, 2009 and 2008 and the related consolidated statements of
operations, stockholders’ equity, and cash flows for the years then ended. These
financial statements are the responsibility of the Company’s management. Our
responsibility is to express an opinion on these financial statements based on
our audits.
We
conducted our audits in accordance with auditing standards generally accepted in
the United States of America. Those standards require that we plan and perform
the audit to obtain reasonable assurance about whether the financial statements
are free of material misstatement. An audit includes consideration of internal
control over financial reporting as a basis for designing audit procedures that
are appropriate in the circumstances, but not for the purpose of expressing an
opinion on the effectiveness of the Company’s internal control over financial
reporting. Accordingly, we express no such opinion. An audit also includes
examining, on a test basis, evidence supporting the amounts and disclosures in
the financial statements, assessing the accounting principles used and
significant estimates made by management, as well as evaluating the overall
financial statement presentation. We believe that our audits provide a
reasonable basis for our opinion.
In our
opinion, the consolidated financial statements referred to above present fairly,
in all material respects, the financial position of Otelco Inc. at December 31,
2009 and 2008, and the results of its operations and its cash flows for the
years then ended in conformity with accounting principles generally accepted in
the United States of America.
We also
have audited, in accordance with the standards of the Public Company Accounting
Oversight Board (United States), Otelco Inc.’s internal control over financial
reporting as of December 31, 2009, based on criteria established in Internal Control – Integrated
Framework issued by the Committee of Sponsoring Organizations of the
Treadway Commission (COSO) and our report dated March 8, 2010 expressed an
adverse opinion thereon.
/s/ BDO
Seidman, LLP
Atlanta,
Georgia
March 8,
2010
36
Board of
Directors and Shareholders
of Otelco
Inc.
Oneonta,
Alabama
We have
audited Otelco Inc.’s internal control over financial reporting as of December
31, 2009, based on criteria established in Internal Control – Integrated
Framework issued by the Committee of Sponsoring Organizations of the
Treadway Commission (the COSO criteria). Otelco Inc.’s management is responsible
for maintaining effective internal control over financial reporting and for its
assessment of the effectiveness of internal control over financial reporting,
included in the accompanying “Item 9A. Controls and Procedures—Management’s
Annual Report on Internal Control Over Financial Reporting”. Our responsibility
is to express an opinion on the company’s internal control over financial
reporting based on our audit.
We
conducted our audit in accordance with the standards of the Public Company
Accounting Oversight Board (United States). Those standards require that we plan
and perform the audit to obtain reasonable assurance about whether effective
internal control over financial reporting was maintained in all material
respects. Our audit included obtaining an understanding of internal control over
financial reporting, assessing the risk that a material weakness exists, and
testing and evaluating the design and operating effectiveness of internal
control based on the assessed risk. Our audit also included performing such
other procedures as we considered necessary in the circumstances. We believe
that our audit provides a reasonable basis for our opinion.
A
company’s internal control over financial reporting is a process designed to
provide reasonable assurance regarding the reliability of financial reporting
and the preparation of financial statements for external purposes in accordance
with generally accepted accounting principles. A company’s internal control over
financial reporting includes those policies and procedures that (1) pertain to
the maintenance of records that, in reasonable detail, accurately and fairly
reflect the transactions and dispositions of the assets of the company; (2)
provide reasonable assurance that transactions are recorded as necessary to
permit preparation of financial statements in accordance with generally accepted
accounting principles, and that receipts and expenditures of the company are
being made only in accordance with authorizations of management and directors of
the company; and (3) provide reasonable assurance regarding prevention or timely
detection of unauthorized acquisition, use, or disposition of the company’s
assets that could have a material effect on the financial
statements.
Because
of its inherent limitations, internal control over financial reporting may not
prevent or detect misstatements. Also, projections of any evaluation of
effectiveness to future periods are subject to the risk that controls may become
inadequate because of changes in conditions, or that the degree of compliance
with the policies or procedures may deteriorate.
A
material weakness is a deficiency, or a combination of deficiencies, in internal
control over financial reporting, such that there is a reasonable possibility
that a material misstatement of the company’s annual or interim financial
statements will not be prevented or detected on a timely basis. A material
weakness existed relating to lack of sufficient expertise to ensure proper
application, at inception, of the criteria for hedge accounting under the
provisions of ASC 815, Derivatives and Hedging, for
two interest rate swaps entered during 2009. This material weakness was
considered in determining the nature, timing, and extent of audit tests applied
in our audit of the 2009 financial statements, and this report does not affect
our report dated March 8, 2010 on those financial statements.
In our
opinion, Otelco Inc. did not maintain, in all material respects, effective
internal control over financial reporting as of December 31, 2009, based on the
COSO criteria.
We do not
express an opinion or any other form of assurance on management’s statements
referring to any corrective actions taken by the company after the date of
management’s assessment.
We also
have audited, in accordance with the standards of the Public Company Accounting
Oversight Board (United States), the consolidated balance sheets of Otelco Inc.
as of December 31, 2009 and 2008, and the related consolidated statements of
operations, stockholders’ equity, and cash flows for each of the three years in
the period ended December 31, 2009 and our report dated March 8, 2010 expressed
an unqualified opinion thereon.
/s/ BDO
Seidman, LLP
Atlanta,
Georgia
March 8,
2010
37
OTELCO
INC.
|
December
31,
|
||||||||
|
2008
|
2009
|
|||||||
|
Assets
|
||||||||
|
Current
assets
|
||||||||
|
Cash
and cash equivalents
|
$ | 13,542,255 | $ | 17,731,044 | ||||
|
Accounts
receivable:
|
||||||||
|
Due
from subscribers, net of allowance for doubtful accounts
of $318,446 and $473,572, respectively |
5,207,731 | 4,650,909 | ||||||
|
Unbilled
receivables
|
2,567,730 | 2,444,979 | ||||||
|
Other
|
4,348,044 | 3,200,945 | ||||||
|
Materials
and supplies
|
2,305,755 | 1,969,966 | ||||||
|
Prepaid
expenses
|
1,141,908 | 1,342,249 | ||||||
|
Income
tax receivable
|
181,644 | 389,486 | ||||||
|
Deferred
income taxes
|
827,686 | 744,531 | ||||||
|
Total
current assets
|
30,122,753 | 32,474,109 | ||||||
|
Property
and equipment, net
|
75,407,062 | 69,028,973 | ||||||
|
Goodwill
|
189,334,837 | 188,190,078 | ||||||
|
Intangible
assets, net
|
44,390,644 | 34,218,115 | ||||||
|
Investments
|
2,015,583 | 1,991,158 | ||||||
|
Deferred
financing costs
|
8,315,921 | 6,964,015 | ||||||
|
Deferred
income taxes
|
5,897,382 | 4,482,430 | ||||||
|
Interest
rate cap
|
7,765 | – | ||||||
|
Other
assets
|
49,540 | 179,325 | ||||||
|
Total
assets
|
$ | 355,541,487 | $ | 337,528,203 | ||||
|
Liabilities
and Stockholders’ Equity
|
||||||||
|
Current
liabilities
|
||||||||
|
Accounts
payable
|
$ | 2,312,920 | $ | 3,145,728 | ||||
|
Accrued
expenses
|
6,632,287 | 6,167,023 | ||||||
|
Advance
billings and payments
|
2,024,123 | 1,665,422 | ||||||
|
Deferred
income taxes
|
213,679 | 394,850 | ||||||
|
Customer
deposits
|
180,582 | 172,109 | ||||||
|
Total
current liabilities
|
11,363,591 | 11,545,132 | ||||||
|
Deferred
income taxes
|
45,748,723 | 42,239,262 | ||||||
|
Interest
rate swaps
|
– | 1,592,813 | ||||||
|
Advance
billings and payments
|
739,736 | 698,352 | ||||||
|
Other
liabilities
|
188,346 | 165,968 | ||||||
|
Long-term
notes payable
|
278,799,513 | 273,717,301 | ||||||
|
Total
liabilities
|
336,839,909 | 329,958,828 | ||||||
|
Derivative
liability
|
238,054 | – | ||||||
|
Class
B common convertible to senior subordinated notes
|
4,085,033 | 4,085,033 | ||||||
|
Stockholders’
Equity
|
||||||||
|
Class
A Common Stock, $.01 par value-authorized 20,000,000 shares;
issued
and outstanding 12,676,733 shares
|
126,767 | 126,767 | ||||||
|
Class
B Common Stock, $.01 par value-authorized 800,000 shares;
issued
and outstanding 544,671 shares
|
5,447 | 5,447 | ||||||
|
Additional
paid in capital
|
19,277,959 | 10,340,862 | ||||||
|
Retained
deficit
|
(3,870,923 | ) | (6,988,734 | ) | ||||
|
Accumulated
other comprehensive loss
|
(1,160,759 | ) | – | |||||
|
Total
stockholders’ equity
|
14,378,491 | 3,484,342 | ||||||
|
Total
liabilities and stockholders’ equity
|
$ | 355,541,487 | $ | 337,528,203 | ||||
The
accompanying notes are an integral part of these consolidated financial
statements.
38
OTELCO INC.
|
Years
Ended December 31,
|
||||||||||||
|
2007
|
2008
|
2009
|
||||||||||
|
Revenues
|
||||||||||||
|
Local
services
|
$ | 26,101,800 | $ | 30,013,901 | $ | 48,441,222 | ||||||
|
Network
access
|
25,670,619 | 27,281,727 | 33,297,241 | |||||||||
|
Cable
television
|
2,184,072 | 2,388,885 | 2,489,011 | |||||||||
|
Internet
|
11,517,514 | 12,448,776 | 14,027,365 | |||||||||
|
Transport
services
|
4,275,429 | 4,981,651 | 5,500,615 | |||||||||
|
Total
revenues
|
69,749,434 | 77,114,940 | 103,755,454 | |||||||||
|
Operating
expenses
|
||||||||||||
|
Cost
of services and products
|
25,718,634 | 29,191,987 | 41,178,502 | |||||||||
|
Selling,
general and administrative expenses
|
10,418,760 | 11,228,585 | 14,164,465 | |||||||||
|
Depreciation
and amortization
|
14,346,620 | 15,607,726 | 26,485,628 | |||||||||
|
Total
operating expenses
|
50,484,014 | 56,028,298 | 81,828,595 | |||||||||
|
Income
from operations
|
19,265,420 | 21,086,642 | 21,926,859 | |||||||||
|
Other
income (expense)
|
||||||||||||
|
Interest
expense
|
(21,378,434 | ) | (21,807,800 | ) | (25,416,024 | ) | ||||||
|
Change
in fair value of derivatives
|
970,281 | 324,058 | (1,354,759 | ) | ||||||||
|
Other
income
|
947,737 | 639,784 | 359,484 | |||||||||
|
Total
other expenses
|
(19,460,416 | ) | (20,843,958 | ) | (26,411,299 | ) | ||||||
|
Income
(loss) before income tax
|
(194,996 | ) | 242,684 | (4,484,440 | ) | |||||||
|
Income
tax (expense) benefit
|
374,375 | (28,810 | ) | 1,366,629 | ||||||||
|
Net
income (loss) available to common stockholders
|
$ | 179,379 | $ | 213,874 | $ | (3,117,811 | ) | |||||
|
Weighted
average shares outstanding:
|
||||||||||||
|
Basic
|
11,156,185 | 12,676,733 | 12,676,733 | |||||||||
|
Diluted
|
11,700,856 | 13,221,404 | 13,221,404 | |||||||||
|
Basic
net income (loss) per share
|
$ | 0.02 | $ | 0.02 | $ | (0.25 | ) | |||||
|
Diluted
net income (loss) per share
|
$ | (0.10 | ) | $ | (0.03 | ) | $ | (0.25 | ) | |||
|
Dividends
declared per share
|
$ | 0.71 | $ | 0.71 | $ | 0.71 | ||||||
The
accompanying notes are an integral part of these consolidated financial
statements.
39
OTELCO
INC.
|
Class
A
Common
Stock
|
Class
B
Common
Stock
|
Additional
Paid-In |
Retained
Earnings |
Accumulated
Other Comprehensive |
Total
Stockholders’ |
|||||||||||||||||||||||||||
|
Shares
|
Amount
|
Shares
|
Amount
|
Capital
|
(Deficit)
|
Income
(Loss)
|
Equity
|
|||||||||||||||||||||||||
|
Balance,
December 31, 2006
|
9,676,733 | $ | 96,767 | 544,671 | $ | 5,447 | $ | 284,041 | $ | (1,137,166 | ) | $ | 878,045 | $ | 127,134 | |||||||||||||||||
|
Comprehensive
Income
|
||||||||||||||||||||||||||||||||
|
Net
income
|
179,379 | 179,379 | ||||||||||||||||||||||||||||||
|
Change
in value of interest rate cap
|
(1,816,777 | ) | (1,816,777 | ) | ||||||||||||||||||||||||||||
|
Total
comprehensive income
|
(1,637,398 | ) | ||||||||||||||||||||||||||||||
|
Dividends
declared
|
(4,752,589 | ) | (3,127,010 | ) | (7,879,599 | ) | ||||||||||||||||||||||||||
|
Subsequent
Public Offering
|
||||||||||||||||||||||||||||||||
|
Issuance
of IDSs
|
3,000,000 | 30,000 | 34,998,584 | 35,028,584 | ||||||||||||||||||||||||||||
|
Capitalized
transactions costs offset
|
||||||||||||||||||||||||||||||||
|
against
proceeds of offering
|
(2,314,980 | ) | (2,314,980 | ) | ||||||||||||||||||||||||||||
|
Balance,
December 31, 2007
|
12,676,733 | $ | 126,767 | 544,671 | $ | 5,447 | $ | 28,215,056 | $ | (4,084,797 | ) | $ | (938,732 | ) | $ | 23,323,741 | ||||||||||||||||
|
Comprehensive
Income
|
||||||||||||||||||||||||||||||||
|
Net
income
|
213,874 | 213,874 | ||||||||||||||||||||||||||||||
|
Change
in value of interest rate cap
|
(222,027 | ) | (222,027 | ) | ||||||||||||||||||||||||||||
|
Total
comprehensive income
|
(8,153 | ) | ||||||||||||||||||||||||||||||
|
Dividends
declared
|
(8,937,097 | ) | (8,937,097 | ) | ||||||||||||||||||||||||||||
|
Balance,
December 31, 2008
|
12,676,733 | $ | 126,767 | 544,671 | $ | 5,447 | $ | 19,277,959 | $ | (3,870,923 | ) | $ | (1,160,759 | ) | $ | 14,378,491 | ||||||||||||||||
|
Comprehensive
Income
|
||||||||||||||||||||||||||||||||
|
Net
loss
|
(3,117,811 | ) | (3,117,811 | ) | ||||||||||||||||||||||||||||
|
Change
in value of interest rate cap
|
1,160,759 | 1,160,759 | ||||||||||||||||||||||||||||||
|
Total
comprehensive income
|
(1,957,052 | ) | ||||||||||||||||||||||||||||||
|
Dividends
declared
|
(8,937,097 | ) | (8,937,097 | ) | ||||||||||||||||||||||||||||
|
Balance,
December 31, 2009
|
12,676,733 | $ | 126,767 | 544,671 | $ | 5,447 | $ | 10,340,862 | $ | (6,988,734 | ) | $ | – | $ | 3,484,342 | |||||||||||||||||
The
accompanying notes are an integral part of these consolidated financial
statements.
40
OTELCO
INC.
|
2007
|
2008
|
2009
|
||||||||||
|
Cash
flows from operating activities:
|
||||||||||||
|
Net
income (loss)
|
$ | 179,379 | $ | 213,874 | $ | (3,117,811 | ) | |||||
|
Adjustments
to reconcile net income to cash flows from operating
activities:
|
||||||||||||
|
Depreciation
|
11,751,673 | 11,772,191 | 14,444,714 | |||||||||
|
Amortization
|
2,594,943 | 3,835,535 | 12,040,914 | |||||||||
|
Interest
rate caplet
|
890,840 | 1,029,264 | 1,168,522 | |||||||||
|
Amortization
of debt premium
|
(33,552 | ) | (73,224 | ) | (82,212 | ) | ||||||
|
Amortization
of loan costs
|
2,606,422 | 2,874,164 | 1,351,906 | |||||||||
|
Change
in fair value of derivatives
|
(970,281 | ) | (324,058 | ) | 1,354,759 | |||||||
|
Provision
for deferred income taxes
|
(208,771 | ) | (114,845 | ) | (1,507,798 | ) | ||||||
|
Provision
for uncollectible revenue
|
225,615 | 416,892 | 920,945 | |||||||||
|
Gain
on early lease termination
|
– | (121,124 | ) | – | ||||||||
|
Changes
in assets and liabilities; net of assets and liabilities
acquired:
|
||||||||||||
|
Accounts
receivables
|
(422,708 | ) | (1,394,629 | ) | 739,921 | |||||||
|
Material
and supplies
|
(183,373 | ) | (124,010 | ) | 339,909 | |||||||
|
Prepaid
expenses and other assets
|
(86,233 | ) | 404,306 | (200,341 | ) | |||||||
|
Income
tax receivable
|
(469,546 | ) | 287,902 | (207,842 | ) | |||||||
|
Accounts
payable and accrued liabilities
|
(1,843,834 | ) | 143,552 | 1,094,474 | ||||||||
|
Advance
billings and payments
|
755,510 | (111,352 | ) | (400,085 | ) | |||||||
|
Other
liabilities
|
(15,630 | ) | (25,909 | ) | (30,850 | ) | ||||||
|
Net
cash from operating activities
|
14,770,454 | 18,688,529 | 27,909,125 | |||||||||
|
Cash
flows from investing activities:
|
||||||||||||
|
Deferred
charges/acquisition
|
(110,923 | ) | 51,222 | (6,551 | ) | |||||||
|
Acquisition
and construction of property and equipment
|
(6,572,336 | ) | (9,244,137 | ) | (9,596,049 | ) | ||||||
|
Proceeds
from retirement of investment
|
7,557 | (2,453 | ) | (1,085 | ) | |||||||
|
Payments
for the purchase of CR Companies, net of cash acquired
|
– | (108,677,338 | ) | – | ||||||||
|
Wholesale
customer acquisition
|
– | – | (179,554 | ) | ||||||||
|
Net
cash used in investing activities
|
(6,675,702 | ) | (117,872,706 | ) | (9,783,239 | ) | ||||||
|
Cash
flows from financing activities:
|
||||||||||||
|
Cash
dividends paid
|
(9,585,120 | ) | (8,937,097 | ) | (8,937,097 | ) | ||||||
|
Proceeds
from long-term notes payable
|
– | 108,853,032 | – | |||||||||
|
Loan
origination costs and transaction costs
|
(1,832,972 | ) | – | – | ||||||||
|
Repayment
of long-term notes payable
|
(55,353,032 | ) | – | (5,000,000 | ) | |||||||
|
Proceeds
from issuance of Income Deposit Securities
|
59,400,000 | – | – | |||||||||
|
Direct
cost of subsequent public offering
|
(2,314,980 | ) | – | – | ||||||||
|
Net
cash from (used in) financing activities
|
(9,686,104 | ) | 99,915,935 | (13,937,097 | ) | |||||||
|
Net
increase (decrease) in cash and cash equivalents
|
(1,591,352 | ) | 731,758 | 4,188,789 | ||||||||
|
Cash
and cash equivalents, beginning of period
|
14,401,849 | 12,810,497 | 13,542,255 | |||||||||
|
Cash
and cash equivalents, end of period
|
$ | 12,810,497 | $ | 13,542,255 | $ | 17,731,044 | ||||||
|
Supplemental
disclosures of cash flow information:
|
||||||||||||
|
Interest
paid
|
$ | 20,636,959 | $ | 17,267,118 | $ | 23,378,798 | ||||||
|
Income
taxes paid (received)
|
$ | (133,218 | ) | $ | (220,221 | ) | $ | 67,658 | ||||
The
accompanying notes are an integral part of these consolidated financial
statements.
41
OTELCO
INC.
NOTES
TO CONSOLIDATED FINANCIAL STATEMENTS
Nature
of Business
Otelco
Inc. (the “Company”) provides a broad range of telecommunications services on a
retail and wholesale basis. These services include local and long distance
calling; network access to and from our customers; data transport; digital
high-speed and dial-up Internet access; cable, satellite and Internet protocol
television; wireless; and other telephone related services. The principal
markets for these services are residential and business customers residing in
and adjacent to the exchanges the Company serves in Alabama, Massachusetts,
Maine, Missouri, and West Virginia. In addition, the Company serves business
customers throughout Maine and New Hampshire and provides dial-up Internet
service throughout the states of Maine and Missouri. The Company
offers various communications services that are sold to economically similar
customers in a comparable manner of distribution. The majority of our customers
buy multiple services, often bundled together at a single price. The Company
views, manages and evaluates the results of its operations from the various
communications services as one company and therefore has identified one
reporting segment as it relates to providing segment information.
Basis
of Presentation and Principles of Consolidation
The
consolidated financial statements include the accounts of the Company and its
subsidiaries, all of which are wholly owned. These include: Otelco
Telecommunications LLC (“OTC”); Otelco Telephone LLC (“OTP”); Hopper Holding
Company, Inc. (“HHC”) and its wholly owned subsidiary, Hopper Telecommunications
Company, Inc. (“HTC”); Brindlee Holdings LLC (“BH”) and its wholly owned
subsidiary Brindlee Mountain Telephone Company, Inc. (“BMTC”); Page & Kiser
Communications, Inc. (“PKC”) and its wholly owned subsidiary Blountsville
Telephone Company, Inc. (“BTC”); Mid-Missouri Holding Corporation (“MMH”) and
its wholly owned subsidiary Mid-Missouri Telephone Company (“MMT”) and its
wholly owned subsidiary Imagination, Inc.; Mid-Maine Communications, Inc.
(“MMeT” or “Mid-Maine”) and its wholly owned subsidiaries Mid-Maine Telecom,
Inc. (“MMTI”) and Mid-Maine TelPlus (“MMTP”); Granby Holdings, Inc. (“GH”) and
its wholly owned subsidiary The Granby Telephone & Telegraph Co. of
Massachusetts (“GTT”); War Holdings, Inc. (“WH”) and its wholly owned subsidiary
War Acquisition Corporation (“WT”); and Pine Tree Holdings, Inc. (“PTH”) and its
wholly owned subsidiaries The Pine Tree Telephone and Telegraph Company (“PTT”),
Saco River Telegraph and Telephone Company (“SRT”), CRC Communications of Maine,
Inc. (“PTN”), and Communications Design Acquisition Corporation
(“CDAC”).
GH, WH
and PTH (collectively, the “CR Companies”) were acquired on October 31, 2008
from Country Road Communications LLC (“CRC”).
Effective
January 1, 2010, HHC, BH, PKC, MMeT, GH, WH and PTH are merged into the Company
and will no longer exist as separate entities.
The
accompanying consolidated financial statements include the accounts of the
Company and all of the aforesaid subsidiaries after elimination of all material
intercompany balances and transactions.
Use
of Estimates
The
Company prepares its consolidated financial statements in accordance with
accounting principles generally accepted in the United States of America, which
require management to make estimates and assumptions that affect the reported
amounts of assets, liabilities, revenues and expenses and disclosure of
contingent assets and liabilities. The estimates and assumptions used
in the accompanying consolidated financial statements are based upon
management’s evaluation of the relevant facts and circumstances as of the date
of the financial statements. Actual results may differ from the
estimates and assumptions used in preparing the accompanying consolidated
financial statements.
Significant
accounting estimates include the recoverability of goodwill, identified
intangibles, long-term assets and allowance for bad debt.
42
OTELCO
INC.
NOTES
TO CONSOLIDATED FINANCIAL STATEMENTS
Regulatory
Accounting
The
Company follows the accounting for regulated enterprises, which is now part of
Accounting Standards Codification (“ASC”) 980, Regulated
Operations. This accounting practice recognizes the economic
effects of rate regulation by recording costs and a return on investment as such
amounts are recovered through rates authorized by regulatory authorities.
Accordingly, ASC 980 requires the Company to depreciate telecommunications
property and equipment over the useful lives approved by regulators, which could
be different than the useful lives that would otherwise be determined by
management. ASC 980 also requires deferral of certain costs and
obligations based upon approvals received from regulators to permit recovery of
such amounts in future years. Criteria that would give rise to the
discontinuance of accounting in accordance with ASC 980 include (1) increasing
competition restricting the ability of the Company to establish prices that
allow it to recover specific costs and (2) significant changes in the manner in
which rates are set by regulators from cost-based regulation to another form of
regulation. The Company periodically reviews the criteria to
determine whether the continuing application of ASC 980 is appropriate for our
rural local exchange carriers.
The
Company is subject to reviews and audits by regulatory agencies. The
effect of these reviews and audits, if any, will be recorded in the period in
which they become known and determinable.
Intangible
Assets and Goodwill
Intangible
assets consist primarily of the value of customer related intangibles,
non-compete agreements and long-term customer contracts. Goodwill represents the
excess of total acquisition cost over the assigned value of net identifiable
tangible and intangible assets acquired through various business combinations.
Due to the regulatory accounting required by ASC 980, the Company did not record
acquired regulated telecommunications property and equipment at fair value as
required by ASC 805, Business
Combinations, through 2004. In accordance with 47 CFR 32.2000, the
federal regulation governing acquired telecommunications property and equipment,
such property and equipment is accounted for at original cost, and depreciation
and amortization of property and equipment acquired is credited to accumulated
depreciation.
For the
acquisition of the CR Companies, property has been recorded at fair value in
accordance with ASC 805, resulting in a plant acquisition adjustment for GTT,
WT, PTT and SRT in 2008. The Company has acquired identifiable intangible assets
associated with the territories it serves through its acquisitions of various
companies, including non-compete agreements with the former CEOs of two acquired
businesses; the customer lists of its various businesses; and a multi-year
contract to provide telecommunications services to a large multi-services
operator in New England. Any excess of the total purchase price over the amounts
assigned to tangible and identifiable assets is recorded as
goodwill.
Effective
January 1, 2002, the Company adopted guidance which is included in ASC 350,
Intangibles-Goodwill and
Other, which establishes accounting and reporting standards for
intangible assets and goodwill. ASC 350 requires that goodwill and intangible
assets with indefinite useful lives no longer be amortized, but rather tested
for impairment at least annually or if an event occurs that potentially triggers
an impairment issue. ASC 350 also requires that intangible assets with definite
useful lives be amortized over their respective estimated useful lives and
reviewed for impairment in accordance with guidance which is included in ASC
360, Property, Plant, and
Equipment. The Company performed the required transition impairment tests
of goodwill and other intangibles in the first six months of adoption, and
determined that no impairment existed. In addition, the Company performs an
annual assessment of impairment as of December 31, unless events indicate
potential impairment should be considered as of another date.
The
Company performs a quarterly review of its identified intangible assets to
determine if facts and circumstances exist which indicate that the useful life
is shorter than originally estimated or that the carrying amount of assets may
not be recoverable. If such facts and circumstances do exist, the Company
assesses the recoverability of identified intangible assets by comparing the
projected undiscounted net cash flows associated with the related asset or group
of assets over their remaining lives against their respective carrying amounts.
Impairment, if any, is based on the excess of the carrying amount over the fair
value of those assets.
Revenue
Recognition
Local service
revenues. Local service revenue for monthly recurring local
services is billed in advance to a portion of the Company’s customers and in
arrears to the balance of the customers. The Company records revenue
for charges that have not yet been invoiced to its customers as unbilled revenue
when services are rendered. The Company records revenue billed in
advance as advance billings and defers recognition until such revenue is
earned. Long distance service is billed to customers in arrears based
on actual usage except when it is included in service bundles. The
Company records unbilled long distance revenue as unbilled revenue when services
are rendered. In bundles, unlimited usage is billed in arrears at a
flat rate.
43
OTELCO
INC.
NOTES
TO CONSOLIDATED FINANCIAL STATEMENTS
Network access
services. Network access revenue is derived from several
sources. Revenue for interstate access services is received through tariffed
access charges filed by the National Exchange Carrier Association (“NECA”) with
the Federal Communications Commission (“FCC”) on behalf of the NECA member
companies for our regulated subsidiaries. These access charges are billed by the
Company to interstate interexchange carriers and pooled with like-revenues from
all NECA member companies. A portion of the pooled access charge revenue
received by the Company is based upon its actual cost of providing interstate
access service, plus a return on the investment dedicated to providing that
service. The balance of the pooled access charge revenue received by the Company
is based upon the nationwide average schedule costs of providing interstate
access services. Rates for our competitive subsidiaries are set by FCC rule to
be no more than the interconnecting interstate rate of the predominant local
carrier. Revenue for intrastate access service is received through tariffed
access charges billed by the Company to the originating intrastate carrier using
access rates filed with the Alabama Public Service Commission (“APSC”), the
Maine Public Utilities Commission (“MPUC”), The Massachusetts Department of
Telecommunications and Cable (“MDTC”), the Missouri Public Service Commission
(“MPSC”), the New Hampshire Public Utilities Commission (“NHPUC”) and the West
Virginia Public Service Commission (“WVPSC”) and are retained by the Company.
Revenue for the intrastate/interLATA access service is received through tariffed
access charges as filed with the APSC, MDTC, MPSC, MPUC, NHPUC and WVPSC. These
access charges are billed to the intrastate carriers and are retained by the
Company. Revenue for terminating and originating long distance service is
received through charges for providing usage of the local exchange network. Toll
revenues are recognized when services are rendered.
Cable television, Internet and
transport services. Cable television, Internet and transport
service revenues are recognized when services are rendered. Operating revenues
from the lease of dark fiber covered by indefeasible rights-of-use (IRU)
agreements are recorded as earned. In some cases, the entire lease
payment is received at inception of the lease and recognized ratably over the
lease term after recognition of expenses associated with lease
inception. The Company has deferred revenue in the consolidated
balance sheet as of December 31, 2008 and 2009 of $739,736 and $698,352,
respectively.
Cash
and Cash Equivalents
Cash
equivalents are stated at cost plus accrued interest, which approximates fair
value. Cash equivalents are high-quality, short-term money market
instruments and highly liquid debt instruments with an original maturity of
three months or less when purchased. The cash equivalents are readily
convertible to known amounts of cash and are so near maturity that they present
insignificant risk of changes in value because of changes in interest
rates.
Accounts
Receivable
The
Company extends credit to its commercial and residential customers based upon a
written credit policy. Service interruption is the primary vehicle
for controlling losses. Accounts receivable are recorded at the
invoiced amount and do not bear interest. The allowance for doubtful
accounts is the Company’s best estimate for the amount of probable credit losses
in the Company’s existing accounts receivable. The Company
establishes an allowance for doubtful accounts based upon factors surrounding
the credit risk of specific customers, historical trends, and other
information. Receivable balances are reviewed on an aged basis and
account balances are charged off against the allowance after all means of
collection have been exhausted and the potential for recovery is considered
remote.
Materials
and Supplies
Materials
and supplies are stated at the lower of cost or market value. Cost is
determined using an average cost basis.
Property
and Equipment
Regulated
property and equipment is stated at original cost. Unregulated
property and equipment purchased through acquisitions is stated at its fair
value at the date of acquisition. Expenditures for improvements that
significantly add to productive capacity or extend the useful life of an asset
are capitalized. Expenditures for maintenance and repairs are
expensed when incurred. Depreciation of regulated property and
equipment is computed principally using the straight-line method over useful
lives determined by the APSC, MDTC, MPSC, MPUC, NHPUC and WVPSC as discussed
above. Depreciation of unregulated property and equipment primarily
employs the straight-line method over industry standard useful
lives.
44
OTELCO
INC.
NOTES
TO CONSOLIDATED FINANCIAL STATEMENTS
Long-Lived
Assets
The
Company reviews its long-lived assets for impairment at each balance sheet date
and whenever events or changes in circumstances indicate that the carrying
amount of an asset should be assessed. To determine if an impairment
exists, the Company estimates the future undiscounted cash flows expected to
result from the use of the asset being reviewed for impairment. If
the sum of these expected future cash flows is less than the carrying amount of
the asset, the Company recognizes an impairment loss in accordance with guidance
included in ASC 360, Property,
Plant, and Equipment. The amount of the impairment recognized is
determined by estimating the fair value of the assets and recording a loss for
the excess of the carrying value over the fair value.
Deferred
Financing Costs
Deferred
financing and loan costs consist of debt issuance costs incurred in obtaining
long-term financing, which are amortized over the life of the related
debt. Amortization of deferred financing and loan costs is classified
as “Interest expense”. When amendments to debt agreements are
considered to extinguish existing debt per guidance included in ASC 470, Debt, the remaining deferred
financing costs are amortized at the time of amendment.
Derivative
Financial Instruments
Derivative
financial instruments are accounted for under guidance included in ASC 815,
Derivatives and
Hedging. Under ASC 815, all derivatives are recorded on the balance sheet
as assets or liabilities and measured at fair value. The embedded exchange
feature of the Class B common stock was accounted for as a derivative liability.
This liability was adjusted to estimated fair value on each balance sheet date
with the offset to other non-operating income or expense. The model to estimate
the value is prepared by an outside expert and updated annually to reflect then
current market conditions. In addition, the Company has an effective hedge of
its interest rates associated with its long-term senior
debt. As of December 2009, there is no longer a financial test
for exchanges and the B share owners have requested that their shares be
exchanged for Income Deposit Securities (“IDS”) units.
The
Company is exposed to the market risk of adverse changes in interest rates. The
Company held an interest rate cap with a notional amount of $80 million and a
three month LIBOR cap rate of 3.0% that expired on December 21, 2009. As of
December 31, 2009, the Company had $168.5 million of senior debt and the
applicable margin was 4.0%. Changes in the fair value of the interest rate cap
are not included in earnings as they qualified for hedge accounting as an
effective hedge, but are reported as a component of accumulated other
comprehensive income. From July 5, 2007 through October 31, 2008, the portion of
the interest rate cap that exceeded the senior debt outstanding during that
period of $64.6 million was treated as an investment.
The cost
of the interest rate cap was expensed as interest over the five year effective
life of the hedge in accordance with its quarterly future value at the date of
inception.
Interest
rate swaps for 3 month LIBOR for $90 million notional amount for three years
beginning February 9, 2009 at 1.85% and for $60 million notional amount for two
years beginning February 9, 2010 at 2.0475% were executed to control interest
rate risk. From an accounting perspective, the documentation for both
swaps does not meet the technical requirements of ASC 815 to allow the swaps to
be considered highly effective as hedging instruments and therefore the
swaps do not qualify for hedge accounting. The change in fair value of the
swaps is charged or credited to income as a change in fair value of derivatives.
Over the life of the swaps, the cumulative change in value will be
zero.
Income
Taxes
The
Company accounts for income taxes using the asset and liability approach in
accordance with guidance included in ASC 740, Income Taxes. The
asset and liability approach requires the recognition of deferred tax
liabilities and assets for the expected future tax consequences of temporary
differences between the carrying amounts and the tax basis of assets and
liabilities. A valuation allowance is provided when it is more likely
than not that some portion or all of the deferred tax assets will not be
realized.
The
provision for income taxes consists of an amount for the taxes currently payable
and a provision for the tax consequences deferred to future
periods.
In July
2006, the Financial Accounting Standards Board (“FASB”) issued guidance included
in ASC 740, Income
Taxes. It clarifies the accounting for uncertainty in income
taxes and sets a consistent framework for preparers to use to determine the
appropriate level of tax reserve to maintain for uncertain tax
positions. This guidance uses a two-step approach wherein a tax
benefit is recognized if a position is more-likely-than-not to be
sustained. The amount of the benefit is then measured to be the
highest tax benefit which is greater than 50% likely to be
realized. ASC 740 also sets out disclosure requirements to enhance
transparency of an entity’s tax reserves. The Company adopted this
guidance as of January 1, 2007. The adoption of ASC 740 did not have
a material impact on our consolidated financial statements.
45
OTELCO
INC.
NOTES
TO CONSOLIDATED FINANCIAL STATEMENTS
Interest
and penalties related to income tax matters would be recognized in income tax
expense. As of December 31, 2009, we did not have an amount recorded
for interest and penalties.
The
Company conducts business in multiple jurisdictions and, as a result, one or
more subsidiaries file income tax returns in the U.S. federal, various state and
local jurisdictions. All tax years since 2002 are open for
examination by various tax authorities.
Fair
Value of Financial Instruments
The
carrying value of the Company’s financial instruments, including cash and cash
equivalents, accounts receivable, accounts payable, derivative liabilities and
long-term notes payable approximate their net book value as of December 31, 2008
and 2009.
Comprehensive
Income
Comprehensive
income equals net income plus other comprehensive income. Other
comprehensive income refers to revenue, expenses, gains and losses, which are
reflected in retained earnings but excluded from net income.
Income
per Common Share
The
Company computes net income per Class A common share in accordance with the
provision included in ASC 260, Earnings per
Share. Under ASC 260, basic and diluted income per share is
computed by dividing net income available to stockholders by the weighted
average number of common shares and common share equivalents outstanding during
the period. Basic income per common share excludes the effect of
potentially dilutive securities, while diluted income per common share reflects
the potential dilution that would occur if securities or other contracts to
issue common shares were exercised for, converted into or otherwise resulted in
the issuance of common shares. Net income is adjusted for the Class B
derivative liability in calculating diluted earnings.
Recently
Adopted Accounting Pronouncements
In June
2009, the FASB issued ASC 105, Generally Accepted Accounting
Principles, or ASC 105. ASC 105 established the FASB Standards
Accounting Codification (“Codification”) as the single source of authoritative
U.S. generally accepted accounting principles (“GAAP”) recognized by the FASB to
be applied to nongovernmental entities, other than guidance issued by the
Securities and Exchange Commission (“SEC”). The Codification
reorganized existing U.S. accounting standards issued by the FASB and other
related standard setters into a single source of authoritative accounting
principles arranged by topic. The guidance is effective for financial
statements issued for interim reporting periods ending after September 15,
2009. The adoption of the Codification changed the Company’s
references to U.S. GAAP accounting standards but did not impact our consolidated
financial statements.
In April
2009, the FASB issued guidance, which is now part of ASC 825, Financial
Instruments. This guidance requires disclosures about fair
value of financial instruments for interim reporting periods and is effective
for interim reporting periods ending after June 15, 2009. The
adoption of this guidance did not have a material impact on our consolidated
financial statements.
In April
2009, the FASB issued guidance, which is now part of ASC 820, Fair Value Measurements and
Disclosures. This guidance provides for estimating fair value
when the volume and level of activity for the asset or liability have
significantly decreased. This guidance is effective for interim
reporting periods ending after June 15, 2009. The adoption of this
guidance did not have a material impact on our consolidated financial
statements.
In April
2009, the FASB issued guidance, which is now part of ASC 320, Investments–Debt and Equity
Securities. This amends the other-than-temporary impairment
guidance for debt securities to make the guidance more operational and to
improve the presentation and disclosure of other-than-temporary impairments on
debt and equity securities in the financial statements. This guidance
is effective for interim reporting periods ending after June 15,
2009. The adoption of this guidance did not have a material impact on
our consolidated financial statements.
46
OTELCO
INC.
NOTES
TO CONSOLIDATED FINANCIAL STATEMENTS
In April
2009, the FASB issued revised guidance, which is now part of ASC 805, Business
Combinations. The revised guidance addresses the initial
recognition, measurement and subsequent accounting for assets and liabilities
arising from contingencies in a business combination, and requires that such
assets acquired or liabilities assumed be initially recognized at fair value at
the acquisition date if fair value can be determined during the measurement
period. If the acquisition-date fair value cannot be determined, the
asset acquired or liability assumed arising from a contingency is recognized
only if certain criteria are met. The revised guidance also requires
that a systematic and rational basis for subsequently measuring and accounting
for the assets or liabilities be developed depending on their
nature. This guidance is effective for assets or liabilities arising
from contingencies in business combinations for which the acquisition date is on
or after the beginning of the first annual reporting period beginning on or
after December 15, 2008. The adoption of this guidance did not have a
material impact on our consolidated financial statements.
In May
2009, the FASB issued guidance, which is now part of ASC 855, Subsequent
Events. The guidance establishes general standards for
accounting for and disclosure of events that occur after the balance sheet date
but before financial statements are available to be issued (“subsequent
events”). More specifically, the guidance sets forth the period after
the balance sheet date during which management of a reporting entity should
evaluate events or transactions that may occur for potential recognition in the
financial statements, identifies the circumstances under which an entity should
recognize events or transactions occurring after the balance sheet date in its
financial statements and the disclosures that should be made about events or
transactions that occur after the balance sheet date. ASC 855
provides largely the same guidance on subsequent events which previously existed
only in auditing literature. The guidance is effective for interim
reporting periods ending after June 15, 2009. The adoption of ASC 855
required additional disclosures but did not have an impact on our consolidated
financial statements.
In August
2009, the FASB issued Accounting Standards Update (“ASU”) 2009-05, Measuring Liabilities at Fair
Value, or ASU 2009-05, an update to ASC 820, Fair Value Measurements and
Disclosures. ASU 2009-05 provides amendments to reduce
potential ambiguity in financial reporting when measuring the fair value of
liabilities. Among other provisions, this update provides
clarification that in circumstances, in which a quoted price in an active market
for the identical liability is not available, a reporting entity is required to
measure fair value using one or more of the valuation techniques described in
the update. ASU 2009-05 is effective for interim reporting periods
ending after August 2009. The adoption of this update did not have a
material impact on our consolidated financial statements.
In February 2010, the FASB issued ASU
2010-09, Amendments to Certain
Recognition and Disclosure Requirements, or ASU 2010-09, an update to ASC
855, Subsequent
Events. ASU 2010-09 removes the requirement for an SEC filer
to disclose a date through which subsequent events have been evaluated in both
issued and revised financial statements. Revised financial statements
include financial statements revised as a result of either correction of an
error or retrospective application of U.S. GAAP. The FASB also
clarified that if the financial statements have been revised, then an entity
that is not an SEC filer should disclose both the date that the financial
statements were issued or available to be issued. The FASB believes
these amendments remove potential conflicts with the SEC’s
literature. ASU 2010-09 is effective upon issuance except for the use
of the issued date for conduit debt obligors, which is effective for interim or
annual periods ending after June 15, 2010. The adoption of this
update did not have a material impact on our consolidated financial
statements.
Recent
Accounting Pronouncements
In
October 2009, the FASB issued ASU 2009-13, Multiple-Deliverable Revenue
Arrangements – a consensus of the FASB Emerging Issues Task Force, or ASU
2009-13, an update to ASC 605, Revenue Recognition. ASU 2009-13
provides application guidance on whether multiple deliverables exist, how the
deliverables should be separated, and how the consideration should be allocated
to one or more units of accounting. ASU 2009-13 establishes a selling
price hierarchy for determining the selling price of a
deliverable. The selling price used for each deliverable will be
based on vendor-specific objective evidence, if available, third-party evidence
if vendor-specific evidence is not available, or estimated selling price if
neither vendor-specific or third-party evidence is available. The
Company will be required to apply this guidance prospectively for revenue
arrangements entered into or materially modified for the fiscal year beginning
on or after June 15, 2010; however, earlier application is
permitted. The Company has not determined the impact that this update
may have on its consolidated financial statements.
In
January 2010, the FASB issued ASU 2010-06, Improving Disclosures about Fair
Value Measurements, or ASU 2010-06, an update to ASC 820, Fair Value Measurements and
Disclosures. ASU 2010-06 provides more robust disclosures
about (1) the different classes of assets and liabilities measured at fair
value, (2) the valuation techniques and inputs used, (3) the activity in Level 3
fair value measurements, and (4) the transfers between Levels 1, 2, and
3. The new disclosures and clarifications of existing disclosures are
effective for interim and annual reporting periods beginning after December 15,
2009, except for the disclosures about purchases, sales, issuances, and
settlements in the roll forward of activity in Level 3 fair value
measurements. Those disclosures are effective for fiscal years
beginning after December 15, 2010, and for interim periods within those fiscal
years. The Company has not determined the impact that this update may
have on its consolidated financial statements.
47
OTELCO
INC.
NOTES
TO CONSOLIDATED FINANCIAL STATEMENTS
Reclassifications
Certain
items in prior year’s consolidated financial statements have been reclassified
to conform with 2009 presentation.
|
2.
|
Income
Deposit Securities Issued
|
On July
5, 2007, the Company completed its offering of 3,000,000 IDS units through an
underwritten public offering at $19.80 per unit. The price per unit
is comprised of $11.68 allocated to each share of Class A common stock and $8.11
allocated to each senior subordinated note, plus $0.01 representing accrued
interest from June 30, 2007. The Company used the net proceeds of
approximately $55.4 million to repay senior secured indebtedness under its
credit facility, reducing senior debt from $120.0 million to approximately $64.6
million. The $8.11 allocated to each senior subordinated note
represents a premium of $0.61 over the $7.50 stated principal
amount. The additional IDS units increase senior subordinated debt by
$22.5 million, bringing senior subordinated debt to approximately $103.6
million. Therefore, total debt was reduced from approximately $201.1
to $170.0 million as of the offering date.
The
following is a summary of the offering receipts and disbursements and related
use of funds:
|
Receipts
|
||||
|
Proceeds
from issuance of IDS units
|
$ | 59,400,000 | ||
|
Disbursements
|
||||
|
Direct
cost of subsequent public offering
|
2,314,980 | |||
|
Principal
repayment of long-term debt
|
55,353,032 | |||
|
Loan
origination costs
|
1,832,972 | |||
|
Total
|
59,500,984 | |||
|
Net
disbursements
|
$ | (100,984 | ) | |
|
3.
|
Acquisitions
|
On
October 31, 2008, the Company acquired 100% of the outstanding common stock of
the CR Companies from CRC. GH owns 100% of its operating subsidiary
GTT. WH owns 100% of its operating subsidiary WT. PTH owns 100% of its operating
subsidiaries, PTT, SRT, PTN, and CDAC. These operating subsidiaries provide
telecommunications solutions, including voice, data and Internet services, to
residential and business customers in portions of Massachusetts, Maine and West
Virginia and extend the Company’s presence in the New England
market. The acquisition added over 24,000 retail access line
equivalents to the Company’s presence in Maine; almost 5,000 retail access line
equivalents in Massachusetts and West Virginia; and a wholesale business in New
England.
The
acquisition agreement relating to the CR Companies provided for cash
consideration of $101,329,000 subject to adjustment as provided in the
acquisition agreement, plus transaction costs. The purchase price was
$108,832,865, including transaction costs. The excess of the purchase price over
the market value of assets and liabilities is reflected as goodwill of
$53,619.643. The goodwill related to the acquisition is not
deductible for tax purposes. The aggregate consideration paid for the
acquisition was as follows:
|
Cash
received
|
$ | (20,167 | ) | |
|
Additional
senior debt notes payable
|
108,853,032 | |||
|
Purchase
price
|
$ | 108,832,865 |
The
allocation of the net purchase price for the CR Companies acquisition was as
follows:
48
OTELCO
INC.
NOTES
TO CONSOLIDATED FINANCIAL STATEMENTS
|
Cash
|
$ | 247,285 | ||
|
Other
current assets
|
4,602,298 | |||
|
Property
and equipment
|
24,034,722 | |||
|
Intangible
assets
|
37,800,000 | |||
|
Goodwill
|
53,619,643 | |||
|
Other
assets
|
6,142,596 | |||
|
Current
liabilities
|
(2,744,832 | ) | ||
|
Deferred
income tax liabilities
|
(14,844,479 | ) | ||
|
Other
liabilities
|
(24,368 | ) | ||
|
Purchase
price
|
$ | 108,832,865 |
Property
and equipment at the time of acquisition had a fair value of $24.0 million and
depreciation lives consistent with those shown in the Property and Equipment
Note. The intangible assets at time of acquisition included regulated
and unregulated customer based assets at fair value of $17 million which had
remaining lives of six to nine years and a non-competition agreement fair valued
at $1.2 million which had a remaining life of one year. Unregulated
contract based assets have a fair value of $19.6 million and remaining lives of
seven years.
Prior to
the closing of the acquisition, the Company entered into a second and amended
restated credit agreement, dated as of October 31, 2008, to amend and restate
the amended and restated credit agreement, dated as of July 3, 2006, as amended
on July 13, 2007, by and among the Company and the other credit parties to the
agreement and General Electric Capital Corporation, as a lender and agent for
the lenders, and other lenders from time to time party thereto. The
credit facilities under the amended and restated credit agreement are comprised
of:
|
●
|
Term
loans of $173.5 million due October 31, 2013, consisting of an original
term loan of $64.6 million, and an additional term loan of $108.9 million,
used to finance the acquisition and related transaction costs and to
provide working capital for the Company and its subsidiaries and for other
corporate purposes; and
|
|
●
|
A
revolving loan commitment of up to $15
million.
|
The term
loan facility was fully drawn concurrent with closing. Interest rates
applicable to the term loan and any revolving loans were an index rate plus
3.00% or LIBOR plus 4.00%. In addition, there are fees associated
with undrawn revolver balances and certain annual fees.
The
acquisition was accounted for using the purchase method of accounting and
accordingly, the accompanying financial statements include the financial
position and results of operations from the date of acquisition.
The
following unaudited pro forma information presents the combined results of
operations of the Company as though the acquisition of the CR Companies had
occurred at the beginning of the preceding year. The results include
certain adjustments, including increased interest expense on notes payable and
increased amortization expense related to intangible assets. The pro
forma financial information does not necessarily reflect the results of
operations had the acquisition been completed at the beginning of the period or
those which may be obtained in the future.
|
Unaudited
|
||||||||
|
2007
|
2008
|
|||||||
|
Revenues
|
$ | 101,108,434 | $ | 104,797,452 | ||||
|
Income
from operations
|
18,335,761 | 19,552,707 | ||||||
|
Net
loss
|
(5,394,454 | ) | (5,125,094 | ) | ||||
|
Basic
net loss per share
|
$ | (0.43 | ) | $ | (0.40 | ) | ||
|
Diluted
net loss per share
|
$ | (0.43 | ) | $ | (0.40 | ) | ||
As of
January 1, 2010, HHC, BH, PKC, MMeT, GH, WH and PTH were merged into Otelco
Inc.
49
OTELCO
INC.
NOTES
TO CONSOLIDATED FINANCIAL STATEMENTS
|
4.
|
Goodwill
and Intangible Assets
|
In June
2001, FASB issued guidance included in ASC 350, Intangibles-Goodwill and
Other. ASC 350 requires that in periods beginning
after December 15, 2001, goodwill shall no longer be
amortized. Instead, goodwill shall be tested for
impairment. The Company adopted this guidance in 2002 and ceased
amortizing goodwill, and performs an annual impairment test to determine whether
the carrying value of goodwill exceeds its fair market value. Based
on the results of its impairment test, the Company does not believe that there
is an impairment of the goodwill balance at December 31, 2008 or 2009,
respectively.
Intangible
assets are summarized as follows:
|
December
31, 2008
|
December
31, 2009
|
|||||||||||||||||||||||
|
Carrying
Value
|
Accumulated
Amortization
|
Net
Value
|
Carrying
Value
|
Accumulated
Amortization
|
Net
Value
|
|||||||||||||||||||
|
Customer
relationships
|
$ | 27,553,440 | $ | (2,946,129 | ) | $ | 24,607,311 | $ | 27,770,417 | $ | (7,603,627 | ) | $ | 20,166,790 | ||||||||||
|
Contract
relationships
|
19,600,000 | (816,667 | ) | 18,783,333 | 19,600,000 | (5,600,000 | ) | 14,000,000 | ||||||||||||||||
|
Non
competition
|
1,200,000 | (200,000 | ) | 1,000,000 | 53,903 | (2,578 | ) | 51,325 | ||||||||||||||||
|
Total
|
$ | 48,353,440 | $ | (3,962,796 | ) | $ | 44,390,644 | $ | 47,424,320 | $ | (13,206,205 | ) | $ | 34,218,115 | ||||||||||
These
intangible assets have a range of 1 to 15 years of useful lives and utilize both
the sum-of-the-years’ digits and straight-line methods of amortization, as
appropriate. The following table presents current and expected
amortization expense of the existing intangible assets as of December 31, 2009
for each of the following periods:
Aggregate
amortization expense:
|
For
the year ended December 31, 2007
|
$ | 2,594,943 | ||
|
For
the year ended December 31, 2008
|
$ | 3,835,535 | ||
|
For
the year ended December 31, 2009
|
$ | 10,443,409 |
Expected
amortization expense for the years ending December 31,
|
2010
|
8,274,583 | |||
|
2011
|
7,038,405 | |||
|
2012
|
5,720,229 | |||
|
2013
|
4,473,199 | |||
|
2014
|
3,237,523 | |||
|
Thereafter
|
5,474,176 | |||
|
Total
|
$ | 34,218,115 |
Changes
in the carrying amount of goodwill were as follows:
|
Balance,
December 31, 2008
|
$ | 189,334,837 | ||
|
CR
Companies acquisition adjustments:
|
||||
|
True-up
income tax accounts
|
(974,583 | ) | ||
|
Restructuring
plan liability
|
(170,176 | ) | ||
|
Balance,
December 31, 2009
|
$ | 188,190,078 |
50
OTELCO
INC.
NOTES
TO CONSOLIDATED FINANCIAL STATEMENTS
|
5.
|
Property
and Equipment
|
A summary
of property and equipment from continuing operations is shown as
follows:
|
Estimated
|
December
31,
|
|||||||||||
|
Life
|
2008
|
2009
|
||||||||||
|
Land
|
$ | 1,181,338 | $ | 1,104,528 | ||||||||
|
Building
and improvements
|
20-40 | 11,244,234 | 11,353,840 | |||||||||
|
Telephone
equipment
|
6-20 | 201,217,430 | 205,838,648 | |||||||||
|
Cable
television equipment
|
7 | 8,963,865 | 9,628,087 | |||||||||
|
Furniture
and equipment
|
8-14 | 2,827,769 | 2,889,110 | |||||||||
|
Vehicles
|
7-9 | 5,414,286 | 5,553,616 | |||||||||
|
Computer
software equipment
|
5-7 | 12,851,152 | 13,315,358 | |||||||||
|
Internet
equipment
|
5 | 3,061,251 | 3,426,905 | |||||||||
|
Total
property, plant and equipment
|
246,761,325 | 253,110,092 | ||||||||||
|
Accumulated
depreciation
|
(171,354,263 | ) | (184,081,119 | ) | ||||||||
|
Net
property, plant and equipment
|
$ | 75,407,062 | $ | 69,028,973 | ||||||||
The
Company’s composite depreciation rate for property and equipment was 21.5%,
20.2%, and 20.9% in 2007, 2008 and 2009, respectively. Depreciation
expense for the years ended December 31, 2007, 2008 and 2009 was
$11,751,673, $11,772,191 and $14,444,714, respectively.
|
6.
|
Other
Accounts Receivable
|
Other
accounts receivable consist of the following:
|
December
31,
|
||||||||
|
2008
|
2009
|
|||||||
|
Carrier
access bills receivable
|
$ | 3,110,123 | $ | 1,678,039 | ||||
|
Receivables
from Alabama Service Fund
|
453,159 | 443,169 | ||||||
|
Wholesale
contracts receivable
|
735,013 | 880,163 | ||||||
|
Other
miscellaneous
|
49,749 | 199,574 | ||||||
| $ | 4,348,044 | $ | 3,200,945 | |||||
The
carrier access bills receivable at December 31, 2009 includes an allowance for
FairPoint Communications (“FRT”) which filed for bankruptcy on October 25,
2009. In Maine and New Hampshire, several Company subsidiaries have
business relationships with FRT as a customer and/or supplier of
telecommunications services.
|
7.
|
Investments
|
Investments
consist of the following:
|
December
31,
|
||||||||
|
2008
|
2009
|
|||||||
|
Investment
in CoBank stock
|
$ | 1,474,830 | $ | 1,474,920 | ||||
|
Rental
property
|
474,173 | 448,663 | ||||||
|
Other
miscellaneous
|
66,580 | 67,575 | ||||||
| $ | 2,015,583 | $ | 1,991,158 | |||||
The
investment in CoBank stock is carried at historical cost due to no readily
determinable fair value for those instruments being available. This
investment consists of patronage certificates that represent ownership in the
financial institution where the Company has, and in the past, had,
debt. These certificates yield dividends on an annual basis, and the
investment is redeemed ratably subsequent to the repayment of the
debt.
51
OTELCO
INC.
NOTES
TO CONSOLIDATED FINANCIAL STATEMENTS
|
8.
|
Leases
|
Minimum
future rental commitments under non-cancellable operating leases, primarily for
real property and office facilities at December 31, 2009, consist of the
following:
|
2010
|
$ | 468,314 | ||
|
2011
|
199,718 | |||
|
2012
|
127,524 | |||
|
2013
|
124,849 | |||
|
2014
|
123,734 | |||
|
Thereafter
|
547,380 | |||
|
Total
|
$ | 1,591,519 |
Rent
expense in 2009 was $481,099.
|
9.
|
Long-Term
Debt
|
The
Company’s credit agreement with General Electric Capital Corporation, originally
dated December 21, 2004, has been amended and restated on several occasions to
reflect requirements for funds to complete two acquisitions and the use of
proceeds from the Company’s successful offering of 3,000,000 IDS units on July
5, 2007. On July 13, 2007, the Company amended that agreement to,
among other things, reduce the margin it pays on the loan to vary with the
Company’s total leverage ratio. At that time, the variable margin based on
leverage was 2% over LIBOR. On October 31, 2008, the Company completed its
second amendment and restatement, increasing the principal balance from $64.6
million to $173.5 million on October 31, 2008 for the acquisition of the CR
Companies, changing the variable margin, and extending the maturity from July 3,
2011 to October 31, 2013. The variable margin based on leverage is 4%
over LIBOR. On August 8, 2009, the Company made a voluntary
prepayment of $5.0 million, reducing the credit facility notes payable balance
to $168.5 million.
Long-term
notes payable consists of the following:
52
OTELCO
INC.
NOTES
TO CONSOLIDATED FINANCIAL STATEMENTS
|
December
31,
|
||||||||
|
2008
|
2009
|
|||||||
|
Term
credit facility, General Electric Capital Corporation; variable
interest rate of 6.22% and 4.27% at December 31, 2008 and
2009, respectively. There are no scheduled principal payments.
Interest
payments are due on the last day of each LIBOR period or at three
month intervals, whichever date comes first. Interest rate
is the index
rate plus the applicable term loan index margin or the applicable
LIBOR rate plus the applicable term loan LIBOR margin. On
July 5, 2007, the Company repaid $55,353,032 in senior debt with
the proceeds from its offering of 3,000,000 IDS units. The
Company also made a $5.0 million voluntary prepayment on August 8, 2009.
The unpaid balance will be due on October 31, 2013
|
$ | 173,500,000 | $ | 168,500,000 | ||||
|
13%
Senior subordinated notes, due 2019; interest payments are
due quarterly. On July 5, 2007, the Company sold 3,000,000
IDS units that included $22,500,000 in senior subordinated
debt and, $1,830,791 in premium paid for debt. Premium
amortization for the years ended December
31, 2008, and 2009 was $73,224 and $82,212 respectively.
|
96,799,513 | 96,717,301 | ||||||
|
13%
Senior subordinated notes, held separately, due 2019; interest
payments are due quarterly.
|
8,500,000 | 8,500,000 | ||||||
|
Total
long-term notes payable
|
$ | 278,799,513 | $ | 273,717,301 | ||||
|
Less:
current portion
|
– | – | ||||||
|
Long-term
notes payable
|
$ | 278,799,513 | $ | 273,717,301 | ||||
Associated
with these long-term notes payable, the Company capitalized $8.1 million in
deferred financing costs associated with the credit facility and the 13% senior
subordinated notes put in place on December 21, 2004. On July 3,
2006, an additional $1,545,743 in deferred financing costs was
capitalized. On July 5, 2007, $1,064,526 in deferred finance costs
were written off associated with the reduction in long-term notes payable from
the proceeds of its offering of 3,000,000 IDS units. On October 31, 2008, an
additional $5,311,138 in deferred financing costs was capitalized associated
with the acquisition of the CR Companies. $1,406,088 in deferred financing costs
were written-off associated with the effective extinguishment of the existing
indebtedness at time of closing. The credit facility is secured by
the total assets of the subsidiary guarantors.
The
Company has a revolving credit facility of $15,000,000. There was no
balance as of December 31, 2008 and 2009. The interest rate is the
index rate plus a variable margin or LIBOR rate plus a variable margin,
whichever is applicable. The range of margins can vary from
3.5% to 4.25%, depending on our total debt leverage. The Company pays a
commitment fee of 0.50% per annum, payable quarterly in arrears, on the unused
portion of the revolver loan. The commitment fee expense was $76,250
and $76,042 for the years ended December 31, 2008 and 2009,
respectively.
The
deferred financing costs related to the issuance of debt is capitalized and
amortized over the life of the debt obligation. Amortization of deferred
financing costs is reflected in interest expense. The amortization of deferred
financing costs also includes unamortized loan cost that is expensed due to the
related debt being extinguished. The unamortized loan cost that was expensed and
included in amortization expense for both years ended December 31, 2008 and 2009
was $2,874,164 and $1,351,906, respectively.
Maturities
of long-term debt for the next five years are as follows:
53
OTELCO
INC.
NOTES
TO CONSOLIDATED FINANCIAL STATEMENTS
|
2010
|
– | ||||
|
2011
|
– | ||||
|
2012
|
– | ||||
|
2013
|
168,500,000 | ||||
|
2014
|
– | ||||
|
Thereafter
|
103,575,498 | ||||
|
Total
principal
|
$ | 272,075,498 | |||
|
Unamortized
premium
|
1,641,803 | ||||
|
Total
|
$ | 273,717,301 |
The above
schedule of maturities of long-term debt excludes the $4.1 million liquidation
value of Class B common shares convertible into senior subordinated notes in the
mezzanine section of the consolidated balance sheet and includes the premium
paid for the debt associated with the 3,000,000 IDS units issued July 5,
2007.
The
Company’s long-term notes payable agreement is subject to certain financial
covenants and restrictions on indebtedness, financial guarantees, business
combinations and other related items. As of December 31, 2009, the
Company is in compliance with all covenants.
|
10.
|
Derivative
and Hedge Activities
|
An
interest rate cap was purchased on December 21, 2004, coincident with the
closing of our initial public offering. The interest rate cap was purchased to
mitigate the risk of rising interest rates by capping the rate at 3% for the
three month LIBOR index plus the applicable margin on $80 million in senior debt
for five years. On July 5, 2007, the Company repaid $55,353,032 in debt,
reducing its senior debt below the level of the rate cap. The balance of the cap
at that time was considered as an investment and adjustments were made to
accumulated other comprehensive income to reflect this change. On October 31,
2008, the Company implemented its second amended and restated credit agreement,
increasing senior debt to $173.5 million in conjunction with the acquisition of
the CR Companies. The full $80 million rate cap again became effective as a
hedge from that date forward.
The
second amended and restated credit agreement required that the Company acquire
interest rate protection for at least half of the $173.5 million senior debt
through at least October 31, 2010. The Company acquired two interest rate swaps
with approved counterparties. The first swap has a notional amount of $90
million with the Company paying a fixed rate of 1.85% and the counterparty
paying a variable rate based upon the three month LIBOR interest rate. It is
effective from February 9, 2009 through February 8, 2012. The second swap has a
notional amount of $60 million with the Company paying a fixed rate of 2.0475%
and the counterparty paying a variable rate based upon the three month LIBOR
interest rate. It is effective from February 9, 2010 through February 8,
2012. From an accounting perspective, the documentation for both
swaps does not meet the technical requirements of ASC 815 to allow the swaps to
be considered highly effective as hedging instruments and therefore the
swaps do not qualify for hedge accounting. The change in fair value of the
swaps is charged or credited to income as a change in fair value of derivatives.
Over the life of the swaps, the cumulative change in value will be
zero.
Changes
in the fair value of the effective portion of the interest rate hedges are not
included in earnings but are reported as a component of accumulated other
comprehensive income. Changes in the fair value of interest rate
hedges which do not technically qualify for hedge accounting are reported in the
change in fair value of derivatives.
The cost
of the effective portion of the interest rate cap was expensed as interest over
the effective life of the hedge in accordance with the quarterly value of the
caplets as determined at the date of inception. The expense related
to the ineffective portion of the interest rate cap in 2008 is reflected in the
change in fair value of derivatives. For the years ended December 31,
2008 and 2009, the cost of the effective portion of the interest rate cap was
$1,029,264 and $1,168,522 respectively.
The
corresponding other comprehensive income related to the ineffective portion of
the hedge at July 5, 2007 which totaled approximately $254,000 was reclassified
from other comprehensive income to other income to reflect this
change.
|
11.
|
Income
Taxes
|
Income
tax expense for the years ended December 31, 2007, 2008 and 2009 is summarized
below:
54
OTELCO
INC.
NOTES
TO CONSOLIDATED FINANCIAL STATEMENTS
|
For
the Years Ended December 31,
|
||||||||||||
|
2007
|
2008
|
2009
|
||||||||||
|
Federal
income taxes
|
||||||||||||
|
Current
|
$ | (237,619 | ) | $ | – | $ | 114,947 | |||||
|
Deferred
|
(135,813 | ) | (230,915 | ) | (1,474,119 | ) | ||||||
|
Total
federal tax expense (benefit)
|
(373,432 | ) | (230,915 | ) | (1,359,172 | ) | ||||||
|
State
income taxes
|
||||||||||||
|
Current
|
72,015 | 85,470 | 26,222 | |||||||||
|
Deferred
|
(72,958 | ) | 174,255 | (33,679 | ) | |||||||
|
Total
state tax expense (benefit)
|
(943 | ) | 259,725 | (7,457 | ) | |||||||
|
Total
tax expense (benefit)
|
$ | (374,375 | ) | $ | 28,810 | $ | (1,366,629 | ) | ||||
Total
income tax expense (benefit) from continuing operations was different than that
computed by applying U.S. federal income tax rates to income from continuing
operations before income taxes for the years ended December 31, 2007, 2008 and
2009. The reasons for the differences are presented below:
|
For
the Years Ended December 31,
|
||||||||||||
|
2007
|
2008
|
2009
|
||||||||||
|
Federal
income tax at statutory rate
|
34 | % | 35 | % | 35 | % | ||||||
|
Federal
income tax provision (benefit) at statutory rate
|
$ | (66,299 | ) | $ | 84,939 | $ | (1,569,554 | ) | ||||
|
Change
in fair value of derivative
|
(329,896 | ) | (113,421 | ) | 474,166 | |||||||
|
State
income tax (provision), net of federal income tax effects
|
(622 | ) | 168,821 | (4,847 | ) | |||||||
|
Other
|
22,442 | (111,529 | ) | (266,394 | ) | |||||||
|
Provision
(benefit) on income taxes
|
$ | (374,375 | ) | $ | 28,810 | $ | (1,366,629 | ) | ||||
|
Effective
income tax rate
|
192.0 | % | 11.9 | % | 30.5 | % | ||||||
As of
December 31, 2009 the Company has U.S. federal and state net operating loss
carryforwards of $9.2 million and $12.5 million, respectively. These
net operating loss carryforwards expire at various times beginning in 2020
through 2029. Included in these losses are $6.3 million of federal
and $2.3 million of state losses related to the acquisition of the CR companies
referenced in Note 3. These acquired losses are subject to annual
limitations imposed by rules under the internal Revenue Code.
During
2009, the Company took advantage of the 5-year net operating loss carryback
provisions of the Worker, Homeownership, and Business Act of
2009. Approximately, $1.7 million of the 2008 net operating loss was
carried back to 2004 for a refund of $0.4 million.
The tax
effects of temporary differences that give rise to significant portions of the
deferred tax assets and deferred tax liabilities as of December 31, 2008 and
2009 are presented below:
55
OTELCO
INC.
NOTES
TO CONSOLIDATED FINANCIAL STATEMENTS
|
December
31,
|
||||||||
|
2008
|
2009
|
|||||||
|
Deferred
tax liabilities:
|
||||||||
|
Amortization
|
$ | (19,660,737 | ) | $ | (23,066,247 | ) | ||
|
Depreciation
|
(11,576,537 | ) | (9,166,193 | ) | ||||
|
Amortized
intangibles
|
(14,511,446 | ) | (9,990,208 | ) | ||||
|
Prepaid
expense
|
(213,682 | ) | (394,850 | ) | ||||
|
Other
|
– | (16,614 | ) | |||||
|
Total
deferred tax liabilities
|
$ | (45,962,402 | ) | $ | (42,634,112 | ) | ||
|
Deferred
tax assets:
|
||||||||
|
Deferred
Compensation
|
$ | 329,785 | $ | 345,781 | ||||
|
Federal
net operating loss carryforwards
|
4,599,500 | 3,216,433 | ||||||
|
Alternative
minimum credits carryforwards
|
254,458 | 507,560 | ||||||
|
State
net operating loss carryforwards
|
495,212 | 272,811 | ||||||
|
Advance
payments
|
304,637 | 288,497 | ||||||
|
Bad
debt
|
435,600 | 292,434 | ||||||
|
Other
|
305,876 | 303,445 | ||||||
|
Total
deferred tax assets
|
$ | 6,725,068 | $ | 5,226,961 | ||||
The
Company expects to owe alternative minimum tax of approximately $74,000 for
2009.
Effective
January 1, 2007, the Company adopted the provision included in ASC 740, Income Taxes. ASC 740
clarifies the accounting for uncertainty in income taxes recognized in an
enterprise’s financial statements. ASC 740 prescribes a recognition
threshold and measurement attribute for the financial statement recognition and
measurement of a tax position taken or expected to be taken in a tax
return. This pronouncement also provides guidance on de-recognition,
classification, interest and penalties, accounting in interim periods,
disclosure and transition. Any interest and penalties assessed by a taxing
authority are reflected in interest expense and selling, general and
administrative expenses, respectively, in the Consolidated Statements of
Operations. The adoption of ASC 740 did not result in the identification of
material uncertain tax positions through December 31, 2009.
|
12.
|
Employee
Benefit Program
|
Employees
of all subsidiaries except BTC participate in a defined contribution savings
plan under Section 401(k) of the Internal Revenue Code, which is sponsored by
the Company. The terms of the plan provide for an elective
contribution from employees not to exceed $15,500, $15,500, and $16,500 for
2007, 2008 and 2009, respectively. The Company matches the employee’s
contribution up to 6% of the employee’s annual compensation. For the
years ended December 31, 2007, 2008 and 2009, the total expense associated with
this plan was $515,750, $486,737 and $713,364, respectively.
The
employees of BTC participate in a multiemployer Retirement and Security Program
(“RSP”) as a defined benefit plan and a Savings Plan (“SP”) provided through the
National Telecommunications Cooperative Association
(“NTCA”). Participation in the RSP requires a minimum employee
contribution of 1% of their annual compensation. The Company
contributes 10.1%, 10.5%, and 9.4% for 2007, 2008 and 2009, respectively of
their annual compensation for every participating employee. On
October 1, 2009, the Company reduced its contribution from 10.5% to
6%. SP is a defined contribution savings plan under Section 401(k) of
the Internal Revenue Code to which the Company contributes 1% , 0%, and 0% for
2007, 2008 and 2009 respectively of employee earnings and the employee can make
additional voluntary contributions as desired with no additional Company
contribution. For the years ended December 31, 2007, 2008 and 2009
the total expense associated with these plans was $119,880, $85,003 and $70,271
respectively. The reduced contribution in 2008 was partially the
result of the NTCA suspension of a contribution surcharge imposed in
2007.
Employees
of the CR Companies participated in a defined contribution savings plan under
Section 401(k) of the Internal Revenue code from October 31, 2008 to December
31, 2008, which was sponsored by the Company. The terms of the plan
provided for elective contributions from employees not to exceed $15,500 for
2008. The Company matches 50% of the employee’s contribution up to 6%
of the employee’s annual pay excluding any bonus. From the date of
acquisition through December 31, 2008, the total expense associated with this
plan was $22,271. In 2009, employees of the CR Companies participated
in the defined contribution savings plan mentioned in the first paragraph
above.
56
OTELCO
INC.
NOTES
TO CONSOLIDATED FINANCIAL STATEMENTS
|
13.
|
Income
(Loss) per Common Share and Potential Common
Share
|
Basic
income (loss) per common share is computed by dividing net income (loss) by the
weighted-average number of shares outstanding for the period. Diluted
income (loss) per common share reflects the potential dilution that could occur
if the Class B common stock were exercised into IDS units. Class B
common stock is convertible on a one-for-one basis into IDS units, each of which
includes a Class A common share.
A
reconciliation of the common shares for the Company’s basic and diluted income
(loss) per common share calculation is as follows:
|
For
the Years Ended December 31,
|
||||||||||||
|
2007
|
2008
|
2009
|
||||||||||
|
Weighted
average of common shares-basic
|
11,156,185 | 12,676,733 | 12,676,733 | |||||||||
|
Effect
of dilutive securities
|
544,671 | 544,671 | 544,671 | |||||||||
|
Weighted
average common shares and potential
|
||||||||||||
|
common
shares-diluted
|
11,700,856 | 13,221,404 | 13,221,404 | |||||||||
|
Net
income (loss) available to common shareholders
|
$ | 179,379 | $ | 213,874 | $ | (3,117,811 | ) | |||||
|
Net
income (loss) per basic share
|
$ | 0.02 | $ | 0.02 | $ | (0.25 | ) | |||||
|
Net
income (loss) available to common stockholders
|
$ | 179,379 | $ | 213,874 | $ | (3,117,811 | ) | |||||
|
Change
in fair value of Class B derivative
|
(1,293,872 | ) | (575,951 | ) | (238,054 | ) | ||||||
|
Net
income (loss) available for diluted shares
|
$ | (1,114,493 | ) | $ | (362,077 | ) | $ | (3,355,865 | ) | |||
|
Net
income (loss) per diluted share
|
$ | (0.10 | ) | $ | (0.03 | ) | $ | (0.25 | ) | |||
|
14.
|
Selected
Quarterly Financial Data
(unaudited)
|
|
First
Quarter
|
Second
Quarter
|
Third
Quarter
|
Fourth
Quarter
|
|||||||||||||
|
Fiscal
2008:
|
||||||||||||||||
|
Revenue
|
$ | 17,859,420 | $ | 17,668,730 | $ | 18,237,574 | $ | 23,349,216 | ||||||||
|
Operating
income
|
5,140,078 | 5,005,928 | 5,664,615 | 5,276,021 | ||||||||||||
|
Net
income (loss)
|
408,039 | 406,135 | 789,243 | (1,389,543 | ) | |||||||||||
|
Net
income (loss) per share, basic
|
$ | 0.03 | $ | 0.03 | $ | 0.06 | $ | (0.11 | ) | |||||||
|
Net
income (loss) per share, diluted
|
$ | 0.03 | $ | 0.02 | $ | 0.04 | $ | (0.13 | ) | |||||||
|
Fiscal
2009:
|
||||||||||||||||
|
Revenue
|
$ | 25,500,176 | $ | 25,796,671 | $ | 26,403,134 | $ | 26,055,473 | ||||||||
|
Operating
income
|
4,465,207 | 5,715,812 | 6,209,071 | 5,536,769 | ||||||||||||
|
Net
income (loss)
|
(1,834,036 | ) | 510,700 | (1,594,614 | ) | (199,861 | ) | |||||||||
|
Net
income (loss) per share, basic
|
$ | (0.14 | ) | $ | 0.04 | $ | (0.13 | ) | $ | (0.02 | ) | |||||
|
Net
income (loss) per share, diluted
|
$ | (0.14 | ) | $ | 0.03 | $ | (0.13 | ) | $ | (0.02 | ) | |||||
Net loss
in the fourth quarter of 2008 included a write-off of $1,406,088 of deferred
financing costs and an increase of the income tax provision by approximately
$166,903 as a result of a change in the expected annual income tax
rate. Net loss per diluted share in first quarter 2008 does not
reflect the Class B shares, as the effect would have been
anti-dilutive.
On February 17, 2010, our management
concluded and subsequently reported to the audit committee of our board of
directors that our interim financial statements for the quarters ended March 31,
2009, June 30, 2009 and September 30, 2009 (collectively, the “Relevant
Periods”) should no longer be relied upon due to an accounting error caused by
non-compliance with the technical requirements of ASC 815 concerning the
treatment of our interest rate swaps as effective hedges against changes in
interest on our senior debt. We considered two interest rate swaps as effective
hedges against interest expense on our senior debt, reflecting changes in value
of the hedges in other comprehensive income in the equity section of the balance
sheet. Because we did not meet a technical requirement under ASC 815, these
changes in value should have been recorded in the appropriate line in the
statement of operations. The change has no impact on cash, equity on the balance
sheet or our operations.
57
OTELCO
INC.
NOTES
TO CONSOLIDATED FINANCIAL STATEMENTS
The
impact of the error on the Relevant Periods is as follows:
|
CONSOLIDATED
BALANCE SHEET
|
||||||||||||||||||||||||
|
|
March
31, 2009
|
June
30, 2009
|
September
30, 2009
|
|||||||||||||||||||||
|
(unaudited)
|
(unaudited)
|
(unaudited)
|
(unaudited)
|
(unaudited)
|
(unaudited)
|
|||||||||||||||||||
|
As
Reported
|
Restated
|
As
Reported
|
Restated
|
As
Reported
|
Restated
|
|||||||||||||||||||
|
Retained
deficit
|
$ | (4,742,274 | ) | $ | (5,704,957 | ) | $ | (5,458,523 | ) | $ | (5,194,256 | ) | $ | (5,470,262 | ) | $ | (6,788,873 | ) | ||||||
|
Accumulated
other comprehensive income
|
$ | (1,785,667 | ) | $ | (822,984 | ) | $ | (204,475 | ) | $ | (468,742 | ) | $ | (1,318,611 | ) | $ | – | |||||||
|
CONSOLIDATED
STATEMENTS OF OPERATIONS
|
||||||||||||||||||||||||
|
|
Three
Months Ended
March 31, 2009 |
Three
Months Ended
June 30, 2009 |
Three
Months Ended
September 30, 2009 |
|||||||||||||||||||||
|
(unaudited)
|
(unaudited)
|
(unaudited)
|
(unaudited)
|
(unaudited)
|
(unaudited)
|
|||||||||||||||||||
|
As
Reported
|
Restated
|
As
Reported
|
Restated
|
As
Reported
|
Restated
|
|||||||||||||||||||
|
Change
in fair value of derivatives
|
$ | 11,580 | $ | (951,103 | ) | $ | 62,882 | $ | 1,289,832 | $ | 74,274 | $ | (1,508,601 | ) | ||||||||||
|
Total
other expenses
|
$ | (6,361,513 | ) | $ | (7,324,196 | ) | $ | (6,371,510 | ) | $ | (5,144,560 | ) | $ | (6,365,061 | ) | $ | (7,947,936 | ) | ||||||
|
Income
(loss) before income tax
|
$ | (1,896,306 | ) | $ | (2,858,989 | ) | $ | (655,698 | ) | $ | 571,252 | $ | (155,990 | ) | $ | (1,738,865 | ) | |||||||
|
Net
income (loss) available to common stockholders
|
$ | (871,353 | ) | $ | (1,834,036 | ) | $ | (716,250 | ) | $ | 510,700 | $ | (11,739 | ) | $ | (1,594,614 | ) | |||||||
|
Basic
net income (loss) per share
|
$ | (0.07 | ) | $ | (0.14 | ) | $ | (0.06 | ) | $ | 0.04 | $ | (0.00 | ) | $ | (0.13 | ) | |||||||
|
Diluted
net income (loss) per share
|
$ | (0.07 | ) | $ | (0.14 | ) | $ | (0.06 | ) | $ | 0.03 | $ | (0.01 | ) | $ | (0.13 | ) | |||||||
|
Six
Months Ended
June
30, 2009
|
Nine
Months Ended
September
30, 2009
|
|||||||||||||||||||||||
|
(unaudited)
|
(unaudited)
|
(unaudited)
|
(unaudited)
|
|||||||||||||||||||||
|
As
Reported
|
Restated
|
As
Reported
|
Restated
|
|||||||||||||||||||||
|
Change
in fair value of derivatives
|
$ | 74,462 | $ | 338,729 | $ | 148,736 | $ | (1,169,872 | ) | |||||||||||||||
|
Total
other expenses
|
$ | (12,733,022 | ) | $ | (12,468,755 | ) | $ | (19,098,083 | ) | $ | (20,416,691 | ) | ||||||||||||
|
Income
(loss) before income tax
|
$ | (2,552,001 | ) | $ | (2,287,734 | ) | $ | (2,707,992 | ) | $ | (4,026,600 | ) | ||||||||||||
|
Net
income (loss) available to common stockholders
|
$ | (1,587,600 | ) | $ | (1,323,333 | ) | $ | (1,599,340 | ) | $ | (2,917,948 | ) | ||||||||||||
|
Basic
net income (loss) per share
|
$ | (0.13 | ) | $ | (0.10 | ) | $ | (0.13 | ) | $ | (0.23 | ) | ||||||||||||
|
Diluted
net income (loss) per share
|
$ | (0.13 | ) | $ | (0.11 | ) | $ | (0.13 | ) | $ | (0.23 | ) | ||||||||||||
|
CONSOLIDATED
STATEMENTS OF CASH FLOWS
|
||||||||||||||||||||||||
|
|
Three
Months Ended
March 31, 2009 |
Six
Months Ended
June
30, 2009
|
Nine
Months Ended
September 30, 2009 |
|||||||||||||||||||||
|
(unaudited)
|
(unaudited)
|
(unaudited)
|
(unaudited)
|
(unaudited)
|
(unaudited)
|
|||||||||||||||||||
|
As
Reported
|
Restated
|
As
Reported
|
Restated
|
As
Reported
|
Restated
|
|||||||||||||||||||
|
Net
loss
|
$ | (871,353 | ) | $ | (1,834,636 | ) | $ | (1,587,600 | ) | $ | (1,323,333 | ) | $ | (1,599,340 | ) | $ | (2,917,948 | ) | ||||||
|
Change
in fair value of derivatives
|
$ | (11,580 | ) | $ | 951,103 | $ | (74,462 | ) | $ | (338,729 | ) | $ | (148,736 | ) | $ | 1,169,872 | ||||||||
The Class
B holders have notified the Company of their desire to convert their shares into
IDS units during 2010. Additional information is included in Note 15
related to Class B shares.
|
15.
|
Fair
Value Measurement
|
In
accordance with ASC 820, Fair
Value Measurements and Disclosures, the following table represents the
Company’s fair value hierarchy for its financial assets and liabilities as of
December 31, 2009:
58
OTELCO
INC.
NOTES
TO CONSOLIDATED FINANCIAL STATEMENTS
|
December
31, 2009
|
||||||||||||||||
|
Fair
Value
|
Level 1
(1)
|
Level
2 (2)
|
Level 3
(3)
|
|||||||||||||
|
Assets
|
||||||||||||||||
|
Cash
and cash equivalents
|
$ | 17,731,044 | $ | 17,731,044 | $ | – | $ | – | ||||||||
|
Co-operative patronage
shares
|
1,542,495 | – | – | 1,542,495 | ||||||||||||
|
Total
assets
|
$ | 19,273,539 | $ | 17,731,044 | $ | – | $ | 1,542,495 | ||||||||
|
Liabilities
|
||||||||||||||||
|
Interest
rate swaps
|
$ | 1,592,813 | $ | – | $ | 1,592,813 | $ | – | ||||||||
|
Class
B derivative liability
|
– | – | – | – | ||||||||||||
|
Total
liabilities
|
$ | 1,592,813 | $ | – | $ | 1,592,813 | $ | – | ||||||||
(1) Quoted
prices in active markets for identical assets.
(2) Significant
other observable inputs.
(3) Significant
unobservable inputs.
The
Company retains its cash and cash equivalents in short-term interest bearing
instruments whose value is observable on a daily basis. Its interest rate cap is
valued at the end of each quarter by market experts in that business based on
similar transactions in the same financial market on the day of
valuation. Patronage shares have been issued primarily by one of our
lenders which operates as a co-operative. The Company does not pay
for these shares but receives them as a non-cash dividend. The market for these
shares is limited to the issuing organization and subject to uncertainty of
future redemption for cash. These shares are valued at approximately 55% of
their originally issued value. While the issuer and the Company expect these
shares to be worth their issued value, the current valuation recognizes some
uncertainty of their future redemption value.
The
interest rate swaps are valued at the end of the quarter by market experts in
that business based on similar transactions and rates in an active financial
market.
The
interest rate cap matures on December 31, 2009. The interest rate cap
is valued by market experts at the end of each quarter. It had a zero
value at December 31, 2009.
The Class
B derivative is valued at the end of each quarter utilizing current observable
factors and a market based model developed by a company whose business includes
the provision of valuation expertise. Annually, the Company evaluates
the probability of its Class B shares exchanged for IDS units in advance of
their unrestricted December 2009 conversion date. This estimate, as
well as current market conditions, impacts the quarterly valuation of the B
share derivative liability. This liability is extinguished once
the Class B shares can be exchanged for IDS units. This conversion
can occur without any financial test after 2009.
|
16.
|
Subsidiary
Guarantees
|
The
Company has no independent assets or operations separate from its operating
subsidiaries. The guarantees of its senior subordinated notes by 12
of its 14 operating subsidiaries are full and unconditional, joint and
several. The operating subsidiaries have no independent long-term
notes payable. There are no significant restrictions on the ability
of the Company to obtain funds from its operating subsidiaries by dividend or
loan. The condensed consolidated financial information is provided
for the guarantor entities.
The
following tables present condensed consolidating balance sheets as of December
31, 2008 and 2009, condensed consolidating statements of operations for the
years ended December 31, 2008 and 2009; and condensed consolidating statements
of cash flows for the years ended December 31, 2008 and 2009.
59
OTELCO
INC.
NOTES
TO CONSOLIDATED FINANCIAL STATEMENTS
Otelco
Inc.
Condensed Consolidating Balance
Sheet
December 31, 2008
|
Parent
|
Guarantor
|
Non-Guarantor
|
Eliminations
|
Consolidated
|
||||||||||||||||
|
Subsidiaries
|
Subsidiaries
|
|||||||||||||||||||
|
ASSETS
|
||||||||||||||||||||
|
Current
assets
|
||||||||||||||||||||
|
Cash
and cash equivalents
|
$ | – | $ | 13,521,138 | $ | 21,117 | $ | – | $ | 13,542,255 | ||||||||||
|
Accounts
receivable, net
|
– | 10,869,233 | 1,254,272 | – | 12,123,505 | |||||||||||||||
|
Materials
and supplies
|
– | 1,029,214 | 1,276,541 | – | 2,305,755 | |||||||||||||||
|
Prepaid
expenses
|
66,560 | 994,500 | 80,848 | – | 1,141,908 | |||||||||||||||
|
Income
tax receivables
|
181,644 | – | – | – | 181,644 | |||||||||||||||
|
Deferred
income taxes
|
827,686 | – | – | – | 827,686 | |||||||||||||||
|
Investment
in subsidiaries
|
99,481,692 | – | – | (99,481,692 | ) | – | ||||||||||||||
|
Intercompany
receivables
|
155,535,369 | – | – | (155,535,369 | ) | – | ||||||||||||||
|
Total
current assets
|
256,092,951 | 26,414,085 | 2,632,778 | (255,017,061 | ) | 30,122,753 | ||||||||||||||
|
Property
and equipment, net
|
– | 62,507,141 | 12,899,921 | – | 75,407,062 | |||||||||||||||
|
Goodwill
|
– | 191,271,477 | (1,936,640 | ) | – | 189,334,837 | ||||||||||||||
|
Intangibles
assets, net
|
– | 41,286,088 | 3,104,556 | – | 44,390,644 | |||||||||||||||
|
Investments
|
1,000 | 1,686,908 | 327,675 | – | 2,015,583 | |||||||||||||||
|
Deferred
income taxes
|
5,897,382 | 5,897,382 | ||||||||||||||||||
|
Other
long-term assets
|
8,879,424 | (506,198 | ) | – | – | 8,373,226 | ||||||||||||||
|
Total
assets
|
$ | 270,870,757 | $ | 322,659,501 | $ | 17,028,290 | $ | (255,017,061 | ) | $ | 355,541,487 | |||||||||
|
LIABILITIES
AND STOCKHOLDERS’ EQUITY
|
||||||||||||||||||||
|
Current
liabilities
|
||||||||||||||||||||
|
Accounts
payables and accrued expenses
|
$ | 3,316,323 | $ | 4,543,542 | $ | 1,085,342 | $ | – | $ | 8,945,207 | ||||||||||
|
Intercompany
payables
|
– | 146,585,645 | 8,949,724 | (155,535,369 | ) | – | ||||||||||||||
|
Other
current liabilities
|
213,679 | 2,129,257 | 75,448 | – | 2,418,384 | |||||||||||||||
|
Total
current liabilities
|
3,530,002 | 153,258,444 | 10,110,514 | (155,535,369 | ) | 11,363,591 | ||||||||||||||
|
Deferred
income taxes
|
10,103,140 | 31,595,332 | 4,050,251 | – | 45,748,723 | |||||||||||||||
|
Other
liabilities
|
– | 928,082 | – | – | 928,082 | |||||||||||||||
|
Long-term
notes payable
|
238,536,037 | 40,263,476 | – | – | 278,799,513 | |||||||||||||||
|
Derivative
liability
|
238,054 | – | – | – | 238,054 | |||||||||||||||
|
Class
B common convertible to senior subordinated notes
|
4,085,033 | – | – | – | 4,085,033 | |||||||||||||||
|
Stockholders’
equity
|
14,378,491 | 96,614,167 | 2,867,525 | (99,481,692 | ) | 14,378,491 | ||||||||||||||
|
Total
liabilities and stockholders’ equity
|
$ | 270,870,757 | $ | 322,659,501 | $ | 17,028,290 | $ | (255,017,061 | ) | $ | 355,541,487 | |||||||||
60
OTELCO
INC.
NOTES
TO CONSOLIDATED FINANCIAL STATEMENTS
Otelco
Inc.
Condensed
Consolidating Balance Sheet
December
31, 2009
|
Parent
|
Guarantor
|
Non-Guarantor
|
Eliminations
|
Consolidated
|
||||||||||||||||
|
Subsidiaries
|
Subsidiaries
|
|||||||||||||||||||
|
ASSETS
|
||||||||||||||||||||
|
Current
assets
|
||||||||||||||||||||
|
Cash
and cash equivalents
|
$ | – | $ | 17,617,266 | $ | 113,778 | $ | – | $ | 17,731,044 | ||||||||||
|
Accounts
receivable, net
|
– | 9,354,246 | 942,587 | – | 10,296,833 | |||||||||||||||
|
Materials
and supplies
|
– | 938,766 | 1,031,200 | – | 1,969,966 | |||||||||||||||
|
Prepaid
expenses
|
76,219 | 1,192,272 | 73,758 | – | 1,342,249 | |||||||||||||||
|
Income
tax receivables
|
389,486 | – | – | – | 389,486 | |||||||||||||||
|
Deferred
income taxes
|
744,531 | – | – | – | 744,531 | |||||||||||||||
|
Investment
in subsidiaries
|
113,558,790 | – | – | (113,558,790 | ) | – | ||||||||||||||
|
Intercompany
receivable
|
129,450,605 | – | – | (129,450,605 | ) | – | ||||||||||||||
|
Total
current assets
|
244,219,631 | 29,102,550 | 2,161,323 | (243,009,395 | ) | 32,474,109 | ||||||||||||||
|
Property
and equipment, net
|
– | 57,762,888 | 11,266,085 | – | 69,028,973 | |||||||||||||||
|
Goodwill
|
– | 190,126,718 | (1,936,640 | ) | – | 188,190,078 | ||||||||||||||
|
Intangibles
assets, net
|
– | 31,361,923 | 2,856,192 | – | 34,218,115 | |||||||||||||||
|
Investments
|
1,000 | 1,661,027 | 329,131 | – | 1,991,158 | |||||||||||||||
|
Deferred
income Taxes
|
4,482,430 | – | – | – | 4,482,430 | |||||||||||||||
|
Other
long-term assets
|
7,519,753 | (376,413 | ) | – | – | 7,143,340 | ||||||||||||||
|
Total
assets
|
$ | 256,222,814 | $ | 309,638,693 | $ | 14,676,091 | $ | (243,009,395 | ) | $ | 337,528,203 | |||||||||
|
LIABILITIES
AND STOCKHOLDERS’ EQUITY
|
||||||||||||||||||||
|
Current
liabilities
|
||||||||||||||||||||
|
Accounts
payable and accrued expenses
|
$ | 2,549,577 | $ | 5,650,086 | $ | 1,113,088 | $ | – | $ | 9,312,751 | ||||||||||
|
Intercompany
payables
|
– | 123,837,610 | 5,612,995 | (129,450,605 | ) | – | ||||||||||||||
|
Other
current liabilities
|
394,850 | 1,758,112 | 79,419 | – | 2,232,381 | |||||||||||||||
|
Total
current liabilities
|
2,944,427 | 131,245,808 | 6,805,502 | (129,450,605 | ) | 11,545,132 | ||||||||||||||
|
Deferred
income taxes
|
10,662,374 | 28,184,570 | 3,392,318 | – | 42,239,262 | |||||||||||||||
|
Other
liabilities
|
1,592,813 | 864,320 | – | – | 2,457,133 | |||||||||||||||
|
Long-term
notes payable
|
233,453,825 | 40,263,476 | – | – | 273,717,301 | |||||||||||||||
|
Class
B common convertible to senior subordinated notes
|
4,085,033 | – | – | – | 4,085,033 | |||||||||||||||
|
Stockholders’
equity
|
3,484,342 | 109,080,519 | 4,478,271 | (113,558,790 | ) | 3,484,342 | ||||||||||||||
|
Total
liabilities and stockholders’ equity
|
$ | 256,222,814 | $ | 309,638,693 | $ | 14,676,091 | $ | (243,009,395 | ) | $ | 337,528,203 | |||||||||
61
OTELCO
INC.
NOTES
TO CONSOLIDATED FINANCIAL STATEMENTS
Otelco
Inc.
Condensed
Consolidating Statement of Operations
For
the Twelve Months Ended December 31, 2008
|
Parent
|
Guarantor
|
Non-Guarantor
|
||||||||||||||||||
|
Subsidiaries
|
Subsidiaries
|
Eliminations
|
Consolidated
|
|||||||||||||||||
|
Revenue
|
$ | 3,113,485 | $ | 70,986,248 | $ | 12,441,820 | $ | (9,426,613 | ) | $ | 77,114,940 | |||||||||
|
Operating
expenses
|
(3,113,485 | ) | (52,706,074 | ) | (9,635,352 | ) | 9,426,613 | (56,028,298 | ) | |||||||||||
|
Income
from operations
|
– | 18,280,174 | 2,806,468 | – | 21,086,642 | |||||||||||||||
|
Other
income (expense)
|
(20,483,939 | ) | (363,814 | ) | 3,795 | – | (20,843,958 | ) | ||||||||||||
|
Earnings
from subsidiaries
|
15,165,333 | – | – | (15,165,333 | ) | – | ||||||||||||||
|
Income
before income tax
|
(5,318,606 | ) | 17,916,360 | 2,810,263 | (15,165,333 | ) | 242,684 | |||||||||||||
|
Income
tax (expense) benefit
|
5,532,480 | (4,460,513 | ) | (1,100,777 | ) | – | (28,810 | ) | ||||||||||||
|
Net
income (loss) to common stockholders
|
$ | 213,874 | $ | 13,455,847 | $ | 1,709,486 | $ | (15,165,333 | ) | $ | 213,874 | |||||||||
Otelco
Inc.
Condensed
Consolidating Statement of Operations
For
the Twelve Months Ended December 31, 2009
|
Parent
|
Guarantor
|
Non-Guarantor
|
||||||||||||||||||
|
Subsidiaries
|
Subsidiaries
|
Eliminations
|
Consolidated
|
|||||||||||||||||
|
Revenue
|
$ | 3,318,678 | $ | 100,173,351 | $ | 11,701,213 | $ | (11,437,788 | ) | $ | 103,755,454 | |||||||||
|
Operating
expenses
|
(3,318,678 | ) | (80,815,648 | ) | (9,132,057 | ) | 11,437,788 | (81,828,595 | ) | |||||||||||
|
Income
from operations
|
– | 19,357,703 | 2,569,156 | – | 21,926,859 | |||||||||||||||
|
Other
income (expense)
|
(26,098,959 | ) | (390,828 | ) | 78,488 | – | (26,411,299 | ) | ||||||||||||
|
Earnings
from subsidiaries
|
14,247,278 | – | – | (14,247,278 | ) | – | ||||||||||||||
|
Income
(loss) before income tax
|
(11,851,681 | ) | 18,966,875 | 2,647,644 | (14,247,278 | ) | (4,484,440 | ) | ||||||||||||
|
Income
tax (expense) benefit
|
8,733,870 | (6,330,343 | ) | (1,036,898 | ) | – | 1,366,629 | |||||||||||||
|
Net
income (loss) to common stockholders
|
$ | (3,117,811 | ) | $ | 12,636,532 | $ | 1,610,746 | $ | (14,247,278 | ) | $ | (3,117,811 | ) | |||||||
62
OTELCO
INC.
NOTES
TO CONSOLIDATED FINANCIAL STATEMENTS
Otelco
Inc.
Condensed
Consolidating Statement of Cash Flows
For
the Twelve Months Ended December 31, 2008
|
Parent
|
Guarantor
|
Non-Guarantor
|
||||||||||||||||||
|
Subsidiaries
|
Subsidiaries
|
Eliminations
|
Consolidated
|
|||||||||||||||||
|
Cash
flows from operating activities:
|
||||||||||||||||||||
|
Net
income (loss)
|
$ | 213,874 | $ | 13,455,847 | $ | 1,709,486 | $ | (15,165,333 | ) | $ | 213,874 | |||||||||
|
Adjustment
to reconcile net income (loss)
|
||||||||||||||||||||
|
to
cash flows from operating activities
|
3,187,009 | 12,636,002 | 3,471,784 | – | 19,294,795 | |||||||||||||||
|
Changes
in assets and liabilities, net of
|
||||||||||||||||||||
|
assets
and liabilities acquired
|
(82,872,573 | ) | 86,250,017 | (4,197,584 | ) | – | (820,140 | ) | ||||||||||||
|
Net
cash provided by operating activities
|
(79,471,690 | ) | 112,341,866 | 983,686 | (15,165,333 | ) | 18,688,529 | |||||||||||||
|
Cash
flows from investing activities
|
(5,278,911 | ) | (111,528,403 | ) | (1,065,392 | ) | – | (117,872,706 | ) | |||||||||||
|
Cash
flows from financing activities
|
84,750,601 | 1 | – | 15,165,333 | 99,915,935 | |||||||||||||||
|
Net
increase (decrease) in cash and cash equivalents
|
– | 813,464 | (81,706 | ) | – | 731,758 | ||||||||||||||
|
Cash
and cash equivalents, beginning of period
|
– | 12,707,674 | 102,823 | – | 12,810,497 | |||||||||||||||
|
Cash
and cash equivalents, end of period
|
$ | – | $ | 13,521,138 | $ | 21,117 | $ | – | $ | 13,542,255 | ||||||||||
Otelco
Inc.
Condensed
Consolidating Statement of Cash Flows
For
the Twelve Months Ended December 31, 2009
|
Parent
|
Guarantor
|
Non-Guarantor
|
||||||||||||||||||
|
Subsidiaries
|
Subsidiaries
|
Eliminations
|
Consolidated
|
|||||||||||||||||
|
Cash
flows from operating activities:
|
||||||||||||||||||||
|
Net
income (loss)
|
$ | (3,117,811 | ) | $ | 12,636,532 | $ | 1,610,746 | $ | (14,247,278 | ) | $ | (3,117,811 | ) | |||||||
|
Adjustment
to reconcile net income (loss)
|
||||||||||||||||||||
|
to
cash flows from operating activities
|
5,379,288 | 21,551,341 | 2,761,121 | – | 29,691,750 | |||||||||||||||
|
Changes
in assets and liabilities, net of
|
||||||||||||||||||||
|
assets
and liabilities acquired
|
25,922,898 | (21,716,059 | ) | (2,871,653 | ) | – | 1,335,186 | |||||||||||||
|
Net
cash provided by operating activities
|
28,184,375 | 12,471,814 | 1,500,214 | (14,247,278 | ) | 27,909,125 | ||||||||||||||
|
Cash
flows used investing activities
|
– | (8,375,686 | ) | (1,407,553 | ) | – | (9,783,239 | ) | ||||||||||||
|
Cash
flows used financing activities
|
(28,184,375 | ) | – | – | 14,247,278 | (13,937,097 | ) | |||||||||||||
|
Net
increase in cash and cash equivalents
|
– | 4,096,128 | 92,661 | – | 4,188,789 | |||||||||||||||
|
Cash
and cash equivalents, beginning of period
|
– | 13,521,138 | 21,117 | – | 13,542,255 | |||||||||||||||
|
Cash
and cash equivalents, end of period
|
$ | – | $ | 17,617,266 | $ | 113,778 | $ | – | $ | 17,731,044 | ||||||||||
|
17.
|
Revenue
Concentrations
|
Revenues
for interstate access services are based on reimbursement of costs and an
allowed rate of return. Revenues of this nature are received from the
National Exchange Carrier Association in the form of monthly
settlements. Such revenues amounted to 14.3%, 13.7% and 10.8% of the
Company’s total revenues from continuing operations for the years ended December
31, 2007, 2008 and 2009, respectively.
In
connection with the acquisition of the CR Companies, the Company acquired a
multi-year contract with a large multiple system operator (“MSO”) for the
provision of wholesale network connections to the MSO’s customers in Maine and
New Hampshire. Various terms of the agreement were amended at the time of the
acquisition, including extending the contract through 2012. The customer
represented approximately 9.1% of the consolidated revenue for 2009. Other
unrelated telecommunications providers also pay the Company access revenue for
terminating calls through us to the MSO.
63
OTELCO
INC.
NOTES
TO CONSOLIDATED FINANCIAL STATEMENTS
|
18.
|
Commitments
and Contingencies
|
From time
to time, we may be involved in various claims, legal action and regulatory
proceedings incidental to and in the ordinary course of business, including
administrative hearings of the APSC, MDTC, MPSC, MPUC, NHPUC and WVPSC relating
primarily to rate making. Currently, none of the legal proceedings
are expected to have a material adverse effect on our business.
64
Disclosure
Controls and Procedures
Disclosure controls and procedures are
defined by the Securities and Exchange Commission as those controls and other
procedures that are designed to ensure that information required to be disclosed
in the Company’s filings under the Securities Exchange Act of 1934 is recorded,
processed, summarized and reported within the time periods specified in the
Securities and Exchange Commission’s rules and forms. The Company’s
Chief Executive Officer and Chief Financial Officer have evaluated the Company’s
disclosure controls and procedures as of December 31, 2009, and, based on the
material weakness in our internal control over financial reporting described
below, have determined that such disclosure controls and procedures were
ineffective. In response to this material weakness, management
performed additional analysis and other procedures to ensure that our
consolidated financial statements included in this Annual Report on Form 10-K
were prepared in accordance with generally accepted accounting
principles. Accordingly, management, including our Chief Executive
Officer and Chief Financial Officer, believes that the consolidated financial
statements included in this Annual Report on Form 10-K fairly present in all
material respects our financial condition, results of operations and cash flows
for the periods presented.
Management’s
Annual Report on Internal Control over Financial Reporting
The
management of the Company is responsible for establishing and maintaining
adequate internal control over financial reporting. The Securities Exchange Act
of 1934 defines internal control over financial reporting in Rule 13a-15(f) and
15d-15(f) as a process designed by, or under the supervision of, the Company’s
principal executive and principal financial officers and effected by the
Company’s board of directors, management and other personnel, to provide
reasonable assurance regarding the reliability of financial reporting and the
preparation of financial statements for external purposes in accordance with
generally accepted accounting principles and includes those policies and
procedures that:
|
●
|
Pertain
to the maintenance of records that in reasonable detail accurately and
fairly reflect the transactions and dispositions of the assets of the
Company;
|
|
●
|
Provide
reasonable assurance that transactions are recorded as necessary to permit
preparation of financial statements in accordance with generally accepted
accounting principles, and that receipts and expenditures of the Company
are being made only in accordance with authorizations of management and
directors of the Company; and
|
|
●
|
Provide
reasonable assurance regarding prevention or timely detection of
unauthorized acquisition, use or disposition of the Company’s assets that
could have a material effect on the consolidated financial
statements.
|
Because
of its inherent limitations, internal control over financial reporting may not
prevent or detect misstatements. Also, projections of any evaluation of
effectiveness to future periods are subject to the risk that controls may become
inadequate because of changes in conditions, or that the degree of compliance
with the policies or procedures may deteriorate.
The
Company’s management assessed the effectiveness of the Company’s internal
control over financial reporting as of December 31, 2009. In making this
assessment, the Company’s management used the criteria set forth by the
Committee of Sponsoring Organizations of the Treadway Commission (COSO) in Internal Control-Integrated
Framework.
A material weakness is a significant
deficiency, or combination of significant deficiencies, that results in more
than a remote likelihood that a material misstatement of the annual or interim
financial statements will not be prevented or detected. As of
December 31, 2009, management determined that its financial statements contained
an error with respect to one rule within ASC 815, Derivatives and Hedging, or
ASC 815, and that this error arose from a
material
weakness in the Company’s internal
control over financial reporting. Specifically, the Company acquired
two interest rate swap contracts to hedge against changes in the interest rate
associated with its senior credit facility. These agreements were
marked to market value on March 31, 2009, June 30, 2009 and September 30,
2009 and placed on the consolidated balance sheets of the
Company. Using ASC 815, the swaps were initially determined to be
effective hedges using the short-cut methodology and changes in their value were
recorded as other comprehensive income in stockholders’ equity on the
consolidated balance sheets. Subsequent review determined that,
because the swaps had future start dates when they were acquired, their value
would not have been zero at the effective date and therefore, the short-cut
methodology could not be employed. ASC 815 further requires that all
documentation to determine the effectiveness of hedging instruments be completed
prior to their effective date, precluding the subsequent use of another
methodology available within the accounting guidance to assess
effectiveness. Therefore, the swaps may not be considered effective
for the period. The hedges must be considered investments and changes
in their fair value would flow through the statement of operations as change in
fair value of derivatives and net income would vary with the
changes. Over the two and three year lives of the two swaps, the
cumulative value of these changes will be zero. Therefore, the
Company determined that it did not maintain effective controls to ensure
the proper application of ASC 815. To remediate this material
weakness, should any future interest rate hedging contracts be used by the
Company, an external hedge accounting expert will be employed to validate that
the Company has properly interpreted the guidance in accounting for the
contracts.
While the
documentation did not support the original decision to account for changes in
the swaps as effective hedges, it did not impact operations of the business;
operations of the interest rate swaps; revenue and operating costs; or
cash. There was also no impact on any debt covenants.
The
effectiveness of our internal control over financial reporting as at December
31, 2009 has been independently audited by BDO Seidman, LLP, an independent
registered public accounting firm, as stated in their attestation report
included in Item 8 of this report.
Changes
in Internal Control over Financial Reporting
Other
than the changes referred to above, there were no changes in our internal
control over financial reporting (as defined in Rule 13a-15(f) under the
Securities Exchange Act of 1934) during the fourth quarter of fiscal 2009 that
materially affected, or are reasonably likely to materially affect, our internal
control over financial reporting.
None.
65
We have a
code of ethics that applies to each director and employee of the Company,
including the principal executive, financial, and accounting officers. Our code
of conduct is available on our website at http://www.OtelcoInc.com
under the Investor Relations section titled Corporate Governance. We intend to
disclose any amendment to, or waiver from, a provision of the code of ethics
that applies to our chief executive officer or chief financial officer and
principal accounting officer in the investor relations section of our web
site.
The other
information required by this Item is incorporated herein by reference to the
applicable information in the proxy statement for our 2010 annual meeting of
stockholders, including the information set forth under the captions “Election
of Directors,” “Section 16(a) Beneficial Ownership Reporting Compliance” and
“Governance of the Company — Audit Committee.” See Item X in Part I of
this report regarding our executive officers.
The
information required by this Item is incorporated herein by reference to the
applicable information in the proxy statement for our 2010 annual meeting of
stockholders, including the information set forth under the captions “Executive
Compensation,” “Compensation of Directors,” “Compensation Committee Report” and
“Compensation Committee Interlocks and Insider Participation.”
The
Company currently has no securities authorized for issuance under an equity
compensation plan. The other information required by this Item is incorporated
herein by reference to the applicable information in the proxy statement for our
2010 annual meeting of stockholders, including the information set forth under
the caption “Beneficial Ownership of Common Stock.”
The
information required by this Item is incorporated herein by reference to the
applicable information in the proxy statement for our 2010 annual meeting of
stockholders, including the information set forth under the caption “Election of
Directors” and “Other Relationships and Transactions with Executives.”
The
information required by this Item is incorporated herein by reference to the
applicable information in the proxy statement for our 2010 annual meeting of
stockholders, including the information set forth under the caption “Our
Relationship with Our Independent Registered Public Accounting
Firm.”
66
(a)(1)
Financial Statements
| Reports of Independent Registered Public Accounting Firm | 36 | ||
| Consolidated Balance Sheets | 38 | ||
| Consolidated Statements of Operations | 39 | ||
| Consolidated Statements of Changes in Stockholders’ Equity | 40 | ||
| Consolidated Statements of Cash Flows | 41 | ||
| Notes to Consolidated Financial Statements | 42 |
(a)(2)
Financial Statement Schedules
None
(a)(3)
Exhibits
|
Exhibit
No.
|
Description
|
|
|
3.1
|
Certificate
of Incorporation of Otelco Inc. (filed as Exhibit 3.1 to the Company’s
Annual Report on Form 10-K for the year ended December 31, 2004 and
incorporated herein by reference)
|
|
|
3.2
|
Third
Amended and Restated By-laws of Otelco Inc. (filed as Exhibit 3.2 to the
Company’s Annual Report on Form 10-K for the year ended December 31, 2004
and incorporated herein by reference)
|
|
|
4.1
|
Indenture,
dated as of December 21, 2004, among Otelco Inc., each subsidiary listed
on the signature pages thereto and Wells Fargo Bank, National Association,
as trustee, relating to the 13% Senior Subordinated Notes dues 2019 (filed
as Exhibit 4.1 to the Company’s Annual Report on Form 10-K for the year
ended December 31, 2004 and incorporated herein by
reference)
|
|
|
4.2
|
Supplemental
Indenture, dated as of July 3, 2006, by and among Mid-Maine
Communications, Inc., Mid-Maine TelPlus, the Existing Guarantors listed on
the signature pages thereto, and Wells Fargo Bank, NA, as trustee (filed
as Exhibit 10.2 to the Company’s Current Report on Form 8-K filed on July
5, 2006 and incorporated herein by reference)
|
|
|
4.3
|
Second
Supplemental Indenture, dated as of July 5, 2007, by and among Otelco
Inc., certain of its subsidiaries and Wells Fargo Bank, National
Association, as trustee (filed as Exhibit
4.1 to the Company’s Current Report on Form 8-K filed on July 5, 2007 and
incorporated herein by reference)
|
|
|
4.4
|
Third
Supplemental Indenture, dated as of October 31, 2008, by and among War
Holdings, Inc., Pine Tree Holdings, Inc., The Pine Tree Telegraph and
Telephone Company, CRC Communications of Maine, Inc., Saco River Telegraph
and Telephone Company, Communications Design Acquisition Corporation,
Granby Holdings, Inc., The Granby Telegraph and Telephone Co. of Mass.,
Inc., the Existing Guarantors listed on the signature pages thereto,
Otelco Inc. and Wells Fargo Bank, National Association, as trustee (filed
as Exhibit 4.4 to the Company’s Annual Report on Form 10-K for the year
ended December 31, 2008 and incorporated herein by
reference)
|
|
|
4.5
|
Form
of 13% Senior Subordinated Note due 2019 (included in Exhibit
4.1)
|
|
|
4.6
|
Investor
Rights Agreement, dated December 21, 2004, among Otelco Inc., Seaport
Capital Partners II, L.P., Seaport Investments, LLC, CEA Capital Partners
USA, L.P., CEA Capital Partners USA CI, L.P., BancBoston Ventures Inc.,
Mid-Missouri Parent LLC, Michael D. Weaver, Sean Reilly, Kevin Reilly and
Sternberg Consulting Inc. (filed as Exhibit 4.3 to the Company’s Annual
Report on Form 10-K for the year ended December 31, 2004 and incorporated
herein by reference)
|
67
|
Exhibit
No.
|
Description
|
|
4.7
|
Form
of stock certificate for Class A common stock (filed as Exhibit 4.4 to
Amendment No. 4 to Registration Statement on Form S-1 (file no.
333-115341) and incorporated herein by reference)
|
|
|
4.8
|
Form
of global Income Deposit Security (filed as Exhibit 4.5 to Amendment No. 4
to Registration Statement on Form S-1 (file no. 333-115341) and
incorporated herein by reference)
|
|
|
10.1
|
Amended
and Restated Employment Agreement, dated as of March 11, 2009, between
Otelco Inc. and Michael D. Weaver (filed as Exhibit 10.1 to the Company’s
Current Report on 8-K filed on March 12, 2009 and incorporated
herein by reference)*
|
|
|
10.2
|
Amended
and Restated Employment Agreement, dated as of March 11, 2009, between
Otelco Inc. and Curtis L. Garner, Jr. (filed as Exhibit 10.2 to the
Company’s Current Report on Form 8-K filed on March 11, 2009 and
incorporated herein by reference)*
|
|
|
10.3
|
Employment
Agreement, dated as of July 3, 2006, between Mid-Maine and Nicholas A.
Winchester (filed as Exhibit 10.3 to the Company’s Current Report on Form
8-K filed on July 5, 2006 and incorporated herein by
reference)*
|
|
|
10.4
|
Employment
Agreement, dated as of August 24, 2006, between Otelco Inc. and Dennis
Andrews (filed as Exhibit 10.1 to the Company’s Current Report on Form 8-K
filed on August 29, 2006 and incorporated herein by
reference)*
|
|
|
10.5
|
Employment
Agreement, dated as of November 15, 2006, between Otelco Inc. and Gary B.
Romig (filed as Exhibit 10.1 to the Company’s Current Report on Form 8-K
filed on November 15, 2006 and incorporated herein by
reference)*
|
|
|
10.6
|
Employment
Agreement, dated as of November 15, 2006, between Otelco Inc. and Jerry C.
Boles (filed as Exhibit 10.2 to the Company’s Current Report on Form 8-K
filed on November 15, 2006 and incorporated herein by
reference)*
|
|
|
10.7
|
Amendment,
dated as of December 17, 2008, to the Employment Agreement, dated as of
August 24, 2006, between Otelco Inc. and Dennis Andrews (filed as Exhibit
10.10 to the Company’s Annual Report on Form 10-K filed on March 11, 2009
and incorporated herein by reference)*
|
|
|
10.8
|
Amendment,
dated as of December 17, 2008, to the Employment Agreement, dated as of
November 15, 2006, between Otelco Inc. and Jerry C. Boles (filed as
Exhibit 10.11 to the Company’s Annual Report on Form 10-K for the year
ended December 31, 2008 and incorporated herein by
reference)*
|
|
|
10.9
|
Amendment,
dated as of December 18, 2008, to the Employment Agreement, dated as of
November 15, 2006, between Otelco Inc. and Gary B. Romig (filed as Exhibit
10.12 to the Company’s Annual Report on Form 10-K for the year ended
December 31, 2008 and incorporated herein by
reference)*
|
|
|
10.10
|
Amended
and Restated Employment Agreement, dated as of April 27, 2009, between
Otelco Inc. and Robert Souza (filed as Exhibit 10.1 to the Company’s
Current Report on Form 8-K filed on April 28, 2009 and incorporated herein
by reference)*
|
|
|
10.11
|
Amendment,
dated as of December 31, 2008, to the Employment Agreement, dated as of
July 3, 2006, between Mid-Maine and Nicholas A. Winchester (filed as
Exhibit 10.16 to the Company’s Annual Report on Form 10-K for the year
ended December 31, 2008 and incorporated herein by
reference)*
|
|
|
10.12
|
Executive
Long Term Incentive Plan approved May 12, 2009, effective January 1,
2009 (filed as Exhibit 10.1 to the Company’s Current Report on Form 8-K
filed on May 14, 2009 and incorporated herein by
reference)*
|
|
|
10.13
|
Amendment,
dated as of March 5, 2010, to the Amended and Restated Employment
Agreement, dated as of March 11, 2009, between Otelco Inc. and Michael D.
Weaver*
|
|
|
10.14
|
Amendment,
dated as of March 5, 2010, to the Amended and Restated Employment
Agreement, dated as of March 11, 2009, between Otelco Inc. and Curtis L.
Garner, Jr.*
|
|
|
12.1
|
Computation
of Ratio of Earnings to Fixed Charges
|
|
|
21.1
|
List
of subsidiaries of Otelco Inc.
|
|
|
31.1
|
Certificate
pursuant to Rule 13a-14(a) or Rule 15d-14(a) of the Securities Exchange
Act of 1934 of the Chief Executive Officer
|
|
|
31.2
|
Certificate
pursuant to Rule 13a-14(a) or Rule 15d-14(a) of the Securities Exchange
Act of 1934 of the Chief Financial
Officer
|
68
|
Exhibit
No.
|
Description
|
|
32.1
|
Certificate
pursuant to 18 U.S.C. Section 1350, as adopted pursuant to Section 906 of
the Sarbanes-Oxley Act of 2002, of the Chief Executive
Officer
|
|
|
32.2
|
Certificate
pursuant to 18 U.S.C. Section 1350, as adopted pursuant to Section 906 of
the Sarbanes-Oxley Act of 2002, of the Chief Financial
Officer
|
* Management
contract or compensatory plan or arrangement
69
SIGNATURES
Pursuant
to the requirements of Section 13 or 15(d) of the Securities Exchange Act of
1934, the registrant has duly caused this report to be signed on its behalf by
the undersigned, thereunto duly authorized.
| OTELCO INC. | |||
|
|
By:
|
/s/ Michael D. Weaver | |
| Michael D. Weaver | |||
| President and Chief Executive Officer | |||
| Date: March 8, 2010 | |||
Pursuant
to the requirements of the Securities Exchange Act of 1934, this report has been
signed below by the following persons on behalf of the registrant and in the
capacities and on the dates indicated:
|
Signature
|
Title
|
Date
|
||
|
/s/
Michael
D. Weaver
|
President,
Chief Executive Officer and Director (Principal Executive
Officer)
|
March
8, 2010
|
||
|
Michael
D. Weaver
|
||||
|
/s/
Curtis
L. Garner, Jr.
|
Chief
Financial Officer
(Principal
Financial and Accounting Officer)
|
March
8, 2010
|
||
|
Curtis
L. Garner, Jr.
|
||||
|
/s/
William
Bak
|
Director
|
March
8, 2010
|
||
|
William
Bak
|
|
/s/
Howard
J. Haug
|
Director
|
March
8, 2010
|
||
|
Howard
J. Haug
|
||||
|
/s/
John
P. Kunz
|
Director
|
March
8, 2010
|
||
|
John
P. Kunz
|
||||
|
/s/
Stephen
P. McCall
|
Director
|
March
8, 2010
|
||
|
Stephen
P. McCall
|
|
/s/
Andrew
Meyers
|
Director
|
March
8, 2010
|
||
|
Andrew
Meyers
|
||||
|
/s/
William
F. Reddersen
|
Director
|
March
8, 2010
|
||
|
William
F. Reddersen
|