Attached files
Table of Contents
UNITED STATES
SECURITIES AND EXCHANGE COMMISSION
WASHINGTON DC, 20549
FORM 10-K
| x | ANNUAL REPORT PURSUANT TO SECTION 13 OR 15(d) OF THE SECURITIES EXCHANGE ACT OF 1934 |
For the fiscal year ended December 31, 2009
| ¨ | TRANSITION REPORT PURSUANT TO SECTION 13 OR 15(d) OF THE SECURITIES EXCHANGE ACT OF 1934 |
For the transition period from to
INNOPHOS, INC.
(EXACT NAME OF REGISTRANT AS SPECIFIED IN ITS CHARTER)
| Delaware | 333-129951 | 20-1380712 | ||
| (state or other jurisdiction of incorporation) |
(Commission File number) | (IRS Employer Identification No.) |
259 Prospect Plains Road
Cranbury, New Jersey 08512
(Address of Principal Executive Officer, including Zip Code)
(609) 495-2495
(Registrants’ Telephone Number, Including Area Code)
Not Applicable
(Former name or former address, if changed since last report)
Securities registered pursuant to Section 12(b) of the Act:
| Title of Each Class |
Name of Each Exchange on Which Registered | |
| None | None |
Securities registered pursuant to Section 12(g) of the Act: None
Indicate by check mark if the registrant is a well-known seasoned issuer, as defined in Rule 405 of the Securities Act. ¨ Yes x No
Indicate by check mark if the registrant is not required to file reports pursuant to Section 13 or Section 15(d) of the Act. x Yes ¨ No
Indicate by check mark whether the registrant (1) has filed all reports required to be filed by Section 13 or 15(d) of the Securities Exchange Act of 1934 during the preceding 12 months (or for such shorter period that the registrant was required to file such reports), and (2) has been subject to such filing requirements for the past 90 days. x Yes ¨ No
Indicate by check mark whether the registrant has submitted electronically and posted on its corporate Web site, if any, every Interactive Data File required to be submitted and posted pursuant to Rule 405 of Regulation S-T (§232.405 of this chapter) during the preceding 12 months (or for such shorter period that the registrant was required to submit and post such files). Yes ¨ No ¨
Indicate by check mark if disclosure of delinquent filers pursuant to Item 405 of Regulation S-K (§ 229.405 of this chapter) is not contained herein, and will not be contained, to the best of registrant’s knowledge, in definitive proxy or information statements incorporated by reference in Part III of this Form 10-K or any amendment to this Form 10-K. x
Indicate by check mark whether the registrant is a large accelerated filer, an accelerated filer, a non-accelerated filer or a smaller reporting company. See definition of “accelerated filer,” “large accelerated filer,” and “smaller reporting company” in Rule 12b-2 of the Exchange Act.
| Large Accelerated Filer | ¨ | Accelerated Filer | ¨ | |||
| Non-accelerated filer | x | Smaller reporting company | ¨ | |||
Indicate by check mark whether the registrant is a shell company (as defined in Rule 12b-2 of the Exchange Act). ¨ Yes x No
As of February 28, 2010, the registrant had 1,000 shares of Common Stock outstanding.
The registrant meets the conditions set forth in General Instruction I of Form 10-K and is therefore filing this Form 10-K with the reduced disclosure format.
Table of Contents
Page 2 of 94
Table of Contents
FORWARD-LOOKING STATEMENTS
Certain information set forth in this report contains “forward-looking statements” within the meaning of the federal securities laws. Forward-looking statements include statements concerning our plans, objectives, goals, strategies, future events, future revenues or performance, capital expenditures, financing needs, plans or intentions relating to acquisitions and other information that is not historical information. In some cases, forward-looking statements can be identified by terminology such as “believes,” “expects,” “may,” “will,” “should,” or “anticipates,” or the negative of such terms or other comparable terminology, or by discussions of strategy. We may also make additional forward-looking statements from time to time. All such subsequent forward-looking statements, whether written or oral, by us or on our behalf, are also expressly qualified by these cautionary statements.
All forward-looking statements, including without limitation, management’s examination of historical operating trends, are based upon our current expectations and various assumptions. Our expectations, beliefs and projections are expressed in good faith and we believe there is a reasonable basis for them, but there can be no assurance that management’s expectations, beliefs and projections will result or be achieved. All forward-looking statements apply only as of the date made. Unless required by law, we undertake no obligation to update or revise forward-looking statements to reflect events or circumstances after the date made or to reflect the occurrence of unanticipated events.
There are a number of risks and uncertainties that could cause our actual results to differ materially from the forward-looking statements contained in or contemplated by this report. The following are among the factors that could cause actual results to differ materially from the forward-looking statements. There may be other factors, including those discussed elsewhere in this report, which may cause our actual results to differ materially from the forward-looking statements. Any forward-looking statements should be considered in light of the risk factors specified in this Form 10-K.
Unless the context otherwise indicates, all references in this report to the “Company,” “Innophos,” “we,” “us” or “our” or similar words are to Innophos, Inc. and its consolidated subsidiaries. Innophos, Inc. is a Delaware corporation and was incorporated July 15, 2004.
Page 3 of 94
Table of Contents
| ITEM 1. | BUSINESS |
Our Company
Innophos, Inc., an indirect wholly-owned subsidiary of Innophos Holdings, Inc. (“Holdings”), commenced operations as an independent company in August 2004 after Holdings purchasing our North American specialty phosphates business from affiliates of Rhodia, S.A., or Rhodia. In November 2006, Holdings completed an initial public offering and listed their Common Stock for trading on the NASDAQ Stock Market under the symbol “IPHS”.
Innophos is a leading North American producer of specialty phosphates. Many specialty phosphates are application-specific compounds engineered to meet customer performance requirements. Specialty phosphates are often critical to the taste, texture and performance of foods, beverages, pharmaceuticals, oral care products and other applications. For example, specialty phosphates act as flavor enhancers in beverages, electrolytes in sports drinks, texture additives in cheeses, leavening agents in baked goods, calcium and phosphorus sources for nutritional supplements, pharmaceutical excipients and cleaning agents in toothpaste.
Key Product Lines
We have three principal product lines: (i) Specialty Salts and Specialty Acids, (ii) Purified Phosphoric Acid, and (iii) Technical Sodium Tripolyphosphate (STPP) & Other Products. Our products serve diverse end-use markets which historically have exhibited stable demand growth.
Specialty Salts and Specialty Acids
Specialty Salts and Specialty Acids are the most highly engineered products in our portfolio. There are a wide range of application-specific products for Specialty Salts, such as flavor enhancers in beverages, electrolytes in sports drinks, texture modifiers in cheeses, leavening agents in baked goods, calcium and phosphorus sources for nutritional supplements, pharmaceutical excipients and abrasives in toothpaste. Specialty Acids are used in industrial applications such as asphalt modification and petrochemical catalysis.
The table below presents a list of the main Specialty Salts and Specialty Acids sold by us in 2009:
| Product |
Description/End-Use Application | |
| Sodium Aluminum Phosphate, Acidic and Basic (“SALP”) | Premier leavening agent for baking mixes, cakes, self-rising flours, baking powders, batter & breadings (acidic). Improves melting properties of cheese (basic). | |
| Sodium Acid PyroPhosphate (“SAPP”) | Leavening agent for baking powders, doughnuts, and biscuits; inhibits browning in potatoes; provides moisture and color retention in poultry and meat. | |
| Sodium HexaMetaPhosphate (“SHMP”) | Water treatment applications; anti-microbial and sequestrant in beverages; cheese emulsifier; improves tenderness in meat, seafood and poultry applications. | |
| Monocalcium Phosphate (“MCP”) | Leavening agent in double-acting baking powder; acidulant; buffering agent. | |
| Dicalcium Phosphate (“DCP”) | Toothpaste abrasive; leavening agent; calcium fortification. | |
| Tricalcium Phosphate (“TCP”) | Calcium and phosphorus fortifier in food and beverage applications (e.g., orange juice, cereals, and cheese); flow aid; additive in expandable polystyrene. | |
Page 4 of 94
Table of Contents
| Product |
Description/End-Use Application | |
| Pharma Calcium Phosphates (“A-Tab®”, “Di-Tab®”, “Tri-Tab®”) | Excipients in vitamins, minerals, nutritional supplements and pharmaceuticals. | |
| Ammonium Phosphates (“MAP”, “DAP”) | High-end fertilizer products for horticultural use; flame retardant; cigarette additives; culture nutrient. | |
| Potassium Phosphates (“TKPP”, “DKP”, “MKP”, “KTPP”) | Water treatment; sports drinks; buffering agent; improves tenderness in meat, seafood and poultry applications; horticulture applications. | |
| Specialty Acids (e.g., Polyacid, High Purity) | Additive improving performance properties of asphalt; electronic applications. | |
| Sodium Blends (e.g., Sodium Tripolyphosphate (STPP (food grade))) | Ingredient improving yield, tenderness, shelf life, moisture and color retention in meat, seafood and poultry applications. | |
| Other (Sodium Bicarbonate, Calcium Acid Pyrophosphate (“CAPP”), Tetrasodium Pyrophosphate (“TSPP”), Mono, Di, & Trisodium Phosphates (“MSP”, “DSP”, “TSP”)) | Baking powders; gelling agent in puddings; cheese emulsifiers. | |
Each salt or acid derivative typically has a number of different applications and end uses. For example, DCP can be used both as a leavening agent in bakery products and as an abrasive in oral care products. However, several food grade salts are unique to the end user in their particular finished product application. Manufacturers often work directly with customers to tailor products to their required specifications.
Our major competitor in the downstream Specialty Salts and Specialty Acids is Israel Chemicals Limited, or ICL.
Purified Phosphoric Acid
Purified Phosphoric Acid (PPA) is a higher-purity form of phosphoric acid, distinct from the agricultural-grade merchant green phosphoric acid used in fertilizer production. PPA is used to manufacture specialty phosphate salts and acids and is also used directly in beverage applications as a flavor enhancer and in water treatment applications. We also sell PPA in the merchant market to third-party phosphate derivative producers.
Our major PPA competitor is Potash Corporation of Saskatchewan Inc., or PCS, a global fertilizer company for which specialty phosphates represents only a small part of its business. We consume the majority of our PPA production in our downstream operations and sell the remainder on the North American merchant market and to other downstream phosphate derivative producers, where we compete with PCS. To the best of our knowledge, PCS does not have any downstream technical or food grade phosphate derivative production capacity, other than a small potassium phosphate salt unit which primarily operates under a contract manufacturing arrangement.
Technical Grade Sodium Tripolyphosphate (STPP) & Other Products
STPP is a specialty phosphate derived from reacting phosphoric acid with a sodium alkali. STPP is a key ingredient in cleaning products, including automatic dishwashing detergents, industrial and institutional cleaners and (outside the U.S.) consumer laundry detergents. In addition to its use in cleaning products, STPP is also used in water treatment, clay processing, and copper ore processing. Over 90% of the end use market for STPP is derived from consumer product applications.
Other Products primarily include phosphate fertilizers produced in Mexico chiefly as co-products of manufacturing PPA.
Our major STPP competitor is Mexichem, S.A.B. de C.V., or Mexichem, in Mexico. Currently, Mexichem produces STPP at two manufacturing locations in Mexico.
Over the past several decades, there have been efforts to reduce the use of STPP in consumer and institutional cleaners. In the 1980’s STPP use in consumer laundry applications was discontinued in the U.S. and Canada. Over the last several
Page 5 of 94
Table of Contents
years momentum has gained in eliminating STPP use in consumer automatic dishwashing applications in the U.S. and Canada. It is expected that most detergent manufacturers will discontinue the use of STPP in automatic dishwashing detergent applications during 2010. The Industrial & Institutional market has also reformulated some of its products to reduce STPP content in an effort to market a lower cost and reduced phosphate content product line. In 2008, a global retailer began an initiative to materially reduce the use of STPP in consumer laundry detergent in Latin America by 2011. In January 2009, our largest customer, Quimir, a division of Mexichem, closed its largest STPP plant. Our Mexican operations have historically dedicated a significant portion of their capacity to the production of STPP directly and have sold purified acid to other producers of STPP. In anticipation of reduced detergent grade STPP related demand Innophos Mexico is investing in upgrading the food grade acid and salts capability of the Coatzacoalcos facility, and consequently substantially reducing the portion of capacity dedicated to detergent grade products.
Our Industry
The North American marketplaces for each of our product lines have seen consolidation to two primary producers and several secondary suppliers. We consider the two key producers in each product category to be: (i) our Company and ICL, which acquired Astaris LLC, or Astaris, in 2005, in Specialty Salts and Specialty Acids; (ii) our Company and PCS, in Purified Phosphoric Acid; and (iii) our Company and Mexichem in Technical STPP. The production of specialty phosphates begins with phosphate rock, which can be processed in two alternative ways to produce Purified Phosphoric Acid (PPA): (i) the thermal acid method, in which elemental phosphorus is combusted in a furnace and subsequently hydrated to produce purified phosphoric acid; or (ii) the purified wet acid method (PWA), in which mined phosphate rock is reacted with sulfuric acid to produce merchant green acid, or MGA, (agricultural grade phosphoric acid), which is then purified through solvent-based extraction into purified phosphoric acid. The conversion of merchant green acid into purified phosphoric acid (PPA) is a technically complex and a capital-intensive process.
The thermal acid method of production is based on the electrolytic production of elemental phosphorus and is therefore electricity intensive, while phosphoric acid made by the purified wet acid process requires the use of significant amounts of sulfuric acid. The relative overall costs of the two methods depend on the availability and cost of their component processes, electricity and coke for the former and sulfur for the latter. Purified phosphoric acid is reacted with appropriate mineral salts or inorganic compounds to produce various specialty phosphate salts or STPP as required. We currently use purified acid manufactured via the wet acid process for all of our Specialty Salts and Specialty Acids manufacturing needs.
Consolidation of producers has been most significant in the Specialty Salts and Specialty Acids market.
In addition to consolidation of producers, uneconomic production capacity has been eliminated in North America across all three major specialty phosphate product categories. For instance, in 2001, Rhodia closed its specialty salts and specialty acids plants in Buckingham, Quebec and Morrisville, Pennsylvania. In 2002, Vicksburg Chemical Company closed a specialty salts plant in Vicksburg, Mississippi. In 2003 and 2004, Astaris closed three manufacturing facilities, eliminating roughly 320,000 metric tons of capacity: a purified wet phosphoric acid plant in Conda, Idaho; a specialty salts plant in Trenton, Michigan; and an STPP plant in Green River, Wyoming. In January 2009, Mexichem closed its Coatzacoalcos facility eliminating approximately 50% of their estimated STPP capacity.
In June 2006, PCS started up a fourth PWA based purified phosphoric acid production train at its Aurora, NC facility, a capacity addition less than the estimated combined level of 2006 North American PPA imports and domestic PPA produced via the thermal process. The PCS capacity increase was also comparable in capacity to the Astaris Idaho plant closed in 2003 following a failed start-up.
Penetration from Imports
Over the past several years, we estimate that imports, including domestically located production facilities owned by foreign based organizations, have accounted for approximately 15-20% of the North American specialty phosphate market. This market share has been fairly stable for the last two years; however, China imports of STPP and Phosphoric acid increased in 2009, off-setting reductions in phosphoric acid imports from Belgium & Israel.
The following are the primary importers of purified phosphoric acid products and derivatives into North America: (i) Prayon SA, or Prayon, and Rotem Amfert Negev Ltd. (a subsidiary of ICL) for purified phosphoric acid, with Prayon primarily supplying acid to its specialty salts manufacturing facility in Augusta, Georgia; and (ii) various Chinese, European, and Israeli specialty phosphate manufacturers such as Chemische Fabrik Budenheim, Thermphos, Hubei Xingfa, Jiangyin Chengxing, Guangxi Mingli and BK Giulini Chemie GmbH & Co. (a subsidiary of ICL) for specialty salts and STPP.
Page 6 of 94
Table of Contents
Our Customers
Our customer base is principally composed of consumer goods manufacturers, distributors and specialty chemical manufacturers. Our customers manufacture products such as soft drinks, sports drinks and juices, various food products, toothpaste and other dental products, petroleum and petrochemical products, and various cleaners and detergents. Our customers include major consumer goods manufacturers with global market recognition in the food, beverage, pharmaceutical and cleaning product markets. We have maintained long-term relationships with the majority of our key customers, with the average customer relationship having lasted over 15 years, and some relationships spanning nearly a century. Our specialty chemical products are often critical ingredients in the formulation of our customers’ products, and typically represent only a small percentage of their total product costs. As a result, we believe that the risks associated with our customers switching suppliers often outweigh the potential gains.
For the years ended December 31, 2007, 2008 and 2009, we generated net sales of $579.0 million, $934.8 million and $666.8 million, respectively. Net sales by end-market were as follows:
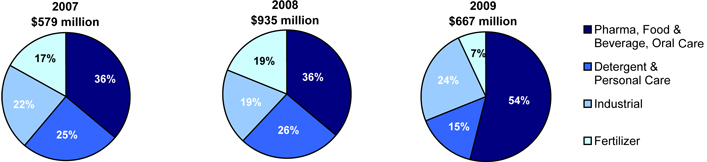
The company delivered record revenues in 2008 as we responded to rapidly rising market raw material costs by effectively raising our own selling prices. By early 2009, raw material costs had fallen rapidly together with recessionary economic conditions that also negatively impacted demand in 2009 compared to 2008. We responded with reductions in our own selling prices during 2009. Through this period our continued focus on demonstrating the value of our products and service to high value end markets has enabled us to significantly enhance our mix with now over 50% of our sales into pharmaceutical, food, beverage and oral care applications.
Raw Materials and Energy
We purchase a range of raw materials and energy sources on the open market, including phosphate rock, sulfur and sulfuric acid, agricultural grade phosphoric acid (also known as MGA), PPA, natural gas and electricity. To help secure supply, we purchase several of our key raw materials under long-term contracts generally providing for fixed or minimum quantities of materials, or purchase of our full requirements, and predetermined pricing formulae based on various market indices and other factors. We do not engage in any significant futures or other derivative contracts to hedge against fluctuations of raw material . We are not integrated vertically back to our sources of supply by ownership interests, joint ventures or affiliated companies, as a result of which raw materials acquisition at economical price levels is a major risk of our business. See Item 1A “Raw Materials Availability and Pricing” of this Report Form 10-K.
Phosphate Rock and Merchant Green Acid (MGA). MGA is the main raw material for the creation of our downstream salts and acids. We purchase MGA for processing at our Geismar, LA facility through a long-term agreement with PCS. At our Coatzacoalcos facility in Mexico we typically purchase phosphate rock in order to produce MGA internally; however, we can also process externally purchased MGA, available from various suppliers globally. We have an agreement with OCP, S.A., or OCP, for the supply of phosphate rock to Mexico, which is scheduled to expire on September 10, 2010. The price we pay OCP under this contract was settled annually based on parameters established in the contract and has now been fixed for the remainder of the current contract. During 2008 and 2009 volatility in the market price of phosphate rock led to a dispute between OCP and Innophos over the application of the supply contract pricing clause. Having failed to settle these differences by negotiation the parties began arbitration at the ICC in Paris over the pricing dispute and counterclaims made by OCP asserting a failure by Innophos to meet implied minimum purchase and exclusivity commitments. This dispute was settled on February 24, 2010, details of the settlement are included in Note 16 of Notes to Consolidated Financial Statements in “Item 8. Financial Statements and Supplementary Data.” We are currently in active negotiations with several suppliers for phosphate rock supply once the OCP contract expires.
Page 7 of 94
Table of Contents
Sulfur and Sulfuric Acid. Sulfur is the key raw material used in the production of Sulfuric Acid. Sulfuric acid is a key raw material used in the production of merchant green acid. We produce the vast majority of the sulfuric acid required to operate our Coatzacoalcos facility. The majority of the sulfuric acid required for the production of MGA by PCS, at Geismar is supplied by Rhodia. Our U.S. needs for sulfuric acid and our Mexican needs for sulfur are handled through long term contracts with Rhodia and Pemex-Gas y Petroquimica Basica, or PEMEX, respectively.
Purified Phosphoric Acid. The key raw material input for all of our downstream Specialty Salt and Specialty Acid operations is PPA. We purchase certain quantities of our PPA supply from third parties to optimize our consumption and net sales, including from PCS with whom we have a long-term supply contract. In 2009 Innophos produced approximately 70 percent and purchased approximately 30 percent of its total PPA supply.
Natural Gas and Electricity. Natural gas and electricity are used to operate our facilities and generate heat and steam for the various manufacturing processes. We typically purchase natural gas and electricity on the North American open market at so-called “spot rates.” From time to time, we will enter into longer term natural gas and electricity supply contracts in an effort to eliminate some of the volatility in our energy costs. We also seek to increase the energy efficiencies of our facilities and reduce costs through investments such as the co-generation project for our Coatzacoalcos Plant commissioned into service in March 2008.
Research and Development
Our product engineering and development activities are aimed at developing and enhancing products, processes, applications and technologies to strengthen our position in our markets and with our customers. We focus on:
| • | developing new or improved application-specific specialty phosphate products based on our existing product line and identified or anticipated customer needs; |
| • | creating specialty phosphate products to be used in new applications or to serve new markets; |
| • | providing customers with premier technical services as they integrate our specialty phosphate products into their products and manufacturing processes; |
| • | ensuring that our products are manufactured in accordance with our stringent regulatory, health and safety policies and objectives; |
| • | developing more efficient and lower cost manufacturing processes; and |
| • | expanding existing, and developing new, relationships with customers to meet their product engineering needs. |
Our research expenditures were $1.9 million, $2.3 million and $2.0 million for the years ended December 31, 2009, December 31, 2008 and December 31, 2007, respectively.
Environmental and Regulatory Compliance
Certain of our operations involve manufacturing ingredients for use in food, nutritional supplement and pharmaceutical excipient products, and therefore must comply with stringent U.S. Food and Drug Administration, or FDA or the U.S. Department of Agriculture, or USDA good manufacturing practices as well as the quality requirements of our customers. In addition, our operations that involve the use, handling, processing, storage, transportation and disposal of hazardous materials, are subject to extensive and frequently changing environmental regulation by federal, state, and local authorities, as well as regulatory authorities with jurisdiction over our foreign operations. Our operations also expose us to the risk of claims for environmental remediation and restoration or for exposure to hazardous materials. Our production facilities require operating permits that are subject to renewal or modification. Violations of health and safety and environmental laws, regulations, or permits may result in restrictions being imposed on operating activities, substantial fines, penalties, damages, the rescission of an operating permit, third-party claims for property damage or personal injury, or other costs, any of which could have a material adverse effect on our business, financial condition, results of operations, or cash flows. Due to changes in health and safety and environmental laws and regulations, the time frames when those laws and regulations might be applied, and developments in environmental control technology, we cannot predict with certainty the amount of capital expenditures to be incurred for environmental purposes.
Page 8 of 94
Table of Contents
Some environmental laws and regulations impose liability and responsibility on present and former owners, operators or users of facilities, and sites for contamination at such facilities and sites without regard to causation or knowledge of contamination. Many of our sites have an extended history of industrial use. Soil and groundwater contamination have been detected at some of our sites, and additional contamination might occur or be discovered at these sites or other sites in the future (including sites to which we may have sent hazardous waste). We continue to investigate, monitor or cleanup contamination at most of these sites. The potential liability for all these sites will depend on several factors, including the extent of contamination, the method of remediation, future developments and increasingly stringent regulation , the outcome of discussions with regulatory agencies, the liability of third parties, potential natural resource damage, and insurance coverage. Accruals for environmental matters are recorded in the accounting period in which our responsibility is established and the cost can be reasonably estimated. Due to the uncertainties associated with environmental investigations and cleanups and the ongoing nature of the investigations and cleanups at our sites, we are unable to predict precisely the nature, cost and timing of our future remedial obligations with respect to our sites and, as a result, our actual environmental costs and liabilities could significantly exceed our accruals.
Further information, including the current status of significant environmental matters and the financial impact incurred for the remediation of such environmental matters, is included in Note 14, Commitments and Contingencies, of the Notes to Financial Statements in “Item 8. Financial Statements and Supplementary Data,” and in “Item 1A. Risk Factors”.
Intellectual Property
We rely on a combination of patent, copyright and trademark laws to protect certain key intellectual aspects of our business. In addition, our pool of proprietary information, consisting of manufacturing know-how, trade secrets and unregistered copyrights relating to the design and operation of our facilities and systems, is considered particularly important and valuable. Accordingly, we protect proprietary information through all legal means practicable. However, monitoring the unauthorized use of our intellectual property is difficult, and the steps we have taken may not prevent all unauthorized use by others. While we consider our copyrights and trademarks to be important to our business, ultimately our established reputation and the products and service we provide to the end-customer are more important.
Insurance
In the normal course of business, we are subject to numerous operating risks, including risks associated with environmental, health and safety while manufacturing, developing and supplying products, potential damage to a customer, and the potential for an environmental accident.
We currently have in force insurance policies covering property, general liability, excess liability, workers’ compensation/employer’s liability, product liability, product recall, fiduciary and other coverages. We seek to maintain coverages consistent with market practices and required by those with whom we do business. We believe that we are appropriately insured for the insurable risks associated with our business.
Employees
As of December 31, 2009, we had approximately 990 employees, of whom 693 were unionized hourly wage employees. We currently employ both union and non-union employees at most of our facilities. We believe we have a good working relationship with our employees, which has resulted in high productivity and low turnover in key production positions. We have experienced no work stoppages or strikes at any of our unionized facilities since acquiring them in 2004. We are a party to a collective bargaining agreement with the United Steel, Paper and Forestry, Rubber, Manufacturing, Energy, Allied Industrial and Service Workers International Union, Local No. 7-765 through January 16, 2011 at the Chicago Heights facility; International Union of Operating Engineers, Local No. 912 through April 15, 2010 at the Nashville facility; the Health Care, Professional, Technical, Office, Warehouse and Mail Order Employees Union, affiliated with the International Brotherhood of Teamsters, Local 743 through June 17, 2011 at the Chicago (Waterway) facility; the United Steelworkers of America, Local No. 6304 through April 30, 2011 at the Port Maitland, Ontario facility; and the Sindicato de Trabajadores de la Industria Química, Petroquímica, Carboquímica, Similares y Conexos de la República Mexicana, at the Mexico facilities. The agreement at the Coatzacoalcos, Mexico facility is for an indefinite period, but wages are reviewed every year and the rest of the agreement is subject to negotiation every two years. The current two-year period will expire in June 2010.
Page 9 of 94
Table of Contents
Executive Officers
The following table and biographical material present information about the persons serving as our executive officers, and key employees:
| Name |
Age | Position | ||
| Randolph Gress |
54 | Chairman of the Board, Chief Executive Officer, President and Director | ||
| Neil Salmon |
41 | Vice President and Chief Financial Officer | ||
| William Farran |
60 | Vice President, General Counsel and Corporate Secretary | ||
| Charles Brodheim |
46 | Corporate Controller | ||
| Louis Calvarin |
46 | Vice President—Operations | ||
| Mark Feuerbach |
51 | Vice President—Treasury, Financial Planning & Analysis | ||
| Joseph Golowski |
48 | Vice President—Sales | ||
| Wilma Harris |
64 | Vice President—Human Resources | ||
| Russell Kemp |
50 | Vice President—Research & Development | ||
| Michael Lovrich |
56 | Vice President—Supply Chain | ||
| Abraham Shabot |
48 | Vice President—Director General—Innophos Latin America | ||
| Mark Thurston |
50 | Vice President—Corporate Strategy and Worldwide Business Development | ||
| Timothy Treinen |
59 | Vice President—Phosphates Business |
Biographical Material
Randolph Gress is Chairman of the Board, Chief Executive Officer, President and Director of Innophos. Mr. Gress has served as Chief Executive Officer of Innophos since August 2004. Previously, Mr. Gress joined Rhodia in 1997 and became Vice President and General Manager of the sulfuric acid business. He was named global President of Specialty Phosphates (based in the U.K.) in 2001. Prior to joining Rhodia, Mr. Gress spent fourteen years at FMC Corporation where he worked in various managerial capacities in the Chemical Products, Phosphorus Chemicals and Corporate Development groups. From 1977 to 1980, Mr. Gress worked at Ford Motor Company in various capacities within the Plastics, Paint and Vinyl Division. Mr. Gress earned a B.S.E. in Chemical Engineering from Princeton University and an M.B.A. from Harvard Business School.
Neil Salmon is Vice President and Chief Financial Officer of Innophos. Mr. Salmon joined Innophos in October 2009. Previously he spent around 20 years with Imperial Chemical Industries PLC (ICI), holding a succession of divisional and corporate finance roles across various specialty chemicals businesses in Africa, US, UK and Asia Pacific. Most recently he was CFO of the Adhesives Business Group, a $2 billion division, operating globally. From 2004-2007 he was CFO of the Asia Pacific division of National Starch and Chemical, an ICI subsidiary. Mr. Salmon is a Chartered Management Accountant and earned an M.A. (Hons) in Politics, Philosophy and Economics from Oxford University.
William Farran is Vice President, General Counsel and Corporate Secretary of Innophos. Prior to joining Innophos, Mr. Farran was Assistant General Counsel of Rhodia, Inc., providing and managing a wide range of legal services to various Rhodia North American enterprises. Prior to joining Rhodia in 1987, Mr. Farran was Senior Counsel for UGI Corporation, Valley Forge, PA, and an associate with Morgan, Lewis & Bockius, Philadelphia, PA. Mr. Farran earned his B.S. in Economics from the Wharton School, University of Pennsylvania and his J.D. from Case Western Reserve University. He is a member of the bars of the Supreme Court of Pennsylvania and the Supreme Court of the United States.
Charles Brodheim is Corporate Controller of Innophos. Mr. Brodheim joined Rhodia in 1988 and held various tax, accounting and business analyst positions within Rhodia. Mr. Brodheim was the North American Finance Director for Specialty Phosphates from 2000-2002. After 2002, Mr. Brodheim was a Finance Director for various Rhodia North American Enterprises, including its Eco-Services enterprise. Mr. Brodheim earned a B.B.A. degree in Finance/Accounting from Temple University and is a certified public accountant.
Louis Calvarin is Vice President—Operations of Innophos. Dr. Calvarin joined Rhodia in France in 1986. He has been Director of Manufacturing and Engineering for Specialty Phosphates since January 2004. Prior to that, Dr. Calvarin held the positions of Director of Manufacturing for Specialty Phosphates (U.S.), Mineral Chemicals Industrial Operations Manager for Home, Personal Care and Industrial Ingredients, and Projects Director for Paint, Paper and Construction Materials. Dr. Calvarin earned a Ph.D. degree in Chemical Engineering from the Ecole Nationale Superieure des Mines in France and graduated from Ecole Polytechnique in France.
Page 10 of 94
Table of Contents
Mark Feuerbach was appointed Vice President—Treasury, Financial Planning & Analysis of Innophos in April, 2005 and had previously served as Chief Financial Officer of Innophos from August 2004 through April 2005 and again served as Chief Financial Officer from June through September 2009. Mr. Feuerbach joined Rhodia in 1989 and was Global Finance Director of Specialty Phosphates from 2000 to 2004, including a two-year assignment in the U.K. immediately following the purchase of the phosphates business of Albright & Wilson. Prior to this assignment, Mr. Feuerbach was the Finance Director of Rhodia’s North American phosphates business from 1997 to 2000 and he previously held various finance positions in a number of Rhodia’s businesses. Prior to joining Rhodia, Mr. Feuerbach held various accounting and finance positions in both manufacturing and service companies. Mr. Feuerbach earned a B.A. in Business Administration/Accounting from Rutgers College and an M.B.A. in Finance/Information Systems from Rutgers Graduate School of Management.
Joseph Golowski is Vice President—Sales & Distribution of Innophos. Joining Rhodia in 1989 as Market Development Specialist, Mr. Golowski has since then held progressive roles in business development, sales, marketing and management. From 1997 through 2000, Mr. Golowski served as a Global Market Director for Rhodia based in Paris, France. Returning to the U.S., he became the North American Asset Manager for Phosphoric Acid and subsequently the Director of Sales for the Specialty Phosphate Business. Mr. Golowski has earned a B.S. in Ceramic Engineering from Rutgers University, College of Engineering.
Wilma Harris is Vice President—Human Resources of Innophos. Ms. Harris joined Rhodia in 1986 as Human Resource Manager for the Agricultural Products business located in Research Triangle Park, NC. Since that time she has held various positions in corporate, shared services and business human resources and information technology. From January 2003 until August 2005, she was the Human Resources Director for the Specialty Phosphates and Performance Phosphates and Derivatives businesses. Prior to joining Rhodia, Ms. Harris worked for Union Carbide Corporation in several labor relations and research and development positions. She holds a B.S. degree from West Virginia University, a M.P.A. degree from Marshall University and Masters Degrees in Theological Studies and Divinity from New Brunswick, NJ Theological Seminary.
Russell Kemp is Vice President—Research & Development of Innophos. Mr. Kemp joined Rhodia in 1989, first holding several manufacturing management jobs and – from 1998 through 2007 – fulfilling a business management role. Previously, he worked as a process and production engineer at Monsanto Company. Mr. Kemp earned a BS in Chemical Engineering from the Colorado School of Mines and an MBA from Southern Illinois University – Edwardsville.
Michael Lovrich is Vice President—Supply Chain of Innophos. Mr. Lovrich joined Innophos in August, 2007 from Coach, Inc., where he served as Vice President, Supply Chain from 2004 through 2007 for that specialty leather and women’s accessories manufacturer. Prior to his tenure with Coach, Mr. Lovrich was with Engelhard Corporation where he held various positions in Supply Chain Operations and Information Technology focusing on leading several supply chain transformation initiatives. Prior to Engelhard, Mr. Lovrich held positions with Fisher Scientific, Thompson Medical and Becton-Dickinson. Mr. Lovrich earned his B.A. in History from William Paterson College and his MBA from New York University Stern School of Business.
Abraham Shabot is Vice President and Director General—Innophos Latin America. Mr. Shabot joined Innophos in July 2009. Prior to joining Innophos, he served as Managing Director of Kaltex Fibers, a leading acrylic fiber producer in the Americas, from 2007 to 2009. Before that, he held various positions in Sales and Business Development for Comex, a large Mexican building supplies manufacturer and distributor. In addition, he was Latin American Director for Polyone Corporation, a large publicly held manufacturer and distributor of plastic resin and rubber compounds. He earned a degree in Chemical Engineering from Iberoamericana University in Mexico City.
Mark Thurston is Vice President—Corporate Strategy and Worldwide Business Development. Prior to his appointment to his current role in 2009, Mr. Thurston served as Vice President—Specialties of Innophos from 2004 through 2008. Mr. Thurston joined Rhodia in 1985 working in Fine Organics and has been Business Director of Specialties since February 2004. Previously, Mr. Thurston was a Vice President and General Manager of Food Ingredients North America from 2002 to 2004 and, prior to that, worked in various sales and marketing capacities for Rhodia. Mr. Thurston previously worked at RTZ Corp. as an assistant planning and marketing manager and an assistant production manager. Mr. Thurston earned a B.S. in Chemical Engineering from the University of Aston in Birmingham, England.
Timothy Treinen is Vice President—Phosphates Business of Innophos. Mr. Treinen joined Rhodia in 2000 as the Global Asset Director, Acid and had been a Business Director of Performance Chemicals since February 2004. Prior to joining Rhodia, Mr. Treinen spent thirteen years at Albright & Wilson where he worked as a Vice President and General
Page 11 of 94
Table of Contents
Manager of Industrial Chemicals from 1994 to 2000. Previously, Mr. Treinen worked at Tenneco Inc. in the finance department in various capacities including strategic planning, plant controller and accounting manager. Mr. Treinen earned a B.B.A. in Accounting from the University of Iowa.
Available Information
The SEC maintains a website that contains reports, proxy and information statements, and other information regarding issuers, including the Company, that file electronically with the SEC. The public can obtain any documents that the Company files with the SEC at http://www.sec.gov. The Company files annual reports, quarterly reports, proxy statements and other documents with the Securities and Exchange Commission (SEC) under the Securities Exchange Act of 1934 (Exchange Act). The public may read and copy any materials that the Company files with the SEC at the SEC’s Public Reference Room at 100 F Street, N.E., Room 1580, Washington, D.C. 20549. The public may obtain information on the operation of the Public Reference Room by calling the SEC at 1-800-SEC-0330.
Innophos also makes available free of charge through its website (www.innophos.com) the Company’s Annual Report on Form 10-K, Quarterly Reports on Form 10-Q, Current Reports on Form 8-K, and, if applicable, amendments to those reports filed or furnished pursuant to the Exchange Act as soon as reasonably practicable after the Company electronically files such material with, or furnishes it to, the SEC.
Page 12 of 94
Table of Contents
| ITEM 1A. | RISK FACTORS |
Investing in our company involves a high degree of risk of varying origins, including from our operations and financial matters. If any of the following risks or uncertainties actually occurs, our business, prospects, financial condition and results of operations could be materially and adversely affected.
Risks Related to Our Business Operations
Raw Materials Availability and Pricing
Our principal raw materials consist of phosphate rock, sulfur and sulfuric acid, MGA, PPA and energy (principally natural gas and electricity). Our raw materials are generally purchased under long-term supply contracts typically priced according to predetermined formulae dependent on price indices or market prices. The prices we pay under these contracts generally may lag the market prices of the underlying raw material. In periods of increasing market prices, these long-term supply contracts tend to be favorable to the Company, possibly by material amounts. Conversely, in periods of decreasing market prices, these long-term supply contracts tend to be unfavorable to the Company, possibly by material amounts. We do not typically engage in futures or other derivatives contracts to hedge against fluctuations in future prices. These effects may also be amplified in the case of supply contracts that have multiple-year durations. The Company may enter into sales contracts where the selling prices for our products (or some of the components within a specific pricing formula) are fixed for a period of one year, exposing us to volatility in raw materials prices that we acquire on a spot market basis.
Various market conditions can affect the price and supply of our raw materials. Because phosphate rock is also used globally for fertilizer production, the cost of that material is heavily influenced by demand conditions in the fertilizer market and freight costs, which traditionally have been volatile, and both of which escalated rapidly during 2007 and 2008, although they have declined since the fourth quarter of 2008 and throughout 2009. We obtain substantially all our phosphate rock for our Coatzacoalcos, Mexico facility from OCP, a state-owned mining company in Morocco under a 1992 supply agreement set to expire September 10, 2010, with an option to take delivery of a portion of the committed volume through December 2010. Our supply of that material could be affected by capacity constraints, political unrest, or weather conditions in the areas where our supplier operates or a failure to reach new supply agreements. Innophos has also been exploring various alternatives for phosphate rock and MGA supplies around the world to reduce our dependence on a single supplier for phosphate rock. Through plant trials at production scale and in our pilot plant, we have made significant progress in confirming our ability to use multiple sources of rock and MGA. At the present time, we do not have committed volume beyond the expiry of our OCP contract; however, we are in active discussions with several suppliers.
New supply arrangements may be on long-term contracts with historical market index pricing similar to OCP or be based on more current market prices. We cannot guarantee that all our production needs in Mexico (at least when measured at historic levels) could be met from alternative rock sources or downstream intermediate products, such as MGA, or, that we could do so without significant purchases at spot market prices. We also cannot guarantee that there will be no material financial impact in the form of higher supply cost from procuring alternative rock and MGA supplies. Alternative grades of rock or MGA could reduce the operating efficiency of the plant and the complexity of handling multiple sources could affect supply chain costs. Nevertheless, based on conditions known thus far, management believes that there are several alternative phosphate rock sources available to us which should meet our current production needs in Mexico.
Natural gas prices have experienced significant volatility in the past several years. Wide fluctuations in natural gas prices may result from relatively minor changes in the supply and demand, market uncertainty, and other factors, both domestic and foreign, that are beyond our control. In addition, natural gas is often a substitute for petroleum-based energy supplies and natural gas prices are positively correlated with petroleum prices. Future increases in the price of petroleum (resulting from increased demand, political instability or other factors) may result in significant additional increases in the price of natural gas. We typically purchase natural gas at spot market prices for use at our facilities which exposes us to that price volatility, except in those instances where, from time to time, we enter into longer term, fixed-price natural gas contracts.
Most of our raw materials are supplied to us by either one or a small number of suppliers. Some of those suppliers rely, in turn, on sole or limited sources of supply for raw materials included in their products. Failure of our suppliers to maintain sufficient capability to meet changes in demand or to overcome unanticipated interruptions in their own sources of supply from force majeure conditions, such as disaster or political unrest, may prevent them from continuing to supply raw materials as we require them, or at all. Our inability to obtain sufficient quantities of sole or limited source raw materials or to develop alternative sources on a timely basis if required could result in increased costs, which may be material, in our operations or our inability to properly maintain our existing level of operations.
Page 13 of 94
Table of Contents
Environmental, Product Regulations and Sustainability Initiative Concerns
Our operations involve the use, handling, processing, storage, transportation and disposal of hazardous materials and some of our products are ingredients in foods, nutritional supplements or pharmaceutical excipients that are used in finished products consumed or used by humans or animals. As a result, we are subject to extensive and frequently changing environmental and other regulatory requirements and periodic inspection by federal, state, and local authorities, including the U.S. Environmental Protection Agency, or EPA, the FDA, and the USDA, as well as other regulatory authorities and those with jurisdiction over our foreign operations. Our operations also expose us to the risk of claims for environmental remediation and restoration or for exposure to hazardous materials. Our production facilities require various operating permits that are subject to renewal or modification. Violations of environmental laws, regulations, or permits may result in restrictions being imposed on operating activities, substantial fines, penalties, damages, the rescission of operating permits, third-party claims for property damage or personal injury, or other costs.
Maintaining compliance with health and safety and environmental laws and regulations has resulted in ongoing costs for us. Currently, we are involved in several compliance and remediation efforts and agency inspections concerning health, safety and environmental matters.
EPA has indicated that compliance at facilities in the phosphate industry is a high enforcement priority. After several years of expressing various concerns (without issuing any notice of violation) about aspects of our Geismar, LA operations, in March 2008, we received notice from the Department of Justice, or DOJ, indicating that EPA had referred the case for civil enforcement, contending, among other things, that we do not qualify for certain exemptions we have claimed, and alleging that we violate the Resource Conservation and Recovery Act, or RCRA at Geismar by failing to manage two materials appropriately. Although the communication stated that EPA/DOJ intended to seek unspecified penalties and corrective action, it proposed discussions to explore possible resolution, which we undertook and are pursuing. In late 2008, the DOJ/EPA demanded that Innophos and its neighboring interconnected supplier, PCS, undertake certain “interim measures” to address DOJ/EPA’s chief environmental concerns. We and PCS have initiated joint technical efforts to explore solutions to the government concerns. Based on our contact with the agencies to date in 2009, we have determined it is probable that one of the process modifications will need to be undertaken in the next several months, and likewise probable that the capital expenditure and future operating expense of that modification will not be material, unless the DOJ adds terms and conditions that could result in the parties not reaching agreement. However, the second measure sought by DOJ/EPA has not yet been fully evaluated from a technological or cost standpoint. The companies have proposed to DOJ/EPA a schedule for such evaluation, and although the government has not formally approved the schedule, the companies are proceeding as proposed. Based upon work so far, there appears to be at least one technically viable approach, but costs of a full scale operation as compared to other approaches are not known at this time. Even though the companies have begun substantial technical work in an attempt to develop a feasible approach to address DOJ/EPA’s concerns, we cannot guarantee that our technical efforts will be successful, whether either party would be willing to implement solutions or, depending on those factors and the agencies’ position, whether this matter will be settled with DOJ/EPA or will require litigation. Should litigation become necessary to defend our operations at Geismar as compliant with environmental laws and regulations, no assurance can be given as to its outcome.
Since similar action has been taken by EPA/DOJ with regard to PCS’s interconnected plant at Geismar from which we obtain acid raw material, it is possible that, in the event of further enforcement, PCS’s operations could be interrupted for an extended time. The impact of any such occurrence would likely be material to our operations, as our Geismar facility may not be able to operate economically under current market conditions without raw materials from that supplier’s plant. Depending upon the facts and circumstances of, and developments arising from, any non-compliance, our long-term raw material supply contract with PCS at Geismar also may be adversely affected. That contract provides important protections that should safeguard Innophos from adverse financial or operating consequences either through continued operations at Geismar or alternative supplies from PCS. Nevertheless, we cannot guarantee that the contract provides full protection against losses we may suffer, or that our operating costs would not increase by a material amount, as a result of the provision.
Some existing environmental laws and regulations impose liability and responsibility on present and former owners, operators or users of facilities and sites for contamination at those locations without regard to causation or knowledge of contamination. Many of our sites have an extended history of industrial use. Soil and groundwater contamination have been detected at some of our sites, and additional contamination might occur or be discovered at these sites or other sites (including sites to which we may have sent hazardous waste) in the future. We continue to investigate, monitor or clean-up contamination at most of these sites. Due to the uncertainties associated with environmental investigations and clean-ups and the ongoing nature of the investigations and clean-ups at our sites, we cannot predict precisely the nature, cost, and timing of our future remedial obligations with respect to our sites.
Page 14 of 94
Table of Contents
Additional laws or regulations focused on phosphate-based products may be implemented in the future. For example, a number of states within the U.S. and the Canadian provinces have moved or are moving to effectively ban the use of phosphate-based products in consumer automatic dishwashing detergents. The trade association that includes major manufacturers of consumer automatic dishwashing detergents has actively supported these efforts in the U.S. and Canada, increasing the likelihood they will become widespread as most of the non-phosphate legislation becomes effective in July 2010. This trend and related changes in consumer preferences has already reduced our requirements for auto dish markets and we have responded with a shift in our capabilities to serve other food and industrial applications. We can not predict the impact and the corresponding responses made by our competitors. Furthermore, although already banned in consumer laundry detergents in many U.S. States, phosphates are still permitted for those applications in many Latin American regions and other parts of the world. We cannot be sure that such a ban for use in consumer laundry detergents may not be implemented in some or all of these markets in the future, or that the same effect may not result from manufacturers reformulating to reduce phosphate levels. Additional laws, regulations or distribution policies focused on reduced use of other phosphate-based products could occur in the future. For example, a global retailer, as part of a corporate sustainability initiative, issued a statement indicating its intent to reduce phosphates in laundry and dish detergents by 70% in its Latin American and Canadian stores. Also, some jurisdictions have threatened to further regulate or ban the use of polyphosphoric acid and orthophosphoric acid in asphalt road construction. During 2008, such restrictions were implemented in New York State, but reversed in Nebraska and in 2009 restrictions were reversed in Wyoming and relaxed in Colorado. In 2009, Colorado allowed the use of polyphosphoric acid in asphalt road construction on an exception basis. Such a ban, if instituted in multiple jurisdictions or throughout the U.S. and Canada, could have a significant impact on our business.
Increased Costs and Pricing May Accelerate Substitution of Competing Products
Prices for raw materials necessary to manufacture our products, particularly phosphate rock and sulfur, rose dramatically from mid-2007 through most of 2008, although falling demand and prices for some raw materials, particularly sulfur, were seen in 2009. Although we have generally been successful in recovering costs and enhancing margins through price increases on prior occasions, there can be no assurance we will be able to do so in the future. See Item 7, Management’s Discussion and Analysis of Results of Operations and Financial Condition “Recent Trends and Outlook”.
As the costs and prices of our products correspondingly rise, certain of those products, particularly those directed at end use markets such as the detergent and oral care markets (where their portion of the end product cost is often larger), face an increasing threat of substitution from cost factors alone. Under circumstances where the costs of known and acceptable substitute non-phosphate chemistries become economically viable for a significant portion of our end use markets, our customers may decide to utilize the substitute chemistries to control their costs. If higher costs and prices result in such substitutions for major products and markets and we are not able to shift our manufacturing capabilities to alternate products we can sell profitably, we could face a loss of volumes, revenues and/or profits from this kind of cost-driven substitution. Although we cannot estimate the pricing levels at which cost substitution will affect us (since it depends on variables such as the duration of price escalations, the availability and costs of our products relative to the substitutes, and future marketing and pricing decisions made by our customers), we believe, based on our understanding of where substitutions become feasible, at least 30% of our current end use markets could be exposed to some level of potential cost substitution. We cannot be sure that actions we take to reduce the effects of cost driven substitution will be effective, nor that those effects ultimately will not be material to our results of operations or financial position.
Competitive Factors
We face significant competition in each of our markets. In the specialty chemicals industry, competition is based upon a number of considerations, including product differentiation and innovation, product quality, technical service, and supply reliability. In addition, in some markets, our products are subject to price competition due to factors such as competition from low-cost producers, import competition, excess industry capacity and consolidation among our customers and competitors. New products or technologies developed by competitors may also have an adverse impact on our competitive position. Future expansions could have a negative impact on our competitive position.
Innophos’ Mexican production is sold across Latin America where, from time to time, it faces strong competition from Chinese materials produced by the thermal method, a process more heavily dependent on energy which may be cost advantaged during periods of low energy costs. The collapse in energy prices, when combined with depressed domestic markets and relaxed export controls in China, has resulted in a shift in Chinese specialty phosphate products into American markets, and has put heavy pressure on our Mexican operations. In the event that prices for Chinese products remain low for an extended time and it is possible that our Mexican operations could be unable to compete effectively with Chinese phosphate products and thus become uneconomic.
Page 15 of 94
Table of Contents
From time to time, we have experienced pricing pressure, particularly from significant customers and often coincident with periods of overcapacity in the markets in which we compete. The pricing environment for 2009, in line with worldwide economic slowdown, substitutions and increased import presence, took that character. In the past, we have taken steps to reduce costs and resist possible price reductions by structuring our contracts and developing strong “value-oriented” non-price related customer service relationships. However, price reductions in the past have adversely affected our sales and margins, and if we are not able to offset price pressure when it arises through improved operating efficiencies, reduced expenditures and other means, we may be subject to those same effects in the future.
Supplier Contract Concentration
Our business activities depend on long-term or renewable contracts to supply materials or products. In particular, we rely to a significant degree on single-source supply contracts and some of these contractual relationships may be with a relatively limited number of suppliers. Although most of our supplier relationships are typically the result of multiple contractual arrangements of varying terms, in any given year, one or more of these contracts may come up for renewal. In addition, from time to time, we enter into toll manufacturing agreements or other arrangements to produce minimum quantities of product for a certain duration. If we experience delays in delivering contracted production, we may be subject to contractual liabilities to the buyers to whom we have promised the products.
Changing Technologies
Our future results will depend on our ability to continue to introduce new products and applications that offer distinct value for our customers. Many of our products could be affected by technological change and new product introductions and enhancements. For example: technical grade STPP (used as a builder in automatic dishwasher detergents) may be substituted by a new builder; Specialty Acids products, such as Polyphosphoric Acid (used in asphalt modification applications), may be substituted by polymers; or Specialty Salts products, such as Calcium Phosphates (used in Calcium fortification), may be substituted by other sources of Calcium such as Calcium Carbonate. We expect to continue to enhance our existing products, to identify, develop, and manufacture new products with improved capabilities, and to make improvements in our productivity in order to maintain our competitive position. We also intend to devote resources to the development of new technologically advanced products and systems and to continue to devote a substantial amount of expenditures to the research and development functions of our business. However, we cannot be sure that we will be successful in achieving our goals in those regards.
Reliance on Rhodia
We depend on Rhodia’s ability to perform its obligations under our 2004 acquisition agreements, primarily to indemnify us (or provide security) against potential liabilities whether asserted or yet to be asserted. Rhodia has experienced financial difficulties in recent years and suffered from margin pressure during the global recession. In its most recent filing, Rhodia reported significantly reduced debt and improving margins; however, there is no assurance that Rhodia will be able to fund its obligations to us when, as and if required. In February 2008, New York State’s highest court affirmed a declaratory judgment we won in the lower courts holding Rhodia liable for taxes asserted by the Mexican National Waters Commission, or CNA, for fresh water extraction, or Fresh Water Claims, at our Coatzacoalcos, Mexico facility dating back to the period 1998-2002, but subsequently the 1998 claim was determined to be beyond the applicable statute of limitations. As now assessed, the claims through 2002 total approximately $23.6 million at current exchange rates as of February 18, 2010, including basic charges of $7.1 million and $16.5 million for interest, inflation and penalties. If the legal proceedings in Mexico under which the CNA taxes are being contested are not successful and Rhodia cannot perform under the judgment, we may have to pay CNA taxes from our own resources.
We also depend on Rhodia’s ability to fulfill its responsibilities under certain operating arrangements, including the sulfuric acid supply agreement providing feedstock to the interconnected PCS facility supplying MGA at our Geismar, LA plant. Adverse financial developments affecting Rhodia’s continued performance under its supply agreement with Innophos could require us to provide replacement sulfuric acid, if available, at significantly higher market prices than provided in the contract with Rhodia.
International Operations
We have significant production operations in Mexico and Canada and believe that revenue from sales outside the U.S. will continue to account for a material portion of our total revenue for the foreseeable future. There are inherent risks in
Page 16 of 94
Table of Contents
international operations, including currency fluctuations and devaluations, economic and business conditions that differ from US cycles, unsettled political conditions and communication and translation errors due to language barriers. Among those additional risks potentially affecting our Mexican operations are changes in local economic conditions, currency devaluations, disruption from political unrest and difficulty in enforcing agreements due to differences in the Mexican legal and regulatory regimes compared to those of the U.S. Risks that our Canadian operations may be subject to include changes in laws or regulations differing from trends in the U.S. and currency fluctuations and devaluations.
Our overall success as a multinational business depends, in part, upon our ability to succeed in differing economic, social and political conditions. Among other things, we are faced with potential difficulties in staffing and managing local operations, and we have to design local solutions to manage credit risks posed by local customers and distributors. We may not continue to succeed in developing and implementing policies and strategies that are effective in each location where we do business. These risks are not limited to just those countries in which we operate facilities. For example, our Mexican operations and indirectly our Geismar operations, (where we recently exercised an option extending to July 2021 our long-term purchase agreement for MGA converted from phosphate rock), are supplied with phosphate rock from Morocco, including territories under disputed Moroccan sovereignty claims, and both could be subject to the risk of adverse affects that may arise from local political unrest.
As a U.S. corporation, we are subject to the regulations imposed by the Foreign Corrupt Practices Act, or FCPA, which generally prohibit U.S. companies and their intermediaries from making improper payments to foreign officials for the purpose of obtaining or keeping business. We sell many of our products in developing countries through sales agents and distributors that are not subject to our disciplinary procedures. While we and our subsidiaries are committed to conducting business in a legal and ethical manner and we communicate our policies to all who do business with us, we cannot be sure that all our third party distributors or agents remain in full compliance with the FCPA at all times.
Product Liability Exposure
Many of our products are additives used in the food and beverage, consumer product, nutritional supplement and pharmaceutical industries. The sale of these additives and our customers’ products that include them involve the risk of product liability and personal injury claims, which may be brought by our customers or end-users of products. While we adhere to stringent quality standards, in the course of their production, storage and transportation, our products could be subject to adverse effects from foreign matter such as moisture, dust, odors, insects, mold, or other substances (organic or inorganic), or from excessive temperature. Historically, we have not been subject to material product liability claims, and none are currently outstanding. However, because our products are used in manufacturing a wide variety of our customers’ products, including those ingested by people, we cannot be sure we will not be subject to material product liability or recall claims in the future.
Production Facility Operating Hazards
Our production facilities are subject to hazards associated with the manufacturing, handling, storage, and transportation of chemical materials and products, including failure of pipeline integrity, explosions, fires, inclement weather and natural disasters, terrorist attacks, mechanical failures, unscheduled downtime, transportation interruptions, remedial complications, chemical spills, discharges or releases of toxic or hazardous substances, storage tank leaks and other environmental risks. We have implemented and installed various management systems and engineering controls and procedures at all our production facilities to minimize these risks. We also insure our facilities to protect against a range of risks. However, these potential hazards do exist and could cause personal injury and loss of life, severe damage to or destruction of property and equipment, and environmental and natural resource damage, and may result in a suspension of operations (or extended shutdowns) and the imposition of civil or criminal penalties, whose nature, timing, severity and non-insured exposures are unknown.
Intellectual Property Rights
We rely on a combination of contractual provisions, confidentiality procedures and agreements, and patent, trademark, copyright, unfair competition, trade secrecy, and other intellectual property laws to protect our intellectual property and other proprietary rights. Nonetheless, we cannot be sure that any pending patent application or trademark application will result in an issued patent or registered trademark, or that any issued or registered patents or trademarks will not be challenged, invalidated, circumvented or rendered unenforceable. The use of our intellectual property by others could reduce any competitive advantage we have developed or otherwise harm our business. Moreover, we cannot be sure that our property rights can be asserted in all cases or that we can defend ourselves successfully or cost-effectively against the assertion of rights by others.
Page 17 of 94
Table of Contents
Contingency Planning
We operate a number of manufacturing facilities in the US, Canada and Mexico, and we coordinate company activities, including our sales, customer service, information technology systems and administrative services and the like, through headquarters operated in those countries. In 2009, the Company launched an enterprise resource planning, or ERP, system and business process redesign project to upgrade its information technology systems including updated contingency plans. We cannot be sure that our plans, intentions or expectations of the business process redesign and information technology systems upgrade will be achieved and we may experience business disruptions as a result of our business process and information technology systems conversions.
Our sites and those of others who provide services to them are subject to varying risks of disaster and follow on consequences, both manmade and natural, that could degrade or render inoperable one or more of our facilities for an extended period of time. Such disaster related risks and effects are not predictable with certainty and, although they can be mitigated, they cannot be avoided. We seek to mitigate our exposures to physical disaster events in a number of ways. For example, where feasible, we design and engineer the configuration of our plants to reduce the consequences of disasters. We also maintain insurance for our facilities against casualties, including extended business interruption, and we continually evaluate our risks and develop contingency plans for dealing with them. Although we have reviewed and analyzed a broad range of risks applicable to our business, the ones that actually affect us may not be those we have concluded most likely to occur. Furthermore, although our reviews have led to more systematic contingency planning, our plans are in varying stages of development and execution, such that they may not be adequate at the time of occurrence for the magnitude of any particular disaster event that befalls us.
Risks Relating to Our Indebtedness
Leverage Issues
Our assets were acquired in 2004 in a transaction with a high proportion of debt. After Holdings initial public offering of equity in 2006, we remained what could be characterized as a highly leveraged company through 2007. However, by December 31, 2009, our total indebtedness, including Holdings, had been reduced to $246.0 million and our stockholders’ equity, including Holdings, had grown to $295.4 million, respectively, reflecting a significant de-leveraging in accordance with our business policy. However, all operations of Holdings and Innophos Investments Holdings, Inc. (“Investments Holdings”) are conducted through Innophos, Inc. and therefore Holdings and Investments Holdings are dependent on us for debt servicing and dividend payments through our operations. Nevertheless, to the extent we are not prohibited by our debt instruments in effect from time to time from incurring additional debt or obligations that do not constitute “indebtedness,” doing so could intensify the risks to our financial condition resulting from a renewed condition of higher leverage. Those risks may include, for example, difficulty satisfying our ongoing obligations directly related to our debt (including complying with restrictive financial covenants), increasing our vulnerability to general adverse economic and industry conditions, requiring us to dedicate a substantial portion of cash flow from operations to payments on our indebtedness (thereby reducing the availability of our cash flow to fund working capital), limiting our flexibility in planning for, or reacting to, changes in our business (thereby placing us at a competitive disadvantage compared to our competitors with less debt), and limiting our ability to borrow additional funds, refinance existing debt or make discretionary use of funds such as the payment of dividends on our stock.
Page 18 of 94
Table of Contents
| ITEM 1B. | UNRESOLVED STAFF COMMENTS |
None.
| ITEM 2. | PROPERTIES |
Our headquarters are located in Cranbury, New Jersey, with manufacturing facilities strategically located throughout the United States, Canada, and Mexico. We operate seven facilities which manufacture our three main product lines: Specialty Salts and Specialty Acids, Purified Phosphoric Acid, and STPP & Other Products. Our largest manufacturing facility is located in Coatzacoalcos, Mexico. We operate four medium-size plants in Chicago Heights, Illinois, Nashville, Tennessee, Port Maitland, Canada (Ontario), and Geismar, Louisiana, which collectively produce our major products. We produce additional specialty salts in two plants located in Chicago, Illinois (Waterway), and Mission Hills, Mexico. All the facilities listed above are owned with the exception of Mission Hills, Mexico, where the land is leased long-term. We also lease facilities at Cranbury, New Jersey, Mexico City, Mexico, and Mississauga, Canada (Ontario) which house our executive, commercial, administrative, product engineering and research and development employees, with the Cranbury, New Jersey facility serving as our world headquarters. We also own a distribution facility in Chicago which we use to service our customer base. We do not own and are not responsible for any closed U.S. or Canadian elemental phosphorus or phosphate production sites, as these were not part of the assets or liabilities acquired from Rhodia.
| ITEM 3. | LEGAL PROCEEDINGS |
The information set forth in Note 14 to our consolidated financial statements, “Commitments and Contingencies,” contained in this Annual Report on Form 10-K is incorporated herein by reference.
| ITEM 4. | SUBMISSION OF MATTERS TO A VOTE OF SECURITY HOLDERS |
The response to this item is omitted pursuant to General Instruction I of Form 10-K.
Page 19 of 94
Table of Contents
| ITEM 5. | MARKET FOR COMMON EQUITY, RELATED STOCKHOLDER MATTERS AND ISSUER PURCHASES OF EQUITY SECURITIES |
There is no market for the common stock of Innophos, Inc. As of December 31, 2009, Innophos Investments Holdings, Inc. was the one holder record of Innophos, Inc. common.
| ITEM 6. | SELECTED FINANCIAL DATA |
The response to this item is omitted pursuant to General Instruction I of Form 10-K.
| ITEM 7. | MANAGEMENT’S DISCUSSION AND ANALYSIS OF FINANCIAL CONDITION AND RESULTS OF OPERATIONS |
This discussion contains forward-looking statements about our markets, the demand for our products and services and our future results. We based these statements on assumptions that we consider reasonable. Actual results may differ materially from those suggested by our forward-looking statements for various reasons including those discussed in the “Risk Factors” and “Forward-Looking Statements” sections of this report.
Background
Holdings is the parent holding company of Investments Holdings, which owns 100% of Innophos, Inc; all are incorporated under the laws of the State of Delaware. All operations of Holdings and Investments Holdings are conducted through Innophos, Inc. and therefore Holdings and Investments Holdings are dependent on us for debt servicing and dividend payments through our operations. Innophos is a leading North American producer of specialty phosphates. Most specialty phosphates are highly customized, application-specific compounds that are engineered to meet customer performance requirements. Specialty phosphates are often critical to the taste, texture and performance of foods, beverages, pharmaceuticals, oral care products and other applications. For example, specialty phosphates act as flavor enhancers in beverages, electrolytes in sports drinks, texture additives in cheeses, leavening agents in baked goods, calcium and phosphorus sources for nutritional supplements, pharmaceutical excipients and cleaning agents in toothpaste.
Page 20 of 94
Table of Contents
Below is a summary chart of the corporate structure of our subsidiaries.
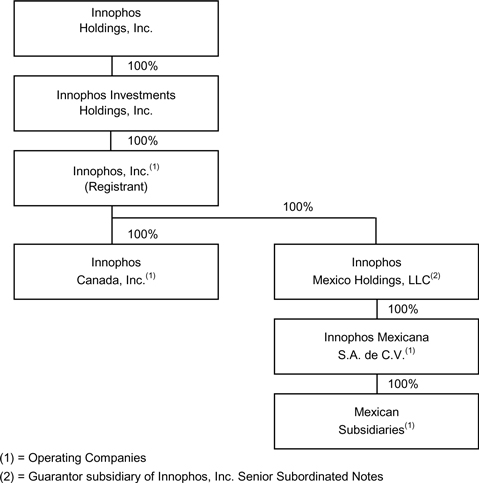
2009 Overview
Our financial performance in 2009 was highlighted by:
| • | Net sales of $666.8 million compared to a record $934.8 million for 2008, with lower volume and mix accounting for most of the $268.0 million decline; |
| • | Operating income of $126.8 million compared to the peak of $299.1 million for 2008, with U.S. & Canada achieving a profit improvement and Mexico down sharply, due to lower selling prices and volumes, with the business significantly disadvantaged versus market price raw material costs in the period; |
| • | Net Interest expense improvement of $6.8 million as a result of $126.5 million of debt retirements in 2009; |
| • | Net income of $65.4 million; |
| • | Net cash from operations of $172.5 million with a net increase in cash of $7.6 million; |
| • | A 29% decrease in net working capital (current assets excluding cash minus current liabilities excluding current portion of long-term debt) to $130.2 million at December 31, 2009; |
| • | Capital expenditures of $19.6 million; |
Refer to the Company’s results of operations and liquidity for the year ended December 31, 2009 for further details.
Recent Trends and Outlook
Sales volume and mix accounted for 97% of the $268.0 million revenue decline for 2009 compared to 2008. Each segment recorded a volume and mix decline in excess of 24% for 2009 compared to 2008, but those rates of decline were considerably reduced in the fourth quarter 2009, with the U.S. recording a fourth quarter volume increase against the comparable 2008 period. Selling prices for U.S. and Canada were both up more than 20% for the year while Mexico was down almost 29% for 2009 compared to 2008, but each segment experienced lower prices in the fourth quarter 2009 compared to fourth quarter 2008. Pricing reached a peak during first quarter 2009, began declining on a sequential basis in the second quarter, and continued to decline, though at a slowing sequential rate, through the fourth quarter 2009. 2009 raw material costs were $24 million higher than 2008, as high market prices for some of our raw materials in 2008 fed through into 2009 from lagged price adjustment conditions included in certain contracts. Mexico made good progress in 2009 on delivering lower, restructured fixed costs, although legal fees relating to the rock supply contract arbitration affected results.
Page 21 of 94
Table of Contents
Management currently expects first quarter 2010 volumes (excluding commodity fertilizer co-products, primarily GTSP) to increase on a sequential basis by approximately 7%, driven by Mexico, and overall expects the business to deliver the first quarter of year over year volume growth since 2007.
Selling prices (excluding GTSP) in the first quarter 2010 are expected to decline sequentially at no more than 6%. Beyond the first quarter 2010, management believes the correction related to the fall in commodity prices in early 2009 will have run its course, and that Innophos will have achieved an improvement in the margins of its U.S. and Canadian businesses over this cycle.
The Company expects a portion of its U.S. and Canada raw material cost structure to adjust down in the first quarter 2010 reflecting market conditions at the beginning of the year. However other raw materials, in particular sulfur and ammonia are expected to increase in the quarter. Market prices for phosphate fertilizers and Chinese exports have also increased and while it is difficult to predict the sustainability of these trends, Innophos is also expecting to increase prices during the 1st quarter. Specifically for GTSP, higher prices should allow the business to make a small profit on co-product sales of this co-product versus a loss in 2009.
Under the terms of the addendum recently agreed to for the existing rock supply contract with OCP, Innophos Mexicana will purchase rock from OCP during the first nine months of 2010, with an option to take delivery of a portion of the committed volume through December 2010, at prices broadly in line with current market conditions and favorable to the significant disadvantage vs. market raw material costs experienced in 2009. Management expects the Mexican business in 2010 to build on the significant progress made in the fourth quarter 2009 in restoring its market position, and with the benefits of returning to a competitive sourcing position, anticipates an operating income in the mid single digit millions for the first quarter 2010, and for the subsequent quarters of 2010, is targeting significant progress in restoring pre 2008 levels of profitability.
Capital expenditures for 2010 are expected to be in the $30 to $35 million range. Major items of expenditure are anticipated to include: completion of the Mexican food grade acid expansion; incremental improvements to existing Mexican food grade salts capability; completion of our enterprise resource planning (ERP) system and business redesign project; additional debottlenecking and expansion of food grade salts capability in Canada and various U.S. locations; and finally, investment to enhance Mexico’s capability to store, handle and process multiple grades of rock consistent with the Company’s supply chain diversification strategy. Management continues to make progress in executing its phosphate sourcing strategy, which will take effect with the end of the current rock contract, and is actively negotiating with several suppliers for rock sourcing agreements beginning in September 2010.
Page 22 of 94
Table of Contents
Results of Operations
The following table sets forth a summary of the Company’s operations and their percentages of total revenue for the periods indicated. (dollars in millions):
| Year Ended December 31, | |||||||||||||||||||||
| 2009 | 2008 | 2007 | |||||||||||||||||||
| Amount | % | Amount | % | Amount | % | ||||||||||||||||
| Net sales |
$ | 666.8 | 100.0 | $ | 934.8 | 100.0 | $ | 579.0 | 100.0 | ||||||||||||
| Cost of goods sold |
470.8 | 70.6 | 570.2 | 61.0 | 474.8 | 82.0 | |||||||||||||||
| Gross profit |
196.0 | 29.4 | 364.6 | 39.0 | 104.2 | 18.0 | |||||||||||||||
| Operating expenses: Selling, general and administrative |
67.2 | 10.1 | 63.2 | 6.8 | 54.2 | 9.4 | |||||||||||||||
| Research & development |
2.0 | 0.3 | 2.3 | 0.2 | 2.0 | 0.3 | |||||||||||||||
| Income from operations |
126.8 | 19.0 | 299.1 | 32.0 | 48.0 | 8.3 | |||||||||||||||
| Interest expense, net |
20.7 | 3.1 | 27.5 | 2.9 | 30.9 | 5.3 | |||||||||||||||
| Foreign exchange (gains) losses, net |
(0.8 | ) | (0.1 | ) | 2.7 | 0.3 | — | — | |||||||||||||
| Other income |
— | — | (0.4 | ) | (0.0 | ) | (0.3 | ) | (0.1 | ) | |||||||||||
| Provision for income taxes |
41.5 | 6.2 | 72.2 | 7.7 | 11.9 | 2.1 | |||||||||||||||
| Net income |
$ | 65.4 | 9.8 | $ | 197.1 | 21.1 | $ | 5.5 | 0.9 | ||||||||||||
Year Ended December 31, 2009 compared to the Year Ended December 31, 2008
Net Sales
Net sales represent the selling price of the products, net of any customer-related rebates, plus freight and any other items invoiced to customers. Net sales for the year ended December 31, 2009 were $666.8 million, a decrease of $268.0 million, or 28.7%, as compared to $934.8 million for the same period in 2008. Selling price decreases had a negative impact on revenue of 0.9% or $8.4 million. Lower prices for GTSP fertilizer co-product sales, and to a lesser extent technical grade STPP and Purified Phosphoric Acid, were mostly offset by increased prices in Specialty Salts & Specialty Acids. Volume and mix effects upon revenue had a negative effect of 27.8% or $259.6 million which occurred across all product lines and reporting segments, but most significantly in Purified Phosphoric Acid in Mexico, where Innophos’ largest customer reduced volumes due to a permanent shutdown of their largest STPP plant in the first quarter of 2009.
The following table illustrates for the year ended December 31, 2009 the percentage changes in net sales by reportable segment compared with the prior year, including the effect of price and volume/mix changes upon revenue:
| Price | Volume/Mix | Total | |||||||
| United States |
20.6 | % | (25.3 | )% | (4.7 | )% | |||
| Mexico |
(28.7 | )% | (31.0 | )% | (59.7 | )% | |||
| Canada |
22.5 | % | (24.1 | )% | (1.6 | )% |
The following table illustrates for the year ended December 31, 2009 the percentage changes for net sales by major product lines compared with the prior year, including the effect of price and volume/mix changes:
| Price | Volume/Mix | Total | |||||||
| Purified Phosphoric Acid |
(2.5 | )% | (49.3 | )% | (51.8 | )% | |||
| Specialty Salts and Specialty Acids |
19.4 | % | (20.9 | )% | (1.5 | )% | |||
| STPP & Other Products |
(38.2 | )% | (17.9 | )% | (56.1 | )% |
Gross Profit
Gross profit represents net sales less cost of goods sold. Gross profit for the year ended December 31, 2009 was $196.0 million, a decrease of $168.6 million, or 46.2%, as compared to $364.6 million for the same period in 2008. Gross margin decreased to 29.4% for the year ended December 31, 2009 versus 39.0% for the same period in 2008. The change in gross
Page 23 of 94
Table of Contents
profit was due to lower selling prices, which had a negative impact of $8.4 million, unfavorable sales volume and mix impact upon revenue and higher raw material costs which had a combined unfavorable impact of $158.1 million. As a result of reduced operating rates and higher raw material costs for 2009, the company incurred $12.2 million of reduced fixed cost absorptions and unfavorable inventory related variances. In addition, the company took a charge of approximately $7.0 million as a result of the settlement of the OCP arbitration matter and also took a charge of $1.6 million for Mexican workforce reduction costs. These unfavorable effects were partially offset by $8.9 million lower cash fixed costs and $7.2 million favorable exchange rate impacts, both primarily in Mexico. Included in 2008 results were $1.3 million expense for a scheduled Geismar, LA plant maintenance outage, and $1.3 million asset impairment charge for two obsolete production units.
Operating Expenses and Research and Development
Operating expenses in 2009 consisted primarily of selling, general and administrative and research and development expenses. Operating expenses for the year ended December 31, 2009 were $69.2 million, an increase of $3.7 million, or 5.6%, as compared to $65.5 million for 2008. The change in operating expenses was due to an increase of $6.4 million for our ERP project, $5.0 million increased legal expenses related to our OCP arbitration, and $0.2 million increase in all other costs partially offset by $2.1 million lower legal and other fees which were incurred in 2008 to comply with the DOJ STPP document request subpoena, $2.5 million lower professional fees used to support growth and other corporate initiatives, net $1.7 million lower post-restructured expenses in Mexico, and $1.6 million favorable exchange rate impact from our Mexican peso based costs.
Operating Income
Operating income for the year ended December 31, 2009 was $126.8 million, a decrease of $172.3 million, or 57.6%, as compared to $299.1 million for the same period in 2008. Operating income percentages decreased to 19.0% for 2009 from 32.0% for 2008.
Interest Expense, net
Net interest expense, including deferred financing amortization expense, for the year ended December 31, 2009 was $20.7 million, a decrease of $6.8 million, or 24.7% as compared to $27.5 million for the same period in 2008. This decrease is primarily due to lower average interest rates and the lower average balance of our Term Loan resulting from the $126.5 million principal payments made in the first half of 2009 to pay off the balance of the Term Loan.
Foreign Exchange
Foreign exchange gain for the year ended December 31, 2009 was $0.8 million as compared to a $2.7 million loss for 2008. The U.S. Dollar is the functional currency of our Mexican and Canadian operations. Consequently, foreign exchange gain or loss is recorded on re-measurement of non-U.S. Dollar denominated monetary assets and liabilities. Such gains and losses fluctuate from period to period as the foreign currencies strengthen or weaken against the U.S. Dollar and the amount of non-U.S. Dollar denominated assets and liabilities increases or decreases.
Provision for Income Taxes
Provision for income tax expense for the year ended December 31, 2009 was $41.5 million, a decrease of $30.7 million or 42.5% as compared to $72.2 million for 2008. The increase in the effective tax rate from 26.8% in 2008 to 38.8% in 2009 is primarily a result of a $9.9 million benefit in 2008 from the reversal of valuation allowances against U.S. federal net deferred tax assets mainly as the result of the usage of our net operating loss carry-forwards. In addition, there were unfavorable 2009 impacts on deferred taxes of a strengthening Mexican peso versus the U.S. dollar, a recently enacted increase in Mexican corporate tax rates for 2010 and approximately $1.0 million additional tax liability under the Mexican alternative minimum tax (IETU) rules which exceeded a favorable enacted tax rate change in Canada.
Net Income
Net income for the year ended December 31, 2009 was $65.4 million, a decrease of $131.7 million as compared to $197.1 million for the same period in 2008, due to the factors described above.
Page 24 of 94
Table of Contents
Year Ended December 31, 2008 compared to the Year Ended December 31, 2007
Net Sales
Net sales represent the selling price of the products, net of any customer-related rebates, plus freight and any other items invoiced to customers. Net sales for the year ended December 31, 2008 were $934.8 million, an increase of $355.8 million, or 61.5%, as compared to $579.0 million for the same period in 2007. Selling price increases had a positive impact of 83.0% or $480.3 million on sales that occurred across all product lines. Volume and mix impacts upon revenue had a negative impact of 21.5% or $124.5 million that occurred mostly in STPP & Other Products due to reduced demand for GTSP fertilizer co-product and limited reformulation in detergents using STPP. Strong demand and efforts to grow the Specialty Salts and Specialty Acids business in 2008 resulted in a positive volume and mix impact, while unfavorable volume and mix impacted Purified Phosphoric Acid in 2008 compared to 2007. On a unit basis, the average selling price for all Innophos products increased by 90.9% compared to 2007, while total volume shipped decreased by 15.4%.
The following table illustrates for the year ended December 31, 2008 the percentage changes in net sales by reportable segment compared with the prior year, including the effect of price and volume/mix changes upon revenue:
| Price | Volume/Mix | Total | |||||||
| United States |
52.0 | % | (3.3 | )% | 48.7 | % | |||
| Canada |
53.8 | % | (21.7 | )% | 32.1 | % | |||
| Mexico |
132.2 | % | (48.2 | )% | 84.0 | % |
The following table illustrates for the year ended December 31, 2008 the percentage changes for net sales by major product lines compared with the prior year, including the effect of price and volume/mix changes:
| Price | Volume/Mix | Total | |||||||
| Purified Phosphoric Acid |
117.6 | % | (22.3 | )% | 95.3 | % | |||
| Specialty Salts and Specialty Acids |
47.0 | % | 6.3 | % | 53.3 | % | |||
| STPP & Other Products |
121.9 | % | (73.1 | )% | 48.8 | % |
Shipped volume for the year ended December 31, 2008 declined approximately 34% on a pure tonnage basis for STPP & Other Products compared with the same period in 2007.
Gross Profit
Gross profit represents net sales less cost of goods sold. Gross profit for the year ended December 31, 2008 was $364.6 million, an increase of $260.4 million, or 249.9%, as compared to $104.2 million for the same period in 2007. Gross profit percentage increased to 39.0% for the year ended December 31, 2008 versus 18.0% for the same period in 2007. The change in gross profit was due to higher selling prices in 2008 which had a favorable impact of $480.3 million, partially offset by unfavorable volume and mix impacts upon revenue, and higher raw material, energy, freight and manufacturing expenses which had a combined unfavorable impact of $226.6 million. Gross profit was unfavorable by $1.3 million for a scheduled maintenance outage at our Geismar, LA plant in the second quarter of 2008, which was lower than anticipated, $1.3 million for the asset impairment expense for two obsolete production units in the second quarter of 2008, and a $1.9 million charge related to the write-down of on hand GTSP fertilizer in the fourth quarter of 2008. Gross profit was favorable relative to 2007 by $3.3 million, of which $3.2 million reflects out of period adjustments in 2008 related to deferred Mexican employee statutory profit sharing. Gross profit was also favorable relative to 2007 by $5.4 million for maintenance costs and $1.1 million of replacement raw material cost from the planned and unplanned maintenance outages in 2007 at our Coatzacoalcos facility and supply shortages. Gross profit was also favorable relative to 2007 by unusual items of $1.4 million for Mexican workforce reorganization costs and $2.0 million for the regularization of Mexican port facilities taxes covering the periods 1996 to 2006, both of which occurred in 2007.
Operating Expenses and Research and Development
Operating expenses in 2008 consisted primarily of selling, general and administrative and research and development expenses. Operating expenses for the year ended December 31, 2008 were $65.5 million, an increase of $9.3 million, or 16.5%, as compared to $56.2 million for 2007. Operating expenses increased $3.3 million for professional fees to support growth and other corporate initiatives such as assessing our IT systems, $3.5 million for higher short-term incentive program accruals, $2.7 million for increased commercial efforts, $2.4 million for non-cash share based compensation, and $3.7 million for all other costs. The overall increases over prior year were partially offset by $6.3 million for unusual expenses incurred in 2007 primarily in connection with the early cancellation of the company’s “pharma” sales agency arrangement with Rhodia, Inc. and the transfer of related assets to Innophos.
Page 25 of 94
Table of Contents
Operating Income
Operating income for the year ended December 31, 2008 was $299.1 million, an increase of $251.1 million, or 523.1%, as compared to $48.0 million for the same period in 2007. Operating income percentages increased to 32.0% for 2008 from 8.3% for 2007.
Interest Expense, net
Net interest expense, including deferred financing amortization expense, for the year ended December 31, 2008 was $27.5 million, a decrease of $3.4 million, or 11.0% as compared to $30.9 million for the same period in 2007. This decrease is primarily due to the lower average balance of our Term Loan from prepayments made in 2007 along with lower interest rates, and lower bond interest expense from the retirement/refinancing of our Floating Rate Senior Notes in 2007. This was partially offset by fees associated with the fourth amendment to our credit facility.
Foreign Exchange
Foreign exchange loss for the year ended December 31, 2008 was $2.7 million, an increase of $2.7 million as compared to a net zero impact for 2007, primarily due to the strengthening of the U.S. Dollar against the Mexican peso in the fourth quarter of 2008. The U.S. Dollar is the functional currency of our Mexican and Canadian operations. Consequently, foreign exchange gain or loss is recorded on re-measurement of non-U.S. Dollar denominated monetary assets and liabilities. Such gains and losses fluctuate from period to period as the foreign currencies strengthen or weaken against the U.S. Dollar and the amount of non-U.S. Dollar denominated assets and liabilities increases or decreases.
Provision for Income Taxes
Provision for income tax expense for the year ended December 31, 2008 was $72.2 million, an increase of $60.3 million or 506.7% as compared to $11.9 million for 2007. Income earned by our subsidiaries in Mexico and Canada is fully taxable, so increases in their earnings, as we had in 2008, would normally be expected to result in increased income tax expense. The low effective tax rate of 26.8% for the current year is due to a $9.9 million benefit from the reversal of valuation allowances against U.S. Federal net deferred tax assets mainly as the result of the usage of our net operating loss carryforwards.
Net Income
Net income for the year ended December 31, 2008 was $197.1 million, an improvement in results of $191.6 million as compared to a net loss of $5.5 million for the same period in 2007, due to the factors described above.
Page 26 of 94
Table of Contents
Segment Reporting
We report our operations in three business segments—United States, Mexico and Canada, each of which sells the entire portfolio of products. The primary performance indicators for the chief operating decision maker are sales and operating income, with sales on a ship-from basis. The following table sets forth the historical results of these indicators by segment:
| 2009 | 2008 | 2007 | ||||||||||
| Segment Net Sales |
||||||||||||
| United States |
$ | 463,286 | $ | 486,186 | $ | 326,882 | ||||||
| Mexico |
165,269 | 409,745 | 222,699 | |||||||||
| Canada |
38,204 | 38,827 | 29,401 | |||||||||
| Total |
$ | 666,759 | $ | 934,758 | $ | 578,982 | ||||||
| Net Sales % Growth |
||||||||||||
| United States |
(4.7 | )% | 48.7 | % | 2.8 | % | ||||||
| Mexico |
(59.7 | )% | 84.0 | % | 14.4 | % | ||||||
| Canada |
(1.6 | )% | 32.1 | % | 1.2 | % | ||||||
| Total |
(28.7 | )% | 61.4 | % | 6.9 | % | ||||||
| Segment Operating Income |
||||||||||||
| United States |
$ | 111,655 | $ | 108,977 | $ | 3,585 | ||||||
| Mexico |
614 | 183,587 | 39,819 | |||||||||
| Canada |
14,629 | 6,525 | 4,591 | |||||||||
| Total |
$ | 126,898 | $ | 299,089 | $ | 47,995 | ||||||
| Segment Operating Income % of net sales |
||||||||||||
| United States |
24.1 | % | 22.4 | % | 1.1 | % | ||||||
| Mexico |
0.4 | % | 44.8 | % | 17.9 | % | ||||||
| Canada |
38.3 | % | 16.8 | % | 15.6 | % | ||||||
Segment Net Sales:
In the United States net sales decreased 4.7% for the year ended December 31, 2009 when compared with the same period in 2008. Selling prices increased sales 20.6% with increases across all product lines, most notably in Specialty Salts and Specialty Acids. Volume and mix impact upon revenue was a decrease of 25.3%, with decreases across all product lines. In 2008 net sales increased 48.7% when compared with 2007. Selling prices increased sales 52.0% with increases across all product lines, most notably in Specialty Salts and Specialty Acids. Volume and mix impact upon revenue was a decrease of 3.3%, with decreases in Purified Phosphoric Acids and STPP & Other Products being partially offset by an increase in Specialty Salts and Specialty Acids where demand for these products was strong in 2008.
In Mexico net sales decreased 59.7% for the year ended December 31, 2009 when compared with the same period in 2008. Selling prices decreased sales 28.7% with decreases across all product lines, most notably in STPP and Other Products, due to lower prices for granular triple super-phosphate (GTSP) fertilizer co-product sales. Volume and mix impact upon revenue was a decrease of 31.0% which occurred across all product lines, most notably in Purified Phosphoric Acids, where Innophos’ largest customer reduced volumes due to a permanent shutdown of their largest plant in the first quarter of 2009. In 2008 net sales increased 84.0% when compared with 2007. Selling prices increased sales 132.2% with significant increases across all product lines. Volume and mix impact upon revenue was a decrease of 48.2%, mainly in STPP & Other Products due to reduced demand for GTSP fertilizer co-product and limited reformulation in detergents using STPP.
In Canada net sales decreased 1.6% for the year ended December 31, 2009 when compared with the same period in 2008. Selling price increased sales 22.5% with increases across all product lines. Volume and mix impact upon revenue was a decrease of 24.1% with decreases across all product lines. In 2008 net sales increased 32.1% when compared with 2007. Selling prices increased sales 53.8% with increases across all product lines. Volume and mix impact upon revenue was a decrease of 21.7% across all product lines.
Page 27 of 94
Table of Contents
Segment Operating Income % of Net Sales:
The 1.7% increase in the United States for the year ended December 31, 2009 compared with the same period in 2008 was mainly due to favorable selling prices which were offset by unfavorable volume and mix impact on revenue, higher raw material costs and higher manufacturing costs. Included in 2008 results were expenses for a scheduled Geismar, LA plant maintenance outage and asset impairment charges for two obsolete production units. Operating expenses were flat, with increases from our enterprise resource planning (ERP) system and business redesign project partially offset by lower legal and other fees which were incurred in 2008 to comply with the DOJ STPP document request subpoena, and lower professional fees used to support growth and other corporate initiative. The 21.4% increase in the United States from 2007 to 2008 was mainly due to favorable selling prices which were partially offset by an unfavorable volume and mix impact on revenue, higher raw material and energy costs, increased manufacturing cost including cost for a scheduled maintenance outage at our Geismar, LA plant, the asset impairment expense for two obsolete production units, and increased operating expenses. Operating expenses increased mainly due to professional fees to support growth and other corporate initiatives such as assessing our IT systems, higher short-term incentive program accruals, higher non-cash share based compensation, and increased commercial efforts, partially offset by expense incurred in 2007 in connection with the early cancellation of the company’s “pharma” sales agency arrangement with Rhodia, Inc.
The 44.4% decrease in Mexico for the year ended December 31, 2009 compared with the same period in 2008 was due to unfavorable selling prices, unfavorable volume and mix impacts upon revenue, increased cost of goods sold as a result of disadvantaged raw material costs to market and charges for the settlement of the OCP arbitration matter and increased operating expenses mainly for legal expenses related to the OCP arbitration matter. As a result of reduced operating rates and higher raw material costs for 2009, Mexico incurred $9.2 million of reduced fixed cost absorptions and unfavorable inventory related variances, and took a charge of $2.0 million for Mexican workforce reorganization costs. These unfavorable effects were more than offset by $11.1 million lower cash fixed costs and $8.2 million favorable exchange rate impacts from our Mexican peso based costs. The 26.9% increase in Mexico from 2007 to 2008 was due to favorable selling prices, which were partially offset by decreased volume and mix impacts upon revenue, increased raw material and energy costs and increased operating expenses. The operating income percent increase is also due to expenses incurred in 2007 for the planned and un-planned maintenance outages and the related raw material replacement costs, the Mexican workforce reorganization, and the regularization of Mexican port facilities taxes covering the periods 1996 to 2006.
The 21.5% increase in Canada for the year ended December 31, 2009 compared with the same period in 2008 was due to increased selling prices partially offset by unfavorable volume and mix impact on revenue. The 1.2% increase in Canada from 2007 to 2008 was due to favorable selling prices partially offset by unfavorable volume and mix impact on revenue, higher raw material and energy costs, and increased manufacturing costs.
The United States had depreciation and amortization of $28.5 million, $30.3 million, and $28.4 million in 2009, 2008, and 2007, respectively. Canada had depreciation and amortization of $2.0 million, $2.2 million, and $1.5 million in 2009, 2008 and 2007, respectively. Mexico had depreciation and amortization of $20.7 million, $20.0 million, and $17.5 million in 2009, 2008, and 2007, respectively.
Liquidity and Capital Resources
The following table sets forth a summary of the Company’s cash flows for the periods indicated.
| Year Ended December 31, | ||||||||||||
| (Dollars in millions) |
2009 | 2008 | 2007 | |||||||||
| Operating Activities |
$ | 172.5 | $ | 148.9 | $ | 52.7 | ||||||
| Investing Activities |
(19.6 | ) | (18.5 | ) | (30.5 | ) | ||||||
| Financing Activities |
(145.2 | ) | (21.3 | ) | (36.2 | ) | ||||||
Year Ended December 31, 2009 compared to the Year Ended December 31, 2008
Net cash provided by operating activities was $172.5 million for the year ended December 31, 2009 as compared to $148.9 million for 2008, an increase of $23.6 million. The increase in operating activities cash resulted from favorable changes of $156.2 million in working capital and $1.5 million in non-current accounts, partially offset by unfavorable changes of $131.7million in net income and $2.4 million in non-cash items affecting net income.
The change in working capital is a source of cash of $58.0 million in 2009 compared to a use in 2008 of $98.2 million, an increase in the source of cash of $156.2 million. The increase in working capital is due to decreases in accounts receivable and inventory, and increased other current liabilities, partially offset by decreased accounts payable and increased other
Page 28 of 94
Table of Contents
current assets. The change in working capital for our Mexican operations is a source of cash of $23.3 million in 2009 compared to a use in 2008 of $56.9 million, an increase in working capital of $80.2 million mainly due to decreases in inventory.
Total inventories decreased $31.7 million from December 2008 levels. Days of inventory on hand decreased 4 days as a result. The following chart shows its historical performance:
| 2009 | 2008 | 2007 | ||||
| Inventory Days on Hand |
89 | 93 | 61 |
Net cash used for investing activities was $19.6 million for the year ended December 31, 2009, compared to $18.5 million for 2008, an increase in the use of cash of $1.1 million which was mainly due to higher capital spending. Net cash used for investing activities for our Mexican operations, mainly capital expenditures, was $5.5 million in 2009, compared to $4.8 million for the same period in 2008, an increase in the use of cash of $0.7 million.
In the second quarter of 2009 the Company launched an enterprise resource planning, or ERP, system and business process redesign project to upgrade its systems technology and to improve its position as a reliable specialty phosphate supplier. To date the Company has spent approximately $11.4 million on this project, of which approximately $5.0 million was capitalized as of December 31, 2009, and future expenditures on the ERP project are expected to total approximately $12 to $14 million by the end of 2010, with the majority of this spending anticipated as capital expenditures.
The Company is investing to grow its food, beverage and pharmaceutical phosphate business, especially geographically, and also to diversify its raw material supply long term. Projects are underway in the U.S. to debottleneck and increase production capabilities of various specialty salts. Additionally, in conjunction with the investment in the Coatzacoalcos facility to more than double its existing food grade purified phosphoric acid capacity by the first quarter 2010, the site personnel have conducted successful production tests of several additional food grade salts to enable a shift in focus from detergency to the multiple food market segments served by salts and acid.
Innophos currently estimates that full exploration costs to a proven reserves standard for the Santo Domingo deposit could require expenditures of $10 to $15 million over a three year period, inclusive of expenditures to date. This estimate includes mineral rights payments, taxes, mineral resource measurement, beneficiation process design and completion of feasibility studies. Full expenditures would only occur if interim milestone goals were successfully attained. It is estimated that 2010 expenditures will be approximately $1 to $2 million, with efforts primarily focused on the Santo Domingo deposit. Innophos intends to seek one or more partners for these efforts, but anticipates no difficulties in completing the exploration phase without a partnership.
Net cash used for financing activities for the year ended December 31, 2009, was a use of $145.2 million, compared to a use of $21.3 million in 2008, an increase in the use of cash of $123.9 million. This was mainly due to $124.5 million higher Term Loan principal payments to satisfy the excess cash flow requirement for 2008 and subsequently to pay off the remaining balance of the Term loan as described below, $2.6 million lower return of capital to parent in 2009, $1.0 million deferred financing charges on the new loan and security agreement and $1.0 million lower excess tax benefit from exercise of stock options. Net cash from financing activities for our Mexican operations in 2009 was a use of $51.5 million compared to a use of $31.0 million in for the same period in 2008, an increase in cash payments of $20.5 million for intercompany debt obligations which are eliminated in consolidation.
Year Ended December 31, 2008 compared to the Year Ended December 31, 2007
Net cash provided by operating activities was $148.9 million for the year ended December 31, 2008 as compared to $52.7 million for 2007, an increase of $96.2 million. The increase in operating activities cash resulted from favorable changes of $191.6 million in net income, and $2.8 million in non-cash items affecting net income, partially offset by unfavorable changes of $92.9 million in net working capital, and $5.3 million in non-current accounts.
The change in working capital is a use of cash of $98.2 million in 2008 compared to a use in 2007 of $5.3 million, an increase in the use of cash of $92.9 million. The increased use of cash is due to higher selling prices which increased accounts receivable balances, higher quantities and raw material costs increasing inventory values without any compensating increase in accounts payable due primarily to advance payments with raw material suppliers to ensure timely deliveries. Decreased current liabilities and accounts payable, and increased other current assets also added to the increased use of cash in 2008. During the fourth quarter of 2008, the company made a significant estimated tax payment in Mexico due to the high Mexican income for 2008.
Page 29 of 94
Table of Contents
Total inventories increased $66.6 million from December 2007 levels as the result of increased raw material costs, higher quantities of raw materials purchased prior to January 1, 2009 price increases and increased on-hand GTSP inventory due to reduced fertilizer demand. Days of inventory on hand increased 32 days as a result. The following chart shows its historical performance:
| 2008 | 2007 | 2006 | ||||
| Inventory Days on Hand |
93 | 61 | 57 |
Net cash used for investing activities was $18.5 million for the year ended December 31, 2008, compared to $30.5 million for 2007, a decrease in the use of cash of $12.0 million. This was mainly due to $13.8 million lower capital spending related to the 2007 cogeneration project in Coatzacoalcos, Mexico, and $2.1 million lower spending for the purchase in 2007 of certain assets from Rhodia related to the early cancellation of our 2004 ten-year “pharma” sales agency agreement. This was partially offset by an increase in capital spending of $3.9 million in all other projects.
Net cash used for financing activities for the year ended December 31, 2008, was a use of $21.3 million, compared to a use of $36.2 million in 2007, a decrease in the use of cash of $14.9 million. This was primarily due to $18.5 million lower Term Loan principal payments and $1.5 million tax benefits from stock option exercises, partially offset by $1.3 million higher dividend payments, $0.4 million lower proceeds from stock option exercises, partially offset by $5.1 million higher return of capital to parent in 2008.
Indebtedness
Total debt was $190.0 million as of December 31, 2009. Short term and long term debt net of cash was $57.8 million as of December 31, 2009, a decrease of $134.1 million, or 70% from December 31, 2008. Total debt, excluding debt held by Innophos Holdings, Inc. of $56.0 million, comprised borrowings of $190.0 million Senior Subordinated Notes due 2014. All operations of Holdings and Investments Holdings are conducted through Innophos, Inc. and therefore Holdings and Investments Holdings are dependent on us for debt servicing and dividend payments through our operations.
The Company was party to a Credit Agreement dated as of August 13, 2004, as subsequently amended (the “2004 Credit Facility”). On May 22, 2009, the Company entered into a Termination pursuant to which, among other things, the 2004 Credit Facility was terminated, the Company paid the $72.7 million of outstanding term loan balance (principal and accrued interest) from cash on hand, and security held by the lenders on substantially all the Company’s property was released.
On May 22, 2009, the Company and its wholly owned subsidiary, Innophos Canada, Inc. entered into a Loan and Security Agreement (the “Loan Agreement”) with certain lenders (collectively, the “Lenders”) including Wachovia Bank, National Association, as agent. The Loan Agreement provides the Company with a revolving line of credit from the Lenders of up to $65.0 million in the aggregate, with a $20 million letter of credit sub-facility, terminating on May 22, 2013. The amount actually available to the Company may be less than the maximum credit and will vary from time to time depending on, among other factors, the amount of its net eligible inventory and accounts receivable as calculated for purposes of the Loan Agreement. The obligations of the Company under the Loan Agreement are secured by the accounts receivable, inventory and other assets of Innophos, Inc. and Innophos Canada, Inc., not including equipment or real property. Innophos Inc.’s Mexico-based subsidiaries are excluded from certain of the covenants under the Loan Agreement, do not guaranty the indebtedness of Innophos, Inc. and Innophos Canada, Inc. incurred under it, and do not furnish collateral in connection with it.
As of December 31, 2009, the Company had $41.9 million excess availability above the minimum excess availability requirements, as calculated in accordance with the Loan Agreement, and there was no amount outstanding on the revolving credit line. A total of $2.2 million in face amount of letters of credit were issued under the sub-facility to support instruments outstanding under the terminated 2004 Credit Facility.
As indicated elsewhere, the current recommendation of management and the policy of Holdings Board of Directors is to pay a quarterly dividend on Holdings Common Stock at an annual rate of $0.68 per share. That policy may change and is subject to numerous conditions and variables. All operations of Holdings and Investments Holdings are conducted through Innophos, Inc. and therefore Holdings and Investments Holdings are dependent on us for debt servicing and dividend payments through our operations.
We believe that on-hand cash combined with cash generated from operations, including our Mexican operations, will be sufficient to meet our obligations such as debt service, tax payments, capital expenditures and working capital requirements for at least the next twelve months.
Page 30 of 94
Table of Contents
We expect to fund all these obligations through our existing cash and our future operating cash flows. However, future operating performance for the Company is subject to prevailing economic and competitive conditions and various other factors that are uncertain. If the cash flows and other capital resources available to the Company are insufficient to fund our debt and other liquidity needs, the Company may have to take alternative actions that differ from the Company’s current operating plan.
Innophos and its subsidiaries and affiliates may from time to time seek to acquire or otherwise retire outstanding debt (including publicly issued debt) through open market purchases, privately negotiated transactions, tender offers, exchanges or otherwise. Debt repurchases or exchanges, if any, will depend on prevailing market conditions, Company liquidity requirements, restrictive financial covenants and other factors applicable at the time. The amounts involved may be material.
Capital Expenditures
We spent $19.6 million in 2009 on projects that were capitalized. Additionally, we spent $23.3 million in 2009 on maintenance projects that were expensed during the year. There were no planned major non-annual maintenance expenses in 2009. These amounts compare to $18.5 million of 2008 capitalized projects and $32.8 million of maintenance projects that were expensed during 2008 of which $1.3 million was related to planned major non-annual maintenance. We expect our capital expenditures to continue to run below depreciation levels. However, as 2004 purchase accounting effects on step-up depreciation and useful lives mature, the per annum depreciation expense will trend down towards sustaining capital expenditure levels. Based on assets currently in service, we expect annual depreciation to decline by approximately $14 million over the next 3 years compared to 2009 levels, with approximately half of that decline expected in 2011 and the remainder equally split between 2010 and 2012. This depreciation decline will be partially offset by the depreciation of future capital expenditures including our enterprise resource planning upgrades.
Contractual Obligations and Commercial Commitments
The following table sets forth our long-term contractual cash obligations as of December 31, 2009 (dollars in thousands):
| Years ending December 31, | |||||||||||||||||||||
| Contractual Obligations |
Total | 2010 | 2011 | 2012 | 2013 | 2014 | Thereafter | ||||||||||||||
| Senior Subordinated Notes Due 2014 (1) |
274,313 | 16,862 | 16,863 | 16,862 | 16,863 | 206,863 | — | ||||||||||||||
| Future Service Pension Benefits |
9,632 | 537 | 642 | 735 | 825 | 902 | 5,991 | ||||||||||||||
| Other (2) |
459,249 | 89,845 | 48,764 | 48,764 | 48,764 | 48,764 | 174,348 | ||||||||||||||
| Operating Leases |
18,540 | 4,113 | 3,688 | 2,824 | 2,690 | 2,246 | 2,979 | ||||||||||||||
| Total contractual cash obligations (3) |
$ | 761,734 | $ | 111,357 | $ | 69,957 | $ | 69,185 | $ | 69,142 | $ | 258,775 | $ | 183,318 | |||||||
| (1) | Amounts include fixed rate interest payments at 8.875% for years 2010 and thereafter. |
| (2) | Represents minimum annual purchase commitments to buy raw materials. |
| (3) | Does not reflect the $56.0 million 9.5% Senior Unsecured Notes due 2012 which were issued by our ultimate parent, Innophos Holdings, Inc. on April 16, 2007. Annual cash interest payments would be approximately $6.3 million. |
Critical Accounting Estimates and Policies
Our discussion and analysis of our financial condition and results of operations are based upon our consolidated financial statements, which have been prepared in accordance with United States generally accepted accounting principles. The preparation of these financial statements requires us to make estimates, assumptions and judgments that affect the reported amounts of assets, liabilities, revenues and expenses, and related disclosures of contingent liabilities. On an ongoing basis, we evaluate our estimates, including those related to allowance for bad debts, the recoverability of long-term assets such as goodwill and intangible assets, depreciation and amortization periods, income taxes and commitments and contingencies. We base our estimates on historical experience and on various other assumptions that we believe to be reasonable under the circumstances, the results of which form the basis for making judgments about the carrying values of assets and liabilities that are not readily apparent from other sources. Actual results may differ from these estimates under different assumptions or conditions. We believe that the following critical accounting policies affect our more significant judgments and estimates used in the preparation of our consolidated financial statements.
Page 31 of 94
Table of Contents
Claims and Legal Proceedings
The categories of asserted or unasserted claims for which the Company has estimated a probable liability and for which amounts are estimable are critical accounting estimates. Please refer to Note 14 of Notes to Consolidated Financial Statements in “Item 8. Financial Statements and Supplementary Data” for additional information about such estimates.
Deferred Taxes
Deferred taxes are accounted for by recognizing deferred tax assets and liabilities for the expected future tax consequences of events that have been recognized in the financial statements. Accordingly, deferred tax assets and liabilities are determined based on the differences between the financial statement and tax basis of assets and liabilities using enacted tax rates in effect for the year in which the differences are expected to reverse.
Deferred tax assets are assessed for recoverability and a valuation allowance is considered necessary if it is more likely than not that some portion or all of the net deferred tax assets will not be realized. We continue to analyze our current and future profitability and probability of the realization of our net deferred tax assets in future periods. Please refer to Note 13 of Notes to Consolidated Financial Statements in “Item 8. Financial Statements and Supplementary Data” for additional information regarding deferred taxes.
Goodwill
Goodwill represents the excess of the acquisition cost over the fair value of net assets of the businesses acquired. ASC 350, “Intangibles - Goodwill and Other,” requires periodic tests of the impairment of goodwill. ASC 350 requires a comparison, at least annually, of the net book value of the assets and liabilities associated with a reporting unit, including goodwill, with the fair value of the reporting unit, which corresponds to the discounted cash flows of the reporting unit, in the absence of an active market. When this comparison indicates that impairment must be recorded, the impairment recognized is the amount by which the carrying amount of the assets exceeds the fair value of these assets. The annual goodwill impairment review is conducted during the fourth quarter of each year.
Fair values for goodwill testing are estimated using a discounted cash flow approach. Significant estimates in the discounted cash flow approach include the cash flow forecasts for each of our reporting units (Mexico, U.S. and Canada), the discount rate and the terminal value. The five year cash flow forecasts of the company’s reporting units is based upon management’s estimate at the date of the assessment, which incorporates managements long-term view of selling prices, sales volumes for Innophos’ products, key raw materials and energy costs, and our operating cost structure. The aggregated fair value of our reporting units was reconciled to our market capitalization at the date of the assessment, plus a suitable control premium. Our market capitalization during fourth quarter of 2009 exceeded the book value of our equity. The terminal value was determined by applying business growth factors for each reporting unit which are in-line with longer term historical growth rates, to the latest year for which a forecast exists.
Solely for the purpose of goodwill valuation for our Mexico reporting unit, the 2009 goodwill impairment analysis included estimates addressing changes in phosphate rock pricing, weakness in the markets served by those operations, loss of traditional business which in part is a result of the softness in the fertilizer markets, and operating the Coatzacoalcos, Mexico complex at substantially reduced levels. Our 2009 goodwill impairment analysis included: (i) for the first three quarters of 2010, assumed phosphate rock prices estimated to be below the 2009 price paid, trending towards an estimated market price; and (ii) for late 2010 and thereafter, assumptions that Mexico operations would return to an estimated market price for phosphate rock. The reporting unit’s cash flow model is estimated to be higher than 2009 levels, with improvement occurring as our phosphate rock price returns to market pricing in 2011. Revenue levels are estimated to have a slight recovery in 2011 and estimated to return to a historical growth rate of 3% per annum in 2012. We applied operating margin percentages slightly below our historical trends and used a 3% growth rate to calculate the terminal value for our Mexican reporting unit. We used a 12% discount rate, which is above our weighted average cost of capital and consistent with our prior year goodwill impairment test. Based on this valuation, we determined that the fair values of our reporting units exceeded their carrying values and no goodwill impairment charge was required.
As of December 31, 2009, the Mexican reporting unit had a carrying value, including goodwill, of approximately $187 million. The fair value of the reporting unit exceeded its carrying value by approximately 15%. In addition, if we were to decrease the long-term growth rate or increase the discount rate used in the calculation by 1%, there would still be no goodwill impairment for the Mexican reporting unit.
Page 32 of 94
Table of Contents
Given the current economic environment and uncertainties surrounding the impact on our Mexican business of factors such as market conditions affecting our selling prices, sales volumes, and raw material costs and other factors not limited to those enumerated, we cannot be sure that the estimates and assumptions used in the goodwill impairment analysis will prove to be accurate predictions of the future. Significant changes in assumptions will influence the goodwill impairment analysis and may result in goodwill impairment charges in future periods.
Long-lived assets
Under ASC 360,” Property, Plant, and Equipment,” long-lived assets including property, plant and equipment and amortized intangible assets are evaluated and reviewed for impairment whenever events or changes in circumstances indicate that the carrying amount of an asset or asset group may not be recoverable. Recoverability of assets to be held and used is measured by a comparison of the carrying amount of the assets to the undiscounted future cash flows expected to be generated by the asset or asset group. When this comparison indicates that impairment must be recorded, the impairment recognized is the amount by which the carrying amount of the assets exceeds the fair value of the assets.
The determination of whether or not assets are impaired and the corresponding useful lives of these long-lived assets requires significant judgment. The development of future cash flow projections requires management estimates related to forecasted sales and expected costs trends. To the extent that changes in business conditions occur or other management decisions are made that result in adjusted management projections or alternative use of the assets, impairment losses or accelerated depreciation may occur in future periods.
In our Mexican operations, we continue to monitor changes in circumstances where the undiscounted cash flows would indicate that the carrying amount of an asset or asset group may not be recoverable. The uncertainty in phosphate rock prices, volume decreases, sales price erosion, and the reduced operating rates for the Coatzacoalcos plant were included in management’s estimates and are consistent with management’s expectations. The carrying value of the Coatzacoalcos plant was approximately $84.2 million at December 31, 2009. The undiscounted cash flows of the STPP (Sodium Tripolyphosphate) asset group exceeded their carrying value by 31%, while the other asset groups exceeded their carrying values by significantly greater margins. The Company did not conduct an asset impairment test during the fourth quarter as there were no triggering events that warranted an impairment test.
Stock-Based Compensation Expense
Holdings compensation programs can include share-based payments. The primary share-based awards and their general terms and conditions currently in effect are as follows:
| • | Stock options, which entitle the holder to purchase, after the end of a vesting term, a specified number of shares of Holdings common stock at an exercise price per share set equal to the market price of Holdings common stock on the date of grant. |
| • | Restricted stock grants, which entitle the holder to receive, at the end of each vesting term, a specified number of shares of Holdings common stock, and which also entitle the holder to receive dividends paid on such grants throughout the vesting period. |
| • | Performance share awards which entitle the holder to receive, at the end of a vesting term, a number of shares of Holdings common stock, within a range of shares from zero to a specified maximum, calculated using a three year future average return on invested capital (i.e. the three year period 2008-2010 for a 2007 award) as defined solely by reference to Holdings own activities. Dividends will accrue over the vesting period and are paid on performance share awards when fully vested. |
| • | Annual stock retainer grants, which entitle independent members of the Board of Directors to receive a number of shares of Holdings common stock equal to a fixed retainer value. |
Since these programs benefit the employees of Innophos, Inc. all amounts have been recorded in our consolidated results.
Page 33 of 94
Table of Contents
The fair value of the options granted during 2009, 2008 and 2007 was determined using the Black-Scholes option-pricing model. The assumptions used in the Black-Scholes option-pricing model were as follows:
| Non-qualified stock options |
Year Ended December 31, 2009 |
Year Ended December 31, 2008 |
Year Ended December 31, 2007 |
|||||||||
| Expected volatility |
61.4 | % | 36.8 | % | 36.8 | % | ||||||
| Dividend yield |
5.0 | % | 4.6 | % | 4.5 | % | ||||||
| Risk-free interest rate |
2.7 | % | 3.4 | % | 4.2 | % | ||||||
| Expected term |
6 years | 6 years | 6 years | |||||||||
| Weighted average grant date fair value of stock options |
$ | 6.19 | $ | 4.52 | $ | 3.97 | ||||||
Prior to 2009, since Innophos Holdings, Inc. was a newly public entity and has limited historical data on the price of its publicly traded shares, the expected volatility for the valuation of its stock options and performance shares was based on peer group historical volatility data equaling the expected term. In 2009, Holdings had chosen a blended volatility which consists of 50% average historical volatility of the peer group and 50% historical volatility of Holdings. The increase in the expected volatility in 2009 versus prior periods is a result of broader market conditions. The expected term for the stock options is based on the simplified method since Holdings has limited data on the exercises of stock options. These stock options qualify as “plain vanilla” stock options. The dividend yield is the expected annual dividend payments divided by the average stock price up to the date of grant. The risk-free interest rates are derived from the U.S. Treasury securities in effect on the date of grant whose maturity period equals the options expected term. Holdings applies an expected forfeiture rate to stock-based compensation expense. The estimate of the forfeiture rate is based primarily upon historical experience of employee turnover. As actual forfeitures become known, stock-based compensation expense is adjusted accordingly.
Pension and Post-Retirement Costs / Post-Employment Plan
The Company maintains both noncontributory defined benefit pension plans and defined contribution plans that together cover all U.S. and Canadian employees.
In the United States, salaried and hourly employees are covered by a defined contribution plan with a 401(k) feature. The plan provides for employee contributions, company matching contributions, and an age-weighted annual company contribution to eligible employees. Union-represented hourly employees, at our Nashville site, are covered by a traditional defined benefit plan providing benefits based on years of service and final average pay whose benefit accruals were frozen as of August 1, 2007, after which the Nashville union employees now participate in the Company’s existing non contributory defined contribution benefit plan. All plans were established by Innophos in 2004.
In Canada, salaried employees are covered by defined contribution plans which provide for company contributions as a percent of pay, employee contributions, and company matching contributions. Union-represented hourly employees are covered by a defined benefit plan providing benefits based on a negotiated benefit level and years of service.
Our pension and postretirement benefit costs are developed from actuarial valuations. Inherent in these valuations are key assumptions, including the discount rate and the expected long-term rate on plan assets. These assumptions require significant judgment and material changes in our pension and postretirement benefit costs may occur in the future due to changes in these assumptions, changes in levels of benefits provided, and changes in asset levels. Such assumptions are based on benchmarks obtained from third party sources.
As a sensitivity measure, the effect of a 25 basis-point decrease in our discount rate assumption would increase our net periodic benefit cost for our pension and post-retirement plans by approximately $60. A 1% decrease in our expected rate of return on plan assets would increase our pension plan expense by $135.
Page 34 of 94
Table of Contents
Recently Issued Accounting Standards
New accounting standards effective in 2009 are described in the Recent Accounting Pronouncements section in Note 1 of Notes to Consolidated Financial Statements in “Item 8. Financial Statements and Supplementary Data”.
| ITEM 7A. | QUANTITATIVE AND QUALITATIVE DISCLOSURES ABOUT MARKET RISK |
We are exposed to certain market risks as part of our ongoing business operations. Primary exposures include changes in interest rates, as borrowings under our Loan Agreement will bear interest at floating rates based on LIBOR plus an applicable borrowing margin. We manage our interest rate risk by balancing the amount of fixed-rate and floating-rate debt to the extent practicable consistent with our credit status. For fixed-rate debt, interest rate changes do not affect earnings or cash flows. Conversely, for floating-rate debt, interest rate changes generally affect our earnings and cash flows, assuming other factors are held constant.
At December 31, 2009, we had $190.0 million principal amount of fixed-rate debt and a $65.0 million revolving credit facility, of which we had $41.9 million available above the minimum excess availability requirements, which has not been drawn upon. . In addition, Holdings has $56.0 million of 9.5% Senior Unsecured Notes due 2012. These Senior Unsecured Notes are not included in the consolidated results of Innophos, Inc. As all of the business for Holdings is transacted through Innophos, Inc. and its subsidiaries, Holdings is dependent on earnings and the distribution of funds from Innophos, Inc. and subsidiaries.
Changes in economic conditions could result in higher interest rates, thereby increasing our interest expense and other operating expenses and reducing our funds available for capital investment, operations or other purposes. In addition, a substantial portion of our cash flow must be used to service debt, which may affect our ability to make future acquisitions or capital expenditures. We may from time to time use interest rate protection agreements to minimize our exposure to interest rate fluctuation. Regardless of hedges, we may experience economic loss and a negative impact on earnings or net assets as a result of interest rate fluctuations.
We do not currently, but may from time to time, hedge our commodity, interest rate or currency rate risks.
We believe that our concentration of credit risk related to trade accounts receivable is limited since these receivables are spread among a number of customers and are geographically dispersed. Our largest customer in 2008 represented 11.1% of that year’s sales, otherwise, no other customer accounted for more than 10% of our sales in the last 3 years.
Foreign Currency Exchange Rates
The U.S. Dollar is the functional currency of the Canadian and Mexican operations. Accordingly, these operations’ monetary assets and liabilities are translated at current exchange rates, non-monetary assets and liabilities are translated at historical exchange rates, and revenue and expenses are translated at average exchange rates and at historical exchange rates for the related revenue and expenses of non-monetary assets and liabilities. All transaction gains and losses are included in net income.
Our principal source of exchange rate exposure in our foreign operations consists of expenses, such as labor expenses, which are denominated in the foreign currency of the country in which we operate. A decline in the value of the U.S. Dollar relative to the local currency would generally cause our operational expenses (particularly labor costs) to increase (conversely, a decline in the value of the foreign currency relative to the U.S. Dollar would cause these expenses to decrease). We believe that normal exchange rate fluctuations consistent with recent historical trends would have a modest impact on our expenses, and would not materially affect our financial condition or results of operations. Nearly all of our sales are denominated in U.S. Dollars and our exchange rate exposure in terms of sales revenues is minimal.
Inflation and changing prices
Our costs and expenses will be subject to inflation and price fluctuations. Significant price fluctuations in raw materials, freight, and energy costs, if not compensated for by cost savings from production efficiencies or price increases passed on to customers could have a material effect on our financial condition and results of operations. Refer to “Item 1A. Risk Factors” contained in this Annual Report on Form 10-K for further information on raw materials availability and pricing.
Page 35 of 94
Table of Contents
Off-Balance Sheet Arrangements
We do not have any relationships with unconsolidated entities or financial partnerships, such as entities often referred to as “structured finance or special purpose entities”, which would have been established for the purpose of facilitating off-balance sheet arrangements or other contractually narrow or limited purposes.
| ITEM 8. | CONSOLIDATED FINANCIAL STATEMENTS AND SUPPLEMENTARY DATA |
INDEX TO FINANCIAL STATEMENTS
| Page | ||
| Consolidated Financial Statements |
||
| 37 | ||
| 38 | ||
| Statements of Operations for each of the three years ended December 31, 2009 |
39 | |
| 40 | ||
| Statements of Cash Flows for each of the three years ended December 31, 2009 |
41 | |
| 42 | ||
Page 36 of 94
Table of Contents
Report of Independent Registered Public Accounting Firm
To the Stockholders and Board of Directors of Innophos, Inc:
In our opinion, the consolidated financial statements listed in the accompanying index present fairly, in all material respects, the financial position of Innophos, Inc. and its subsidiaries at December 2009 and 2008, and the results of their operations and their cash flows for each of the three years in the period ended December 31, 2009 in conformity with accounting principles generally accepted in the United States of America. These financial statements are the responsibility of the Company’s management. Our responsibility is to express an opinion on these financial statements based on our audits. We conducted our audits of these statements in accordance with the standards of the Public Company Accounting Oversight Board (United States). Those standards require that we plan and perform the audit to obtain reasonable assurance about whether the financial statements are free of material misstatement. An audit includes examining, on a test basis, evidence supporting the amounts and disclosures in the financial statements, assessing the accounting principles used and significant estimates made by management, and evaluating the overall financial statement presentation. We believe that our audits provide a reasonable basis for our opinion.
/s/ PricewaterhouseCoopers LLP
Florham Park, New Jersey
March 8, 2010
Page 37 of 94
Table of Contents
INNOPHOS, INC. AND SUBSIDIARIES
Consolidated Balance Sheets
(Dollars in thousands)
| December 31, | ||||||||
| 2009 | 2008 | |||||||
| ASSETS |
||||||||
| Current assets: |
||||||||
| Cash and cash equivalents |
$ | 132,222 | $ | 124,623 | ||||
| Restricted cash |
1,749 | — | ||||||
| Accounts receivable, net |
56,345 | 79,532 | ||||||
| Inventories |
113,636 | 145,310 | ||||||
| Other current assets |
45,638 | 33,993 | ||||||
| Total current assets |
349,590 | 383,458 | ||||||
| Property, plant and equipment, net |
204,527 | 230,422 | ||||||
| Goodwill |
51,706 | 51,706 | ||||||
| Intangibles and other assets, net |
51,483 | 54,518 | ||||||
| Total assets |
$ | 657,306 | $ | 720,104 | ||||
| LIABILITIES AND STOCKHOLDERS’ EQUITY |
||||||||
| Current liabilities: |
||||||||
| Current portion of long-term debt |
$ | — | $ | 72,613 | ||||
| Accounts payable, trade and other |
32,580 | 36,676 | ||||||
| Other current liabilities |
54,603 | 39,232 | ||||||
| Total current liabilities |
87,183 | 148,521 | ||||||
| Long-term debt |
190,000 | 243,887 | ||||||
| Other long-term liabilities |
37,920 | 35,865 | ||||||
| Total liabilities |
315,103 | 428,273 | ||||||
| Commitments and contingencies (note 14) |
||||||||
| Stockholders’ equity: |
||||||||
| Common stock, par value $.001 per share; authorized and issued 1,000 |
— | — | ||||||
| Paid-in capital |
84,829 | 99,658 | ||||||
| Retained earnings |
259,624 | 194,197 | ||||||
| Accumulated other comprehensive loss |
(2,250 | ) | (2,024 | ) | ||||
| Total stockholders’ equity |
342,203 | 291,831 | ||||||
| Total liabilities and stockholders’ equity |
$ | 657,306 | $ | 720,104 | ||||
See notes to consolidated financial statements
Page 38 of 94
Table of Contents
INNOPHOS, INC. AND SUBSIDIARIES
Consolidated Statements of Operations
(Dollars in thousands)
| Year Ended December 31, | ||||||||||||
| 2009 | 2008 | 2007 | ||||||||||
| Net sales |
$ | 666,759 | $ | 934,758 | $ | 578,982 | ||||||
| Cost of goods sold |
470,780 | 570,176 | 474,785 | |||||||||
| Gross profit |
195,979 | 364,582 | 104,197 | |||||||||
| Operating expenses: |
||||||||||||
| Selling, general and administrative |
67,143 | 63,183 | 54,155 | |||||||||
| Research & Development Expenses |
1,938 | 2,310 | 2,047 | |||||||||
| Total operating expenses |
69,081 | 65,493 | 56,202 | |||||||||
| Operating income |
126,898 | 299,089 | 47,995 | |||||||||
| Interest expense, net |
20,743 | 27,569 | 30,854 | |||||||||
| Foreign exchange (gains)/losses |
(769 | ) | 2,663 | 40 | ||||||||
| Other income, net |
— | (386 | ) | (299 | ) | |||||||
| Income before income taxes |
106,924 | 269,243 | 17,400 | |||||||||
| Provision for income taxes |
41,497 | 72,134 | 11,896 | |||||||||
| Net income |
$ | 65,427 | $ | 197,109 | $ | 5,504 | ||||||
See notes to consolidated financial statements
Page 39 of 94
Table of Contents
INNOPHOS, INC. AND SUBSIDIARIES
Statements of Stockholders’ Equity and Other Comprehensive Income (Loss)
(Dollars in thousands)
| Retained Earnings (Deficit) |
Paid-in Capital |
Accumulated Other Comprehensive Income/(Loss) |
Total Shareholders’ Equity |
|||||||||||||
| Balance, December 31, 2006 |
$ | (8,416 | ) | $ | 133,421 | $ | (3,816 | ) | $ | 121,189 | ||||||
| Net income |
5,504 | 5,504 | ||||||||||||||
| Change in pension and post-retirement plans, (net of tax $243) |
1,545 | 1,545 | ||||||||||||||
| Net income and other comprehensive income, net of tax |
7,049 | |||||||||||||||
| Stock based compensation |
1,077 | 1,077 | ||||||||||||||
| Return of capital |
(15,367 | ) | (15,367 | ) | ||||||||||||
| Balance, December 31, 2007 |
$ | (2,912 | ) | $ | 119,131 | $ | (2,271 | ) | $ | 113,948 | ||||||
| Net income |
197,109 | 197,109 | ||||||||||||||
| Change in pension and post-retirement plans, (net of tax $144) |
247 | 247 | ||||||||||||||
| Net income and other comprehensive income, net of tax |
197,356 | |||||||||||||||
| Stock based compensation |
3,467 | 3,467 | ||||||||||||||
| Return of capital |
(22,940 | ) | (22,940 | ) | ||||||||||||
| Balance, December 31, 2008 |
$ | 194,197 | $ | 99,658 | $ | (2,024 | ) | $ | 291,831 | |||||||
| Net income |
65,427 | 65,427 | ||||||||||||||
| Change in pension and post-retirement plans, (net of tax $109) |
(226 | ) | (226 | ) | ||||||||||||
| Net income and other comprehensive income, net of tax |
65,201 | |||||||||||||||
| Stock based compensation |
3,367 | 3,367 | ||||||||||||||
| Return of capital |
(18,196 | ) | (18,196 | ) | ||||||||||||
| Balance, December 31, 2009 |
$ | 259,624 | $ | 84,829 | $ | (2,250 | ) | $ | 342,203 | |||||||
See notes to consolidated financial statements
Page 40 of 94
Table of Contents
INNOPHOS, INC. AND SUBSIDIARIES
Consolidated Statements of Cash Flows
(Dollars in thousands)
| Year Ended December 31, | ||||||||||||
| 2009 | 2008 | 2007 | ||||||||||
| Cash flows from operating activities |
||||||||||||
| Net income |
$ | 65,427 | $ | 197,109 | $ | 5,504 | ||||||
| Adjustments to reconcile net income to net cash provided from operating activities: |
||||||||||||
| Depreciation and amortization |
51,186 | 52,507 | 47,486 | |||||||||
| Amortization of deferred financing charges |
2,641 | 2,363 | 2,773 | |||||||||
| Deferred income tax benefit |
(5,662 | ) | (1,922 | ) | (1,807 | ) | ||||||
| Deferred profit sharing |
(756 | ) | (3,258 | ) | 800 | |||||||
| Stock based compensation |
3,367 | 3,467 | 1,077 | |||||||||
| Changes in assets and liabilities: |
||||||||||||
| Increase in restricted cash |
(1,749 | ) | — | — | ||||||||
| Decrease/(increase) in accounts receivable |
23,187 | (19,453 | ) | (3,763 | ) | |||||||
| Decrease/(increase) in inventories |
31,674 | (66,582 | ) | (8,159 | ) | |||||||
| Increase in other current assets |
(6,433 | ) | (11,116 | ) | (2,645 | ) | ||||||
| (Decrease)/increase in accounts payable |
(4,096 | ) | 232 | 5,581 | ||||||||
| Increase/(decrease) in other current liabilities |
15,371 | (1,292 | ) | 3,700 | ||||||||
| Changes in other long-term assets and liabilities |
(1,698 | ) | (3,133 | ) | 2,125 | |||||||
| Net cash provided from operating activities |
172,459 | 148,922 | 52,672 | |||||||||
| Cash flows for investing activities: |
||||||||||||
| Capital expenditures |
(19,609 | ) | (18,536 | ) | (28,356 | ) | ||||||
| Purchase of assets |
— | — | (2,120 | ) | ||||||||
| Net cash used for investing activities |
(19,609 | ) | (18,536 | ) | (30,476 | ) | ||||||
| Cash flows used for financing activities: |
||||||||||||
| Return of capital to parent |
(18,196 | ) | (20,797 | ) | (15,746 | ) | ||||||
| Deferred financing costs |
(1,050 | ) | — | — | ||||||||
| Excess tax benefits from exercise of stock options |
495 | 1,466 | — | |||||||||
| Principal payments of term-loan |
(126,500 | ) | (2,000 | ) | (20,500 | ) | ||||||
| Net cash used for financing activities |
(145,251 | ) | (21,331 | ) | (36,246 | ) | ||||||
| Net change in cash |
7,599 | 109,055 | (14,050 | ) | ||||||||
| Cash and cash equivalents at beginning of period |
124,623 | 15,568 | 29,618 | |||||||||
| Cash and cash equivalents at end of period |
$ | 132,222 | $ | 124,623 | $ | 15,568 | ||||||
See notes to consolidated financial statements
Page 41 of 94
Table of Contents
INNOPHOS, INC. AND SUBSIDIARIES
Notes to Consolidated Financial Statements
(Dollars in thousands, except where otherwise noted)
1. Basis of Statement Presentation:
Summary of Significant Accounting Policies
Fiscal Year
Our fiscal year end is December 31.
Description of Business and Principles of Consolidation
Innophos is a leading North American producer of specialty phosphates. Many specialty phosphates are application-specific compounds engineered to meet customer performance requirements. Specialty phosphates are often critical to the taste, texture and performance of foods, beverages, pharmaceuticals, oral care products and other applications. For example, specialty phosphates act as flavor enhancers in beverages, electrolytes in sports drinks, texture additives in cheeses, leavening agents in baked goods, calcium and phosphorus sources for nutritional supplements, pharmaceutical excipients and cleaning agents in toothpaste.
Innophos Holdings, Inc. (Holdings) is the parent of Innophos Investments Holdings, Inc., which owns 100% of Innophos, Inc; all are incorporated under the laws of the State of Delaware. All intercompany transactions are eliminated in consolidation.
Use of Estimates
The preparation of financial statements in conformity with United States generally accepted accounting principles requires the use of judgments and estimates made by management. Actual results could differ from those estimates. Some of the more significant estimates pertaining to the Company include accruals for contingencies, distributor incentives and rebates, the valuation of inventories, the allowance for doubtful accounts, income tax valuation allowances, the recoverability of long-lived assets and goodwill analysis. Management routinely reviews its estimates and assumptions utilizing currently available information, changes in facts and circumstances, and historical experience.
Cash Equivalents
All highly liquid investments with original maturities of three months or less are considered to be cash equivalents.
Accounts Receivable and Allowances for Doubtful Accounts
Trade accounts receivable is recorded at the invoiced amount and does not bear interest. The collectability of accounts receivable is evaluated based on a combination of factors. Allowances for doubtful accounts are recorded based on the length of time the receivables are past due and historical experience. In circumstances when it is probable that a specific customer is unable to meet its financial obligations, an allowance is recorded against amounts due to reduce the receivable to the amount that is reasonably expected to be collected.
Inventories
Inventories are valued at the lower of cost or market. Cost is determined on the basis of the first-in, first-out method. These costs include raw materials, direct labor, manufacturing overhead and depreciation. Spare parts are included in inventory and are initially recorded at cost.
Inventories, including spare parts, are evaluated for excess quantities, obsolescence or shelf-life expiration. This evaluation includes an analysis of historical sales levels by product and projections of future demand. To the extent management determines there are excess, obsolete or expired inventory quantities, valuation reserves are recorded against all or a portion of the value of the related products with the appropriate charge to cost of goods sold.
Property, Plant and Equipment
Property, plant and equipment are stated at cost less accumulated depreciation. Major renewals and improvements are capitalized. Maintenance, repairs and minor renewals are expensed as incurred. The cost and related accumulated depreciation of all property, plant and equipment retired or otherwise disposed of are eliminated from the accounts and any resulting gain or loss is reflected in net income. Interest is capitalized in connection with the construction of major renewals
Page 42 of 94
Table of Contents
INNOPHOS, INC. AND SUBSIDIARIES
Notes to Consolidated Financial Statements
(Dollars in thousands, except where otherwise noted)
and improvements. Capitalized interest is recorded as part of the asset to which it relates and is amortized over the asset’s estimated useful life. Depreciation is calculated on the straight-line basis over the estimated useful lives of the related assets, ranging from ten to forty years for buildings and improvements, three to twenty years for machinery and equipment, and three to seven years for capitalized software. Leasehold improvements are amortized over the lease term or the estimated useful life of the improvement, whichever is less.
Long-Lived Assets
Under ASC 360,” Property, Plant, and Equipment,” long-lived assets including property, plant and equipment and amortized intangible assets are evaluated and reviewed for impairment whenever events or changes in circumstances indicate that the carrying amount of an asset or asset group may not be recoverable. Recoverability of assets to be held and used is measured by a comparison of the carrying amount of the assets to the undiscounted future cash flows expected to be generated by the asset or asset group. When this comparison indicates that impairment must be recorded, the impairment recognized is the amount by which the carrying amount of the assets exceeds the fair value of the assets.
The determination of whether or not assets are impaired and the corresponding useful lives of these long-lived assets requires significant judgment. The development of future cash flow projections requires management estimates related to forecasted sales and expected costs trends. To the extent that changes in business conditions occur or other management decisions are made that result in adjusted management projections or alternative use of the assets, impairment losses or accelerated depreciation may occur in future periods.
Goodwill
Goodwill represents the excess of the acquisition cost over the fair value of net assets of the businesses acquired. ASC 350, “Intangibles - Goodwill and Other,” requires periodic tests of the impairment of goodwill. ASC 350 requires a comparison, at least annually, of the net book value of the assets and liabilities associated with a reporting unit, including goodwill, with the fair value of the reporting unit, which corresponds to the discounted cash flows of the reporting unit, in the absence of an active market. When this comparison indicates that impairment must be recorded, the impairment recognized is the amount by which the carrying amount of the assets exceeds the fair value of these assets. The annual goodwill impairment review is conducted during the fourth quarter of each year.
Other Intangible Assets
Other intangible assets, which consist of developed technology, customer relationships, tradenames, a non-compete agreement, patents, licenses and software, are amortized on a straight-line basis over their estimated useful lives. For capitalized software the amortization period is three to seven years; all other identifiable intangibles amortization period is up to twenty years.
External direct costs in developing or obtaining internal use computer software and payroll, and payroll-related costs for employees dedicated solely to the project, to the extent of the time spent directly on the project and which they meet the requirements of ASC 350-40, are capitalized.
Revenue Recognition
Revenues from sales of products are recognized when delivery has occurred and title and risk of loss passes to the customer. In the United States and Canada, the Company records estimated reductions to revenue for distributor incentives and customer incentives such as rebates, at the time of the initial sale. Distributor and customer incentives in Mexico are immaterial to the consolidated financial statements. The estimated reductions are based on the sales terms, historical experience and trend analysis. Accruals for distributor incentives are reflected as a direct reduction to accounts receivable and accruals for rebates are recorded as accrued expenses. This analysis requires a significant amount of judgment from management. Changes in the assumptions used to calculate these estimates or changes resulting from actual results are recorded against revenue in the period in which the change occurs.
Page 43 of 94
Table of Contents
INNOPHOS, INC. AND SUBSIDIARIES
Notes to Consolidated Financial Statements
(Dollars in thousands, except where otherwise noted)
Shipping and Handling Fees and Costs and Advertising Expenses
Shipping and handling fees and costs invoiced to customers are included in Net sales. Shipping and handling fees and costs incurred by the Company are included in Cost of goods sold. Advertising expenses, which are not significant, are expensed as incurred.
Foreign Currency Translation
The U.S. dollar is the functional currency of the Canadian and Mexican operations. Accordingly, these operations monetary assets and liabilities are translated at current exchange rates, non-monetary assets and liabilities are translated at historical exchange rates. Revenue and expenses related to monetary assets and liabilities are translated at average exchange rates and at historical exchange rates for the related revenue and expenses of non-monetary assets and liabilities. All translation gains and losses are included in net income.
Research and Development Expenses
Research and development expenditures, including expenditures relating to the development of new products and processes and significant improvements and refinements to existing products, are expensed as incurred.
Employee Termination Benefits
The Company does not have a written severance plan for its Mexican operations, nor does it offer similar termination benefits to affected employees in all Mexican restructuring initiatives however, Mexican law requires payment of certain minimum termination benefits. Accordingly, in situations where minimum statutory termination benefits must be paid to the affected employees, the Company records employee severance costs associated with these activities in accordance with Accounting Standards Codification (ASC) 712 (formerly SFAS No. 112), Compensation – Nonretirement Postemployment Benefits. The Company does have a written severance plan which is in accordance with ASC 712 for its U.S. and Canadian operations. The Company has no accrued obligation for post-employment benefits for U.S. and Canadian operations because the amount is not probable and reasonably estimated. Charges associated with these activities are recorded when the payment of benefits is probable and can be reasonably estimated. In all other situations where the Company pays out termination benefits, including supplemental benefits paid in excess of statutory minimum amounts and benefits offered to affected employees based on management’s discretion, the Company records these termination costs in accordance with ASC 420 (formerly SFAS No. 146), Exit or Disposal Cost Obligations.
The timing of the recognition of charges for employee severance costs depends on whether the affected employees are required to render service beyond their legal notification period in order to receive the benefits. If affected employees are required to render service beyond their legal notification period, charges are recognized ratably over the future service period. Otherwise, charges are recognized when a specific plan has been confirmed by management and required employee communication requirements have been met.
Legal Costs
The Company expenses legal costs as incurred, including those legal costs expected to be incurred in connection with a loss contingency.
Income Taxes
The Company is included in a consolidated U.S. tax return of Innophos Holdings, Inc., however the income tax provision has been prepared on a separate return basis. The Mexican subsidiaries file separate tax returns and current income taxes receivable or payable are reflected on the accompanying combined balance sheets. The Company accounts for income taxes in accordance with ASC 740 (formerly SFAS No. 109), Income Taxes. Under ASC 740, deferred tax assets and liabilities are determined based on the differences between the financial statement and tax bases using enacted tax rates applied to those differences.
Deferred tax assets are assessed for recoverability and a valuation allowance is provided if it is more likely than not that the associated tax benefit will not be recognized.
Page 44 of 94
Table of Contents
INNOPHOS, INC. AND SUBSIDIARIES
Notes to Consolidated Financial Statements
(Dollars in thousands, except where otherwise noted)
The Company does not have any material uncertain income tax positions in accordance with ASC 740-10-25 (formerly FIN 48). If any material uncertain tax positions did arise, the Company’s policy is to accrue associated penalties in selling, general and administrative expenses and to accrue interest as part of net interest expense. All of the tax years since the Company’s inception in 2004 are subject to examination by the Canadian, Mexican and United States revenue authorities. Currently, the Company is under examination, or has been contacted for examination, by certain foreign jurisdictions for its income tax returns for the years 2004 through 2008. As of December 31, 2009, no significant adjustments have been proposed to the Company’s tax positions and the Company currently does not anticipate any adjustments that would result in a material change to its financial position. The Company does not anticipate that total unrecognized tax benefits will significantly change prior to December 31, 2010.
Environmental Costs
Environmental liabilities are recorded undiscounted when it is probable that these liabilities have been incurred and the amounts can be reasonably estimated. These liabilities are estimated based on an assessment of many factors, including the amount of remediation costs, the timing and extent of remediation actions required by the applicable governmental authorities, and the amount of the Company’s liability after considering the liability and financial resources of other potentially responsible parties. Generally, the recording of these accruals coincides with the assertion of a claim or litigation, completion of a feasibility study or a commitment to a formal plan of action. Anticipated recoveries from third parties are recorded as a reduction of expense only when such amounts are realized. Any insurance receivables would be recorded gross of the estimated liability.
Other Comprehensive Income (Loss)
Other comprehensive income (loss) is composed of net income (loss), adjusted for changes in other comprehensive income items such as changes in defined benefit pension plan funded status. In accordance with ASC 220 (formerly SFAS No. 130), Comprehensive Income, the Company has identified and reported other comprehensive income in stockholders’ equity.
Stock Options
In connection with Holdings initial public offering, the historical stock option strips originally granted on April 1, 2005 under the Innophos Holdings, Inc. 2005 Stock Option Plan, or 2005 Plan, were converted, as required under the terms of the 2005 Plan, to 1,116,944 single class common stock options currently outstanding with the same vesting schedule. The exercise price is $2.55 per option. The determination of the fair value of the underlying common stock used to determine the exercise prices for the stock options granted on April 1, 2005 was performed contemporaneously with the issuance of these common stock option grants.
Under the prospective transition method, only new awards (or awards modified, repurchased, or cancelled after the effective date) are accounted for under the provisions of ASC 718 (formerly SFAS No. 123(R)), Compensation – Stock Compensation. Holdings will continue to account for the outstanding 2005 Plan awards under APB 25, which falls under grandfathered material excluded from the first release of the FASB Codification, until they are settled or modified.
Recently Issued Accounting Standards
In June 2009, the Financial Accounting Standards Board (FASB) issued a standard that established the FASB Accounting Standards Codification™ (ASC) and amended the hierarchy of generally accepted accounting principles (GAAP) such that the ASC became the single source of authoritative nongovernmental U.S. GAAP. The ASC did not change current U.S. GAAP, but was intended to simplify user access to all authoritative U.S. GAAP by providing all the authoritative literature related to a particular topic in one place. All previously existing accounting standard documents were superseded and all other accounting literature not included in the ASC is considered non-authoritative. New accounting standards issued subsequent to June 30, 2009 are communicated by the FASB through Accounting Standards Updates (ASUs). For Innophos, the ASC was effective July 1, 2009. This standard did not have an impact on the Company’s consolidated results of operations or financial condition. However, throughout the notes to the consolidated financial statements references that were previously made to various former authoritative U.S. GAAP pronouncements have been changed to coincide with the appropriate section of the ASC.
Page 45 of 94
Table of Contents
INNOPHOS, INC. AND SUBSIDIARIES
Notes to Consolidated Financial Statements
(Dollars in thousands, except where otherwise noted)
The Company adopted the provisions of ASC 820-10, Fair Value Measurements and Disclosures (formerly Statement of Financial Standards (SFAS) No. 157, Fair Value Measurements), with respect to non-financial assets and liabilities effective January 1, 2009. This pronouncement defines fair value, establishes a framework for measuring fair value and expands disclosures about fair value measurements. The adoption of ASC 820-10 did not have a material impact on the Company’s consolidated financial position and results of operations.
The Company adopted ASC 805 (formerly SFAS No. 141(R), Business Combinations and SFAS No. 160, Non-controlling Interests in Consolidated Financial Statements), for business combinations on or after January 1, 2009. This requires recognition of assets acquired, liabilities assumed, and any non-controlling interest in the acquiree at the acquisition date, measured at their fair values as of that date. In a business combination achieved in stages, this pronouncement requires recognition of identifiable assets and liabilities, as well as the non-controlling interest in the acquiree, at the full amounts of their fair values. This pronouncement also requires the fair value of acquired in-process research and development (IPRD) to be recorded as indefinite lived intangibles, contingent consideration to be recorded on the acquisition date, and restructuring and acquisition-related deal costs to be expensed as incurred. In addition, any excess of the fair value of net assets acquired over purchase price and any subsequent changes in estimated contingencies are to be recorded in earnings. The implementation of this standard did not have a material impact on the Company’s consolidated financial position and results of operations.
The Company adopted ASC 855 as of June 30, 2009 (formerly SFAS No. 165, Subsequent Events). ASC 855 should not result in significant changes in the subsequent events that an entity reports. Rather, ASC 855 introduces the concept of financial statements being available to be issued. Financial statements are considered available to be issued when they are complete in a form and format that complies with generally accepted accounting principles (GAAP) and all approvals necessary for issuance have been obtained.
In June 2009, the FASB issued an amendment to ASC topic 860 (the amendment was formerly SFAS No. 166, Accounting for Transfers of Financial Asset). Among other items the provision removes the concept of a qualifying special-purpose entity and clarifies that the objective of paragraph ASC 860-10-40-4 is to determine whether a transferor and all of the entities included in the transferor’s financial statements being presented have surrendered control over transferred financial assets. This pronouncement is effective January 1, 2010. The implementation of this standard will not have a material impact on the Company’s consolidated financial position and results of operations.
In June 2009, the FASB issued an amendment to ASC topic 810 (the amendment was formerly SFAS No. 167, Disclosure Requirements for Variable Interest Entities). The provisions of ASC 810 provide guidance in determining whether an enterprise has a controlling financial interest in a variable interest entity. This determination identifies the primary beneficiary of a variable interest entity as the enterprise that has both the power to direct the activities of a variable interest entity that most significantly impacts the entity’s economic performance, and the obligation to absorb losses or the right to receive benefits of the entity that could potentially be significant to the variable interest entity. This pronouncement also requires ongoing reassessments of whether an enterprise is the primary beneficiary and eliminates the quantitative approach previously required for determining the primary beneficiary. New provisions of this pronouncement are effective January 1, 2010. The implementation of this standard will not have a material impact on the Company’s consolidated financial position and results of operations.
In July 2009, the FASB issued ASC topic 105 (formerly SFAS No. 168, The Hierarchy of Generally Accepted Accounting Principles). ASC 105 contains guidance which reduces the U.S. GAAP hierarchy to two levels, one that is authoritative and one that is not. This pronouncement is effective September 15, 2009. The adoption of this pronouncement did not have an effect on the consolidated financial statements.
In October 2009, the FASB approved for issuance (currently within the scope of FASB Accounting Standards Codification (ASC) Subtopic 605-25) Emerging Issues Task Force (EITF) issue 08-01, Revenue Arrangements with Multiple Deliverables. This statement provides principles for allocation of consideration among its multiple-elements, allowing more flexibility in identifying and accounting for separate deliverables under an arrangement. The EITF introduces an estimated selling price method for valuing the elements of a bundled arrangement if vendor-specific objective evidence or third-party evidence of selling price is not available, and significantly expands related disclosure requirements. This standard is effective on a prospective basis for revenue arrangements entered into or materially modified in fiscal years beginning on or after June 15, 2010. Alternatively, adoption may be on a retrospective basis, and early application is permitted. The implementation of this standard will not have a material impact on the Company’s consolidated financial position and results of operations.
Page 46 of 94
Table of Contents
INNOPHOS, INC. AND SUBSIDIARIES
Notes to Consolidated Financial Statements
(Dollars in thousands, except where otherwise noted)
2. Restricted Cash:
Restricted cash consisted of escrow funds agreed to be deposited in connection with a dispute between the Company and a third party. The dispute was settled on February 24, 2010 and the funds will be disbursed to the third party in accordance with the settlement terms.
3. Inventories:
Inventories consist of the following:
| 2009 | 2008 | |||||
| Raw materials |
$ | 31,770 | $ | 26,183 | ||
| Finished products |
73,924 | 111,031 | ||||
| Spare parts |
7,942 | 8,096 | ||||
| $ | 113,636 | $ | 145,310 | |||
Inventory reserves for excess quantities, obsolescence or shelf-life expiration as of December 31, 2009 and December 31, 2008 were $13,189 and $8,863, respectively.
4. Other Current Assets:
Other current assets consist of the following:
| 2009 | 2008 | |||||
| Creditable taxes (value added taxes) |
$ | 4,028 | $ | 5,444 | ||
| Prepaid income taxes |
10,435 | 1,492 | ||||
| Deferred income taxes |
11,792 | 6,580 | ||||
| Other prepaids |
13,110 | 16,220 | ||||
| Other |
6,273 | 4,257 | ||||
| $ | 45,638 | $ | 33,993 | |||
5. Property, Plant and Equipment, net:
Property, plant and equipment, at cost, consist of the following:
| 2009 | 2008 | |||||
| Land and buildings |
$ | 90,384 | $ | 87,635 | ||
| Machinery and equipment |
322,523 | 315,865 | ||||
| Construction-in-progress |
10,799 | 5,813 | ||||
| 423,706 | 409,313 | |||||
| Less accumulated depreciation |
219,179 | 178,891 | ||||
| $ | 204,527 | $ | 230,422 | |||
Under ASC 360, “Property, Plant, and Equipment,” long-lived assets including property, plant and equipment and amortized intangible assets are evaluated and reviewed for impairment whenever events or changes in circumstances indicate that the carrying amount of an asset or asset group may not be recoverable. Recoverability of assets to be held and used is measured by a comparison of the carrying amount of the assets to the undiscounted future cash flows expected to be generated by the asset or asset group. When this comparison indicates that impairment must be recorded, the impairment recognized is the amount by which the carrying amount of the assets exceeds the fair value of the assets.
Page 47 of 94
Table of Contents
INNOPHOS, INC. AND SUBSIDIARIES
Notes to Consolidated Financial Statements
(Dollars in thousands, except where otherwise noted)
The determination of whether or not assets are impaired and the corresponding useful lives of these long-lived assets requires significant judgment. The development of future cash flow projections requires management estimates related to forecasted sales and expected costs trends. To the extent that changes in business conditions occur or other management decisions are made that result in adjusted management projections or alternative use of the assets, impairment losses or accelerated depreciation may occur in future periods.
In our Mexican operations, we continue to monitor changes in circumstances where the undiscounted cash flows would indicate that the carrying amount of an asset or asset group may not be recoverable. The uncertainty in phosphate rock prices, volume decreases, sales price erosion, and the reduced operating rates for the Coatzacoalcos plant were included in management’s estimates and are consistent with management’s expectations. The carrying value of the Coatzacoalcos plant was approximately $84.2 million at December 31, 2009. The undiscounted cash flows of the STPP (Sodium Tripolyphosphate) asset group exceeded their carrying value by 31%, while the other asset groups exceeded their carrying values by significantly greater margins. The Company completed an impairment analysis for certain of its long lived assets during the third quarter of 2009 and, based on the undiscounted cash flows, no asset impairment charges were recorded for the Mexican assets. The Company did not conduct an asset impairment test during the fourth quarter as there were no triggering events that warranted an impairment test.
Depreciation expense, excluding depreciation expense in changes of inventory, was $45,837, $45,904 and $42,469 in 2009, 2008 and 2007, respectively.
6. Goodwill:
| United States |
Mexico | Canada | Total | |||||||||
| Balance, December 31, 2007 |
$ | 7,237 | $ | 37,501 | $ | 2,530 | $ | 47,268 | ||||
| Adjustments, net of tax |
— | 4,438 | — | 4,438 | ||||||||
| Balance, December 31, 2008 and 2009 |
$ | 7,237 | $ | 41,939 | $ | 2,530 | $ | 51,706 | ||||
In 2008, the Company had an immaterial adjustment to its August 13, 2004 opening balance sheet of $4.4 million related to its deferred Mexican employee statutory profit sharing. A benefit of approximately $2.0 million was recorded for deferred income taxes and deferred profit sharing liabilities for 2008 related to prior years, which was immaterial individually and in the aggregate to all periods.
Goodwill represents the excess of the acquisition cost over the fair value of net assets of the businesses acquired. ASC 350, “Intangibles - Goodwill and Other,” requires periodic tests of the impairment of goodwill. ASC 350 requires a comparison, at least annually, of the net book value of the assets and liabilities associated with a reporting unit, including goodwill, with the fair value of the reporting unit, which corresponds to the discounted cash flows of the reporting unit, in the absence of an active market. When this comparison indicates that impairment must be recorded, the impairment recognized is the amount by which the carrying amount of the assets exceeds the fair value of these assets. The annual goodwill impairment review is conducted during the fourth quarter of each year.
Fair values for goodwill testing are estimated using a discounted cash flow approach. Significant estimates in the discounted cash flow approach include the cash flow forecasts for each of our reporting units (Mexico, U.S. and Canada), the discount rate and the terminal value. The five year cash flow forecasts of the company’s reporting units is based upon management’s estimate at the date of the assessment, which incorporates managements long-term view of selling prices, sales volumes for Innophos’ products, key raw materials and energy costs, operating cost structure and other industry data. The aggregated fair value of our reporting units was reconciled to our market capitalization at the date of the assessment, plus a suitable control premium. Our market capitalization during fourth quarter of 2009 exceeded the book value of our equity. The terminal value was determined by applying business growth factors for each reporting unit which are in-line with longer term historical growth rates, to the latest year for which a forecast exists.
Page 48 of 94
Table of Contents
INNOPHOS, INC. AND SUBSIDIARIES
Notes to Consolidated Financial Statements
(Dollars in thousands, except where otherwise noted)
7. Intangibles and Other Assets, net:
Intangibles and other assets consist of the following:
| Useful life (years) |
2009 | 2008 | ||||||
| Developed technology and application patents, net of accumulated amortization of $10,168 for 2009 and $8,279 for 2008 |
10-20 | 26,432 | 28,321 | |||||
| Customer relationships, net of accumulated amortization of $3,961 for 2009 and $3,012 for 2008 |
5-15 | 7,369 | 8,318 | |||||
| Tradenames and license agreements, net of accumulated amortization of $3,401 for 2009 and $2,839 for 2008 |
5-20 | 5,959 | 6,521 | |||||
| Capitalized software, net of accumulated amortization of $2,279 for 2008 and $2,496 for 2008 |
3-5 | 700 | 1,293 | |||||
| Non-compete agreement, net of accumulated amortization of $315 for 2009 and $189 for 2008 |
5 | 315 | 441 | |||||
| Total Intangibles |
$ | 40,775 | $ | 44,894 | ||||
| Deferred financing costs, net of accumulated amortization of $6,364 for 2009 and $13,643 for 2008 |
$ | 6,215 | $ | 7,806 | ||||
| Deferred income taxes |
1,409 | 512 | ||||||
| Other Assets |
3,084 | 1,306 | ||||||
| Total other assets |
$ | 10,708 | $ | 9,624 | ||||
| $ | 51,483 | $ | 54,518 | |||||
Amortization expense for intangibles was $4,312, $4,312 and $4,034 in 2009, 2008 and 2007, respectively. Anticipated amortization expense for the next five years related to intangibles is as follows:
| 2010 | 2011 | 2012 | 2013 | 2014 | |||||||||||
| Intangible amortization expense |
$ | 3,853 | $ | 3,554 | $ | 3,266 | $ | 3,061 | $ | 2,980 | |||||
The preceding expected amortization expense is an estimate. Actual amounts of amortization expense may differ from estimated amounts due to additional intangible asset acquisitions, impairment of intangible assets, accelerated amortization of intangible assets and other events.
Page 49 of 94
Table of Contents
INNOPHOS, INC. AND SUBSIDIARIES
Notes to Consolidated Financial Statements
(Dollars in thousands, except where otherwise noted)
8. Other Current Liabilities:
Other current liabilities consist of the following:
| 2009 | 2008 | |||||
| Payroll related |
$ | 13,480 | $ | 9,318 | ||
| Interest |
6,396 | 6,507 | ||||
| Freight and rebates |
3,794 | 4,942 | ||||
| Benefits and pensions |
5,104 | 5,688 | ||||
| Taxes |
8,626 | 9,284 | ||||
| Legal |
2,820 | 828 | ||||
| Other |
14,383 | 2,665 | ||||
| $ | 54,603 | $ | 39,232 | |||
9. Short-term Borrowings, Long-Term Debt, and Interest Expense:
Short-term borrowings and long-term debt consist of the following:
| 2009 | 2008 | |||||
| Senior credit facility |
$ | — | $ | 126,500 | ||
| Senior subordinated notes |
190,000 | 190,000 | ||||
| $ | 190,000 | $ | 316,500 | |||
| Less current portion |
— | 72,613 | ||||
| $ | 190,000 | $ | 243,887 | |||
On May 22, 2009, the Company and its wholly owned subsidiary, Innophos Canada, Inc. (the “Borrowers”) entered into a Loan and Security Agreement (the “Loan Agreement”) with certain lenders (collectively, the “Lenders”) including Wachovia Bank, National Association, as agent.
The Loan Agreement provides the Borrowers with a revolving line of credit from the Lenders of up to $65.0 million in the aggregate, with a $20 million letter of credit sub-facility, terminating on May 22, 2013. The amount actually available to the Borrowers may be less than the maximum credit and will vary from time to time depending on, among other factors, the amount of its net eligible inventory and accounts receivable as calculated for purposes of the Loan Agreement. The obligations of the Borrowers under the Loan Agreement are secured by the accounts receivable, inventory and other assets of Innophos, Inc. and Innophos Canada, Inc., not including equipment or real property. Innophos Inc.’s Mexico-based subsidiaries are excluded from certain of the covenants under the Loan Agreement, do not guaranty the indebtedness of Innophos, Inc. and Innophos Canada, Inc. incurred under it, and do not furnish collateral in connection with it.
The Loan Agreement includes affirmative as well as negative covenants that prohibit or restrict a variety of actions without the Lenders’ approval, including covenants that affect the ability of the Borrowers and its subsidiaries among other things to (a) incur or guarantee debt, (b) create liens, (c) enter into mergers, recapitalizations or similar transactions or purchase all or substantially all of the assets or stock of another party, (d) sell assets, (e) change names, (f) make certain changes to their business, (g) optionally prepay, amend, acquire or refinance indebtedness, (h) pay dividends on, or purchase, acquire or redeem shares of, capital stock, (i) change accounting methods, (j) make investments, or (k) enter into transactions with affiliates.
In addition, the Loan Agreement requires the Borrowers to maintain a fixed charge coverage ratio (on a consolidated basis) of at least 1.00 to 1.00 as of the last day of each calendar month for the preceding twelve consecutive fiscal months during any “Compliance Period.” Compliance Period is defined as any period beginning on a day on which (i) an event of default under the Loan Agreement has occurred and is continuing or (ii) the excess availability under the revolving credit facility is less than $16.0 million through and including the first day when excess availability has exceeded $16.0 million for 60 consecutive days during each of which no event of default has occurred. The Loan Agreement also requires the Borrowers
Page 50 of 94
Table of Contents
INNOPHOS, INC. AND SUBSIDIARIES
Notes to Consolidated Financial Statements
(Dollars in thousands, except where otherwise noted)
to maintain at all times excess availability under the revolving credit facility of at least $6.5 million. The Loan Agreement allows the Borrowers to declare and pay dividends or make other distributions to stockholders in an aggregate amount not to exceed $5.0 million in any calendar quarter.
As of December 31, 2009, the Borrowers had $41.9 million excess availability above the minimum excess availability requirements, as calculated in accordance with the Loan Agreement, and there was no amount outstanding on the revolving credit line. A total of $2.2 million in face amount of letters of credit were issued under the sub-facility to support instruments outstanding under a prior credit facility terminated on that date.
The Company was party to a Credit Agreement dated as of August 13, 2004, as subsequently amended (the “2004 Credit Facility”). On May 22, 2009, the Company entered into a Termination Agreement with the agent and J P Morgan Chase Bank, N.A. and National City Bank, the latter two as issuing banks relating to letters of credit, pursuant to which, among other things, the 2004 Credit Facility was terminated, the Company paid the $72.7 million of outstanding term loan balance (principal and accrued interest) from cash on hand, and security held by the lenders on substantially all the Company’s property was released. In the second quarter of 2009 this payment resulted in an approximate $0.4 million charge to earnings for the acceleration of deferred financing charges.
Prior to the termination of the term loan the Company made a $53.6 million excess cash flow payment of the term loan on March 16, 2009. In the first quarter of 2009 this payment resulted in an approximate $0.4 million charge to earnings for the acceleration of deferred financing charges.
2004 Senior Subordinated Notes
On August 13, 2004, the Company issued $190.0 million aggregate principal amount of 8.875% Senior Subordinated Notes due August 15, 2014. We issued the notes in transactions exempt from or not subject to registration under the Securities Act, pursuant to Rule 144A and Regulation S under the Securities Act. The Company did file a registration statement which became effective on February 14, 2006.
Interest. Interest on the notes accrues at the rate of 8.875% per annum and is payable semi-annually on February 15 and August 15. Interest on overdue principal and interest accrues at a maximum rate that is 1% higher than the then applicable interest rate on the notes. We make each interest payment to the holders of record on the immediately preceding February 1 and August 1.
Subsidiary Guarantees. Our obligations under the Innophos, Inc. Notes are fully, unconditionally, jointly and severally guaranteed on a senior subordinated unsecured basis by all of our existing and future domestic restricted subsidiaries. As of the date of this Form 10-K, Innophos Mexico Holdings, LLC was the only guarantor of the Innophos, Inc. 2004 Senior Subordinated Notes.
Optional Redemption. We may redeem any of the notes at any time on or after August 15, 2009, in whole or in part, in cash at the redemption prices described in the indenture governing the notes, plus accrued and unpaid interest and liquidated damages, if any, to the date of redemption.
Change of Control. Upon a change of control, we may be required to make an offer to purchase each holder’s notes at a price equal to 101% of the principal amount thereof, plus accrued and unpaid interest and liquidated damages, if any, to the date of purchase.
Certain Covenants. The indenture governing the 2004 Senior Subordinated Notes contains covenants that, among other things, limit our ability and the ability of our restricted subsidiaries to:
| • | pay dividends on, redeem or repurchase our capital stock; |
| • | make investments and other restricted payments; |
| • | incur additional indebtedness or issue preferred stock; |
| • | create liens; |
| • | permit dividend or other payment restrictions on our restricted subsidiaries; |
| • | sell all or substantially all of our assets or consolidate or merge with or into other companies; and |
Page 51 of 94
Table of Contents
INNOPHOS, INC. AND SUBSIDIARIES
Notes to Consolidated Financial Statements
(Dollars in thousands, except where otherwise noted)
| • | engage in transactions with affiliates. |
Any dividends or similar payments to Holdings from Innophos, Inc. will be treated as restricted payments under the indenture governing the 2004 Senior Subordinated Notes. Holdings will rely upon the ability of Innophos, Inc. to make such restricted payments to us in order for us to make any payments on the notes. The amount of all restricted payments that can be made by the Company is approximately equal to 50% of the consolidated net income (as defined in the indenture governing the 2004 Senior Subordinated Notes) of the Company since the beginning of the first fiscal quarter following the date on which the 2004 Senior Subordinated Notes were issued, plus 100% of the net cash proceeds received by the Company since the date of the indenture from the issue or sale of equity interests. The indenture governing the 2004 Senior Subordinated Notes prohibits all restricted payments if a default or event of default has occurred under that indenture or if Innophos, Inc.’s fixed charge coverage ratio is below 2.0 to 1.0.
Senior Unsecured Notes
On April 16, 2007, Holdings issued $66.0 million aggregate principal amount of Senior Unsecured Notes. Holdings issued the Senior Unsecured Notes in transactions exempt from or not subject to registration under the Securities Act, pursuant to Rule 144A and Regulation S under the Securities Act. These Senior Unsecured Notes are not included in the consolidated results of Innophos, Inc. However, all operations of Holdings and Investments Holdings are conducted through Innophos, Inc. and therefore Holdings and Investments Holdings are dependent on us for debt servicing and dividend payments through our operations.
Interest. Interest on the Holdings Senior Unsecured Notes accrues at the rate of 9.5% per annum and is payable semi-annually on April 15 and October 15, commencing on October 15, 2007. Interest on overdue principal and interest accrues at a maximum rate that is 1% higher than the then applicable interest rate on the Senior Unsecured Notes. Holdings makes each interest payment to the holders of record on the immediately preceding April 1 and October 1.
Optional Redemption. Holdings may, at their option, redeem some or all of the Senior Unsecured Notes at any time on or after April 15, 2009, at the redemption prices described in the indenture governing the Senior Unsecured Notes, plus accrued and unpaid interest and liquidated damages, if any, to the date of redemption.
Change of Control. Upon a change of control, Holdings may be required to make an offer to purchase each holder’s Senior Unsecured Notes at a price equal to 101% of the principal amount thereof, plus accrued and unpaid interest and liquidated damages, if any, to the date of purchase.
Certain Covenants. The indenture governing the Senior Unsecured Notes contains covenants that, among other things, limit our ability and the ability of our restricted subsidiaries to:
| • | pay dividends on, redeem or repurchase our capital stock; |
| • | make investments and other restricted payments; |
| • | incur additional indebtedness or issue preferred stock; |
| • | create liens; |
| • | permit dividend or other payment restrictions on our restricted subsidiaries; |
| • | sell all or substantially all of our assets or consolidate or merge with or into other companies; and |
| • | engage in transactions with affiliates. |
These limitations are subject to a number of important qualifications and exceptions as described in the indenture governing the Holdings Senior Unsecured Notes. Innophos Holdings, Inc. is dependent on the earnings and distributions from Innophos, Inc. and subsidiaries to fund this obligation.
The proceeds from the sale of the Holdings Senior Unsecured notes, together with $0.5 million of cash on hand, were applied to pay expenses and redeem the entire remaining outstanding amount of Innophos Investments Holdings, Inc. (Investments Holdings) Floating Rate Senior Notes due 2015 (including the payment of principal, premium and accrued interest) issued by our wholly-owned subsidiary, Innophos Investments Holdings, Inc. Fees and expenses related to the Holdings Senior Unsecured notes offering were approximately $1.8 million. This amount was recorded as deferred financing costs and will be amortized over the life of the Holdings Senior Unsecured notes using the effective interest method.
Page 52 of 94
Table of Contents
INNOPHOS, INC. AND SUBSIDIARIES
Notes to Consolidated Financial Statements
(Dollars in thousands, except where otherwise noted)
On April 13, 2009 Holdings purchased $10.0 million of the Holdings 9.5% Senior Unsecured Notes due April 2012 for $6.5 million. The $3.5 million retirement gain was reflected in interest expense, net in Holdings Consolidated Statement of Operations in the second quarter of 2009. Holdings also recorded accelerated deferred financing costs of approximately $0.2 million in the second quarter of 2009. These Senior Unsecured Notes are not included in the consolidated results of Innophos, Inc. However, all operations of Holdings and Investments Holdings are conducted through Innophos, Inc. and therefore Holdings and Investments Holdings are dependent on us for debt servicing and dividend payments through our operations.
Innophos and its subsidiaries and affiliates may from time to time seek to acquire or otherwise retire outstanding debt (including publicly issued debt) through open market purchases, privately negotiated transactions, tender offers, exchanges or otherwise. Debt repurchases or exchanges, if any, will depend on prevailing market conditions, Company liquidity requirements, restrictive financial covenants and other factors applicable at the time. The amounts involved may be material.
Floating Rate Senior Notes
On April 16, 2007, Investments Holdings called for the redemption of the remaining $60.8 million in principal of its Floating Rate Senior Notes due 2015 effective May 17, 2007. The redemption of the Investments Holdings Floating Rate Senior Notes resulted in an approximate $1.5 million charge to earnings for the acceleration of deferred financing charges and a $1.8 million charge to earnings for the call premium. The $3.3 million charge was recorded in interest expense. These floating rate senior notes were not included in the consolidated results of Innophos, Inc. However, all operations of Holdings and Investments Holdings are conducted through Innophos, Inc. and therefore Holdings and Investments Holdings are dependent on us for debt servicing and dividend payments through our operations.
We believe that the cash generated from operations and availability under our revolving credit facility will be sufficient to meet our debt service, tax payments, capital expenditures and working capital requirements for at least the next twelve months. Our current business plans support these operating needs, including our scheduled repayments of debt in accordance with the terms of those agreements. However, future operating performance is subject to prevailing economic and competitive conditions and other factors that are uncertain. If the cash flows and other capital resources available to the Company are insufficient to fund our debt and other liquidity needs, the Company may have to take alternative actions that differ from the Company’s current operating plan.
Total interest paid by Innophos, Inc. for all indebtedness for 2009 (excluding the interest paid by Holdings of $5,790), 2008 (excluding the interest paid by Holdings of $6,270) and 2007 (excluding the interest paid by Holdings and Investments Holdings of $9,051) was $18,971, $26,866 and $29,735.
As of December 31, 2009, the Company was in full compliance with all debt covenant requirements.
Interest expense, net consists of the following:
| Year Ended December 31, | ||||||||||||
| 2009 | 2008 | 2007 | ||||||||||
| Interest expense |
$ | 18,863 | 26,899 | $ | 29,574 | |||||||
| Deferred financing cost |
2,641 | 2,363 | 2,773 | |||||||||
| Interest income |
(530 | ) | (1,362 | ) | (825 | ) | ||||||
| Less: amount capitalized for capital projects |
(231 | ) | (331 | ) | (668 | ) | ||||||
| Total interest expense, net |
$ | 20,743 | $ | 27,569 | $ | 30,854 | ||||||
Page 53 of 94
Table of Contents
INNOPHOS, INC. AND SUBSIDIARIES
Notes to Consolidated Financial Statements
(Dollars in thousands, except where otherwise noted)
10. Other Long-Term Liabilities:
Other long-term liabilities consist of the following:
| 2009 | 2008 | |||||
| Environmental liabilities |
$ | 1,100 | 1,100 | |||
| Profit sharing liabilities |
2,350 | 3,106 | ||||
| Deferred income taxes |
22,043 | 21,707 | ||||
| Pension and post retirement liabilities (U.S. and Canada only) |
5,240 | 4,647 | ||||
| Other Liabilities |
7,187 | 5,305 | ||||
| $37,920 | $ | 35,865 | ||||
11. Stockholders’ Equity / Stock-Based Compensation:
Innophos Inc. has 1,000 shares issued and outstanding, which are all owned by Innophos Investments Holdings, Inc. (see corporate structure—page 17). Innophos Investments Holdings, Inc. has 297 shares issued and outstanding, which are all owned by Innophos Holdings, Inc., the parent company of Innophos Investments Holdings, Inc.
Holdings compensation programs include share-based payments. The primary share-based awards and their general terms and conditions currently in effect are as follows:
| • | Restricted stock grants, which entitle the holder to receive, at the end of each vesting term, a specified number of shares of Holdings common stock, and which also entitle the holder to receive dividends paid on such grants throughout the vesting period. |
| • | Stock options, which entitle the holder to purchase, after the end of a vesting term, a specified number of shares of Holdings common stock at an exercise price per share set equal to the market price of Holdings common stock on the date of grant. |
| • | Performance share awards which entitle the holder to receive, at the end of a vesting term, a number of shares of Holdings common stock, within a range of shares from zero to a specified maximum (generally 200%), calculated using a three year future average return on invested capital (i.e. the three year period 2009-2011 for a 2009 award) as defined solely by reference to Holdings own activities. Dividends will accrue over the vesting period and are paid on performance share awards when fully vested. |
| • | Annual stock retainer grants, which entitle independent members of the Board of Directors to receive a number of shares of Holdings common stock equal to a fixed retainer value. |
Since these programs benefit the employees of Innophos, Inc. all amounts have been recorded in our consolidated results.
In 2005 Holdings Board of Directors approved the Innophos Holdings, Inc. 2005 Stock Option Plan, or 2005 Plan. The 2005 Plan provided for grants of qualified and non-qualified stock options with a ten year term. All options vest ratably over an approximate five year term. The 2005 Plan, for all practical purposes, was discontinued with the adoption of the Innophos Holdings, Inc. 2006 Stock Option Plan, or 2006 Plan. The 2006 Plan was adopted as a successor to Holdings 2005 Plan prior to the IPO in November 2006. The 2006 Plan allows for the issuance of up to 1,000,000 shares of Holdings Common Stock under its stock provisions. Subsequently, in June 2009 the stockholders approved Holdings 2009 Long Term Incentive Plan (the 2009 Plan), which effectively replaced the 2006 Plan.
Restricted Stock
In October 2006, Holdings Board of Directors awarded 173,568 shares of restricted Common Stock with a fair value of $2.1 million to certain executive officers of Innophos, Inc. These awards are classified as equity awards and vest over nine quarters in equal installments of 11.11% per quarter beginning January 1, 2007. Declared dividends will accrue on the restricted stock and will vest over the same period. The restricted stock is fully vested as of January 1, 2009 and has converted into an equivalent number of shares of common stock. The related compensation expense is based on the public offering price of $12. The compensation expense is amortized on a straight-line basis over the requisite service period. Holdings recognized approximately $0.9 million of compensation expense in 2008 and 2007, respectively. As of December 31, 2009 all shares have vested. There were 96,428 unvested and 77,140 vested shares granted as of December 31, 2007. As of December 31, 2008, there were 19,288 unvested and 154,280 vested shares granted.
Page 54 of 94
Table of Contents
INNOPHOS, INC. AND SUBSIDIARIES
Notes to Consolidated Financial Statements
(Dollars in thousands, except where otherwise noted)
There were 5,500 restricted shares granted with a fair value of $45 in the first quarter of 2009. These awards are classified as equity awards and vest through no later than January 31, 2011. The related compensation expense is based on the date of grant share price of $8.24. The compensation expense is amortized on a straight-line basis over the requisite vesting period.
Stock Options
In connection with Holdings initial public offering, the historical stock option strips originally granted on April 1, 2005 under the Innophos Holdings, Inc. 2005 Stock Option Plan, or 2005 Plan, were converted, as required under the terms of the 2005 Plan, to 1,116,944 single class common stock options currently outstanding with the same vesting schedule. The exercise price is $2.55 per option. The determination of the fair value of the underlying common stock used to determine the exercise prices for the stock options granted on April 1, 2005 was performed contemporaneously with the issuance of these common stock option grants.
On May 24, 2007 the two independent directors of Holdings were granted a total of 4,424 stock options which were fully vested with an exercise price of $15.37 per share. These grants were reissued options under the 2005 Plan of previously forfeited options. These options are accounted for under the provisions of ASC 718 (formerly SFAS No. 123(R)). The compensation expense to these immediate vesting options was approximately $22.
On October 22, 2007 Holdings granted 287,200 non-qualified stock options at an exercise price of $15.20 per share to certain employees with a fair value of $1.0 million. The non-qualified stock options vest annually over three years with a ten-year term from date of grant.
On December 19, 2007 Holdings granted 2,000 non-qualified stock options to a certain employee at an exercise price of $14.47 per share with a fair value of $7. The non-qualified stock options vest annually over three years with a ten-year term from date of grant.
On April 25, 2008 Holdings granted 248,550 non-qualified stock options at an exercise price of $18.38 per share to certain employees with a fair value of $0.9 million. The non-qualified stock options vest annually over three years with a ten-year term from date of grant.
On May 7, 2009 and June 2, 2009 Holdings granted 84,651 and 136,849 non-qualified stock options with a fair value of $0.5 million and $0.9 million, respectively. The non-qualified stock options vest annually over three years with a ten-year term from date of grant.
Performance Share Awards
On October 22, 2007 Holdings granted 74,650 performance share awards to certain employees with a fair value of $0.9 million. The performance share awards vest at the end of the three year service period with a ten-year term from date of grant. Declared dividends will accrue on the performance shares and will vest over the same period.
On December 19, 2007 Holdings granted 600 performance share awards to a certain employee with a fair value of $8. The performance share awards vest at the end of the three year service period with a ten-year term from date of grant. Declared dividends will accrue on the performance shares and will vest over the same period.
On April 25, 2008 Holdings granted 82,340 performance share awards to certain employees with a fair value of $1.4 million. The performance share awards vest at the end of the three year service period with a ten-year term from date of grant. Declared dividends will accrue on the performance shares and will vest over the same period. During 2008 Holdings revised its estimate of the number of performance shares expected to be earned at the end of the performance periods, as a result of revising its estimate of projected performance, and increased the number of performance shares by 157,590 with an associated fair value of $2.3 million.
Page 55 of 94
Table of Contents
INNOPHOS, INC. AND SUBSIDIARIES
Notes to Consolidated Financial Statements
(Dollars in thousands, except where otherwise noted)
On May 7, 2009 Holdings granted 94,150 performance share awards to certain employees with a fair value of $0.9 million. The performance share awards vest at the end of the three year service period with a ten-year term from date of grant. Declared dividends will accrue on the performance shares and will vest over the same period. In the third quarter of 2009 Holdings revised its estimate of the number of performance shares expected to be earned at the end of the performance period, as a result of revising its estimate of projected performance, and increased the number of performance shares by 94,150 with an associated fair value of $1.4 million.
On October 30, 2009 Holdings granted 2,067 performance share awards to certain employees with a fair value of less than $0.1 million. The performance share awards vest at the end of the three year service period with a ten-year term from date of grant. Declared dividends will accrue on the performance shares and will vest over the same period. In the fourth quarter of 2009 Holdings revised its estimate of the number of performance shares expected to be earned at the end of the performance period, as a result of revising its estimate of projected performance, and increased the number of performance shares by 2,067 with an associated fair value of less than $0.1 million.
Stock Grants
In December 2008 the five external members of the Board of Directors were each granted 3,349 shares of Holdings common stock with an aggregated fair value of $250,000 which immediately vested as part of their director fees.
In July 2009 the six external members of the Board of Directors were each granted 3,106 shares of Holdings common stock with an aggregated fair value of $0.3 million which immediately vested as part of their director fees.
At December 31, 2009, assuming all performance share grants are at maximum, there were 2.2 million shares available for future grants under Holdings 2009 Plan.
Holdings will continue to account for the outstanding 2005 Plan awards under APB 25, which falls under grandfathered material excluded from the first release of the FASB Codification, until they are settled or modified. All of the awards granted under Holdings 2009 Plan and Holdings 2006 Plan are accounted for under the provisions of ASC 718 (formerly SFAS No. 123(R)). The compensation expense is amortized on a straight-line basis over the requisite service period, adjusted for forfeiture assumptions.
The following table summarizes the components of stock-based compensation expense, all of which has been classified as selling, general and administrative expense:
| Year Ended December 31, | |||||||||
| 2009 | 2008 | 2007 | |||||||
| Stock options |
$ | 937 | $ | 644 | $ | 91 | |||
| Restricted stock |
20 | 926 | 926 | ||||||
| Performance shares |
2,110 | 1,647 | 60 | ||||||
| Stock grants |
300 | 250 | — | ||||||
| Total stock-based compensation expense |
$ | 3,367 | $ | 3,467 | $ | 1,077 | |||
Page 56 of 94
Table of Contents
INNOPHOS, INC. AND SUBSIDIARIES
Notes to Consolidated Financial Statements
(Dollars in thousands, except where otherwise noted)
A summary of stock option activity during the three years ended December 31, 2009, is presented below:
| Number of Options |
Weighted Average Exercise Price | |||||
| Outstanding at January 1, 2007 |
1,116,943 | $ | 2.55 | |||
| Granted |
293,624 | 15.20 | ||||
| Forfeited |
(65,649 | ) | 2.55 | |||
| Exercised |
(422,860 | ) | 2.55 | |||
| Outstanding at December 31, 2007 |
922,058 | $ | 6.58 | |||
| Exercisable at December 31, 2007 |
389,526 | $ | 2.70 | |||
| Outstanding at January 1, 2008 |
922,058 | $ | 6.58 | |||
| Granted |
248,550 | 18.38 | ||||
| Forfeited |
(351 | ) | 15.20 | |||
| Exercised |
(207,763 | ) | 2.62 | |||
| Outstanding at December 31, 2008 |
962,494 | $ | 10.48 | |||
| Exercisable at December 31, 2008 |
484,323 | $ | 5.53 | |||
| Outstanding at January 1, 2009 |
962,494 | $ | 10.48 | |||
| Granted |
221,500 | 14.57 | ||||
| Forfeited |
(46,503 | ) | 16.77 | |||
| Exercised |
(218,405 | ) | 3.12 | |||
| Outstanding at December 31, 2009 |
919,086 | $ | 12.89 | |||
| Exercisable at December 31, 2009 |
473,716 | $ | 10.10 | |||
The fair value of the options granted during 2009, 2008 and 2007 was determined using the Black-Scholes option-pricing model. The assumptions used in the Black-Scholes option-pricing model were as follows:
| Non-qualified stock options |
Year Ended December 31, 2009 |
Year Ended December 31, 2008 |
Year Ended December 31, 2007 |
|||||||||
| Expected volatility |
61.4 | % | 36.8 | % | 36.8 | % | ||||||
| Dividend yield |
5.0 | % | 4.6 | % | 4.5 | % | ||||||
| Risk-free interest rate |
2.7 | % | 3.4 | % | 4.2 | % | ||||||
| Expected term |
6 years | 6 years | 6 years | |||||||||
| Weighted average grant date fair value of stock options |
$ | 6.19 | $ | 4.52 | $ | 3.97 | ||||||
Prior to 2009, since Innophos Holdings, Inc. was a newly public entity and has limited historical data on the price of its publicly traded shares, the expected volatility for the valuation of its stock options and performance shares was based on peer group historical volatility data equaling the expected term. In 2009, Holdings had chosen a blended volatility which consists of 50% historical volatility average of the peer group and 50% historical volatility of Holdings. The increase in the expected volatility in 2009 versus prior periods is a result of broader market conditions. The expected term for the stock options is based on the simplified method since Holdings has limited data on the exercises of stock options. These stock options qualify as “plain vanilla” stock options. The dividend yield is the expected annual dividend payments divided by the average stock price up to the date of grant. The risk-free interest rates are derived from the U.S. Treasury securities in effect on the date of grant whose maturity period equals the options expected term. Holdings applies an expected forfeiture rate to stock-based compensation expense. The estimate of the forfeiture rate is based primarily upon historical experience of employee turnover. As actual forfeitures become known, stock-based compensation expense is adjusted accordingly.
Page 57 of 94
Table of Contents
INNOPHOS, INC. AND SUBSIDIARIES
Notes to Consolidated Financial Statements
(Dollars in thousands, except where otherwise noted)
A summary of performance share activity is presented below:
| Number of Shares |
Weighted Average Grant Date Fair Value | |||||
| Outstanding at January 1, 2007 |
— | $ | — | |||
| Granted |
75,250 | 13.28 | ||||
| Forfeited |
— | — | ||||
| Vested |
— | — | ||||
| Outstanding at December 31, 2007 |
75,250 | $ | 13.28 | |||
| Outstanding at January 1, 2008 |
75,250 | $ | 13.28 | |||
| Granted (at targeted return on invested capital) |
82,340 | 18.38 | ||||
| Forfeited |
— | — | ||||
| Vested |
— | — | ||||
| Adjustment to estimate of shares to be earned |
157,590 | 15.95 | ||||
| Outstanding at December 31, 2008 |
315,180 | $ | 15.95 | |||
| Outstanding at January 1, 2009 |
315,180 | $ | 15.95 | |||
| Granted (at targeted return on invested capital) |
96,217 | 14.67 | ||||
| Forfeited |
(28,000 | ) | 16.02 | |||
| Vested |
— | — | ||||
| Adjustment to estimate of shares to be earned |
96,217 | 14.67 | ||||
| Outstanding at December 31, 2009 |
479,614 | $ | 15.43 | |||
The total intrinsic value of options exercised and stock grants during 2009, 2008 and 2007 was $2.7 million, $5.1 million and $5.2 million, respectively. The aggregate intrinsic value of stock options outstanding and exercisable at December 31, 2009 was $12.9 million and $6.1 million, respectively. The total remaining unrecognized compensation expense related to share-based payments is as follows:
| Unrecognized Compensation Expense |
Restricted Stock |
Stock Options |
Performance Based | ||||||
| Amount |
$ | 26 | $ | 1,987 | $ | 3,602 | |||
| Weighted-average years to be recognized |
2.2 years | 1.6 years | 1.6 years | ||||||
12. Pension Plans and Postretirement Benefits:
Innophos maintains both noncontributory defined benefit pension plans and defined contribution plans that together cover substantially all U.S. and Canadian employees.
In the United States, salaried and hourly employees are covered by a defined contribution plan with a 401(k) feature. The plan provides for employee contributions, company matching contributions, and an age-weighted annual company contribution to eligible employees. Union-represented hourly employees, at our Nashville site, are covered by a traditional defined benefit plan providing benefits based on years of service and final average pay. On April 26, 2007, the Company and the Union for the hourly employees at our Nashville facility agreed that it would freeze its defined benefit pension plan (the “Plan”) as of August 1, 2007. The accrual of additional benefits or increase in the current level of benefits under the Plan ceased as of August 1, 2007, after which the Nashville union employees now participate in the Company’s existing non contributory defined contribution benefit plan. All plans were established by Innophos in 2004.
In Canada, salaried employees are covered by defined contribution plans which provide for company contributions as a percent of pay, employee contributions, and company matching contributions. Union-represented hourly employees are
Page 58 of 94
Table of Contents
INNOPHOS, INC. AND SUBSIDIARIES
Notes to Consolidated Financial Statements
(Dollars in thousands, except where otherwise noted)
covered by a defined benefit plan providing benefits based on a negotiated benefit level and years of service. The defined contribution plans were established by the Company in 2004; the defined benefit plan for union-represented hourly employees is a continuation of the Rhodia Canada Inc.’s pension plan for its Port Maitland union employees, which was included in the acquisition of the Phosphates Business from Rhodia on August 13, 2004.
Innophos also has other postretirement benefit plans covering substantially all of its U.S. and Canadian employees. Certain employee groups covered under the plans do not receive benefits post-age 65. In the United States, the health care plans are contributory with participants’ contributions adjusted annually, and limits on the company’s share of the costs; the life insurance plans are noncontributory. The effects of the Medicare Prescription Drug, Improvement and Modernization Act of 2003, or the Act, are not significant. In Canada, the plans are non-contributory.
Innophos uses a December 31 measurement date for all of its plans. For the purposes of the following schedules, beginning of the year is January 1.
The weighted average discount rate at the measurement dates for the Company’s defined benefit pension plans and the post-retirement benefit plans is developed using a spot interest yield curve based upon a broad population of corporate bonds rated AA or higher, adjusted to match the duration of each plan’s projected benefit payment stream.
The expected return is based on a specific asset mix, active management, rebalancing among diversified asset classes within the portfolio, and a consistent underlying inflation assumption to calculate the appropriate long-term expected investment return.
As a sensitivity measure, the effect of a 25 basis-point decrease in our discount rate assumption would increase our net periodic benefit cost for our pension and post-retirement plans by approximately $60. A 1% decrease in our expected rate of return on plan assets would increase our pension plan expense by $135.
The amounts in accumulated other comprehensive income (loss), or AOCI, for all plans that are expected to be amortized as components of net periodic benefit cost (benefit) during 2010 are as follows:
| Pension | Other Benefits |
Total | ||||||||
| Prior Service Cost |
$ | 93 | $ | 261 | $ | 354 | ||||
| Net Actuarial Loss/(Gain) |
87 | (58 | ) | 29 | ||||||
| Transition Obligation |
— | 27 | 27 | |||||||
The changes in benefit obligations recognized in other comprehensive loss during 2009 and 2008 are as follows:
| Pension Benefits | Other Benefits | Total | ||||||||||||||||||||||
| 2009 | 2008 | 2009 | 2008 | 2009 | 2008 | |||||||||||||||||||
| Change in accumulated other comprehensive income |
||||||||||||||||||||||||
| Amortization of net gain |
$ | (75 | ) | $ | (28 | ) | $ | 90 | $ | 109 | $ | 15 | $ | 81 | ||||||||||
| Amortization of prior service cost |
(93 | ) | — | (289 | ) | (289 | ) | (382 | ) | (289 | ) | |||||||||||||
| Prior service cost arising during period from amendments |
— | 259 | — | (30 | ) | — | 229 | |||||||||||||||||
| Net loss arising during period |
504 | (5 | ) | 198 | (120 | ) | 702 | (125 | ) | |||||||||||||||
| Total change in accumulated other comprehensive income |
336 | 226 | (1 | ) | (330 | ) | 335 | (104 | ) | |||||||||||||||
| Deferred taxes |
(114 | ) | 1 | 6 | (144 | ) | (108 | ) | (143 | ) | ||||||||||||||
| Net amount recognized |
$ | 222 | $ | 227 | $ | 5 | $ | (474 | ) | $ | 227 | $ | (247 | ) | ||||||||||
U.S. Plans
On April 26, 2007, the Company and the Union for the hourly employees at our Nashville facility agreed that it would freeze its defined benefit pension plan (the “Plan”) as of August 1, 2007. The accrual of additional benefits or increase in the current level of benefits under the Plan will cease as of August 1, 2007, after which the Nashville union employees will
Page 59 of 94
Table of Contents
INNOPHOS, INC. AND SUBSIDIARIES
Notes to Consolidated Financial Statements
(Dollars in thousands, except where otherwise noted)
participate in the Company’s existing non contributory defined contribution benefit plan. As of January 1, 2007, Plan assets were less than the projected benefit obligation. Freezing of the Plan was accounted for as a curtailment under ASC 715 (formerly SFAS No. 88), Compensation – Retirement Benefits. The Company remeasured the pension obligation during the three months ended June 30, 2007 and as a result, reduced the projected benefit obligation by $1.2 million and recognized $1.4 million largely attributable to the recognition of prior service cost, resulting in a net curtailment loss of $0.2 million to earnings.
Obligations and Funded Status—U.S. Plans
At December 31
| Pension Benefits | Other Benefits | |||||||||||||||
| 2009 | 2008 | 2009 | 2008 | |||||||||||||
| Accumulated benefit obligation |
$ | 1,928 | $ | 1,898 | $ | 3,402 | $ | 2,992 | ||||||||
| Change in Projected Benefit Obligation |
||||||||||||||||
| Projected Benefit Obligation at Beginning of Year |
$ | 1,898 | $ | 1,915 | $ | 2,992 | $ | 2,589 | ||||||||
| Service cost |
— | — | 342 | 323 | ||||||||||||
| Interest cost |
104 | 100 | 161 | 142 | ||||||||||||
| Actuarial (Gain)/Loss |
(64 | ) | (112 | ) | (36 | ) | (14 | ) | ||||||||
| Actual Benefits Paid |
(10 | ) | (5 | ) | (57 | ) | (48 | ) | ||||||||
| Plan Amendments |
— | — | — | — | ||||||||||||
| Projected Benefit Obligation at End of Year |
$ | 1,928 | $ | 1,898 | $ | 3,402 | $ | 2,992 | ||||||||
| Change in Plan Assets |
||||||||||||||||
| Fair Value of Trust Assets at Beginning of Year |
$ | 982 | $ | 1,184 | $ | — | $ | — | ||||||||
| Actual Return on Plan Assets |
130 | (295 | ) | — | — | |||||||||||
| Employer Contributions |
83 | 98 | 57 | 48 | ||||||||||||
| Actual Benefits Paid |
(10 | ) | (5 | ) | (57 | ) | (48 | ) | ||||||||
| Fair Value of Trust Assets at End of Year |
$ | 1,185 | $ | 982 | $ | — | $ | — | ||||||||
| Funded Status of the Plan |
$ | (743 | ) | $ | (916 | ) | $ | (3,402 | ) | $ | (2,992 | ) | ||||
| Amounts Recognized in the Consolidated Balance Sheets |
||||||||||||||||
| Noncurrent Assets |
$ | — | $ | — | $ | — | $ | — | ||||||||
| Current Liabilities |
— | — | (119 | ) | (87 | ) | ||||||||||
| Noncurrent Liabilities |
(743 | ) | (916 | ) | (3,283 | ) | (2,905 | ) | ||||||||
| Net Amounts Recognized |
$ | (743 | ) | $ | (916 | ) | $ | (3,402 | ) | $ | (2,992 | ) | ||||
| Amounts Recognized in Accumulated Other Comprehensive Income |
||||||||||||||||
| Net Transition (Asset)/Obligation |
$ | — | $ | — | $ | — | $ | — | ||||||||
| Prior Service Cost/(Credit) |
— | — | 1,311 | 1,573 | ||||||||||||
| Net Actuarial (Gain)/Loss |
8 | 86 | (981 | ) | (1,039 | ) | ||||||||||
| Total Amount Recognized |
$ | 8 | $ | 86 | $ | 330 | $ | 534 | ||||||||
| Deferred Taxes |
(3 | ) | (33 | ) | (127 | ) | (205 | ) | ||||||||
| Net Amount Recognized |
5 | 53 | 203 | 329 | ||||||||||||
Page 60 of 94
Table of Contents
INNOPHOS, INC. AND SUBSIDIARIES
Notes to Consolidated Financial Statements
(Dollars in thousands, except where otherwise noted)
| Pension Benefits | Other Benefits | |||||||||||||||||||||||
| 2009 | 2008 | 2007 | 2009 | 2008 | 2007 | |||||||||||||||||||
| Components of Net Periodic Benefit Cost |
||||||||||||||||||||||||
| Service cost |
$ | — | $ | — | $ | 201 | $ | 342 | $ | 323 | $ | 311 | ||||||||||||
| Interest cost |
104 | 100 | 134 | 161 | 142 | 126 | ||||||||||||||||||
| Expected Return on Assets |
(109 | ) | (100 | ) | (61 | ) | — | — | — | |||||||||||||||
| Amortization of |
||||||||||||||||||||||||
| Prior Service Cost |
— | — | 43 | 262 | 261 | 262 | ||||||||||||||||||
| Actuarial (Gain)/Loss |
(7 | ) | (41 | ) | 2 | (95 | ) | (115 | ) | (115 | ) | |||||||||||||
| Curtailment Expense |
— | — | 203 | — | — | — | ||||||||||||||||||
| Net Periodic Cost |
$ | (12 | ) | $ | (41 | ) | $ | 522 | $ | 670 | $ | 611 | $ | 584 | ||||||||||
| Weighted Average Assumptions for Balance Sheet Liability at End of Year |
||||||||||||||||||||||||
| Discount Rate |
5.50 | % | 5.50 | % | 6.00 | % | 5.50 | % | 5.50 | % | 5.75 | % | ||||||||||||
| Expected Long-Term Rate of Return |
8.00 | % | 8.00 | % | 8.00 | % | NA | NA | NA | |||||||||||||||
| Rate of Compensation Increase |
NA | NA | NA | 3.00 | % | 3.00 | % | 3.00 | % | |||||||||||||||
| Weighted Average Assumptions for Net Periodic Benefit Cost at End of Year |
||||||||||||||||||||||||
| Discount Rate |
5.50 | % | 6.00 | % | 5.75 | % | 5.50 | % | 5.75 | % | 5.75 | % | ||||||||||||
| Expected Long-Term Rate of Return |
8.00 | % | 8.00 | % | 8.00 | % | NA | NA | NA | |||||||||||||||
| Rate of Compensation Increase |
NA | NA | 3.00 | % | 3.00 | % | 3.00 | % | 3.00 | % | ||||||||||||||
| Pension Benefits |
Other Benefits |
|||||||||||||||||||||||
| Estimated Future Benefit Payments |
||||||||||||||||||||||||
| Fiscal 2010 |
$ | 38 | $ | 119 | ||||||||||||||||||||
| Fiscal 2011 |
50 | 159 | ||||||||||||||||||||||
| Fiscal 2012 |
65 | 206 | ||||||||||||||||||||||
| Fiscal 2013 |
79 | 250 | ||||||||||||||||||||||
| Fiscal 2014 |
91 | 288 | ||||||||||||||||||||||
| Fiscal Years 2015-2019 |
632 | 2,054 | ||||||||||||||||||||||
Innophos expects to contribute approximately $0.1 million to its U.S. defined benefit pension plan in 2010.
There are no estimated net actuarial gain, prior service cost, or transition obligation (asset) for all defined benefit pension plans that will be amortized from accumulated other comprehensive income into net periodic benefit cost during the 2010 fiscal year.
The estimated actuarial gain, prior service cost, and transition obligation (asset) for the postretirement plan that will be amortized from accumulated other comprehensive income into net periodic benefit cost during the 2010 fiscal year are ($78), $261 and $0, respectively.
Assumed health care cost trend rates on the U.S. plans do not have a significant effect on the amounts reported for the health care plans as a result of limits on the Company’s share of the cost.
Page 61 of 94
Table of Contents
INNOPHOS, INC. AND SUBSIDIARIES
Notes to Consolidated Financial Statements
(Dollars in thousands, except where otherwise noted)
Plan Assets
As of December 31, 2009 the Innophos, Inc. Pension Investment Committee was in the process of formalizing an investment policy designed to achieve long-term objectives of return, while mitigating against downside risk and considering expected cash flow. Innophos, Inc.’s pension plan invests in mutual funds and commercial paper and the weighted-average asset allocations at December 31, 2009 and 2008 by asset category are as follows:
| Plan Assets at December 31 |
||||||
| 2009 | 2008 | |||||
| Asset Category |
||||||
| Equity securities |
35.8 | % | 59.9 | % | ||
| Fixed income securities |
61.5 | 40.1 | ||||
| Other |
2.7 | 0.0 | ||||
| Total |
100.0 | % | 100.0 | % | ||
The fair values of Innophos, Inc.’s pension plan assets at December 31, 2009 by asset category are as follows:
| Total | Level 1 | Level 2 | Level 3 | |||||||||
| Equity securities |
$ | 424 | $ | 424 | $ | — | $ | — | ||||
| Fixed income securities |
729 | 729 | — | — | ||||||||
| Other |
32 | 32 | — | — | ||||||||
| $ | 1,185 | $ | 1,185 | $ | — | $ | — | |||||
Defined Contribution Plan—U.S.
Innophos Inc.’s expense for the defined contribution plan was $2.7 million, $2.9 million and $2.2 million for 2009, 2008 and 2007, respectively.
Page 62 of 94
Table of Contents
INNOPHOS, INC. AND SUBSIDIARIES
Notes to Consolidated Financial Statements
(Dollars in thousands, except where otherwise noted)
Canadian Plans
Obligations and Funded Status—Canadian Plans at December 31
| Pension Benefits | Other Benefits | |||||||||||||||
| 2009 | 2008 | 2009 | 2008 | |||||||||||||
| Accumulated benefit obligation |
$ | 8,175 | $ | 5,852 | $ | 1,254 | $ | 853 | ||||||||
| Projected Change in Benefit Obligation |
||||||||||||||||
| Projected Benefit Obligation at Beginning of Year |
$ | 5,852 | $ | 8,543 | $ | 853 | $ | 998 | ||||||||
| Service cost |
157 | 218 | 40 | 55 | ||||||||||||
| Interest cost |
473 | 446 | 71 | 54 | ||||||||||||
| Plan Amendments |
— | 299 | — | (35 | ) | |||||||||||
| Actuarial (Gain)/Loss |
915 | (1,971 | ) | 158 | (3 | ) | ||||||||||
| Actual Benefits Paid |
(301 | ) | (292 | ) | (29 | ) | (28 | ) | ||||||||
| Exchange Rate Changes |
1,079 | (1,391 | ) | 161 | (188 | ) | ||||||||||
| Projected Benefit Obligation at End of Year |
$ | 8,175 | $ | 5,852 | $ | 1,254 | $ | 853 | ||||||||
| Change in Plan Assets |
||||||||||||||||
| Fair Value of Trust Assets at Beginning of Year |
$ | 6,837 | $ | 9,017 | $ | — | $ | — | ||||||||
| Actual Return on Plan Assets |
1,353 | (1,452 | ) | — | — | |||||||||||
| Employer Contributions |
1,637 | 1,132 | 29 | 28 | ||||||||||||
| Actual Benefits Paid |
(301 | ) | (292 | ) | (29 | ) | (28 | ) | ||||||||
| Exchange Rate Changes |
1,415 | (1,568 | ) | — | — | |||||||||||
| Fair Value of Trust Assets at End of Year |
$ | 10,941 | $ | 6,837 | $ | — | $ | — | ||||||||
| Funded Status of the Plan |
$ | 2,766 | $ | 984 | $ | (1,254 | ) | $ | (853 | ) | ||||||
| Amounts Recognized in the Consolidated Balance Sheets |
||||||||||||||||
| Noncurrent Assets |
$ | 2,766 | $ | 984 | $ | — | $ | — | ||||||||
| Current Liabilities |
— | — | (40 | ) | (27 | ) | ||||||||||
| Noncurrent Liabilities |
— | — | (1,214 | ) | (826 | ) | ||||||||||
| Net Amounts Recognized |
$ | 2,766 | $ | 984 | $ | (1,254 | ) | $ | (853 | ) | ||||||
| Amounts Recognized in Accumulated Other Comprehensive Income |
||||||||||||||||
| Net Transition (Asset)/Obligation |
$ | — | $ | — | $ | 277 | $ | 263 | ||||||||
| Prior Service Cost/(Credit) |
201 | 258 | — | — | ||||||||||||
| Net Actuarial (Gain)/Loss |
2,344 | 1,873 | 319 | 131 | ||||||||||||
| Total Amount Recognized |
$ | 2,545 | $ | 2,131 | $ | 596 | $ | 394 | ||||||||
| Deferred Taxes |
(890 | ) | (746 | ) | (209 | ) | (138 | ) | ||||||||
| Net Amount Recognized |
1,655 | 1,385 | 387 | 256 | ||||||||||||
Page 63 of 94
Table of Contents
INNOPHOS, INC. AND SUBSIDIARIES
Notes to Consolidated Financial Statements
(Dollars in thousands, except where otherwise noted)
| Pension Benefits | Other Benefits | |||||||||||||||||||||||
| 2009 | 2008 | 2007 | 2009 | 2008 | 2007 | |||||||||||||||||||
| Components of Net Periodic Benefit Cost |
||||||||||||||||||||||||
| Service cost |
$ | 157 | $ | 218 | $ | 230 | $ | 40 | $ | 55 | $ | 55 | ||||||||||||
| Interest cost |
473 | 446 | 420 | 71 | 54 | 49 | ||||||||||||||||||
| Expected Return on Assets |
(667 | ) | (660 | ) | (565 | ) | — | — | — | |||||||||||||||
| Amortization of |
||||||||||||||||||||||||
| Actuarial (Gain)/Loss |
82 | 80 | 49 | 5 | 7 | 13 | ||||||||||||||||||
| Prior Service Cost |
93 | — | — | — | — | — | ||||||||||||||||||
| Net Transition Obligation |
— | — | — | 27 | 33 | 32 | ||||||||||||||||||
| Net Periodic Cost |
$ | 138 | $ | 84 | $ | 134 | $ | 143 | $ | 149 | $ | 149 | ||||||||||||
| Weighted Average Assumptions for Balance Sheet Liability at End of Year |
||||||||||||||||||||||||
| Discount Rate |
6.50 | % | 7.50 | % | 5.50 | % | 6.50 | % | 7.50 | % | 5.50 | % | ||||||||||||
| Rate of Compensation Increase |
NA | NA | NA | NA | NA | NA | ||||||||||||||||||
| Weighted Average Assumptions for Net Periodic Benefit Cost at End of Year |
||||||||||||||||||||||||
| Discount Rate |
7.50 | % | 5.50 | % | 5.25 | % | 7.50 | % | 5.50 | % | 5.25 | % | ||||||||||||
| Expected Long-Term Rate of Return |
7.00 | % | 7.00 | % | 7.00 | % | 0.00 | % | 0.00 | % | 0.00 | % | ||||||||||||
| Rate of Compensation Increase |
NA | NA | NA | NA | NA | NA | ||||||||||||||||||
| Accrued Health Care Cost Trend Rates at End of Year |
||||||||||||||||||||||||
| Health Care Cost Trend Rate Assumed for Next Year (Initial Rate) |
10 | % | 9 | % | 10 | % | ||||||||||||||||||
| Rate to which the Cost Trend Rate is Assumed to Decline (Ultimate Rate) |
5 | % | 5 | % | 5 | % | ||||||||||||||||||
Assumed health care cost trend rates have a significant effect on the amounts reported for the health care plans. A one-percentage-point change in assumed health care cost trend rates would have the following effects:
| Other Benefits | ||||||||
| 2009 | 2008 | |||||||
| Effect of a Change in the Assumed Rate of Increase in Health Benefit Costs |
||||||||
| Effect of a 1% Increase On |
||||||||
| Total of Service Cost and Interest Cost |
$ | 22 | $ | 15 | ||||
| Postretirement Benefit Obligation |
$ | 194 | $ | 131 | ||||
| Effect of a 1% Decrease On |
||||||||
| Total of Service Cost and Interest Cost |
$ | (18 | ) | $ | (12 | ) | ||
The estimated net actuarial loss, prior service cost, and transition obligation (asset) for all defined benefit pension plans that will be amortized from accumulated other comprehensive income into net periodic benefit cost during the 2010 fiscal year are $91, $93 and $0, respectively.
The estimated actuarial loss, prior service cost, and transition obligation (asset) for the postretirement plan that will be amortized from accumulated other comprehensive income into net periodic benefit cost during the 2010 fiscal year are $20, $0 and $27, respectively.
Page 64 of 94
Table of Contents
INNOPHOS, INC. AND SUBSIDIARIES
Notes to Consolidated Financial Statements
(Dollars in thousands, except where otherwise noted)
Plan Assets
Innophos Canada Inc.’s pension plan invests in mutual funds and the weighted-average asset allocations at December 31, 2009 and 2008 by asset category are as follows:
| 2009 | 2008 | |||||
| Asset Category |
||||||
| Equity securities |
57.6 | % | 55.7 | % | ||
| Fixed income securities |
41.7 | 40.1 | ||||
| Other |
0.7 | 4.2 | ||||
| Total |
100 | % | 100 | % | ||
The fair values of Innophos Canada, Inc.’s pension plan assets at December 31, 2009 by asset category are as follows:
| Total | Level 1 | Level 2 | Level 3 | |||||||||
| Equity securities |
$ | 6,298 | $ | 6,298 | $ | — | $ | — | ||||
| Fixed income securities |
4,566 | 4,566 | — | — | ||||||||
| Other |
77 | 77 | — | — | ||||||||
| $ | 10,941 | $ | 10,941 | $ | — | $ | — | |||||
The Pension Committee has promulgated a Statement of Investment Policies and Procedures based on the “prudent person portfolio approach” to ensure investment and administration of the assets of the Plan within the parameters set out in the Ontario Pension Benefits Act and the Regulations hereunder. Investment managers appointed by the Plan are directed to achieve a satisfactory return through a diversified portfolio consistent with acceptable risks and prudent management. In accordance with the investment and risk philosophy of the Committee, a target asset mix of 60% equities and 40% fixed income instruments has been established. Investment weightings and results are tested regularly against appropriate benchmark portfolios.
Cash Flows
Contributions
Innophos Canada, Inc. contributed $1.7 million to its pension plan in 2009.
Estimated Future Benefit Payments
The following benefit payments, which reflect expected future service, as appropriate, are expected to be paid:
| Pension Benefits |
Other Benefits | |||||
| Estimated Future Benefit Payments |
||||||
| Fiscal 2010 |
$ | 340 | $ | 40 | ||
| Fiscal 2011 |
396 | 37 | ||||
| Fiscal 2012 |
427 | 37 | ||||
| Fiscal 2013 |
453 | 43 | ||||
| Fiscal 2014 |
466 | 57 | ||||
Innophos plans to contribute approximately $1.0 million to its Canadian pension plan in 2010.
Defined Contribution Plans—Canada
Innophos Canada Inc.’s expense for the defined contribution plans was approximately $0.1 million for 2009, 2008 and 2007, respectively.
Mexico
In accordance with Mexican labor law, a Mexican employee is entitled to certain post employment payments after reaching fifteen years of service. In addition, Mexican employees also participate in a statutory profit sharing program based on 10% of adjusted taxable income. For 2009, 2008 and 2007, Innophos Fosfatados de Mexico, S.A. de C.V., recorded provisions of zero, $4,546 and $2,135, respectively, for these liabilities.
Page 65 of 94
Table of Contents
INNOPHOS, INC. AND SUBSIDIARIES
Notes to Consolidated Financial Statements
(Dollars in thousands, except where otherwise noted)
13. Income Taxes:
A reconciliation of the U.S. statutory rate and income taxes follows:
| Year Ended December 31, | ||||||||||||||||||||||
| 2009 | 2008 | 2007 | ||||||||||||||||||||
| Income before income taxes |
Income tax expense/ (benefit) |
Income before income taxes |
Income tax expense/ (benefit) |
Income (loss) before income taxes |
Income tax expense/ (benefit) |
|||||||||||||||||
| US |
$ | 92,405 | $ | 33,685 | $ | 87,042 | $ | 20,854 | $ | (18,012 | ) | $ | 293 | |||||||||
| Canada/Mexico |
14,519 | 7,812 | 182,201 | 51,280 | 35,412 | 11,603 | ||||||||||||||||
| Total |
$ | 106,924 | $ | 41,497 | $ | 269,243 | $ | 72,134 | $ | 17,400 | $ | 11,896 | ||||||||||
| Current income taxes |
$ | 47,159 | $ | 74,056 | $ | 13,703 | ||||||||||||||||
| Deferred income taxes |
(5,662 | ) | (1,922 | ) | (1,807 | ) | ||||||||||||||||
| Total |
$ | 41,497 | $ | 72,134 | $ | 11,896 | ||||||||||||||||
| Year Ended December 31, | ||||||||||||
| 2009 | 2008 | 2007 | ||||||||||
| Income tax expense at the U.S. statutory rate |
$ | 37,424 | $ | 94,236 | $ | 6,091 | ||||||
| State income taxes (net of federal tax effect and State valuation allowance |
3,182 | 851 | 90 | |||||||||
| Foreign tax rate differential |
3,041 | (12,314 | ) | (504 | ) | |||||||
| Change in Federal U.S. valuation allowance |
— | (9,933 | ) | 6,412 | ||||||||
| Non-deductible permanent items |
(2,150 | ) | (706 | ) | (193 | ) | ||||||
| Provision for income taxes |
$ | 41,497 | $ | 72,134 | $ | 11,896 | ||||||
Net deferred tax assets were reflected on the consolidated balance sheets as follows:
| Year Ended December 31, | ||||||||
| 2009 | 2008 | |||||||
| Net current deferred tax assets |
$ | 11,792 | $ | 6,580 | ||||
| Net noncurrent deferred tax assets |
1,409 | 512 | ||||||
| Net current deferred tax liabilities |
— | — | ||||||
| Net noncurrent deferred tax liabilities |
(22,044 | ) | (21,707 | ) | ||||
| Net deferred tax liabilities |
$ | (8,843 | ) | $ | (14,615 | ) | ||
Page 66 of 94
Table of Contents
INNOPHOS, INC. AND SUBSIDIARIES
Notes to Consolidated Financial Statements
(Dollars in thousands, except where otherwise noted)
The components of the Company’s deferred tax assets/ (liabilities) were as follows:
| Year Ended December 31, | ||||||||
| 2009 | 2008 | |||||||
| Deferred tax assets: |
||||||||
| Inventories |
$ | 4,536 | $ | 2,345 | ||||
| Accrued liabilities |
12,229 | 8,429 | ||||||
| Intangibles |
— | 1 | ||||||
| Tax losses |
854 | 1,248 | ||||||
| Total deferred tax assets |
17,619 | 12,023 | ||||||
| Deferred tax liabilities: |
||||||||
| Intangibles |
(519 | ) | — | |||||
| Fixed assets |
(25,511 | ) | (26,487 | ) | ||||
| Total deferred tax liabilities |
(26,030 | ) | (26,487 | ) | ||||
| Total valuation allowances |
(432 | ) | (151 | ) | ||||
| Net deferred tax liabilities |
$ | (8,843 | ) | $ | (14,615 | ) | ||
The Company realized tax benefits of $495 from stock options exercised during 2009.
As of December 31, 2008, the U.S. operations no longer had cumulative losses and, after consideration of the positive and negative evidence including the sustainability of the positive earnings trend, the Company concluded that it was more likely than not that the net deferred tax assets will be utilized and as a result a $9.9 million benefit from the reversal of valuation allowances mainly as the result of the usage of our net operating loss carryforwards had been recorded. The Company is included in a consolidated U.S. tax return.
For the years ended December 31, 2009, 2008 and 2007, income taxes were not provided on unremitted earnings of $6,707, $130,921 and $23,809, respectively, as these earnings are expected to be permanently reinvested internationally.
In the fourth quarter of 2009, both Mexico and Canada enacted new tax legislation which, among other provisions, modified the future tax rates in those jurisdictions. As a result, the Company recognized, in the income tax provision, the impact of this change in tax rates for its deferred tax assets and liabilities as of December 31, 2009.
The Company does not have any material uncertain income tax positions in accordance with ASC 740-10-25 (formerly FIN 48). If any material uncertain tax positions did arise, the Company’s policy is to accrue associated penalties in selling, general and administrative expenses and to accrue interest as part of net interest expense. All of the tax years since the Company’s inception in 2004 are subject to examination by the Canadian, Mexican and United States revenue authorities. Currently, the Company is under examination, or has been contacted for examination, by certain foreign jurisdictions for its income tax returns for the years 2004 through 2008. As of December 31, 2009, no significant adjustments have been proposed to the Company’s tax positions and the Company currently does not anticipate any adjustments that would result in a material change to its financial position. The Company does not anticipate that total unrecognized tax benefits will significantly change prior to December 31, 2010.
Income taxes paid were $49,705, $64,822 and $7,786 for 2009, 2008 and 2007, respectively.
Page 67 of 94
Table of Contents
INNOPHOS, INC. AND SUBSIDIARIES
Notes to Consolidated Financial Statements
(Dollars in thousands, except where otherwise noted)
14. Commitments and Contingencies:
Leases
Under agreements expiring through 2017, the Company leases railcars and other equipment under various operating leases. Rental expense for 2009, 2008 and 2007 was $5,140, $5,213 and $4,438, respectively. Minimum annual rentals for all operating leases are:
| Year Ending |
Lease Payments | ||
| 2010 |
$ | 4,113 | |
| 2011 |
3,688 | ||
| 2012 |
2,824 | ||
| 2013 |
2,690 | ||
| 2014 |
2,246 | ||
| Thereafter |
2,979 | ||
Purchase Commitments and Supplier Concentration
The Company has two raw material supply contracts, one with an initial term through 2018 with an automatic five-year renewal term at prices established annually based on a formula and the other through 2010. The minimum annual purchase obligations, at current prices, approximates $89.8 million for 2010.
Our business activities depend on long-term or renewable contracts to supply materials or products. In particular, we rely to a significant degree on single-source supply contracts and some of these contractual relationships may be with a relatively limited number of suppliers. Although most of our supplier relationships are typically the result of multiple contractual arrangements of varying terms, in any given year, one or more of these contracts may come up for renewal. In addition, from time to time, we enter into toll manufacturing agreements or other arrangements to produce minimum quantities of product for a certain duration. If we experience delays in delivering contracted production, we may be subject to contractual liabilities to the buyers to whom we have promised the products.
Environmental
The Company’s operations are subject to extensive and changing federal and state environmental laws and regulations. The Company’s manufacturing sites have an extended history of industrial use, and soil and groundwater contamination have or may have occurred in the past and might occur or be discovered in the future.
Environmental efforts are difficult to assess for numerous reasons, including the discovery of new remedial sites, discovery of new information and scarcity of reliable information pertaining to certain sites, improvements in technology, changes in environmental laws and regulations, numerous possible remedial techniques and solutions, difficulty in assessing the involvement of and the financial capability of other potentially responsible parties and the extended time periods over which remediation occurs. Other than the items listed below, the Company is not aware of material environmental liabilities which are probable and estimable. As the Company’s environmental contingencies are more clearly determined, it is reasonably possible that amounts may need to be accrued. However, management does not believe, based on current information, that environmental remediation requirements will have a material impact on the Company’s results of operations, financial position or cash flows.
Under the agreements by which the Company acquired the Phosphates Business and related assets, the Company has certain rights of indemnification from the sellers for breach of representations, warranties, covenants and other agreements. The indemnification rights relating to undisclosed environmental matters are subject to certain substantial limitations and exclusions and expired as of August 13, 2009.
Future environmental spending is probable at our site in Nashville, TN, the eastern portion of which had been used historically as a landfill, and a western parcel previously acquired from a third party, which reportedly had housed, but no longer does, a fertilizer and pesticide manufacturing facility. We have an estimated liability with a range of $0.9-$1.2 million. The remedial action plan has yet to be finalized, and as such, the Company has recorded a liability, which represents the Company’s best estimate, of $1.1 million as of December 31, 2009.
Page 68 of 94
Table of Contents
INNOPHOS, INC. AND SUBSIDIARIES
Notes to Consolidated Financial Statements
(Dollars in thousands, except where otherwise noted)
The U.S. Environmental Protection Agency, or EPA, has indicated that compliance at facilities in the phosphate industry is a high enforcement priority. After several years of expressing various concerns (without issuing any notice of violation) about aspects of our Geismar, LA operations, in March 2008, we received a letter from the Department of Justice, or DOJ, indicating that EPA had referred the case for civil enforcement, contending, among other things, that we do not qualify for certain exemptions we have claimed, and alleging that we violate the Resource Conservation and Recovery Act (RCRA) at Geismar by failing to manage two materials appropriately. Although the letter stated that EPA/DOJ intended to seek unspecified penalties and corrective action, it proposed discussions to explore possible resolution, which we undertook and are pursuing. During the fourth quarter of 2008, the DOJ/EPA demanded that Innophos and its neighboring interconnected supplier, PCS, undertake certain “interim measures” to address DOJ/EPA’s chief environmental concerns. We and PCS have initiated joint technical efforts to explore solutions to the government concerns. Based on our contact with the agencies to date in 2009, we have determined it is probable that one of the process modifications will need to be undertaken in the next several months, and likewise probable that the capital expenditure and future operating expense of that modification will not be material, unless the DOJ adds terms and conditions that could result in the parties not reaching agreement. However, the second measure sought by DOJ/EPA has not yet been fully evaluated from a technological or cost standpoint. The companies have proposed to DOJ/EPA a schedule for such evaluation, and although the government has not formally approved the schedule, the companies are proceeding as proposed. Based upon work so far, there appears to be at least one technically viable approach, but costs of a full scale operation as compared to other approaches are not known at this time. Even though the companies have begun substantial technical work in an attempt to develop a feasible approach to address DOJ/EPA’s concerns, we cannot guarantee that our technical efforts will be successful, whether either party would be willing to implement solutions or, depending on those factors and the agencies’ position, whether this matter will be settled with DOJ/EPA or will require litigation. Should litigation become necessary to defend our operations at Geismar as compliant with environmental laws and regulations, no assurance can be given as to its outcome. We have determined that a contingent liability is neither probable nor estimable at this time, but liability is reasonably possible.
Litigation
OCP Arbitration
In December 2008, Innophos’ Mexican affiliate, Innophos Mexico, initiated binding arbitration with OCP, S.A., or OCP, its sole supplier of phosphate rock for Mexico, concerning pricing terms for 2008 and 2009 under Innophos Mexico’s agreement with that supplier. A panel of three arbitrators sitting in Paris, France under auspices of the International Chamber of Commerce was selected to hear the case, and hearings on the 2008 and 2009 pricing issues were held in November 2009. On February 24, 2010, Innophos Mexico and OCP entered into agreements fully settling the arbitration, resolving disputes concerning 2008 and 2009 prices and quantities of phosphate rock, and agreed upon 2010 prices and quantities for phosphate rock purchases and sales until the existing agreement expires. The terms of the settlement were confidential, and neither OCP nor Innophos Mexico admitted liability, and entered into the settlement solely in order to avoid the costs and burdens of continued arbitration.
The financial impact of the settlement was a $7.1 million pre-tax expense ($5.0 million net of tax) largely recorded in cost of goods sold.
In addition, in connection with the settlement, on February 24, 2010, the parties executed an amendment to their existing 1992 supply agreement.
The major features in the amendment, identified as Addendum No. 13 to the 1992 agreement, are the following terms and conditions:
| • | 2008 and 2009 final prices for phosphate rock are agreed to be the interim prices already paid by Innophos Mexico; |
Page 69 of 94
Table of Contents
INNOPHOS, INC. AND SUBSIDIARIES
Notes to Consolidated Financial Statements
(Dollars in thousands, except where otherwise noted)
| • | 2010 final prices and estimated volumes of phosphate rock (until the end of the 1992 agreement scheduled for September 10, 2010) are set for Innophos Mexico’s Coatzacoalcos, Veracruz, Mexico plant, together with mutual minimum volume commitments for each of the two types of phosphate rock to be supplied; |
| • | Innophos Mexico is afforded an option to extend the 1992 agreement to December 31, 2010, if the option is exercised by July 31, 2010, without additional volume commitments; exclusivity of OCP as a supplier would terminate as of September 10, 2010; |
| • | Innophos Mexico receives an option before September 10, 2010 to purchase limited quantities of third party phosphate rock for testing purposes; and |
| • | The 1992 agreement is revised in a number of other respects, including as to its force majeure provisions, limitations of damages and liquidated damages. |
Mexican CNA Water Tax Claims
Nature and Extent. In November 2004, our Mexican subsidiary, Innophos Fosfatados, or Fosfatados, received notice from the CNA of the Fresh Water Claims relating to water usage at our Coatzacoalcos, Veracruz, Mexico plant. As initially assessed, the claims extended from 1998-2002, but subsequently the 1998 claim was determined to be beyond the applicable statute of limitations. As now assessed, the claims through 2002 total approximately $23.6 million (at current exchange rates as of February 18, 2010), including basic charges of $7.1 million and $16.5 million for interest, inflation and penalties. Management believes that Fosfatados has valid bases for challenging the Fresh Water Claims, and that matter is being defended vigorously.
Rhodia Indemnity Confirmed. As a result of favorably concluded litigation in New York state courts against Rhodia, S.A. and affiliates, or the New York Litigation, concerning their indemnification obligation for CNA claims as “taxes” under the agreement by which we purchased our business from those parties, Innophos is fully indemnified against the Fresh Water Claims, as well as any like claims pertaining to periods prior to the closing date of purchase, August 13, 2004, were such liabilities to be sustained.
Further Proceedings. The Fresh Water Claims are currently pending reconsideration from appeals in the Mexican fiscal court system. On October 29, 2009, the Tax Court on remand ruled unfavorably as to all of Fosfatado’s remaining defenses. On January 10, 2010, Fosfatados appealed the decision of the Tax Court on remand. On January 27, 2010, CNA also filed an appeal challenging the prior decision that the CNA claim as to 1998 is beyond the applicable statute of limitations. The timing of a decision on this round of appeals is not known.
A final determination of the Fresh Water Claims may require further appeals to the Mexican Supreme Court and remands to the CNA or to lower courts, a process that might continue for several years. In the event that the appeals were to be decided against us and Rhodia were then unable to pay on its indemnification obligations, our subsidiary could be required to satisfy a judgment for the entire amount claimed.
Possible Post-2002 Claims. If the CNA Fresh Water Claims were sustained for the period now at issue, it is possible that the CNA would seek to claim similar higher duties, fees and other charges for fresh water extraction and usage from 2005 on into the future (2003 and 2004 are believed to be beyond the statute of limitations), or the Post-2002 Fresh Water Claims. Management estimates that amounts involved would be approximately $5.8 million of additional basic charges to date at current exchange rates, $5.9 million relating to interest, inflation, and penalties, and, under current operating conditions, approximately $0.5 million of additional basic charges per year at current exchange rates. Although not included in our court judgments in the New York Litigation against Rhodia, we believe Rhodia is required to indemnify us fully for post-closing “losses” caused by breaches of covenants set forth in the agreement, which could represent the remainder of the Post-2002 Fresh Water Claims exposure. Rhodia has contested indemnification responsibility for those breaches, but its motion for partial summary judgment to dismiss our claims was denied by the New York trial court in January 2009. It is possible that the New York Litigation will proceed to trial or involve further motions to resolve remaining issues.
Based upon advice of counsel and our review of the CNA Fresh Water Claims and the Post-2002 Fresh Water Claims, the facts and applicable law, management has determined that liability is reasonably possible, but is neither probable nor reasonably estimable. Accordingly, we did not establish a liability on the balance sheet as of December 31, 2009. As additional information is gained, management will reassess the potential liability and establish any loss reserve as appropriate. The ultimate liability amount could be material to our results of operations and financial condition. Furthermore, given Rhodia’s financial condition, we cannot be sure we will ultimately collect amounts due from Rhodia under our indemnification rights, even though they have been confirmed by court judgments.
Page 70 of 94
Table of Contents
INNOPHOS, INC. AND SUBSIDIARIES
Notes to Consolidated Financial Statements
(Dollars in thousands, except where otherwise noted)
Mexican Water Discharge Duties
On August 18, 2009, Fosfatados was served with four resolutions from the CNA seeking water discharge duties, fees and other charges relating to the Company’s Coatzacoalcos, Veracruz, Mexico plant for the period 2002-2005 and amounting to a total of $2.5 million at current exchange rates. The resolutions affirmed that the plant has complied with the relevant parameters in its discharge permits, or CPDs, but asserted that Fosfatados did not meet a different set of discharge standards in general duties tables that limit the discharge of various contaminants and set fees payable for exceeding those limits.
On October 21, 2009, Fosfatados filed an annulment proceeding in the Mexican fiscal court system seeking to void the resolutions. On January 21, 2010, the Tax Court issued resolutions annulling the CNA resolutions. As the time for appeal has elapsed and CNA did not file an appeal, management regards this matter as resolved favorably.
Other Legal Matters
In June 2005, our subsidiary, Innophos Canada, Inc., was contacted by representatives of The Mosaic Company (a division of Cargill Corporation), or Mosaic, seeking a meeting to discuss the status of an ongoing remedial investigation and clean-up Mosaic is conducting at its former fertilizer manufacturing site located north of Innophos’ Pt. Maitland, Ontario Canada plant site. The remediation is being overseen by the Provincial Ministry of Environment, or MOE. Mosaic stated that, in its view, we and Rhodia (our predecessor in interest prior to August 2004) were responsible for some phosphorus compound contamination at a rail yard between the Innophos and Mosaic sites, and will be asked to participate in the clean-up. We have determined that this contingent liability is neither probable nor estimable at this time, but liability is reasonably possible. We have notified Rhodia of the Mosaic claim, and we will seek all appropriate indemnification.
In March 2008, Sudamfos S.A., or Sudamfos, an Argentine phosphate producer, filed a request for arbitration before the ICC International Court of Arbitration, Paris, France, or ICC, of a commercial dispute with Mexicana. Sudamfos claimed Mexicana agreed to sell Sudamfos certain quantities of phosphoric acid for delivery in 2007 and 2008, and sought an order requiring Mexicana to sell approximately 12,500 metric tons during 2008 in accordance with the claimed agreement. Subsequently, Sudamfos withdrew the request for arbitration. In October 2008, Mexicana filed a lawsuit in Mexico against Sudamfos to collect approximately $1.2 million representing the contract price for prior deliveries of acid that Sudamfos had refused to pay. In October 2009, Sudamfos answered the suit and counterclaimed for $3.0 million based upon the agreement alleged in the arbitration request to sell additional acid, which agreement Mexicana denies. Management has determined that the outstanding receivable is fully collectible, and that the contingent liability from the Sudamfos counterclaim is remote, and therefore no accrual is required.
In addition, we are party to legal proceedings and contractual disputes that arise in the ordinary course of our business. Except as to the matters specifically discussed, management does not believe that these matters represent probable liabilities. However, these matters cannot be predicted with certainty and an unfavorable resolution of one or more of them could have a material adverse effect on our business, results of operations, financial condition, and/or cash flows.
15. Financial Instruments and Concentration of Credit Risks:
The carrying value of our Senior Subordinated Notes and Holdings Senior Unsecured Notes are $190.0 million and $56.0 million, respectively. The fair values at December 31, 2009 (excluding accrued interest) are approximately $192.9 million and $56.8 million, respectively.
The Company believes that its concentration of credit risk related to trade accounts receivable is limited since these receivables are spread among a number of customers and are geographically dispersed. The ten largest customers accounted for 40%, 40% and 39%, respectively, of net sales for 2009, 2008 and 2007. During 2008 a single customer represented 11% of our sales, otherwise, no other customer accounted for more than 10% of our sales in the last 3 years.
Page 71 of 94
Table of Contents
INNOPHOS, INC. AND SUBSIDIARIES
Notes to Consolidated Financial Statements
(Dollars in thousands, except where otherwise noted)
16. Valuation Allowances:
Valuation allowances as of December 31, 2009, 2008 and 2007, and the changes in the valuation allowances for the year ended December 31, 2009, 2008 and 2007 are as follows:
| Balance, January 1, 2009 |
Charged/ (credited) to costs and expenses |
Deductions (Bad debts) |
(Credited) to Goodwill |
Balance, December 31, 2009 | |||||||||||||
| Deferred taxes valuation allowances |
$ | 151 | $ | 281 | $ | — | $ | — | $ | 432 | |||||||
| Allowance for doubtful accounts |
— | — | — | — | — | ||||||||||||
| Balance, January 1, 2008 |
Charged/ (credited) to costs and expenses |
Deductions (Bad debts) |
(Credited) to Goodwill |
Balance, December 31, 2008 | |||||||||||||
| Deferred taxes valuation allowances |
$ | 10,667 | $ | (10,516 | ) | $ | — | $ | — | $ | 151 | ||||||
| Allowance for doubtful accounts |
— | — | — | — | — | ||||||||||||
| Balance, January 1, 2007 |
Charged/ (credited) to costs and expenses |
Deductions (Bad debts) |
(Credited) to Goodwill |
Balance, December 31, 2007 | |||||||||||||
| Deferred taxes valuation allowances |
$ | 4,409 | $ | 6,258 | $ | — | $ | — | $ | 10,667 | |||||||
| Allowance for doubtful accounts |
1,318 | — | (1,318 | ) | — | — | |||||||||||
17. Segment Reporting:
The company discloses certain financial and supplementary information about its reportable segments, revenue by products and revenues by geographic area. Operating segments are defined as components of an enterprise about which separate discrete financial information is evaluated regularly by the chief operating decision maker, in order to decide how to allocate resources and assess performance. The primary performance indicators for the chief operating decision maker are sales and operating income, with sales on a ship-from basis. The Company reports its operations in three reporting segments—United States, Mexico and Canada, each of which sells the entire portfolio of products.
Page 72 of 94
Table of Contents
INNOPHOS, INC. AND SUBSIDIARIES
Notes to Consolidated Financial Statements
(Dollars in thousands, except where otherwise noted)
| For the year ended December 31, 2009 |
United States | Mexico | Canada | Eliminations | Total | |||||||||||||||
| Sales |
$ | 463,286 | $ | 165,269 | $ | 38,204 | $ | — | $ | 666,759 | ||||||||||
| Intersegment sales |
64,427 | 21,240 | 75,153 | (160,820 | ) | — | ||||||||||||||
| Total sales |
527,713 | 186,509 | 113,357 | (160,820 | ) | 666,759 | ||||||||||||||
| Operating income |
$ | 111,655 | $ | 614 | $ | 14,629 | — | $ | 126,898 | |||||||||||
| Other data |
||||||||||||||||||||
| Capital expenditures |
$ | 13,208 | $ | 5,513 | $ | 888 | $ | — | $ | 19,609 | ||||||||||
| Long-lived assets |
99,844 | 89,585 | 15,098 | — | 204,527 | |||||||||||||||
| Total assets |
860,415 | 260,687 | 297,423 | — | 1,418,525 | |||||||||||||||
| Reconciliation of total assets to reported assets |
||||||||||||||||||||
| Total assets |
$ | 860,415 | $ | 260,687 | $ | 297,423 | $ | — | $ | 1,418,525 | ||||||||||
| Eliminations |
(512,502 | ) | (6,841 | ) | (241,876 | ) | — | (761,219 | ) | |||||||||||
| Reported assets |
$ | 347,913 | $ | 253,846 | $ | 55,547 | $ | — | $ | 657,306 | ||||||||||
| For the year ended December 31, 2008 |
United States | Mexico | Canada | Eliminations | Total | |||||||||||||||
| Sales |
$ | 486,186 | $ | 409,745 | $ | 38,827 | $ | — | $ | 934,758 | ||||||||||
| Intersegment sales |
28,999 | 29,965 | 63,820 | (122,784 | ) | — | ||||||||||||||
| Total sales |
515,185 | 439,710 | 102,647 | (122,784 | ) | 934,758 | ||||||||||||||
| Operating income |
$ | 108,977 | $ | 183,587 | $ | 6,525 | — | $ | 299,089 | |||||||||||
| Other data |
||||||||||||||||||||
| Capital expenditures |
$ | 11,574 | $ | 4,779 | $ | 2,183 | $ | — | $ | 18,536 | ||||||||||
| Long-lived assets |
111,349 | 102,912 | 16,161 | — | 230,422 | |||||||||||||||
| Total assets |
842,885 | 312,297 | 205,398 | — | 1,360,580 | |||||||||||||||
| Reconciliation of total assets to reported assets |
||||||||||||||||||||
| Total assets |
$ | 842,885 | $ | 312,297 | $ | 205,398 | $ | — | $ | 1,360,580 | ||||||||||
| Eliminations |
(473,304 | ) | — | (167,172 | ) | — | (640,476 | ) | ||||||||||||
| Reported assets |
$ | 369,581 | $ | 312,297 | $ | 38,226 | $ | — | $ | 720,104 | ||||||||||
| For the year ended December 31, 2007 |
United States | Mexico | Canada | Eliminations | Total | |||||||||||||||
| Sales |
$ | 326,882 | $ | 222,699 | $ | 29,401 | $ | — | $ | 578,982 | ||||||||||
| Intersegment sales |
26,239 | 24,560 | 57,002 | (107,801 | ) | — | ||||||||||||||
| Total sales |
353,121 | 247,259 | 86,403 | (107,801 | ) | 578,982 | ||||||||||||||
| Operating income |
$ | 3,585 | $ | 39,819 | $ | 4,591 | — | $ | 47,995 | |||||||||||
| Other data |
||||||||||||||||||||
| Capital expenditures |
$ | 7,275 | $ | 18,999 | $ | 2,082 | $ | — | $ | 28,356 | ||||||||||
| Long-lived assets |
125,914 | 118,423 | 16,226 | — | 260,563 | |||||||||||||||
| Total assets |
586,398 | 222,839 | 137,777 | — | 947,014 | |||||||||||||||
| Reconciliation of total assets to reported assets |
||||||||||||||||||||
| Total assets |
$ | 586,398 | $ | 222,839 | $ | 137,777 | $ | — | $ | 947,014 | ||||||||||
| Eliminations |
(301,711 | ) | (902 | ) | (103,329 | ) | — | (405,942 | ) | |||||||||||
| Reported assets |
$ | 284,687 | $ | 221,937 | $ | 34,448 | $ | — | $ | 541,072 | ||||||||||
Page 73 of 94
Table of Contents
INNOPHOS, INC. AND SUBSIDIARIES
Notes to Consolidated Financial Statements
(Dollars in thousands, except where otherwise noted)
| Year Ended December 31, | |||||||||
| Product Revenues |
2009 | 2008 | 2007 | ||||||
| Purified Phosphoric Acid |
$ | 121,328 | $ | 251,656 | $ | 128,882 | |||
| Specialty Salts and Acids |
443,112 | 449,878 | 293,389 | ||||||
| STPP & Other Products |
102,319 | 233,224 | 156,711 | ||||||
| Total |
$ | 666,759 | $ | 934,758 | $ | 578,982 | |||
| Year Ended December 31, | |||||||||
| Geographic Revenues |
2009 | 2008 | 2007 | ||||||
| US |
$ | 385,037 | $ | 451,082 | $ | 303,941 | |||
| Mexico |
144,168 | 250,034 | 131,811 | ||||||
| Canada |
38,258 | 39,669 | 31,109 | ||||||
| Other foreign countries |
99,296 | 193,973 | 112,121 | ||||||
| Total |
$ | 666,759 | $ | 934,758 | $ | 578,982 | |||
Revenues for the geographic information are attributed to geographic areas based on the destination of the sale.
Intersegment sales are recorded based on established transfer price.
Long-lived assets include property, plant and equipment.
The United States had depreciation and amortization of $28.5 million, $30.3 million, and $28.4 million in 2009, 2008, and 2007, respectively. Canada had depreciation and amortization of $2.0 million, $2.2 million, and $1.5 million in 2009, 2008 and 2007, respectively. Mexico had depreciation and amortization of $20.7 million, $20.0 million, and $17.5 million in 2009, 2008, and 2007, respectively.
18. Quarterly information (unaudited):
| 2009 | ||||||||||||||||
| Quarters ended | ||||||||||||||||
| March 31 | June 30 | September 30 | December 31 | Total | ||||||||||||
| Net sales |
$ | 190,817 | $ | 166,766 | $ | 161,934 | $ | 147,242 | $ | 666,759 | ||||||
| Gross profit |
69,793 | 49,395 | 47,730 | 29,061 | (a) | 195,979 | ||||||||||
| Net income |
$ | 31,360 | $ | 16,498 | $ | 16,046 | $ | 6,521 | (a) | $ | 70,425 | |||||
| 2008 | ||||||||||||||||
| Quarters ended | ||||||||||||||||
| March 31 | June 30 | September 30 | December 31 | December 31 | ||||||||||||
| Net sales |
$ | 162,538 | $ | 264,000 | $ | 291,772 | $ | 216,448 | $ | 934,758 | ||||||
| Gross profit |
40,707 | 107,865 | 126,583 | 89,427 | (b) | 364,582 | ||||||||||
| Net income |
$ | 10,914 | $ | 61,233 | $ | 73,595 | $ | 51,367 | (c) | $ | 197,109 | |||||
| (a) | Includes an approximate $7.0 million, $5.0 million after tax, charge for the settlement of the OCP arbitration matter. |
| (b) | Includes a $3.9 million, $2.5 million after tax, out of period benefit for certain adjustments related to deferred Mexican employee statutory profit sharing. |
| (c) | Includes a $14.4 million benefit from the reversal of valuation allowances against U.S. Federal net deferred tax assets mainly as the result of the usage of our net operating loss carryforwards and a $2.5 million after tax out of period benefit related to deferred Mexican employee statutory profit sharing and deferred income taxes. |
Page 74 of 94
Table of Contents
INNOPHOS, INC. AND SUBSIDIARIES
Notes to Consolidated Financial Statements
(Dollars in thousands, except where otherwise noted)
19. Condensed Combining Financial Statements:
The following condensed combined financial data is presented to segregate the assets, liabilities, and results of operations and cash flows of the US operations (the “Guarantors”) and the Canadian and Mexican operations (the “Non-guarantors”). Innophos Inc. has issued debt and the Guarantor subsidiary is a 100% wholly owned subsidiary of Innophos Inc. The Non-guarantors are 100% wholly-owned subsidiaries of the Guarantors. Innophos, Inc. and the Guarantor subsidiary will fully and unconditionally and joint and severally, guarantee the Company’s obligations under the Company’s senior credit facility and Innophos, Inc.’s Senior Subordinated Notes due 2014. Investments in subsidiaries are accounted for by the guarantor using the equity method of accounting. The Non-guarantors are presented on a combined basis. The principal combining adjustments are to eliminate intercompany balances and transactions.
Page 75 of 94
Table of Contents
INNOPHOS, INC. AND SUBSIDIARIES
Notes to Consolidated Financial Statements
(Dollars in thousands, except where otherwise noted)
Condensed Consolidated Balance Sheet
As of December 31, 2009
(In thousands)
| Innophos, Inc. | Guarantor Subsidiary |
Non-Guarantor Subsidiary |
Adjustments and Eliminations |
Total | ||||||||||||
| ASSETS |
||||||||||||||||
| Current assets: |
||||||||||||||||
| Cash and cash equivalents |
$ | 72,079 | $ | 2 | $ | 60,141 | $ | — | $ | 132,222 | ||||||
| Restricted Cash |
— | — | 1,749 | — | 1,749 | |||||||||||
| Accounts receivable, net |
285,306 | — | 264,519 | (493,480 | ) | 56,345 | ||||||||||
| Inventories |
62,552 | — | 51,084 | — | 113,636 | |||||||||||
| Other current assets |
27,395 | — | 18,327 | (84 | ) | 45,638 | ||||||||||
| Total current assets |
447,332 | 2 | 395,820 | (493,564 | ) | 349,590 | ||||||||||
| Property, plant and equipment, net |
99,844 | — | 104,683 | — | 204,527 | |||||||||||
| Goodwill |
7,237 | — | 44,469 | — | 51,706 | |||||||||||
| Investment in subsidiaries |
238,013 | 188,623 | — | (426,636 | ) | — | ||||||||||
| Intercompany notes |
29,642 | — | — | (29,642 | ) | — | ||||||||||
| Intangibles and other assets, net |
38,345 | — | 13,138 | — | 51,483 | |||||||||||
| Total |
$ | 860,413 | $ | 188,625 | $ | 558,110 | $ | (949,842 | ) | $ | 657,306 | |||||
| LIABILITIES AND STOCKHOLDERS’ EQUITY |
||||||||||||||||
| Current liabilities: |
||||||||||||||||
| Current portion of long-term debt |
$ | — | $ | — | $ | — | $ | — | $ | — | ||||||
| Accounts payable, trade and other |
276,150 | — | 249,910 | (493,480 | ) | 32,580 | ||||||||||
| Other current liabilities |
33,149 | — | 21,538 | (84 | ) | 54,603 | ||||||||||
| Total current liabilities |
309,299 | — | 271,448 | (493,564 | ) | 87,183 | ||||||||||
| Long-term debt |
190,000 | — | 29,642 | (29,642 | ) | 190,000 | ||||||||||
| Other long-term liabilities |
18,911 | — | 19,009 | — | 37,920 | |||||||||||
| Total stockholders’ equity |
342,203 | 188,625 | 238,011 | (426,636 | ) | 342,203 | ||||||||||
| Total |
$ | 860,413 | $ | 188,625 | $ | 558,110 | $ | (949,842 | ) | $ | 657,306 | |||||
Page 76 of 94
Table of Contents
INNOPHOS, INC. AND SUBSIDIARIES
Notes to Consolidated Financial Statements
(Dollars in thousands, except where otherwise noted)
Condensed Consolidated Balance Sheet
As of December 31, 2008
(In thousands)
| Innophos, Inc. | Guarantor Subsidiary |
Non-Guarantor Subsidiary |
Adjustments and Eliminations |
Total | ||||||||||||
| ASSETS |
||||||||||||||||
| Current assets: |
||||||||||||||||
| Cash and cash equivalents |
$ | 61,295 | $ | 5 | $ | 63,323 | $ | — | $ | 124,623 | ||||||
| Accounts receivable, net |
214,941 | — | 193,432 | (328,841 | ) | 79,532 | ||||||||||
| Inventories |
71,146 | — | 74,164 | — | 145,310 | |||||||||||
| Other current assets |
22,312 | — | 12,144 | (463 | ) | 33,993 | ||||||||||
| Total current assets |
369,694 | 5 | 343,063 | (329,304 | ) | 383,458 | ||||||||||
| Property, plant and equipment, net |
111,349 | — | 119,073 | — | 230,422 | |||||||||||
| Goodwill |
7,237 | — | 44,469 | — | 51,706 | |||||||||||
| Investment in subsidiaries |
231,709 | 193,120 | — | (424,829 | ) | — | ||||||||||
| Intercompany notes |
79,463 | — | — | (79,463 | ) | — | ||||||||||
| Intangibles and other assets, net |
43,427 | — | 11,091 | — | 54,518 | |||||||||||
| Total |
$ | 842,879 | $ | 193,125 | $ | 517,696 | $ | (833,596 | ) | $ | 720,104 | |||||
| LIABILITIES AND STOCKHOLDERS’ EQUITY |
||||||||||||||||
| Current liabilities: |
||||||||||||||||
| Current portion of long-term debt |
$ | 72,613 | $ | — | $ | — | $ | — | $ | 72,613 | ||||||
| Accounts payable, trade and other |
192,470 | — | 173,047 | (328,841 | ) | 36,676 | ||||||||||
| Other current liabilities |
25,549 | — | 14,146 | (463 | ) | 39,232 | ||||||||||
| Total current liabilities |
290,632 | — | 187,193 | (329,304 | ) | 148,521 | ||||||||||
| Long-term debt |
243,887 | — | 79,463 | (79,463 | ) | 243,887 | ||||||||||
| Other long-term liabilities |
16,529 | — | 19,336 | — | 35,865 | |||||||||||
| Total stockholders’ equity |
291,831 | 193,125 | 231,704 | (424,829 | ) | 291,831 | ||||||||||
| Total |
$ | 842,879 | $ | 193,125 | $ | 517,696 | $ | (833,596 | ) | $ | 720,104 | |||||
Page 77 of 94
Table of Contents
INNOPHOS, INC. AND SUBSIDIARIES
Notes to Consolidated Financial Statements
(Dollars in thousands, except where otherwise noted)
Condensed Consolidated Statements of Operations
For the year ended December 31, 2009
(In thousands)
| Innophos, Inc. | Guarantor Subsidiary |
Non-Guarantor Subsidiary |
Adjustments and Eliminations |
Total | ||||||||||||||||
| Net sales |
$ | 527,712 | $ | — | $ | 299,867 | $ | (160,820 | ) | $ | 666,759 | |||||||||
| Cost of goods sold |
365,653 | — | 265,947 | (160,820 | ) | 470,780 | ||||||||||||||
| Gross profit |
162,059 | — | 33,920 | — | 195,979 | |||||||||||||||
| Operating expenses: |
||||||||||||||||||||
| Selling, general and administrative |
48,462 | 3 | 18,678 | — | 67,143 | |||||||||||||||
| Research & development expenses |
1,938 | — | — | — | 1,938 | |||||||||||||||
| Total operating expenses |
50,400 | 3 | 18,678 | — | 69,081 | |||||||||||||||
| Operating income |
111,659 | (3 | ) | 15,242 | — | 126,898 | ||||||||||||||
| Interest expense, net |
19,285 | — | 1,458 | — | 20,743 | |||||||||||||||
| Foreign exchange gains |
(34 | ) | — | (735 | ) | — | (769 | ) | ||||||||||||
| Other income |
— | — | — | — | — | |||||||||||||||
| Equity (income) loss |
(6,705 | ) | 4,497 | — | 2,208 | — | ||||||||||||||
| Income (loss) before income tax |
99,113 | (4,500 | ) | 14,519 | (2,208 | ) | 106,924 | |||||||||||||
| Provision for income taxes |
33,686 | — | 7,811 | — | 41,497 | |||||||||||||||
| Net income (loss) |
$ | 65,427 | $ | (4,500 | ) | $ | 6,708 | $ | (2,208 | ) | $ | 65,427 | ||||||||
Condensed Consolidated Statements of Operations
For the year ended December 31, 2008
(In thousands)
| Innophos, Inc. | Guarantor Subsidiary |
Non-Guarantor Subsidiary |
Adjustments and Eliminations |
Total | ||||||||||||||||
| Net sales |
$ | 515,185 | $ | — | $ | 542,357 | $ | (122,784 | ) | $ | 934,758 | |||||||||
| Cost of goods sold |
356,013 | — | 336,947 | (122,784 | ) | 570,176 | ||||||||||||||
| Gross profit |
159,172 | — | 205,410 | — | 364,582 | |||||||||||||||
| Operating expenses: |
||||||||||||||||||||
| Selling, general and administrative |
47,883 | 1 | 15,299 | — | 63,183 | |||||||||||||||
| Research & development expenses |
2,310 | — | — | — | 2,310 | |||||||||||||||
| Total operating expenses |
50,193 | 1 | 15,299 | — | 65,493 | |||||||||||||||
| Operating income |
108,979 | (1 | ) | 190,111 | — | 299,089 | ||||||||||||||
| Interest expense, net |
21,706 | — | 5,863 | — | 27,569 | |||||||||||||||
| Foreign exchange losses |
229 | — | 2,434 | — | 2,663 | |||||||||||||||
| Other income |
— | — | (386 | ) | — | (386 | ) | |||||||||||||
| Equity (income) loss |
(130,919 | ) | (127,271 | ) | — | 258,190 | — | |||||||||||||
| Income (loss) before income tax |
217,963 | 127,270 | 182,200 | (258,190 | ) | 269,243 | ||||||||||||||
| Provision for income taxes |
20,854 | — | 51,280 | — | 72,134 | |||||||||||||||
| Net income (loss) |
$ | 197,109 | $ | 127,270 | $ | 130,920 | $ | (258,190 | ) | $ | 197,109 | |||||||||
Page 78 of 94
Table of Contents
INNOPHOS, INC. AND SUBSIDIARIES
Notes to Consolidated Financial Statements
(Dollars in thousands, except where otherwise noted)
Condensed Consolidated Statements of Operations
For the year ended December 31, 2007
(In thousands)
| Innophos, Inc. | Guarantor Subsidiary |
Non-Guarantor Subsidiary |
Adjustments and Eliminations |
Total | ||||||||||||||||
| Net sales |
$ | 353,121 | $ | — | $ | 333,662 | $ | (107,801 | ) | $ | 578,982 | |||||||||
| Cost of goods sold |
304,728 | — | 277,858 | (107,801 | ) | 474,785 | ||||||||||||||
| Gross profit |
48,393 | — | 55,804 | — | 104,197 | |||||||||||||||
| Operating expenses: |
||||||||||||||||||||
| Selling, general and administrative |
42,761 | — | 11,394 | — | 54,155 | |||||||||||||||
| Research & development expenses |
2,047 | — | — | — | 2,047 | |||||||||||||||
| Total operating expenses |
44,808 | — | 11,394 | — | 56,202 | |||||||||||||||
| Operating income |
3,585 | — | 44,410 | — | 47,995 | |||||||||||||||
| Interest expense, net |
21,636 | — | 9,218 | — | 30,854 | |||||||||||||||
| Foreign exchange (gains) losses |
(39 | ) | — | 79 | — | 40 | ||||||||||||||
| Other income |
— | (299 | ) | — | (299 | ) | ||||||||||||||
| Equity (income) loss |
(23,809 | ) | (20,419 | ) | — | 44,228 | — | |||||||||||||
| Income (loss) before income tax |
5,797 | 20,419 | 35,412 | (44,228 | ) | 17,400 | ||||||||||||||
| Provision for income taxes |
293 | — | 11,603 | — | 11,896 | |||||||||||||||
| Net income (loss) |
$ | 5,504 | $ | 20,419 | $ | 23,809 | $ | (44,228 | ) | $ | 5,504 | |||||||||
Page 79 of 94
Table of Contents
INNOPHOS, INC. AND SUBSIDIARIES
Notes to Consolidated Financial Statements
(Dollars in thousands, except where otherwise noted)
Condensed Consolidated Statements of Cash Flows
For the year ended December 31, 2009
(in Thousands)
| Innophos, Inc | Guarantor Subsidiary |
Non-guarantor Subsidiary |
Adjustments and Eliminations |
Total | ||||||||||||||||
| Cash Flows from operating activities |
||||||||||||||||||||
| Net income (loss) |
$ | 65,427 | $ | (4,500 | ) | $ | 6,708 | $ | (2,208 | ) | $ | 65,427 | ||||||||
| Adjustments to reconcile net income (loss) to net cash provided from (used in) operating activities: |
||||||||||||||||||||
| Depreciation and amortization |
28,494 | — | 22,692 | — | 51,186 | |||||||||||||||
| Amortization of deferred financing charges |
2,641 | — | — | — | 2,641 | |||||||||||||||
| Deferred income tax benefit |
(2,197 | ) | — | (3,465 | ) | — | (5,662 | ) | ||||||||||||
| Deferred profit sharing |
— | — | (756 | ) | — | (756 | ) | |||||||||||||
| Stock based compensation |
3,367 | — | — | — | 3,367 | |||||||||||||||
| Equity (income) loss in subsidiaries |
(6,705 | ) | 4,497 | — | 2,208 | — | ||||||||||||||
| Changes in assets and liabilities: |
||||||||||||||||||||
| Increase in restricted cash |
— | — | (1,749 | ) | — | (1,749 | ) | |||||||||||||
| (Increase)/decrease in accounts receivable |
(70,365 | ) | — | (71,087 | ) | 164,639 | 23,187 | |||||||||||||
| Decrease in inventories |
8,594 | — | 23,080 | — | 31,674 | |||||||||||||||
| Increase in other current assets |
(2,051 | ) | — | (4,003 | ) | (379 | ) | (6,433 | ) | |||||||||||
| (Decrease)/increase in accounts payable |
83,680 | — | 76,863 | (164,639 | ) | (4,096 | ) | |||||||||||||
| Increase in other current liabilities |
7,600 | — | 7,392 | 379 | 15,371 | |||||||||||||||
| Changes in other long-term assets and liabilities |
(770 | ) | — | (928 | ) | — | (1,698 | ) | ||||||||||||
| Net cash provided from (used in) operating activities |
117,715 | (3 | ) | 54,747 | — | 172,459 | ||||||||||||||
| Cash flows used for investing activities: |
||||||||||||||||||||
| Capital expenditures |
(13,208 | ) | — | (6,401 | ) | — | (19,609 | ) | ||||||||||||
| Net Cash used for investing activities |
(13,208 | ) | — | (6,401 | ) | — | (19,609 | ) | ||||||||||||
| Cash flows (used for) provided by financing activities: |
||||||||||||||||||||
| Net change in borrowing with Innophos, Inc |
— | — | (51,528 | ) | 51,528 | — | ||||||||||||||
| Repayments from subsidiaries |
51,528 | — | — | (51,528 | ) | — | ||||||||||||||
| Return of capital to parent |
(18,196 | ) | — | — | — | (18,196 | ) | |||||||||||||
| Deferred financing costs |
(1,050 | ) | — | — | (1,050 | ) | ||||||||||||||
| Excess tax benefits from exercise of stock options |
495 | — | — | — | 495 | |||||||||||||||
| Principal payment of term loans |
(126,500 | ) | — | — | — | (126,500 | ) | |||||||||||||
| Net cash used for financing activities |
(93,723 | ) | — | (51,528 | ) | — | (145,251 | ) | ||||||||||||
| Net change in cash |
10,784 | (3 | ) | (3,182 | ) | — | 7,599 | |||||||||||||
| Cash and cash equivalents at beginning of period |
61,295 | 5 | 63,323 | — | 124,623 | |||||||||||||||
| Cash and cash equivalents at end of period |
$ | 72,079 | $ | 2 | $ | 60,141 | $ | — | $ | 132,222 | ||||||||||
Page 80 of 94
Table of Contents
INNOPHOS, INC. AND SUBSIDIARIES
Notes to Consolidated Financial Statements
(Dollars in thousands, except where otherwise noted)
Condensed Consolidated Statements of Cash Flows
For the year ended December 31, 2008
(in Thousands)
| Innophos, Inc | Guarantor Subsidiary |
Non-guarantor Subsidiary |
Adjustments and Eliminations |
Total | ||||||||||||||||
| Cash Flows from operating activities |
||||||||||||||||||||
| Net income (loss) |
$ | 197,109 | $ | 127,270 | $ | 130,920 | $ | (258,190 | ) | $ | 197,109 | |||||||||
| Adjustments to reconcile net income (loss) to net cash provided from (used in) operating activities: |
||||||||||||||||||||
| Depreciation and amortization |
30,266 | — | 22,241 | — | 52,507 | |||||||||||||||
| Amortization of deferred financing charges |
2,363 | — | — | — | 2,363 | |||||||||||||||
| Deferred income tax provision (benefit) |
5,132 | — | (7,054 | ) | — | (1,922 | ) | |||||||||||||
| Deferred profit sharing |
— | — | (3,258 | ) | — | (3,258 | ) | |||||||||||||
| Stock based compensation |
3,467 | — | — | — | 3,467 | |||||||||||||||
| Equity (income) loss in subsidiaries |
(130,919 | ) | (127,271 | ) | — | 258,190 | — | |||||||||||||
| Changes in assets and liabilities: |
||||||||||||||||||||
| (Increase)/decrease in accounts receivable |
(79,593 | ) | — | (68,391 | ) | 128,531 | (19,453 | ) | ||||||||||||
| Increase in inventories |
(23,278 | ) | — | (43,304 | ) | — | (66,582 | ) | ||||||||||||
| Increase in other current assets |
(6,101 | ) | — | (4,811 | ) | (204 | ) | (11,116 | ) | |||||||||||
| Increase/(decrease) in accounts payable |
72,044 | — | 56,719 | (128,531 | ) | 232 | ||||||||||||||
| (Decrease)/increase in other current liabilities |
(1,586 | ) | — | 90 | 204 | (1,292 | ) | |||||||||||||
| Changes in other long-term assets and liabilities |
(9,361 | ) | 6,228 | — | (3,133 | ) | ||||||||||||||
| Net cash provided from (used in) operating activities |
59,543 | (1 | ) | 89,380 | — | 148,922 | ||||||||||||||
| Cash flows from investing activities: |
||||||||||||||||||||
| Capital expenditures |
(11,574 | ) | — | (6,962 | ) | — | (18,536 | ) | ||||||||||||
| Net Cash used for investing activities |
(11,574 | ) | — | (6,962 | ) | — | (18,536 | ) | ||||||||||||
| Cash flows provided by (used for) financing activities: |
||||||||||||||||||||
| Net change in borrowing with Innophos, Inc |
— | — | (31,000 | ) | 31,000 | — | ||||||||||||||
| Repayments from subsidiaries |
31,000 | — | — | (31,000 | ) | — | ||||||||||||||
| Return of capital to parent |
(20,797 | ) | — | — | — | (20,797 | ) | |||||||||||||
| Excess tax benefits from exercise of stock options |
1,466 | — | — | — | 1,466 | |||||||||||||||
| Principal payment of term loans |
(2,000 | ) | — | — | — | (2,000 | ) | |||||||||||||
| Net cash provided by (used for) financing activities |
9,669 | — | (31,000 | ) | — | (21,331 | ) | |||||||||||||
| Net change in cash |
57,638 | (1 | ) | 51,418 | — | 109,055 | ||||||||||||||
| Cash and cash equivalents at beginning of period |
3,657 | 6 | 11,905 | — | 15,568 | |||||||||||||||
| Cash and cash equivalents at end of period |
$ | 61,295 | $ | 5 | $ | 63,323 | $ | — | $ | 124,623 | ||||||||||
Page 81 of 94
Table of Contents
INNOPHOS, INC. AND SUBSIDIARIES
Notes to Consolidated Financial Statements
(Dollars in thousands, except where otherwise noted)
Condensed Consolidated Statements of Cash Flows
For the year ended December 31, 2007
(in Thousands)
| Innophos, Inc | Guarantor Subsidiary |
Non-guarantor Subsidiary |
Adjustments and Eliminations |
Total | ||||||||||||||||
| Cash Flows from operating activities |
||||||||||||||||||||
| Net income (loss) |
$ | 5,504 | $ | 20,419 | $ | 23,809 | $ | (44,228 | ) | $ | 5,504 | |||||||||
| Adjustments to reconcile net income (loss) to net cash provided from operating activities: |
||||||||||||||||||||
| Depreciation and amortization |
28,414 | — | 19,072 | — | 47,486 | |||||||||||||||
| Amortization of deferred financing charges |
2,773 | — | — | — | 2,773 | |||||||||||||||
| Deferred income tax provision (benefit) |
193 | — | (2,000 | ) | — | (1,807 | ) | |||||||||||||
| Deferred profit sharing |
— | — | 800 | — | 800 | |||||||||||||||
| Stock based compensation |
1,077 | — | — | — | 1,077 | |||||||||||||||
| Equity (income) loss in subsidiaries |
(23,809 | ) | (20,419 | ) | — | 44,228 | — | |||||||||||||
| Changes in assets and liabilities: |
||||||||||||||||||||
| (Increase)/decrease in accounts receivable |
(23,409 | ) | — | (26,707 | ) | 46,353 | (3,763 | ) | ||||||||||||
| Increase in inventories |
(5,251 | ) | — | (2,908 | ) | — | (8,159 | ) | ||||||||||||
| Decrease/(increase) in other current assets |
795 | — | (3,355 | ) | (85 | ) | (2,645 | ) | ||||||||||||
| Increase/(decrease) in accounts payable |
28,209 | — | 23,725 | (46,353 | ) | 5,581 | ||||||||||||||
| Increase in other current liabilities |
1,034 | — | 2,581 | 85 | 3,700 | |||||||||||||||
| Changes in other long-term assets and liabilities |
(7,104 | ) | 9,229 | — | 2,125 | |||||||||||||||
| Net cash provided from operating activities |
8,426 | — | 44,246 | — | 52,672 | |||||||||||||||
| Cash flows used for investing activities: |
||||||||||||||||||||
| Capital expenditures |
(7,275 | ) | — | (21,081 | ) | — | (28,356 | ) | ||||||||||||
| Purchase of assets |
(2,120 | ) | — | — | — | (2,120 | ) | |||||||||||||
| Net Cash used for investing activities |
(9,395 | ) | — | (21,081 | ) | — | (30,476 | ) | ||||||||||||
| Cash flows provided by (used for) financing activities: |
||||||||||||||||||||
| Net change in borrowing with Innophos, Inc |
— | — | (26,185 | ) | 26,185 | — | ||||||||||||||
| Repayments from subsidiaries |
26,185 | — | — | (26,185 | ) | — | ||||||||||||||
| Return of capital to parent |
(15,746 | ) | — | — | — | (15,746 | ) | |||||||||||||
| Principal payment of term loans |
(20,500 | ) | — | — | — | (20,500 | ) | |||||||||||||
| Net cash used for financing activities |
(10,061 | ) | — | (26,185 | ) | — | (36,246 | ) | ||||||||||||
| Net change in cash |
(11,030 | ) | — | (3,020 | ) | — | (14,050 | ) | ||||||||||||
| Cash and cash equivalents at beginning of period |
14,687 | 6 | 14,925 | — | 29,618 | |||||||||||||||
| Cash and cash equivalents at end of period |
$ | 3,657 | $ | 6 | $ | 11,905 | $ | — | $ | 15,568 | ||||||||||
Page 82 of 94
Table of Contents
| ITEM 9. | CHANGES IN AND DISAGREEMENTS WITH ACCOUNTANTS ON ACCOUNTING AND FINANCIAL DISCLOSURE |
None.
ITEM 9A(T). CONTROLS AND PROCEDURES
Disclosure Control and Procedures
The Company maintains disclosure controls and procedures (as defined in Rule 13a-15(e) and 15d-15(e) of the Securities Exchange Act of 1934) that are designed to provide reasonable assurance that information required to be reported in the Company’s consolidated financial statements and filings is recorded, processed, summarized and reported within the periods specified in the rules and forms of the SEC and that such information is accumulated and communicated to the Company’s management, including its principal executive officer and principal financial officer, as appropriate, to allow timely decisions regarding required disclosure. The Chief Executive Officer and Chief Financial Officer, with the participation of management, concluded that the Company’s disclosure controls and procedures are effective.
MANAGEMENT’S REPORT ON INTERNAL CONTROL OVER FINANCIAL REPORTING
Management is responsible for establishing and maintaining adequate internal control over financial reporting. The Company’s internal control framework and processes are designed to provide reasonable assurance to management and the Board of Directors regarding the reliability of financial reporting and the preparation of the Company’s consolidated financial statements in accordance with United States generally accepted accounting principles.
As of December 31, 2009, management conducted an assessment of the Company’s internal control over financial reporting based on the framework established by the Committee of Sponsoring Organizations of the Treadway Commission in Internal Control — Integrated Framework. Based on the assessment, management concluded that, as of December 31, 2009, the Company’s internal control over financial reporting is effective at the reasonable assurance level. The year ending December 31, 2009 annual report does not include an attestation report of the Company’s registered public accounting firm regarding internal control over financial reporting.
Management’s report is not subject to attestation by the Company’s registered public accounting firm pursuant to temporary rules of the Securities and Exchange Commission that permit the company to provide only management’s report in the year ending December 31, 2009 annual report.
Because of its inherent limitations, internal control over financial reporting may not prevent or detect misstatements. Also, projections of any evaluation of effectiveness to future periods are subject to the risk that controls may become inadequate because of changes in conditions, or that the degree of compliance with the policies or procedures may deteriorate.
Changes in Internal Control Over Financial Reporting
There have been no changes in our internal control over financial reporting during or with respect to the fourth quarter of 2009 that have materially affected, or are reasonably likely to materially affect, the Company’s internal control over financial reporting.
| ITEM 9B. | OTHER INFORMATION |
None.
Page 83 of 94
Table of Contents
| ITEM 10. | DIRECTORS, EXECUTIVE OFFICERS AND CORPORATE GOVERNANCE |
The response to this item is omitted pursuant to General Instruction I of Form 10-K.
| ITEM 11. | EXECUTIVE COMPENSATION |
The response to this item is omitted pursuant to General Instruction I of Form 10-K.
| ITEM 12. | SECURITY OWNERSHIP OF CERTAIN BENEFICIAL OWNERS AND MANAGEMENT AND RELATED STOCKHOLDER MATTERS |
The response to this item is omitted pursuant to General Instruction I of Form 10-K.
| ITEM 13. | CERTAIN RELATIONSHIPS AND RELATED TRANSACTIONS AND DIRECTOR INDEPENDENCE |
The response to this item is omitted pursuant to General Instruction I of Form 10-K.
| ITEM 14. | PRINCIPAL ACCOUNTING FEES AND SERVICES |
The following table presents fees for services provided to Innophos by PricewaterhouseCoopers LLP (“PwC”) for 2009 and 2008, including fees for Holdings.
| (In thousands) |
2009 | 2008 | ||||
| Audit Fees(a) |
$ | 1,497 | $ | 2,071 | ||
| Audit-Related Fees(b) |
138 | 103 | ||||
| Tax Services(c) |
342 | 118 | ||||
| Total |
$ | 1,977 | $ | 2,292 | ||
| (a) | Fees for professional services provided for the audit of Innophos’s annual financial statements as well as reviews of Innophos’ quarterly reports on Form 10-Q, accounting consultations on matters addressed during the audit or interim reviews, and SEC filings and offering memorandums including comfort letters and consents. |
| (b) | Fees for professional services which principally include audits of employee benefit plans and other audit related services. |
| (c) | Fees for professional services which principally include tax services. |
| ITEM 15. | EXHIBITS, FINANCIAL STATEMENT SCHEDULES |
(a) Exhibits. The following exhibits are filed as part of this 10-K.
See the attached Exhibit Index.
Page 84 of 94
Table of Contents
Pursuant to the requirements of Section 13 or 15(d) of the Securities Exchange Act of 1934, Innophos, Inc. has duly caused this report to be signed on its behalf by the undersigned, thereto duly authorized on the 8th day of March, 2010.
| INNOPHOS, INC. | ||
| By: | /s/ RANDOLPH GRESS | |
| Randolph Gress | ||
| Chief Executive Officer (Principal Executive Officer) | ||
Pursuant to the requirements of the Securities Exchange Act of 1934, this report has been signed by the following persons on behalf of Innophos, Inc. and in the capacities and on the dates indicated.
| Signatures |
Title |
Dates | ||
| /S/ RANDOLPH GRESS Randolph Gress |
Chief Executive Officer and Director (Principal Executive Officer) |
March 8, 2010 | ||
| /S/ NEIL I. SALMON Neil I. Salmon |
Vice President and Chief Financial Officer (Principal Financial Officer) |
March 8, 2010 | ||
| /S/ CHARLES BRODHEIM Charles Brodheim |
Corporate Controller (Principal Accounting Officer) |
March 8, 2010 | ||
| /S/ GARY CAPPELINE Gary Cappeline |
Director | March 8, 2010 | ||
| /S/ AMADO CAVAZOS Amado Cavazos |
Director | March 8, 2010 | ||
| /S/ LINDA MYRICK Linda Myrick |
Director | March 8, 2010 | ||
| /S/ KAREN OSAR Karen Osar |
Director | March 8, 2010 | ||
| /S/ JOHN STEITZ John Steitz |
Director | March 8, 2010 | ||
| /S/ STEPHEN ZIDE Stephen Zide |
Director | March 8, 2010 | ||
Page 85 of 94
Table of Contents
EXHIBIT INDEX
| Exhibit No. |
Description | |
| 2.1 | Purchase Agreement dated June 10, 2004 among Rhodia, Inc., Rhodia Canada Inc., Rhodia de Mexico, S.A. de C.V., Rhodia Overseas Limited, Rhodia Consumer Specialties Limited, Rhodia, S.A. and Innophos, Inc. (f/k/a Phosphates Acquisition, Inc.), incorporated by reference to Exhibit 2.1 of Registration Statement 333-129951 on Form S-4 of Innophos, Inc. filed November 23, 2005 | |
| 3.1 | Second Amended and Restated Certificate of Incorporation of Innophos Holdings, Inc. incorporated by reference to Exhibit 3.1 of Amendment No. 4 to Registration Statement 333-135851 on Form S-1 of Innophos Holdings, Inc. filed October 30, 2006 | |
| 3.2 | Amended and Restated By-Laws of Innophos Holdings, Inc. as of November 30, 2007 incorporated by reference to Exhibit 99.1/99.2B of Form 8-K of Innophos Holdings, Inc. filed December 6, 2007 | |
| 4.1 | Form of Common Stock certificate incorporated by reference to Exhibit 4.1 of Amendment No. 4 to Registration Statement 333-135851 on Form S-1 of Innophos Holdings, Inc. filed October 30, 2006 | |
| 4.2 | Registration Rights Agreement dated as of August 13, 2004 by and between Innophos Holdings, Inc., the entities set forth on Schedule I attached thereto and the other individuals signatory thereto incorporated by reference to Exhibit 4.2 of Registration Statement No. 333-129951 on Form S-4 of Innophos, Inc. filed November 23, 2005 | |
| 4.3 | Indenture by and between Innophos Holdings, Inc. and U.S. Bank National Association, as Trustee dated as of April 16, 2007 relating to 9 1/ 2% Senior Unsecured Notes Due 2012 incorporated by reference to Exhibit 4.1 of Form 8-K of Innophos Holdings, Inc. filed April 17, 2007 | |
| 4.4 | Purchase Agreement dated April 11, 2007 between Innophos Holdings, Inc. and Credit Suisse Securities (USA) LLC incorporated by reference to Exhibit 4.2 of Form 8-K of Innophos Holdings, Inc. filed April 17, 2007 | |
| 4.5 | Indenture by and between Innophos, Inc., and Wachovia Bank, National Association, dated as of August 13, 2004 incorporated by reference to Exhibit 4.1 of Registration Statement 333-129951 on Form S-4 of Innophos, Inc. filed November 23, 2005 | |
| 4.6 | Guarantee dated as of August 13, 2004 among Innophos, Inc., Innophos Mexico Holdings, LLC and Wachovia Bank, National Association incorporated by reference to Exhibit 10.3 of Registration Statement 333-129951 on Form S-4 of Innophos, Inc. filed November 23, 2005 | |
| 4.7 | Loan and Security Agreement dated May 22, 2009 by and among Innophos, Inc. and Innophos Canada, Inc., as Borrowers, and Wachovia Bank, National Association, TD Bank, N.A. and Israel Discount Bank, Wachovia Bank, National Association, as Administrative and Collateral Agent for Lenders, and Wachovia Capital Markets LLC, as Syndication Agent, Lead Arranger and Lead Bookrunner, incorporated by reference to Exhibit 99.1 of Form 8-K of Innophos Holdings, Inc. filed May 27, 2009. | |
| 10.1 | Supply Agreement (Sulphuric Acid) dated as of August 13, 2004 between Rhodia, Inc. and Innophos, Inc. incorporated by reference to Exhibit 10.3 of Annual Report on Form 10-K of Innophos Holdings, Inc. for the year ended December 31, 2007 | |
| 10.2 | Agreement dated as of September 10, 1992 by and between Office Cherifien Des Phosphates and Troy Industrias S.A. de C.V. incorporated by reference to Exhibit 10.12 to Amendment No. 4 of Registration Statement 333-129951 on Form S-4 of Innophos, Inc. filed February 14, 2006 | |
| 10.3 | Addendum No. 7 dated June 5, 2002 to Agreement dated as of September 10, 1992 by and between Office Cherifien Des Phosphates and Troy Industrias S.A. de C.V. incorporated by reference to Exhibit 99.1 of Form 8-K of Innophos Holdings, Inc. filed July 21, 2008 | |
| 10.4 | Purchasing Agreement between Innophos, Inc. and Mississippi Lime Company dated March 11, 2008, with redactions subject to pending confidential treatment request. incorporated by reference to Exhibit 10.5 of Annual Report on Form 10-K of Innophos Holdings, Inc. for the year ended December 31, 2007 | |
| 10.5 | Amended and Restated Purified Wet Phosphoric Acid Supply Agreement dated as of March 23, 2000 by and between Rhodia, Inc. and PCS Purified Phosphates incorporated by reference to Exhibit 10.15 to Amendment No. 4 of Registration Statement 333-129951 on Form S-4 of Innophos, Inc. filed February 14, 2006 | |
| 10.6 | Amended and Restated Acid Purchase Agreement dated as of March 23, 2000 among Rhodia, Inc., PCS Sales (USA), Inc. and PCS Nitrogen Fertilizer L.P incorporated by reference to Exhibit 10.16 to Amendment No. 4 of Registration Statement 333-129951 on Form S-4 of Innophos, Inc. filed February 14, 2006 | |
| 10.7 | Base Agreement dated as of September 1, 2003 by and between Pemex-Gas y Petroquimica Basica and Rhodia Fosfatados De Mexico S.A. de C.V. incorporated by reference to Exhibit 10.17 to Amendment No. 4 of Registration Statement 333-129951 on Form S-4 of Innophos, Inc. filed February 14, 2006 | |
Page 86 of 94
Table of Contents
| Exhibit No. |
Description | |
| 10.8 | Purchase and Sale Agreement of Anhydrous Ammonia dated as of February 15th , 2008 , by and between Pemex Petroquimica, and Innophos Fosfatados De Mexico, S. de R.L. de C.V. incorporated by reference to Exhibit 10.8 of Annual Report on Form 10-K/A of Innophos, Inc. for the year ended December 31, 2008 | |
| 10.9 | Sulfur Supply Contract dated as of August 1, 2007 by and Between Pemex Gas Y Petroquimica Basica and Innophos Fosfatados de Mexico, S. de R.L. de C.V. incorporated by reference to Exhibit 10.8 of Annual Report on Form 10-K/A of Innophos, Inc. for the year ended December 31, 2008 | |
| 10.10 | Supply Agreement dated as of June 18, 1998 by and among Colgate Palmolive Company, Inmobiliaria Hills, S.A. de C.V., and Rhone-Poulenc de Mexico, S.A. de C.V. incorporated by reference to Exhibit 10.21 of Registration Statement 333-129951 on Form S-4 of Innophos, Inc. filed November 23, 2005 | |
| 10.11 | Operations Agreement made as of the 18th day of June, 1998 by and among Mission Hills, S.A. de C.V, Inmobiliaria Hills. S.A. de C.V., and Rhone-Poulenc de Mexico, S.A. de C.V. incorporated by reference to Exhibit 10.22 of Registration Statement 333-129951 on Form S-4 of Innophos, Inc. filed November 23, 2005 | |
| 10.12 | Form of Memorandum of Agreement dated January 30, 2009 by and between Innophos, Inc. and Colgate Palmolive incorporated by reference to Exhibit 99.1 of Form 8-K of Innophos Holdings, Inc. and Innophos, Inc. filed February 5, 2009 | |
| 10.13 | Form of Individual Employment Agreement for executive officers of Innophos Servicios de Mexico, S. de R.L. de C.V., incorporated by reference to Exhibit 10.24 of Amendment No. 1 to Annual Report on Form 10-K of Innophos Holdings, Inc. for the year ended December 31, 2007 | |
| 10.14 | Form of Executive Employment Agreement by and between Innophos Holdings, Inc. and certain executive officers incorporated by reference to Exhibit 99.13 of Form 8-K of Innophos Holdings, Inc. filed May 1, 2008 | |
| 10.15 | Innophos Holdings, Inc. Amended and Restated 2005 Executive Stock Option Plan incorporated by reference to Exhibit 10.28 to Amendment No. 4 of Registration Statement 333-135851 on Form S-1 of Innophos, Inc. filed October 30, 2006 | |
| 10.16 | Innophos, Inc. Executive, Management and Sales Incentive Plan effective January 1, 2007, incorporated by reference to Exhibit 10.17 of Annual Report on Form 10-K of Innophos Holdings, Inc. for the year ended December 31, 2007 | |
| 10.17 | Form of Retention Bonus Agreement dated as of October 18, 2006 by and among Innophos Holdings, Inc., and senior management employees incorporated by reference to Exhibit 4.6 of Registration Statement No. 333-139623 on Form S-8 of Innophos Holdings, Inc. filed December 22, 2006 | |
| 10.18 | Form of Indemnification Agreement, by and among Innophos Holdings, Inc. and certain Directors and Executive Officers incorporated by reference to Exhibit 99.2 of Form 8-K of Innophos Holdings, Inc. filed January 31, 2007 | |
| 10.19 | Form of 2006 Long-Term Equity Incentive Plan incorporated by reference to Exhibit 10.37 to Amendment No. 4 of Registration Statement 333-135851 on Form S-1 of Innophos, Inc. filed October 30, 2006 | |
| 10.20 | Form of 2009 Long-Term Incentive Plan (2009 LTIP) incorporated by reference to Exhibit 99.1 of Form 8-K of Innophos Holdings, Inc. filed June 4, 2009 | |
| 10.21 | Form of Award Agreement under the 2009 Long Term Incentive Plan incorporated by reference to Exhibit 4.5 of Form S-8 of Innophos Holdings, Inc. filed June 15, 2009 | |
| 10.22 | Form of Innophos, Inc. Retirement Savings Restoration Plan effective as of January 1, 2006, incorporated by reference to Exhibit 10.29 of Annual Report on Form 10-K of Innophos Holdings, Inc. for the year ended December 31, 2006. | |
| 10.24 | Addendum No. 13 dated February 4, 2010 to Agreement dated as of September 10, 1992 by and between OCP, S.A. and Innophos Mexicana, S.A. de C.V. incorporated by reference to Exhibit 99.1 of Form 8-K of Innophos Holdings, Inc. filed February 4, 2010 (Filed in redacted form pending request for confidential treatment submitted to the Securities and Exchange Commission under Rule 24b-2 of the Securities Exchange Act of 1934, as amended.) | |
| 12.1 | Statement re: Calculation of Ratio of Earnings to Fixed Charges, filed herewith | |
| 21.1 | Subsidiaries of Registrant, incorporated by reference to Exhibit 21.1 of Annual Report on Form 10-K/A of Innophos, Inc. for the year ended December 31, 2008. | |
| 31.1 | Certification of Principal Executive Officer dated March 8, 2010 pursuant to Section 302 of the Sarbanes-Oxley Act of 2002, filed herewith | |
| 31.2 | Certification of Principal Financial Officer dated March 8, 2010 pursuant to Section 302 of the Sarbanes-Oxley Act of 2002, filed herewith | |
| 32.1 | Certification of Principal Executive Officer dated March 8, 2010 pursuant to Section 906 of the Sarbanes-Oxley Act of 2002, filed herewith | |
| 32.2 | Certification of Principal Financial Officer dated March 8, 2010 pursuant to Section 906 of the Sarbanes-Oxley Act of 2002, filed herewith | |
Page 87 of 94
Table of Contents
Pursuant to rules of the Securities and Exchange Commission, agreements and instruments evidencing the rights of holders of debt whose total amount does not exceed 10 percent of the total assets of the registrant and its subsidiaries on a consolidated basis are not being filed as exhibits to this report. The registrant has agreed to furnish a copy of such agreements and instruments to the Commission upon its request.
Page 88 of 94