Attached files
Use these links to rapidly review the document
TABLE OF CONTENTS
PART IV
UNITED STATES
SECURITIES AND EXCHANGE COMMISSION
Washington, D.C. 20549
FORM 10-K
| (Mark One) | ||
| ý | ANNUAL REPORT PURSUANT TO SECTION 13 OR 15(d) OF THE SECURITIES EXCHANGE ACT OF 1934 | |
| For the fiscal year ended January 2, 2010 | ||
| Or | ||
| o | TRANSITION REPORT PURSUANT TO SECTION 13 OR 15(d) OF THE SECURITIES EXCHANGE ACT OF 1934 | |
| For the transition period
from to
|
||
Commission File Number: 001-33760
FGX INTERNATIONAL HOLDINGS LIMITED
(Exact name of registrant as specified in its charter)
| British Virgin Islands (State or other jurisdiction of incorporation) |
98-0475043 (IRS Employer Identification No.) |
500 George Washington Highway
Smithfield, RI 02917
(Address of principal executive offices) (zip code)
(401) 231-3800
(Registrant's telephone number, including area code)
Securities registered pursuant to Section 12(b) of the Act:
| Title of each class Ordinary shares, no par value |
Name of each exchange on which registered The NASDAQ Global Market |
Securities registered pursuant to Section 12(g) of the Act:
None
Indicate by check mark if the registrant is a well-known seasoned issuer, as defined in Rule 405 of the Securities Act. Yes o No ý
Indicate by check mark if the registrant is not required to file reports pursuant to Section 13 or Section 15(d) of the Act. Yes o No ý
Indicate by check mark whether the registrant (1) has filed all reports required to be filed by Section 13 or 15(d) of the Securities Exchange Act of 1934 during the preceding 12 months (or for such shorter period that the registrant was required to file such reports), and (2) has been subject to such filing requirements for the past 90 days. Yes ý No o
Indicate by check mark whether the registrant has submitted electronically and posted on its corporate website, if any, every Interactive Data File required to be submitted and posted pursuant to Rule 405 of Regulation S-T (§232.405 of this chapter) during the preceding 12 months (or for such shorter period that the registrant was required to submit and post such files). Yes o No o
Indicate by check mark if disclosure of delinquent filers pursuant to Item 405 of Regulation S-K is not contained herein, and will not be contained, to the best of registrant's knowledge, in definitive proxy or information statements incorporated by reference in Part III of this Form 10-K or any amendment to this Form 10-K. o
Indicate by check mark whether the registrant is a large accelerated filer, an accelerated filer, a non-accelerated filer or a smaller reporting company. See definition of "large accelerated filer," "accelerated filer" and "smaller reporting company" in Rule 12b-2 of the Exchange Act.
| Large accelerated filer o | Accelerated filer ý | |
Non-accelerated filer o (Do not check if a smaller reporting company) |
Smaller reporting company o |
Indicate by check mark whether the registrant is a shell company (as defined in Rule 12b-2 of the Act). Yes o No ý
As of the last business day of our most recently completed second fiscal quarter, the aggregate market value of the voting shares held by non-affiliates was $173.9 million, based on the number of shares held by non-affiliates of the registrant as of July 4, 2009 and the reported last sale price of ordinary shares on July 2, 2009.
Number of the registrant's ordinary shares, no par value, outstanding as of March 5, 2010: 22,280,522.
Documents incorporated by reference:
Portions of the definitive Proxy Statement for FGX International Holdings Limited's 2010 Annual Meeting of Shareholders ("Proxy Statement") are incorporated by reference into Part III of this Form 10-K.
2
This report and the information incorporated by reference in it include forward-looking statements. These include, but are not limited to, statements about our expectations, hopes, beliefs, intentions or strategies regarding the future, as well as statements that refer to projections, forecasts or other characterizations of future events or circumstances, including any underlying assumptions. They may refer, without limitation, to retail and brand initiatives, upcoming product releases, operational improvements, market growth or acceptance of our products, and future revenue, costs, results of operations, or profitability. The words "anticipate," "believe," "continue," "could," "estimate," "expect," "intend," "may," "might," "plan," "possible," "potential," "predict," "project," "should," "would" and similar expressions may, but are not necessary to, identify forward-looking statements.
The forward-looking statements contained or incorporated by reference in this report are based on our current expectations, beliefs and assumptions concerning future developments and their potential effects on us and speak only as of the date of this report. There can be no assurance that future developments affecting us will be those that we have anticipated. These forward-looking statements involve a number of risks, uncertainties (some of which are beyond our control) or other factors that may cause actual results or performance to be materially different from those expressed or implied by these forward-looking statements. These risks and uncertainties include, but are not limited to, those factors described or referred to under the heading "Risk Factors" below. We undertake no obligation to update or revise any forward-looking statements, whether as a result of new information, future events or otherwise, except as may be required under applicable law.
NOTE REGARDING RELIANCE ON STATEMENTS IN OUR CONTRACTS
The agreements included or incorporated by reference as exhibits to this Annual Report on Form 10-K contain representations and warranties by each of the parties to the applicable agreement. These representations and warranties were made solely for the benefit of the other parties to the applicable agreement and (i) were not intended to be treated as categorical statements of fact, but rather as a way of allocating the risk to one of the parties if those statements prove to be inaccurate; (ii) may have been qualified in such agreement by disclosures that were made to the other party in connection with the negotiation of the applicable agreement; (iii) may apply contract standards of "materiality" that are different from "materiality" under the applicable securities laws; and (iv) were made only as of the date of the applicable agreement or such other date or dates as may be specified in the agreement.
The Company acknowledges that, notwithstanding the inclusion of the foregoing cautionary statements, it is responsible for considering whether additional specific disclosures of material information regarding material contractual provisions are required to make the statements in this report not misleading.
3
The Company
FGX International Holdings Limited is a business company incorporated under the laws of the British Virgin Islands ("BVI"). We conduct business through our subsidiary, FGX International Inc., and its operating subsidiaries.
Our largest shareholder, Berggruen Holdings North America Ltd. (together with its predecessors, "BHNA"), acquired AAi.FosterGrant, Inc. in a series of transactions between 2000 and 2003. We were incorporated on September 22, 2004 to hold the stock of AAi.FosterGrant, Inc. and, in October 2004, we acquired Magnivision, Inc. On October 24, 2007, we undertook an initial public offering in which we sold 6,666,667 of our ordinary shares at a price to the public of $16.00 per share and certain shareholders sold 7,133,333 shares. We received approximately $97.2 million in net proceeds (after deducting underwriting discounts, commissions and expenses of approximately $9.5 million), which we used to repay indebtedness and related costs.
In the second quarter of 2009, we decided to divest the costume jewelry business to focus on the core optical business segments, and we completed a sale of the assets of that business on July 23, 2009.
On November 26, 2008, we acquired all of the outstanding common shares of Dioptics Medical Products, Inc., a designer and marketer of sunglasses and optical accessories. On October 28, 2009, we acquired all of the outstanding stock of Corinne McCormack, Inc and eye-bar inc., a designer and marketer of fashion eyewear and optical accessories.
Our registered office is located at Nemours Chambers, Road Town, Tortola, British Virgin Islands. Our principal executive offices are located at 500 George Washington Highway, Smithfield, Rhode Island 02917; telephone: (401) 231-3800. Our web site is www.fgxi.com. We make available free of charge on our web site the following reports as soon as reasonably practicable after electronically filing them with, or furnishing them to, the SEC: our Annual Reports on Form 10-K; our Quarterly Reports on Form 10-Q; our Current Reports on Form 8-K; and amendments to those reports filed or furnished pursuant to Sections 13(a) or 15(d) of the Securities Exchange Act of 1934. (We have included our web site address in this document as an inactive textual reference only and you should not consider information contained on our web site or that can be accessed through our web site to be a part of this Annual Report on Form 10-K.)
Proposed Merger
On December 15, 2009, we entered into a definitive Agreement and Plan of Merger ("Merger Agreement") with Essilor International ("Essilor") of Charenton-le-Pont, France and one of its subsidiaries. Under the terms of the Merger Agreement, our shareholders will receive $19.75 per share in cash upon completion of the merger contemplated by the Merger Agreement. If the merger is completed, we will become a wholly owned subsidiary of Essilor.
The transaction is subject to customary closing conditions, including approval by our shareholders. A special meeting of shareholders to consider and vote upon the approval of the merger is currently scheduled for March 9, 2010. Our principal shareholder, an affiliate of Berggruen Holdings, which owns approximately 32% of outstanding shares, and key members of our senior management team have agreed to vote their shares in favor of the merger.
Statements made in this Form 10-K relating to the Company's business strategies, operating plans, planned expenditures, expected capital requirements and other forward-looking statements regarding the Company's business are made on the basis that the Company remains independent and do not take into account potential future impacts of the Company's proposed acquisition by Essilor.
4
Overview
We are a leading designer and marketer of non-prescription reading glasses and sunglasses with a portfolio of established, highly recognized eyewear brands including Foster Grant(1) and Magnivision. We and our predecessors have worked to build a strong reputation for providing consumers a broad selection of products that deliver style and quality at affordable prices. This is exemplified by the Foster Grant brand, which has been one of the most recognizable sunglasses brands since the 1960s "Who's That Behind Those Foster Grants?" advertising campaign, which used high profile celebrities to promote the brand. We revived this campaign in 2009.
We sell our Foster Grant brand in the popular priced sunglasses market (less than $30) and both our Foster Grant and Magnivision brands in the non-prescription reading glasses market. Our products are sourced through low-cost Asian manufacturers and sold primarily through mass channels, which include mass merchandisers, chain drug stores, chain grocery stores and variety stores. Some of our products are sold to ophthalmic retailers, mid-tier department stores and other specialty retailers
On November 26, 2008, we acquired Dioptics Medical Products, Inc. of San Luis Obispo, CA, a designer and marketer of sunglasses and optical accessories. With the acquisition, we added a portfolio of proprietary brands of sunglasses and associated eye care products and accessories, including SolarShield and PolarEyes. These products and accessories are primarily sold through mass merchandisers and chain drug stores, as well as medical supply stores and ophthalmic retailers, generally in the $10-$30 retail price range.
On October 28, 2009, we acquired Corinne McCormack, Inc, a designer and marketer of eyewear and accessories. Corinne McCormack brand products are sold to better specialty and department stores, generally in the $35-$80 retail price range.
Our company-owned portfolio also includes the Anarchy, Angel and Gargoyles brands, which target different demographic groups and distribution channels at a premium price point (generally $50-$170). We believe our premium brands have a strong niche consumer appeal. We promote these brands through endorsements from well recognized action sports athletes and sponsorship of action sports events.
To complement our proprietary brands, we market both popular priced and premium eyewear under nationally-recognized licensed brands including Ironman Triathlon, Levi Strauss Signature, Body Glove, C9 by Champion and Rawlings. In addition, we sell a line of prescription frames, which we introduced in 2004.
We will seek to continue to add to our domestic and international customer base as well as consider selective acquisitions that fit strategically into our business model.
Our Markets
We compete primarily in the non-prescription reading glasses and popular priced sunglasses markets.
- (1)
- Foster Grant®, Magnivision®, Anarchy®, AngelTM, Gargoyles®, SolarShield®, PolarEyes® and Corinne McCormack® are our trademarks. Ironman Triathlon®, Levi Strauss Signature®, Body Glove®, C9 by Champion® and Rawlings® are the property of their respective owners. The ® and ™ symbols included here are deemed to apply to each instance of the respective mark in this report.
5
Non-prescription reading glasses are designed to provide magnification for near-vision tasks associated with the normal aging process, which is marked by the decreased ability to focus on nearby objects, or presbyopia. We believe the general aging of the population is a key growth factor in the U.S. non-prescription reading glasses market. In addition, we believe that growth in this market will be driven by product innovations, the appeal of more fashionable designs and enhancement in alternative eyesight correction technologies, which typically correct nearsightedness, or myopia, but not presbyopia.
We believe the market for popular priced sunglasses is supported by a number of long-term growth drivers. These include changing fashion trends, consumers' desire for multiple, activity-specific sunglasses, the growing desire for UVA/ UVB eye protection and product innovation.
Our sales into the international market are principally generated in the United Kingdom, Canada and Mexico and have averaged approximately 14% of our net sales during the past three fiscal years. We primarily sell sunglasses and non-prescription reading glasses products in these markets.
See Note 20 to our consolidated financial statements in this Form 10-K for an analysis of our sales by segment and Note 19 for additional information relating to our international operations.
Our Customers
We sell our products in over 63,000 retail locations worldwide. Our core customer base spans a range of mass channels, and primarily consists of mass merchandisers, chain drug stores, chain grocery stores, specialty retailers, variety stores, ophthalmic retailers and mid-tier department stores.
- •
- Mass merchandisers in the U.S. accounted for approximately 33% of our total net sales in fiscal 2009. Representative mass
merchandiser customers include Wal-Mart, Target, Meijer, Fred Meyer and BJ's Wholesale Club.
- •
- Chain drug stores in the U.S. accounted for approximately 33% of our total net sales in fiscal 2009. Representative chain
drug store customers include CVS, Walgreens and Rite Aid. These stores tend to be smaller than mass merchandisers and attract a consumer base that is often less price sensitive and more convenience
oriented than the mass merchandiser or variety store customer.
- •
- Chain grocery stores, specialty retailers, variety stores, ophthalmic retailers and mid-tier department stores in the U.S. accounted for approximately 14% of our total net sales in fiscal 2009. Representative stores in this category include Kroger, Family Dollar, and Hudson and Paradies airport shops.
We have established strong and long-standing relationships with many leading national retailers. Nine of our top ten customer relationships, ranked by 2009 revenues, span ten years or more each, and our relationship with Wal-Mart spans more than 20 years. Approximately 73% of our sales are to 10 large retail customers with approximately 36,000 locations worldwide. In fiscal 2009, our five largest customers represented approximately 61% of our sales. Net sales to each of Wal-Mart, Walgreens and CVS accounted for more than 10% of our net sales, and sales to Wal-Mart accounted for more than 10% of our net sales in each segment in which we operate. See Note 19 to our consolidated financial statements in this Form 10-K for additional information regarding our three largest customers.
Sales and Marketing
Our domestic and international sales teams are organized by distribution channel, product line and customer. We also have dedicated sales, marketing and merchant personnel exclusively responsible for maintaining and growing our presence within certain larger customers.
We believe that relationships with our retail customers are dependent upon the efficient use of allocated floor space and the generation of profits by our customers. To this end, we strive to deliver competitively priced products and service programs that consistently provide retailers with attractive
6
gross margins and inventory turnover rates. We have a history of customer retention from year to year, and customer loss has generally been attributable to consolidation in the various retail channels we serve.
Our marketing organization is responsible for increasing brand awareness and helping to propel retail sales of our brands by identifying and subsequently utilizing consumer insights to develop targeted advertising, public relations and in-store campaigns. Marketing spending, which is approximately 3-5% of net sales, has increased every year since 2006 and is expected to do so again in 2010 due to the costs associated with our recently added advertising campaign for reading glasses. This campaign reinforces the fashion content and efficacy of the product.
In addition, a Foster Grant sunglasses campaign is expected to be launched in the second quarter of 2010. We are also focused on increasing the awareness of our premium brands, Anarchy, Angel and Gargoyles, with a print and digital media campaign.
We maintain showrooms and sales offices at our Smithfield, Rhode Island corporate office, and in New York, NY; San Luis Obispo, CA; Toronto, Canada; Stoke-on-Trent, England; and Mexico City, Mexico.
We conduct our operations in Mexico through a joint venture established in 1996, AAi/Joske's S. de R.L. de C.V., of which we own 50%. AAi/Joske's develops, sources and distributes customized collections of accessories utilizing our product development personnel and supplier relationships, as well as the distribution expertise of our joint venture partner, Joske's de Mexico, S.A. de C.V. ("Joske's"), an established Mexican jewelry company with strong local retail relationships.
Our operating results fluctuate from quarter to quarter as a result of seasonal demand for some of our product lines, changes in demand for our products, our effectiveness in managing our inventories and costs, the timing of the introduction of new products and weather patterns. Orders for our more fashion-oriented sunglasses in the United States and Canada are typically shipped initially in December while in the United Kingdom, they are usually shipped initially in February and March. Replenishment sunglasses orders in the United States, Canada and the United Kingdom are primarily shipped during the first half of the fiscal year as retailers build inventories for the spring and summer selling seasons. Sales of non-prescription reading glasses and sunglasses designed for use with ophthalmic products are generally uniform throughout the year. Although sales of our non-prescription reading glasses and fits over products have, in part, offset the seasonality of sales of sunglasses, our financial condition and results of operations are largely dependent on the shipping of product during the second half of the fiscal year.
Customer Contracts
A majority of our eyewear sales, particularly in the chain drug store channel, are made pursuant to customer contracts. Our relationships are generally based on multi-year sales and/or dollar volume agreements. Some customers, including Wal-Mart, operate via purchase orders, which set forth their terms and conditions related to purchases. Our customer contracts may be exclusive or non-exclusive and may specify inventory and service levels, anticipated inventory sales rates, sales volumes and the amount of any fixed obligation due to the customer in connection with the establishment of the relationship.
Upon commencement of a new customer contract or renewal of an existing customer contract, we may incur costs associated with providing new display fixtures and payments of product placement allowances. Upon commencement or renewal, we also experience a significant increase in revenue from the sale of eyewear to that customer to stock the new display fixtures. After initial stocking, we generate sales by reorders for product replenishment, which are typically at lower levels than at the commencement of the contract. In the case of a new contract, we may be required to issue credits to the customer equal to the customer's cost of the existing eyewear inventory of the incumbent supplier
7
at the customer's retail locations and warehouses. Conversely, in the event that we are replaced as the eyewear supplier of a customer, the new supplier could be required to provide similar allowances for our customer's inventory.
Product returns, markdowns and contractual allowances (which include product placement fees, cooperative advertising, volume rebates and other discounts) are a key component of our profitability, which we continually assess based on information and reports regarding products sold by our customers to consumers. Before entering into a new customer contract or renewing an existing customer contract, we engage in extensive analysis to determine the appropriate level of contractual allowances to be offered based on the projected profitability of the program. As a percentage of our gross product shipments, our product returns, markdowns and contractual allowances have averaged approximately 27% over the last three fiscal years. We continuously strive to reduce product returns, markdowns and contractual allowances and manage factors that impact these types of allowances.
Customer Support
Our customers typically demand a high level of merchandising support and national distribution capability. Accordingly, our business is supported by an integrated infrastructure of sales and service, design and outsourcing functions. Our domestic and Canadian sales teams are supported by our merchant and field service organizations.
- •
- Merchant Organization. Our merchant organization works
closely with our customers to improve their sales and profitability by providing services such as collaborative planning, product merchandising, fashion trend reporting and retail sales data analysis.
This group is also primarily responsible for managing customer returns and markdowns. By conducting point-of-sale analysis, they help retailers manage inventory and analyze
revenue and margins.
- •
- Field Service Organization. Our field service organization consists primarily of part-time employees who maintain and restock in-store displays, set up promotional materials and communicate store-level needs to our management team. We believe our field service organization enables us to better serve our customers and enhances our ability to control the content and appearance of our in-store product displays, which we believe increases our sales volume. We also believe our field service organization is significantly larger than those of our competitors and also serves as a competitive advantage.
Our U.K. and Mexican sales teams are each supported locally by similar merchant organizations and third-party field service organizations.
We believe our merchant and field service organizations represent a critical differentiating competitive advantage in the marketplace. These distinctive service features enable us to better serve our customers and enhance our ability to control the content and appearance of our in-store product displays, which we believe increases our sales volume.
Working Capital
We need working capital to support seasonal variations in our business, primarily inventory fluctuations due to the seasonal demands for our sunglasses. We typically experience peak seasonal working capital needs from approximately mid-March through July in connection with these changes in demand. We use borrowings under our revolving credit facility to satisfy normal operating costs during these periods.
Product Development and Sourcing
We believe our reputation for style, quality and value distinguishes our products from those of our competitors and provides us with significant competitive advantages. Our product development objective is to provide stylish products that represent a strong price-to-value relationship for our end
8
consumer. We employ a team of experienced designers, product development specialists and support staff. The design team focuses on the development of new product styles or enhancements to reflect constantly evolving consumer preferences. The design team works closely with:
- •
- our sales, marketing and merchant organizations, and trend forecasters to predict, monitor and respond to market trends in
a timely manner;
- •
- employees located at each of our international offices to custom design products for local style preferences;
- •
- licensor/retailers to design products that meet their approval; and
- •
- our manufacturers to maintain design integrity and ensure that our designs are feasible for low-cost mass-volume manufacturing while meeting quality standards.
We outsource the manufacturing of our products to contract manufacturers principally in China. We have successfully executed our Asian sourcing strategy since the 1980s. We are not dependent on any single supplier for the manufacture of any product category as we source from multiple suppliers across each such category and our largest supplier represented 18% of all our purchases in fiscal 2009. We buy our products from our suppliers on a purchase order basis with generally favorable trade terms and no obligation to any long-term contractual supply agreements. All purchase orders are fixed price and denominated in U.S. dollars.
In 2005, we opened an office in Shenzhen, China to enhance the management of our supplier relationships, and in 2008 we added a quality control laboratory to test the safety and product specification compliance of our products. We seek to ensure the quality of our manufacturers' products by using our quality control laboratory, and our own quality inspection team located throughout China, to inspect all of our product orders prior to shipment. In addition, subsequent sample inspections are conducted at our facilities to verify product quality and order accuracy. We also maintain a quality control department at our Smithfield, Rhode Island facility and use an independent laboratory for material testing of our products.
Warehousing and Distribution
We own and operate a 187,000 square-foot distribution center and corporate headquarters in Smithfield, Rhode Island. This facility is configured to enhance supply chain operations, rapidly distribute products, improve customer service and decrease operational costs. We receive sales and inventory data from retailers via electronic data interchange, or EDI, and generate purchase orders using vendor managed inventory, or VMI. We manage product distribution in the United States through our Smithfield facility and an independent third-party contract warehouse near Long Beach, California. We ship our products to our customers by contract carriers. We also lease a 105,000 square-foot office, warehouse and distribution center in San Luis Obispo, California under a lease that will terminate November 30, 2010. The operations of this warehouse and distribution center will be consolidated into our Smithfield distribution center during the first quarter of 2010. We intend to maintain a product development, sales and marketing office in San Luis Obispo.
Products are typically shipped in containers by ocean or air freight, depending on our requirements and cost efficiencies, from the ports of Hong Kong, Shanghai and Xiamen in China to Los Angeles/Long Beach, California or Boston, Massachusetts for our products that we sell domestically and in Canada or Stoke-on-Trent, United Kingdom or Mexico City, Mexico for our products that we sell internationally. The domestic containers are then shipped either directly to our Smithfield, Rhode Island distribution facility or, depending on cost and logistical considerations, to an independent third-party contract warehouse near Long Beach, California.
Our international products are warehoused and distributed by a facility we lease in the United Kingdom for our European customers, a facility owned by our joint venture partner, Joske's, in Mexico
9
City for our customers in Mexico and South America, and our Smithfield facility for our customers in Canada.
Competition
There is intense competition in each of the markets in which we sell our products. Generally, the bases of competition in our markets are brand recognition, fashion, service, merchandising, quality and price. We believe that our established relationships with large retail customers, brand recognition, efficient, low-cost sourcing strategy and ability to deliver stylish products to consumers at a competitive price are important factors in our ability to compete. Some of our competitors may enjoy substantial competitive advantages, including less outstanding indebtedness and greater financial resources that can be devoted to competitive activities, such as sales and marketing, product development and strategic acquisitions.
In the non-prescription reading glasses market, our primary competitors are StyleMark, Inc., Zoom Eyeworks, Icon Eyewear and Select-A-Vision. The majority of retail outlets for non-prescription reading glasses are mass and chain drug channels. Our Corinne McCormack reading glasses also compete with eyebobs Eyewear and I-Line Eyewear in better specialty and department stores. To establish and maintain product placement in these retail outlets, we compete primarily on retail support, point-of-sale performance, price and terms. Along with value, fashion is a differentiator in this market, and our ability to incorporate fashion into our Magnivision and Foster Grant product lines will be a key factor in retaining our market-leading position.
In the sunglasses market, we compete with a variety of companies across multiple channels of trade. The major competitive factors include fashion trends, brand recognition and distribution channels. The majority of our sunglasses sales are in mass channels, where we primarily compete against companies such as StyleMark, Inc., Fantas Eyes, Inc. and various direct import companies. In specialty retailers, where we sell our premium products, we compete with companies in various niches, including Oakley, Orange 21 and VonZipper.
The prescription frames market is intensely competitive, as frame styles are marketed under multiple brand names. To obtain space at an optical retailer, we compete against many companies, foreign and domestic, including Luxottica Group S.p.A., Safilo Group S.p.A., Signature Eyewear, Inc. and StyleMark, Inc. Distributors also frequently carry many lines of eyewear, and we must compete with other suppliers for attention from sales representatives. Frames are generally sold under licensed brands such as Levi Strauss Signature, Body Glove and Jeff Banks. At major retail chains, we compete not only against other eyewear suppliers but often against private labels of the chains themselves. To best leverage our strengths in this market, we have introduced our prescription frames into optical centers within our existing large retail customers, such as Wal-Mart. We believe successful relationships with these retailers will establish our brands in the prescription frames market and give us the experience we need to expand into other retail channels.
Intellectual Property
Our intellectual property portfolio, including our product designs, trademarks and licenses, are of material importance to our business.
Trademarks. We have numerous trademarks registered in the United States and in many foreign countries. We have registered our principal trademarks Foster Grant, Magnivision, Anarchy, Gargoyles, SolarShield, PolarEyes and Corinne McCormack and have an application pending for the Angel trademark for use on our products in the United States. We have also registered or applied for the registration of certain other marks used by us in conjunction with the sale and marketing of our products.
10
Patents. We seek patent protection generally for those inventions and improvements likely to be incorporated into our products and displays or where patent protection will improve our competitive position. We do not have any patents that we believe are, individually or in the aggregate, material to our results of operations or financial condition.
Licenses. We have exclusive license agreements to manufacture, market, distribute and sell products under the Ironman Triathlon, Levi Strauss Signature, Body Glove, C9 by Champion and Rawlings brands in the United States and/or numerous countries around the world. These agreements typically require us to guarantee certain minimum net sales requirements or make minimum royalty payments. They will expire by their terms at intervals over the next one to four years but in some cases may be renewed by us if we have complied with their terms.
We primarily protect our intellectual property rights through patent, trade secret, trade dress, trademark, copyright and unfair competition law, in addition to nondisclosure, confidentiality and other contractual restrictions. From time to time, we bring claims against third parties who, in our opinion, infringe upon these rights. While we cannot guarantee that our efforts to protect our intellectual property rights are adequate or effective, we intend to assert our intellectual property rights against infringers.
Governmental Regulation
Our operations are subject to a variety of federal, state and local quality control standards and regulatory requirements relating to health and safety matters. In particular, we are subject to regulations promulgated by the Occupational Safety and Health Administration, pertaining to health and safety in the workplace and the regulation of corresponding state agencies, and the Food and Drug Administration, or FDA, pertaining to safety of "medical devices." Our international businesses are subject to similar regulations in the countries where they operate, and are subject to various international trade agreements and regulations.
Because our products are manufactured overseas, our operations are, or may become, subject to international trade agreements and regulations. We are also subject to other restrictions imposed by the United States that include prohibitions set forth in the regulations issued by the U.S. Department of Commerce, the U.S. Department of State and the U.S. Department of the Treasury (Office of Foreign Asset Controls) with regard to "specially designated" or blocked persons or entities with which we are prohibited from doing business, as well as import/trade restrictions imposed by the countries in which our products are manufactured and sold. Modification and imposition of trade restrictions is based upon relationships between nations that we are unable to control, and we cannot predict the effect, if any, these events would have on our operations, especially in light of our concentrated product sourcing in Asia.
Backlog
Our customers expect quick response times on standard orders, and we do not typically have a material order backlog.
Employees
As of January 2, 2010, we employed approximately 500 full-time employees and approximately 2,500 part-time employees worldwide. Most of our part-time employees are members of our field service organization, providing re-stocking and support services for our customers. We also employ temporary employees on an as-needed basis in the Smithfield, Rhode Island facility to meet seasonal needs and fulfill orders. None of our employees are represented by a collective bargaining agreement.
11
Our business and, accordingly, an investment in our securities, involves significant risks, including but not limited to those described below. If any of those risks actually materializes, our business, financial condition and results of operations could be seriously harmed and the trading price of our shares could decline.
We operate in a highly competitive market and the size and resources of some of our competitors may allow them to compete more successfully, which could result in a loss of market share and as a result, a decrease in our net sales and gross profit.
The sunglasses, non-prescription reading glasses and prescription frames markets in which we compete are intensely competitive. Fashion is a differentiator in our markets, and our ability to continue to incorporate current fashions into our product lines and to generate marketing programs, product design and brand image that influence consumer purchases will be key factors in our ability to compete. Some of our competitors may enjoy substantial competitive advantages, including greater financial resources that can be devoted to competitive activities, such as sales and marketing, product development and strategic acquisitions. As a result, these competitors may be able to:
- •
- adapt to changes in consumer preferences more quickly;
- •
- anticipate and respond to changing fashion and performance trends more quickly;
- •
- devote greater resources to the marketing and sale of their products;
- •
- better adapt to downturns in the economy and decreases in sales;
- •
- borrow money at a lower cost; and
- •
- take advantage of acquisitions and other opportunities more readily.
We might not be able to compete successfully with these competitors in the future. If we fail to compete successfully, our market share and gross profit would be materially adversely affected.
We rely on a few customers for a significant portion of our sales. The leverage exerted by those customers or the loss of or significant decrease in business from one or more of them may materially adversely affect us.
A few customers represent material portions of our business and results of operations. Our business and results of operations could be adversely affected by further consolidation in the mass channels or any deterioration in the financial condition of, or other adverse developments affecting, one or more of our top customers. Our large customers are also able to exert pricing and other influence on us, requiring us to market, deliver and promote our products in a manner of their choosing, which frequently is more costly to us. Moreover, we do not have long-term contracts with several of our customers, including our largest customer, Wal-Mart. As a result, Wal-Mart and other customers generally purchase our products on an order-by-order basis, and our relationship, as well as particular orders, can be terminated at any time. The loss of or significant decrease in business from any of our major customers would materially adversely affect our business, results of operations and cash flow. Moreover, if we are successful in our strategy of broadening the range of products we sell to existing customers, the impact of any of the risks described in this risk factor would be increased.
12
Any interruption or termination of our relationships with our manufacturers could adversely affect our business, result in increased cost of goods sold or lead to an inability to deliver our products to our customers.
We rely on third-party manufacturers to supply all of our products. Our principal manufacturers are located in China. We do not have long-term supply agreements with any of our manufacturers, and products are generally supplied on a purchase order basis. We cannot be certain that we will not experience difficulties with our manufacturers, such as reductions in the availability of production capacity, failures to comply with product specifications, failures to comply with applicable law, insufficient quality control, failures to meet production deadlines, increases in raw materials, labor and manufacturing costs or failures to comply with our requirements for the proper utilization of our intellectual property. If our relationship with any of our manufacturers is interrupted or terminated for any reason, we would need to locate alternative manufacturing sources. Potential events that could adversely affect our foreign supply chain include the following:
- •
- political instability, acts of war or terrorism, or other international events resulting in the disruption of trade with
countries where our sourcing partners' manufacturing facilities are located;
- •
- disruptions in shipping and freight forwarding services, including as a result of dockworker or port strikes;
- •
- increases in oil prices, which would increase the cost of shipping;
- •
- interruptions in the availability of basic services and infrastructure, including power shortages;
- •
- extraordinary weather conditions (such as hurricanes, typhoons and snowstorms) or natural disasters (such as earthquakes
or tsunamis); and
- •
- the occurrence of an epidemic, the spread of which may impact our ability to obtain products on a timely basis.
These and other events could interrupt production by our third party manufacturers, increase our cost of goods sold or shipping costs, impair our ability to timely ship orders of our products, delay receipt of products into the United States, the United Kingdom or Mexico, cause us to miss the delivery requirements of our customers or prevent us from sourcing products at all. As a result, we could experience lost sales, cancellation of orders, refusal to accept deliveries, increased product costs or a reduction in purchase prices, any of which could adversely affect our net sales, results of operations, reputation and relationships with our customers. The establishment of new manufacturing relationships involves numerous uncertainties, and we cannot be certain that we would be able to obtain alternative manufacturing sources in a manner that would enable us to meet our customer orders on a timely basis or on satisfactory commercial terms. If we are required to change any of our major manufacturers, we may experience increased costs, substantial disruptions in the manufacture and shipment of our products and a loss of net sales.
We may be subject to product liability claims, or we may be required to recall our products.
Any of our products may be defective for a number of reasons, including but not limited to our suppliers' errors, failure to comply with applicable law or failure to comply with our specifications. We may be required to pay for losses or injuries caused by our products. We have been and may again be subjected to various product liability claims, including claims for serious personal injury. Successful assertion against us of one or a series of large claims could materially harm our business. Also, if one of our products is found to be defective, we may be required to recall it, which may result in substantial expense and adverse publicity and negatively impact our sales, operating results and reputation. Potential product liability claims may exceed the amount of insurance coverage or potential
13
product liability claims may be excluded under the terms of the policy, which would hurt our financial condition. In addition, we may also be required to pay higher premiums and accept higher deductibles in order to secure adequate insurance coverage in the future.
Economic conditions in general, and disruptions in the economy and the financial markets, may adversely impact our business.
The continuing disruptions in the national and international economies and financial markets, and the related reductions in the availability of credit and increases in the unemployment rate, may result in a continuing decline in consumer confidence and spending and may make it more difficult for businesses to obtain financing. If such conditions persist, there could be a continuing decline in consumer spending. There can be no assurance that government responses to the disruptions in the financial markets will restore consumer confidence, stabilize the markets or increase liquidity and the availability of credit. If our customers are unable to obtain borrowed funds on acceptable terms, or if conditions in the economy and the financial markets do not improve, our revenues, results of operations, business and financial condition could be adversely affected as a result.
Some of our customers have experienced declining financial performance, which could affect their ability to pay amounts payable to us on a timely basis or at all. Our suppliers may also be impacted by the disruptions in the economy, which may impact our ability to obtain the products we sell. The bankruptcy, receivership or closure of one or more of our significant retail customers or suppliers could materially adversely impact our revenues and bad debt expense and could result in charges related to fixed assets and competitive buybacks or placements. Continued economic decline that adversely affects our suppliers and customers could adversely affect our operations and sales.
The banking system and financial markets have experienced severe disruption, including, among other things, bank failures and consolidations, severely diminished liquidity and credit availability, rating downgrades, declines in asset valuations, and fluctuations in foreign currency exchange rates. We are dependent on the continued financial viability of the financial institutions that participate in the syndicate that is obligated to fund our $75 million revolving credit facility. In addition, our credit facility includes an "accordion" feature that enables us to request from the participating financial institutions an increase in the principal amount of the revolving facility by $50 million. If one or more participating institutions is unable to honor, or unwilling to increase, their funding commitments, the cash availability under our revolving credit facility may be curtailed and/or funding of the accordion feature may not occur. We have not been notified of any circumstances that would prevent any participating financial institution from funding our revolving credit facility. However, under current or future circumstances, such constraints may exist. Although we believe that our operating cash flows, together with our access to the credit markets, provide us with significant discretionary funding capacity, the inability or unwillingness of one or more institutions to fund the credit facilities could have a material adverse effect on our liquidity and operations.
We face business, political, operational, financial and economic risks because a material portion of our operations is outside the United States, a material portion of our sales is to customers outside the United States and all of our manufacturers are outside the United States.
We outsource the manufacture of all our products to Asian contract manufacturers that maintain factories principally in China. In addition, we have foreign sales offices in the United Kingdom, Canada and Mexico and, in recent years, have made approximately 14% of our net sales to customers outside the United States. We are subject to risks inherent in international business, many of which are beyond our control, including:
- •
- imposition of U.S. and foreign government controls, such as export license requirements or other trade restrictions and changes in regulatory practices;
14
- •
- transportation delays and difficulties of managing international distribution channels;
- •
- longer payment cycles for, and greater difficulty collecting, accounts receivable;
- •
- unexpected changes in regulatory requirements, such as changes in withholding taxes that restrict the repatriation of
earnings into the United States and affect our effective income tax rate due to profits generated or lost in foreign countries;
- •
- political and economic instability, including wars, terrorism, political unrest, boycotts, curtailment of trade and other
business restrictions; and
- •
- difficulties in obtaining the protections of intellectual property laws, if any, of other countries.
Any of these events could reduce our net sales, decrease our gross margins or increase our expenses.
Fluctuations in foreign currency exchange rates could harm our results of operations.
We are exposed to gains and losses resulting from the effect that fluctuations in foreign currency exchange rates have on the reported results in our consolidated financial statements due to the translation of the operating results and financial position of our United Kingdom, Canadian and Mexican subsidiaries. The reported results of our foreign operations will be influenced by their translation into U.S. dollars and by foreign currency movements against the U.S. dollar. The strengthening in the value of the U.S. dollar in 2009 relative to each of the currencies in which our foreign revenues and expenses are denominated has resulted in a decrease in revenues and net income. Additionally, we outsource the manufacture of our products to Asian contract manufacturers. While we pay these suppliers in U.S. dollars, their costs are typically based upon the local currency of the country in which they operate. Any decrease in the value of the U.S. dollar against these foreign currencies could result in a corresponding increase in our future cost of goods sold and decrease in our gross profit, which would materially adversely affect our financial condition and operating results.
We have indebtedness which may restrict our business and operations, adversely affect our cash flow and restrict our future access to sufficient funding to finance desired growth.
At January 2, 2010, we had outstanding indebtedness of approximately $107.5 million under our credit facility.
This amount of indebtedness (i) makes us more vulnerable to adverse changes in general economic, industry and competitive conditions, (ii) limits our ability to borrow money to fund working capital, capital expenditures, acquisitions, debt service requirements and other financing needs and (iii) places us at a disadvantage compared to any of our competitors that may have less debt. Furthermore, our interest expense would increase if interest rates rise because a portion of our debt bears interest at floating rates. If we do not have sufficient earnings to service our debt, we would need to refinance all or part of that debt, sell assets, borrow more money or sell securities, which we may not be able to do on commercially reasonable terms, or at all.
The terms of our credit facility include customary events of default and covenants that limit us from taking certain actions without obtaining the consent of the lenders. In addition, our credit facility requires us to maintain certain financial ratios and restricts our ability to incur additional indebtedness. These restrictions and covenants may limit our ability to respond to changing business and economic conditions and may prevent us from engaging in transactions that might otherwise be considered beneficial to us, including strategic acquisitions.
A breach of the provisions of our credit facility, including any inability to comply with the required financial ratios, could result in an event of default under our credit facility. If an event of default occurs under our credit facility (after any applicable notice and cure periods), our lenders would be entitled to accelerate the repayment of amounts outstanding, plus accrued and unpaid interest.
15
Moreover, these lenders would have the option to terminate any obligation to make further extensions of credit under our credit facility. In the event of a default under our credit facility, the lenders could also foreclose against the assets securing such obligations. In the event of a foreclosure on all or substantially all of our assets, we may not be able to continue to operate as a going concern.
Due to the uncertainty of the interpretation and application of existing U.S. federal income tax laws there is a risk that FGX International Holdings Limited could be treated as a U.S. corporation for U.S. federal income tax purposes, in which case we would be subject to higher taxes, which could materially adversely affect our results of operations and cash flows.
U.S. federal income tax laws provide that if a foreign corporation acquires substantially all of the properties of a U.S. corporation and, after the acquisition, the former shareholders of the U.S. corporation own 80% or more of the stock of the foreign corporation by virtue of their ownership of the U.S. corporation's stock, the foreign corporation may be treated as a U.S. corporation for U.S. federal income tax purposes. Although we believe that these anti-inversion rules do not apply to us, these rules have not been the subject of any judicial decisions or administrative rulings, are subject to change at any time and any such change may be retroactive. Moreover, regulations or interpretations adversely affecting our position under the anti-inversion rules could be issued at any time, potentially with retroactive effect. If the Internal Revenue Service ("IRS") was to take successfully the contrary position that FGX International Holdings Limited should be treated as a U.S. corporation, we could be subject to substantially higher U.S. federal income taxes and such changes could materially adversely affect our results of operations and cash flows.
If in the future we fail to maintain an effective system of internal controls, we may not be able to accurately report our financial results. As a result, current and potential shareholders could lose confidence in our financial reporting, which would harm our business.
Effective internal controls are necessary for us to provide reliable financial reports. If we cannot provide reliable financial reports, our operating results could be misstated, our reputation may be harmed and the trading price of our shares could be negatively affected. There can be no assurance that our controls over financial processes and reporting will be effective in the future.
If we are unable to implement our business strategy successfully to expand our product offerings, our business may suffer.
We intend to continue to expand our product offerings, particularly focusing on, more fashionable and unique non-prescription reading glasses. We also plan to introduce new products within the eyewear market. However, we may not be successful in gaining market acceptance for any new products that we offer. In addition, introduction of new product offerings will require us to incur additional sales and marketing expenses, and many require us to incur intellectual property royalty expenses, and these expenses may be material. The execution of our business strategy could strain our management, financial and operational resources, which could materially adversely affect our performance and results of operations. If our new products are not received favorably by consumers, our reputation and the value of our brands could be damaged. The lack of market acceptance of new products we may develop or our inability to generate satisfactory net sales from any new products to offset their cost could harm our business.
If we do not continue to negotiate and maintain favorable license arrangements, our growth prospects, sales and operating results could be adversely affected.
We have entered into license agreements that enable us to sell eyewear under certain nationally recognized brands, including Ironman Triathlon, Levi Strauss Signature, Body Glove, C9 by Champion and Rawlings. We believe that our ability to maintain and negotiate favorable license agreements
16
enables us to increase our access to additional distribution channels. Accordingly, if we are unable to negotiate and maintain satisfactory license arrangements, our growth prospects, sales and operating results could be adversely affected.
Our business could be harmed if we fail to maintain proper inventory levels or if we misjudge the market for a particular product.
The sunglasses and non-prescription reading glasses markets are subject to changing consumer preferences based on fashion and performance trends. Our success depends largely on our ability to continue to anticipate and respond to changing fashion and performance trends and consumer preferences in a timely manner. If we misjudge the market for a particular product or are unable to respond quickly to fashion trends, we may be unable to sell the products we have ordered from manufacturers or that we have in our inventory. Excess inventory levels may result in inventory write-downs, and the sale of excess inventory at discounted prices could significantly impair our brand image and harm our operating results and financial condition. Conversely, if we underestimate consumer demand for our products or if our manufacturers fail to supply the quality products that we require at the time we need them, we may experience inventory shortages. Inventory shortages might delay shipments to our customers, negatively impact retailer relationships, diminish brand loyalty, or increase our costs.
If we fail to secure or protect our intellectual property rights, competitors may be able to use our intellectual property, which could weaken our competitive position, reduce our net sales and increase our costs.
We attempt to protect our intellectual property rights through the enforcement of patent, trade secret, trade dress, trademark, copyright and unfair competition laws, in addition to nondisclosure, confidentiality and other contractual restrictions. Despite our efforts, third parties may have violated and may in the future violate our intellectual property rights. In addition, other parties, including our competitors, may independently develop similar, competing or superior products, technologies or designs that do not infringe on our intellectual property rights. If we fail to protect our intellectual property rights adequately, our competitors could obtain our proprietary information and imitate our products using processes or technologies developed by us and thereby harm our competitive position and financial condition. Parallel trade (i.e., gray markets) and counterfeiting of our products could harm our reputation for producing high-quality products.
Since we sell our products internationally and outsource the manufacture of our products to Asian contract manufacturers that maintain factories in China, we also are dependent on the laws of foreign countries to protect our intellectual property. These laws may not enforce or protect our intellectual property rights to the same extent or in the same manner as the laws of the United States. There can be no assurance that our efforts to protect our intellectual property will be adequate, effective or will not be challenged by third parties or that the costs associated with protecting our rights abroad will not be extensive. If we are unable to protect adequately our intellectual property rights, our results of operations would be adversely affected.
We may be involved in intellectual property litigation or subject to claims by third parties for alleged infringement of their intellectual property rights, which are costly to defend, could require us to pay damages and could limit our ability to use certain technologies in the future.
From time to time in the course of our business we are involved in litigation to protect and enforce our intellectual property rights and receive notices of claims of infringement, misappropriation or misuse of other parties' proprietary rights. Some of these claims lead to litigation. Our intellectual property rights may not have the value we believe them to have and our products may be found to infringe upon the intellectual property rights of others. Any intellectual property claim, whether or not
17
determined in our favor or settled, could be costly, could harm our reputation and could divert our management from normal business operations. Adverse determinations in litigation could subject us to significant liability and force us to recall infringing products from our customers or terminate sales of infringing products or to develop redesigned products or brands or could subject us to the loss of our rights to a particular patent, trademark, copyright or trade secret. In addition, we could be required to seek a license from the holder of the intellectual property, and it is possible that we may not be able to obtain a license on reasonable terms, or at all. Even if we obtain a license, the cost of potential royalty payments could negatively affect our margins. If we are unable to redesign our products or obtain a license, we may have to discontinue a particular product offering. If we fail to develop a non-infringing technology or product on a timely basis or to license the infringed technology on acceptable terms, our business, financial condition and results of operations could be harmed.
Fluctuations in our operating results on a quarterly and annual basis could cause the market price of our ordinary shares to decline.
Our operating results fluctuate from quarter to quarter as a result of seasonal demand for some of our product lines, changes in demand for our products, our effectiveness in managing our suppliers and costs, our spending patterns, the timing of the introduction of new products and weather patterns, and are likely to continue to do so. Our expense levels in the future will be based, in large part, on our expectations regarding net sales. Many of our expenses are fixed in the short term or are incurred in advance of anticipated sales. We may not be able to decrease our expenses in a timely manner to offset any seasonal shortfall of sales. These fluctuations could cause the market price of our ordinary shares to decline. You should not rely on period-to-period comparisons of our operating results as an indication of our future performance.
An increase in product returns could negatively impact our operating results.
Sales are recognized when revenue is realized or realizable and has been earned. We recognize revenue when title to the product, ownership and risk of loss transfer to the customer, which generally is on the date of shipment, but is sometimes on the date of receipt by the customer. In addition, prior to revenue recognition, we require persuasive evidence of the business arrangement, that the price is fixed or determinable, and that collectibility is reasonably assured. Accordingly, we provide allowances for the estimated amounts of these returns at the time of revenue recognition based on historical experience. Any significant increase in product damages or defects or product returns could materially adversely affect our operating results for the period or periods in which such events materialize.
Disruption in our distribution centers could significantly lower our net sales and gross profit.
Our distribution center in Smithfield, Rhode Island and our third party warehouse near Long Beach, California, are essential to the efficient operation of our distribution network. Any serious disruption to these distribution centers due to fire, snowstorms, earthquake, flooding, acts of terrorism or any other cause could damage a significant portion of our inventory and could materially impair our ability to receive products from our suppliers and distribute products to our customers. In addition, we could incur significantly higher costs and longer lead times associated with distributing our products to our customers during the time that it takes for us to reopen or replace the centers. As a result, any such disruption could significantly lower our net sales and gross profit.
We are heavily dependent on our current executive officers and management and the loss of any of them could adversely affect our ability to operate our business and to develop and market our products successfully.
We believe that our future success is heavily dependent on the continuing contributions of our current executive officers and other members of management, as well as on our ability to attract and
18
retain additional qualified management, design and sales and marketing personnel. We cannot be certain that any of them will not be recruited by our competitors or otherwise terminate their relationship with us. We do not carry key man life insurance. The loss of any key employee or the inability to attract or retain qualified personnel, including product design and sales and marketing personnel, could delay the development and introduction of, and harm our ability to sell our products and damage our brand.
A shift by one or more of our significant customers to "pay-on-scan" payment programs could materially reduce our net sales, gross profit and cash flows.
Some of our customers are considering ways to shift their inventory risks and costs of working capital by adopting "pay-on-scan" payment programs. Under these pay-on-scan arrangements, our inventory would not transfer to the customer until the customer has sold the product to a consumer. Accordingly, we would not be able to recognize sales until the customer notifies us that the product has been sold to a consumer. Historically, we have declined to participate in most pay-on-scan inventory programs because of their adverse effect on our inventory management, net sales and cash flows. Recently, however, we have selectively chosen to participate in pay-on-scan inventory programs with a small percentage of our customers because pay-on-scan arrangements are the preferred method for certain retail channels, such as grocery and office superstores, to conduct business with suppliers who sell products of the type we sell. Our competitors may be more willing to participate in pay-on-scan payment programs than we are. Our decision not to participate in pay-on-scan may result in our loss of certain customers, which would reduce our net sales and cash flows. If one or more of our customers terminates its relationship with us as a result of our decision not to participate in such pay-on-scan programs, our net sales, gross profit and cash flows may be materially adversely affected. Furthermore, if we agree to participate in such programs, it may be more difficult for us to manage effectively our inventory and our net sales and cash flows may be materially adversely affected as well.
If we fail to comply with federal regulations imposed by the Food and Drug Administration or various state regulations, we could be subject to fines and penalties and our products could be suspended or removed from the market, each of which would cause our net sales and results of operations to decline.
Our non-prescription reading glasses and sunglasses are considered to be medical devices by the FDA, which can modify how these products are classified or could, through appropriate rulemaking, withdraw the exemption from pre-market notification. If this were to occur, it could have an adverse impact on our ability to continue to market these products and would likely increase our costs of compliance.
If the FDA were to conclude, following such an inspection of our facilities or otherwise, that we are not in compliance with applicable laws or regulations, or that any of our medical devices are ineffective or pose an unreasonable health risk, the FDA could ban such medical devices, detain or seize adulterated or misbranded medical devices, order a recall, repair, replacement, or refund of such devices, and require us to notify health professionals and others that the devices present unreasonable risks of substantial harm to public health. The FDA may also impose operating restrictions either through consent decrees or otherwise, enjoin and restrain certain violations of applicable law pertaining to medical devices, and assess civil or criminal penalties against our officers, employees or us. The FDA may also recommend prosecution to the Department of Justice. Any of these adverse governmental actions could negatively affect our gross profit with respect to our non-prescription reading glasses and sunglasses.
19
We may suffer negative publicity, be sued or have one or more of our license agreements or business relationships terminated if the manufacturers of our products violate labor or other laws or engage in practices that are viewed as unethical.
We cannot control whether our manufacturers comply with legal and ethical labor practices. If one of these manufacturers violates, or is accused of violating, labor laws or other applicable laws or regulations, or if such a manufacturer engages in labor or other practices that would be viewed as unethical if such practices occurred in the United States, one or more of our license agreements could be terminated by our licensors or our business relationships with our customers could be terminated. We also could suffer negative publicity or be sued. In addition, if such negative publicity affected one of our customers, it could result in the loss of business for us and materially adversely affect our business.
If our trade customers discontinue or reduce distribution of our products or increase direct import of private label products, our sales may decline, adversely affecting our financial performance.
Changes in the economy have caused many of our trade customers to more critically analyze their financial performance and the number of products they offer for sale, which may result in the reduction or discontinuance of certain of our product lines, the number of SKUs carried in the customers' stores or the amount of inventory of our products such customers maintain in their stores and warehouses. If this occurs, and we are unable to improve distribution for those products at other trade customers, our results could be adversely affected.
In addition, some of our trade customers import and sell products under their own private label brands, which compete with products that we sell. As consumers look for opportunities to decrease discretionary spending, our trade customers may discontinue or reduce distribution of our products to encourage those consumers to purchase their less expensive private label products. Our results could be materially adversely affected if our customers increase their efforts to sell private label products that compete with the products we sell.
If the reputation of one or more of our leading brands erodes, our financial results could suffer.
Our financial success is directly dependent on the success of our brands, particularly the Foster Grant, Magnivision and SolarShield brands. The success of these brands can suffer if our marketing and advertising plans or product initiatives do not have the desired favorable impact on a brand's image or fail to attract consumers. Further, our Company's results could be adversely affected if one of our leading brands suffers damage to its reputation due to real or perceived quality issues.
We may not be able to integrate and realize the benefits of the Corinne McCormack, Inc. acquisition.
We may not be able to successfully integrate the business and operations of Corinne McCormack, Inc., which we acquired on October 28, 2009. If we are unable to effectively manage their operations or are unable to retain their key employees, we may not realize the value that we believe the business holds. An inability to achieve the full extent, or any, of the anticipated synergies or cross-selling opportunities, could have an adverse effect on our business, financial position and results of operations, which may affect the value of our ordinary shares.
We may make acquisitions that result in dilution of our current shareholders or increase our indebtedness, or both. In addition, acquisition targets that are not properly integrated or are otherwise unsuccessful could strain or divert our resources.
We may make acquisitions or substantial investments in complementary businesses or products in the future. Any future acquisitions or investments would entail various risks, including the difficulty of assimilating the operations and personnel of the acquired businesses or products, the potential
20
disruption of our ongoing business and, generally, our potential inability to obtain the desired financial and strategic benefits from the acquisition or investment. The risks associated with assimilation are increased to the extent we acquire businesses that have operations or sources of supply outside of the United States and Canada. These factors could harm our financial condition and operating results. Any future acquisitions or investments could result in substantial cash expenditures, the issuance of new equity by us and/or the incurrence of additional debt and contingent liabilities. In addition, any potential acquisitions or investments, whether or not ultimately completed, could divert the attention of management and divert other resources from other matters that are critical to our operations. The inability to successfully complete the integration of the operations of Dioptics Medical Products, Inc., which is planned for the first quarter of 2010, could harm our financial condition and operating results and divert the attention of management and divert other resources from other matters that are critical to our operations.
If our goodwill or intangible assets become impaired we may be required to record a significant charge to earnings.
Under generally accepted accounting principles, we review our amortizable intangible assets for impairment when events or changes in circumstances indicate the carrying value may not be recoverable. Goodwill is required to be tested for impairment at least annually. Factors that may be considered when determining if the carrying value of our goodwill or amortizable intangible assets may not be recoverable include a significant decline in our expected future cash flows or a sustained, significant decline in our share price and market capitalization. Our valuation methodology for assessing impairment requires management to make judgments and assumptions based on projections of future operating performance. We operate in highly competitive environments and projections of future operating results and cash flows may vary significantly from actual results. As a result, we may incur substantial impairment charges to earnings in our financial statements should an impairment of our goodwill or indefinite life intangible assets be determined resulting in an adverse impact on our results of operations.
If the merger with Essilor contemplated by the Merger Agreement does not occur, it could have a material adverse effect on our business, results of operations and financial condition, as well as the market value of our shares.
We cannot predict whether the closing conditions to the merger set forth in the Merger Agreement will be satisfied, and the transactions contemplated by the Merger Agreement may be delayed or even abandoned before completion if certain events occur. The Merger Agreement may be terminated by us or Essilor under certain circumstances. Termination of the Merger Agreement may require us to pay a termination fee of $18,330,425 to Essilor. If the closing conditions to the merger are not satisfied or waived, or if the merger is not completed for any other reason, (i) the market price of our ordinary shares could significantly decline, (ii) we will remain liable for the significant expenses that we have incurred related to the merger, including legal and financial advisor fees, and may be required to pay the termination fee, (iii) we may experience substantial disruption in our sales and operating activities, and the loss of key personnel, customers, suppliers and other third-party relationships, any of which could materially and adversely affect us and our business, operating results and financial condition, and (iv) we may have difficulty attracting and retaining key personnel.
Until the closing of the merger, it is possible that the focus of our management team and employees may be diverted, and that there may be a negative reaction to the merger on the part of our customers, employees, suppliers and other third-party relationships. The Merger Agreement also contains certain limitations regarding our ability to conduct business operations prior to completion of the merger and these limitations may adversely affect our financial results.
21
Item 1B Unresolved Staff Comments.
None.
Our corporate headquarters is located on 32 acres in Smithfield, Rhode Island, and both the facility and the land are wholly owned by us. Originally constructed in 1976 and expanded by 125,000 square feet in 1998, this facility houses a 150,000 square foot warehouse and distribution center and 37,000 square feet of office space. We maintain showrooms and sales offices at our Smithfield, Rhode Island corporate offices, and in New York, NY, San Luis Obispo, CA, Toronto, Canada, Stoke-on-Trent, England and Mexico City, Mexico. We believe our current space is adequate for our current operations and when necessary, suitable replacement or additional space will be available on commercially reasonable terms.
We also lease a 105,000 square-foot office, warehouse and distribution center in San Luis Obispo, California under a lease that will terminate on November 30, 2010. The operations of this warehouse and distribution center will be consolidated into our Smithfield distribution center during the first quarter of 2010. We intend to maintain a product development, sales and marketing office in San Luis Obispo. We also hold a lease to a 200,000 square foot facility in Miramar, Florida where we ceased operations in March 2005. We have subleased approximately 50% of this facility through the end of the lease term.
From time to time we are a party to various lawsuits, claims and other legal proceedings that arise in the ordinary course of our business. We do not believe that we are subject to any proceedings that, individually or in the aggregate, would be expected to materially adversely affect our results of operations or financial condition.
Item 4 Submission of Matters to a Vote of Security Holders.
None.
22
Item 5 Market for Registrant's Common Equity, Related Stockholder Matters and Issuer Purchases of Equity Securities.
Our ordinary shares trade on the NASDAQ Global Market under the symbol FGXI. The following table sets forth the high and low sale prices as reported by NASDAQ for the periods indicated.
Fiscal 2009 |
|||||||
First Quarter |
$ | 14.00 | $ | 7.68 | |||
Second Quarter |
$ | 13.82 | $ | 9.61 | |||
Third Quarter |
$ | 15.97 | $ | 9.36 | |||
Fourth Quarter |
$ | 19.93 | $ | 12.99 | |||
Fiscal 2008 |
|||||||
First Quarter |
$ | 14.24 | $ | 8.03 | |||
Second Quarter |
$ | 14.47 | $ | 7.76 | |||
Third Quarter |
$ | 14.25 | $ | 7.37 | |||
Fourth Quarter |
$ | 14.45 | $ | 7.73 |
As of March 1, 2010, we had five shareholders of record; however, we believe the number of beneficial owners to be much larger.
We have not paid any cash dividends since our initial public offering and do not anticipate paying cash dividends in the future. Furthermore, our ability to pay dividends is restricted by the terms of our credit facility and the Merger Agreement.
Stock Performance Graph
The following graph compares our cumulative total stockholder return since October 25, 2007, the date of our initial public offering, the Peer Group Index described below and the Russell 2000 Index. The graph assumes that the value of the investment in the Company's ordinary shares and each index was $100.00 on October 25, 2007. The graph was prepared based on the assumption that all dividends paid, if any, were reinvested.
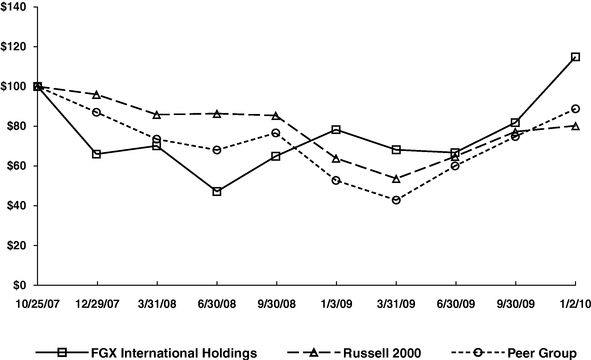
23
| |
10/25/07 | 12/29/07 | 3/31/08 | 6/30/08 | 9/30/08 | 1/3/09 | 3/31/09 | 6/30/09 | 9/30/09 | 1/2/10 | |||||||||||||||||||||
|---|---|---|---|---|---|---|---|---|---|---|---|---|---|---|---|---|---|---|---|---|---|---|---|---|---|---|---|---|---|---|---|
FGX International Holdings |
100.00 | 65.98 | 70.15 | 47.16 | 64.93 | 78.30 | 68.15 | 66.74 | 81.82 | 114.90 | |||||||||||||||||||||
Russell 2000 |
100.00 | 96.02 | 85.87 | 86.37 | 85.41 | 63.91 | 53.67 | 64.77 | 77.26 | 80.25 | |||||||||||||||||||||
Peer Group |
100.00 | 87.03 | 73.49 | 68.04 | 76.63 | 52.74 | 42.84 | 60.02 | 74.78 | 88.78 | |||||||||||||||||||||
- (1)
- The
Company's initial public offering priced at $16.00 per share. The Company's ordinary shares closed at $17.05 per share on October 25, 2007, the
first day the Company's ordinary shares were traded on NASDAQ.
- (2)
- The Peer Group Index is a self-constructed peer group consisting of companies in the consumer products industry with comparable revenues, market capitalization, similar channels of trade and branded product lines. The Peer Group Index is comprised of the following companies: (i) A.T. Cross Company, (ii) Elizabeth Arden, Inc., (iii) Fossil, Inc., (iv) Chattem, Inc., (v) Jarden Corporation, (vi) Physicians Formula Holdings, Inc., (vii) Helen of Troy Limited, (viii) Prestige Brand Holdings, Inc. and (ix) Ulta Salon, Cosmetics & Fragrance, Inc.
This performance graph is furnished and shall not be deemed "filed" with the SEC nor subject to Section 18 of the Securities Exchange Act of 1934, nor shall it be deemed incorporated by reference into any of our filings under the Securities Act of 1933.
Item 6 Selected Financial Data.
The following table sets forth selected financial information for fiscal 2009, 2008, 2007, 2006 and 2005. Our fiscal year is a 52 or 53 week period ending on the Saturday closest to December 31. Fiscal 2009, which ended on January 2, 2010, fiscal 2007, which ended on December 29, 2007, fiscal 2006, which ended on December 30, 2006, and fiscal 2005, which ended on December 31, 2005, each included 52 weeks. Fiscal 2008, which ended on January 3, 2009, included 53 weeks. We have derived the consolidated statement of operations data for fiscal 2009, 2008, and 2007 and the consolidated balance sheet data as of January 2, 2010 and January 3, 2009 from our audited financial statements contained in Item 15 of Part IV of this Form 10-K. The consolidated statement of operations data for fiscal 2006 and 2005 and the consolidated balance sheet data as of December 29, 2007 and December 30, 2006 have been derived from the audited financial statements included in our Form 10-K filed with the SEC on March 14, 2008. The selected consolidated balance sheet data as of December 31, 2005 have been derived from the audited financial statements included in our prospectus filed with the SEC on October 25, 2007.
The consolidated statements of operations for fiscal years 2005 through 2008, consolidated balance sheet data as of January 3, 2009, December 29, 2007 and December 30, 2006 and consolidated cash flow data for fiscal years 2007 and 2008 have been revised to reflect the reclassification of our costume jewelry business as discontinued operations as a result of the decision in the second quarter of 2009 to divest the business.
The historical financial information set forth below may not be indicative of our future performance and should be read together with "Management's Discussion and Analysis of Financial
24
Condition and Results of Operations" and our historical consolidated financial statements and notes to those statements included in Item 7 of Part II and Item 15 of Part IV, respectively, of this Form 10-K.
| |
Fiscal Year Ended | |||||||||||||||||
|---|---|---|---|---|---|---|---|---|---|---|---|---|---|---|---|---|---|---|
| |
January 2, 2010 |
January 3, 2009 |
December 29, 2007 |
December 30, 2006 |
December 31, 2005 |
|||||||||||||
| |
(in thousands except per share amounts) |
|||||||||||||||||
Consolidated Statement of Operations Data: |
||||||||||||||||||
Net sales |
$ | 259,275 | $ | 237,106 | $ | 212,425 | $ | 178,648 | $ | 153,025 | ||||||||
Cost of goods sold |
111,933 | 104,152 | 94,105 | 85,277 | 66,985 | |||||||||||||
Gross profit |
147,342 | 132,954 | 118,320 | 93,371 | 86,040 | |||||||||||||
Operating expenses: |
||||||||||||||||||
Selling expenses |
73,131 | 69,983 | 62,198 | 50,229 | 40,441 | |||||||||||||
General and administrative expenses |
29,374 | 24,676 | 21,007 | 17,649 | 27,682 | |||||||||||||
Amortization of acquired intangibles |
4,714 | 5,312 | 6,172 | 7,597 | 9,276 | |||||||||||||
Abandoned lease charge(1) |
— | — | 4,407 | — | — | |||||||||||||
Operating income |
40,123 | 32,983 | 24,536 | 17,896 | 8,641 | |||||||||||||
Other income (expense) |
||||||||||||||||||
Interest expense |
(4,588 | ) | (6,356 | ) | (24,710 | ) | (21,951 | ) | (12,472 | ) | ||||||||
Other income (expense), net |
261 | (91 | ) | 117 | 154 | (72 | ) | |||||||||||
Income (loss) from continuing operations before income taxes |
35,796 | 26,536 | (57 | ) | (3,901 | ) | (3,903 | ) | ||||||||||
Income tax expense (benefit) |
14,242 | 9,748 | (1,851 | ) | 2,953 | 2,273 | ||||||||||||
Income (loss) from continuing operations |
21,554 | 16,788 | 1,794 | (6,854 | ) | (6,176 | ) | |||||||||||
Discontinued operations, net of tax |
(4,653 | ) | 757 | 3,261 | 4,107 | 4,255 | ||||||||||||
Net income (loss) attributable to FGX International Holdings Limited |
16,901 | 17,545 | 5,055 | (2,747 | ) | (1,921 | ) | |||||||||||
Less: net income attributable to noncontrolling interest |
408 | 527 | 347 | 233 | 351 | |||||||||||||
Net income (loss) attributable to FGX International Holdings Limited |
$ | 16,493 | $ | 17,018 | $ | 4,708 | $ | (2,980 | ) | $ | (2,272 | ) | ||||||
Income (loss) from continuing operations attributable to FGX International Holdings Limited: |
||||||||||||||||||
Income (loss) from continuing operations |
$ | 21,554 | $ | 16,788 | $ | 1,794 | $ | (6,854 | ) | $ | (6,176 | ) | ||||||
Less: Net income attributable to noncontrolling interest |
408 | 527 | 347 | 233 | 351 | |||||||||||||
Income (loss) from continuing operations attributable to FGX International Holdings Limited |
$ | 21,146 | $ | 16,261 | $ | 1,447 | $ | (7,087 | ) | $ | (6,527 | ) | ||||||
Basic earnings (loss) per share(2): |
||||||||||||||||||
Income (loss) from continuing operations attributable to FGX International Holdings Limited |
$ | 0.96 | $ | 0.76 | $ | 0.09 | $ | (0.48 | ) | $ | (0.45 | ) | ||||||
Discontinued operations, net of tax |
(0.21 | ) | 0.04 | 0.21 | 0.28 | 0.30 | ||||||||||||
Basic earnings (loss) per share attributable to FGX International Holdings Limited shareholders |
$ | 0.75 | $ | 0.80 | $ | 0.30 | $ | (0.20 | ) | $ | (0.16 | ) | ||||||
Diluted earnings (loss) per share(3): |
||||||||||||||||||
Income (loss) from continuing operations attributable to FGX International Holdings Limited |
$ | 0.95 | $ | 0.76 | $ | 0.09 | $ | (0.48 | ) | $ | (0.45 | ) | ||||||
Discontinued operations, net of tax |
(0.21 | ) | $ | 0.03 | 0.20 | 0.28 | 0.30 | |||||||||||
Diluted earnings (loss) per share attributable to FGX International Holdings Limited shareholders |
$ | 0.74 | $ | 0.79 | $ | 0.29 | $ | (0.20 | ) | $ | (0.16 | ) | ||||||
Basic weighted average shares outstanding |
22,128 | 21,311 | 15,941 | 14,838 | 14,376 | |||||||||||||
Diluted weighted average shares outstanding |
22,398 | 21,437 | 16,010 | 14,838 | 14,376 | |||||||||||||
25
| |
Fiscal Year Ended | ||||||||||||||||
|---|---|---|---|---|---|---|---|---|---|---|---|---|---|---|---|---|---|
| |
January 2, 2010 |
January 3, 2009 |
December 29, 2007 |
December 30, 2006 |
December 31, 2005 |
||||||||||||
| |
(in thousands) |
||||||||||||||||
Other Data: |
|||||||||||||||||
Net cash provided by (used in): |
|||||||||||||||||
Operating activities |
$ | 41,433 | $ | 34,313 | $ | 10,913 | $ | (903 | ) | $ | 18,804 | ||||||
Investing activities |
(12,406 | ) | (48,906 | ) | (15,472 | ) | (13,948 | ) | (8,801 | ) | |||||||
Financing activities |
(23,111 | ) | 8,639 | (504 | ) | 11,105 | (2,478 | ) | |||||||||
Capital expenditures |
$ | 8,504 | $ | 13,980 | $ | 15,310 | $ | 10,948 | $ | 8,969 | |||||||
| |
As of | |||||||||||||||
|---|---|---|---|---|---|---|---|---|---|---|---|---|---|---|---|---|
| |
January 2, 2010 |
January 3, 2009 |
December 29, 2007 |
December 30, 2006 |
December 31, 2005 |
|||||||||||
| |
(in thousands) |
|||||||||||||||
Consolidated Balance Sheet Data: |
||||||||||||||||
Current assets |
$ | 113,705 | $ | 124,413 | $ | 112,636 | $ | 119,053 | $ | 92,498 | ||||||
Current liabilities |
104,951 | 118,358 | 82,148 | 93,286 | 63,828 | |||||||||||
Property, plant and equipment, net |
16,364 | 20,543 | 21,123 | 18,236 | 18,770 | |||||||||||
Total assets |
254,632 | 273,015 | 211,855 | 221,038 | 201,158 | |||||||||||
Total debt, including current maturities |
107,500 | 130,000 | 120,000 | 213,583 | 202,340 | |||||||||||
Total FGXI shareholders' equity (deficit) |
59,804 | 41,665 | 17,333 | (82,229 | ) | (81,264 | ) | |||||||||
- (1)
- Represents
an additional charge incurred as a result of the continued vacancy at our Miramar, Florida facility. We assumed the lease on this facility in
connection with the Magnivision acquisition during fiscal 2004. See "Management Discussion & Analysis of Financial Condition and Results of Operations—Factors Affecting Our
Results."
- (2)
- Basic
earnings (loss) per share is computed by dividing net income (loss) by the weighted average number of ordinary shares outstanding during the period.
- (3)
- Diluted earnings (loss) per share is computed by dividing net income (loss) by the weighted average number of ordinary shares and dilutive potential ordinary shares outstanding during the period. Under the treasury stock method, the unexercised options and restricted stock units are assumed to be exercised at the beginning of the period or at issuance, if later. Assumed proceeds are then used to purchase ordinary shares at the average market price during the period. Potential ordinary shares for which inclusion would have the effect of increasing diluted earnings per share (i.e., anti-dilutive) are excluded from the computation.
26
Item 7 Management's Discussion and Analysis of Financial Condition and Results of Operations.
Management's Discussion and Analysis of Financial Condition and Results of Operations ("MD&A") is designed to provide a reader of our financial statements with a narrative from the perspective of our management on our financial condition, results of operations, liquidity and certain other factors that may affect our future results.
Our MD&A should be read in conjunction with the Consolidated Financial Statements and related Notes included in Item 8, Financial Statements and Supplementary Data, of this Form 10-K.
On October 18, 2007, the Company effected a 242,717 to one stock split of its ordinary shares. All share data has been retroactively restated to reflect the split.
Recent Developments
On December 15, 2009, we entered into a definitive agreement to merge with a subsidiary of Essilor. Under the terms of the Merger Agreement, our shareholders will receive $19.75 per share in cash upon completion of the merger contemplated by the Merger Agreement. If the merger is completed, we will become a wholly owned subsidiary of Essilor.
The transaction is subject to customary closing conditions, including approval by our shareholders. A special meeting of shareholders to consider and vote upon the approval of the merger is currently scheduled for March 9, 2010. Our principal shareholder, an affiliate of Berggruen Holdings, which owns approximately 32% of outstanding shares, and key members of our senior management team have agreed to vote their shares in favor of the merger. The merger is expected to be completed in the first quarter of 2010, but there is no assurance that the merger will be completed. Statements in the following discussion and analysis relating to our business strategies, operating plans, planned expenditures, expected capital requirements and other forward-looking statements regarding our business are made on the basis that the Company remains independent and do not take into account potential future impacts of our proposed acquisition by Essilor International.
On October 28, 2009, we acquired all of the outstanding stock of Corinne McCormack, Inc. of New York, NY, a designer and marketer of eyewear and accessories, and eye-bar inc., a related e-commerce company, in exchange for $1.45 million in cash. Corinne McCormack's sales are reported in the non-prescription reading glasses segment.
In the second quarter of 2009, we decided to divest the costume jewelry business to focus on the core optical business segments. The costume jewelry business qualified for held for sale treatment in the second quarter of 2009. We recorded pre-tax charges in the second quarter of 2009 totaling $5.0 million, including estimated future product returns of $3.6 million, inventory write-downs of $0.8 million, display fixture write-offs of $0.3 million and other costs of $0.3 million related to the divestiture, and a $1.8 million pre-tax goodwill impairment in the first quarter of 2009. We have presented the results of operations and financial position of this business in discontinued operations in the Consolidated Statements of Operations, Consolidated Balance Sheets and Consolidated Statements of Cash Flows for all periods presented. On July 23, 2009, we completed a sale of assets related to the costume jewelry business for consideration of approximately $1.3 million, and no significant costs are expected to be incurred in future periods.
In the fourth quarter of 2009, we decided to close the San Luis Obispo, California warehouse and distribution center and consolidate the operations of that facility into our Smithfield distribution center during the first quarter of 2010.
27
Overview
- •
- Net sales increased 9.3% in 2009 to $259.3 million. The increase reflected the addition of sales by Dioptics
Medical Products, acquired in November 2008, and organic growth, partially offset by the loss of an opening price point reading glasses program at a major customer.
- •
- Gross margin as a percentage of net sales improved to 56.8% in 2009 versus 56.1% in 2008. This increase was driven by
favorable product mix, lower product costs and reduced freight rates.
- •
- Income from continuing operations attributable to the Company increased from $16.3 million, or $0.76 per diluted
share, in 2008 to $21.1 million, or $0.95 per diluted share, in 2009. This increase was driven by higher sales, improved margins and lower operating expenses as a percentage of net sales
resulting from the leveraging effect of increased volume.
- •
- Net income attributable to the Company's shareholders decreased 3.1% to $16.5 million in 2009 from
$17.0 million in 2008. The decrease was driven by charges related to divestiture of our costume jewelry business and transactions costs related to the pending merger with a subsidiary of
Essilor International.
- •
- Cash flow provided from operating activities was $41.4 million in 2009 compared to $34.3 million in 2008 due to improved profitability and improvements in working capital management.
Results of Operations
The following table sets forth, for the periods indicated, selected statement of operations data as a percentage of net sales:
| |
Fiscal Year Ended | |||||||||||
|---|---|---|---|---|---|---|---|---|---|---|---|---|
| |
January 2, 2010 |
January 3, 2009 |
December 29, 2007 |
|||||||||
Net sales |
100.0 | % | 100.0 | % | 100.0 | % | ||||||
Cost of goods sold |
43.2 | 43.9 | 44.3 | |||||||||
Gross profit |
56.8 |
56.1 |
55.7 |
|||||||||
Operating expenses: |
||||||||||||
Selling expenses |
28.2 | 29.6 | 29.3 | |||||||||
General and administrative expenses |
11.3 | 10.4 | 9.9 | |||||||||
Amortization of acquired intangibles |
1.8 | 2.2 | 2.9 | |||||||||
Abandoned lease charge |
— | — | 2.1 | |||||||||
Operating income |
15.5 | 13.9 | 11.5 | |||||||||
Other income (expense): |
||||||||||||
Interest expense |
(1.8 | ) | (2.7 | ) | (11.6 | ) | ||||||
Other income, net |
0.1 | — | 0.1 | |||||||||
Income from continuing opetations before income taxes |
13.8 | 11.2 | 0.0 | |||||||||
Income tax expense (benefit) |
5.5 | 4.1 | (0.9 | ) | ||||||||
Income from continuing operations |
8.3 | 7.1 | 0.9 | |||||||||
Discontinued operations, net of tax |
(1.8 | ) | 0.3 | 1.5 | ||||||||
Net income |
6.5 | 7.4 | 2.4 | |||||||||
Less: Net income attributable to noncontrolling interest |
0.1 | 0.2 | 0.2 | |||||||||
Net income attributable to the Company |
6.4 | % | 7.2 | % | 2.2 | % | ||||||
28
The following table sets forth, for the periods indicated, selected segment data as a percentage of net sales:
| |
Fiscal Year Ended | ||||||||||||||||||
|---|---|---|---|---|---|---|---|---|---|---|---|---|---|---|---|---|---|---|---|
Segment Net Sales
|
January 2, 2010 |
January 3, 2009 |
December 29, 2007 |
||||||||||||||||
Non-prescription reading glasses |
$ | 128,476 | 49.6 | % | $ | 126,761 | 53.5 | % | $ | 117,862 | 55.5 | % | |||||||
Sunglasses and prescription frames |
99,610 | 38.4 | 78,991 | 33.3 | 61,717 | 29.0 | |||||||||||||
International |
31,189 | 12.0 | 31,354 | 13.2 | 32,846 | 15.5 | |||||||||||||
Net sales |
$ | 259,275 | 100.0 | % | $ | 237,106 | 100.0 | % | $ | 212,425 | 100.0 | % | |||||||
The following table sets forth, for the periods indicated, selected operating results by segment.
| |
Fiscal Year Ended | |||||||||||||||||||
|---|---|---|---|---|---|---|---|---|---|---|---|---|---|---|---|---|---|---|---|---|
Segment
|
January 2, 2010 |
January 3, 2009 |
December 29, 2007 |
|||||||||||||||||
| |
(dollars in thousands) |
|||||||||||||||||||
Non-prescription reading glasses |
||||||||||||||||||||
Net sales |
$ | 128,476 | 100.0 | % | $ | 126,761 | 100.0 | % | $ | 117,862 | 100.0 | % | ||||||||
Cost of goods sold |
49,168 | 38.3 | 49,631 | 39.2 | 46,759 | 39.7 | ||||||||||||||
Gross profit |
$ | 79,308 | 61.7 | % | $ | 77,130 | 60.8 | % | $ | 71,103 | 60.3 | % | ||||||||
Sunglasses and prescription frames |
||||||||||||||||||||
Net sales |
$ | 99,610 | 100.0 | % | $ | 78,991 | 100.0 | % | $ | 61,717 | 100.0 | % | ||||||||
Cost of goods sold |
51,625 | 51.8 | 43,458 | 55.0 | 35,376 | 57.3 | ||||||||||||||
Gross profit |
$ | 47,985 | 48.2 | % | $ | 35,533 | 45.0 | % | $ | 26,341 | 42.7 | % | ||||||||
International |
||||||||||||||||||||
Net sales |
$ | 31,189 | 100.0 | % | $ | 31,354 | 100.0 | % | $ | 32,846 | 100.0 | % | ||||||||
Cost of goods sold |
11,140 | 35.7 | 11,063 | 35.3 | 11,970 | 36.4 | ||||||||||||||
Gross profit |
$ | 20,049 | 64.3 | % | $ | 20,291 | 64.7 | % | $ | 20,876 | 63.6 | % | ||||||||
Fiscal 2009 Compared to Fiscal 2008
Net Sales. Net sales increased by $22.2 million, or 9.3%, from $237.1 million in fiscal 2008 to $259.3 million in fiscal 2009.
In the non-prescription reading glasses segment, net sales increased by $1.7 million, or 1.4%, from $126.8 million in fiscal 2008 to $128.5 million in fiscal 2009. This increase was due to organic growth at existing customers, including a $11.5 million increase at a major customer due to a program update, promotions and change in pricing structure, partially offset by the $5.9 million impact of the loss of an opening price point program at a major customer in 2008 and the $3.8 million impact of the reduction of inventory levels at another major customer.
In the sunglasses and prescription frames segment, net sales increased by $20.6 million, or 26.1%, from $79.0 million in fiscal 2008 to $99.6 million in fiscal 2009. This increase was due to the $29.4 million incremental impact of a full year of sales by Dioptics Medical Products, which was acquired in November 2008, partially offset by a non-anniversaried product roll-out that drove a $4.7 million decrease in sales to a major customer and a $4.1 million impact of a reduction of promotional programs at another major customer.
29
In the international segment, net sales decreased by $0.2 million, or 0.5%, from $31.4 million in fiscal 2008 to $31.2 million fiscal 2009. This decrease was attributable to an approximately $4.3 million unfavorable foreign exchange impact and non-anniversaried roll-outs in the U.K., partially offset by a $5.8 million reading glasses roll-out to a major customer in Canada.
Gross Profit. Gross profit increased by $14.3 million, or 10.8%, from $133.0 million in fiscal 2008 to $147.3 million in fiscal 2009. As a percentage of net sales, gross profit increased from 56.1% to 56.8% in the corresponding periods.
In the non-prescription reading glasses segment, gross profit increased by $2.2 million, or 2.8%, from $77.1 million in fiscal 2008 to $79.3 million in fiscal 2009. As a percentage of net sales, gross profit increased from 60.8% to 61.7% during the corresponding periods. The increase in gross profit as a percentage of net sales was due to lower product costs, partially offset by the discontinuation of a high gross margin opening price point program at a major retailer.
In the sunglasses and prescription frames segment, gross profit increased by $12.5 million, or 35.0%, from $35.5 million in fiscal 2008 to $48.0 million in fiscal 2009. As a percentage of net sales, gross profit increased from 45.0% to 48.2% in the corresponding periods. The increase in gross profit as a percentage of net sales was driven by sales of the higher gross margin Dioptics products, acquired in November 2008.
In the international segment, gross profit decreased by $0.3 million, or 1.2%, from $20.3 million in fiscal 2008 to $20.0 million in fiscal 2009. As a percentage of net sales, gross profit decreased from 64.7% to 64.3% in the corresponding periods. The decrease in gross profit as a percentage of net sales resulted from a higher margin reading glasses roll-out to a major Canadian retailer, partially offset by unfavorable foreign exchange rates and a lower-margin reading glasses program rolled out to a new U.K. customer in 2009.
Selling Expenses. Selling expenses increased by $3.1 million, or 4.5%, from $70.0 million in fiscal 2008 to $73.1 million in fiscal 2009. As a percentage of net sales, selling expenses decreased from 29.6% to 28.2% in the corresponding periods due to the leveraging effect of increased volume. The increase in selling expenses was due to incremental selling expenses of $5.8 million from a full year of operations of Dioptics Medical Products, which we acquired in November 2008, increased field service costs of $3.6 million due to a higher number of customer store locations, and a $2.7 million increase in marketing costs driven by television advertising campaigns that concluded at the end of the second quarter. These increases were partially offset by a $3.2 million decrease in freight costs, a $2.7 million decrease in depreciation and other expense reductions.
General and Administrative Expenses. General and administrative expenses increased by $4.7 million, or 19.0%, from $24.7 million in fiscal 2008 to $29.4 million in fiscal 2009. As a percentage of net sales, general and administrative expenses increased from 10.4% to 11.3% in the corresponding periods. The dollar increase was the result of incremental expenses of $2.8 million from a full year of operations of Dioptics Medical Products, which we acquired in November 2008, and $1.9 million of costs related to an agreement to merge with a subsidiary of Essilor International.
Amortization of Acquired Intangibles. Amortization of acquired intangibles decreased by $0.6 million, or 11.3%, from $5.3 million in fiscal 2008 to $4.7 million in fiscal 2009. This decrease was due to certain intangible assets associated with the acquisition of Magnivision being amortized on an accelerated basis over their economic lives, partially offset by $0.9 million of incremental amortization of acquired Dioptics intangible assets.
Interest Expense. Interest expense decreased $1.8 million, or 27.8%, from $6.4 million in fiscal 2008 to $4.6 million in fiscal 2009. This decrease was the result of lower interest rates.
30
Income Taxes. Provision for income taxes increased from $9.7 million, or 36.7% of pre-tax income, in fiscal 2008 to $14.2 million, or 39.8% of pre-tax income in fiscal 2009. The change in income tax rate resulted from a valuation allowance established for the carryforward of foreign tax credits.
Income from Continuing Operations. For the reasons described above, income from continuing operations increased by $4.8 million, or 28.4%, from $16.8 million in fiscal 2008 to $21.6 million in fiscal 2009.
Discontinued Operations, Net of Tax. Discontinued operations decreased $5.5 million from income of $0.8 million in fiscal 2008 to a loss of $4.7 million in fiscal 2009. We recorded pre-tax charges totaling $5.0 million, including estimated future product returns of $3.6 million, inventory write-downs of $0.8 million, display fixture write-offs of $0.3 million and other costs of $0.3 million in the second quarter of 2009 related to the divestiture of the costume jewelry business, and a $1.8 million pre-tax goodwill impairment in the first quarter of 2009. We ceased operations of the jewelry business upon completion of the sale on July 23, 2009.
Net Income. For the reasons described above, net income attributable to our shareholders decreased by $0.5 million from $17.0 million in fiscal 2008 to $16.5 million in fiscal 2009.
Fiscal 2008 Compared to Fiscal 2007
The following has been modified from the corresponding discussion in our Form 10-K for 2008 to reflect that the results of our former costume jewelry business are now included in discontinued operations for the periods discussed.
Net Sales. Net sales increased by $24.7 million, or 11.6%, from $212.4 million in fiscal 2007 to $237.1 million in fiscal 2008.
In the non-prescription reading glasses segment, net sales increased by $8.9 million, or 7.6%, from $117.9 million in fiscal 2007 to $126.8 million in fiscal 2008. This increase was due to the full year impact of a new program launched at a major customer at the end of 2007 which contributed $5.5 million of incremental sales in 2008, a new customer that contributed $3.7 million of sales, a reset at a major customer that generated $3.4 million of additional revenue, partially offset by a loss of an opening price point program at a major customer.
In the sunglasses and prescription frames segment, net sales increased by $17.3 million, or 28.0%, from $61.7 million in fiscal 2007 to $79.0 million in fiscal 2008. This increase was due to a new program launched at a major customer which contributed $11.1 million in sales, an expanded promotional program that generated an additional $3.4 million in sales at a major customer sales from our Dioptics acquisition (that closed on November 26, 2008), that generated $2.1 million of sales, as well as promotional roll-outs and organic sales growth at other existing customers.
In the international segment, net sales decreased by $1.4 million, or 4.5%, from $32.8 million in fiscal 2007 to $31.4 million in fiscal 2008. This decrease was due to a non-anniversaried reading glass roll-out in the U.K. in the first quarter of 2007 combined with approximately $0.8 million unfavorable foreign exchange difference caused by the strengthening U.S. dollar.
Gross Profit. Gross profit increased by $14.6 million, or 12.4%, from $118.3 million in fiscal 2007 to $133.0 million in fiscal 2008. As a percentage of net sales, gross profit increased from 55.7% to 56.1% in the corresponding periods.
In the non-prescription reading glasses segment, gross profit increased by $6.0 million, or 8.5%, from $71.1 million in fiscal 2007 to $77.1 million in fiscal 2008. As a percentage of net sales, gross profit increased from 60.3% to 60.8% during the corresponding periods. The dollar increase in gross
31
profit was due to the increase in net sales. The increase in gross profit as a percentage of net sales was the result of favorable product mix and lower product costs from our suppliers.
In the sunglasses and prescription frames segment, gross profit increased by $9.2 million, or 34.9%, from $26.3 million in fiscal 2007 to $35.5 million in fiscal 2008. As a percentage of net sales, gross profit increased from 42.7% to 45.0% in the corresponding periods. The dollar increase in gross profit was due to the increase in net sales combined with our Dioptics acquisition, which contributed $1.0 million of gross profit. The increase in gross profit as a percentage of net sales was the result of increased sales to a major retailer that carried higher gross margins, partially offset by increased sales of a promotional program to a different major retailer that carried lower gross margins.
In the international segment, gross profit decreased by $0.6 million, or 2.8%, from $20.9 million in fiscal 2007 to $20.3 million in fiscal 2008. As a percentage of net sales, gross profit increased from 63.6% to 64.7% in the corresponding periods. The dollar decrease in gross profit was due to the decreases in net sales. The increase in gross profit as a percentage of net sales resulted from favorable sales mix in Canada, partially offset by higher product returns in the U.K.
Selling Expenses. Selling expenses increased by $7.8 million, or 12.5%, from $62.2 million in fiscal 2007 to $70.0 million in fiscal 2008. As a percentage of net sales, selling expenses increased from 29.3% to 29.5% in the corresponding periods. The increase in selling expenses was due to higher depreciation expenses of $2.0 million related to increased number of display fixtures placed in service, increased field service costs of $1.6 million due to the increased number of customer store locations, increased variable selling costs resulting from higher sales volume, incremental selling expenses of $0.5 million from our Dioptics acquisition and increased personnel, costs including stock compensation charges.
General and Administrative Expenses. General and administrative expenses increased by $3.7 million, or 17.5%, from $21.0 million in fiscal 2007 to $24.7 million in fiscal 2008. As a percentage of net sales, general and administrative expenses increased from 9.9% to 10.4% in the corresponding periods. The dollar increase was the result of incremental costs associated with being a public company, which include Sarbanes-Oxley implementation and related costs, incremental compensation costs, including stock compensation charges, to support our growth, and $0.3 million of incremental expenses from our Dioptics acquisition.
Amortization of Acquired Intangibles. Amortization of acquired intangibles decreased by $0.9 million, or 13.9%, from $6.2 million in fiscal 2007 to $5.3 million in fiscal 2008. This decrease was due to certain intangible assets associated with the acquisition of Magnivision being amortized on an accelerated basis over their economic lives, partially offset by $0.1 million of amortization of acquired Dioptics intangible assets.
Abandoned Lease Charge. During fiscal 2007, the Company recorded a total of $4.4 million in abandoned lease charges as a result of the continued vacancy of our Miramar, Florida facility. This charge assumed that the remaining space of this facility will remain vacant through the end of the lease term in April 2011.
Interest Expense. Interest expense decreased $18.3 million, or 74.3%, from $24.7 million in fiscal 2007 to $6.4 million in fiscal 2008. This decrease was primarily due to lower average indebtedness and lower borrowing costs along with the elimination of a $2.8 million charge related to the early extinguishment of debt recognized in 2007 as a result of payment from initial public offering proceeds.
Income Taxes. Provision for income taxes was a benefit of $1.9 million in fiscal 2007 compared to expense of $9.7 million in fiscal 2008. This increase was related to the 2007 release of a portion of the $4.5 million valuation allowance we had previously recorded against U.S. deferred tax assets. We recorded that allowance in prior periods based on our determination at the time that it was more likely than not that our U.S. deferred tax assets would not be realized (primarily due to cumulative losses in
32
the periods preceding recording of the allowance). As a result of improved operating results in the U.S. and our assessment of expected future results in the U.S., we determined that it was more likely than not that a substantial portion of our U.S. deferred tax assets would be realized and released most of our valuation allowance, recognizing an income tax benefit of $3.4 million.
Income from Continuing Operations. For the reasons described above, income from continuing operations increased by $15.0 million, or 835.8%, from $1.8 million in fiscal 2007 to $16.8 million in fiscal 2008.
Discontinued Operations, Net of Tax. Discontinued operations decreased $2.5 million from income of $3.3 million in fiscal 2007 to $0.8 million in fiscal 2008. The decrease was due to a decline in costume jewelry sales driven by the loss of a major customer.
Net Income. For the reasons described above, net income attributable to our shareholders increased by $12.3 million, or 261.5%, from $4.7 million in fiscal 2007 to $17.0 million in fiscal 2008.
Liquidity and Capital Resources
Our primary liquidity needs are for working capital, capital expenditures (specifically, display fixtures), debt service and to fund possible future acquisitions. Our primary sources of cash have been cash flow from operations, net proceeds from our initial public offering and borrowings under our credit facility. As of January 2, 2010, we had $7.9 million of cash and $44.5 million available under our revolving credit facility. As of January 3, 2009, we had $2.1 million of cash and $37.2 million available under our revolving credit facility.
We believe that our cash flow from operations, available cash and borrowings available under our credit facility will be adequate to meet our liquidity needs through at least the next twelve months. However, our ability to make scheduled payments of principal, pay the interest on or refinance our indebtedness or fund planned capital expenditures will depend on our future performance, which, to a certain extent, is subject to general economic, financial, competitive and other factors that are beyond our control. In addition, current worldwide economic conditions, including, without limitation, the reduction in credit available to businesses and consumers, and the high unemployment rate and corresponding weak consumer spending, may substantially reduce demand for our products, which could have a material adverse effect on our liquidity and results of operations.
To the extent we decide to pursue acquisitions, we may need to incur additional indebtedness or sell additional equity to finance those acquisitions.
Cash Flows
The following table summarizes our cash flow activities for the periods indicated:
| |
Fiscal Year Ended | ||||||||||
|---|---|---|---|---|---|---|---|---|---|---|---|
| |
January 2, 2010 |
January 3, 2009 |
December 29, 2007 |
||||||||
| |
(in thousands) |
||||||||||
Net cash provided by (used in): |
|||||||||||
Operating activities |
$ | 41,433 | $ | 34,313 | $ | 10,913 | |||||
Investing activities |
(12,406 | ) | (48,906 | ) | (15,472 | ) | |||||
Financing activities |
(23,111 | ) | 8,639 | (504 | ) | ||||||
Effect of exchange rates on cash balances |
(127 | ) | 3,484 | (33 | ) | ||||||
Increase (decrease) in cash |
$ | 5,789 | $ | (2,470 | ) | $ | (5,096 | ) | |||
33
We purchase finished goods from our contract manufacturers in Asia and take title upon delivery to the freight consolidator. Transit times range from ten to 30 days. Our payment terms with our eyewear suppliers range from 45 to 120 days and provide discounts to us for timely payments. As a result of increases in our overall sales volume, we have used cash to fund our receivables and inventories. In general, these increases are only partially offset by increases in accounts payable to our suppliers.
Operating Activities. During fiscal 2009, the Company generated $41.4 million in cash from operating activities compared to $34.3 million in fiscal 2008. This increase in operating cash flow was due to an $11.8 million increase in cash provided by activities related to inventory, a $6.4 million increase in cash provided by activities related to prepaid expenses and other current assets and a $4.8 million increase in net income from continuing operations, partially offset by a $10.9 million increase in cash used in activities related to accrued income taxes, a $5.2 million increase in cash used in activities related to accounts payable. The change in inventory activity was a result of timing of purchase and shipments of inventory, partially offsetting a change in cash activity from accounts payable. The change in accounts receivable activities is the result of timing of customer collections and credits. The change in accounts payable activities was partially a result of timing of inventory purchases, corresponding to an offsetting change in cash from inventory activities, and partially due to timing of payments to suppliers. The change in accrued income taxes and prepaid expenses and other current assets was the result of tax payments related to the 2008 tax year and estimated tax payments for the 2009 tax year that resulted in a prepaid income tax balance.
Net cash provided by operating activities increased by $23.4 million to $34.3 million in fiscal 2008 from $10.9 million in fiscal 2007. The increase in operating cash flow was due to income from continuing operations that was higher by $15.0 million and increases in accounts payable. The decrease in cash used to pay accounts payable was primarily the result of increased payments in 2007 for purchases to support new business at a major customer at the end of fiscal 2006.
Investing Activities. Net cash used in investing activities decreased from $48.9 million in fiscal 2008 to $12.4 million in fiscal 2009. The decrease in net cash used in investing activities was due to $30.4 million less cash used for acquisitions in 2009 and a $5.5 million decrease in purchases of property, plant and equipment.
Net cash used in investing activities increased from $15.5 million in fiscal 2007 to $48.9 million in fiscal 2008. The increase in net cash used in investing activities was due to the acquisition of Dioptics Medical Products, Inc.
Financing Activities. Net cash used in financing activities increased by $31.7 million to $23.1 million used in fiscal 2009 from $8.6 million provided in fiscal 2008. The increase in net cash used in financing activities was due to net repayments under our revolving credit facility and scheduled payments on our term debt.
Net cash provided by financing activities increased by $9.1 million to $8.6 million in fiscal 2008 from a use of $0.5 million in fiscal 2007. The increase in net cash provided by financing activities was due to additional borrowings under our revolving debt facility to finance our acquisition of Dioptics partially offset by scheduled payments on our term debt.
Capital Expenditures
Our capital expenditures were $8.5 million and $14.0 million for fiscal 2009 and 2008, respectively. The majority of our capital expenditures related to permanent display fixtures, which we provide in our customers' retail locations. We typically depreciate our fixtures using an estimated useful life of two to three years. The future timing and volume of such capital expenditures will be affected by new business, customer contract renewals and replacements of existing fixtures at existing retail customers.
34
At January 2, 2010, we had outstanding commitments for capital expenditures of $3.8 million relating to permanent display fixtures. We intend to fund these expenditures primarily from operating cash flow and borrowings under our revolving credit facility.
Credit Facility
Our credit facility is comprised of (a) a $75.0 million revolving credit facility, which may be increased with the consent of our existing or additional lenders by up to an additional $50.0 million; and (b) a $100.0 million term loan facility. Interest rates for borrowings under the new facility are determined based upon our defined leverage ratio. Interest rates were initially priced at 1.75% above LIBOR and then range from 1.00% to 2.25% above LIBOR for Eurodollar-based borrowings, and from 0.00% to 1.25% above the defined base rate (higher of prime rate or the Federal Funds rate plus 0.5%) for base rate borrowings, depending upon our leverage ratio. The term loan facility is due in 20 consecutive quarterly graduating installments ranging from $1.9 million to $8.1 million. Payment of these installments commenced on March 31, 2008. The term loan facility and the revolving credit facility will mature on December 19, 2012. Amounts due under both facilities are collateralized by a pledge of 100% of our tangible and intangible assets. We are also required to pay commitment and other customary fees. These commitment fees will range from 0.20% to 0.50% per annum depending upon our leverage ratio.
Our credit facility contains covenants limiting, among other things, mergers, consolidations, liquidations and dissolutions; sales of assets; investments and acquisitions; indebtedness; liens and other encumbrances; dividends and other restricted payments; payment and modification of material subordinated debt instruments; transactions with affiliates; changes in fiscal year; negative pledge clauses; restrictions on subsidiary distributions; sale and leaseback transactions; factoring arrangements and changes in lines of business; and capital expenditures. Our credit facility also requires that we comply with leverage ratio and fixed charge coverage ratio covenants. As of January 2, 2010, we were in compliance with these covenants. For a description of risks associated with our credit facility, see "Risk Factors."
As of January 2, 2010, we had outstanding indebtedness of $77.5 million under our term loan facility, $30.0 million outstanding under the revolving credit facility and $0.5 million committed under standby letters of credit. Our borrowing availability under the revolving credit facility was $44.5 million. Principal payments of $17.5 million under the term loan facility are scheduled in the next twelve months. The interest rate on the term loan facility is at the three-month LIBOR rate plus 1.5% (1.76% in aggregate as of January 2, 2010). The interest rate on $10.0 million of the revolving credit facility is at the one-month LIBOR rate plus 1.5% (1.74% in aggregate as of January 2, 2010). The remaining balance of the revolving credit facility is subject to an interest rate of prime plus 0.5% (3.75% in aggregate as of January 2, 2010).
35
Contractual Obligations and Other Commitments
As of January 2, 2010, our contractual obligations and other commitments were as follows:
| |
Payments Due by Period | ||||||||||||||||
|---|---|---|---|---|---|---|---|---|---|---|---|---|---|---|---|---|---|
| |
Total | Less than 1 Year |
1-3 Years | 3-5 Years | More than 5 Years |
||||||||||||
| |
(in thousands) |
||||||||||||||||
Long-term debt obligations(1) |
$ | 77,667 | $ | 17,613 | $ | 60,054 | $ | — | $ | — | |||||||
Interest payment obligations(2) |
4,560 | 2,298 | 2,262 | — | — | ||||||||||||
Operating lease obligations(3) |
5,126 | 3,057 | 1,475 | 321 | 273 | ||||||||||||
Minimum royalty obligations(4) |
1,201 | 594 | 587 | 20 | — | ||||||||||||
Purchase obligations(5) |
34,595 | 34,595 | — | — | — | ||||||||||||
Total(6) |
$ | 123,149 | $ | 58,157 | $ | 64,378 | $ | 341 | $ | 273 | |||||||
- (1)
- Includes
obligations to pay principal only under our credit facility and capital lease obligations. No interest expense is included. Assumes that principal
payments under our credit facility are made as originally scheduled.
- (2)
- Represents
estimated interest payments to be made on our variable rate debt. Assumes that principal payments are made as originally scheduled. Interest
rates used to determine interest payments for variable rate debt are based upon the interest rate in effect on January 2, 2010.
- (3)
- Net
of subleases.
- (4)
- Consists
of obligations for future minimum royalties pertaining to licensed brands to be paid to third-party licensors.
- (5)
- Represents
purchase orders related to inventory and display fixtures.
- (6)
- Excludes approximately $11.9 million of uncertain income tax liabilities that have been recorded in other long-term liabilities in our consolidated balance sheet as of January 2, 2010, in accordance with the Income Tax Topic of FASB ASC. These liabilities are excluded as the Company does not know the ultimate timing of their payment or if they will ultimately be payable due to their uncertain nature.
Off-Balance Sheet Arrangements
As of January 2, 2010, we did not have any off-balance sheet arrangements, as defined in Item 303(a)(4)(ii) of SEC Regulation S-K.
Critical Accounting Estimates
We prepare our consolidated financial statements in accordance with accounting principles generally accepted in the United States. As such, management is required to make certain estimates, judgments and assumptions that affect the reported amounts of assets and liabilities at the date of the financial statements and the reported amounts of revenues and expenses for the periods presented. Management believes that the estimates and judgments reflected in the financial statements included in this Form 10-K were reasonable based on the information available at the respective times. Actual circumstances could differ from those estimates, and any such differences may materially affect our reported results. The estimates and assumptions that management believes are the most significant in preparing our financial statements are described below.
36
Revenue Recognition
Sales are recognized when revenue is realized or realizable and has been earned. We recognize revenue when title to the product, ownership and risk of loss transfer to the customer, which generally is on the date of shipment. We also maintain destination-based terms with a limited number of customers in the United States and with all our customers in the United Kingdom and Mexico pursuant to which we recognize revenue upon confirmation of receipt by the customer. In addition, prior to revenue recognition, we require persuasive evidence of an arrangement, that the price is fixed or determinable, and that collection is reasonably assured. A provision for anticipated returns is recorded as a reduction in sales in the same period as the revenue in accordance with the Revenue Recognition topic of FASB ASC. We account for certain customer promotional payments, volume rebates, cooperative advertising, product placement fees and other discounts as a reduction of revenue. We also enter into multi-year supply agreements with many of our customers, some of which have minimum purchase requirements. Upfront payments and credits to customers are recorded as a reduction of revenue when the customer has earned the credits based on the purchase order or sales contract and are provided for based on our estimates.
Product Returns, Markdowns and Contractual Allowances
Net sales, as reported in our consolidated statements of operations, represent gross shipments to our customers less provisions and charges for product returns, markdowns, damages and contractual allowances. We regularly review and revise our estimates of returns, markdowns and contractual allowances, which are recorded at the time of sale based upon our historical experience in light of actual returns, planned product discontinuances and promotional sales and our estimates and judgments regarding future product sales to our customers. We record returns and markdowns as a reduction to sales and as a reserve against accounts receivable on our consolidated balance sheet. Actual product returns, markdowns and contractual allowances, as well as realized value on product returns, may differ significantly, either favorably or unfavorably, from our estimates.
Contractual allowances include product placement fees, cooperative advertising, volume rebates and other discounts that are agreed upon as a component of our program terms with our customers. These allowances are specific to a customer contract and are recognized at the time of shipment. We record contractual allowances as a reduction of gross sales but not as a reduction of accounts receivable. Instead, we record contractual allowances as an accrued expense on our consolidated balance sheet.
Inventories
Inventories are stated at the lower of cost (first-in, first-out) or market and consist of finished goods. We provide inventory allowances for excess, slow moving and obsolete inventories determined primarily by estimates of future demand. The allowance is measured as the difference between the cost of the inventory and estimated market value and charged to the provision for inventory, which is a component of our cost of goods sold. Assumptions about future demand are among the primary factors used to estimate market value. At the time of the loss recognition, which is recorded to cost of goods sold, a newer, lower-cost basis for that inventory is established and subsequent changes in facts and circumstances do not result in the restoration or increase in the newly established cost basis. Inventory management is a primary management focus as we balance the need to maintain adequate inventory levels to ensure timely customer order fulfillment against the risk of obsolescence because of changing fashion trends and customer requirements.
37
Impairment of Long-Lived Assets
We test for impairment whenever events or changes in circumstances indicate that the carrying value of the asset might not be recoverable from estimated future cash flows. We account for long-lived assets, excluding goodwill and non-amortized trademarks, in accordance with the provisions of the Property, Plant and Equipment Topic of FASB ASC which requires recognition of an impairment loss only if the carrying amount of a long-lived asset or asset group is not recoverable from its estimated undiscounted cash flows. An impairment loss is measured as the difference between the carrying amount and fair value of the asset or asset group.
Valuation of Goodwill and Other Intangible Assets
Goodwill represents the excess of cost over the fair value of the net tangible assets and identifiable intangible assets of businesses acquired. The fair value of identified intangible asset is based upon an estimate of the future economic benefits expected to result from ownership, which represents the amount at which the assets could be bought or sold in a current transaction between willing parties, that is, other than in a forced or liquidation sale. In accordance with the Goodwill and Other Intangibles Topic of FASB ASC, we test our goodwill and indefinite-lived intangibles for impairment annually or more frequently if events or circumstances indicate impairment may exist. We generally complete our annual analysis of goodwill during our fourth fiscal quarter or more frequently if impairment indicators arise. We apply a two-step fair value-based test to assess goodwill impairment. The first step compares the fair value of a reporting unit to its carrying amount, including goodwill. If the carrying amount of the reporting unit exceeds its fair value, the second step is then performed. The second step compares the carrying amount of the reporting unit's goodwill to the fair value of the goodwill. If the fair value of the goodwill is less than the carrying amount, an impairment loss would be recorded in our income from operations. Intangible assets with definite lives are amortized over their estimated useful lives and are also reviewed for impairment if events or changes in circumstances indicate that their carrying value may not be realizable.
We make certain estimates and assumptions in order to determine the fair value of net assets and liabilities, including, among other things, an assessment of market conditions, projected cash flows, cost of capital and growth rates which could significantly impact the reported value of goodwill and other intangible assets. Estimating future cash flows requires significant judgment, and our projections may vary from cash flows eventually realized. When necessary, we engage third-party specialists to assist us with our valuations. The valuations employ a combination of present value techniques to measure fair value, corroborated by comparisons to estimated market multiples. These valuations are based on a discount rate determined by us to be consistent with industry discount rates and the risks inherent in our current business model.
We cannot predict the occurrence of certain future events that might adversely affect the reported value of goodwill and other intangible assets that totaled $112.8 million and $113.8 million at January 2, 2010 and January 3, 2009, respectively. Such events include strategic decisions made in response to economic and competitive conditions, the impact of the economic environment on our customer base or material negative changes in our relationships with material customers.
Stock-Based Compensation
We have a stock-based compensation plan for employees and non-employee members of our board of directors. Under this plan, we grant restricted stock units and options to purchase our shares at or above the fair market value of our shares. FASB ASC Topic 718, "Compensation-Stock Compensation," requires us to measure all stock-based compensation awards using a fair value method and record such expense in our consolidated financial statements. We use the Black-Scholes option pricing model to value the options that are granted under these plans. The Black-Scholes method includes four
38
significant assumptions: (1) expected term of the option, (2) risk-free interest rate, (3) expected dividend yield and (4) expected stock price volatility.
Concentration of Credit Risk
We must estimate the collectibility of our accounts receivable. Management specifically analyzes accounts receivable balances in view of customer credit worthiness, customer concentrations, historical bad debts, current economic trends, and changes in our customer payment terms when evaluating the adequacy of the allowance for doubtful accounts. Three customers together accounted for 59% and 61% of our accounts receivable at January 2, 2010 and at January 3, 2009, respectively. To reduce credit risk, we purchase credit insurance, as we deem appropriate. Historical write-offs, as a result of uncollectibility, have been less than 1% of net sales annually.
Income Taxes
Significant management judgment is required in determining our provision for income taxes, deferred tax assets and liabilities and any valuation allowance. Our effective tax rates differ from the statutory rate due to the impact of acquisition-related costs, state taxes, and the tax impact of non-U.S. operations. Our future effective tax rates could be adversely affected by earnings being lower than anticipated in countries where we have lower statutory rates, and vice versa. Changes in the valuation of our deferred tax assets or liabilities, or changes in tax laws or interpretations thereof may also adversely affect our future effective tax rate. In addition, we are subject to the examination of our income tax returns by the IRS and other tax authorities. We regularly assess the likelihood of adverse outcomes resulting from these examinations to determine the adequacy of our provision for income taxes.
At January 2, 2010 and January 3, 2009, our total valuation allowance was $4.9 million and $2.9 million, respectively, due to foreign net operating loss carry forwards and foreign tax credits. The valuation allowance is based on estimates of taxable income in each of the jurisdictions in which we operate and the period over which our deferred tax assets will be recoverable. If market conditions improve and future results of operations exceed our current expectations, our existing tax valuation allowances may be adjusted, resulting in future tax benefits. Alternatively, if market conditions deteriorate further or future results of operations are less than expected, future assessments may result in a determination that some or all of the deferred tax assets are not realizable. As a result, we may need to establish additional tax valuation allowances for all or a portion of the gross deferred tax assets, which may have a material adverse effect on our business, results of operations and financial condition.
Item 7A Quantitative and Qualitative Disclosures about Market Risk.
We are exposed to market risk from changes in interest rates and foreign currency exchange rates, which may adversely affect our results of operations and financial condition.
Our exposure to interest rate risk currently relates to amounts outstanding under our revolving and term loan credit facility. This facility is comprised of a $100.0 million term loan facility and a $75.0 million revolving credit facility. As of January 2, 2010, we had $77.5 million outstanding under the term loan facility and $30.0 million outstanding under the revolving credit facility. The term loan facility bore interest of 1.5% above three-month LIBOR, or 1.76% in aggregate, at January 2, 2010. $10.0 million of the revolving credit facility bore interest of 1.5% above one-month LIBOR, or 1.74% in aggregate, at January 2, 2010. The remaining balance of the revolving credit facility bore interest of 0.5% above prime, or 3.75% in aggregate, at January 2, 2010. A hypothetical change in the interest rate of 100 basis points would have an effect on our results of operations and cash flows of approximately $0.7 million over the next four quarters.
39
On March 10, 2008, we entered into an interest rate swap agreement (the "Swap") to manage our exposure to floating interest rate risk on our credit facility. The Swap has an initial notional amount of $49.1 million and is scheduled to decline to reflect certain scheduled principal payments under the term loan facility. Currently, we are borrowing under the term loan facility at a floating interest rate based on three-month LIBOR (plus 1.5% under the terms of our term loan facility) and will pay under the Swap a fixed interest rate of 3.22% (plus 1.5% under the terms of our term loan facility) through December 19, 2012.
The Swap has been designated as a cash flow hedge in accordance with the Derivatives and Hedging Topic of FASB ASC and we record the effective portion of any change in the fair value as other comprehensive income (loss), net of tax.
We are subject to risk from changes in the foreign exchange rates relating to our Canadian and U.K. subsidiaries, and our Mexico joint venture. Assets and liabilities of these entities are translated to U.S. dollars at period-end exchange rates. Income and expense items are translated at average rates of exchange prevailing during the period. Translation adjustments are accumulated as a separate component of shareholders' equity. Gains and losses, which result from foreign currency transactions, are included as other income (expense) in the accompanying condensed consolidated statements of operations. The potential loss resulting from a hypothetical 10.0% adverse change in the quoted foreign currency exchange rate amounts would not have a material impact on our annual results of operations and cash flows.
Item 8 Financial Statements and Supplementary Data.
The response to this Item is included as a separate section of this report immediately following Item 15.
Item 9 Changes in and Disagreements with Accountants on Accounting and Financial Disclosure.
None.
Item 9A Controls and Procedures.
Evaluation of Disclosure Controls and Procedures.
We carried out an evaluation, under the supervision and with the participation of our Chief Executive Officer and Chief Financial Officer, of the effectiveness of the design and operation of our disclosure controls and procedures (as defined in Rules 13a-15(e) and 15d-15(e) of the Securities Exchange Act of 1934, as amended (the "Exchange Act")) as of the last day of the period covered by this report, January 2, 2010 (the "Evaluation Date"). Based on this evaluation, our Chief Executive Officer and Chief Financial Officer concluded that, as of the Evaluation Date, our disclosure controls and procedures were effective.
Our management, including the Chief Executive Officer and Chief Financial Officer, does not expect that our disclosure controls and procedures will prevent all errors and all fraud. A control system, no matter how well designed and operated, can provide only reasonable, not absolute, assurance that the objectives of the control system are met. Because of the inherent limitations in all control systems, no evaluation of controls can provide absolute assurance that all control issues and instances of fraud, if any, within the Company have been detected.
Management's Annual Report on Internal Control over Financial Reporting.
Our management is responsible for establishing and maintaining adequate internal control over financial reporting, as defined in Rules 13a-15(f) or 15d-15(f) promulgated under the Exchange Act. Our internal control system is designed to provide reasonable assurance regarding the reliability of
40
financial reporting and the preparation of financial statements for external purposes in accordance with U.S. generally accepted accounting principles.
Our management assessed the effectiveness of our internal control over financial reporting as of January 2, 2010, the last day of our most recent fiscal year. In making this assessment, our management used the criteria set forth by the Committee of Sponsoring Organizations of the Treadway Commission in "Internal Control-Integrated Framework."
Based on its assessment, our management concluded that, as of January 2, 2010, our internal control over financial reporting was effective based on those criteria.
The effectiveness of our internal control over financial reporting as of January 2, 2010 has been audited by KPMG LLP, an independent registered public accounting firm, as stated in its report which is below.
Because of its inherent limitations, internal control over financial reporting may not prevent or detect misstatements. One should not project any evaluation of effectiveness to future periods because controls may become inadequate because of changes in conditions or the degree of compliance with the policies or procedures may deteriorate.
Report of Independent Registered Public Accounting Firm
The
Board of Directors and Shareholders
FGX International Holdings Limited:
We have audited FGX International Holdings Limited's internal control over financial reporting as of January 2, 2010, based on criteria established in Internal Control—Integrated Framework issued by the Committee of Sponsoring Organizations of the Treadway Commission (COSO). FGX International Holdings Limited's management is responsible for maintaining effective internal control over financial reporting and for its assessment of the effectiveness of internal control over financial reporting, included in the accompanying Management's Annual Report on Internal Control over Financial Reporting. Our responsibility is to express an opinion on the Company's internal control over financial reporting based on our audit.
We conducted our audit in accordance with the standards of the Public Company Accounting Oversight Board (United States). Those standards require that we plan and perform the audit to obtain reasonable assurance about whether effective internal control over financial reporting was maintained in all material respects. Our audit included obtaining an understanding of internal control over financial reporting, assessing the risk that a material weakness exists, and testing and evaluating the design and operating effectiveness of internal control based on the assessed risk. Our audit also included performing such other procedures as we considered necessary in the circumstances. We believe that our audit provides a reasonable basis for our opinion.
A company's internal control over financial reporting is a process designed to provide reasonable assurance regarding the reliability of financial reporting and the preparation of financial statements for external purposes in accordance with generally accepted accounting principles. A company's internal control over financial reporting includes those policies and procedures that (1) pertain to the maintenance of records that, in reasonable detail, accurately and fairly reflect the transactions and dispositions of the assets of the company; (2) provide reasonable assurance that transactions are recorded as necessary to permit preparation of financial statements in accordance with generally accepted accounting principles, and that receipts and expenditures of the company are being made only in accordance with authorizations of management and directors of the company; and (3) provide reasonable assurance regarding prevention or timely detection of unauthorized acquisition, use, or disposition of the company's assets that could have a material effect on the financial statements.
41
Because of its inherent limitations, internal control over financial reporting may not prevent or detect misstatements. Also, projections of any evaluation of effectiveness to future periods are subject to the risk that controls may become inadequate because of changes in conditions, or that the degree of compliance with the policies or procedures may deteriorate.
In our opinion, FGX International Holdings Limited maintained, in all material respects, effective internal control over financial reporting as of January 2, 2010, based on criteria established in Internal Control—Integrated Framework issued by the Committee of Sponsoring Organizations of the Treadway Commission.
We also have audited, in accordance with the standards of the Public Company Accounting Oversight Board (United States), the consolidated balance sheets of FGX International Holdings Limited and subsidiaries as of January 2, 2010 and January 3, 2009, and the related consolidated statements of operations, shareholders' equity (deficit) and comprehensive income, and cash flows for the fiscal years ended January 2, 2010, January 3, 2009 and December 29, 2007, and our report dated March 8, 2010 expressed an unqualified opinion on those consolidated financial statements.
| /s/ KPMG LLP | ||
Providence, Rhode Island March 8, 2010 |
Changes in Internal Controls over Financial Reporting
No change in our internal control over financial reporting (as such term is defined in Exchange Act Rule 13a-15(f)) occurred during the fiscal quarter ended January 2, 2010 that materially affected, or is reasonably likely to materially affect, our internal control over financial reporting.
None.
42
Item 10 Directors, Executive Officers and Corporate Governance.
Executive Officers
Set forth below is a list of our executive officers as of January 2, 2010, their ages and positions, and a brief description of the recent business experience of each one.
Name
|
Age | Position | |||
|---|---|---|---|---|---|
Alec Taylor |
56 | Chief Executive Officer and Director | |||
John H. Flynn, Jr. |
59 | President | |||
Anthony Di Paola |
43 | Executive Vice President, Chief Financial Officer and Treasurer | |||
Steven Crellin |
50 | Executive Vice President, Sales and President, Dioptics Medical Products, Inc. | |||
Jeffrey J. Giguere |
49 | Executive Vice President, General Counsel and Secretary | |||
Gerald Kitchen |
61 | Executive Vice President, Operations | |||
Richard Kornhauser |
55 | Executive Vice President, Chief Marketing Officer | |||
Robert Grow |
52 | Executive Vice President, Product Development | |||
Alec Taylor, Chief Executive Officer and Director—Mr. Taylor has been our Chief Executive Officer since October 2005. Before joining us, he was President and Chief Operating Officer of Chattem, Inc., a publicly traded manufacturer and marketer of health and beauty products, toiletries and dietary supplements, from January 1998 to September 2005 and a director of Chattem from 1993 to 2005. Mr. Taylor was previously an attorney with Miller and Martin in Chattanooga, Tennessee, from 1978 to January 1998.
John H. Flynn, Jr., President—Mr. Flynn has served as our President since December 2004. Mr. Flynn was the Executive Vice President, Sales of AAi.FosterGrant, Inc. from 1998 to December 2004, President and CEO of the predecessor of AAi.FosterGrant, Inc. from 1985 to 1998, and Vice President of AAi.FosterGrant, Inc. (then known as Accessories Associates Inc.) from 1982 to 1985. Mr. Flynn is a director of the Sunglass Association of America Inc.
Anthony Di Paola, Executive Vice President, Chief Financial Officer and Treasurer—Mr. Di Paola has served as our Executive Vice President, Chief Financial Officer and Treasurer since July 2007. Prior to that, Mr. Di Paola held various finance positions at General Electric, including Americas Controller for GE Water & Process Technologies, from February 2005 to July 2007. Mr. Di Paola previously served as Vice President and Corporate Controller of Ionics, Inc., a publicly traded supplier of water purification and wastewater treatment equipment and services, from May 2000 to February 2005, when Ionics was acquired by General Electric Company.
Steven Crellin, Executive Vice President, Sales—Mr. Crellin has served as President of Dioptics Medical Products, Inc. since January 2009 and as our Executive Vice President, Domestic Sales since January 2006. Prior to that Mr. Crellin was our Executive Vice President, Magnivision from October 2004 to December 2005 and the Vice President, Sales of Magnivision from February 1998 to October 2004. Mr. Crellin sits on the advisory board of the National Association of Chain Drug Stores and is a director of the Sunglass Association of America Inc.
Jeffrey J. Giguere, Executive Vice President, General Counsel and Secretary—Mr. Giguere has served as our Executive Vice President, General Counsel and Secretary since April 2007. Mr. Giguere was Vice President, General Counsel and Secretary of American Power Conversion Corporation, a publicly traded provider of back-up power products and services, from June 2001 to March 2007, and General Counsel from April 2000 to June 2001.
43
Gerald Kitchen, Executive Vice President, Operations—Mr. Kitchen has served as our Executive Vice President, Operations since January 2007, and was our Vice President, Operations since September 2004 and the Vice President, Operations of our subsidiary, AAi.FosterGrant, Inc., since January 2004. Before that, Mr. Kitchen served as President of Blue Mountain Industries, Inc., a textile manufacturer, during 2003, Vice President of Global Sourcing for Roam International Limited, a luggage importer, from April 2000 to December 2002.
Richard Kornhauser, Executive Vice President, Marketing—Mr. Kornhauser has served as Executive Vice President and Chief Marketing Officer since January, 2008. Prior to that, Mr. Kornhauser was the Vice President of Marketing for Chattem, Inc., a publicly traded manufacturer and marketer of health and beauty products, toiletries and dietary supplements, from May 2000 to October 2007.
Robert Grow, Executive Vice President, Product Development—Mr. Grow has served as Executive Vice President, Product Development since January 2008. Prior to that, Mr. Grow was our Vice President, Product Development from April 2004 to January 2008. From January 2000 to April 2004, Mr. Grow was the National Sales Manager.
Code of Ethics
We have adopted a code of ethics that applies to our Directors and senior financial officers, including our Chief Executive Officer and Chief Financial Officer. This code sets forth written standards that are designed to deter wrongdoing and to promote honest and ethical conduct, including the ethical handling of actual or apparent conflicts of interest between personal and professional relationships; full, fair, accurate, timely, and understandable disclosure in reports and documents that we file with, or submit to, the Securities and Exchange Commission and in our other public communications; compliance with applicable governmental laws, rules and regulations; the prompt internal reporting of violations of the code to an appropriate person or persons; and accountability for adherence to the code. The code of ethics is available without charge upon request from our Corporate Secretary, FGX International Holdings Limited, 500 George Washington Highway, Smithfield, RI 02917. If we make any substantive amendment to this code of ethics or grant any waiver from any of its provisions, we will disclose the nature of such amendment or waiver in a report on Form 8-K.
Directors; Corporate Governance
The remaining information required by this item is incorporated by reference from the information responsive thereto in the sections in the Proxy Statement captioned "Proposal 1: Election of Directors," "Corporate Governance—Audit Committee," and "Other Matters—Section 16(a) Beneficial Ownership Reporting Compliance."
Item 11 Executive Compensation.
The information required by this item is incorporated by reference from the information responsive thereto in the sections in the Proxy Statement captioned "Executive Compensation," and "Corporate Governance—Compensation Committee Interlocks and Insider Participation."
Item 12 Security Ownership of Certain Beneficial Owners and Management and Related Stockholder Matters.
The information required by this item is incorporated by reference from the information responsive thereto in the sections in the Proxy Statement captioned "Shares Held by Principal Shareholders and Management."
44
The following table sets forth information regarding our equity compensation plans as of January 2, 2010:
Plan category
|
Number of shares to be issued upon exercise of outstanding options or vesting of restricted stock units (a) |
Weighted-average exercise price of outstanding options and restricted stock units (b) |
Number of shares remaining available for future issuance under equity compensation plans (excluding shares reflected in column (a)) (c) |
|||||||
|---|---|---|---|---|---|---|---|---|---|---|
Equity compensation plans approved by stockholders |
2,298,959 | $ | 11.65 | 1,273,158 | ||||||
Equity compensation plans not approved by stockholders |
N/A | N/A | N/A | |||||||
Total |
2,298,959 | $ | 11.65 | 1,273,158 | ||||||
Item 13 Certain Relationships and Related Transactions, and Director Independence.
The information required by this item is incorporated by reference from the information responsive thereto in the sections in the Proxy Statement captioned "Executive Compensation—Executive Employment Agreements" and "—Potential Payments upon Termination of Employment or Change-in-Control," "Certain Relationships and Related Person Transactions" and "Corporate Governance—Board of Directors Independence and Meetings."
Item 14 Principal Accounting Fees and Services
The information required by this item is incorporated by reference from the information responsive thereto in the section in the Proxy Statement captioned "Proposal 2: Ratification of the Appointment of Our Independent Registered Public Accounting Firm."
45
Item 15 Exhibits, Financial Statement Schedules.
- (a)
- The
following documents are filed as part of this Report:
- 1.
- Financial Statements:
- 2.
- Financial
Statement Schedules:
- •
- Schedule II—Valuation and Qualifying Accounts for the fiscal years ended January 2, 2010,
January 3, 2009 and December 29, 2007
- •
- All other schedules for which provision is made in the applicable regulation of the Securities and Exchange Commission are
not required under the related instructions or are inapplicable, and therefore have been omitted.
- (b)
- Exhibits
The exhibits listed in the Exhibit Index following the signature page are filed herewith, which Exhibit Index is incorporated herein by reference.
- (c)
- Financial Statement Schedules
See (a)2 above.
F-1
Report of Independent Registered Public Accounting Firm
The
Board of Directors and Shareholders
FGX International Holdings Limited:
We have audited the accompanying consolidated balance sheets of FGX International Holdings Limited and subsidiaries as of January 2, 2010 and January 3, 2009, and the related consolidated statements of operations, shareholders' equity (deficit) and comprehensive income, and cash flows for the fiscal years ended January 2, 2010, January 3, 2009 and December 29, 2007. These consolidated financial statements are the responsibility of the Company's management. Our responsibility is to express an opinion on these consolidated financial statements based on our audits.
We conducted our audits in accordance with the standards of the Public Company Accounting Oversight Board (United States). Those standards require that we plan and perform the audit to obtain reasonable assurance about whether the financial statements are free of material misstatement. An audit includes examining, on a test basis, evidence supporting the amounts and disclosures in the financial statements. An audit also includes assessing the accounting principles used and significant estimates made by management, as well as evaluating the overall financial statement presentation. We believe that our audits provide a reasonable basis for our opinion.
In our opinion, the consolidated financial statements referred to above present fairly, in all material respects, the financial position of FGX International Holdings Limited and subsidiaries as of January 2, 2010 and January 3, 2009, and the results of their operations and their cash flows for the fiscal years ended January 2, 2010, January 3, 2009 and December 29, 2007, in conformity with U.S. generally accepted accounting principles.
We also have audited, in accordance with the standards of the Public Company Accounting Oversight Board (United States), FGX International Holdings Limited's internal control over financial reporting as of January 2, 2010, based on criteria established in Internal Control—Integrated Framework issued by the Committee of Sponsoring Organizations of the Treadway Commission (COSO), and our report dated March 8, 2010 expressed an unqualified opinion on the effectiveness of the Company's internal control over financial reporting.
/s/ KPMG LLP
Providence,
Rhode Island
March 8, 2010
F-2
FGX INTERNATIONAL HOLDINGS LIMITED
Consolidated Balance Sheets
January 2, 2010 and January 3, 2009
(in thousands)
| |
January 2, 2010 |
January 3, 2009 |
|||||||
|---|---|---|---|---|---|---|---|---|---|
ASSETS |
|||||||||
Current assets: |
|||||||||
Cash |
$ | 7,886 | $ | 2,097 | |||||
Accounts receivable, less allowances of $21,675 and $23,854 at January 2, 2010 and January 3, 2009, respectively |
52,430 | 50,746 | |||||||
Inventories |
27,548 | 35,543 | |||||||
Prepaid expenses and other current assets |
11,798 | 15,761 | |||||||
Deferred tax assets |
14,043 | 16,013 | |||||||
Current assets of discontinued operations |
— | 4,253 | |||||||
Total current assets |
113,705 | 124,413 | |||||||
Property, plant and equipment, net |
16,364 | 20,543 | |||||||
Other assets: |
|||||||||
Goodwill |
47,446 | 44,928 | |||||||
Intangible assets, net of accumulated amortization of $34,350 and $29,642 at January 2, 2010 and January 3, 2009, respectively |
65,399 | 68,856 | |||||||
Other assets |
11,718 | 11,905 | |||||||
Noncurrent asets of discontinued operations |
— | 2,370 | |||||||
Total assets |
$ | 254,632 | $ | 273,015 | |||||
LIABILITIES AND SHAREHOLDERS' EQUITY |
|||||||||
Current liabilities: |
|||||||||
Revolving line of credit |
$ | 30,000 | $ | 37,500 | |||||
Current maturities of long-term obligations |
17,613 | 15,199 | |||||||
Accounts payable |
28,011 | 30,324 | |||||||
Accrued expenses |
26,011 | 26,836 | |||||||
Accrued income taxes |
— | 6,005 | |||||||
Current liabilities of discontinued operations |
3,316 | 2,494 | |||||||
Total current liabilities |
104,951 | 118,358 | |||||||
Long-term obligations, less current maturities |
60,477 | 77,863 | |||||||
Deferred tax liabilities |
12,934 | 18,156 | |||||||
Other long term liabilities |
14,367 | 15,284 | |||||||
Commitments and contingencies (note 15) |
|||||||||
Shareholders' equity: |
|||||||||
Common stock, no par value. Authorized 101,000 shares; issued 23,044 shares at January 2, 2010 and issued 22,886 shares at January 3, 2009; outstanding 22,281 shares at January 2, 2010 and outstanding 22,123 shares at January 3, 2009 |
— | — | |||||||
Additional paid-in capital |
109,607 | 107,048 | |||||||
Accumulated other comprehensive loss |
(3,524 | ) | (2,611 | ) | |||||
Accumulated deficit |
(43,766 | ) | (60,259 | ) | |||||
Treasury stock, at cost, 630 shares at January 2, 2010 and January 3, 2009 |
(2,513 | ) | (2,513 | ) | |||||
Total FGX International Holding Limited shareholders' equity |
59,804 | 41,665 | |||||||
Noncontrolling interest |
2,099 | 1,689 | |||||||
Total shareholders' equity |
61,903 | 43,354 | |||||||
Total liabilities and shareholders' equity |
$ | 254,632 | $ | 273,015 | |||||
See accompanying notes to consolidated financial statements.
F-3
FGX INTERNATIONAL HOLDINGS LIMITED
Consolidated Statements of Operations
Fiscal years ended January 2, 2010, January 3, 2009 and
December 29, 2007
(in thousands, except per share amounts)
| |
Fiscal Year Ended | |||||||||||
|---|---|---|---|---|---|---|---|---|---|---|---|---|
| |
January 2, 2010 |
January 3, 2009 |
December 29, 2007 |
|||||||||
Net sales |
$ | 259,275 | $ | 237,106 | $ | 212,425 | ||||||
Cost of goods sold |
111,933 | 104,152 | 94,105 | |||||||||
Gross profit |
147,342 | 132,954 | 118,320 | |||||||||
Operating expenses: |
||||||||||||
Selling expenses |
73,131 | 69,983 | 62,198 | |||||||||
General and administrative expenses |
29,374 | 24,676 | 21,007 | |||||||||
Amortization of acquired intangibles |
4,714 | 5,312 | 6,172 | |||||||||
Abandoned lease charge |
— | — | 4,407 | |||||||||
Operating income |
40,123 | 32,983 | 24,536 | |||||||||
Other income (expense): |
||||||||||||
Interest expense |
(4,588 | ) | (6,356 | ) | (24,710 | ) | ||||||
Other income (expense), net |
261 | (91 | ) | 117 | ||||||||
Income (loss) from continuing operations before income taxes |
35,796 | 26,536 | (57 | ) | ||||||||
Income tax expense (benefit) |
14,242 | 9,748 | (1,851 | ) | ||||||||
Income from continuing operations |
21,554 | 16,788 | 1,794 | |||||||||
Discontinued operations, net of tax |
(4,653 | ) | 757 | 3,261 | ||||||||
Net income |
16,901 | 17,545 | 5,055 | |||||||||
Less: Net income attributable to noncontrolling interest |
408 | 527 | 347 | |||||||||
Net income attributable to FGX International Holdings Limited |
$ | 16,493 | $ | 17,018 | $ | 4,708 | ||||||
Income from continuing operations attributable to FGX International Holdings Limited: |
||||||||||||
Income from continuing operations |
21,554 | 16,788 | 1,794 | |||||||||
Less: Net income attributable to noncontrolling interest |
408 | 527 | 347 | |||||||||
Income from continuing operations attributable to FGX International Holdings Limited |
21,146 | 16,261 | 1,447 | |||||||||
Basic earnings (loss) per share: |
||||||||||||
Income from continuing operations attributable to FGX International Holdings Limited |
$ | 0.96 | $ | 0.76 | $ | 0.09 | ||||||
Discontinued operations, net of tax |
(0.21 | ) | 0.04 | 0.21 | ||||||||
Basic earnings per share attributable to FGX International Holdings Limited shareholders |
$ | 0.75 | $ | 0.80 | $ | 0.30 | ||||||
Diluted earnings (loss) per share: |
||||||||||||
Income from continuing operations attributable to FGX International Holdings Limited |
$ | 0.95 | $ | 0.76 | $ | 0.09 | ||||||
Discontinued operations, net of tax |
(0.21 | ) | 0.03 | 0.20 | ||||||||
Diluted earnings per share attributable to FGX International Holdings Limited shareholders |
$ | 0.74 | $ | 0.79 | $ | 0.29 | ||||||
Basic weighted average shares outstanding |
22,128 | 21,311 | 15,941 | |||||||||
Diluted weighted average shares outstanding |
22,398 | 21,437 | 16,010 | |||||||||
See accompanying notes to consolidated financial statements.
F-4
FGX INTERNATIONAL HOLDINGS LIMITED
Consolidated Statements of Shareholders'
Equity (Deficit) and Comprehensive Income
Years ended
January 2, 2010, January 3, 2009 and
December 29, 2007
(in thousands)
| |
Common stock | |
Accumulated other comprehensive income (loss) |
|
|
Total shareholders' equity (deficit) |
|
||||||||||||||||||
|---|---|---|---|---|---|---|---|---|---|---|---|---|---|---|---|---|---|---|---|---|---|---|---|---|---|
| |
Additional paid-in capital |
Accumulated deficit |
Treasury stock |
Comprehensive income |
|||||||||||||||||||||
| |
Shares | Par value | |||||||||||||||||||||||
Balance, December 30, 2006 |
14,837 | $ | — | $ | 1,499 | $ | 694 | $ | (81,985 | ) | $ | (2,437 | ) | $ | (82,229 | ) | |||||||||
Net proceeds from issuance of common stock |
6,667 | — | 93,817 | — | — | — | 93,817 | — | |||||||||||||||||
Redemption of common shares |
(200 | ) | — | — | — | — | (76 | ) | (76 | ) | — | ||||||||||||||
Stock-based compensation expense |
— | — | 864 | — | — | — | 864 | — | |||||||||||||||||
Foreign currency translation adjustment |
— | — | — | 249 | — | — | 249 | 249 | |||||||||||||||||
Net income |
— | — | — | — | 4,708 | — | 4,708 | 4,708 | |||||||||||||||||
Comprehensive income for the year ended December 29, 2007 |
$ | 4,957 | |||||||||||||||||||||||
Balance, December 29, 2007 |
21,304 | — | 96,180 | 943 | (77,277 | ) | (2,513 | ) | 17,333 | ||||||||||||||||
Shares issued for purchase of acquired business |
952 | — | 9,909 | — | — | — | 9,909 | — | |||||||||||||||||
Redemption of common shares |
(133 | ) | — | (1,484 | ) | — | — | — | (1,484 | ) | — | ||||||||||||||
Stock-based compensation expense |
— | — | 2,443 | — | — | — | 2,443 | — | |||||||||||||||||
Revaluation of financial instrument (net of tax of $599) |
— | — | — | (898 | ) | — | — | (898 | ) | (898 | ) | ||||||||||||||
Foreign currency translation adjustment (net of tax of $185) |
— | — | — | (2,656 | ) | — | — | (2,656 | ) | (2,656 | ) | ||||||||||||||
Net income |
— | — | — | — | 17,018 | — | 17,018 | 17,018 | |||||||||||||||||
Comprehensive income for the year ended January 3, 2009 |
$ | 13,464 | |||||||||||||||||||||||
Balance, January 3, 2009 |
22,123 | — | 107,048 | (2,611 | ) | (60,259 | ) | (2,513 | ) | 41,665 | |||||||||||||||
Stock-based compensation expense |
— | — | 3,198 | — | — | — | 3,198 | — | |||||||||||||||||
Stock option transactions |
158 | — | (639 | ) | — | — | — | (639 | ) | — | |||||||||||||||
Revaluation of financial instrument (net of tax of $137) |
— | — | — | 145 | — | — | 145 | 145 | |||||||||||||||||
Foreign currency translation adjustment (net of tax of $1735) |
— | — | — | (1,058 | ) | — | — | (1,058 | ) | (1,058 | ) | ||||||||||||||
Net income |
— | — | — | — | 16,493 | — | 16,493 | 16,493 | |||||||||||||||||
Comprehensive income for the year ended January 2, 2010 |
$ | 15,580 | |||||||||||||||||||||||
Balance, January 2, 2010 |
22,281 | $ | — | $ | 109,607 | $ | (3,524 | ) | $ | (43,766 | ) | $ | (2,513 | ) | $ | 59,804 | |||||||||
See accompanying notes to consolidated financial statements.
F-5
FGX INTERNATIONAL HOLDINGS LIMITED
Consolidated Statements of Cash Flows
Fiscal Years Ended January 2, 2010, January 3, 2009 and
December 29, 2007
(in thousands)
| |
Fiscal Year Ended | ||||||||||||
|---|---|---|---|---|---|---|---|---|---|---|---|---|---|
| |
January 2, 2010 |
January 3, 2009 |
December 29, 2007 |
||||||||||
Cash flows from operating activities: |
|||||||||||||
Net income |
$ | 16,901 | $ | 17,545 | $ | 5,055 | |||||||
Less: discontinued operations, net of tax |
(4,653 | ) | 757 | 3,261 | |||||||||
Income from continuing operations |
21,554 | 16,788 | 1,794 | ||||||||||
Adjustments to reconcile income from continuing operations to net cash provided by operating activities: |
|||||||||||||
Depreciation and amortization |
17,327 | 19,951 | 18,688 | ||||||||||
Abandoned lease charge |
— | — | 4,407 | ||||||||||
Stock-based compensation |
3,198 | 2,443 | 864 | ||||||||||
Deferred income taxes |
(4,890 | ) | (7,429 | ) | (7,824 | ) | |||||||
Loss on disposal of property, plant and equipment |
344 | 233 | — | ||||||||||
Changes in assets and liabilities: |
|||||||||||||
Accounts receivable |
2,109 | (330 | ) | 6,657 | |||||||||
Inventories |
8,736 | (3,023 | ) | 993 | |||||||||
Prepaid expenses and other current assets |
3,167 | (3,209 | ) | (3,721 | ) | ||||||||
Other assets |
(1,527 | ) | 2,359 | 488 | |||||||||
Accounts payable |
(2,706 | ) | 2,520 | (15,896 | ) | ||||||||
Accrued expenses and other long-term liabilities |
(2,613 | ) | (1,334 | ) | 1,807 | ||||||||
Accrued income taxes |
(6,026 | ) | 4,887 | (814 | ) | ||||||||
Net cash provided by operating activities of discontinued operations |
2,760 | 457 | 3,470 | ||||||||||
Net cash provided by operating activities |
41,433 | 34,313 | 10,913 | ||||||||||
Cash flows from investing activities: |
|||||||||||||
Purchases of property, plant, and equipment |
(8,504 | ) | (13,980 | ) | (15,310 | ) | |||||||
Purchase of acquired business, net of cash acquired |
(3,902 | ) | (34,323 | ) | — | ||||||||
Net cash used in investing activities of discontinued operations |
— | (603 | ) | (162 | ) | ||||||||
Net cash used in investing activities |
(12,406 | ) | (48,906 | ) | (15,472 | ) | |||||||
Cash flows from financing activities: |
|||||||||||||
Net borrowings (repayments) under revolving note payable |
(7,500 | ) | 17,500 | 7,500 | |||||||||
Proceeds from issuance of long term debt |
— | — | 120,000 | ||||||||||
Payments on long-term obligations |
(14,972 | ) | (7,377 | ) | (220,650 | ) | |||||||
Net proceeds from initial public offering |
— | — | 93,817 | ||||||||||
Payment of financing fees |
— | — | (1,095 | ) | |||||||||
Proceeds from the exercise of stock options |
90 | — | — | ||||||||||
Redemption of common stock |
(1,860 | ) | (1,484 | ) | (76 | ) | |||||||
Excess tax benefit on exercise of options |
1,131 | — | — | ||||||||||
Net cash provided by (used in) financing activities |
(23,111 | ) | 8,639 | (504 | ) | ||||||||
Effect of exchange rate changes on cash |
(127 | ) | 3,484 | (33 | ) | ||||||||
Net increase (decrease) in cash |
5,789 | (2,470 | ) | (5,096 | ) | ||||||||
Cash, beginning of period |
2,097 | 4,567 | 9,663 | ||||||||||
Cash, end of period |
$ | 7,886 | $ | 2,097 | $ | 4,567 | |||||||
See accompanying notes to consolidated financial statements.
F-6
FGX INTERNATIONAL HOLDINGS LIMITED
Notes to Consolidated Financial Statements
(1) Reporting Entity and Nature of Business
FGX International Holdings Limited (the "Company") is a leading designer and marketer of non-prescription reading glasses and sunglasses with distribution primarily in the mass merchandise, chain drug store and chain grocery store channels in North America and the United Kingdom. The Company is incorporated under the laws of the British Virgin Islands.
The accompanying consolidated financial statements reflect the reclassification of the Company's costume jewelry business as discontinued operations as a result of the decision in the second quarter of 2009 to divest that business.
On December 15, 2009, the Company entered into a definitive agreement and plan of merger ("Merger Agreement") to merge with a subsidiary of Essilor International ("Essilor") of Charenton-le-Pont, France. Under the terms of the Merger Agreement, shareholders will receive $19.75 per share in cash upon completion of the merger contemplated by the Merger Agreement. The merger is subject to the approval of shareholders. A special meeting of shareholders to consider and vote upon the approval of the merger is currently scheduled for March 9, 2010.
The Company has evaluated subsequent events through March 8, 2010, the date the accompanying financial statements were issued. The Company did not identify any subsequent events that required disclosure.
(2) Recent Accounting Pronouncements
In June 2009, the FASB issued guidance that will require entities to provide more information about sales of securitized financial assets and similar transactions, particularly if the seller retains some risk to the assets, and eliminates the concept of a qualifying special-purpose entity, changes the requirements for the de-recognition of financial assets, and calls upon sellers of the assets to make additional disclosures about them. This guidance will be effective at the start of the first fiscal year beginning after November 15, 2009. The Company does not expect the adoption of this guidance to have an impact on its financial position or results of operations.
In June 2009, the FASB issued guidance altering how a company determines when an entity that is insufficiently capitalized or not controlled through voting should be consolidated. A company must determine whether it should provide consolidated reporting of an entity based upon the entity's purpose and design and the parent company's ability to direct the entity's actions. This guidance will be effective at the start of the first fiscal year beginning after November 15, 2009. The Company does not expect the adoption of this standard to have an impact on its financial position or results of operations.
In January 2010, the FASB issued guidance that expands the interim and annual disclosure requirements of fair value measurements, including the information about movement of assets between level 1 and 2 of the three-tier fair value hierarchy established under its fair value measurement guidance. This guidance also requires separate disclosure for each of purchases, sales, issuance, and settlements in the reconciliation for fair value measurements using significant unobservable inputs, level 3. Except for the detailed disclosure in the level 3 reconciliation, which is effective for the fiscal years beginning after December 15, 2010, all the other disclosures under this guidance are effective for the fiscal years beginning after December 15, 2009. The Company is currently evaluating the impact of the adoption of this guidance on its results of operations and financial position.
F-7
FGX INTERNATIONAL HOLDINGS LIMITED
Notes to Consolidated Financial Statements (Continued)
(3) Significant Accounting Policies
(a) Principles of Consolidation
The consolidated financial statements include the results of operations of the Company as well as those companies in which the Company has majority ownership or control. All significant intercompany balances and transactions have been eliminated in consolidation. Noncontrolling interest represents the minority partners' accumulated earnings in our joint venture in Mexico.
(b) Fiscal Year-End
The Company's fiscal year ends on the Saturday closest to December 31. Fiscal 2009 and 2007 each reflect a 52-week period, and fiscal 2008 reflects a 53-week period.
(c) Stock Split
On October 18, 2007, the Company (i) amended its Memorandum and Articles of Association to increase its authorized shares to 101,000,000 and (ii) effected a 242,717 to one stock split of its ordinary shares. All share data shown in the accompanying consolidated financial statements have been retroactively restated to reflect the split.
(d) Cash and Cash Equivalents
The Company considers all highly liquid investments with original maturities of three months or less at the time of purchase to be cash equivalents. The Company held no cash equivalents at January 2, 2010 or January 3, 2009.
(e) Inventories
Inventories are stated at the lower of cost (first-in, first-out) or market and consist of finished goods. Inventory reserve adjustments are considered permanent decreases to the cost basis of the inventory and are recorded in cost of goods sold in the Company's Consolidated Statements of Operations.
(f) Advertising Costs
Advertising costs, which are included in selling expenses, are expensed when the advertisement first takes place. Advertising expense was approximately $9.1 million, $6.1 million and $6.6 million for fiscal 2009, 2008 and 2007, respectively.
(g) Property, Plant and Equipment
Property, plant and equipment are stated at cost. Depreciation is recognized over the estimated useful lives indicated below on a straight-line or accelerated basis. Leasehold improvements are
F-8
FGX INTERNATIONAL HOLDINGS LIMITED
Notes to Consolidated Financial Statements (Continued)
(3) Significant Accounting Policies (Continued)
amortized over the shorter of the lease term or estimated useful life of the asset. Fully depreciated displays are written off to the respective accumulated depreciation account each year.
Asset classification
|
Estimated useful life | |
|---|---|---|
Building and improvements |
10-20 years |
|
Display fixtures |
Up to 3 years |
|
Furniture, fixtures and equipment |
3-5 years |
|
Leasehold improvements |
Shorter of useful life or lease term |
(h) Goodwill and Other Intangible Assets
Goodwill represents the excess of cost over the fair value of the net tangible assets and identifiable intangible assets of businesses acquired. Goodwill and intangible assets acquired in a purchase business combination and determined to have an indefinite useful life are not amortized, but instead tested annually in accordance with the provisions of the Goodwill and Other Intangibles Topic of FASB ASC. Intangible assets with estimable useful lives are amortized over their respective estimated useful lives to their estimated residual values, and reviewed for impairment in accordance with the provisions of FASB guidance. This guidance requires recognition of an impairment loss only if the carrying amount of a long-lived asset or asset group is not recoverable from its undiscounted cash flows. An impairment loss is measured as the difference between the carrying amount and fair value of the asset or asset group. The Company evaluates its long-lived assets if impairment indicators arise. The Company evaluates each of its reporting units with goodwill and indefinite-lived intangibles during the fourth quarter of each fiscal year or more frequently if impairment indicators arise.
Intangible assets consist of trademarks, customer relationships and patents. Trademarks, customer relationships and patents, acquired in business combinations, are recorded at their estimated fair value at the date of the combination. The Company has determined that currently owned trademarks have indefinite useful lives, customer relationships have a weighted average estimated useful life of 15 years and patents have a weighted average estimated useful life of 7 years. The Company is amortizing the recorded amount of the customer relationships on an accelerated basis and the patents on a straight-line basis over their estimated useful lives. The amortization method of the customer relationships is accelerated based on a projected economic value of the asset over its useful life.
(i) Revenue Recognition
Sales are recognized when revenue is realized or realizable and has been earned. The Company's policy is to recognize revenue when title to the product, ownership and risk of loss transfer to the customer, which generally is on the date of shipment. The Company also maintains destination-based terms with a limited number of customers in the United States and Canada and with substantially all of its customers in the United Kingdom and Mexico under which it recognizes revenue upon confirmation of receipt by the customer. In addition, prior to revenue recognition, the Company requires persuasive evidence of the arrangement, that the price is fixed or determinable, and that collectibility is reasonably assured. A provision for anticipated returns is recorded as a reduction of sales in the same period that the revenue is recognized in accordance with FASB guidance on recognizing revenue when right of return exists.
F-9
FGX INTERNATIONAL HOLDINGS LIMITED
Notes to Consolidated Financial Statements (Continued)
(3) Significant Accounting Policies (Continued)
The Company accounts for certain customer promotional payments, volume rebates, cooperative advertising, product placement fees and other discounts as a reduction of revenue. The Company also enters into multi-year supply agreements with many of its customers that often have minimum purchase requirements. Upfront payments and credits to our customers associated with these multi-year agreements are recorded to "Other assets" in our Consolidated Balance Sheets and are recorded net of accumulated amortization. Amortization of these payments and credits is recorded as earned by our customers over the contract term and are recorded as a reduction of revenue. When the payment or credit has been fully amortized, the asset and related amortization are written off. Amortization estimated to be earned by our customers and charged to operations during the next twelve months is classified as "Prepaid expenses and other current assets" in the Consolidated Balance Sheets.
(j) Shipping and Handling
Shipping and handling costs are recorded as a component of selling expenses. Any shipping and handling billed to customers is recognized as a component of net sales. Shipping and handling billed to customers is not significant for any of the periods presented.
(k) Net Income (Loss) Per Share
The Company calculates net income (loss) per share in accordance with the Earnings Per Share Topic of FASB ASC. Basic net income (loss) per share is computed by dividing net income (loss) by the weighted average number of common shares outstanding. Diluted net income (loss) per share is computed by dividing net income (loss) by the weighted average number of common shares outstanding and potentially dilutive securities outstanding during the period. Potentially dilutive securities include restricted stock units and stock options using the treasury stock method. Securities are excluded from the computations of diluted net income (loss) per share if their effect would be antidilutive.
| |
Fiscal Year Ended | |||||||||
|---|---|---|---|---|---|---|---|---|---|---|
| |
January 2, 2010 |
January 3, 2009 |
December 29, 2007 |
|||||||
| |
(in thousands, except per share amounts) |
|||||||||
Net income attributable to the Company |
$ | 16,493 | $ | 17,018 | $ | 4,708 | ||||
Shares used in computing basic net income per share |
22,128 | 21,311 | 15,941 | |||||||
Effect of dilutive securities |
270 | 126 | 69 | |||||||
Shares used in computing diluted net income per share |
22,398 | 21,437 | 16,010 | |||||||
Basic earnings per share attributable to the Company's shareholders |
$ | 0.75 | $ | 0.80 | $ | 0.30 | ||||
Diluted earnings per share attributable to the Company's shareholders |
$ | 0.74 | $ | 0.79 | $ | 0.29 | ||||
Antidilutive potential common shares excluded from the computation above |
1,215 | 1,148 | 1,285 | |||||||
F-10
FGX INTERNATIONAL HOLDINGS LIMITED
Notes to Consolidated Financial Statements (Continued)
(3) Significant Accounting Policies (Continued)
(l) Comprehensive Income
Comprehensive income for the years 2009, 2008 and 2007 consists of the following:
| |
2009 | 2008 | 2007 | ||||||||
|---|---|---|---|---|---|---|---|---|---|---|---|
| |
(in thousands) |
||||||||||
Net income |
$ | 16,901 | $ | 17,545 | $ | 5,055 | |||||
Other comprehensive income, net of tax |
|||||||||||
Foreign currency translation adjustments |
(1,058 | ) | (2,656 | ) | 249 | ||||||
Gain (loss) on cash flow hedging activities |
145 | (898 | ) | — | |||||||
Total comprehensive income, net of tax |
15,988 | 13,991 | 5,304 | ||||||||
Less: Comprehensive income attributable to noncontrolling interest |
408 | 527 | 347 | ||||||||
Comprehensive income attributable to the Company |
$ | 15,580 | $ | 13,464 | $ | 4,957 | |||||
(m) Concentration of Credit Risk
Financial instruments that potentially subject the Company to concentrations of credit risk are principally accounts receivable. A significant portion of the Company's business activity is with domestic mass merchandisers whose ability to meet their financial obligations is dependent on economic conditions germane to the retail industry. To reduce credit risk, the Company routinely assesses the financial strength of its customers and maintains credit insurance on substantially all of its domestic and Canadian accounts receivable.
(n) Financial Instruments
The Company's financial instruments include cash, accounts receivable, short-term borrowings, accounts payable and accrued liabilities. At January 2, 2010, the carrying cost of these instruments approximated their fair value. The Company's financial instruments at January 2, 2010 also include long-term borrowings (see note 11 for carrying cost and related fair values).
(o) Use of Estimates
The preparation of the consolidated financial statements in conformity with accounting principles generally accepted in the United States of America requires management to make a number of estimates and assumptions relating to the reported amounts of assets and liabilities and the disclosure of contingent assets and liabilities at the date of the consolidated financial statements and the reported amounts of revenues and expenses during the period. Significant items subject to such estimates and assumptions include the carrying amount of intangibles and goodwill, and valuation allowances for receivables, inventories and deferred income tax assets. Actual results could differ from those estimates.
(p) Income Taxes
Income taxes are accounted for under the asset and liability method. Under this method, deferred tax assets and liabilities are recognized for the future tax consequences attributable to differences between the financial statement carrying amounts of existing assets and liabilities and their respective tax bases and operating loss carryforwards. Deferred tax assets and liabilities are measured using enacted tax rates expected to apply to taxable income in the years in which those temporary differences
F-11
FGX INTERNATIONAL HOLDINGS LIMITED
Notes to Consolidated Financial Statements (Continued)
(3) Significant Accounting Policies (Continued)
are expected to be recovered or settled. The effect on deferred tax assets and liabilities of a change in tax rates is recognized in income in the period that includes the enactment date.
Deferred income taxes have not been provided for the undistributed earnings of the Company's foreign subsidiaries as such undistributed earnings are considered to be indefinitely reinvested.
(q) Derivative instruments
The Derivatives and Hedging Topic of FASB ASC requires companies to recognize all derivative instruments as either assets or liabilities in the balance sheet at fair value. The accounting for changes in the fair value of a derivative instrument depends on whether it has been designated and qualifies as part of a hedging relationship and further, on the type of hedging relationship. For those derivative instruments that are designated and qualify as hedging instruments, a company must designate the hedging instrument, based upon the exposure being hedged, as a fair value hedge, a cash flow hedge or a hedge of a net investment in an international operation.
On March 10, 2008, the Company entered into an interest rate swap agreement (the "Swap") to manage its exposure to floating interest rate risk on its term loan facility. The Swap has been designated as a cash flow hedge in accordance with the Derivatives and Hedging Topic of FASB ASC and the Company will record the effective portion of any change in the fair value as other comprehensive income (loss), and reclassify the gains and losses to interest expense during the hedged interest payment period.
(r) Supplemental Cash Flow Disclosures
Cash paid during fiscal years 2009, 2008 and 2007 for interest and income taxes is as follows:
| |
Fiscal | |||||||||
|---|---|---|---|---|---|---|---|---|---|---|
| |
2009 | 2008 | 2007 | |||||||
| |
(in thousands) |
|||||||||
Interest |
$ | 8,159 | $ | 6,234 | $ | 21,862 | ||||
Income taxes |
21,362 | 9,592 | 4,307 | |||||||
The Company had the following noncash activities related to acquired equipment financed with capital lease obligations for fiscal years 2009, 2008 and 2007:
| |
(in thousands) | ||||
|---|---|---|---|---|---|
Fiscal Year: |
|||||
2009 |
$ | — | |||
2008 |
258 | ||||
2007 |
234 | ||||
F-12
FGX INTERNATIONAL HOLDINGS LIMITED
Notes to Consolidated Financial Statements (Continued)
(4) Discontinued Operations
In the second quarter of 2009, the Company's Board of Directors voted to divest the costume jewelry business. The costume jewelry business qualified for held for sale treatment in the second quarter of 2009. The Company recorded pre-tax charges totaling $5.0 million, including estimated future product returns of $3.6 million, inventory write-downs of $0.8 million, display fixture write-offs of $0.3 million and other costs of $0.3 million related to the divestiture. The Company has presented the results of operations and financial position of this business in discontinued operations in the Consolidated Statements of Operations, Consolidated Balance Sheets and Consolidated Statements of Cash Flows for all periods presented. On July 23, 2009, the Company completed a sale of assets related to its costume jewelry business for consideration of approximately $1.3 million, and no significant costs are expected to be incurred in future periods.
Summarized results of the Company's discontinued operations are as follows:
| |
2009 | 2008 | 2007 | |||||||
|---|---|---|---|---|---|---|---|---|---|---|
| |
(in thousands) |
|||||||||
Net sales |
$ | 4,659 | $ | 18,994 | $ | 28,038 | ||||
Income (loss) from discontinued operations before tax |
$ | (7,661 | ) | $ | 1,282 | $ | 5,407 | |||
Provision (benefit) for income taxes |
(3,008 | ) | 525 | 2,146 | ||||||
Income (loss) from discontinued operations, net of tax |
$ | (4,653 | ) | $ | 757 | $ | 3,261 | |||
The major classes of assets and liabilities of operations from discontinued operations are as follows:
| |
As of January 2, 2010 |
As of January 3, 2009 |
|||||||
|---|---|---|---|---|---|---|---|---|---|
| |
(in thousands) |
||||||||
Accounts receivable |
$ | — | $ | 1,517 | |||||
Inventories |
— | 2,680 | |||||||
Prepaid expenses and other current assets |
— | 56 | |||||||
Current assets of discontinued operations |
— | 4,253 | |||||||
Property, plant and equipment, net |
— | 468 | |||||||
Goodwill |
— | 1,819 | |||||||
Other assets |
— | 83 | |||||||
Noncurrent assets of discontinued operations |
— | 2,370 | |||||||
Total assets of discontinued operations |
$ | — | $ | 6,623 | |||||
Accounts payable |
$ | — | $ | 1,640 | |||||
Accrued expenses |
3,316 | 854 | |||||||
Current liabilities of discontinued operations |
$ | 3,316 | $ | 2,494 | |||||
F-13
FGX INTERNATIONAL HOLDINGS LIMITED
Notes to Consolidated Financial Statements (Continued)
(5) Acquisitions
On October 28, 2009, the Company acquired all of the outstanding stock of Corinne McCormack, Inc. and eye-bar inc. in exchange for $1.45 million in cash. The purchase price allocation did not have a material impact on the Company's financial position.
On November 26, 2008, the Company acquired all of the outstanding common shares of Dioptics Medical Products, Inc.("DMP"), a designer and marketer of sunglasses and optical accessories, in exchange for 952,380 of the Company's ordinary shares and $34.9 million in cash (net of cash acquired), subject to a working capital adjustment. The Company's shares have been valued at $9.9 million, which was recorded as part of the purchase price and to Additional Paid-in Capital. This value was determined by calculating the average closing price of the shares two days before, the day of, and two days after the closing. The cash consideration includes $1.9 million of direct acquisition costs and is net of $2.2 million cash acquired. FGX funded the cash portion of the transaction with borrowings from its existing revolving credit facility. On March 10, 2009, the final working capital adjustment was determined and resulted in a $0.1 million addition to the purchase price. During the year ended January 2, 2010, the Company recorded a $0.6 million increase in purchase price, of which $0.1 million represented a payment made to the sellers as the result of a working capital adjustment and $0.5 million related to incremental accounting and other acquisition fees. Additionally, the Company recorded an adjustment to its allocation of purchase price that increased liabilities $1.9 million related to the closure of a distribution facility in San Luis Obispo, California. These costs included $0.8 million in lease exit costs, $0.7 million in severance, and $0.4 million in other related costs. These adjustments were recorded as an increase to goodwill. The Company committed to the closure plans in the fourth quarter of 2009.
Results of Dioptics operations from November 26, 2008, the closing date, through January 2, 2010 have been included in the Company's consolidated statements of operations. These results are reported in the sunglasses and prescription frames segment.
F-14
FGX INTERNATIONAL HOLDINGS LIMITED
Notes to Consolidated Financial Statements (Continued)
(5) Acquisitions (Continued)
The following is a presentation reflecting the purchase price allocation of the assets acquired and liabilities assumed in connection with the purchase of the common stock of DMP, which includes transactions, as of November 26, 2008:
Assets Acquired and Liabilities Assumed as of November 26, 2008
(in thousands)
Cash and cash equivalents |
$ | 2,174 | |||
Accounts receivable |
2,758 | ||||
Inventories |
3,676 | ||||
Deferred tax assets |
1,106 | ||||
Other current assets |
1,817 | ||||
Total current assets |
11,531 | ||||
Property and equipment |
917 | ||||
Trademark |
21,600 | ||||
Patents |
2,700 | ||||
Customer relationships |
5,000 | ||||
Goodwill |
23,909 | ||||
Other assets |
4,101 | ||||
Total assets acquired |
69,758 | ||||
Accounts payable |
1,982 | ||||
Accrued expenses |
5,416 | ||||
Total current liabilities |
7,398 | ||||
Deferred tax liabilities |
11,954 | ||||
Other liabilities |
4,000 | ||||
Total liabilities |
23,352 | ||||
Net assets acquired |
$ | 46,406 | |||
Both patents and customer relationships have been deemed to have definite lives, and accordingly the value attributed to these assets will be amortized. The weighted average lives of patents, and customer relationships acquired is 11 and 14 years, respectively. The combined weighted average life of these assets is 13 years. Trademarks have been deemed to have an indefinite life and accordingly will not be amortized. The goodwill recorded for this acquisition will not be deductible for income tax purposes.
F-15
FGX INTERNATIONAL HOLDINGS LIMITED
Notes to Consolidated Financial Statements (Continued)
(6) Property, Plant and Equipment
| |
January 2, 2010 |
January 3, 2009 |
||||||
|---|---|---|---|---|---|---|---|---|
| |
(in thousands) |
|||||||
Property, plant and equipment: |
||||||||
Land |
$ | 1,233 | $ | 1,233 | ||||
Building and improvements |
7,589 | 6,963 | ||||||
Display fixtures |
21,239 | 26,466 | ||||||
Furniture, fixtures and equipment |
17,287 | 17,587 | ||||||
Leasehold improvements |
29 | 2,820 | ||||||
Equipment under capital lease |
3,812 | 3,812 | ||||||
|
51,189 | 58,881 | ||||||
Less accumulated depreciation |
34,825 | 38,338 | ||||||
|
$ | 16,364 | $ | 20,543 | ||||
The Company has recorded depreciation expense of $12.6 million, $14.6 million and $12.5 million during fiscal 2009, 2008 and 2007, respectively.
(7) Goodwill and Other Intangible Assets
At January 2, 2010 and January 3, 2009, goodwill totaled $47.4 million and $44.9 million, respectively. At January 2, 2010, $23.3 million, $23.9 million and $0.2 million of goodwill is related to the non-prescription reading glasses, sunglasses and prescription frames and international segments, respectively. At January 3, 2009, $23.3 million, $21.4 million and $0.2 million of goodwill is related to the non-prescription reading glasses, sunglasses and prescription frames and international segments, respectively. Other intangible assets were as follows:
| |
|
January 2, 2010 | January 3, 2009 | |||||||||||||
|---|---|---|---|---|---|---|---|---|---|---|---|---|---|---|---|---|
| |
Weighted Average Amortization Period |
|||||||||||||||
| |
Gross Carrying Amount |
Accumulated Amortization |
Gross Carrying Amount |
Accumulated Amortization |
||||||||||||
| |
|
(in thousands) |
||||||||||||||
Patents |
7 years | $ | 5,600 | $ | 3,183 | $ | 5,600 | $ | 2,935 | |||||||
Customer relationships |
15 years | 49,782 | 31,167 | 48,531 | 26,707 | |||||||||||
Total amortizable intangible assets |
14 years | 55,382 | 34,350 | 54,131 | 29,642 | |||||||||||
Trademarks |
44,367 | — | 44,367 | — | ||||||||||||
Total intangible assets |
$ | 99,749 | $ | 34,350 | $ | 98,498 | $ | 29,642 | ||||||||
The Company has recorded amortization expense of $4.7 million, $5.3 million and $6.2 million for its customer relationships and patents during fiscal 2009, 2008 and 2007, respectively.
Goodwill and trademarks are not being amortized as they have been determined to have indefinite lives.
F-16
FGX INTERNATIONAL HOLDINGS LIMITED
Notes to Consolidated Financial Statements (Continued)
(7) Goodwill and Other Intangible Assets (Continued)
Estimated annual amortization expense for the next five years and thereafter is as follows, and there are no expected residual values related to these amortizable intangible assets:
| |
(in thousands) | ||||
|---|---|---|---|---|---|
Years: |
|||||
2010 |
$ | 4,025 | |||
2011 |
3,424 | ||||
2012 |
2,870 | ||||
2013 |
2,386 | ||||
2014 |
1,985 | ||||
Thereafter |
6,342 | ||||
|
$ | 21,032 | |||
(8) Accrued Expense
Accrued expenses are comprised of the following as of January 2, 2010 and January 3, 2009:
| |
January 2, 2010 |
January 3, 2009 |
|||||
|---|---|---|---|---|---|---|---|
| |
(in thousands) |
||||||
Accrued customer allowances |
$ | 13,936 | $ | 12,742 | |||
Accrued lease obligation (Note 15) |
2,277 | 1,510 | |||||
Accrued bonuses |
2,682 | 2,772 | |||||
Other |
7,116 | 9,812 | |||||
|
$ | 26,011 | $ | 26,836 | |||
(9) Credit Agreements
The Company is party to a senior secured credit facility ("December 2007 Credit Agreement") that is comprised of (a) a $75.0 million revolving credit facility, which may be increased with the consent of its existing or additional lenders by up to an additional $50.0 million; and (b) a $100.0 million term loan facility. Interest rates for borrowings under the credit facility are determined based upon the Company's defined leverage ratio. Interest rates were initially priced at 1.75% above the London Interbank Offered Rate (LIBOR) and then range from 1.00% to 2.25% above LIBOR for Eurodollar-based borrowings, and from 0.00% to 1.25% above the defined base rate (higher of prime rate or the Federal Funds rate plus 0.5%) for base rate borrowings, depending upon the Company's leverage ratio. The term loan facility is due in 20 consecutive quarterly graduating installments ranging from $1.9 million to $8.1 million, which commenced on March 31, 2008. The term loan facility and the revolving credit facility will mature on December 19, 2012. Amounts due under both facilities are collateralized by a pledge of 100% of the Company's tangible and intangible assets. The Company also is required to pay commitment and other customary fees. These commitment fees will range from 0.20% to 0.50% per annum depending upon the Company's leverage ratio.
As of January 2, 2010, the Company had outstanding indebtedness of $77.5 million under the term loan facility, $30.0 million outstanding under the revolving credit facility and $0.5 million committed under standby letters of credit. Our borrowing availability under the revolving credit facility was
F-17
FGX INTERNATIONAL HOLDINGS LIMITED
Notes to Consolidated Financial Statements (Continued)
(9) Credit Agreements (Continued)
$44.5 million. The interest rate on the term loan facility was at the three-month LIBOR rate plus 1.5% (1.76% in aggregate as of January 2, 2010). The interest rate on $10.0 million of the revolving credit facility is at the one-month LIBOR rate plus 1.5% (1.74% in aggregate as of January 2, 2010). The remaining balance of the revolving credit facility is subject to an interest rate of prime plus 0.5% (3.75% in aggregate as of January 2, 2010).
On December 22, 2009, the Company received an extension of a deadline under the December 2007 Credit Agreement that allows the Company until March 31, 2010 to grant a required security interest in leasehold interests that FGX acquired in connection with its acquisition of Corinne McCormack, Inc. and eye-bar inc. on October 28, 2009. The Company believes that it will take actions to remain in compliance with the December 2007 Credit Agreement and that the related debt has been properly classified on the Company's balance sheet.
The December 2007 Credit Agreement contains covenants limiting, among other things, mergers, consolidations, liquidations and dissolutions; sales of assets; investments and acquisitions; indebtedness; liens and other encumbrances; dividends and other restricted payments; payment and modification of material subordinated debt instruments; transactions with affiliates; changes in fiscal year; negative pledge clauses; restrictions on subsidiary distributions; sale and leaseback transactions; factoring arrangements and changes in lines of business; and capital expenditures. The Company must also comply with certain administrative covenants, including furnishing audited financial statements to the lenders within 90 days of fiscal year end. This facility also requires the Company to comply with a leverage ratio covenant and a fixed charge ratio covenant. As of January 2, 2010, the Company was in compliance with the required covenants.
(10) Swap Agreement
On March 10, 2008, the Company entered into an interest rate swap agreement (the "Swap") to manage the Company's exposure to floating interest rate risk on its term loan facility. The Swap had an initial notional amount of approximately $49.1 million and is scheduled to decline to reflect certain scheduled principal payments under the term loan facility. Currently, the Company is borrowing under the term loan facility at a floating interest rate based on 3-month LIBOR (plus 1.5% under the terms of our term loan facility) and will pay under the Swap a fixed interest rate of 3.22% (plus 1.5% under the terms of our term loan facility) through December 19, 2012.
The Swap has been designated as a cash flow hedge in accordance with the Derivatives and Hedging Topic of FASB ASC and the Company records the effective portion of any change in the fair value as other comprehensive income (loss), net of tax.
The following table summarizes the balance of the Swap, the Company's only derivative instrument, based on fair value:
| |
January 2, 2010 | January 3, 2009 | |||||||||
|---|---|---|---|---|---|---|---|---|---|---|---|
| |
Balance sheet classification |
Fair value |
Balance sheet classification |
Fair value |
|||||||
| |
(in thousands) |
||||||||||
Derivatives designated as hedging instruments: |
|||||||||||
Interest rate swap agreement |
Other long-term liabilities |
$ | 1,214 | Other long-term liabilities |
$ | 1,497 | |||||
Total |
$ | 1,214 | $ | 1,497 | |||||||
F-18
FGX INTERNATIONAL HOLDINGS LIMITED
Notes to Consolidated Financial Statements (Continued)
(10) Swap Agreement (Continued)
The following table summarizes the effects of the Swap:
| |
Amount of gains (losses) recognized in other comprehensive income Fiscal |
|||||||||
|---|---|---|---|---|---|---|---|---|---|---|
| |
2009 | 2008 | 2007 | |||||||
| |
(in thousands) |
|||||||||
Derivatives designated as cash flow hedges: |
||||||||||
Interest rate swap agreement, net of tax |
$ | 145 | $ | (898 | ) | $ | — | |||
Total |
$ | 145 | $ | (898 | ) | $ | — | |||
(11) Long-Term Obligations
Long-term obligations consist of the following as of January 2, 2010 and January 3, 2009:
| |
January 2, 2010 | January 3, 2009 | |||||
|---|---|---|---|---|---|---|---|
| |
(in thousands) |
||||||
| Term loan facility under the December 2007 Credit Agreement due December 19, 2012, 20 consecutive quarterly graduating installments beginning March 31, 2008 with payments ranging from $1,875 to $8,125, interest based on LIBOR of 0.26% (January 2, 2010) plus 1.5% | $ | 77,500 | $ | 92,500 | |||
Capital lease obligation of computer equipment, payable in monthly installments of principal and interest of $8 through August 2011, interest at 5.99% per annum |
142 |
225 |
|||||
Capital lease obligations of office equipment, payable in monthly installments of principal and interest of $6 and $4 through April 2010, interest rates ranging from 6.22% to 6.80% per annum |
25 |
141 |
|||||
Deferred compensation plan (Note 14) |
423 |
196 |
|||||
| 78,090 | 93,062 | ||||||
| Less current maturities | 17,613 | 15,199 | |||||
| $ | 60,477 | $ | 77,863 | ||||
At January 2, 2010, the fair value of the term loan facility was approximately $75.5 million.
F-19
FGX INTERNATIONAL HOLDINGS LIMITED
Notes to Consolidated Financial Statements (Continued)
(11) Long-Term Obligations (Continued)
Future minimum payments under these agreements, excluding deferred compensation, are as follows as of January 2, 2010:
| |
(in thousands) | ||||
|---|---|---|---|---|---|
Years: |
|||||
2010 |
$ | 17,613 | |||
2011 |
27,554 | ||||
2012 |
32,500 | ||||
2013 |
— | ||||
2014 |
— | ||||
Thereafter |
— | ||||
|
$ | 77,667 | |||
(12) Income Taxes
Income (loss) from continuing operations before income taxes consisted of the following for fiscal years 2009, 2008 and 2007:
| |
2009 | 2008 | 2007 | ||||||||
|---|---|---|---|---|---|---|---|---|---|---|---|
| |
(in thousands) |
||||||||||
Domestic |
$ | 18,936 | $ | 16,531 | $ | (3,157 | ) | ||||
Foreign |
16,860 | 10,005 | 3,100 | ||||||||
Income (loss) from continuing operations before income taxes |
$ | 35,796 | $ | 26,536 | $ | (57 | ) | ||||
The components of income tax expense (benefit) for fiscal years 2009, 2008 and 2007 are as follows:
| |
Fiscal | ||||||||||
|---|---|---|---|---|---|---|---|---|---|---|---|
| |
2009 | 2008 | 2007 | ||||||||
| |
(in thousands) |
||||||||||
Income (loss) from continuing operations |
$ | 14,242 | $ | 9,748 | $ | (1,851 | ) | ||||
Discontinued operations |
(3,008 | ) | 525 | 2,145 | |||||||
Tax benefit on exercise of options |
(1,131 | ) | — | — | |||||||
Other comprehensive income (loss) |
1,873 | (784 | ) | — | |||||||
Total income tax expense |
$ | 11,976 | $ | 9,489 | $ | 294 | |||||
F-20
FGX INTERNATIONAL HOLDINGS LIMITED
Notes to Consolidated Financial Statements (Continued)
(12) Income Taxes (Continued)
Total federal, state, and foreign income tax expense (benefit) from continuing operations for fiscal years 2009, 2008 and 2007 are as follows:
| |
Fiscal | ||||||||||
|---|---|---|---|---|---|---|---|---|---|---|---|
| |
2009 | 2008 | 2007 | ||||||||
| |
(in thousands) |
||||||||||
Current: |
|||||||||||
Federal |
$ | 7,912 | $ | 10,250 | $ | 3,161 | |||||
State |
2,897 | 3,103 | 1,213 | ||||||||
Foreign |
6,482 | 2,763 | 1,719 | ||||||||
|
17,291 | 16,116 | 6,093 | ||||||||
Deferred: |
|||||||||||
Federal |
(3,196 | ) | (5,297 | ) | (4,897 | ) | |||||
State |
(1,382 | ) | (1,411 | ) | (1,038 | ) | |||||
Foreign |
(453 | ) | 109 | 1,399 | |||||||
|
(5,031 | ) | (6,599 | ) | (4,536 | ) | |||||
Change in valuation allowance |
1,982 | 231 | (3,408 | ) | |||||||
|
(3,049 | ) | (6,368 | ) | (7,944 | ) | |||||
|
$ | 14,242 | $ | 9,748 | $ | (1,851 | ) | ||||
The actual expense attributable to continuing operations for fiscal years 2009, 2008 and 2007 differs from the "expected" tax expense (computed by applying the U.S. statutory federal corporate tax rate to income before income taxes and minority interest) as follows:
| |
Fiscal | |||||||||
|---|---|---|---|---|---|---|---|---|---|---|
| |
2009 | 2008 | 2007 | |||||||
| |
(in thousands) |
|||||||||
Computed "expected" tax expense |
$ | 12,529 | $ | 9,288 | $ | (20 | ) | |||
State income taxes, net of federal income tax benefit |
985 | 1,133 | 212 | |||||||
Foreign tax differential |
2,418 | 315 | 1,347 | |||||||
Foreign tax credit |
(2,331 | ) | (838 | ) | (3,250 | ) | ||||
Deemed foreign dividend |
— | — | 3,293 | |||||||
Nondeductible expense |
40 | 38 | 158 | |||||||
Nondeductible compensation |
(461 | ) | 70 | 219 | ||||||
Charitable donation |
(617 | ) | (599 | ) | (283 | ) | ||||
Change in valuation allowance |
1,982 | 231 | (3,408 | ) | ||||||
Change in state deferred rate |
(844 | ) | — | — | ||||||
Other, net |
541 | 110 | (119 | ) | ||||||
|
$ | 14,242 | $ | 9,748 | $ | (1,851 | ) | |||
F-21
FGX INTERNATIONAL HOLDINGS LIMITED
Notes to Consolidated Financial Statements (Continued)
(12) Income Taxes (Continued)