Attached files
| file | filename |
|---|---|
| 10-K - FORM 10-K - EDAC TECHNOLOGIES CORP | c56787e10vk.htm |
| EX-21 - EX-21 - EDAC TECHNOLOGIES CORP | c56787exv21.htm |
| EX-32.1 - EX-32.1 - EDAC TECHNOLOGIES CORP | c56787exv32w1.htm |
| EX-31.2 - EX-31.2 - EDAC TECHNOLOGIES CORP | c56787exv31w2.htm |
| EX-23.1 - EX-23.1 - EDAC TECHNOLOGIES CORP | c56787exv23w1.htm |
| EX-31.1 - EX-31.1 - EDAC TECHNOLOGIES CORP | c56787exv31w1.htm |
Exhibit 13
EDAC Technologies Corporation
Annual Report
2009
To Our Shareholders:
“..geneticists described evolution simply as a change in gene frequencies in populations,
totally ignoring the fact that evolution consists of the two simultaneous but quite separate
phenomena of adaptation and diversification.”
Ernst Mayr
2009 was a year of both adaptation and diversification for EDAC. Our adaptation was
necessitated by the extraordinarily difficult economy that affected demand for all of our
product lines, especially Apex Machine Tool and Spindle. However, we were prepared for and
capitalized on opportunities that also arose in the past year to strengthen your Company and
deliver strong results for our shareholders and value for our customers.
Our diversification came from two acquisitions that added strength and depth to our business.
We acquired MTU Aero Engines North America Inc.’s Manufacturing Business Unit (AERO) in May,
providing new competencies and technologies to further broaden our aerospace presence. The
acquisition added $13,900,000 in revenues over the seven month period and was accretive to this
year’s operating earnings. With the assets acquired recorded at their fair value, the
acquisition resulted in a gain of $11,900,000 recognized as other income in our statement of
income.
In August we acquired the assets of Service Network Inc. (SNI), adding the manufacture and
service of precision grinders to our Spindle product line. While this acquisition required
considerable start-up costs that impacted our fourth quarter profitability, it is consistent
with our long-term strategic growth plan and we believe will contribute to our earnings in
2010.
With the inclusion of AERO and SNI, our total sales for 2009 reached $54.6 million and net
income was $7.6 million or $1.54 per diluted share.
Effective January 1, 2010, in an effort to better serve our customers, clarify our business and
market position, and align our resources, we reorganized our aerospace operations into a single
product line combining Precision Components, including its repair unit, and AERO, and renamed
the combined unit EDAC AERO.
We also expanded the range of parts we are providing for a number of engine and non-engine
programs, and we invested in developmental jet engine parts for the Joint Strike Fighter and
for new GE engines. While these investments resulted in the need to absorb additional costs
during the year, they have expanded our capabilities and provided a solid platform for future
profitable growth.
During the year we strengthened our Board of Directors with two outstanding individuals:
John A. Rolls joined our Board in April 2009. John is currently Managing Partner of Core
Capital Partners LLP, a private investment partnership. Until 2006 he served as President and
Chief Executive Officer of Thermion Systems International and had previously served as
President and Chief Executive Officer of Deutsche Bank North America, Executive Vice
1
President and Chief Financial Officer of United Technologies Corporation, Senior Vice President
and Chief Financial Officer of RCA and Treasurer of Monsanto Company.
Lee K. Barba joined our Board in January 2010. From 2000 to 2009, Lee was Chairman and Chief
Executive Officer of thinkorswim Group Inc., a leading online brokerage and investor education
firm, which he built through acquisitions prior to its sale to TD AMERITRADE. Prior to that,
he was President of Coral Energy L.P., a joint venture of Shell Oil Company focused on
deregulated energy markets. He spent eight years in a variety of executive positions with
Bankers Trust, including Chief Operating Officer of the Global Investment Bank.
At the same time I would like to thank Stephen Raffay for his distinguished service to our
company. Steve will be retiring from the Board at our annual meeting after ten years of
providing guidance and direction to the Company.
With the onset of this new year, I am more optimistic about not only our long-term future, but
for 2010 as well. Although it may be a while before we return to a healthy economy, markets
that we serve have recently shown signs of stabilization and early improvements that should be
sustained. We ended 2009 with a backlog of $126 million, which has increased in the early
months of 2010. We have proactively reorganized EDAC to optimize our operations, better serve
our customers and position ourselves to capitalize on emerging programs. In 2010 we will be
making new investments in ERP systems and equipment. And, we will continue to seek selective
acquisition opportunities that complement our businesses and can take EDAC to the next level.
Our objective is to achieve long-term growth through investing in skilled personnel and
state-of-the-art machinery and equipment, and committing to operational excellence throughout
our organization. We are prepared and positioned to seize opportunities. Like many we remain
optimistic that the best is yet to come.
| Sincerely yours, |
||||
| /s/ Dominick A. Pagano | ||||
| Dominick A. Pagano | ||||
| President and Chief Executive Officer | ||||
2
EDAC Technologies: Organization and Mission
EDAC Technologies Corporation (“EDAC” or “the Company”), founded in 1946, is a diversified public
corporation that designs, manufactures and services precision components for aerospace and
industrial applications. EDAC operates as one company offering three major product lines: EDAC
AERO, Apex Machine Tool and Gros-Ite Spindles.
The Company’s manufacturing services to the aerospace sector, represented by its EDAC AERO product
line, include the design, manufacture and servicing of components for commercial and military
aircraft, in such areas as jet engine parts, special tooling, equipment, gauges and components
used in the manufacture, assembly and inspection of jet engines and other aircraft systems.
EDAC expanded its products and services to the aerospace sector with the acquisition on May 27,
2009, of certain assets of MTU Aero Engines North America Inc.’s manufacturing Business Unit
(“AERO”). AERO primarily manufactures rotating components, such as disks, rings and shafts, for
the aerospace industry. Consistent with the Company’s long-term strategic plans of achieving
growth through both organically and through targeted acquisitions, the AERO transaction added
complementary product lines, expanded EDAC’s customer base, and contributed to the diversification
of its core aerospace business into adjacent markets.
Effective January 1, 2010, all of the Company’s aerospace operations were combined into a single
product line to better serve customers, align resources and simplify market positioning. The
combined product line, renamed EDAC AERO, includes the Company’s
Precision Aerospace AERO and Aero Engine Component Repair product
lines.
EDAC AERO produces low pressure turbine cases, hubs, rings, disks and other complex, close
tolerance components for all major aircraft engine and ground turbine manufacturers. This product
line specializes in turnings and 4 and 5 axis milling of difficult-to-machine alloys such as
waspalloy, hastalloy, inconnel, titanium, high nickel alloys, aluminum and stainless steels. Its
products also include rotating components, such as disks, rings and shafts. Precision assembly
services include assembly of jet engine sync rings, aircraft welding and riveting, post-assembly
machining and sutton barrel finishing. EDAC AERO also includes the business of Aero Engine
Component Repair, acquired in December 2007, which is engaged in precision machining for the
maintenance and repair of selected components in the aircraft engine industry. Geographic markets
include the U.S., Canada, Mexico, Europe and Asia, although most of this product line’s sales come
from the United States.
The Company serves industrial customers through its Apex Machine Tool and Gros-Ite Spindles
product lines.
Apex Machine Tool designs and manufactures highly sophisticated fixtures, precision gauges, close
tolerance plastic injection molds and precision component molds for composite parts and specialized
machinery. A unique combination of highly skilled toolmakers and machinists and leading edge
technology has enabled Apex to provide exacting quality to customers
who require tolerances to +/- .0001 inches. Geographic markets include the U.S., Canada and Europe, although almost all sales
come from the United States.
Gros-Ite Spindles designs, manufactures and repairs all types of precision rolling element bearing
spindles including hydrostatic and other precision rotary devices. Custom spindles are completely
assembled in a Class 10,000 Clean Room and are built to suit any manufacturing application up to
100 horsepower and speeds in excess of 100,000 revolutions per minute. Gros-Ite Spindles’ repair
service can recondition all brands of precision rolling element spindles, domestic or foreign. On
August 10, 2009, the Company acquired the assets of Service Network Inc. (SNI), adding the
manufacture and service of precision grinders to its spindle product line. The spindle product line
serves a variety of customers: machine tool manufacturers, special machine tool builders and
integrators, industrial end-users, and powertrain machinery manufacturers and end-users.
Geographic markets include the U.S., Canada, Mexico, Europe and Asia, although almost all sales
come from the United States.
EDAC is AS9100:2004 and ISO 14001:2004 Certified. Gros-Ite Spindle is AS9100:2008 Certified.
Mission
The mission of EDAC is to be the company of choice for customers, shareholders, employees and the
community at large. We believe that this can be achieved by being flexible and responsive,
providing customers with benchmark
quality, service and value, providing shareholders superior return on their investment, developing
a world class
3
working environment for employee health, safety, security and career growth, and
acting as a good corporate citizen through support of the local community and charities.
EDAC’s long-term strategy to enhance shareholder value is based on pursuing profitable growth both
organically and through selected acquisitions. This strategy is intended to expand the Company’s
range of products and services, increase its business with existing customers, and add new customer
relationships.
MARKETING AND COMPETITION
EDAC designs, manufactures and services tooling, fixtures, molds, jet engine components and machine
spindles, satisfying the highest precision requirements of some of the most exacting customers in
the world. This high skill level has been developed through more than 50 years of involvement with
the aerospace industry. In the aerospace market, EDAC has been actively pursuing qualification as
a supplier of products to the military. Beyond aerospace, EDAC continues to expand its
manufacturing services to a broad base of industrial customers.
Most of the competition for design, manufacturing and service in precision machining and machine
tools comes from independent firms, many of which are smaller than EDAC. This point of difference
often gives us an advantage in that we can bring a broader spectrum of support to customers who are
constantly looking for ways to consolidate their vendor base. We also compete against the in-house
manufacturing and service capabilities of larger customers. We believe that the trend of these
large manufacturers is to outsource activities beyond their core competencies, which presents us
with opportunities.
The market for our products and precision machining capabilities continues to change with the
development of more sophisticated use of business-to-business tools on the internet. We are
actively involved in securing new business leads through the web and have participated in internet
auctions and research for quoting opportunities. Moreover, the sales and marketing team at EDAC has
developed an updated website (www.edactechnologies.com) with interactive tools to make it easier
for customers to do business with us.
EDAC’s competitive advantage is enhanced not only by the extra level of expertise gained through
our experience in the aerospace industry, but also by our ability to provide customers with high
quality, high precision, and quick turnaround support, from design to delivery. We believe that
this comprehensive end-to-end service capability sets us apart. It is also indicative of our
commitment to seek continuous improvement and utilization of the latest technology. Such
commitment, we believe, will boost our productivity and make us ready to respond effectively to the
increasing price pressure in a very competitive marketplace. To maintain and strengthen its
competitive position, EDAC will continue to invest in improvements to its capacity to provide
advanced in-house design and engineering capabilities, and facilities equipped with the latest
enabling machine tools and manufacturing technologies.
MARKET INFORMATION
The Company’s Common Stock trades on The Nasdaq Capital Market under the symbol: “EDAC”.
High and low sales prices per share during each fiscal quarter of the past two fiscal years were as
follows:
| 2009 | 2008 | |||||||||||||||
| High | Low | High | Low | |||||||||||||
First Quarter |
$ | 1.97 | $ | 1.20 | $ | 9.58 | $ | 6.26 | ||||||||
Second Quarter |
4.32 | 1.76 | 7.81 | 6.16 | ||||||||||||
Third Quarter |
5.00 | 3.18 | 7.00 | 3.61 | ||||||||||||
Fourth Quarter |
4.75 | 3.03 | 3.61 | 1.00 | ||||||||||||
The information provided above reflects inter-dealer prices, without retail mark-ups,
markdowns or commissions and may not represent actual transactions.
The approximate number of shareholders of record plus beneficial shareholders of the Company’s
Common Stock at February 25, 2010 was 1,466.
4
The Company has never paid cash dividends. The Company must obtain approval from its primary lender
prior to paying any cash dividends (See Note D to the Consolidated Financial Statements and
Management’s Discussion and Analysis of Financial Condition and Results of Operations included
elsewhere in this report).
Shareholder Return Performance Graph
The following performance graph compares the five year cumulative total shareholder return from
investing $100 on January 1, 2005 in the Company’s Common Stock to (i) the Total Return Index for
The Nasdaq Stock Market (U.S. Companies) (the “Nasdaq (US) Index”) and (ii) the Total Return Index
for Nasdaq Trucking and Transportation Stocks (the “Nasdaq Transportation Index”).
Comparison of Five-Year Cumulative Total Return of EDAC Common Stock, Nasdaq (US)
Index and Nasdaq Transportation Index
Index and Nasdaq Transportation Index
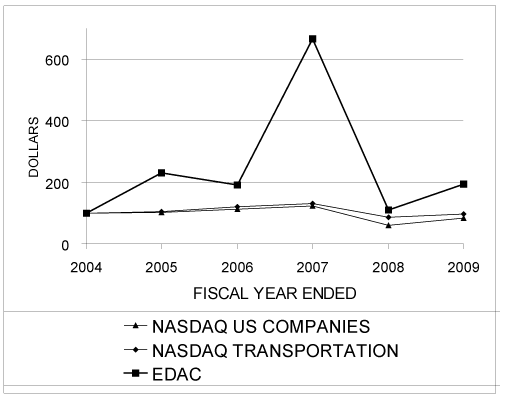
| Nasdaq | ||||||||||||
| Nasdaq (US) | Transportation | EDAC Technologies | ||||||||||
| Fiscal Year Ended | Index | Index | Corporation | |||||||||
January 1, 2005 |
$ | 100 | $ | 100 | $ | 100 | ||||||
December 31, 2005 |
102 | 104 | 231 | |||||||||
December 30, 2006 |
112 | 121 | 190 | |||||||||
December 29, 2007 |
123 | 132 | 666 | |||||||||
January 3, 2009 |
61 | 87 | 110 | |||||||||
January 2, 2010 |
84 | 98 | 193 | |||||||||
5
SELECTED FINANCIAL INFORMATION
The following selected financial information for each of the two most recent fiscal years has been
derived from the Company’s audited financial statements. The following data is qualified by
reference to and should be read in conjunction with the Company’s audited financial statements and
notes thereto and “Management’s Discussion and Analysis of Financial Condition and Results of
Operations.”
The Company operates on a fiscal year basis. The Company’s fiscal year is a 52 or 53-week period
ending on the Saturday closest to December 31. The 2009 fiscal year was a 52-week year.
SELECTED STATEMENT OF INCOME DATA
| (In thousands, except per share data) | 2009 | 2008 | ||||||
Sales |
$ | 54,643 | $ | 44,677 | ||||
Net income |
$ | 7,626 | $ | 1,138 | ||||
Earnings per common share: |
||||||||
Basic |
$ | 1.58 | $ | 0.24 | ||||
Diluted |
$ | 1.54 | $ | 0.23 | ||||
SELECTED BALANCE SHEET DATA
| (In thousands) | 2009 | 2008 | ||||||
Current assets |
$ | 33,468 | $ | 18,982 | ||||
Total assets |
56,127 | 31,464 | ||||||
Current liabilities |
14,284 | 9,271 | ||||||
Working capital |
19,184 | 9,711 | ||||||
Long-term liabilities |
18,077 | 6,526 | ||||||
Shareholders’ equity |
23,766 | 15,667 | ||||||
6
MANAGEMENTS’ DISCUSSION AND ANALYSIS OF FINANCIAL CONDITION
AND RESULTS OF OPERATIONS
(in thousands)
AND RESULTS OF OPERATIONS
(in thousands)
RESULTS OF OPERATIONS
The following discussion should be read in conjunction with the Consolidated Financial
Statements of the Company and related notes thereto.
Sales to the Company’s principal markets are as follows:
| 2009 | 2008 | |||||||
Aerospace customers |
$ | 41,979 | $ | 30,756 | ||||
Other |
12,664 | 13,921 | ||||||
Total |
$ | 54,643 | $ | 44,677 | ||||
Sales by product line are as follows:
| 2009 | 2008 | |||||||
EDAC Aero |
$ | 36,697 | $ | 21,191 | ||||
Apex Machine Tool |
15,280 | 19,429 | ||||||
Gros-Ite Spindles |
2,666 | 4,057 | ||||||
Total |
$ | 54,643 | $ | 44,677 | ||||
2009 vs. 2008
Acquisition of AERO
On May 27, 2009, the Company acquired certain assets of MTU Aero Engines North America Inc.’s
Manufacturing Business Unit (AERO). The acquisition was accounted for under the purchase method
of accounting with the assets acquired recorded at their fair values at the date of acquisition.
The results of operations of the acquired business
have been included in the Consolidated Statement of Operations beginning as of the effective date
of acquisition. The acquisition further diversifies our core Aerospace business to adjacent
markets and is consistent with our long term growth plan.
Sales
The Company’s sales increased $9,966 or 22.3%, from $44,677 in 2008 to $54,643 in 2009. Sales to
aerospace customers increased $11,223, or 36.5% from 2008 to 2009, primarily due to the inclusion
of the sales of the Company’s AERO acquisition commencing on May 27, 2009. This was partially
offset by the decrease in shipments of tooling and fixtures. Sales to non-aerospace customers
decreased $1,257 or 9.0% from 2008 to 2009, due to decreased sales to the power generation
industry. As of January 2, 2010, sales backlog was approximately $125,900, compared to
approximately $52,400 at January 3, 2009. The sales backlog increase is primarily due to the
acquisition of AERO. The Company presently expects to complete approximately $54,000 of the January
2, 2010 backlog during the 2010 fiscal year.
Sales for the EDAC Aero product line increased $15,506, or 73.2%, from $21,191 in 2008 to $36,697
in 2009. The increase was due primarily to the Company’s May 27, 2009 acquisition of AERO which
contributed $13,900. Additionally, shipments of certain jet engine parts to our major aerospace
customers increased partially offset by modifications of Boeing’s delivery schedules. The
Company’s sales backlog for EDAC Aero increased from $47,700 at January 3, 2009 to $118,800 at
January 2, 2010. To further increase machining capacity in support of the EDAC
7
MANAGEMENTS’ DISCUSSION AND ANALYSIS OF FINANCIAL CONDITION
AND RESULTS OF OPERATIONS (continued)
(in thousands)
AND RESULTS OF OPERATIONS (continued)
(in thousands)
Aero
product line, the Company plans on taking delivery on $3,100 of additional machinery and
equipment for the EDAC Aero product line in 2010.
Sales for the Apex Machine Tool product line decreased $4,149, or 21.4%, from $19,429 in 2008 to
$15,280 in 2009. The decrease was due to adverse market conditions. Sales backlog for the Apex
Machine Tool product line increased from $4,400 million at
January 3, 2009 to $5,100 million at January
2, 2010.
Sales for the Gros-Ite Spindles product line, which includes SNI sales of $446, decreased $1,391,
or 34.3% from $4,057 in 2008 to $2,666 in 2009 due to adverse market conditions. The Company
believes, based on indications from its customers, that demand for both new spindles and the repair
of spindles will improve slightly for 2010.
Cost of Sales
Cost of sales as a percentage of sales increased in 2009 to 89.2% from 86.9% in 2008. This
increase was primarily due to the sales levels decreasing in the Apex and Spindle product lines
more significantly than manufacturing costs due to the fixed element or semi-variable element of
certain manufacturing costs. Additionally, the costs of the start-up of our new Service Network
International (SNI) product line were considerable. EDAC purchased the SNI assets through the
Bankruptcy Court process in August 2009 and operations had ceased months before. A move to new and
larger facilities is anticipated for SNI in the second quarter of 2010.
Selling, General and Administrative Expenses
Selling, general and administrative expenses were $4,850 in 2009, representing an increase of
$1,358, or 38.9%, from the 2008 level of $3,492. The increase was primarily due to the inclusion
of selling, general and administrative expenses of the Company’s AERO acquisition commencing on May
27, 2009. Additionally, increases in salary expense and pension expense were partially offset by
decreases in bonus and profit sharing expense.
Interest Expense
Interest
expense for 2009 increased $198 to $829 from $631 in 2008. This was due to increased
borrowing levels associated with the acquisition of AERO. See Note D to the Consolidated Financial
Statements.
Other Income.
The Company, due to bargain purchase accounting rules, recognized a gain on the acquisition of
AERO in the amount of $12,161. The gain has been offset by acquisition related expenses in the
amount of $257, resulting in a net gain of $11,904. See Note A to the Consolidated Financial
Statements.
Provision for Income Taxes
The effective income tax provision rate for 2009 was 37.4%, compared to 37.5% in 2008.
For additional discussion of income taxes, see “Critical Accounting Policies and Estimates —
Income Taxes” and Note G to the Consolidated Financial Statements.
LIQUIDITY AND CAPITAL RESOURCES
The Company has met its working capital needs through funds generated from operations. The Company
assesses its liquidity in terms of its ability to generate cash to fund its operating and investing
activities. A decrease in product demand would impact the availability of funds. Of particular
importance to the Company’s liquidity are cash flows generated from operating activities, capital
expenditure levels and borrowings on the revolving credit facility.
8
MANAGEMENTS’ DISCUSSION AND ANALYSIS OF FINANCIAL CONDITION
AND RESULTS OF OPERATIONS (continued)
(in thousands)
AND RESULTS OF OPERATIONS (continued)
(in thousands)
Long-term Debt and Revolving Line of Credit
Long-term debt and lines of credit consist of the following:
| Jan 2, 2010 | Jan 3, 2009 | |||||||
Lines of credit |
$ | 1,591 | $ | 1,675 | ||||
Term notes |
8,420 | 3,915 | ||||||
Mortgage loans |
5,475 | 3,011 | ||||||
Capital lease obligations |
92 | 278 | ||||||
| 15,578 | 8,879 | |||||||
Less — equipment line of credit |
1,391 | 1,675 | ||||||
Less — revolving line of credit |
200 | — | ||||||
Less — current portion of long-term debt |
1,833 | 2,376 | ||||||
| $ | 12,154 | $ | 4,828 | |||||
Cash Flow
The following is selected cash flow data from the Consolidated
Statements of Cash Flows:
| 2009 | 2008 | |||||||
Net cash provided by (used in)
operating activities |
$ | 3,556 | ($39 | ) | ||||
Net cash used in
investing activities |
(10,289 | ) | (1,793 | ) | ||||
Net cash provided by (used in)
financing activities |
6,522 | (143 | ) | |||||
2009
The increase in cash generated from operating activities in 2009 as compared to 2008 is primarily
due to a decrease in net operating assets and liabilities of $1,257 during 2009 as compared to an
increase in net operating assets and liabilities of $2,544 during 2008. Impacting 2009 were
decreases in accounts receivable of $1,431 and $575, respectively and increases in other
liabilities and trade accounts payable of $1,320 and $737, respectively. This was partially offset
by an increase in inventories of $2,785.
Cash used in investing activities primarily reflects the Company’s business acquisitions and
expenditures for capital equipment. Capital expenditures for 2010 are targeted at $4,000 to
$5,000.
Cash flows provided by financing activities primarily reflect $9,500 of new debt to finance the
Company’s business acquisition. Cash was used in financing activities for scheduled payments of
term debt in the amount of $2,717 and to reduce the lines of credit by $84. Amounts advanced on
the equipment line of credit will convert to a term note on July 31, 2010, unless converted earlier
at the option of the Company.
As of January 2, 2010, the Company had $200 outstanding balance on its revolving line of credit and
$1,391 outstanding on its equipment line of credit and had $4,800 and $3,309, respectively,
available for additional borrowings.
9
MANAGEMENTS’ DISCUSSION AND ANALYSIS OF FINANCIAL CONDITION
AND RESULTS OF OPERATIONS (continued)
(in thousands)
AND RESULTS OF OPERATIONS (continued)
(in thousands)
2008
Impacting operating cash flow for 2008 was an increase in net operating assets and liabilities of
$2,544. Inventories increased by $1,447, due to an increase in the amount of raw material
purchased and put into production in the later
part of 2008 compared to 2007, and due to
changes by our aerospace customers to our delivery schedules. The increase in accounts receivable
reflect a change in payment terms from our major aerospace customer, while a decrease in accounts
payable compared to 2007 reflects the payment in early 2008 of a large machine delivered to the
Company in late 2007.
Cash used in investing activities reflects expenditures and deposits of $837 and $981,
respectively, primarily for machinery and equipment to increase manufacturing capacity. Capital
expenditures for 2009 were targeted at $4,000 to $6,300. Of that targeted amount $2,300 was on
order for which deposits of $981 were paid in 2008.
Net cash used in financing activities resulted primarily from the repayment of the revolving line
of credit. Repayment of long-term bank debt was mostly offset by a new borrowing of long-term bank
debt.
The
Company believes that its credit facilities (See Note D to the
Consolidated Financial Statements) and cash to be provided by
operations will be adequate to meet the Company’s liquidity
needs for 2010.
CRITICAL ACCOUNTING POLICIES AND ESTIMATES
The preparation of consolidated financial statements in conformity with accounting principles
generally accepted in the United States of America requires management to make estimates and
assumptions that affect the reported amounts of assets and liabilities and disclosure of contingent
assets and liabilities at the date of the consolidated financial statements and the reported
amounts of revenues and expenses during the reporting period. Actual results could differ from
those estimates. The Company’s significant accounting policies are set forth below.
Revenue Recognition — Sales are recorded when all criteria for revenue recognition have been
satisfied, which is generally when goods are shipped to the Company’s customers. The Company
defers revenue recognition on certain product shipments until customer acceptance, including
inspection and installation requirements, as defined, are achieved.
Accounts receivable — The Company evaluates its allowance for doubtful accounts by considering the
age of each invoice, the financial strength of the customer, the customer’s past payment record and
subsequent payments.
Inventories — Inventories are stated at the lower of cost (first-in, first-out method) or market.
The Company has specifically identified certain inventory as obsolete or slow-moving and provided a
full reserve for these parts. The assumption is that these parts will not be sold. The
assumptions and the resulting reserve have been reasonably accurate in the past, and are not likely
to change materially in the future.
Income Taxes — The Company will only recognize a deferred tax asset when, based upon available
evidence, realization is more likely than not. In making this determination, the Company has
considered both available positive and negative evidence including, but not limited to, cumulative
losses in recent years, future taxable income and prudent and feasible tax planning strategies. At
present, the Company has concluded that it is more likely than not that the Company will realize
all of its deferred tax assets. Valuation allowances related to deferred tax assets can also be
impacted by changes to tax laws, changes to statutory tax rates and future taxable income levels.
In the event the Company were to determine that it would not be able to realize all or a portion of
its deferred tax assets in the future, it would record a valuation allowance through a charge to
income in the period in which that determination is made.
The provisions of the Financial Accounting Standards Board (“FASB”) Accounting Standards
Codification (“ASC”) 740-10 address the determination of whether tax benefits claimed or expected
to be claimed on a tax return should be recorded in the financial statements. Under ASC 740-10,
the Company may recognize the tax benefit from an uncertain tax position only if it is more likely
than not that the tax position will be sustained on examination by taxing
10
MANAGEMENTS’ DISCUSSION AND ANALYSIS OF FINANCIAL CONDITION
AND RESULTS OF OPERATIONS (continued)
(in thousands)
AND RESULTS OF OPERATIONS (continued)
(in thousands)
authorities, based on the technical merits of the position. The Company has determined that
it has no significant uncertain tax positions.
Long-Lived Assets — Property, plant and equipment are carried at cost less accumulated
depreciation. The appropriateness and the recoverability of the carrying value of such assets are
periodically reviewed taking into consideration current and expected business conditions.
Share-based compensation — Share-based compensation cost is measured at the grant date, based on
the calculated fair value of the award, and is recognized as an expense over the employee’s
requisite service period (generally the vesting period of the equity grant). The Company
estimates the fair value of stock options using the Black-Scholes valuation model. Key input
assumptions used to estimate the fair value of stock options include the expected option term, the
expected volatility of the Company’s stock over the option’s expected term, the risk-free interest
rate over the option’s expected term, and the Company’s expected annual dividend yield. The
Company believes that the valuation technique and the approach utilized to develop the underlying
assumptions are appropriate in calculating the fair values of the Company’s stock options granted
during the fiscal years ended January 2, 2010 and January 3, 2009. Estimates of fair value are not
intended to predict actual future events or the value ultimately realized by persons who receive
equity awards.
Pension — The Company maintains a noncontributory defined benefit pension plan covering
substantially all employees meeting certain minimum age and service requirements. The benefits are
generally based on years of service and compensation during the last five years of employment. The
Company’s policy is to contribute annually the amount necessary to satisfy the requirements of the
Employee Retirement Income Security Act of 1974. In March 1993, the Board of Directors approved a
curtailment to the plan which resulted in the freezing of all future benefits under the plan as of
April 1, 1993.
Net periodic benefit cost (income) for the plan was $211 and ($21) for the fiscal years ended
January 2, 2010 and January 3, 2009, respectively, and is calculated based upon a number of
actuarial assumptions, including an expected long-term rate of return on our plan assets of 7% for
each year. In developing our expected long-term rate of return assumption, we evaluated input from
our actuaries and our investment managers. We anticipate that our investment managers will
continue to generate long-term returns of at least 7%. We regularly review our asset allocation
and periodically rebalance our investments when considered appropriate. For the year ended January
2, 2010, we realized a return of greater than 7%, however, we continue to believe that 7% is a
reasonable long-term rate of return on our plan assets.
The discount rate that we utilize for determining future pension obligations is based on a review
of long-term bonds that receive one of the two highest ratings given by a recognized rating agency.
The discount rate determined on this basis has been reduced to 5.75% at January 2, 2010 from 6.25%
at January 3, 2009. Based on an expected rate of return on our plan assets of 7.0%, a discount
rate of 5.75% and various other assumptions, we estimate that our pension expense for the plan will
be approximately $146, $142, and $133 in 2010, 2011 and 2012, respectively. Future actual pension
expense will depend on future investment performance, changes in future discount rates and various
other factors related to the populations participating in our plan. We will continue to evaluate
our actuarial assumptions, including our discount rate and expected rate of return, at least
annually, and will adjust as necessary.
The value of our plan assets has increased from $3,800 on at January 3, 2009 to $4,300 at January
2, 2010. For the year ended January 2, 2010, the investment performance returns were greater that
7% and the discount rate was reduced to 5.75% resulting in an actuarial loss of $400. As a result
of the above, the funded status of our plan decreased from $1,700 unfunded at January 3, 2009, to
$1,500 unfunded at January 2, 2010. We believe that, based on our actuarial assumptions, we will
be required to continue to make cash contributions to our plan.
During fiscal 2009, the Company made no contribution to the plan, which met the minimum required
for the plan year beginning October 1, 2008. In the absence of significant changes, it is
estimated that there will be a $25 minimum required contribution for the plan year beginning
October 1, 2009. See Note F to the Consolidated Financial Statements for further discussion.
The Company recognizes the overfunded or underfunded status of its defined benefit pension plan.
Actuarial gains and losses, prior service costs or credits, and any remaining transition assets or
obligations that have not been
11
MANAGEMENTS’ DISCUSSION AND ANALYSIS OF FINANCIAL CONDITION
AND RESULTS OF OPERATIONS (continued)
(in thousands)
AND RESULTS OF OPERATIONS (continued)
(in thousands)
recognized are recognized in Accumulated Other Comprehensive Loss, net of tax effects, until
they are amortized as a component of net periodic benefit cost.
The Company’s significant accounting policies are more fully described in Note A to the Company’s
Consolidated Financial Statements.
ACCOUNTING STANDARDS NOT YET ADOPTED
In June 2009, the FASB issued guidance under FASB ASC 860-20, Sales of Financial Assets, The
guidance removes the concept of a qualifying special-purpose entity and establishes a new
“participating interest” definition that must be met for transfers of portions of financial assets
to be eligible for sale accounting, clarifies and amends the derecognition criteria for a transfer
to be accounted for as a sale, and changes the amount that can be recognized as a gain or loss on
a transfer accounted for as a sale when beneficial interests are received by the transferor.
Enhanced disclosures are also required to provide information about transfers of financial assets
and a transferor’s continuing involvement with transferred financial assets. This statement must
be applied as of the beginning of an entity’s first annual reporting period that begins after
November 15, 2009, for interim periods within that first annual reporting period, and for interim
and annual reporting periods thereafter. Earlier application is prohibited. The Company is
currently evaluating this new guidance.
In June 2009, the FASB issued guidance under FASB ASC 810, Consolidation of Variable Interest
Entities. The guidance amends previous accounting related to the Consolidation of Variable
Interest Entities to require an enterprise to qualitatively assess the determination of the
primary beneficiary of a variable interest entity (VIE) based on whether the entity (1) has the
power to direct the activities of a VIE that most significantly impact the entity’s economic
performance and (2) has the obligation to absorb losses of the entity or the right to receive
benefits from the entity that could potentially be significant to the VIE. Also, the guidance
requires an ongoing reconsideration of the primary beneficiary, and amends the events that trigger
a reassessment of whether an entity is a VIE. Enhanced disclosures are also required to provide
information about an enterprise’s involvement in a VIE. This statement will be effective as of the
beginning of each reporting entity’s first annual reporting period that begins after November 15,
2009, for interim periods within that first annual reporting period, and for interim and annual
reporting periods thereafter. Earlier application is prohibited. The Company is currently
evaluating this new guidance.
In October 2009, the FASB issued Accounting Standard Update (“ASU”) No. 2009-13,
“Multiple-Deliverable Revenue Arrangements.” This ASU establishes the accounting and reporting
guidance for arrangements including multiple revenue-generating activities. This ASU provides
amendments to the criteria for separating deliverables, measuring and allocating arrangement
consideration to one or more units of accounting. The amendments in this ASU also establish a
selling price hierarchy for determining the selling price of a deliverable. Significantly enhanced
disclosures are also required to provide information about a vendor’s multiple-deliverable revenue
arrangements, including information about the nature and terms, significant deliverables, and its
performance within arrangements. The amendments also require providing information about the
significant judgments made and changes to those judgments and about how the application of the
relative selling-price method affects the timing or amount of revenue recognition. The amendments
in this ASU are effective prospectively for revenue arrangements entered into or materially
modified in the fiscal years beginning on or after June 15, 2010. Early application is permitted.
The Company is currently evaluating this new ASU.
No other recently issued, but not yet adopted accounting pronouncements are expected to have a
material impact on the Company.
Certain factors that may affect future results of operations
All statements other than historical statements contained in this annual report constitute
“forward-looking statements” within the meaning of the Private Securities Litigation Reform Act of
1995. Without limitation, these forward looking statements include statements regarding the
Company’s business strategy and plans, statements about the adequacy of the Company’s working
capital and other financial resources, statements about the Company’s bank agreements, statements
about the Company’s backlog, statements about the Company’s action to improve operating
12
MANAGEMENTS’ DISCUSSION AND ANALYSIS OF FINANCIAL CONDITION
AND RESULTS OF OPERATIONS (continued)
(in thousands)
AND RESULTS OF OPERATIONS (continued)
(in thousands)
performance, and other statements herein that are not of a historical nature. These
forward-looking statements rely on a number of assumptions concerning future events and are
subject to a number of uncertainties and other factors, many of which are outside of the
Company’s control, that could cause actual results to differ materially from such statements.
These include, but are not limited to, factors which could affect demand for the Company’s
products and services such as general economic conditions and economic conditions in the
aerospace industry and the other industries in which the Company competes; competition from
the Company’s competitors; the Company’s ability to effectively use business-to-business tools
on the Internet to improve operating results; the adequacy of the Company’s revolving credit
facility and other sources of capital; and other factors discussed in the Company’s annual
report on Form 10-K for the year ended January 2, 2010. The Company disclaims any intention
or obligation to update or revise any forward-looking statements, whether as a result of new
information, future events or otherwise.
13
REPORT OF INDEPENDENT REGISTERED PUBLIC ACCOUNTING FIRM
To the Shareholders and Board of Directors of
EDAC Technologies Corporation
EDAC Technologies Corporation
We have audited the accompanying consolidated balance sheets of EDAC Technologies Corporation and
subsidiaries (the “Company”) as of January 2, 2010 and January 3, 2009, and the related
consolidated statements of income, cash flows and changes in shareholders’ equity and
comprehensive income (loss) for the years then ended. The Company’s management is responsible for
these consolidated financial statements. Our responsibility is to express an opinion on these
consolidated financial statements based on our audits.
We conducted our audits in accordance with the standards of the Public Company Accounting
Oversight Board (United States). Those standards require that we plan and perform the audits to
obtain reasonable assurance about whether the consolidated financial statements are free of
material misstatement. The Company is not required to have, nor were we engaged to perform, an
audit of its internal control over financial reporting. Our audits included consideration of
internal control over financial reporting as a basis for designing audit procedures that are
appropriate in the circumstances, but not for the purpose of expressing an opinion on the
effectiveness of the Company’s internal control over financial reporting. Accordingly, we express
no such opinion. An audit also includes examining, on a test basis, evidence supporting the
amounts and disclosures in the consolidated financial statements, assessing the accounting
principles used and significant estimates made by management, as well as evaluating the overall
financial statement presentation. We believe that our audits provide a reasonable basis for our
opinion.
In our opinion, the consolidated financial statements referred to above present fairly, in all
material respects, the financial position of EDAC Technologies Corporation and subsidiaries as of
January 2, 2010 and January 3, 2009, and the results of their operations and their cash flows for
the years then ended in conformity with accounting principles generally accepted in the United
States of America.
/s/ CCR LLP
Glastonbury, Connecticut
March 4, 2010
March 4, 2010
14
EDAC Technologies Corporation
CONSOLIDATED BALANCE SHEETS
As of January 2, 2010 and January 3, 2009
(in thousands)
CONSOLIDATED BALANCE SHEETS
As of January 2, 2010 and January 3, 2009
(in thousands)
| January 2, | January 3, | |||||||
| 2010 | 2009 | |||||||
ASSETS |
||||||||
CURRENT ASSETS: |
||||||||
Cash |
$ | 1,100 | $ | 1,311 | ||||
Accounts receivable (net of allowance for
for doubtful accounts of $249 as of
January 2, 2010 and $186 as of
January 3, 2009) |
10,862 | 7,932 | ||||||
Inventories, net |
19,990 | 7,962 | ||||||
Prepaid expenses and other current
assets |
306 | 107 | ||||||
Refundable income taxes |
112 | 687 | ||||||
Deferred income taxes |
1,098 | 983 | ||||||
Total current assets |
33,468 | 18,982 | ||||||
PROPERTY, PLANT AND EQUIPMENT, at cost: |
||||||||
Land |
1,546 | 893 | ||||||
Buildings and improvements |
10,166 | 7,519 | ||||||
Machinery and equipment |
36,719 | 26,935 | ||||||
| 48,431 | 35,347 | |||||||
Less: accumulated depreciation |
25,974 | 23,993 | ||||||
| 22,457 | 11,354 | |||||||
DEFERRED INCOME TAXES |
— | 106 | ||||||
OTHER ASSETS: |
||||||||
Deposits on machinery |
— | 981 | ||||||
Other |
202 | 40 | ||||||
| 202 | 1,022 | |||||||
TOTAL ASSETS |
$ | 56,127 | $ | 31,464 | ||||
See notes to consolidated financial statements.
15
EDAC Technologies Corporation
CONSOLIDATED BALANCE SHEETS (CONTINUED)
As of January 2, 2010 and January 3, 2009
(in thousands except share amounts)
CONSOLIDATED BALANCE SHEETS (CONTINUED)
As of January 2, 2010 and January 3, 2009
(in thousands except share amounts)
| January 2, | January 3, | |||||||
| 2010 | 2009 | |||||||
LIABILITIES AND SHAREHOLDERS’ EQUITY |
||||||||
CURRENT LIABILITIES: |
||||||||
Lines of credit |
$ | 1,591 | $ | 1,675 | ||||
Current portion of long-term debt |
1,833 | 2,376 | ||||||
Trade accounts payable |
6,828 | 3,485 | ||||||
Employee compensation and amounts
withheld |
1,185 | 1,112 | ||||||
Accrued expenses |
1,819 | 361 | ||||||
Customer advances |
1,028 | 262 | ||||||
Total current liabilities |
14,284 | 9,271 | ||||||
LONG-TERM DEBT, less current portion |
12,154 | 4,828 | ||||||
PENSION LIABILITIES |
1,448 | 1,698 | ||||||
DEFERRED INCOME TAXES |
4,475 | — | ||||||
COMMITMENTS AND CONTINGENCIES (NOTE H) |
— | — | ||||||
SHAREHOLDERS’ EQUITY: |
||||||||
Common stock, par value $.0025 per
share; 20,000,000 shares authorized;
issued and outstanding— 4,840,803 on
January 2, 2010 and 4,825,303
on January 3, 2009 |
12 | 12 | ||||||
Additional paid-in capital |
11,225 | 10,935 | ||||||
Retained earnings |
14,785 | 7,159 | ||||||
| 26,022 | 18,105 | |||||||
Less: accumulated other comprehensive loss |
2,256 | 2,439 | ||||||
Total shareholders’ equity |
23,766 | 15,667 | ||||||
TOTAL LIABILITIES AND
SHAREHOLDERS’ EQUITY |
$ | 56,127 | $ | 31,464 | ||||
See notes to consolidated financial statements.
16
EDAC Technologies Corporation
CONSOLIDATED STATEMENTS OF INCOME
For the Fiscal Years Ended January 2, 2010
and January 3, 2009
(in thousands except per share amounts)
CONSOLIDATED STATEMENTS OF INCOME
For the Fiscal Years Ended January 2, 2010
and January 3, 2009
(in thousands except per share amounts)
| FISCAL YEAR | ||||||||
| 2009 | 2008 | |||||||
Sales |
$ | 54,643 | $ | 44,677 | ||||
Cost of Sales |
48,716 | 38,805 | ||||||
Gross Profit |
5,927 | 5,872 | ||||||
Selling, General and Administrative Expenses |
4,850 | 3,492 | ||||||
Income from Operations |
1,076 | 2,380 | ||||||
Non-Operating Income (Expense): |
||||||||
Interest Expense |
(829 | ) | (631 | ) | ||||
Other |
11,941 | 73 | ||||||
Income before Provision For Income Taxes |
12,188 | 1,822 | ||||||
Provision for Income Taxes |
4,562 | 683 | ||||||
Net Income |
$ | 7,626 | $ | 1,138 | ||||
Basic Income Per Common Share: |
$ | 1.58 | $ | 0.24 | ||||
Diluted Income Per Common Share: |
$ | 1.54 | $ | 0.23 | ||||
See notes to consolidated financial statements.
17
EDAC Technologies Corporation
CONSOLIDATED STATEMENTS OF CASH FLOWS
For the Fiscal Years Ended January 2, 2010
and January 3, 2009
(in thousands)
CONSOLIDATED STATEMENTS OF CASH FLOWS
For the Fiscal Years Ended January 2, 2010
and January 3, 2009
(in thousands)
| FISCAL YEAR | ||||||||||||||||||||||||||||||||||||||||||||
| 2009 | 2008 | |||||||||||||||||||||||||||||||||||||||||||
Operating Activities: |
||||||||||||||||||||||||||||||||||||||||||||
Net income |
$ | 7,626 | $ | 1,138 | ||||||||||||||||||||||||||||||||||||||||
Adjustments to reconcile net income
to net cash provided by (used in) operating activities: |
||||||||||||||||||||||||||||||||||||||||||||
Depreciation and amortization |
2,137 | 1,984 | ||||||||||||||||||||||||||||||||||||||||||
Deferred income taxes |
4,338 | 251 | ||||||||||||||||||||||||||||||||||||||||||
Gain on acquisition of business |
(12,161 | ) | — | |||||||||||||||||||||||||||||||||||||||||
Gain on sale of property, plant and equipment |
(33 | ) | (25 | ) | ||||||||||||||||||||||||||||||||||||||||
Compensation expense pursuant to stock options |
260 | 221 | ||||||||||||||||||||||||||||||||||||||||||
Excess tax benefit from share-based compensation |
(10 | ) | (308 | ) | ||||||||||||||||||||||||||||||||||||||||
Provision for inventories reserve |
17 | 83 | ||||||||||||||||||||||||||||||||||||||||||
Provision for doubtful accounts receivable |
128 | 17 | ||||||||||||||||||||||||||||||||||||||||||
Changes in operating assets and liabilities: |
||||||||||||||||||||||||||||||||||||||||||||
Accounts receivable |
1,431 | (310 | ) | |||||||||||||||||||||||||||||||||||||||||
Refundable income taxes |
575 | (402 | ) | |||||||||||||||||||||||||||||||||||||||||
Inventories |
(2,785 | ) | (1,447 | ) | ||||||||||||||||||||||||||||||||||||||||
Prepaid expenses and other assets |
(21 | ) | 373 | |||||||||||||||||||||||||||||||||||||||||
Trade accounts payable |
737 | (537 | ) | |||||||||||||||||||||||||||||||||||||||||
Other current liabilities |
1,320 | (1,078 | ) | |||||||||||||||||||||||||||||||||||||||||
Net cash provided by (used in) operating activities |
3,556 | (39 | ) | |||||||||||||||||||||||||||||||||||||||||
Investing Activities: |
||||||||||||||||||||||||||||||||||||||||||||
Additions to property, plant and equipment |
(1,029 | ) | (837 | ) | ||||||||||||||||||||||||||||||||||||||||
Equipment deposits |
981 | (981 | ) | |||||||||||||||||||||||||||||||||||||||||
Cash paid for businesses acquired |
(10,275 | ) | — | |||||||||||||||||||||||||||||||||||||||||
Proceeds from sales of property, plant and equipment |
34 | 26 | ||||||||||||||||||||||||||||||||||||||||||
Net cash used in investing activities |
(10,289 | ) | (1,793 | ) | ||||||||||||||||||||||||||||||||||||||||
Financing Activities: |
||||||||||||||||||||||||||||||||||||||||||||
(Decrease) increase in lines of credit |
(84 | ) | 1,675 | |||||||||||||||||||||||||||||||||||||||||
Borrowings on long-term debt |
9,500 | — | ||||||||||||||||||||||||||||||||||||||||||
Repayments of long-term debt |
(2,717 | ) | (2,287 | ) | ||||||||||||||||||||||||||||||||||||||||
Deferred financing fees |
(208 | ) | — | |||||||||||||||||||||||||||||||||||||||||
Proceeds from exercise of common stock options |
21 | 161 | ||||||||||||||||||||||||||||||||||||||||||
Excess tax benefit from share-based compensation |
10 | 308 | ||||||||||||||||||||||||||||||||||||||||||
Net cash provided by (used in) financing activities |
6,522 | (143 | ) | |||||||||||||||||||||||||||||||||||||||||
Decrease in cash |
(211 | ) | (1,975 | ) | ||||||||||||||||||||||||||||||||||||||||
Cash at beginning of year |
1,311 | 3,286 | ||||||||||||||||||||||||||||||||||||||||||
Cash at end of year |
$ | 1,100 | $ | 1,311 | ||||||||||||||||||||||||||||||||||||||||
Supplemental Disclosure of
Cash Flow Information: |
||||||||||||||||||||||||||||||||||||||||||||
Interest paid |
$ | 825 | $ | 631 | ||||||||||||||||||||||||||||||||||||||||
Income taxes paid (refunded) |
(351 | ) | 526 | |||||||||||||||||||||||||||||||||||||||||
See notes to consolidated financial statements.
18
EDAC Technologies Corporation
CONSOLIDATED STATEMENTS OF CHANGES IN SHAREHOLDERS’ EQUITY
AND COMPREHENSIVE INCOME (LOSS)
For the Fiscal Years Ended January 2, 2010 and January 3, 2009
(in thousands)
CONSOLIDATED STATEMENTS OF CHANGES IN SHAREHOLDERS’ EQUITY
AND COMPREHENSIVE INCOME (LOSS)
For the Fiscal Years Ended January 2, 2010 and January 3, 2009
(in thousands)
| Additional | Accumulated | |||||||||||||||||||
| Common | Paid-in | Retained | Other | |||||||||||||||||
| Stock | Capital | Earnings | Comprehensive | Total | ||||||||||||||||
Balances at December 29, 2007 |
$ | 12 | $ | 10,246 | $ | 6,020 | ($1,097 | ) | $ | 15,181 | ||||||||||
Comprehensive income: |
||||||||||||||||||||
Net income |
— | — | 1,138 | — | 1,138 | |||||||||||||||
Minimum pension liability,
net of income tax benefit of $856 |
— | — | — | (1,342 | ) | (1,342 | ) | |||||||||||||
Total comprehensive loss |
(204 | ) | ||||||||||||||||||
Exercise of stock options |
— | 468 | — | — | 468 | |||||||||||||||
Stock option compensation expense |
— | 221 | — | — | 221 | |||||||||||||||
Balances at January 3, 2009 |
12 | 10,935 | 7,159 | (2,439 | ) | 15,666 | ||||||||||||||
Comprehensive income: |
||||||||||||||||||||
Net income |
— | — | 7,626 | — | 7,626 | |||||||||||||||
Minimum pension liability,
net of income taxes of $168 |
— | — | — | 253 | 253 | |||||||||||||||
Unrealized loss on cash flow hedges
net of income tax benefit of $40 |
(70 | ) | (70 | ) | ||||||||||||||||
Total comprehensive income |
7,809 | |||||||||||||||||||
Exercise of stock options |
— | 31 | — | — | 31 | |||||||||||||||
Stock option compensation expense |
— | 260 | — | — | 260 | |||||||||||||||
Balances at January 2, 2010 |
$ | 12 | $ | 11,225 | $ | 14,785 | ($2,256 | ) | $ | 23,766 | ||||||||||
See notes to consolidated financial statements.
19
EDAC Technologies Corporation
NOTES TO FINANCIAL STATEMENTS
For the years ended January 2, 2010 and January 3, 2009
(in thousands except per share and option amounts)
NOTES TO FINANCIAL STATEMENTS
For the years ended January 2, 2010 and January 3, 2009
(in thousands except per share and option amounts)
NOTE A — ORGANIZATION AND BUSINESS AND SIGNIFICANT ACCOUNTING POLICIES
ORGANIZATION AND BUSINESS
The accompanying consolidated financial statements include EDAC Technologies Corporation (the
“Company”) and its wholly-owned subsidiaries, Gros-Ite Industries, Inc. and Apex Machine Tool
Company, Inc. The Company provides complete design, manufacture and service meeting the precision
requirements of customers for jet engine components, tooling, fixtures, molds and machine spindles.
ACQUISITION
On May 27, 2009, the Company acquired substantially all of the assets and certain liabilities
of MTU Aero Engines North America, Inc.’s Manufacturing Business Unit (“AENA”). This business is
hereinafter referred to as “AERO”. The acquisition was accounted for under the purchase method of
accounting with the assets and liabilities acquired recorded at their fair values at the date of
acquisition. The results of operations of the acquired business have been included in the Company’s
operating results beginning as of the effective date of the acquisition.
The $9,500
purchase price of AERO has been allocated entirely to the working capital
acquired. In accordance with ASC 805.30, “Business Combinations”, the acquisition was determined to
be a “bargain purchase”. The excess value consisting entirely of fixed assets was determined based
on independent appraisals and resulted in a net gain of $11,904, after acquisition related expenses
of $257. Fair values as currently estimated are as follows (in thousands):
Accounts receivable |
$ | 4,274 | ||
Inventories |
8,980 | |||
Prepaid expenses |
169 | |||
Property, plant and equipment |
11,893 | |||
Accounts payable and accrued expenses |
(3,655 | ) | ||
| $ | 21,661 | |||
The Company believes that it has correctly identified all of the assets acquired and liabilities
assumed. The following procedures were used to measure the amounts recognized at the acquisition
date for the assets acquired and liabilities assumed in the acquisition transaction.
| • | Accounts receivable were reviewed and valued based on accounts deemed collectible. | ||
| • | A physical inventory was taken. Raw material was valued at replacement cost. Work-in-process and finished goods were valued at selling price less cost to complete, selling costs and reasonable manufacturer’s profit. | ||
| • | Property, plant and equipment were appraised. | ||
| • | Accounts payable and accrued expenses were valued at current value based on amounts expected to be paid to settle the obligation. |
The Company realized a gain on the acquisition since the seller was willing to sell at less than
the fair value of the net assets sold in consideration for the continued employment of the
workforce. The seller had incurred significant losses in this operation in prior years and
reported that “the sale comes as a result of a review and realignment of our entire production
structure.” The seller was also opening a new facility in Poland.
The unaudited pro forma consolidated financial information for the fiscal years ended January 2,
2010 and January 3, 2009 as though the acquisition had been completed at the beginning of the
respective periods are as follows. The pro forma information excludes the gain on the acquisition.
20
EDAC Technologies Corporation
NOTES TO FINANCIAL STATEMENTS
For the years ended January 2, 2010 and January 3, 2009
(in thousands except per share and option amounts)
NOTES TO FINANCIAL STATEMENTS
For the years ended January 2, 2010 and January 3, 2009
(in thousands except per share and option amounts)
| January 2, 2010 | January 3, 2009 | |||||||
Sales |
$ | 64,512 | $ | 65,108 | ||||
Net income (loss) |
325 | (2,045 | ) | |||||
Basic income (loss) per share |
$ | 0.07 | ($0.43 | ) | ||||
Diluted income (loss) per share |
$ | 0.07 | ($0.43 | ) | ||||
On August 10, 2009, the Company acquired substantially all of the assets of Service Network
Incorporated. This business is hereinafter referred to as “SNI”. The $775 purchase price of SNI has
been allocated as follows: accounts receivable $215, inventory $279, prepaid expenses $9 and
machinery and equipment $272. The acquisition was funded through the Company’s normal working
capital and line of credit with TD Bank.
SIGNIFICANT ACCOUNTING POLICIES
Principles of Consolidation: All significant intercompany transactions and balances have been
eliminated in the consolidated financial statements.
Fiscal Year: The Company’s fiscal year is a 52 or 53-week period ending on the Saturday closest to
December 31. Fiscal year 2009 was a 52-week year that ended on January 2, 2010. Fiscal year 2008
was a 53-week year that ended on January 3, 2009.
Estimates: The preparation of financial statements in conformity with accounting principles
generally accepted in the United States of America requires management to make estimates and
assumptions that affect certain of the amounts and disclosures reflected in the consolidated
financial statements. Actual results could differ from those estimates.
Cash and Cash Equivalents: For the purpose of the statement of cash flows, the Company defines
cash equivalents as highly liquid instruments with an original maturity of three months or less.
The Company had no cash equivalents at January 2, 2010 and January 3, 2009.
Revenue Recognition: Sales are recorded when all criteria for revenue recognition have been
satisfied, which is generally when goods are shipped to the Company’s customers. The Company
defers revenue recognition on certain product shipments until customer acceptance, including
inspection and installation requirements, as defined, are achieved.
Inventories: Inventories are stated at the lower of cost (first-in, first-out method) or market.
Provisions for slow moving and obsolete inventory are provided based on historical experience and
product demand. As of January 2, 2010 and January 3, 2009, inventories consist of the following:
| January 2, 2010 | January 3, 2009 | |||||||
Raw materials |
$ | 2,519 | $ | 1,450 | ||||
Work-in-progress |
15,890 | 5,789 | ||||||
Finished goods |
2,236 | 1,367 | ||||||
| 20,645 | 8,606 | |||||||
Less: reserve for excess and obsolete |
(655 | ) | (644 | ) | ||||
Inventories, net |
$ | 19,990 | $ | 7,962 | ||||
21
EDAC Technologies Corporation
NOTES TO FINANCIAL STATEMENTS
For the years ended January 2, 2010 and January 3, 2009
(in thousands except per share and option amounts)
NOTES TO FINANCIAL STATEMENTS
For the years ended January 2, 2010 and January 3, 2009
(in thousands except per share and option amounts)
Long-Lived Assets: Property, plant and equipment are stated at cost. Provisions for depreciation
and amortization for financial reporting purposes are computed using the straight-line method over
3 to 12 years for machinery and equipment and 25 years for buildings. Depreciation expense was
$2,091 and $1,961 for 2009 and 2008, respectively.
The Company reviews its investments in long-lived assets for impairment whenever events or changes
in circumstances indicate that the carrying amount of an asset may not be recoverable. The Company
recognizes impairment when the carrying amount of the asset exceeds its estimated fair value.
Income Taxes: Deferred tax assets or liabilities are computed based on the difference between the
financial statement and income tax bases of assets and liabilities using the enacted marginal tax
rate. Deferred income tax expenses or benefits are based on the changes in the deferred tax assets
and liabilities from period-to-period.
The Company will only recognize a deferred tax asset when, based upon available evidence,
realization is more likely than not. In making this determination, the Company has considered both
available positive and negative evidence including, but not limited to, cumulative losses in recent
years, future taxable income and prudent and feasible tax planning strategies. At present, the
Company has concluded that it is more likely than not that the Company will realize all of its
deferred tax assets. Valuation allowances related to deferred tax assets can also be impacted by
changes to tax laws, changes to statutory tax rates and future taxable income levels. In the event
the Company were to determine that it would not be able to realize all or a portion of its deferred
tax assets in the future, it would record a valuation allowance through a charge to income in the
period in which that determination is made.
The provisions of the Financial Accounting Standards Board (“FASB”) Accounting Standards
Codification (“ASC”) 740-10 address the determination of whether tax benefits claimed or expected
to be claimed on a tax return should be recorded in the financial statements. Under ASC 740-10,
the Company may recognize the tax benefit from an uncertain tax position only if it is more likely
than not that the tax position will be sustained on examination by taxing authorities, based on the
technical merits of the position. The Company has determined that it has no uncertain tax
positions.
Earnings Per Share: Basic earnings per common share is based on the average number of common
shares outstanding during the year. Diluted earnings per common share assumes, in addition to the
above, a dilutive effect of common share equivalents during the year. Common share equivalents
represent dilutive stock options using the treasury method, which results in the inclusion of
common shares in an amount less than the options exercised. The number of shares used in the
earnings per common share computation for fiscal 2009 and 2008 are as follows:
| 2009 | 2008 | |||||||
Basic: |
||||||||
Weighted average common shares outstanding |
4,833 | 4,724 | ||||||
Diluted: |
||||||||
Dilutive effect of stock options |
112 | 314 | ||||||
Weighted average shares diluted |
4,945 | 5,038 | ||||||
Options excluded since anti—dilutive |
577 | 189 | ||||||
Comprehensive Income (Loss): Comprehensive income (loss), which is reported on the accompanying
consolidated statement of changes in shareholders’ equity and comprehensive income (loss) consists
of net income (loss) and other gains and losses affecting shareholders’ equity that, under
accounting principles generally accepted in the United States of America, are excluded from net
income (loss). For the Company, comprehensive income (loss) consists of gains and losses related
to the Company’s defined benefit pension plan and unrealized losses on established cash flow
hedges.
22
EDAC Technologies Corporation
NOTES TO FINANCIAL STATEMENTS
For the years ended January 2, 2010 and January 3, 2009
(in thousands except per share and option amounts)
NOTES TO FINANCIAL STATEMENTS
For the years ended January 2, 2010 and January 3, 2009
(in thousands except per share and option amounts)
Share Based Compensation: The Company accounts for share-based compensation in accordance with
FASB ASC Topic 718, Compensation — Stock Compensation, which establishes accounting for equity
instruments exchanged for employee services. Under the provisions of FASB ASC Topic 718,
share-based compensation cost is measured at the grant date, based on the calculated fair value of
the award, and is recognized as an expense over the employee’s requisite service period (generally
the vesting period of the equity grant). The Company elected to adopt the modified prospective
transition method of FASB ASC Topic 718 and, accordingly, financial statement amounts for the prior
periods have not been restated to reflect the fair value method of expensing share-based
compensation. Under this application, the Company is required to record compensation cost for all
share-based payments granted after the date of adoption based on the grant date fair value
estimated in accordance with the provisions of FASB ASC Topic 718 and for the unvested portion of
all share-based payments previously granted that remain outstanding which were based on the grant
date fair value estimated in accordance with the original provisions of FASB ASC Topic 718. The
majority of the Company’s share-based compensation arrangements vest over three years. The Company
expenses its share-based compensation under the straight-line method.
Pension: The Company accounts for postemployment benefits in accordance with FASB ASC Topic 715,
Compensation-Retirement Benefits. The Company recognizes the overfunded or underfunded status of
the Company’s defined benefit pension plan. Actuarial gains and losses, prior service costs or
credits, and any remaining transition assets or obligations that have not been recognized under
previous accounting standards are recognized in Accumulated Other Comprehensive Loss, net of tax
effects, until they are amortized as a component of net periodic benefit cost. The Company uses its
fiscal year-end as the measurement date for its pension plan assets and the benefit obligation.
In December 2008, the FASB issued guidance under FASB ASC 715, Compensation-Retirement Benefits,
regarding an employer’s disclosures about plan assets of a defined benefit pension or other
post-retirement plan on investment policies and strategies, major categories of plan assets, inputs
and valuation techniques used to measure the fair value of plan assets and significant
concentrations of risk within plan assets. This guidance is effective for fiscal years ending after
December 15, 2009, with earlier application permitted. Upon initial application, the provisions of
this FSP are not required for earlier periods that are presented for comparative purposes.
Fair Value: On January 1, 2008, the Company adopted FASB ASC 820, which defines fair value,
establishes a framework for measuring fair value, and expands disclosures about fair value
measurements. FASB ASC 820 applies to reported balances that are required or permitted to be
measured at fair value under existing accounting pronouncements; accordingly, the standard does not
require any new fair value measurements of reported balances. The FASB has partially delayed the
effective date for one year for certain fair value measurements when those measurements are used
for financial statement items that are not measured at fair value on a recurring basis.
FASB ASC 820 emphasizes that fair value is a market-based measurement, not an entity-specific
measurement. Therefore, a fair value measurement should be determined based on the assumptions
that market participants would use in pricing the asset or liability. As a basis for considering
market participant assumptions in fair value measurements, FASB ASC 820 establishes a fair value
hierarchy that distinguishes between market participant assumptions based on market data obtained
from sources independent of the reporting entity (observable inputs that are classified within
Levels 1 and 2 of the hierarchy) and the reporting entity’s own assumptions about market
participant assumptions (unobservable inputs classified within Level 3 of the hierarchy).
Level 1 inputs utilize quoted prices (unadjusted) in active markets for identical assets or
liabilities that the Company has the ability to access. Level 2 inputs are inputs other than quoted
prices included in Level 1 that are observable for the asset or liability, either directly or
indirectly. Level 2 inputs may include quoted prices for similar assets and liabilities in active
markets, as well as inputs that are observable for the asset or liability (other than quoted
prices), such as interest rates, foreign exchange rates, and yield curves that are observable at
commonly quoted intervals. Level 3 inputs are unobservable inputs for the asset or liability, which
is typically based on an entity’s own assumptions, as there is little, if any, related market
activity. In instances where the determination of the fair value measurement is based on inputs
from different levels of the fair value hierarchy, the level in the fair value hierarchy within
which the entire fair value measurement falls is based on the lowest level input that is
significant to the fair value measurement in its entirety. The Company’s assessment of the
significance of a
23
EDAC Technologies Corporation
NOTES TO FINANCIAL STATEMENTS
For the years ended January 2, 2010 and January 3, 2009
(in thousands except per share and option amounts)
NOTES TO FINANCIAL STATEMENTS
For the years ended January 2, 2010 and January 3, 2009
(in thousands except per share and option amounts)
particular input to the fair value measurement in its entirety requires judgment,
and considers factors specific to the asset or liability.
In February 2007, the FASB issued FASB ASC Topic 825, The Fair Value Option for Financial Assets
and Financial Liabilities. This statement permits an entity to choose to measure many financial
instruments and certain other items at fair value at specified election dates. Subsequent
unrealized gains and losses on items for which the fair value option has been elected will be
reported in earnings. The Company has adopted FASB ASC Topic 825 and has elected not to measure any
additional financial instruments and other items of fair value.
Business Combinations: The Company accounts for business combinations as required by the
provisions of FASB ASC 805, Business Combinations, which includes provisions that the Company
adopted effective January 1, 2009. The accounting for business combinations retains the underlying
concepts of the previously issued standard in that all business combinations are still required to
be accounted for at fair value under the acquisition method of accounting but changed the method of
applying the acquisition method in a number of significant aspects. Acquisition costs are generally
expensed as incurred; noncontrolling interests will be valued at fair value at the acquisition
date; in-process research and development will be recorded at fair value as an indefinite-lived
intangible asset at the acquisition date; restructuring costs associated with a business
combination are generally expensed subsequent to the acquisition date; and changes in deferred tax
asset valuation allowances and income tax uncertainties after the acquisition date generally will
affect income tax expense. These changes are effective on a prospective basis for all of our
business combinations for which the acquisition date is on or after January 1, 2009, with the
exception of the accounting for valuation allowances on deferred taxes and acquired tax
contingencies. Adjustments for valuation allowances on deferred taxes and acquired tax
contingencies associated with acquisitions that closed prior to January 1, 2009 would also apply
the revised accounting for business combination provisions.
During the measurement period we will recognize additional assets or liabilities if new information
is obtained about facts and circumstances that existed as of the acquisitions date that, if known,
would have resulted in the recognition of those assets and liabilities as of that date. The
measurement period shall not exceed one year from the acquisition date.
In June 2009, the Financial Accounting Standards Board (“FASB”), launched the FASB Accounting
Standards Codification (“ASC”) as the single source of authoritative U.S. GAAP recognized by the
FASB. The ASC reorganizes various U.S. GAAP pronouncements into accounting topics and displays
them using a consistent structure. All existing accounting standards documents are superseded as
described in Statement of Financial Accounting Standard (“SFAS”) No. 168, The FASB Accounting
Standards Codification and the Hierarchy of Generally Accepted Accounting Principles. All of the
contents of the ASC carry the same level of authority, effectively superseding SFAS No. 162, The
Hierarchy of Generally Accepted Accounting Principles, which identified and ranked the sources of
accounting principles and the framework for selecting the principles used in preparing financial
statements in conformity with U.S. GAAP. Also included in the ASC are rules and interpretive
releases of the SEC, under authority of federal securities laws that are also sources of
authoritative U.S. GAAP for SEC registrants. The adoption of the ASC
as of July 1, 2009 had no impact
on our consolidated financial statements other than changing the way specific accounting standards
are referenced in the Company’s financial statements.
In May 2009, the FASB issued guidance now codified as FASB ASC Topic 855, Subsequent Events (“FASB
ASC 855”), which defines and establishes the period after the balance sheet date during which
management of a reporting entity evaluates transactions and events for potential disclosure in the
financial statements in addition to disclosing the date through which such events have been
evaluated. The guidance is effective for financial statements issued for fiscal years and interim
periods ending after June 15, 2009 and is to be applied prospectively. The adoption of FASB ASC 855
did not have a material impact on the Company’s consolidated financial position, results of
operations or cash flows. In accordance with FASB ASC 855, the Company has evaluated subsequent
events through March 4, 2010, which is the date on which these financial statements were issued.
Accounting Pronouncements Not Yet Adopted: In June 2009, the FASB issued guidance under FASB ASC
860-20, Sales of Financial Assets, The guidance removes the concept of a qualifying
special-purpose entity and establishes a new “participating interest” definition that must be met
for transfers of portions of financial assets to
be eligible for sale accounting, clarifies and amends the derecognition criteria for a transfer to
be accounted for as
24
EDAC Technologies Corporation
NOTES TO FINANCIAL STATEMENTS
For the years ended January 2, 2010 and January 3, 2009
(in thousands except per share and option amounts)
NOTES TO FINANCIAL STATEMENTS
For the years ended January 2, 2010 and January 3, 2009
(in thousands except per share and option amounts)
a sale, and changes the amount that can be recognized as a gain or loss on a
transfer accounted for as a sale when beneficial interests are received by the transferor. Enhanced
disclosures are also required to provide information about transfers of financial assets and a
transferor’s continuing involvement with transferred financial assets. This statement must be
applied as of the beginning of an entity’s first annual reporting period that begins after November
15, 2009, for interim periods within that first annual reporting period, and for interim and annual
reporting periods thereafter. Earlier application is prohibited. The Company is currently
evaluating this new guidance.
In June 2009, the FASB issued guidance under FASB ASC 810, Consolidation of Variable Interest
Entities. The guidance amends previous accounting related to the Consolidation of Variable
Interest Entities to require an enterprise to qualitatively assess the determination of the primary
beneficiary of a variable interest entity (VIE) based on whether the entity (1) has the power to
direct the activities of a VIE that most significantly impact the entity’s economic performance and
(2) has the obligation to absorb losses of the entity or the right to receive benefits from the
entity that could potentially be significant to the VIE. Also, SFAS 167 requires an ongoing
reconsideration of the primary beneficiary, and amends the events that trigger a reassessment of
whether an entity is a VIE. Enhanced disclosures are also required to provide information about an
enterprise’s involvement in a VIE. This statement will be effective as of the beginning of each
reporting entity’s first annual reporting period that begins after November 15, 2009, for interim
periods within that first annual reporting period, and for interim and annual reporting periods
thereafter. Earlier application is prohibited. The Company is currently evaluating this new
guidance.
In October 2009, the FASB issued ASU No. 2009-13, “Multiple-Deliverable Revenue Arrangements.” This
ASU establishes the accounting and reporting guidance for arrangements including multiple
revenue-generating activities. This ASU provides amendments to the criteria for separating
deliverables, measuring and allocating arrangement consideration to one or more units of
accounting. The amendments in this ASU also establish a selling price hierarchy for determining the
selling price of a deliverable. Significantly enhanced disclosures are also required to provide
information about a vendor’s multiple-deliverable revenue arrangements, including information about
the nature and terms, significant deliverables, and its performance within arrangements. The
amendments also require providing information about the significant judgments made and changes to
those judgments and about how the application of the relative selling-price method affects the
timing or amount of revenue recognition. The amendments in this ASU are effective prospectively for
revenue arrangements entered into or materially modified in the fiscal years beginning on or after
June 15, 2010. Early application is permitted. The Company is currently evaluating this new ASU.
No other recently issued, but not yet adopted accounting pronouncements are expected to have a
material impact on the Company.
NOTE B — FINANCIAL INSTRUMENTS
Concentrations of Credit Risk
The Company’s financial instruments that are subject to concentrations of credit risk consist of
cash and accounts receivable.
The Company places its cash deposits with a high credit quality financial institution. Bank
deposits may at times be in excess of the federal depository insurance limit.
Sales to United Technologies Corporation for 2009 and 2008 amounted to 41% and 40%, respectively,
of the Company’s sales. The Company’s international sales for 2009 and 2008, amounted to 13%, and
5%, respectively, of the Company’s sales. At January 2, 2010, the Company had $4,673 of its
accounts receivable or 44% due from United Technologies Corporation. The Company reviews a
customer’s credit history before extending credit and typically does not require collateral. The
Company establishes an allowance for doubtful accounts based upon factors surrounding the credit
risk of specific customers, historical trends and other information. Such losses have been within
management’s expectations.
25
EDAC Technologies Corporation
NOTES TO FINANCIAL STATEMENTS
For the years ended January 2, 2010 and January 3, 2009
(in thousands except per share and option amounts)
NOTES TO FINANCIAL STATEMENTS
For the years ended January 2, 2010 and January 3, 2009
(in thousands except per share and option amounts)
Fair Value of Financial Instruments
FASB ASC Topic 825, The Fair Value Option for Financial Assets and Financial Liabilities, requires
disclosure of the fair value of financial instruments for which the determination of fair value is
practicable. The fair value of a financial instrument is defined as the amount at which the
instrument could be exchanged in a current transaction between willing parties.
The carrying amount of the Company’s financial instruments approximates their fair value as
outlined below.
Cash, accounts receivable and accounts payable: The carrying amounts approximate their fair value
because of the short maturity of those instruments.
Notes payable and long-term debt: The carrying amounts approximate their fair value as the
interest rates on the debt approximates the Company’s current incremental borrowing rate.
The Company’s financial instruments are held for other than trading purposes.
NOTE C — COMMON STOCK AND STOCK OPTIONS
The following table presents share-based compensation expense for continuing operations and
the effects on earnings per share included in the Company’s consolidated statements of income:
| Fiscal | Fiscal | |||||||
| Year Ended | Year Ended | |||||||
| January 2, 2010 | January 3, 2009 | |||||||
Selling, general and administrative: |
||||||||
Share-based compensation expense before tax |
$ | 260 | $ | 221 | ||||
Income tax benefit |
98 | 83 | ||||||
Net share-based compensation expense |
$ | 162 | $ | 138 | ||||
The Company estimates the fair value of stock options using the Black-Scholes valuation model.
Key input assumptions used to estimate the fair value of stock options include the expected option
term, the expected volatility of the Company’s stock over the option’s expected term, the risk-free
interest rate over the option’s expected term, and the Company’s expected annual dividend yield.
The Company believes that the valuation technique and the approach utilized to develop the
underlying assumptions are appropriate in calculating the fair values of the Company’s stock
options granted during the fiscal years ended January 2, 2010 and January 3, 2009. Estimates of
fair value are not intended to predict actual future events or the value ultimately realized by
persons who receive equity awards.
The fair value of each option grant was estimated on the grant date using the Black-Scholes
option-pricing model with the following assumptions:
| Fiscal | Fiscal | |||||||
| Year Ended | Year Ended | |||||||
| January 2, 2010 | January 3, 2009 | |||||||
Expected option term (1) |
3.5 years | 3.5 years | ||||||
Expected volatility factor (2) |
69.2 | % | 62.8 | % | ||||
Risk-free interest rate (3) |
0.06 | % | 0.06 | % | ||||
Expected annual dividend yield |
0 | % | 0 | % | ||||
26
EDAC Technologies Corporation
NOTES TO FINANCIAL STATEMENTS
For the years ended January 2, 2010 and January 3, 2009
(in thousands except per share and option amounts)
NOTES TO FINANCIAL STATEMENTS
For the years ended January 2, 2010 and January 3, 2009
(in thousands except per share and option amounts)
| (1) | The option term was determined using the simplified method for estimating expected option life, which qualify as “plain-vanilla” options. | |
| (2) | The stock volatility for each grant is measured using the weighted average of historical monthly price changes of the Company’s common stock over the most recent period equal to the expected option life of the grant, adjusted for activity which is not expected to occur in the future. | |
| (3) | The risk-free interest rate for periods equal to the expected term of the share option is based on the U.S. Treasury yield curve in effect at the time of grant. |
Stock Incentive Plans
The Company has issued stock options from the 2000 Employee Stock Option Plan, the 2000-B Employee
Stock Option Plan and the 2008 Equity Incentive Plan. The terms of the options and vesting
requirements shall be for such period as the Compensation Committee designates. The option price is
not less than the fair market value of the shares on the date of the grant.
As of January 2, 2010, 79,266 shares were reserved for future issuance for stock options including
10,500 shares for the 2000 Employee Stock Option Plan, 10,766 shares for the 2000-B Employee Stock
Option Plan and 58,000 for the 2008 Equity Incentive Plan.
A summary of the status of the Company’s stock option plans as of January 2, 2010 and January 3,
2009, and changes during the years then ended is presented below:
| January 2, 2010 | January 3, 2009 | |||||||||||||||
| Weighted- | Weighted- | |||||||||||||||
| Average | Average | |||||||||||||||
| Exercise | Exercise | |||||||||||||||
| Options | Price | Options | Price | |||||||||||||
Outstanding at beginning of year |
540,834 | $ | 4.69 | 604,834 | $ | 2.28 | ||||||||||
Granted |
372,000 | 3.59 | 135,000 | 2.18 | ||||||||||||
Exercised |
(15,500 | ) | 1.34 | (189,000 | ) | 0.78 | ||||||||||
Expired/Forfeited |
(23,000 | ) | 4.11 | (10,000 | ) | 5.50 | ||||||||||
Outstanding at end of year |
874,334 | $ | 4.28 | 540,834 | $ | 4.67 | ||||||||||
Options exercisable at year-end |
382,833 | $ | 4.75 | 292,003 | $ | 4.43 | ||||||||||
Weighted-average fair
value of options granted
during the year |
$ | 1.70 | $ | 0.91 | ||||||||||||
The following Table summarizes information about stock options outstanding at January 2, 2010:
| Options Outstanding | Options Exercisable | |||||||||||||||||||
| Weighted- | Weighted- | Number | Weighted- | |||||||||||||||||
| Number | Remaining | Average | Exercisable | Average | ||||||||||||||||
| Exercise Price | At | Contractual Life | Exercise | At | Exercise | |||||||||||||||
| Range | 1/2/2010 | (in years) | Price | 1/2/2010 | Price | |||||||||||||||
$0.51 to $1.00 |
30,000 | 0.90 | $ | 0.92 | 30,000 | $ | 0.92 | |||||||||||||
$1.01 to $2.00 |
80,000 | 2.14 | 1.38 | 80,000 | 1.38 | |||||||||||||||
$2.01 to $5.50 |
580,834 | 4.92 | 3.28 | 135,501 | 3.00 | |||||||||||||||
$5.51 to $9.28 |
183,500 | 2.93 | 9.28 | 137,332 | 9.28 | |||||||||||||||
$0.51 to $9.28 |
874,334 | 4.11 | $ | 4.28 | 382,833 | $ | 4.75 | |||||||||||||
27
EDAC Technologies Corporation
NOTES TO FINANCIAL STATEMENTS
For the years ended January 2, 2010 and January 3, 2009
(in thousands except per share and option amounts)
NOTES TO FINANCIAL STATEMENTS
For the years ended January 2, 2010 and January 3, 2009
(in thousands except per share and option amounts)
The aggregate intrinsic value of outstanding options as of January 2, 2010 was $333.
The intrinsic value of options exercised during the fiscal year ended January 2, 2010 was
$30. The intrinsic value of options vested during the fiscal year ended January 2, 2010 was
$42.
The following table summarizes the status of the Company’s non-vested options since December 29,
2007:
| Non-Vested Options | ||||||||
| Weighted | ||||||||
| Number of | Average | |||||||
| Options | Fair Value | |||||||
Non-vested at December 29, 2007 |
209,833 | $ | 2.88 | |||||
Granted |
135,000 | 0.91 | ||||||
Vested |
(96,002 | ) | 2.56 | |||||
Non-vested at January 3, 2009 |
248,831 | 1.92 | ||||||
Granted |
372,000 | 1.70 | ||||||
Vested |
(115,004 | ) | 1.75 | |||||
Forfeited |
(14,333 | ) | 2.56 | |||||
Non-vested at January 2, 2010 |
491,494 | $ | 1.75 | |||||
As of January 2, 2010, there was $833 of total unrecognized compensation cost related to
nonvested share-based compensation arrangements granted under the Company’s stock plans. That cost
is expected to be recognized over a weighted-average period of 2.5 years.
Cash received from option exercises under all share based payment arrangements for the fiscal years
ended January 2, 2010 and January 3, 2009 was $21 and $161, respectively. The actual tax benefit
realized for the tax deductions from option exercises of the share-based payment arrangements was
$10 and $316 for the fiscal years ended January 2, 2010 and January 3, 2009, respectively.
NOTE D — NOTES PAYABLE AND LONG-TERM DEBT
Long-term debt and lines of credit consist of the following:
| Jan 2, 2010 | Jan 3, 2009 | |||||||
Lines of credit |
$ | 1,591 | $ | 1,675 | ||||
Term notes |
8,420 | 3,915 | ||||||
Mortgage loans |
5,475 | 3,011 | ||||||
Capital lease obligations |
92 | 278 | ||||||
| 15,578 | 8,879 | |||||||
Less — equipment line of credit |
1,391 | 1,675 | ||||||
Less — revolving line of credit |
200 | — | ||||||
Less — current portion of long-term debt |
1,833 | 2,376 | ||||||
| $ | 12,154 | $ | 4,828 | |||||
The Company’s credit facility with TD Bank, N.A. includes a revolving line of credit, which
provides for borrowings up to $5,000 and an equipment line of credit, which provides for borrowings
up to $4,700. The revolving line of credit is limited to an amount determined by a formula based
on percentages of receivables and inventory and bears interest at a variable rate equal to the
highest Prime Rate as published in the Wall Street Journal, adjusted daily (3.25% at January 2,
2010). The revolving line of credit is payable on demand and is reviewed annually as of July 31
with renewal at the bank’s discretion. The equipment line of credit provides advances to purchase
eligible
28
EDAC Technologies Corporation
NOTES TO FINANCIAL STATEMENTS
For the years ended January 2, 2010 and January 3, 2009
(in thousands except per share and option amounts)
NOTES TO FINANCIAL STATEMENTS
For the years ended January 2, 2010 and January 3, 2009
(in thousands except per share and option amounts)
equipment and bears interest at a variable rate equal to the highest Prime Rate as published
in the Wall Street Journal, adjusted daily. Amounts advanced on the equipment line of credit will
convert to a term note on July 31, 2010, unless converted earlier at the option of the Company,
with monthly payments of principal and interest in an amount to amortize the then existing
principal balance in 60 equal monthly payments including interest at the then FHLBB 5 year Regular
Amortizing Advance Rate plus 3%. The credit facility gives TD Bank, N.A. a first security interest
in accounts receivable, inventory, equipment and other assets and requires approval from TD Bank,
N.A. prior to paying cash dividends. As of January 2, 2010, there was $4,800 and $3,309 available
for borrowing on the revolving line of credit and on the equipment line of credit, respectively,
and the Company was in compliance with its debt covenants.
The Company’s acquisition of AERO in May 2009 was funded by a five year term note in the amount of
$4,360 and a ten year mortgage on the AERO real estate in the amount of $2,640, both with TD Bank,
N.A. The Company fixed the interest rates on the note and mortgage at 5.8% and 6.1%, respectively,
through interest rate swap arrangements with TD Bank, N.A. In addition, the Company issued a
$2,500 secured promissory note to AENA, the principal amount of which is due on May 27, 2011, with
interest payable quarterly at the annual rate of 5.0%. As of January 2, 2010, the amounts
outstanding on the five-year term note, the mortgage and the secured promissory note were $4,058,
$2,604 and $2,500, respectively.
In addition, the Company has two mortgages secured by the Company’s real estate. One is due in
monthly installments of $16, including interest at 7.5% through February 2021. The payment will be
adjusted by the bank on March 1, 2011 and every 5 years thereafter to reflect interest at the Five
Year Federal Home Loan Bank “Classic Credit Rate” plus 2.75%. The second is due in monthly
installments of $12 including interest at 6.49% with a balloon payment due on April 1, 2014. The
monthly payment will be adjusted by the bank on April 1, 2009, to reflect interest at the Five Year
FHLBB Amortizing Advance Rate plus 2.75%. As of January 2, 2010, the amounts outstanding on the
mortgages were $1,494 and $1,377, respectively.
The Company has five term notes with TD Bank, N.A. that were used to finance the purchase of
machinery and equipment with interest rates ranging between 6.9% and 7.47% and maturity dates
ranging between December 2010 and July 2012. As of January 2, 2010, the outstanding balance of the
five notes totaled $1,862.
The following table sets forth leased property under capital leases.
| Class of Property | 2009 | 2008 | ||||||
Machinery & equipment |
$ | 983 | $ | 983 | ||||
Less: accumulated amortization |
461 | 363 | ||||||
| $ | 522 | $ | 620 | |||||
Amortization expense related to leased property under capital leases is included in
depreciation expense disclosed in Note A.
Aggregate annual maturities of long-term debt for the five year period subsequent to January 2,
2010, are as follows: 2010—$1,833; 2011—$3,956; 2012—$1,053; 2013—$900; 2014—$2,005; 2015 and
thereafter—$4,240.
NOTE E — INTEREST RATE SWAPS
Simultaneous with the AERO acquisition, the Company entered into two pay-fixed,
receive-variable interest rate swaps to reduce exposure to changes in cash payments caused by
changes in interest rates on certain senior long-term notes payable that were also entered into on
the date of the AERO acquisition. Both relationships are designated as cash flow hedges and meet
the criteria for the shortcut method for assessing hedge effectiveness; therefore, the hedge is
assumed to be 100% effective and all changes in the fair value of the interest rate swaps are
recorded in consolidated accumulated other comprehensive loss. These changes in fair value must be
reclassified in whole or in part from consolidated accumulated other comprehensive loss into
earnings if, and when,
a comparison of the swaps and the related hedged cash flows demonstrates that the shortcut method
is no
29
EDAC Technologies Corporation
NOTES TO FINANCIAL STATEMENTS
For the years ended January 2, 2010 and January 3, 2009
(in thousands except per share and option amounts)
NOTES TO FINANCIAL STATEMENTS
For the years ended January 2, 2010 and January 3, 2009
(in thousands except per share and option amounts)
longer applicable. The Company expects these hedges to meet the criteria of the shortcut
method for the duration of the hedging relationship and therefore, it does not expect to reclassify
any portion of any unrealized loss from consolidated accumulated other comprehensive loss to
earnings in the future. Under FASB ASC 820, the Company has determined that the inputs associated
with the fair value determination are readily observable at commonly quoted intervals and as a
result the interest rate swaps were classified within Level 2 of the fair value hierarchy.
NOTE F — PENSION PLANS
The Company maintains a noncontributory defined benefit pension plan covering substantially
all employees that met certain minimum age and service requirements prior to April 1, 1993. The
benefits are generally based on years of service and compensation during the last five years of
employment prior to April 1, 1993. The Company’s policy is to contribute annually the amount
necessary to satisfy the requirements of the Employee Retirement Income Security Act of 1974. In
March 1993, the Board of Directors approved a curtailment to the plan which resulted in the
freezing of all future benefits under the plan as of April 1, 1993.
The Company uses its fiscal year-end as the measurement date for its pension plan assets and
benefit obligation.
The following tables set forth the changes in benefit obligations and plan assets, and reconciles
amounts recognized in the Company’s consolidated balance sheets:
| 2009 | 2008 | |||||||
Change in Benefit Obligation: |
||||||||
Benefit obligation at beginning of year |
$ | 5,457 | $ | 5,656 | ||||
Interest cost |
328 | 353 | ||||||
Actuarial gain (loss) |
399 | (105 | ) | |||||
Benefits paid |
(441 | ) | (447 | ) | ||||
Benefit obligation at end of year |
$ | 5,743 | $ | 5,457 | ||||
Change in Plan Assets: |
||||||||
Fair value of plan assets at beginning of year |
$ | 3,759 | $ | 6,085 | ||||
Actual return (loss) on plan assets |
962 | (1,877 | ) | |||||
Employer contribution |
— | 50 | ||||||
Expenses |
(25 | ) | (52 | ) | ||||
Benefits paid |
(441 | ) | (447 | ) | ||||
Fair value of plan assets at end of year |
$ | 4,255 | $ | 3,759 | ||||
Unfunded status |
$ | (1,488 | ) | $ | (1,698 | ) | ||
Amounts recognized in the consolidated
balance sheets consist of: |
||||||||
Accrued expense — current |
$ | (40 | ) | $ | — | |||
Other liabilities — long term |
(1,448 | ) | (1,698 | ) | ||||
| $ | (1,488 | ) | $ | (1,698 | ) | |||
Amounts recognized in accumulated other comprehensive
income consist of: |
||||||||
Net loss |
$ | (2,590 | ) | $ | (3,010 | ) | ||
30
EDAC Technologies Corporation
NOTES TO FINANCIAL STATEMENTS
For the years ended January 2, 2010 and January 3, 2009
(in thousands except per share and option amounts)
NOTES TO FINANCIAL STATEMENTS
For the years ended January 2, 2010 and January 3, 2009
(in thousands except per share and option amounts)
| 2009 | 2008 | |||||||
Information for pension plans with an accumulated benefit
obligation in excess of plan assets: |
||||||||
Projected benefit obligation |
$ | 5,743 | $ | 5,457 | ||||
Accumulated benefit obligation |
5,743 | 5,457 | ||||||
Fair value of plan assets |
4,255 | 3,759 | ||||||
Components of Net Periodic Benefit Cost: |
||||||||
Interest cost |
$ | 328 | $ | 353 | ||||
Service cost |
22 | 22 | ||||||
Expected return on plan assets |
(248 | ) | (413 | ) | ||||
Amortization of net loss |
109 | 17 | ||||||
Net periodic benefit cost (income) |
$ | 211 | $ | (21 | ) | |||
Other Changes in Plan Assets and Benefit
Obligations Recognized in Other Comprehensive
Income: |
||||||||
Current year net (loss) gain |
$ | (312 | ) | $ | 2,215 | |||
Amortization of net (loss) gain |
(109 | ) | (17 | ) | ||||
Total recognized in other comprehensive income |
$ | (421 | ) | $ | 2,198 | |||
Total recognized in net periodic benefit cost and other
comprehensive income |
$ | (210 | ) | $ | 2,177 | |||
The estimated amount of net loss that will be amortized from accumulated other comprehensive
loss into net periodic benefit cost in 2010 is $100.
| 2009 | 2008 | |||||||
Assumptions: |
||||||||
Weighted-average assumptions used to determine benefit
obligation as of year-end: |
||||||||
Discount rate |
5.75 | % | 6.25 | % | ||||
Rate of compensation increase |
n/a | n/a | ||||||
Weighted-average assumptions used to determine net
benefit cost: |
||||||||
Discount rate |
6.25 | % | 6.25 | % | ||||
Rate of compensation increase |
n/a | n/a | ||||||
Expected return on plan assets |
7.00 | % | 7.00 | % | ||||
The expected long-term rate of return on assets assumption is 7%. This assumption represents
the rate of return on plan assets reflecting the average rate of earnings expected on the funds
invested or to be invested to provide for the benefits included in the benefit obligation. The
assumption has been determined by reflecting expectations regarding future rates of return for the
investment portfolio, with consideration given to the distribution of investments by asset class
and historic rates of return for each individual asset class.
Asset management objectives include maintaining an adequate level of diversification to reduce
interest rate and market risk while also providing adequate liquidity to meet benefit payment
requirements.
31
EDAC Technologies Corporation
NOTES TO FINANCIAL STATEMENTS
For the years ended January 2, 2010 and January 3, 2009
(in thousands except per share and option amounts)
NOTES TO FINANCIAL STATEMENTS
For the years ended January 2, 2010 and January 3, 2009
(in thousands except per share and option amounts)
Plan Assets
| Target | ||||||||||||
| Fair Value | Allocation | |||||||||||
| Asset Category | January 2, 2010 | 2009 | 2008 | |||||||||
Equity securities |
$ | 3,422 | 80 | % | 80 | % | ||||||
Debt securities |
676 | 16 | 16 | |||||||||
Real estate equity fund |
90 | 3 | 3 | |||||||||
Cash |
67 | 1 | 1 | |||||||||
Total |
$ | 4,255 | 100 | % | 100 | % | ||||||
Under the
fair value hierarchy of FASB ASC 820, the Company has classified the Plan’s assets as Level
1, since the inputs associated with the fair value determination
utilize quoted prices in active markets for identical assets.
Cash Flows
Contributions
The expected employer contribution for 2010 is $40.
Estimated
Future Benefit Payments
The
following benefit payments are expected to be paid:
2010 |
$ | 449 | ||
2011 |
448 | |||
2012 |
444 | |||
2013 |
434 | |||
2014 |
424 | |||
Years 2015 —2019 |
2,098 |
The Company maintains a defined contribution plan known as the EDAC Technologies Corporation
401(k) Retirement Plan. All employees who have completed at least three consecutive months of
service and are age eighteen or older are eligible to participate. For 2009 and 2008, the Company
did not provide matching contributions.
NOTE G — INCOME TAXES
| 2009 | 2008 | |||||||
Current provision |
$ | 224 | $ | 432 | ||||
Deferred |
4,338 | 251 | ||||||
Total provision for income taxes |
$ | 4,562 | $ | 683 | ||||
The following table reconciles the expected federal tax provision applied to pre-tax income based
on the federal statutory tax rate of 34% to the actual tax provision:
32
EDAC Technologies Corporation
NOTES TO FINANCIAL STATEMENTS
For the years ended January 2, 2010 and January 3, 2009
(in thousands except per share and option amounts)
NOTES TO FINANCIAL STATEMENTS
For the years ended January 2, 2010 and January 3, 2009
(in thousands except per share and option amounts)
| 2009 | 2008 | |||||||
Income before income taxes |
$ | 12,188 | $ | 1,822 | ||||
Income tax provision at Federal statutory rate |
$ | 4,144 | $ | 619 | ||||
State income taxes, net of Federal benefit |
432 | 82 | ||||||
Other |
(14 | ) | (18 | ) | ||||
Total income tax provision |
$ | 4,562 | $ | 683 | ||||
The tax effect of temporary differences giving rise to the Company’s deferred tax assets and
liabilities are as follows:
| 2009 | 2008 | |||||||
Deferred tax assets: |
||||||||
Allowance for uncollectible
accounts receivable |
$ | 90 | $ | 72 | ||||
Employee compensation and amounts withheld |
360 | 272 | ||||||
Accrued expenses |
249 | 225 | ||||||
Unicap and inventory reserves |
269 | 304 | ||||||
State tax credits |
67 | 109 | ||||||
Interest rate swap (in equity) |
40 | — | ||||||
Pension liability (in equity) |
1,004 | 1,173 | ||||||
Goodwill |
965 | 1,330 | ||||||
| $ | 3,044 | $ | 3,485 | |||||
Deferred tax liabilities: |
||||||||
Property, plant and equipment |
$ | 6,010 | $ | 1,891 | ||||
Pension |
411 | 505 | ||||||
| 6,421 | 2,396 | |||||||
Net deferred tax asset (liability) |
$ | (3,377 | ) | $ | 1,089 | |||
Reflected in consolidated balance sheets as: |
||||||||
Net current deferred tax asset |
$ | 1,098 | $ | 983 | ||||
Net long-term deferred tax asset |
— | 106 | ||||||
Net long-term deferred tax liability |
(4,475 | ) | — | |||||
| $ | (3,377 | ) | $ | 1,089 | ||||
The change in the net deferred tax asset is
consolidated financial statements as: |
||||||||
Deferred provision allocated to income |
$ | 4,338 | $ | 251 | ||||
Deferred provision allocated to equity |
128 | (856 | ) | |||||
| $ | 4,466 | $ | (605 | ) | ||||
The Company will only recognize a deferred tax asset when, based upon available evidence,
realization is more likely than not.
33
EDAC Technologies Corporation
NOTES TO FINANCIAL STATEMENTS
For the years ended January 2, 2010 and January 3, 2009
(in thousands except per share and option amounts)
NOTES TO FINANCIAL STATEMENTS
For the years ended January 2, 2010 and January 3, 2009
(in thousands except per share and option amounts)
Under FASB ASC 740-10, the Company may recognize the tax benefit from an uncertain tax position
only if it is more likely than not that the tax position will be sustained on examination by taxing
authorities, based on the technical merits of the position. The Company has determined that it has
no uncertain tax positions.
On January 21, 2010, the Internal Revenue Service completed its examination of the Company’s 2007
and 2008 tax returns, increasing the Company’s net tax by $9. The Company’s subsequent years’
returns are subject to examination by federal taxing authorities. In addition, net operating
losses originating in 2003 that were utilized in 2006 are also open to IRS examination.
The statute of limitations for Connecticut tax returns is closed for all tax years prior to 2001.
This is due to utilization of credit carryforwards and net operating loss carryfowards.
The Company’s policy is to recognize interest and penalties accrued on any unrecognized tax
benefits as a component of income tax expense. As of the date of adoption of the provisions of
FASB ASC 740, Income Taxes, as it relates to the accounting for uncertainty in income taxes, there
was no accrued interest or penalties associated with any recognized tax benefits, nor was any
interest expense recognized during the year.
The Company also has approximately $175 of state tax credit carryforwards relating to property
taxes paid on electronic data processing equipment, training expenses, and capital investments
available for use on the 2009 tax return. The Company expects the carryforward to 2010 to be
approximately $101. The state credits have a short carryforward period and will expire if they are
not utilized over the next five years.
NOTE H — COMMITMENTS AND CONTINGENCIES
Lease expense under operating leases was $171 and $22 for 2009 and 2008, respectively.
Minimum rental commitments as of January 2, 2010 for noncancelable operating leases with an initial
or remaining term of one year or more are as follows: 2010—$312; 2011—$281; 2012—$247;
2013—$232; 2014 and thereafter—$619.
NOTE I — SEGMENT INFORMATION
Operating segments are defined as components of an enterprise about which financial
information is available that is evaluated regularly by the Company’s President in deciding how to
allocate resources and in assessing performance. The Company has determined that it operates as
one segment.
NOTE J — QUARTERLY DATA (Unaudited)
Following is selected quarterly data for 2009 and 2008. All quarterly information was
obtained from unaudited consolidated financial statements not otherwise contained herein. The
unaudited results for any quarter are not
necessarily indicative of the results for any future period.
34
EDAC Technologies Corporation
NOTES TO FINANCIAL STATEMENTS
For the years ended January 2, 2010 and January 3, 2009
(in thousands except per share and option amounts)
NOTES TO FINANCIAL STATEMENTS
For the years ended January 2, 2010 and January 3, 2009
(in thousands except per share and option amounts)
| 2009 | 1st quarter | 2nd quarter | 3rd quarter | 4th quarter | ||||||||||||
Sales |
$ | 9,584 | $ | 13,629 | $ | 15,132 | $ | 16,298 | ||||||||
Gross profit |
1,080 | 1,696 | 1,762 | 1,389 | ||||||||||||
Income (loss) from operations |
219 | 515 | 456 | (114 | ) | |||||||||||
Net income |
56 | 7,376 | 80 | 113 | ||||||||||||
Basic income per common share |
$ | 0.01 | $ | 1.53 | $ | 0.02 | $ | 0.02 | ||||||||
Diluted income per common share |
$ | 0.01 | $ | 1.50 | $ | 0.02 | $ | 0.02 | ||||||||
| 2008 | 1st quarter | 2nd quarter | 3rd quarter | 4th quarter | ||||||||||||
Sales |
$ | 11,181 | $ | 10,849 | $ | 10,547 | $ | 12,099 | ||||||||
Gross profit |
2,086 | 1,830 | 1,385 | 570 | ||||||||||||
Income (loss) from operations |
1,117 | 966 | 542 | (245 | ) | |||||||||||
Net income (loss) |
630 | 533 | 255 | (279 | ) | |||||||||||
Basic income (loss) per common share |
$ | 0.14 | $ | 0.11 | $ | 0.05 | ($0.06 | ) | ||||||||
Diluted income (loss) per common share |
$ | 0.13 | $ | 0.11 | $ | 0.05 | ($0.06 | ) | ||||||||
35
OFFICERS
Dominick A. Pagano
|
President and Chief Executive Officer | |
Glenn L. Purple
|
Vice President-Finance, Chief Financial Officer and Secretary | |
BOARD OF DIRECTORS |
||
Daniel C. Tracy
|
Chairman | |
Dominick A. Pagano
|
President and Chief Executive Officer | |
Lee K. Barba
|
Former Chairman and CEO of thinkorswim Group Inc. | |
Joseph Lebel
|
Private Investor | |
Stephen J. Raffay
|
Retired Vice-Chairman, Emhart Corporation | |
John A. Rolls
|
Managing Partner, Core Capital Partners LLP | |
Ross C. Towne
|
Owner, Management Partners, Inc. |
CORPORATE OFFICES
1806 New Britain Avenue
Farmington, CT 06032
Farmington, CT 06032
GENERAL COUNSEL
Robinson & Cole LLP
280 Trumbull Street
Hartford, CT 06103-3597
280 Trumbull Street
Hartford, CT 06103-3597
INDEPENDENT AUDITORS
|
TRANSFER AGENT | |
CCR LLP
|
American Stock Transfer & Trust Company | |
124 Hebron Avenue
|
59 Maiden Lane | |
Glastonbury, CT 06033
|
New York, NY 10038 |
ANNUAL MEETING
The 2010 annual meeting of shareholders will be held on the date and at the time and place
indicated in the Notice of Annual Meeting and Proxy Statement accompanying this report.
10-K INFORMATION
A copy of EDAC’s 2009 Annual Report on Form 10-K filed with the Securities and Exchange Commission
is available without charge by writing to: Glenn L. Purple, Secretary, EDAC Technologies
Corporation, 1806 New Britain Avenue, Farmington, CT 06032.
36