Attached files
| file | filename |
|---|---|
| 8-K - 8-K - Allegiant Travel CO | a10-5305_18k.htm |
Exhibit 99.1
|
|
Management Presentation March 2010 |
|
|
Notice on Forward Looking Statements This presentation as well as oral statements made by officers or directors of Allegiant Travel Company, its advisors and affiliates (collectively or separately, the "Company") will contain forward-looking statements that are only predictions and involve risks and uncertainties. Forward-looking statements may include, among others, references to future performance, future growth and any comments about our strategic plans. There are many risk factors that could prevent us from achieving our goals and cause the underlying assumptions of these forward-looking statements, and our actual results, to differ materially from those expressed in, or implied by, our forward-looking statements. These risk factors and others are more fully discussed in our filings with the Securities and Exchange Commission. Any forward-looking statements are based on information available to us today and we undertake no obligation to update publicly any forward-looking statements, whether as a result of future events, new information or otherwise. The Company cautions users of this presentation not to place undue reliance on forward looking statements, which may be based on assumptions and anticipated events that do not materialize. |
|
|
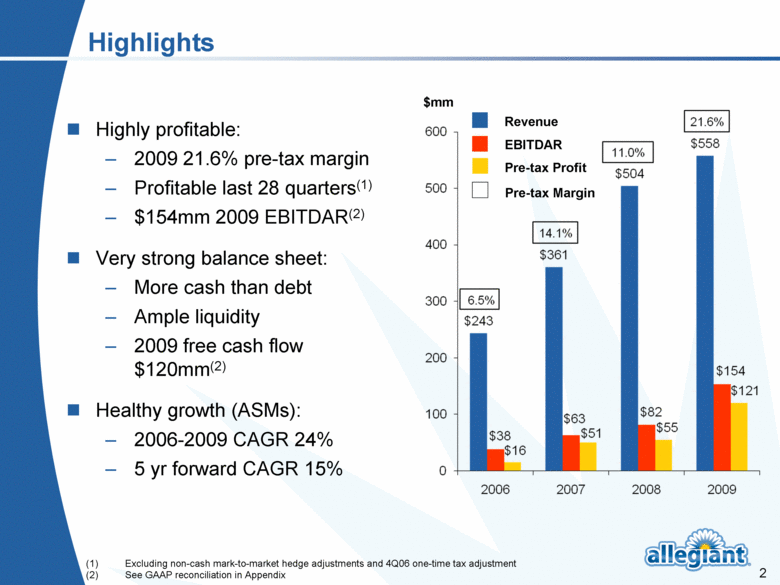
Highlights $mm Highly profitable: 2009 21.6% pre-tax margin Profitable last 28 quarters(1) $154mm 2009 EBITDAR(2) Very strong balance sheet: More cash than debt Ample liquidity 2009 free cash flow $120mm(2) Healthy growth (ASMs): 2006-2009 CAGR 24% 5 yr forward CAGR 15% Revenue Pre-tax Profit Pre-tax Margin (1) Excluding non-cash mark-to-market hedge adjustments and 4Q06 one-time tax adjustment (2) See GAAP reconciliation in Appendix EBITDAR |
|
|
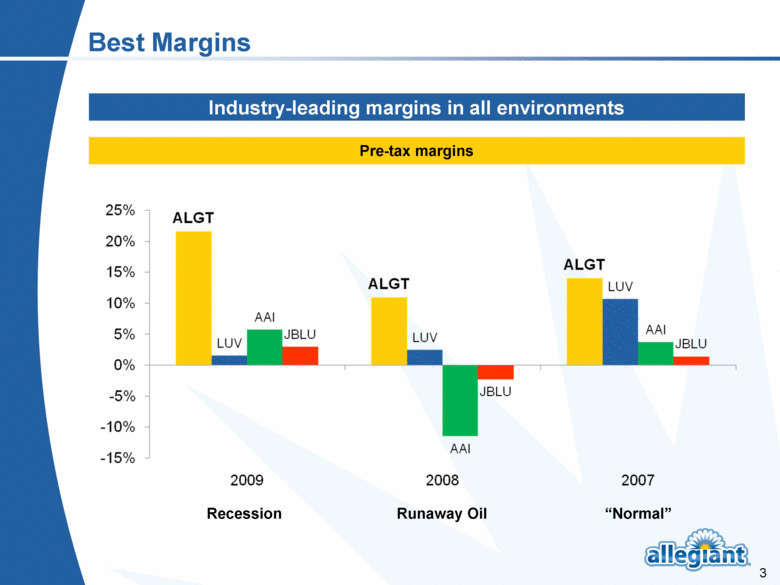
Best Margins Pre-tax margins Industry-leading margins in all environments Recession Runaway Oil “Normal” |
|
|
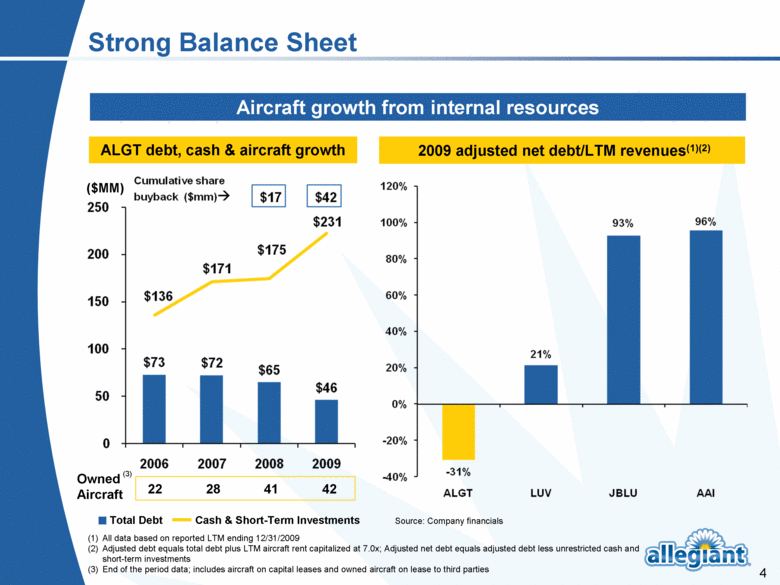
(1) All data based on reported LTM ending 12/31/2009 (2) Adjusted debt equals total debt plus LTM aircraft rent capitalized at 7.0x; Adjusted net debt equals adjusted debt less unrestricted cash and short-term investments (3) End of the period data; includes aircraft on capital leases and owned aircraft on lease to third parties ALGT debt, cash & aircraft growth 2009 adjusted net debt/LTM revenues(1)(2) Source: Company financials Aircraft growth from internal resources Total Debt Cash & Short-Term Investments Owned Aircraft 22 28 41 42 ($MM) Strong Balance Sheet (3) |
|
|
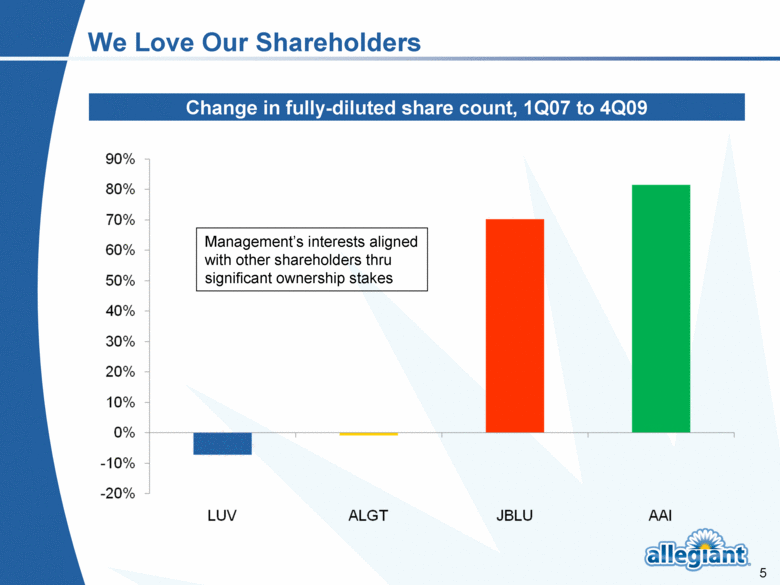
We Love Our Shareholders Change in fully-diluted share count, 1Q07 to 4Q09 Management’s interests aligned with other shareholders thru significant ownership stakes |
|
|
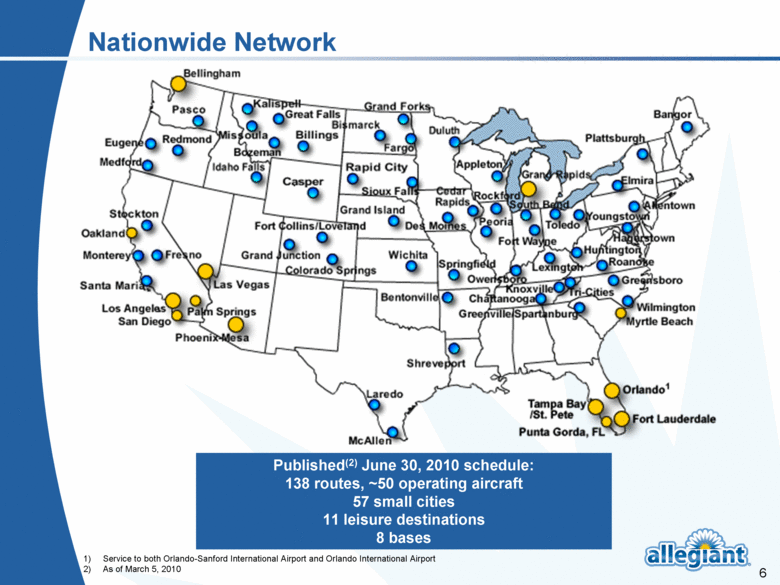
Nationwide Network Published(2) June 30, 2010 schedule: 138 routes, ~50 operating aircraft 57 small cities 11 leisure destinations 8 bases 1) Service to both Orlando-Sanford International Airport and Orlando International Airport 2) As of March 5, 2010 |
|
|
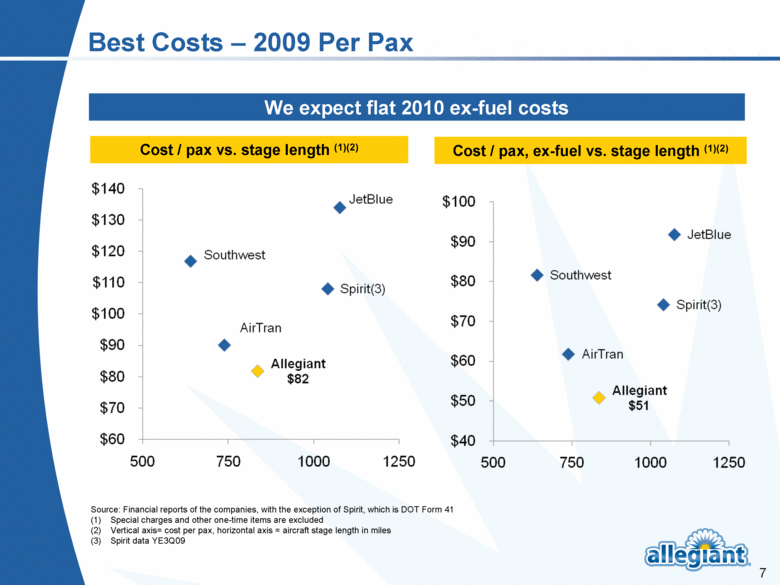
Best Costs – 2009 Per Pax Cost / pax vs. stage length (1)(2) Cost / pax, ex-fuel vs. stage length (1)(2) We expect flat 2010 ex-fuel costs Source: Financial reports of the companies, with the exception of Spirit, which is DOT Form 41 (1) Special charges and other one-time items are excluded (2) Vertical axis= cost per pax, horizontal axis = aircraft stage length in miles (3) Spirit data YE3Q09 |
|
|
Unique Revenue Approach Non-traditional markets Aggressive capacity management Ancillary revenue Own reservation platform Closed distribution system Pricing power |
|
|
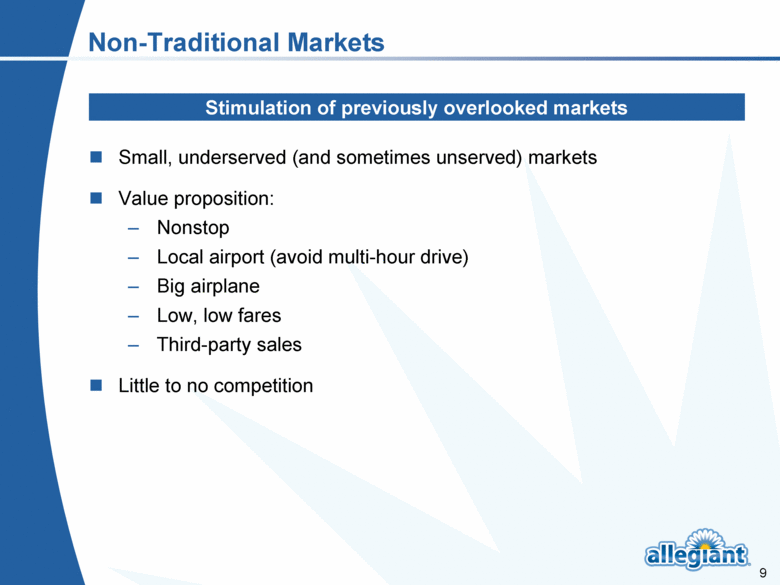
Non-Traditional Markets Small, underserved (and sometimes unserved) markets Value proposition: Nonstop Local airport (avoid multi-hour drive) Big airplane Low, low fares Third-party sales Little to no competition Stimulation of previously overlooked markets |
|
|
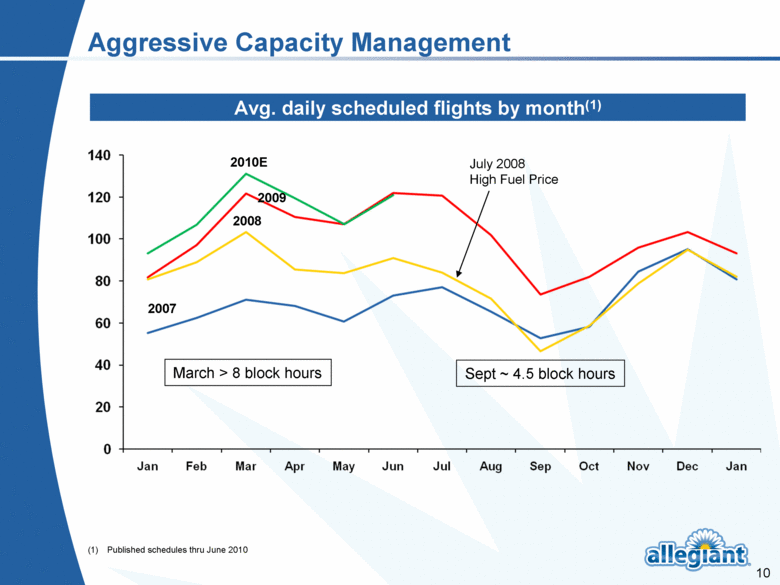
Avg. daily scheduled flights by month(1) Aggressive Capacity Management 2008 2007 2009 July 2008 High Fuel Price (1) Published schedules thru June 2010 2010E March > 8 block hours Sept ~ 4.5 block hours (1) |
|
|
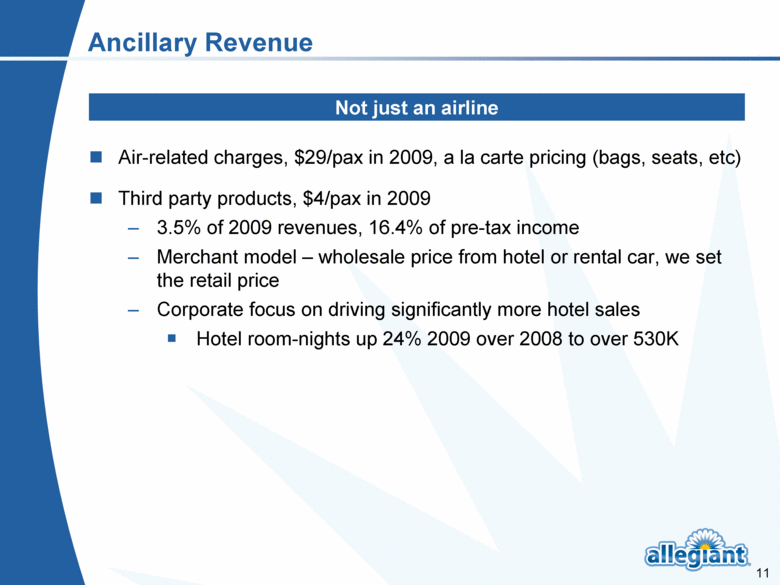
Ancillary Revenue Air-related charges, $29/pax in 2009, a la carte pricing (bags, seats, etc) Third party products, $4/pax in 2009 3.5% of 2009 revenues, 16.4% of pre-tax income Merchant model – wholesale price from hotel or rental car, we set the retail price Corporate focus on driving significantly more hotel sales Hotel room-nights up 24% 2009 over 2008 to over 530K Not just an airline |
|
|
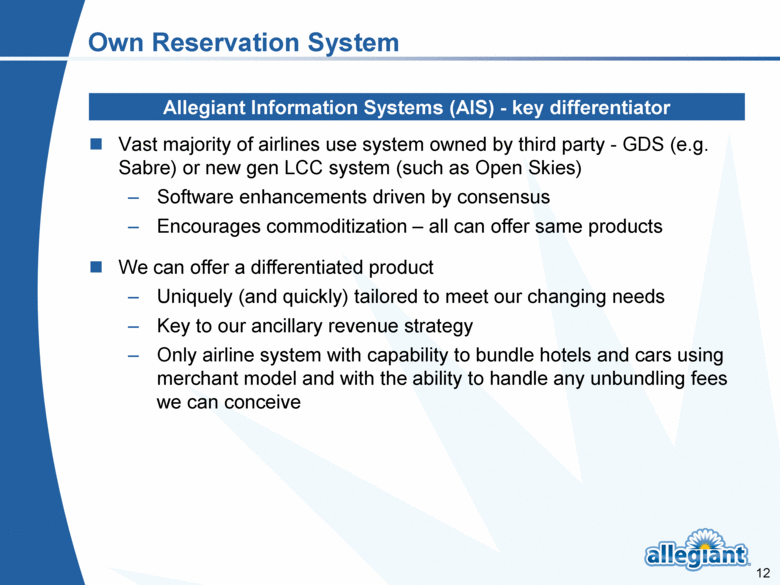
Own Reservation System Vast majority of airlines use system owned by third party - GDS (e.g. Sabre) or new gen LCC system (such as Open Skies) Software enhancements driven by consensus Encourages commoditization – all can offer same products We can offer a differentiated product Uniquely (and quickly) tailored to meet our changing needs Key to our ancillary revenue strategy Only airline system with capability to bundle hotels and cars using merchant model and with the ability to handle any unbundling fees we can conceive Allegiant Information Systems (AIS) - key differentiator |
|
|
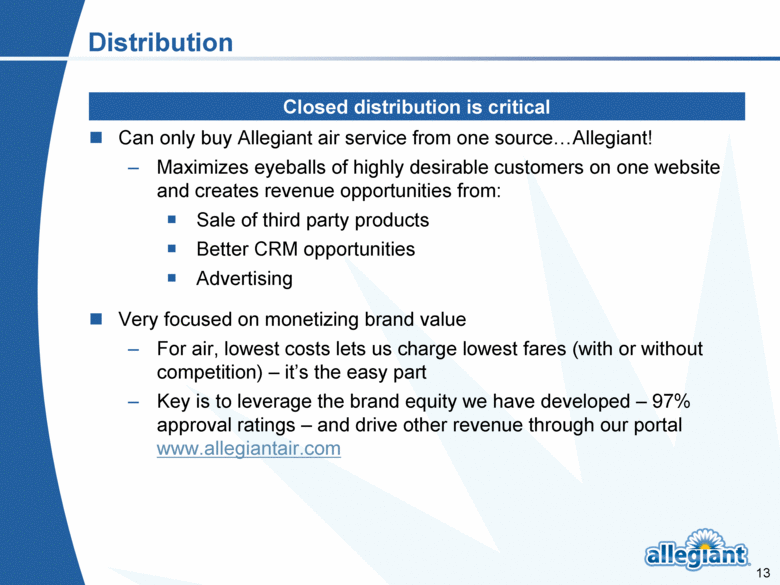
Distribution Can only buy Allegiant air service from one source...Allegiant! Maximizes eyeballs of highly desirable customers on one website and creates revenue opportunities from: Sale of third party products Better CRM opportunities Advertising Very focused on monetizing brand value For air, lowest costs lets us charge lowest fares (with or without competition) – it’s the easy part Key is to leverage the brand equity we have developed – 97% approval ratings – and drive other revenue through our portal www.allegiantair.com Closed distribution is critical
|
|
|
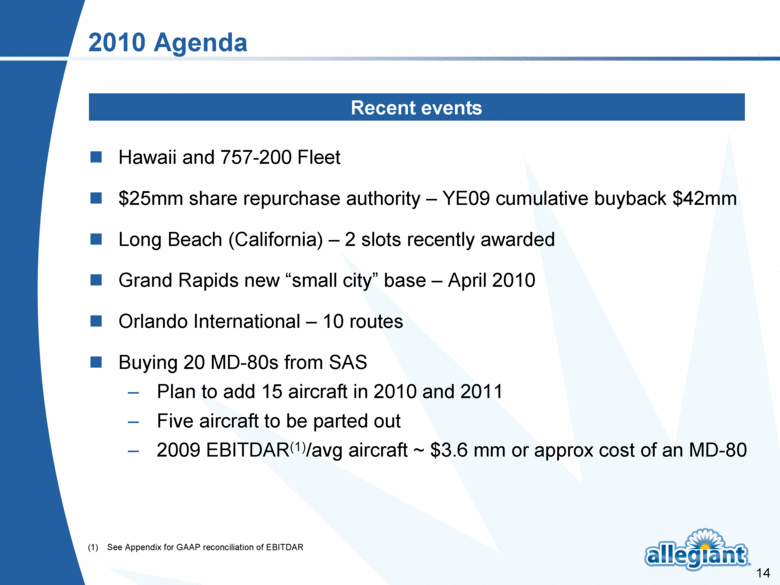
2010 Agenda Hawaii and 757-200 Fleet $25mm share repurchase authority – YE09 cumulative buyback $42mm Long Beach (California) – 2 slots recently awarded Grand Rapids new “small city” base – April 2010 Orlando International – 10 routes Buying 20 MD-80s from SAS Plan to add 15 aircraft in 2010 and 2011 Five aircraft to be parted out 2009 EBITDAR(1)/avg aircraft ~ $3.6 mm or approx cost of an MD-80 Recent events (1) See Appendix for GAAP reconciliation of EBITDAR (1) |
|
|
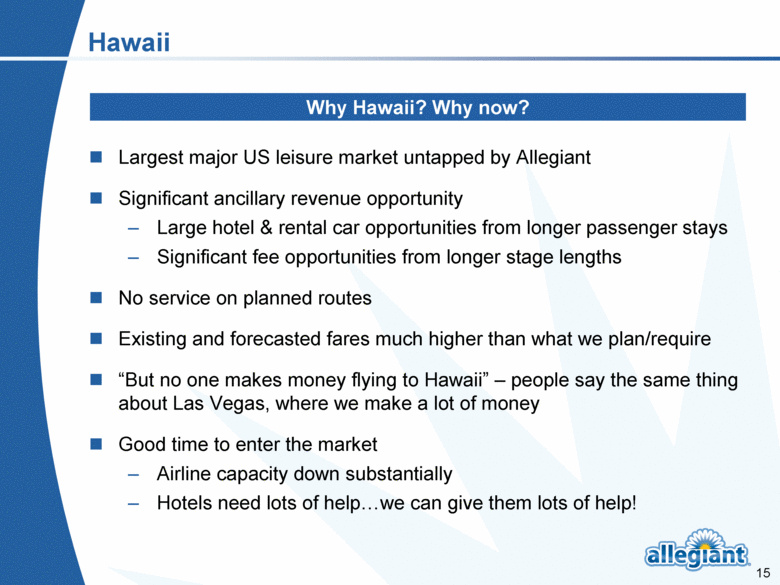
Hawaii Largest major US leisure market untapped by Allegiant Significant ancillary revenue opportunity Large hotel & rental car opportunities from longer passenger stays Significant fee opportunities from longer stage lengths No service on planned routes Existing and forecasted fares much higher than what we plan/require “But no one makes money flying to Hawaii” – people say the same thing about Las Vegas, where we make a lot of money Good time to enter the market Airline capacity down substantially Hotels need lots of help... we can give them lots of help! Why Hawaii? Why now? |
|
|
757 Program Best Hawaii aircraft Can reach Rocky Mountains 200+ seats Acquisition cost enables same flexible capacity approach as MD-80 Matched set of six high-spec, excellent-condition aircraft available Limited downside – if targeted expansion market fails, we can profitably put these to work elsewhere Asset values at trough in the cycle 757 NOT a replacement for MD-80 MD-80 best in class for Allegiant routes within its range 757 opens complementary opportunities MD-80 routes still represent overwhelming majority of future growth opportunities Why 757s? Why now? |
|
|
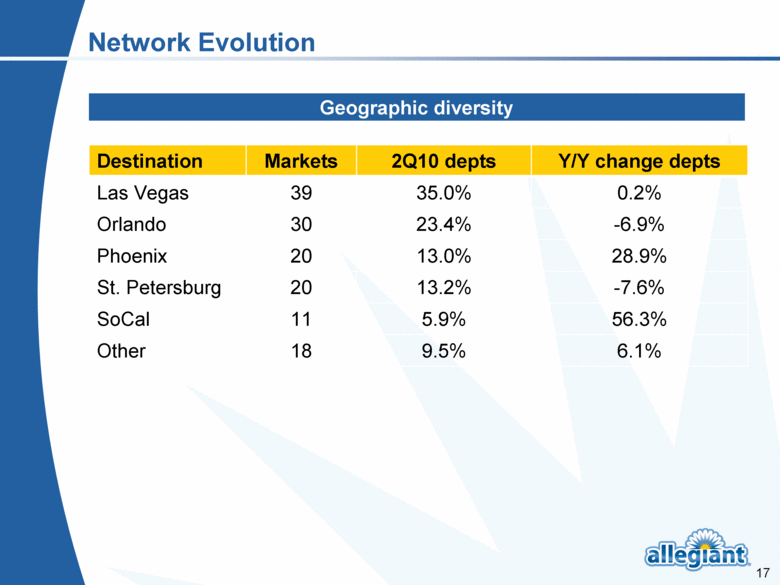
Network Evolution Geographic diversity Destination Markets 2Q10 depts Y/Y change depts Las Vegas 39 35.0% 0.2% Orlando 30 23.4% -6.9% Phoenix 20 13.0% 28.9% St. Petersburg 20 13.2% -7.6% SoCal 11 5.9% 56.3% Other 18 9.5% 6.1% |
|
|
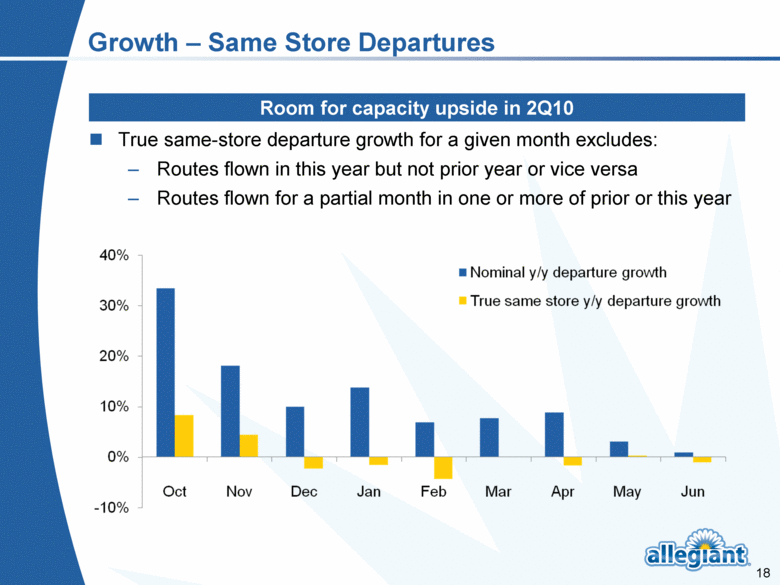
Growth – Same Store Departures True same-store departure growth for a given month excludes: Routes flown in this year but not prior year or vice versa Routes flown for a partial month in one or more of prior or this year Room for capacity upside in 2Q10 |
|
|
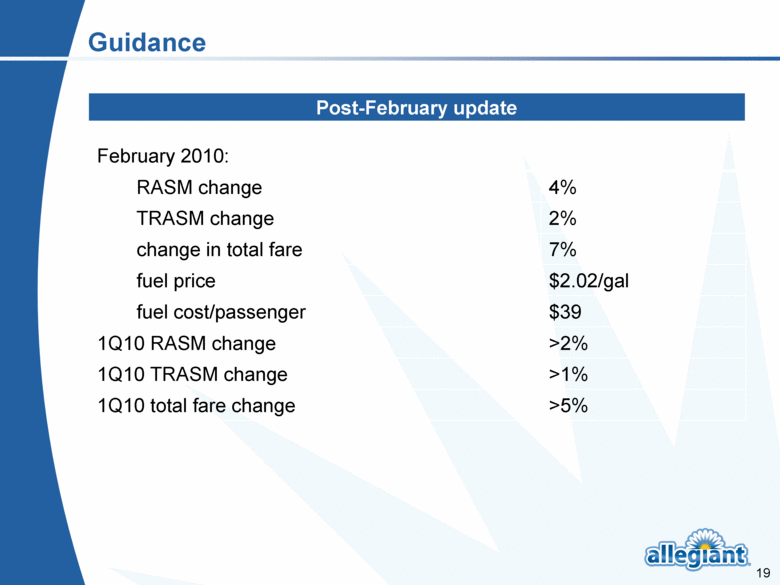
Guidance Post-February update February 2010: RASM change 4% TRASM change 2% change in total fare 7% fuel price $2.02/gal fuel cost/passenger $39 1Q10 RASM change >2% 1Q10 TRASM change >1% 1Q10 total fare change >5% |
|
|
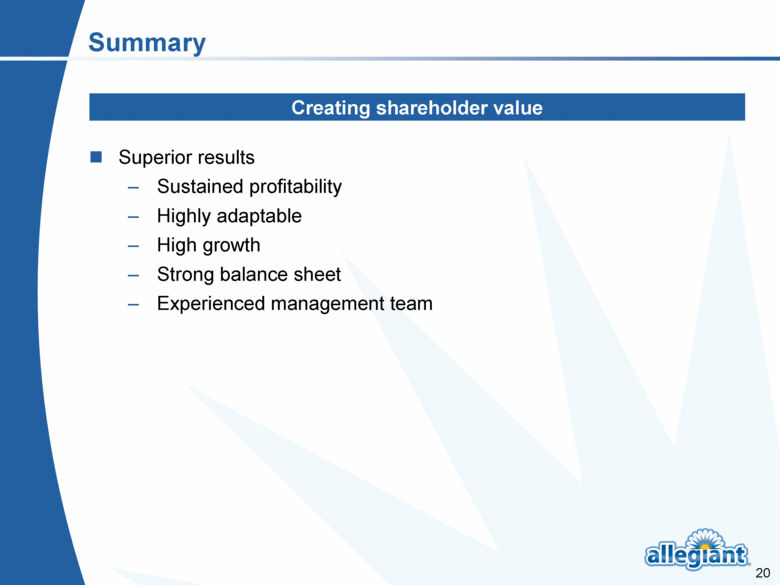
Summary Superior results Sustained profitability Highly adaptable High growth Strong balance sheet Experienced management team Creating shareholder value |
|
|
Appendix |
|
|
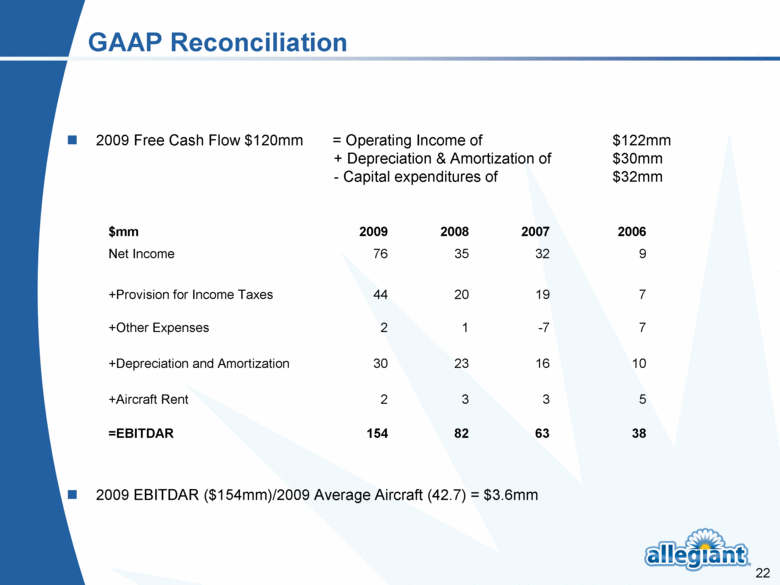
GAAP Reconciliation 2009 Free Cash Flow $120mm = Operating Income of $122mm + Depreciation & Amortization of $30mm - Capital expenditures of $32mm 2009 EBITDAR ($154mm)/2009 Average Aircraft (42.7) = $3.6mm $mm 2009 2008 2007 2006 Net Income 76 35 32 9 +Provision for Income Taxes 44 20 19 7 +Other Expenses 2 1 -7 7 +Depreciation and Amortization 30 23 16 10 +Aircraft Rent 2 3 3 5 =EBITDAR 154 82 63 38 |
Supplemental information provided to investors regarding Allegiant Travel Company’s recently announced forward purchase of six 757s, which Allegiant intends to use to serve Hawaii.
· Expected 757-related capital expenditures for 2010: $40mm
· Expected 757-related capital expenditures for 2011: $40mm
· Expected number of seats of each aircraft: between 200 and 220.
· Expected departures per 757 aircraft per day: 1.5
· Timing of start of 757 service to Hawaii: Approximately 120 days after receipt of extended twin-engine operations (“ETOPS”) certification from the FAA. We believe this is mostly likely to be first quarter 2011, however, this cannot be assured as the grant of ETOPS certification depends on the FAA determining that Allegiant has met the ETOPS requirements, which need not happen on any particular schedule.
· Assuming 757 service to Hawaii starts in the first quarter of 2011, 757 program departures should account for less than 5% of total Allegiant departures in 2011 and 2012.
· These 757 aircraft are powered by Rolls-Royce RB211-535E4 engines.
· Average age of the six 757s: 17 years
· Average number of cycles of the six 757s as of June, 2009 : 19,000

