Attached files
Table of Contents
UNITED STATES
SECURITIES AND EXCHANGE COMMISSION
Washington, D.C. 20549
FORM 10-K
(Mark One)
| x | ANNUAL REPORT PURSUANT TO SECTION 13 OR 15(d) OF THE SECURITIES EXCHANGE ACT OF 1934 |
For the fiscal year ended December 31, 2009
OR
| ¨ | TRANSITION REPORT PURSUANT TO SECTION 13 OR 15(d) OF THE SECURITIES EXCHANGE ACT OF 1934 |
For the transition period from to
Commission file number 1-15477
MAXWELL TECHNOLOGIES, INC.
(Exact name of registrant as specified in its charter)
| Delaware |
95-2390133 | |
| (State or other jurisdiction of incorporation or organization) |
(I.R.S. Employer Identification No.) | |
| 9244 Balboa Avenue San Diego, California |
92123 | |
| (Address of principal executive offices) | (Zip Code) | |
Registrant’s telephone number, including area code: (858) 503-3300
Securities registered pursuant to Section 12(b) of the Act:
None
Securities registered pursuant to Section 12(g) of the Act:
Common Stock, par value $0.10 per share
Indicate by check mark if the registrant is a well-known seasoned issuer, as defined in Rule 405 of the Securities Act. YES ¨ NO x
Indicate by check mark if the registrant is not required to file reports pursuant to Section 13 or Section 15(d) of the Act. YES ¨ NO x
Indicate by check mark whether the registrant: (1) has filed all reports required to be filed by Section 13 or 15(d) of the Securities Exchange Act of 1934 during the preceding 12 months (or for such shorter period that the registrant was required to file such reports), and (2) has been subject to such filing requirements for the past 90 days. YES x NO ¨
Indicate by check mark whether the registrant has submitted electronically and posted on its corporate Website, if and, every Interactive Data File required to be submitted and posted pursuant to Rule 405 of Regulation S-T (§ 232.405 of this chapter) during the preceding 12 months (or for such shorter period that the registrant was required to submit and post such files). YES ¨ NO ¨
Indicate by check mark if disclosure of delinquent filers pursuant to Item 405 of Regulation S-K (§ 229.405 of this chapter) is not contained herein, and will not be contained, to the best of registrant’s knowledge, in definitive proxy or information statements incorporated by reference in Part III of this Form 10-K or any amendment to this Form 10-K. x
Indicate by check mark whether the registrant is a large accelerated filer, an accelerated filer, a non-accelerated filer or a smaller reporting company. See the definitions of “accelerated filer”, “large accelerated filer” and “smaller reporting company” in Rule 12b-2 of the Exchange Act.
| Large accelerated filer ¨ | Accelerated filer x | Non-accelerated filer ¨ | Smaller reporting company ¨ |
Indicate by check mark whether the registrant is a shell company (as defined in Rule 12b-2 of the Act). YES ¨ NO x
The aggregate market value of Common Stock held by non-affiliates as of June 30, 2009 based on the closing price of the common stock on the NASDAQ Global Market was $323,443,095.
The number of shares of the registrant’s Common Stock outstanding as of February 28, 2010 was 26,412,040 shares.
DOCUMENTS INCORPORATED BY REFERENCE
Specified portions of the registrant’s definitive Proxy Statement to be issued in conjunction with the registrant’s 2010 Annual Meeting of Stockholders, which is expected to be filed not later than 120 days after the registrant’s fiscal year ended December 31, 2009, are incorporated by reference into Part III of this Annual Report. Except as expressly incorporated by reference, the registrant’s Proxy Statement shall not be deemed to be a part of this Annual Report on Form 10-K.
Table of Contents
MAXWELL TECHNOLOGIES, INC.
INDEX TO ANNUAL REPORT ON FORM 10-K
For the fiscal year ended December 31, 2009
i
Table of Contents
SPECIAL NOTE REGARDING FORWARD-LOOKING STATEMENTS
Some of the statements contained in this Annual Report on Form 10-K and incorporated herein by reference discuss our plans and strategies for our business or make other forward-looking statements, within the meaning of Section 27A of the Securities Act of 1933, as amended, and Section 21E of the Securities Exchange Act of 1934, as amended. The words “anticipates,” “believes,” “estimates,” “expects,” “plans,” “intends,” “may,” “could,” “will,” “continue,” “seek,” “should,” “would” and similar expressions are intended to identify these forward-looking statements, but are not the exclusive means of identifying them. These forward-looking statements reflect the current views and beliefs of our management; however, various risks, uncertainties and contingencies could cause our actual results, performance or achievements to differ materially from those expressed in, or implied by, our statements. Such risks, uncertainties and contingencies include, but are not limited to, the following:
| • | financial markets in the United States, Europe and Asia have been experiencing extreme disruption in recent months, including, among others things, extreme volatility in securities prices, diminished liquidity and credit availability, ratings downgrades of certain investments and declining valuations of others; |
| • | decline in the domestic and global economies that may delay development and introduction of products by our customers that incorporate our products; |
| • | our success in introducing and marketing new products into existing and new markets; |
| • | our ability to manufacture existing and new products in volumes demanded by our customers and at competitive prices with adequate gross margins; |
| • | market success of the products into which our products are integrated; |
| • | our ability in growing markets to increase our market share relative to our competitors; |
| • | our ability to successfully integrate our business with operations of businesses we may acquire; |
| • | our ability to finance the growth of our business with internal resources or through outside financing at reasonable rates; and |
| • | our ability to produce our products at quality levels demanded by our customers. |
Many of these factors are beyond our control. Additionally, there can be no assurance that we will not incur new or additional unforeseen costs in connection with the ongoing conduct of our business. Accordingly, any forward-looking statements included herein do not purport to be predictions of future events or circumstances and may not be realized.
For a discussion of important risks associated with an investment in our securities, including factors that could cause actual results to differ materially from expectations referred to in the forward-looking statements, see Item 1A. “Risk Factors” of this document. We do not have any obligation to update publicly any forward-looking statements, whether as a result of new information, future events or otherwise.
1
Table of Contents
| Item 1. | Business |
Introduction
Maxwell was incorporated under the name Maxwell Laboratories, Inc. in 1965. The Company made an initial public offering of common stock in 1983, and changed its name to Maxwell Technologies, Inc. in 1996. Today, we develop, manufacture and market energy storage and power delivery products for transportation, industrial, telecommunications and other applications and microelectronic products for space and satellite applications. Our products are designed and manufactured to perform reliably with minimal maintenance for the life of the applications into which they are integrated. We believe that this “life-of-the-application” reliability gives our products a competitive advantage and enables them to command higher profit margins than commodity products. We focus on the following lines of high-reliability products:
| • | Ultracapacitors: Our primary focus is on ultracapacitors, energy storage devices that are characterized by high power density, long operational life and the ability to charge and discharge very rapidly. Our BOOSTCAP® ultracapacitor cells and multi-cell modules provide energy storage and power delivery solutions for applications in multiple industries, including transportation, automotive, telecommunications, renewable energy and consumer and industrial electronics. |
| • | High-Voltage Capacitors: Our CONDIS® high-voltage capacitors are designed and manufactured to perform reliably for decades in all climates. These products include grading and coupling capacitors and capacitive voltage dividers that are used to ensure the safety and reliability of electric utility infrastructure and other applications involving transport, distribution and measurement of high-voltage electrical energy. |
| • | Radiation-Mitigated Microelectronic Products: Our radiation-mitigated microelectronic products for satellites and spacecraft include single board computers and components, such as high-density memory and power modules. Many of these products incorporate our proprietary RADPAK® packaging and shielding technology and novel architectures that enable them to withstand the effects of environmental radiation and perform reliably in space. |
General Product Line Overview
Ultracapacitors
Ultracapacitors enhance the efficiency and reliability of devices or systems that generate or consume electrical energy. They differ from other energy storage and power delivery products in that they combine rapid charge/discharge capabilities typically associated with film and electrolytic capacitors with energy storage capacity generally associated with batteries. Although batteries store significantly more electrical energy than ultracapacitors, they cannot charge and discharge as rapidly and efficiently as ultracapacitors. Conversely, although electrolytic capacitors can deliver bursts of high power very rapidly, they have extremely limited energy storage capacity, and therefore cannot sustain power delivery for as much as a full second. Also, unlike batteries, which store electrical energy by means of a chemical reaction and experience gradual depletion of their energy storage and power delivery capability over hundreds to a few thousand charge/discharge cycles, ultracapacitors’ energy storage and power delivery mechanisms involve no chemical reaction, so they can be charged and discharged hundreds of thousands to millions of times with minimal performance degradation. This ability to store energy, deliver bursts of power and perform reliably for many years with little or no maintenance makes ultracapacitors an attractive energy-efficiency option for a wide range of energy-consuming and generating devices and systems.
Based on potential volumes, we believe that the transportation industry represents the largest market opportunity for ultracapacitors. Transportation applications include braking energy recuperation and torque-augmentation systems for hybrid-electric buses, trucks and autos and electric rail vehicles, vehicle power network smoothing and stabilization, engine starting systems for internal combustion vehicles and burst power for idle stop-start systems.
2
Table of Contents
Our ultracapacitor products have advanced to commercial utilization in transportation applications such as hybrid-electric transit buses and electric rail systems and industrial electronics applications such as wind energy, telecommunications, information technology and automated utility meters in “smart grid” systems.
To reduce manufacturing cost and improve the performance of our ultracapacitor products, we developed a proprietary, solvent-free, process to produce the carbon film electrode material which accounts for a significant portion of the cost of ultracapacitor cells. This process has enabled us to become a low-cost producer of electrode material, and our cost position has enabled us to market electrode material to other ultracapacitor manufacturers. Although we do not intend to license this electrode technology to other ultracapacitor or electrode manufacturers, we have licensed our proprietary cell architecture to manufacturers in China, Taiwan and Korea to expand and accelerate acceptance of ultracapacitor products in large and rapidly growing Asian markets.
High-Voltage Capacitors
High-voltage grading and coupling capacitors and capacitive voltage dividers are used mainly in the electric utility industry. These devices prevent high-voltage arcing that can damage switches, circuit breakers, step-down transformers and other equipment that transmits, distributes or measures high-voltage electrical energy in electric utility infrastructure. The market for these products consists of expansion, upgrading and maintenance of existing infrastructure and new infrastructure installations in developing countries. Such installations are capital-intensive and frequently are subject to regulation, availability of government funding and general economic conditions. For example, while North America has a large installed base of electric utility infrastructure, and has experienced power interruptions and supply problems, utility deregulation, government budget deficits, and other factors have limited recent capital spending in what historically has been a very large market for utility infrastructure components. However, projects to meet growing demand for electrical energy in developing countries, such as China and India, continue to drive increasing global demand for high-voltage capacitors.
Radiation-Mitigated Microelectronics
Radiation-mitigated microelectronic products are used almost exclusively in the space and satellite industry. Because satellites and spacecraft are extremely expensive to manufacture and launch, and space missions typically span years or even decades, and because it is impractical or impossible to repair or replace malfunctioning parts, the industry demands electronic components that are virtually failure-free. As satellites and spacecraft routinely encounter ionizing radiation from solar flares and other natural sources, microelectronic components must be able to withstand such radiation and continue to perform reliably. For that reason, suppliers of components for space applications historically used only special radiation-hardened silicon in the manufacture of such components. However, since the space market is relatively small and the process of producing “rad-hard” silicon is very expensive, only a few government-funded wafer fabrication facilities are capable of producing such material. In addition, because it takes several years to produce a rad-hard version of a new semiconductor, components using rad-hard silicon typically are several generations behind their current commercial counterparts in terms of density, processing power and functionality.
To address the performance gap between rad-hard and commercial silicon and provide components with both increased functionality and significantly greater processing power, Maxwell and a few other specialty components suppliers have developed shielding, packaging, and other radiation mitigation techniques that allow sensitive commercial semiconductors to withstand space radiation effects and perform as reliably as rad-hard components. Although this market is limited in size, the value proposition for high-performance, radiation-tolerant, components enables us to generate profit margins much higher than those for commodity electronic components.
3
Table of Contents
Business Strategy
Our primary objective is to significantly increase the company’s revenue and profit margins by creating and satisfying demand for ultracapacitor-based energy storage and power delivery solutions. To accomplish this, we are focusing on:
Establishing and expanding market opportunities for ultracapacitors by:
| • | Collaborating with key existing and prospective customers in development of ultracapacitor-based solutions for strategic applications; |
| • | Demonstrating the efficiency, durability and safety of our ultracapacitor products through extensive in-house and third party testing; |
| • | Integrating mathematical models for ultracapacitors into simulation software used by system designers; |
| • | Participating in a broad array of working groups, consortia and industry standards committees to disseminate knowledge of, and promote the use of, ultracapacitors; and |
| • | Manufacturing products that are environmentally compatible. |
Becoming a preferred ultracapacitor supplier by:
| • | Being a low-cost producer and demonstrating ultracapacitors’ value proposition; |
| • | Designing and manufacturing products with “life-of-the-application” durability; |
| • | Building a robust supply chain through global sourcing; |
| • | Achieving superior performance and manufacturing quality while reducing product cost; |
| • | Developing and deploying enabling technologies and systems, including cell-to-cell and module-to-module balancing and integrated charging systems, among others; |
| • | Marketing high-performance, low-cost electrode material to other manufacturers; and |
| • | Establishing and maintaining broad and deep protections of key intellectual property. |
We also seek to expand market opportunities and revenue for our high-voltage capacitors and radiation-mitigated microelectronic products. While these products have highly specialized applications, we are a technology leader in the markets they serve, and thus are able to sell our products at attractive profit margins. To maintain and expand this competitive position we are leveraging our technological expertise to develop new products that not only meet the demands of our current markets, but also address additional applications. For example, our microelectronics group has successfully introduced a single-board computer (SBC) for the space and satellite market, addressing an application that we did not previously serve. In 2005, Northrop Grumman Space Technologies, prime contractor for the National Polar-orbiting Operational Environmental Satellite System, the U.S. government’s next generation weather satellite constellation, selected our SCS750 SBC for spacecraft control and data management. Orbital Sciences selected the SCS750 to manage payload data for the National Aeronautics and Space Administration’s “Glory” earth sciences mission and took delivery of our first space-qualified SBCs in 2007. In October 2007, Astrium, a subsidiary of EADS, selected the SCS750 to process images gathered by a satellite Astrium has contracted to produce for the European Space Agency’s “Gaia” astronomy mission.
Products and Applications
Our products incorporate our expertise and proprietary energy storage and power delivery and microelectronics technologies at both the component and system levels for specialized, high-value applications that demand “life-of-the-application” reliability.
4
Table of Contents
Ultracapacitors
Ultracapacitors, also known as electrochemical double-layer capacitors (EDLC) or supercapacitors, store energy electrostatically by polarizing an organic salt solution within a sealed package. Although ultracapacitors are electrochemical devices, no chemical reaction is involved in their energy storage mechanism. Their electrostatic energy storage mechanism is fully reversible, allowing ultracapacitors to be rapidly charged and discharged hundreds of thousands to millions of times with minimal performance degradation, even in the most demanding heavy charge/discharge applications.
Compared with electrolytic capacitors, which have very low energy storage capacity and discharge power too rapidly to be suitable for many power delivery applications, ultracapacitors have much greater energy storage capacity and can discharge energy over time periods ranging from fractions of a second to several minutes.
Compared with batteries, which require minutes or hours to fully charge or discharge, ultracapacitors discharge and recharge in as little as fractions of a second. Although ultracapacitors store only about five to ten percent as much electrical energy as a battery of comparable size, they can deliver or absorb electric energy up to 100 times more rapidly than batteries. Because they operate reliably through hundreds of thousands to millions of deep discharge cycles, compared with only hundreds to a few thousand equivalent cycles for batteries, ultracapacitors have significantly higher lifetime energy throughput, which equates to significantly lower cost on a life cycle basis.
We link our ultracapacitor cells together in multi-cell modules to satisfy energy storage and power delivery requirements of varying voltages. Both individual cells and multi-cell products can be charged from any primary energy source, such as a battery, generator, fuel cell, solar panel or electrical outlet. Virtually any device or system whose intermittent peak power demands are greater than its average continuous power requirement is a candidate for an ultracapacitor-based energy storage and power delivery solution.
Our ultracapacitor products have significant advantages over batteries, including:
| • | the ability to deliver up to 100 times more instantaneous power; |
| • | significantly lower weight per unit of electrical energy stored; |
| • | the ability to discharge much deeper and recharge much faster and more efficiently, minimizing energy loss; |
| • | the ability to operate reliably and continuously in extreme temperatures (-40 degrees C to +65 degrees C); |
| • | minimal to no maintenance requirements; |
| • | “life of the application” durability; and |
| • | minimal environmental issues associated with disposal because they contain no heavy metals. |
With no moving parts and no chemical reactions involved in their energy storage mechanism, ultracapacitors provide a simple, highly reliable, “solid state-like” solution to buffer short-term mismatches between power available and power required. Additionally, ultracapacitors offer the advantage of storing energy in the same form in which it is used, as electricity.
Emerging applications, including increasing use of electric power in vehicles, wireless communication systems and growing demand for highly reliable, maintenance-free, back-up power for telecommunication information technology and industrial installations are creating significant opportunities for more efficient and reliable energy storage and power delivery products. In many applications, power demand varies widely from moment to moment, and peak power demand typically is much greater than the average power requirement. For example, automobiles require 10 times more power to accelerate than to maintain a constant speed, and forklifts require more power to lift a heavy pallet of material than to move from place to place within a warehouse.
5
Table of Contents
Engineers historically have addressed transient peak power requirements by over-sizing the engine, battery or other primary energy source to satisfy all of a system’s power demands, including demands that occur infrequently and may last only fractions of a second. Sizing a primary power source to meet brief peak power requirements, rather than for average power requirements, is costly and inefficient. When a primary energy source is coupled with ultracapacitors, which can deliver or absorb brief bursts of high power on demand for periods of time ranging from fractions of a second to several minutes, the primary energy source can be smaller, lighter and less costly.
The following diagram depicts the separation of a primary energy storage source from a peak power delivery component to satisfy the requirements of a particular application. Components that enable this separation allow designers to optimize the size, efficiency and cost of the entire electrical power system.
Peak Power Application Model
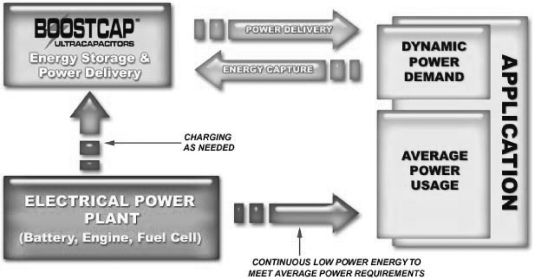
Although conventional batteries have been the most widely used component for both energy storage and peak power delivery, ultracapacitors, advanced batteries and flywheels now enable system designers to separate and optimize these functions. Based in part on our ultracapacitor products’ declining cost, high performance and “life-of-the-application” durability, they are becoming a preferred solution for many energy storage and power delivery applications.
We offer our BOOSTCAP® ultracapacitors in numerous form factors, ranging from postage stamp size 10-farad small cells rated at 2.5 volts, to cylindrical, 2.7-volt, 3,000-farad large cells that measure approximately two inches in diameter and five inches long. Applications such as hybrid-electric bus, truck and auto drive trains, electric rail systems and UPS systems require integrated modules consisting of up to hundreds of ultracapacitor cells. To facilitate adoption of ultracapacitors for these larger systems, we have developed integration technologies, including proprietary electrical balancing and thermal management systems and interconnect technologies. We have applied for patents for certain of these technologies. We offer a broad range of standard multi-cell modules to provide fully integrated solutions for applications requiring up to 1,500 volts of power. Our current standard multi-cell products each incorporate from six to 48 of our large cells to provide “plug and play” solutions for applications requiring from 15 to 125 volts. In addition, our multi-cell modules are designed to be linked together for higher voltage applications. Since 2005, we have introduced more than 30 new products, including several additional cell form factors and corresponding multi-cell modules to better meet the diverse requirements of the automotive, transportation, industrial and consumer electronics markets.
6
Table of Contents
High-Voltage Capacitors
Electric utility infrastructure includes switches, circuit breakers, step-down transformers and measurement instruments that transmit, distribute and measure high-voltage electrical energy. High-voltage capacitors are used to protect these systems from high-voltage arcing. With operational lifetimes measured in decades, these applications require high reliability and durability.
Through our acquisition in 2002 of Montena Components Ltd., now known as Maxwell Technologies SA, and its CONDIS® line of high-voltage capacitor products, Maxwell has more than 20 years of experience in this industry, and is the world’s largest producer of such products for use in utility infrastructure. Engineers with specific expertise in high-voltage systems develop, design and test our high-voltage capacitor products in our development and production facility in Rossens, Switzerland. Our high-voltage capacitors are produced through a proprietary assembly and automated winding process to ensure consistent quality and reliability. We have upgraded and expanded our high-voltage capacitor production facility over the past five years to double its output capacity and significantly shorten order-to-delivery intervals.
We sell our high-voltage capacitor products to large systems integrators, such as Areva and Siemens AG, which install and service power plants and electrical utility infrastructure worldwide.
Radiation-Mitigated Microelectronic Products
Manufacturers of satellites and other spacecraft require microelectronic components and sub-systems that meet specific functional requirements and can withstand exposure to gamma rays, hot electrons and protons and other environmental radiation encountered in space. In the past, microelectronic components and systems for such special applications used only specially fabricated radiation-hardened silicon. However, the process of designing and producing rad-hard silicon is lengthy and expensive, and there are only a few specialty semiconductor wafer fabricators, so supplies of rad-hard silicon are limited. Therefore, demand for space-qualified components made with higher-performance, lower-cost commercial silicon, protected by shielding and other radiation mitigation techniques, has grown. Producing our components and systems incorporating radiation-mitigated commercial silicon requires expertise in power electronics, circuit design, silicon selection, radiation shielding and extensive expertise in quality assurance testing.
We design, manufacture and market radiation-mitigated microelectronic products, including single-board computers and components such as memory and power modules, for the space and satellite markets. Using highly adaptable, proprietary, packaging and shielding technology and other radiation mitigation techniques, we design and manufacture products that allow satellite and spacecraft manufacturers to use powerful, low cost, commercial semiconductors that are protected with the level of radiation mitigation required for reliable performance in the specific orbit or environment in which they are to be deployed.
Manufacturing
Our internal manufacturing operations are conducted in production facilities located in San Diego, California, and Rossens, Switzerland. We have made substantial capital investments to outfit and expand our internal production facilities and incorporate mechanization and automation techniques and processes. We have trained our manufacturing personnel in advanced operational techniques, added information technology infrastructure and implemented new business processes and systems to increase our manufacturing capacity and improve efficiency, planning and product quality. In 2007, we outsourced assembly of our MC family of large cell ultracapacitors, and subsequently, assembly of multi-cell modules based on MC cells, to Belton Technology Group (Belton), a contract manufacturer based in Shenzhen, China. We are currently outsourcing assembly of our BC family of ultracapacitor products and multi-cell modules based on BC cells to the Lishen Battery Company (Lishen), China’s largest producer of lithium-ion batteries, based in Tianjin. With the completion of certain upgrades and capacity expansions currently underway, along with our contract manufacturing relationships with Belton and Lishen in China, we believe that we have sufficient capacity to meet near-term demand for all of our product lines.
7
Table of Contents
Acceptance of our ultracapacitor products and high-voltage capacitor products depends in part on compliance and certification with a number of U.S. and foreign standards for electronic components and systems. Among the entities that promulgate such standards are Underwriters Laboratories, Canadian Standards Association and Committee European. We incorporate compliance with such standards into the quality assurance protocols we follow in manufacturing and testing these products.
Ultracapacitors
We currently produce 10-farad PC ultracapacitor cells on a production line in our San Diego facility and produce our BC family of ultracapacitor products in our Rossens facility. As noted above, we have outsourced large cell, ultracapacitor cell and multi-cell module assembly to a contract manufacturer in China, and we are in the process of moving assembly of our BC ultracapacitor cells and multi-cell modules to a second contract manufacturer in China. To reduce cost, simplify assembly and facilitate automation, we have redesigned our ultracapacitor products to incorporate lower-cost materials and to reduce both the number of parts in a finished cell and the number of manufacturing process steps required to produce them. We intend to outsource all future additional increments of cell and module assembly capacity to countries with low-cost labor, but will continue to produce our proprietary electrode material only in internal production facilities.
We produce electrode material for our BOOSTCAP® products, and for sale to other ultracapacitor manufacturers, such as Yeong-Long Technologies Co., Ltd., (YEC) and Shanghai Sanjiu Electric Equipment Company, Ltd. (Sanjiu), at our San Diego headquarters location. In 2007, we completed installation of an advanced carbon powder processing system as part of a major electrode capacity expansion that more than doubled previous electrode output without additional direct labor, and we are in the process of installing a new generation of electrode fabrication equipment that will enable us to re-double capacity. This expansion gives us sufficient capacity to support both our current ultracapacitor production requirements and external electrode sales. As demand increases, additional increments of electrode production capacity can be added within a few months of placing an order with our current equipment vendor. We intend to continue producing this proprietary material internally, and do not contemplate licensing our solvent-free electrode fabrication process to ultracapacitor electrode customers or competing suppliers of such material.
In 2003, we formed an ultracapacitor manufacturing and marketing alliance with YEC, an ultracapacitor manufacturer headquartered in Taichung, Taiwan, with manufacturing and sales operations in mainland China. We entered into this alliance to accelerate commercialization of our proprietary BOOSTCAP® ultracapacitors in China, and to utilize YEC’s production capabilities for assembly of certain Maxwell-branded ultracapacitor products. In 2006, we expanded our relationship with YEC to include supplying ultracapacitor electrode material produced in our San Diego manufacturing facility to YEC for incorporation into its own line of ultracapacitor products, and to assist YEC in establishing worldwide distribution and marketing.
High-Voltage Capacitors
We produce our high-voltage grading and coupling capacitors in our Rossens, Switzerland facility. We believe we are the only high-voltage capacitor producer that manufactures its products with stacking, assembly and automated winding processes. This enables us to produce consistent, high quality and highly reliable products, and gives us sufficient capacity to satisfy growing global customer demand. Using advanced demand-based techniques, we upgraded the assembly portion of the process to a “cell-based,” “just-in-time” design in 2004, doubling our production capacity without adding direct labor, and significantly shortening order-to-delivery intervals. This upgrade and subsequent capacity expansion also enabled us to manufacture products for the capacitive voltage divider market, which we did not previously serve. We believe that penetrating this new market could enable us to materially increase our High-Voltage capacitor revenue.
8
Table of Contents
Radiation-Mitigated Microelectronics Products
We produce our radiation-mitigated microelectronics products in our San Diego production facility. We have reengineered our production processes for radiation-mitigated microelectronics, resulting in substantial reductions in cycle time and a significant increase in yield. This facility maintains the QML-V and QML-Q certifications, issued by the Department of Defense procurement agency.
Our radiation-mitigated microelectronics production operations include die characterization, packaging and electrical, environmental and life testing. As a result of manufacturing cycle time reductions and operator productivity increases achieved over the past several years, we believe that this facility is capable of significantly increasing its current output with minimal additional direct labor or capital expenditure, and therefore, that we have ample capacity to meet foreseeable demand in the space and satellite markets.
Suppliers
We generally purchase components and materials, such as carbon powder, electronic components, dielectric materials and ceramic insulators from a number of suppliers. For certain products, such as our radiation-mitigated microelectronic products and our high-voltage capacitors, we rely on a limited number of suppliers or a single supplier. Although we believe there are alternative sources for some of the components and materials that we currently obtain from a single source, there can be no assurance that we will be able to identify and qualify alternative suppliers in a timely manner. Therefore, in critical component areas, we “bank,” or store, critical high value materials, especially silicon die. We are working to reduce our dependence on sole and limited source suppliers through an extensive global sourcing effort.
Marketing and Sales
We market and sell our products through both direct and indirect sales organizations in North America, Europe and Asia for integration by OEM customers into a wide range of end products. Because the introduction of products based on emerging technologies requires customer acceptance of new and unfamiliar technical approaches, and because many OEM customers have rigorous vendor qualification processes, the design-in process and initial sale of our products often takes months or even years.
Our principal marketing strategy is to identify applications for which our products and technology offer a competitive value proposition, become a preferred vendor on the basis of service and price, and negotiate supply agreements that enable us to establish long-term relationships with key OEM and integrator customers. As these design-in sales tend to be technical and engineering-intensive, we organize customer-specific teams composed of sales, engineering, research and development and other technical and operational personnel to work closely with our customers across multiple disciplines to satisfy their requirements for form, fit, function and environmental needs. As time-to-market often is a primary motivation for our customers to use our products, the initial sale and design-in process typically evolves into ongoing account management to ensure on-time delivery, responsive technical support and problem-solving.
We design and conduct discrete marketing programs intended to position and promote each of our product lines. These include trade shows, seminars, advertising, product publicity, distribution of product literature, internet websites and “social media”. We employ marketing communications specialists and outside consultants to develop and implement our marketing programs, design and develop marketing materials, negotiate advertising media purchases, write and place product press releases and manage our marketing websites.
We have an alliance with YEC to assemble and market small cell BOOSTCAP® ultracapacitor products. In addition, we sell electrode material to YEC, both for Maxwell-branded products and for incorporation into YEC’s own ultracapacitor products, and to Shanghai Sanjiu Electric Equipment Company, which has licensed our large cell architecture and is introducing its own brand of ultracapacitor products in China.
9
Table of Contents
Competition
Each of our product lines has competitors, some of whom have longer operating histories, significantly greater financial, technical, marketing and other resources, greater name recognition and larger installed customer bases than we have. In some of the target markets for our emerging technologies, we face competition both from products utilizing well-established, existing technologies and other novel or emerging technologies.
Ultracapacitors
Our ultracapacitor products have two types of competitors: other ultracapacitor suppliers and purveyors of energy storage and power delivery solutions based on batteries or other technologies. Although a number of companies are developing ultracapacitor products and technology, our principal competitors in the supply of ultracapacitor or supercapacitor products are Panasonic, a division of Matsushita Electric Industrial Co., Ltd., NessCap Co., Ltd., LS Mtron, part of the LG Group, and Groupe Bollore. In the supply of ultracapacitor electrode material to other ultracapacitor manufacturers, our primary competitor is W.L. Gore & Associates, Inc. The key competitive factors in the ultracapacitor industry are price, performance (energy stored and power delivered per unit volume), durability and reliability, operational lifetime and overall breadth of product offerings. We believe that our ultracapacitor products and electrode material compete favorably with respect to all of these competitive factors.
Ultracapacitors also compete with products based on other technologies, including advanced batteries in power quality and peak power applications, and flywheels, thermal storage and batteries in back-up energy storage applications. We believe that ultracapacitors’ high durability, long life, high performance and value proposition give them a competitive advantage over these alternative choices in many applications. In addition, integration of ultracapacitors with some of these competing products may provide optimized solutions that neither product can provide by itself. For example, a combined solution incorporating ultracapacitors with batteries for engine starting in diesel transit buses was designed by a customer and went into production in 2008.
High-Voltage Capacitors
Maxwell, through its acquisition in 2002 of Montena Components Ltd. (renamed Maxwell Technologies SA) and its CONDIS® line of high-voltage capacitor products, is the world’s largest producer of high-voltage capacitors for use in electric utility infrastructure. Our principal competitors in the high-voltage capacitor markets are in-house production groups of certain of our customers and other independent manufacturers, such as the Coil Product Division of Trench Limited in Canada and Europe and Hochspannungsgeräte Porz GmbH in Germany. We believe that we compete favorably, both as a consistent supplier of highly reliable high-voltage capacitors, and in terms of our expertise in high-voltage systems design. Over the last ten years, our largest customer has transitioned from producing its grading and coupling capacitors internally to outsourcing substantially all of its requirements to us.
Radiation-Mitigated Microelectronic Products
Our radiation-mitigated single-board computers and components compete with the products of traditional radiation-hardened integrated circuit suppliers such as Honeywell Corporation, Lockheed Martin Corporation and BAE Systems. We also compete with commercial integrated circuit suppliers with product lines that have inherent radiation tolerance characteristics, such as National Semiconductor Corporation, Analog Devices Inc. and Temic Instruments B.V. in Europe. Our proprietary radiation-mitigation technologies enable us to provide flexible, high function, cost-competitive, radiation-mitigated products based on the most advanced commercial electronic circuits and processors. In addition, we compete with component product offerings from high reliability packaging houses such as Austin Semiconductor, Inc., White Microelectronics, Inc. and Teledyne Microelectronics, a unit of Teledyne Technologies, Inc.
10
Table of Contents
Research and Development
We maintain active research and development (“R&D”) programs to improve existing products and develop new products. For the year ended December 31, 2009, our research and development expenditures totaled approximately $16.0 million, compared with $14.8 million and $11.3 million in the years ended December 31, 2008 and December 31, 2007, respectively. In general, we focus our research and product development activities on:
| • | designing and producing products that perform reliably for the life of the end products or systems into which they are integrated; |
| • | making our products less expensive to produce so as to improve our profit margins and to enable us to reduce prices so that our products can penetrate new, price-enabled, markets; |
| • | designing our products to have superior technical performance; |
| • | designing new products that provide novel solutions to expand our market opportunities; and |
| • | designing our products to be compact and light. |
Most of our current research, development and engineering activities are focused on material science, including activated carbon, electrolyte, electrically conducting and dielectric materials, ceramics and radiation-tolerant silicon and ceramic composites to reduce cost and improve performance, reliability and ease of manufacture. Additional efforts are focused on product design and manufacturing engineering and manufacturing processes for high-volume manufacturing.
Ultracapacitors
The principal focus of our ultracapacitor development activities is to increase power and energy density, extend operational life and substantially reduce product cost. Our ultracapacitor designs focus on low-cost, high-capacity cells in standard sizes ranging from 10-farads to 3,000-farads, and corresponding multi-cell modules based on those form factors. Since 2005, we have introduced more than 30 new products, with a goal of penetrating key strategic applications at multi-million unit volumes.
High-voltage capacitors
The principal focus of our high-voltage capacitor development efforts is to enhance performance and reliability while reducing the size, weight and manufacturing cost of our products. We also are directing our design efforts to develop high-voltage capacitors for additional applications.
Microelectronic products
The principal focus of our microelectronics product development activities is on circuit design, shielding and other radiation-mitigation techniques that allow the use of powerful commercial silicon components in space and satellite applications that require ultra high reliability. We also focus on creating system solutions that overcome the basic failure mechanisms of individual components through architectural approaches, including redundancy, mitigation and correction. This involves expertise in system architecture, including algorithm and microcode development, circuit design and the physics of radiation effects on silicon electronic components.
Intellectual Property
We place a strong emphasis on inventing proprietary processes and designs that increase the value and uniqueness of our product portfolio. In an effort to assist in protecting this added value and uniqueness, we focus a significant amount of energy on obtaining patents to provide the broadest and strongest possible protection for those products and related technologies. Our ultimate success will depend in part on our ability to protect our
11
Table of Contents
existing patents, secure additional patent protection in a manner that augments our existing patent portfolio and develop new processes and designs not currently claimed by the patents of third parties. As of December 31, 2009, Maxwell and its subsidiaries held 89 issued U.S. patents and 35 pending U.S. patent applications. Of these issued patents, 59 relate to our ultracapacitor products and technology, 5 relate to our high voltage capacitor products and technology, and 25 relate to our microelectronics products and technology. Our subsidiary, PurePulse Technologies, Inc. (“PurePulse”), which suspended operations in 2002, holds 12 issued U.S. patents. Our issued patents have various expiration dates ranging from 2013 to 2028.
Our pending patent applications and any future patent applications may not be allowed. We routinely seek to protect our new developments and technologies by applying for patents in jurisdictions in which we hope to obtain a market advantage, including, most commonly, the United States and the principal countries of Europe and Asia. At present, with the exception of microcode architectures within our radiation-mitigated microelectronics product line, we do not rely on licenses from any third parties to produce our products.
Our existing patent portfolios and pending patent applications relate primarily to:
Ultracapacitors
| • | compositions of the electrode, including its design and fabrication; |
| • | physical cell package designs as well as the affiliated processes used in cell assembly; |
| • | cell-to-cell and module-to-module interconnect technologies that minimize equivalent series resistance and enhance the functionality, performance and longevity of ultracapacitor products; and |
| • | module and system designs that facilitate applications of ultracapacitor technology. |
Microelectronics
| • | system architectures that enable commercial silicon products to be used in radiation-intense space environments; |
| • | technologies and designs that improve packaging densities while mitigating the effect of radiation on commercial silicon; |
| • | radiation-mitigation techniques that improve performance while protecting sensitive commercial silicon from the effects of environmental radiation in space; and |
| • | fault-tolerant computer systems with a plurality of processors which avoid deficiencies typically experienced by similar systems due to ionizing radiation. |
High Voltage Capacitors
| • | manufacture of cells which significantly reduces exposure of internal components to impurities, moisture and other undesired materials which lead to longer manufacturing times and reduced performance characteristics. |
Historically, our high-voltage capacitor products have been based on our know-how and trade secrets rather than on patents. We filed our first patent application covering our high-voltage capacitor technology in 2003, and we continue to pursue patent protection in addition to trade secret protection of certain aspects of our products’ design and production.
Establishing and protecting proprietary products and technologies is a key element of our strategy. Although we attempt to protect our intellectual property rights through patents, trademarks, copyrights, trade secrets and other measures, there can be no assurance that these steps will be adequate to prevent infringement, misappropriation or other misuse by third parties, or will be adequate under the laws of some foreign countries, which may not protect our intellectual property rights to the same extent as do the laws of the U.S.
12
Table of Contents
We use employee and third party confidentiality and nondisclosure agreements to protect our trade secrets and unpatented know-how. We require each of our employees to enter into a proprietary rights and nondisclosure agreement in which the employee agrees to maintain the confidentiality of all our proprietary information and, subject to certain exceptions, to assign to us all rights in any proprietary information or technology made or contributed by the employee during his or her employment with us. In addition, we regularly enter into nondisclosure agreements with third parties, such as potential product development partners and customers, to protect any information disclosed in the pursuit of securing possible fruitful business endeavors.
Financial Information by Geographic Areas
| Year ending December 31, | ||||||||||||||||||
| 2009 | 2008 | 2007 | ||||||||||||||||
| Amount | Percent | Amount | Percent | Amount | Percent | |||||||||||||
| (Dollars in thousands) | ||||||||||||||||||
| Revenues from external customers located in: |
||||||||||||||||||
| United States |
$ | 40,401 | 40 | % | $ | 23,184 | 29 | % | $ | 17,195 | 30 | % | ||||||
| All other countries |
60,914 | 60 | % | 57,255 | 71 | % | 39,513 | 70 | % | |||||||||
| Total |
$ | 101,315 | 100 | % | $ | 80,439 | 100 | % | $ | 56,708 | 100 | % | ||||||
| Long-lived assets: |
||||||||||||||||||
| United States |
$ | 9,990 | 56 | % | $ | 8,870 | 49 | % | $ | 6,153 | 42 | % | ||||||
| Switzerland |
7,804 | 44 | % | 9,285 | 51 | % | 8,483 | 58 | % | |||||||||
| Total |
$ | 17,794 | 100 | % | $ | 18,155 | 100 | % | $ | 14,636 | 100 | % | ||||||
Risks Attendant to Foreign Operations and Dependence
We have substantial operations in Switzerland, and we derive a significant portion of our revenues from sales to customers located outside the U.S. We expect our international sales to continue to represent a significant and increasing amount of our future revenues. As a result, our business will continue to be subject to certain risks, such as foreign government regulations, export controls, changes in tax laws, tax treaties, tariffs and freight rates. Additionally, as a result of our extensive international operations and significant revenue generated outside the U.S., the dollar amount of our current and future revenues, expenses and debt may be materially affected by fluctuations in foreign currency exchange rates. If we are unable to manage these risks effectively, it could impair our ability to increase international sales.
Similarly, assets or liabilities of our consolidated foreign subsidiary that are not denominated in its functional currency are subject to effects of currency fluctuations, which may affect our reported earnings.
Having substantial international operations increases the complexity of managing our financial reporting and internal controls and procedures. In addition, to the extent we are unable to respond effectively to political, economic and other conditions in the countries where we operate and do business, our results of operations and financial condition could be materially adversely affected. Moreover, changes in the mix of income from our foreign subsidiaries, expiration of tax holidays and changes in tax laws and regulations could increase our tax expense.
As a result of our international operations, we are subject to the U.S. Foreign Corrupt Practices Act (“FCPA”), which prohibits companies from making improper payments to foreign officials for the purpose of obtaining or keeping business. As a result of an internal review, we are currently conducting an inquiry into the nature of certain payments made to our former independent sales agent in China with respect to sales of our high voltage capacitor products produced by our Swiss subsidiary. These payments equaled the difference between our quoted price for certain products and the amount that the independent sales agent was able to sell such
13
Table of Contents
products to certain customers in China. These payments had previously been recorded as commissions; however, a portion of those payments may actually have been rebated directly or indirectly to customers. We recorded commissions to the agent of $585,000, $1.8 million and $653,000 for the years ended December 31, 2009, 2008 and 2007, respectively. These commissions were based on sales of $3.1 million, $8.2 million and $3.4 million for the years ended December 31, 2009, 2008 and 2007, respectively. These amounts are recorded as a reduction to revenue for the periods presented. In 2008, these amounts were recorded as commission expense and were included in selling, general and administrative expense in the condensed consolidated statement of operations. This independent sales agent also worked as an independent sales agent for Metar (see Note 13 of Notes to Consolidated Financial Statements, included in Part II, Item 8 of this report). We terminated our relationship with this independent sales agent as of May 20, 2009.
We are in the process of evaluating how these payments should be treated for FCPA purposes, which could harm our business. Our internal review is focused on a thorough examination of all of our international operations and business practices, as well as a review of our compliance programs. We have taken certain remedial actions, including terminating our relationship with the independent sales agent in China as well as terminating our relationship with Metar, which could harm our business.
We have not yet completed our internal review. As we progress, we are voluntarily sharing information related to our internal review with the Securities and Exchange Commission (“SEC”) and Department of Justice (“DOJ”) and have provided certain documents as requested by the SEC in connection with their review of this matter. In the event that our internal review or any governmental investigation identifies violations of law, the DOJ, the SEC or other governmental authorities could seek civil and/or criminal sanctions, including monetary fines and penalties, against the Company and/or its employees, as well as additional changes to our business practices and compliance programs, which could have a material adverse effect on our business, results of operations or financial condition.
In the fourth quarter of 2009 and in connection with our internal review of the matters described above, we recorded an accrual of $9.3 million for the potential settlement with the SEC and DOJ. The amount we recorded was based on our estimation of loss as required under U.S. Generally Accepted Accounting Principles (“GAAP”) and discussions with both government agencies. These discussions have resulted in our estimate of a potential settlement range of $9.3 million to $20.0 million. The top end of the range of $20.0 million represents the combined first offer of settlement recently put forth by the relevant governmental agencies. Discussions with the SEC and DOJ are ongoing in an effort to resolve these matters, but whether agreement can be reached and on what terms, is uncertain. The amount of any disgorgements, penalties and/or fines that we could face depends on a number of eventual factors which are not currently known to us or have not yet been resolved with the relevant government authorities, including findings by relevant authorities regarding the amount, nature and scope of any improper payments, the amount of any pecuniary gain involved, our ability to pay, and the level of cooperation provided to government authorities during the investigations. There can be no assurance that a settlement will be reached at all, or that any final settlement amount will not be more or less than our accrual of $9.3 million. Actual payments to the government agencies in connection with any settlement could have a material adverse effect on our business, results of operations or financial condition.
Backlog
Backlog for continuing operations for the year ended December 31, 2009 was approximately $48.3 million, compared with $38.3 million as of December 31, 2008. Backlog consists of firm orders for products that will be delivered within 12 months.
Significant Customers
Sales to one customer, ABB Ltd., amounted to approximately $9.7 million, or 10%, and $12.1 million, or 15%, of our total revenue for years ended December 31, 2009 and 2008, respectively.
14
Table of Contents
Government Regulation
Due to the nature of our operations and the use of hazardous substances in some of our manufacturing and research and development activities, we are subject to stringent federal, state and local laws, rules, regulations and policies governing workplace safety and environmental protection. These include the use, generation, manufacture, storage, air emission, effluent discharge, handling and disposal of certain materials and wastes. In the course of our historical operations, materials or wastes may have spilled or been released from properties owned or leased by us or on or under other locations where these materials and wastes have been taken for disposal. These properties and the materials and wastes spilled, released, or disposed thereon are subject to environmental laws that may impose strict liability, without regard to fault or the legality of the original conduct, for remediation of contamination resulting from such releases. Under such laws and regulations, we could be required to remediate previously spilled, released, or disposed substances or wastes, or to make capital improvements to prevent future contamination. Failure to comply with such laws and regulations also could result in the assessment of substantial administrative, civil and criminal penalties and even the issuance of injunctions restricting or prohibiting our activities. It is also possible that implementation of stricter environmental laws and regulations in the future could result in additional costs or liabilities to us as well as the industry in general. While we believe we are in substantial compliance with existing environmental laws and regulations, we cannot be certain that we will not incur substantial costs in the future.
In addition, certain of our microelectronics products are subject to International Traffic in Arms export regulations when they are sold to customers outside the U.S. We routinely obtain export licenses for such product shipments outside the U.S.
Employees
As of December 31, 2009, we had 361 employees in four countries, as follows: 170 full-time, 3 part-time and 28 temporary employees in the U.S., 120 full-time, 10 part-time and 17 temporary employees in Switzerland, 10 full-time employees in China and 3 full-time employees in Germany. We believe that approximately 30 percent of our employees in Switzerland are members of a labor union. Swiss law prohibits employers from inquiring into the union status of employees. We consider our relations with our employees to be good.
Available Information
We file annual, quarterly and special reports, proxy statements and other information with the Securities and Exchange Commission (SEC). Our SEC filings are available free of charge to the public over the Internet at the SEC’s website at http://www.sec.gov. Our SEC filings are also available free of charge on our website at http://www.maxwell.com as soon as reasonably practicable following the time that they are filed with the SEC. You may also read and copy any document we file with the SEC at the SEC’s Public Reference Room at 450 Fifth Street, NW, Washington, DC 20549. You may obtain information on the operation of the Public Reference Room by calling the SEC at 1-800-SEC-0330. The information found on our website is not part of this or any report that we file with the SEC.
Facilities
Our San Diego headquarters and principal manufacturing and marketing facility occupies approximately 45,000 square feet under a lease that expires in July 2015. We also occupy a 16,500-square-foot research and development annex in San Diego under a renewable lease that expires in November 2010. In addition, we lease research, manufacturing and marketing facilities occupying 68,620 square feet in Rossens, Switzerland, under a renewable lease that expires in December 2014 and we have an additional 5 year option thereafter. We believe that we have sufficient floor space to support forecast increases in production volume and, therefore, that our facilities are adequate to meet our needs for the foreseeable future.
15
Table of Contents
| Item 1A. | Risk Factors |
An investment in our common stock involves a high degree of risk. Our business, financial condition and results of operations could be seriously harmed if potentially adverse developments, some of which are described below, materialize and cannot be resolved successfully. In any such case, the market price of our common stock could decline and you may lose all or part of your investment in our common stock.
The risks and uncertainties described below are not the only ones we face. Additional risks and uncertainties, including those not presently known to us or that we currently deem immaterial, may also result in decreased revenues, increased expenses or other adverse impacts that could result in a decline in the price of our common stock. You should also refer to the other information set forth in this Annual Report on Form 10-K, including our consolidated financial statements and the related notes.
We have a history of losses and we may not achieve or maintain profitability in the future, which may decrease the market value of our common stock.
We have a history of losses and cannot predict with certainty when we may become profitable, if ever. Even if we do achieve profitability, we may experience significant fluctuations in our revenues and we may incur net losses from period to period as a result of a number of factors, including but not limited to the following:
| • | the amounts invested in developing, manufacturing and marketing our products in any period as compared with the volume of sales of those products in the same period; |
| • | increasing number of competitors and resulting price competition; |
| • | inability to manufacture our products at a level that supports adequate profit margins; |
| • | fluctuations in demand for our products by our OEM customers; |
| • | the timing of our product introductions may lag behind those of our competitors; |
| • | negative impacts resulting from acquisitions we have made or may make; and |
| • | future changes in financial accounting standards or practices. |
In addition, we incur significant costs developing and marketing products based on new technologies and, in order to increase our market share, we have sold, and may in the future sell, our products at profit margins below those we ultimately expect to achieve.
Our growth is subject to a number of economic risks which are beyond our reasonable control.
Financial markets in the United States, Europe and Asia have been experiencing disruption, including, among other things, volatility in securities prices, diminished liquidity and credit availability, ratings downgrades of certain investments and declining valuations of others. Governments have taken unprecedented actions intended to address extreme market conditions such as severely restricted credit and depreciated real estate values. While these market conditions have not impaired our ability to access credit markets and finance our operations, there can be no assurance that there will not be a further deterioration in financial markets and confidence in major economies such that our ability to access credit markets and finance our operations might be impaired. Although our total revenues continued to improve in 2009, the current tightening of credit in financial markets could adversely affect the ability of customers and suppliers to obtain financing for significant purchases and operations and could result in a decrease in or cancellation of orders for our products and services by customers or an increase in operational costs passed along to us by our suppliers. Our global business can also be adversely affected by decreases in the general level of economic activity, such as decreases in business and consumer spending, construction activity, financial strength of customers and government procurement. As a consequence of operating our business in varying currencies, changes in the rate of exchange for the U.S. Dollar against certain major currencies such as the Euro, the Swiss Franc and other currencies may also adversely affect
16
Table of Contents
our results. We are unable to predict the duration and severity of the current disruption in financial markets and the adverse economic conditions that might occur in the U.S. and other countries and the effect such events might have on our business.
We might require additional capital to support business growth and operations, and this capital might not be available.
We intend to continue to make investments to support our business growth and operations and may require additional funds to respond to business challenges, including the need to develop new products or enhance our existing products, enhance our operating infrastructure, complete our development activities, continue manufacturing at cost levels that support adequate profit margins and possibly acquire complementary businesses and technologies. In the future we may need to engage in equity or debt financings to secure additional funds to support our operations and investments in new products, if we are unable to finance such activities from the proceeds of our continuing operations.
If we raise additional funds through issuances of equity or other transactions involving securities exercisable or convertible into our equity securities, our existing stockholders could suffer significant dilution, and any new equity securities we issue could have rights, preferences and privileges superior to those of holders of our common stock. Further, any debt financing may involve restrictive covenants on the company.
We face risks selling products internationally which are or may become regulated by the US Government.
Some of our products, including primarily our radiation mitigated microelectronic products, are designated a defense article under various Categories of the United States Munitions List thereby regulated by the International Traffic in Arms Regulations (ITAR) which subject the products and associated technology to the export licensing jurisdiction of the Department of State in accordance with the ITAR (22 CFR 120 through 130). This means that all international sales of these controlled products require export licensing, which makes our business more complex and may impact sales as follows: a) approval of the export license may or may not be granted, the latter of which results in a loss of the anticipated sale, b) the time between the receipt of an order and shipment of product may be increased, and c) sales could be reduced or lost entirely due to a customer’s preference of using non-ITAR regulated products. We continue to review the status of our products and their end use applications to determine if additional products will fall within the restrictions of the export control laws and, as such, more products may be subject to the above impacts if such restrictions apply. Additionally, we may be subject to new regulations that might impact sales of products that we sell internationally or domestically.
A small number of customers account for a significant portion of our revenues.
We expect that a small number of customers will continue to account for a large portion of our revenues for the foreseeable future. For example, we have one customer, ABB Ltd., which accounted for approximately 10% of our revenues in 2009. If our relationships with such large customers are disrupted, we could lose a significant portion of our anticipated revenue. Factors that could influence our relationships with our customers include:
| • | our ability to sell our products at prices that are competitive with competing suppliers; |
| • | our ability to maintain features and quality standards for our products sufficient to meet the expectations of our customers; |
| • | our ability to produce and deliver a sufficient quantity of our products in a timely manner to meet our customers’ requirements; and |
| • | our financial condition and perceived viability as a long term supplier. |
17
Table of Contents
Foreign currency exchange fluctuation risk.
As a result of our extensive international operations and significant international revenue, both of which may be transacted in U.S. Dollars and foreign currencies, the U.S. Dollar amount of our current revenues, future revenues, expenses and debt may be materially affected by fluctuations in foreign currency exchange rates. If we are unable to manage these risks effectively, it could have a substantial impact on our consolidated financial position, results of operations and cash flow.
Our large cell ultracapacitors may not gain widespread technological acceptance, which would adversely impact our growth opportunities, and our overall business prospects.
We have designed our large cell ultracapacitor products primarily for use in transportation and industrial applications. Currently, most of the major automotive companies are testing and developing alternative power sources to support the power requirements of hybrid drive systems. We believe our ultracapacitors provide an innovative alternative power solution for such applications and we are currently collaborating technically with several automotive suppliers and auto companies regarding designing our ultracapacitors into their future products for these purposes. However, there are other competing technologies such as advanced batteries, compressed gas and hydrolytic fluids some of which have already been established as technologically viable alternatives. Furthermore, there are other ultracapacitors currently sold by other companies which may possess performance characteristics which are on par with or exceed the specification and quality of our ultracapacitor products. We believe that the long-term success of our ultracapacitor products will be determined by our ability to outperform competing technologies, resulting in our ultracapacitors being designed into automotive electrical systems and the next generation of hybrid drive systems. If our ultracapacitor products fail to achieve commercial acceptance in the automotive and other transportation and industrial applications, our future revenues and growth opportunities will be adversely impacted and our overall business prospects will be significantly impaired.
We may not be able to develop and market our products successfully, and thus may not be able to achieve or maintain profitability in the future.
If we are unable to develop and market our products successfully, we may not achieve or maintain profitability. In recent years, we have introduced many of our products into commercial markets and, upon such introductions, we also must demonstrate our capabilities as a reliable supplier of these products. Some of our products are alternatives to established products or provide capabilities that do not presently exist in the marketplace. Our products are sold in highly competitive and rapidly changing markets. The success of our products is significantly affected by their cost, technology standards, performance and reliability and end-user preferences. The success of our products also depends on a number of factors, including our ability to:
| • | maintain engineering and marketing staffs sufficiently skilled to identify market opportunities and design the corresponding new products; |
| • | identify and develop attractive markets for our new products and technologies and accurately anticipate demand; |
| • | utilize appropriate sales and distribution channels; |
| • | develop and manufacture new products that we can sell at competitive prices while maintaining adequate profit margins; |
| • | deliver products that meet our customers’ requirements for quality and reliability; |
| • | increase our manufacturing capacity and improve manufacturing efficiency to meet our customer demands while maintaining quality and performance; |
| • | respond to technological changes by successfully improving our existing products and technologies; |
| • | demonstrate that our products have technological and/or economic advantages over competing or alternative products; |
18
Table of Contents
| • | react to and distinguish ourselves from competitors that are more experienced, have significantly greater resources and have a larger base of customers; and |
| • | secure required raw materials in sufficient quantities and at prices required to manufacture and deliver competitive products. |
If we are unable to secure qualified and adequate sources for our materials, components and sub-assemblies, we may not be able to make our products at competitive costs and we may have difficulty meeting customer demand, which could damage our relationships with our customers.
Our ability to manufacture products depends in part on our ability to secure qualified and adequate sources of materials, components and sub-assemblies at prices that enable us to make our products at competitive costs. Some of our suppliers are currently the sole source of one or more items that we need to manufacture our products. Although we seek to reduce our dependence on sole and limited source suppliers, the partial or complete loss of or delay in delivery from these sources could have at least a temporary adverse effect on our business and results of operations and could potentially damage customer relationships if an interruption of or delay in business occurs. Such risks have materialized in the past and there can be no assurance that such supply problems will not recur in the future.
Our product lines may be subject to increased competition, and this may limit our ability to increase or maintain our profit margins.
Market acceptance of our products depends on competitive factors, many of which are beyond our control. Competition in our markets is intense and has been accentuated by the rapid pace of technological development. Our competitors include large fully-integrated companies with substantial financial and other resources. Many of our competitors have substantially greater research and development capabilities and financial, manufacturing, technological, marketing and sales resources than we do, as well as more experience in research and development, product testing, manufacturing, marketing and sales. These organizations also compete with us to:
| • | attract parties for collaborations or joint ventures; |
| • | license proprietary technology that is competitive with our technology; and |
| • | attract and hire scientific, engineering and marketing talent. |
Our competitors may succeed in developing and commercializing products earlier than we do. Our competitors may also develop products or technologies that are superior to or lower in cost than ours, thus rendering our products, product candidates or technology obsolete or non-competitive. We may not be able to develop, fund or invest in one or more of our product lines to the same degree or as quickly as these competitors do. If our competitors develop and commercialize products faster than we do, or commercialize products that are superior to or at a lower cost than our products, our commercial opportunities may be reduced or eliminated. If we cannot successfully compete with new or existing products, our sales and revenue would suffer and we may never become profitable.
If our OEM customers fail to purchase our products or to sell sufficient quantities of their products incorporating our products, or if our OEM customers’ sales timing and volume fluctuates, it could prevent us from achieving our sales and market share goals.
Sales to a relatively small number of OEM customers, as opposed to direct retail sales to end customers, make up a large portion of our revenues. For example, we have one customer, ABB Ltd., which accounted for approximately 10% of our revenue in 2009. Our ability to make sales to OEM customers depends on our ability to compete on price, delivery and quality. The timing and volume of these sales depend upon the sales levels and shipping schedules for the products into which our OEM customers incorporate our products. Thus, even if we develop a successful component in sufficient volume and appropriate costs, our sales will not increase unless the
19
Table of Contents
product into which our component is incorporated is commercially successful. If our OEM customers fail to sell a sufficient quantity of products incorporating our components, or if the OEM customers’ sales timing and volume fluctuate, it could prevent us from achieving our sales targets and negatively impact our market share. Our OEM customers typically require a long development and engineering process before incorporating our products into their systems and products. This period of time is in addition to the time we spend on basic research and product development. As a result, we are vulnerable to changes in technology or end user preferences.
Our opportunity to sell our products to our OEM customers typically occurs at infrequent intervals, depending on when the OEM customer designs a new product or enhances an existing one. If we are not aware of an OEM’s product development schedule, or if we cannot provide components or technologies at the time that they are developing their products, we may miss sales opportunities that may not reappear for some time.
We may face product liability or warranty claims, either directly or indirectly through our customers, and we have limited experience with some of our products as to our potential liability.
We offer our customers a warranty for our products. Defects in our products could, in turn, lead to defects in our customers’ products that incorporate our products. Defects in our products could give rise to warranty claims against us or to liability for damages including, in certain circumstances, liability for consequential damages. For example, as described elsewhere in this 10-K, in 2005 a customer brought to our attention a possible defect in a product that was produced for Maxwell under contract by another manufacturer and resold to the customer. Maxwell is currently a party to a legal proceeding in Germany that will determine whether or not a defect existed. In the event that it is determined that a defect did exist, Maxwell and/or the manufacturer could be liable to the customer for damages. Defects in our products could also impair market acceptance of our products. Any of these events could have a material adverse effect on our business and financial condition. We have limited experience with some of our products in evaluating the potential liability that could be created by claims under our warranties. If the claims made under such warranties exceed our warranty reserves, our results of operations and financial condition could be materially adversely affected. Additionally, warranty periods in some foreign countries are mandated by law. Changes in such laws may affect the adequacy of our warranty reserves.
A prolonged economic downturn could materially harm our business.
Any negative trends in the general economy, including trends resulting from actual or threatened military action by the United States and threats of terrorist attacks in the United States and abroad, could cause a decrease in capital spending in the markets we serve. In particular, the current economic downturn affecting the automotive industry, as well as a downward cycle affecting the transportation, industrial, electric utility or aerospace markets would likely result in reduced demand for our products. In addition, if our customers’ own markets and financial performance decline, we may not be able to collect outstanding amounts due to us. Any such circumstances could harm our consolidated financial position, results of operations and cash flows.
If we are unable to protect our intellectual property adequately, such as in the Peoples Republic of China (PRC), we could lose our competitive advantage in the industry segments in which we do business.
Our success depends in part on establishing and protecting our intellectual property rights. If we are unable to protect our intellectual property adequately, we could lose our competitive advantage in the industry segments in which we do business. Although we protect our intellectual property rights through patents, trademarks, copyrights, trade secrets, contracts and other measures, these steps may not prevent infringement, misappropriation or other misuse by third parties. We have taken steps to protect our intellectual property rights under the laws of certain foreign countries, but our efforts may not be effective to the extent that foreign laws are not as protective as the laws of the U.S. For example, we have licensed technology related to our patented ultracapacitor products to companies located in the PRC. Patent and other intellectual property rights have been traditionally less enforceable in the PRC than in the United States. In addition, we face the possibility that third parties may reverse engineer our products to discover how they work and how they are designed and introduce competing products, or that third parties might independently develop products and intellectual property similar to ours.
20
Table of Contents
We have increased our emphasis on protecting our technologies and products through patents. Our success depends on maintaining our patents, adding to them where appropriate, and developing products and applications without infringing the patent and proprietary rights of others. The following risks, among others, are involved in protecting our patents:
| • | our patents may be circumvented or challenged and held unenforceable or invalid; |
| • | our pending or future patent applications may not be issued in a timely manner and may not provide the protections we seek; and |
| • | others may claim rights in the patented and other proprietary technology that we own or license. |
If our patents are invalidated or if it is determined that we, or the licensor of a patent, do not hold sole rights to such patent, we could lose our competitive advantage in the industry segments in which we do business.
Competing research and patent activity in our product areas is substantial. For example, in October 2006, we filed a lawsuit alleging infringement of four of our patents by NessCap, a Korean competitor, and in December 2006, NessCap filed a lawsuit alleging that one of our products infringes one of NessCap’s patents. We have since settled these lawsuits. Although we do not believe that our products or proprietary rights infringe third parties’ rights, infringement claims may be asserted against us in the future. If we are forced to bring such claims or are subject to such claims by others, we face time-consuming, costly litigation that could potentially result in product shipment delays, damage payments or injunctions that could prevent us from making, using or selling infringing products. In addition, such litigation increases our operating expenses and adversely impacts our operating results. We may also be required to enter into royalty or licensing agreements which include unfavorable terms as part of a judgment or settlement, all of which could negatively impact the amount of revenue derived from our products or proprietary rights.
Our reputation and ability to enter into alliances or other strategic arrangements may affect our success.
Our reputation is important to our growth and success. Since we have licensed our technology to others, our reputation may be affected by the performance of the companies to which we have licensed our technology. Our licenses may grant exclusivity with respect to certain uses or geographic areas. For example, we have granted licenses to YEC in Taiwan and Shanghai Sanjiu in China to manufacture and sell products based on our proprietary ultracapacitor designs. As a result, we will be dependent in part on the success of these licensees for success in China. We anticipate that future alliances may also be with foreign partners or entities. As a result, such future alliances may be subject to the political climate and economies of the foreign countries where such partners reside and operate. We cannot be certain that our alliance partners will provide us with the support we anticipate, that such alliances or other relationships will be successful in developing our technology for use with their intended products, or that any alliances or other relationships will be successful in manufacturing and marketing their products. Our international operations also are subject to certain external business risks such as exchange rate fluctuations, political instability or significant weakening of a local economy in which a foreign entity with which we have an affiliation operates or is located. Certain provisions of alliance agreements that are for our benefit may be subject to restrictions in foreign laws that limit our ability to enforce such contractual provisions. If these alliances are not successful our business and prospects could be negatively affected.
We face risks associated with marketing, distribution and sale of our products internationally and, if we are unable to manage these risks effectively, it could impair our ability to increase sales.
We derive a significant portion of our revenues from sales to customers located outside the U.S. We expect international sales to continue to represent a significant and increasing portion of our future revenue. As a result, our business will continue to be subject to certain risks, such as foreign government regulations, export controls, changes in tax laws, tax treaties, tariffs, freight rates and timely and accurate financial reporting from our international subsidiary.
21
Table of Contents
Additionally, as a result of our extensive international operations and significant revenue generated outside the U.S., the dollar amount of our current and future revenues, expenses and debt may be materially affected by fluctuations in foreign currency exchange rates. If we are unable to manage these risks effectively, it could impair our ability to increase international sales.
Similarly, assets or liabilities of our consolidated foreign subsidiary that are not denominated in its functional currency are subject to effects of currency fluctuations, which may affect our reported financial results.
We have substantial operations in Switzerland. Having substantial international operations increases the difficulty of managing our financial reporting and internal controls and procedures. In addition, to the extent we are unable to respond effectively to political, economic and other conditions in the countries where we operate and do business, our results of operations and financial condition could be materially adversely affected. Moreover, changes in the mix of income from our foreign subsidiaries, expiration of tax holidays and changes in tax laws and regulations could increase our tax expense.
If we are unable to attract and retain key personnel, we could lose our technological and competitive advantage in some product areas and business segments.
Since many of our products employ emerging technologies, our success depends upon attracting and retaining key technical and management personnel. Some of our scientists and engineers are the key developers of our products and technologies and are recognized as leaders in their area of expertise. The loss of such personnel could threaten our technological and competitive advantage in some product areas and product lines.
Our performance also depends on our ability to identify, hire, train, retain and motivate qualified personnel, especially key executives, operations staff and highly skilled engineers. The industries in which we compete are characterized by a high level of employee mobility and aggressive recruiting of skilled personnel in a highly competitive employment market. All of our employees are “at will” and thus may terminate their employment with us at any time.
Our ability to increase market share and sales depends on our ability to hire, train and retain qualified marketing and sales personnel.
Because many of our products are new, we have limited experience marketing and selling them. To sell our products, our marketing and sales personnel must demonstrate the advantages of our products over competing products, and we must be able to demonstrate the value of new technology in order to sell new products to existing and new customers. The highly technical nature of the products we offer requires that we attract and retain qualified marketing and sales personnel, and we may have difficulty doing that in a highly competitive employment market. Also, as part of our sales and marketing strategy, we enter into arrangements with distributors and sales representatives to sell our products, and it is possible that our arrangements with outside distributors and sales representatives may not be successful.
Our business and operations would suffer in the event of system failures.
Despite the implementation of security measures, redundancy and backup, our internal information technology networking systems are vulnerable to damages from computer viruses, unauthorized access, energy blackouts, natural disasters, terrorism, war and telecommunication failures. Additionally, from time to time, we install new or upgraded business management systems. To the extent such systems fail or are not properly implemented, we may experience material disruption to our business, including our ability to report operating results on a timely basis.
22
Table of Contents
Changes to existing accounting pronouncements or taxation rules or practices may affect how we conduct our business and affect our reported results of operations.
Changes in accounting pronouncements or taxation rules or practices can have a significant effect on our reported results and may even affect our reporting of transactions completed before the change is effective. Also, changes from U.S. GAAP to International Financial Reporting Standards, and varying interpretations of accounting pronouncements or taxation practice have occurred and may occur in the future. Changes to existing rules, future changes, if any, or the questioning of current practices may adversely affect our reported financial results or the way we conduct our business.
Compliance with changing regulations of corporate governance and public disclosure may result in additional expenses.
Changing laws, regulations and standards relating to corporate governance and public disclosure, including the Sarbanes-Oxley Act of 2002, new SEC regulations and NASDAQ Global Market rules, have created significant additional expenses for public companies. We are committed to maintaining high standards of corporate governance and public disclosure. As a result, our efforts to comply with evolving laws, regulations and standards have resulted in, and are likely to continue to result in, significantly increased general and administrative expenses and diversion of management time to such compliance activities. Our efforts to comply with section 404 of the Sarbanes-Oxley Act of 2002 and the related regulations have required significant effort and resources, and resulted in significant cost to us. These efforts and expense are further increased because of our substantial international operations.
Anti-takeover provisions in our certificate of incorporation and bylaws could prevent certain transactions and could make a takeover more difficult.
Some provisions in our certificate of incorporation and bylaws could make it more difficult for a third party to acquire control of us, even if such change in control would be beneficial to our stockholders. We have a classified board of directors, which means that our directors are divided into three classes that are elected to three-year terms on a staggered basis. Since the three year terms of each class overlap the terms of the other classes of directors, the entire board of directors cannot be replaced in any one year. Furthermore, our certificate of incorporation contains a “fair price provision” which may require a potential acquirer to obtain the consent of our board to any business combination involving us.
The provisions of our certificate of incorporation and bylaws could delay, deter or prevent a merger, tender offer, or other business combination or change in control involving us that stockholders might consider to be in their best interests. This includes offers or attempted takeovers that could result in our stockholders receiving a premium over the market price for their shares of our common stock.
Our common stock experiences limited trading volume and our stock price has been volatile.
Our common stock is traded on the NASDAQ Global Market. The trading volume of our common stock each day is relatively low. This means that sales or purchases of relatively small blocks of stock can have a significant impact on the price at which our stock is traded. We believe that factors such as quarterly fluctuations in financial results, announcements of new technologies impacting our products, announcements by competitors or changes in securities analysts’ recommendations could cause the price of our stock to fluctuate substantially. These fluctuations, as well as general economic conditions such as recessions or higher interest rates, may adversely affect the market price of our common stock.
23
Table of Contents
If the investors in our December 2005 financing convert their notes or exercise their warrants, it will have a dilutive effect upon our stockholders.
In December 2005 we issued notes and warrants to an institutional investor. Pursuant to the terms of the notes, the holders of such notes may convert the notes into shares of common stock at any time prior to their maturity at the conversion price (currently $16.22 per share), subject to adjustment upon specified events, including a price-based weighted average anti-dilution provision, and further subject to adjustment for stock splits, combinations or similar events specified in the notes. Subject to certain conditions, we can automatically convert the notes into our common stock at the conversion price. Unless our shares of common stock trade at or above a weighted-average price of 115% of the original conversion price ($19.00 per share), we will be obligated to repay equal portions of the principal amount outstanding under the notes on a quarterly basis beginning two (2) years after the date of original issuance, provided that the holder may defer the receipt of any such payment for a period of up to two (2) years. As part of the transaction, we also issued to such investors warrants to purchase up to an additional 430,540 shares of our common stock at the conversion price, subject to anti-dilution provisions similar to the provisions set forth in the notes, and further subject to adjustment for stock splits, combinations or similar events. The warrants became exercisable immediately after the closing date of the private placement and expire in December 2010. If the investor converts the notes or exercises the warrants, we will issue shares of our common stock and such issuances will be dilutive to our stockholders. Because the conversion price may be adjusted from time to time in accordance with the provisions of the notes and the warrants, the number of shares that could actually be issued may be greater than the amount described above. In addition, if such institutional investors or our other stockholders sell substantial amounts of our common stock in the public market during a short period of time, our stock price may decline significantly.
We substantially increased our outstanding indebtedness with the issuance of certain subordinated convertible notes and we will be required to repay the outstanding balance in 2011.
In December 2005 we issued notes in the aggregate principal amount of $25 million in a private placement to an institutional investor, of which $8.3 million in principal amount remains outstanding. The notes accrue interest at a per annum rate equal to the Federal Funds Rate (as defined in the notes) plus 1.125%, subject to adjustment, with accrued interest payable quarterly. By issuing the notes we increased our indebtedness substantially. In addition, the holders of the notes have imposed certain restrictive covenants, including limits on our future indebtedness and limits on our ability to incur future liens and make certain restricted payments. Upon a change of control (as defined in the notes), the holders of the notes will have certain redemption rights. An event of default would occur under the notes for a number of reasons, including our failure to pay when due any principal, interest or late charges on the notes, certain defaults on our indebtedness, certain events of bankruptcy and our breach or failure to perform certain representations and obligations under the notes. Upon the occurrence of an event of default, our obligations under the notes may become due and payable in accordance with the terms thereof.
As a result, the issuance of the notes may or will:
| • | make it more difficult for us to obtain financing in the future for working capital, capital expenditures or other purposes; |
| • | make it more difficult for us to be acquired; |
| • | require us to dedicate a substantial portion of our cash flow from operations and other capital resources to debt service; |
| • | limit our flexibility in planning for, or reacting to, changes in our business; and |
| • | make us more vulnerable in the event of a downturn in our business or industry conditions. |
24
Table of Contents
Our credit agreements contain various restrictions and covenants that limit management’s discretion in the operation of our business and could limit our ability to grow and compete.
The credit agreements governing our bank credit facilities contain various provisions that limit our ability to:
| • | incur additional debt; |
| • | make loans, pay dividends and make other distributions; |
| • | create certain liens on, or sell, our assets; |
| • | merge or consolidate with another corporation or entity, or enter into other transactions outside the ordinary course of business; and |
| • | make certain changes in our capital structure. |
These provisions restrict management’s ability to operate our business in accordance with management’s discretion and could limit our ability to grow and compete. Our credit agreements also require us to comply with certain financial covenants and ratios. If we fail to comply with any such financial covenants or ratios, or otherwise default under our credit agreements, the lenders under such agreements could:
| • | accelerate and declare all amounts borrowed to be immediately due and payable, together with accrued and unpaid interest; and |
| • | terminate their commitments, if any, to make further extensions of credit to us and/or attempt to secure collateral. |
In the event that amounts due under our credit agreements are declared immediately payable, we may not have, or be able to obtain, sufficient funds to make such accelerated payments.
We may not be able to obtain sufficient capital to meet potential customer demand or corporate needs, which could require us to change our business strategy and result in decreased profitability and a loss of customers.
We believe that in the future we will need a substantial amount of additional capital for a number of purposes, including the following:
| • | to meet potential production volumes for our products, particularly our ultracapacitors, which may require high-speed automated production lines to achieve targeted customer volume and price requirements; |
| • | to expand our manufacturing capabilities and develop viable outsource partners and other production alternatives; |
| • | to fund our continuing expansion into commercial markets and compete effectively in those markets; |
| • | to develop new technology and cost effective solutions in our business; and |
| • | to acquire new or complementary businesses, product lines and technologies. |
During 2007, we raised approximately $26.6 million (net of offering expenses) through the sale of our common stock pursuant to a shelf registration statement on Form S-3. In August 2008, we entered into an Equity Distribution Agreement (“EDA”) with UBS Securities LLC (“UBS”). The EDA provides that we may offer and sell shares of our common stock, par value $0.10 per share, having an aggregate offering price of up to $15 million. During 2008, we raised approximately $5.6 million (net of commissions) under the EDA. During 2009, we raised approximately $18.6 million (net of offering expenses) through the sale of our common stock pursuant to a shelf registration statement on Form S-3 and $2.4 million (net of commissions) under the EDA. We have currently suspended any further sales under the EDA. There can be no assurance that additional financing will be
25
Table of Contents
available to us on acceptable terms or at all. If adequate funds are not available when needed, we may be required to change or delay our planned growth, which could result in decreased revenues, profits and a loss of customers. The issuance of additional shares will result in dilution of our current stockholders. Further, if additional financing is accomplished by the issuance of debt, the service cost, or interest, will reduce net income or increase net losses and may also require the issuance of additional warrants to purchase shares of common stock.
The issuance of shares of our common stock could result in the loss of our ability to use our net operating losses.
As of December 31, 2009, we had approximately $237 million of federal tax and state tax net operating loss carryforwards. Realization of any benefit from our tax net operating losses is dependent on: 1) our ability to generate future taxable income and 2) the absence of certain future “ownership changes” of our common stock. An “ownership change,” as defined in the applicable federal income tax rules, would place significant limitations, on an annual basis, on the use of such net operating losses to offset any future taxable income we may generate. Such limitations, in conjunction with the net operating loss expiration provisions, could effectively eliminate our ability to use a substantial portion of our net operating losses to offset any future taxable income. The issuance of shares of our common stock could cause an “ownership change.” Such transactions include the issuance of shares of common stock upon future conversion or exercise of outstanding options, warrants and convertible preferred stock.
Our international operations are subject to the U.S. Foreign Corrupt Practices Act, or FCPA. If we fail to comply with the laws and regulations thereunder we could be subject to civil and/or criminal penalties.
As a result of our international operations, we are subject to the FCPA, which prohibits companies from making improper payments to foreign officials for the purpose of obtaining or keeping business. As a result of an internal review, we are currently conducting an inquiry into the nature of certain payments made to our former independent sales agent in China with respect to sales of our high voltage capacitor products produced by our Swiss subsidiary. These payments equaled the difference between our quoted price for certain products and the amount that the independent sales agent was able to sell such products to certain customers in China. These payments had previously been recorded as commissions; however, a portion of those payments may actually have been rebated directly or indirectly to customers. We recorded commissions to the agent of $585,000, $1.8 million and $653,000 for the years ended December 31, 2009, 2008 and 2007, respectively. These commissions were based on sales of $3.1 million, $8.2 million and $3.4 million for the years ended December 31, 2009, 2008 and 2007, respectively. These amounts are recorded as a reduction to revenue for the periods presented. In 2008, these amounts were recorded as commission expense and were included in selling, general and administrative expense in the condensed consolidated statement of operations. This independent sales agent also worked as an independent sales agent for Metar (see Note 13 of Notes to Consolidated Financial Statements, included in Part II, Item 8 of this report). We terminated our relationship with this independent sales agent as of May 20, 2009.
We are in the process of evaluating how these payments should be treated for FCPA purposes, which could harm our business. Our internal review is focused on a thorough examination of all of our international operations and business practices, as well as a review of our compliance programs. We have taken certain remedial actions, including terminating our relationship with the independent sales agent in China as well as terminating our relationship with Metar, which could harm our business.
We have not yet completed our internal review. As we progress, we are voluntarily sharing information related to our internal review with the Securities and Exchange Commission (“SEC”) and Department of Justice (“DOJ”) and have provided certain documents as requested by the SEC in connection with their review of this matter. In the event that our internal review or any governmental investigation identifies violations of law, the DOJ, the SEC or other governmental authorities could seek civil and/or criminal sanctions, including monetary fines and penalties, against the Company and/or its employees, as well as additional changes to our business practices and compliance programs, which could have a material adverse effect on our business, results of operations or financial condition.
26
Table of Contents
In the fourth quarter of 2009 and in connection with our internal review of the matters described above, we recorded an accrual of $9.3 million for the potential settlement with the SEC and DOJ. The amount we recorded was based on our estimation of loss as required under U.S. Generally Accepted Accounting Principles (“GAAP”) and discussions with both government agencies. These discussions have resulted in our estimate of a potential settlement range of $9.3 million to $20.0 million. The top end of the range of $20.0 million represents the combined first offer of settlement recently put forth by the relevant governmental agencies. Discussions with the SEC and DOJ are ongoing in an effort to resolve these matters, but whether agreement can be reached and on what terms, is uncertain. The amount of any disgorgements, penalties and/or fines that we could face depends on a number of eventual factors which are not currently known to us or have not yet been resolved with the relevant government authorities, including findings by relevant authorities regarding the amount, nature and scope of any improper payments, the amount of any pecuniary gain involved, our ability to pay, and the level of cooperation provided to government authorities during the investigations. There can be no assurance that a settlement will be reached at all, or that any final settlement amount will not be more or less than our accrual of $9.3 million. Actual payments to the government agencies in connection with any settlement could have a material adverse effect on our business, results of operations or financial condition.
| Item 1B. | Unresolved Staff Comments |
None.
| Item 2. | Properties |
We have ongoing operations in San Diego, California and Rossens, Switzerland. Our San Diego headquarters and principal research, manufacturing and marketing facility occupies approximately 45,000 square feet under a renewable lease that expires in July 2015. We also occupy a 16,500-square-foot production annex in San Diego under a renewable lease that expires in November 2010. In addition, we lease research, manufacturing and marketing facilities occupying 68,620 square feet in Rossens, Switzerland, under a renewable lease that expires in December 2014 and we have an additional 5 year option thereafter. We believe that we have sufficient floor space to support forecasted increases in production volume and, therefore, that our facilities are adequate to meet our needs for the foreseeable future.
Over the past several years, we have made substantial capital investments to outfit and expand our internal production facilities and incorporate mechanization and automation techniques and processes. We have trained our manufacturing personnel in the necessary operational techniques. With the completion of certain upgrades in 2007, and other upgrades and capacity expansions currently underway, along with our contract manufacturing relationships with Belton Technology Group and Tianjin Lishen Battery Joint-Stock Co. Ltd. in China, we believe that we have sufficient capacity to meet near-term demand for all of our product lines.
| Item 3. | Legal Proceedings |
NessCap—Patent Infringement
In October 2006, Maxwell filed a patent infringement lawsuit against NessCap in the United States District Court for the Southern District of California seeking monetary damages and an injunction to stop NessCap’s sales of infringing products based on four of Maxwell’s patents. In December 2006, NessCap filed a lawsuit against Maxwell in the United States District Court in the District of Delaware claiming Maxwell products infringe NessCap’s patented intellectual property. Maxwell moved for an alternate forum and the lawsuit was transferred to the same district court in San Diego where Maxwell’s patent claims against NessCap are pending. Maxwell subsequently filed a motion for summary judgment asserting non-infringement of NessCap’s patents and a hearing was held in November, 2007. In December, 2007, the Court denied Maxwell’s motion for summary judgment, deciding instead to wait until the Court considers additional briefs on the issue of patent claim interpretation. The Court held a claim construction hearing and subsequently issued its ruling in April, 2008. In February 2009, the Company entered into a definitive settlement agreement with NessCap Co., Ltd., and
27
Table of Contents
NessCap, Inc. (“NessCap”). In the settlement agreement, Maxwell and NessCap agreed to release all claims against each other on issues related to the lawsuit and agreed to a ten year, worldwide cross license of certain patent rights of each company. Following the execution of the definitive settlement agreement, the matters were formally concluded by dismissing all pending matters in both the District Court and the United States Court of Appeals. As part of the settlement agreement, NessCap must pay $1 million to Maxwell in annual installments of $200,000 through 2013. During the case the Company capitalized patent legal defense costs as additional costs of the patents and is now amortizing these capitalized costs over the remaining lives of these patents. Payments received from NessCap under this settlement have been and will continue to be netted against these capitalized patent legal defense costs upon receipt. As of December 31, 2009, $200,000 has been received from NessCap for this settlement.
Product Defect Matter
In 2005, a customer brought to our attention a possible defect in a product that was produced for Maxwell under contract by another manufacturer and resold to the customer. In an effort to resolve the matter, Maxwell’s subsidiary, Maxwell Technologies SA, initiated a legal proceeding in Germany in late 2007 against the product manufacturer. The suit is currently in the discovery phase during which time the allegedly defective product will be analyzed by an expert who is tasked with determining: (a) if there is a defect; and (b) if there is a defect, if the defect is one stemming from manufacturing or from operating conditions. Since the inception of the proceedings, the parties have met with the expert on more than one occasion. At that meeting the expert did not issue any report on his findings. Most recently, the court granted the request of the parties to allow the expert to consider not only the allegedly defective products known when the proceedings were initiated but also the products with alleged defects after the proceedings began. In the event that a determination is made that a defect exists, any potential liability would depend upon the nature of the defect and the actual amount of any damages would be determined in a subsequent legal proceeding. Since the matter is still in its preliminary stages, we have not yet been able to determine what, if any, warranty exposure Maxwell may have, and therefore, we have not recorded any warranty reserve provision. Maxwell does, however, carry insurance that may cover a portion of such warranty liability that might ultimately arise from this matter.
Angeles Chemical
In December 2007, Maxwell, along with more than 150 other defendants, was named in an environmental suit. The suit, Angeles Chemical Company, Inc. et al. v. Omega Chemical PRP Group, LLC, et al., was filed by the plaintiffs in the United States District Court for the Central District of California alleging damages related to hazardous waste contamination of the plaintiffs’ land (the “Angeles Site”). The plaintiff alleges that a prior service provider of Maxwell improperly disposed of hazardous material on property upstream from the plaintiffs’ land (the “Omega Site”). In March 2008, Maxwell joined and adopted the motion to dismiss filed by defendants Omega Chemical PRP Group LLC and Omega Chemical PRP Group. That motion was denied, however, the Court elected to grant a motion to stay the proceedings. In the meantime, Maxwell’s outside counsel is conferring with co-defendants’ counsel to finalize a Joint Defense Agreement whereby related defendants can share information in an effort to reduce the cost of defending the suit.
In April 2009, Maxwell attended an Internal Technical Committee Meeting regarding the Angeles Site. The purpose of the meeting was to review the EPA’s Remedial Investigation Report, an analysis of the contamination occurring near the Omega Site. The EPA had spent the last several months collecting data and running a model analysis for this report. The EPA concluded that the Omega Site was the cause of an 8 mile contamination plume, a conclusion that the defendants deny. The EPA’s conclusions and assumptions were challenged by technical experts at De Maximis and CDM. The experts believe that the EPA made simplified assumptions to attain results that supported a conclusion desired by the EPA. The defendants, including Maxwell, predicted that the cost of the EPA’s 8 mile plume would be approximately $100-150 million, perhaps double what it would cost if the Omega site is to blame for only 2-4 miles of the plume. The consensus was that the defendants would have to challenge the EPA’s model with their own model, perhaps collecting additional data at points the EPA ignored in hopes of saving potentially millions of dollars in the overall cleanup.
28
Table of Contents
Maxwell has been included in this suit as a result of an earlier suit that was settled in 1999. In that suit, Maxwell was a potentially responsible party (PRP) at a site a short distance from the current site. That suit was settled by Maxwell paying approximately $37,000.
Omega Chemical
In August 2009, unrelated to the Angeles Chemical matter and yet pertaining to the original Omega Chemical matter, the Omega PRP Organized Group (OPOG) submitted a good faith offer letter to parties who settled their portion of the Omega matter for 100% of their respective liabilities for the original Omega Chemical clean up efforts. Within the offer letter, OPOG solicited additional funding for additional clean up efforts it claims are necessary to remediate the Omega Chemical site. Maxwell has joined several other parties receiving the same good faith offer letter from OPOG to review and assess the validity of OPOG’s claim for further clean up funding. Most recently, these collaborating parties have hired an outside consultant to review the state of the Omega Chemical site and assist in determining the validity of such claims, including cost estimates, made by OPOG and have scheduled a meeting with OPOG to discuss such findings. To date, the plaintiff has completed a draft feasibility study.
FCPA Investigations
As a result of Maxwell’s international operations, the Company is subject to the U.S. Foreign Corrupt Practices Act (“FCPA”), which prohibits companies from making improper payments to foreign officials for the purpose of obtaining or keeping business. As a result of an internal review, the Company is currently conducting an inquiry into the nature of certain payments made to our former independent sales agent in China with respect to sales of our high voltage capacitor products produced by our Swiss subsidiary. These payments equaled the difference between Maxwell’s quoted price for certain products and the amount that the independent sales agent was able to sell such products to certain customers in China. These payments had previously been recorded as commissions; however, a portion of those payments may actually have been rebated directly or indirectly to customers. Maxwell recorded commissions to the agent of $585,000, $1.8 million and $653,000 for the years ended December 31, 2009, 2008 and 2007, respectively. These commissions were based on sales of $3.1 million, $8.2 million and $3.4 million for the years ended December 31, 2009, 2008 and 2007, respectively. These amounts are recorded as a reduction to revenue for the periods presented. In 2008, these amounts were recorded as commission expense and were included in selling, general and administrative expense in the condensed consolidated statement of operations. This independent sales agent also worked as an independent sales agent for Metar (see Note 13). The Company terminated its relationship with this independent sales agent as of May 20, 2009.
Maxwell is in the process of evaluating how these payments should be treated for FCPA purposes, which could harm the Company’s business. The Company’s internal review is focused on a thorough examination of all of its international operations and business practices, as well as a review of its compliance programs. The Company has taken certain remedial actions, including terminating its relationship with the independent sales agent in China as well as terminating its relationship with Metar, which could harm its business.
Maxwell has not yet completed its internal review. As the Company progresses, management is voluntarily sharing information related to its internal review with the Securities and Exchange Commission (“SEC”) and Department of Justice (“DOJ”) and has provided certain documents as requested by the SEC in connection with their review of this matter. In the event that the Company’s internal review or any governmental investigation identifies violations of law, the DOJ, the SEC or other governmental authorities could seek civil and/or criminal sanctions, including monetary fines and penalties, against the Company and/or its employees, as well as additional changes to its business practices and compliance programs, which could have a material adverse effect on the Company’s business, results of operations or financial condition.
In the fourth quarter of 2009 and in connection with the internal review of the matters described above, the Company recorded an accrual of $9.3 million for the potential settlement with the SEC and DOJ. The amount
29
Table of Contents
recorded was based on the Company’s estimation of loss as required under GAAP and discussions with both government agencies. These discussions have resulted in an estimate of a potential settlement range of $9.3 million to $20.0 million. The top end of the range of $20.0 million represents the combined first offer of settlement recently put forth by the relevant governmental agencies. Discussions with the SEC and DOJ are ongoing in an effort to resolve these matters, but whether agreement can be reached and on what terms, is uncertain. The amount of any disgorgements, penalties and/or fines that the Company could face depends on a number of eventual factors which are not currently known or have not yet been resolved with the relevant government authorities, including findings by relevant authorities regarding the amount, nature and scope of any improper payments, the amount of any pecuniary gain involved, our ability to pay and the level of cooperation provided to government authorities during the investigations. There can be no assurance that a settlement will be reached at all, or that any final settlement amount will not be more or less than the accrual of $9.3 million. Actual payments to the government agencies in connection with any settlement could have a material adverse effect on the Company’s business, results of operations or financial condition.
| Item 4. | Reserved |
30
Table of Contents
| Item 5. | Market for the Registrant’s Common Equity, Related Stockholder Matters and Issuer Purchases of Equity Securities |
Our common stock has been quoted on the NASDAQ Global Market under the symbol “MXWL” since 1983. The following table sets forth the high and low sale prices per share of our common stock as reported on the NASDAQ Global Market for the periods indicated.
| High | Low | |||||
| Year Ended December 31, 2009 |
||||||
| First Quarter |
$ | 7.64 | $ | 4.50 | ||
| Second Quarter |
14.37 | 6.63 | ||||
| Third Quarter |
19.72 | 12.25 | ||||
| Fourth Quarter |
21.81 | 14.30 | ||||
| Year Ended December 31, 2008 |
||||||
| First Quarter |
$ | 11.89 | $ | 7.10 | ||
| Second Quarter |
14.00 | 9.52 | ||||
| Third Quarter |
14.75 | 9.50 | ||||
| Fourth Quarter |
13.79 | 4.00 | ||||
As of February 23, 2010 there were 393 holders of record of our common stock. We believe that the number of beneficial owners of our common stock substantially exceeds this number.
Dividend Policy
We have never declared or paid cash dividends on our capital stock. We currently anticipate that any earnings will be retained for the development and expansion of our business and, therefore, we do not anticipate paying cash dividends on our capital stock in the foreseeable future. In addition, under our bank credit and convertible debt agreements, neither we nor any of our subsidiaries may, directly or indirectly, pay any cash dividends to our stockholders.
Recent Sales of Unregistered Securities
None.
Equity Compensation Plans
The information required by this item will be contained in our definitive proxy statement to be filed with the Securities and Exchange Commission in connection with the Annual Meeting of our Stockholders, which is expected to be filed no later than 120 days after the end of our fiscal year ended December 31, 2009 (the “Proxy Statement”), and is incorporated in this report by reference.
Issuer Purchases of Equity Securities
None.
31
Table of Contents
Stock Performance Graph
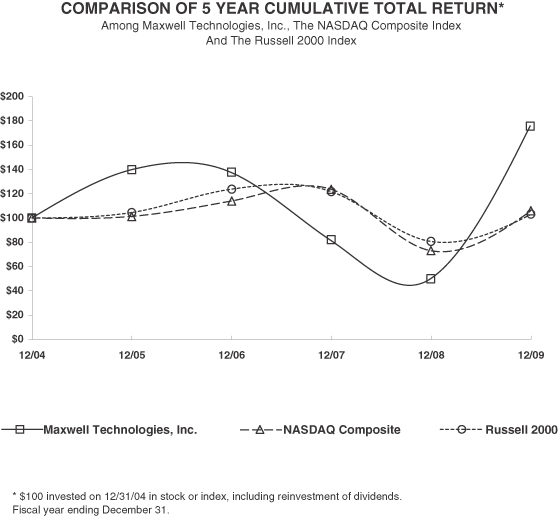
32
Table of Contents
| Item 6. | Selected Financial Data |
The selected consolidated financial data presented below are for each fiscal year in the five-year period ended December 31. This data is derived from the Company’s audited consolidated financial statements.
| Years Ended December 31, | ||||||||||||||||||||
| 2009 | 2008 | 2007 | 2006 | 2005 | ||||||||||||||||
| (In thousands, except per share data) | ||||||||||||||||||||
| Consolidated Statement of Operations Data: |
||||||||||||||||||||
| Continuing operations: |
||||||||||||||||||||
| Total revenue |
$ | 101,315 | $ | 80,439 | $ | 56,708 | $ | 53,707 | $ | 45,055 | ||||||||||
| Loss from continuing operations |
(22,912 | ) | (14,808 | ) | (15,733 | ) | (16,300 | ) | (6,254 | ) | ||||||||||
| Income (loss) from discontinued operations, net of tax |
— | — | — | (195 | ) | (40 | ) | |||||||||||||
| Net loss |
$ | (22,912 | ) | $ | (14,808 | ) | $ | (15,733 | ) | $ | (16,495 | ) | $ | (6,294 | ) | |||||
| Basic and diluted net loss per share: |
||||||||||||||||||||
| Loss from continuing operations |
$ | (0.94 | ) | $ | (0.71 | ) | $ | (0.86 | ) | $ | (0.97 | ) | $ | (0.39 | ) | |||||
| Income (loss) from discontinued operations, net of tax |
— | — | — | (0.01 | ) | — | ||||||||||||||
| Net loss per share |
$ | (0.94 | ) | $ | (0.71 | ) | $ | (0.86 | ) | $ | (0.98 | ) | $ | (0.39 | ) | |||||
| As of December 31, | ||||||||||||||||||||
| 2009 | 2008 | 2007 | 2006 | 2005 | ||||||||||||||||
| Consolidated Balance Sheet Data: |
||||||||||||||||||||
| Total assets |
$ | 128,819 | $ | 102,313 | $ | 108,280 | $ | 91,669 | $ | 88,464 | ||||||||||
| Cash, cash equivalents, short-term investments in marketable securities and restricted cash |
$ | 37,582 | $ | 20,576 | $ | 30,214 | $ | 19,387 | $ | 34,456 | ||||||||||
| Short-term borrowings and current portion of long-term debt |
$ | 5,245 | $ | 18,888 | $ | 16,472 | $ | 5,688 | $ | 1,695 | ||||||||||
| Long-term debt excluding current portion |
$ | 11,452 | $ | 582 | $ | 13,544 | $ | 22,527 | $ | 22,212 | ||||||||||
| Stockholders’ equity |
$ | 77,992 | $ | 63,247 | $ | 62,112 | $ | 45,883 | $ | 49,851 | ||||||||||
| Shares outstanding |
26,321 | 22,521 | 20,417 | 17,261 | 16,600 | |||||||||||||||
33
Table of Contents
| Item 7. | Management’s Discussion and Analysis of Financial Condition and Results of Operations |
The following discussion of our financial condition and results of operations for the years ended December 31, 2009, 2008 and 2007 should be read in conjunction with our consolidated financial statements and the related notes included in Item 8, Financial Statements and Supplementary Data, of this Annual Report on Form 10-K. In addition, the discussion and the historical information contain forward-looking statements that are subject to risks and uncertainties, including estimates based on our judgment. These estimates include, but are not limited to, assessing the collectability of accounts receivable, applied and unapplied production costs, production capacities, the usage and recoverability of inventories and long-lived assets, deferred income taxes, the incurrence of losses on warranty costs, stock compensation expense, impairment of goodwill and other intangible assets, estimations of the cost to complete for certain projects and research and development projects, estimation of the probability that the performance criteria of restricted stock awards will be met and the fair value of warrants and embedded conversion options related to convertible debentures. Our estimation of liquidity for fiscal year 2010 may be significantly different than our actual results. Negative changes in revenues will affect our estimation in cost of sales, research and development, selling, general and administrative and other aspects of our business.
Management’s Discussion and Analysis of Financial Condition and Results of Operations (MD&A) is designed to provide a reader of our financial statements with a narrative from the perspective of our management on our financial condition, results of operations, liquidity and certain other factors that may affect our future results. Our MD&A is presented in the following sections:
| • | Overview |
| • | 2009 Highlights |
| • | Results of Operations |
| • | Liquidity and Capital Resources |
| • | Contractual Obligations |
| • | Critical Accounting Estimates |
| • | Pending Accounting Pronouncements |
| • | Off Balance Sheet Arrangements |
| • | Outlook |
Overview
Maxwell Technologies, Inc. is a Delaware corporation that is headquartered in San Diego, California. We originally incorporated in 1965 under the name Maxwell Laboratories, Inc. In 1996, we changed our name to Maxwell Technologies, Inc. We develop, manufacture and market energy storage and power delivery products for transportation, industrial telecommunications and other applications and microelectronic products for space and satellite applications.
Maxwell has two manufacturing locations (San Diego, California and Rossens, Switzerland). In addition, we have a contract manufacturer in the Longgang District, Shenzhen China. Maxwell operates as one operating segment called High Reliability, which is comprised of three product lines:
| • | Ultracapacitors: Our primary focus is on ultracapacitors, energy storage devices that possess a unique combination of high power density, long operational life and the ability to charge and discharge very rapidly. Our BOOSTCAP® ultracapacitor cells and multi-cell modules provide highly reliable energy storage and power delivery solutions for applications in multiple industries, including transportation, automotive, telecommunications, energy and consumer and industrial electronics. |
34
Table of Contents
| • | High-Voltage Capacitors: Our CONDIS® high-voltage capacitors are extremely robust devices that are designed and manufactured to perform reliably for decades in all climates. These products include grading and coupling capacitors and capacitive voltage dividers that are used to ensure the safety and reliability of electric utility infrastructure and other applications involving transport, distribution and measurement of high-voltage electrical energy. |
| • | Radiation-Mitigated Microelectronic Products: Our radiation-mitigated microelectronic products include high-performance, high-density power modules, memory modules and single board computers that incorporate our proprietary RADPAK® packaging and shielding technology and novel architectures that enable them to withstand the effects of environmental radiation and perform reliably in space. |
Our goal is to meet or exceed the life of the application product and service needs of our customers through continuous improvements of the effectiveness of all our business processes. We aim to design and manufacture our products to perform reliably for the life of the products and systems into which they are integrated. We seek to achieve high reliability through the application of proprietary technologies and rigorously controlled design, development, manufacturing and test processes. This high reliability strategy emphasizes the development and marketing of products that could enable us to achieve higher profit margins than commodity electronic components and systems.
2009 Highlights
For 2009, we reported revenue of $101.3 million compared with $80.4 million in 2008. For 2009 we reported a net loss of $22.9 million, or $0.94 per diluted share, including a $9.3 million, or $0.38 per diluted share, accrual for potential settlement of U.S. Foreign Corrupt Practices Act (“FCPA”) violations; versus a net loss of $14.8 million, or $0.71 per diluted share for fiscal 2008.
During fiscal 2009, we continued to focus on developing strategic alliances, introducing new products, increasing production capacity to meet anticipated future demand, reducing product costs, funding capital improvements, augmenting executive management and improving production processes. Some of these efforts are described below:
| • | In December, we reached a significant milestone with delivery of our one-millionth large cell BOOSTCAP® ultracapacitor. |
| • | In December, we began increasing production capacity for small cell BOOSTCAP® ultracapacitors to satisfy demand from several leading producers of high performance solid-state drives (SSD) that are using ultracapacitors to supply integrated backup power in enterprise storage products. |
| • | In October, we announced the availability of our PC-10 ultracapacitor with proprietary electrode for enhancing the reliability of backup power in enterprise storage, powering smart utility meters, and benefiting a variety of other industrial applications. |
| • | In September, we announced that Continental AG, one of the world’s leading automotive electronics and mechatronics suppliers, has selected Maxwell’s BOOSTCAP® ultracapacitors as the energy storage element of a voltage stabilization system it has developed for automobiles. |
| • | In August, we announced the promotion of George Kreigler III to the new position of chief operating officer, with overall responsibility for our operations in the U.S., Europe and Asia. |
| • | In July, we announced the appointment of Sacha Jenny to vice president and general manager of our Swiss subsidiary, Maxwell Technologies SA. |
| • | In July, we entered into a global catalog distribution agreement with Mouser Electronics, Inc., known for its rapid introduction of the newest products. |
35
Table of Contents
| • | In May, we raised money from the sale of two million shares of common stock in a public offering underwritten by Roth Capital Partners. In June the underwriter exercised its option to purchase an additional 300,000 shares. In total we sold 2.3 million shares for a total of $18.6 million, net of expenses. |
| • | In April, we received purchase orders with a total value of approximately $13.5 million from three of China’s leading transit bus producers for BOOSTCAP® ultracapacitor modules to support braking energy recuperation and torque assist functions in diesel-electric hybrid transit buses. |
| • | In March, we announced the appointment of Kevin S. Royal as senior vice president, chief financial officer, treasurer and secretary. Mr. Royal began employment at Maxwell on April 20, 2009. |
| • | In January, we announced that Vanner Inc., a manufacturer of electrical power conversion products, had selected our BOOSTCAP® ultracapacitor modules to provide burst power for a retrofit diesel engine starter system that will be installed in Chicago transit buses. |
36
Table of Contents
Results of Operations
The following table presents certain statement of operations data expressed as a percentage of revenue for the periods indicated:
| Years Ended December 31, | |||||||||
| 2009 | 2008 | 2007 | |||||||
| Total revenue |
100 | % | 100 | % | 100 | % | |||
| Cost of sales |
65 | % | 69 | % | 76 | % | |||
| Gross profit |
35 | % | 31 | % | 24 | % | |||
| Operating expenses: |
|||||||||
| Selling, general and administrative |
33 | % | 29 | % | 31 | % | |||
| Research and development |
16 | % | 19 | % | 20 | % | |||
| Total operating expenses |
49 | % | 48 | % | 51 | % | |||
| Loss from operations |
(14 | )% | (17 | )% | (27 | )% | |||
| Other expense, net |
(6 | )% | (1 | )% | (1 | )% | |||
| Loss from continuing operations before income taxes |
(20 | )% | (18 | )% | (28 | )% | |||
| Income tax provision |
3 | % | 0 | % | 0 | % | |||
| Net loss |
(23 | )% | (18 | )% | (28 | )% | |||
Year Ended December 31, 2009 Compared with Year Ended December 31, 2008
In 2009, loss from operations of $14.1 million included an accrual for the potential settlement of U.S. FCPA violations of $9.3 million. Excluding the $9.3 million, loss from operations improved $8.6 million, or 64%, compared with the same period one year ago. Various items influenced the improvement in our operations; the primary influences include an increase in gross profit and decreases in SG&A and R&D as a percentage of revenue. More specifics of these areas are discussed below.
In 2009, net loss increased $8.1 million, or 55%, compared with the same period one year ago. Net loss reported for fiscal 2009 was $22.9 million, or $0.94 per share, while net loss was $14.8 million, or $0.71 per share, in the same period one year ago. The increase in net loss was impacted by an accrual of $9.3 million for potential settlement of U.S. FCPA violations and $6.5 million of higher losses on embedded derivatives and warrants during the year ended December 31, 2009 compared with the same period one year ago.
Revenue and Gross Profit
The following table presents revenue, cost of sales and gross profit for the years ended December 31, 2009 and 2008 (in thousands, except percentage):
| Year Ended December 31, 2009 |
Year Ended December 31, 2008 |
Increase | % Change |
|||||||||||||||
| Amount | % of Net Revenue |
Amount | % of Net Revenue |
|||||||||||||||
| Revenue |
$ | 101,315 | 100 | % | $ | 80,439 | 100 | % | $ | 20,876 | 26 | % | ||||||
| Cost of sales |
66,026 | 65 | % | 55,342 | 69 | % | 10,684 | 19 | % | |||||||||
| Gross profit |
$ | 35,289 | 35 | % | $ | 25,097 | 31 | % | $ | 10,192 | 41 | % | ||||||
Revenue in fiscal 2009 increased 26% to $101.3 million, compared with $80.4 million in the same period one year ago. Product revenue increased 29% or $22.9 million, while license fee and service revenue decreased
37
Table of Contents
100% or $2.0 million. The increase in total revenue was influenced primarily by higher volume in our ultracapacitor and microelectronic product lines. Increases in ultracapacitor volumes were driven primarily by continuing strong demand for ultracapacitor-based energy storage systems for wind turbines and hybrid busses. The increase in volume of microelectronic revenue was driven by timing of certain satellite projects and management does not expect this higher level of volume to continue.
A substantial amount of our revenue is generated through our Swiss subsidiary. As such, reported revenue can be materially impacted by the fluctuation of the Swiss Franc to U.S. dollar, our reporting currency. However, the impact for comparing revenue in 2009 compared with 2008 was less than half of one percent as the weighted-average foreign exchange rate of the U.S. dollar to the Swiss Franc was $0.92113 per Swiss Franc for the year ended December 31, 2009 compared with $0.92561 per Swiss Franc for the same period one year ago.
The following table presents revenue mix by product line for the years ended December 31, 2009 and 2008:
| Year Ended December 31, |
||||||
| 2009 | 2008 | |||||
| Ultracapacitors |
43 | % | 36 | % | ||
| High-Voltage Capacitors |
39 | % | 45 | % | ||
| Microelectronics |
18 | % | 19 | % | ||
| Total |
100 | % | 100 | % | ||
Gross profit in 2009 increased $10.2 million, or 41%, to $35.3 million compared with 2008. As a percentage of revenue, gross profit increased to 35% in 2009 compared with 31% in 2008. Higher gross profit resulted from an increase in the volume of sales of $6.5 million and an increase of $3.7 million due to net reduction of product costs. These cost reductions were driven primarily by advancements in our manufacturing process and product design, using a greater mix of ocean freight rather than air freight and outsourcing the assembly of some of our products to Chinese manufacturers. The product design advancements allowed us to improve the performance of our large cell ultracapacitor product line, while maintaining the same form and function as well as reducing the cost of the product.
Selling, General & Administrative (SG&A) Expense
The following table presents selling, general and administrative (SG&A) expense for the years ended December 31, 2009 and 2008 (in thousands, except percentage):
| Year Ended December 31, 2009 |
Year Ended December 31, 2008 |
Increase | % Change |
|||||||||||||||
| Amount | % of Net Revenue |
Amount | % of Net Revenue |
|||||||||||||||
| Selling, general and administrative |
$ | 33,111 | 33 | % | $ | 23,268 | 29 | % | $ | 9,843 | 42 | % | ||||||
SG&A expenses were 33% of revenue in 2009, compared with 29% in 2008, while total expense increased by $9.8 million, or 42%. When comparing 2009 to 2008 several material items that occurred in 2009 but not in 2008 should be considered. In the fourth quarter of 2009, we accrued $9.3 million for the potential settlement of FCPA violations. In 2009 we incurred approximately $700,000 in legal and professional services related to our international investigation of the FCPA violations. Approximately $500,000 was paid in executive severance in 2009. In addition to these new items, labor expense increased approximately $1.2 million in 2009 compared with 2008. This increase was driven primarily by increases in selling and marketing personnel and is consistent with the increase in revenues. These increases to the 2009 SG&A expense compared with 2008 were partially offset by greater foreign currency transaction gains of $1.5 million and a decrease of $400,000 in travel expenses.
38
Table of Contents
Research and Development (R&D) Expense
The following table presents research and development (R&D) expense for the years ended December 31, 2009 and 2008 (in thousands, except percentage):
| Year Ended December 31, 2009 |
Year Ended December 31, 2008 |
Increase | % Change |
|||||||||||||||
| Amount | % of Net Revenue |
Amount | % of Net Revenue |
|||||||||||||||
| Research and development |
$ | 15,955 | 16 | % | $ | 14,847 | 19 | % | $ | 1,108 | 7 | % | ||||||
R&D expense was $16.0 million in 2009 compared with $14.8 million in 2008, an increase of approximately $1.1 million or 7%. However, as a percentage of revenues, R&D expense was 16% in 2009 compared with 19% in 2008. The increase in absolute dollars of $1.1 million was driven primarily by increases in labor costs due to a focus on product development as well as improvements to our manufacturing processes.
Provision (Benefit) For Income Taxes
We recorded an income tax provision of $2.5 million for the year ended December 31, 2009 compared with an income tax benefit of $226,000 for the same period in 2008. This provision is related to our Swiss operations. The 2009 tax provision included a one-time non-cash tax provision of $1.7 million associated with the transfer of certain intellectual property from Switzerland to the U.S. in order to maximize utilization of U.S. federal and state net operating loss carryforwards. Unremitted earnings of foreign subsidiaries have been included in the consolidated financial statements without giving effect to the United States taxes that may be payable as it is not anticipated such earnings will be remitted to the United States.
Year Ended December 31, 2008 Compared with Year Ended December 31, 2007
Revenue and Gross Profit
The following table presents revenue, cost of sales and gross profit for the years ended December 31, 2008 and 2007 (in thousands, except percentage):
| Year Ended December 31, 2008 |
Year Ended December 31, 2007 |
|||||||||||||||||
| Amount | % of Net Revenue |
Amount | % of Net Revenue |
Increase | % Change |
|||||||||||||
| Revenue |
$ | 80,439 | 100 | % | $ | 56,708 | 100 | % | $ | 23,731 | 42 | % | ||||||
| Cost of sales |
55,342 | 69 | % | 43,010 | 76 | % | 12,332 | 29 | % | |||||||||
| Gross profit |
$ | 25,097 | 31 | % | $ | 13,698 | 24 | % | $ | 11,399 | 83 | % | ||||||
Revenue in fiscal 2008 increased 42% to $80.4 million, compared with $56.7 million in fiscal 2007. Product revenue increased 45% or $24.2 million, while license fee and service revenue decreased 20% or $505,000.
Based on the yearly weighted-average of the foreign exchange rate of the Swiss Franc to the U.S. dollar, the value of the Swiss Franc increased 11% to $0.9255 per Swiss Franc for the year ended December 31, 2008, up from $0.8353 per Swiss Franc for the year ended December 31, 2007. The revenues reported for the year ended December 31, 2008 increased $5.5 million due to the increase in the U.S. dollar to the Swiss Franc exchange rate.
39
Table of Contents
Revenue mix by product line for the years ended December 31, 2008 and 2007:
| Year Ended December 31, |
||||||
| 2008 | 2007 | |||||
| Ultracapacitors |
36 | % | 31 | % | ||
| High-Voltage Capacitors |
45 | % | 46 | % | ||
| Microelectronics |
19 | % | 23 | % | ||
| Total |
100 | % | 100 | % | ||
Gross profit in 2008 increased $11.4 million, or 83%, to $25.1 million compared with 2007. As a percentage of revenue, gross profit increased to 31% in 2008 compared with 24% in 2007. Higher gross profit resulted from an increase in the volume of sales of $5.7 million and an increase of $5.7 million due to higher average selling prices and/or net reduction of product costs. The increase in gross profit was negatively impacted by increases in freight expenses of $1.5 million.
Selling, General & Administrative (SG&A) Expense
The following table presents selling, general and administrative (SG&A) expense for the years ended December 31, 2008 and 2007 (in thousands, except percentage):
| Year Ended December 31, 2008 |
Year Ended December 31, 2007 |
|||||||||||||||||
| Amount | % of Net Revenue |
Amount | % of Net Revenue |
Increase | % Change |
|||||||||||||
| Selling, general and administrative |
$ | 23,268 | 29 | % | $ | 17,864 | 31 | % | $ | 5,404 | 30 | % | ||||||
Selling, general and administrative (SG&A) expenses were 29% of revenue in 2008, compared with 31% in 2007, while total expense increased by $5.4 million, or 30%. This increase in absolute dollars was driven by increases of: $1.9 million in personnel costs, $1.6 million of greater foreign exchange transaction losses in 2008 compared with 2007, $893,000 from foreign currency transaction losses due to an increase in exchange rates and $421,000 in travel expenses. The increase in personnel costs is due to an increase in headcount which reflects the increase of sales.
Research & Development (R&D) Expense
The following table presents research and development (R&D) expense for the years ended December 31, 2008 and 2007 (in thousands, except percentage):
| Year Ended December 31, 2008 |
Year Ended December 31, 2007 |
|||||||||||||||||
| Amount | % of Net Revenue |
Amount | % of Net Revenue |
Increase | % Change |
|||||||||||||
| Research and development |
$ | 14,847 | 19 | % | $ | 11,263 | 20 | % | $ | 3,584 | 32 | % | ||||||
Research and development (R&D) expenses were $14.8 million in 2008 compared with $11.3 million in 2007, an increase of $3.5 million or 32%. However, as a percentage of revenues, R&D expense was 19% in 2008 compared with 20% in 2007. The increase of $3.5 million was primarily driven by increases of: $1.4 million in personnel costs, $830,000 in travel expenses, $816,000 of design and development costs and $298,000 related to an increase in exchange rates. The increase in personnel costs is related to an increase in headcount and reflects the increase in revenue as well as a decrease in work previously outsourced. Our R&D spending continues to represent a significant percentage of revenue and is focused mainly on BOOSTCAP® product development and Microelectronics single board computer product development.
40
Table of Contents
Provision (Benefit) For Income Taxes
We recorded an income tax benefit of $226,000 in 2008 compared with an income tax provision of $65,000 in 2007. This provision is for our Swiss and U.S. operations. Unremitted earnings of foreign subsidiaries have been included in the consolidated financial statements without giving effect to the United States taxes that may be payable on distribution to the United States because it is not anticipated such earnings will be remitted to the United States. If remitted, the additional United States taxes paid would not be material.
Commitments and Contingencies
As a result of our international operations, we are subject to the FCPA, which prohibits companies from making improper payments to foreign officials for the purpose of obtaining or keeping business. As a result of an internal review, we are currently conducting an inquiry into the nature of certain payments made to our former independent sales agent in China with respect to sales of our high voltage capacitor products produced by our Swiss subsidiary. These payments equaled the difference between our quoted price for certain products and the amount that the independent sales agent was able to sell such products to certain customers in China. These payments had previously been recorded as commissions; however, a portion of those payments may actually have been rebated directly or indirectly to customers. We recorded commissions to the agent of $585,000, $1.8 million and $653,000 for the years ended December 31, 2009, 2008 and 2007, respectively. These commissions were based on sales of $3.1 million, $8.2 million and $3.4 million for the years ended December 31, 2009, 2008 and 2007, respectively. These amounts are recorded as a reduction to revenue for the periods presented. In 2008, these amounts were recorded as commission expense and were included in selling, general and administrative expense in the condensed consolidated statement of operations. This independent sales agent also worked as an independent sales agent for Metar (see Note 13 of Notes to Consolidated Financial Statements, included in Part II, Item 8 of this report). We terminated our relationship with this independent sales agent as of May 20, 2009.
We are in the process of evaluating how these payments should be treated for FCPA purposes, which could harm our business. Our internal review is focused on a thorough examination of all of our international operations and business practices, as well as a review of our compliance programs. We have taken certain remedial actions, including terminating our relationship with the independent sales agent in China as well as terminating our relationship with Metar, which could harm our business.
We have not yet completed our internal review. As we progress, we are voluntarily sharing information related to our internal review with the Securities and Exchange Commission (“SEC”) and Department of Justice (“DOJ”) and have provided certain documents as requested by the SEC in connection with their review of this matter. In the event that our internal review or any governmental investigation identifies violations of law, the DOJ, the SEC or other governmental authorities could seek civil and/or criminal sanctions, including monetary fines and penalties, against the Company and/or its employees, as well as additional changes to our business practices and compliance programs, which could have a material adverse effect on our business, results of operations or financial condition.
In the fourth quarter of 2009 and in connection with our internal review of the matters described above, we recorded an accrual of $9.3 million for the potential settlement with the SEC and DOJ. The amount we recorded was based on our estimation of loss as required under U.S. Generally Accepted Accounting Principles (“GAAP”) and discussions with both government agencies. These discussions have resulted in our estimate of a potential settlement range of $9.3 million to $20.0 million. The top end of the range of $20.0 million represents the combined first offer of settlement recently put forth by the relevant governmental agencies. Discussions with the SEC and DOJ are ongoing in an effort to resolve these matters, but whether agreement can be reached and on what terms, is uncertain. The amount of any disgorgements, penalties and/or fines that we could face depends on a number of eventual factors which are not currently known to us or have not yet been resolved with the relevant government authorities, including findings by relevant authorities regarding the amount, nature and scope of any improper payments, the amount of any pecuniary gain involved, our ability to pay, and the level of cooperation provided to government authorities during the investigations. There can be no assurance that a settlement will be
41
Table of Contents
reached at all, or that any final settlement amount will not be more or less than our accrual of $9.3 million. Actual payments to the government agencies in connection with any settlement could have a material adverse effect on our business, results of operations or financial condition.
Other Events
We assess the Company’s goodwill and intangible assets annually or as economic conditions warrant an assessment and determined that there was no impairment. We also assess the impairment of long-term assets. Accordingly, no goodwill or other asset impairments were recognized for the years ended December 31, 2009, 2008 and 2007.
Amortization of patents was $353,000, $364,000 and $224,000 for the years ended December 31, 2009, 2008 and 2007, respectively.
Net interest expense for the years ended December 31, 2009, 2008 and 2007 was $254,000, $481,000 and $1.1 million, respectively. The decrease in interest expense is driven primarily by a decrease in the outstanding principal of our convertible debt as well as a decrease in interest as the interest rate on our convertible debt is equal to the Federal Funds Rate plus 1.125% per annum.
As a result of the registration rights on the shares which would be acquired upon debt conversion and warrant exercises the fair value of the embedded conversion features and warrants are recorded as liabilities. The initial fair value of $9.2 million as of December 20, 2005 was treated as a discount to the $25 million debenture; in addition, there was $1.3 million of costs related to the issuance of the convertible debt, which are also amortized over the remaining current life of the note. The term of the debenture may be adjusted based on the holder’s election to extend the payment terms. Each quarterly payment can be deferred for a 24 month period, with the final payment on this debt extended until December 2011. The holder elected to delay the payments that were due in June, September and December of 2009 until June, September and December of 2011, respectively. The amortization of the debt discount and deferred costs totaled $737,000, $2.4 million, and $3.6 million for the years ended December 31, 2009, 2008 and 2007, respectively.
The fair value calculation at December 31, 2009 and 2008 was impacted by the change in Maxwell’s stock price and an increase in the time which the holder has to exercise their rights. The fair value of the embedded conversion features and warrants will be recalculated each reporting period and any difference in value from the prior period will be reflected in the Statement of Operations. The future impact of fair value recalculations is difficult to predict, given the historical volatility of Maxwell’s stock price, however, it is a non-cash item and does not impact cash flow.
Liquidity and Capital Resources
Changes in Cash Flow
The following table summarizes our cash flows from operating, investing and financing activities for each of the past three fiscal years (in thousands):
| Years Ended December 31, | ||||||||||||
| 2009 | 2008 | 2007 | ||||||||||
| Total cash provided by (used in): |
||||||||||||
| Operating activities |
$ | (999 | ) | $ | (6,975 | ) | $ | (14,629 | ) | |||
| Investing activities |
(4,951 | ) | 381 | (9,093 | ) | |||||||
| Financing activities |
22,696 | 4,107 | 29,729 | |||||||||
| Effect of exchange rate changes on cash and cash equivalents |
260 | 484 | 413 | |||||||||
| Increase (decrease) in cash and cash equivalents |
$ | 17,006 | $ | (2,003 | ) | $ | 6,420 | |||||
42
Table of Contents
Our net cash used in operating activities was $1.0 million for the year ended December 31, 2009, compared with $7.0 million in 2008 and $14.6 million in 2007. The improvement in operating cash flows in 2009, compared with the prior year, was due primarily to net working capital inflows of $8.3 million and an increase in net-non cash charges of $5.8 million, partially offset by an increase in net loss of $8.1 million. The net working capital inflows were driven by increases in accounts payable and accrued liabilities and deferred income taxes as well as a decrease in inventory. Accounts payable and accrued liabilities increased due to the $9.3 million accrual for the potential settlement of FCPA violations. Inventory decreased due to timing of shipments at the end of 2009. The working capital inflows were offset by an increase in accounts receivable. This increase was due to greater sales volume as well as the timing of customer billings at the end of 2009 compared to the end of 2008.
Our net cash used in investing activities was $5.0 million for the year ended December 31, 2009, compared with $381,000 provided by investing activities for the year ended December 31, 2008 and $9.1 million used in investing activities for the year ended December 31, 2007. The cash used in investing activities in 2009 was due to capital expenditures. The 2009 capital expenditures were focused on advancements in our manufacturing processes, increasing production capacity and test equipment for R&D.
Our net cash provided by financing activities was $22.7 million for the year ended December 31, 2009, compared with $4.1 million in 2008 and $29.7 million in 2007. The change in 2009 was due primarily to increases in cash proceeds from the issuance of common stock, which was partially offset by greater principal payments on long-term and short-term borrowings. Cash proceeds from the issuance of common stock in the year ended December 31, 2009 were driven primarily by an underwritten public offering through which we sold 2.3 million shares of our common stock. The increase in principal payments on long-term and short-term borrowings was driven primarily by cash payments on our convertible debenture, which were paid with common stock in 2008.
Liquidity
As of December 31, 2009, we had approximately $29.6 million in cash and cash equivalents with an additional $8.0 million in restricted cash for a total of $37.6 million. The cash restriction will be released when the convertible debenture is repaid. Working capital increased to $32.1 million as of December 31, 2009 from $17.6 million as of December 31, 2008.
In November 2006 we filed an S-3 with the Securities and Exchange Commission to, from time to time, sell up to an aggregate of $125 million of the Company’s common stock, warrants or debt securities (the “Shelf Registration Statement”). During 2007 the Company received $26.6 million in cash from the sale of 2.7 million shares of common stock. In August 2008 we entered into an Equity Distribution Agreement (“EDA“) with UBS Securities LLC (“UBS”) to, from time to time, sell up to $15 million of our common stock. We have received $5.6 million in cash from the sale of 687,000 shares of our common stock since entering into the EDA. The EDA was suspended in April 2009. In May 2009 we raised $18.6 million in cash from the sale of 2.3 million shares of common stock through a public offering underwritten by Roth Capital Partners. As of January 2010, the Shelf Registration Statement is no longer effective.
As discussed above, the company has accrued $9.3 million for the potential settlement of FCPA violations. Principal payments on our convertible debenture of $8.3 million are due throughout 2011, with the final payment due on December 31, 2011. Additionally, we have $8.0 million of restricted cash that will be released when the debenture is repaid. Management believes that cash from operating activities, combined with available cash balances will be sufficient for Maxwell to fund our working capital requirements, settlement of FCPA violations, the debenture payments, obligations as they become due, capital equipment additions and product development expenditures for the next several years.
43
Table of Contents
Debentures, Short-term and Long Term Borrowings
Convertible Debentures
On December 20, 2005, the Company issued $25 million in aggregate principal amount of senior subordinated convertible debentures (the “Debentures”) along with warrants to purchase shares of Maxwell common stock. The net proceeds of the issuance totaled approximately $23.7 million after direct placement costs of approximately $1.3 million. The debenture is payable in quarterly installments of $2.8 million from March 2008 through December 2009, with the holder having the option to delay each installment 24 months. The holder elected to delay the quarterly payments that were due in June, September and December 2009 to June, September and December 2011, respectively. The warrants initially issued were to purchase 395,000 shares of Maxwell common stock while the Debentures were convertible into 1.3 million shares of Maxwell’s common stock, at any time at the option of the holder, at a strike price of $19.00 per share. The number of warrants, conversion shares and the strike price are subject to adjustment upon certain events such as the sale of equity securities by Maxwell at a price below the strike price of $19.00 per share. At December 31, 2009 the warrants had an exercise price of $16.22 per share.
Interest is due quarterly with the interest rate tied to the Federal Funds Rate plus 1.125% per annum. All or a portion of the accrued and unpaid interest may be paid in shares of Maxwell’s common stock at the Company’s option. For the fiscal year ended December 31, 2009 we made principal payments of $2.8 million in cash and the holder converted $2.8 million of principal into 171,000 shares of our common stock. In 2009 we made interest payments of $92,000 with 18,000 shares of our common stock as well as $122,000 in cash.
After eighteen months from the issue date, Maxwell may require that a specified amount of the principal of the Debentures be converted if certain conditions are satisfied for a period of 20 consecutive trading days. None of these conditions have occurred since the issuance of the Debentures.
The change in fair value on revaluation of debenture conversion rights and warrant liabilities represents the difference between the fair value of the warrants and debenture conversion between the two measurement dates using a Black-Scholes calculation. The effect of the fair market value adjustment is recorded as “gain (loss) on embedded derivative liabilities.”
The net fair value of the holder’s and Maxwell’s conversion rights at December 31, 2009 and 2008 were liabilities of $3.0 million and $357,000, respectively. These amounts are included in “convertible debenture and long-term debt” on the balance sheet.
The warrants issued in connection with the issuance of the Debentures had a fair value at December 31, 2009 and 2008 of $2.5 million and $318,000 respectively and is included in “stock warrants” on the balance sheet. The warrants are exercisable at any time through December 20, 2010. No warrants had been exercised as of December 31, 2009.
As long as the Debentures are outstanding, we are required to maintain a cash balance of $8.0 million, which is classified as restricted cash at December 31, 2009 and 2008. At December 31, 2008 the restricted cash was classified as a current asset. However, since the holder of the Debenture elected to delay the payments that were due 2009 until 2011, the restricted cash was classified as a non-current asset as of December 31, 2009.
Short-term borrowings
Maxwell’s European subsidiary, Maxwell Technologies SA, has a 2.0 million Swiss Francs (approximately $1.9 million at December 31, 2009) bank credit agreement with a Swiss bank, which renews annually. Borrowings under the credit agreement bear interest at 3.9% with repayment terms extending beyond one month from the date of funding. Borrowings under the credit agreement are unsecured and as of December 31, 2009 and 2008, the full amount available under the credit line was drawn.
44
Table of Contents
Maxwell Technologies SA, has a 1.0 million Swiss Francs (approximately $966,000 as of December 31, 2009) overdraft credit agreement with a Swiss bank, which renews quarterly. Borrowings under the credit agreement bear interest at 2.05%. Borrowings under the credit agreement are unsecured and as of December 31, 2009, the full amount of the overdraft credit line was drawn.
Maxwell Technologies SA, has a 2.0 million Swiss Francs (approximately $1.9 million as of December 31, 2009) short-term loan with a Swiss bank, which renews quarterly. Borrowings under this short-term loan agreement bear interest at 2.05%. Borrowings under the short-term loan agreement are unsecured and as of December 31, 2009 and 2008, the full amount of the credit line was drawn.
Long-term borrowings
Maxwell Technologies SA had a lending agreement for the acquisition of manufacturing equipment up to 1.5 million Swiss Francs. After the acquisition of the equipment was completed the agreement converted to 48 monthly payments of 34,302 Swiss Francs with an interest rate of 2.22%. As of December 31, 2009 and 2008 the balance of the obligation was $543,000 and $863,000, respectively, with final payment due in 2011.
We have various financing agreements for vehicles in Switzerland. These agreements are for up to a five year repayment period with interest rates of 4.9% – 7.0%. At December 31, 2009 and 2008, $84,000 and $112,000, respectively, was outstanding.
Minority Equity Interests in Subsidiaries
PurePulse, which suspended operations in 2002 and was classified as discontinued operations in 2006, has minority equity investors. These investors are former employees who were issued shares when PurePulse originally was incorporated and former employees who have exercised stock options in that entity. As of December 31, 2009 and 2008 minority investors owned approximately 11% of the outstanding stock of PurePulse.
Contractual Obligations
| Payment due by period (in thousands) | |||||||||||||||
| Total | Less than 1 Year |
1–3 Years |
3–5 Years |
More than 5 Years | |||||||||||
| Operating Lease Obligations (1) |
$ | 9,677 | $ | 1,804 | $ | 5,377 | $ | 2,496 | $ | — | |||||
| Purchase Commitments (2) |
8,681 | 8,681 | — | — | — | ||||||||||
| Debt Obligations (3) |
14,164 | 5,523 | 8,641 | — | — | ||||||||||
| Pension benefit payments (4) |
27,195 | 1,083 | 2,269 | 2,603 | 21,240 | ||||||||||
| Total |
$ | 59,717 | $ | 17,091 | $ | 16,287 | $ | 5,099 | $ | 21,240 | |||||
| (1) | Operating lease obligations represent building leases, for U.S. and Switzerland locations. |
| (2) | Purchase commitments primarily represent the value of non-cancelable purchase orders and an estimate of purchase orders that if cancelled would result in a significant penalty to the Company. |
| (3) | Debt obligations represent long-term and short-term borrowings and current portion of long-term debt of $13.8 million and interest of $373,000. |
| (4) | Pension benefit payments represent the expected amounts to be paid for pension benefits. |
45
Table of Contents
Critical Accounting Policies and Estimates
We consider an accounting estimate to be critical if: 1) the accounting estimate requires us to make assumptions about matters that were uncertain at the time the accounting estimate was made and 2) changes in the estimate are reasonably likely to occur from period to period, or use of different estimates that we reasonably could have used in the current period, would have a material impact on our financial condition or results of operations.
Also see Note 1, Summary of Significant Accounting Policies, in Part II, Item 8, Financial Statements and Supplementary Data, of this Annual Report on Form 10-K, which discusses the significant accounting policies.
We believe the following are either (i) critical accounting policies that require us to make significant estimates or assumptions in the preparation of our consolidated financial statements or (ii) other key accounting policies that may require us to make difficult or subjective judgments:
Revenue Recognition
Nature of Estimates Required. Sales revenue is derived from the sale of manufactured products directly to customers. For certain long-term contracts, revenue is recognized at the time costs are incurred and for license fees and service revenue we recognize revenue when the performance requirements have been met.
Assumptions and Approach Used. Product revenue is recognized when all of the following criteria are met: (1) persuasive evidence of an arrangement exists (upon contract signing or receipt of an authorized purchase order from a customer); (2) title passes to the customer at either shipment from our facilities or receipt at the customer facility, depending on shipping terms; (3) price is deemed fixed or determinable and free of contingencies or significant uncertainties; and (4) collectability is reasonably assured. Customer purchase orders and/or contracts are generally used to determine the existence of an arrangement. Shipping documents are used to verify product delivery. We assess whether a price is fixed or determinable based upon the payment terms associated with the transaction. If a volume discount is offered, revenue is recognized at the lowest price to the customer. We assess the collectability of accounts receivable based primarily upon creditworthiness of the customer as determined by credit checks and analysis, as well as customer’s payment history.
Revenue generated from certain long-term, fixed price contracts is recognized at the time costs are incurred and is calculated on a percentage of completion basis measured by the percentage of cost incurred to date to the estimated costs for each contract and is limited by the funding of the prime contractor. Provisions for estimated losses on incomplete contracts are made in the period in which such losses are determined. The estimated contract costs are based on historical experience and assumptions regarding future contractual obligations. We regularly review these estimates and consider the impact of recurring business risks and uncertainties inherent in the contracts, such as implementation delays due to factors within or outside our control.
From time to time we have entered into multiple-deliverable contractual arrangements with elements of software that are essential to the functionality of the delivered elements. Additionally, we have contracts where all the elements of the agreement need to be delivered and accepted by the customer prior to any revenue being recognized for the agreement. We recognize revenue on the delivered elements when vendor-specific objective evidence (“VSOE”) of the fair value of the undelivered elements exists. We have entered into one contract whereby we have delivered certain elements and VSOE of fair value of the undelivered elements did not exist.
Changes in cost estimates and the fair values of certain deliverables could negatively impact our operating results. In addition, unforeseen conditions could arise over the contract term that may have a significant impact on operating results.
46
Table of Contents
Excess and Obsolete Inventory
Nature of Estimates Required. Estimates are principally based on assumptions regarding the ability to sell the items in our inventory. Due to the uncertainty and potential volatility of these estimated factors, changes in our assumptions could materially affect the results of operations.
Assumptions and Approach Used. Our estimate is evaluated on a quarterly basis and is based on rolling historical inventory usage and assumptions regarding future product sales and requirements. As actual levels of inventory change or specific products become slow moving or obsolete, the resulting outcomes are factored into the estimated reserve value.
Warrants and Convertible Debt Conversion Features
Nature of Estimates Required. Each reporting period we value the holder’s conversion option and the forced conversion option of our convertible debenture along with the associated warrants as derivative liabilities. To calculate the value of these features we use the Black-Scholes pricing model along with a Z factor statistical model which is used to calculate the probability for the forced conversion option.
Assumptions and Approach Used. The Black-Scholes pricing model requires the estimation of the expected term, of which all of the other variables are dependent. The expected term that we have used is based on the weighted average estimated holding period of each principal payment and as of December 31, 2009 we estimated that each payment will be outstanding until its due date. However, if certain conditions are satisfied for a period of 20 consecutive trading days we may require that a specified amount of the outstanding principal of the Debenture be converted. Furthermore, at the holder’s election, all or a portion of the outstanding principal may be converted into shares of common stock at anytime. Either of these scenarios could reduce the expected term and therefore effect the estimated liability. Additionally, changes in estimates will impact our estimate of the probability of the forced conversion option. This conversion is based on the current variance between our market stock price and the exercise price which would indicate the likelihood of the conversion to equity prior to the final payment. The holding period estimate also impacts other variables; expected volatility and risk-free interest rate. Each of these variables could have a potentially significant impact on the carrying value of the debt and warrants and materially affect results of operations.
At December 31, 2009 we estimated the holding period as 1.7 years, which resulted with the estimation of the net fair value of the liability to the holders and Maxwell’s conversion rights as a liability of $3.0 million. The effect of the fair value adjustment was a $4.8 million loss for the year ended December 31, 2009. If management had estimated a 1 year holding period, the fair value of the liability to the holder’s and Maxwell’s conversion rights would have been reported as $2.3 million and the effect of the fair value adjustment would have been a $3.7 million loss.
Pension
Nature of Estimates Required. Assumptions are significant inputs to the actuarial models that measure the pension benefit obligations and the fair values of real estate assets are appraised.
Assumptions and Approach Used. Discount rate and expected return on assets are important elements of plan expense and asset and liability measurement. We annually appraise the fair value of real estate assets. We evaluate these critical assumptions at least annually. We periodically evaluate other assumptions involving demographic factors, such as retirement age, mortality and turnover, and update them to reflect our experience and expectations for the future. Actual results in any given year will often differ from actuarial assumptions because of economic and other factors. For example, at December 31, 2008 we estimated benefit payments of approximately $1.2 million would be paid in 2009, but the actual benefits paid in 2009 were $373,000. The projected benefit obligation as of December 31, 2009 was $19.5 million and fair value of plan assets was $27.2 million.
47
Table of Contents
Warranty
Nature of Estimates Required. The estimated warranty reserve is established at the time revenue is recognized. Our products typically carry a one to two year warranty. Estimates are principally based on assumptions regarding the warranty costs of the sale, in some cases for a new product where little or no claims experience may exist. Due to the uncertainty and potential volatility of these estimated factors, changes in our assumptions could materially affect results of operations.
Assumptions and Approach Used. Our estimate of warranty is evaluated on a quarterly basis and is based on prior experience data for return rates and historical costs. Although we engage in extensive product quality programs and processes, our warranty obligation has been and may in the future be affected by product failure rates, product recalls, repair or field replacement costs and additional development costs incurred in correcting any product failure. Should actual product failure rates, use of materials or service delivery costs differ from our estimates, additional warranty reserves could be required. In that event, our gross profit and gross margins would be reduced. To that extent, if actual experience varies from our estimates or specific data becomes available, it is used to modify our reserve that was estimated based on historical averages to ensure that the reserves are within the range of likely outcomes.
Stock-Based Compensation
Nature of Estimates Required. Our stock-based awards include stock option grants, restricted stock, Employee Stock Purchase Plan and restricted unit awards. We record compensation expense for our stock-based awards in accordance with the criteria set forth in Stock Compensation Subtopic of the Financial Accounting Standards Board Accounting Standards Codification. Under the guidance, the fair value of each employee stock option is estimated on the date of grant using an option pricing model that meets certain requirements. We currently use the Black-Scholes option pricing model to estimate the fair value of our stock options. The Black-Scholes model meets the requirements of the guidance, but the fair values generated by the model may not be indicative of the actual fair values of our equity awards. The determination of the fair value of share-based payment awards utilizing the Black-Scholes model is affected by our stock price and a number of assumptions, including expected volatility, expected life, risk-free interest rate and expected dividends.
Assumptions and Approach Used. Expected dividend yield is zero because we have never paid cash dividends and have no present intention to pay cash dividends. Expected volatility is based on our historical stock prices using a mathematical formula to measure the standard deviation of the change in the natural logarithm of our underlying stock price that is expected over a period of time, commensurate with the option life. The risk-free interest rate is derived from the zero coupon rate on U.S. Treasury instruments for the options expected life. The expected life calculation is based on our history of exercised options from previous equity-based share option grants.
Share-based compensation expense recognized in the Consolidated Statement of Operations is based on options and awards ultimately expected to vest. The guidance requires forfeitures to be estimated at the time of grant and revised, if necessary, in subsequent periods if actual forfeitures differ from those estimates with a cumulative catch up adjustment.
The fair value of our restricted stock and restricted stock units is based on the closing market price of our common stock on the date of grant.
We evaluate the assumptions used to value stock-based awards on a quarterly basis. If factors change and we employ different assumptions, stock-based compensation expense may differ significantly from what we have recorded in the past. If there are any modifications or cancellations of the underlying unvested securities, we may be required to accelerate, increase or cancel any remaining unearned stock-based compensation expense. To the extent that we grant additional equity securities our stock-based compensation expense will increase by the fair value of the additional grants. Compensation expense is only recognized for those awards that are expected to
48
Table of Contents
vest and therefore we estimate a forfeiture rate and revise those estimates in subsequent periods if the actual forfeitures or probability of milestone achievement for the restricted stock differs from the prior estimates.
Income Taxes
Nature of Estimates Required. We record an income tax valuation allowance when the realization of certain deferred tax assets, including net operating losses is not likely.
Assumptions and Approach Used. Significant judgment is required in evaluating our federal, state and foreign tax positions and in the determination of our tax provision. Despite our belief that our valuation allowance for unrecognized tax benefits is adequate, it is often difficult to predict the final outcome or the timing of the resolution of any particular tax matters. We may adjust the allowance as relevant circumstances evolve, such as guidance from the relevant tax authority, our tax advisors or resolution of issues in the courts. These adjustments are recognized as a component of income tax expense entirely in the period in which they are identified.
Commitments and Contingencies
Nature of Estimates Required. We are involved in litigation, regulatory and other proceedings and claims. We prosecute and defend these matters aggressively. However, there are many uncertainties associated with any litigation, and there can be no assurance that these actions or other third party claims against us will be resolved without costly litigation and/or substantial settlement charges.
Assumptions and Approach Used. We disclose information concerning contingent liabilities in respect of these claims and proceedings for which an unfavorable outcome is more than remote. We recognize liabilities for these claims and proceedings as appropriate based upon the probability of loss and our ability to estimate losses and to fairly present, in conjunction with the disclosures of these matters in our consolidated financial statements, management’s view of our exposure. We review outstanding claims and proceedings with external counsel as appropriate to assess probability and estimates of loss. We will recognize within selling, general and administrative expenses a liability related to claims and proceedings at such time as an unfavorable outcome becomes probable and the amount can be reasonably estimated. When the reasonable estimate is a range, the recognized liability will be the best estimate within the range. If no amount in the range is a better estimate than any other amount, the minimum amount of the range will be recognized.
We re-evaluate these assessments each quarter or as new and significant information becomes available to determine whether a liability should be recognized or if any existing liability should be adjusted. The actual cost of ultimately resolving a claim or proceeding may be substantially different from the amount of the recognized liability. In addition, because it is not permissible to recognize a liability until the loss is both probable and estimable, in some cases there may be insufficient time to recognize a liability prior to the actual incurrence of the loss (upon verdict and judgment at trial, for example, or in the case of a quickly negotiated settlement).
Impact of Inflation
We believe that inflation has not had a material impact on our results of operations for any of our fiscal years in the three-year period ended December 31, 2009. However, there can be no assurance that future inflation would not have an adverse impact on our operating results and financial condition.
Recent Accounting Pronouncements
In August 2009, the Financial Accounting Standards Board (“FASB”) issued Accounting Standards Update (“ASU”) 2009-05, Measuring Liabilities at Fair Value, which provides amendments to the Fair Value Measurements and Disclosures—Overall Subtopic of the FASB Accounting Standards Codification (“ASC”) for the fair value measurement of liabilities. This update provides clarification for the fair value measurement of
49
Table of Contents
liabilities in which a quoted market price in an active market for an identical liability is not available. The amendments in this update clarify that when estimating the fair value of a liability, a reporting entity is not required to include a separate input or adjustment to other inputs relating to the existence of a restriction that prevents the transfer of the liability. The amendments in this update also clarify that both a quoted price in an active market for the identical liability at the measurement date and the quoted price for the identical liability when traded as an asset in an active market when no adjustments to the quoted price of the asset are required are Level 1 fair value measurements. The guidance provided in this update is effective for the first reporting period (including interim periods) beginning after issuance. The adoption of this update did not have a material impact on the Company’s financial statements.
In June 2009, the FASB issued ASU 2009-01, Generally Accepted Accounting Principles and approved the FASB Accounting Standards Codification (“Codification”) as the single source of authoritative nongovernmental US GAAP. The Codification does not change previous US GAAP, but is intended to simplify user access to all authoritative US GAAP by providing all the authoritative literature related to a particular Topic in one place. All prior accounting standard documents will be superseded and all other accounting literature not included in the Codification will be considered non-authoritative. ASU 2009-01 is effective for interim and annual periods ending after September 15, 2009. The implementation of this update did not have an impact on the Company’s consolidated financial statements.
In May 2009, the FASB updated and we adopted the Subsequent Events Topic of the FASB ASC to establish general standards of accounting for and disclosure of events that occur after the balance sheet date but before financial statements are issued or are available to be issued. This topic requires the disclosure of the date through which an entity has evaluated subsequent events and the basis for that date, that is, whether the date represents the date the financial statements were issued or were available to be issued. This topic is effective in the first interim period ending after June 15, 2009. The adoption of this update did not have a material impact on the Company’s financial statements.
In April 2009, the FASB updated the Fair Value Measurements and Disclosures Topic of the FASB ASC to provide guidelines for making fair value measurements more consistent with the principles presented in this topic. This update provides additional authoritative guidance in determining whether a market is active or inactive, and whether a transaction is distressed, is applicable to all assets and liabilities (i.e., financial and nonfinancial) and will require enhanced disclosures. The pronouncement is effective for periods ending after June 15, 2009. The adoption of this update did not have a material impact on the Company’s financial statements.
In April 2009, the FASB updated the Investments—Debt and Equity Securities Topic of the FASB ASC to give additional guidance to provide greater clarity about the credit and noncredit component of an other-than-temporary impairment event and to more effectively communicate when an other-than-temporary impairment event has occurred. This update applies to debt securities. This also modifies the requirements for recognizing other-than-temporary impaired debt securities and revises the existing impairment model for such securities by modifying the current “intent and ability” indicator in determining whether a debt security is other-than-temporarily impaired. The pronouncement is effective for periods ending after June 15, 2009. The adoption of this update did not have a material impact on the Company’s financial statements.
In April 2009, the FASB updated the Financial Instruments Topic of the FASB ASC to require disclosures about fair value of financial instruments in interim as well as in annual financial statements. This update also requires those disclosures in all interim financial statements. As this update is only disclosure-related, it did not have an impact on the financial position and results of operations.
In December 2008, the FASB updated the Retirement Benefits Topic of the FASB ASC to require more detailed disclosures about employers’ plan assets in a defined benefit pension or other postretirement plan, including employers’ investment strategies, major categories of plan assets, concentrations of risk within plan assets, and inputs and valuation techniques used to measure the fair value of plan assets. This update also requires, for fair value measurements using significant unobservable inputs (Level 3), disclosure of the effect of
50
Table of Contents
the measurements on changes in plan assets for the period. The disclosures about plan assets required by this update must be provided for fiscal years ending after December 15, 2009. As this update is only disclosure-related, it did not have an impact on the financial position and results of operations.
Pending Accounting Pronouncements
In January 2010, the FASB issued ASU 2010-06, Fair Value Measurements and Disclosures, to improve the disclosures about fair value measurements. This update requires the Company to disclose separately the amounts of significant transfers in and out of Level 1 and Level 2 fair value measurements and describe the reasons for the transfers. In the reconciliation for fair value measurements using significant unobservable inputs (Level 3), the Company will be required to present separately information about purchases, sales, issuances and settlements (that is, on a gross basis rather than as one net number). This update provides clarification as to the level of disaggregation in determining the appropriate classes of assets and liabilities. This update clarifies disclosures about inputs and valuation techniques for Level 2 and Level 3 fair value measurements. The new disclosures and clarifications of existing disclosures are effective for interim and reporting periods beginning after December 15, 2009, except for the disclosures about purchases, sales, issuances and settlements in the roll forward of activity in Level 3 fair value measurements. Those disclosures are effective for fiscal years beginning after December 15, 2010, and for interim periods within those fiscal years. As this update is only disclosure-related, it will not have an impact on the financial position and results of operations.
In September 2009, the FASB reached a consensus on ASU 2009-13, Multiple-Deliverable Revenue Arrangements, and ASU 2009-14, Certain Revenue Arrangements That Include Software Elements. ASU 2009-13 modifies the requirements that must be met for an entity to recognize revenue from the sale of a delivered item that is part of a multiple-element arrangement when other items have not yet been delivered. ASU 2009-13 eliminates the requirement that all undelivered elements must have either: i) vendor-specific objective evidence (“VSOE”) or ii) third-party evidence (“TPE”) before an entity can recognize the portion of an overall arrangement consideration that is attributable to items that already have been delivered. In the absence of VSOE or TPE of the standalone selling price for one or more delivered or undelivered elements in a multiple-element arrangement, entities will be required to estimate the selling prices of those elements. Overall arrangement consideration will be allocated to each element (both delivered and undelivered items) based on their relative selling prices, regardless of whether those selling prices are evidenced by VSOE or TPE or are based on the entity’s estimated selling price. The residual method of allocating arrangement consideration has been eliminated. ASU 2009-14 modifies the software revenue recognition guidance to exclude from its scope tangible products that contain both software and non-software components that function together to deliver a product’s essential functionality. These new updates are effective for revenue arrangements entered into or materially modified in fiscal years beginning on or after June 15, 2010. Early adoption is permitted. This new pronouncement would allow us to recognize revenue on multiple-deliverable arrangements earlier than in previous years. Although we are unable to estimate what those amounts will be in the future, the amounts recognized for multiple-deliverable revenue arrangements were approximately $0, $896,000 and $1.1 million for the years ended December 31, 2009, 2008 and 2007, respectively. As of December 31, 2009 and 2008, we had recorded approximately $2.1 million and $1.9 million, respectively of deferred revenue related to multiple-deliverable revenue arrangements.
Off Balance Sheet Arrangements
None.
51
Table of Contents
Outlook
We will continue to focus on our ultracapacitor product line in 2010 and develop new applications for ultracapacitors in multiple industries, including transportation, automotive, telecommunications, energy and consumer and industrial electronics. We are increasing production capacity for small cell ultracapacitors to satisfy demand from several leading producers of high performance solid-state drives that are using ultracapacitors to supply integrated backup power in enterprise storage. We expect modest growth of our large cells to be enhanced by sales for voltage stabilization and idle-stop-start functionality in micro hybrid automobiles. We expect revenue to continue to grow in 2010 although at a more moderate pace. Nearly all of the revenue growth in 2010 is expected to come from ultracapacitor products.
Technology advances in manufacturing processes and design of our large cell ultracapacitor products, as well as expanding production capacity, are expected to continue the improvement of our manufacturing cost structure. We expect additional cost savings as we move more of our production to China. We expect gross profit, as a percentage of sales, to continue to increase in 2010 but once again, at a more moderate pace than the growth in 2009.
As we continue to increase revenue, we expect SG&A expenses to increase with the addition of sales personnel as well as customer facing application engineers who will work on improving ultracapacitor applications and developing new applications. We also expect R&D expenses to increase while we focus on product design and develop new products in our ultracapacitor product line. Although operating expenses are expected to increase in absolute dollars, we expect operating expenses to remain consistent with 2009 operating expenses as a percentage of revenue. Combined with the increases in revenue and gross profit improvements, we expect to achieve positive profit from operations in 2010.
Capital expenditures are expected to be approximately $8.5 million in 2010. Forty percent of our planned capital spending is focused on advances in our manufacturing processes and increases in production capacity for our ultracapacitor products. Increasing our production capacity based on our current product mix of high-voltage capacitors makes up another twenty percent of our planned capital spending. An additional fifteen percent of our planned capital spending is related to ERP and financial planning and analysis application improvement initiatives to support expected growth in our ultracapacitor product line. The remaining capital expenditures will support R&D and our microelectronics product line.
| Item 7A. | Quantitative and Qualitative Disclosures about Market Risk |
We face exposure to financial market risks, including adverse movements in foreign currency exchange rates and changes in interest rates. These exposures may change over time and could have a material adverse impact on our financial results. We have not entered into or invested in any instruments that are subject to market risk, except as follows:
Foreign Currency Risk
Our primary foreign currency exposure is related to our subsidiary in Switzerland. Maxwell Technologies SA has Euro and local currency (Swiss Francs) revenue and operating expenses as well as loans in Swiss Francs. Changes in these currency exchange rates impact the U.S. dollar amount of revenue, expenses and debt. The Company has certain long term contracts in a currency other than U.S. dollars. A change of 100 basis points (or 1%) in the customer local currency would impact the value of the contracts by approximately $41,000.
As part of our risk management strategy, we use forward contracts to hedge certain foreign currency exposures. Our objective is to offset gains and losses resulting from these exposures with gains and losses on the forward contracts, thereby reducing volatility of earnings. We use the forward contracts to hedge certain monetary assets and liabilities, primarily receivables and payables, denominated in a foreign currency. The change in fair value of these instruments represents a natural hedge as their gains and losses offset the changes in the underlying fair value of the monetary assets and liabilities due to movements in currency exchange rates.
52
Table of Contents
Interest Rate Risk
At December 31, 2009, we had approximately $16.7 million in debt, which includes $11.5 million of long-term debt. We do not anticipate significant interest rate swings in the near future. However, if they occur it may affect the consolidated balance sheet or the statement of operations. The estimated impact on earnings or cash flow during the next fiscal year from a change of 100 basis points in the interest rate would have a $167,000 effect on our related interest expense.
Fair Value Risk
We record an adjustment on our convertible debenture adjusting the fair value of the embedded conversion options and stock warrants. The change in the value of these instruments is primarily impacted by the price of our stock at the end of each reporting period. This adjustment creates a non-cash effect on our statement of operations which may have a significant impact.
We have a prepaid pension asset of $7.7 million at December 31, 2009, including plan assets of $27.2 million, which are recorded at fair value. The plan assets consist of 49% debt and equity securities, 37% real estate and 14% cash and cash equivalents. The fair value measurement of the real estate is subject to the real estate market forces in Switzerland. Our debt and equity securities fair value is determined based on quoted prices in active markets for identical assets and are subject to interest rate risk. We manage our risk by having a diversified portfolio. See Note 12 to the consolidated financial statements for further discussion on the pension assets.
53
Table of Contents
| Item 8. | Financial Statements and Supplementary Data |
Our consolidated financial statements and notes thereto appear on pages 54 to 92 of this Annual Report on Form 10-K.
MAXWELL TECHNOLOGIES, INC. AND SUBSIDIARIES
INDEX TO CONSOLIDATED FINANCIAL STATEMENTS
54
Table of Contents
REPORT OF INDEPENDENT REGISTERED PUBLIC ACCOUNTING FIRM
To the Board of Directors and Stockholders
Maxwell Technologies, Inc.
We have audited the accompanying consolidated balance sheets of Maxwell Technologies, Inc. and subsidiaries as of December 31, 2009 and 2008, and the related consolidated statements of operations, stockholders’ equity and comprehensive loss and cash flows for each of the three years in the period ended December 31, 2009. Our audits also included the financial statement schedule of Maxwell Technologies, Inc. listed in Item 15(a). These financial statements and financial statement schedule are the responsibility of the Company’s management. Our responsibility is to express an opinion on these financial statements and schedule based on our audits.
We conducted our audits in accordance with the standards of the Public Company Accounting Oversight Board (United States). Those standards require that we plan and perform the audit to obtain reasonable assurance about whether the financial statements are free of material misstatement. An audit includes examining, on a test basis, evidence supporting the amounts and disclosures in the financial statements. An audit also includes assessing the accounting principles used and significant estimates made by management, as well as evaluating the overall financial statement presentation. We believe that our audits provide a reasonable basis for our opinion.
In our opinion, the consolidated financial statements referred to above present fairly, in all material respects, the financial position of Maxwell Technologies, Inc. and subsidiaries as of December 31, 2009 and 2008, and the results of their operations and their cash flows for each of the three years in the period ended December 31, 2009, in conformity with U.S. generally accepted accounting principles. Also, in our opinion, the related financial statement schedule, when considered in relation to the basic consolidated financial statements taken as a whole, presents fairly in all material respects the information set forth therein.
We have also audited, in accordance with the standards of the Public Company Accounting Oversight Board (United States), Maxwell Technologies, Inc.’s and subsidiaries’ internal control over financial reporting as of December 31, 2009, based on criteria established in Internal Control—Integrated Framework issued by the Committee of Sponsoring Organizations of the Treadway Commission, and our report dated March 5, 2010 expressed an unqualified opinion on the effectiveness of Maxwell Technologies, Inc.’s internal control over financial reporting.
/s/ MCGLADREY & PULLEN, LLP
San Diego, California
March 5, 2010
55
Table of Contents
MAXWELL TECHNOLOGIES, INC. AND SUBSIDIARIES
CONSOLIDATED BALANCE SHEETS
(in thousands, except per share data)
| December 31, | ||||||||
| 2009 | 2008 | |||||||
| ASSETS |
||||||||
| Current assets: |
||||||||
| Cash and cash equivalents |
$ | 29,582 | $ | 12,576 | ||||
| Restricted cash |
— | 8,000 | ||||||
| Trade and other accounts receivable, net of allowance for doubtful accounts of $386 and $434 at December 31, 2009 and 2008, respectively |
20,485 | 14,107 | ||||||
| Inventories, net |
17,788 | 18,502 | ||||||
| Prepaid expenses and other current assets |
1,776 | 1,645 | ||||||
| Total current assets |
69,631 | 54,830 | ||||||
| Property and equipment, net |
17,080 | 17,355 | ||||||
| Intangible assets, net |
2,922 | 3,755 | ||||||
| Goodwill |
22,799 | 22,408 | ||||||
| Prepaid pension asset |
7,653 | 2,592 | ||||||
| Restricted cash |
8,000 | — | ||||||
| Other non-current assets |
734 | 1,373 | ||||||
| Total assets |
$ | 128,819 | $ | 102,313 | ||||
| LIABILITIES AND STOCKHOLDERS’ EQUITY |
||||||||
| Current liabilities: |
||||||||
| Accounts payable and accrued liabilities |
$ | 23,672 | $ | 12,592 | ||||
| Accrued warranty |
588 | 905 | ||||||
| Accrued employee compensation |
4,615 | 4,353 | ||||||
| Short-term borrowings and current portion of long-term debt |
5,245 | 18,888 | ||||||
| Stock warrants |
2,465 | — | ||||||
| Deferred tax liability |
906 | 456 | ||||||
| Total current liabilities |
37,491 | 37,194 | ||||||
| Deferred tax liability, long-term |
1,097 | — | ||||||
| Convertible debenture and long-term debt, excluding current portion |
11,452 | 582 | ||||||
| Stock warrants |
— | 318 | ||||||
| Other long-term liabilities |
787 | 972 | ||||||
| Total liabilities |
50,827 | 39,066 | ||||||
| Commitments and contingencies |
||||||||
| Stockholders’ equity: |
||||||||
| Common stock, $0.10 par value per share, 40,000 shares authorized; 26,321 and 22,521 shares issued and outstanding at December 31, 2009 and 2008, respectively |
2,633 | 2,253 | ||||||
| Additional paid-in capital |
224,575 | 192,228 | ||||||
| Accumulated deficit |
(157,814 | ) | (134,902 | ) | ||||
| Accumulated other comprehensive income |
8,598 | 3,668 | ||||||
| Total stockholders’ equity |
77,992 | 63,247 | ||||||
| Total liabilities and stockholders’ equity |
$ | 128,819 | $ | 102,313 | ||||
The accompanying notes are an integral part of these consolidated financial statements.
56
Table of Contents
MAXWELL TECHNOLOGIES, INC. AND SUBSIDIARIES
CONSOLIDATED STATEMENTS OF OPERATIONS
(in thousands, except per share data)
| Years Ended December 31, | ||||||||||||
| 2009 | 2008 | 2007 | ||||||||||
| Sales |
$ | 101,315 | $ | 78,459 | $ | 54,223 | ||||||
| License fees and service revenue |
— | 1,980 | 2,485 | |||||||||
| Total revenue |
101,315 | 80,439 | 56,708 | |||||||||
| Cost of sales |
66,026 | 55,342 | 43,010 | |||||||||
| Gross profit |
35,289 | 25,097 | 13,698 | |||||||||
| Operating expenses: |
||||||||||||
| Selling, general and administrative |
33,111 | 23,268 | 17,864 | |||||||||
| Research and development |
15,955 | 14,847 | 11,263 | |||||||||
| Amortization of intangibles |
353 | 364 | 224 | |||||||||
| Total operating expenses |
49,419 | 38,479 | 29,351 | |||||||||
| Loss from operations |
(14,130 | ) | (13,382 | ) | (15,653 | ) | ||||||
| Interest expense, net |
(254 | ) | (481 | ) | (1,064 | ) | ||||||
| Amortization of debt discount and prepaid debt costs |
(737 | ) | (2,388 | ) | (3,567 | ) | ||||||
| Gain (loss) on embedded derivative and warrants |
(5,251 | ) | 1,217 | 4,528 | ||||||||
| Other income, net |
— | — | 88 | |||||||||
| Loss from operations before income taxes |
(20,372 | ) | (15,034 | ) | (15,668 | ) | ||||||
| Income tax provision (benefit) |
2,540 | (226 | ) | 65 | ||||||||
| Net loss |
$ | (22,912 | ) | $ | (14,808 | ) | $ | (15,733 | ) | |||
| Net loss per share—basic and diluted |
$ | (0.94 | ) | $ | (0.71 | ) | $ | (0.86 | ) | |||
| Weighted average shares used in computing basic and diluted net loss per share |
24,457 | 20,819 | 18,285 | |||||||||
The accompanying notes are an integral part of these consolidated financial statements.
57
Table of Contents
MAXWELL TECHNOLOGIES, INC. AND SUBSIDIARIES
CONSOLIDATED STATEMENTS OF STOCKHOLDERS’ EQUITY AND COMPREHENSIVE LOSS
(in thousands)
| Shares | Amount | Additional Paid-in Capital |
Accumulated Deficit |
Accumulated Other Comprehensive Income |
Total Stockholders’ Equity |
Comprehensive Loss |
|||||||||||||||||||||
| Balance at December 31, 2006 |
17,261 | $ | 1,726 | $ | 141,294 | $ | (104,361 | ) | $ | 7,224 | $ | 45,883 | $ | (14,166 | ) | ||||||||||||
| Exercise of stock options |
258 | 26 | 1,816 | — | — | 1,842 | |||||||||||||||||||||
| Share-based compensation expense |
— | — | 1,175 | — | — | 1,175 | |||||||||||||||||||||
| Proceeds from issuance of common stock |
2,645 | 264 | 26,383 | — | — | 26,647 | |||||||||||||||||||||
| Restricted stock awards |
212 | 21 | 1,740 | — | — | 1,761 | |||||||||||||||||||||
| Shares issued for interest on convertible debt |
65 | 6 | 788 | — | — | 794 | |||||||||||||||||||||
| Retirement of shares |
(24 | ) | (1 | ) | (297 | ) | — | — | (298 | ) | |||||||||||||||||
| Net loss |
— | — | — | (15,733 | ) | — | (15,733 | ) | $ | (15,733 | ) | ||||||||||||||||
| Other comprehensive income |
|||||||||||||||||||||||||||
| Foreign currency translation adjustments |
— | — | — | — | 2,671 | 2,671 | 2,671 | ||||||||||||||||||||
| Pension adjustment |
— | — | — | — | (2,631 | ) | (2,631 | ) | (2,631 | ) | |||||||||||||||||
| Unrealized gain on marketable securities |
— | — | — | — | 1 | 1 | 1 | ||||||||||||||||||||
| Balance at December 31, 2007 |
20,417 | $ | 2,042 | $ | 172,899 | $ | (120,094 | ) | $ | 7,265 | $ | 62,112 | $ | (15,692 | ) | ||||||||||||
| Exercise of stock options |
159 | 16 | 1,159 | — | — | 1,175 | |||||||||||||||||||||
| Share-based compensation expense |
— | — | 1,267 | — | — | 1,267 | |||||||||||||||||||||
| Proceeds from issuance of common stock |
687 | 69 | 5,362 | — | — | 5,431 | |||||||||||||||||||||
| Restricted stock awards |
107 | 11 | 1,439 | — | — | 1,450 | |||||||||||||||||||||
| Shares issued for interest on convertible debt |
54 | 5 | 592 | — | — | 597 | |||||||||||||||||||||
| Shares issued for principal on convertible debt |
1,107 | 111 | 9,612 | — | — | 9,723 | |||||||||||||||||||||
| Retirement of shares |
(10 | ) | (1 | ) | (102 | ) | — | — | (103 | ) | |||||||||||||||||
| Net loss |
— | — | — | (14,808 | ) | — | (14,808 | ) | $ | (14,808 | ) | ||||||||||||||||
| Other comprehensive income |
|||||||||||||||||||||||||||
| Foreign currency translation adjustments |
— | — | — | — | 1,646 | 1,646 | 1,646 | ||||||||||||||||||||
| Pension adjustment, net of tax of $1,701 |
— | — | — | — | (5,240 | ) | (5,240 | ) | (5,240 | ) | |||||||||||||||||
| Unrealized loss on marketable securities |
— | — | — | — | (3 | ) | (3 | ) | (3 | ) | |||||||||||||||||
| Balance at December 31, 2008 |
22,521 | $ | 2,253 | $ | 192,228 | $ | (134,902 | ) | $ | 3,668 | $ | 63,247 | $ | (18,405 | ) | ||||||||||||
| Exercise of stock options |
757 | 76 | 5,498 | — | — | 5,574 | |||||||||||||||||||||
| Share-based compensation expense |
— | — | 1,637 | — | — | 1,637 | |||||||||||||||||||||
| Proceeds from issuance of common stock |
2,773 | 277 | 20,728 | — | — | 21,005 | |||||||||||||||||||||
| Restricted stock awards |
30 | 3 | 1,060 | — | — | 1,063 | |||||||||||||||||||||
| Shares issued for bonus payment |
85 | 9 | 629 | — | — | 638 | |||||||||||||||||||||
| Shares issued for interest on convertible debt |
19 | 2 | 90 | — | — | 92 | |||||||||||||||||||||
| Conversion of principal into shares of common stock |
171 | 17 | 3,197 | — | — | 3,214 | |||||||||||||||||||||
| Retirement of shares |
(35 | ) | (4 | ) | (492 | ) | — | — | (496 | ) | |||||||||||||||||
| Net loss |
— | — | — | (22,912 | ) | — | (22,912 | ) | $ | (22,912 | ) | ||||||||||||||||
| Other comprehensive income |
|||||||||||||||||||||||||||
| Foreign currency translation adjustments |
— | — | — | — | 939 | 939 | 939 | ||||||||||||||||||||
| Pension adjustment, net of tax of $922 |
— | — | — | — | 3,991 | 3,991 | 3,991 | ||||||||||||||||||||
| Balance at December 31, 2009 |
26,321 | $ | 2,633 | $ | 224,575 | $ | (157,814 | ) | $ | 8,598 | $ | 77,922 | $ | (17,982 | ) | ||||||||||||
The accompanying notes are an integral part of these consolidated financial statements.
58
Table of Contents
MAXWELL TECHNOLOGIES, INC. AND SUBSIDIARIES
CONSOLIDATED STATEMENTS OF CASH FLOWS
(in thousands)
| Years Ended December 31, | ||||||||||||
| 2009 | 2008 | 2007 | ||||||||||
| Operating activities: |
||||||||||||
| Net loss |
$ | (22,912 | ) | $ | (14,808 | ) | $ | (15,733 | ) | |||
| Adjustments to reconcile net loss to net cash used in operating activities: |
||||||||||||
| Depreciation |
5,293 | 4,941 | 4,240 | |||||||||
| Amortization |
643 | 573 | 360 | |||||||||
| Amortization of debt discount and prepaid debt costs |
737 | 2,388 | 3,567 | |||||||||
| Loss (gain) on embedded derivative and warrant liabilities |
5,251 | (1,217 | ) | (4,528 | ) | |||||||
| Pension cost (benefit) |
574 | (237 | ) | (659 | ) | |||||||
| Stock based compensation expense |
2,700 | 2,717 | 2,936 | |||||||||
| Shares issued for bonus payment |
638 | — | — | |||||||||
| Loss on sales of property and equipment |
34 | — | 63 | |||||||||
| Shares issued for interest expense |
92 | 597 | 794 | |||||||||
| Provision for losses on accounts receivable |
(52 | ) | 341 | 52 | ||||||||
| Changes in operating assets and liabilities, net of effect of acquisitions and dispositions: |
||||||||||||
| Trade and other accounts receivable |
(6,792 | ) | 41 | (3,645 | ) | |||||||
| Inventories |
905 | (3,508 | ) | 493 | ||||||||
| Prepaid expenses and other assets |
655 | (1,574 | ) | (2,046 | ) | |||||||
| Deferred income taxes |
1,547 | (1,415 | ) | (1,066 | ) | |||||||
| Accounts payable and accrued liabilities |
9,620 | 2,649 | (180 | ) | ||||||||
| Accrued employee compensation |
245 | 1,409 | 284 | |||||||||
| Net liabilities of discontinued operations |
— | — | (63 | ) | ||||||||
| Other long-term liabilities |
(177 | ) | 128 | 502 | ||||||||
| Net cash used in operating activities |
(999 | ) | (6,975 | ) | (14,629 | ) | ||||||
| Investing activities: |
||||||||||||
| Purchases of property and equipment |
(4,951 | ) | (7,105 | ) | (4,708 | ) | ||||||
| Proceeds from sale of property and equipment |
— | — | 22 | |||||||||
| Maturities of marketable securities |
— | 8,136 | 3,228 | |||||||||
| Purchases of marketable securities |
— | (501 | ) | (7,635 | ) | |||||||
| Purchases of intangible assets |
— | (149 | ) | — | ||||||||
| Net cash provided by (used in) investing activities |
(4,951 | ) | 381 | (9,093 | ) | |||||||
| Financing activities: |
||||||||||||
| Principal payments on long-term debt and short-term borrowings |
(12,604 | ) | (10,082 | ) | (7,817 | ) | ||||||
| Proceeds from long-term and short-term borrowings |
9,217 | 7,686 | 9,355 | |||||||||
| Retirement of shares |
(496 | ) | (103 | ) | (298 | ) | ||||||
| Proceeds from issuance of company stock |
26,579 | 6,606 | 28,489 | |||||||||
| Net cash provided by financing activities |
22,696 | 4,107 | 29,729 | |||||||||
| Increase (decrease) in cash and cash equivalents from operations |
16,746 | (2,487 | ) | 6,007 | ||||||||
| Effect of exchange rate changes on cash and cash equivalents |
260 | 484 | 413 | |||||||||
| Increase (decrease) in cash and cash equivalents |
17,006 | (2,003 | ) | 6,420 | ||||||||
| Cash and cash equivalents at beginning of year |
12,576 | 14,579 | 8,159 | |||||||||
| Cash and cash equivalents at end of year |
$ | 29,582 | $ | 12,576 | $ | 14,579 | ||||||
| Cash paid for: |
||||||||||||
| Interest |
$ | 314 | $ | 660 | $ | 1,094 | ||||||
| Income taxes |
$ | 21 | $ | 168 | $ | — | ||||||
| Supplemental schedule of noncash investing and financing activities: |
||||||||||||
| Shares issued for interest payable |
$ | 92 | $ | 597 | $ | 794 | ||||||
| Shares issued for payment on long-term debt |
$ | — | $ | 9,723 | $ | — | ||||||
| Conversion of principal into shares of common stock |
$ | 2,778 | $ | — | $ | — | ||||||
| Purchase of intangible asset under note |
$ | — | $ | 592 | $ | — | ||||||
The accompanying notes are an integral part of these consolidated financial statements.
59
Table of Contents
MAXWELL TECHNOLOGIES, INC. AND SUBSIDIARIES
NOTES TO CONSOLIDATED FINANCIAL STATEMENTS
Unless the context otherwise requires, all references to “Maxwell,” the “Company,” “we,” “us,” and “our” refer to Maxwell Technologies, Inc. and its subsidiaries; all references to “Maxwell SA” refer to our European Subsidiary, Maxwell Technologies, SA; all references to “I-Bus/Phoenix” refer to our subsidiary, I-Bus/Phoenix, Inc., and its subsidiaries; and all references to “PurePulse” refer to our non-operating subsidiary, PurePulse Technologies, Inc.
Note 1—Description of Business and Summary of Significant Accounting Policies
Description of Business
Maxwell Technologies, Inc. is a Delaware corporation originally incorporated in 1965 under the name Maxwell Laboratories, Inc. In 1996, the Company changed its name to Maxwell Technologies, Inc. and is headquartered in San Diego, California.
Maxwell operates as a single operating segment, High Reliability, which is comprised of two manufacturing locations (San Diego, California and Rossens, Switzerland). In addition, the Company has a contract manufacturer in the Longgang District, Shenzhen China. Maxwell operates as one operating segment called High Reliability, which is comprised of three product lines:
| • | Ultracapacitors: Our primary focus, ultracapacitors, are energy storage devices that possess a unique combination of high power density, extremely long operational life and the ability to charge and discharge very rapidly. Our BOOSTCAP® ultracapacitor cells and multi-cell packs and modules provide highly reliable energy storage and power delivery solutions for applications in multiple industries, including transportation, energy, consumer and industrial electronics and telecommunications. |
| • | High-Voltage Capacitors: Our CONDIS® high-voltage capacitors are extremely robust devices that are designed and manufactured to perform reliably for decades in all climates. These products include grading and coupling capacitors and capacitive voltage dividers that are used to ensure the safety and reliability of electric utility infrastructure and other applications involving transport, distribution and measurement of high-voltage electrical energy. |
| • | Radiation-Mitigated Microelectronic Products: Our radiation-mitigated microelectronic products include high-performance, high-density power modules, memory modules and single board computers that incorporate our proprietary RADPAK® packaging and shielding technology and novel architectures that enable them to withstand environmental radiation effects and perform reliably in space. |
The Company’s products are designed and manufactured to perform reliably for the life of the products and systems into which they are integrated. The Company achieves high reliability through the application of proprietary technologies and rigorously controlled design, development, manufacturing and test processes.
Financial Statement Presentation
The accompanying consolidated financial statements include the accounts of Maxwell Technologies, Inc. and its subsidiaries and have been prepared in accordance with accounting principles generally accepted in the United States (“U.S. GAAP”). All intercompany transactions and account balances have been eliminated in consolidation.
60
Table of Contents
Liquidity
As of December 31, 2009, the Company had approximately $29.6 million in cash and cash equivalents with an additional $8.0 million in restricted cash for a total of $37.6 million. The cash restriction will be released when the convertible debenture is repaid or converted.
The Company has been conducting an inquiry into the nature of certain payments made to a former independent sales agent in China associated with sales of high voltage capacitor products produced by Maxwell’s Swiss subsidiary. The Company has been voluntarily sharing information with the Securities and Exchange Commission and the Department of Justice, and discussions with those authorities are ongoing. For accounting purposes, based on the Company’s estimate of a potential settlement range of $9.3 million to $20.0 million, the company recorded an accrual of $9.3 million in the fourth quarter of 2009. For additional information, refer to Note 10—Commitments and Contingencies.
Based on the Company’s assessment of its current and long-term obligations, management believes it will have adequate resources to fund working capital requirements, obligations as they become due, capital equipment additions and product development expenditures for the next several years.
Reclassifications
Certain prior period amounts in the consolidated statement of operations have been reclassified to conform to the current period presentation. These reclassifications do not impact the reported net loss and do not have a material impact on the presentation of the overall financial statements.
Use of Estimates
The preparation of the financial statements in conformity with accounting principles generally accepted in the United States of America requires management to make estimates and assumptions that affect reported amounts and related disclosures. These estimates include, but are not limited to, assessing the collectability of accounts receivable, applied and unapplied production costs, production capacities, the usage and recoverability of inventories and long-lived assets, including deferred income taxes, the incurrence of losses on warranty costs, stock compensation expense, impairment of goodwill and other intangible assets, estimations of the cost to complete for certain projects and research and development projects, estimation of the probability that the performance criteria of restricted stock awards will be met and the fair value of warrants and embedded conversion options related to convertible debentures. The markets for the Company’s products are extremely competitive and are characterized by rapid technological change, new product development, product obsolescence and evolving industry standards. In addition, price competition is intense and significant price erosion generally occurs over the life of a product. As a result of such factors, actual results could differ from the estimates used by management.
Revenue Recognition
Sales revenue is derived from the sale of manufactured products directly to customers. For certain long-term contracts, revenue is recognized at the time costs are incurred and license fees and service revenue is recognized when the performance requirements have been met. Product revenue is recognized, according to the guidelines of the Securities and Exchange Commission (“SEC”) Staff Accounting Bulletin (“SAB”) Numbers 101, Revenue Recognition in Financial Statements, and 104, Revenue Recognition, when all of the following criteria are met: (1) persuasive evidence of an arrangement exists (upon contract signing or receipt of an authorized purchase order from a customer); (2) title passes to the customer at either shipment from our facilities or receipt at the customer facility, depending on shipping terms; (3) price is deemed fixed or determinable and free of contingencies or significant uncertainties; and (4) collectability is reasonably assured. If a volume discount is offered, revenue is recognized at the lowest price to the customer. This method has been consistently applied from period to period and there is no right of return.
61
Table of Contents
Revenue generated from fixed price contracts is recognized at the time costs are incurred and is calculated on a percentage of completion basis measured by the percentage of cost incurred to date to the estimated costs for each contract, as required by the Construction-Type and Production-Type Contracts Subtopic of the Financial Accounting Standards Board (“FASB”) Accounting Standards Codification (“ASC”) and is limited by the funding of the prime contractor. Provisions for estimated losses on incomplete contracts are made in the period in which such losses are determined.
From time to time the Company has entered into multiple-element contractual arrangements with elements of software that are essential to the functionality of the delivered elements. Additionally, the Company has contracts where all the elements of the agreement need to be delivered and accepted by the customer prior to any revenue being recognized for the agreement. The Company recognizes revenue on the delivered elements when vendor-specific objective evidence (“VSOE”) of the fair value of the undelivered elements exists in accordance with the Software Revenue Recognition Subtopic of the FASB ASC. The Company has entered into one contract whereby the Company has delivered certain elements and VSOE of fair value of the undelivered elements did not exist. As of December 31, 2009, the Company has recorded approximately $2.1 million of deferred revenue related to these contracts.
For contract research and development arrangements that contain up-front or milestone-based payments, the Company recognizes revenue using the proportional performance method based on the percentage of costs incurred relative to the total costs estimated to be incurred to complete the contract. Revenue recognition computed under this methodology is compared with the amount of non-refundable cash payments received or contractually receivable at the reporting date and the lesser of the two amounts is recognized as revenue at each reporting date. The proportional performance methodology applied by the Company utilizes an input based measure, specifically costs incurred to date, to determine proportional performance because the Company believes the use of an input measure is a reasonable surrogate of proportional performance compared to an output based measure, such as milestones. Amounts billed in advance are recorded as deferred revenue on the balance sheet. Since payments received are generally non-refundable, the termination of a contract by a customer prior to its completion could result in an immediate recognition of deferred revenue relating to payments already received but not previously recognized as revenue.
Cash and Cash Equivalents
The Company invests its excess cash in debt instruments of the U.S. Government and its agencies, bank certificates of deposit; commercial paper and high-quality corporate issuers. All highly liquid instruments with an original maturity of three months or less from purchase are considered cash equivalents, and those with original maturities greater than three months on the date of purchase are considered investments in marketable securities. The Company’s investments in marketable securities are classified as available-for-sale and are reported at fair value, with unrealized gains and losses included in stockholders’ equity as a separate component of accumulated other comprehensive income. Realized gains or losses and other-than-temporary declines in value, if any, on available-for-sale securities are reported in other income or expense as incurred. The Company recognized no net realized gains in the years ended December 31, 2009 and 2008. The Company uses the specific identification method on sales of investments.
Restricted Cash
The Company’s convertible debentures agreement requires the Company to maintain minimum cash balances of at least $8.0 million. This amount is classified as restricted cash at December 31, 2009 and 2008. At December 31, 2008 the restricted cash was classified as a current asset. However, since the holder of convertible debentures elected to delay the payments that were due in June, September and December 2009 until June, September and December 2011, respectively, the restricted cash was classified as a non-current asset as of December 31, 2009.
62
Table of Contents
Accounts Receivable
Trade receivables are stated at gross invoiced amount less discounts, other allowances and allowance for uncollectible accounts.
Allowance for Doubtful Accounts
The allowance for doubtful accounts reflects management’s best estimate of probable losses inherent in the accounts receivable balance. Management determines the allowance for doubtful accounts based on known troubled accounts, historical experience and other currently available evidence.
Inventories
Inventories are stated at the lower of cost (first-in first-out basis) or market. Finished goods and work-in-process inventory values include the cost of raw materials, labor and manufacturing overhead. Inventory when written down to market value establishes a new cost basis and its value is not subsequently increased based upon changes in underlying facts and circumstances. The Company makes adjustments to reduce the cost of inventory to its net realizable value, if required, for estimated excess obsolete inventories. Factors influencing these adjustments include inventories on-hand compared to historical and estimated future usage and sales for existing and new products and assumptions about the likelihood of obsolescence. Unabsorbed and underabsorbed costs are treated as expense in the period incurred.
Property and Equipment
Property and equipment are carried at cost and are depreciated using the straight-line method. Depreciation and amortization is provided over the estimated useful lives of the related assets (three to ten years). Leasehold improvements are amortized over the shorter of their estimated useful lives or the terms of the lease. Leasehold improvements funded by the landlord are recorded as assets and deferred liabilities and are amortized over the lease term.
Goodwill
Goodwill, which represents the excess of the cost of an acquired business over the net of the fair value assigned to its assets acquired and liabilities assumed, is not amortized. Instead, goodwill is assessed for impairment under the Intangibles—Goodwill and Other Topic of the FASB ASC. The Company tests goodwill and has established December 31 as the annual impairment test date, using a fair value approach.
Long-Lived Assets and Intangible Assets
Property and equipment and intangible assets are reviewed for impairment whenever events and changes in business circumstances indicate the carrying value of the assets may not be recoverable. If the Company determines that the carrying value of the asset is not recoverable, a permanent impairment charge is recorded for the amount by which the carrying value of the long-lived asset exceeds its fair value. Intangible assets with finite lives continue to be amortized on a straight-line basis over their useful lives of 10 to 12 years and are evaluated for impairment whenever events, or changes in circumstances, indicate that their carrying value may not be recoverable under the guidance.
Warranty Obligation
The Company provides product warranties in conjunction with certain product sales. The majority of the Company’s warranties are for one to two years in the normal course of business. The Company accrues for the estimated warranty at the time of sale based on historical warranty expenses. The estimated warranty liability is calculated based on historical warranty expenses plus any known or expected change in warranty exposure.
63
Table of Contents
Income Taxes
The Company accounts for income taxes in accordance with the Income Taxes Topic of the FASB ASC, which requires the use of the liability method of accounting for deferred income taxes. Under this method, deferred income taxes are recorded to reflect the tax consequences on future years of temporary differences between the tax basis of assets and liabilities and their financial reporting amounts at each period end. If it is more likely than not that some portion or all of a deferred tax asset will not be realized, a valuation allowance is recognized. The guidance also provides criteria for the recognition, measurement, presentation and disclosures of uncertain tax positions. A tax benefit from an uncertain tax position may be recognized if it is “more likely than not” that the position is sustainable based solely on its technical merits.
Concentration of Credit Risk
The Company maintains cash balances at various financial institutions primarily in California and such balances commonly exceed the $250,000 Federal Deposit Insurance Corporation insurance limit. The Company has not experienced any losses in such accounts and management believes that the Company is not exposed to any significant credit risk with respect to such cash and cash equivalents.
Financial instruments, which subject the Company to potential concentrations of credit risk, consist principally of the Company’s accounts receivable. The Company’s accounts receivable result from product sales to customers in various industries and in various geographical areas, both domestic and foreign. The Company performs credit evaluations of its customers and generally requires no collateral. One customer, ABB Ltd., provided 10%, 15% and 18% of revenue in 2009, 2008 and 2007, respectively and comprised 8% and 15% of accounts receivable balances at December 31, 2009 and 2008, respectively.
Research and Development Expense
Research and development expenditures are expensed in the period incurred.
Advertising Expense
Advertising costs are expensed in the period incurred. Advertising expense was $52,000, $70,000 and $206,000 for fiscal 2009, 2008 and 2007, respectively.
Shipping and Handling
The Company recognizes shipping and handling costs as a component of cost of sales. Total shipping and handling expense included in cost of sales was $878,000, $1.3 million, and $857,000 for the years ended 2009, 2008 and 2007, respectively.
Patent Defense Costs
The Company capitalizes patent legal defense costs as additional cost of the patents when a successful outcome in the patent defense case is probable. If the Company is ultimately unsuccessful the costs would be charged to expense. The legal expenses associated with our patent infringement lawsuit against NessCap Co., Ltd., and NessCap, Inc. (“NessCap”) in the United States District Court for the Southern District of California have been capitalized. In February 2009, the Company entered into a settlement agreement with NessCap. In the settlement agreement, Maxwell and NessCap agreed to drop all pending claims against each other and agreed to a ten year, worldwide cross license of each company’s patents and a mutual covenant not to sue on patents either party has a right to assert. As part of the settlement agreement, NessCap must pay $1 million to Maxwell in annual installments of $200,000 through 2013. During the case the Company capitalized patent legal defense costs as additional costs of the patents and is now amortizing these capitalized costs over the remaining lives of these patents. Payments received from NessCap under this settlement have been and will continue to be netted
64
Table of Contents
against these capitalized patent legal defense costs upon receipt. Additionally, Maxwell believes the value of the intellectual property involved in the lawsuit is greater than those capitalized costs. As of December 31, 2009 unamortized capitalized legal costs total $1.6 million are classified as intangible assets in the consolidated balance sheet. The recovery of costs upon a successful outcome will reduce the asset carrying value.
Foreign Currencies
The Company’s primary foreign currency exposure is related to its subsidiary in Switzerland. Maxwell SA has Euro and local currency (Swiss Franc) revenue and operating expenses. Changes in these currency exchange rates impact the U.S. dollar amount of revenue and expenses as well as loans in Swiss Francs. The functional currency of the Swiss subsidiary is the Swiss Franc. Assets and liabilities of Maxwell SA are translated at month-end exchange rates, and revenues, expenses, gains and losses are translated at rates of exchange that approximate the rate in effect at the time of the transaction. Any translation adjustments resulting from this process are shown separately as a component of accumulated other comprehensive income (loss) within stockholders’ equity in the consolidated balance sheets. Foreign currency transaction gains and losses are reported in cost of sales and selling, general and administrative expenses in the consolidated statements of operations.
Foreign Currency Derivative Instruments
As part of its risk management strategy, Maxwell uses forward contracts to hedge certain foreign currency exposures. Maxwell’s objective is to offset gains or losses resulting from these exposures with opposing gains or losses on the forward contracts, thereby reducing volatility of earnings created by these foreign currency exposures. In accordance with the Derivatives and Hedging Topic of the FASB ASC, the fair values of the forward contracts are estimated based on quoted market prices and all forward contracts are recorded in “prepaid expenses and other current assets” or “accounts payable and accrued liabilities” on the consolidated balance sheet at fair value. Any gains or losses recognized on these contracts are recorded in “cost of sales” and “selling, general and administrative” expense on the consolidated statements of operations.
Other Comprehensive Income
Comprehensive income, as defined, includes all changes in equity during a period from non-owner sources. Net loss and other comprehensive loss, including foreign currency translation adjustments, pension accounting and unrealized gains and losses on investments in marketable securities are reported, net of their related tax effect, to arrive at comprehensive loss. Accumulated other comprehensive income consisted of the following (in thousands):
| December 31, | ||||||||
| 2009 | 2008 | |||||||
| Accumulated other comprehensive income: |
||||||||
| Unrealized gain on foreign currency translation |
$ | 9,679 | $ | 8,740 | ||||
| Pension adjustment, net of taxes |
(1,079 | ) | (5,070 | ) | ||||
| Unrealized loss on investments |
(2 | ) | (2 | ) | ||||
| $ | 8,598 | $ | 3,668 | |||||
65
Table of Contents
Loss Per Share
Basic loss per share is calculated using the weighted average number of common shares outstanding. Diluted loss per share is calculated on the basis of the weighted average number of common shares outstanding plus any dilutive effect of outstanding stock options, restricted stock awards and restricted stock unit awards of the Company, assuming their exercise using the “treasury stock” method. The following table sets forth the computation of basic and diluted loss per share (in thousands, except per share data):
| Years Ended December 31, | ||||||||||||
| 2009 | 2008 | 2007 | ||||||||||
| Numerator |
||||||||||||
| Net loss |
$ | (22,912 | ) | $ | (14,808 | ) | $ | (15,733 | ) | |||
| Denominator |
||||||||||||
| Basic and Diluted: |
||||||||||||
| Weighted average shares outstanding |
24,457 | 20,819 | 18,285 | |||||||||
| Basic and diluted net loss per share |
$ | (0.94 | ) | $ | (0.71 | ) | $ | (0.86 | ) | |||
The following table summarizes instruments that may be convertible into common shares that are not included in the denominator used in the diluted net loss per share calculation because to do so would be antidilutive (in thousands):
| Common Stock |
2009 | 2008 | 2007 | |||
| Outstanding options to purchase common stock |
1,625 | 2,104 | 2,071 | |||
| Restricted stock awards outstanding |
253 | 380 | 352 | |||
| Shares issuable on conversion of convertible debentures |
514 | 797 | 1,398 | |||
| Warrants to purchase common stock |
462 | 431 | 419 | |||
| Restricted stock unit awards |
16 | — | — |
Stock-Based Compensation
The Company’s primary types of share-based compensation consist of stock options, restricted stock, restricted stock units and an employee stock purchase plan, which are accounted for in accordance with the Compensation—Stock Compensation Subtopic of the FASB ASC.
Pending Accounting Pronouncements
In January 2010, the FASB issued ASU 2010-06, Fair Value Measurements and Disclosures, to improve the disclosures about fair value measurements. This update requires the Company to disclose separately the amounts of significant transfers in and out of Level 1 and Level 2 fair value measurements and describe the reasons for the transfers. In the reconciliation for fair value measurements using significant unobservable inputs (Level 3), the Company will be required to present separately information about purchases, sales, issuances and settlements (that is, on a gross basis rather than as one net number). This update provides clarification as to the level of disaggregation in determining the appropriate classes of assets and liabilities. This update clarifies disclosures about inputs and valuation techniques for Level 2 and Level 3 fair value measurements. The new disclosures and clarifications of existing disclosures are effective for interim and reporting periods beginning after December 15, 2009, except for the disclosures about purchases, sales, issuances and settlements in the roll forward of activity in Level 3 fair value measurements. Those disclosures are effective for fiscal years beginning after December 15, 2010, and for interim periods within those fiscal year. As this update is only disclosure-related, it will not have an impact on the financial position and results of operations.
66
Table of Contents
In September 2009, the FASB reached a consensus on ASU 2009-13, Multiple-Deliverable Revenue Arrangements, and ASU 2009-14, Certain Revenue Arrangements That Include Software Elements. ASU 2009-13 modifies the requirements that must be met for an entity to recognize revenue from the sale of a delivered item that is part of a multiple-element arrangement when other items have not yet been delivered. ASU 2009-13 eliminates the requirement that all undelivered elements must have either: i) VSOE or ii) third-party evidence (“TPE”) before an entity can recognize the portion of an overall arrangement consideration that is attributable to items that already have been delivered. In the absence of VSOE or TPE of the standalone selling price for one or more delivered or undelivered elements in a multiple-element arrangement, entities will be required to estimate the selling prices of those elements. Overall arrangement consideration will be allocated to each element (both delivered and undelivered items) based on their relative selling prices, regardless of whether those selling prices are evidenced by VSOE or TPE or are based on the entity’s estimated selling price. The residual method of allocating arrangement consideration has been eliminated. ASU 2009-14 modifies the software revenue recognition guidance to exclude from its scope tangible products that contain both software and non-software components that function together to deliver a product’s essential functionality. These new updates are effective for revenue arrangements entered into or materially modified in fiscal years beginning on or after June 15, 2010. Early adoption is permitted. This new pronouncement would allow the Company to recognize revenue on multiple-deliverable arrangements earlier than in previous years. Although the Company is unable to estimate what those amounts will be in the future, the amount recognized for multiple-deliverable revenue arrangements were approximately $0, $896,000 and $1.1 million for the years ended December 31, 2009, 2008 and 2007, respectively. As of December 31, 2009 and 2008, there was approximately $2.1 million and $1.9 million, respectively of deferred revenue related to multiple-deliverable revenue arrangements.
Business Enterprise Information
The Company operates as one reportable operating segment, High Reliability, according to the Disclosures about Segments of an Enterprise and Related Information Topic of the FASB ASC, which establishes standards for the way that public business enterprises report information about operating segments in annual consolidated financial statements. The chief operating decision maker does not regularly review discrete financial information below the consolidated level.
67
Table of Contents
Revenue by product line is provided below (in thousands):
| Year ending December 31, | |||||||||
| 2009 | 2008 | 2007 | |||||||
| Revenues: |
|||||||||
| Ultracapacitors |
$ | 43,790 | $ | 28,747 | $ | 17,435 | |||
| Radiation-Mitigated Microelectronic Products |
17,738 | 15,610 | 13,360 | ||||||
| High-Voltage Capacitors |
39,787 | 36,082 | 25,913 | ||||||
| Total |
$ | 101,315 | $ | 80,439 | $ | 56,708 | |||
| Year ending December 31, | |||||||||
| 2009 | 2008 | 2007 | |||||||
| Revenues from external customers located in: |
|||||||||
| United States |
$ | 25,534 | $ | 23,184 | $ | 17,195 | |||
| Germany |
24,800 | 20,463 | 11,116 | ||||||
| China |
16,905 | 12,123 | 7,871 | ||||||
| Hong Kong |
7,354 | 2,932 | 1,819 | ||||||
| France |
4,332 | 3,871 | 3,793 | ||||||
| Sweden |
3,370 | 2,707 | 3,199 | ||||||
| Switzerland |
2,875 | 5,214 | 2,711 | ||||||
| Korea |
2,129 | 661 | 17 | ||||||
| Italy |
1,818 | 598 | 771 | ||||||
| Spain |
1,699 | 378 | 387 | ||||||
| Canada |
1,555 | 1,708 | 1,594 | ||||||
| Russia |
1,387 | 1,030 | 973 | ||||||
| Netherlands |
1,206 | 294 | 131 | ||||||
| United Kingdom |
982 | 1,862 | 1,340 | ||||||
| All other countries |
5,369 | 3,414 | 3,791 | ||||||
| Total |
$ | 101,315 | $ | 80,439 | $ | 56,708 | |||
| Year ending December 31, | |||||||||
| 2009 | 2008 | 2007 | |||||||
| (in thousands) | |||||||||
| Long-lived assets: |
|||||||||
| United States |
$ | 9,990 | $ | 8,870 | $ | 6,153 | |||
| Switzerland |
7,804 | 9,285 | 8,483 | ||||||
| Total |
$ | 17,794 | $ | 18,155 | $ | 14,636 | |||
68
Table of Contents
Note 2—Balance Sheet Details (in thousands):
| Year ending December 31, | ||||||||
| 2009 | 2008 | |||||||
| Inventory: |
||||||||
| Raw material and purchased parts |
$ | 10,190 | $ | 10,141 | ||||
| Work-in-process |
3,685 | 4,802 | ||||||
| Finished goods |
6,555 | 6,465 | ||||||
| Inventory reserves |
(2,642 | ) | (2,906 | ) | ||||
| $ | 17,788 | $ | 18,502 | |||||
| Property and equipment: |
||||||||
| Machinery, furniture and office equipment |
$ | 40,475 | $ | 35,288 | ||||
| Computer hardware and software |
6,506 | 6,670 | ||||||
| Leasehold improvements |
4,363 | 4,231 | ||||||
| Construction in Progress |
1,085 | 3,500 | ||||||
| 52,429 | 49,689 | |||||||
| Less accumulated depreciation and amortization |
(35,349 | ) | (32,334 | ) | ||||
| $ | 17,080 | $ | 17,355 | |||||
| Accounts payable and accrued liabilities |
||||||||
| Accounts payable |
$ | 7,955 | $ | 7,250 | ||||
| Contingent settlement |
9,300 | — | ||||||
| Other accrued liabilities |
4,029 | 2,838 | ||||||
| Customer deposits |
2,388 | 2,504 | ||||||
| $ | 23,672 | $ | 12,592 | |||||
Warranty Reserve Analysis
| Years Ended December 31, |
||||||||
| 2009 | 2008 | |||||||
| Accrued Warranty: |
||||||||
| Beginning balance |
$ | 905 | $ | 768 | ||||
| New product warranties |
511 | 763 | ||||||
| Settlement of warranties |
(795 | ) | (666 | ) | ||||
| Other changes/adjustments to warranties |
(33 | ) | 40 | |||||
| Ending balance |
$ | 588 | $ | 905 | ||||
Leasehold improvements
Certain leasehold improvements funded by the landlord are recorded as assets and deferred liabilities and are amortized over the shorter of the estimated useful life or the lease term. As of December 31, 2009 and 2008 the Company had $461,000 and $628,000, respectively of unamortized leasehold improvements funded by the landlord. The Company has a related amount of deferred rent of $388,000, which is included in other long-term liabilities at December 31, 2009.
Note 3—Goodwill and Intangibles
The Company annually reviews for impairment of goodwill under the Intangibles—Goodwill and Other Topic of the FASB ASC. The goodwill impairment test is a two-step process. The first step consists of estimating the fair value of the reporting unit and comparing the estimated fair value with the carrying value, which includes
69
Table of Contents
the goodwill. If the fair value is less than the carrying value, a second step is performed to compute the amount of the impairment by determining an implied fair value of goodwill. The implied fair value of goodwill is the residual fair value derived by deducting the fair value of a reporting unit’s assets and liabilities from its estimated total fair value, which was calculated in step one. An impairment charge would represent the excess of the carrying amount of the reporting unit’s goodwill over the implied fair value of their goodwill. The guidance requires goodwill to be tested annually at the same time every year or when an event occurs or circumstances change such that it is reasonably possible that impairment may exist. The Company selected December 31 as its annual testing date. As a result of the Company’s annual assessment as of December 31, 2009 and 2008, no impairment was indicated.
Intangible assets are reviewed for impairment whenever events and changes in business circumstances indicate the carrying value of the assets may not be recoverable. If the Company determines that the carrying value of the asset is not recoverable, a permanent impairment charge is recorded for the amount by which the carrying value of the asset exceeds its fair value.
The change in the carrying amount of goodwill from January 1, 2008 to December 31, 2009 is as follows (in thousands):
| Balance at January 1, 2008 |
$ | 21,183 | |
| Foreign currency translation adjustments |
1,225 | ||
| Balance at December 31, 2008 |
22,408 | ||
| Foreign currency translation adjustments |
391 | ||
| Balance at December 31, 2009 |
$ | 22,799 | |
Acquired intangible assets subject to amortization at December 31, 2009, and 2008 were as follows (in thousands):
| Useful Life |
Gross Carrying Value |
Accumulated Amortization |
Cumulative Foreign Currency Adjustment |
Net Carrying Value | ||||||||||||
| As of December 31, 2009: |
||||||||||||||||
| Patents |
13 years | $ | 3,276 | $ | (1,263 | ) | $ | — | $ | 2,013 | ||||||
| Developed core technology |
10 years | 1,100 | (1,002 | ) | 288 | 386 | ||||||||||
| Patent license agreement |
5 years | 741 | (194 | ) | (24 | ) | 523 | |||||||||
| $ | 5,117 | $ | (2,459 | ) | $ | 264 | $ | 2,922 | ||||||||
| As of December 31, 2008: |
||||||||||||||||
| Patents |
13 years | $ | 3,476 | $ | (910 | ) | $ | — | $ | 2,566 | ||||||
| Developed core technology |
10 years | 1,100 | (851 | ) | 284 | 533 | ||||||||||
| Patent license agreement |
5 years | 741 | (56 | ) | (29 | ) | 656 | |||||||||
| $ | 5,317 | $ | (1,817 | ) | $ | 255 | $ | 3,755 | ||||||||
70
Table of Contents
Amortization expense for intangible assets was $643,000, $571,000 and $360,000 for the years ended December 31, 2009, 2008 and 2007, respectively. The estimated amortization for each of the next five years ended December 31 is as follows (in thousands):
| Fiscal Years |
|||
| 2010 |
$ | 635 | |
| 2011 |
635 | ||
| 2012 |
571 | ||
| 2013 |
451 | ||
| 2014 |
346 | ||
| Thereafter |
284 | ||
| $ | 2,922 | ||
Actual amortization expense to be reported in future periods could differ from these estimates as a result of foreign currency translation adjustments, impairments and other factors.
Note 4—Fair Value Measurement
The convertible debentures issued on December 20, 2005 were evaluated and determined not to be conventional convertible debentures and, therefore, because of certain terms and provisions including liquidating damages under the associated registration rights agreement the embedded conversion option was bifurcated and has been accounted for as a derivative liability instrument. The stock warrants issued on December 20, 2005, in conjunction with the convertible debt were also evaluated and determined to be a derivative instrument and, therefore, classified as a liability on the balance sheet. The accounting guidance also requires that the conversion feature and warrants be recorded at fair value for each reporting period with changes in fair value recorded in our Statement of Operations. The discount value determined on the issue date of December 20, 2005 is amortized over the term of the debt. The fair value of embedded conversion options and stock warrants are based on a Black-Scholes fair value calculation. The carrying value and fair value of the convertible debentures was approximately $8.2 million and $7.7 million, respectively, as of December 31, 2009. The fair value of the convertible debentures was based on discounted cash flows of principal and interest payments using an interest rate of 5.88%.
The carrying value of restricted cash and short-term borrowings approximates fair value because of the short maturity of these instruments.
The Company records certain liabilities at fair value in accordance with the Fair Value Measurements and Disclosures Topic of the FASB ASC. As of December 31, 2009, the financial instruments to which this topic applied were financial liabilities for the conversion feature of the convertible debenture, warrants and foreign currency forward contracts.
The foreign currency derivative instruments are valued using quoted market prices. As of December 31, 2009, the fair value of foreign currency derivative instruments was nominal.
Liabilities held by the Company and measured at fair value on a recurring basis are summarized as follows (in thousands):
| Fair Value Measurements as of December 31, 2009 | ||||||||||
| Description |
Total | Active Market Prices (Level 1) |
Significant Observable Inputs (Level 2) |
Significant Unobservable Inputs (Level 3) | ||||||
| Conversion features of convertible debenture |
$ | 3,024 | — | — | $ | 3,024 | ||||
| Warrants |
$ | 2,465 | — | — | $ | 2,465 | ||||
71
Table of Contents
For those financial instruments with significant Level 3 inputs, the following table summarizes the activity for the period by investment type:
| Description |
Convertible1 Debenture |
Warrants1 | ||||
| Beginning balance, December 31, 2008 |
$ | 357 | $ | 318 | ||
| Total unrealized loss included in net loss |
2,667 | 2,147 | ||||
| Ending balance, December 31, 2009 |
$ | 3,024 | $ | 2,465 | ||
| 1 | Refer to Note 5—Convertible Debenture for the valuation model and unobservable data used to calculate fair value of the conversion features of the convertible debenture and warrants issued by the Company. |
Note 5—Convertible Debentures
On December 20, 2005, the Company issued $25 million in aggregate principal amount of senior subordinated convertible debentures (the “Debentures”) due and payable in quarterly installments of $2.8 million which commenced December 2008 through December 2009. However, the holder, at its election, could defer each quarterly payment one time, for a 24 month period. As the holder has elected to defer some quarterly installments, the outstanding principal of the Debenture at December 31, 2009 was $8.3 million; the amount is payable in June, September and December, 2011.
Interest is due quarterly with the interest rate tied to the Federal Funds Rate plus 1.125% per annum. Subject to certain limitations in the Debenture, all or a portion of the accrued and unpaid interest may be paid in shares of Maxwell’s common stock at the Company’s option. As of December 31, 2009 and 2008 the interest rate on the Debentures was 1.375%, and the accrued interest at December 31, 2009 and 2008 was $33,800 and $91,600, respectively.
At the issuance date, the Debentures were convertible by the holder at any time into 1,315,789 common shares. We also issued 394,737 warrants in connection with the issuance of the debentures; these had an exercise price of $19.00 at the issuance date. The exercise price, number of convertible shares and warrants are subject to adjustment upon certain events, such as the sale of equity securities by Maxwell at a price below the current exercise price of $16.22 per share.
Since the issuance date Maxwell has sold 6.1 million shares through various offerings at a price below $19.00 which has adjusted the conversion and warrant price to $16.22. The number of warrants has increased to 462,461 warrants, and the number of shares related to the outstanding balance of the convertible debenture adjusted to 513,845 shares as of December 31, 2009.
In the fourth quarter of 2009, the holder converted $2.8 million of principal into 171,000 shares of common stock. On the conversion dates, the common stock had fair value of $3.2 million, which was based on the quoted market price at the close of the trading days. This conversion resulted in a loss of $436,000 and is recorded as a “gain (loss) on embedded derivative and warrants” in the statement of operations. The principal and interest paid with or converted into shares of common stock and paid with cash were as follows (in thousands):
| Year Ended December 31, 2009 |
Year Ended December 31, 2008 |
Year Ended December 31, 2007 | |||||||||||||
| Value | Shares | Value | Shares | Value | Shares | ||||||||||
| Conversion of principal into shares of common stock |
$ | 2,778 | 171 | $ | 9,723 | 1,107 | $ | — | — | ||||||
| Principal paid with cash |
2,778 | N/A | 1,388 | N/A | — | — | |||||||||
| Total debenture principal payments |
$ | 5,556 | 171 | $ | 11,111 | 1,107 | $ | — | — | ||||||
| Interest paid with shares of common stock |
$ | 92 | 19 | $ | 597 | 54 | $ | 794 | 65 | ||||||
| Interest paid with cash |
122 | N/A | 356 | N/A | 795 | N/A | |||||||||
| Total debenture interest payments |
$ | 214 | 19 | $ | 953 | 54 | $ | 1,589 | 65 | ||||||
72
Table of Contents
The Debentures are convertible by the holder at any time into common shares; however after eighteen months from the issue date, Maxwell may require that a specified amount of the principal of the Debentures be converted if certain conditions are satisfied for a period of 20 consecutive trading days. To determine a fair value of this forced conversion the Company applies a Z factor, which is a theoretical measurement of the probability of this occurrence. The Z factor used as of December 31, 2009 and 2008 was 35.2% and 0.0%, respectively, for forced conversion of 50% of the conversion option at 135% of the exercise price and 22.4% and 0.0%, respectively, for forced conversion of the remaining conversion option at 175% of the exercise price. The warrants issued in connection with the issuance of the Debentures are exercisable at any time through December 20, 2010. No warrants had been exercised as of December 31, 2009.
Maxwell is accounting for the conversion option in the Debentures and the associated warrants as derivative liabilities in accordance the Derivatives and Hedging Topic of the FASB ASC. The unamortized discount attributable to the issuance date aggregate fair value of the conversion options and warrants was $118,000 and $757,000 as of December 31, 2009 and 2008, respectively, is being amortized using the effective interest method over the term of the Debentures.
The change in fair value on revaluation of debenture conversion rights and warrant liabilities represents the difference between the fair value at the end of the year and the fair value at the beginning of the year using the value calculated by the Black-Scholes pricing model. The fair value of the warrants at December 31, 2009 and 2008 was $2.5 million and $318,000 respectively and is included in “stock warrants” on the balance sheet. The net fair value of the liability to the holders and Maxwell’s conversion rights at December 31, 2009 and 2008 were liabilities of $3.0 million and $357,000 respectively which is included in “convertible debenture and long-term debt” on the balance sheet. The effect of the fair market value adjustment was a $4.8 million loss and $1.2 million gain for the fiscal year ended December 31, 2009 and 2008, respectively, which is recorded as “gain (loss) on embedded derivative and warrants”.
The fair value of the warrants and embedded conversion option is estimated on the balance sheet date using the Black-Scholes valuation model with the following assumptions:
| Convertible Shares as of December 31, |
Warrants as of December 31, |
|||||||||||||||
| 2009 | 2008 | 2009 | 2008 | |||||||||||||
| Black-Scholes Assumptions: |
||||||||||||||||
| Conversion / Exercise Price |
$ | 16.22 | $ | 17.42 | $ | 16.22 | $ | 17.42 | ||||||||
| Market Price |
$ | 17.84 | $ | 5.07 | $ | 17.84 | $ | 5.07 | ||||||||
| Expected dividends |
— | — | — | — | ||||||||||||
| Expected volatility |
86.9 | % | 99.6 | % | 67.7 | % | 82.9 | % | ||||||||
| Average risk-free interest rate |
0.98 | % | 0.37 | % | 0.47 | % | 0.76 | % | ||||||||
| Expected term/life (in years) |
1.7 | 1.0 | 1.0 | 2.0 | ||||||||||||
In the event of any default or fundamental change as defined in the Debentures, the holder will be entitled to require Maxwell to redeem the Debentures (or any portion thereof) at a price equal to the greater of (i) the applicable redemption premium (ranging from 103%-115%) and (ii) the product of (x) the number of shares in to which the Debenture is convertible using the $16.22 per share conversion price and (y) the closing price of Maxwell’s common stock on the day preceding the default or fundamental change.
The Company shall pay to each holder of registrable securities related to the embedded conversion feature and warrants liquidated damages of 1.5% of the aggregate purchase price every 30th day after a maintenance failure of the registration of the securities. These damages continue each 30 days (pro rated) until the registration failure is cured. As of December 31, 2009, if the Company was not in compliance we would incur damages of $125,000 every 30 days until we cured the maintenance failure. In addition, if the damages are not paid in 30 days after they are due the Company would incur interest of 1.0% per month on the outstanding damages.
73
Table of Contents
As long as Debentures are outstanding, the Company is required to maintain a cash balance in excess of $8.0 million. This amount is classified as restricted cash at December 31, 2009 and 2008.
Note 6—Short-Term and Long-Term Borrowings
Short-term borrowings
Maxwell’s European subsidiary, Maxwell SA, has a 2.0 million Swiss Francs (approximately $1.9 million at December 31, 2009) bank credit agreement with a Swiss bank, which renews annually. Borrowings under the credit agreement bear interest at 3.9% with repayment terms extending beyond one month from the date of funding. Borrowings under the credit agreement are unsecured and as of December 31, 2009 and 2008, the full amount available under the credit line was drawn.
Maxwell SA, has a 1.0 million Swiss Francs (approximately $966,000 as of December 31, 2009) overdraft credit agreement with a Swiss bank, which renews quarterly. Borrowings under the credit agreement bear interest at 2.05%. Borrowings under the credit agreement are unsecured and as of December 31, 2009, the full amount of the overdraft credit line was drawn.
Maxwell SA, has a 2.0 million Swiss Francs (approximately $1.9 million as of December 31, 2009) short-term loan with a Swiss bank, which renews quarterly. Borrowings under this short-term loan agreement bear interest at 2.05%. Borrowings under the short-term loan agreement are unsecured and as of December 31, 2009 and 2008, the full amount of the loan was drawn.
Long-term borrowings
Maxwell, SA had a lending agreement for the acquisition of manufacturing equipment up to 1.5 million Swiss Francs. After the acquisition of the equipment was completed the agreement converted to 48 monthly payments of 34,302 Swiss Francs with an interest rate of 2.22%. As of December 31, 2009 and 2008 the balance of the obligation was $543,000 and $863,000, respectively, with final payment due in 2011.
The Company has various financing agreements for vehicles. These agreements are for up to a five year repayment period with interest rates of 4.9% – 7.0%. At December 31, 2009 and 2008, $84,000 and $112,000, respectively, was outstanding.
The following table summarizes convertible debentures and debt (in thousands):
| December 31, 2009 |
December 31, 2008 | |||||
| Maxwell SA credit agreement |
$ | 1,932 | $ | 1,894 | ||
| Maxwell SA overdraft agreement |
966 | 916 | ||||
| U.S. Vehicle loan |
— | 15 | ||||
| Maxwell SA capital expenditure loan |
— | 218 | ||||
| Maxwell SA term loan |
1,932 | 1,894 | ||||
| U.S. short-term loan |
— | 84 | ||||
| Maxwell SA auto leases |
84 | 97 | ||||
| Maxwell SA lending agreement |
543 | 863 | ||||
| Convertible debentures |
11,240 | 13,489 | ||||
| Total convertible debentures and long-term debt |
16,697 | 19,470 | ||||
| Less current portion |
5,245 | 18,888 | ||||
| Convertible debentures and long-term debt, excluding current portion |
$ | 11,452 | $ | 582 | ||
74
Table of Contents
Payments due on borrowings during each of the five years subsequent to December 31, 2009 are as follows (in thousands):
| 2010 |
$ | 5,245 | ||
| 2011 |
8,535 | |||
| 2012 |
11 | |||
| Subtotal payments |
13,791 | |||
| Unamortized discount attributed to conversion option and warrants |
(118 | ) | ||
| Net fair value of conversion options |
3,024 | |||
| $ | 16,697 | |||
Note 7––Foreign Currency Derivative Instruments
Maxwell uses forward contracts to hedge certain monetary assets and liabilities, primarily receivables and payables, denominated in a foreign currency. The change in fair value of these instruments represents a natural hedge as gains and losses offset the changes in the underlying fair value of the monetary assets and liabilities due to movements in currency exchange rates. These contracts generally expire in one month. These contracts are considered economic hedges and are not designated as hedges under the Derivatives and Hedging Topic of the FASB ASC, and therefore, the change in the instrument’s fair value is recognized currently in earnings.
Net losses on foreign currency forward contracts included in cost of sales and selling, general and administrative are (in thousands):
| Year Ended December 31, | ||||||
| 2009 | 2008 | |||||
| Net losses on foreign currency forward contracts recognized: |
||||||
| Cost of sales |
$ | 241 | $ | — | ||
| Selling, general and administrative |
482 | — | ||||
| Total |
$ | 723 | $ | — | ||
As of December 31, 2009, the total notional amount of foreign currency forward contracts not designated as hedges was $2.4 million. The fair value of these derivatives not designated as hedging instruments was nominal at December 31, 2009. For additional information, refer to Note 4—Fair Value Measurements.
These net losses were partially offset by net gains on those monetary assets and liabilities noted above. Foreign currency transactions gains on those monetary assets and liabilities included in cost of sales and selling, general and administrative are (in thousands):
| Year Ended December 31, | ||||||
| 2009 | 2008 | |||||
| Cost of sales |
$ | 210 | $ | — | ||
| Selling, general and administrative |
481 | — | ||||
| Total |
$ | 691 | $ | — | ||
75
Table of Contents
Note 8—Stock Activity and Stock Plans
Stock sale and Equity Distribution Agreement
In November 2006, the Company filed a registration statement on Form S-3 with the Securities and Exchange Commission to, from time to time, sell up to an aggregate of $125 million of the Company’s common stock, warrants or debt securities. On August 8, 2008, the Company entered into an Equity Distribution Agreement (“EDA”) with UBS Securities, LLC (“UBS”). The EDA provides that we may offer and sell shares of our common stock, par value $0.10 per share, having an aggregate offering price of up to $15 million (the “Shares”) from time to time through UBS, as sales agent. In exchange for its services as sales agent, the Company paid UBS a commission equal to 3.5% of the gross sales price of the Shares sold. In April 2009 the Company suspended the EDA program.
In May 2009, the Company issued shares of common stock, par value $0.10 per share through a public offering underwritten by Roth Capital Partners (“Roth”) for 2 million shares with an over-allotment option to purchase an additional 300,000 shares. In exchange for its services as underwriter, the Company paid Roth a commission of 7% of the gross sales price of the shares sold.
During the year ended December 31, 2009, the Company raised $26.6 million under the S-3, Employee Stock Purchase Plan and the exercise of stock options under the Omnibus Equity Incentive Plan. This $26.6 million consists of $18.6 million in cash from the sale of 2.3 million shares, net of offering costs; $2.4 million from the sale of 473,000 shares under the EDA, net of offering costs; $4.9 million from the exercise of stock options and $671,000 under the Employee Stock Purchase Plan.
Stock Option Plans
The Company has two active share-based compensation plans as of December 31, 2009; the 2004 ESPP and 2005 Omnibus Equity Incentive Plan under which incentive stock options, non-qualified stock options, Employee Stock Purchase Plan (ESPP), restricted stock awards and restricted stock units have been granted to employees. Generally, stock options and restricted stock awards vest over periods of one to four years and have a maximum contractual period of ten years. Option and share award plans provide for accelerated vesting if there is a change of control. Stock options are granted at a price equal to the market price of Company stock at date of grant. The Company has also granted equity incentive under the 1999 Director Stock Option Plan, which 75,000 shares were reserved for future grant, was adopted in 1999 and approved by the Company’s shareholders in January 2000.
The expense for all stock based compensation that has been charged against income for the years ended December 31, 2009, 2008 and 2007 is $2.7 million, $2.7 million and $2.9 million, respectively. For the year ended December 31, 2009, the tax benefits associated with the exercise of non-qualified stock options, restricted stock grants, disqualifying dispositions of both Incentive Stock Options and stock acquired from the Company’s Employee Stock Purchase Plan was approximately $6.8 million. No tax benefit was recognized in 2009, 2008 and 2007.
Employee Stock Option Plan
The Company’s 2005 Omnibus Equity Incentive Plan (the “Incentive Plan”), was approved by the shareholders and amended at the 2007 Annual Meeting of Stockholders at the May 3, 2007 meeting to replenish the equity incentive pool by increasing the number of shares of Common Stock reserved for issuance under the Incentive Plan from 750,000 shares to 1,750,000 shares. The Incentive Plan, provides for the grant of stock based awards, including incentive stock options, non-qualified stock options, stock appreciation rights, performance awards, restricted stock, and restricted stock unit awards. This Incentive Plan shares reserved for issuance are
76
Table of Contents
replenished by forfeited shares. Additionally, the 152,000 shares cancelled from the expired 1995 stock option plan and the 1,000 shares from the 1999 Directors’ plan are added to the total available for issuance.
The fair value of each option award granted is estimated on the date of grant using the Black-Scholes valuation model with the following assumptions:
| Fiscal Year Ended December 31, 2009 |
Fiscal Year Ended December 31, 2008 |
Fiscal Year Ended December 31, 2007 | ||||
| Expected dividends |
— | — | — | |||
| Weighted average expected volatility range |
68.9% | 52.2% - 60.5% | 49.5% - 52.3% | |||
| Weighted average risk-free interest rate range |
2.0% | 2.6% - 3.1% | 4.1% - 4.9% | |||
| Weighted average expected term/life (in years) |
4.6 | 4.7 | 4.6 |
The dividend yield is zero because the Company has never paid cash dividends and has no present intention to pay cash dividends. Expected volatility is based on historical Company stock prices using a mathematical formula to measure the standard deviation of the change in the natural logarithm of our underlying stock price that is expected over a period of time, commensurate with the option life. This is expressed as an annual percentage rate required by our option-pricing model. The Company does not consider implied volatility due to the low volume of publicly traded stock options. The risk-free interest rate is derived from the zero coupon rate on U.S. Treasury instruments for the option expected life. The expected life calculation is based on the Company’s history of exercised options from previous equity-based share option grants.
Share-based compensation expense recognized in the Consolidated Statement of Operations is based on awards ultimately expected to vest. The guidance requires forfeitures to be estimated at the time of grant and revised, if necessary, in subsequent periods if actual forfeitures differ from those estimates with a cumulative catch up adjustment.
The following table summarizes total aggregate stock option activity for the period December 31, 2008 through December 31, 2009:
| Number of Shares |
Weighted Average Exercise Price |
Weighted Average Remaining Contractual Term |
Aggregate Intrinsic Value | ||||||||
| Balance at December 31, 2008 |
2,103,615 | $ | 9.76 | ||||||||
| Granted |
408,350 | $ | 9.25 | ||||||||
| Exercised |
(655,920 | ) | $ | 7.84 | |||||||
| Cancelled |
(231,353 | ) | $ | 12.83 | |||||||
| Balance at December 31, 2009 |
1,624,692 | $ | 9.97 | 6.17 | $ | 12,820,409 | |||||
| Vested or expected to vest at December 31, 2009 |
1,374,024 | $ | 9.89 | 5.74 | $ | 10,957,941 | |||||
| Exercisable at December 31, 2009 |
998,097 | $ | 9.87 | 4.62 | $ | 7,980,912 | |||||
The number of shares exercisable at December 31, 2009, 2008 and 2007 were 998,097, 1,639,300 and 1,573,704, respectively, with weighted average exercise prices of $9.87, $9.20 and $8.72, respectively. The Company’s policy is to issue new shares for options exercised.
The weighted-average grant date fair value of employee options granted during the years ended December 31, 2009, 2008 and 2007 was $5.17, $3.88 and $6.13 per share, respectively. The total intrinsic value of options exercised in fiscal years ending December 31, 2009, 2008 and 2007 were $ 2.6 million, $279,000 and $1.3 million, respectively.
77
Table of Contents
As of December 31, 2009 there was $2.7 million, or $1.9 million adjusted for estimated forfeitures, of total unrecognized compensation cost related to nonvested share-based compensation arrangements granted under the employee stock option plan. The cost is expected to be recognized over a weighted average period of 2.58 years. Cash received from options exercised under all share-based payment arrangements for the year ended December 31, 2009 was $ 5.6 million.
Restricted Stock Awards
Beginning in 2005, the Company awarded Directors and selected senior management restricted stock awards under the Incentive Plan. Vesting of restricted stock awards is contingent upon period of service, or meeting various departmental, Company performance or market conditions and requires a one year service period. The restricted stock awards have a contractual life of ten years.
The fair value of each restricted stock award is calculated on the date of grant using the stock price on the date of grant. Performance conditions have estimated achievement dates over which compensation expense is recognized. The requisite service period is the greater of the estimated achievement date or the minimum 12-month vesting period. This requisite service period is determined based on an analysis of all the terms and conditions of each grant. The Company uses the requisite service period that is most likely to occur including the likelihood that the restricted stock award will not be earned. The initial requisite service period may be adjusted for changes in the expected outcomes of the related service or performance conditions with such changes recognized as a cumulative catch-up adjustment.
Based on the Company’s historical experience of pre-vesting award cancellations management has assumed zero forfeitures for restricted stock awards. Management would change its assumption under the true-up provisions of the guidance, if the actual forfeiture rate is higher than estimated, a recovery of prior expense is recorded and if the actual forfeiture rate is lower than estimated an additional expense is recorded.
The following table summarizes the activity under the restricted stock plan (in thousands, except for per share amounts):
| Nonvested Shares |
Shares | Weighted Average Grant Date Fair Value | ||||
| Nonvested at January 1, 2009 |
380 | $ | 11.79 | |||
| Granted |
162 | 10.91 | ||||
| Forfeited |
(37 | ) | 12.38 | |||
| Vested/Released |
(202 | ) | 12.17 | |||
| Performance based milestone not obtainable |
(50 | ) | 10.74 | |||
| Nonvested at December 31, 2009 |
253 | $ | 11.05 | |||
The total grant date fair value of restricted stock awards granted during the year ended December 31, 2009 for service and performance based awards were $378,000 and $1.4 million, respectively. In 2009 the company had issued and released 85,039 shares of restricted stock for performance based awards of about $1.2 million. This amount had been accrued in the year ended December 31, 2008. As such, for disclosure purposes these shares appear as a 2009 issue and release but the related expense was incurred in 2008. For the year ended December 31, 2008, service and performance based awards were $280,000 and $1.6 million, respectively.
The weighted average grant date fair value of shares granted during the years ended December 31, 2009, 2008 and 2007 was $10.91, $10.51 and $12.45, respectively. The fair value of nonvested shares is determined based on the closing trading price of the Company shares on the grant date. Awards released during the year ended December 31, 2009 and 2008 were 202,000 and 79,000, respectively. Awards vesting in 2009 and 2008 had a vest date fair value for service based awards of $502,000 and $768,000 and for performance based awards
78
Table of Contents
of $2.0 million and $295,000, respectively. As of December 31, 2009, there was $816,000 of total unrecognized compensation cost related to nonvested restricted stock awards granted under the plan that are likely to vest. The cost is expected to be recognized over a weighted average period of 1.0 year.
Employee Stock Purchase Plan (ESPP)
In 2004, the Company established the 2004 ESPP. The aggregate number of shares of common stock which may be purchased under this Plan shall not exceed five hundred thousand (500,000) shares of common stock of the Company. As of December 31, 2009, the Company has issued a total of 205,004 shares of common stock from the current ESPP. For the year ended December 31, 2009 and 2008, the Company issued 100,535 and 54,663 shares of stock for ESPP purchases, respectively.
The plan permits substantially all employees to purchase common stock through payroll deductions, at 85% of the lower of the trading price of the stock at the beginning or at the end of each six-month offering period commencing on January 1 and July 1. The number of shares purchased is based on participants’ contributions made during the offering period.
The fair value of the “look back” option of the ESPP is estimated based on the fair value of the ESPP shares to be granted during the offering period by using the Black-Scholes valuation model for a call and a put option. The share price used for the model is a 15% discount on the stock price on the first day of the offering period; the number of shares to be purchased is calculated based on employee contributions; and by using the following assumptions:
| Six Month Period Ended December 31, 2009 |
Six Month Period Ended June 30, 2009 |
Six Month Period Ended December 31, 2008 |
Six Month Period Ended June 30, 2008 |
|||||||||||||
| Expected dividends |
— | — | — | — | ||||||||||||
| Stock Price on valuation date |
$ | 13.83 | $ | 5.07 | $ | 10.62 | $ | 8.27 | ||||||||
| Expected volatility |
88 | % | 121 | % | 72 | % | 70 | % | ||||||||
| Average risk-free interest rate |
0.35 | % | 0.27 | % | 2.17 | % | 3.37 | % | ||||||||
| Expected life (in years) |
.5 | .5 | .5 | .5 | ||||||||||||
| Fair value per share |
$ | 4.94 | $ | 2.43 | $ | 3.75 | $ | 2.90 | ||||||||
| Fiscal Year Ended December 31, 2009 |
Fiscal Year Ended December 31, 2008 | |||||
| ESPP compensation expense recognized |
$ | 238,000 | $ | 172,000 | ||
| Intrinsic value at respective purchase date |
$ | 681,000 | $ | 154,000 | ||
Restricted Stock Units
As of January 1, 2009 the non-employee directors of the Company were no longer paid a quarterly retainer in cash. Instead, the Company granted non-discretionary restricted stock unit (“RSU”) awards under the 2005 Omnibus Equity Incentive Plan.
On the last trading day of each calendar quarter, each non-employee director who has been a director for the full quarter automatically received an RSU award covering a number of shares of our Common Stock determined by dividing $6,250 by the closing selling price of the Company’s Common Stock on the last trading day of the calendar quarter. These quarterly RSU awards fully vested on the date of automatic grant. Each RSU award granted pursuant to this retainer program will be settled and shares issued thereunder on the earliest to occur of (i) February 15 of the calendar year following the calendar year in which granted, (ii) 60 days after the director’s service terminates or (iii) the occurrence of a change of control.
79
Table of Contents
The Company determines the fair value at grant date and expenses that amount over the requisite service period. The following table summarizes the amount of compensation expense recognized for the fiscal year ended December 31, 2009 and 2008 (in thousands, except share data):
| Fiscal Year Ended December 31, 2009 |
Fiscal Year Ended December 31, 2008 | |||||
| Service based restricted stock unit awards granted |
16,320 | — | ||||
| Total compensation expense recognized for restricted stock unit awards |
$ | 200 | $ | — | ||
Stock based compensation expense
Compensation cost for restricted stock awards and units, employee stock options and ESPP stock compensation included in Cost of sales; Selling, general and administrative; and Research and development is (in thousands):
| Fiscal Year Ended December 31, 2009 |
Fiscal Year Ended December 31, 2008 | |||||
| Cost of sales |
$ | 342 | $ | 352 | ||
| Selling, general and administrative |
1,921 | 2,000 | ||||
| Research and development |
437 | 365 | ||||
| Total Stock-Based Compensation Costs |
$ | 2,700 | $ | 2,717 | ||
Share Reservations
The following table summarizes the reservation of authorized unissued shares for issuance upon exercise and conversion of outstanding instruments as of December 31, 2009:
| Stock Option Plans: |
||
| 2005 Omnibus equity incentive plan |
1,223,692 | |
| 2004 Employee stock purchase plan |
294,996 | |
| 1999 Directors stock option plan |
23,335 | |
| Convertible debenture and warrants |
1,085,514 | |
| Total |
2,627,537 | |
80
Table of Contents
Note 9—Income Taxes
The provision (benefit) for income taxes based on loss from continuing operations is as follows (in thousands):
| Years Ended December 31, | ||||||||||||
| 2009 | 2008 | 2007 | ||||||||||
| Federal: |
||||||||||||
| Current |
$ | — | $ | — | $ | — | ||||||
| Deferred |
(8,452 | ) | 1,778 | (4,479 | ) | |||||||
| (8,452 | ) | 1,778 | (4,479 | ) | ||||||||
| State: |
||||||||||||
| Current |
5 | 4 | — | |||||||||
| Deferred |
(1,457 | ) | 1,336 | 250 | ||||||||
| (1,452 | ) | 1,340 | 250 | |||||||||
| Foreign: |
||||||||||||
| Current |
1,454 | 169 | — | |||||||||
| Deferred |
625 | 62 | 65 | |||||||||
| 2,079 | 231 | 65 | ||||||||||
| Valuation allowance |
10,365 | (3,575 | ) | 4,229 | ||||||||
| $ | 2,540 | $ | (226 | ) | $ | 65 | ||||||
The provision (benefit) for income taxes in the accompanying consolidated statements of operations differs from the amount calculated by applying the statutory income tax rate to loss from continuing operations before income taxes. The primary components of such difference are as follows (in thousands):
| Years Ended December 31, | ||||||||||||
| 2009 | 2008 | 2007 | ||||||||||
| Taxes at federal statutory rate |
$ | (6,891 | ) | $ | (5,107 | ) | $ | (5,418 | ) | |||
| State taxes, net of federal benefit |
(677 | ) | (915 | ) | (1,077 | ) | ||||||
| Effect of tax rate differential for foreign subsidiary |
(1,801 | ) | 7 | (263 | ) | |||||||
| Deferred tax profit |
— | (456 | ) | — | ||||||||
| Valuation allowance, including tax benefits of stock activity |
10,365 | 5,327 | 7,354 | |||||||||
| Nondeductible interest |
852 | 1,095 | — | |||||||||
| Other |
692 | (177 | ) | (531 | ) | |||||||
| Tax provision (benefit) |
$ | 2,540 | $ | (226 | ) | $ | 65 | |||||
The Company has established a valuation allowance against its U.S. federal and state deferred tax assets due to the uncertainty surrounding the realization of such assets as evidenced by the cumulative losses from operations through December 31, 2009. Management periodically evaluates the recoverability of the deferred tax assets. At such time as it is determined that it is more likely than not that deferred assets are realizable, the valuation allowance will be reduced accordingly, and recorded as a tax benefit with the exception of $15.5 million which will result in additional paid in capital as discussed below. The Company has recorded a valuation allowance of $61.5 million as of December 31, 2009 to reflect the estimated amount of deferred tax assets that may not be realized. The Company increased its valuation allowance by $10.4 million for the year ended December 31, 2009.
Pursuant to Internal Revenue Code Sections 382 and 383, use of the Company’s federal net operating loss and credit carryforwards may be limited due to a cumulative change in ownership of more than 50% within a three-year period.
81
Table of Contents
At December 31, 2009, the Company has federal and state net operating loss carryforwards of approximately $141.4 million and $95.8 million, respectively. The federal tax loss will begin to expire in 2020 and the state tax loss carryforwards will begin to expire in 2012. The excess tax benefits associated with the exercise of non-qualified stock options, restricted stock grants, disqualifying dispositions of both Incentive Stock Option stock and stock acquired from the Company’s Employee Stock Purchase Plan for 2009 and 2008 in the approximate amount of $2.7 and $1.9 million, respectively, did not reduce current income taxes payable and, accordingly, it is not included in the deferred tax asset relating to net operating loss (NOL) carryforwards, but it is included with the federal and state NOL carryforwards disclosed in this footnote. The tax benefits associated with stock option deductions from 1998 to 2005 in the approximate amount of $15.5 million were not recorded in Additional Paid-in Capital because their realization was not more likely than not to occur and, consequently a valuation allowance was recorded against the entire benefit. In addition, the Company has research and development and other tax credit carryforwards for federal and state income tax purposes as of December 31, 2009 of $4.1 million and $3.5 million, respectively. The federal credits will begin to expire in 2010 and the state credits have an indefinite life.
Unremitted earnings of foreign subsidiaries have been included in the consolidated financial statements without giving effect to the United States taxes that may be payable on distribution to the United States because it is not anticipated such earnings will be remitted to the United States. If remitted, the additional United States taxes paid would not be material.
Items that give rise to significant portions of the deferred tax accounts are as follows (in thousands):
| December 31, | ||||||||
| 2009 | 2008 | |||||||
| Deferred tax assets: |
||||||||
| Tax loss carryforwards |
$ | 50,944 | $ | 47,606 | ||||
| Debt conversion rights |
1,204 | 142 | ||||||
| Research and development and other tax credit carryforwards |
19 | 28 | ||||||
| Uniform capitalization, contract and inventory related reserves |
1,182 | 1,446 | ||||||
| Accrued vacation |
461 | 415 | ||||||
| Allowance for doubtful accounts |
88 | 119 | ||||||
| Deferred compensation |
— | 124 | ||||||
| Stock-based compensation |
884 | 884 | ||||||
| Tax basis depreciation less book depreciation |
976 | 722 | ||||||
| Intangible assets |
229 | — | ||||||
| Deferred revenue |
766 | — | ||||||
| Expenses capitalized for tax |
909 | — | ||||||
| Contingent settlement |
3,224 | — | ||||||
| Other |
870 | 15 | ||||||
| 61,756 | 51,501 | |||||||
| Deferred tax liabilities: |
||||||||
| Convertible debt discount, embedded conversion option |
— | (206 | ) | |||||
| Inventory deduction |
(770 | ) | (260 | ) | ||||
| Intangible assets |
(71 | ) | (91 | ) | ||||
| Pension assets |
(1,097 | ) | (173 | ) | ||||
| Other |
(371 | ) | (142 | ) | ||||
| (2,309 | ) | (872 | ) | |||||
| Net deferred tax assets before valuation allowance |
59,447 | 50,629 | ||||||
| Valuation allowance |
(61,450 | ) | (51,085 | ) | ||||
| Net deferred tax liabilities |
$ | (2,003 | ) | $ | (456 | ) | ||
82
Table of Contents
The Company adopted the provisions of the Accounting for Uncertainty in Income Taxes Topic of the FASB ASC on January 1, 2007. At the date of adoption, the Company had $3.17 million of unrecognized tax benefits. Of the total unrecognized benefits at December 31, 2009, approximately $7.5 million was recorded as a reduction to deferred tax assets, which caused a corresponding reduction in the Company’s valuation allowance of $7.5 million. To the extent such portion of unrecognized tax benefit recognized at a time such valuation allowance no longer exists, the recognition of the entire $7.5 million would reduce the effective tax rate. The Company does not anticipate that the amount of unrecognized tax benefits as of December 31, 2009 will significantly increase or decrease within 12 months.
The Company recognizes interest and penalties as a component of income tax expense. The interest and penalties as of December 31, 2009 and for the years ended December 31, 2009, 2008 and 2007 were zero.
The Company’s United States federal income tax returns for tax years since 2006 are subject to examination by the Internal Revenue Service and its state income tax returns since 2005 are subject to examination by state tax authorities. The Company’s foreign tax returns since 2000 are subject to examination by the foreign tax authorities.
A reconciliation of the beginning and ending amount of unrecognized tax benefits is as follows (in thousands):
| Balance at January 1, 2009 |
$ | 7,143 | |
| Increase in prior period positions |
97 | ||
| Increase in current period positions |
703 | ||
| Balance at December 31, 2009 |
$ | 7,943 | |
Net operating losses from years from which the statute of limitations have expired (2005 and prior for federal and 2004 and prior for state) could be adjusted in the event that the taxing jurisdictions challenge the amounts of net operating loss carryforwards from such years.
Note 10—Commitments and Contingencies
The Company enters into indemnification agreements in the ordinary course of business in which the indemnified party is held harmless and is reimbursed for losses incurred from claims by third parties. In connection with divestitures of certain assets or businesses, the Company often provides indemnities to the buyer with respect to certain matters including, for example, environmental liabilities and unidentified liabilities related to periods prior to the disposition. Due to the uncertain nature of the indemnities, the maximum liability cannot be quantified. Liabilities for obligations are recorded where appropriate and when they are probable and can be reasonably estimated. Historically, the Company has not made significant payments for these obligations.
As a result of Maxwell’s international operations, the Company is subject to the U.S. Foreign Corrupt Practices Act (“FCPA”), which prohibits companies from making improper payments to foreign officials for the purpose of obtaining or keeping business. As a result of an internal review, the Company is currently conducting an inquiry into the nature of certain payments made to our former independent sales agent in China with respect to sales of our high voltage capacitor products produced by our Swiss subsidiary. These payments equaled the difference between Maxwell’s quoted price for certain products and the amount that the independent sales agent was able to sell such products to certain customers in China. These payments had previously been recorded as commissions; however, a portion of those payments may actually have been rebated directly or indirectly to customers. Maxwell recorded commissions to the agent of $585,000, $1.8 million and $653,000 for the years ended December 31, 2009, 2008 and 2007, respectively. These commissions were based on sales of $3.1 million, $8.2 million and $3.4 million for the years ended December 31, 2009, 2008 and 2007, respectively. These amounts are recorded as a reduction to revenue for the periods presented. In 2008, these amounts were recorded
83
Table of Contents
as commission expense and were included in selling, general and administrative expense in the condensed consolidated statement of operations. This independent sales agent also worked as an independent sales agent for Metar (see Note 13). The Company terminated its relationship with this independent sales agent as of May 20, 2009.
Maxwell is in the process of evaluating how these payments should be treated for FCPA purposes, which could harm the Company’s business. The Company’s internal review is focused on a thorough examination of all of its international operations and business practices, as well as a review of its compliance programs. The Company has taken certain remedial actions, including terminating its relationship with the independent sales agent in China as well as terminating its relationship with Metar, which could harm its business.
Maxwell has not yet completed its internal review. As the Company progresses, management is voluntarily sharing information related to its internal review with the Securities and Exchange Commission (“SEC”) and Department of Justice (“DOJ”) and has provided certain documents as requested by the SEC in connection with their review of this matter. In the event that the Company’s internal review or any governmental investigation identifies violations of law, the DOJ, the SEC or other governmental authorities could seek civil and/or criminal sanctions, including monetary fines and penalties, against the Company and/or its employees, as well as additional changes to its business practices and compliance programs, which could have a material adverse effect on the Company’s business, results of operations or financial condition.
In the fourth quarter of 2009 and in connection with the internal review of the matters described above, the Company recorded an accrual of $9.3 million for the potential settlement with the SEC and DOJ. The amount recorded was based on the Company’s estimation of loss as required under GAAP and discussions with both government agencies. These discussions have resulted in an estimate of a potential settlement range of $9.3 million to $20.0 million. The top end of the range of $20.0 million represents the combined first offer of settlement recently put forth by the relevant governmental agencies. Discussions with the SEC and DOJ are ongoing in an effort to resolve these matters, but whether agreement can be reached and on what terms, is uncertain. The amount of any disgorgements, penalties and/or fines that the Company could face depends on a number of eventual factors which are not currently known or have not yet been resolved with the relevant government authorities, including findings by relevant authorities regarding the amount, nature and scope of any improper payments, the amount of any pecuniary gain involved, our ability to pay and the level of cooperation provided to government authorities during the investigations. There can be no assurance that a settlement will be reached at all, or that any final settlement amount will not be more or less than the accrual of $9.3 million. Actual payments to the government agencies in connection with any settlement could have a material adverse effect on the Company’s business, results of operations or financial condition.
84
Table of Contents
Note 11—Leases
Rental expense amounted to $2.1 million, $2.0 million and $1.9 million for the years ended December 31, 2009, 2008 and 2007, respectively, and was incurred primarily for facility rental. Our San Diego headquarters and principal research, manufacturing and marketing facility occupies approximately 45,000 square feet under a renewable lease that expires in July 2015. The Company also occupies a 16,500-square-foot production annex in San Diego under a renewable lease that expires in November 2010. In addition, the Company leases research, manufacturing and marketing facilities occupying 68,620 square feet in Rossens, Switzerland, under a renewable lease that expires in December 2014. Future annual minimum rental commitments as of December 31, 2009 are as follows (in thousands):
| Fiscal Years |
|||
| 2010 |
$ | 1,804 | |
| 2011 |
1,748 | ||
| 2012 |
1,791 | ||
| 2013 |
1,838 | ||
| 2014 |
1,886 | ||
| Thereafter |
610 | ||
| $ | 9,677 | ||
Note 12—Pension and Other Postretirement Benefit Plans
Foreign Plan
The Compensation—Retirement Benefits Subtopic of the FASB ASC requires balance sheet recognition of the total over funded or under funded status of pension and postretirement benefit plans. Under the guidance, actuarial gains and losses, prior service costs or credits, and any remaining transition assets or obligations that have not been recognized under previous accounting standards must be recognized as a component of accumulated other comprehensive income (loss) within stockholders’ equity, net of tax effects, until they are amortized as a component of net periodic benefit cost.
This plan is regulated by the Swiss Government and is funded by the employees and the Company. The pension benefit is based on compensation, length of service and credited investment earnings. The plan guarantees both a minimum rate of return as well as minimum annuity purchase rates. The Company’s funding policy with respect to the pension plan is to contribute the amount required by Swiss law, using the required percentage applied to the employee’s compensation. In addition, participating employees are required to contribute to the pension plan. The Company made pension contributions of $589,000, $577,000 and $498,000 in 2009, 2008 and 2007, respectively, and 45% of the contributions to the plan are made by the employees. This plan has a measurement date of December 31. The Company does not have any rights to this asset.
The reported prepaid pension asset increased from $2.6 million to $7.7 million during the year ended December 31, 2009. The asset increase is a combination of actuarial gain due to participant experience and gain due to changes in certain demographic and economic assumptions; this was offset by an actuarial loss due to actual investment return being less than expected in 2009.
For the year ended December 31, 2009, the total lump sum benefits paid out of the plan were greater than the employer service costs plus interest cost and so a settlement recognition was required. Because there was no related restructuring program and additionally the plan population actually increased during the year there was related curtailment.
85
Table of Contents
The following table reflects changes in pension benefits for the years ended December 31, 2009 and 2008:
| Pension Benefits | ||||||||
| Year ended December 31, |
||||||||
| 2009 | 2008 | |||||||
| (in thousands) | ||||||||
| Change in benefit obligation: |
||||||||
| Benefit obligation at beginning of year |
$ | 24,096 | $ | 19,039 | ||||
| Service cost |
690 | 477 | ||||||
| Interest cost |
629 | 678 | ||||||
| Plan participant contributions |
482 | 472 | ||||||
| Benefits paid |
(373 | ) | (1,143 | ) | ||||
| Actuarial (gain) loss |
(4,473 | ) | 3,286 | |||||
| Administrative expenses paid |
(71 | ) | (71 | ) | ||||
| Settlement |
(1,696 | ) | — | |||||
| Effect of foreign currency translation |
258 | 1,358 | ||||||
| Projected benefit obligation at end of year |
19,542 | 24,096 | ||||||
| Changes in plan assets: |
||||||||
| Fair value of plan assets at beginning of year |
26,688 | 27,408 | ||||||
| Actual return (loss) on plan assets |
1,045 | (2,330 | ) | |||||
| Special termination benefits/asset transfers in |
— | — | ||||||
| Company contributions |
589 | 577 | ||||||
| Plan participant contributions |
482 | 472 | ||||||
| Benefits paid |
(373 | ) | (1,143 | ) | ||||
| Administrative expenses paid |
(71 | ) | (71 | ) | ||||
| Settlements |
(1,696 | ) | — | |||||
| Effect of foreign currency translation |
531 | 1,775 | ||||||
| Fair value of plan assets at end of year |
27,195 | 26,688 | ||||||
| Funded status at end of year |
$ | 7,653 | $ | 2,592 | ||||
| Amounts recognized in the consolidated balance sheet consist of: |
||||||||
| Prepaid benefit cost |
$ | 9,540 | $ | 8,960 | ||||
| Foreign currency translation adjustment |
190 | 567 | ||||||
| Accumulated other comprehensive loss |
(2,077 | ) | (6,935 | ) | ||||
| Net amount recognized |
$ | 7,653 | $ | 2,592 | ||||
The components of net periodic benefit cost to the Company of the plan are as follows:
| Year ended December 31, |
||||||||||||
| 2009 | 2008 | 2007 | ||||||||||
| (in thousands) | ||||||||||||
| Components of net periodic benefit cost: |
||||||||||||
| Service cost |
$ | 690 | $ | 477 | $ | 314 | ||||||
| Interest cost |
629 | 678 | 426 | |||||||||
| Expected return on plan assets |
(1,298 | ) | (1,430 | ) | (1,257 | ) | ||||||
| Prior service cost (credit) amortization |
38 | 38 | 34 | |||||||||
| Net loss / (gain) amortization |
365 | — | (176 | ) | ||||||||
| Settlement cost |
150 | — | — | |||||||||
| Net periodic loss / (income) |
$ | 574 | $ | (237 | ) | $ | (659 | ) | ||||
86
Table of Contents
| Pension Benefits | ||||||
| Year ended December 31, |
||||||
| 2009 | 2008 | |||||
| Weighted-average assumptions used to determine benefit obligations: |
||||||
| Discount rate |
3.25 | % | 2.75 | % | ||
| Rate of compensation increase |
2.50 | % | 2.50 | % | ||
| Measurement date |
12/31/2009 | 12/31/2008 | ||||
| Weighted-average assumptions used to determine net periodic benefit cost: |
||||||
| Discount rate |
3.25 | % | 3.50 | % | ||
| Expected long-term return on plan assets |
5.50 | % | 5.00 | % | ||
| Rate of compensation increase |
2.50 | % | 2.50 | % | ||
| Percentage of the fair value of total plan assets held in each major category of plan assets: |
||||||
| Equity securities |
25 | %2 | 12 | % | ||
| Debt securities |
24 | %2 | 11 | % | ||
| Real estate |
37 | % | 36 | % | ||
| Other |
14 | %1 | 41 | %1 | ||
| Total |
100 | % | 100 | % | ||
| 1 | The plan assets held as of December 31, 2009 and 2008 included a large portion of cash and short-term investments from recent sales of certain real estate property that was not reinvested as of December 31, 2008. |
| 2 | The increase as percentage invested in Equity and Debt Securities in 2009, occurred from the investment of the year end cash position held in 2008. |
The Pension Plan’s overall strategy and investment policy is managed by the board of the Plan. The overall long-term rate is based on the target asset allocation of 10% Swiss bonds, 15% non-Swiss bonds (10% unhedged and 5% hedged), 8% Swiss equities, 14% Global equities, 45% real estate, 3% alternative investments and 5% cash and other short-term investments.
The 2010 expected future long-term rate of return is estimated to be 5.5%, this is based on historical asset rate of returns for each asset allocation classification at a 2.7% rate for Swiss bonds, 3.7% for unhedged foreign bonds, 2.9% for hedged foreign bonds, 5.7% for real property, 8.1% for Swiss equities and 9.1% for Global equities and 2.1% for Cash. The 2009 expected long-term rate of return was 5.0% and was based on the asset rates of return of; 3.3% for Swiss bonds, 5.1% for unhedged foreign bonds, 4.1% for hedged foreign bonds, 5.0% for real property, 6.8% for Swiss equities and 7.2% for Global equities and 2.1% for Cash.
| (in thousands) | |||
| Accumulated other comprehensive loss consists of the following: |
|||
| Net transition obligation |
$ | — | |
| Net prior service cost |
343 | ||
| Net gain |
1,734 | ||
| Accumulated other comprehensive loss before taxes as of December 31, 2009 |
$ | 2,077 | |
| Expected amortization during the fiscal year ended December 31, 2010: |
|||
| Amortization of net transition obligation |
$ | — | |
| Amortization of net prior service costs |
38 | ||
| Amortization of net loss |
— | ||
87
Table of Contents
The following benefit payments, which reflect expected future service, as appropriate, are expected to be paid (in thousands):
| 2010 |
$ | 1,083 | |
| 2011 |
1,119 | ||
| 2012 |
1,150 | ||
| 2013 |
1,212 | ||
| 2014 |
1,391 | ||
| Years 2015 through 2019 |
6,535 | ||
| Total |
$ | 12,490 | |
As noted in the pension benefits table, the projected benefit obligation was $19.5 million and $24.1 million as of December 31, 2009 and 2008, respectively.
The Company expects to contribute approximately $635,000 to its foreign pension plan in fiscal 2010.
Investment objectives:
The primary investment goal of the Pension Plan is to achieve a total annualized return of 5.5% over the long-term. The investments are evaluated, compared and benchmarked to plans with a similar investment strategy. The Plan also attempts to minimize risk by not having any single security or class of securities with a disproportionate impact on the Plan. As a guideline, assets are diversified by asset classes (Equity, Fixed Income, Real Estate, and Alternative Investments)
Fair value of Assets
Level 1: Observable inputs such as quoted prices in active markets for identical assets.
Level 2: Inputs other than quoted prices that are observable for the asset or liability, either directly or indirectly. These include quoted prices for similar assets or liabilities in active markets and quoted prices for identical or similar assets or liabilities in markets that are not active.
Level 3: Unobservable inputs that reflect the reporting entity’s own assumptions. These investments can include; real estate owned by the Pension Plan stated at appraised value obtained from an independent source to the Plan and the Company; real estate investment that has potential long term investment liquidation processes; hedge funds that might have monthly, quarterly or annual restraints on redemptions or may require advance notice for a redemption.
88
Table of Contents
The fair value of the Plans assets at December 31, 2009 by asset category, are as follows:
| Fair Value Measurements at December 31, 2009 | ||||||||||||
| (in thousands) |
Total | Active Market Prices (Level 1) |
Significant Observable Inputs (Level 2) |
Significant Unobservable Inputs (Level 3) | ||||||||
| Asset category |
||||||||||||
| Cash: |
||||||||||||
| Held in Swiss Franc, Euro and USD denominated |
$ | 1,130 | $ | 1,130 | $ | — | $ | — | ||||
| Equity securities: |
||||||||||||
| Investment Funds |
12,580 | 11,790 | 790 | — | ||||||||
| Fixed income / Bond securities: |
||||||||||||
| Bonds |
1,307 | 1,307 | — | — | ||||||||
| Direct loan/note |
676 | — | 676 | — | ||||||||
| Total fixed income / Bond securities |
1,983 | 1,307 | 676 | — | ||||||||
| Real estate investments: |
||||||||||||
| Shares of real estate corporation investment |
119 | — | 119 | — | ||||||||
| Real estate investment in specific properties 100% owned by the plan |
10,184 | — | — | 10,184 | ||||||||
| Total real estate |
10,303 | — | 119 | 10,184 | ||||||||
| Alternative investments/ Structured products: |
||||||||||||
| Structured product |
929 | 643 | 286 | — | ||||||||
| Other assets (accounts receivable, assets at real estate management company Structured product) |
270 | — | 270 | — | ||||||||
| Net assets of Pension Plan |
$ | 27,195 | $ | 14,870 | $ | 2,141 | $ | 10,184 | ||||
For those financial instruments with significant Level 3 inputs, the following table summarizes the activity for the period by investment type:
| Description |
Real estate investments |
|||
| Beginning balance, December 31, 2008 |
$ | 8,748 | ||
| Total purchases |
1,417 | |||
| Total unrealized losses included in net loss1 |
(222 | ) | ||
| Foreign currency translation adjustments |
241 | |||
| Ending balance, December 31, 2009 |
$ | 10,184 | ||
| 1 | Total unrealized losses are reported as a component of accumulated other comprehensive income in the consolidated statement of stockholders’ equity. |
U.S. Plan
The Company has post retirement benefit plans covering its employees in the United States. Substantially all U.S. employees are eligible to elect coverage under contributory employee savings plan which provide for Company matching contributions based on one-half of employee contributions up to certain plan limits. The Company’s matching contributions under this plan totaled $384,000, $236,000 and $197,000 for the years ended December 31, 2009, 2008 and 2007, respectively.
89
Table of Contents
Note 13—Related Party Transactions
Maxwell SA made payments to Metar Machines (Metar) for commissions on sales of our High Voltage products. Metar has established business relationships in Asia that provide additional sales opportunity for High Voltage products. Montena, SA (“Montena”) was the majority shareholder of Metar Machines until March 22, 2009. A member of Maxwell Technologies, Inc. Board of Directors, José Cortes, is also a director of Montena. Mr. Cortes is also a minority shareholder of Genturica Ltd. and Genturica Ltd. is the majority shareholder of Montena. As of March 22, 2009, Montena had sold its interest in Metar. Further, the Company has terminated its agreement with Metar as of May 14, 2009, and Metar is no longer a related party. Total expense for this non-exclusive sales commission recognized during the years ended December 31, 2009, 2008 and 2007 were $128,000, $260,000 and $119,000, respectively. The expense included accounts payable of $0, $39,000 and $27,000 as of December 31, 2009, 2008 and 2007, respectively. All expenses are classified as selling, general and administrative expense in the statement of operations. Metar and Maxwell used the same independent sales agent in China. See Note 10 above for further information.
Maxwell SA Pension Plan has provided a long term loan of 700,000 Swiss Francs (approximately $676,000 as of December 31, 2009) to Montena Properties SA. Montena Properties SA is 100% owned by Montena SA. The loan has been negotiated to be completely repaid by December 12, 2010 and bears an interest rate of 4.25%. As stated earlier, a member of Maxwell Technologies, Inc.’s Board of Directors, José Cortes, is also a director and indirect minority stockholder of Montena SA. The loan was provided to Montena Properties SA prior to Mr. Cortes becoming a director of Maxwell and Montena.
Note 14—Legal Proceedings
NessCap—Patent Infringement
In October 2006, Maxwell filed a patent infringement lawsuit against NessCap in the United States District Court for the Southern District of California seeking monetary damages and an injunction to stop NessCap’s sales of infringing products based on four of Maxwell’s patents. In December 2006, NessCap filed a lawsuit against Maxwell in the United States District Court in the District of Delaware claiming Maxwell products infringe NessCap’s patented intellectual property. Maxwell moved for an alternate forum and the lawsuit was transferred to the same district court in San Diego where Maxwell’s patent claims against NessCap are pending. Maxwell subsequently filed a motion for summary judgment asserting non-infringement of NessCap’s patents and a hearing was held in November, 2007. In December, 2007, the Court denied Maxwell’s motion for summary judgment, deciding instead to wait until the Court considers additional briefs on the issue of patent claim interpretation. The Court held a claim construction hearing and subsequently issued its ruling in April, 2008. In February 2009, the Company entered into a definitive settlement agreement with NessCap Co., Ltd., and NessCap, Inc. (“NessCap”). In the settlement agreement, Maxwell and NessCap agreed to release all claims against each other on issues related to the lawsuit and agreed to a ten year, worldwide cross license of certain patent rights of each company. Following the execution of the definitive settlement agreement, the matters were formally concluded by dismissing all pending matters in both the District Court and the United States Court of Appeals. As part of the settlement agreement, NessCap must pay $1 million to Maxwell in annual installments of $200,000 through 2013. During the case the Company capitalized patent legal defense costs as additional costs of the patents and is now amortizing these capitalized costs over the remaining lives of these patents. Payments received from NessCap under this settlement have been and will continue to be netted against these capitalized patent legal defense costs upon receipt. As of December 31, 2009, $200,000 has been received from NessCap for this settlement.
Product Defect Matter
In 2005, a customer brought to our attention a possible defect in a product that was produced for Maxwell under contract by another manufacturer and resold to the customer. In an effort to resolve the matter, Maxwell’s subsidiary, Maxwell SA, initiated a legal proceeding in Germany in late 2007 against the product manufacturer. The suit is currently in the discovery phase during which time the allegedly defective product will be analyzed by
90
Table of Contents
an expert who is tasked with determining: (a) if there is a defect; and (b) if there is a defect, if the defect is one stemming from manufacturing or from operating conditions. Since the inception of the proceedings, the parties have met with the expert on more than one occasion. At those meetings the expert did not issue any report on his findings. Most recently, the court granted the request of the parties to allow the expert to consider not only the allegedly defective products known when the proceedings were initiated but also the products with alleged defects after the proceedings began. In the event that a determination is made that a defect exists, any potential liability would depend upon the nature of the defect and the actual amount of any damages would be determined in a subsequent legal proceeding. Since the matter is still in its preliminary stages, we have not yet been able to determine what, if any, warranty exposure Maxwell may have, and therefore, we have not recorded any warranty reserve provision. Maxwell does, however, carry insurance that may cover a portion of such warranty liability that might ultimately arise from this matter.
Angeles Chemical
In December 2007, Maxwell, along with more than 150 other defendants, was named in an environmental suit. The suit, Angeles Chemical Company, Inc. et al. v. Omega Chemical PRP Group, LLC, et al., was filed by the plaintiffs in the United States District Court for the Central District of California alleging damages related to hazardous waste contamination of the plaintiffs’ land (the “Angeles Site”). The plaintiff alleges that a prior service provider of Maxwell improperly disposed of hazardous material on property upstream from the plaintiffs’ land (the “Omega Site”). In March 2008, Maxwell joined and adopted the motion to dismiss filed by defendants Omega Chemical PRP Group LLC and Omega Chemical PRP Group. That motion was denied, however, the Court elected to grant a motion to stay the proceedings. In the meantime, Maxwell’s outside counsel is conferring with co-defendants’ counsel to finalize a Joint Defense Agreement whereby related defendants can share information in an effort to reduce the cost of defending the suit.
In April 2009, Maxwell attended an Internal Technical Committee Meeting regarding the Angeles Site. The purpose of the meeting was to review the EPA’s Remedial Investigation Report, an analysis of the contamination occurring near the Omega Site. The EPA had spent the last several months collecting data and running a model analysis for this report. The EPA concluded that the Omega Site was the cause of an 8 mile contamination plume, a conclusion that the defendants deny. The EPA’s conclusions and assumptions were challenged by technical experts at De Maximis and CDM. The experts believe that the EPA made simplified assumptions to attain results that supported a conclusion designed by the EPA. The defendants, including Maxwell, predicted that the cost of the EPA’s 8 mile plume would be approximately $100-$150 million, perhaps double what it would cost if the Omega site is to blame for only 2-4 miles of the plume. The consensus was that the defendants would have to challenge the EPA’s model with their own model, perhaps collecting additional data at points the EPA ignored in hopes of saving potentially millions of dollars in the overall cleanup.
Maxwell has been included in this suit as a result of an earlier suit that was settled in 1999. In that suit, Maxwell was a potentially responsible party (PRP) at a site a short distance from the current site. That suit was settled by Maxwell paying approximately $37,000.
Omega Chemical
In August 2009, unrelated to the Angeles Chemical matter and yet pertaining to the original Omega Chemical matter, the Omega PRP Organized Group (OPOG) submitted a good faith offer letter to parties who settled their portion of the Omega matter for 100% of their respective liabilities for the original Omega Chemical clean up efforts. Within the offer letter, OPOG solicited additional funding for additional clean up efforts it claims are necessary to remediate the Omega Chemical site. Maxwell has joined several other parties receiving the same good faith offer letter from OPOG to review and assess the validity of OPOG’s claim for further clean up funding. Most recently, these collaborating parties have hired an outside consultant to review the state of the Omega Chemical site and assist in determining the validity of such claims, including cost estimates, made by OPOG and have scheduled a meeting with OPOG to discuss such findings. To date, the plaintiff has completed a draft feasibility study.
91
Table of Contents
Note 15—Subsequent Events
In accordance with the Subsequent Events Topic of the FASB ASC, the Company has evaluated subsequent events through March 5, 2010, the date of issuance of the consolidated financial statements. During the period the Company did not have any material recognizable subsequent events.
Note 16—Unaudited Quarterly Results of Operations
| Quarter Ended | ||||||||||||||||
| March 31 | June 30 | September 30 | December 31 | |||||||||||||
| (in thousands except per share data) | ||||||||||||||||
| Year ended December 31, 2009 |
||||||||||||||||
| Operating: |
||||||||||||||||
| Total revenue |
$ | 22,459 | $ | 24,754 | $ | 26,101 | $ | 28,001 | ||||||||
| Gross profit |
7,053 | 8,915 | 9,937 | 9,384 | ||||||||||||
| Net loss |
(2,965 | )(a) | (5,335 | )(b) | (4,637 | )(c) | (9,975 | )(d) | ||||||||
| Basic and diluted net loss per share |
$ | (0.13 | ) | $ | (0.22 | ) | $ | (0.18 | ) | $ | (0.39 | ) | ||||
| Year ended December 31, 2008 |
||||||||||||||||
| Operating: |
||||||||||||||||
| Total revenue |
$ | 17,146 | $ | 18,978 | $ | 21,380 | $ | 22,935 | ||||||||
| Gross profit |
5,040 | 4,896 | 6,141 | 9,020 | ||||||||||||
| Net income (loss) |
(5,557 | )(e) | (4,977 | )(f) | (5,705 | )(g) | 1,431 | (h) | ||||||||
| Basic net income (loss) per share |
$ | (0.28 | ) | $ | (0.24 | ) | $ | (0.27 | ) | $ | 0.08 | |||||
| Diluted net income (loss) per share |
$ | (0.28 | ) | $ | (0.24 | ) | $ | (0.27 | ) | $ | 0.07 | |||||
| (a) | Includes a loss on embedded derivatives of $607,000, a non-cash expense for stock options of $738,000 and an amortization of debt discount of $379,000. |
| (b) | Includes a loss on embedded derivatives of $3.8 million, a non-cash expense for stock options of $841,000 and an amortization of debt discount of $243,000. |
| (c) | Includes a loss on embedded derivatives of $2.8 million, a non-cash expense for stock options of $899,000 and an amortization of debt discount of $73,000. |
| (d) | Includes an accrual for potential settlement of FCPA violations of $9.3 million, a gain on embedded derivatives of $1.9 million, a non-cash expense for stock options of $222,000 and an amortization of debt discount of $42,000. |
| (e) | Includes a loss on embedded derivatives of $993,000, a non-cash expense for stock options of $569,000 and an amortization of debt discount of $728,000. |
| (f) | Includes a gain on embedded derivatives of $33,000, a non-cash expense for stock options of $576,000 and an amortization of debt discount of $641,000. |
| (g) | Includes a loss on embedded derivatives of $1.0 million, a non-cash expense for stock options of $911,000 and an amortization of debt discount of $553,000. |
| (h) | Includes a gain on embedded derivatives of $3.2 million, a non-cash expense for stock options of $661,000 and an amortization of debt discount of $466,000. |
92
Table of Contents
Valuation and Qualifying Accounts (in thousands)
| Balance at the Beginning of the Year |
Charged to Expense |
Acquisitions/ Transfers and Other |
Write-offs Net of Recoveries |
Balance at the End of the Year | |||||||||
| Allowance for Doubtful Accounts: |
|||||||||||||
| December 31, 2007 |
134 | 31 | (43 | ) | (35 | ) | 87 | ||||||
| December 31, 2008 |
87 | 433 | (56 | ) | (30 | ) | 434 | ||||||
| December 31, 2009 |
434 | (52 | ) | 4 | — | 386 | |||||||
| Inventory Reserve: |
|||||||||||||
| December 31, 2007 |
2,785 | 1,072 | (90 | ) | (697 | ) | 3,070 | ||||||
| December 31, 2008 |
3,070 | 484 | 20 | (668 | ) | 2,906 | |||||||
| December 31, 2009 |
2,906 | 283 | (29 | ) | (518 | ) | 2,642 |
93
Table of Contents
| Item 9. | Changes in and Disagreements with Accountants on Accounting and Financial Disclosure |
None.
| Item 9A. | Controls and Procedures |
Evaluation of Disclosure Controls and Procedures
As of December 31, 2009, management has evaluated the effectiveness of the design and operation of our disclosure controls and procedures for purposes of filing reports under the Securities and Exchange Act of 1934 (the “Exchange Act”). This controls evaluation was done under the supervision and with the participation of management, including our chief executive officer (principal executive officer) and our chief financial officer (principal financial officer). Our principal executive officer and our principal financial officer have concluded that our disclosure controls and procedures (as defined in Rule 13a-15(e) and 15d-15(e) under the Exchange Act) are effective to provide reasonable assurance that information required disclosed in the reports that the Company files or submit to the SEC is recorded, processed, summarized and reported with the time periods specified in the SEC’s rules and forms.
Changes in Internal Control Over Financial Reporting
There have been no changes in our internal control over financial reporting that occurred during our last fiscal quarter that has materially affected, or is reasonably likely to materially affect, our internal control over financial reporting
Management’s Annual Report on Internal Control over Financial Reporting
Our management is responsible for establishing and maintaining adequate internal control over financial reporting, as such term is defined in Exchange Act Rule 13a-15(f). Under the supervision and with the participation of our management, including our principal executive officer and principal financial officer, we conducted an evaluation of the effectiveness of our internal control over financial reporting based on the framework in Internal Control—Integrated Framework issued by the Committee of Sponsoring Organizations of the Treadway Commission.
Because of its inherent limitations, internal control over financial reporting is not intended to provide absolute assurance that a misstatement of our financial statements would be prevented or detected. Also, projections of any evaluation of effectiveness to future periods are subject to the risk that controls may become inadequate because of changes in conditions or because the degree of compliance with policies or procedures may deteriorate. Based on our evaluation under the framework in Internal Control—Integrated Framework, management concluded that our internal control over financial reporting was effective as of December 31, 2009.
McGladrey & Pullen LLP, the independent registered public accounting firm that audited the consolidated financial statements of Maxwell in this Annual Report on Form 10-K, has issued an unqualified opinion on the effectiveness of Maxwell’s controls over financial reporting as of December 31, 2009 which is included in this Item under the heading “Report of Independent Registered Public Accounting Firm.”
94
Table of Contents
REPORT OF INDEPENDENT REGISTERED PUBLIC ACCOUNTING FIRM
To the Board of Directors and Stockholders
Maxwell Technologies, Inc.
We have audited Maxwell Technologies, Inc.’s and subsidiaries’ internal control over financial reporting as of December 31, 2009, based on criteria established in Internal Control—Integrated Framework issued by the Committee of Sponsoring Organizations of the Treadway Commission. Maxwell Technologies, Inc.’s management is responsible for maintaining effective internal control over financial reporting and for its assessment of the effectiveness of internal control over financial reporting included in the accompanying Management’s Annual Report on Internal Control over Financial Reporting. Our responsibility is to express an opinion on the company’s internal control over financial reporting based on our audit.
We conducted our audit in accordance with the standards of the Public Company Accounting Oversight Board (United States). Those standards require that we plan and perform the audit to obtain reasonable assurance about whether effective internal control over financial reporting was maintained in all material respects. Our audit included obtaining an understanding of internal control over financial reporting, assessing the risk that a material weakness exists, and testing and evaluating the design and operating effectiveness of internal control based on the assessed risk. Our audit also included performing such other procedures as we considered necessary in the circumstances. We believe that our audit provides a reasonable basis for our opinion.
A company’s internal control over financial reporting is a process designed to provide reasonable assurance regarding the reliability of financial reporting and the preparation of financial statements for external purposes in accordance with generally accepted accounting principles. A company’s internal control over financial reporting includes those policies and procedures that (a) pertain to the maintenance of records that, in reasonable detail, accurately and fairly reflect the transactions and dispositions of the assets of the company; (b) provide reasonable assurance that transactions are recorded as necessary to permit preparation of financial statements in accordance with generally accepted accounting principles, and that receipts and expenditures of the company are being made only in accordance with authorizations of management and directors of the company; and (c) provide reasonable assurance regarding prevention or timely detection of unauthorized acquisition, use, or disposition of the company’s assets that could have a material effect on the financial statements.
Because of its inherent limitations, internal control over financial reporting may not prevent or detect misstatements. Also, projections of any evaluation of effectiveness to future periods are subject to the risk that controls may become inadequate because of changes in conditions, or that the degree of compliance with the policies or procedures may deteriorate.
In our opinion, Maxwell Technologies, Inc. and subsidiaries maintained, in all material respects, effective internal control over financial reporting as of December 31, 2009, based on criteria established in Internal Control—Integrated Framework issued by the Committee of Sponsoring Organizations of the Treadway Commission.
We have also audited, in accordance with the standards of the Public Company Accounting Oversight Board (United States), the consolidated balance sheets of Maxwell Technologies, Inc. and subsidiaries as of December 31, 2009 and 2008, and related consolidated statements of operations, stockholders’ equity and comprehensive loss and cash flows for each of the three years in the period ended December 31, 2009, and our report dated March 5, 2010 expressed an unqualified opinion.
/s/ MCGLADREY & PULLEN, LLP
San Diego, California
March 5, 2010
95
Table of Contents
| Item 9B. | Other Information |
None.
96
Table of Contents
| Item 10. | Directors, Executive Officers and Corporate Governance |
The information required by this item will be set forth in the Proxy Statement and is incorporated in this report by reference.
| Item 11. | Executive Compensation |
The information required by this item will be set forth in the Proxy Statement and is incorporated in this report by reference.
| Item 12. | Security Ownership of Certain Beneficial Owners and Management and Related Stockholder Matters |
The information required by this item will be set forth in the Proxy Statement and is incorporated in this report by reference.
| Item 13. | Certain Relationships and Related Transactions, and Director Independence |
The information required by this item will be set forth in the Proxy Statement and is incorporated in this report by reference.
| Item 14. | Principal Accounting Fees and Services |
The information required by this item will be set forth in the Proxy Statement and is incorporated in this report by reference.
97
Table of Contents
| Item 15. | Exhibits and Financial Statement Schedules |
(a) Documents filed as part of this report.
1. Financial Statements. The consolidated financial statements required by this item are submitted in a separate section beginning on page 54 of this Annual Report on Form 10-K.
2. Financial Statement Schedules. The financial statement schedule entitled “Valuation and Qualifying Accounts” required by this item is submitted in a separate section beginning on page 93 of this Annual Report on Form 10-K.
3. Exhibits.
| Exhibit |
Description of Document | |
| 2.1 | Asset Purchase Agreement dated December 10, 2003 between Registrant and Metar SA en constitution. (1) | |
| 2.2 | Purchase and Sale Agreement and Joint Escrow Instructions dated August 15, 2003 by and between Registrant and Horizon Christian Fellowship. (1) | |
| 2.3 | First Amendment to Purchase and Sale Agreement and Joint Escrow Instructions by and between Registrant and Horizon Christian Fellowship, dated September 26, 2003. (1) | |
| 2.4 | Second Amendment to Purchase and Sale Agreement and Joint Escrow Instructions by and between Registrant and Horizon Christian Fellowship, dated October 13, 2003. (1) | |
| 2.5 | Third Amendment to Purchase and Sale Agreement and Joint Escrow Instructions by and between Registrant and Horizon Christian Fellowship, dated December 23, 2003. (1) | |
| 3.1 | Restated Certificate of Incorporation of Registrant. (11) | |
| 3.2 | Certificate of Amendment of Restated Certificate of Incorporation of Registrant, dated November 22, 1996. (7) | |
| 3.3 | Certificate of Amendment of Restated Certificate of Incorporation of Registrant, dated February 9, 1998. (2) | |
| 3.4 | Amended and Restated Bylaws of Registrant. (3) | |
| 4.1 | Rights Agreement dated November 5, 1999 between Registrant and Chase Mellon Shareholders Services, LLC, as Rights Agent. (10) | |
| 4.2 | Amendment of Rights Agreement dated as of July 5, 2002. (12) | |
| 10.1 | 1995 Stock Option Plan of Registrant. (8) | |
| 10.2 | Amendment No. One to Registrant’s 1995 Stock Option Plan dated March 19, 1997. (7) | |
| 10.3 | Amendment No. Two to Registrant’s 1995 Stock Option Plan dated February 13, 1998. (14) | |
| 10.4 | Amendment No. Three to Registrant’s 1995 Stock Option Plan dated January 28, 1999. (2) | |
| 10.5 | Amendment No. Four to Registrant’s 1995 Stock Option Plan dated Nov. 22, 1999. (4) | |
| 10.6 | Amendment No. Five to Registrant’s 1995 Stock Option Plan dated August 14, 2000. (13) | |
| 10.7 | Stock Option Agreement under 1995 Stock Option Plan by and between Registrant and Kenneth Potashner, dated as of May 19, 2003. (12) | |
98
Table of Contents
| Exhibit |
Description of Document | |
| 10.8 | 1999 Director Stock Option Plan of Registrant. (4) | |
| 10.9 | Registrant’s 1994 Employee Stock Purchase Plan. (8) | |
| 10.10 | Amendment Number One to Registrant’s 1994 Employee Stock Purchase Plan, effective as of April 30, 1997. (7) | |
| 10.11 | PurePulse Technologies, Inc. 1994 Stock Option Plan. (9) | |
| 10.12 | Shareholder Agreement among Registrant, PurePulse Technologies, Inc., Sanyo E&E Corporation and Three Oceans Inc., dated January 28, 1999. (2) | |
| 10.13 | Stock Purchase and Barter Agreement by and between Registrant and Montena SA dated May 30, 2002. (5) | |
| 10.14 | Amendment Number One to Stock Purchase and Barter Agreement by and between Registrant and Montena SA dated June 28, 2002. (5) | |
| 10.15 | Amendment Number Two to the Stock Purchase and Barter Agreement by and between Registrant and Montena SA dated August 12, 2002. (6) | |
| 10.16 | Indemnity Agreement for Directors of Registrant dated December 2004. (12) | |
| 10.17 | Loan and Security Agreement (Exim Program) dated February 4, 2004 between Registrant and Silicon Valley Bank. (12) | |
| 10.18 | Schedule to Loan and Security Agreement (Exim Program) dated February 4, 2004 between Registrant and Silicon Valley Bank. (12) | |
| 10.19 | Export-Import Bank of the United States Agreement Executed by Borrower dated February 4, 2004 between Registrant, Export-Import Bank of the United States and Silicon Valley Bank. (12) | |
| 10.20 | Securities Account Control Agreement dated February 4, 2004 between Registrant and Silicon Valley Bank. (12) | |
| 10.21 | Firm-Fixed-Price Subcontract Purchase Order dated February 14, 2005 between Registrant and Northrop Grumman Space and Mission Systems Corp. (15) | |
| 10.22 | Securities Purchase Agreement, dated as of December 20, 2005 between Registrant and Castlerigg Master Investments Ltd. (16) | |
| 10.23 | Registration Rights Agreement, dated as of December 20, 2005 between Registrant and Castlerigg Master Investments Ltd. (16) | |
| 10.24 | Registrant’s 2005 Omnibus Equity Incentive Plan, as amended through May 3, 2007. (17) | |
| 10.25 | Underwriting Agreement dated May 8, 2007 between the Registrant and UBS Securities, LLC. (18) | |
| 10.26 | Transition agreement effective as of July 23, 2007 between the Company and Richard D. Balanson. (19) | |
| 10.27 | Employment agreement effective as of July 23, 2007 between the Company and David J. Schramm. (19) | |
| 10.28 | Underwriting Agreement between the Company and UBS Securities, LLC dated October 9, 2007. (20) | |
| 10.29 | Equity Distribution Agreement, dated August 8, 2008, between the Company and UBS Securities, LLC, including the form of Terms Agreement. (21) | |
| 10.30 | Amendment No. 1 dated December 19, 2008 to Employment Agreement between the Company and David J. Schramm. (22) | |
99
Table of Contents
| Exhibit |
Description of Document | |
| 10.31 | Employment agreement effective as of March 23, 2009 between the Company and Kevin S. Royal. (23) | |
| 10.32 | Underwriting Agreement between the Company and Roth Capital Partners, LLC dated May 18, 2009. (24) | |
| 10.33 | Form of Restricted Stock Unit Award Agreement. (25) | |
| 10.34 | Separation Agreement and General Release of all Claims between Registrant and Tim Hart. (25) | |
| 10.35 | Termination Agreement between Registrant and Alain R. Riedo. (25) | |
| 10.36 | Employment Agreement effective as of September 21, 2009 between the Registrant and George Kreigler. (26) | |
| 21.1 | List of subsidiaries of Registrant. * | |
| 23.1 | Consent of Independent Registered Public Accounting Firm, McGladrey & Pullen, LLP. * | |
| 31.1 | Certification of Chief Executive Officer pursuant to Rule 13a-14(a) (Section 302 Certification) as adopted pursuant to Section 302 of the Sarbanes-Oxley Act of 2002. * | |
| 31.2 | Certification of Chief Financial Officer pursuant to Rule 13a-14(a) (Section 302 Certification) as adopted pursuant to Section 302 of the Sarbanes-Oxley Act of 2002. * | |
| 32.1 | Certification of Chief Executive Officer pursuant to 18 U.S.C. Section 1350, as adopted pursuant to Section 906 of the Sarbanes-Oxley Act of 2002. * | |
| 32.2 | Certification of Chief Financial Officer pursuant to 18 U.S.C. Section 1350, as adopted pursuant to Section 906 of the Sarbanes-Oxley Act of 2002. * | |
| * | Filed herewith. |
| (1) | Incorporated herein by reference to Registrant’s Current Report on Form 8-K filed with the SEC on January 15, 2004 (SEC file no. 001-15477). |
| (2) | Incorporated herein by reference to Registrant’s Annual Report on Form 10-K for the fiscal year ended July 31, 1999 (SEC file no. 000-10964). |
| (3) | Incorporated herein by reference to Registrant’s Quarterly Report on Form 10-Q for the quarter ended June 30, 2003 (SEC file no. 001-15477). |
| (4) | Incorporated herein by reference to Registrant’s Transition Report on Form 10-K for the transition period from August 1, 1999 to December 31, 1999 (SEC file no. 001-15477). |
| (5) | Incorporated herein by reference to Registrant’s Current Report on Form 8-K filed with the SEC on July 19, 2002 (SEC file no. 001-15477). |
| (6) | Incorporated herein by reference to Registrant’s Current Report on Form 8-K filed with the SEC on September 18, 2002 (SEC file no. 001-15477). |
| (7) | Incorporated herein by reference to Registrant’s Annual Report on Form 10-K for the fiscal year ended July 31, 1997 (SEC file no. 000-10964). |
| (8) | Incorporated herein by reference to Registrant’s Annual Report on Form 10-K for the fiscal year ended July 31, 1995 (SEC file no. 000-10964). |
| (9) | Incorporated herein by reference to Registrant’s Annual Report on Form 10-K for the fiscal year ended July 31, 1996 (SEC file no. 000-10964). |
| (10) | Incorporated herein by reference to Registrant’s Form 8-A filed November 18, 1999 (SEC file no. 001-15477). |
| (11) | Incorporated herein by reference to Registrant’s Annual Report on Form 10-K for the fiscal year ended July 31, 1987 (SEC file no. 000-10964). |
| (12) | Incorporated herein by reference to Registrant’s Annual Report on Form 10-K for the fiscal year ended December 31, 2003 (SEC file no. 001-15477). |
100
Table of Contents
| (13) | Incorporated herein by reference to Registrant’s Annual Report on Form 10-K for the fiscal year ended December 31, 2000 (SEC file no. 001-15477). |
| (14) | Incorporated herein by reference to Registrant’s Annual Report on Form 10-K for the fiscal year ended July 31, 1998 (SEC file no. 000-10964). |
| (15) | Incorporated herein by reference to Registrant’s Annual Reports on Form 10-K for the fiscal year ended December 31, 2004 (SEC file no. 001-15477). |
| (16) | Incorporated herein by reference to Registrant’s Current Report on Form 8-K filed with the SEC on December 21, 2005 (SEC file no. 001-15477). |
| (17) | Incorporated herein by reference to Registrant’s Current Report on Form 8-K filed with the SEC on May 8, 2007 (SEC file no. 001-15477). |
| (18) | Incorporated herein by reference to Registrant’s Current Report on Form 8-K filed with the SEC on May 10, 2007 (SEC file no. 001-15477). |
| (19) | Incorporated herein by reference to Registrant’s Current Report on Form 10-Q filed with the SEC on August 9, 2007 (SEC file no. 001-15477). |
| (20) | Incorporated herein by reference to Registrant’s Current Report on Form 8-K filed with the SEC on October 10, 2007 (SEC file no. 001-15477). |
| (21) | Incorporated herein by reference to Registrant’s Current Report on Form 8-K filed with the SEC on August 11, 2008 (SEC file no. 001-15477). |
| (22) | Incorporated herein by reference to Registrant’s Annual Reports on Form 10-K for the fiscal year ended December 31, 2008. |
| (23) | Incorporated herein by reference to Registrant’s Current Report on Form 10-Q filed with the SEC on May 5, 2009 (SEC file no. 001-15477). |
| (24) | Incorporated herein by reference to Registrant’s Current Report on Form 8-K filed with the SEC on May 19, 2009 (SEC file no. 001-15477). |
| (25) | Incorporated herein by reference to Registrant’s Current Report on Form 10-Q filed with the SEC on August 10, 2009 (SEC file no. 001-15477). |
| (26) | Incorporated herein by reference to Registrant’s Current Report on Form 10-Q filed with the SEC on November 5, 2009 (SEC file no. 001-15477). |
(b) See the exhibits required by this item under Item 15(a)(3) above.
(c) See the financial statement schedule required by this item under Item 15(a)(2) above.
101
Table of Contents
SIGNATURES
Pursuant to the requirements of Section 13 or 15(d) of the Securities Exchange Act of 1934, the registrant has duly caused this report to be signed on its behalf by the undersigned, thereunto duly authorized, on this 5th day of March 2010.
| MAXWELL TECHNOLOGIES, INC. | ||
| By: | /S/ DAVID J. SCHRAMM | |
| David J. Schramm President and Chief Executive Officer | ||
Pursuant to the requirements of the Securities Exchange Act of 1934, this report has been signed below by the following persons on behalf of the registrant and in the capacities and on the dates indicated.
| Signature |
Title |
Date | ||
| /S/ DAVID J. SCHRAMM David J. Schramm |
President, Chief Executive Officer and Director |
March 5, 2010 | ||
| /S/ KEVIN S. ROYAL Kevin S. Royal |
Senior Vice President, Chief Financial Officer, Treasurer and Secretary |
March 5, 2010 | ||
| /S/ MARK ROSSI Mark Rossi |
Director |
March 5, 2010 | ||
| /S/ JEAN LAVIGNE Jean Lavigne |
Director |
March 5, 2010 | ||
| /S/ ROBERT L. GUYETT Robert L. Guyett |
Director |
March 5, 2010 | ||
| /S/ JOSÉ CORTES José Cortes |
Director |
March 5, 2010 | ||
| /S/ EDWARD CAUDILL Edward Caudill |
Director |
March 5, 2010 | ||
| /S/ BURKHARD GOESCHEL Burkhard Goeschel |
Director |
March 5, 2010 | ||
| /S/ ROGER HOWSMON Roger Howsmon |
Director |
March 5, 2010 | ||
| /S/ YON YOON JORDEN Yon Yoon Jorden |
Director |
March 5, 2010 | ||
102