Attached files
Table of Contents
UNITED STATES
SECURITIES AND EXCHANGE COMMISSION
Washington, D.C. 20549
FORM 10-K
Annual Report Pursuant to Section 13 or 15(d) of the Securities Exchange Act of 1934
For the fiscal year ended December 27, 2009
Commission File Number: 1-31805
JOURNAL COMMUNICATIONS, INC.
(Exact name of Registrant as specified in its charter)
| Wisconsin | 20-0020198 | |
| (State of incorporation) | (I.R.S. Employer identification number) | |
| 333 West State Street, Milwaukee, Wisconsin | 53203 | |
| (Address of principal executive offices) | (Zip Code) | |
Registrant’s telephone number, including area code: (414) 224-2000
Securities registered pursuant to Section 12(b) of the Act:
| Title of Class | Name of Each Exchange on Which Registered | |
| Class A Common Stock, $0.01 par value per share | The New York Stock Exchange |
Securities registered pursuant to Section 12(g) of the Act:
Class B Common Stock, $0.01 par value per share
Indicate by check mark if the registrant is a well-known seasoned issuer, as defined in Rule 405 of the Securities Act. Yes ¨ No x
Indicate by check mark whether the registrant is not required to file reports pursuant to Section 13 or Section 15(d) of the Exchange Act. Yes ¨ No x
Indicate by check mark whether the Registrant (1) has filed all reports required to be filed by Section 13 or 15(d) of Securities Exchange Act of 1934 during the preceding 12 months (or for such shorter period that the Registrant was required to file such reports) and (2) has been subject to such filing requirements for the past 90 days. Yes x No ¨
Indicate by check mark whether the registrant has submitted electronically and posted on its corporate Web site, if any, every Interactive Data File required to be submitted and posted pursuant to Rule 405 of Regulation S-T during the preceding 12 months (or for such shorter period that the registrant was required to submit and post such files) (Registrant is not yet required to provide financial disclosure in an Interactive Data File format). Yes ¨ No ¨
Indicate by check mark if disclosure of delinquent filers pursuant to Item 405 of Regulation S-K (Section 229.405 of this chapter) is not contained herein, and will not be contained, to the best of registrant’s knowledge, in definitive proxy or information statements incorporated by reference in Part III of this Form 10-K or any amendment to this Form 10-K. x
Indicate by check mark whether the registrant is a large accelerated filer, an accelerated filer, non-accelerated filer or a smaller reporting company. See definitions of “large accelerated filer,” “accelerated filer,” and “smaller reporting company” in Rule 12b-2 of the Exchange Act.
Large Accelerated Filer ¨ Accelerated Filer ¨ Non-accelerated Filer x Smaller reporting company ¨
Indicate by check mark whether the registrant is a shell company (as defined in Rule 12b-2 of the Exchange Act) Yes ¨ No x
The aggregate market value of the class A common stock held by non-affiliates of the registrant as of June 26, 2009 was approximately $38,793,495 (based on the closing price of such stock on the New York Stock Exchange, Inc. as of such date). Neither of the registrant’s class B common stock or Class C common stock is listed on a national securities exchange or traded in an organized over-the-counter market, but each share of the registrant’s class B common stock is convertible into one share of the registrant’s class A common stock and each share of the registrant’s class C common stock is convertible into 1.3639790 shares of the registrant’s class A common stock.
Number of shares outstanding of each of the issuer’s classes of common stock as of February 26, 2010 (excluding 8,676,705 shares of class B common stock held by our subsidiary, The Journal Company):
| Class |
Outstanding at February 26, 2010 | |
| Class A Common Stock |
41,934,533 | |
| Class B Common Stock |
9,755,953 | |
| Class C Common Stock |
3,264,000 |
Documents Incorporated by Reference
Portions of the Proxy Statement for our April 28, 2010 Annual Meeting of Shareholders are incorporated by reference into Part III.
Table of Contents
INDEX TO FORM 10-K
| Page No. | ||||
| Part I |
||||
| Item 1. |
2 | |||
| Item 1A. |
18 | |||
| Item 1B. |
29 | |||
| Item 2. |
29 | |||
| Item 3. |
30 | |||
| Item 4. |
30 | |||
| Part II |
||||
| Item 5. |
31 | |||
| Item 6. |
33 | |||
| Item 7. |
Management’s Discussion and Analysis of Financial Condition and Results of Operations |
34 | ||
| Item 7A. |
63 | |||
| Item 8. |
64 | |||
| Item 9. |
Changes in and Disagreements with Accountants on Accounting and Financial Disclosure |
106 | ||
| Item 9A. |
106 | |||
| Item 9B. |
106 | |||
| Part III |
||||
| Item 10. |
107 | |||
| Item 11. |
107 | |||
| Item 12. |
Security Ownership of Certain Beneficial Owners and Management and Related Stockholder Matters |
107 | ||
| Item 13. |
Certain Relationships and Related Transactions, and Director Independence |
108 | ||
| Item 14. |
108 | |||
| Part IV |
||||
| Item 15. |
109 | |||
| 111 | ||||
| 112 | ||||
Table of Contents
Forward-Looking Statements
We make certain statements in this Annual Report on Form 10-K (including the information that we incorporate by reference herein) that are “forward-looking statements” within the meaning of the Section 21E of the Securities Exchange Act of 1934, as amended. We intend these forward-looking statements to be covered by the safe harbor provisions for forward-looking statements contained in that Act, and we are including this statement for purposes of those safe harbor provisions. These forward-looking statements generally include all statements other than statements of historical fact, including statements regarding our future financial position, business strategy, budgets, projected revenues and expenses, expected regulatory actions and plans and objectives of management for future operations. We often use words such as “may,” “will,” “intend,” “anticipate,” “believe,” or “should” and similar expressions in this Annual Report on Form 10-K to identify forward-looking statements. These forward-looking statements are not guarantees of future performance and are subject to risks, uncertainties and other factors, some of which are beyond our control. These risks, uncertainties and other factors could cause actual results to differ materially from those expressed or implied by those forward-looking statements. Among such risks, uncertainties and other factors that may impact us are the following, as well as those contained in Item 1A. “Risk Factors” of this Annual Report on Form 10-K:
| • | changes in advertising demand or the buying strategies of advertisers or the migration of advertising to the internet; |
| • | changes in newsprint prices and other costs of materials; |
| • | changes in federal or state laws and regulations or their interpretations (including changes in regulations governing the number and types of broadcast and cable system properties, newspapers and licenses that a person may control in a given market or in total); |
| • | changes in legislation or customs relating to the collection, management and aggregation and use of consumer information through telemarketing and electronic communication efforts; |
| • | the availability of quality broadcast programming at competitive prices; |
| • | changes in network affiliation agreements; |
| • | quality and rating of network over-the-air broadcast programs, including programs changing networks and changing competitive dynamics regarding how and when programs are made available to our viewers; |
| • | effects of the loss of commercial inventory resulting from uninterrupted television news coverage and potential advertising cancellations due to war or terrorist acts; |
| • | effects of the rapidly changing nature of the publishing, broadcasting and printing industries, including general business issues, competitive issues and the introduction of new technologies; |
| • | an other than temporary decline in operating results and enterprise value that could lead to further non-cash impairment charges due to the impairment of goodwill, broadcast licenses, other intangible assets and property, plant and equipment; |
| • | the impact of changing economic and financial market conditions and interest rates on our liquidity, on the value of our pension plan assets and on the availability of capital; |
| • | our ability to remain in compliance with the terms of our credit agreement; |
| • | changes in interest rates; |
| • | the outcome of pending or future litigation; |
| • | energy costs; |
| • | the availability and effect of acquisitions, investments, dispositions and other capital expenditures including share repurchases on our results of operations, financial condition or stock price; and |
| • | changes in general economic conditions. |
We caution you not to place undue reliance on these forward-looking statements, which we have made as of the date of this Annual Report on Form 10-K.
1
Table of Contents
| ITEM 1. | BUSINESS |
Overview
Our business segments are based on the organizational structure used by management for making operating and investment decisions and for assessing performance. Our reportable business segments are: (i) publishing; (ii) broadcasting; (iii) printing services; and (iv) other. Our publishing segment consists of the Milwaukee Journal Sentinel, which serves as the only major daily newspaper for the Milwaukee metropolitan area, and community newspapers and shoppers in Wisconsin and Florida. Our broadcasting segment consists of 33 radio stations and 13 television stations in 12 states and the operation of a television station under a local marketing agreement. Our interactive media assets build on our strong publishing and broadcasting brands. We also provide a wide range of commercial printing services, including printing of publications, professional journals and documentation material, through our printing services segment. Our other segment consists of corporate expenses and eliminations and, historically, included a direct marketing services business until we sold this business in February 2010.
We were founded in 1882 as a newspaper publisher serving Milwaukee, Wisconsin. Our media business mix was expanded in 1927 when we signed on radio station WTMJ-AM, and again in 1947 when we put WTMJ-TV on the air. In 1937, Harry J. Grant founded our employee ownership plan, which contributed significantly to our company’s positive culture and growth through its termination in 2003, in conjunction with our initial public offering. We believe our current capital structure allows us to continue our longstanding tradition of employee ownership. We have been able to attract and retain motivated people who have a passion for the business and a level of commitment and sense of accountability that is heightened due to our business culture and employees’ ability to participate in ownership. Our culture is reinforced by our strong commitment to high ethical standards.
In 2009, our total revenue was $433.6 million, 84.4% of which was generated from our publishing and broadcasting operations and 15.6% from printing services and other operations. The revenue generated by each operating segment, as a percentage of our consolidated revenue, for the last three years is shown below:
| 2009 | 2008 | 2007 | |||||||
| Publishing |
44.8 | % | 44.4 | % | 45.7 | % | |||
| Broadcasting |
39.6 | 38.5 | 37.4 | ||||||
| Printing Services |
11.1 | 12.0 | 11.9 | ||||||
| Other |
4.5 | 5.1 | 5.0 | ||||||
| Total |
100.0 | % | 100.0 | % | 100.0 | % | |||
More information regarding us is available at our website at www.journalcommunications.com. We are not including the information contained on our website as part of, or incorporating it by reference into this Annual Report on Form 10-K. Our Annual Report on Form 10-K, Quarterly Reports on Form 10-Q, Current Reports on Form 8-K and any amendments to those reports are made available to the public at no charge, other than a reader’s own internet access charges, through a link appearing on our website. We provide access to such material through our website as soon as reasonably practicable after we electronically file such material with, or furnish it to, the Securities and Exchange Commission.
Publishing
Our publishing business is conducted through our wholly owned subsidiaries, Journal Sentinel, Inc., and Journal Community Publishing Group, Inc., and consists of our daily newspaper, the Milwaukee Journal Sentinel, and our community newspapers and shoppers. Our publishing business accounted for 44.8% of our revenue for the year ended December 27, 2009. Within our publishing segment, our daily newspaper accounted
2
Table of Contents
for 82.4% of our publishing revenue. See “Management’s Discussion and Analysis of Financial Condition and Results of Operations” and Note 12 to our Consolidated Financial Statements for additional financial information regarding our publishing business.
Daily Newspaper
Published continuously from 1882, our daily newspaper has the largest circulation among all newspapers published in Wisconsin, with a six-month average net paid circulation reported to the Audit Bureau of Circulations in our Publisher’s Statement at September 30, 2009 of 334,240 on Sunday and 190,841 daily. The Milwaukee Journal Sentinel serves as the only major daily and Sunday newspaper for the Milwaukee metropolitan area. According to a 2009 readership survey conducted by Scarborough Research, the Sunday Milwaukee Journal Sentinel ranks number one in readership among the 50 highest populated markets in the United States and the daily newspaper ranks number two. Over the course of a week, readership of our daily newspaper, online and niche products is tied for number one with a 62% penetration rate. These rankings are calculated by dividing the number of adults reading an average issue of the newspaper in a newspaper’s Designated Market Area (DMA) by the number of persons over the age of 18 in the newspaper’s DMA. The Milwaukee Journal Sentinel’s DMA, which ranks among the top 50 in the United States, consists of the 10-county area surrounding Milwaukee, Wisconsin.
Our daily newspaper and its reporting staff won more national awards in 2009 than in any previous year. “Chemical Fallout”, an ongoing series that exposed the dangers of common household chemicals—particularly bisphenol A—and the failures of the Environmental Protection Agency and the Food and Drug Administration to protect the public, won two major awards: the Polk Award, one of the nation’s highest honors in journalism, and the Environmental Reporting prize in the Scripps Howard Foundation National Journalism Awards. The series also was a Pulitzer Finalist for investigative reporting. The Journal Sentinel staff also won more first-place reporting and writing awards than any other newspaper in the country in the 2009 Scripps Howard competition, hosted by the Press Club of Atlantic City. The Society of American Business Editors and Writers, the leading trade organization for business journalists, picked the series “Easy Money” for a 2008 Best in Business award for detailing the causes and consequences of the subprime mortgage mess, and how it hurt local residents. The staff also won the National Academies’ 2009 Communication Award for excellence in reporting and communicating science, engineering and medicine to the public for the series “Targeting the Good Cell”, which chronicled the behind-the-scenes race among scientists to discover a way to return mature human cells back to their pristine embryonic state, without using human embryos.
In addition to our traditional print media, we operate a number of websites that provide editorial and advertising content, including JSOnline.com, MilwaukeeMarketplace.com, Milwaukeemoms.com and the MyCommunityNOW family of 26 community websites, which we operate under the name of Journal Interactive division of Journal Sentinel, Inc. Also, we produce a subscription-based website, PackerInsider.com, dedicated to coverage of the Green Bay Packers. Our employment site, JobNoggin.com, which is co-branded with Monster Worldwide, Inc. (Monster®), combines the promotional strength of our daily newspaper, JSOnline.com and our Milwaukee television and radio properties with Monster®’s product and brand. In 2008, our daily newspaper joined the Yahoo! Consortium, a newspaper and Yahoo! web portal partnership that shares content, advertising and technology. In January 2009, our daily newspaper launched a new co-branded online automotive offering under a new franchise agreement with CarSoup of Minnesota, Inc. (CarSoup). In 2009, online revenue of $9.5 million for Journal Interactive at our daily newspaper decreased 35.5% compared to $14.7 million in 2008. The difficult economic environment negatively impacted automotive and employment online advertising revenue. In 2009, revenue from automotive online classified advertising decreased by 80.6% primarily due to the transition to the new franchise relationship with CarSoup.com.
The Milwaukee Journal Sentinel is distributed primarily by independent contract carriers throughout southeastern Wisconsin. Agents deliver the Milwaukee Journal Sentinel to single copy outlets throughout the rest of Wisconsin.
3
Table of Contents
The following table sets forth our average net paid circulation:
| Six-Months Ended September 30 | 12-Months Ended March 31 | |||||||||||
| 2009 | 2008 | 2007 | 2009 | 2008 | 2007 | |||||||
| Daily (Five-day average) |
190,841 | 212,157 | 220,676 | 207,717 | 219,214 | 230,503 | ||||||
| Sunday |
334,240 | 375,432 | 390,842 | 368,686 | 387,756 | 400,871 | ||||||
Circulation revenue accounted for 31.9% of our daily newspaper’s total revenue in 2009. The Milwaukee Journal Sentinel single copy prices are $0.75 for daily and $2.00 for Sunday in our five county primary market area. We believe our average net paid circulation is decreasing due to, among other factors, increased competition for readers from new media products, other free sources, our decision to discontinue certain third-party programs and economic pressures on consumers. Advertising revenue accounted for 58.6% of our daily newspaper’s total revenue in 2009. Our daily newspaper experienced decreases in revenue in all advertising categories in 2009 compared to 2008 due to the secular influences affecting the newspaper industry and the difficult economic environment, which persisted in 2009.
Other revenue, which consists of revenue from promotional and commercial distribution and commercial printing revenue accounted for 9.5% of our daily newspaper’s total revenue in 2009. Our state-of-the-art printing facility allows us to leverage our existing assets to sign long term agreements to print other daily newspapers, such as USA Today, Kenosha News, Pioneer Press and others. We believe we provide high quality, competitive pricing and close proximity to their readers.
Community Newspapers and Shoppers
We own and operate community newspapers and shoppers in Wisconsin and Florida and a printing plant in Wisconsin through our subsidiary, Journal Community Publishing Group, Inc.
Our community newspapers have a combined paid and free average weekly distribution of approximately 240,000. Our community newspapers focus on local news and events that are of interest to the local residents. In some markets, our community newspapers are the only source of local news.
Our shoppers have a combined average weekly distribution of approximately 291,000. Shoppers are free-distribution publications, primarily carrier-delivered to each household in a geographic area, featuring advertisements primarily from local and regional businesses. A few of our shoppers also include local interest stories and weekly columns, such as fishing/hunting reports, obituaries and television listings.
We also publish niche publications that appeal to very specific advertisers and readers, with a combined paid and free average weekly distribution of approximately 76,000. A few examples of the niche products are lifestyle, sports, automotive and boat enthusiast and agricultural publications.
Advertising revenue and circulation revenue accounted for 84.9% and 6.0%, respectively, of our community newspapers’ and shoppers’ total revenue in 2009. In addition to our publishing operations, we also provide commercial printing services, including cold-web printing, sheet-fed printing, electronic prepress, mailing services, bindery and inserting, mostly for other weekly and monthly publications. Revenue from commercial printing accounted for 9.1% of our community newspapers’ and shoppers’ total revenue in 2009. Our community newspapers, shoppers and niche publications groups are as follows:
| 2010 Average Distribution |
2009 Average Distribution |
Number of | ||||||||||||||
| Newspapers | Shoppers | Niche Publications | ||||||||||||||
| 2010 | 2009 | 2010 | 2009 | 2010 | 2009 | |||||||||||
| Northern Wisconsin |
304,000 | 360,000 | 6 | 9 | 11 | 12 | 3 | 5 | ||||||||
| Southeastern Wisconsin |
190,000 | 225,000 | 14 | 14 | 4 | 4 | — | — | ||||||||
| Florida |
113,000 | 135,000 | 4 | 4 | 1 | 1 | 4 | 5 | ||||||||
4
Table of Contents
Newsprint
The basic raw material of newspapers is newsprint. We currently purchase the majority of our estimated newsprint requirements from a single supplier. We may purchase our remaining estimated newsprint requirements in the spot market from other suppliers.
We believe we will continue to receive an adequate supply of newsprint for our needs. Newsprint prices fluctuate based upon market factors, which include newsprint production capacity, currency exchange rates, manufacturer’s cost drivers, inventory levels, demand and consumption. Price fluctuations for newsprint can have a significant effect on our results of operations. The average net price per ton was $581 in 2009 compared to an average net price per ton of $692 in 2008. Our consumption of newsprint decreased to 27,540 metric tons in 2009 from 35,822 metric tons in 2008, and our total cost of newsprint decreased $8.8 million in 2009. The decrease in consumption in 2009 is primarily due to decreases in run-of-press (ROP) advertising at our daily newspaper and our community newspapers and shoppers business, a decrease in content pages in the daily newspaper and community newspapers and shoppers, a decrease in average net paid circulation and a decrease in waste. Based on the consumption of newsprint in 2009 by our daily newspaper and by our community newspapers and shoppers, a $10 per ton increase or decrease in the price of newsprint would increase or decrease our total cost of newsprint by $0.3 million.
Industry and Competition
Newspaper publishing is the oldest segment of the media industry. Metropolitan and community newspapers often represent the primary medium for news and local advertising due to their historic importance to the communities they serve.
Over the past few years, fundamentals in the newspaper industry have deteriorated significantly. Continuing weakness in the automobile industry has resulted in a decline in automotive advertising. Reductions in retail and classified run-of-press (ROP) advertising (due in part to department store consolidation, weakened employment and real estate economics and a migration of advertising to the internet), circulation declines and online competition have also negatively impacted newspaper industry revenues. Additionally, the continued housing market downturn has adversely impacted the newspaper industry, including real estate classified advertising as well as the home improvement, furniture and financial services advertising categories. These conditions, coupled with a weak economy, persisted in 2009.
Advertising revenue is the largest component of a newspaper’s total revenue and it is affected by cyclical changes in national and regional economic conditions. Classified advertising is generally the most sensitive to economic cycles and secular changes in the newspaper business because it is driven primarily by the demand for employment, real estate transactions and automotive sales. Newspaper advertising revenue is seasonal and our publishing business tends to see increased revenue due to increased advertising activity during certain holidays.
We believe newspapers and their online and niche products continue to be one of the most effective mediums for retail and classified advertising because they allow advertisers to promote the price and selection of goods and to maximize household reach within a local retail trading area. Notwithstanding the advertising advantages newspapers offer, newspapers have many competitors for advertising dollars and paid circulation. These competitors include local, regional and national newspapers, shoppers, magazines, broadcast and cable television, radio, direct mail, Yellow Pages, the internet and other media. Competition for newspaper advertising revenue is based largely upon advertiser results, advertising rates, readership, demographics and circulation levels, while competition for circulation revenue is based largely upon the content of the newspaper, its price, editorial quality, and customer service. On occasion, our businesses compete with each other for regional and local advertising, particularly in the Milwaukee market.
5
Table of Contents
Broadcasting
Our broadcasting business is conducted through our wholly owned subsidiary, Journal Broadcast Corporation, and its subsidiaries, which together operate 33 radio stations and 13 television stations in 12 states and a television station under a local marketing agreement. Our broadcasting business accounted for 39.6% of our revenue for the year ended December 27, 2009. See “Management’s Discussion and Analysis of Financial Condition and Results of Operations” and Note 12 to our Consolidated Financial Statements for additional financial information regarding our broadcasting business.
Our radio and television stations focus on providing targeted and relevant local programming that is responsive to the interests of the communities in which they compete. We promote a local focus that allows our stations and radio clusters to serve listeners, viewers and advertisers more effectively, strengthens each station’s brand identity and allows our stations to provide effective marketing solutions for local advertisers by reaching their targeted audiences.
In an effort to maximize our operating margins, we have implemented a centralized management approach to certain functions such as engineering, IT, finance and human resources to generate economies of scale and incorporate best practices. We intend to continue to explore cost reduction and efficiency measures across our stations and pursue market share and ratings growth which we believe will generate increased operating efficiency and revenue, and drive improvement in operating margin.
In five of our markets, Milwaukee, Wisconsin; Boise, Idaho; Tucson, Arizona; Omaha, Nebraska and Palm Springs, California, we either own and operate both television and radio stations or own and operate more than one television station. We believe multiple properties in a market help us to better serve advertisers, viewers and listeners.
Television Broadcasting
Based on the November 2009 Nielsen ratings book, we are ranked among the top three stations in terms of station audience rating in seven of the 10 markets in which our television stations operate. WTMJ-TV, our Milwaukee television station, had the top-rated late night local newscast (Monday-Friday) in its Designated Market Area in 76 of the previous 81 ratings periods (based on the percentage of the total potential household audience). In 2009, revenue from television operations accounted for 61.5% of our broadcasting revenue.
6
Table of Contents
Our television stations are:
| Station and |
Market |
Year Acquired |
Station Market Rank(1) |
Station Audience Rank(1) |
Total Stations in Market(2) |
Expiration Date of Network Affiliation |
Expiration Date of FCC License(8) |
||||||||
| WTMJ-TV NBC |
Milwaukee, WI | 1947 | 3 | 9 | 15 | 12/31/2012 | 12/01/2005 |
(9) | |||||||
| KTNV-TV ABC |
Las Vegas, NV | 1979 | 3+ | 6 | 15 | 12/31/2012 | 10/01/2014 | ||||||||
| WSYM-TV FOX |
Lansing, MI | 1984 | 4 | 6 | 7 | 6/30/2010 | 10/01/2013 | ||||||||
| KMIR-TV NBC |
Palm Springs, CA | 1999 | 3+ | 6 | 9 | 12/31/2012 | 12/01/2014 | ||||||||
| KPSE-LP(3)(7) MNT |
Palm Springs, CA | 2008 | N/A | N/A | 9 | 10/03/2010 | 12/01/2014 | ||||||||
| KIVI-TV ABC |
Boise, ID | 2001 | 3 | 9 | 13 | 12/31/2012 | 6/01/2014 | ||||||||
| KNIN-TV(4) CW |
Boise, ID | 2009 | 6 | 3 | 13 | 8/31/2011 | 10/01/2014 | ||||||||
| KSAW-LP(3) ABC |
Twin Falls, ID | 2001 | 3+ | 4 | 7 | 12/31/2012 | 10/01/2014 | ||||||||
| WGBA-TV NBC |
Green Bay/Appleton, WI | 2004 | 4 | 7 | 7 | 1/01/2013 | 12/01/2013 | ||||||||
| WACY-TV(5)(7) MNT |
Green Bay/ Appleton, WI |
2004 | N/A | N/A | 7 | 10/03/2010 | N/A | ||||||||
| KGUN-TV ABC |
Tucson, AZ | 2005 | 1+ | 12 | 10 | 2/12/2012 | 10/01/2014 | ||||||||
| KWBA-TV(7) CW |
Tucson, AZ | 2008 | N/A | N/A | 10 | 8/31/2016 | 10/01/2014 | ||||||||
| WFTX-TV FOX |
Naples/Fort Myers, FL | 2005 | 4 | 5 | 10 | 6/30/2010 | 2/01/2013 | ||||||||
| KMTV-TV CBS |
Omaha, NE | 2005 | 3 | 11 | 9 | 9/18/2016 | 6/01/2014 |
| (1) | Station market rank is based upon station audience ratings, which equal the percentage of the total potential household audience in the Designated Market Area (DMA). Station audience share equals the percentages of the audience in the DMA actually watching our television station. The percentages are based on surveys conducted 5:00 a.m. to 2:00 a.m., seven days a week, as published in the November 2009 Nielsen ratings book. A “+” indicates a tie with another station in the market. |
| (2) | Includes all television stations whose city of origin is within the DMA that meet the minimum reporting standards. |
| (3) | Low-power television station. |
| (4) | We acquired KNIN-TV on April 23, 2009. |
| (5) | We operate WACY-TV under a local marketing agreement between WGBA-TV and WACY-TV. |
| (6) | Green Bay, WI and Appleton, WI are considered one DMA. |
| (7) | KPSE-LP, WACY-TV and KWBA-TV did not qualify to be reported in the November 2009 Nielsen ratings book. |
| (8) | FCC (aka broadcast) licenses are granted for maximum terms of eight years and are subject to renewal upon application to the FCC. Refer to “Regulation” for further discussion of the FCC license renewal process. |
| (9) | Pending. |
The affiliation by a station with one of the four major networks (NBC, ABC, CBS and FOX) has a significant impact on the composition of the station’s programming, revenue, expenses and operations. Lower ratings of NBC network programming have continued to have an adverse affect on revenue in our Milwaukee, Green Bay, and Palm Springs markets. We believe all of our television stations are strong affiliates with good relationships with the respective networks.
7
Table of Contents
In all of our markets and regardless of network affiliation, we focus on delivering leading local news programming, locally produced programming and contracting for popular syndicated programming with the objective of maximizing our ratings and in turn our share of advertising spending in a given market. We believe that Las Vegas, Boise, Palm Springs, Tucson and Fort Myers/Naples are markets with attractive long-term demographic and growth profiles and that as a result, there is significant opportunity for growth and operating improvement at these stations.
Television advertising revenue and rates in even-numbered years typically benefit from political and issue and advertising because there tends to be more pressure on available inventory as the demand for advertising increases and we have the opportunity to increase the average unit rates we charge our customers. Television political and issue advertising revenue was $2.3 million in 2009, which is generally considered a non-election year, compared to $11.6 million in 2008. Olympics-related advertising on our three NBC affiliates was $2.3 million in 2008. NBC has purchased the right to broadcast the Olympics through 2012, and we expect higher revenue in these years because the expected increased ratings during the Olympic time period for our three NBC affiliates will allow them to sell advertising at premium rates. National automotive revenue is heavily placed in prime time, which helps drive average unit rates among other advertisers. When that placement doesn’t occur in prime time, it negatively affects demand and does not allow us the opportunity to increase the rates we can charge our advertisers even when the sell-out levels are high.
We currently have retransmission consent agreements with virtually all distributors (cable, satellite and telecommunications) in our local markets for the rights to carry our signals and local programming in their pay television services to consumers. Our television stations experienced a $2.9 million increase in retransmission consent revenue in 2009 due to recently renegotiated contracts. These agreements are for multiple years with set rate increases and are based upon the number of subscribers to the cable, satellite or telecommunications systems.
We have also made substantial investments in digital transmission equipment at our stations and are fully compliant with Federal Communications Commission (FCC) mandates on digital transmission. We anticipate investing in digital infrastructure in several of our television markets as we make the continuing transition to HDTV (high-definition television). Also, we expect these investments to create additional operating efficiencies and improve the transfer of program content to our internet websites.
Radio Broadcasting
Based on the Fall 2009 Arbitron ratings book, we have the number one station in terms of station audience rank in three of the eight markets in which our radio stations operate, including in Milwaukee where WTMJ-AM has been the top-rated radio station for 56 consecutive Arbitron rating periods. We have grown our radio operations primarily through acquisitions of stations in mid-sized growth markets. We have acquired 17 of our 33 radio stations since 1999. During 2009, we sold radio stations KGEM-AM and KCID-AM in Boise, Idaho. In 2009, revenue from radio operations accounted for 38.5% of our broadcasting revenue.
8
Table of Contents
Our radio stations are:
| Market and Station |
Year Acquired |
Format |
Station Audience Rank(1) |
Total Stations in Market(2) |
FCC License Class(3) |
Expiration Date of FCC License(6) | ||||||
| Milwaukee, WI |
||||||||||||
| WTMJ-AM(5) |
1927 | News/Talk/Sports | 1 | 29 | B | 12/01/2012 | ||||||
| WLWK-FM(5) |
1959 | Variety Hits | 11 | 29 | B | 12/01/2012 | ||||||
| Omaha, NE |
||||||||||||
| KEZO-FM(5) |
1995 | Rock | 8 | 19 | C | 6/01/2013 | ||||||
| KKCD-FM(5) |
1995 | Classic Rock | 11 | 19 | C2 | 6/01/2013 | ||||||
| KSRZ-FM(5) |
1998 | Hot Adult Contemporary | 9 | 19 | C | 6/01/2013 | ||||||
| KXSP-AM |
1999 | Sports | 18 | 19 | B | 6/01/2013 | ||||||
| KQCH-FM(5) |
1999 | Contemporary Hits | 4 | 19 | C | 6/01/2013 | ||||||
| Tucson, AZ |
||||||||||||
| KFFN-AM |
1996 | Sports | 17 | 28 | C | 10/01/2013 | ||||||
| KMXZ-FM(5) |
1996 | Adult Contemporary | 2 | 28 | C | 10/01/2013 | ||||||
| KQTH-FM(5) |
1996 | Talk | 10 | 28 | A | 10/01/2013 | ||||||
| KGMG-FM |
1998 | Rhythmic Oldies | 11 | 28 | C2 | 6/01/2013 | ||||||
| Knoxville, TN |
||||||||||||
| WKTI-AM(4) |
1998 | Adult Standards | N/A | 19 | D | 8/01/2012 | ||||||
| WCYQ-FM(5) |
1997 | Country | 9 | 19 | A | 8/01/2012 | ||||||
| WWST-FM(5) |
1997 | Contemporary Hits | 3 | 19 | C1 | 8/01/2012 | ||||||
| WKHT-FM |
1998 | Rhythmic Contemporary Hits | 5+ | 19 | A | 8/01/2012 | ||||||
| Boise, ID |
||||||||||||
| KJOT-FM |
1998 | Rock | 17 | 20 | C | 10/01/2013 | ||||||
| KQXR-FM |
1998 | Active Rock | 5+ | 20 | C1 | 10/01/2013 | ||||||
| KTHI-FM |
1998 | Classic Hits | 2 | 20 | C | 10/01/2013 | ||||||
| KRVB-FM |
2000 | Adult Alternative | 16 | 20 | C | 10/01/2013 | ||||||
| Wichita, KS |
||||||||||||
| KFDI-FM(5) |
1999 | Country | 1 | 21 | C | 6/01/2013 | ||||||
| KICT-FM(5) |
1999 | Rock | 8+ | 21 | C1 | 6/01/2013 | ||||||
| KFXJ-FM(5) |
1999 | Classic Rock | 8+ | 21 | C2 | 6/01/2013 | ||||||
| KFTI-AM |
1999 | Traditional Country | 15 | 21 | B | 6/01/2013 | ||||||
| KYQQ-FM |
1999 | Regional Mexican | 14 | 21 | C | 6/01/2013 | ||||||
| KFTI-FM |
2000 | Classic Country | 16+ | 21 | C1 | 6/01/2013 | ||||||
| Springfield, MO |
||||||||||||
| KSGF-AM/FM |
1999/2003 | News/Talk (Simulcast) | 7+ | 18 | B/C3 | 2/01/2013 | ||||||
| KTTS-FM |
1999 | Country | 1 | 18 | C | 2/01/2013 | ||||||
| KSPW-FM |
1999 | Contemporary Hits | 2 | 18 | C2 | 2/01/2013 | ||||||
| KRVI-FM |
2003 | Variety Hits | 14+ | 18 | C3 | 2/01/2013 | ||||||
| Tulsa, OK |
||||||||||||
| KFAQ-AM(5) |
1999 | Talk | 13 | 23 | A | 6/01/2013 | ||||||
| KVOO-FM(5) |
1999 | Contemporary Country | 4 | 23 | C | 6/01/2013 | ||||||
| KXBL-FM(5) |
1999 | Classic Country | 11+ | 23 | C1 | 6/01/2013 | ||||||
| (1) | Station audience rank equals the ranking of each station, in its market, according to the Fall 2009 Arbitron ratings book. The ranking is determined based on the estimated share of persons 12 years and older listening during an average 15-minute increment (also known as “average quarterly hour,” or “AQH,” share) |
9
Table of Contents
| occurring Monday-Sunday between 6:00 a.m. and midnight. A “+” indicates a tie with another station in the market. |
| (2) | Includes stations qualified to be reported in the Fall 2009 Arbitron ratings book. In order to be qualified to be reported, a station must have received five or more minutes of listening in at least 10 diaries in the market from midnight to midnight, Monday through Sunday, during the survey period. |
| (3) | The FCC license class is a designation for the type of license based upon the radio broadcast service area according to radio broadcast rules compiled in the Code of Federal Regulations. |
| (4) | WKTI-AM did not qualify to be reported in the Fall 2009 Arbitron ratings book. |
| (5) | Stations that are broadcasting in digital. |
| (6) | FCC (aka broadcast) licenses are granted for maximum terms of eight years and are subject to renewal upon application to the FCC. Refer to “Regulation” for further discussion of the FCC license renewal process. |
We employ a variety of sales-related and programming strategies. Our sales-related strategies include maximizing our share of the local advertisers’ advertising spending. We believe development of local station clusters allows us to maximize market share because it allows us to offer a variety of format alternatives to appeal to a broader range of local advertisers. Our programming strategy includes developing and retaining local on-air talent to drive ratings. We have long-term contracts with many of our on-air personalities. In addition, our Milwaukee radio station, WTMJ-AM, currently maintains exclusive radio broadcast rights for the Green Bay Packers, Milwaukee Bucks and Milwaukee Brewers, and arranges a statewide radio network for the broadcast of their games.
Most of our radio broadcasting revenue is generated from the sale of local advertising, including developmental revenue, which refers to non-transactional revenue that targets non-traditional advertisers, with the balance generated from the sale of national advertising, political and issue advertising and other sources. We have predetermined the number of commercials that are broadcast each hour, depending on the format of a particular station. We attempt to determine the number of commercials broadcast hourly that can maximize available revenue dollars without diminishing listening levels. Although the number of advertisements broadcast during a given time period may vary, the total number of advertisements broadcast on a particular station generally does not vary significantly from year to year, unless there has been a format change.
We have aligned our radio stations in clusters within a market, in many cases building out the cluster around a lead station. We seek to build a unique and differentiated brand position at each station within a cluster so that we can offer distinct solutions for a variety of advertisers in any given market. This clustering strategy has allowed us to target our stations’ formats and sales efforts to better serve advertisers and listeners as well as leverage operating expenses to maximize the performance of each station and the cluster. We are currently broadcasting 17 radio stations in digital.
Industry and Competition
We compete with other radio and television stations, newspapers, cable television, satellite television, direct mail services, billboards, and the internet and, in the future, may also compete with the satellite radio technology for advertising dollars. We believe some of the factors an advertiser considers when choosing an advertising medium include its overall marketing strategy and reaching its targeted audience in the most cost-effective manner. In both radio and television broadcasting, revenue is derived primarily from advertising. Ratings, which estimate the number of viewers or listeners tuning in to a given station, highly influence competition in broadcasting because they affect the advertising rates the broadcaster can charge—higher ratings generally mean the broadcaster can charge higher rates for advertising. By having a cluster of several stations within one market, we can offer advertisers the opportunity to purchase air time on more than one of our stations in order to reach a broader audience.
10
Table of Contents
Revenues in the broadcast industry are derived primarily from the sale of advertising time to local, national and political advertisers and to a lesser extent from barter, digital revenues, retransmission fees and other revenues. Because television and radio broadcasters rely upon advertising revenue, they are subject to cyclical changes in the economy. The size of advertisers’ budgets, which are affected by broad economic trends, affects the broadcast industry in general and the revenue of individual television and radio stations. The broadcast industry continues to experience softness in television and radio advertising resulting from general economic pressure now impacting local and national economies, primarily in the housing, automobile and retail segments. Our broadcasting business also is affected by audience fragmentation as audiences have an increasing number of options to access news and other programming.
Changes in market demographics, the entry of competitive stations, the adoption of competitive formats by existing stations and the inability to retain popular on-air talent could result in lower ratings, which could in turn reduce advertising revenue. Technology can play an important role in competition as the ratings each station receives also depend upon the strength of the station’s signal in each market and, therefore, the number of listeners who have access to the signal. We continue to invest in the technology needed to maintain, and, where possible, strengthen our signals.
Commercial television stations generally fall into one of three categories. The first category of stations includes those affiliated with one of the four major national networks (NBC, ABC, CBS and FOX). The second category includes stations affiliated with more recently developed national networks, such CW and MyNetwork TV (MNT). The third category includes independent stations that are not affiliated with any network and rely principally on local and syndicated programming. Affiliation with a television network can have a significant influence on the revenue of a television station because the audience ratings generated by a network’s programming can affect the rates at which a station can sell advertising time. Generally, each station determines rates and receives all of the revenue, net of agency commissions, for national and local spot advertising. Recent discussions between certain national networks and cable, satellite and telecommunications providers suggest that the national networks will be seeking an increase in fees from its affiliates when the current affiliation agreements expire. The national networks believe they are due a portion of the retransmission revenue the affiliates generate from its agreements with the cable, satellite and telecommunications providers.
The recently proposed joint venture between Comcast Corporation (Comcast) and NBC Universal (NBCU), which would combine the programming assets owned by each company, could impact our NBC-affiliated television stations if successfully closed. We currently have a network affiliation agreement with NBC for three of our television stations and a retransmission consent agreement with Comcast for distribution of several of our television stations. The merger of the Comcast and NBCU programming assets could reduce our ability to negotiate favorable terms under future network affiliation and cable retransmission agreements. In addition, the merged entity could move popular sports and entertainment programming from the NBC broadcast network to co-owned cable channels and other paid distribution platforms owned by it.
Seasonal revenue fluctuations are common in the broadcasting industry and are primarily due to fluctuations in advertising expenditures by retailers and automobile manufacturers. Broadcast advertising is typically strongest in the second and fourth quarters of the year, which coincides with increased advertising around certain holidays. Historically, the second quarter tends to show an increase in automotive advertising as well as increases in tourism and travel advertising before the summer months. In even-numbered years, the Olympics, which typically occur during the first quarter or third quarter, and political and issue advertising, which typically is strongest in the third and fourth quarters, tend to cause increases in advertising revenue.
Printing Services
Our printing services business is conducted through our wholly owned subsidiary IPC Print Services, Inc. (IPC). Our printing services business accounted for 11.1% of our revenue for the year ended December 27, 2009. See “Management’s Discussion and Analysis of Financial Condition and Results of Operations” and Note 12 to our Consolidated Financial Statements for additional financial information regarding our printing services business.
11
Table of Contents
IPC, which was founded in 1949 and acquired by us in 1992, provides a wide range of printing services including complete production of magazines, professional journals, catalogs and documentation material, as well as distribution solutions and fulfillment. The foundation of our printing business includes printing scientific, medical and technical journals and magazines. We generally utilize conventional and electronic pre-press processes, web-and sheet-fed printing and complete bindery and finishing in our production processes. All of these markets are served through our direct national sales force or by the use of print brokers.
The printing services industry is highly competitive and generally characterized by low operating margins. As a result, we maintain control over our costs and ensure we align our cost base to changes in our revenue streams. We consistently seek opportunities to grow revenue through existing or new business.
Dell Computer Corporation (Dell) accounted for 3.7% and 11.4% of our printing services revenue in 2009 and 2008, respectively. We believe our revenue from Dell will end during 2010.
Industry and Competition
The printing services industry continues to experience consolidation. This trend has resulted in fewer private, independent competitors, creating several competitors that are larger than us in size with broader product offerings. The major competitive factors that impact our printing services business are price and schedule flexibility, paper prices, oil prices, United States Postal Service (USPS) rates, customer service and finished products quality, time to market and distribution capabilities.
We compete with a large number of companies, some of which have greater resources and capacity. In recent years, there has been excess capacity in the printing industry and consolidation within the industry that has increased competition. Rapid technological changes as well as a more global marketplace, both in terms of supply and demand, have also brought new competitors to the marketplace. To lessen exposure to larger competitors with greater resources, we focus generally on specialized markets with small- to medium-sized print run requirements where we can achieve market differentiation and gain competitive advantages through knowledge of the market and the ability to offer high quality solutions to customers.
The vast majority of our customers rely on advertising spending and subscriptions, both of which can be impacted by economic conditions. Technological developments in the industry enabling on-line versions of publications and catalogs, especially with improved reading devices such as Kindle and iPad, will also reduce spending on printed products. We closely watch trends affecting our customer base to ensure that we are appropriately aligning our resources and costs.
Other
Our other business consists of corporate expenses and eliminations and, historically, included our direct marketing services business, PrimeNet, until its sale in February 2010, and accounted for 4.5% of our revenue for the year ended December 27, 2009. See “Management’s Discussion and Analysis of Financial Condition and Results of Operations” and Note 12 to our Consolidated Financial Statements for additional financial information regarding our direct marketing services business and corporate expenses and eliminations.
Compliance with Environmental Laws
As the owner, lessee or operator of various real properties and facilities, we are subject to various federal, state and local environmental laws and regulations. Historically, compliance with these laws and regulations has not had a material adverse effect on our business. Compliance with existing or new environmental laws and regulations may require us to make future expenditures.
12
Table of Contents
Regulation
Our television and radio businesses are subject to regulation by governmental authorities in the United States.
Introduction
Our television and radio broadcasting operations are subject to regulation by the FCC under the Communications Act of 1934, as amended (which we refer to as the Communications Act). Under authority of the Communications Act, the FCC, among other things, assigns frequency bands for broadcast and other uses; determines the location, frequency and operating power of stations; grants permits and licenses to construct and operate television and radio stations on particular frequencies; issues, revokes, modifies and renews radio and television broadcast station licenses; regulates equipment used by stations; determines whether to approve changes in ownership or control of station licenses; regulates the content of some forms of programming; adopts and implements regulations and policies which directly or indirectly affect the ownership, operations and profitability of broadcasting stations; and has the power to impose penalties for violations of its rules.
Licensed broadcast stations must pay FCC regulatory and application fees and comply with various rules promulgated under the Communications Act that regulate, among other things, political advertising, sponsorship identification, closed captioning of certain television programming, obscene, indecent and profane broadcasts, and technical operations, including limits on radio frequency radiation. Additionally, the FCC’s rules require licensees to implement equal employment opportunity outreach programs and maintain records and make filings with the FCC evidencing such efforts.
The following is a brief summary of certain provisions of the Communications Act and specific FCC rules and policies. The summaries are not intended to describe all present and proposed statutes and FCC rules and regulations that impact our television and radio operations. Failure to observe the provisions of the Communications Act and the FCC’s rules and policies can result in the imposition of various sanctions, including monetary forfeitures, the grant of “short-term” (less than the maximum term) license renewal or, for particularly egregious violations, the denial of a license renewal application, the revocation of a license or the withholding of approval for acquisition of additional broadcast properties.
Broadcast Licenses/Renewals
The Communications Act permits the operation of a broadcast station only in accordance with a license issued by the FCC upon a finding that the grant of a license would serve the public interest, convenience and necessity. The FCC grants broadcast licenses for specified periods of time and, upon application, may renew the licenses for additional terms (ordinarily for the maximum eight years). Generally, the FCC renews a broadcast license upon a finding that (i) the broadcast station has served the public interest, convenience and necessity; (ii) there have been no serious violations by the licensee of the Communications Act or the FCC’s rules; and (iii) there have been no other violations by the licensee of the Communications Act or other FCC rules which, taken together, indicate a pattern of abuse. After considering these factors, the FCC may renew a broadcast station’s license, either with conditions or without, or it may designate the renewal application for hearing. Although there can be no assurance that our licenses will be renewed, we have not to date had a violation of the FCC’s regulations that jeopardized the renewal of our licenses, and we are not currently aware of any facts that would prevent their renewal. On November 1, 2005, the Milwaukee Public Interest Media Coalition (“MPIMC”) filed a petition at the FCC asking it to deny the pending license renewal applications of all eleven commercial television stations in the Milwaukee Designated Market Area (DMA), including our station, WTMJ-TV, on the grounds that the stations failed to provide adequate coverage of state and local issues during the 2004 election campaign. In June 2007, the FCC issued an Order denying MPIMC’s Petition. In July 2007, MPIMC filed a Petition for Reconsideration with the FCC requesting it to reconsider the denial of MPIMC’s Petition to Deny. We opposed MPIMC’s Petition for Reconsideration and in July 2008, the FCC issued a decision denying the Petition for Reconsideration. In August 2008, MPIMC filed a second Petition for Reconsideration of the FCC’s June 2007 Order. We filed an Opposition to
13
Table of Contents
MPIMC’s Second Petition in August 2008. The FCC dismissed MPIMC’s Second Petition on January 12, 2009. On February 16, 2010, MPIMC filed an Application for Review requesting the FCC to review the dismissal of MPIMC’s Second Petition. We intend to oppose the Application for Review.
Ownership Restrictions
The Communications Act and FCC rules and policies include a number of limitations regarding the number and reach of broadcast stations that any person or entity may own, directly or by attribution. FCC approval is also required for transfers of control and assignments of station licenses. A person or entity requesting FCC approval to acquire a radio or television station license must demonstrate that the acquisition complies with the FCC’s Ownership rules or that a waiver of the rules is in the public interest.
The FCC is required to review quadrennially the following media ownership rules and to modify, repeal or retain any rules as it determines to be in the public interest: the newspaper broadcast cross-ownership rule; the local radio ownership rule; the radio-television cross-ownership rule; the dual network rule; and the local television ownership rule. In 2003 the FCC completed a comprehensive review of its ownership rules and adopted revised rules. The FCC’s new rules were to have become effective on September 4, 2003. However, a number of parties sought reconsideration of the new rules and others filed judicial appeals. The U.S. Court of Appeals for the Third Circuit issued a stay of the new rules on September 3, 2003. Then, in an opinion issued on June 24, 2004, the court remanded most of the revised rules to the FCC for additional analysis and justification. In 2008, the FCC released a Report and Order that modified only the newspaper broadcast cross-ownership rule to permit cross-ownership of one newspaper and one television or radio station in the top twenty markets under certain circumstances, and establishing a waiver procedure for such combinations in markets smaller than the top twenty. The FCC also reinstated the radio television cross-ownership rule, which had been repealed in 2003, reinstated the local television ownership rule as it had been in effect prior to 2003, and affirmed the local radio ownership rule as adopted in 2003. The FCC stated that newspaper broadcast combinations that were grandfathered in 1975 when the newspaper-broadcast cross-ownership rule was adopted, including our Milwaukee operations, will continue to be grandfathered. The FCC’s 2008 Order is currently on appeal, and the FCC’s 2008 change in the broadcast newspaper cross-ownership rule has been stayed by the court. The FCC’s ownership rules that are currently in effect are briefly summarized below.
Newspaper-Broadcast Cross-Ownership Rule. Under the currently effective newspaper-broadcast cross-ownership Rule, unless grandfathered or subject to waiver, no party can have an attributable interest in both a daily English-language newspaper and either a television station or a radio station in the same market if specified signal contours of the television station or the radio station encompass the entire community in which the newspaper is published. Our media operations in Milwaukee are grandfathered under this rule.
Local Radio Ownership Rule. The local radio ownership rule limits the number of radio stations an entity may own in a given market depending on the size of the radio market. Specifically, in a radio market with 45 or more commercial and noncommercial radio stations, a party may own, operate, or control up to eight commercial radio stations, not more than five of which are in the same service (AM or FM). In a radio market with between 30 and 44 radio stations, a party may own, operate, or control up to seven commercial radio stations, not more than four of which are in the same service. In a radio market with between 15 and 29 radio stations, a party may own, operate, or control up to six commercial radio stations, not more than four of which are in the same service. In a radio market with 14 or fewer radio stations, a party may own, operate, or control up to five commercial radio stations, not more than three of which are in the same service, except that a party may not own, operate, or control more than 50% of the stations in the market, except for combinations of one AM and one FM station, which are permitted in any size market. For stations located in a market in which the Arbitron ratings service provides ratings, the definition of “radio market” is based on the radio market to which BIA Financial Network assigns the affected radio stations. For stations that are not in an Arbitron market, the market definition is based on technical service areas, pending a further FCC rulemaking. Also under the rule, a radio station that provides more than 15% of another in-market station’s weekly programming will be deemed to have an attributable interest in the brokered station.
14
Table of Contents
Radio-Television Cross-Ownership Rule. The radio-television cross-ownership rule generally allows common ownership of one or two television stations and up to six radio stations, or, in certain circumstances, one television station and seven radio stations, in any market where at least 20 independent voices would remain after the combination; two television stations and up to four radio stations in a market where at least 10 independent voices would remain after the combination; and one television and one radio station notwithstanding the number of independent voices in the market. A “voice” generally includes independently owned, same-market commercial and noncommercial broadcast television and radio stations, newspapers of certain minimum circulation, and one cable system per market.
Local Television Ownership Rule. Under the local television ownership rule, one party may own up to two television stations in a market, so long as the market would have at least eight independently owned full power television stations after the combination and at least one of the stations is not one of the top-four-rated stations (based on audience share) in the television market. The rule also permits the ownership of two television stations in a market as long as the stations’ Grade B contours do not overlap. The FCC will waive this rule to permit ownership of these television stations in a market that will not otherwise be permissible if one of the stations is in bankruptcy, is a “failed” station, or is “failing” (i.e. stations with negative cash flow and less than a four share all day audience rating).
Dual Network Rule. The dual network rule prohibits any of the four major networks—ABC, CBS, Fox and NBC—from merging with each other.
Television National Audience Reach Limitation. A person or entity is prohibited from having an attributable interest in television stations whose aggregate audience reach exceeds 39% of the television households in the United States. In calculating the number of households a station reaches, the FCC attributes a UHF station with only 50% of the television households in the market. The FCC is precluded by statute from modifying this rule in connection with its mandated quadrennial review of the ownership rules.
Attribution of Ownership. An “attributable” interest for purposes of the FCC’s broadcast ownership rules generally includes: equity and debt interests which combined exceed 33% of a licensee’s total assets, if the interest holder supplies more that 15% of the licensee’s total weekly programming, or has an attributable same-market media interest, whether television, radio, cable or newspaper; a 5% or greater direct or indirect voting stock interest, including certain interests held in trust, unless the holder is a qualified passive investor in which case the threshold is a 20% or greater voting stock interest; any equity interest in a limited liability company or a partnership, including a limited partnership, unless properly “insulated” from management activities; and any position as an officer or director of a licensee or of its direct or indirect parent.
Alien Ownership
The Communications Act restricts the ability of foreign entities or individuals to own or hold interests in U.S. broadcast licenses. Foreign governments, representatives of foreign governments, non-U.S. citizens, representatives of non-U.S. citizens, and corporations or partnerships organized under the laws of a foreign country (collectively, “aliens”) are prohibited from holding broadcast licenses. Aliens may directly or indirectly own or vote, in the aggregate, up to 20% of the capital stock of a licensee. In addition, a broadcast license may not be granted to or held by any corporation that is controlled, directly or indirectly, by any other corporation more than 25% of whose capital stock is owned or voted by aliens if the FCC finds that the public interest will be served by the refusal or revocation of such license. The FCC has interpreted this provision to require an affirmative finding that foreign ownership in excess of 25% would serve the public interest and, in the broadcast context, has made such a finding only in highly limited circumstances.
Obscenity, Indecency and Profanity
The FCC’s rules prohibit the broadcast of obscene material at any time and indecent or profane material between the hours of 6:00 a.m. and 10:00 p.m. In recent years, the FCC has intensified its enforcement activities
15
Table of Contents
with respect to programming it considers indecent and has issued numerous fines to licensees found to have violated the indecency rules. Several appeals of certain of the FCC’s recent enforcement actions and of the FCC’s underlying indecency standards are pending in the federal courts.
In July 2007, the FCC implemented increased forfeiture amounts for indecency violations that were enacted by Congress. The maximum permitted fine for an indecency violation is $325,000 per incident and $3,000,000 for any continuing violation arising from a single act or failure to act.
Because the FCC may investigate indecency complaints on an ex parte basis, a licensee may not have knowledge of an indecency complaint unless and until the complaint results in the issuance of a formal FCC letter of inquiry or notice of apparent liability for forfeiture. From time to time, our television and radio stations receive letters of inquiry and notices of proposed forfeitures from the FCC alleging that they have broadcast indecent material. We do not believe that broadcasts identified in any currently pending complaints of which we are aware violate the indecency standards.
Sponsorship Identification
Both the Communications Act and the FCC’s rules generally require that, when payment or other consideration has been received or promised to a broadcast licensee for the airing of program material, at the time of the airing, the station must disclose that fact and identify who paid or promised to provide the consideration. In response to a complaint by a public interest organization, the FCC issued letters of inquiry to several dozen television stations seeking to determine whether their broadcast of “video news releases” (VNRs) violated the sponsorship identification rules by failing to disclose the source and sponsorship of the VNR materials. VNRs are news stories and feature materials produced by government agencies and commercial entities, among others, for use by broadcasters. Two of our television stations received and have responded to the VNR letter of inquiry. We cannot predict the outcome of the FCC’s investigation; however in 2007, the FCC issued a forfeiture notice to one cable company for alleged violations of the sponsorship identification rules based on the use of VNRs.
Digital Television
As of June 12, 2009, all full-power broadcast television stations were required to cease broadcasting analog programming and convert to all digital broadcasts. Digital broadcasting permits stations to offer digital channels for a wide variety of services such as high definition video programming, multiple channels of standard definition video programming, audio, data, and other types of communications. Each station is required to provide at least one free over-the-air video program signal that is at least comparable in resolution to the station’s former analog programming transmissions.
To the extent a station has “excess” digital capacity (i.e., digital capacity not used to transmit a single free, over-the-air video program), it may elect to use that capacity in any manner consistent with FCC technical requirements, including for additional free program streams, data transmission, interactive or subscription video services, or paging and information services. If a station uses its digital capacity to provide any such “ancillary or supplementary” services on a subscription or otherwise “feeable” basis, it must pay the FCC an annual fee equal to 5% of the gross revenues realized from such services.
Relationship With Cable/Satellite
A number of provisions of the Communications Act and FCC rules govern aspects of the relationship between broadcast television and subscriber services such as cable and satellite. The rules generally provide certain protections for broadcast stations, for which cable and satellite services are both an important means of distribution and a provider of competing program channels.
16
Table of Contents
To ensure that every local television station can be received in its local market without requiring a cable subscriber to switch between cable and off-air signals, the FCC allows every full-power television broadcast station to require that all local cable systems transmit that station’s programming to their subscribers within the station’s market (the so-called “must-carry” rule). Alternatively, a station may elect to forego its must-carry rights and seek a negotiated agreement to establish the terms of its carriage by a local cable system—referred to as “retransmission consent.” A station electing retransmission consent assumes the risk that it will not be able to strike a deal with the cable operator and will not be carried. A station has the opportunity to elect must-carry or retransmission consent every three years. A station that fails to notify a cable system of its election is presumed to have elected must-carry.
Under the must-carry rule, cable operators are required to carry must-carry signals in analog format or, if a cable system is all-digital, to provide equipment to convert must-carry digital signals for viewing on analog television sets. With some exceptions, cable systems are also required to carry television stations’ high definition signals. Cable systems are not required to carry any programming streams other than a station’s primary video programming channel. Consequently, the multicast programming streams provided by several of our television stations are not entitled to mandatory carriage pursuant to the digital must-carry rules However, because the FCC’s action does not affect digital retransmission consent agreements, we are free to negotiate with cable operators for the carriage of additional programming streams under mutually agreed terms and conditions.
A similar must-carry and retransmission consent regime governs carriage of local broadcast channels by direct-to-home satellite television operators. A satellite provider is not required to transmit the signal of any television station to its subscribers in that station’s market. However, if a satellite provider chooses to provide one local station to its subscribers in a market, the provider also must transmit locally every other station in that market that elects must-carry status. Satellite providers are required, over a four-year phase in period, to carry the high definition signals of must-carry stations. (As with cable, stations may opt to pursue retransmission consent agreements.) A local television station that fails to make any election is deemed to have elected retransmission consent and is not guaranteed carriage. Satellite must-carry election periods occur every three years, consistent with cable must-carry periods.
Children’s Television Programming
Federal legislation and FCC rules limit the amount and content of commercial matter that may be shown on television stations during programming designed for children 12 years and younger, and require stations to broadcast three hours per week of educational and informational programming (“E/I programming”) designed for children 16 years of age and younger. FCC rules also require television stations to broadcast E/I programming on each additional digital multicast program stream transmitted, with the requirement increasing in proportion to the additional hours of free programming offered on multicast channels. These rules also limit the display during children’s programming of internet addresses of websites that contain or link to commercial material or that use program characters to sell products.
Digital Radio
The FCC permits existing AM and FM radio broadcast stations to broadcast digitally in order both to improve sound quality and to provide spectrum for multicast channels and/or enhanced data services to complement the existing programming service. The FCC has authorized AM and FM radio stations to broadcast digital signals using excess spectrum within the same allotted bandwidth used for analog transmissions.
Employees
As of December 27, 2009, we and our subsidiaries had approximately 2,200 full-time and 1,000 part-time employees compared to approximately 2,700 full-time and 1,300 part-time employees at December 28, 2008. Currently, there are 12 bargaining units representing approximately 600 (or approximately 20%) of our total number of employees. We have entered into various collective bargaining agreements with these bargaining units. All twelve of these agreements have expired or will expire within the next two years. Agreements covering 30 employees of our broadcasting business and 461 employees of our daily newspaper have already expired. These employees continue to work without a contract. The majority of employees covered by a collective bargaining agreement work at the daily newspaper.
17
Table of Contents
| ITEM 1A. | RISK FACTORS |
You should carefully consider the following risk factors and warnings before making an investment decision. If any of the risks below actually occur, our business, financial condition, results of operations or prospects could be materially adversely affected. In that case, the price of our securities could decline and you could lose all or part of your investment. You should also refer to the other information set forth or incorporated by reference in this document.
Risks Relating to Our Diversified Media Business
Decreases in advertising spending, resulting from economic downturn, war, terrorism, advertiser consolidation or other factors, could adversely affect our financial condition and results of operations.
Approximately 68% of our revenue in 2009 was generated from the sale of local, regional and national advertising appearing in our newspapers and shoppers and for broadcast on our radio and television stations. Advertisers generally reduce their advertising spending during economic downturns and some advertisers may go out of business or declare bankruptcy. The merger or consolidation of advertisers also generally leads to a reduced amount of collective advertising spending. A recession or economic downturn, as we are currently experiencing, as well as a consolidation of advertisers, has had, and in the future could continue to have, an adverse effect on our financial condition and results of operations. In addition, our advertising revenue tends to decline in times of national or local crisis because our radio and television stations broadcast more news coverage and sell less advertising time. Terrorist attacks or other wars involving the United States or any other local or national crisis could adversely affect our financial condition and results of operations.
Additionally, some of our printed publications and our radio and television stations generate a large percentage of their advertising revenue from a limited number of sources, including the automotive industry, political advertising and professional sports contracts. As a result, even in the absence of a recession or economic downturn, adverse changes specifically affecting these advertising sources could significantly reduce advertising revenue and have a material adverse affect on our financial condition and results of operations.
In addition, our advertising revenue and circulation revenue depend upon a variety of other factors specific to the communities that we serve. Changes in those factors could negatively affect those revenues. These factors include, among others, the size and demographic characteristics of the local population, the concentration of retail stores and local economic conditions in general. If the population demographics, prevailing retail environment or local economic conditions of a community served by us were to change adversely, revenue could decline and our financial condition and results of operations could be adversely affected. This is especially true with respect to the metropolitan Milwaukee market, which is served by our daily newspaper, the Milwaukee Journal Sentinel, one of our television stations, two of our radio stations, a number of our community newspapers and shoppers and several websites, and, collectively, from which we derived approximately 48% of our revenue in 2009.
Our diversified media businesses operate in highly competitive markets, and during a time of rapid competitive changes, we may lose market share and advertising revenue to competing newspapers, radio and television stations or other types of media competitors, as well as through consolidation of media competitors or changes in advertisers’ media buying strategies.
Our diversified media businesses operate in highly competitive markets. Our newspapers, shoppers, radio stations, television stations and internet sites compete for audiences and advertising revenue with other newspapers, shoppers, radio stations, television stations and internet sites as well as with other media such as magazines, cable television, satellite television, satellite radio, outdoor advertising, direct mail and the evolving on-line advertising space. Some of our current and potential competitors have greater financial, marketing, programming and broadcasting resources than we do or, even if smaller in size or in terms of financial resources, the ability to create on-line niche products and communities and may respond faster or more aggressively to
18
Table of Contents
changing competitive dynamics. This competition has intensified as a result of digital media technologies. While the amount of advertising on our internet sites has continued to increase, we have experienced, and in the future may continue to experience, a decrease in advertising revenues if we are unable to attract advertising to our internet sites in volumes and prices sufficient to offset decreases in advertising in our traditional media products, for which rates are generally higher than for internet advertising.
In newspapers and shoppers, our revenue primarily consists of advertising and paid circulation. Competition for advertising expenditures and paid circulation comes from local, regional and national newspapers, shoppers, magazines, broadcast and cable television, radio, direct mail, Yellow Pages, the internet and other media. Competition for newspaper advertising revenue is based largely upon advertiser results, advertising rates, readership, demographics and circulation levels, while competition for circulation revenue is based largely upon the content of the newspaper, its price, editorial quality and customer service. On occasion, our businesses compete with each other for regional and local advertising, particularly in the Milwaukee market. Our local and regional competitors in community newspapers and shoppers are typically unique to each market, but we have many competitors for advertising revenue that are larger and have greater financial and distribution resources than us. Circulation revenue and our ability to achieve price increases for our print products are affected by competition from other publications and other forms of media available in our various markets, declining consumer spending on discretionary items like newspapers, decreasing amounts of free time, and declining frequency of regular newspaper buying among young people. We may incur increasing costs competing for advertising expenditures and paid circulation. If we are not able to compete effectively for advertising expenditures and paid circulation, our revenue may decline and our financial condition and results of operations may be adversely affected.
Our radio and television broadcasting businesses compete for audiences and advertising revenue primarily on the basis of programming content and advertising rates. Our ability to maintain market share and competitive advertising rates depends in part on audience acceptance of our network, syndicated and local programming. Changes in market demographics, the entry of competitive stations to our markets, the introduction of competitive local news or other programming by cable, satellite or other news providers, or the adoption of competitive formats by existing radio stations could result in lower ratings and have a material adverse effect on our financial condition and results of operations. Changes in ratings technology or methodology or metrics used by advertisers or other changes in advertisers’ media buying strategies also could have a material adverse effect on our financial condition and results of operations.
Further, our operations may be adversely affected by consolidation in the broadcast industry, especially if competing stations in our markets are acquired by competitors who have a greater national scope, can offer a greater variety of national and syndicated programming for listeners and viewers and have enhanced opportunities for advertisers to reach broader markets. In 2003 the FCC completed a comprehensive review of its ownership rules and adopted revised rules. These rules were stayed in September 2003 and most of the revised rules were remanded to the FCC for additional analysis and justification. In 2008, the FCC issued a Report and Order that modified only the newspaper broadcast cross-ownership rule to permit cross-ownership of one newspaper and one television or radio station in the top twenty markets under certain circumstances. The FCC’s Order is subject to reconsideration and appeal. We cannot predict the outcome of any further administrative or judicial proceedings related to the rules.
Seasonal and cyclical changes in advertising volume affect our quarterly revenue and results of operations and may cause our stock price to be volatile.
Our quarterly revenue and results of operations are subject to seasonal and cyclical fluctuations that we expect to continue to affect our results of operations in future periods. Our first quarter of the year tends to be our weakest quarter because advertising volume is typically at its lowest levels following the holiday season. Our fourth quarter tends to be our strongest quarter primarily because of revenue from holiday season advertising. Our quarterly revenue also varies based on the dynamics of the television broadcast industry. In particular, we
19
Table of Contents
experience fluctuations, primarily during our third and fourth quarters, during political voting periods as advertising significantly increases. Also, since NBC has exclusive rights to broadcast the Olympics through 2012, our NBC affiliated stations experience increased viewership and revenue during Olympic broadcasts in the first or third quarters of the years in which the Olympics are held. Other factors that affect our quarterly revenue and results of operations may be beyond our control, including changes in the pricing policies of our competitors, the hiring and retention of key personnel, wage and cost pressures, changes in newsprint prices, changes in the buying strategies of advertisers and general economic factors. These quarterly fluctuations in revenue and results of operations may cause our stock price to be volatile.
We may not be able to acquire radio stations, television stations, newspapers or assets related to our internet-based growth strategy, successfully manage acquired properties, or increase our profits from these operations.
Our diversified media business has in the past expanded through acquisitions of radio and television stations and community newspapers and shoppers in selected markets. We intend to pursue continued growth through selected acquisitions, including acquisitions and investments related to our internet-based growth strategy, if we are able to identify strategic acquisition candidates, negotiate definitive agreements on acceptable terms and, as necessary, secure additional financing.
Our acquisition strategy includes certain risks. For example:
| • | we may not be able to identify suitable acquisition candidates or, if identified, negotiate successfully their acquisition; |
| • | we may not be able to secure additional financing necessary to complete acquisitions; |
| • | we may encounter unforeseen expenses, difficulties, complications or delays in connection with the integration of acquired entities and the expansion of operations; |
| • | we may fail to achieve anticipated financial benefits from acquisitions; |
| • | we may encounter regulatory changes or delays or other impediments in connection with proposed transactions; |
| • | our acquisition strategy may divert management’s attention from the day-to-day operation of our businesses; |
| • | key personnel at acquired companies may leave employment; and |
| • | we may be required to focus resources on integration of operations rather than more profitable areas. |
In addition, we compete for certain acquisition targets with companies having greater financial resources. We cannot assure you that we will be able to successfully make future acquisitions or what effects those acquisitions may have on our financial condition and results of operations.
We have in the past and may in the future cluster multiple radio and television stations in markets that we believe have demographic characteristics and growth potential suitable to further our business objectives. Multiple stations in the same geographic market area could make our results of operations more vulnerable to adverse local economic or demographic changes than they would otherwise be if our stations were located in geographically diverse areas.
We anticipate that we would finance potential acquisitions through cash provided by operating activities and/or borrowings, which would reduce our cash available for other purposes. We cannot assure you, however, that we would be able to obtain needed financing in the event strategic acquisition opportunities are identified. We may also consider financing acquisitions by issuing additional shares of class A common stock, which would dilute current shareholders’ ownership. Another potential source of financing for future acquisitions is to incur more debt, which would lead to increased leverage and debt service requirements. Inherent in any future
20
Table of Contents
acquisitions is the risk of transitioning company cultures and facilities, which could have a material adverse effect on our financial condition and results of operations, particularly during the period immediately following any acquisitions.
Decreases or slow growth in circulation may adversely affect our revenues.
Advertising and circulation revenues are affected by the number of subscribers and single copy purchasers, readership levels and overall audience reach. Our daily newspaper, and the newspaper industry as a whole, is experiencing difficulty maintaining and increasing print circulation and related revenues. This is due to, among other factors, increased competition from new media products and sources other than traditional newspapers (often free to users), and shifting preferences among some consumers to receive all or a portion of their news other than from a newspaper.
A prolonged decrease in net paid circulation copies could have a material effect on our revenues, particularly if we are not able to otherwise grow our readership levels and overall audience reach. To maintain our circulation base, we may incur additional costs, and we may not be able to recover these costs through circulation and advertising revenues.
Our publishing business may suffer if there is a significant increase in the cost of newsprint or a reduction in the availability of newsprint.
The basic raw material for newspapers and shoppers is newsprint. Our newsprint consumption related to our publications totaled $16.0 million in 2009, which was 8.2% of our total publishing revenue. We currently purchase our newsprint primarily from a single supplier, with our current pricing agreement ending in December 2011. Our inability to obtain an adequate supply of newsprint in the future or significant increases in newsprint costs could have a material adverse effect on our financial condition and results of operations.
If we are unable to respond to changes in technology and evolving industry trends, our publishing operations may not be able to effectively compete.
The publishing industry is being challenged by the preferences of today’s “on demand” culture, particularly among younger segments of the population. Some consumers prefer to receive all or a portion of their news in new media formats and from sources other than traditional newspapers. Information delivery and programming alternatives such as the Internet, various mobile devices, electronic readers, cable, direct satellite-to-home services, pay-per-view and home video and entertainment systems have fractionalized newspaper readership. The shift in consumer behaviors has the potential to introduce new market competitors or change the means by which traditional newspaper advertisers can most efficiently and effectively reach their target audiences. We may not have the resources to acquire new technologies or to introduce new products or services that could compete with these evolving technologies.
If we are unable to respond to changes in technology and evolving industry standards, our radio stations may not be able to effectively compete.
The broadcast media industry is subject to evolving media technologies and evolving industry standards. Several new technologies are being developed and/or utilized that may compete with our radio stations, including:
| • | audio programming by cable television systems, direct broadcast satellite systems, personal communications and wireless systems, internet content providers and other digital audio broadcast formats; |
| • | satellite digital audio radio service, with enhanced sound quality comparable to that of compact discs and that provide numerous niche formats; |
21
Table of Contents
| • | in-band on-channel digital radio, which could improve the quality of existing AM and FM stations, including stations owned by us; |
| • | radio stations and sites streamed over the internet; |
| • | expanded approval of low-power FM radio, which could result in additional FM radio broadcast outlets designed to serve small, localized areas; and |
| • | enhanced capabilities of cell phones, MP3 players, electronic readers and other mobile devices. |
These new technologies have the potential to introduce new market competitors or change the means by which radio advertisers can most efficiently and effectively reach their target audiences. We may not have the resources to acquire new technologies or to introduce new services that could compete with these evolving technologies.
If we are unable to respond to changes in technology and evolving industry standards, our television stations may not be able to effectively compete.
New technologies could also adversely affect our television stations. Programming alternatives such as cable, direct satellite-to-home services, mobile media services, pay-per-view, on-demand programming, the internet and home video and entertainment systems have fractionalized television viewing audiences. Over the past decade, cable television programming services have captured an increasing market share, while the aggregate viewership of the major television networks has declined. In addition, the expansion of cable television and other technological changes, including the recent entry by certain of the regional Bell operating companies into the video services delivery market, has increased, and may continue to increase, competitive demand for programming. Such increased demand, together with rising production costs may, in the future, increase our programming costs or impair our ability to acquire programming. The enhanced video and audio capabilities of cell phones, MP3 players, electronic readers and other mobile devices also has the potential to affect television viewership.
In addition, video compression techniques now in use with direct broadcast satellites and, increasingly, by cable and wireless cable, are expected to permit greater numbers of channels to be carried within existing bandwidth. These compression techniques, as well as other technological developments, which are applicable to all video delivery systems and enable television broadcasters operating digital signals to offer multiple channels, have the potential to provide vastly expanded programming to highly targeted audiences. Reduction in the cost of creating additional channel capacity could lower entry barriers for new channels and encourage the development of increasingly specialized niche programming. This ability to reach very narrowly defined audiences may alter the competitive dynamics for advertising expenditures. We are unable to predict the effect that these technological changes will have on the television industry or the future results of our television broadcast business.
If the network programming we broadcast pursuant to network affiliation agreements does not maintain satisfactory viewership levels or if the networks we are affiliated with terminate or do not renew our agreements, our advertising revenues, financial condition and results of operations may be adversely affected.
The television viewership levels, and ultimately advertising revenue, for each of our stations are materially dependent upon network programming, which is provided pursuant to network affiliation agreements. We cannot assure you that network programming will achieve or maintain satisfactory viewership levels. In particular, because four of our stations (including one of our low-power stations) are parties to affiliation agreements with ABC, three with NBC, two with FOX, two with CW and one with CBS, failures of these networks to provide programming to attract viewers or generate satisfactory ratings may have an adverse effect on our financial condition and results of operations. In addition, we cannot assure you that we will be able to renew our network affiliation agreements on as favorable terms or at all. The retransmission agreements which we negotiated with
22
Table of Contents
cable, satellite and telecommunications providers for the rights to carry our signals and local programming in their pay television services to consumers are for multiple years with set rate increases. Certain national networks have, and other may try to obtain from us a portion of the retransmission revenue for their programming content we are providing to the cable, satellite and telecommunications providers. The termination or non-renewal, or renewal on less favorable terms, of the affiliation agreements could have an adverse effect on us.
Changes in the relationship of television networks with their affiliates and other content providers and distribution channels also could affect our results of operation. For example, networks and other content providers recently have begun to sell programming content through new distribution channels and offer viewers the ability to watch programs on-demand, rather than on an established “live” television broadcast schedule.
The costs of television programming may increase, which could adversely affect our results of operations.
Television programming is a significant operating cost component in our broadcasting operations. We cannot assure you that we will not be exposed in the future to increased programming costs. Should such an increase occur, it could have an adverse effect on our results of operations. Television networks have been seeking arrangements from their affiliates to share the networks’ programming costs. We cannot predict the nature or scope of any such potential compensation arrangements or the effect, if any, on our operations. In addition, acquisitions of program rights for syndicated programming are usually made two or three years in advance and may require multi-year commitments, making it difficult to predict accurately how a program will perform. In some instances, programs must be replaced before their costs have been fully amortized, resulting in write-offs that increase station operating costs and decrease station earnings.
If our key on-air talent does not remain with us or loses popularity, our advertising revenue and results of operations may be adversely affected.
We employ or independently contract with a number of on-air personalities and hosts of television and radio programs whose ratings success depends in part on audience loyalty in their respective markets. Although we have entered into long-term agreements with some of our key on-air talent and program hosts to protect our interests in those relationships, we cannot assure you that all or any of these key employees will remain with us over the long term. Furthermore, the popularity and audience loyalty to our key on-air talent and program hosts is highly sensitive to rapidly changing public tastes. A loss of such popularity or audience loyalty could reduce ratings and may impact our ability to generate advertising revenue.
In addition, our key local management employees are extremely important to our business since we believe that our growth and future success depends on retaining local management with knowledge of the community, its audience and its advertisers. Our inability to attract or retain these skilled personnel could have a material adverse impact on our financial condition and results of operations.
Changes in the professional sports industry or changes in our contractual relationships with local professional sports teams could result in decreased ratings for our Milwaukee radio station and adversely affect our results of operations and financial condition.
Our Milwaukee radio station, WTMJ-AM, currently maintains exclusive radio broadcast rights for the Green Bay Packers, Milwaukee Bucks and Milwaukee Brewers, and arranges a statewide radio network for the broadcast of their games. Our advertising revenue could be adversely affected by changes in the professional sports industry, such as a relocation of one of the local professional sports teams from the Wisconsin market or the potential loss of exclusivity due to league or team initiatives such as pay-per-listen, satellite radio or internet broadcast of games. In addition, we could lose our exclusive broadcast rights during periodic competitive bidding, or suffer damage to the marketplace value of sports advertising due to factors such as a players’ strike, negative publicity or downturn in on-field performance of a team.
23
Table of Contents
If cable systems and other video distribution systems do not carry our new digital channels or we do not enter into acceptable agreements with such systems, our revenue and results of operations may be adversely affected.
Since our television stations are highly dependent on carriage by cable systems in many of the areas they service, any modifications to rules regarding the obligations of cable systems or satellite providers to carry digital television signals of local broadcast stations could result in some of our television stations or channels not being carried on cable systems or direct to home satellite systems, which could adversely affect our revenue and results of operations. We have elected retransmission consent rather than must-carry with cable systems and satellite providers for most of our television stations. If we are unable to negotiate retransmission consent agreements in a timely manner or on favorable economic terms, some of our stations may not be carried on certain cable systems or direct to home satellite systems for a period of time and our revenue and results of operations could be adversely affected. We may also be unable to negotiate or renegotiate acceptable agreements with other types of video distribution systems, which could also cause our revenue and results of operations to be adversely affected.
If we cannot renew our FCC broadcast licenses, our business will be impaired.
Our business depends upon maintaining our broadcast licenses, which are issued by the FCC for a term of eight years and are renewable. Pursuant to FCC rules, our broadcast license for station WTMJ-TV that expired in 2005 remains in effect pending processing by the FCC of its timely filed renewal application. Interested parties may challenge a renewal application. The FCC has the authority to revoke licenses, not renew them, or renew them with conditions, including renewals for less than a full term. We cannot assure you that our future renewal applications will be approved, or that the renewals, even if granted, will not include conditions or qualifications that could adversely affect our operations. If we fail to renew any of our licenses, or renew them with substantial conditions or modifications (including renewing one or more of our licenses for a term of fewer than eight years), it could prevent us from operating the affected station and generating revenue from it.
Changes relating to consumer information collection and use could adversely affect our ability to collect and use data, which could harm our business.
Public concern over methods of information gathering has led to the enactment of legislation in most jurisdictions that restricts the collection and use of consumer information. Our publishing business relies in part on telemarketing sales, which are affected by “do not call” legislation at both the federal and state levels. We also engage in e-mail marketing and the collection and use of consumer information in connection with our publishing and broadcasting businesses and our growing internet efforts. Further legislation, industry regulations, the issuance of judicial interpretations or a change in customs relating to the collection, management, aggregation and use of consumer information could materially increase the cost of collecting that data, or limit our ability to provide information to our customers or otherwise utilize telemarketing or e-mail marketing, and could adversely affect our results of operations.
The FCC may impose sanctions or penalties for violations of rules or regulations.
If we or any of our officers, directors or significant shareholders materially violate the FCC’s rules and regulations or are convicted of a felony or are found to have engaged in unlawful anticompetitive conduct or fraud upon another government agency, the FCC may, in response to a petition by a third party or on its own initiative, in its discretion, commence a proceeding to impose sanctions upon us that could involve the imposition of monetary penalties, the denial of a license renewal application, revocation of a broadcast license or other sanctions. If the FCC were to issue an order denying a license renewal application or revoking a license, we would be required to cease operating the broadcast station only after we had exhausted all administrative and judicial review without success. In addition, the FCC has recently emphasized more vigorous enforcement of indecency standards and the prohibition on “payola,” which could result in increased costs associated with the adoption and implementation of stricter compliance procedures at our broadcast facilities or FCC fines.
24
Table of Contents
We could experience delays in expanding our business due to antitrust laws.
The Federal Trade Commission, the United States Department of Justice and the FCC carefully review our proposed business acquisitions and dispositions under their respective regulatory authority, focusing on the effects on competition, the number and types of stations owned in a market and the effects on concentration of market revenue share. The Department of Justice has challenged proposed acquisitions of radio stations, particularly in instances where an existing licensee seeks to acquire additional radio stations in the same market. Some of these challenges ultimately resulted in consent decrees requiring, among other things, divestitures of certain stations. In general, the Department of Justice has more closely scrutinized radio station acquisitions that result in local market shares in excess of 40% of radio advertising revenue. Any delay, prohibition or modification required by regulatory authorities could adversely affect the terms of a proposed transaction or could require us to modify or abandon an otherwise attractive acquisition opportunity. The filing of petitions or complaints against us or any FCC licensee from which we acquire a station could result in the FCC delaying the grant of, refusing to grant or imposing conditions on its consent to the assignment or transfer of control of licenses.
Regulatory changes may result in increased competition in our radio and television broadcasting business.
The radio and television broadcasting industry is subject to extensive and changing federal regulation. Among other things, the Communications Act of 1934, as amended, and FCC rules and policies require FCC approval for transfers of control and assignments of licenses, and limit the number and types of broadcast properties in a market in which any person or entity may have an attributable interest. Media ownership restrictions include a variety of limits on local ownership, such as a limit of one television station in medium and smaller markets and two stations in larger markets as long as one station is not a top-four rated station (known as the duopoly rule), a prohibition on ownership of a daily English-language newspaper and a television or radio station in the same market, and limits both on the ownership of radio stations, and on common ownership of radio stations and television stations, in the same local market. In response to a court order and to satisfy its statutory obligation to conduct a quadrennial review of its media ownership rules, the FCC undertook further review of changes to its ownership rules adopted in 2003 (the effectiveness of which had been stayed pending judicial review). In December 2007, the FCC adopted an order relaxing only the newspaper-broadcast cross-ownership rule and declining to make changes in its other broadcast ownership rules. Requests for reconsideration and judicial review of the FCC’s decision to relax the newspaper-broadcast cross-ownership rule in the top twenty markets have been filed and are pending. We are unable to predict the outcome of this further review.
In addition, the 2004 Consolidated Appropriations Act prohibits any person or entity from having an attributable interest in broadcast television stations with an aggregate audience reach exceeding 39% of television households nationally. The increase in the national television viewership cap gave the largest television operators the ability to continue to hold or to acquire additional stations, which may give them a competitive advantage over us, since they have much greater financial and other resources than we have. In addition, the networks’ ability to acquire additional stations could give them “leverage” over their affiliates on issues such as compensation and program clearance, in part because of the risk that a network facing an uncooperative affiliate could acquire a station in the market and terminate its agreement with that affiliate.
Congress, the FCC or other federal agencies may in the future consider and adopt new laws, regulations and policies regarding a wide variety of matters that could, directly or indirectly, affect the operation, ownership and profitability of our television and radio stations and result in the loss of audience share and advertising revenue for our stations. Examples of such changes include:
| • | proposals to increase regulatory fees or to impose spectrum use or other fees on FCC licenses; |
| • | proposals to restrict or prohibit the advertising of beer, wine and other alcoholic beverages; |
| • | proposals to limit the tax deductibility of advertising expenses by advertisers; |
25
Table of Contents
| • | proposals to impose sales tax on advertising expense; |
| • | proposals to revise the rules relating to political broadcasting; |
| • | proposals to require broadcast stations to operate studios in the communities to which they are licensed, requiring construction of new studios, and to provide staffing on a 24 hour per day basis; and |
| • | proposals to require radio broadcasters to pay royalties to musicians and record labels for the performance of music played on the stations. |
Risks Relating to Our Printing Services Business
Postal rate increases and disruptions in postal services could lead to reduced volumes of business.
Our printing services business has been negatively impacted from time to time during the past years by postal rate increases. Rate increases may result in customers mailing fewer pieces with reduced page counts. The USPS has implemented a policy of annual cost of living increases with the cost of postage that is targeted to be implemented in May each year. Additionally, the amount of mailings could be reduced in response to disruptions in and concerns over the security of the United States mail system. Such responses by customers could negatively impact us by decreasing the amount of printing or other services that our customers purchase from us, which could result in decreased revenue.
Material cost increases could lead to reduced volumes of business.
Our printing services business has been negatively affected from time to time by increases in the cost of raw materials, such as paper, ink, chemicals and packaging. These price increases are often passed along to our customers and, in turn, our customers have reduced the number of pieces they mail and/or the number of pages they have us print. Such cost increases may continue to result in customers mailing fewer pieces and/or reducing the number of pages they have us print.
Changes in economic conditions in the markets we serve may produce volatility in demand for our products and services.
Customers of our printing services business may reduce their spending during economic downturns; a recession or economic downturn has had and may continue to have an adverse effect on our financial condition and results of operations.
Other Business Risks
Our business has been and may be in the future negatively affected by an impairment charge of goodwill, broadcast licenses or other intangible assets.
In 2008, due to deteriorating macro-economic factors, a prolonged adverse change in the business climate, deteriorating market conditions and financial results and a further decline in our stock price, we recorded a pre-tax, non-cash impairment charge for goodwill of $245.9 million and a pre-tax, non-cash impairment charge for broadcast licenses of $129.2 million. In 2009, we determined there were significant adverse changes in projected revenues in the markets where we own television and radio stations and we recorded a pre-tax, non-cash impairment charge for broadcast licenses of $20.1 million. There was no impairment of our goodwill in 2009. As of December 27, 2009, we had a total of $115.8 million of goodwill, broadcast licenses and other intangible assets on our balance sheet, representing 24.5% of our total assets. The 2008 and 2009 impairment charges had, and any future non-cash impairment charge of goodwill, broadcast licenses or other intangible assets would have, an adverse effect on our financial condition and results of operations.
26
Table of Contents
We may not be able to utilize deferred tax assets to offset future federal and state taxable income.
As of December 27, 2009, we had a total of $68.3 million of deferred tax assets on our balance sheet. We expect to utilize the deferred tax assets to reduce our consolidated federal and state income tax liabilities over a period of time not to exceed 20 years. However, we may not be able to fully utilize the deferred tax assets if our future federal and state taxable income and related income tax liability is insufficient to permit their use. In addition, in the future, we may be required to record a valuation allowance against the deferred tax assets if we believe we are unable to utilize them, which would have an adverse effect on our financial condition and results of operations.
The current economic environment and volatility in US credit markets could affect our financing arrangements.
Given the current economic environment, including the current instability of financial institutions, one or more of the lenders in our revolving credit facility syndicate could fail or be unable to fund future draws thereunder or take other positions adverse to us. In such an event, our liquidity could be severely restrained. In addition, our ability to meet our credit agreement’s financial covenants may also be affected by events beyond our control, including a further deterioration of current economic and industry conditions, which could negatively affect our earnings. If it is determined we are not in compliance with these financial covenants, the lenders in our credit facility syndicate will be entitled to take certain actions, including acceleration of all amounts due under the facility. If the lenders take such action, we may be forced to amend the terms of the credit agreement, obtain a waiver or find alternative sources of capital. Because of the current volatility in US credit markets, obtaining new financing arrangements or amending our existing one may result in significantly higher fees and ongoing interest costs as compared to those in our current arrangement. If we are unable to obtain alternative sources of capital, it may be necessary to significantly restructure our business operations or sell assets, or, in the event of a prolonged and extensive economic decline, seek bankruptcy protection.
Sustained increases in costs of providing pension benefits may adversely affect our operations, financial condition and liquidity.
We have a funded, qualified defined benefit pension plan that covers certain employees and an unfunded, non-qualified pension plan for certain employees whose benefits under the qualified pension plan may be restricted due to limitations imposed by the Internal Revenue Service. Two significant elements in determining pension income or pension expense are the discount rate used in projecting benefit obligations and the expected return on plan assets. A lower discount rate driven by lower interest rates would increase our pension expense by increasing the calculated value of our liabilities. If our expected return on plan assets is not achieved, as was the case in 2008 because of significant declines in the equity markets, our pension expense and cash contributions to the pension plans would increase. In 2008, as a result of significant equity decline, our qualified pension plan moved from a fully funded to underfunded status. In 2009, the pension plan is still underfunded. If the equity markets do not sufficiently recover, the discount rate does not increase or there is no legislative relief, we will be obligated to make substantial contributions in future years to fund the deficiency. A significant increase in our obligation to make contributions to our pension plans would reduce the cash available for working capital, debt reduction and other corporate uses, and may have an adverse impact on our operations, financial condition and liquidity.
We depend on key personnel, and we may not be able to operate and grow our business effectively if we lose the services of any of our senior executive officers or are unable to attract qualified personnel in the future.
We are dependent upon the efforts of our senior executive officers. The success of our business is heavily dependent on our ability to retain our current management and to attract and retain qualified personnel in the future. Competition for senior management personnel is intense, and we may not be able to retain our personnel. We have not entered into employment agreements with our key personnel, other than with our Chairman and
27
Table of Contents
Chief Executive Officer, and these individuals may not continue in their present capacity with us for any particular period of time. We have, however, entered into change in control agreements with certain of our senior executives which provide, within two years after a change in control, severance payments and benefits to the executive if his or her employment is terminated without cause or the executive resigns for good reason. We do not have key man insurance for any of our executive officers or key personnel. The loss of any senior executive officer could require the remaining executive officers to divert immediate and substantial attention to seeking a replacement. Our inability to find a replacement for any departing executive officer on a timely basis could adversely affect our ability to operate and grow our business.
Our business may be negatively affected by work stoppages, slowdowns or strikes by our employees.
As of December 27, 2009, we and our subsidiaries had approximately 2,200 full-time and 1,000 part-time employees. Currently, there are 12 bargaining units representing approximately 600 (or approximately 20%) of our total number of employees. We have entered into various collective bargaining agreements with these bargaining units. All twelve of these agreements have expired or will expire within the next two years. Agreements covering 30 employees of our broadcasting business and 461 employees of our daily newspaper have already expired. These employees continue to work without a contract. The majority of employees who are covered by a collective bargaining agreement work at the daily newspaper. We cannot assure you the results of negotiations of future collective bargaining agreements or of negotiations related to reopening of collective bargaining agreements in order to reduce our labor costs or achieve other objectives will be negotiated without interruptions in our businesses. We cannot assure you that strikes will not occur in the future in connection with labor negotiations or otherwise. Any prolonged strike or work stoppage could have a material adverse effect on our financial condition and results of operations. We also cannot assure you the impact of future collective bargaining agreements will not have an adverse impact on our financial condition and results of operations.
28
Table of Contents
| ITEM 1B. | UNRESOLVED STAFF COMMENTS |
None.
| ITEM 2. | PROPERTIES |
Our corporate headquarters are located in Milwaukee, Wisconsin. We believe all of our properties are well maintained, are in good conditions, and suitable for present operations. There are no material encumbrances on any of our owned properties or equipment. The following are the principal properties operated by us and our subsidiaries and the approximate square footage, as December 27, 2009.
| Owned | Leased | |||
| Publishing |
||||
| Printing plants, newsrooms, offices and distribution centers located in: |
||||
| Milwaukee, WI(1)(8) |
522,000 | 42,000 | ||
| West Milwaukee, WI(2) |
479,000 | — | ||
| Cedarburg, WI |
17,000 | — | ||
| Waukesha, WI |
34,000 | — | ||
| Wauwatosa, WI |
18,000 | — | ||
| Sturtevant, WI |
— | 10,000 | ||
| Madison, WI |
— | 10,000 | ||
| Menomonee Falls, WI |
12,000 | — | ||
| Waupaca, WI(6) |
93,000 | — | ||
| Hartland, WI |
13,000 | 4,000 | ||
| Elkhorn, WI |
— | 5,000 | ||
| Waterford, WI(7) |
— | 5,000 | ||
| West Bend, WI |
7,000 | — | ||
| Hartford, WI |
7,000 | — | ||
| New London, WI |
6,000 | — | ||
| Rhinelander, WI |
7,000 | — | ||
| Clintonville, WI |
6,000 | — | ||
| Antigo, Beaver Dam(9), Fond du Lac, Iola, Jefferson, Johnson Creek, Marshfield, Merrill, Mukwonago, Muskego, Oconomowoc, Oshkosh, Port Washington, Seymour, Sheboygan, Stevens Point, Wausau, Wisconsin Rapids and Wittenberg, WI |
9,000 | 49,000 | ||
| Venice, Orange Park, Sarasota and Ponte Vedra, FL |
— | 9,000 | ||
| Washington, D.C. |
— | 1,000 | ||
| Broadcasting |
||||
| Offices, studios and transmitter and tower sites located in: |
||||
| Milwaukee, WI(3) |
109,000 | — | ||
| Green Bay, WI |
22,000 | 2,000 | ||
| Las Vegas, NV |
33,000 | — | ||
| Lansing, MI |
2,000 | 11,000 | ||
| Palm Springs, CA |
19,000 | 1,000 | ||
| Omaha, NE |
62,000 | — | ||
| Tucson, AZ |
29,000 | — | ||
| Knoxville, TN(4) |
26,000 | — | ||
| Boise, ID |
46,000 | 13,000 | ||
| Wichita, KS(5) |
23,000 | 6,000 | ||
| Springfield, MO |
2,000 | 9,000 | ||
| Tulsa, OK |
22,000 | 1,000 | ||
| Fort Myers, FL |
25,000 | 1,000 | ||
| Mount Bigelow, AZ |
2,000 | — | ||
| Printing services |
||||
| Offices, printing plants and warehouses located in: |
||||
| St. Joseph, MI(3)(11) |
— | 216,000 | ||
29
Table of Contents
| Owned | Leased | |||
| Direct marketing services |
||||
| Offices, plants and warehouses located in: |
||||
| St. Paul, MN(3) |
— | 87,000 | ||
| Clearwater, FL |
— | 45,000 | ||
| Discontinued operations |
||||
| Printing plant located in: |
||||
| Green Bay, WI(10) |
40,000 | — | ||
| (1) | Includes our corporate headquarters and Journal Sentinel, Inc.’s business and editorial offices. |
| (2) | Production facility housing printing, packaging, inserting, recycling, distribution, and transportation operations of the Milwaukee Journal Sentinel. |
| (3) | Includes our business operations’ headquarters. |
| (4) | Includes 5,000 square feet leased to third party pursuant to lease expiring in September 2012 and 9,000 square feet not in use. |
| (5) | Includes 4,700 square feet not in use. |
| (6) | Includes 20,000 square feet not in use. |
| (7) | Lease covering 5,000 square feet expired on December 31, 2009 and was not renewed. |
| (8) | Lease covering 23,000 square feet expired on December 31, 2009 and was not renewed. |
| (9) | Lease covering 4,000 square feet expired on December 31, 2009 and was not renewed. |
| (10) | Property to be sold to Multi-Color Corporation, in connection with the 2005 sale of the assets of NorthStar Print Group, Inc., upon the achievement of certain environmental standards. The property is currently being leased to Multi-Color. |
| (11) | Lease in St. Joseph, Michigan covering 37,000 square feet expired on January 31, 2010 and was not renewed. |
| ITEM 3. | LEGAL PROCEEDINGS |
We are subject to various legal actions, administrative proceedings and claims arising out of the ordinary course of business. We do not believe that any such unresolved legal actions and claims will materially adversely affect our consolidated results of operations, financial condition or cash flows.
| ITEM 4. | RESERVED |
30
Table of Contents
| ITEM 5. | MARKET FOR REGISTRANT’S COMMON EQUITY, RELATED STOCKHOLDER MATTERS AND ISSUER PURCHASES OF EQUITY SECURITIES |
We are authorized to issue 170 million shares of class A common stock; 120 million shares of class B common stock; 10 million shares of class C common stock; and 10 million shares of preferred stock.
Class C shares are held by Matex Inc., members of the family of our former chairman Harry J. Grant, trusts for the benefit of members of the family (which we collectively refer to as the “Grant family shareholders”) and Proteus Fund, Inc., a non-profit organization. The class C shares are entitled to two votes per share. These shares are convertible into either (i) 1.363970 shares of class A common stock or (ii) a combination of 0.248243 shares of class A common stock and 1.115727 shares of class B common stock at any time at the option of the holder. There is no public trading market for the class C shares.
Class B shares are primarily held by our current and former employees, our non-employee directors and Grant family shareholders. These shares are entitled to ten votes per share. Each class B share is convertible into one class A share at any time, but first must be offered for sale to other eligible purchasers through the offer procedures set forth in our amended and restated articles of incorporation. As of February 26, 2009, there were 8,676,705 class B shares held by our subsidiary, The Journal Company. There is no public trading market for the class B shares, although shares can be offered for sale to eligible purchasers under our amended and restated articles of incorporation.
Class A shares are listed for trading on the New York Stock Exchange under the symbol “JRN.” Class A shareholders are entitled to one vote per share.
As of February 26, 2010, there were 1,787 holders of class B common stock, 125 record holders of Class A common stock and 13 record holders of class C common stock. We have no outstanding shares of preferred stock.
The high and low sales prices of our class A common shares for the four quarters of 2009 and 2008 as reported on the New York Stock Exchange and the dividends declared per class A and class B common share for the four quarters of 2009 and 2008 were as follows:
| 2009 | 2008 | |||||||||||||||||
| High | Low | Cash Dividend |
High | Low | Cash Dividend | |||||||||||||
| First Quarter |
$ | 2.86 | $ | 0.37 | $ | 0.02 | $ | 9.11 | $ | 6.37 | $ | 0.08 | ||||||
| Second Quarter |
1.81 | 0.57 | — | 7.60 | 4.69 | 0.08 | ||||||||||||
| Third Quarter |
4.42 | 0.86 | — | 5.97 | 4.34 | 0.08 | ||||||||||||
| Fourth Quarter |
4.79 | 3.00 | — | 5.22 | 1.27 | 0.08 | ||||||||||||
Dividends
The declaration of future dividends is subject to the discretion of our board of directors in light of all relevant factors, including earnings, general business conditions, working capital requirements, capital spending needs, debt levels and contractual restrictions. Our board of directors reviews these factors at each quarterly board of directors meeting. Pursuant to our amended and restated articles of incorporation, each class of common stock has equal rights with respect to cash dividends, except that dividends on class C shares are cumulative and will not be less than approximately $0.57 per year.
Our board of directors made a decision to reduce our first quarter 2009 dividend on our class A and class B shares to $0.02 per share from $0.08 per shares in each quarter of 2008. The quarterly dividend on our class C
31
Table of Contents
shares remained at its historical level for the first quarter of 2009. In April 2009, our board of directors suspended dividends on our class A and class B shares given the challenging economic environment. Our board of directors also suspended the payment of the cumulative dividend on our class C shares. The accumulated class C dividend must be paid prior to the payment of any future dividends on our class A and class B shares. Our board of directors consistently reviews our dividend payment policy, as well as our ability to pay cash dividends, at each quarterly board of directors meeting.
The terms of our credit facility provide that we cannot make distributions or dividends (other than distributions or dividends payable solely in stock) if an event of default under our credit facility then exists or would result therefrom.
Stock Performance Information
The following information in this Item 5 of this Annual Report on Form 10-K is not deemed to be “soliciting material” or to be “filed” with the SEC or subject to Regulation 14A or 14C under the Securities Exchange Act of 1934 or to the liabilities of Section 18 of the Securities Exchange Act of 1934, and will not be deemed to be incorporated by reference into any filing under the Securities Act of 1933 or the Securities Exchange Act of 1934, except to the extent we specifically incorporate it by reference into such a filings.
The following graph compares, on a cumulative basis, changes in the total return on our class A common stock with the total return on the Standard & Poor’s 500 Stock Index and the total return on a peer group comprised of eight corporations that concentrate on newspapers and broadcast operations. Our peer group is comprised of Belo Corp., Gannett, Inc., Lee Enterprises, Inc., McClatchy Newspapers, Inc., The New York Times Company, The E.W. Scripps Company, Media General, Inc., and The Washington Post Company. This graph assumes the investment of $100.00 on December 26, 2004 and the reinvestment of all dividends since that date.
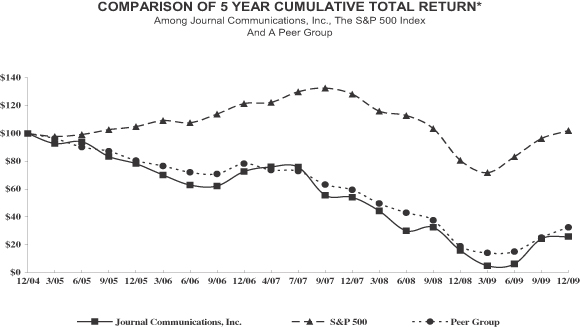
| 12/04 | 12/05 | 12/06 | 12/07 | 12/08 | 12/09 | |||||||||||||
| Journal Communications, Inc. |
$ | 100.00 | $ | 78.30 | $ | 72.68 | $ | 54.11 | $ | 15.91 | $ | 25.94 | ||||||
| S&P 500 Index |
100.00 | 104.91 | 121.48 | 128.16 | 80.74 | 102.11 | ||||||||||||
| Peer Group |
100.00 | 80.56 | 78.27 | 59.49 | 19.03 | 32.56 | ||||||||||||
32
Table of Contents
| ITEM 6. | SELECTED FINANCIAL DATA |
The following table presents our selected financial data. The selected financial data for the years ended December 27, 2009, December 28, 2008, and December 30, 2007 and as of December 27, 2009, and December 28, 2008 have been derived from our audited consolidated financial statements, including the notes thereto, appearing elsewhere in this Annual Report on Form 10-K. The selected financial data for the years ended December 31, 2006 and December 25, 2005 and as of December 30, 2007, December 31, 2006, and December 25, 2005 have been derived from our audited consolidated financial statements, including the notes thereto, not included in this Annual Report on Form 10-K. This table should be read together with our other financial information, including “Management’s Discussion and Analysis of Financial Condition and Results of Operations” and the consolidated financial statements, including the notes thereto, appearing elsewhere in this Annual Report on Form 10-K. Three regional publishing and printing operations of our community newspapers and shoppers business, Norlight Telecommunications, Inc. and NorthStar Print Group, Inc. have been reflected as discontinued operations in all years presented.
| 2009(1) | 2008(2) | 2007(3) | 2006 | 2005(4) | ||||||||||||||||
| (dollars and shares in thousands, except for per share amounts) | ||||||||||||||||||||
| Statement of Operations Data |
||||||||||||||||||||
| Revenue |
$ | 433,565 | $ | 544,931 | $ | 582,654 | $ | 628,763 | $ | 581,700 | ||||||||||
| Operating costs and expenses |
404,921 | 492,524 | 503,866 | 524,163 | 506,496 | |||||||||||||||
| Goodwill and broadcast license impairment |
20,133 | 375,086 | — | — | — | |||||||||||||||
| Operating (loss) earnings |
8,511 | (322,679 | ) | 78,788 | 104,600 | 75,204 | ||||||||||||||
| Total other income and (expense) |
(2,804 | ) | (8,164 | ) | (9,144 | ) | (15,570 | ) | (3,798 | ) | ||||||||||
| Earnings (loss) from continuing operations before income taxes |
5,707 | (330,843 | ) | 69,644 | 89,030 | 71,406 | ||||||||||||||
| Provision (benefit) for income taxes |
1,400 | (106,040 | ) | 26,626 | 35,247 | 28,234 | ||||||||||||||
| Earnings (loss) from continuing operations |
4,307 | (224,803 | ) | 43,018 | 53,783 | 43,172 | ||||||||||||||
| Gain from discontinued operations, net of taxes |
— | 400 | 67,060 | 10,590 | 23,071 | |||||||||||||||
| Net earnings (loss) |
$ | 4,307 | $ | (224,403 | ) | $ | 110,078 | $ | 64,373 | $ | 66,243 | |||||||||
| Diluted weighted average shares outstanding |
50,400 | 51,917 | 66,809 | 71,985 | 75,415 | |||||||||||||||
| Diluted – Class A and B common stock: |
||||||||||||||||||||
| Continuing operations |
$ | 0.05 | $ | (4.37 | ) | $ | 0.65 | $ | 0.75 | $ | 0.57 | |||||||||
| Discontinued operations |
— | 0.01 | 1.00 | 0.14 | 0.31 | |||||||||||||||
| Net earnings |
$ | 0.05 | $ | (4.36 | ) | $ | 1.65 | $ | 0.89 | $ | 0.88 | |||||||||
| Cash dividends |
||||||||||||||||||||
| Class C |
$ | 0.57 | (5) | $ | 0.57 | $ | 0.57 | $ | 0.57 | $ | 0.57 | |||||||||
| Class B |
$ | 0.02 | $ | 0.32 | $ | 0.30 | $ | 0.26 | $ | 0.26 | ||||||||||
| Class A |
$ | 0.02 | $ | 0.32 | $ | 0.30 | $ | 0.26 | $ | 0.26 | ||||||||||
| Segment Data |
||||||||||||||||||||
| Revenue: |
||||||||||||||||||||
| Publishing |
$ | 194,196 | $ | 241,972 | $ | 266,142 | $ | 284,894 | $ | 296,539 | ||||||||||
| Broadcasting |
171,491 | 209,914 | 218,118 | 238,536 | 168,316 | |||||||||||||||
| Printing Services |
48,249 | 65,201 | 69,377 | 66,956 | 72,463 | |||||||||||||||
| Other |
19,629 | 27,844 | 29,017 | 38,377 | 44,382 | |||||||||||||||
| Total revenue |
$ | 433,565 | $ | 544,931 | $ | 582,654 | $ | 628,763 | $ | 581,700 | ||||||||||
33
Table of Contents
| 2009(1) | 2008(2) | 2007(3) | 2006 | 2005(4) | ||||||||||||||||
| (dollars and shares in thousands, except for per share amounts) | ||||||||||||||||||||
| Operating earnings (loss): |
||||||||||||||||||||
| Publishing |
$ | 10,183 | $ | (2,792 | ) | $ | 31,040 | $ | 34,835 | $ | 39,224 | |||||||||
| Broadcasting |
(130 | ) | (322,706 | ) | 41,349 | 65,887 | 35,094 | |||||||||||||
| Printing Services |
(308 | ) | 2,424 | 5,932 | 2,600 | 2,324 | ||||||||||||||
| Other |
(1,234 | ) | 395 | 467 | 1,278 | (1,438 | ) | |||||||||||||
| Total operating earnings (loss) |
$ | 8,511 | $ | (322,679 | ) | $ | 78,788 | $ | 104,600 | $ | 75,204 | |||||||||
| Other Financial Data |
||||||||||||||||||||
| Depreciation |
$ | 26,598 | $ | 27,438 | $ | 27,407 | $ | 27,080 | $ | 24,343 | ||||||||||
| Amortization |
$ | 1,975 | $ | 1,998 | $ | 1,961 | $ | 1,998 | $ | 936 | ||||||||||
| Capital expenditures |
$ | 8,634 | $ | 22,225 | $ | 35,906 | $ | 21,735 | $ | 19,352 | ||||||||||
| Cash dividends |
$ | 1,476 | $ | 18,527 | $ | 20,445 | $ | 19,433 | $ | 20,289 | ||||||||||
| Cash Flow Data |
||||||||||||||||||||
| Net cash provided by (used for): |
||||||||||||||||||||
| Operating activities |
$ | 76,772 | $ | 71,791 | $ | 66,641 | $ | 89,731 | $ | 77,467 | ||||||||||
| Investing activities |
$ | (12,585 | ) | $ | (47,416 | ) | $ | 160,271 | $ | (11,657 | ) | $ | (221,880 | ) | ||||||
| Financing activities |
$ | (64,858 | ) | $ | (26,670 | ) | $ | (178,634 | ) | $ | (91,893 | ) | $ | 130,815 | ||||||
| Discontinued operations |
$ | — | $ | 79 | $ | (49,945 | ) | $ | 14,878 | $ | 14,088 | |||||||||
| Balance Sheet Data |
||||||||||||||||||||
| Property and equipment, net |
$ | 202,453 | $ | 221,158 | $ | 224,691 | $ | 218,103 | $ | 225,920 | ||||||||||
| Intangible assets, net |
$ | 115,836 | $ | 132,111 | $ | 481,769 | $ | 455,120 | $ | 477,010 | ||||||||||
| Total assets |
$ | 473,187 | $ | 542,599 | $ | 856,967 | $ | 955,258 | $ | 984,666 | ||||||||||
| Total debt |
$ | 151,375 | $ | 215,090 | $ | 178,885 | $ | 235,000 | $ | 274,545 | ||||||||||
| Shareholders’ equity |
$ | 171,075 | $ | 168,062 | $ | 487,562 | $ | 480,892 | $ | 484,068 | ||||||||||
| (1) | On April 23, 2009, we completed the purchase of CW affiliate, KNIN-TV, in Boise, Idaho. On September 25, 2009, we completed the sale of KGEM-AM and KCID-AM in Boise, Idaho. |
| (2) | On January 9, 2008, we completed the purchase of the Iola Herald and Manawa Advocate in Waupaca County, Wisconsin. On January 28, 2008, we completed the purchase of My Network affiliate KPSE-LP, Channel 50, in Palm Springs, California. On March 19, 2008, we completed the purchase of the Clintonville Shopper’s Guide and the Wittenberg Northerner Shopping News in Waupaca County, Wisconsin. On July 22, 2008, we completed the purchase of CW Network affiliate, KWBA-TV, in Sierra Vista, Arizona. On October 6, 2008, we completed the purchase of Waupaca Publishing Company in Waupaca, Wisconsin. |
| (3) | On March 27, 2007, we completed the purchase of the KMTV-TV FCC license. |
| (4) | Includes Fort Myers, Florida television station WFTX-TV and Tucson, Arizona Television station KGUN-TV, and a local marketing agreement for Omaha, Nebraska television station, KMTV-TV, from December 5, 2005, the date we acquired these television stations. |
| (5) | The first quarter 2009 dividend of $0.142 per share was paid. Dividends of $0.428 per share were accrued for the remaining three quarters of 2009. |
| ITEM 7. | MANAGEMENT’S DISCUSSION AND ANALYSIS OF FINANCIAL CONDITION AND RESULTS OF OPERATIONS |
The following discussion of our financial condition and results of operations should be read together with our audited consolidated financial statements for the three years ended December 27, 2009, including the notes thereto, appearing elsewhere in this Annual Report on Form 10-K. This discussion contains forward-looking statements. See “Forward-Looking Statements” for a discussion of uncertainties, risks and assumptions associated with these statements.
34
Table of Contents
Overview
Our business segments are based on the organizational structure used by management for making operating and investment decisions and for assessing performance. Our reportable business segments are: (i) publishing; (ii) broadcasting; (iii) printing services; and (iv) other. Our publishing segment consists of the Milwaukee Journal Sentinel, which serves as the only major daily newspaper for the Milwaukee metropolitan area, and community newspapers and shoppers in Wisconsin and Florida. Our broadcasting segment consists of 33 radio stations and 13 television stations in 12 states and the operation of a television station under a local marketing agreement. Our interactive media assets build on our strong publishing and broadcasting brands. We also provide a wide range of commercial printing services, including printing of publications, professional journals and documentation material, through our printing services segment. Our other segment consists of corporate expenses and eliminations and, historically, included a direct marketing services business until we sold this business in February 2010.
Over the past few years, fundamentals in the newspaper industry have deteriorated significantly. Continuing weakness in the automobile industry has resulted in a decline in automotive advertising. Reductions in retail and classified run-of-press (ROP) advertising (due in part to department store consolidation, weakened employment and real estate economics and a migration of advertising to the internet), circulation declines and online competition have also negatively impacted newspaper industry revenues. Additionally, the continued housing market downturn has adversely impacted the newspaper industry, including real estate classified advertising as well as the home improvement, furniture and financial services advertising categories. These conditions, coupled with a weak economy, persisted in 2009.
Our publishing businesses continued to be challenged in 2009 due to the difficult economic environment and the secular and cyclical influences affecting the newspaper industry. We have seen advertisers reduce their advertising spending in virtually all revenue categories. In addition, due to the changing mix of revenue categories, frequency and placement of advertising in the newspaper and customer choices to reduce or eliminate the use of color in their ads, we have seen a decrease in the average rate per inch of advertising. Classified advertising revenue, specifically for employment, real estate and automotive, decreased in 2009 compared to 2008. Retail advertising also decreased in 2009 compared to 2008 with weakness in a number of consumer-driven categories, including the furniture and furnishings, dining and entertainment, finance/insurance, home improvement, health services, department stores, small-retailers, automotive, food, business services, real estate, communications and airline and travel. Interactive revenue decreased at our publishing businesses in 2009 compared to 2008. In addition to the impact of the difficult economic environment, revenue from automotive online classifieds decreased 80.6% primarily due to our daily newspaper’s transition to a new franchise relationship with CarSoup.com. Our publishing businesses remained profitable in 2009 despite recording $5.4 million in workforce reduction charges. Notwithstanding these challenges, our publishing businesses continue to reduce their expense platforms to better align with a reduced revenue base. Total expenses decreased $60.8 million, or 24.8%, in 2009 compared to 2008 primarily due to a decrease of $23.3 million in payroll-related costs, a non-cash goodwill impairment of $16.7 million in 2008 and a decrease of $9.3 million in newsprint and paper costs.
Revenues in the broadcast industry are derived primarily from the sale of advertising time to local, national and political and issue advertisers and, to a lesser extent, from barter, digital revenues, retransmission fees, network compensation and other revenues. Because television and radio broadcasters rely upon advertising revenue, they are subject to cyclical changes in the economy. The size of advertisers’ budgets, which are affected by broad economic trends, affects the radio industry in general and the revenue of individual television stations, in particular. The broadcast industry continues to experience softness in television and radio advertising resulting from general economic pressure now impacting local and national economies, primarily in the automobile, housing and retail segments. Our broadcasting business also is affected by audience fragmentation as audiences have an increasing number of options to access news and other programming.
35
Table of Contents
Revenue from broadcasting decreased in 2009 compared to 2008 due to decreases in local, political and issue, national and Olympic advertising revenue, partially offset by an increase in retransmission revenue and revenue from the television stations acquired in 2008 and 2009. The difficult economic environment has negatively impacted our broadcasting advertising revenue across most categories, the most significant being our largest revenue category—automotive. The significant decline in automotive advertising negatively impacts our average unit rates even if our inventory sell-out levels are high. The operating results of our broadcasting business were essentially break even in 2009, including a $20.1 million non-cash broadcast license impairment charge, compared to an operating loss of $322.7 million in 2008. The operating loss in 2008 included a $229.2 million non-cash goodwill impairment charge and a $129.2 million non-cash broadcast license impairment charge. Total expenses decreased $361.0 million, or 67.8%, in 2009 compared to 2008, primarily due to the non-cash goodwill impairment charge in 2008 and a decrease of $109.1 million of the broadcast license impairment charge in 2009 compared to 2008. Our broadcasting business continues to reduce its expense platforms to reflect a reduced revenue base.
Revenue at our printing services business decreased in 2009 compared to 2008 primarily due to the effects of the difficult economic environment and the planned reduction in revenue from Dell Computer Corporation (Dell). Customers are reducing their print volumes, ceasing to print and/or are taking their printing needs out for bid in order to achieve lower pricing. Our printing services business recorded an operating loss of $0.3 million in 2009 compared to operating earnings of $2.4 million in 2008. The decrease in operating earnings was primarily due to the impact from the decrease in revenue and an increase in bad debt expense, partially offset by a decrease in production and payroll-related costs.
Revenue at our direct marketing services business decreased in 2009 compared to 2008 primarily due to a decrease in mailing services and postage revenue. Our direct marketing services business posted an operating loss in 2009 primarily due to the operating earnings impact of the decrease in revenue and a $0.6 million fixed asset impairment charge, partially offset by a decrease in production and payroll-related costs.
For all of our advertising-based businesses, we believe that as the current economic environment improves, advertising revenue will begin to stabilize and eventually increase from its current level. We do not expect, however, that revenues at our daily newspaper will return to revenue levels reported in the last five years given the secular changes affecting the newspaper industry.
Subsequent Events
On February 3, 2010, we completed the sale of certain assets of the St. Paul, Minnesota-based mailing services operations of our direct marketing services business to Impact Mailing of Minnesota, Inc. for cash and a commission on buyer’s future revenue for a period of three years. The remaining operations in St. Paul, Minnesota will be shut down by the end of April, 2010. We expect to record approximately $0.8 million for shut down costs in 2010. In a separate transaction on February 8, 2010, we completed the sale of certain assets of the Clearwater, Florida-based operations of our direct marketing services business to PrimeNet Direct Marketing Solutions, LLC, owned by the former president of our direct marketing services business, as we exit the direct marketing business. Consideration from the sale to PrimeNet Direct Marketing Solutions, LLC includes a minimum guaranteed commission on buyer’s future revenue for a period of four years and seller financing of working capital. We believe the loss on the sale of the Clearwater-Florida based operations will be minimal. The net loss in 2009 for our direct marketing services business was $1.4 million. As of December 27, 2009, total assets were $2.8 million and total liabilities were $1.0 million.
36
Table of Contents
Results of Operations
2009 Compared to 2008
Our consolidated revenue in 2009 was $433.6 million, a decrease of $111.3 million, or 20.4%, compared to $544.9 million in 2008. Our consolidated operating costs and expenses in 2009 were $280.8 million, a decrease of $56.7 million, or 16.8%, compared to $337.5 million in 2008. Our consolidated selling and administrative expenses in 2009 were $124.2 million, a decrease of $30.8 million, or 19.9%, compared to $155.0 million in 2008. Non-cash broadcast license impairment was $20.1 million in 2009 compared to non-cash goodwill and broadcast license impairment charges of $375.1 million in 2008.
The following table presents our total revenue by segment, total operating costs and expenses, selling and administrative expenses, non-cash goodwill and broadcast license impairment and total operating earnings (loss) as a percent of total revenue for 2009 and 2008:
| 2009 | Percent of Total Revenue |
2008 | Percent of Total Revenue |
||||||||||
| (dollars in millions) | |||||||||||||
| Revenue: |
|||||||||||||
| Publishing |
$ | 194.2 | 44.8 | % | $ | 242.0 | 44.4 | % | |||||
| Broadcasting |
171.5 | 39.6 | 209.9 | 38.5 | |||||||||
| Printing services |
48.3 | 11.1 | 65.2 | 12.0 | |||||||||
| Other |
19.6 | 4.5 | 27.8 | 5.1 | |||||||||
| Total revenue |
433.6 | 100.0 | 544.9 | 100.0 | |||||||||
| Total operating costs and expenses |
280.8 | 64.8 | 337.5 | 61.9 | |||||||||
| Selling and administrative expenses |
124.2 | 28.6 | 155.0 | 28.4 | |||||||||
| Goodwill and broadcast license impairment |
20.1 | 4.6 | 375.1 | 68.8 | |||||||||
| Total operating costs and expenses, selling and administrative expenses and goodwill and broadcast license impairment |
425.1 | 98.0 | 867.6 | 159.1 | |||||||||
| Total operating earnings (loss) |
$ | 8.5 | 2.0 | % | $ | (322.7 | ) | (59.1 | )% | ||||
In addition to the secular influences affecting the newspaper industry discussed above, the difficult economic environment negatively impacted our publishing, broadcasting and direct marketing services advertising revenue and commercial printing revenue in 2009.
In the newspaper industry, classified advertising has historically been the most sensitive to economic cycles because it is driven by the demand of employment, real estate transactions and automotive sales. Newspaper classified advertising also has been the most impacted by secular changes affecting the newspaper industry. Classified advertising continues to move away from printed products to online products. While we offer online products and seek to retain classified advertising, we face increasing competition for this business and are losing the benefit of a strong base of print classified advertising against which we can upsell online advertisements. Our publishing business experienced a 44.0% decrease in classified advertising revenue in 2009 compared to 2008. Retail advertising revenue decreased 19.6% in 2009 compared to 2008 primarily in consumer-driven categories. As consumers have less discretionary income, our advertisers are decreasing their spending on advertising. The most significant decreases were in the furniture and furnishings, dining and entertainment, finance/insurance, home improvement, health services, department stores, small-retailers, automotive, food, business services, real estate, communications and airline and travel. Secular changes affecting the newspaper industry also are resulting in pressure to reduce costs and align our cost structure in the face of decreasing revenues.
At our broadcasting business, advertising revenue decreased in 2009 compared to 2008 across most categories, the most significant being our largest revenue category—automotive. Automotive advertising revenue decreased $15.2 million, or 39.3%, in 2009 compared to 2008 as the domestic automobile industry is experiencing an
37
Table of Contents
unprecedented decrease in automotive sales. In 2009, political and issue advertising revenue decreased $10.1 million compared to 2008. This is part of the normal two-year advertising cycle which affects our television stations in particular. Olympic advertising revenue decreased $2.3 million due to the broadcast of the 2008 Summer Olympics on our NBC affiliates in 2008. Partially offsetting the decrease in advertising revenue, retransmission revenue increased $2.9 million in 2009 compared to 2008. The retransmission contracts will continue to generate incremental revenue into the next several years.
The decrease in printing services revenue was primarily due to the effects of the difficult economic environment. Revenue from printing publications and revenue from Dell and other computer-related customers decreased in 2009 compared to 2008. At our direct marketing services business, revenue from mailing and list services, postage and offset printing decreased in 2009 compared to 2008 as the demand for direct marketing advertising continued to decrease.
The decrease in total operating costs and expenses was primarily due to the decrease in revenue, a decrease in payroll-related costs reflecting the savings from workforce reduction initiatives, a decrease in newsprint and paper costs, a $2.2 million gain related to insurance proceeds from our tower replacement in Wichita, Kansas, a decrease in travel and entertainment expenses, a decrease in legal fees and a decrease in programming expenses. The decrease in selling and administrative expenses was primarily due to decreases in payroll-related costs reflecting the savings from workforce reduction initiatives, a decrease in agency commissions, a decrease in advertising and promotion expenses and overall cost reduction initiatives as our businesses continue to reduce expense platforms in response to the decrease in revenue. We recorded a $20.1 million non-cash broadcast license impairment charge in 2009 compared to a $129.2 million non-cash broadcast license in impairment charge in 2008. We also recorded a non-cash goodwill impairment charge of $245.9 million in 2008. Total workforce reduction charges were $6.4 million in 2009 compared to $5.3 million in 2008.
Our consolidated operating earnings were $8.5 million in 2009 compared to an operating loss of $322.7 million in 2008. The following table presents our operating earnings (loss) by segment for 2009 and 2008:
| 2009 | Percent of Total Operating Earnings |
2008 | Percent of Total Operating Loss |
|||||||||||
| (dollars in millions) | ||||||||||||||
| Publishing |
$ | 10.2 | 119.6 | % | $ | (2.8 | ) | 0.9 | % | |||||
| Broadcasting |
(0.1 | ) | (1.5 | ) | (322.7 | ) | 100.0 | |||||||
| Printing services |
(0.3 | ) | (3.6 | ) | 2.4 | (0.8 | ) | |||||||
| Other |
(1.3 | ) | (14.5 | ) | 0.4 | (0.1 | ) | |||||||
| Total operating earnings (loss) |
$ | 8.5 | 100.0 | % | $ | (322.7 | ) | 100.0 | % | |||||
The increase in total operating earnings was primarily due to the decrease in non-cash goodwill and broadcast license impairment charges and the decreases in expenses, partially offset by the decrease in revenue at our publishing, broadcasting, printing services and direct marketing services businesses.
Publishing
Revenue from publishing in 2009 was $194.2 million, a decrease of $47.8 million, or 19.7%, compared to $242.0 million in 2008. Operating earnings from publishing were $10.2 million in 2009 compared to an operating loss of $2.8 million in 2008, which included a non-cash goodwill impairment charge of $16.7 million.
38
Table of Contents
The following table presents our publishing revenue by category, non-cash goodwill impairment and operating earnings (loss) for 2009 and 2008:
| 2009 | 2008 | ||||||||||||||||||||||
| Daily Newspaper |
Community Newspapers & Shoppers |
Total | Daily Newspaper |
Community Newspapers & Shoppers |
Total | Percent Change |
|||||||||||||||||
| (dollars in millions) | |||||||||||||||||||||||
| Advertising revenue: |
|||||||||||||||||||||||
| Retail |
$ | 66.0 | $ | 23.5 | $ | 89.5 | $ | 83.6 | $ | 27.7 | $ | 111.3 | (19.6 | ) | |||||||||
| Classified |
22.3 | 5.3 | 27.6 | 43.4 | 5.7 | 49.1 | (44.0 | ) | |||||||||||||||
| National |
4.9 | — | 4.9 | 7.6 | — | 7.6 | (35.1 | ) | |||||||||||||||
| Direct Marketing |
0.6 | — | 0.6 | 3.4 | — | 3.4 | (82.5 | ) | |||||||||||||||
| Other |
— | 0.2 | 0.2 | — | 0.4 | 0.4 | (37.5 | ) | |||||||||||||||
| Total advertising revenue |
93.8 | 29.0 | 122.8 | 138.0 | 33.8 | 171.8 | (28.5 | ) | |||||||||||||||
| Circulation revenue |
51.1 | 2.0 | 53.1 | 50.5 | 1.3 | 51.8 | 2.5 | ||||||||||||||||
| Other revenue |
15.2 | 3.1 | 18.3 | 14.9 | 3.5 | 18.4 | (0.4 | ) | |||||||||||||||
| Total revenue |
$ | 160.1 | $ | 34.1 | $ | 194.2 | $ | 203.4 | $ | 38.6 | $ | 242.0 | (19.7 | ) | |||||||||
| Goodwill impairment |
$ | — | $ | — | $ | — | $ | 2.9 | $ | 13.8 | $ | 16.7 | NA | ||||||||||
| Operating earnings (loss) |
$ | 8.9 | $ | 1.3 | $ | 10.2 | $ | 10.4 | $ | (13.2 | ) | $ | (2.8 | ) | NA | ||||||||
Advertising revenue accounted for 63.2% of total publishing revenue in 2009 compared to 71.0% in 2008. The difficult economic environment and ongoing secular changes in the newspaper industry have caused advertisers to decrease their advertising spending across all of our advertising revenue categories. In addition, due to the changing mix of revenue categories, frequency and placement of advertising in the newspaper and customer choices to reduce or eliminate the use of color in their ads, we have seen a decrease in the average rate per inch of advertising. This rapid decline in advertising revenue has been partially offset by an increase in circulation revenue and commercial delivery revenue.
Retail advertising revenue in 2009 was $89.5 million, a decrease of $21.8 million, or 19.6%, compared to $111.3 million in 2008. The $17.6 million decrease at our daily newspaper was primarily due to a decrease in ROP and preprint advertising in consumer-driven categories. As consumers have less discretionary income, advertisers are decreasing their spending. The most significant decreases were in the furniture and furnishings, dining and entertainment, finance/insurance, home improvement, health services, department stores, small-retailers, automotive, food, business services, real estate, communications and airline and travel categories. The same trends persisted in our community newspapers and shoppers business. The $4.2 million decrease in revenue at our community newspapers and shoppers was primarily due to decreases in automotive and real estate advertising, partially offset by $1.7 million in revenue from publications acquired in Northern Wisconsin and Florida in late 2008.
Classified advertising is generally the most sensitive to economic cycles because it is driven by the demand of employment, real estate transactions and automotive sales. As a result of the difficult economic environment and the ongoing secular trend of classified advertising transitioning to the internet, our publishing businesses experienced a significant decrease in classified advertising revenue in 2009 compared to 2008. Classified advertising revenue in 2009 was $27.6 million, a decrease of $21.5 million, or 44.0%, compared to $49.1 million in 2008. At our daily newspaper, print and online classified advertising revenue decreased by 48.8% from 2008. Specifically, the employment category decreased $10.8 million, or 64.6%; automotive decreased $5.0 million, or 54.0%; real estate decreased $4.4 million, or 44.0% and other decreased $1.0 million, or 13.0%. The average rate per inch of classified advertising has decreased primarily due to the significant decrease in employment classified revenue which, historically, has been at a higher rate than other categories. At our community newspapers and shoppers business, a decrease in automotive, employment and real estate classified advertising revenue was
39
Table of Contents
partially offset by an increase in classified advertising revenue from newly acquired publications in Northern Wisconsin and Florida in late 2008 and an increase in legal classified advertising in Florida due to an increase in foreclosure notices.
The total decrease in retail and classified automotive ROP and online advertising at our daily newspaper in 2009 was $6.1 million, or 49.7%, compared to 2008. The decrease was due to a decline in demand for advertising from local dealers and regional dealer associations. Consumers have decreased their purchases of new automobiles and, in response, local dealers and regional dealer associations are reducing their costs, including advertising costs.
Interactive advertising revenue is reported in the various advertising revenue categories. Total retail and classified interactive advertising revenue at our publishing businesses was $9.5 million in 2009, a decrease of $5.2 million, or 35.6%, compared to $14.7 million in 2008. Interactive classified advertising revenue at the daily newspaper was $4.0 million in 2009, a decrease of $4.8 million, or 54.4%, compared to $8.8 million in 2008. The $4.8 million decrease was primarily due to decreases in automotive classified advertising of $2.8 million, or 80.6%, and employment classified advertising of $2.0 million, or 46.2%. The difficult economic environment has negatively impacted automotive and employment online advertising revenue. In 2009, revenue from automotive online classified advertising at our daily newspaper decreased 80.6% primarily due to the transition to a new franchise relationship with CarSoup.com.
National advertising revenue in 2009 was $4.9 million, a decrease of $2.7 million, or 35.1%, compared to $7.6 million in 2008. The decrease was primarily due to a decrease in ROP and preprint advertising in the business services, airline and travel, small-retailers and food categories, which are predominantly consumer-driven.
Direct marketing revenue, consisting of revenue from the sale of direct mail products of our daily newspaper, was $0.6 million in 2009, a decrease of $2.8 million, or 82.5%, compared to $3.4 million in 2008. This revenue category was also negatively impacted by the difficult economic environment as the demand for direct marketing advertising decreased. In May 2009, we shut down the operations of our Milwaukee-area direct marketing facility. The near-term and long-term business prospects did not support continuing this product offering. During the second half of 2009, we focused our direct marketing efforts on our total market coverage (TMC) product, which is more cost effective for us to produce and distribute.
Other advertising revenue, consisting of revenue from company-sponsored event advertising at our community newspapers and shoppers, was $0.2 million in 2009 compared to $0.4 million in 2008.
Circulation revenue accounted for 27.3% of total publishing revenue in 2009 compared to 21.4% in 2008. The increase as a percentage of total revenue is due to the decrease in advertising revenue, the overall decline in total revenue and the increase in circulation revenue. Circulation revenue of $53.1 million in 2009 increased $1.3 million, or 2.5%, compared to $51.8 million in 2008. At our daily newspaper, circulation revenue increased due to an increase in daily single copy revenue, following a price increase to 75 cents per daily paper in the Milwaukee-metro market in January 2009, a change from wholesale rates to retail rates and a price increase in home delivery rates in June 2009. Circulation average rates for the daily and Sunday editions increased on the strength of pricing gains that more than offset a decrease in the number of copies sold. At our community newspapers and shoppers business, circulation revenue increased due to the publications acquired in Northern Wisconsin in late 2008.
Other revenue, which consists of revenue from promotional and commercial distribution and commercial printing revenue at our daily newspaper and commercial printing at the printing plants for our community newspapers and shoppers, accounted for 9.5% of total publishing revenue in 2009 compared to 7.6% in 2008. The increase as a percentage of total revenue is due to the decrease in advertising revenue and the overall decline in total revenue. Other revenue was $18.3 million in 2009, a decrease of $0.1 million, or 0.4%, compared to
40
Table of Contents
$18.4 million in 2008. The $0.3 million increase at our daily newspaper was primarily due to an increase in commercial distribution revenue due to additional routes for USA Today and promotion revenue partially offset by a decrease in commercial and brokered printing revenue due to volume declines as certain customers reduced page counts and number of copies and the loss of certain customers. The $0.4 million decrease at our community newspapers and shoppers was due to the loss of certain commercial printing customers.
In September 2009, our daily newspaper signed a three-year commercial printing contract to print all of the Pioneer Press Publications, which consist of 39 weekly newspapers serving Northeastern Illinois communities. The Pioneer Press Publications are owned by Sun Times Media Group, which expects to print about 156,000 weekly copies. In July 2009, our daily newspaper signed a commercial printing contract with The Kenosha News, a seven-day newspaper located north of the Illinois and Wisconsin border. This is the first newspaper that has completely outsourced all of its printing and packaging to our production plant. Our daily newspaper is printing approximately 26,000 daily and 29,000 Sunday copies, plus weekly and community products. Currently, there is limited capacity available at our daily newspaper’s production facility to allow for printing and inserting for additional commercial printing customers.
Publishing operating earnings in 2009 were $10.2 million, an increase of $13.0 million compared to an operating loss of $2.8 million in 2008, which included a non-cash goodwill impairment charge of $16.7 million. In an effort to partially offset the impact of the decrease in advertising revenue, our publishing businesses continue to reduce their expense platforms. Total expenses decreased $60.8 million, or 24.8%, in 2009 compared to 2008 primarily due to a decrease of $23.3 million in payroll-related costs and the non-cash goodwill impairment charge of $16.7 million in 2008. The charges for workforce reductions were $5.4 million and $4.6 million in 2009 and 2008, respectively. Since the end of 2007, our full-time and part-time employee count for our publishing businesses has decreased by approximately 30%. Excluding payroll-related costs, operating costs and expenses decreased $16.0 million in 2009 compared to 2008, the most significant of which was newsprint and paper costs, online fees and costs related to the TMC product, which was transitioned from mail delivery to carrier delivery, and the direct mail advertising product at our daily newspaper. Total newsprint and paper costs for our publishing businesses in 2009 were $17.4 million, a decrease of $9.3 million, or 34.7%, compared to $26.7 million in 2008 due to a 23.1% decrease in newsprint consumption and a 16.0% decrease in average newsprint pricing per metric ton. Consumption of metric tonnes of newsprint in 2009 decreased primarily due to decreases in ROP advertising and editorial pages, average net paid circulation and waste. Online fees at our daily newspaper decreased by $1.6 million in 2009 compared to 2008 primarily due to the daily newspaper’s transition to a new franchise relationship with CarSoup.com and due to the decrease in interactive employment classified advertising. Legal fees decreased by $0.7 million in 2009 compared to 2008 primarily due to a $0.4 million contract termination charge in 2008. Partially offsetting the expense decreases, the daily newspaper increased its sales and use tax reserve by $0.9 million in 2009.
Broadcasting
Revenue from broadcasting in 2009 was $171.5 million, a decrease of $38.4 million, or 18.3%, compared to $209.9 million in 2008. The operating loss from broadcasting in 2009 was $0.1 million, which includes a $20.1 million non-cash broadcast license impairment charge and a $2.2 million gain related to insurance proceeds from our tower replacement in Wichita, Kansas. This compared to an operating loss of $322.7 million in 2008, which includes a $229.2 million non-cash goodwill impairment charge and a $129.2 million non-cash broadcast license impairment charge.
41
Table of Contents
The following table presents our broadcasting revenue, non-cash goodwill and broadcast license impairment and operating earnings (loss) for 2009 and 2008:
| 2009 | 2008 | ||||||||||||||||||||||||||||||||
| Television | Radio | Goodwill Impairment |
Total | Television | Radio | Goodwill Impairment |
Total | Percent Change |
|||||||||||||||||||||||||
| (dollars in millions) | |||||||||||||||||||||||||||||||||
| Revenue |
$ | 105.4 | $ | 66.1 | $ | 171.5 | $ | 130.6 | $ | 79.3 | $ | 209.9 | (18.3 | ) | |||||||||||||||||||
| Broadcast license impairment |
$ | 16.0 | $ | 4.1 | $ | 20.1 | $ | 77.9 | $ | 51.3 | $ | 129.2 | NA | ||||||||||||||||||||
| Operating earnings (loss) |
$ | (9.6 | ) | $ | 9.5 | $ | — | $ | (0.1 | ) | $ | (60.7 | ) | $ | (32.8 | ) | $ | (229.2 | ) | $ | (322.7 | ) | NA | ||||||||||
Revenue from our television stations in 2009 was $105.4 million, a decrease of $25.2 million, or 19.3%, compared to $130.6 million in 2008. The revenue decrease was experienced across all of our television markets, partially offset by incremental revenue of $3.0 million from the 2008 acquisitions of KPSE-TV in Palm Springs, California and KWBA-TV in Sierra Vista, Arizona (Tucson market) and the acquisition of KNIN-TV in Boise, Idaho in 2009. Compared to 2008, local advertising revenue decreased $9.9 million, or 11.5%; political and issue advertising revenue decreased $9.3 million, or 80.0%; national advertising revenue decreased $6.6 million or 23.6%; and Olympic advertising revenue decreased $2.3 million, or 100.0% due to the broadcast of the 2008 Summer Olympics on our NBC affiliates in 2008. We will experience an increase in Olympic advertising revenue in 2010 compared to 2009 due the broadcast of the Winter Olympics in February 2010. In 2009, which is generally considered a non-election year, we recorded higher than expected political and issue advertising revenue due to the national debate on health care reform. Television advertising revenue and rates in even-numbered years typically benefit from political and issue and advertising because there tends to be more pressure on available inventory as the demand for advertising increases and we have the opportunity to increase the average unit rates we charge our customers. We have television stations in a number of states with competitive political races in 2010; however, in the current economic environment, we cannot predict that our rates will increase if the demand for our available inventory increases.
The difficult economic environment has negatively impacted our advertising revenue across most categories, the most significant being our largest revenue category—automotive, which represented 14.2% of television advertising revenue in 2009 compared to 20.1% in 2008. Automotive advertising revenue decreased $11.2 million in 2009 compared to 2008 as the automobile industry is experiencing an unprecedented decrease in automotive sales. The lack of automotive advertising had a negative impact on the average unit rate we charge our advertisers. National automotive revenue is heavily placed in prime time, which helps drive average unit rates among other advertisers. When that placement doesn’t occur in prime time, it negatively affects demand and does not allow us the opportunity to increase the rates we can charge our advertisers even when the sell-out levels are high. The other consumer-driven categories that felt the impact of the economic recession and caused revenue decreases included furniture and electronics, communications, medical, restaurants, home improvement, retail, entertainment, travel, professional services, home products and beverages. In an effort to overcome the decrease in automotive and other consumer-driven advertising revenue, our television stations are selling developmental revenue. While developmental revenue decreased $0.2 million in 2009 compared to 2008, it increased as a percentage of total revenue from our television stations to 14.0%, up from 11.5%. Interactive revenue was $1.4 million in 2009, a decrease of $0.3 million, or 17.7%, compared to $1.7 million in 2008. Both interactive and developmental revenue are reported in local advertising revenue. Partially offsetting the revenue decreases was an increase in retransmission revenue and local revenue in the supermarkets, financial and media categories. Retransmission revenue increased $2.9 million in 2009 to $4.4 million, compared to $1.5 million in 2008. We finalized retransmission contracts covering virtually all of the subscribers in our markets. These contracts will continue to generate incremental revenue in the next several years.
42
Table of Contents
Operating loss from our television stations in 2009 was $9.6 million compared to $60.7 million in 2008. The decrease in the operating loss was primarily due to the decrease in the non-cash broadcast license impairment in 2009 compared to 2008 and a decrease in expenses partially offset by the impact from the decrease in advertising revenue. Our television stations continue to reduce their expense platforms to align with a reduced revenue base. Total television expenses in 2009 were $115.0 million, a decrease of $76.3 million compared to $191.3 million in 2008. The decrease in total television expenses was primarily due to a decrease of $61.9 million in non-cash broadcast license impairment charges, a decrease of $8.9 million in payroll-related costs, a decrease in agency commissions, a decrease in advertising and promotion expenses, a decrease in syndicated programming expenses, a decrease in bad debt expense, a decrease in travel and entertainment and a decrease in news services. Partially offsetting these expense decreases was $1.5 million in incremental expenses from television stations acquired in 2008 and 2009, an increase of $0.4 million in legal fees and an increase of $0.2 million in cable retransmission costs.
Revenue from our radio stations in 2009 was $66.1 million, a decrease of $13.2 million, or 16.7%, compared to 79.3 million in 2008. The revenue decrease was experienced across all of our radio markets. Compared to 2008, local advertising revenue decreased $10.9 million, or 15.8%, national advertising revenue decreased $1.5 million, or 23.3% and political and issue advertising revenue decreased $0.8 million, or 68.7%. The difficult economic environment has negatively impacted our advertising revenue across most categories, the most significant being our largest revenue category—automotive, which represented 13.0% of radio advertising revenue in 2009 compared to 15.9% in 2008. Automotive advertising revenue decreased $4.0 million in 2009 compared to 2008 as the domestic automobile industry is experiencing an unprecedented decrease in automotive sales. The other consumer-driven categories that felt the impact of the economic recession and caused revenue decreases included communications, home improvement, medical, restaurants, media, entertainment, restaurants, furniture and electronics, retail, hotel and gambling, education and recreation. In an effort to overcome the decrease in automotive and other consumer-driven advertising revenue, our radio stations are working to replace this lost revenue with developmental revenue. Developmental revenue increased $0.2 million in 2009 compared to 2008 and it increased as a percentage of total revenue from our radio stations to 19.3%, up from 15.9%. Interactive revenue was $1.7 million in 2009, a decrease of $0.2 million, or 7.9%, compared to $1.9 million in 2008. Both interactive and developmental revenue are reported in local advertising revenue.
Operating earnings from our radio stations in 2009 were $9.5 million compared to an operating loss of $32.8 million in 2008. The increase in operating earnings was primarily due to the decrease in the non-cash broadcast license impairment in 2009 compared to 2008 and a decrease in expenses partially offset by the impact from the decrease in advertising revenue. Our radio stations continue to reduce their expense platforms to align with a reduced revenue base. Total radio expenses in 2009 were $56.6 million, a decrease of $55.5 million compared to $112.1 million in 2008. The decrease in total radio expenses was primarily due to a decrease of $47.2 million in non-cash broadcast license impairment charges, a decrease of $5.0 million in payroll-related costs, a $2.2 million gain related to insurance proceeds from our tower replacement in Wichita, Kansas that was destroyed in an ice storm, a decrease in advertising and promotion expenses, a decrease in professional services and a decrease in agency commissions. Partially offsetting these expense decreases was an increase in sports rights fees and an increase in bad debt expense.
Printing Services
Revenue from printing services in 2009 was $48.3 million, a decrease of $16.9 million, or 26.0%, compared to $65.2 million in 2008. Operating loss from printing services in 2009 was $0.3 million compared to operating earnings of $2.4 million in 2008.
The decrease in printing services revenue was primarily due to the effects of the difficult economic environment. Revenue from printing publications and revenue from Dell and other computer-related customers decreased in 2009 compared to 2008. Our printing services’ customers continue to reduce their print volumes,
43
Table of Contents
cease to print and/or take their printing needs out for bid in order to achieve lower pricing. We believe our revenue from Dell, which was $1.8 million in 2009, will end during 2010.
The decrease in printing services operating earnings was primarily due to the impact from the decrease in revenue. Total expenses decreased $14.2 million, or 22.7%, in 2009 compared to 2008. The decrease in total expenses was primarily due to a decrease of $8.1 million in materials costs, a decrease of $4.9 million in payroll-related costs and various other expense reductions, partially offset by an increase of $0.7 million in postage and freight expense, an increase in workforce reduction charges of $0.5 million and an increase in bad debt expense of $0.3 million. Due to the difficult economic environment, our printing services business is encountering an increase in slow-paying customers as well as customers who have filed bankruptcy.
Other
Other revenue in 2009 was $19.6 million, a decrease of $8.2 million, or 29.5%, compared to $27.8 million in 2008. Other operating loss in 2009 was $1.3 million compared to operating earnings of $0.4 million in 2008.
The following table presents our other revenue and operating earnings (loss) for 2009 and 2008:
| 2009 | 2008 | Percent Change |
||||||||||||||||||||||||
| Direct Marketing Services |
Corporate and Eliminations |
Total | Direct Marketing Services |
Corporate and Eliminations |
Total | |||||||||||||||||||||
| (dollars in millions) | ||||||||||||||||||||||||||
| Revenue |
$ | 20.1 | $ | (0.5 | ) | $ | 19.6 | $ | 28.3 | $ | (0.6 | ) | $ | 27.8 | (29.5 | ) | ||||||||||
| Operating earnings (loss) |
$ | (2.5 | ) | $ | 1.2 | $ | (1.3 | ) | $ | (1.2 | ) | $ | 1.6 | $ | 0.4 | NA | ||||||||||
The decrease in direct marketing services revenue was primarily due to the effects of the difficult economic environment. Revenue from mailing and list services, postage and offset printing decreased in 2009 compared to 2008 as the demand for direct marketing advertising continues to decrease and customers change from first-class mailings to bulk mailings or third-class mailings. This decrease was partially offset by an increase in laser printing revenue. Included in revenue and operating costs and expenses from our direct marketing services business is $11.1 million and $16.3 million of postage amounts billed to customers in 2009 and 2008, respectively.
The decrease in operating earnings at our “other” segment was primarily due to the operating earnings impact of the decrease in revenue at our direct marketing services business, a $0.6 million fixed asset impairment charge and an increase in payroll-related expenses at corporate, partially offset by an decrease in payroll-related costs at our direct marketing services business and a decrease in legal fees at corporate.
Other Income and Expense and Taxes
Interest income was insignificant in 2009 and 2008. Interest expense was $2.8 million in 2009 compared to $8.2 million in 2008. The decrease was due to a decrease in both the average borrowings during the year and the interest rate on our borrowings. Amortization of deferred financing costs was $0.3 million in 2009 and 2008.
Our effective tax rate was 24.5% in 2009 compared to an effective tax benefit rate of 32.1% in 2008. In 2009, the effective tax rate was impacted by the a settlement with the Wisconsin Department of Revenue (WDR) and a favorable adjustment to our income tax reserve due to the expiration of certain statute of limitations. The settlement with the WDR had a $1.2 million impact on our effective tax rate in 2009. Additionally, in connection with the settlement with the WDR, we received an $8.7 million refund in 2009 from the deposit we made in 2007.
44
Table of Contents
Discontinued Operations
There were no results from discontinued operations in 2009. In 2008, we recorded a gain on discontinued operations of $0.4 million for a reduction in the reserve related to a settlement between the Environmental Protection Agency and NorthStar Print Group, Inc.
Net Earnings (Loss)
Our net earnings in 2009 were $4.3 million compared to a net loss of $224.4 million in 2008. The increase was due to the increase in operating earnings from continuing operations for the reasons described above and by the decrease in interest expense, partially offset by the increase in income tax expense and the decrease in gain from discontinued operations.
Earnings (Loss) per Share for Class A and B Common Stock
In 2009, basic and diluted net loss per share of class A and B common stock were $0.05 for both. This compared to net loss per share of $4.36 for both in 2008. Basic and diluted loss per share of class A and B common stock from continuing operations were $0.05 for both in 2009. Basic and diluted loss per share from continuing operations was $4.37 for both in 2008. There were no basic and diluted earnings per share of class A and B common stock from discontinued operations in 2009 compared to $0.01 for both in 2008.
2008 compared to 2007
Our consolidated revenue in 2008 was $544.9 million, a decrease of $37.8 million, or 6.5%, compared to $582.7 million in 2007. Our consolidated operating costs and expenses in 2008 were $337.5 million, a decrease of $5.5 million, or 1.6%, compared to $343.0 million in 2007. Our consolidated selling and administrative expenses in 2008 were $155.0 million, a decrease of $5.9 million, or 3.7%, compared to $160.9 million in 2007. Non-cash goodwill and broadcast license impairment was $375.1 million in 2008.
The following table presents our total revenue by segment, total operating costs and expenses, selling and administrative expenses, non-cash goodwill and broadcast license impairment and total operating earnings (loss) as a percent of total revenue for 2008 and 2007:
| 2008 | Percent of Total Revenue |
2007 | Percent of Total Revenue |
||||||||||
| (dollars in millions) | |||||||||||||
| Continuing operations: |
|||||||||||||
| Revenue: |
|||||||||||||
| Publishing |
$ | 242.0 | 44.4 | % | $ | 266.1 | 45.7 | % | |||||
| Broadcasting |
209.9 | 38.5 | 218.1 | 37.4 | |||||||||
| Printing services |
65.2 | 12.0 | 69.4 | 11.9 | |||||||||
| Other |
27.8 | 5.1 | 29.1 | 5.0 | |||||||||
| Total revenue |
544.9 | 100.0 | 582.7 | 100.0 | |||||||||
| Total operating costs and expenses |
337.5 | 61.9 | 343.0 | 58.9 | |||||||||
| Selling and administrative costs |
155.0 | 28.4 | 160.9 | 27.6 | |||||||||
| Goodwill and broadcast license impairment |
375.1 | 68.8 | — | — | |||||||||
| Total operating costs and expenses, selling and administrative expenses and goodwill and broadcast license impairment |
867.6 | 159.2 | 503.9 | 86.5 | |||||||||
| Total operating earnings (loss) |
$ | (322.7 | ) | (59.2 | )% | $ | 78.8 | 13.5 | % | ||||
45
Table of Contents
The decrease in total revenue was due to a decrease in classified ROP advertising at our publishing businesses, a decrease in local advertising revenue at our television and radio stations, a decrease in retail ROP and preprint advertising at our publishing business, a decrease in national advertising revenue at our television and radio stations, a decrease in revenue from printing catalogs at our printing services business, a decrease in national ROP and preprint advertising revenue at our daily newspaper, a decrease in mailing services revenue at our direct marketing services business, and a decrease in direct marketing advertising revenue at our daily newspaper. These revenue decreases were partially offset by an increase in political and issue advertising revenue at our television and radio stations, an increase in commercial printing and commercial delivery revenue at our daily newspaper, an increase in Olympic advertising revenue at our NBC affiliated television stations and an increase in interactive advertising revenue at our publishing and broadcasting businesses.
The decrease in total operating costs and expenses was due to a decrease in payroll-related costs, a decrease in postage costs due to a decrease in direct marketing revenue, a decrease in material costs due to a decrease in revenue at our publishing and direct marketing services businesses, a decrease in pension costs and a decrease in outside printing costs at our daily newspaper due to the decrease in direct marketing advertising revenue. Partially offsetting these operating cost and expense decreases were operating costs and expenses related to our newly acquired television stations, KPSE-LP and KWBA-TV, and our newly acquired publications in Northern Wisconsin and Florida, workforce reduction charges across all of our businesses, an increase in depreciation expense due to our investment in digital and high-definition equipment and the new building constructed in Las Vegas, Nevada.
The decrease in selling and administrative expenses was primarily due to a decrease in payroll-related costs across all of our businesses, a decrease in advertising and promotion expenses at our publishing and broadcasting businesses, a decrease in depreciation expense and decreases due to various other cost reductions across all of our businesses. These expense decreases were partially offset by workforce reduction charges across all of our businesses, an increase in bad debt expense, an increase in legal fees, a gain on the sale of the Hartland, Wisconsin printing facility in 2007 and selling and administrative expenses related to our newly acquired television stations and publications.
We recorded $375.1 million non-cash impairment charges in 2008 for goodwill at our publishing and broadcasting reporting units and for eight television broadcast licenses and 26 radio broadcast licenses. We recorded a $0.4 million non-cash impairment charge for goodwill in 2007 at our direct marketing services business.
Our consolidated operating loss in 2008 was $322.7 million compared to operating earnings of $78.8 million 2007. The following table presents our operating earnings (loss) by segment for 2008 and 2007:
| 2008 | Percent of Total Operating Loss |
2007 | Percent of Total Operating Earnings |
||||||||||
| (dollars in millions) | |||||||||||||
| Publishing |
$ | (2.8 | ) | 0.9 | % | $ | 31.0 | 39.4 | % | ||||
| Broadcasting |
(322.7 | ) | 100.0 | 41.4 | 52.5 | ||||||||
| Printing services |
2.4 | (0.8 | ) | 5.9 | 7.5 | ||||||||
| Other |
0.4 | (0.1 | ) | 0.5 | 0.6 | ||||||||
| Total operating earnings (loss) |
$ | (322.7 | ) | 100.0 | % | $ | 78.8 | 100.0 | % | ||||
The decrease in total operating earnings was primarily due to the $375.1 million non-cash impairment charges for goodwill and broadcast licenses and the decrease in revenue in our publishing, broadcasting, printing services and direct marketing services businesses.
46
Table of Contents
Publishing
Revenue from publishing in 2008 was $242.0 million, a decrease of $24.1 million, or 9.1%, compared to $266.1 million in 2007. Operating loss from publishing in 2008 was $2.8 million compared to operating earnings of $31.0 million in 2007. We recorded a $16.7 million non-cash impairment charge for goodwill at our publishing reporting units in 2008.
The following table presents our publishing revenue by category and operating earnings (loss) for 2008 and 2007:
| 2008 | 2007 | Percent Change |
|||||||||||||||||||||
| Daily Newspaper |
Community Newspapers & Shoppers |
Total | Daily Newspaper |
Community Newspapers & Shoppers |
Total | ||||||||||||||||||
| (dollars in millions) | |||||||||||||||||||||||
| Advertising revenue: |
|||||||||||||||||||||||
| Retail |
$ | 83.6 | $ | 27.7 | $ | 111.3 | $ | 90.3 | $ | 29.3 | $ | 119.6 | (6.8 | ) | |||||||||
| Classified |
43.4 | 5.7 | 49.1 | 58.1 | 6.0 | 64.1 | (23.5 | ) | |||||||||||||||
| National |
7.6 | — | 7.6 | 9.2 | — | 9.2 | (18.1 | ) | |||||||||||||||
| Direct Marketing |
3.4 | — | 3.4 | 4.4 | — | 4.4 | (24.8 | ) | |||||||||||||||
| Other |
— | 0.4 | 0.4 | — | 0.4 | 0.4 | (0.5 | ) | |||||||||||||||
| Total advertising revenue |
138.0 | 33.8 | 171.8 | 162.0 | 35.7 | 197.7 | (13.1 | ) | |||||||||||||||
| Circulation revenue |
50.5 | 1.3 | 51.8 | 51.2 | 1.1 | 52.3 | (0.9 | ) | |||||||||||||||
| Other revenue |
14.9 | 3.5 | 18.4 | 12.2 | 3.9 | 16.1 | 14.4 | ||||||||||||||||
| Total revenue |
$ | 203.4 | $ | 38.6 | $ | 242.0 | $ | 225.4 | $ | 40.7 | $ | 266.1 | (9.1 | ) | |||||||||
| Goodwill impairment |
$ | 2.9 | $ | 13.8 | $ | 16.7 | $ | — | $ | — | $ | — | NA | ||||||||||
| Operating earnings (loss) |
$ | 10.4 | $ | (13.2 | ) | $ | (2.8 | ) | $ | 30.5 | $ | 0.5 | $ | 31.0 | NA | ||||||||
Advertising revenue in 2008 accounted for 71.0% of total publishing revenue compared to 74.3% in 2007.
In 2008, our daily newspaper discontinued publishing MKE, the free weekly publication aimed at young adults. The publication was launched in 2004. Advertising revenue peaked in 2006 and it had decreased consistently since then. The weak advertising climate, competition with other websites and publications and increasing costs prompted the decision.
Retail advertising revenue in 2008 was $111.3 million, a decrease of $8.3 million, or 6.8%, compared to $119.6 million in 2007. The $6.7 million decrease at our daily newspaper was primarily due to a decrease in ROP advertising in nearly all categories. The most significant decreases were in the automotive, home improvement, finance/insurance, furniture and furnishings, real estate and communications categories. Retail preprint advertising decreased primarily in the home improvement, furniture and furnishings and department store categories. MKE retail advertising decreased due to discontinuing the product in 2008. These decreases were partially offset by increases in interactive, specialty magazines, event marketing related to a special promotion with the Milwaukee Brewers and Market Place retail advertising. The $1.6 million decrease at our community newspapers and shoppers was primarily due to decreases in automotive and real estate advertising, partially offset by revenue from newly acquired publications in Northern Wisconsin and Florida.
Classified advertising revenue in 2008 was $49.1 million, a decrease of $15.0 million, or 23.5%, compared to $64.1 million in 2007. Decreases in ROP, MKE and Market Place classified advertising at our daily newspaper were partially offset by an increase in interactive classified advertising. The $15.0 million decrease in ROP, MKE and Market Place classified advertising revenue at our daily newspaper was primarily due to decreases in the following categories: employment advertising of $7.8 million, real estate advertising of $4.6 million and
47
Table of Contents
automotive advertising of $2.9 million and the discontinuation of the MKE product. Other classified advertising increased $0.3 million in 2008 compared to 2007. Employment advertising accounted for 38.5% of classified advertising revenue at the daily newspaper in 2008 compared to 42.2% in 2007. The $0.3 million decrease at our community newspapers and shoppers was primarily due to decreases in automotive, employment and real estate advertising, partially offset by revenue from newly acquired publications in Northern Wisconsin and Florida.
Interactive advertising revenue is reported in the various advertising revenue categories. Total retail and classified interactive advertising revenue at our publishing business was $14.9 million in 2008, an increase of $1.3 million, or 9.7%, compared to $13.6 million in 2007 primarily due to an increase in online sponsorship advertising and online classified advertising, including ancillary services from our Jobnoggin.com co-branded employment site with Monster®.
National advertising revenue in 2008 was $7.6 million, a decrease of $1.6 million, or 18.1%, compared to $9.2 million in 2007. The decrease was primarily due to a decrease in ROP advertising in the communications, dining and entertainment and airline and travel categories and a decrease in preprint advertising in the business services categories.
Direct marketing revenue, consisting of revenue from the sale of direct mail products of our daily newspaper, was $3.4 million in 2008, a decrease of $1.0 million, or 24.8%, compared to $4.4 million in 2007 primarily due to a decrease in direct mail products sold and a decrease in postage amounts billed to customers.
Other advertising revenue, consisting of revenue from company-sponsored event advertising at our community newspapers and shoppers, was $0.4 million in 2008 and 2007.
Circulation revenue in 2008 accounted for 21.4% of total publishing revenue compared to 19.6% in 2007. Circulation revenue of $51.8 million in 2008 decreased $0.5 million, or 0.9%, compared to $52.3 million in 2007 primarily due to decreases in average net paid circulation for the daily and Sunday editions, partially offset by an increase in the daily average rate per copy at our daily newspaper reflecting prices increases put into effect earlier in 2008.
Other revenue, which consists of revenue from promotional, distribution and commercial printing revenue at our daily newspaper and commercial printing at the printing plants for our community newspapers and shoppers, accounted for 7.6% of total publishing revenue in 2008 compared to 6.1% in 2007. Other revenue in 2008 was $18.4 million, an increase of $2.3 million, or 14.4%, compared to $16.1 million in 2007. The $2.7 million increase at our daily newspaper was primarily due to an increase in commercial printing revenue from new customers, the Chicago Reader, which was added in the fourth quarter of 2007, and La Raza, which was added in the second quarter of 2008. The Chicago Reader filed Chapter 11 bankruptcy in 2008 and was purchased by a hedge fund firm in a bankruptcy auction in late 2009. We recorded a $0.2 million reserve for our pre-bankruptcy accounts receivable and received payment in 2009. We continue to print this publication. Commercial printing revenue decreased $0.4 million at our community newspapers and shoppers primarily due to a decrease in the number of pages printed for existing customers.
In May 2008, our daily newspaper signed a three-year agreement and began printing La Raza, a Spanish language newspaper, for distribution in the greater Chicago, Illinois area.
Publishing operating loss in 2008 was $2.8 million compared to operating earnings of $31.0 million in 2007. Operating earnings decreased $20.1 million in 2008 at the daily newspaper primarily due to the impact of the decrease in classified and retail ROP advertising, workforce reduction charges of $4.5 million, a non-cash impairment charge for goodwill of $2.9 million, an increase in interactive online fees of $1.5 million due to the increase in interactive revenue, an increase in legal fees of $1.0 million due to an insurance settlement in 2007 and 2008 legal activity, and an increase in bad debt expense of $0.6 million. These operating earnings decreases were partially offset by an $8.4 million decrease in payroll-related costs, a $2.1 million decrease in defined
48
Table of Contents
benefit pension expense, web-width reduction costs of $0.5 million in 2007, a $0.5 million decrease in advertising expenses and various other cost reductions. Operating earnings decreased $13.7 million in 2008 at our community newspapers and shoppers primarily due to a $13.8 million non-cash impairment charge for goodwill, the operating earnings impact from the decrease in revenue and an increase in newsprint costs, partially offset by a $1.3 million decrease in payroll-related costs and $0.6 million in earnings from our newly acquired publications in Northern Wisconsin and Florida. Total newsprint and paper costs for our publishing businesses in 2008 were $26.6 million, a decrease of $0.1 million, or 0.4%, compared to $26.7 million in 2007 primarily due to a 12.4% decrease in newsprint consumption, partially offset by a 15.9% increase in average newsprint pricing per metric ton. Consumption of metric tonnes of newsprint in 2008 decreased primarily due to decreases in ROP advertising, average net paid circulation and a reduction in waste at our daily newspaper and a decrease in ROP advertising at our community newspapers and shoppers.
Broadcasting
Revenue from broadcasting in 2008 was $209.9 million, a decrease of $8.2 million, or 3.8%, compared to $218.1 million in 2007. The operating loss from broadcasting in 2008 was $322.7 million compared to operating earnings of $41.4 million in 2007. We recorded a $229.2 million non-cash impairment charge for goodwill at our broadcasting reporting unit and $129.2 million non-cash impairment charge for eight television and 26 radio broadcast licenses in 2008.
The following table presents our broadcasting revenue, non-cash goodwill and broadcast license non-cash impairment charges and operating earnings (loss) for 2008 and 2007:
| 2008 | 2007 | ||||||||||||||||||||||||||||||
| Television | Radio | Goodwill Impairment |
Total | Television | Radio | Goodwill Impairment |
Total | Percent Change |
|||||||||||||||||||||||
| (dollars in millions) | |||||||||||||||||||||||||||||||
| Revenue |
$ | 130.6 | $ | 79.3 | $ | 209.9 | $ | 134.0 | $ | 84.1 | $ | 218.1 | (3.8 | ) | |||||||||||||||||
| Broadcast license impairment |
$ | 77.9 | $ | 51.3 | $ | 129.2 | $ | — | $ | — | $ | — | NA | ||||||||||||||||||
| Operating earnings (loss) |
$ | (60.7 | ) | $ | (32.8 | ) | $ | (229.2 | ) | $ | (322.7 | ) | $ | 20.5 | $ | 20.9 | $ | — | $ | 41.4 | NA | ||||||||||
Revenue from our television stations in 2008 was $130.6 million, a decrease of $3.4 million, or 2.6%, compared to $134.0 million in 2007. The revenue decrease was primarily from our television markets of Fort Myers/Naples, Las Vegas, Tucson and Boise, partially offset by an increase in revenue in our Milwaukee, Lansing and Green Bay markets and our newly acquired stations. The decrease was due to a $10.6 million decrease in local advertising revenue and a $5.7 million decrease in national advertising revenue. These revenue decreases were partially offset by a $10.3 million increase in political and issue advertising revenue, which includes revenue credits for rebates we believe are due to certain political advertisers in 2008 and 2006 of $0.4 million and $0.6 million, respectively, a $2.3 million increase in Olympic advertising revenue at our NBC affiliates and a $0.4 million increase in other revenue. Developmental revenue decreased $0.1 million in 2008 compared to 2007 and interactive revenue increased $0.3 million in 2008 compared to 2007. Developmental revenue refers to non-transactional revenue that is not tied to ratings or sold on a cost per point basis. Both interactive and developmental revenue are reported in local advertising revenue.
The operating loss from our television stations in 2008 was $60.7 million compared to operating earnings of $20.5 million in 2007. The decrease in operating earnings was primarily due to a $77.9 million non-cash impairment charge for eight television broadcast licenses, $2.0 million in expenses related to our newly acquired television stations in 2008, an increase in depreciation expense due to our investment in digital and high-definition equipment and the new building constructed in Las Vegas, Nevada, an increase in legal fees, an increase in web-hosting and streaming fees and a workforce reduction charge of $0.1 million. These operating earnings decreases were partially offset by a decrease in payroll-related costs.
49
Table of Contents
Revenue from our radio stations in 2008 was $79.3 million, a decrease of $4.8 million, or 5.6%, compared to $84.1 million in 2007. Revenue decreased in all of our radio markets. The decrease was due to a $3.9 million decrease in local advertising revenue and a $1.2 million decrease in national advertising revenue. These revenue decreases were partially offset by a $0.3 million increase in political and issue advertising revenue, which includes revenue credits for rebates we believe are due to certain political advertisers, and a $0.1 million increase in other revenue. Developmental revenue decreased $0.1 million in 2008 compared to 2007. Interactive revenue increased $0.3 million in 2008 compared to 2007. Both developmental and interactive revenue are reported in local advertising revenue.
The operating loss from our radio stations in 2008 was $32.8 million compared to operating earnings of $20.9 million in 2007. The decrease in operating earnings was primarily due to a $51.3 million non-cash impairment charge for 26 radio broadcast licenses and the impact of the decrease in revenue, a workforce reduction charge of $0.4 million and an increase in sports’ rights fees. Partially offsetting the expense increases was a decrease in payroll-related costs, a decrease in legal fees, a loss on the sale of KOMJ-AM in Omaha, Nebraska in 2007 and a decrease in advertising and promotion expenses.
In 2008, our Milwaukee, Wisconsin radio station, WTMJ-AM, agreed to an extension of a radio broadcasting rights agreement with the Milwaukee Brewers baseball team.
Printing Services
Revenue from printing services in 2008 was $65.2 million, a decrease of $4.2 million, or 6.0%, compared to $69.4 million in 2007. Operating earnings from printing services in 2008 were $2.4 million, a decrease of $3.5 million, or 59.1%, compared to $5.9 million in 2007.
The decrease in printing services revenue was primarily due to a decrease in printing for original equipment manufacturers and computer related customers, partially offset by an increase in revenue from printing publications. Our revenue from Dell, which was $7.4 million in 2008, was significantly reduced in 2009 and we believe it will eventually end in 2010.
The decrease in printing services operating earnings was primarily due to the impact from the decrease in revenue, an increase in employee benefit costs, an increase in bad debt expense and a favorable adjustment from the termination of a sublease agreement in 2007, partially offset by a decrease in payroll-related costs and certain production costs.
Other
Other revenue in 2008 was $27.9 million, a decrease of $1.2 million, or 4.0%, compared to $29.1 million in 2007. Other operating earnings were $0.4 million in 2008, a decrease of $0.1 million, or 15.4%, compared to $0.5 million in 2007.
The following table presents our other revenue and operating earnings (loss) for 2008 and 2007:
| 2008 | 2007 | Percent Change |
|||||||||||||||||||||||
| Direct Marketing Services |
Corporate and Eliminations |
Total | Direct Marketing Services |
Corporate and Eliminations |
Total | ||||||||||||||||||||
| (dollars in millions) | |||||||||||||||||||||||||
| Revenue |
$ | 28.4 | $ | (0.5 | ) | $ | 27.9 | $ | 29.8 | $ | (0.7 | ) | $ | 29.1 | (4.0 | ) | |||||||||
| Operating earnings (loss) |
$ | (1.2 | ) | $ | 1.6 | $ | 0.4 | $ | (1.8 | ) | $ | 2.3 | $ | 0.5 | (15.4 | ) | |||||||||
50
Table of Contents
The decrease in other revenue in 2008 compared to 2007 was primarily due to a decrease in mailing services revenue and postage revenue, partially offset by an increase in offset and laser printing revenue at our direct marketing services business. Included in revenue and operating costs and expenses from our direct marketing services business is $16.3 million and $16.7 million of postage amounts billed to customers in 2008 and 2007, respectively.
The decrease in operating earnings was primarily due to the operating earnings impact of the decrease in revenue at our direct marketing services business and an increase in corporate payroll-related costs, partially offset by a decrease in payroll-related costs at our direct marketing services business.
Other Income and Expense and Taxes
Interest income was insignificant in 2008 and 2007. Interest expense was $8.2 million in 2008 compared to $9.2 million in 2007. The decrease is primarily due to a decrease in our weighted average interest rate partially offset by an increase in the average debt outstanding due to repurchases of our class A common stock and acquisitions of businesses. Amortization of deferred financing costs was $0.3 million in 2008 and 2007.
Our effective tax benefit rate from continuing operations was 32.1% in 2008 compared to an effective tax provision rate of 38.2% in 2007. The difference is primarily due to the impact of the non-cash impairment charges, a decrease in our liability for unrecognized tax benefits for positions taken in prior years and the settlement of certain state income tax audits.
Discontinued Operations
On February 26, 2007, Q-Comm Corporation acquired 100% of the stock of Norlight Telecommunications, Inc. (Norlight). On June 25, 2007, July 6, 2007 and August 2, 2007, we sold our Ohio publishing and printing operations, our Louisiana publishing operation and our New England publishing and printing operations, respectively. The operations of Norlight and the three regional publishing and printing operations of our community newspapers and shoppers business have been reflected as discontinued operations in our consolidated financial statements for all periods presented.
Gain from discontinued operations, net of income taxes, was $0.4 million in 2008 compared to $67.1 million in 2007. Income tax expense related to discontinued operations was $43.3 million in 2007.
In 2008, we recorded a gain on discontinued operations of $0.4 million for a reduction in the reserve related to a settlement between the Environmental Protection Agency and NorthStar Print Group, Inc.
We recorded a $64.0 million net gain on the sale of Norlight and the three regional publishing and printing operations of our community newspapers and shoppers business in 2007. We recorded $3.1 million net gain from the operating results of our discontinued operations in 2007.
Net Earnings (Loss)
Our net loss in 2008 was $224.4 million compared to net earnings of $110.1 million in 2007. The decrease was due to the $253.0 million after-tax non-cash impairment charges, the decrease in gain from discontinued operations in 2008 compared to 2007 and the decrease in operating earnings from continuing operations for the reasons described above.
Diluted Earnings (Loss) per Share for Class A and B Common Stock
Diluted loss per share for class A and B common stock from continuing operations was $4.37 in 2008 compared to diluted earnings per share of $0.65 in 2007. Diluted earnings per share from discontinued operations for class A and B common stock were $0.01 in 2008 compared to $1.00 in 2007. Diluted net loss per share for class A and B common stock was $4.36 in 2008 compared to diluted earnings per share of $1.65 in 2007.
51
Table of Contents
Liquidity and Capital Resources
Cash balances were $3.4 million at December 27, 2009. We believe our expected cash flows from operations and borrowings available under our credit facility will meet our needs for the next twelve months.
We have an unsecured revolving credit facility that expires on June 2, 2011. The interest rate on borrowings is either LIBOR plus a margin that ranges from 37.5 basis points to 87.5 basis points, depending on our leverage, or the base rate, which equals the higher of the prime rate set by U.S. Bank, N.A. or the Federal Funds Rate plus 100 basis points. At December 27, 2009 and December 28, 2008, we had borrowings of $151.4 million and $215.1 million, respectively, under the facility at a weighted average rate of 1.00% and 2.10%, respectively. Cash provided by operating activities was used primarily to decrease our borrowings during 2009. Fees in connection with the facility of $1.7 million are being amortized over the term of the facility using the straight-line method. The facility includes the following two financial covenants, which remain constant over the term of the agreement:
| • | A consolidated funded debt ratio of not greater than 4-to-1, as determined for the four fiscal quarter period preceding the date of determination. This ratio compares, for any period, our funded debt to our earnings before interest, taxes, depreciation and amortization, as adjusted for non-operational impairment charges recorded as a result of applying the FASB’s guidance for impairment testing for goodwill and other intangible assets not subject to amortization. As of December 27, 2009, our consolidated funded debt ratio was 2.65-to-1, resulting in a current maximum borrowing capacity of $228.9 million. Our future borrowing capacity is subject to change due to changes in our future operating results. |
| • | An interest coverage ratio of not less than 3-to-1, as determined for the four fiscal quarter period preceding the date of determination. This ratio compares, for any period, our earnings before interest, taxes, depreciation and amortization, as adjusted for non-operational impairment charges recorded as a result of applying the FASB’s guidance for impairment testing for goodwill and other intangible assets not subject to amortization to our interest expense. As of December 27, 2009, our interest coverage ratio was 20.25–to-1. |
Although our unsecured revolving credit facility is not up for renewal until June 2, 2011, we are beginning preliminary discussions with our relationship banks to explore our options, including optimal timing, particularly given the current conditions in the credit markets. We are evaluating our future credit needs and if there is an opportunity to exchange a portion of our expected funding requirements for a fixed-term amount at a competitive fixed interest rate prior to the end of our agreement, we will consider it.
We define adjusted EBITDA as net earnings (loss) excluding gain from discontinued operations, net, provision (benefit) for income taxes, total other expense, net (which is entirely comprised of interest income and expense), depreciation and amortization and, if any, non-cash impairment charges. This calculation of adjusted EBITDA, as defined in our credit facility, is used in our two financial covenants. Management primarily uses adjusted EBITDA to monitor our borrowing capacity, a key component to our overall liquidity. Management also uses adjusted EBITDA, among other things, to evaluate our operating performance compared to our operating plans and/or prior years and its impact on our borrowing capacity and to value prospective acquisitions. We believe the presentation of this measure is relevant and useful for investors because it allows investors to view performance in a manner similar to the method used by management and our lenders, helps to improve their ability to understand our operating performance and our borrowing capacity and makes it easier to compare our results with other companies that have different financing and capital structures or tax rates. Adjusted EBITDA is also a primary measure used externally by our investors and our peers in our industry for purposes of valuation and comparing our operating performance to other companies in the industry. Adjusted EBITDA is not a measure of performance or liquidity calculated in accordance with accounting principles generally accepted in the United States. Adjusted EBITDA should not be considered in isolation of, or as a substitute for, net earnings as an indicator of operating performance or cash flows from operating activities as a measure of liquidity. Adjusted EBITDA, as we calculate it, may not be comparable to EBITDA measures reported by other companies.
52
Table of Contents
The following table presents a reconciliation of our consolidated net earnings to consolidated adjusted EBITDA for 2009, 2008 and 2007:
| 2009 | 2008 | 2007 | |||||||||
| (dollars in millions) | |||||||||||
| Net earnings (loss) |
$ | 4.3 | $ | (224.4 | ) | $ | 110.1 | ||||
| Earnings from discontinued operations, net |
— | (0.4 | ) | (67.1 | ) | ||||||
| Provision (benefit) for income taxes |
1.4 | (106.0 | ) | 26.6 | |||||||
| Total other expense, net |
2.8 | 8.2 | 9.2 | ||||||||
| Depreciation |
26.6 | 27.4 | 27.4 | ||||||||
| Amortization |
2.0 | 1.9 | 2.0 | ||||||||
| Goodwill and Broadcast license impairment |
20.1 | 375.1 | — | ||||||||
| Adjusted EBITDA |
$ | 57.2 | $ | 81.8 | $ | 108.2 | |||||
We expect to be able to continue to pay down debt over the next 12 months and to stay within our debt covenants.
Our ability to remain in compliance with these financial covenants may be impacted by a number of factors, including our ability to continue to generate sufficient revenues and cash flows, as well as interest rates and other risks and uncertainties set forth in Item 1A. “Risk Factors.” If it is determined we are not in compliance with these financial covenants, the lenders in our credit facility syndicate will be entitled to take certain actions, including acceleration of all amounts due under the facility. If actual operating and cash flow results over the next 12 months are lower than expected, the margins by which we will comply with the covenants will decrease. In such case, we may seek to amend or replace our current credit facility with one or more capital sources on appropriate terms. If we were unable to remain in compliance with these covenants or to amend or replace our current facility on appropriate terms, we could face increased pressure to reduce or delay capital expenditures, dispose of assets or operations, further reduce the size of our workforce or take other steps to revise our capital structure or our business operations. We cannot assure you that we will have the ability to take any of these actions or that these actions would be successful.
Given the difficult economic environment, one or more of the lenders in our credit facility syndicate could fail or be unable to fund future draws thereunder or take other positions adverse to us. In such an event, our liquidity could be severely constrained with an adverse impact on our ability to operate our businesses and we may be forced to take the actions described above. We continue to monitor the financial status of our current lenders and compliance with our credit agreement terms and are working on possible strategies in the event one or more of our lenders is unable or unwilling to fund future demands.
We have $2.5 million of standby letters of credit for business insurance purposes.
In February 2009, we suspended our matching contribution to our 401(k) plan through the remainder of 2009. In March 2009, our board of directors approved an amendment to our 401(k) plan to suspend the annual employer contribution for all active employees for 18 months beginning July 1, 2009. In April 2009, a 6% employee-wage reduction program was initiated for most full-time employees for the remainder of 2009. Collectively, these actions saved $3.0 million in cash, net of taxes, in 2009. These actions, along with our workforce reduction initiatives, were taken in order to offset decreases in revenue and to help maintain financial flexibility in this difficult economic environment.
53
Table of Contents
In 2008 and 2009, we made significant progress to align our costs with the changing nature of our businesses. We reduced our full-time employees by 10.6% in 2008 and by another 17.8% in 2009. The costs associated with workforce reductions during the years ended December 27, 2009 and December 28, 2008 were as follows:
| Balance at December 28, 2008 |
Charge for Separation Benefits |
Payments for Separation Benefits |
Balance at December 27, 2009 | ||||||||||
| (dollars in millions) | |||||||||||||
| Publishing |
|||||||||||||
| Daily newspaper |
$ | 0.6 | $ | 5.2 | $ | (4.3 | ) | $ | 1.5 | ||||
| Community newspapers and shoppers |
— | 0.2 | (0.2 | ) | — | ||||||||
| Total publishing |
0.6 | 5.4 | (4.5 | ) | 1.5 | ||||||||
| Broadcasting |
— | 0.3 | (0.2 | ) | 0.1 | ||||||||
| Printing services |
— | 0.5 | (0.5 | ) | — | ||||||||
| Direct marketing services |
0.2 | 0.2 | (0.3 | ) | 0.1 | ||||||||
| Total |
$ | 0.8 | $ | 6.4 | $ | (5.5 | ) | $ | 1.7 | ||||
| Balance at December 30, 2007 |
Charge for Separation Benefits |
Payments for Separation Benefits |
Balance at December 28, 2008 | ||||||||||
| (dollars in millions) | |||||||||||||
| Publishing |
|||||||||||||
| Daily newspaper |
$ | 0.3 | $ | 4.5 | $ | (4.2 | ) | $ | 0.6 | ||||
| Community newspapers and shoppers |
— | 0.1 | (0.1 | ) | — | ||||||||
| Total publishing |
0.3 | 4.6 | (4.3 | ) | 0.6 | ||||||||
| Broadcasting |
— | 0.4 | (0.4 | ) | — | ||||||||
| Printing services |
— | 0.1 | (0.1 | ) | — | ||||||||
| Direct marketing services |
— | 0.2 | — | 0.2 | |||||||||
| Total |
$ | 0.3 | $ | 5.3 | $ | (4.8 | ) | $ | 0.8 | ||||
Dividends
Our board of directors made a decision to reduce our first quarter 2009 dividend on our class A and class B shares to $0.02 per share from $0.08 per shares in each quarter of 2008. The quarterly dividend on our class C shares remained at its historical level for the first quarter of 2009. In April 2009, our board of directors suspended dividends on our class A and class B shares given the challenging economic environment. Our board of directors also suspended the payment of the cumulative dividend on our class C shares. The accumulated class C dividend of approximately $0.14 per share must be paid prior to the payment of any future dividends on our class A and class B shares. As of the end of 2009, we have $1.4 million accrued for class C dividends. Our board of directors consistently reviews our dividend payment policy, as well as our ability to pay cash dividends, at each quarterly board of directors meeting.
Acquisitions and Sale
2009
On April 23, 2009, Journal Broadcast Group, Inc. and Journal Broadcast Corporation, our broadcasting businesses, completed the asset purchase of KNIN-TV from Banks Boise, Inc. for $6.6 million. KNIN-TV is the CW Network affiliate serving the Boise, Idaho market. We also own KIVI-TV, the ABC affiliate, and four radio stations in Boise, Idaho. The purchase of KNIN-TV builds our cross-media business in Boise, Idaho to better serve advertisers and viewers, builds a stronger community presence in Boise, Idaho, and enhances our margin with multiple media properties.
54
Table of Contents
On September 25, 2009, Journal Broadcast Group, Inc. and Journal Broadcast Corporation, our broadcasting businesses, completed the asset sale of KGEM-AM and KCID-AM in Boise, Idaho to Salt & Light Radio, Inc., an Idaho non-profit corporation, for $1.0 million. We recorded a $0.3 million gain on the sale of these assets.
2008
On January 9, 2008, Journal Community Publishing Group, Inc., our community newspapers and shoppers business, acquired the Iola Herald and Manawa Advocate in Waupaca County in Wisconsin. These are weekly paid publications. On March 19, 2008, Journal Community Publishing group, Inc. acquired two shoppers, the Clintonville Shopper’s Guide and the Wittenberg Northerner Shopping News, in Waupaca County, Wisconsin. The total cash purchase price for these publications was $1.6 million. The acquisitions deepen our media offerings and extend our reach in north central Wisconsin.
On January 28, 2008, Journal Broadcast Corporation and Journal Broadcast Group, Inc., our broadcasting businesses, completed the asset purchase of My Network affiliate KPSE-LP, Channel 50, in Palm Springs, California from Mirage Media LLC for $4.7 million. The acquisition of KPSE allows us to better serve advertisers and viewers in the Coachella Valley and builds a stronger presence in Palm Springs and the surrounding area.
On July 22, 2008, Journal Broadcast Corporation and Journal Broadcast Group, Inc., our broadcasting businesses, completed the asset purchase of CW Network affiliate, KWBA-TV, in Sierra Vista, Arizona, from Cascade Broadcasting Group, LLC and Tucson Communications, L.L.C. for $12.0 million. KWBA-TV serves the Tucson, Arizona market. We believe owning cross-platform businesses in this growth market will help us increase our local news focus and better serve our viewers and listeners.
On October 6, 2008, Journal Community Publishing Group, Inc., our community newspapers and shoppers business of our publishing segment, purchased the assets of Waupaca Publishing Company for $7.0 million. We paid $7.0 million and retained from the purchase price $0.1 million for environmental related expenses, which we have agreed to pay on behalf of the seller. The seller remains liable for all obligations relating to the conditions of the property purchased. The purchase consists of several Waupaca-area weekly paid newspapers including the Waupaca County Post, The Chronicle (Weyauwega/Fremont), Wisconsin State Farmer and the Picture Post. It also includes the monthly paid niche publications Wisconsin Horsemen’s News, and Silent Sports magazine. The purchase includes additional print publications and associated internet websites as well as Waupaca Publishing Company’s commercial printing business and the related real estate and buildings.
Cash Flow
Continuing Operations
In 2009, our primary intention for the use of our cash was to reduce our debt. We accomplished this, in part, by reducing our cash dividends paid to shareholders and reducing our capital expenditures. We reduced our debt, cash dividends and capital expenditures by $63.7 million, $17.0 million and $13.6 million in 2009 compared to 2008.
Cash provided by operating activities was $76.8 million in 2009 compared to $71.8 million in 2008. The increase was primarily due to cash provided by changes in working capital and an $8.7 million refund of an income and franchise tax audit payment due to a settlement with the WDR, partially offset by the decrease in net earnings.
Cash used for investing activities was $12.6 million in 2009 compared to $47.4 million in 2008. Capital expenditures were $8.6 million in 2009 compared to $22.2 million in 2008. Our capital expenditures at our daily newspaper in 2009 related primarily to building improvements and software upgrades for production equipment. Our capital expenditures in our broadcasting segment in 2009 related primarily to technology upgrades, including
55
Table of Contents
investments in television and radio digital infrastructure and building improvements. We believe these expenditures will help us to better serve our advertisers and viewers and will help to facilitate our cost control initiatives. In 2010, our capital expenditures are expected to increase slightly over the amount of capital expenditures in 2009. During 2009, we acquired KNIN-TV in Boise, Idaho for $6.6 million and we received $0.5 million for the sale of KGEM-AM and KCID-AM. During 2008, we acquired two television stations for $16.7 million and several publications in Northern Wisconsin and Florida for $8.6 million. In 2009, we received $2.0 million in insurance proceeds for our tower replacement in Wichita, Kansas that was destroyed in an ice storm. We currently expect to receive an additional $0.5 million in insurance proceeds in 2010.
Cash used for financing activities was $64.9 million in 2009 compared to $26.7 million in 2008. Borrowings under our credit facility in 2009 were $131.7 million and we made payments of $195.4 million, reflecting a $63.7 million decrease in our debt outstanding compared to borrowings of $209.5 million and payments of $173.3 million in 2008. The increase in borrowings in 2008 was used to finance the repurchase our class A common stock for $44.9 million. We paid cash dividends of $1.5 million and $18.5 million in 2009 and 2008, respectively.
Discontinued Operations
Cash used for discontinued operations was zero in 2009 compared to $0.1 million in 2008.
Contractual Obligations
Our contractual obligations as of December 27, 2009 are summarized below.
| Payments due by Period | |||||||||||||||
| Total | Less than 1 year |
1-3 years |
3-5 years |
More than 5 years | |||||||||||
| (dollars in millions) | |||||||||||||||
| Contractual obligations |
|||||||||||||||
| Long-term notes payable to banks(1) |
$ | 155.0 | $ | 1.5 | $ | 153.5 | $ | — | $ | — | |||||
| Pension and other postretirement benefits(2) |
89.6 | 1.6 | 13.4 | 30.6 | 44.0 | ||||||||||
| Operating leases |
15.8 | 4.5 | 6.0 | 2.1 | 3.2 | ||||||||||
| Purchase commitments |
20.9 | 7.5 | 10.6 | 2.0 | 0.8 | ||||||||||
| Syndicated liabilities |
16.2 | 9.9 | 4.9 | 1.4 | — | ||||||||||
| Other liabilities(3) |
6.4 | 2.8 | 1.7 | 0.1 | 1.8 | ||||||||||
| Total |
$ | 303.9 | $ | 27.8 | $ | 190.1 | $ | 36.2 | $ | 49.8 | |||||
| (1) | Includes the associated interest calculated on our borrowings of $151.4 million outstanding as of December 27, 2009 at a weighted average rate of 1.00%. |
| (2) | For the pension and other postretirement benefits, payments included in the table have been actuarially estimated over a ten-year period. These payments are expected to be funded directly from company assets through 2019. While benefit payments under these benefit plans are expected to continue beyond 2019, we believe that an estimate beyond this period is unreasonable. |
| (3) | Includes accrued dividends payable on class C common stock of $1.4 million, which we currently estimate will be paid in more than five years. |
Our unsecured revolving facility expires on June 2, 2011. As of December 27, 2009, we had borrowings outstanding of $151.4 million under the facility.
Based on actuarial estimates, we expect to make contributions of $70.0 million to the qualified pension plan over a ten-year period. If actual results differ from the estimates used, the amount of contributions to the qualified pension plan would likely change. As of December 27, 2009, we expect to make payments over a ten-year period for the non-qualified pension plan and other postretirement benefit plan of $5.3 million and $14.4 million, respectively.
56
Table of Contents
We lease office space, certain broadcasting facilities, distribution centers, buildings used for printing plants and equipment under both short-term and long-term leases accounted for as operating leases. Some of the lease agreements contain renewal options and rental escalation clauses, as well as provisions for the payment of utilities, maintenance and taxes.
We have several purchase commitments as of December 27, 2009. We have purchase commitments related to printing equipment and truck leases for our publishing business of approximately $0.3 million. For our broadcasting business we have purchase commitments related to a sales order entry and billing system for $5.1 million, audience research services for $3.7 million, telephone and data services for $1.3 million, and a support agreement for a news production system for $0.2 million.
Other liabilities consist primarily of obligations for severance, unrecognized tax benefits, accrued dividends payable on our class C common stock, capital leases, and deferred compensation.
As of December 27, 2009, our expected payment for significant contractual obligations includes approximately $1.4 million for our liability for unrecognized tax benefits and related interest income/expense and penalties. We have estimated that our liability for unrecognized tax benefits will be settled as follows: $0.6 million will occur in less than one year and $0.8 million will occur in one to three years.
Off-Balance Sheet Arrangements
We do not engage in off-balance sheet transactions, arrangements, obligations (including contingent obligations), and other relationships with unconsolidated entities or other persons that may have a material current or future effect on our financial condition, results of operations, liquidity, capital expenditures, capital resources, or significant components of revenues or expenses. We do not rely on off-balance sheet arrangements for liquidity, capital resources, market risk support, credit risk support or other benefits.
Critical Accounting Policies
Our management’s discussion and analysis of financial condition and results of operations are based upon our consolidated financial statements, which have been prepared in accordance with accounting principles generally accepted in the United States. The preparation of these financial statements requires us to make estimates and judgments that affect the reported amounts of assets, liabilities, revenues and expenses, and related footnote disclosures. On an on-going basis, we evaluate our estimates, including those related to doubtful accounts, property and equipment, intangible assets, income taxes, litigation, and pension and other postretirement benefits. We base our estimates on historical experience and on various other assumptions that are believed to be reasonable under the circumstances, the results of which form the basis for making judgments about the carrying values of assets and liabilities that are not readily apparent from other sources. We do not believe our past results have differed materially from these estimates, however, we cannot predict how actual results may differ from these estimates in the future.
We believe the following critical accounting policies affect our more significant judgments and estimates used in the preparation of our consolidated financial statements.
Allowance for doubtful accounts
We evaluate the collectability of our accounts receivable based on a combination of factors. We specifically review historical write-off activity by market, large customer concentrations, customer creditworthiness and changes in our customer payment patterns and terms when evaluating the adequacy of the allowance for doubtful accounts. In circumstances where we are aware of a specific customer’s inability to meet its financial obligations to us (such as bankruptcy filings, credit history, etc.), we record a specific reserve for bad debts against amounts due us to reduce the net recognized receivable to the amount we reasonably believe will be collected. For all
57
Table of Contents
other customers, we recognize reserves for bad debts based on past loss history, the length of time the receivables are past due and the current business environment. If our evaluations of the collectability of our accounts receivable differ from actual results, increases or decreases in bad debt expense and allowances may be required.
Property and equipment and definite-lived intangibles
We assign useful lives for our property and equipment and definite-lived intangibles based on our estimate of the amount of time that we will use those assets and we have selected the straight-line method to depreciate our property and equipment and definite-lived intangibles. A change in the estimated useful lives or the depreciation or amortization method used could have a material impact upon our results of operations.
Accounting standards require that, if the sum of the future cash flows expected to result from an asset or group of assets, undiscounted and without interest charges, is less than the carrying amount of the asset or group of assets, an asset impairment must be recognized in the financial statements. An evaluation of impairment of our property and equipment and definite-lived intangibles was performed in 2009 and we recorded a charge of $0.7 million for the impairment of certain equipment and a building. The estimated future cash flows related to an asset or group of assets is highly susceptible to change because we must make assumptions about future revenue and the related cost of sales. Changes in our assumptions could require us to recognize a loss for asset impairment in the future.
Impairment of goodwill and indefinite-lived intangibles
Goodwill and broadcast licenses accounted for 19.2% and 19.4% of total assets as of December 27, 2009 and December 28, 2008, respectively. The interim and annual impairment tests for goodwill and broadcast licenses in accordance with the FASB’s guidance for goodwill and intangible assets require us to make certain assumptions in determining fair value, including assumptions about the cash flow growth rates of our businesses. Additionally, the fair values are significantly impacted by factors including competitive industry valuations and long-term interest rates that exist at the time the annual impairment tests are performed. Accordingly, we may incur additional impairment charges in future periods to the extent we do not achieve our expected cash flow growth rates, and to the extent that market values and long-term interest rates in general decrease and increase, respectively.
For purposes of testing the carrying values of goodwill related to our reporting units, we determined fair value by using an income and a market valuation approach. The income approach uses expected cash flows for each reporting unit. The cash flows were then discounted for risk and time value. In addition, the present value of the projected residual value was estimated and added to the present value of the cash flows. The market approach was based on price multiples of publicly traded stocks of comparable companies to derive fair value. Each approach was weighted equally to determine a fair value estimate of each reporting unit.
We based our fair value estimates, in large measure, on projected financial information, which are unobservable level 3 inputs per the FASB’s fair value hierarchy and for which we believe to be reasonable. However, actual future results may differ from those projections, and those differences may be material. The valuation methodology used to estimate the fair value of our total company and our reporting units requires inputs and assumptions (i.e. market growth, operating profit margins, and discount rates) that reflect current market conditions as well as management judgment. The current economic downturn has negatively impacted many of those inputs and assumptions. If expected cash flows of our community newspapers and shoppers reporting unit continues to deteriorate and management concludes expected cash flows will not improve within a reasonable period of time, we may be required to recognize a goodwill impairment charge in future periods, which could have an adverse impact on our financial condition and results of operations.
For broadcast licenses at individual television and radio stations, we used an income approach to estimate fair value. The fair value estimates of our broadcast licenses contain significant assumptions incorporating
58
Table of Contents
variables that are based on past experiences and judgments about future performance using industry normalized information for an average station within a market with the type of signal that each subject station produces. These variables include, but are not limited to: the forecasted growth rate of each market, (including market population, household income and retail sales), market share and profit margins of an average station within a market, estimated capital expenditures and start-up costs, risk-adjusted discount rate, likely media competition within the market and expected growth rates into perpetuity to estimate terminal values. Adverse changes in significant assumptions such as an increase in discount rates or a decrease in projected market revenues could result in additional non-cash impairment charges on our broadcast licenses in future periods, which could have a material impact on our financial condition and results of operations.
Accrued income taxes
The Internal Revenue Service (IRS) and various state Departments of Revenue routinely examine our federal and state tax returns. We believe our tax positions comply with applicable tax law, and we would vigorously defend these positions if challenged. The final disposition of any positions challenged by the IRS or state Departments of Revenue could require us to make additional tax payments or have an impact on our effective tax rate. Nonetheless, we believe that we have adequately reserved for any foreseeable payments related to such matters and consequently do not anticipate any material earnings impact from the ultimate resolution of such matters. As of December 27, 2009 and December 28, 2008, our liabilities for unrecognized tax benefits and related interest and penalties were $1.4 million and $3.7 million, respectively.
We deduct broadcast licenses and tax-deductible goodwill over a period of 15 years from the date of acquisition. The non-cash goodwill and broadcast license impairment charges recorded during 2008 and the non-cash broadcast license impairment charge recorded in 2009 are not currently deductible for income tax purposes and have caused us to recognize deferred tax assets. We believe it is more likely than not that we will realize a tax benefit for our of our deferred tax assets and we believe that they will be utilized to offset future taxable income over the next 20 years in accordance with current income tax law. In the future, we may be required to record a valuation allowance against our deferred tax assets if we have future operating losses or reductions in our expected future profitability which would cause us to believe we would be unable to utilize them.
Accrued litigation
We are subject to various legal actions, administrative proceedings and claims. When necessary, we record a liability for an estimate of the probable costs for the resolution of such claims. The estimate would be developed in consultation with counsel and would be based upon an analysis of potential results, assuming a combination of litigation and settlement strategies. We believe that such unresolved legal actions and claims would not materially affect our results of operations, financial position or cash flows.
Employee benefits
We are self-insured for a majority of our employee related health and disability benefits and workers compensation claims. Third party administrators are used to process all claims. Liabilities for unpaid claims are based on our historical claims experience. Liabilities for workers compensation claims are developed from actuarial valuations. Actual amounts could vary significantly from such estimates which would require us to record additional expense in the future.
There are certain assumptions that have a significant effect on our obligations, such as:
| • | the discount rate–used to arrive at the net present value of the obligations and expense; |
| • | the return on assets–used to estimate the growth in invested asset value available to satisfy certain obligations; |
59
Table of Contents
| • | the salary increases–used to calculate the impact future pay increases will have on pension obligations; and |
| • | the employee turnover statistics–used to estimate the number of employees to be paid pension benefits. |
The assumptions used in accounting for pension benefits and other postretirement benefits for 2009 and 2008 are:
| Pension Benefits | Other Postretirement Benefits |
|||||||||||
| 2009 | 2008 | 2009 | 2008 | |||||||||
| Discount rate for expense |
6.50 | % | 6.60 | % | 6.15 | % | 6.50 | % | ||||
| Discount rate for obligations |
5.70 | 6.50 | 5.50 | 6.15 | ||||||||
| Rate of compensation increases for expense |
4.80 | 4.80 | — | — | ||||||||
| Rate of compensation increases for obligations |
4.80 | 4.80 | — | — | ||||||||
| Expected return on plan assets |
8.50 | 8.50 | — | — | ||||||||
For our pension plans, as of December 27, 2009, a one percent increase or decrease in the discount rate would have the following effects:
| 1% Increase |
1% Decrease | ||||||
| Effect on total of service and interest cost components in 2009 |
$ | (0.8 | ) | $ | 2.0 | ||
| Effect on pension benefit obligation as of December 27, 2009 |
$ | (16.1 | ) | $ | 19.7 | ||
To determine the discount rate assumptions for the pension and the other postretirement benefit plans, we studied our plans’ specific discount rate by matching our projected benefit payments to a yield curve developed from high grade corporate bonds. The results of those studies were used as the benchmark to determine the discount rate assumptions.
We study historical markets to determine the long-term rate of return assumption for pension plan assets. We preserved the long-term historical relationships between equities and fixed-income securities consistent with the widely accepted capital market principle that assets with higher volatility generate a greater return over the long run. We evaluate current market factors such as inflation and interest rates before we determine long-term capital market assumptions. We review peer data and historical returns to check for reasonability and appropriateness.
We make other assumptions that affect the accounting for pension benefits, such as the rate of compensation increase. Changes in these assumptions affect the benefit obligations and the service and interest cost components of the pension plan and the other postretirement plan and the required funding of the pension plan. We review these assumptions on an annual basis.
The discount rate and medical cost inflation assumptions could have a significant effect on our other postretirement benefits obligations. The discount rate is used to arrive at the net present value of the obligation. The health care cost trend rate is used to calculate the impact future medical costs would have on postretirement obligations. A one percent increase or decrease in the assumed health care cost trend rate would have the following effects:
| 1% Increase |
1% Decrease | ||||
| Effect on total of service and interest cost components in 2009 |
less than $ | 0.1 | less than ($ 0.1) | ||
| Effect on postretirement benefit obligation as of December 27, 2009 |
$0.3 | $(0.3) | |||
60
Table of Contents
New Accounting Standards
Future Adoptions
In January 2010, the FASB issued amended guidance for fair value measurements and disclosures. The guidance requires new disclosures about the activity in Level 3 fair value measurements and the transfers between Levels 1, 2, and 3. This guidance is effective for interim and annual periods beginning after December 15, 2009. The guidance also clarifies existing disclosures about the different classes of assets and liabilities measured at fair value and the valuation techniques and inputs used. This guidance is effective for fiscal years beginning after December 15, 2010 and for interim periods within those fiscal years. We do not believe the effect of adopting this guidance will have a material impact on our consolidated financial statements.
In December 2009, the FASB issued amended guidance for consolidating variable interest entities (VIEs). The guidance replaces the quantitative-based risks and rewards calculation for determining which reporting entity, if any, has a controlling financial interest in a VIE with an approach focused on identifying which reporting entity has the power to direct the activities of a VIE that most significantly impact the entity’s economic performance and (1) the obligation to absorb losses of the entity or (2) the right to receive benefits from the entity. The amended guidance also requires additional disclosures about a reporting entity’s involvement in VIEs. The guidance is effective for fiscal years beginning after November 15, 2009 and for interim periods within that fiscal year. In June 2009, the FASB issued amended standards for determining whether to consolidate a variable interest entity. The guidance amends the evaluation criteria to identify the primary beneficiary of a variable interest entity and requires ongoing reassessment of whether an enterprise is the primary beneficiary of the variable interest entity. The guidance is effective for fiscal years beginning after November 15, 2009 and interim periods within those fiscal years. We are currently evaluating the impact of adopting this guidance on our consolidated financial statements.
Current Adoptions
In August 2009, the FASB issued amended guidance for fair value measurements and disclosures. The guidance provides clarification for the circumstances when a quoted price in an active market for the identical liability is not available, a reporting entity is required to measure fair value using a valuation technique that uses either the quoted price of the identical liability when traded as an asset or quoted prices for similar liabilities or similar liabilities when traded as assets. This guidance was effective upon issuance. The adoption of this guidance did not have a material impact on our consolidated financial statements.
In May 2009, the FASB issued guidance on the accounting for and disclosure of events that occur after the balance sheet date but before financial statements are issued or are available to be issued. Specifically, this guidance provides:
| • | The period after the balance sheet date during which management of a reporting entity should evaluate events or transactions that may occur for potential recognition or disclosure in the financial statements; |
| • | The circumstance under which an entity should recognize events or transactions occurring after the balance sheet date in its financial statements; and |
| • | The disclosures that an entity should make about events or transactions that occurred after the balance sheet date. |
This guidance is effective for interim or annual periods ending after June 15, 2009, and shall be applied prospectively. We adopted this guidance in the second quarter of 2009. The adoption of this guidance did not have a material impact on our consolidated financial statements.
In April 2009, the FASB issued amended guidance on the disclosures about fair value of financial instruments in interim financial information. Under this amended guidance, an entity shall disclose in the body or
61
Table of Contents
in the accompanying notes of its summarized financial information for interim reporting periods and in its financial statements for annual reporting periods the fair value of all financial instruments for which it is practicable to estimate that value, whether recognized or not recognized in the statement of financial position. This amended guidance was effective for interim periods ending after June 15, 2009. We adopted this amended guidance in the second quarter of 2009. The adoption of this amended guidance did not have a material impact on our consolidated financial statements.
In December 2008, the FASB amended the existing guidance on an employers’ disclosures about plan assets of a defined benefit pension or other postretirement plan. The guidance is effective for fiscal years ending after December 15, 2009. Upon initial application, the guidance is not required for earlier periods that are presented for comparative purposes. We adopted this guidance in the fourth quarter of 2009. The adoption of this guidance did not have a material impact on our consolidated financial statements.
In February 2008, the FASB issued guidance which delayed the effective date of the guidance for fair value measurements for all nonfinancial assets and liabilities, except those that are recognized or disclosed at fair value in the financial statements on a recurring basis (at least annually) to fiscal years beginning after November 15, 2008. We adopted this guidance in the first quarter of 2009. The adoption of this guidance did not have a material impact on our consolidated financial statements.
In December 2007, the FASB issued amended guidance for accounting for business combinations. This amended guidance requires that an acquiring entity recognize all the assets acquired and liabilities assumed in a transaction at the acquisition date fair value with limited exceptions. This guidance changed the accounting treatment for acquisition costs, non-controlling interests, contingent liabilities, in-process research and development, restructuring costs, and income taxes. In addition, it also requires a substantial number of new disclosure requirements. This guidance applies to business combinations for which the acquisition date is on or after the beginning of the first annual reporting period beginning on or after December 15, 2008. We adopted this guidance in the first quarter of 2009. The adoption of this guidance did not have a material impact on our consolidated financial statements.
Effect of Inflation
Our results of operations and financial condition have not been significantly affected by general inflation. We have reduced the effects of rising costs through improvements in productivity, cost containment programs and, where the competitive environment permits, increased selling prices. However, changes in newsprint prices could have an adverse impact on costs, which we may not be able to offset fully in our pricing or cost containment programs.
62
Table of Contents
| ITEM 7A. | QUANTITATIVE AND QUALITATIVE DISCLOSURES ABOUT MARKET RISK |
We are exposed to market risk stemming from changes in interest rates on our long-term notes payable to banks, which are borrowings under our unsecured revolving credit facility, and in prices for newsprint. Changes in these factors could cause fluctuations in our net earnings and cash flows. Interest rates on our long-term notes payable to banks are variable. The interest rate on our revolving credit facility is either at LIBOR plus a margin that ranges from 37.5 basis points to 87.5 basis points, depending on our leverage, or the Base Rate, which equals the higher of the prime rate set by U.S. Bank, N.A. or the Federal Funds Rate plus 100 basis points. Average interest rates on borrowings under our revolving credit facility ranged from 1.23% at the beginning of 2009 to 1.00% at the end of 2009. If interest rates had been 100 basis points higher, our annual interest expense would have increased $1.9 million, assuming comparable borrowing levels. We have not entered into derivative instruments to manage our exposure to interest rate risk.
Price fluctuations for newsprint can have a significant effect on our results of operations. The average net price per ton was $581 in 2009. Based on the consumption of newsprint in 2009 for our publishing businesses, a $10 per ton increase or decrease in the price of newsprint would increase or decrease our total cost of newsprint by $0.3 million. We have not entered into derivative instruments to manage our exposure to newsprint price risk.
63
Table of Contents
| ITEM 8. | FINANCIAL STATEMENTS AND SUPPLEMENTARY DATA |
CONSOLIDATED BALANCE SHEETS
December 27, 2009 and December 28, 2008
(in thousands, except per share amounts)
| 2009 | 2008 | |||||||
| ASSETS |
||||||||
| Current assets: |
||||||||
| Cash and cash equivalents |
$ | 3,369 | $ | 4,040 | ||||
| Receivables, net |
63,462 | 79,418 | ||||||
| Inventories, net |
3,456 | 5,935 | ||||||
| Prepaid expenses |
3,673 | 4,472 | ||||||
| Syndicated programs |
7,983 | 11,088 | ||||||
| Deferred income taxes |
4,899 | 4,869 | ||||||
| TOTAL CURRENT ASSETS |
86,842 | 109,822 | ||||||
| Property and equipment: |
||||||||
| Land and land improvements |
35,046 | 35,066 | ||||||
| Buildings and building improvements |
135,548 | 133,252 | ||||||
| Equipment |
282,143 | 277,653 | ||||||
| Construction in progress |
3,513 | 8,567 | ||||||
| 456,250 | 454,538 | |||||||
| Less accumulated depreciation |
253,797 | 233,380 | ||||||
| Net property and equipment |
202,453 | 221,158 | ||||||
| Goodwill |
9,098 | 4,285 | ||||||
| Broadcast licenses |
81,762 | 101,120 | ||||||
| Other intangible assets, net |
24,976 | 26,706 | ||||||
| Deferred income taxes |
63,368 | 64,420 | ||||||
| Syndicated programs |
3,285 | 3,091 | ||||||
| Other assets |
1,403 | 11,997 | ||||||
| TOTAL ASSETS |
$ | 473,187 | $ | 542,599 | ||||
| LIABILITIES AND SHAREHOLDERS’ EQUITY |
||||||||
| Current liabilities: |
||||||||
| Accounts payable |
$ | 24,281 | $ | 23,582 | ||||
| Accrued compensation |
13,963 | 15,046 | ||||||
| Accrued employee benefits |
5,686 | 7,214 | ||||||
| Deferred revenue |
15,353 | 15,001 | ||||||
| Accrued income taxes |
1,884 | 43 | ||||||
| Syndicated programs |
9,944 | 12,348 | ||||||
| Other current liabilities |
6,030 | 6,668 | ||||||
| Current portion of long-term liabilities |
483 | 1,609 | ||||||
| TOTAL CURRENT LIABILITIES |
77,624 | 81,511 | ||||||
| Accrued employee benefits |
63,268 | 64,620 | ||||||
| Syndicated programs |
6,250 | 7,871 | ||||||
| Long-term notes payable to banks |
151,375 | 215,090 | ||||||
| Other long-term liabilities |
3,595 | 5,445 | ||||||
| Commitments and contingencies (see Note 5) |
||||||||
| Shareholders’ equity: |
||||||||
| Preferred stock, $0.01 par – authorized 10,000,000 shares, no shares outstanding at December 27, 2009 and December 28, 2008 |
— | — | ||||||
| Common stock, $0.01 par: |
||||||||
| Class C – authorized 10,000,000 shares; issued and outstanding: |
||||||||
| 3,264,000 shares at December 27, 2009 and December 28, 2008 |
33 | 33 | ||||||
| Class B – authorized 120,000,000 shares; issued and outstanding (excluding treasury stock): 9,642,293 shares at December 27, 2009 and 9,938,816 shares at December 28, 2008 |
174 | 183 | ||||||
| Class A – authorized 170,000,000 shares; issued and outstanding: 41,783,044 shares at December 27, 2009 and 40,553,107 shares at December 28, 2008 |
418 | 406 | ||||||
| Additional paid-in capital |
258,413 | 256,716 | ||||||
| Accumulated other comprehensive loss |
(34,487 | ) | (34,355 | ) | ||||
| Retained earnings |
55,239 | 53,794 | ||||||
| Treasury stock, at cost (8,676,705 class B shares) |
(108,715 | ) | (108,715 | ) | ||||
| TOTAL SHAREHOLDERS’ EQUITY |
171,075 | 168,062 | ||||||
| TOTAL LIABILITIES AND SHAREHOLDERS’ EQUITY |
$ | 473,187 | $ | 542,599 | ||||
See accompanying notes.
64
Table of Contents
CONSOLIDATED STATEMENTS OF OPERATIONS
Years Ended December 27, 2009, December 28, 2008 and December 30, 2007
(in thousands, except per share amounts)
| 2009 | 2008 | 2007 | ||||||||||
| Continuing operations: |
||||||||||||
| Revenue: |
||||||||||||
| Publishing |
$ | 194,196 | $ | 241,972 | $ | 266,142 | ||||||
| Broadcasting |
171,491 | 209,914 | 218,118 | |||||||||
| Printing services |
48,249 | 65,201 | 69,377 | |||||||||
| Other |
19,629 | 27,844 | 29,017 | |||||||||
| Total revenue |
433,565 | 544,931 | 582,654 | |||||||||
| Operating costs and expenses: |
||||||||||||
| Publishing |
128,656 | 154,413 | 158,716 | |||||||||
| Broadcasting |
92,899 | 104,586 | 103,380 | |||||||||
| Printing services |
41,731 | 54,537 | 55,313 | |||||||||
| Other |
17,459 | 24,022 | 25,539 | |||||||||
| Total operating costs and expenses |
280,745 | 337,558 | 342,948 | |||||||||
| Selling and administrative expenses |
124,176 | 154,966 | 160,918 | |||||||||
| Goodwill and broadcast license impairment |
20,133 | 375,086 | — | |||||||||
| Total operating costs and expenses, selling and administrative expenses and goodwill and broadcast license impairment |
425,054 | 867,610 | 503,866 | |||||||||
| Operating earnings (loss) |
8,511 | (322,679 | ) | 78,788 | ||||||||
| Other income and expense: |
||||||||||||
| Interest income |
22 | 2 | 36 | |||||||||
| Interest expense, net |
(2,826 | ) | (8,166 | ) | (9,180 | ) | ||||||
| Total other income and expense |
(2,804 | ) | (8,164 | ) | (9,144 | ) | ||||||
| Earnings (loss) from continuing operations before income taxes |
5,707 | (330,843 | ) | 69,644 | ||||||||
| Provision (benefit) for income taxes |
1,400 | (106,040 | ) | 26,626 | ||||||||
| Earnings (loss) from continuing operations |
4,307 | (224,803 | ) | 43,018 | ||||||||
| Earnings from discontinued operations, net of applicable income tax expense of $0, $0 and $43,250, respectively |
— | 400 | 67,060 | |||||||||
| Net earnings (loss) |
$ | 4,307 | $ | (224,403 | ) | $ | 110,078 | |||||
| Earnings (loss) per share: |
||||||||||||
| Basic – Class A and B common stock: |
||||||||||||
| Continuing operations |
$ | 0.05 | $ | (4.37 | ) | $ | 0.65 | |||||
| Discontinued operations |
— | 0.01 | 1.02 | |||||||||
| Net earnings (loss) |
$ | 0.05 | $ | (4.36 | ) | $ | 1.67 | |||||
| Diluted – Class A and B common stock: |
||||||||||||
| Continuing operations |
$ | 0.05 | $ | (4.37 | ) | $ | 0.65 | |||||
| Discontinued operations |
— | 0.01 | 1.00 | |||||||||
| Net earnings (loss) |
$ | 0.05 | $ | (4.36 | ) | $ | 1.65 | |||||
| Basic and diluted – Class C common stock: |
||||||||||||
| Continuing operations |
$ | 0.60 | $ | 0.57 | $ | 0.92 | ||||||
| Discontinued operations |
— | 0.01 | 1.02 | |||||||||
| Net earnings |
$ | 0.60 | $ | 0.58 | $ | 1.94 | ||||||
See accompanying notes
65
Table of Contents
Consolidated Statements of Shareholders’ Equity
Years Ended December 27, 2009, December 28, 2008 and December 30, 2007
(in thousands, except per share amounts)
| Preferred Stock |
Common Stock | Additional Paid-in-Capital |
||||||||||||||||
| Class C | Class B | Class A | ||||||||||||||||
| Balance at December 31, 2006 |
$ | — | $ | 33 | $ | 268 | $ | 481 | $ | 334,948 | ||||||||
| Comprehensive income: |
||||||||||||||||||
| Net earnings |
||||||||||||||||||
| Other comprehensive income, net: |
||||||||||||||||||
| Change in pension and postretirement |
||||||||||||||||||
| Comprehensive income |
||||||||||||||||||
| Dividends declared: |
||||||||||||||||||
| Class C ($0.57 per share) |
||||||||||||||||||
| Class B ($0.30 per share) |
||||||||||||||||||
| Class A ($0.30 per share) |
||||||||||||||||||
| Issuance of shares: |
||||||||||||||||||
| Conversion of class B to class A |
(36 | ) | 36 | |||||||||||||||
| Stock grants |
695 | |||||||||||||||||
| Employee stock purchase plan |
358 | |||||||||||||||||
| Shares purchased and retired |
(32 | ) | (63 | ) | (42,818 | ) | ||||||||||||
| Reversal of reserve for unrecognized tax benefits |
771 | |||||||||||||||||
| Adoption of accounting for uncertainty in income taxes |
||||||||||||||||||
| Stock-based compensation |
1 | 1,063 | ||||||||||||||||
| Balance at December 30, 2007 |
— | 33 | 201 | 454 | 295,017 | |||||||||||||
| Comprehensive loss: |
||||||||||||||||||
| Net loss |
||||||||||||||||||
| Other comprehensive loss, net: |
||||||||||||||||||
| Change in pension and postretirement |
||||||||||||||||||
| Comprehensive loss |
||||||||||||||||||
| Dividends declared: |
||||||||||||||||||
| Class C ($0.57 per share) |
||||||||||||||||||
| Class B ($0.32 per share) |
||||||||||||||||||
| Class A ($0.32 per share) |
||||||||||||||||||
| Issuance of shares: |
||||||||||||||||||
| Conversion of class B to class A |
(18 | ) | 18 | |||||||||||||||
| Stock grants |
382 | |||||||||||||||||
| Employee stock purchase plan |
585 | |||||||||||||||||
| Shares purchased and retired |
(66 | ) | (40,338 | ) | ||||||||||||||
| Shares withheld from employees for tax withholding |
(102 | ) | ||||||||||||||||
| Stock-based compensation |
1,172 | |||||||||||||||||
| Balance at December 28, 2008 |
— | 33 | 183 | 406 | 256,716 | |||||||||||||
| Comprehensive income (loss): |
||||||||||||||||||
| Net earnings |
||||||||||||||||||
| Other comprehensive loss, net: |
||||||||||||||||||
| Change in pension and postretirement |
||||||||||||||||||
| Comprehensive income |
||||||||||||||||||
| Dividends declared: |
||||||||||||||||||
| Class C ($0.57 per share) |
||||||||||||||||||
| Class B ($0.02 per share) |
||||||||||||||||||
| Class A ($0.02 per share) |
||||||||||||||||||
| Issuance of shares: |
||||||||||||||||||
| Conversion of class B to class A |
(12 | ) | 12 | |||||||||||||||
| Stock grants |
1 | 127 | ||||||||||||||||
| Employee stock purchase plan |
2 | 368 | ||||||||||||||||
| Shares withheld from employees for tax withholding |
(20 | ) | ||||||||||||||||
| Stock-based compensation |
1,222 | |||||||||||||||||
| Balance at December 27, 2009 |
$ | — | $ | 33 | $ | 174 | $ | 418 | $ | 258,413 | ||||||||
See accompanying notes.
66
Table of Contents
| Accumulated Other Comprehensive Loss |
Retained Earnings |
Treasury Stock, at cost |
Total | Comprehensive Income (loss) |
||||||||||||||||
| $ | (17,114 | ) | $ | 270,991 | $ | (108,715 | ) | $ | 480,892 | |||||||||||
| 110,078 | 110,078 | $ | 110,078 | |||||||||||||||||
|
|
16,499 |
|
16,499 | 16,499 | ||||||||||||||||
| $ | 126,577 | |||||||||||||||||||
| (1,854 | ) | (1,854 | ) | |||||||||||||||||
| (4,274 | ) | (4,274 | ) | |||||||||||||||||
| (14,327 | ) | (14,327 | ) | |||||||||||||||||
| — | ||||||||||||||||||||
| 695 | ||||||||||||||||||||
| 358 | ||||||||||||||||||||
| (59,483 | ) | (102,396 | ) | |||||||||||||||||
| 771 | ||||||||||||||||||||
| 45 | 45 | |||||||||||||||||||
| 11 | 1,075 | |||||||||||||||||||
| (615 | ) | 301,187 | (108,715 | ) | 487,562 | |||||||||||||||
| (224,403 | ) | (224,403 | ) | $ | (224,403 | ) | ||||||||||||||
|
|
(33,740 |
) |
(33,740 | ) | (33,740 | ) | ||||||||||||||
| $ | (258,143 | ) | ||||||||||||||||||
| (1,854 | ) | (1,854 | ) | |||||||||||||||||
| (3,376 | ) | (3,376 | ) | |||||||||||||||||
| (13,297 | ) | (13,297 | ) | |||||||||||||||||
| — | ||||||||||||||||||||
| 382 | ||||||||||||||||||||
| 585 | ||||||||||||||||||||
| (4,471 | ) | (44,875 | ) | |||||||||||||||||
| (102 | ) | |||||||||||||||||||
| 8 | 1,180 | |||||||||||||||||||
| (34,355 | ) | 53,794 | (108,715 | ) | 168,062 | |||||||||||||||
| 4,307 | 4,307 | $ | 4,307 | |||||||||||||||||
|
|
(132 |
) |
(132 | ) | (132 | ) | ||||||||||||||
| $ | 4,175 | |||||||||||||||||||
| (1,854 | ) | (1,854 | ) | |||||||||||||||||
| (200 | ) | (200 | ) | |||||||||||||||||
| (812 | ) | (812 | ) | |||||||||||||||||
| — | ||||||||||||||||||||
| 128 | ||||||||||||||||||||
| 370 | ||||||||||||||||||||
| (20 | ) | |||||||||||||||||||
| 4 | 1,226 | |||||||||||||||||||
| $ | (34,487 | ) | $ | 55,239 | $ | (108,715 | ) | $ | 171,075 | |||||||||||
67
Table of Contents
CONSOLIDATED STATEMENTS OF CASH FLOWS
Years Ended December 27, 2009, December 28, 2008 and December 30, 2007
(in thousands)
| 2009 | 2008 | 2007 | ||||||||||
| Cash flow from operating activities: |
||||||||||||
| Net earnings (loss) |
$ | 4,307 | $ | (224,403 | ) | $ | 110,078 | |||||
| Less earnings from discontinued operations |
— | 400 | 67,060 | |||||||||
| Earnings from continuing operations |
4,307 | (224,803 | ) | 43,018 | ||||||||
| Adjustments for non-cash items: |
||||||||||||
| Depreciation |
26,598 | 27,438 | 27,407 | |||||||||
| Amortization |
1,975 | 1,998 | 1,961 | |||||||||
| Provision for doubtful accounts |
2,706 | 2,774 | 1,646 | |||||||||
| Deferred income taxes |
1,113 | (107,505 | ) | (1,275 | ) | |||||||
| Non-cash stock-based compensation |
1,350 | 1,600 | 1,829 | |||||||||
| Curtailment gains for defined benefit pension plan |
(492 | ) | — | — | ||||||||
| Net (gain) loss from disposal of assets |
(2,509 | ) | 268 | (744 | ) | |||||||
| Impairment of goodwill and broadcast licenses |
20,133 | 375,086 | 410 | |||||||||
| Impairment of long-lived assets |
698 | — | — | |||||||||
| Net changes in operating assets and liabilities, excluding effect of sales and acquisitions: |
||||||||||||
| Receivables |
13,230 | 4,457 | (412 | ) | ||||||||
| Inventories |
2,479 | 626 | (506 | ) | ||||||||
| Accounts payable |
699 | (3,168 | ) | (1,082 | ) | |||||||
| Other assets and liabilities |
4,485 | (6,980 | ) | (5,611 | ) | |||||||
| NET CASH PROVIDED BY OPERATING ACTIVITIES |
76,772 | 71,791 | 66,641 | |||||||||
| Cash flow from investing activities: |
||||||||||||
| Capital expenditures for property and equipment |
(8,634 | ) | (22,225 | ) | (35,906 | ) | ||||||
| Insurance proceeds and proceeds from sales of assets |
2,141 | 93 | 3,391 | |||||||||
| Acquisition of businesses |
(6,593 | ) | (25,284 | ) | (12,221 | ) | ||||||
| Proceeds from sale of businesses |
501 | — | 205,007 | |||||||||
| NET CASH PROVIDED BY (USED FOR) INVESTING ACTIVITIES |
(12,585 | ) | (47,416 | ) | 160,271 | |||||||
| Cash flow from financing activities: |
||||||||||||
| Proceeds from long-term notes payable to banks |
131,685 | 209,497 | 343,310 | |||||||||
| Payments of long-term notes payable to banks |
(195,400 | ) | (173,292 | ) | (399,425 | ) | ||||||
| Proceeds from issuance of common stock, net |
333 | 527 | 322 | |||||||||
| Redemption of common stock, net |
— | (44,875 | ) | (102,396 | ) | |||||||
| Cash dividends |
(1,476 | ) | (18,527 | ) | (20,445 | ) | ||||||
| NET CASH USED FOR FINANCING ACTIVITIES |
(64,858 | ) | (26,670 | ) | (178,634 | ) | ||||||
| Cash flow from discontinued operations: |
||||||||||||
| Net operating activities |
— | 79 | (49,275 | ) | ||||||||
| Net investing activities |
— | — | (670 | ) | ||||||||
| NET CASH PROVIDED BY (USED FOR) DISCONTINUED OPERATIONS |
— | 79 | (49,945 | ) | ||||||||
| NET DECREASE IN CASH AND CASH EQUIVALENTS |
(671 | ) | (2,216 | ) | (1,667 | ) | ||||||
| Cash and cash equivalents: |
||||||||||||
| Beginning of year |
4,040 | 6,256 | 7,923 | |||||||||
| End of year |
$ | 3,369 | $ | 4,040 | $ | 6,256 | ||||||
| SUPPLEMENTAL CASH FLOW INFORMATION |
||||||||||||
| Cash paid for income taxes |
$ | 198 | $ | 4,883 | $ | 76,748 | ||||||
| Cash paid for interest |
$ | 2,167 | $ | 7,596 | $ | 8,798 | ||||||
See accompanying notes
68
Table of Contents
NOTES TO CONSOLIDATED FINANCIAL STATEMENTS
December 27, 2009 (in thousands, except per share amounts)
| 1 | SIGNIFICANT ACCOUNTING POLICIES |
Basis of presentation and consolidation—We report on a 52-53 week fiscal year ending on the last Sunday of December in each year. In addition, we have four quarterly reporting periods, each consisting of thirteen weeks and ending on a Sunday, provided that once every six years the fourth quarterly reporting period will be fourteen weeks.
The consolidated financial statements include the accounts of Journal Communications, Inc. and its wholly owned subsidiaries. All significant intercompany balances and transactions have been eliminated.
Revenue recognition—Publishing revenue is generated primarily from the sale of newspaper and internet advertising space and newspaper sales. Broadcasting revenue is generated primarily from the sale of television and radio advertising time. Advertising revenue is recognized in the publishing and broadcasting industries when the advertisement is published or aired, including advertising aired online on web sites. Circulation revenue is recognized when the newspaper is delivered to the customer. Printing services revenue is recorded primarily at the time of shipment when title passes to the customer. Retransmission revenue from cable, satellite and telecommunications systems is recognized based on average monthly subscriber counts and contractual rates. Other revenue that consists of direct marketing services is recognized at the time the service is performed or products are shipped.
Amounts we receive from customers in advance of revenue recognition are deferred as liabilities. Deferred revenue to be earned more than one year from the balance sheet date is included in other long-term liabilities in the consolidated balance sheets.
Shipping and handling costs—Shipping and handling costs, including postage, billed to customers are included in revenue and the related costs are included in operating costs and expenses.
Advertising expense—We expense our advertising costs as incurred. Advertising expense totaled $2,677, $3,982, and $4,538 in 2009, 2008, and 2007, respectively.
Interest expense—All interest incurred during the years ended December 27, 2009 and December 28, 2008 was expensed. Capitalized interest for the year ended December 30, 2007 totaled $89.
Income taxes—We account for income taxes in accordance with the FASB’s (Financial Accounting Standards Board) guidance for accounting for income taxes. Deferred taxes are provided for the net tax effects of temporary differences between the carrying amounts of assets and liabilities for financial reporting purposes and the amounts for income tax purposes. Valuation allowances are established when management determines that it is more likely than not that some portion or all of a deferred tax asset will not be realized.
On January 1, 2007, we adopted the FASB’s guidance for accounting for uncertainty in income taxes. We recognize an uncertain tax position when it is more likely than not to be sustained upon examination by taxing authorities and we measure the tax benefit as the largest amount of benefit, determined on a cumulative probability basis, which is more likely than not to be realized upon ultimate settlement.
69
Table of Contents
NOTES TO CONSOLIDATED FINANCIAL STATEMENTS—(CONTINUED)
December 27, 2009 (in thousands, except per share amounts)
| 1 | SIGNIFICANT ACCOUNTING POLICIES continued |
Earnings per share
Basic
We apply the two-class method for calculating and presenting our basic earnings per share. As noted in the FASB’s guidance for earnings per share, the two-class method is an earnings allocation formula that determines earnings per share for each class of common stock according to dividends declared (or accumulated) and participation rights in undistributed earnings. Under that method:
| (a) | Income (loss) from continuing operations (“net earnings (loss)”) is reduced by the amount of dividends declared in the current period for each class of stock and by the contractual amount of dividends that must be paid during the current period. |
| (b) | The remaining earnings, which may include earnings from discontinued operations (“undistributed earnings”), are allocated to each class of common stock to the extent that each class of stock may share in earnings if all of the earnings for the period were distributed. |
| (c) | The remaining losses, which may include losses from discontinued operations (“undistributed losses”), are allocated to the class A and B common stock. Undistributed losses are not allocated to the class C common stock and non-vested restricted stock because the class C shares and the non-vested restricted stock are not contractually obligated to share in the losses. |
| (d) | The total earnings (loss) allocated to each class of common stock are then divided by the number of weighted average shares outstanding of the class of common stock to which the earnings (loss) are allocated to determine the earnings (loss) per share for that class of common stock. |
| (e) | Basic earnings (loss) per share data are presented for class A and B common stock in the aggregate and for class C common stock. The basic earnings (loss) per share for class A and B common stock are the same; hence, these classes are reported together. |
In applying the two-class method, we have determined that undistributed earnings should be allocated equally on a per share basis among each class of common stock due to the lack of any contractual participation rights of any class to those undistributed earnings. Undistributed losses are allocated to only the class A and B common stock for the reason stated above.
We adopted guidance in the first quarter of 2009 on how to determine whether instruments granted in share-based payment transactions are participating securities and should be included in the computation of earnings per share pursuant to the two-class method. Our non-vested restricted stock awards contain nonforfeitable rights to dividends and are included in the computation of earnings per share pursuant to the two-class method. The adoption of this guidance did not have a material effect on our historically reported earnings per share.
70
Table of Contents
NOTES TO CONSOLIDATED FINANCIAL STATEMENTS—(CONTINUED)
December 27, 2009 (in thousands, except per share amounts)
| 1 | SIGNIFICANT ACCOUNTING POLICIES continued |
The following table sets forth the computation of basic earnings per share under the two-class method:
| 2009 | 2008 | 2007 | ||||||||
| Numerator for basic earnings (loss) from continuing operations for each class of common stock and non-vested restricted stock: |
||||||||||
| Earnings (loss) from continuing operations |
$ | 4,307 | $ | (224,803 | ) | $ | 43,018 | |||
| Less dividends declared: |
||||||||||
| Class A and B |
1,006 | 16,665 | 18,591 | |||||||
| Class C |
1,854 | 1,854 | 1,854 | |||||||
| Non-vested restricted stock |
2 | — | — | |||||||
| Total undistributed earnings (loss) from continuing operations |
$ | 1,445 | $ | (243,322 | ) | $ | 22,573 | |||
| Undistributed earnings (loss) from continuing operations: |
||||||||||
| Class A and B |
$ | 1,336 | $ | (243,322 | ) | $ | 21,449 | |||
| Class C |
87 | — | 1,124 | |||||||
| Non-vested restricted stock |
22 | — | — | |||||||
| Total undistributed earnings (loss) from continuing operations |
$ | 1,445 | $ | (243,322 | ) | $ | 22,573 | |||
| Numerator for basic earnings (loss) from continuing operations per class A and B common stock: |
||||||||||
| Dividends on class A and B |
$ | 1,006 | $ | 16,665 | $ | 18,591 | ||||
| Class A and B undistributed earnings (loss) |
1,336 | (243,322 | ) | 21,449 | ||||||
| Numerator for basic earnings (loss) from continuing operations per class A and B common stock |
$ | 2,342 | $ | (226,657 | ) | $ | 40,040 | |||
| Numerator for basic earnings from continuing operations per class C common stock: |
||||||||||
| Dividends on class C |
$ | 1,854 | $ | 1,854 | $ | 1,854 | ||||
| Class C undistributed earnings |
87 | — | 1,124 | |||||||
| Numerator for basic earnings from continuing operations per class C common stock |
$ | 1,941 | $ | 1,854 | $ | 2,978 | ||||
| Denominator for basic earnings (loss) from continuing operations for each class of common stock: |
||||||||||
| Weighted average shares outstanding – |
||||||||||
| Class A and B |
50,400 | 51,917 | 62,276 | |||||||
| Class C |
3,264 | 3,264 | 3,264 | |||||||
| Basic earnings (loss) per share from continuing operations: |
||||||||||
| Class A and B |
$ | 0.05 | $ | (4.37 | ) | $ | 0.65 | |||
| Class C |
$ | 0.60 | $ | 0.57 | $ | 0.92 | ||||
| Numerator for basic earnings from discontinued operations for each class of common stock and non-vested restricted stock: |
||||||||||
| Total undistributed earnings from discontinued operations |
$ | — | $ | 400 | $ | 67,060 | ||||
71
Table of Contents
NOTES TO CONSOLIDATED FINANCIAL STATEMENTS—(CONTINUED)
December 27, 2009 (in thousands, except per share amounts)
| 1 | SIGNIFICANT ACCOUNTING POLICIES continued |
| 2009 | 2008 | 2007 | ||||||||
| Undistributed earnings from discontinued operations: |
||||||||||
| Class A and B |
$ | — | $ | 376 | $ | 63,720 | ||||
| Class C |
— | 24 | 3,340 | |||||||
| Non-vested restricted stock |
— | — | — | |||||||
| Total undistributed earnings from discontinued operations |
$ | — | $ | 400 | $ | 67,060 | ||||
| Denominator for basic earnings from discontinued operations for each class of common stock: |
||||||||||
| Weighted average shares outstanding – |
||||||||||
| Class A and B |
50,400 | 51,917 | 62,276 | |||||||
| Class C |
3,264 | 3,264 | 3,264 | |||||||
| Basic earnings per share from discontinued operations: |
||||||||||
| Class A and B |
$ | — | $ | 0.01 | $ | 1.02 | ||||
| Class C |
$ | — | $ | 0.01 | $ | 1.02 | ||||
| Numerator for basic net earnings for each class of common stock and non-vested restricted stock: |
||||||||||
| Net earnings (loss) |
$ | 4,307 | $ | (224,403 | ) | $ | 110,078 | |||
| Less dividends: |
||||||||||
| Class A and B |
$ | 1,006 | $ | 16,665 | $ | 18,591 | ||||
| Class C |
1,854 | 1,854 | 1,854 | |||||||
| Non-vested restricted stock |
2 | — | — | |||||||
| Total undistributed net earnings (loss) |
$ | 1,445 | $ | (242,922 | ) | $ | 89,633 | |||
| Undistributed net earnings (loss): |
||||||||||
| Class A and B |
$ | 1,336 | $ | (242,946 | ) | $ | 85,169 | |||
| Class C |
87 | 24 | 4,464 | |||||||
| Non-vested restricted stock |
22 | — | — | |||||||
| Total undistributed net earnings (loss) |
$ | 1,445 | $ | (242,922 | ) | $ | 89,633 | |||
| Numerator for basic net earnings (loss) per class A and B common stock: |
||||||||||
| Dividends on class A and B |
$ | 1,006 | $ | 16,665 | $ | 18,591 | ||||
| Class A and B undistributed net earnings (loss) |
1,336 | (242,946 | ) | 85,169 | ||||||
| Numerator for basic net earnings (loss) per class A and B common stock |
$ | 2,342 | $ | (226,281 | ) | $ | 103,760 | |||
| Numerator for basic net earnings per class C common stock: |
||||||||||
| Dividends on class C |
$ | 1,854 | $ | 1,854 | $ | 1,854 | ||||
| Class C undistributed net earnings |
87 | 24 | 4,464 | |||||||
| Numerator for basic net earnings per class C common stock |
$ | 1,941 | $ | 1,878 | $ | 6,318 | ||||
| Denominator for basic net earnings (loss) for each class of common stock: |
||||||||||
| Weighted average shares outstanding – |
||||||||||
| Class A and B |
50,400 | 51,917 | 62,276 | |||||||
| Class C |
3,264 | 3,264 | 3,264 | |||||||
| Basic net earnings (loss) per share: |
||||||||||
| Class A and B |
$ | 0.05 | $ | (4.36 | ) | $ | 1.67 | |||
| Class C |
$ | 0.60 | $ | 0.58 | $ | 1.94 | ||||
72
Table of Contents
NOTES TO CONSOLIDATED FINANCIAL STATEMENTS—(CONTINUED)
December 27, 2009 (in thousands, except per share amounts)
| 1 | SIGNIFICANT ACCOUNTING POLICIES continued |
Diluted
Diluted earnings per share is computed based upon the assumption that the class C shares outstanding were converted into class A and B shares, class B common shares are issued upon exercise of our nonstatutory stock options or stock appreciation rights when the exercise price is less than the average market price of our common shares, and common shares will be outstanding upon expiration of the vesting periods of our non-vested restricted stock. Diluted earnings per share for the years ended December 27, 2009 and December 28, 2008 is computed based upon the assumption that 437 and 63 class B common shares, respectively, are not outstanding upon the expiration of the vesting periods of our non-vested restricted stock and the class C shares were not converted and as they are anti-dilutive.
The following table sets forth the computation of diluted net earnings per share for class A and B common stock:
| 2009 | 2008 | 2007 | ||||||||
| Numerator for diluted earnings (loss) per share: |
||||||||||
| Dividends on class A and B common stock |
$ | 1,006 | $ | 16,665 | $ | 18,591 | ||||
| Dividends on class C common stock |
— | — | 1,854 | |||||||
| Total undistributed earnings (loss) from continuing operations |
1,336 | (243,322 | ) | 22,573 | ||||||
| Total undistributed earnings from discontinued operations |
— | 376 | 67,060 | |||||||
| Net earnings (loss) |
$ | 2,342 | $ | (226,281 | ) | $ | 110,078 | |||
| Denominator for diluted net earnings (loss) per share: |
||||||||||
| Weighted average shares outstanding – class A and B |
50,400 | 51,917 | 62,276 | |||||||
| Impact of non-vested restricted stock |
— | — | 81 | |||||||
| Conversion of class C shares |
— | — | 4,452 | |||||||
| Adjusted weighted average shares outstanding |
50,400 | 51,917 | 66,809 | |||||||
| Diluted earnings (loss) per share: |
||||||||||
| Continuing operations |
$ | 0.05 | $ | (4.37 | ) | $ | 0.65 | |||
| Discontinued operations |
— | 0.01 | 1.00 | |||||||
| Net earnings |
$ | 0.05 | $ | (4.36 | ) | $ | 1.65 | |||
Diluted earnings (loss) per share for the class C common stock is the same as basic earnings (loss) per share for the class C common stock because there are no class C common stock equivalents.
Each of the 3,264,000 class C shares outstanding is convertible at any time at the option of the holder into either (i) 1.363970 class A shares (or a total of 4,451,998 class A shares) or (ii) 0.248243 class A shares (or a total of 810,265 class A shares) and 1.115727 class B shares (or a total of 3,641,733 class B shares).
Fair values—The carrying amount of cash and cash equivalents, receivables, accounts payable, accrued severance and barter programming assets and liabilities approximates fair value as of December 27, 2009 and December 28, 2008.
Cash equivalents—Cash equivalents are highly liquid investments with maturities of three months or less when purchased. Cash equivalents are stated at cost, which approximates market value.
73
Table of Contents
NOTES TO CONSOLIDATED FINANCIAL STATEMENTS—(CONTINUED)
December 27, 2009 (in thousands, except per share amounts)
| 1 | SIGNIFICANT ACCOUNTING POLICIES continued |
Receivables, net—We evaluate the collectability of our accounts receivable based on a combination of factors. We specifically review historical write-off activity by market, large customer concentrations, customer creditworthiness and changes in our customer payment patterns and terms when evaluating the adequacy of the allowance for doubtful accounts. In circumstances where we are aware of a specific customer’s inability to meet its financial obligations, we record a specific reserve to reduce the amounts recorded to what we believe will be collected. For all other customers, we recognize allowances for bad debts based on historical experience of bad debts as a percent of accounts receivable for each business unit. We write off uncollectible accounts against the allowance for doubtful accounts after collection efforts have been exhausted. The allowance for doubtful accounts at December 27, 2009 and December 28, 2008 was $4,270 and $4,734, respectively. Included in receivables, net, as of December 27, 2009 is $956 of income tax credits and overpayments related to the 2008 and 2007 income tax years for which we have applied for refunds.
Concentration of credit risk—Generally, credit is extended based upon an evaluation of the customer’s financial position, and advance payment is not required. Credit losses are provided for in the financial statements and have been within management’s expectations. Given the current economic environment, credit losses may increase in the future.
Inventories—Inventories are stated at the lower of cost (first in, first out method) or market. A summary of inventories follows:
| December 27 and December 28 |
2009 | 2008 | ||||||
| Paper and supplies |
$ | 2,822 | $ | 4,779 | ||||
| Work in process |
600 | 723 | ||||||
| Finished goods |
273 | 632 | ||||||
| Less obsolescence reserve |
(239 | ) | (199 | ) | ||||
| Inventories, net |
$ | 3,456 | $ | 5,935 | ||||
Television programming—We have agreements with distributors for the rights to television programming over contract periods, which generally run for one to five years. Each contract is recorded as an asset and a liability at an amount equal to its gross contractual commitment when the license period begins and the program is available for its first showing. The portion of program contracts that become payable within one year is reflected as a current liability in the accompanying consolidated balance sheets. The rights to program materials are carried at the lower of unamortized cost or estimated net realizable value or in the case of programming obtained by an acquisition, at estimated fair value. Certain of our agreements require us to provide barter advertising time to our distributors. Barter advertising revenue and expense was $5,711, $6,184 and $6,322 in 2009, 2008 and 2007, respectively.
Property and equipment—Property and equipment are recorded at cost. Depreciation of property and equipment is provided, using the straight-line method, over the estimated useful lives, which are as follows:
| Years | ||
| Building and land improvements |
10 | |
| Buildings |
30 | |
| Newspaper printing presses |
25 | |
| Broadcasting equipment |
5-20 | |
| Other printing presses |
10 | |
| Other |
3-10 |
74
Table of Contents
NOTES TO CONSOLIDATED FINANCIAL STATEMENTS—(CONTINUED)
December 27, 2009 (in thousands, except per share amounts)
| 1 | SIGNIFICANT ACCOUNTING POLICIES continued |
Capital leases—We charge amortization expense of assets recorded under capital leases to depreciation expense in our consolidated statements of operations and accumulated depreciation in our consolidated balance sheets. At December 27, 2009 we recorded $1,767 for capital leases in equipment, $984 in accumulated depreciation, $300 in current portion of long-term liabilities and $531 in other long-term liabilities in our consolidated balance sheets. At December 28, 2008, we recorded $1,638 for capital leases in equipment, $656 in accumulated depreciation, $357 in current portion of long-term liabilities and $739 in other long-term liabilities in our consolidated balance sheets.
Intangible assets—Indefinite-lived intangible assets, which consist of broadcast licenses, and goodwill are no longer amortized but instead are reviewed for impairment at least annually or more frequently if impairment indicators are present. We continue to amortize definite-lived intangible assets on a straight-line basis over periods of five to 25 years.
Impairment of long-lived assets—Property and equipment and other definite-lived intangible assets are reviewed for impairment whenever events or changes in circumstances indicate that the carrying amount may not be recoverable. If an asset is considered impaired, a charge is recognized for the difference between the fair value and carrying value of the asset or group of assets. Such analyses necessarily involve significant judgment. Equipment and property impairment charges for $698 were reported in our other and publishing segments in 2009. The charges were determined based upon quoted market prices and are reported in selling and administrative expenses in the consolidated statement of operations. There were no impairment losses in 2008 and 2007.
Use of estimates—The preparation of financial statements in conformity with accounting principles generally accepted in the United States requires management to make estimates and assumptions that affect the amounts reported in the financial statements and accompanying notes. Actual results could differ from those estimates.
Revisions—Certain prior year amounts have been revised to conform to the 2009 presentation. These are primarily related to circulation delivery costs for our publishing businesses and the allocation of building related expenses for our broadcasting business. These costs were previously reported in selling and administrative expenses and are now correctly classified in operating costs and expenses.
The following table sets forth operating costs and expenses and selling and administrative expenses for 2008 and 2007 as previously reported and revised to conform to the 2009 presentation:
| 2008 As Revised |
2008 As Previously Reported | |||||
| Operating costs and expenses: |
||||||
| Publishing |
$ | 154,413 | $ | 138,582 | ||
| Broadcasting |
104,586 | 100,904 | ||||
| Printing services |
54,537 | 54,536 | ||||
| Other |
24,022 | 24,022 | ||||
| Total operating costs and expenses |
$ | 337,558 | $ | 318,044 | ||
| Selling and administrative expenses |
$ | 154,966 | $ | 174,480 | ||
75
Table of Contents
NOTES TO CONSOLIDATED FINANCIAL STATEMENTS—(CONTINUED)
December 27, 2009 (in thousands, except per share amounts)
| 1 | SIGNIFICANT ACCOUNTING POLICIES continued |
| 2007 As Revised |
2007 As Previously Reported | |||||
| Operating costs and expenses: |
||||||
| Publishing |
$ | 158,716 | $ | 142,441 | ||
| Broadcasting |
103,380 | 99,706 | ||||
| Printing services |
55,313 | 55,313 | ||||
| Other |
25,539 | 25,539 | ||||
| Total operating costs and expenses |
$ | 342,948 | $ | 322,999 | ||
| Selling and administrative expenses |
$ | 160,918 | $ | 180,867 | ||
Similar revisions will be made in future filings that include previously reported quarter results.
New accounting standards
Future Adoptions
In January 2010, the FASB issued amended guidance for fair value measurements and disclosures. The guidance requires new disclosures about the activity in Level 3 fair value measurements and the transfers between Levels 1, 2, and 3. This guidance is effective for interim and annual periods beginning after December 15, 2009. The guidance also clarifies existing disclosures about the different classes of assets and liabilities measured at fair value and the valuation techniques and inputs used. This guidance is effective for fiscal years beginning after December 15, 2010 and for interim periods within those fiscal years. We do not believe the effect of adopting this guidance will have a material impact on our consolidated financial statements.
In December 2009, the FASB issued amended guidance for consolidating variable interest entities (VIEs). The guidance replaces the quantitative-based risks and rewards calculation for determining which reporting entity, if any, has a controlling financial interest in a VIE with an approach focused on identifying which reporting entity has the power to direct the activities of a VIE that most significantly impact the entity’s economic performance and (1) the obligation to absorb losses of the entity or (2) the right to receive benefits from the entity. The amended guidance also requires additional disclosures about a reporting entity’s involvement in VIEs. The guidance is effective for fiscal years beginning after November 15, 2009 and for interim periods within that fiscal year. We are currently evaluating the impact of adopting this guidance on our consolidated financial statements. In June 2009, the FASB issued amended standards for determining whether to consolidate a variable interest entity. The guidance amends the evaluation criteria to identify the primary beneficiary of a variable interest entity and requires ongoing reassessment of whether an enterprise is the primary beneficiary of the variable interest entity. The guidance is effective for fiscal years beginning after November 15, 2009 and interim periods within those fiscal years. We are currently evaluating the impact of adopting this guidance on our consolidated financial statements.
Current Adoptions
In August 2009, the FASB issued amended guidance for fair value measurements and disclosures. The guidance provides clarification for the circumstances when a quoted price in an active market for the identical liability is not available, a reporting entity is required to measure fair value using a valuation technique that uses either the quoted price of the identical liability when traded as an asset or quoted prices for similar liabilities or similar liabilities when traded as assets. This guidance was effective upon issuance. The adoption of this guidance did not have a material impact on our consolidated financial statements.
76
Table of Contents
NOTES TO CONSOLIDATED FINANCIAL STATEMENTS—(CONTINUED)
December 27, 2009 (in thousands, except per share amounts)
| 1 | SIGNIFICANT ACCOUNTING POLICIES continued |
In May 2009, the FASB issued guidance on the accounting for and disclosure of events that occur after the balance sheet date but before financial statements are issued or are available to be issued. Specifically, this guidance provides:
| • | The period after the balance sheet date during which management of a reporting entity should evaluate events or transactions that may occur for potential recognition or disclosure in the financial statements; |
| • | The circumstance under which an entity should recognize events or transactions occurring after the balance sheet date in its financial statements; and |
| • | The disclosures that an entity should make about events or transactions that occurred after the balance sheet date. |
This guidance is effective for interim or annual periods ending after June 15, 2009, and shall be applied prospectively. We adopted this guidance in the second quarter of 2009. The adoption of this guidance did not have a material impact on our consolidated financial statements.
In April 2009, the FASB issued amended guidance on the disclosures about fair value of financial instruments in interim financial information. Under this amended guidance, an entity shall disclose in the body or in the accompanying notes of its summarized financial information for interim reporting periods and in its financial statements for annual reporting periods the fair value of all financial instruments for which it is practicable to estimate that value, whether recognized or not recognized in the statement of financial position. This amended guidance was effective for interim periods ending after June 15, 2009. We adopted this amended guidance in the second quarter of 2009. The adoption of this amended guidance did not have a material impact on our consolidated financial statements.
In December 2008, the FASB amended the existing guidance on an employers’ disclosures about plan assets of a defined benefit pension or other postretirement plan. The guidance is effective for fiscal years ending after December 15, 2009. Upon initial application, the guidance is not required for earlier periods that are presented for comparative purposes. We adopted this guidance in the fourth quarter of 2009. The adoption of this guidance did not have a material impact on our consolidated financial statements.
In February 2008, the FASB issued guidance which delayed the effective date of the guidance for fair value measurements for all nonfinancial assets and liabilities, except those that are recognized or disclosed at fair value in the financial statements on a recurring basis (at least annually) to fiscal years beginning after November 15, 2008. We adopted this guidance in the first quarter of 2009. The adoption of this guidance did not have a material impact on our consolidated financial statements.
In December 2007, the FASB issued amended guidance for accounting for business combinations. This amended guidance requires that an acquiring entity recognize all the assets acquired and liabilities assumed in a transaction at the acquisition date fair value with limited exceptions. This guidance changed the accounting treatment for acquisition costs, non-controlling interests, contingent liabilities, in-process research and development, restructuring costs, and income taxes. In addition, it also requires a substantial number of new disclosure requirements. This guidance applies to business combinations for which the acquisition date is on or after the beginning of the first annual reporting period beginning on or after December 15, 2008. We adopted this guidance in the first quarter of 2009. The adoption of this guidance did not have a material impact on our consolidated financial statements.
77
Table of Contents
NOTES TO CONSOLIDATED FINANCIAL STATEMENTS—(CONTINUED)
December 27, 2009 (in thousands, except per share amounts)
| 2 | NOTES PAYABLE TO BANKS |
We have an unsecured revolving facility that expires on June 2, 2011. The interest rate on borrowings is either LIBOR plus a margin that ranges from 37.5 basis points to 87.5 basis points, depending on our leverage, or the base rate, which equals the higher of the prime rate set by U.S. Bank, N.A. or the Federal Funds Rate plus 100 basis points. At December 27, 2009 and December 28, 2008, the borrowings under the facility were at a weighted average interest rate of 1.00% and 2.10%, respectively. Fees in connection with the facility of $1,717 are being amortized over the term of the facility using the straight-line method which approximates the effective interest method. This agreement includes the following two financial covenants:
| • | A consolidated funded debt ratio of not greater than 4-to-1, as determined for the four fiscal quarter periods preceding the date of determination. This ratio compares, for any period, our funded debt to our earnings before interest, taxes, depreciation and amortization, as adjusted for non-operational impairment charges recorded as a result of applying the FASB’s guidance for impairment testing for goodwill and other intangible assets not subject to amortization. As of December 27, 2009, we were in compliance with this financial covenant. |
| • | An interest coverage ratio of not less than 3-to-1, as determined for the four fiscal quarter periods preceding the date of determination. This ratio compares, for any period, our earnings before interest, taxes, depreciation and amortization, as adjusted for non-operational impairment charges recorded as a result of applying the FASB’s guidance for impairment testing for goodwill and other intangible assets not subject to amortization to our interest expense. As of December 27, 2009, we were in compliance with this financial covenant. |
If actual operating results and cash flows over the next 12 months are lower than current projections, the margins by which we will comply with the covenants will decrease. In a recessionary economy, a significant risk to achieving our projections is meeting our revenue, earnings and debt forecasts. To remain in compliance with the terms of our credit agreement, we could face increased pressure to reduce or delay capital expenditures, dispose of assets or operations, further reduce the size of our workforce or take other steps to revise our capital structure or our business operations. In addition, to remain in compliance with the terms of our credit agreement, we may seek to amend or replace our current credit facility with one or more capital sources on appropriate terms. We cannot assure you that we will have the ability to take any of these actions or that these actions would be successful. If it is determined we are not in compliance with these financial covenants, the lenders in our credit facility syndicate will be entitled to take certain actions, including acceleration of all amounts due under the facility. If the lenders take such action, we may be forced to amend the terms of the credit agreement, obtain a waiver or find alternative sources of capital. If we are unable to obtain alternative sources of capital, it may be necessary to significantly restructure our business.
Given the current economic environment, one or more of the lenders in our credit facility syndicate could fail or be unable to fund future draws thereunder or take other positions adverse to us. In such an event, our liquidity could be severely constrained with an adverse impact on our ability to operate our businesses and we may be forced to take the actions described above. We continue to monitor the financial status of our current lenders and compliance with our credit agreement terms and are working on possible strategies in the event one or more of our lenders is unable or unwilling to fund future borrowing requests.
78
Table of Contents
NOTES TO CONSOLIDATED FINANCIAL STATEMENTS—(CONTINUED)
December 27, 2009 (in thousands, except per share amounts)
| 2 | NOTES PAYABLE TO BANKS continued |
The following table presents the carrying amount and estimated fair value of our unsecured revolving facility as of December 27, 2009 and December 28, 2008:
| 2009 | 2008 | |||||||||||
| Carrying Amount |
Fair Value | Carrying Amount |
Fair Value | |||||||||
| Unsecured revolving facility |
$ | 151,375 | $ | 143,657 | $ | 215,090 | $ | 195,375 | ||||
We estimated the fair value based on discounted cash flows and current borrowing rates.
| 3 | EMPLOYEE BENEFIT PLANS |
We have a defined benefit pension plan covering certain employees. The plan provides benefits based on years of service and the average compensation for the employee’s last five years of employment. Plan assets consist primarily of listed stocks and government and other bonds. The Pension Protection Act of 2006 was signed into law on August 17, 2006. The law was effective for the plan year 2008 and primarily changed employer funding rules of defined benefit pension plans. This law did not have a significant effect on funding to our plans.
In addition, we provide postretirement health benefits to certain retirees and their eligible spouses and certain full-time active employees who did not attain age 50 by December 31, 2006. Full-time active employees who retire after April 1, 2007 do not receive an employer contribution for health benefits after attaining age 65. Due to certain plan changes, we do not expect the plan will qualify for actuarial equivalent pharmaceutical benefits under the Medicare Part D federal subsidy.
We also sponsor an unfunded non-qualified pension plan for certain employees whose benefits under the pension plan and the 401(k) plan may be restricted due to limitations imposed by the Internal Revenue Service. The disclosure for the unfunded non-qualified pension plan for all years presented is combined with the defined benefit pension plan.
| Pension Benefits | Other Postretirement Benefits |
|||||||||||||||
| Years ended December 27 and December 28 |
2009 | 2008 | 2009 | 2008 | ||||||||||||
| Change in benefit obligations |
||||||||||||||||
| Benefit obligation at beginning of year |
$ | 138,131 | $ | 128,941 | $ | 18,316 | $ | 20,216 | ||||||||
| Service cost |
1,088 | 2,270 | 69 | 105 | ||||||||||||
| Interest cost |
9,002 | 8,243 | 1,078 | 1,260 | ||||||||||||
| Actuarial (gain) loss |
11,512 | 7,028 | 562 | (1,125 | ) | |||||||||||
| Benefits paid |
(8,331 | ) | (8,351 | ) | (2,092 | ) | (2,140 | ) | ||||||||
| Curtailment gain |
(778 | ) | — | — | — | |||||||||||
| Benefit obligation at end of year |
$ | 150,624 | $ | 138,131 | $ | 17,933 | $ | 18,316 | ||||||||
| Change in plan assets |
||||||||||||||||
| Fair value of plan assets at beginning of year |
$ | 90,820 | $ | 138,372 | $ | — | $ | — | ||||||||
| Actual gain (loss) on plan assets |
21,842 | (39,467 | ) | — | — | |||||||||||
| Company contributions |
246 | 266 | 2,092 | 2,140 | ||||||||||||
| Benefits paid |
(8,331 | ) | (8,351 | ) | (2,092 | ) | (2,140 | ) | ||||||||
| Fair value of plan assets at end of year |
$ | 104,577 | $ | 90,820 | $ | — | $ | — | ||||||||
79
Table of Contents
NOTES TO CONSOLIDATED FINANCIAL STATEMENTS—(CONTINUED)
December 27, 2009 (in thousands, except per share amounts)
| 3 | EMPLOYEE BENEFIT PLANS continued |
| Pension Benefits | Other Postretirement Benefits |
|||||||||||||||
| Years ended December 27 and December 28 |
2009 | 2008 | 2009 | 2008 | ||||||||||||
| Funded status |
$ | (46,047 | ) | $ | (47,311 | ) | $ | (17,933 | ) | $ | (18,316 | ) | ||||
| Amounts recognized in consolidated balance sheets |
||||||||||||||||
| Current liabilities |
$ | (317 | ) | $ | (289 | ) | $ | (1,319 | ) | $ | (1,624 | ) | ||||
| Noncurrent liabilities |
(45,730 | ) | (47,022 | ) | (16,614 | ) | (16,692 | ) | ||||||||
| Total |
$ | (46,047 | ) | $ | (47,311 | ) | $ | (17,933 | ) | $ | (18,316 | ) | ||||
| Amounts recognized in accumulated other comprehensive loss |
||||||||||||||||
| Actuarial loss, net |
$ | 57,442 | $ | 58,132 | $ | 1,275 | $ | 713 | ||||||||
| Prior service credit |
(1,308 | ) | (1,989 | ) | (1,440 | ) | (1,659 | ) | ||||||||
| Transition obligation |
— | — | 1,644 | 2,193 | ||||||||||||
| Deferred income tax asset |
(22,532 | ) | (22,534 | ) | (594 | ) | (501 | ) | ||||||||
| Total |
$ | 33,602 | $ | 33,609 | $ | 885 | $ | 746 | ||||||||
The accumulated benefit obligation for the pension plans was $143,767 and $129,955 at December 27, 2009 and December 28, 2008, respectively.
| Pension Benefits | ||||||||||||
| Years ended December 27, December 28 and December 30 |
2009 | 2008 | 2007 | |||||||||
| Components of net periodic benefit cost |
||||||||||||
| Service cost |
$ | 1,088 | $ | 2,270 | $ | 4,148 | ||||||
| Interest cost |
9,002 | 8,243 | 8,713 | |||||||||
| Expected return on plan assets |
(10,600 | ) | (11,103 | ) | (10,524 | ) | ||||||
| Curtailment gain |
(492 | ) | — | — | ||||||||
| Amortization of: |
||||||||||||
| Unrecognized prior service credit |
(189 | ) | (219 | ) | (269 | ) | ||||||
| Unrecognized net loss |
182 | — | 1,360 | |||||||||
| Net periodic benefit cost included in operating costs and expenses and selling and administrative expenses |
$ | (1,009 | ) | $ | (809 | ) | $ | 3,428 | ||||
We recorded a $353 pension plan curtailment gain due to an amendment to the plans adopted on March 25, 2009. The amendment suspended benefit accruals in our qualified and non-qualified plans for all active plan participants for the 18-month period beginning July 1, 2009. Due to the plan amendment, measurements of both plan assets and obligations were calculated. We recorded an additional $139 pension plan curtailment gain as a result of the 2009 workforce reductions.
80
Table of Contents
NOTES TO CONSOLIDATED FINANCIAL STATEMENTS—(CONTINUED)
December 27, 2009 (in thousands, except per share amounts)
| 3 | EMPLOYEE BENEFIT PLANS continued |
In 2007, we recorded pension plan curtailment gains of $632 as the result of the sales of Norlight Telecommunications, Inc. (Norlight) and Journal Community Publishing Group’s Ohio publishing and printing, Louisiana publishing and New England publishing and printing operations. The curtailment gains were recorded in discontinued operations and are not reflected in the above table. The net periodic pension benefit cost related to these operations was $231 and is reported in discontinued operations.
| Other Postretirement Benefits | ||||||||||||
| Years ended December 27, December 28 and December 30 |
2009 | 2008 | 2007 | |||||||||
| Components of net periodic benefit cost |
||||||||||||
| Service cost |
$ | 69 | $ | 105 | $ | 137 | ||||||
| Interest cost |
1,078 | 1,260 | 1,181 | |||||||||
| Amortization of: |
||||||||||||
| Unrecognized prior service credit |
(219 | ) | (219 | ) | (219 | ) | ||||||
| Unrecognized net transition obligation |
549 | 549 | 549 | |||||||||
| Unrecognized net loss |
— | — | 155 | |||||||||
| Net periodic benefit cost included in selling and administrative expense |
$ | 1,477 | $ | 1,695 | $ | 1,803 | ||||||
The unrecognized net loss and prior service credit for the defined benefit plans that is expected to be amortized from accumulated other comprehensive income into net periodic benefit cost over the next fiscal year is $2,718 and ($163), respectively. The prior service credit and transition obligation for the other postretirement plan that is expected to be amortized from other accumulated comprehensive income into net periodic benefit cost over the next fiscal year is ($219) and $549, respectively.
The costs for our pension benefits and other postretirement benefits are actuarially determined. Key assumptions utilized at the measurement dates of December 27, 2009 and December 28, 2008 for pension benefits and for other postretirement benefits include the following:
Weighted-average assumptions used to determine benefit obligations:
| Pension Benefits | Other Postretirement Benefits |
|||||||||||
| December 27 and December 28 |
2009 | 2008 | 2009 | 2008 | ||||||||
| Discount rate |
5.70 | % | 6.50 | % | 5.50 | % | 6.15 | % | ||||
| Rate of compensation increases |
4.80 | 4.80 | — | — | ||||||||
Weighted-average assumptions used to determine net periodic benefit cost:
| Pension Benefits | Other Postretirement Benefits |
|||||||||||||||||
| Years ended December 27 and December 28 |
2009 | 2008 | 2007 | 2009 | 2008 | 2007 | ||||||||||||
| Discount rate |
6.50 | % | 6.60 | % | 5.90 | % | 6.15 | % | 6.50 | % | 5.75 | % | ||||||
| Expected return on plan assets |
8.50 | 8.50 | 8.50 | — | — | — | ||||||||||||
| Rate of compensation increases |
4.80 | 4.80 | 4.00 | — | — | — | ||||||||||||
Due to the amendments to the pension plans, the measurement of the net periodic benefit cost from the beginning of the year through March 25, 2009 was based upon a 6.50% discount rate. The measurement of the net periodic pension benefit cost from the amendment date to the end of 2009 was based upon a 7.10% discount rate.
81
Table of Contents
NOTES TO CONSOLIDATED FINANCIAL STATEMENTS—(CONTINUED)
December 27, 2009 (in thousands, except per share amounts)
| 3 | EMPLOYEE BENEFIT PLANS continued |
Due to the sale of Norlight, the measurement of the net periodic benefit cost from February 26, 2007 until the sale of all three regional publishing and printing operations of our community newspapers and shoppers business was based upon a 5.75% discount rate. The measurement of the net periodic pension benefit cost from the time of the sale of all three regional publishing and printing operations of our community newspapers and shoppers business to the end of 2007 was based upon a 6.35% discount rate.
To determine the discount rate assumptions for the pension and the postretirement benefit plans, we studied our plans’ specific discount rate by matching our projected benefit payments to a yield curve developed from high grade corporate bonds. The results of those studies were used as the benchmark to determine the discount rate assumptions.
We studied historical markets to determine the long-term rate of return assumption for plan assets. We preserved the long-term historical relationships between equities and fixed-income securities, consistent with the widely accepted capital market principle that assets with higher volatility generate a greater return over the long run. We evaluate current market factors such as inflation and interest rates before we determine long-term capital market assumptions. We review peer data and historical returns to check for reasonableness and appropriateness.
The assumed health care cost trend rate used in measuring the postretirement benefit obligation for retirees for 2010 is 10.0%, grading down to 5.0% in the year 2020 and thereafter. The assumed health care cost trend rates have a significant effect on the amounts reported for other postretirement benefits. A 1% change in the assumed health care cost trend rate would have the following effects.
| 1% Increase |
1% Decrease |
||||||
| Effect on total of service and interest cost components in 2009 |
$ | 20 | $ | (18 | ) | ||
| Effect on postretirement benefit obligation as of December 27, 2009 |
$ | 303 | $ | (276 | ) | ||
Plan Assets
The following table presents the fair value of our plan assets by level of the fair value hierarchy. In accordance with the FASB’s guidance for fair value measurements, level 1 inputs are quoted prices in active markets for identical assets; level 2 inputs are significant other observable inputs; and level 3 inputs are significant unobservable inputs.
| Description |
Level 1 Inputs |
Level 2 Inputs |
Level 3 Inputs |
Total | ||||||||||
| Common stocks |
$ | 9,265 | $ | — | $ | — | $ | 9,265 | ||||||
| Mutual funds |
81,145 | — | — | 81,145 | ||||||||||
| Money-market fund |
504 | — | — | 504 | ||||||||||
| Collective trust fund |
— | 13,710 | — | 13,710 | ||||||||||
| 90,914 | 13,710 | — | 104,624 | |||||||||||
| Unsettled trades of common stock |
(47 | ) | — | — | (47 | ) | ||||||||
| Fair value of plan assets |
$ | 90,867 | $ | 13,710 | — | $ | 104,577 | |||||||
82
Table of Contents
NOTES TO CONSOLIDATED FINANCIAL STATEMENTS—(CONTINUED)
December 27, 2009 (in thousands, except per share amounts)
| 3 | EMPLOYEE BENEFIT PLANS continued |
Our pension plan weighted average asset allocations at December 27, 2009 and December 28, 2008 by asset category are as follows:
| Plan Assets | ||||||
| December 27 and December 28 |
2009 | 2008 | ||||
| Equity securities |
70.0 | % | 62.4 | % | ||
| Fixed-income securities |
29.6 | 36.8 | ||||
| Other |
0.4 | 0.8 | ||||
| Total |
100.0 | % | 100.0 | % | ||
We employ a total return investment approach whereby a mix of equity and fixed-income investment funds are used to maximize the long-term return of plan assets for a prudent level of risk. We establish our risk tolerance through careful consideration of plan liabilities, plan funded status, and our financial condition. The investment portfolio contains a diversified blend of equity and debt investments. The equity component is diversified across U.S. and non-U.S. stocks, as well as growth, value and small and large capitalization stocks. The fixed-income component is diversified across the maturity, quality and sector spectrum. The portfolio may also hold cash equivalents. Fund managers may use derivatives only if the vehicle is deemed by the manager to be more attractive than a similar direct investment in the underlying cash market, or if the vehicle is being used to manage risk of the portfolio. Derivatives, however, may not be used in a speculative manner or to leverage the portfolio. We measure and monitor investment risk on an ongoing basis through quarterly investment portfolio reviews, annual liability measurements, and periodic asset/liability allocation studies. The asset mix guidelines for the plan are as follows:
| Percent of Total Portfolio | |||||||||
| Minimum | Target | Maximum | |||||||
| Large capitalization U.S. stocks |
30.0 | % | 35.0 | % | 40.0 | % | |||
| Small capitalization U.S. stocks |
15.0 | 20.0 | 25.0 | ||||||
| International stock |
10.0 | 15.0 | 20.0 | ||||||
| Fixed-income securities |
20.0 | 25.0 | 35.0 | ||||||
| Cash equivalents |
— | 5.0 | 5.0 | ||||||
Contributions
We fund our defined benefit pension plan at the minimum amount required by the Pension Protection Act of 2006. We do not expect to contribute to our qualified defined benefit pension plan in 2010 and 2011. We expect to contribute $317 and $418 to our unfunded non-qualified pension plan in 2010 and 2011, respectively.
83
Table of Contents
NOTES TO CONSOLIDATED FINANCIAL STATEMENTS—(CONTINUED)
December 27, 2009 (in thousands, except per share amounts)
| 3 | EMPLOYEE BENEFIT PLANS continued |
Benefit Payments
The following benefit payments, which reflect expected future service, as appropriate, are expected to be paid with future contributions to the plan or directly from plan assets, as follows:
| Pension Benefits |
Other Postretirement Benefits | |||||
| 2010 |
$ | 8,693 | $ | 1,319 | ||
| 2011 |
8,889 | 1,356 | ||||
| 2012 |
9,040 | 1,384 | ||||
| 2013 |
9,129 | 1,406 | ||||
| 2014 |
9,306 | 1,437 | ||||
| 2015-2019 |
50,434 | 7,451 | ||||
The 401(k) plan is a defined contribution benefit plan covering substantially all employees. The plan allows employees to defer up to 50% of their eligible wages, up to the IRS limit, on a pre-tax basis. In addition, employees can contribute up to 50% of their eligible wages after taxes. The maximum combined total contribution may not exceed 50% of each employee’s eligible wages. Each employee who elects to participate is eligible to receive company matching contributions. We may contribute $0.50 for each dollar contributed by the participant, up to 5% of eligible wages as defined by the 401(k) plan. In February 2009, we suspended our matching contributions to our 401(k) plan and we expect to continue this suspension through at least mid-2010. The matching contributions, recorded as an operating expense, were $437, $2,399, and $2,177 in 2009, 2008, and 2007, respectively. Included in the 2007 matching contributions are contributions to the employees of Norlight and the three regional publishing and printing operations of our community newspapers and shoppers business that were sold in 2007 of $68. Norlight and the three regional publishing and printing operations of our community newspapers and shoppers business that were sold are reported as discontinued operations.
We made additional contributions into the 401(k) on behalf of certain employees not covered by the defined benefit pension plan and for employees who elected to freeze their defined pension benefits under our Annual Employer Contribution (AEC) plan. In March 2009, our board of directors approved an amendment to our 401(k) plan to suspend the AEC contribution for all active employees for 18 months beginning July 1, 2009. Our AEC contributions, recorded as an operating expense, were $873, $2,103, and $2,140 in 2009, 2008, and 2007, respectively.
84
Table of Contents
NOTES TO CONSOLIDATED FINANCIAL STATEMENTS—(CONTINUED)
December 27, 2009 (in thousands, except per share amounts)
| 4 | INCOME TAXES |
The components of the provision (benefit) for income taxes consist of the following:
| Years ended December 27, December 28 and December 30 |
2009 | 2008 | 2007 | |||||||||
| Current: |
||||||||||||
| Federal |
$ | 1,132 | $ | 459 | $ | 23,249 | ||||||
| State |
(845 | ) | 1,006 | 4,652 | ||||||||
| Total current |
287 | 1,465 | 27,901 | |||||||||
| Deferred: |
||||||||||||
| Federal |
232 | (93,585 | ) | (211 | ) | |||||||
| State |
881 | (13,920 | ) | (1,064 | ) | |||||||
| Total deferred |
1,113 | (107,505 | ) | (1,275 | ) | |||||||
| Total provision (benefit) for income taxes for continuing operations |
$ | 1,400 | $ | (106,040 | ) | $ | 26,626 | |||||
| Current: |
||||||||||||
| Federal |
$ | — | $ | — | $ | 35,973 | ||||||
| State |
— | — | 7,277 | |||||||||
| Total provision for income taxes for discontinued operations |
$ | — | $ | — | $ | 43,250 | ||||||
The significant differences between the statutory federal income tax rates and the effective income tax rates are as follows:
| Years ended December 27, December 28 and December 30 |
2009 | 2008 | 2007 | ||||||
| Statutory federal income (benefit) tax rate |
35.0 | % | (35.0 | )% | 35.0 | % | |||
| State income taxes, net of federal tax benefit |
8.3 | (2.5 | ) | 3.3 | |||||
| Goodwill and broadcast license impairment |
— | 5.7 | — | ||||||
| Recognition of uncertain tax benefits |
(21.0 | ) | — | — | |||||
| Non-deductible meals and entertainment expenses |
3.2 | (0.1 | ) | 0.5 | |||||
| Domestic production deduction |
(1.4 | ) | — | (0.5 | ) | ||||
| Other |
0.4 | (0.2 | ) | (0.1 | ) | ||||
| Effective income tax (benefit) rate |
24.5 | % | (32.1 | )% | 38.2 | % | |||
85
Table of Contents
NOTES TO CONSOLIDATED FINANCIAL STATEMENTS—(CONTINUED)
December 27, 2009 (in thousands, except per share amounts)
| 4 | INCOME TAXES continued |
Temporary differences that give rise to the deferred tax assets and liabilities at December 27, 2009 and December 28, 2008 are as follows:
| 2009 | 2008 | |||||||
| Current assets |
||||||||
| Receivables |
$ | 1,517 | $ | 1,683 | ||||
| Inventories |
89 | 79 | ||||||
| Other assets |
548 | 675 | ||||||
| Accrued compensation |
2,038 | 2,061 | ||||||
| Accrued employee benefits |
957 | 1,075 | ||||||
| Total current deferred tax assets |
5,149 | 5,573 | ||||||
| Current liabilities |
||||||||
| Accrued state income taxes |
(250 | ) | (704 | ) | ||||
| Total current deferred tax liabilities |
(250 | ) | (704 | ) | ||||
| Total net current deferred tax assets |
$ | 4,899 | $ | 4,869 | ||||
| Non-current assets |
||||||||
| Accrued employee benefits |
$ | 23,658 | $ | 24,030 | ||||
| State deferred income taxes |
6,400 | 6,838 | ||||||
| State net operating loss and tax credit carryforwards |
2,406 | 2,584 | ||||||
| Intangible assets |
48,527 | 51,065 | ||||||
| Other assets |
262 | 295 | ||||||
| Valuation allowances on state net operating loss and tax credit carryforwards |
(202 | ) | (322 | ) | ||||
| Total non-current deferred tax assets |
81,051 | 84,490 | ||||||
| Non-current liabilities |
||||||||
| Property and equipment |
(17,683 | ) | (16,762 | ) | ||||
| Other liabilities |
— | (3,308 | ) | |||||
| Total non-current deferred tax liabilities |
(17,683 | ) | (20,070 | ) | ||||
| Total net non-current deferred tax assets |
$ | 63,368 | $ | 64,420 | ||||
We deduct broadcast licenses and tax-deductible goodwill over a period of 15 years from the date of acquisition. The non-cash goodwill and broadcast license impairment charges recorded during 2009 and 2008 are not currently deductible for income tax purposes and have caused us to recognize a deferred tax asset. We believe it is more likely than not that we will realize a tax benefit for our of our deferred tax assets and we believe that they will be utilized to offset future taxable income over the next 20 years in accordance with current income tax law. In the future, we may be required to record a valuation allowance against our deferred tax assets if we have future operating losses or reductions in our expected future profitability which would cause us to believe we would be unable to utilize them.
At December 27, 2009, we have $2,406 of tax-effected state net operating loss carryforwards available to offset against future taxable income over the next 20 years. The net operating losses begin expiring in 2010. To the extent we believe it is more likely than not that certain of the net operating loss carryforwards will expire unused, we have recorded $202 in valuation allowances.
86
Table of Contents
NOTES TO CONSOLIDATED FINANCIAL STATEMENTS—(CONTINUED)
December 27, 2009 (in thousands, except per share amounts)
| 4 | INCOME TAXES continued |
We file tax returns in the United States federal jurisdiction, as well as approximately 15 state and local jurisdictions. The statute of limitations for assessing additional taxes is three years for federal purposes and typically between three and four years for state and local purposes. Accordingly, our 2006 through 2008 tax returns are open for federal purposes, and our 2005 through 2008 tax returns remain open for state tax purposes, unless the statute of limitations has been previously extended. Currently, we are under audit in Wisconsin for our 2003 through 2007 tax returns, Florida for our 2006 through 2008 tax returns and Illinois for our 2006 and 2007 tax returns.
The following table summarizes the activity related to our unrecognized tax benefits during 2009, 2008 and 2007:
| 2009 | 2008 | 2007 | ||||||||||
| Beginning balance |
$ | 2,478 | $ | 2,408 | $ | 3,088 | ||||||
| Increases related to current year tax provisions |
112 | 747 | — | |||||||||
| Increases due to prior year tax provisions |
— | — | 115 | |||||||||
| Decreases related to prior year tax provisions |
(283 | ) | (236 | ) | — | |||||||
| Decreases due to the expiration of statutes of limitations |
(188 | ) | — | (795 | ) | |||||||
| Decreases due to settlements |
(1,061 | ) | (441 | ) | — | |||||||
| Ending balance |
$ | 1,058 | $ | 2,478 | $ | 2,408 | ||||||
As of December 27, 2009, our liability for unrecognized tax benefits was $1,058, which, if recognized, $945 would have an impact on our effective tax rate. As of December 27, 2009, it is possible for $568 in unrecognized tax benefits and related interest to be recognized within the next 12 months due to settlements with taxing authorities.
We recognize interest income/expense and penalties related to unrecognized tax benefits in our provision for income taxes. As of December 27, 2009 and December 28, 2008, we had $374 and $1,224, respectively, accrued for interest expense and penalties. During 2009 and 2008, we recognized $418 in interest income and $103 in interest expense, respectively, related to unrecognized tax benefits. Our liability for interest and penalties decreased by $433 due to a reduction for a state audit settlement and the expiration of statutes of limitations.
During the second quarter of 2009, as a result of a settlement with the Wisconsin Department of Revenue, we received a refund of $8,693 of an income and franchise tax audit payment made in 2007. The 2007 payment was reported in other assets in the consolidated balance sheet as of December 28, 2008.
87
Table of Contents
NOTES TO CONSOLIDATED FINANCIAL STATEMENTS—(CONTINUED)
December 27, 2009 (in thousands, except per share amounts)
| 5 | COMMITMENTS |
We lease office space, certain broadcasting facilities, distribution centers, buildings used for printing plants and equipment under both short-term and long-term leases accounted for as operating leases. Some of the lease agreements contain renewal options and rental escalation clauses, as well as provisions for the payment of utilities, maintenance and taxes. As of December 27, 2009, our future minimum rental payments due under noncancellable operating lease agreements consist of the following:
| 2010 |
$ | 4,471 | |
| 2011 |
3,377 | ||
| 2012 |
2,600 | ||
| 2013 |
1,164 | ||
| 2014 |
955 | ||
| Thereafter |
3,214 | ||
| $ | 15,781 | ||
Our publishing businesses lease print equipment and delivery trucks accounted for as capital leases. As of December 27, 2009, our future minimum rental payments due under capital lease agreements consist of the following:
| 2010 |
$ | 334 | |
| 2011 |
325 | ||
| 2012 |
223 | ||
| 2013 |
8 | ||
| 2014 |
— | ||
| Thereafter |
— | ||
| $ | 890 | ||
Rent expense charged to operations for 2009, 2008, and 2007 was $6,609, $7,080, and $7,245, respectively. We amortize rent expense on a straight-line basis for leases with rent escalation clauses. Rental income from subleases included in operations for 2009, 2008 and 2007 was $6, $33, and $423, respectively. There were no noncancellable subleases as of December 27, 2009.
We have purchase commitments related to printing equipment and truck leases for our publishing business of approximately $9 and $284, respectively, as of December 27, 2009. For our broadcasting business we have purchase commitments as of December 27, 2009 related to a sales order entry and billing system for $5,142, audience research services for $3,667, telephone and data services for $1,275, and a support agreement for a news production system for $150.
We have $2,470 of standby letters of credit for business insurance purposes.
Over the next five years, we are committed to purchase and provide advertising time in the amount of $10,386 for television program rights that currently are not available for broadcast, including programs not yet produced. If such programs are not produced, our corresponding commitment would expire without obligation.
We provided a guarantee to the landlord of our former New England community newspapers and shopper business, which was sold in 2007, with respect to tenant liabilities and obligations associated with a lease which
88
Table of Contents
NOTES TO CONSOLIDATED FINANCIAL STATEMENTS—(CONTINUED)
December 27, 2009 (in thousands, except per share amounts)
| 5 | COMMITMENTS continued |
expires in December 2016. Our maximum potential obligation pursuant to the guarantee is $1,218 as of December 27, 2009. As part of the sales transaction, we received a guarantee from the buyer of our New England business that they will satisfy all the liabilities and obligations of the assigned lease. In the event that they fail to satisfy their liabilities and obligations and the landlord invokes our guarantee, we have a right to indemnification from the buyer.
| 6 | SHAREHOLDERS’ EQUITY |
We have three classes of common stock. Class C shares are held by Matex Inc., members of the family of our former chairman Harry J. Grant, trusts for the benefit of members of the family (which we collectively refer to as the “Grant family shareholders”) and Proteus Fund, Inc., a non-profit organization. The class C shares are entitled to two votes per share. These shares are convertible into class A shares or a combination of class A and class B shares at any time at the option of the holder. Dividends on class C shares are cumulative and equal to the dividends declared on the class A and class B shares, provided that the dividend will not be less than approximately $0.57 per year. Cash dividends may be declared and paid with respect to class C common stock without concurrent cash dividends on the class A and class B shares. Class B shares are held by our current and former employees, our non-employee directors and Grant family shareholders. These shares are entitled to ten votes per share, and are convertible to class A shares at the option of the holder after first offering to sell them to other eligible purchasers through the offer procedures set forth in our articles of incorporation. Dividends on Class B shares are equal to those declared on the class A shares. Cash dividends on class A and class B shares may not be paid until cumulative dividends on class C shares are paid. Class A shares are publicly traded on the New York Stock Exchange under the symbol “JRN”.
The changes in the number of shares of our common stock during 2009, 2008 and 2007 are as follows (in thousands):
| Common Stock | ||||||||
| Class C | Class B | Class A | ||||||
| Balance at December 31, 2006 |
3,264 | 18,232 | 48,141 | |||||
| Conversion of class B shares to class A shares |
— | (3,623 | ) | 3,623 | ||||
| Shares repurchased |
— | (3,200 | ) | (6,412 | ) | |||
| Shares issued under equity incentive and employee stock purchase plans |
— | 119 | — | |||||
| Balance at December 30, 2007 |
3,264 | 11,528 | 45,352 | |||||
| Conversion of class B shares to class A shares |
— | (1,958 | ) | 1,958 | ||||
| Shares repurchased |
— | — | (6,757 | ) | ||||
| Shares issued under equity incentive and employee stock purchase plans |
— | 369 | — | |||||
| Balance at December 28, 2008 |
3,264 | 9,939 | 40,553 | |||||
| Conversion of class B shares to class A shares |
— | (1,230 | ) | 1,230 | ||||
| Shares issued under equity incentive and employee stock purchase plans |
— | 933 | — | |||||
| Balance at December 27, 2009 |
3,264 | 9,642 | 41,783 | |||||
89
Table of Contents
NOTES TO CONSOLIDATED FINANCIAL STATEMENTS—(CONTINUED)
December 27, 2009 (in thousands, except per share amounts)
| 7 | STOCK-BASED COMPENSATION |
2007 Journal Communications, Inc. Omnibus Incentive Plan
The purpose of the 2007 Journal Communications, Inc. Omnibus Incentive Plan (2007 Plan) is to promote our success by linking personal interests of our employees, officers and directors to those of our shareholders, and by providing participants with an incentive for outstanding performance. The 2007 Plan is also intended to enhance our ability to attract, motivate and retain the services of employees, officers, and directors upon whose judgment, interest, and special effort the successful conduct of our operation is largely dependent.
Subject to adjustment as provided in the 2007 Plan, the aggregate number of shares of class A common stock or class B common stock reserved and available for issuance pursuant to awards granted under the 2007 Plan is 4,800,000 shares which may be awarded in the form of nonstatutory or incentive stock options, stock appreciation rights, restricted stock, restricted or deferred stock units, performance awards, dividend equivalents or other stock-based awards. The 2007 Plan also provides for the issuance of cash-based awards. The 2007 Plan replaced the 2003 Equity Incentive Plan (2003 Plan) and, as of May 3, 2007, all equity grants are made from the 2007 Plan. We will not grant any additional awards under the 2003 Plan. As of December 27, 2009, there are 3,382,781 shares available for issuance under the 2007 Plan.
2003 Equity Incentive Plan
Our 2003 Plan, which was replaced in May 2007 by our 2007 Plan, rewarded key employees for achieving designated corporate and individual performance goals and allowed for issuances to outside directors as part of their board compensation package. In February 2007, our board of directors approved and adopted an amendment to our 2003 Plan to provide for the inclusion of stock-settled stock appreciation rights as a permitted form of award under the Plan. Awards to outside directors could have been granted in any one or a combination of stock appreciation rights, stock grants, nonstatutory stock options, performance unit grants and stock unit grants. Incentive stock options could have been granted to employees.
During the years ended December 27, 2009, December 28, 2008 and December 30, 2007, we recognized $1,388, $1,608 and $1,838, respectively, in stock-based compensation expense, including $96 recorded in gain from discontinued operations in 2007. Total income tax benefit recognized related to stock-based compensation for the years ended December 27, 2009, December 28, 2008 and December 30, 2007 was $341, $515 and $702, respectively. We recognize stock-based compensation expense on a straight-line basis over the service period based upon the fair value of the award on the grant date. As of December 27, 2009, total unrecognized compensation cost related to stock-based awards was $1,246, net of estimated forfeitures, which we expect to recognize over a weighted average period of 0.9 years. Stock-based compensation expense is reported in selling and administrative expenses and gain on discontinued operations in our consolidated statements of operations.
Nonstatutory stock options
The compensation committee of our board of directors has granted nonstatutory stock options to employees and directors at a purchase price equal to at least the fair market value of our class B common stock on the grant date for an exercise term determined by the committee, not to exceed 10 years from the grant date. It is our policy to issue new class B common stock upon the exercise of nonstatutory stock options.
In 2003 and 2004, our directors and certain of our employees were granted options to purchase class B common stock. These options are exercisable and will remain exercisable for a period of up to seven years from the grant date. There have been no options granted since 2004.
90
Table of Contents
NOTES TO CONSOLIDATED FINANCIAL STATEMENTS—(CONTINUED)
December 27, 2009 (in thousands, except per share amounts)
| 7 | STOCK-BASED COMPENSATION continued |
A summary of stock option activity during 2009 is:
| Options | Weighted Average Exercise Price |
Weighted Average Contractual Term (years) | ||||||
| Outstanding at December 28, 2008 |
47,500 | $ | 18.14 | |||||
| Expired |
(6,000 | ) | 17.86 | |||||
| Outstanding and exercisable at December 27, 2009 |
41,500 | 18.18 | 1.4 | |||||
The aggregate intrinsic value of stock options outstanding and exercisable at the end of 2009 is zero because the fair market value of our class B common stock on December 27, 2009 was lower than the exercise price of the options.
Stock appreciation rights
A stock appreciation right, or SAR, represents the right to receive an amount equal to the excess of the fair value of a share of our class B common stock on the exercise date over the base value of the SAR, which shall not be less than the fair value of a share of our class B common stock on the grant date. Each SAR is settled only in shares of our class B common stock. The term during which any SAR may be exercised is 10 years from the grant date, or such shorter period as determined by the compensation committee of our board of directors.
Our SARs vest over a three year graded vesting schedule and it is our policy to recognize compensation expense for awards with graded vesting on a straight-line basis over the vesting period for the entire award. We ensure the compensation expense recognized at any date is at least equal to the portion of the grant-date value of the award that is vested at that date. The fixed price SARs have a fixed base value equal to the closing price of our class A common stock on the date of grant. The escalating price SARs have an escalating base value that starts with the closing price of our class A common stock on the date of grant and increases by six percent per year for each year that the SARs remain outstanding, starting on the first anniversary of the grant date.
A summary of SAR activity during 2009 is as follows:
| SARs | Weighted Average Exercise Price |
Weighted Average Contractual Term (years) | ||||||
| Outstanding at December 28, 2008 |
1,331,000 | $ | 10.56 | |||||
| Forfeited |
(247,793 | ) | 9.92 | |||||
| Outstanding at December 27, 2009 |
1,083,207 | 10.71 | 7.6 | |||||
| Exercisable at December 27, 2009 |
590,409 | 11.51 | 7.8 | |||||
The aggregate intrinsic value of the SARs outstanding and exercisable at the end of 2009 is zero because the fair market value of our class B common stock on December 27, 2009 was lower than the exercise price of the SARs.
91
Table of Contents
NOTES TO CONSOLIDATED FINANCIAL STATEMENTS—(CONTINUED)
December 27, 2009 (in thousands, except per share amounts)
| 7 | STOCK-BASED COMPENSATION continued |
Fair value for SARs granted in 2008 was calculated using the Black-Scholes option pricing model, with the following weighted average assumptions:
| Dividend yield |
2.70 | % | ||
| Expected volatility |
26.00 | % | ||
| Risk-free rate of return of fixed price SARs |
3.41 | % | ||
| Risk-free rate of return of escalating price SARs |
3.54 | % | ||
| Expected life of fixed price SARs (in years) |
7.0 | |||
| Expected life of escalating price SARs (in years) |
7.5 | |||
| Weighted average fair value of fixed price SARs granted |
$ | 1.81 | ||
| Weighted average fair value of escalating price SARs granted |
$ | 1.03 |
Because we have no historical options or SARs exercise experience, the expected life of the fixed price SARs was based on the midpoint between the vesting date and the end of the contractual term and adjusted for the retirement provisions of our 2007 Plan. The expected life of the escalating price SARs was determined by adding a half of a year to the fixed price SARs to compensate for their higher exercise price. The risk free rate of return was based on the United States Treasury yield curve in effect on the date of grant for the respective life of the SAR. The dividend yield was based on the most recent annualized quarterly dividend payment divided by the average trailing twelve-month daily stock price and annualizing the rate. The expected volatility was based on the historical volatility of our common stock and was benchmarked to our peers’ historical volatility over the same time period.
Fair value for SARs granted in 2007 was calculated using the Black-Scholes option pricing model, with the following weighted average assumptions:
| Dividend yield |
2.60 | % | ||
| Expected volatility |
21.00 | % | ||
| Risk-free rate of return |
4.44 | % | ||
| Expected life of SARs (in years) |
6.0 | |||
| Weighted average fair value of fixed price SARs granted |
$ | 2.85 | ||
| Weighted average fair value of escalating price SARs granted |
$ | 1.36 |
Due to the lack of historical experience, the expected life was based on the midpoint between the vesting date and the end of the contractual term. The risk free rate of return was based on the United States Treasury yield curve in effect on the date of grant for the respective life of the SAR. The dividend yield was based on the most recent quarterly dividend payment divided by the average trailing twelve-month daily stock price and annualizing the rate. The expected volatility was based on the historical volatility of our common stock and was benchmarked to our peers’ historical volatility over the same time period.
Stock grants
The compensation committee of our board of directors has granted class B common stock to employees and directors under our 2003 Plan and our 2007 Plan. Each stock grant may have been accompanied by restrictions, or may have been made without any restrictions, as the compensation committee of our board of directors determined. Such restrictions could have included requirements that the participant remain in our continuous employment for a specified period of time, or that we or the participant meet designated performance goals. We
92
Table of Contents
NOTES TO CONSOLIDATED FINANCIAL STATEMENTS—(CONTINUED)
December 27, 2009 (in thousands, except per share amounts)
| 7 | STOCK-BASED COMPENSATION continued |
value non-vested restricted stock grants at the closing market prices of our class A common stock on the grant date. A summary of stock grant activity during 2009 is as follows:
| Shares | Weighted Average Fair Value | |||||
| Non-vested at December 28, 2008 |
325,600 | $ | 6.09 | |||
| Granted |
836,005 | 1.11 | ||||
| Vested |
(119,885 | ) | 5.24 | |||
| Forfeited |
(129,170 | ) | 2.12 | |||
| Non-vested at December 27, 2009 |
912,550 | 2.20 | ||||
Our non-vested restricted stock grants vest from one to five years from the grant date. We expect our non-vested restricted stock grants to fully vest over the weighted average remaining service period of 1.2 years. The total fair value of shares vesting during 2009 was $628. There were 309,313 vested unrestricted and non-vested restricted stock grants issued to our directors and employees during 2008 at a weighted average fair value of $3.75 per share, of which 66,663 shares are vested as of December 27, 2009 with a total grant date fair value of $360. There were 105,508 vested unrestricted and non-vested restricted stock grants issued to our directors and employees during 2007 at a weighted average fair value of $13.30 per share, of which 52,348 shares are vested as of December 27, 2009 with a total grant date fair value of $695.
In 2006, the compensation committee of our board of directors accelerated the vesting of 13,950 non-vested restricted stock grants granted to 45 employees of Norlight. The non-vested restricted stock grants vested immediately prior to the effective time of the February 26, 2007 sale of Norlight. There was no overall incremental compensation expense resulting from this modification.
Employee stock purchase plan
The 2003 Employee Stock Purchase Plan permits eligible employees to purchase our class B common stock at 90% of the fair market value measured as of the closing market price of our class A common stock on the day of purchase. We recognize compensation expense equal to the 10% discount of the fair market value. Subject to certain adjustments, 3,000,000 shares of our class B common stock are authorized for sale under this plan. There were 238,339 class B common shares sold to employees under this plan in 2009 at a weighted average fair value of $1.40. As of December 27, 2009, there are 2,404,650 shares available for sale under the plan.
| 8 | GOODWILL, BROADCAST LICENSES AND OTHER INTANGIBLE ASSETS |
Definite-Lived Intangibles
Our definite-lived intangible assets consist primarily of network affiliation agreements, customer lists, non-compete agreements and trade names. We amortize the network affiliation agreements over a period of 25 years based on our good relationships with the networks, our long history of renewing these agreements and because 25 years is deemed to be the length of time before a material modification of the underlying contract would occur. We amortize the customer lists over a period of five to 15 years, the non-compete agreements and franchise agreement fees over the terms of the contracts and the tradenames over a period of 25 years. Management determined there were no significant adverse changes in the value of these assets as of December 27, 2009.
93
Table of Contents
NOTES TO CONSOLIDATED FINANCIAL STATEMENTS—(CONTINUED)
December 27, 2009 (in thousands, except per share amounts)
| 8 | GOODWILL, BROADCAST LICENSES AND OTHER INTANGIBLE ASSETS continued |
Amortization expense was $1,975, $1,998 and $1,961 for 2009, 2008 and 2007, respectively. Estimated amortization expense for our next five fiscal years is $1,937 for 2010, $1,579 for 2011, $1,496 for 2012, $1,377 for 2013 and $1,278 for 2014.
The gross carrying amount, accumulated amortization and net carrying amount of the major classes of definite-lived intangible assets as of December 27, 2009 and December 28, 2008 is as follows:
| December 27, 2009 |
Gross Carrying Amount |
Accumulated Amortization |
Net Carrying Amount | |||||||
| Network affiliation agreements |
$ | 26,930 | $ | (5,996 | ) | $ | 20,934 | |||
| Customer lists |
18,206 | (16,076 | ) | 2,130 | ||||||
| Non-compete agreements |
15,351 | (15,286 | ) | 65 | ||||||
| Other |
4,884 | (3,037 | ) | 1,847 | ||||||
| Total |
$ | 65,371 | $ | (40,395 | ) | $ | 24,976 | |||
| December 28, 2008 |
Gross Carrying Amount |
Accumulated Amortization |
Net Carrying Amount | |||||||
| Network affiliation agreements |
$ | 26,930 | $ | (4,929 | ) | $ | 22,001 | |||
| Customer lists |
18,066 | (15,365 | ) | 2,701 | ||||||
| Non-compete agreements |
15,351 | (15,266 | ) | 85 | ||||||
| Other |
4,779 | (2,860 | ) | 1,919 | ||||||
| Total |
$ | 65,126 | $ | (38,420 | ) | $ | 26,706 | |||
The change in the gross carrying amount of customer lists during 2009 represents the acquisition of KNIN-TV in Boise, Idaho and the change in the gross carrying amount of other intangibles during 2009 represents the payment of a franchise fee.
| Weighted-average amortization period: |
Years | |
| Network affiliation agreements |
25 | |
| Customer lists |
12 | |
| Non-compete agreements |
5 | |
| Other |
13 | |
| Total |
16 |
Broadcast Licenses
Broadcast licenses are deemed to have indefinite useful lives because we have renewed these agreements without issue in the past and we intend to renew them indefinitely in the future. Accordingly, we expect the cash flows from our broadcast licenses to continue indefinitely. The carrying value of our broadcast licenses was $81,762 and $101,120 as of December 27, 2009 and December 28, 2008, respectively. We acquired the broadcast license of KNIN-TV in Boise, Idaho for $1,203 on April 23, 2009 and we sold the broadcasting licenses of KGEM-AM and KCID-AM in Boise, Idaho with a carrying value of $428 on September 25, 2009.
The costs incurred to renew or extend the term of our broadcast licenses and certain customer relationships are expensed as incurred.
94
Table of Contents
NOTES TO CONSOLIDATED FINANCIAL STATEMENTS—(CONTINUED)
December 27, 2009 (in thousands, except per share amounts)
| 8 | GOODWILL, BROADCAST LICENSES AND OTHER INTANGIBLE ASSETS continued |
Interim Impairment Test
During the second quarter of 2009, management determined there was a significant adverse change in projected gross market revenues in the markets where we own television and radio stations. Therefore, interim impairment tests as of May 31, 2009 were performed on all of our broadcast licenses. Our interim impairment tests indicated seven of our television broadcast licenses and 11 of our radio broadcast licenses were impaired. In accordance with the FASB’s guidance for goodwill and intangible assets, broadcast licenses with a carrying amount of $101,120, as of December 28, 2008, were written down by an $18,975 non-cash impairment charge in the second quarter of 2009. Partially offsetting the impairment charge was the acquisition of the broadcast license for KNIN-TV in Boise, Idaho for $1,203.
Annual Impairment Test
We perform our annual impairment test on our broadcast licenses at individual television and radio stations, as of the beginning of the fourth quarter. Our annual impairment tests indicated two of our television broadcast licenses and one of our radio broadcast licenses was impaired due to a further decline in projected market revenues and an increase in the discount rates. In accordance with the FASB’s guidance for goodwill and intangible assets, our broadcast licenses were written down to their estimated fair value of $81,762, resulting in an $1,158 non-cash impairment charge in the fourth quarter of 2009.
The following table presents the fair value measurement of our broadcast licenses by level of the fair value hierarchy.
| As of the Measurement Date |
Fair Value Measurement Using |
|||||||||||||||
| Description |
Level 1 Inputs |
Level 2 Inputs |
Level 3 Inputs |
Total Losses |
||||||||||||
| Broadcast licenses |
$ | 81,762 | $ | — | $ | — | $ | 81,762 | $ | (20,133 | ) | |||||
For broadcast licenses at individual television and radio stations, we used an income approach to estimate fair value. This approach uses the Greenfield method, which assumes the start up of a new station by an independent market participant. The fair value of the broadcast license is the result of the cash flows, for the license only, necessary to start up and operate a station, without consideration of any goodwill or improvement to the station. The fair value estimates of our broadcast licenses contain significant assumptions incorporating variables that are based on past experiences and judgments about future performance using industry normalized information for an average station within a market with the type of signal that each subject station produces. These variables include, but are not limited to: the forecasted growth rate of each market (including market population, household income and retail sales), market share and profit margins of an average station within a market, estimated capital expenditures and start up costs, risk-adjusted discount rate, likely media competition within the market and expected growth rates into perpetuity to estimate terminal values. Adverse changes in significant assumptions such as an increase in discount rates or a decrease in projected market revenues or operating cash flows could result in additional non-cash impairment charges on our broadcast licenses in future periods, which could have a material impact on our financial condition and results of operations.
Goodwill
Our annual impairment test on goodwill as of the beginning of the fourth quarter of 2009 indicated there was no impairment. Due to the downturn in the economy that adversely impacted our fourth quarter 2008 operating results and caused us to significantly reduce our expected cash flows for 2009 and beyond, and further
95
Table of Contents
NOTES TO CONSOLIDATED FINANCIAL STATEMENTS—(CONTINUED)
December 27, 2009 (in thousands, except per share amounts)
| 8 | GOODWILL, BROADCAST LICENSES AND OTHER INTANGIBLE ASSETS continued |
declines in the market value of our common stock, we performed an interim impairment test as of December 28, 2008 on goodwill relating to our reporting units. We recorded a $245,885 non-cash impairment charge for goodwill at our publishing and broadcasting reporting units in the fourth quarter of 2008.
For purposes of testing the carrying values of goodwill related to our reporting units, we determined fair value by using an income and a market valuation approach. The income approach uses expected cash flows for each reporting unit. The cash flows were then discounted for risk and time value. In addition, the present value of the projected residual value was estimated and added to the present value of the cash flows. The market approach was based on price multiples of publicly traded stocks of comparable companies to derive fair value. Each approach was weighted equally to determine a fair value estimate of each reporting unit. We based our fair value estimates, in large measure, on projected financial information which we believe to be reasonable. However, actual future results may differ from those projections, and those differences may be material. The valuation methodology used to estimate the fair value of our total company and our reporting units requires inputs and assumptions (i.e. market growth, operating profit margins, and discount rates) that reflect current market conditions as well as management judgment.
The changes in the carrying amount of goodwill by reporting segment during the years ended December 27, 2009 and December 28, 2008 are as follows:
| Publishing | Broadcasting | Other | Total | |||||||||||||
| Goodwill |
$ | 15,660 | $ | 216,878 | $ | 7,358 | $ | 239,896 | ||||||||
| Accumulated impairment losses |
— | — | (7,358 | ) | (7,358 | ) | ||||||||||
| Balance as of December 30, 2007 |
15,660 | 216,878 | — | 232,538 | ||||||||||||
| 2008 Activity: |
||||||||||||||||
| Goodwill acquired |
5,347 | 12,285 | — | 17,632 | ||||||||||||
| Impairment losses |
(16,722 | ) | (229,163 | ) | — | (245,885 | ) | |||||||||
| Goodwill |
21,007 | 229,163 | 7,358 | 257,528 | ||||||||||||
| Accumulated impairment losses |
(16,722 | ) | (229,163 | ) | (7,358 | ) | (253,243 | ) | ||||||||
| Balance as of December 28, 2008 |
4,285 | — | — | 4,285 | ||||||||||||
| 2009 Activity: |
||||||||||||||||
| Goodwill acquired |
— | 4,824 | — | 4,824 | ||||||||||||
| Goodwill related to the sale of a business unit |
— | (11 | ) | — | (11 | ) | ||||||||||
| Goodwill |
21,007 | 233,976 | 7,358 | 262,341 | ||||||||||||
| Accumulated impairment losses |
(16,722 | ) | (229,163 | ) | (7,358 | ) | (253,243 | ) | ||||||||
| Balance as of December 27, 2009 |
$ | 4,285 | $ | 4,813 | $ | — | $ | 9,098 | ||||||||
96
Table of Contents
NOTES TO CONSOLIDATED FINANCIAL STATEMENTS—(CONTINUED)
December 27, 2009 (in thousands, except per share amounts)
| 9 | ACQUISITIONS AND SALE |
All acquisitions were accounted for using the purchase method. Accordingly, the operating results and cash flows of the acquired businesses are included in our consolidated financial statements from the respective dates of acquisition. Pro forma information is not provided because the operating results of the acquisitions are not material.
2009
On September 25, 2009, Journal Broadcast Group, Inc. and Journal Broadcast Corporation, our broadcasting businesses, completed the sale of KGEM-AM and KCID-AM in Boise, Idaho to Salt & Light Radio, Inc. for $950 and recorded a $312 pre-tax gain on the sale. The divestiture of KGEM-AM and KCID-AM will allow us to focus on our four remaining radio stations and two television stations in Boise, Idaho.
On April 23, 2009, Journal Broadcast Group, Inc. and Journal Broadcast Corporation completed the asset purchase of KNIN-TV from Banks Boise, Inc. for $6,593 in cash. KNIN-TV is the CW Network affiliate serving the Boise, Idaho market. The purchase of KNIN-TV builds our cross-media business in Boise, Idaho to better serve advertisers and viewers, builds a stronger community presence in Boise, Idaho, and enhances our margin with multiple media properties. Acquisition-related expenses were $57 in 2009 and are reported in selling and administrative expenses in our consolidated statement of operations.
The goodwill arising from the acquisition is attributable to the synergies expected from aligning our television and radio stations in a cluster within the Boise, Idaho market. We seek to build a unique and differentiated brand position at each station within a cluster so that we can offer distinct solutions for a variety of advertisers in any given market. This clustering strategy has allowed us to target our stations’ formats and sales efforts to better serve advertisers and listeners as well as leverage operating expenses to maximize the performance of each station and the cluster.
The recognized amounts of identifiable assets acquired and liabilities assumed for KNIN-TV are as follows:
| KNIN-TV Boise, ID |
||||
| Syndicated programs |
$ | 533 | ||
| Property and equipment |
555 | |||
| Goodwill |
4,824 | |||
| Broadcast license |
1,203 | |||
| Customer list |
140 | |||
| Syndicated programs |
(656 | ) | ||
| Other current assets and liabilities |
(6 | ) | ||
| Total purchase price |
$ | 6,593 | ||
We determined the useful life of the acquired customer list to be five years. The KNIN-TV broadcast license expires in 2014 and we expect to renew the license without issue. The goodwill and broadcast license which we acquired are not subject to amortization for financial reporting purposes. These intangible assets are, however, amortized and deductible for income tax purposes.
97
Table of Contents
NOTES TO CONSOLIDATED FINANCIAL STATEMENTS—(CONTINUED)
December 27, 2009 (in thousands, except per share amounts)
| 9 | ACQUISITIONS AND SALE continued |
The operating results of the acquired stations since the acquisition date for the year ended December 27, 2009 was:
| Year Ended December 27, 2009 | |||
| Revenue |
$ | 1,840 | |
| Earnings before income taxes |
$ | 810 | |
2008
On January 9, 2008, Journal Community Publishing Group, Inc., our community newspapers and shoppers business, acquired the Iola Herald and Manawa Advocate in Waupaca County in Wisconsin. These are weekly paid publications. On March 19, 2008, Journal Community Publishing Group, Inc. acquired two shoppers, the Clintonville Shopper’s Guide and the Wittenberg Northerner Shopping News, in Waupaca County, Wisconsin. The total cash purchase price for these publications was $1,632. The acquisitions deepen our media offerings and extend our reach in north central Wisconsin.
On January 28, 2008, Journal Broadcast Corporation and Journal Broadcast Group, Inc., our broadcasting businesses, completed the asset purchase of My Network affiliate KPSE-LP, Channel 50, in Palm Springs, California from Mirage Media LLC for $4,661. The acquisition of KPSE allows us to better serve advertisers and viewers in the Coachella Valley and builds a stronger presence in Palm Springs and the surrounding area.
On July 22, 2008, Journal Broadcast Corporation and Journal Broadcast Group, Inc. completed the asset purchase of CW Network affiliate, KWBA-TV, in Sierra Vista, Arizona, from Cascade Broadcasting Group, LLC and Tucson Communications, L.L.C. for $12,004. KWBA-TV serves the Tucson, Arizona market.
On October 6, 2008, Journal Community Publishing Group, Inc. purchased the assets of Waupaca Publishing Company for $7,037. We paid $6,987 and retained from the purchase price $50 for environmental related expenses, which we have agreed to pay on behalf of the seller. The seller remains liable for all obligations relating to the conditions of the property purchased. The purchase consists of several Waupaca-area weekly paid newspapers including the Waupaca County Post, The Chronicle (Weyauwega/Fremont), Wisconsin State Farmer and the Picture Post. It also includes the monthly paid niche publications Wisconsin Horsemen’s News, and Silent Sports magazine. The purchase includes additional print publications and associated internet websites as well as Waupaca Publishing Company’s commercial printing business and the related real estate and buildings.
| 10 | DISCONTINUED OPERATIONS |
Community newspapers and shoppers
In 2007, Journal Community Publishing Group, Inc., our community newspapers and shopper business of our publishing segment, completed the sale of its New England- Ohio- and Louisiana-based publishing and printing businesses. Proceeds, net of transaction expenses, were $28,613 and resulted in a gain on discontinued operations before income taxes of $3,369.
98
Table of Contents
NOTES TO CONSOLIDATED FINANCIAL STATEMENTS—(CONTINUED)
December 27, 2009 (in thousands, except per share amounts)
| 10 | DISCONTINUED OPERATIONS continued |
The operations of these three regional publishing and printing operations of our community newspapers and shoppers business have been reflected as discontinued operations in our consolidated financial statements for all periods presented.
| Years ended December 27, December 28 and December 30 |
2009 | 2008 | 2007 | ||||||
| Revenue |
$ | — | $ | — | $ | 22,450 | |||
| Earnings before income taxes |
$ | — | $ | — | $ | 1,260 | |||
Norlight Telecommunications, Inc.
On February 26, 2007, Q-Comm acquired 100% of the stock of Norlight, our former telecommunications subsidiary and segment. Proceeds, net of transaction expenses, were $175,906 and resulted in a gain on discontinued operations before income taxes of $101,807. The operations of Norlight have been reflected as discontinued operations in our consolidated financial statements for all periods presented.
The following table summarizes Norlight’s results of operations which are included in the gain from discontinued operations in the consolidated statement of operations for all periods presented:
| Years ended December 27, December 28 and December 30 |
2009 | 2008 | 2007 | ||||||
| Revenue |
$ | — | $ | — | $ | 18,451 | |||
| Earnings before income taxes |
$ | — | $ | — | $ | 4,474 | |||
NorthStar Print Group, Inc.
On January 25, 2005, Multi-Color Corporation acquired substantially all of the assets and certain liabilities of NorthStar Print Group, Inc. (NorthStar), our label printing business. In 2008, we recorded a gain on discontinued operations of $400 for a reduction in the reserve due to a settlement with the Environmental Protection Agency. In 2007, we recorded a loss on discontinued operations of $600 for a preliminary assessment from the Environmental Protection Agency.
The following table summarizes NorthStar’s gain from discontinued operations in the consolidated statement of operations for all periods presented:
| Years ended December 27, December 28 and December 30 |
2009 | 2008 | 2007 | |||||||
| Revenue |
$ | — | $ | — | $ | — | ||||
| Earnings (loss) before income taxes |
— | $ | 400 | $ | (600 | ) | ||||
| 11 | WORKFORCE REDUCTION AND BUSINESS IMPROVEMENT INITIATIVES |
Due to continued reductions in our revenue across all of our business segments, we continued to align our costs through workforce reductions. During 2009, we recorded a pre-tax charge of $6,431 for workforce separation benefits across all of our businesses. These charges are recorded in operating costs and expenses and selling and administrative expenses in the consolidated statement of operations. In 2009, the number of full-time and part-time employees decreased by approximately 19.0%.
During 2008, due to adverse changes in our operating results and further deterioration of economic, market and business conditions, we recorded a pre-tax charge of $5,327 for workforce separation benefits across all of
99
Table of Contents
NOTES TO CONSOLIDATED FINANCIAL STATEMENTS—(CONTINUED)
December 27, 2009 (in thousands, except per share amounts)
| 11 | WORKFORCE REDUCTION AND BUSINESS IMPROVEMENT INITIATIVES continued |
our businesses. These charges are recorded in operating costs and expenses and selling and administrative expenses in the consolidated statement of operations. In 2008, the number of full-time and part-time employees decreased by approximately 12.0%.
Activity associated with workforce reductions during the years ended December 27, 2009 and December 28, 2008 was as follows:
| Balance at December 28, 2008 |
Charge for Separation Benefits |
Payments for Separation Benefits |
Balance at December 27, 2009 | ||||||||||
| Publishing |
|||||||||||||
| Daily newspaper |
$ | 557 | $ | 5,260 | $ | (4,327 | ) | $ | 1,490 | ||||
| Community newspapers and shoppers |
53 | 152 | (179 | ) | 26 | ||||||||
| Total publishing |
610 | 5,412 | (4,506 | ) | 1,516 | ||||||||
| Broadcasting |
30 | 313 | (194 | ) | 149 | ||||||||
| Printing services |
— | 541 | (517 | ) | 24 | ||||||||
| Direct marketing services |
177 | 165 | (288 | ) | 54 | ||||||||
| Total |
$ | 817 | $ | 6,431 | $ | (5,505 | ) | $ | 1,743 | ||||
| Balance at December 30, 2007 |
Charge for Separation Benefits |
Payments for Separation Benefits |
Balance at December 28, 2008 | ||||||||||
| Publishing |
|||||||||||||
| Daily newspaper |
$ | 257 | $ | 4,533 | $ | (4,233 | ) | $ | 557 | ||||
| Community newspapers and shoppers |
— | 67 | (14 | ) | 53 | ||||||||
| Total publishing |
257 | 4,600 | (4,247 | ) | 610 | ||||||||
| Broadcasting |
— | 461 | (431 | ) | 30 | ||||||||
| Printing services |
— | 89 | (89 | ) | — | ||||||||
| Direct marketing services |
— | 177 | — | 177 | |||||||||
| Total |
$ | 257 | $ | 5,327 | $ | (4,767 | ) | $ | 817 | ||||
| 12 | SEGMENT REPORTING |
Our business segments are based on the organizational structure used by management for making operating and investment decisions and for assessing performance. Our reportable business segments are: (i) publishing; (ii) broadcasting; (iii) printing services; and (iv) other. Our publishing segment consisted of the Milwaukee Journal Sentinel, which serves as the only major daily newspaper for the Milwaukee metropolitan area, and community newspapers and shoppers in Wisconsin and Florida. Our broadcasting segment consisted of 33 radio stations and 13 television stations in 12 states and the operation of a television station under a local marketing agreement. We also provide a wide range of commercial printing services, including printing of publications, professional journals and documentation material, through our printing services segment. Our other segment consists of corporate expenses and eliminations and a direct marketing services business, which we sold in February 2010.
100
Table of Contents
NOTES TO CONSOLIDATED FINANCIAL STATEMENTS—(CONTINUED)
December 27, 2009 (in thousands, except per share amounts)
| 12 | SEGMENT REPORTING continued |
The accounting basis for transactions between reportable segments is the same as that described in the “Significant Accounting Policies” outlined in Note 1. The following tables summarize revenue, operating earnings (loss), non-cash impairment charge, depreciation and amortization and capital expenditures for the years ended December 27, 2009, December 28, 2008 and December 30, 2007 and identifiable total assets at December 27, 2009 and December 28, 2008:
| 2009 | 2008 | 2007 | |||||||||
| Revenue |
|||||||||||
| Publishing |
$ | 194,196 | $ | 241,972 | $ | 266,142 | |||||
| Broadcasting |
171,491 | 209,914 | 218,118 | ||||||||
| Printing services |
48,249 | 65,201 | 69,377 | ||||||||
| Other |
19,629 | 27,844 | 29,017 | ||||||||
| $ | 433,565 | $ | 544,931 | $ | 582,654 | ||||||
| Operating earnings (loss) |
|||||||||||
| Publishing |
$ | 10,183 | $ | (2,792 | ) | $ | 31,040 | ||||
| Broadcasting |
(130 | ) | (322,706 | ) | 41,349 | ||||||
| Printing services |
(308 | ) | 2,424 | 5,932 | |||||||
| Other |
(1,234 | ) | 395 | 467 | |||||||
| $ | 8,511 | $ | (322,679 | ) | $ | 78,788 | |||||
| Non-cash impairment charge |
|||||||||||
| Publishing |
$ | — | $ | 16,722 | $ | — | |||||
| Broadcasting |
20,133 | 358,364 | — | ||||||||
| Printing services |
— | — | — | ||||||||
| Other |
— | — | 410 | ||||||||
| $ | 20,133 | $ | 375,086 | $ | 410 | ||||||
| Depreciation and amortization |
|||||||||||
| Publishing |
$ | 12,163 | $ | 12,859 | $ | 13,379 | |||||
| Broadcasting |
13,269 | 13,436 | 12,930 | ||||||||
| Printing services |
2,165 | 2,249 | 2,109 | ||||||||
| Other |
976 | 892 | 950 | ||||||||
| $ | 28,573 | $ | 29,436 | $ | 29,368 | ||||||
| Capital expenditures |
|||||||||||
| Publishing |
$ | 1,667 | $ | 4,601 | $ | 11,342 | |||||
| Broadcasting |
5,901 | 15,200 | 20,879 | ||||||||
| Printing services |
733 | 974 | 1,418 | ||||||||
| Other |
333 | 1,450 | 2,267 | ||||||||
| $ | 8,634 | $ | 22,225 | $ | 35,906 | ||||||
| Identifiable total assets |
|||||||||||
| Publishing |
$ | 140,810 | $ | 157,440 | |||||||
| Broadcasting |
290,021 | 330,355 | |||||||||
| Printing services |
13,371 | 19,375 | |||||||||
| Other |
28,985 | 35,429 | |||||||||
| $ | 473,187 | $ | 542,599 | ||||||||
101
Table of Contents
NOTES TO CONSOLIDATED FINANCIAL STATEMENTS—(CONTINUED)
December 27, 2009 (in thousands, except per share amounts)
| 13 | QUARTERLY FINANCIAL INFORMATION (UNAUDITED) |
| 2009 Quarters | ||||||||||||||||||||
| First | Second | Third | Fourth | Total | ||||||||||||||||
| Revenue |
$ | 106,825 | $ | 109,438 | $ | 105,077 | $ | 112,225 | $ | 433,565 | ||||||||||
| Gross profit |
31,583 | 41,131 | 33,799 | 46,307 | 152,820 | |||||||||||||||
| Net earnings |
121 | (4,832 | ) | 1,825 | 7,193 | 4,307 | ||||||||||||||
| Earnings per share |
||||||||||||||||||||
| Basic – class A and B common stock |
(0.01 | ) | (0.11 | ) | 0.02 | 0.12 | 0.05 | |||||||||||||
| Diluted – class A and B common stock |
(0.01 | ) | (0.11 | ) | 0.02 | 0.12 | 0.05 | |||||||||||||
| Basic and diluted – class C common stock |
0.14 | 0.14 | 0.17 | 0.26 | 0.60 | |||||||||||||||
| 2008 Quarters | ||||||||||||||||||||
| First | Second | Third | Fourth | Total | ||||||||||||||||
| Revenue |
$ | 134,265 | $ | 140,090 | $ | 136,270 | $ | 134,306 | $ | 544,931 | ||||||||||
| Gross profit |
51,281 | 55,417 | 50,316 | 50,359 | 207,373 | |||||||||||||||
| Net earnings |
6,690 | 9,004 | (17,101 | ) | (222,996 | ) | (224,403 | ) | ||||||||||||
| Earnings per share |
||||||||||||||||||||
| Basic – class A and B common stock |
0.11 | 0.16 | (0.35 | ) | (4.46 | ) | (4.36 | ) | ||||||||||||
| Diluted – class A and B common stock |
0.11 | 0.16 | (0.35 | ) | (4.46 | ) | (4.36 | ) | ||||||||||||
| Basic and diluted – class C common stock |
0.17 | 0.22 | 0.14 | 0.14 | 0.58 | |||||||||||||||
Gross profit has been revised to conform with the 2009 presentation, as discussed in “Revisions” in Note 1.
The second quarter of 2009 includes a pre-tax broadcast license impairment charge of $18,975, a pre-tax charge of $746 for separation benefits at all of our businesses and a $1,689 pre-tax gain related to insurance proceeds from our tower replacement in Wichita, Kansas that was destroyed in an ice storm. The third quarter of 2009 includes an additional pre-tax charge of $4,341 for separation benefits across all of our businesses, the majority of which was recorded at our daily newspaper. The fourth quarter of 2009 includes an additional pre-tax broadcast license impairment charge of $1,158, a pre-tax charge of $1,021 for separation benefits at our publishing, broadcasting, and direct marketing services businesses and an additional $516 pre-tax gain related to insurance proceeds from our tower replacement in Wichita, Kansas.
The results for 2008 include a pre-tax gain of $400 recorded in discontinued operations for a final Environmental Protection Agency assessment for NorthStar in the first quarter of 2008. The second quarter of 2008 includes a $426 pre-tax contract termination charge recorded at our community newspapers and shoppers business. The third quarter of 2008 includes a pre-tax broadcast license impairment charge of $38,762 and a $3,924 pre-tax charge for separation benefits at our daily newspaper and broadcasting businesses. The fourth quarter of 2008 includes an additional pre-tax broadcast license impairment charge of $90,439, a pre-tax goodwill impairment charge of $245,885 recorded at our publishing and broadcasting businesses, a $1,167 pre-tax charge for separation benefits at our publishing, broadcasting, printing services and direct marketing services businesses and a $111 pre-tax reduction of the contract termination charge recorded at our community newspapers and shoppers business.
102
Table of Contents
NOTES TO CONSOLIDATED FINANCIAL STATEMENTS—(CONTINUED)
December 27, 2009 (in thousands, except per share amounts)
| 14 | SUBSEQUENT EVENTS |
On February 3, 2010, we completed the sale of certain assets of the St. Paul, Minnesota-based mailing services operations of our direct marketing services business to Impact Mailing of Minnesota, Inc. for cash and a commission on buyer’s future revenue for a period of three years. The remaining operations in St. Paul, Minnesota will be shut down by the end of April, 2010. We expect to record approximately $800 for shut down costs in 2010. In a separate transaction on February 8, 2010, we completed the sale of certain assets of the Clearwater, Florida-based operations of our direct marketing services business to PrimeNet Direct Marketing Solutions, LLC, owned by the former president of our direct marketing services business, as we exit the direct marketing business. Consideration from the sale to PrimeNet Direct Marketing Solutions, LLC includes a minimum guaranteed commission on buyer’s future revenue for a period of four years and seller financing of working capital. We believe the loss on the sale of the Clearwater-Florida based operations will be minimal. The net loss in 2009 for our direct marketing services business was $1,449. As of December 27, 2009, total assets were $2,831 and total liabilities were $1,025.
103
Table of Contents
REPORT OF INDEPENDENT REGISTERED PUBLIC ACCOUNTING FIRM
To the Board of Directors and Shareholders of
Journal Communications, Inc.
In our opinion, the accompanying consolidated balance sheets and the related consolidated statements of operations, shareholders’ equity and cash flows present fairly, in all material respects, the financial position of Journal Communications, Inc. and its subsidiaries at December 27, 2009 and December 28, 2008, and the results of their operations and their cash flows for each of the two years in the period ended December 27, 2009 in conformity with accounting principles generally accepted in the United States of America. In addition, in our opinion, the 2009 and 2008 information in the financial statement schedule listed in the index appearing under Item 15(2) presents fairly, in all material respects, the information set forth therein when read in conjunction with the related consolidated financial statements. Also in our opinion, the Company maintained, in all material respects, effective internal control over financial reporting as of December 27, 2009, based on criteria established in Internal Control—Integrated Framework issued by the Committee of Sponsoring Organizations of the Treadway Commission (COSO). The Company’s management is responsible for these financial statements and financial statement schedule, for maintaining effective internal control over financial reporting and for its assessment of the effectiveness of internal control over financial reporting, included in Management’s Report on Internal Control over Financial Reporting appearing in Item 9A. Our responsibility is to express opinions on these financial statements, on the financial statement schedule, and on the Company’s internal control over financial reporting based on our integrated audits. We conducted our audits in accordance with the standards of the Public Company Accounting Oversight Board (United States). Those standards require that we plan and perform the audits to obtain reasonable assurance about whether the financial statements are free of material misstatement and whether effective internal control over financial reporting was maintained in all material respects. Our audits of the financial statements included examining, on a test basis, evidence supporting the amounts and disclosures in the financial statements, assessing the accounting principles used and significant estimates made by management, and evaluating the overall financial statement presentation. Our audit of internal control over financial reporting included obtaining an understanding of internal control over financial reporting, assessing the risk that a material weakness exists, and testing and evaluating the design and operating effectiveness of internal control based on the assessed risk. Our audits also included performing such other procedures as we considered necessary in the circumstances. We believe that our audits provide a reasonable basis for our opinions.
A company’s internal control over financial reporting is a process designed to provide reasonable assurance regarding the reliability of financial reporting and the preparation of financial statements for external purposes in accordance with generally accepted accounting principles. A company’s internal control over financial reporting includes those policies and procedures that (i) pertain to the maintenance of records that, in reasonable detail, accurately and fairly reflect the transactions and dispositions of the assets of the company; (ii) provide reasonable assurance that transactions are recorded as necessary to permit preparation of financial statements in accordance with generally accepted accounting principles, and that receipts and expenditures of the company are being made only in accordance with authorizations of management and directors of the company; and (iii) provide reasonable assurance regarding prevention or timely detection of unauthorized acquisition, use, or disposition of the company’s assets that could have a material effect on the financial statements.
Because of its inherent limitations, internal control over financial reporting may not prevent or detect misstatements. Also, projections of any evaluation of effectiveness to future periods are subject to the risk that controls may become inadequate because of changes in conditions, or that the degree of compliance with the policies or procedures may deteriorate.
/s/ PRICEWATERHOUSECOOPERS LLP
PricewaterhouseCoopers LLP
Chicago, Illinois
March 5, 2010
104
Table of Contents
REPORT OF INDEPENDENT ACCOUNTING FIRM
The Board of Directors and Shareholders of
Journal Communications, Inc.
We have audited the accompanying consolidated statements of operations, shareholders’ equity, and cash flows of Journal Communications, Inc. for the year ended December 30, 2007. Our audit also included the financial statement schedule for the year ended December 30, 2007 listed in the Index to Exhibit at Item 15(a). These financial statements and schedule are the responsibility of the Company’s management. Our responsibility is to express an opinion on these financial statements and schedule based on our audit.
We conducted our audit in accordance with the standards of the Public Company Accounting Oversight Board (United States). Those standards require that we plan and perform the audit to obtain reasonable assurance about whether the financial statements are free of material misstatement. An audit also includes assessing the accounting principles used and significant estimates made by management, as well as evaluating the overall financial statement presentation. We believe that our audit provides a reasonable basis for our opinion.
In our opinion, the financial statements referred to above present fairly, in all material respects, the consolidated results of operations and cash flows of Journal Communications, Inc. for the year ended December 30, 2007, in conformity with U.S. generally accepted accounting principles. Also, in our opinion, the related 2007 financial statement schedule, when considered in relation to the basic financial statements taken as a whole, presents fairly, in all material respects, the information set forth therein.
As discussed in Note1 to the consolidated financial statements, the Company changed its method of accounting for uncertainty in income taxes effective January 1, 2007.
/s/ Ernst & Young LLP
Milwaukee, Wisconsin
February 19, 2008
105
Table of Contents
| ITEM 9. | CHANGES IN AND DISAGREEMENTS WITH ACCOUNTANTS ON ACCOUNTING AND FINANCIAL DISCLOSURE |
None.
| ITEM 9A. | CONTROLS AND PROCEDURES |
Conclusion Regarding the Effectiveness of Disclosure Controls and Procedures
We carried out an evaluation, under the supervision and with the participation of our Disclosure Committee, including our Chief Executive Officer and our Chief Financial Officer, of the effectiveness of the design and operation of our disclosure controls and procedures, as defined in Exchange Act Rules 14(c) to 15(e) as of the end of the period covered by this Annual Report on Form 10-K. Based on that evaluation, the Chief Executive Officer and Chief Financial Officer concluded that our disclosure controls and procedures are effective to ensure that information required to be disclosed in our Exchange Act reports is recorded, processed, summarized and reported within the time periods specified in the Securities and Exchange Commission’s rules and forms, and that such information is accumulated and communicated to them to allow timely decisions regarding required disclosure.
There has been no change in our internal control over financial reporting that occurred during our last fiscal quarter that has materially affected, or is reasonably likely to materially affect, our internal control over financial reporting.
Management’s Report on Internal Control Over Financial Reporting
We are responsible for establishing and maintaining adequate internal control over financial reporting, as such term is defined in Exchange Act Rule 13a-15(f). Our internal control over financial reporting is designed to provide reasonable assurance regarding the reliability of financial reporting and the preparation of financial statements for external purposes in accordance with generally accepted accounting principles. Under the supervision and with the participation of our management, including our Chief Executive Officer and our Chief Financial Officer, we conducted an evaluation of the effectiveness of our internal control over financial reporting based on the framework in Internal Control-Integrated Framework issued by the Committee of Sponsoring Organizations of the Treadway Commission. Based on our evaluation under this framework, our management concluded that our internal control over financial reporting was effective as of December 27, 2009.
PricewaterhouseCoopers LLP, an independent registered public accounting firm, has audited our internal control over financial reporting as of December 27, 2009, as stated in their report which is included in Item 8 hereto.
| ITEM 9B. | OTHER INFORMATION |
None.
106
Table of Contents
| ITEM 10. | DIRECTORS, EXECUTIVE OFFICERS AND CORPORATE GOVERNANCE |
The information contained under the headings “Election of Directors” and “Other Matters-Section 16(a) Beneficial Ownership Reporting Compliance” in the Proxy Statement for our April 30, 2009 Annual Meeting of Shareholders is incorporated by reference herein. Reference is also made to the information under the heading “Executive Officers of the Registrant” included under Part I of this Annual Report on Form 10-K.
We have adopted a Code of Ethics for Financial Executives that applies to our Chief Executive Officer and senior financial and accounting officers and employees. We have also adopted a Code of Ethics, applicable to all employees, and a Code of Conduct and Ethics for Members of the Board of Directors, applicable to all directors, which together satisfy the requirements of the New York Stock Exchange regarding a “code of business conduct.” Finally, we have adopted Corporate Governance Guidelines addressing the subjects required by the New York Stock Exchange. We make copies of the foregoing, as well as the charters of our Board committees, available free of charge on our website at www.journalcommunications.com. We intend to satisfy the disclosure requirements under Item 5.05 of Form 8-K regarding amendments to, or waivers from, our Code of Ethics for Financial Executives by posting such information on our web site at the address stated above. We are not including the information contained on our website as part of, or incorporating it by reference into, this Annual Report on Form 10-K.
| ITEM 11. | EXECUTIVE COMPENSATION |
The information contained under the headings “Compensation Discussion and Analysis,” “Election of Officers,” “Compensation Committee Report,” “Executive Compensation” and “Director Compensation,” in the Proxy Statement for our April 28, 2010 Annual Meeting of Shareholders is incorporated by reference herein.
| ITEM 12. | SECURITY OWNERSHIP OF CERTAIN BENEFICIAL OWNERS AND MANAGEMENT AND RELATED STOCKHOLDER MATTERS |
The information contained under the headings “Stock Ownership of Management and Others” in the Proxy Statement for our April 28, 2010 Annual Meeting of Shareholders is incorporated by reference herein.
Equity Compensation Plan Information
The following table gives information about our common stock that may be issued under all of our equity compensation plans as of December 27, 2009.
| Plan Category |
Number of Securities to be Issued Upon Exercise of Outstanding Options, Warrants and Rights (a) |
Weighted-Average Exercise Price of Outstanding Options, Warrants and Rights (b) |
Number of Securities Remaining Available for Future Issuance Under Equity Compensation Plans (excluding securities reflected in Column (a)) (c) |
||||||
| Equity compensation plans approved by security holders (2003 Plan) |
567,217 | (1) | $ | 14.04 | N/A | (1) | |||
| Equity compensation plans approved by security holders (2007 Plan) |
557,629 | (2) | $ | 7.88 | 5,787,431 | (3) | |||
| Equity compensation plans not approved by security holders |
— | — | — | ||||||
| Total |
1,124,846 | $ | 10.99 | 5,787,431 | |||||
| 1) | Represents options to purchase shares of Class B common stock and stock appreciation rights (SARs) to receive amounts equal to the excess of fair value of shares of Class B common stock over the base value of each SAR under our 2003 Equity Incentive Plan (2003 Plan). No further awards will be granted under our 2003 Plan. |
107
Table of Contents
| 2) | Represents SARs to receive amounts equal to the excess of fair value of shares of class B common stock over the base value of each SAR under our 2007 Journal Communications, Inc. Omnibus Incentive Plan (2007 Plan). |
| 3) | Represents 3,382,781 shares available for issuance under our 2007 Plan, all of which may be issued in the form of nonstatutory or incentive stock options, SARs, restricted stock, restricted or deferred stock units, performance awards, dividend equivalents and other stock-based awards. Also includes 2,404,650 shares available for issuance under our Employee Stock Purchase Plan. |
| ITEM 13. | CERTAIN RELATIONSHIPS AND RELATED TRANSACTIONS, AND DIRECTOR INDEPENDENCE |
The information contained under the headings “Election of Directors” and “Certain Transactions” in the Proxy Statement for our April 28, 2010 Annual Meeting of Shareholders is incorporated by reference herein.
| ITEM 14. | PRINICIPAL ACCOUNTING FEES AND SERVICES |
The information contained under the heading “Independent Public Accounting Firm Disclosure” in the Proxy Statement for our April 28, 2010 Annual Meeting of Shareholders is incorporated by reference herein.
108
Table of Contents
| ITEM 15. | EXHIBITS, FINANCIAL STATEMENT SCHEDULES |
Financial Statements, Financial Statement Schedule and Exhibits
| Form 10-K Page(s) | ||
| (1) Financial Statements |
||
| Consolidated Balance Sheets at December 27, 2009 and December 28, 2008 |
64 | |
| 65 | ||
| 66 and 67 | ||
| 68 | ||
| 69 | ||
| 104 and 105 | ||
| (2) Financial Statement Schedule for the years ended December 27, 2009, December 28, 2008 and December 30, 2007 |
||
| 110 | ||
All other schedules are omitted since the required information is not present, or is not present in amounts sufficient to require submission of the schedule, or because the information required is included in the consolidated financial statements and notes thereto.
| (3) | Exhibits |
The exhibits listed on the accompanying “Index to Exhibits” (on pages 112 to 115) are filed, or incorporated by reference, as part of this Annual Report on Form 10-K.
109
Table of Contents
SCHEDULE II - CONSOLIDATED VALUATION AND QUALIFYING ACCOUNTS
Years ended December 27, 2009, December 28, 2008, and December 30, 2007
(dollars in thousands)
| Description |
Balance at Beginning of Year |
Additions Charged to Earnings |
Other Additions (Deductions) |
Deductions | Balance at End of Year | ||||||||||||
| Allowance for doubtful accounts: |
|||||||||||||||||
| 2009 |
$ | 4,734 | $ | 5,389 | $ | — | $ | 5,853 | (1) | $ | 4,270 | ||||||
| 2008 |
$ | 4,031 | $ | 4,533 | $ | 45 | (3) | $ | 3,875 | (1) | $ | 4,734 | |||||
| 2007 |
$ | 3,885 | $ | 1,712 | $ | — | $ | 1,566 | (1) | $ | 4,031 | ||||||
| Deferred income taxes |
|||||||||||||||||
| Valuation allowances on state net operating loss and tax credit carryforwards: |
|||||||||||||||||
| 2009 |
$ | 322 | $ | — | $ | — | $ | 120 | (2) | $ | 202 | ||||||
| 2008 |
$ | 611 | $ | — | $ | — | $ | 289 | (2) | $ | 322 | ||||||
| 2007 |
$ | 1,202 | $ | — | $ | — | $ | 591 | (2) | $ | 611 | ||||||
| (1) | Deductions from the allowance for doubtful accounts equal accounts receivable written off, less recoveries, against the allowance. |
| (2) | Deductions from the valuation allowances on state net operating loss and tax credit carryforwards equal expired, utilized or re-valued state net operating loss and tax credit carryforwards. |
| (3) | Represents allowance for doubtful accounts from businesses acquired in 2008. |
110
Table of Contents
Pursuant to the requirements of Section 13 or 15(d) of the Securities Exchange Act of 1934, the Registrant has duly caused this annual report to be signed on its behalf by the undersigned, hereunto duly authorized on March 5, 2010.
| JOURNAL COMMUNICATIONS, INC. | ||
| By: |
/s/ Steven J. Smith | |
| Steven J. Smith | ||
| Chairman and Chief Executive Officer | ||
Pursuant to the requirements of the Securities Exchange Act of 1934, this report has been signed by the following persons on behalf of the Registrant and in the capacities indicated on March 5, 2010:
| /s/ Steven J. Smith |
| Steven J. Smith, Chairman of the Board & Chief Executive Officer |
| (Principal Executive Officer) |
| /s/ Andre J. Fernandez |
| Andre J. Fernandez Executive Vice President & Chief Financial Officer |
| (Principal Financial Officer) |
| /s/ Anne M. Bauer |
| Anne M. Bauer, Vice President & Controller |
| (Principal Accounting Officer) |
| /s/ David J. Drury |
| David J. Drury, Director |
| /s/ David G. Meissner |
| David G. Meissner, Director |
| /s/ Jonathan Newcomb |
| Jonathan Newcomb, Director |
| /s/ Roger D. Peirce |
| Roger D. Peirce, Director |
| /s/ Ellen F. Siminoff |
| Ellen F. Siminoff, Director |
| /s/ Mary Ellen Stanek |
| Mary Ellen Stanek, Director |
| /s/ Owen J. Sullivan |
| Owen J. Sullivan, Director |
| /s/ Jeanette Tully |
| Jeanette Tully, Director |
111
Table of Contents
INDEX TO EXHIBITS
| Exhibit |
Description | |
| (2) | Stock Purchase Agreement, dated as of November 13, 2006, among Journal Communications, Inc., Norlight Telecommunications, Inc. and Q-Comm Corporation (incorporated by reference to Exhibit 2.2 to Journal Communications, Inc.’s Annual Report on Form 10-K for the period ended December 31, 2007 [Commission File No. 1-31805]). | |
| (3.1) | Amended and Restated Articles of Incorporation of Journal Communications, Inc., as amended through June 30, 2006 (incorporated by reference to Exhibit 3.2 to Journal Communications, Inc.’s Current Report on From 8-K dated June 30, 2006 [Commission File No. 1-318051]). | |
| (3.2) | Bylaws of Journal Communications, Inc., as amended (incorporated by reference to Exhibit 3.1 to Journal Communications’ Current Report on Form 8-K dated May 1, 2008 [Commission File No. 1-31805]). | |
| (4.1) | Amended and Restated Credit Agreement, dated December 2, 2005, among Journal Communications, Inc., certain subsidiaries thereof from time to time party thereto, the financial institutions party thereto, Suntrust Bank, as syndication agent, Bank of America, N.A., as co-documentation agent, Wachovia Bank National Association, as co-documentation agent, and U.S. Bank, N.A., as administrative agent (incorporated by reference to Exhibit 4.1 to Journal Communications, Inc.’s Current Report on Form 8-K dated December 2, 2005 [Commission File No. 1-31805]). | |
| (4.2) | Shareholders Agreement, dated as of May 12, 2003, by and among Journal Communications, Inc. (then known as The Journal Company), The Journal Company (then known as Journal Communications, Inc.), Matex Inc. and the Abert Family Journal stock Trust, as further executed by two “Family Successors,” Grant D. Abert and Barbara Abert Tooman (incorporated by reference to Exhibit 4.3 to Journal Communications, Inc.’s Registration Statement on Form S-1 filed on June 19, 2003 [Reg. No. 333-105210]). | |
| (4.3) | Amendment to Shareholders Agreement, dated as of August 2, 2007, by and among Journal Communications, Inc., The Journal Company, Matex Inc., the Abert Family Journal Stock Trust, Grant D. Abert and Barbara Abert Tooman (incorporated by reference to Exhibit 4.2 to Journal Communications, Inc.’s Current Report on From 8-K dated August 22, 2007 [File No. 1-31805]). | |
| (10.1) | Journal Communications, Inc. Executive Management Incentive Plan (f/k/a the Management Long Term Incentive Plan) (incorporated by reference to Exhibit 10.2 to Journal Communications, Inc.’s (now known as The Journal Company) Annual Report on Form 10-K for the period ended December 31, 2002 [Commission File No. 0-7831]). | |
| (10.2) | Journal Communications, Inc. Annual Management Incentive Plan, amended and restated as of December 8, 2009 (incorporated by reference to Exhibit 10.3 to Journal Communications, Inc.’s Current Report on Form 8-K dated December 8, 2008 [Commission File No. 1-31805]).* | |
| (10.3) | Journal Communications, Inc. Non-Qualified Deferred Compensation Plan, as amended (incorporated by reference to Exhibit 10.1 to Journal Communications, Inc.’s Current Report on Form 8-K dated December 12, 2007 [Commission File No. 1-31805]).* | |
| (10.4) | Journal Communications, Inc. Supplemental Benefit Plan (incorporated by reference to Exhibit 10.2 to Journal Communications Inc.’s Current Report on From 8-K dated December 12, 2007 [Commission File No. 1-31805]).* | |
112
Table of Contents
| Exhibit |
Description | |
| (10.5) | Journal Communications, Inc. 2003 Equity Incentive Plan, as amended (incorporated by reference to Exhibit 10.5 to Journal Communications, Inc.’s Annual Report on Form 10-K for the period ended December 26, 2004 [Commission File No. 1-31805]).* | |
| (10.6) | Journal Communications, Inc. 2003 Employee Stock Purchase Plan as amended and restated through December 8, 2009. | |
| (10.7) | Journal Communications, Inc. Executive Management Incentive Plan (incorporated by reference to exhibit 10.7 to Journal Communications, Inc.’s Annual Report on Form 10-K for the period ended December 26, 2004 [Commission File No. 1-31805]).* | |
| (10.8) | Form of Journal Communications, Inc. 2003 Equity Incentive Plan Stock Option Award Agreement (Non-Statutory Stock Option Grant) for Directors (incorporated by reference to Exhibit 10.1 to Journal Communications Inc.’s Current Report on Form 8-K dated February 3, 2005 [Commission File No. 1-31805]).* | |
| (10.9) | Form of Journal Communications, Inc. 2003 Equity Incentive Plan Stock Option Award Agreement (Non-Statutory Stock Option Grant) for Officers and Employees (incorporated by reference to Exhibit 10.2 to Journal Communications Inc.’s Current Report on Form 8-K dated February 3, 2005 [Commission File No. 1-31805]).* | |
| (10.10) | Form of Journal Communications, Inc. 2003 Equity Incentive Plan Stock Grant Award Agreement (incorporated by reference to Exhibit 10.3 to Journal Communications Inc.’s Current Report on Form 8-K dated February 3, 2005 [Commission File No. 1-81805]).* | |
| (10.11) | Form of Journal Communications, Inc. 2003 Equity Incentive Plan Restricted Stock Award Agreement for Officers and Employees (incorporated by reference to Exhibit 10.5 to Journal Communications Inc.’s Current Report on Form 8-K dated February 3, 2005 [Commission File No. 1-31805]).* | |
| (10.12) | Form of Journal Communications, Inc. 2003 Equity Incentive Plan Restricted stock Award Agreement for Officers and Employees (incorporated by reference to Exhibit 10.4 to Journal Communications Inc.’s Current report on Form 8-K dated February 3, 2005 [Commission File No. 1-31805]).* | |
| (10.13) | Amended and Restated Employment Agreement, amended and restated effective as of December 8, 2007, between Steven J. Smith and Journal Communications, Inc. (incorporated by reference to Exhibit 10.14 to Journal Communications, Inc.’s Current Report on Form 8-K dated December 12, 2007 [Commission File No. 1-31805]).* | |
| (10.14) | Change in Control Agreement amended and restated effective as of December 8, 2007, between Journal Communications, Inc. and Douglas G. Kiel (incorporated by reference to Exhibit 10.14 to Journal Communications, Inc.’s Current Report on Form 8-K dated December 12, 2007 [Commission File No. 1-31805]).* | |
| (10.15) | Change in Control Agreement amended and restated effective as of December 8, 2007, between Journal Communications, Inc. and Elizabeth Brenner (incorporated by reference to Exhibit 10.6 to Journal Communications, Inc.’s Current Report on Form 8-K dated December 12, 2007 [Commission File No. 1-31805]).* | |
| (10.16) | Change in Control Agreement amended and restated effective as of December 8, 2007, between Journal Communications, Inc. and Mary Hill Leahy (incorporated by reference to Exhibit 10.8 to Journal Communications, Inc.’s Current Report on Form 8-K dated December 12, 2007 [Commission File No. 1-31805]).* | |
113
Table of Contents
| Exhibit |
Description | ||
| (10.17) | Change in Control Agreement effective as of December 8, 2008, between Journal Communications, Inc. and Andre J. Fernandez (incorporated by reference to Exhibit 10.2 to Journal Communications, Inc.’s Current Report on Form 8-K dated December 12, 2008 [Commission File No. 1-31805]).* | ||
| (10.18) | Amendment to the Journal Communications Inc. 2003 Equity Incentive Plan, as amended (incorporated by reference to Exhibit 10.1 to Journal Communications, Inc.’s Current Report on Form 8-K dated February 13, 2007 [Commission File No. 1-31805]).* | ||
| (10.19) | Form of Stock Appreciation Rights Agreement for Fixed Price Stock Appreciation Rights under the Journal Communications, Inc. 2003 Equity Incentive Plan (incorporated by reference to Exhibit 10.2 to Journal Communications, Inc.’s Current Report on Form 8-K dated February 13, 2007 [Commission File No. 1-31805]).* | ||
| (10.20) | Form of Stock Appreciation Rights Agreement for Escalating Price Stock Appreciation Rights under the Journal Communications, Inc. 2003 Equity Incentive Plan (incorporated by reference to Exhibit 10.3 to Journal Communications, Inc.’s Current Report on Form 8-K dated February 13, 2007 [Commission File No. 1-31805]).* | ||
| (10.21) | Form of Restricted Stock Award Agreement under the Journal Communications, Inc. 2003 Equity Incentive Plan (incorporated by reference to Exhibit 10.5 to Journal Communications, Inc.’s Current Report on Form 8-K dated February 13, 2007 [Commission File No. 1-31805]).* | ||
| (10.22) | Form of Non-Statutory Stock Option Agreement under the Journal Communications, Inc. 2003 Equity Incentive Plan (incorporated by reference to Exhibit 10.5 to Journal Communications, Inc.’s Current Report on Form 8-K dated February 13, 2007 [Commission File No. 1-31805]).* | ||
| (10.23 | ) | Journal Communications Non-Employee Director Compensation Policy, Amended as of February 9, 2010.* | |
| (10.24) | Journal Communications, Inc Annual Management Incentive Plan, adopted December 8, 2007 (incorporated by reference to Exhibit 10.9 to Journal Communications, Inc.’s Current Report on Form 8-K dated December 12, 2007 [Commission File No. 1-31805]).* | ||
| (10.25) | Journal Communications, Inc. 2007 Omnibus Incentive Plan (incorporated by reference to Exhibit 10.2 to Journal Communications, Inc.’s Current Report on Form 8-K dated December 12, 2007 [Commission File No. 1-31805]).* | ||
| (10.26) | Form of Restricted Stock Award Certificate under the Journal Communications, Inc. 2007 Omnibus Incentive Plan* | ||
| (10.27) | Form of Fixed-Price Stock Appreciation Rights Award Certificate under the Journal Communications, Inc. 2007 Omnibus Plan (incorporated by reference to Exhibit 4.5 to Journal Communications, Inc.’s Registration Statement on Form S-8 filed with the Securities and Exchange Commission on May 22, 2007 (Reg. No. 333-143146)).* | ||
| (10.28) | Form of Escalating Price Stock Appreciation Rights Award Certificate under the Journal Communications, Inc. 2007 Omnibus Incentive Plan (incorporated by reference to Exhibit 4.6 to Journal Communications, Inc.’s Registration statement on Form S-8 filed with the Securities and Exchange Commission on May 22, 2007 (Reg. No. 333-143146)).* | ||
| (10.29) | Form of Fully Vested Stock Award Notice under the Journal Communications, Inc. 2007 Omnibus Incentive Plan (incorporated by reference to Exhibit 4.7 to Journal Communications, Inc.’s Registration Statement on Form S-8 filed with the Securities and Exchange Commission on May 22, 2007 (Reg. No. 333-143146)).* | ||
114
Table of Contents
| Exhibit |
Description | |
| (10.30) | Form of Nonstatutory Stock Option Award Certificate under the Journal Communications, Inc. 2007 Omnibus Incentive Plan (incorporated by reference to Exhibit 4.8 to Journal Communications, Inc.’s registration statement on Form S-8 filed with the Securities and Exchange Commission on May 22, 2007 (Reg. No. 333-143146)). | |
| (10.31) | Consulting Agreement effective as of January 1, 2009, between Journal Communications, Inc. and Paul M. Bonaiuto (incorporated by reference to Exhibit 10.1 to Journal Communications, Inc.’s Current Report on Form 8-K dated December 12, 2008 [Commission File No. 1-31805]).* | |
| (21) | Subsidiaries of the registrant | |
| (23.1) | Consent of Independent Registered Public Accounting Firm. | |
| (23.2) | Consent of Independent Registered Public Accounting Firm | |
| (31.1) | Certification by Steven J. Smith, Chairman and Chief Executive Officer of Journal Communications, Inc., pursuant to Section 302 of the Sarbanes-Oxley Act of 2002. | |
| (31.2) | Certification by Andre J. Fernandez, Executive Vice President, Finance & Strategy and Chief Financial Officer of Journal Communications, Inc., pursuant to Section 302 of the Sarbanes-Oxley Act of 2002. | |
| (32) | Certification of Steven J. Smith, Chairman and Chief Executive Officer and Andre J. Fernandez, Executive Vice President, Finance & Strategy and Chief Financial Officer of Journal Communications, Inc., pursuant to 18 U.S.C. Section 1350, as adopted pursuant to Section 906 of the Sarbanes-Oxley Act of 2002. | |
| (99.1) | Proxy Statement for the April 28, 2010 Annual Meeting of Shareholders of Journal Communications, Inc. (Except to the extent specifically incorporated by reference, the Proxy Statement for the April 28, 2010 Annual Meeting of Shareholders shall not be deemed to be filed with the Securities and Exchange Commission as part of this Annual Report on Form 10-K.) | |
| * | Denotes a management or compensatory plan or arrangement. |
115