Attached files
UNITED STATES SECURITIES AND EXCHANGE COMMISSION
Washington, DC 20549
FORM 10-K
|
FOR ANNUAL AND TRANSITION REPORTS PURSUANT TO SECTIONS 13 OR 15(d) OF THE SECURITIES EXCHANGE ACT OF 1934 | ||
|
(Mark One) |
| |
|
|
|
|
|
þ |
|
ANNUAL REPORT PURSUANT TO SECTION 13 OR 15(d) OF THE SECURITIES EXCHANGE ACT OF 1934 |
|
|
|
For the Fiscal Year Ended December 31, 2009 |
|
OR
| ||
|
o |
|
TRANSITION REPORT PURSUANT TO SECTION 13 OR 15(d) OF THE SECURITIES EXCHANGE ACT OF 1934 |
|
|
|
For the transition period from to |
|
| ||
|
Commission File Number 1-34205 | ||
BROADVISION, INC.
(Exact name of registrant as specified in its charter)
|
Delaware |
|
94-3184303 |
|
(State or other jurisdiction of |
|
(I.R.S. Employer |
|
incorporation or organization) |
|
Identification No.) |
|
|
|
|
|
1600 Seaport Blvd, Suite 550, North Bldg. |
|
|
|
Redwood City, California |
|
94063 |
|
(Address of principal executive offices) |
|
(Zip code) |
|
(650) 331-1000
(Registrant's telephone number, including area code) | ||
|
Securities registered pursuant to Section 12(b) of the Act: | ||
|
None | ||
|
Securities registered pursuant to Section 12(g) of the Act: | ||
|
Common Stock, $.0001 par value
(Title of Class) | ||
Indicate by check mark if the registrant is a well-known seasoned issuer, as defined in Rule 405 of the Securities Act.
Yes o No R
Indicate by check mark if the registrant is not required to file reports pursuant to Section 13 or 15(d) of the Act.
Yes o No R
Indicate by check mark whether the registrant: (1) has filed all reports required to be filed by Section 13 or 15(d) of the Securities Exchange Act of 1934 during the preceding 12 months (or for such shorter period that the registrant was required to file such reports), and (2) has been subject to
such filing requirements for the past 90 days.
Yes R No o
Indicate by check mark whether the registrant has submitted electronically and posted on its corporate Web site, if any, every Interactive Data File required to be submitted and posted pursuant to Rule 405 of Regulation S-T (§232.405 of this chapter) during the preceding 12 months (or for such shorter period that the registrant was required
to submit and post such files).
Yes o No R
Yes R No o
Indicate by check mark whether the registrant is a large accelerated filer, an accelerated filer, a non-accelerated filer or a smaller reporting company. See the definitions of “large accelerated filer,” “accelerated filer” and “smaller reporting company” in Rule 12b-2 of the Exchange Act.
Large accelerated filer o Accelerated filero Non-accelerated filer þ Smaller reporting company o
Indicate by check mark whether the registrant is a shell company (as defined in Rule 12b-2 of the Act).
Yes o No R
As of June 30, 2009, based on the closing sales price as quoted by the NASDAQ, 2,011,862 shares of Common Stock, having an aggregate market value of approximately $25,450,054 were held by non-affiliates. For purposes of the
above statement only, all directors and executive officers of the registrant are assumed to be affiliates.
As of February 28, 2010, the registrant had 4,433,696 shares of common stock outstanding.
DOCUMENTS INCORPORATED BY REFERENCE
Parts of the Proxy Statement for the registrant's Annual Meeting of Stockholders to be held in June 2010 are incorporated by reference into Part III of this Annual Report on Form 10-K.
~ 1 ~
BROADVISION, INC.
ANNUAL REPORT ON FORM 10-K
YEAR ENDED DECEMBER 31, 2009
CAUTIONARY STATEMENT PURSUANT TO THE PRIVATE SECURITIES
LITIGATION REFORM ACT OF 1995
Certain statements set forth or incorporated by reference in this Form 10-K constitute "forward-looking statements" within the meaning of the Private Securities Litigation Reform Act of 1995. In some cases, you can identify forward-looking statements by words such as "may", "will", "should", "expect", "intend", "plan", "anticipate",
"believe", "estimate", "predict", "potential" or similar terms. These statements relate to future events or our future financial performance and involve known and unknown risks, uncertainties and other factors that may cause our actual results, levels of activity, performance or achievements to differ materially from any future results, levels of activity, performance or achievements expressed or implied by these forward-looking statements. These risks and other factors include those listed under "Risk Factors"
and elsewhere in this document. These statements are only predictions based on our current expectations and projections about future events, and we cannot guarantee future results, levels of activity, performance or achievements.
We expressly disclaim any obligation to update or publicly release any revision to these forward-looking statements after the date of this Form 10-K.
Information regarding market and industry statistics contained in the "Business" section of this report is included based on information available to us that we believe is accurate. It is generally based on academic and other publications that are not produced for purposes of securities offerings or economic analysis.
|
PART I, ITEM 1 TABLE OF CONTENTS (BUSINESS SECTION) |
|
| 3 | |
| 5 | |
| 7 | |
| 8 | |
| 8 | |
| 8 | |
| 9 | |
| 9 | |
| 10 | |
| 10 | |
| 10 |
Our Business
Since 1993, BroadVision has been a pioneer and consistent innovator of e-business solutions. We deliver a combination of technologies and services into the global market that enable customers of all sizes to power mission-critical web initiatives that ultimately deliver high-value to their bottom line. Our offering consists of a robust
framework for personalization and self-service, modular applications and agile toolsets that customers use to create e-commerce, portal solutions, and Enterprise Social Networks. As of December 31, 2009, we had licensed our products to more than 500 companies - including Audible.com, Baker Hughes, BioRad Laboratories, BNP Paribas, Canon, EFG Bank, Epson America, Fiat, Hilti, Indian Railway Catering and Tourism Company, ING Bank, LaPoste, Mettler Toledo, Office of Controller General of Defence Accounts Government
of India, Oreck Corporation, PETCO, Prime Polymer, Standard Bank of Argentina, Sony Computer Entertainment Inc., Thomas Cook (India) Ltd., U.S. Air Force, Vodafone, W.W. Grainger and Xerox.
Corporate Information
We were incorporated in Delaware in 1993 and have been a publicly traded corporation since 1996. From 2001 to date, our annual revenue has declined and as of December 31, 2009, we had an accumulated deficit of approximately $1.2 billion. The majority of our accumulated deficit to date has resulted from non-cash charges associated
with our 2000 acquisition of Interleaf, Inc. and restructuring charges related to excess real estate lease obligations.
In February 2006, we announced a subscription rights offering to existing stockholders. The primary purpose of the rights offering was to allow the holders of BroadVision common stock an opportunity to further invest in BroadVision in order to maintain their proportionate interest in BroadVision common stock, at the same price per share
as the price afforded to our Chief Executive Officer, founder and largest stockholder, Dr. Pehong Chen, in connection with a transaction in which we issued shares to Dr. Chen in exchange for the cancellation of notes he held. The rights offering expired on November 28, 2006. Eligible participants exercised rights to purchase 1.5 million shares, resulting in $15.8 million in net proceeds for us. Then we reduced our total number of authorized shares of common stock from 80,000,000 to 11,200,000 in February
2007. We deregistered the shares not sold in the rights offering and subject to the registration statement we filed in connection with the rights offering.
In order to complete the issuance of shares to Dr. Chen without violating applicable listing NASDAQ standards, we delivered to NASDAQ a notification of voluntary delisting of BroadVision common stock from the NASDAQ National Market effective prior to the opening of trading on March 8, 2006. Effective as of the opening of trading
on October 27, 2008, we effected a one-for-twenty-five reverse split of our common stock. As of November 10, 2008, we transferred the quotation of our common stock from the OTC Bulletin Board to the NASDAQ Global Market under the trading symbol "BVSN".
The accompanying consolidated financial statements and related financial information contained herein for all periods presented have been retroactively restated to give effect to the stock split in accordance with U.S. generally accepted accounting principles ("U.S. GAAP").
In the year ended December 31, 2008, we recognized a goodwill impairment charge of $25.1 million, which represented a full write-off of our remaining goodwill balance in accordance with the requirements of Accounting Standards Codificationä ("ASC")
350-20, Goodwill ("ASC 350-20").
Our principal executive offices are located at 1600 Seaport Boulevard, Suite 550, North Building, Redwood City, CA 94063. Our telephone number is (650) 331-1000. Our website address is www.broadvision.com. We make available free of
charge through our website, our annual report on Form 10-K, quarterly reports on Form 10-Q, current reports on Form 8-K, and all amendments to these reports as soon as reasonably practicable after filing, by providing a hyperlink to the Securities and Exchange Commission's website (www.sec.gov) directly to our reports. The contents of our website are not incorporated by reference into this report.
Industry Background
e-business has become an integral part of work life and organizations are looking for ways to reduce costs, improve productivity and increase revenues by moving their business online. More and more households and organizations worldwide have adopted a web paradigm and expect websites to be easy to use and available for their convenience.
By providing a way for enterprises to quickly assemble and deploy web-based solutions that tap into their resources, organizations can dramatically reduce the cost and improve the quality of interactions between employees, customers and business partners. A significant number of industry analysts have highlighted the ways in which organizations can reduce costs and improve customer satisfaction by implementing a self-service model, including online shopping and call center operations. In addition to accelerating
the response time for the consumer, e-business applications also enable organizations to collect valuable market research data about their customers.
BroadVision excels in offering e-business solutions that tightly integrate portal and commerce on a single, secure, high-performance framework that also enables advanced personalization and seamless integration to enterprise systems.
BroadVision's software offers advantages over competitive offerings in the following key respects:
Lasting business value extended to everyone:
|
l |
Low total cost of ownership (TCO) philosophy -- Support for both commercial and open source platforms as well as mixed commercial-open source deployment environments |
|
l |
Agility and extensibility -- Integrated tools for both business and IT to rapidly create unique e-business applications with the combination of out-of-the-box capabilities and custom development |
|
l |
Built-in best practices -- Proven technology and methodologies that take the guesswork out of building reliable, available and scalable web applications |
|
l |
Configurability -- Modular application services that can be assembled to meet customer's exact business requirements |
|
l |
Focus on e-business -- Mature applications and proven methodologies developed from over 1,000 implementations and 16 years of experience |
|
l |
Scalability -- Advanced load balancing and multi-layered caching allow BroadVision applications to support large numbers of concurrent customers and transactions |
|
l |
Personalization -- Our advanced personalization technology, including session and event-based observations and transaction information, provide a better understanding of site visitors and allow our customers to dynamically tailor content to them |
|
l |
Ease of use -- Our applications and tools are designed with graphical user interfaces that allow non-technical business managers to modify business rules and content in real time |
|
l |
Secure transaction processing -- Our applications provide secure handling of a wide range of commercial and financial services transactions including order pricing and discount/incentive handling, tax computation, shipping and handling charges, payment authorization, credit
card processing, order tracking, news and stock feeds through a combination of built-in functionality and integration with third-party products |
|
l |
Multi-platform availability -- Our applications are optimized for a variety of hardware and software platforms including IBM AIX, Sun Solaris, Microsoft Windows NT and Hewlett-Packard's HP-UX. Supported databases include Oracle, Sybase, Informix, IBM and Microsoft SQL
Server. Supported application servers include WebLogic, WebSphere and SunOne. We also support Open Source platforms, such as Linux with JBoss and Hypersonic |
|
l |
Multilingual/multicurrency -- Our applications are global ready and designed to support multiple languages (including Arabic, Chinese, Hebrew, Japanese, Korean, Slovakian, Turkish and most Western European languages) and a wide range of currencies, including the euro |
Product Overviews
Our offerings consist of modular applications and agile toolsets that are built on a robust framework for personalization and self-service:
Solutions
|
l |
Business Agility Suite |
Interact with visitors through personalized views of information, resources, and business processes stored in diverse internal and external legacy information systems. Support collaboration both inside and outside the enterprise. Empower business owners to manage more of the website, from content to personalization to collaboration. Take
control of the quality of information as customers create, manage and publish content to customer's e-business applications. Establish "one voice" with consistent branding and reuse valuable content assets more effectively. Bring all of the right people into the content development process with Web-based content creation, versioning and flexible content workflow.
|
l |
Commerce Agility Suite |
In addition to all the capabilities of Business Agility Suite, create an environment in which customers can transact more business throughout the entire sales process from lead generation to sales execution to customer support. Allow customers' businesses to manage Business-to-Business ("B2B") and Business-to-Consumer ("B2C") channels
through a single solution. Deliver advanced merchandising and personalization capabilities and easy-to-use catalog management tools for business users.
|
l |
CLEAR - OnDemand™ and Collaborative Human Resource Management |
Our BroadVision OnDemand™ ("BV OnDemand") business unit, headquartered in Beijing, China, developed an on-demand solution - easy to setup and operate via personalized self-service without costly upfront investments and lingering maintenance overhead - deliver compelling value to our customers immediately and continuously. CLEAR
(formally known as Collaborative Human Resource Management), developed using Kona-Kukini ("K2") in record time and with tremendous cost savings as BV OnDemand's first offering, has proven to be an impressive showcase for the K2 Methodology. This on-demand solution provides superb visibility and agility for all members of our customers' organizations
to collaborate more productively in each phase of the HR management life cycle, creating a strategic competitive advantage through the efficient management of human assets.
|
l |
Clearvale – an ESN solution |
Clearvale is our next-generation e-business solution, aimed at revolutionizing enterprise knowledge flows and performance gains across and beyond a company’s entire ecosystem. Delivered globally through cloud computing, Clearvale empowers the enterprise and all its constituents — employees, partners, customers, and
other stakeholders — to publicize, personalize, and socialize their communications and collaborations directly by anyone, from anywhere, at anytime, with the goal of yielding unprecedented business immediacy, agility, and productivity. Unlike traditional Web 1.0 portal and content tools, which can be unwieldy, expensive, and ineffective and unlike Web 2.0 widgets, which can be too casual, disparate and confusing, Clearvale is an integrated Enterprise 2.0 platform intended to address all e-business issues
holistically and economically.
|
l |
QuickSilver™ |
Provides powerful features for creation and publishing of lengthy, complex documents supporting multiple output formats (including HTML, PDF and Postscript) and automatic publishing of personalized content to BroadVision Portal. Assemble publications from a variety of text, graphic and database sources, including Microsoft Word, AutoCad,
Microsoft Excel, and Oracle. Includes a complete XML authoring environment.
e-business Framework Components
Methodology
|
l |
BroadVision e-business Methodology |
Apply the best practices developed during BroadVision's 16 years of experience with some of the world's largest e-business websites. Ensure application performance, reliability, availability and scalability. Enable global productivity by leveraging multi-shore development teams with optimized division of work. Promote reuse of custom developed
components.
Developer Toolkit
|
l |
Kukini |
Utilize teams of business and IT to create a distinctive user experience with a flexible toolkit. Provide both sets of users with a visual environment where they can work together to design and deploy complex e-business applications and websites quickly and efficiently. Creates a structure for dividing tasks among people with different
skill levels while enforcing best practices. Run with customer's J2EE application environment of choice and leverage the rich and scalable BroadVision Kona services.
Framework
|
l |
Kona |
The Kona framework tightly integrates Portal, Content, Commerce and Staging services with personalization capability. Build differentiated e-business applications quickly and efficiently using a set of open, flexible and configurable services. Use out-of-the box functionality, data schemas and tools to have an e-business application up
and running in days or weeks, not months. Empower business users to take control of day-to-day site management tasks. Leverage commercial operating systems, databases and application servers or a mix of commercial and open source components to drive the highest level of performance with the lowest total cost of ownership.
Application Services Library
Accelerate application development with a modular set of flexible, out-of-the-box web services build on the functionality of Kona, expanding the capabilities of the core framework.
|
l |
Commerce Services |
Display product offerings and transact business on customers' websites. Includes configurable catalog management, pricing, shopping cart, checkout and order management capabilities. Enables business users to maintain control over day-to-day activities on the site.
|
l |
Portal Services |
Provide end users with a personalized and intuitive navigation experience as they interact with customer's business. Incorporates a navigation hierarchy, content categorization and familiar portlet structure into any e-business application.
|
l |
Process Services™ |
Extends web capabilities and transforms costly, people-intensive processes and collaborations into web-based self-service applications. Allows business and IT to design, test and deploy solutions in days, not months, significantly reducing costs and accelerating time-to-implementation.
|
l |
Content Services™ |
Manages web content throughout its lifecycle: from creation and management through deployment and distribution. As part of a BroadVision solution, it creates a review, approval and publishing cycle that replace a cumbersome email trail, provides for version control, creates an audit trail, and helps organizations deliver personalized,
timely and up-to-date content.
|
l |
Staging Services™ |
Simplifies the process of moving content from multiple systems to the production environment. Reduces the cost of managing BroadVision application assets and improves process standardization for enterprise staging initiatives.
|
l |
eMerchandising™ |
Drive higher conversion rates, differentiate e-commerce sites and connect online and offline experiences with innovative, patent-pending discounting capabilities. Create, manage and implement complex sales discounts while maintaining oversight over profitability. Deploys discounts to BroadVision and non-BroadVision e-commerce sites.
|
l |
Search™ |
Provides full-text and field searching of online content and any referenced external files and returns results with relevance-ranked scores. Supports query searches using a broad spectrum of search operators. Connects people to the information they seek regardless of medium.
Open Standards-Based Architecture
BroadVision e-business solutions are built on object-oriented application code written in J2EE programming environments, which allows developers and system integrators to use, integrate, modify, adapt or extend the applications with minimal impact on other areas to create a rapidly customized product that meets specific business requirements.
BroadVision Process leverages a proven open source stack at the platform layers to reduce total cost of ownership and optimize performance.
Support for the J2EE standards for object-oriented computing enables high-volume performance, flexible application deployment and easy integration with third-party or legacy applications. Our applications fully support XML, which is the emerging standard for managing and exchanging data between e-business systems as well as for re-purposing
and sending information to wireless devices.
In addition, we use other widely accepted standards in developing our products, including Web Services, Structured Query Language ("SQL") for accessing relational database management systems; Common Gateway Interface ("CGI") and Hypertext Transfer Protocol
("HTTP") for web access; Secure Socket Layer ("SSL") for secure transmissions over networks; and the encryption algorithms supplied by RSA Security.
Our applications can be operated in conjunction with relational database management systems provided by IBM Corporation, MySQL, Microsoft, and Oracle. Supported application servers include WebLogic, WebSphere, SunOne and JBoss.
Support for Open Source
BroadVision e-business platform gives organizations the option of running on a commercially available technology stack described above or on an open source stack. While our commitment to commercial platforms has not changed, we recognize that our customers are adopting Open Source as a platform because of its total cost of ownership and
runtime benefits.
BroadVision provides a full spectrum of global services to contribute to the success of our customers, including business consulting services, implementation services related to our software and related software, migration and performance tuning services and ongoing training and technical support.
Education Services
Coursework is available for Content Managers, Technical Developers and System Administrators through BroadVision Education Services. Customers and partners can arrange for on-site programs, which keep employees at the office, or take advantage of public courses at BroadVision locations.
Support and Maintenance Services
BroadVision offers a tiered support and maintenance program to better serve the needs of our global customer base. Standard Support provides technical assistance during regular business hours; Enterprise Support is designed for customers with mission-critical environments, providing customers with access to support experts 24 hours
a day, 7 days a week; and Personalized Support assigns a specific individual to a customer along with other customer specified support services, including on-site support engineers. We have technical support centers in North America, Europe and Asia. Under our standard maintenance agreement, we provide telephone support and upgrade rights to new releases, including patch releases (as necessary) and product enhancements (when and if available).
As of December 31, 2009, we had licensed our products to over 500 companies. For the year ended December 31, 2009, one customer in the retail industry accounted for more than 10% of our total revenues. For the years ended December 2008 and 2007, no customer accounted for more than 10% of our total revenues. At December
31, 2009, one customer in the medical device industry accounted for more than 10% of our accounts receivable balance. At December 31, 2008, no customer accounted for more than 10% of our accounts receivable balance. We do not believe that the loss of any single customer would have a material adverse effect on our business or results of operations.
Our software is deployed in all major industry groups, including financial services, government, healthcare, manufacturing, retail and telecommunications. Customers include Audible.com, Baker Hughes, BioRad Laboratories, BNP Paribas, Canon, EFG Bank, Epson America, Fiat, Hilti, Indian Railway Catering and Tourism Company, ING Bank, LaPoste,
Mettler Toledo, Office of Controller General of Defence Accounts Government of India, Oreck Corporation, PETCO, Prime Polymer, Standard Bank of Argentina, Sony Computer Entertainment Inc., Thomas Cook (India) Ltd., U.S. Air Force, Vodafone, W.W. Grainger and Xerox.
We market our products primarily through a direct sales organization with operations in North America, Europe and Asia/Pacific. On December 31, 2009, our direct sales organization included 36 sales representatives, managers and sales support personnel.
We have sales offices located throughout the world to support the sales and marketing of our products. In support of the Americas organizations, offices located in the United States are in California and Massachusetts.
Offices for our Europe region are located in France, Germany, Italy, Spain and the United Kingdom.
Our sales and marketing offices in the Asia Pacific/Japan/India/Middle East region are located in India, China, and Japan. We derive a significant portion of our revenue from our operations outside North America. In the twelve months ended December 31, 2009, approximately 45% of our revenues were derived from international sales.
In the twelve months ended December 31, 2008, approximately 53% of our revenue was derived from international sales. If we are unable to manage or grow our existing international operations, we may not generate sufficient revenue required to establish and maintain these operations, which could slow our overall growth and impair our operating margins.
Initial sales activities typically involve discussion and review of the potential business value associated with the implementation of a BroadVision solution, a demonstration of our e-business applications capabilities at the prospect's site, followed by one or more detailed technical reviews. The sales process usually involves collaboration
with the prospective customer in order to specify the scope of the solution. Our Worldwide e-business Services Organization helps customers to design, develop and deploy their e-business solutions.
As of December 31, 2009, 7 employees were engaged in a variety of marketing activities, including product planning, marketing material development, public relations, identifying potential customers, establishing and maintaining close relationships with recognized industry analysts and maintaining our website.
We recognize that today's organizations require an open, partner-based approach to e-business. Accordingly, we have assembled a global team of best-of-breed partners with the skills, services and value-added products necessary to develop, market, sell and deliver the most competitive e-business solutions available.
Consulting Partners
Our systems integration and consulting services partners deliver strategic business solutions to our global customers. These partners offer deployment experience, strong vertical market expertise, and process-based solutions. Our contractual agreements with these consulting partners motivate them to build a development expertise in our
technology and sell our products and services to potential customers, thus enabling us to extend the reach of our products and services. Revenue generated from consulting partners in recent years has not been significant.
Technology/OEM Partners
Our technology partners include Value-Added Resellers (VAR) and Independent Software Vendors (ISV) who build and deploy BroadVision-based vertical and horizontal software solutions. Our goal is to create value-added solutions that address a customer's specific business and IT goals. In addition, technology partners include distributors
who are authorized representatives that market, distribute, resell and support our products and services or application service providers who develop, host and support value-added application solutions based on our technology. The contracts that govern our relationships with these partners are generally terminable by either party upon 30 to 90 days notice. In most cases, technology/OEM partners license our products to users under the terms of a reseller or distribution agreement. Revenue generated from technology/OEM
partners in recent years has not been significant.
If we fail to compete successfully with current or future competitors, we may lose market share. The market for e-business is intensely competitive. Our customers' requirements and the technology available to satisfy those requirements will continually change. We expect competition in this market to persist. Our primary competition currently
includes:
|
l |
in-house development efforts by prospective customers or partners; |
|
l |
other vendors of application software or application development platforms and tools directed at interactive commerce and portal applications, such as Art Technology Group, ElasticPath, EscalateRetail, IBM Corporation, Microsoft, Oracle and SAP. |
|
l |
other vendors of ESN platforms or solutions, such as Microsoft’s SharePoint, Jive Software, blueKiwi and CubeTree. |
|
l |
web content developers that develop custom software or integrate other application software into custom solutions. |
The principal competitive factors affecting the market for our products are:
|
l |
depth and breadth of functionality offered; |
|
l |
availability of knowledgeable developers; |
|
l |
time required for application deployment; |
|
l |
reliance on industry standards; |
|
l |
product reliability; |
|
l |
proven track record; |
|
l |
scalability; |
|
l |
maintainability; |
|
l |
product quality; |
|
l |
price; and |
|
l |
technical support. |
Compared to us, many of these competitors and other current and future competitors have longer operating histories and significantly greater financial, technical, sales, marketing and other resources. As a result, they may be able to respond more quickly to new or changing opportunities, technologies and customer requirements. Many of
these companies can use their greater name recognition and more extensive customer base to gain market share. Competitors may be able to undertake more extensive promotional activities, adopt more aggressive pricing policies and offer more attractive terms to purchasers. Current and potential competitors may bundle their products to discourage users from purchasing our products. In addition, competitors have established or may establish cooperative relationships among themselves or with third parties to enhance
their products. Accordingly, it is possible that new competitors or alliances among competitors may emerge and rapidly acquire significant market share. Competitive pressures may make it difficult for us to acquire and retain customers.
Our success and ability to compete are dependent to a significant degree on our proprietary technology. We hold a U.S. patent, issued in January 1998 and expiring in August 2015, on elements of the BroadVision One-To-One Enterprise product, which covers e-commerce operations common in today's web business. We also hold a U.S. patent,
issued in November 1996 and expiring in February 2014, acquired as part of the Interleaf acquisition, on the elements of the extensible electronic document processing system for creating new classes of active documents. The patent on active documents (associating procedures to elements of an electronic document) is fundamental and hard to avoid by some modern document processing systems. Although we hold these patents, they may not provide an adequate level of intellectual property protection. In addition, litigation
may be necessary in the future to enforce our intellectual property rights, to protect our trade secrets, to determine the validity and scope of the proprietary rights of others, or to defend against claims of infringement or invalidity. We cannot guarantee that infringement or other claims will not be asserted or prosecuted against us in the future, whether resulting from our intellectual property or licenses from third parties. Claims or litigation, whether successful or unsuccessful, could result in substantial
costs and diversions of resources, either of which could harm our business.
We also rely on copyright, trademark, service mark, trade secret laws and contractual restrictions to protect our proprietary rights in products and services. We have registered "BroadVision", "BroadVision One-To-One", "Interleaf" and "Interleaf Xtreme" as trademarks in the United States and in other countries. It is possible that our
competitors or other companies will adopt product names similar to these trademarks, impeding our ability to build brand identity and possibly confusing customers.
As a matter of our company policy, we enter into confidentiality and assignment agreements with our employees, consultants and vendors. We also control access to and distribution of our software, documents and other proprietary information. Notwithstanding these precautions, it may be possible for an unauthorized third party to copy or
otherwise obtain and use our software or other proprietary information or to develop similar software independently. Policing unauthorized use of our products will be difficult, particularly because the global nature of the Internet makes it difficult to control the ultimate destination or security of software and other transmitted data. The laws of other countries may afford us little or no effective protection of our intellectual property.
As of December 31, 2009, we employed a total of 214 full-time employees, of whom 89 are based in North America, 25 in Europe and 100 in Asia. Of these full-time employees, 43 are in sales and marketing, 100 are in product development, 41 are in global services and client support, and 30 are in operations, administration and finance.
We believe that our future success depends on attracting and retaining highly skilled personnel. We may be unable to attract and retain high-caliber employees. Our employees are not represented by any collective bargaining unit. We have never experienced a work stoppage and consider our employee relations to be good.
Our executive officers and their ages and positions as of December 31, 2009 are in the table below.
|
Name |
Age |
Position | ||
|
Pehong Chen |
52 |
Chairman, President and Chief Executive Officer | ||
|
Shin-Yuan Tzou |
52 |
Chief Financial Officer |
Pehong Chen has served as our Chairman of the Board, Chief Executive Officer and President since our incorporation in May 1993. From 1992 to 1993, Dr. Chen served as the
Vice President of Multimedia Technology at Sybase, a supplier of client-server software products. Dr. Chen founded and, from 1989 to 1992, served as President of Gain Technology, a provider of multimedia applications development systems, which was acquired by Sybase. He received a B.S. in Computer Science from National Taiwan University, an M.S. in Computer Science from Indiana University and a Ph.D. in Computer Science from the University of California at Berkeley.
Shin-Yuan Tzou was appointed our Chief Financial Officer in January 2008. Most recently, Dr. Tzou served as our Chief of Staff, responsible for our Sarbanes-Oxley compliance taskforce, successfully streamlining all back-office business processes worldwide across finance, legal,
HR, IT, etc. He has also served as the Regional General Manager for the Asia-Pacific-Japan region, heading both Sales and BroadVision Professional Services organizations. Dr. Tzou has been with us since 1995, won "Most Valuable Player" award in 1997, and has contributed to the design and development of every version of our self-service suite as our Chief Technology Officer. Prior to BroadVision, Dr. Tzou worked for IBM and Silicon Graphics. He earned his Ph.D. in Computer Science from University of California
at Berkeley.
Financial Information about Geographic Areas
For details regarding financial information about geographic areas, please refer to Note 11 – Geographic, Segment and Significant Customer Information in the Notes to our Consolidated Financial Statements. For risks related to our international operations, please refer to Item 1A. “Risk Factors.”
The risks and uncertainties described below are not the only ones facing us. Additional risks and uncertainties not presently known to us or that we currently deem immaterial also may impair our business operations. If any of the following risks actually occur, our business could be harmed. In that event, the trading
price of our common stock could decline.
Our business currently depends on revenue related to BroadVision e-business solutions, and if the market does not increasingly accept these products and related products and services, our revenue may continue to decline.
We generate our revenue from licenses of BroadVision e-business solutions, including process, commerce, portal and content management and related products and services. We expect that these products, and future upgraded versions, will continue to account for a large portion of our revenue in the foreseeable future. Our future financial
performance will depend on increasing acceptance of our current products and on the successful development, introduction and customer acceptance of new and enhanced versions of our products. If new and future versions and updates of our products and services do not gain market acceptance when released commercially, or if we fail to deliver the product enhancements and complementary third party products that customers want, demand for our products and services, and our revenue, may decline. Our future financial
performance will also depend on our ability to retain our installed base. When existing customers move away from us, often due to budget or competition, we lose recurring maintenance revenue and future up-sell opportunities.
We have recently introduced new products, services and technologies and our business will be harmed if we are not successful in selling these offerings to our existing customers and new customers.
We released BroadVision 8.1™ in 2007, CHRM*360 in 2008 (which was upgraded and renamed to Clear in 2009), BroadVision 8.2™ in 2009 and Clearvale in 2009. We have spent significant resources in developing these offerings and training our employees to implement and support the offerings, and we plan to add additional
sales and marketing resources to support these new products, services and technologies. We do not yet know whether any of these new offerings will appeal to existing and potential new customers, and if so, whether sales of these new offerings will be sufficient for us to offset the costs of development, implementation, support, operation and marketing. Particularly in difficult economic times when companies are more likely to be managing spending, potential new customers may delay spending decisions and
our existing customers may determine that the BroadVision products and services they currently use are sufficient for their purposes, or that the added benefit from these new offerings is not sufficient to merit the additional cost. As a result we may need to decrease our prices or develop modifications. Although we have performed extensive testing of our new products and technologies, their broad-based implementation may require more support than we anticipate, which would further increase our expenses.
If sales of our new products, services and technologies are lower than we expect, or if we must lower our prices or delay implementation to fix unforeseen problems and develop modifications, our operating margins are likely to decrease and we may not be able to operate profitably. A failure to operate profitably would significantly harm our business.
We have recently introduced Cloud-based offerings. Our business will be harmed and our growth potential will be limited, if we are unable to provide reliable, scalable, and cost-efficient Cloud hosting operation.
Traditionally, BroadVision offers perpetual software licenses, with customers responsible for the IT equipment needed for running BroadVision software. The new Clear and Clearvale products, on the other hand, include Cloud-based offerings, where BroadVision provides hosted
IT equipment and operation for subscribing customers. The Cloud model is also known as Software-as-a-Service, or SaaS. BroadVision does not have significant prior experience in operating Cloud hosting. We may be unable to timely provide adequate computing capacity to keep up with business growth and performance requirements. Our hosted operation may fail due to hardware problems, software problems, power problems, network problems, scalability problems, human
errors, hacker attacks, disasters, third-party data center problems and other reasons. The failures may cause us to compromise security, lose customer data or identity, endure prolonged downtime, etc., all of which will harm our business and limit our growth. BroadVision does not have significant prior experience in estimating the costs of Cloud hosting. If we underestimate the costs or under-charge customers, we may not have adequate margins to sustain the Cloud hosting
operation. Clearvale offers customers to use basic functions for free, a business practice gaining popularity in our industry. If we do not have enough customers upgrading to for-fee premium functions, we may be unable to sustain our Cloud hosting operation economically.
Current and potential competitors could make it difficult for us to acquire and retain customers now and in the future.
The market for our products is intensely competitive. We expect competition in this market to persist and increase in the future. If we fail to compete successfully with current or future competitors, we may be unable to attract and retain customers. Increased competition could also result in price reductions for our products and lower
profit margins and reduced market share, any of which could harm our business, results of operations and financial condition.
Many of our competitors have significantly greater financial, technical, marketing and other resources, greater name recognition, a broader range of products and a larger installed customer base, any of which could provide them with a significant competitive advantage. In addition, new competitors, or alliances among existing and future
competitors, may emerge and rapidly gain significant market share. Some of our competitors, particularly established software vendors, may also be able to provide customers with products and services comparable to ours at lower or at aggressively reduced prices in an effort to increase market share or as part of a broader software package they are selling to a customer. We may be unable to match competitor's prices or price reductions, and we may fail to win customers that choose to purchase an information technology
solution as part of a broader software and services package. As a result, we may be unable to compete successfully with current or new competitors.
If we are unable to keep pace with the rapid technological changes in online commerce, portal, social networking and enterprise software, our products and services may fail to be competitive.
Our products and services may fail to be competitive if we do not maintain or exceed the pace of technological developments in Internet commerce, portal, social networking and enterprise software. Failure to be competitive could cause our revenue to decline. The information services, software and communications industries are characterized
by rapid technological change, changes in customer requirements, frequent new product and service introductions and enhancements and evolving industry standards and practices. The introduction of products and services embodying new technologies and the emergence of new industry standards and practices can render existing products and services obsolete. Our future success will depend, in part, on our ability to:
|
• |
develop leading technologies; | |
|
• |
enhance our existing products and services; | |
|
• |
develop new products and services that address the increasingly sophisticated and varied needs of our prospective customers; and | |
|
• |
respond to technological advances and emerging industry standards and practices on a timely and cost-effective basis. |
We have a history of losses and our future profitability on a quarterly or annual basis is uncertain, which could have a harmful effect on our business and the value of BroadVision common stock.
Our quarterly operating results have fluctuated in the past and may fluctuate significantly in the future as a result of a variety of factors, many of which are outside of our control. As of December 31, 2009, we had an accumulated deficit of approximately $1.2 billion.
Given our planned operating and capital expenditures, for the foreseeable future we expect our results of operations to fluctuate, and during this period we may incur losses and/or negative cash flows. If our revenue does not increase or if we fail to maintain our expenses at an amount less than our projected revenue, we will not be able
to achieve or sustain operating profitability on a consistent basis. We are continuing our efforts to reduce and control our expense structure. We believe strict cost containment and expense reductions are essential to achieving positive cash flow and profitability. A number of factors could preclude us from successfully bringing costs and expenses in line with our revenues, including unplanned uses of cash, the inability to accurately forecast business activities and further deterioration of our revenues. If
we are not able to effectively reduce our costs and achieve an expense structure commensurate with our business activities and revenues, we may have inadequate levels of cash for operations or for capital requirements, which could significantly harm our ability to operate our business.
Our failure to operate profitably or control negative cash flows on a quarterly or annual basis could harm our business and the value of BroadVision common stock. If the negative cash flow continues, our liquidity and ability to operate our business would be severely and adversely impacted. Additionally, our ability to raise financial
capital may be hindered due to our operational losses and negative cash flows, reducing our operating flexibility.
Our quarterly operating results are volatile and difficult to predict, and our stock price may decline if we fail to meet the expectations of securities analysts or investors.
Historically our quarterly operating results have varied significantly from quarter to quarter and are likely to continue to vary significantly in the future. If our revenues, operating results, earnings or projections are below the levels expected by securities analysts or investors, our stock price is likely to decline.
We are likely to continue to experience significant fluctuations in our future results of operations due to a variety of factors, some of which are outside of our control, including:
|
• |
introduction of products and services and enhancements by us and our competitors; | |
|
• |
competitive factors that affect our pricing; | |
|
• |
market acceptance of new products; | |
|
• |
the mix of products sold by us; | |
|
• |
the timing of receipt, fulfillment and recognition as revenue of significant orders; | |
|
• |
changes in our pricing policies or our competitors; | |
|
• |
changes in our sales incentive plans; | |
|
• |
the budgeting cycles of our customers; | |
|
• |
customer order deferrals in anticipation of new products or enhancements by our competitors or us or because of macro-economic conditions; | |
|
• |
nonrenewal of our maintenance agreements, which generally automatically renew for one-year terms unless earlier terminated by either party upon 90-days notice; | |
|
• |
product life cycles; | |
|
• |
changes in strategy; | |
|
• |
seasonal trends; | |
|
• |
the mix of distribution channels through which our products are sold; | |
|
• |
the mix of international and domestic sales; | |
|
• |
the rate at which new sales people become productive; | |
|
• |
changes in the level of operating expenses to support projected growth; | |
|
• |
increase in the amount of third party products and services that we use in our products or resell with royalties attached; | |
|
• |
fluctuations in the recorded value of outstanding common stock warrants that will be based upon changes to the underlying market value of BroadVision common stock; and | |
|
• |
costs associated with litigation, regulatory compliance and other corporate events such as operational reorganizations. |
As a result of these factors, we believe that quarter-to-quarter comparisons of our revenue and operating results are not necessarily meaningful, and that these comparisons are not accurate indicators of future performance. Because our staffing and operating expenses are based on anticipated revenue levels, and because a high percentage
of our costs are fixed, small variations in the timing of the recognition of specific revenue could cause significant variations in operating results from quarter to quarter. If we were unable to adjust spending in a timely manner to compensate for any revenue shortfall, any significant revenue shortfall would likely have an immediate negative effect on our operating results. If our operating results in one or more future quarters fail to meet the expectations of securities analysts or investors, we would expect
to experience an immediate and significant decline in the trading price of our stock.
Our sales and product implementation cycles are lengthy and subject to delay, which make it difficult to predict our quarterly results.
Our sales and product implementation cycles generally span months. Delays in customer orders or product implementations, which are difficult to predict, can affect the timing of revenue recognition and adversely affect our quarterly operating results. Licensing our products is often an enterprise-wide decision by prospective customers.
The importance of this decision requires that we engage in a lengthy sales cycle with prospective customers. A successful sales cycle may last up to nine months or longer. Our sales cycle is also affected by a number of other factors, some of which we have little or no control over, including the volatility of the overall software market, the business condition and purchasing cycle of each prospective customer, and the performance of our technology partners, systems integrators and resellers. The implementation
of our products can also be time and resource intensive, and subject to unexpected delays. Delays in either product sales or implementations could cause our operating results to vary significantly from quarter to quarter.
Because a significant portion of our sales activity occurs at the end of each fiscal quarter, delays in a relatively small number of license transactions could adversely affect our quarterly operating results.
A significant proportion of our sales are concentrated in the last month of each fiscal quarter. Gross margins are high for our license transactions. Customers and prospective customers may use these conditions in an attempt to obtain more favorable terms. While we endeavor to avoid making concessions that could result in lower margins,
the negotiations often result in delays in closing license transactions. Small delays in a relatively small number of license transactions could have a significant impact on our reported operating results for that quarter.
We have substantially modified our business and operations and will need to manage and support these changes effectively in order for our business plan to succeed.
We have substantially expanded and subsequently contracted our business and operations since our inception in 1993. We grew from 652 employees at the end of 1999 to 2,412 employees at the end of 2000 and then reduced our numbers to 159 at the end of 2006, 195 at the end of 2007, and 219 at the end of 2008. On December 31, 2009, we had
214 employees. As a consequence of our employee base growing and then contracting so rapidly, we entered into significant contracts for facilities space for which we ultimately determined we did not have a future use. We announced during the third and fourth quarters of 2004 that we had agreed with the landlords of various facilities to renegotiate future lease commitments, extinguishing a total of approximately $155 million of future obligations. The management of the expansion and later reduction of our
operations has taken a considerable amount of our management's attention during the past several years. As we manage our business to introduce and support new products, we will need to continue to monitor our workforce and make appropriate changes as necessary. If we are unable to support past changes and implement future changes effectively, we may have to divert additional resources away from executing our business plan and toward internal administration. If our expenses significantly outpace our revenues,
we may have to make additional changes to our management systems and our business plan may not succeed.
We may face liquidity challenges and need additional financing in the future.
We currently expect to be able to fund our working capital requirements from our existing cash and cash equivalents and our anticipated cash flows from operations and subleases through at least December 31, 2010. However, we could experience unforeseen circumstances, such as an economic downturn, difficulties in retaining customers and/or
key employees, or other factors that could increase our use of available cash and require us to seek additional financing. We may find it necessary to obtain additional equity or debt financing due to the factors listed above or in order to support a more rapid expansion, develop new or enhanced products or services, respond to competitive pressures, acquire complementary businesses or technologies or respond to unanticipated requirements.
We may seek to raise additional funds through private or public sales of securities, strategic relationships, bank debt, financing under leasing arrangements or otherwise. If additional funds are raised through the issuance of equity securities, the percentage ownership of our stockholders will be reduced, stockholders may experience additional
dilution or any equity securities we sell may have rights, preferences or privileges senior to those of the holders of our common stock. We expect that obtaining additional financing on acceptable terms would be difficult, at best. If adequate funds are not available or are not available on acceptable terms, we may be unable to pay our debts as they become due, develop our products, take advantage of future opportunities or respond to competitive pressures or unanticipated requirements, which could have a material
adverse effect on our business, financial condition and future operating results.
If we are unable to maintain our disclosure controls and procedures, including our internal control over financial reporting, our ability to report our financial results on a timely and accurate basis may be adversely affected.
We have evaluated our "disclosure controls and procedures" as such term is defined in Rule 13a-15(e) under the Securities Exchange Act of 1934, as amended. Effective controls are necessary for us to provide reliable financial reports and effectively prevent fraud. If we cannot provide reliable financial reports or prevent fraud,
our operating results could be harmed.
Maintaining sufficient expertise and historical institutional knowledge in our accounting and finance organization is dependent upon retaining existing employees and filling any open positions with experienced personnel in a timely fashion. The market for skilled accounting and finance personnel is competitive and we may have continued
difficulty in retaining our staff because (1) the region in which we compete consists of many established companies that can offer more lucrative compensation packages and (2) some professionals are reluctant to deal with the complex accounting issues relating to our historical operations. Our inability to staff the department with competent personnel with sufficient training will affect our internal controls over financial reporting to the extent that we may not be able to prevent or detect material
misstatements.
We are dependent on direct sales personnel and third-party distribution channels to achieve revenue growth.
To date, we have sold our products primarily through our direct sales force. Our ability to achieve significant revenue growth in the future largely will depend on our success in recruiting, training and retaining sufficient direct sales personnel and establishing and maintaining relationships with distributors, resellers and systems integrators.
Our products and services require a sophisticated sales effort targeted at the senior management of our prospective customers. New hires as well as employees of our distributors, resellers and systems integrators require training and may take a significant amount of time before achieving full productivity. Our recent hires may not become as productive as necessary, and we may be unable to hire and retain sufficient numbers of qualified individuals in the future. We have entered into strategic alliance agreements
with partners, under which partners have agreed to resell and support our current BroadVision product suite. These contracts are generally terminable by either party upon 30 days' notice of an uncured material breach or for convenience upon 90 days' notice prior to the end of any annual term. Termination of any of these alliances could harm our expected revenues. We may be unable to expand our other distribution channels, and any expansion may not result in revenue increases. If we fail to maintain
and expand our direct sales force or other distribution channels, our revenues may not grow or they may decline. Revenue generated from third-party distributors in recent years has not been significant.
Failure to maintain relationships with third-party systems integrators could harm our ability to achieve our business plan.
Our relationships with third-party systems integrators who deploy our products have been a key factor in our overall business strategy, particularly because many of our current and prospective customers rely on integrators to develop, deploy and manage their online marketplaces. Our efforts to manage our relationships with systems integrators
may not succeed, which could harm our ability to achieve our business plan due to a variety of factors, including:
|
• |
Systems integrators may not view their relationships with us as valuable to their own businesses. The related arrangements typically may be terminated by either party with limited notice and in some cases are not covered by a formal agreement. | |
|
• |
Under our business model, we often rely on our system integrators' employees to perform implementations. If we fail to work together effectively, or if these parties perform poorly, our reputation may be harmed and deployment of our products may be delayed or inadequate. | |
|
• |
Systems integrators may attempt to market their own products and services rather than ours. | |
|
• |
Our competitors may have stronger relationships with our systems integrators than us and, as a result, these integrators may recommend a competitor's products and services over ours. | |
|
• |
If we lose our relationships with our systems integrators, we will not have the personnel necessary to deploy our products effectively, and we will need to commit significant additional sales and marketing resources in an effort to reach the markets and customers served by these parties. |
We may be unable to manage or grow our international operations and assets, which could impair our overall growth or financial position.
We derive a significant portion of our revenue from our operations outside North America. In the twelve months ended December 31, 2009, approximately 45% of our revenue was derived from international sales. If we are unable to manage or grow our existing international operations, we may not generate sufficient revenue required to establish
and maintain these operations, which could slow our overall growth and impair our operating margins.
As we rely materially on our operations outside of North America, we are subject to significant risks of doing business internationally, including:
|
• |
difficulties in staffing and managing foreign operations and safeguarding foreign assets; | |
|
• |
unexpected changes in regulatory requirements; | |
|
• |
export controls relating to encryption technology and other export restrictions; | |
|
• |
tariffs and other trade barriers; | |
|
• |
political and economic instability; | |
|
• |
fluctuations in currency exchange rates; | |
|
• |
reduced protection for intellectual property rights in some countries; | |
|
• |
cultural barriers; | |
|
• |
seasonal reductions in business activity during the summer months in Europe and certain other parts of the world; and | |
|
• |
potentially adverse tax consequences. |
Management of international operations presents special challenges, particularly at our reduced staffing levels. For example, during 2008 we uncovered through our whistle blower program that an officer of our
Japan subsidiary was involved in a scheme to submit fraudulent expense reimbursements totaling approximately $84,000 during the period between 2007 and 2008. We were able to recover the funds from the officer and the officer was terminated. Although this scheme was detected, we face the risk that other similar misappropriations of assets may occur in the future.
Our international sales growth could be limited if we are unable to establish additional foreign operations, expand international sales channel management and support, hire additional personnel, customize products for local markets and develop
relationships with international service providers, distributors and system integrators. Even if we are able to successfully expand our international operations, we may not succeed in maintaining or expanding international market demand for our products.
Our success and competitive position will depend on our ability to protect our proprietary technology.
Our success and ability to compete are dependent to a significant degree on our proprietary technology. We hold a U.S. patent, issued in January 1998, on elements of the BroadVision platform, which covers electronic commerce operations common in today's web business. We also hold a U.S. patent, issued in November 1996, acquired as
part of the Interleaf acquisition on the elements of the extensible electronic document processing system for creating new classes of active documents. Although we hold these patents, they may not provide an adequate level of intellectual property protection. In addition, litigation may be necessary in the future to enforce our intellectual property rights, to protect our trade secrets, or to determine the validity and scope of the proprietary rights of others. It is also possible that third parties may claim
we have infringed their patent, trademark, copyright or other proprietary rights. Claims may be made for indemnification resulting from allegations of infringement. Intellectual property infringement claims may be asserted against us as a result of the use by third parties of our products. Claims or litigation, with or without merit, could result in substantial costs and diversions of resources, either of which could harm our business.
We also rely on copyright, trademark, service mark, trade secret laws and contractual restrictions to protect our proprietary rights in products and services. We have registered "BroadVision", "Interleaf" and "Interleaf Xtreme" as trademarks in the United States and in other countries. It is possible that our competitors or
other companies will adopt product names similar to these trademarks, impeding our ability to build brand identity and possibly confusing customers.
As a matter of our company policy, we enter into confidentiality and assignment agreements with our employees, consultants and vendors. We also control access to and distribution of our software, documents and other proprietary information. Notwithstanding these precautions, it may be possible for an unauthorized third party to copy or
otherwise obtain and use our software or other proprietary information or to develop similar software independently. Policing unauthorized use of our products will be difficult, particularly because the global nature of the Internet makes it difficult to control the ultimate destination or security of software and other transmitted data. The laws of other countries may afford us little or no effective protection of our intellectual property.
A breach of the encryption technology that we use could expose us to liability and harm our reputation, causing a loss of customers.
If any breach of the security technology embedded in our products or hosted Cloud operation were to occur, we would be exposed to liability and our reputation could be harmed, which could cause us to lose customers. A significant barrier to online commerce, portal, social networking and enterprise software the secure exchange of valuable
and confidential information over public networks. We rely on encryption and authentication technology, such as Open SSL, public key cryptography, encryption algorithms RC2 and MD5, digital certificates and HTTPS, to provide the security and authentication necessary to affect the secure exchange of confidential information. Advances in computer capabilities, new discoveries in the field of cryptography, new hacking methods, security holes in 3rd-party
components (such as operating system bugs) or other events or developments could cause a breach of the above measures that we use to protect customer data and identity.
The loss or malfunction of technology from third parties could delay the introduction of our products and services.
We rely in part on technology that we license from third parties or we obtain from open sources, including relational database management systems from Oracle, Microsoft and MySQL object request broker software from IONA Technologies PLC, J2EE from Sun Microsystems, JBoss application server from open source, and others. The loss or malfunction
of any third-party technology could harm our business. We integrate or sublicense third-party technology with internally developed software to perform key functions. For example, our products and services incorporate data encryption and authentication technology from Open SSL. Third-party technology might not continue to be available to us on commercially reasonable terms, or at all. Moreover, third-party technology may contain defects that we cannot control. Problems with third-party technology
could cause delays in introducing our products or services until equivalent technology, if available, is identified, licensed or obtained, and integrated. Delays in introducing our products and services could adversely affect our results of operations.
Our officers, key employees and highly skilled technical and managerial personnel are critical to our business, and they may not remain with us in the future.
Our performance substantially depends on the performance of our officers and key employees. We also rely on our ability to retain and motivate qualified personnel, especially our management and highly skilled development teams. The loss of the services of any of our officers or key employees, particularly our founder and Chief Executive
Officer, Dr. Pehong Chen, could cause us to incur increased operating expenses and divert senior management resources in searching for replacements. The loss of their services also could harm our reputation if our customers were to become concerned about our future operations. We do not carry "key person" life insurance policies on any of our employees. Our future success also depends on our continuing ability to identify, hire, train and retain other highly qualified technical and managerial personnel.
Competition for these personnel is intense, especially in the Internet industry. We have in the past experienced, and may continue to experience, difficulty in hiring and retaining sufficient numbers of highly skilled employees. The significant downturn in our business over the past several years has had and may continue to have a negative impact on our operations. We have restructured our operations by reducing our workforce and implementing other cost containment activities. These actions could lead to disruptions
in our business, reduced employee morale and productivity, increased attrition, and problems with retaining existing and recruiting future employees.
Limitations on the online collection of profile information could impair the effectiveness of our products.
Online users' resistance to providing personal data, and laws and regulations prohibiting use of personal data gathered online without express consent or requiring businesses to notify their web site visitors of the possible dissemination of their personal data, could limit the effectiveness of our products. This in turn could adversely
affect our sales and results of operations.
One of the principal features of our products is the ability to develop and maintain profiles of online users to assist business managers in determining the nature of the content to be provided to these online users. Typically, profile information is captured when consumers, business customers and employees visit a web site and volunteer
information in response to survey questions concerning their backgrounds, interests and preferences. Profiles can be augmented over time through the subsequent collection of usage data. Although our products are designed to enable the development of applications that permit web site visitors to prevent the distribution of any of their personal data beyond that specific web site, privacy concerns may nevertheless cause visitors to resist providing the personal data necessary to support this profiling capability.
The mere perception by prospective customers that substantial security and privacy concerns exist among online users, whether or not valid, may indirectly inhibit market acceptance of our products.
In addition, new laws and regulations could heighten privacy concerns by requiring businesses to notify web site users that the data captured from them while online may be used by marketing entities to direct product messages to them. We are subject to increasing regulation at the federal and state levels relating to online privacy and
the use of personal user information. Several states have proposed legislation that would limit the uses of personal user information gathered online or require online services to establish privacy policies. In addition, the U.S. Federal Trade Commission, or FTC, has urged Congress to adopt legislation regarding the collection and use of personal identifying information obtained from individuals when accessing web sites. The FTC has settled several proceedings resulting in consent decrees in which Internet
companies have been required to establish programs regarding the manner in which personal information is collected from users and provided to third parties. We could become a party to a similar enforcement proceeding. These regulatory and enforcement efforts could also harm our customers' ability to collect demographic and personal information from users, which could impair the effectiveness of our products.
We may not have adequate back-up systems, and natural or manmade disasters could damage our operations, reduce our revenue and lead to a loss of customers.
We do not have fully redundant systems for service at an alternate site. A disaster could severely harm our business because our service could be interrupted for an indeterminate length of time. Our operations depend upon our ability to maintain and protect our computer systems at our facility in Redwood City, California, which reside
on or near known earthquake fault zones. Although these systems are designed to be fault tolerant, they are vulnerable to damage from fire, floods, earthquakes, power loss, acts of terrorism, telecommunications failures and similar events. In addition, our facilities in California could be subject to electrical blackouts if California faces another power shortage similar to that of 2001. Although we do have a backup generator that would maintain critical operations, this generator could fail. We also have significantly
reduced our workforce in a short period of time, which has placed different requirements on our systems and has caused us to lose personnel knowledgeable about our systems, both of which could make it more difficult to quickly resolve system disruptions. Disruptions in our internal business operations could harm our business by resulting in delays, disruption of our customers' business, loss of data, and loss of customer confidence.
Risks related to BroadVision common stock
One stockholder beneficially owns a substantial portion of the outstanding BroadVision common stock, and as a result exerts substantial control over us.
As of December 31, 2009, Dr. Pehong Chen, our Chairman and CEO, beneficially owned approximately 1.6 million shares of our common stock, which represents approximately 37% of the outstanding common stock as of such date. As a result, Dr. Chen exerts substantial control over all matters coming to a vote of our stockholders, including with
respect to:
|
• |
the composition of our board of directors and, through it, any determination with respect to our business direction and policies, including the appointment and removal of officers; | |
|
• |
any determinations with respect to mergers and other business combinations; | |
|
• |
our acquisition or disposition of assets; | |
|
• |
our financing activities; and | |
|
• |
the payment of dividends on our capital stock. |
This control by Dr. Chen could depress the market price of our common stock or delay or prevent a change in control of BroadVision.
Our stock price has been highly volatile.
The trading price of BroadVision common stock has been highly volatile. For example, the trading price of BroadVision common stock has ranged from $9.00 per share to $48.8 per share between January 1, 2008 and December 31, 2009. On December 31, 2009 the closing price
of BroadVision common stock was $13.56 per share. Our stock price is subject to wide fluctuations in response to a variety of factors, including:
|
• |
quarterly variations in operating results; | |
|
• |
announcements of technological innovations; | |
|
• |
announcements of new software or services by us or our competitors; | |
|
• |
changes in financial estimates by securities analysts; | |
|
• |
low trading volume on the NASDAQ Global Market; | |
|
• |
general economic conditions; or | |
|
• |
other events or factors that are beyond our control. |
In addition, the stock market has experienced significant price and volume fluctuations that have particularly affected the trading prices of equity securities of many technology companies. These fluctuations have often been unrelated or
disproportionate to the operating performance of these companies. Any negative change in the public's perception of the prospects of Internet or electronic commerce companies could further depress our stock price regardless of our results. Other broad market fluctuations may decrease the trading price of BroadVision common stock. In the past, following declines in the market price of a company's securities, securities class action litigation, such as the class action lawsuits filed against us and certain of our
officers and directors in early 2001, has often been instituted against that company. Litigation could result in substantial costs and a diversion of management's attention and resources.
None.
As of December 31, 2009, we leased approximately 74,217 square feet of office space, of which approximately 71% was in the United States. We occupied or subleased 100% of our leased office space as of December 31, 2009.
In September 2006, we decided not to exercise a $4.5 million buy-out option for a 50,000 square foot lease for 66 months from January 1, 2007 through June 30, 2012 at Pacific Shores Center in Redwood City, California. Our worldwide headquarters at
Pacific Shores Center occupies approximately 27,000 square feet of office facilities used for research and development, technical support, sales, marketing, consulting, training and administration. We subleased the remaining approximately 22,500 square feet to our subtenant Dexterra Inc., effective on January 8, 2007. In May 2009, we received written notice from Dexterra Inc. exercising its right of early termination of the sublease and right to receive payment of a termination fee equal
to three months’ base rent, effective January 7, 2010. See Item 7. Management’s Discussion and Analysis of Financial Condition and Results of Operations – Restructuring for additional details regarding the early termination of the sublease.
Our additional leased domestic facilities include offices located in New York, NY and Waltham, MA, which are primarily used for sales, marketing and customer service activities. Leased facilities of significant size located outside of the United States and used primarily for sales, marketing, customer support and administrative functions
include facilities located in Paris, France; Reading, UK; Milan, Italy; Tokyo, Japan; Beijing, China; and Bangalore, India.
We believe our facilities are suitable for their respective uses and are adequate to support our current and anticipated volume of business. We believe that suitable additional space will be available to accommodate any necessary or currently anticipated expansion of our operations.
We are subject from time to time to various legal actions and other claims arising in the ordinary course of business. We are not presently a party to any material legal proceedings.
ITEM 4. RESERVED
Until our delisting on March 8, 2006, our common stock had been quoted on the NASDAQ National Market. From March 8, 2006 to May 24, 2007, our common stock was quoted on the Pink Sheets®. From May 25, 2007 to October 24, 2008, our common stock was trading on the OTC Bulletin Board. Effective as of the open of trading on October 27,
2008, we effected a one-for-twenty-five reverse split of our common stock. Effective as of November 10, 2008, we have transferred the quotation of our common stock from the OTC Bulletin Board to the NASDAQ Global Market under the trading symbol "BVSN". The following table shows high and low sale prices per share of our common stock as reported on the OTC Bulletin Board and the NASDAQ Global Market:
|
High |
Low |
|||||||
|
Fiscal Year 2009 |
||||||||
|
First Quarter |
$ |
14.50 |
$ |
9.91 |
||||
|
Second Quarter |
16.27 |
12.25 |
||||||
|
Third Quarter |
16.66 |
12.35 |
||||||
|
Fourth Quarter |
18.00 |
13.22 |
||||||
|
Fiscal Year 2008 |
||||||||
|
First Quarter |
48.75 |
24.25 |
||||||
|
Second Quarter |
32.00 |
23.25 |
||||||
|
Third Quarter |
25.00 |
12.75 |
||||||
|
Fourth Quarter |
19.00 |
9.00 |
||||||
As of February 28, 2010, there were 73 holders of record of BroadVision common stock. On March 4, 2010, the last sale price reported on the NASDAQ Global Market for BroadVision common stock was $13.30 per share.
We have never declared or paid cash dividends on our common stock, and currently do not plan to pay any cash dividends in the foreseeable future.
PERFORMANCE MEASUREMENT COMPARISON*
The following graph shows the total stockholder return of an investment of $100 in cash on December 31, 2004 for (a) our Common Stock, (b) the NASDAQ Stock Market (U.S.) Index (the "NASDAQ Index") and (c) the RDG Internet 100 Index. All values assume reinvestment of the full amount of all dividends and are calculated as of December 31
of each year:
COMPARISON OF 5 YEAR CUMULATIVE TOTAL RETURN*
AMONG BROADVISION, INC., THE NASDAQ STOCK MARKET (U.S.) INDEX
AND THE RDG INTERNET COMPOSITE INDEX
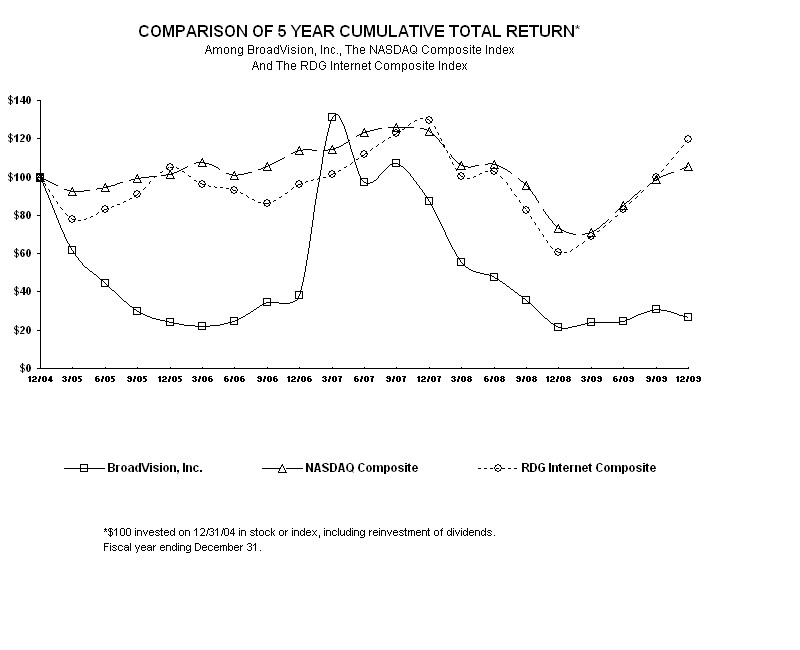
Unregistered Sales of Equity Securities
None.
Issuer Purchases of Equity Securities
None.
The information below is derived from our Consolidated Financial Statements and should be read in conjunction with "Management's Discussion and Analysis of Financial Conditions and Results of Operations", our Consolidated Financial Statements and the Notes thereto, and other financial information included elsewhere in this Form 10-K.
Historical results are not necessarily indicative of results that may be expected for future periods.
|
Years Ended December 31, |
||||||||||||||||||||
|
2009 |
2008 |
2007 |
2006 |
2005 |
||||||||||||||||
|
(In thousands, except per share amount) |
||||||||||||||||||||
|
Consolidated Statement of Operations Data: |
||||||||||||||||||||
|
Revenues: |
||||||||||||||||||||
|
Software licenses |
$ |
11,154 |
$ |
12,137 |
$ |
21,127 |
$ |
15,215 |
$ |
14,721 |
||||||||||
|
Services |
19,807 |
23,766 |
28,891 |
36,769 |
45,400 |
|||||||||||||||
|
Total revenues |
30,961 |
35,903 |
50,018 |
51,984 |
60,121 |
|||||||||||||||
|
Cost of revenues: |
||||||||||||||||||||
|
Cost of (credit for) software licenses |
32 |
26 |
45 |
258 |
(38 |
) | ||||||||||||||
|
Cost of services |
7,531 |
8,885 |
8,961 |
12,456 |
21,931 |
|||||||||||||||
|
Total cost of revenues |
7,563 |
8,911 |
9,006 |
12,714 |
21,893 |
|||||||||||||||
|
Gross profit |
23,398 |
26,992 |
41,012 |
39,270 |
38,228 |
|||||||||||||||
|
Operating expenses: |
||||||||||||||||||||
|
Research and development |
8,573 |
9,183 |
9,668 |
10,510 |
13,831 |
|||||||||||||||
|
Sales and marketing |
7,932 |
7,772 |
8,131 |
8,653 |
16,208 |
|||||||||||||||
|
General and administrative |
4,509 |
6,412 |
6,293 |
8,019 |
9,479 |
|||||||||||||||
|
Goodwill impairment |
- |
25,066 |
- |
- |
31,368 |
|||||||||||||||
|
Restructuring charges (credits) |
71 |
(26 |
) |
649 |
(3,369 |
) |
(462 |
) | ||||||||||||
|
Business combination charges |
- |
- |
- |
- |
2,817 |
|||||||||||||||
|
Total operating expenses |
21,085 |
48,407 |
24,741 |
23,813 |
73,241 |
|||||||||||||||
|
Operating income (loss) |
2,313 |
(21,415 |
) |
16,271 |
15,457 |
(35,013 |
) | |||||||||||||
|
Other income (expense), net |
1,394 |
6,925 |
934 |
193 |
(6,564 |
) | ||||||||||||||
|
Income (Loss) before income taxes |
3,707 |
(14,490 |
) |
17,205 |
15,650 |
(41,577 |
) | |||||||||||||
|
Income tax benefit (expense) |
27 |
(520 |
) |
73 |
(634 |
) |
2,611 |
|||||||||||||
|
Net income (loss) |
$ |
3,734 |
$ |
(15,010 |
) |
$ |
17,278 |
$ |
15,016 |
$ |
(38,966 |
) | ||||||||
|
Net income (loss) per share: |
||||||||||||||||||||
|
Basic earnings (loss) per share |
$ |
0.85 |
$ |
(3.43 |
) |
$ |
4.01 |
$ |
5.71 |
$ |
(28.46 |
) | ||||||||
|
Shares used in computation -- basic earnings (loss) per share |
4,406 |
4,374 |
4,310 |
2,629 |
1,369 |
|||||||||||||||
|
Diluted earnings (loss) per share |
$ |
0.85 |
$ |
(3.43 |
) |
$ |
3.90 |
$ |
5.71 |
$ |
(28.46 |
) | ||||||||
|
Shares used in computation -- diluted earnings (loss) per share |
4,407 |
4,374 |
4,430 |
2,629 |
1,369 |
|||||||||||||||
|
December 31, |
||||||||||||||||||||
|
2009 |
2008 |
2007 |
2006 |
2005 |
||||||||||||||||
|
(In thousands) |
||||||||||||||||||||
|
Consolidated Balance Sheet Data: |
||||||||||||||||||||
|
Cash and cash equivalents |
$ |
21,580 |
$ |
52,884 |
$ |
53,973 |
$ |
37,003 |
$ |
4,849 |
||||||||||
|
Working capital (deficit) |
55,977 |
51,070 |
40,494 |
18,955 |
(35,872 |
) | ||||||||||||||
|
Total assets |
72,867 |
74,737 |
90,312 |
76,942 |
49,942 |
|||||||||||||||
|
Accumulated deficit |
(1,203,669 |
) |
(1,207,403 |
) |
(1,192,393 |
) |
(1,210,059 |
) |
(1,225,075 |
) | ||||||||||
|
Total stockholders' equity (deficit) |
55,593 |
50,718 |
64,765 |
43,254 |
(9,723 |
) | ||||||||||||||
You should read this discussion and analysis in conjunction with our Consolidated Financial Statements and the related Notes appearing elsewhere in this report. In addition to the historical consolidated information, the following discussion contains forward-looking statements within the meaning of Section 27A
of the Securities Act of 1933, as amended, and within the meaning of Section 21E of the Securities Exchange Act of 1934, as amended, which are subject to the "safe harbor" created by those sections. These forward-looking statements are generally identified by words such as "expect", "anticipate", "intend", "believe", "hope", "assume", "estimate", "plan", "will" and other similar words and expressions. These forward-looking statements involve risks and uncertainties that could cause our actual results to
differ materially from those expressed or implied in the forward-looking statements as a result of certain factors. Factors that could cause or contribute to differences include those discussed below and elsewhere in this Form 10-K, particularly in Item 1A, "Risk Factors." We undertake no obligation to publicly release any revisions to the forward-looking statements or to reflect events and circumstances after the date of this document.
Overview
Since 1993, BroadVision has been a pioneer and consistent innovator of e-business solutions. We deliver a combination of technologies and services into the global market that enable customers of all sizes to power mission-critical web initiatives that ultimately deliver
high-value to their bottom line. Our offering consists of a robust framework for personalization and self-service, modular applications and agile toolsets that customers use to create e-commerce, portal solutions, and Enterprise Social Networks. As of December 31, 2009, we had licensed our products to more than 500 companies - including Audible.com, Baker Hughes, BioRad Laboratories, BNP Paribas, Canon, EFG Bank, Epson America, Fiat, Hilti, Indian Railway Catering and Tourism Company, ING Bank, LaPoste, Mettler
Toledo, Office of Controller General of Defence Accounts Government of India, Oreck Corporation, PETCO, Prime Polymer, Standard Bank of Argentina, Sony Computer Entertainment Inc., Thomas Cook (India) Ltd., U.S. Air Force, Vodafone, W.W. Grainger and Xerox.
Our objective is to further our position as a global supplier of web-based, self-service applications. This will require us to continue to build new functionality into our applications that offer our customers a compelling value proposition to license our products rather than design and build custom solutions.
We generate revenue from fees for licenses of our software products, and related maintenance, consulting services and customer training. We generally charge fees for licenses of our software products either based on the number of persons registered to use the product or based on the number of CPUs utilized by the machine on which the product
is installed. Payment terms are generally 30 days from the date the products are delivered, the maintenance contract is booked or the consulting services are provided.
From 2001 to 2005, we incurred significant losses and negative cash flows from operations. In fiscal years 2004 and 2005, we incurred significant cash usage related to the termination of excess real estate obligations, certain reductions in workforce and the execution and subsequent termination of an acquisition agreement. Although we
generated net income in year 2006 and 2007 and net loss in year 2008 due to goodwill impairment, our ability to generate profits or positive cash flows in future periods remains uncertain.
We strive to anticipate changes in the demand for our services and aggressively manage our labor force appropriately. As part of our budgeting process, cross-functional management participates in the planning, reviewing and managing of our business plans. This process is intended to allow us to adjust our cost structures to changing market
needs, competitive landscapes and economic factors. Our emphasis on cost control helps us manage our margins even if revenues generated fall short of our expectations.
Our operations in 2009 faced two challenges: severe worldwide recession and continued consolidation of the enterprise software industry. Consequently, revenues from our existing products declined over 2009. We managed these challenges by: rigorously controlling costs to operate profitably despite lower revenues; diligently
caring for and serving our installed base to improve customer loyalty; and heavily investing in new products, most notably the cloud-based Clearvale Enterprise Social Network.
In February 2006, we announced a subscription rights offering to existing stockholders. The primary purpose of the rights offering was to allow the holders of BroadVision common stock on the record date an opportunity to further invest in BroadVision in order to maintain their proportionate interest in BroadVision common stock, at the
same price per share as the per share price afforded to our Chief Executive Officer, founder and largest stockholder, Dr. Pehong Chen, in connection with a transaction in which we issued shares to Dr. Chen in exchange for the cancellation of notes he held. The rights offering expired on November 28, 2006. Eligible participants exercised rights to purchase 1.5 million shares, resulting in $15.8 million in net proceeds. We deregistered the shares not sold in the rights offering and subject to the registration statement
we filed in connection with the rights offering. Then we reduced our total number of authorized shares of common stock from 80,000,000 to 11,200,000 in February 2007. Dr. Chen's ownership was approximately 39% as a result of closing the rights offering in the fourth quarter of 2006. As of December 31, 2009, Dr. Chen's ownership was approximately 37%.
In order to complete the issuance of shares to Dr. Chen without violating NASDAQ applicable listing standards, we delivered to NASDAQ a notification of voluntary delisting of BroadVision common stock from the NASDAQ National Market effective prior to the opening of trading on March 8, 2006. Effective as of the opening of trading on October
27, 2008, we effected a one-for-twenty-five reverse split of our common stock. As of November 10, 2008, we transferred the quotation of our common stock from the OTC Bulletin Board to the NASDAQ Global Market under the trading symbol "BVSN".
In June 2006, William Meyer resigned as our Chief Financial Officer, a position Mr. Meyer had held since April 2003. Dr. Chen has served as Chief Financial Officer on an interim basis until January 2008 when Dr. Shin-Yuan Tzou was appointed to this position.
In late 2007, we broadened our business model with the introduction of our first product that is offered to customers through a licensing model known as software as a service, or SaaS. SaaS, which has gained popularity in recent years, is a different way of commercializing computer software than the enterprise license model that we and
most other software vendors have traditionally used. In the SaaS model, instead of licensing software to customers for use on their computers, the software is operated, or hosted, on the vendor's own computers, and customers are allowed to access and utilize the software remotely in return for the payment of one-time or recurring subscription fees.
On November 14, 2008, BroadVision (Delaware) LLC, a Delaware limited liability company ("BVD"), which was then our wholly owned subsidiary, entered into a Share Purchase Agreement with CHRM LLC, a Delaware limited liability company, and we and CHRM LLC then entered into an Amended and Restated Operating Agreement of BroadVision (Delaware)
LLC dated as of November 14, 2008 (the "BVD Operating Agreement"). Under these agreements, CHRM LLC received, in exchange for the assignment of certain intellectual property rights, 20 Class B Shares of BVD, representing the right to receive 20% of any "net profit" from a "capital transaction" (as such terms are defined in the BVD Operating Agreement) of BroadVision (Barbados) Limited ("BVB"). A "capital transaction" under that agreement is any merger or sale of substantially all of the assets of BVB as a result
of which the members of BVB will no longer have an interest in BVB or the assets of BVB will be distributed to its members.
Change in Filer Status
Commencing with this annual report on Form 10-K, we are no longer deemed to be an "accelerated filer" (as defined in Rule 12b-2 of the Securities Exchange Act of 1934, as amended) because our public float was below the required
threshold as of the last business day of our second fiscal quarter of 2009. As a result of becoming a non-accelerated filer, we are not required to provide an attestation report of our registered public accounting firm regarding our internal control over financial reporting. We have elected to not include such an attestation report in this annual report, which election was approved by the Audit Committee of our Board of Directors.
Critical Accounting Policies, Judgments and Estimates
This management's discussion and analysis of our financial conditions and results of operations is based upon our Consolidated Financial Statements, which have been prepared in accordance with U.S. GAAP. In preparing these financial statements, we are required to make estimates and judgments that affect the reported amounts of assets,
liabilities, revenues and expenses, and related disclosures of contingent assets and liabilities. On an ongoing basis, we evaluate our estimates, including those related to receivable reserves, stock-based compensation, investments, impairment assessments, income taxes and restructuring, as well as contingencies and litigation. We base our estimates on historical experience and on various other assumptions that we believe are reasonable, the results of which form the basis for making judgments about the carrying
values of assets and liabilities that are not readily apparent from other sources. Actual results may differ from these estimates using different assumptions or conditions. We believe the following critical accounting policies reflect the more significant judgments and estimates used in the preparation of our Consolidated Financial Statements.
Revenue Recognition
Overview
Our revenue consists of fees for licenses of our software products, maintenance, consulting services and customer training. We generally charge fees for licenses of our software products either based on the number of persons using the product or based on the number of CPUs on which the product is installed. Licenses for software for
which fees are charged based upon the number of persons using the product include licenses for development use and licenses for use by registered users of the customer's website (deployment use). Licenses for software for which fees are charged on a per-CPU basis differentiate between development and deployment usage. Our revenue recognition policies comply with ASC 985-605, Software: Revenue Recognition ("ASC 985-605"), and Staff Accounting Bulletin ("SAB")
104, Revenue Recognition ("SAB 104"). We apply the separation criteria in ASC 605-25, Revenue Recognition: Multiple-Element Arrangements ("ASC 605-25"), to determine whether our arrangements with multiple deliverables should be treated as separate units of accounting. ASC 605-25 indicates
that revenue recognized for any multiple-element contract is to be allocated to each element of the arrangement based on the relative fair value of each element. The determination of the fair value of each element is based on our analysis of objective evidence from comparable sales of the individual element.
Revenues for consulting services are generally recognized as the services are performed. If there is a significant uncertainty about the project completion or receipt of payment for the consulting services, revenue is deferred until the uncertainty is sufficiently resolved. For the "fixed" or "not to exceed" fees contracts, revenues are
recognized based on ASC 605-35, Revenue Recognition: Construction-Type and Production-Type Contracts ("ASC 605-35"). We estimate the proportional performance on contracts on a basis of utilizing hours incurred to date as a percentage of total estimated hours to complete the project.
Software License Revenue
We license our products through our direct sales force and indirectly through resellers and Application Service Providers ("ASP"). In general, software license revenues are recognized when a non-cancelable license agreement has been signed and the customer acknowledges an unconditional obligation to pay, the software product has been delivered,
there are no uncertainties surrounding product acceptance, the fees are fixed and determinable and collection is reasonably assured. Delivery is considered to have occurred when title and risk of loss have been transferred to the customer, which generally occurs when media containing the licensed programs is provided to a common carrier. In case of electronic delivery, delivery occurs when the customer is given access to the licensed programs. For products that cannot be used without a licensing key, the delivery
requirement is met when the licensing key is made available to the customer. If collectability is not reasonably assured, revenue is recognized when the fee is collected. Subscription-based license revenues are recognized ratably over the subscription period. We enter into reseller arrangements that typically provide for sublicense fees payable to us based upon a percentage of list prices. We do not grant resellers the right of return.
We recognize revenue using the residual method pursuant to the requirements of ASC 985-605. Revenues recognized from multiple-element software arrangements are allocated to each element of the arrangement based on the fair values of the elements, such as licenses for software products, maintenance, consulting services or customer training.
The determination of fair value is based on vendor-specific objective evidence, which is specific to us. We limit our assessment of objective evidence for each element to either the price charged when the same element is sold separately or the price established by management having the relevant authority to do so, for an element not yet sold separately. If evidence of fair value of all undelivered elements exists but evidence does not exist for one or more delivered elements, then revenue is recognized using
the residual method. Under the residual method, the fair value of the undelivered elements is deferred and the remaining portion of the arrangement fee is recognized as revenue. We have not yet adopted Accounting Standards Update ("ASU") 2009-13 (an update to ASC 605-25), Revenue Recognition: Multiple-Element Arrangements ("ASU 2009-13"), and do not expect the adoption to have a material impact on our Consolidated Financial Statements.
We record unearned revenue for software license agreements when cash has been received from the customer and the agreement does not qualify for revenue recognition under our revenue recognition policy. We record accounts receivable for software license agreements when the agreement qualifies for revenue recognition but cash or other consideration
has not been received from the customer.
Services Revenue
Consulting services revenues and customer training revenues are recognized as such services are performed.
Maintenance revenues, which include revenues bundled with software license agreements that entitle the customers to technical support and future unspecified enhancements to our products, are deferred and recognized ratably over the related agreement period, generally twelve months.
Our consulting services, which consist of consulting, maintenance and training, are delivered through the BroadVision Global Services ("BVGS") organization. In January 2008, we renamed BVGS to Worldwide E-Business Solution Organization ("WebSo"). In order to support our customers’ expanded needs relating to recently launched
products, WebSo involves more internal departments than did the BVGS organization. The services that we provide are not essential to the functionality of the software. We record reimbursement from our customers for out-of-pocket expenses as an increase to services revenues.
Receivable Reserves
Occasionally, our customers experience financial difficulty after we record the sale but before payment has been received. We maintain receivable reserves for estimated losses resulting from the inability of our customers to make required payments. Our normal
payment terms are generally 30 to 90 days from the invoice date. If the financial condition of our customers were to deteriorate, resulting in their inability to make the contractual payments, additional reserves may be required. Losses from customer receivables in the three-year period ended December 31, 2009, have not been significant. If all efforts to collect a receivable fail, and the receivable is considered uncollectible, we would write off against the receivable reserve.
Research and Development and Software Development Costs
ASC 985-20, Costs of Software to be Sold, Leased, or Marketed ("ASC 985-20"), requires capitalization of certain software development costs subsequent to the establishment of technological feasibility. Based on our product development process, technological feasibility is established
upon the completion of a working model. To date, costs incurred by us between the completion of the working model and the point at which the product is ready for general release have been insignificant. Accordingly, we have charged all such costs to research and development expense in the period incurred.
Impairment Assessments
As of December 31, 2007, we performed a goodwill impairment analysis and no impairment was deemed necessary at December 31, 2007.
In the year ended December 31, 2008, we recognized a goodwill impairment charge of $25.1 million, which represented a full write-off of our remaining goodwill balance in accordance with the requirements of ASC 350-20, Goodwill ("ASC 350-20"). As of
December 31, 2008, we performed Step 1 under the provisions of ASC 350-20 by determining that we have a single reporting unit and then comparing our net book value to our market capitalization based upon the quoted market price of our stock. Based upon the results of Step 1, which showed impairment indicators of our goodwill balance, we completed Step 2 and recognized an impairment charge of $25.1 million in the quarter ended December 31, 2008. We had no goodwill or identifiable intangible
assets as of December 31, 2009.
Income Taxes and Deferred Tax Assets
Income taxes are computed using an asset and liability approach in accordance with ASC 740-10, Income Taxes ("ASC 740-10"), which requires the recognition of taxes payable or refundable for the current year and deferred tax assets and liabilities for the future tax consequences of
events that have been recognized in our Consolidated Financial Statements or tax returns. The measurement of current and deferred tax assets and liabilities is based on provisions of the enacted tax law; the effects of future changes in tax laws or rates are not anticipated. The measurement of deferred tax assets is reduced, if necessary, by the amount of any tax benefits that, based on available evidence, is not expected to be realized.
We analyze our deferred tax assets with regard to potential realization. We have established a valuation allowance on our deferred tax assets to the extent that management has determined that it is more likely than not that some portion or all of the deferred tax asset will not be realized based upon the uncertainty of their realization.
We consider the effects of estimated future taxable income, current economic conditions and ongoing prudent and feasible tax planning strategies in assessing the amount of the valuation allowance.
Stock-Based Compensation
Effective January 1, 2006, we adopted ASC 718-10, Compensation – Stock Compensation ("ASC 718-10"), using the modified-prospective transition method. Under ASC 718-10, share-based compensation cost is estimated
at the grant date based on the fair value of the award and is recognized as expense, net of estimated pre-vesting forfeitures, ratably over the vesting period of the award.
We adopted the alternative transition method provided in ASC 718-10 for calculating the tax effects of stock-based compensation pursuant to ASC 718-10 in the fourth quarter of fiscal 2006. The alternative transition method includes simplified methods to establish the beginning balance of the additional paid-in capital pool ("APIC
pool") related to the tax effects of employee stock-based compensation, and to determine the subsequent impact on the APIC pool and Consolidated Statements of Cash Flows of the tax effects of employee stock-based compensation awards that are outstanding upon adoption of ASC 718-10. The adoption did not have a material impact on our results of operations and financial condition.
We did not recognize any significant share-based employee compensation costs in our statements of operations prior to January 1, 2006, as options granted to employees and non-employee members of the board of directors generally had an exercise price equal to the fair value of the underlying common stock on the date of grant. Prior
to the adoption of ASC 718-10, we provided pro forma disclosure of net income (loss) applicable to common stockholders as if the fair-value-based method had been applied. In the pro forma information for periods prior to 2006, we accounted for pre-vesting forfeitures as they occurred. Our operating results for prior periods have not been restated.
For our one-for-twenty-five reverse stock split event effective on October 24, 2008, we were not required to recognize any incremental compensation cost for this equity restructuring. Based on ASC 718-10, if an award is adjusted based on an existing antidilution provision that requires adjustment in the event of an equity restructuring,
and is properly structured to preserve the value of the awards upon completion of the equity restructuring, incremental fair value generally should not result from the modification. Our equity restructuring did not result in any additional compensation expense related to our equity awards.
Further details related to our Stock Benefit Plans and our adoption of ASC 718-10 are provided in Note 9 – Stockholders' Equity in the Notes to our Consolidated Financial Statements.
Restructuring
Through December 31, 2009, we have approved restructuring plans to, among other things, reduce our workforce and consolidate facilities. Restructuring and asset impairment charges were taken to align our cost structure with changing market conditions and to create a more efficient organization. Our restructuring charges are comprised primarily
of: (i) severance and benefits termination costs related to the reduction of our workforce; (ii) lease termination costs and/or costs associated with permanently vacating our facilities; (iii) other incremental costs incurred as a direct result of the restructuring plan; and (iv) impairment costs related to certain long-lived assets abandoned. We account for each of these costs in accordance with SAB No. 100, Restructuring and Impairment Charges ("SAB
100").
Excess Facilities Costs. We account for excess facilities costs as follows:
|
l For exit or disposal activities initiated on or prior to December 31, 2002, we account for lease termination and/or abandonment costs in accordance ASC 420-10 Exit or Disposal Cost Obligations ("ASC 420-10").
Accordingly, we recorded the costs associated with lease termination and/or abandonment when the leased property had no substantive future use or benefit to us. |
|
l For exit or disposal activities initiated after December 31, 2002, we account for lease termination and/or abandonment costs in accordance with ASC 420-10, which requires that a liability for such costs be recognized and measured initially at fair value on the cease
use date of the facility. |
Severance and termination costs and excess facilities costs we record under these provisions are not associated with nor do they benefit continuing activities.
Inherent in the estimation of the costs related to our restructuring efforts are assessments related to the most likely expected outcome of the significant actions to accomplish the restructuring. In determining the charges related to the restructurings to date, the majority of estimates made by management have related to charges for excess
facilities. In determining the charges for excess facilities, we were required to estimate future sublease income, future net operating expenses of the facilities, and brokerage commissions, among other expenses. The most significant of these estimates have related to the timing and extent of future sublease income in which to reduce our lease obligations. We based our estimates of sublease income, in part, on the opinions of independent real estate experts, current market conditions and rental rates, an assessment
of the time period over which reasonable estimates could be made, the status of negotiations with potential subtenants, and the location of the respective facility, among other factors. We have recorded the low-end of a range of assumptions modeled for restructuring charges. Adjustments to the facilities accrual will be required if actual lease exit costs or sublease income differ from amounts currently expected. We will review the status of restructuring activities on a quarterly basis and, if appropriate,
record changes to our restructuring obligations in current operations based on management's most current estimates.
During 2007, one of our leases located in Redwood City, California expired. We incurred an asset retirement obligation of $40,000 before returning the property back to the landlord. We also reversed $347,000 in severance accruals
due to the expiration of the statute of limitations related to these accruals, which was recorded as a reduction of operating expenses in 2007 in our Consolidated Statements of Operations.
During 2008, there were no restructuring charges related to severance and benefits termination costs. We recognized restructuring credits in the amount of $26,000 due to sublease income in excess of rent expense we incurred during the year 2008.
During 2009, we signed a Sublease Termination and Release Agreement (the "Sublease Termination Agreement") with our subtenant Dexterra Inc. Under the terms of the Sublease Termination Agreement, Dexterra Inc. was to (i)
surrender the premises, on an as-is basis, and all of its rights and interest in the premises, (ii) pay a termination fee to us and (iii) be entitled to a partial refund of the termination fee if any party subleases the office space during the period from June 10, 2009 through January 7, 2010. In addition to the termination fee, we retained Dexterra Inc.'s security deposit of $128,000. The termination fee of $678,000 (less the retained security deposit of $128,000) is payable in two installments. Dexterra Inc.
paid the first installment of $472,000 to us on June 10, 2009, and shall pay the second installment of $78,000 on June 10, 2010, subject to certain conditions set forth in the Sublease Termination Agreement. The second installment of the termination fee is being amortized into restructuring charges over the remaining term of the lease, which will expire on June 30, 2012. Because of the early termination of our sublease agreement, we recalculated our restructuring liability in accordance with ASC 420-10. As
a result, we recognized restructuring charges of $71,000 as operating expenses in our Consolidated Statements of Operations. As of March 5, 2010, the 22,500 square feet of formerly subleased space remains vacant. We are making the lease payments and paying operating expenses, and actively seeking to sublease the space.
Statements of Operations as a Percent of Total Revenues
The following table sets forth certain items reflected in our Consolidated Statements of Operations expressed as a percent of total revenues for the periods indicated.
|
Year Ended December 31, |
||||||||||||
|
2009 |
2008 |
2007 |
||||||||||
|
Revenues: |
||||||||||||
|
Software licenses |
36 |
% |
34 |
% |
42 |
% | ||||||
|
Services |
64 |
66 |
58 |
|||||||||
|
Total revenues |
100 |
100 |
100 |
|||||||||
|
Cost of revenues: |
||||||||||||
|
Cost of software licenses |
- |
- |
- |
|||||||||
|
Cost of services |
24 |
25 |
18 |
|||||||||
|
Total cost of revenues |
24 |
25 |
18 |
|||||||||
|
Gross profit |
76 |
75 |
82 |
|||||||||
|
Operating expenses: |
||||||||||||
|
Research and development |
28 |
26 |
19 |
|||||||||
|
Sales and marketing |
26 |
22 |
16 |
|||||||||
|
General and administrative |
15 |
18 |
13 |
|||||||||
|
Goodwill impairment |
- |
70 |
- |
|||||||||
|
Restructuring charges (credits) |
- |
- |
1 |
|||||||||
|
Total operating expenses |
69 |
136 |
49 |
|||||||||
|
Operating income (loss) |
7 |
(61 |
) |
33 |
||||||||
|
Other income |
5 |
20 |
2 |
|||||||||
|
Income (Loss) before income taxes |
12 |
(41 |
) |
35 |
||||||||
|
Income taxes benefit (expense) |
- |
(1 |
) |
- |
||||||||
|
Net income (loss) |
12 |
% |
(42) |
% |
35 |
% | ||||||
Results of Operations
|
Software Licenses |
% |
Services |
% |
Total |
% |
|||||||||||||||||||
|
(In thousands) |
||||||||||||||||||||||||
|
Year Ended December 31, 2009: |
||||||||||||||||||||||||
|
Americas |
$ |
8,143 |
73 |
$ |
8,884 |
45 |
$ |
17,027 |
55 |
|||||||||||||||
|
Europe |
2,562 |
23 |
7,968 |
40 |
10,530 |
34 |
||||||||||||||||||
|
Asia/ Pacific |
449 |
4 |
2,955 |
15 |
3,404 |
11 |
||||||||||||||||||
|
Total |
$ |
11,154 |
100 |
% |
$ |
19,807 |
100 |
% |
$ |
30,961 |
100 |
% | ||||||||||||
|
Year Ended December 31, 2008: |
||||||||||||||||||||||||
|
Americas |
$ |
6,739 |
56 |
$ |
10,154 |
43 |
$ |
16,893 |
47 |
|||||||||||||||
|
Europe |
3,432 |
28 |
10,068 |
42 |
13,500 |
38 |
||||||||||||||||||
|
Asia/ Pacific |
1,966 |
16 |
3,544 |
15 |
5,510 |
15 |
||||||||||||||||||
|
Total |
$ |
12,137 |
100 |
% |
$ |
23,766 |
100 |
% |
$ |
35,903 |
100 |
% | ||||||||||||
|
Year Ended December 31, 2007: |
||||||||||||||||||||||||
|
Americas |
$ |
13,824 |
65 |
$ |
17,890 |
62 |
$ |
31,714 |
64 |
|||||||||||||||
|
Europe |
5,293 |
25 |
6,799 |
24 |
12,092 |
24 |
||||||||||||||||||
|
Asia/ Pacific |
2,010 |
10 |
4,202 |
14 |
6,212 |
12 |
||||||||||||||||||
|
Total |
$ |
21,127 |
100 |
% |
$ |
28,891 |
100 |
% |
$ |
50,018 |
100 |
% | ||||||||||||
Revenues
Total revenues for the year ended December 31, 2009 were $31.0 million, down $4.9 million, or 14%, from $35.9 million for the prior year. License revenue from the sales of software licenses decreased from $12.1 million to $11.1 million. Maintenance revenue, which is generally derived from maintenance contracts sold with initial customer
licenses and from subsequent contract renewals, declined from $17.7 million to $14.9 million due to certain customers choosing to not fully renew maintenance contracts, together with the overall decline in new license revenue. Consulting revenue, which is generally related to services in connection with our licensed software, declined from $6.0 million to $5.0 million. This decrease in consulting revenue was attributable to a decline in demand for new licenses from our customers.
Total revenues for the year ended December 31, 2008 were $35.9 million, down $14.1 million, or 28%, from $50.0 million for the prior year. License revenue from the sales of software licenses decreased from $21.1 million to $12.1 million. The decreases came from all regions due to less demand for our products and to weak macro economic
conditions. Maintenance revenue, which is generally derived from maintenance contracts sold with initial customer licenses and from subsequent contract renewals, declined from $22.7 million to $17.7 million due to certain customers choosing to not fully renew maintenance contracts, together with the decline in new license revenue. Consulting revenue, which is generally related to services in connection with our licensed software, declined from $6.2 million to $6.0 million. This decrease in consulting
revenue was attributable to a decline in demand for new licenses from our customers.
Cost of Revenues
Cost of software licenses includes the net costs of product media, duplication, packaging, and other manufacturing costs as well as royalties payable to third parties for software that is either embedded in, or bundled and sold with, our products.
Cost of services consists primarily of employee-related costs, third-party consultant fees incurred on consulting projects, post-contract customer support and instructional training services.
|
Years Ended December 31, |
||||||||||||||||||||||||
|
2009 |
% |
2008 |
% |
2007 |
% |
|||||||||||||||||||
|
(Dollars in thousands) |
||||||||||||||||||||||||
|
Cost of software licenses (1) |
$ |
32 |
- |
% |
$ |
26 |
- |
% |
$ |
45 |
- |
% | ||||||||||||
|
Cost of services (2) |
7,531 |
38 |
8,885 |
37 |
8,961 |
31 |
||||||||||||||||||
|
Total cost of revenues (3) |
$ |
7,563 |
24 |
% |
$ |
8,911 |
25 |
% |
$ |
9,006 |
18 |
% | ||||||||||||
(1) Percentage is calculated based on total software license revenues for the period indicated.
(2) Percentage is calculated based on total services revenues for the period indicated.
(3) Percentage is calculated based on total revenues for the period indicated.
Cost of software licenses for the year ended December 31, 2009, increased $6,000 or 23%, on a year-over-year basis.
Cost of software licenses for the year ended December 31, 2008, decreased $19,000 or 42%, on a year-over-year basis. This decrease is primarily a result of sending products via electronic download instead of physical shipments.
Cost of services for the year ended December 31, 2009 decreased $1,354,000, or 15%, on a year-over-year basis. This decrease was the result of decreased services revenue.
Cost of services for the year ended December 31, 2008 decreased $76,000, or 1%, on a year-over-year basis. This decrease was the result of decreased services revenue.
The number of total consulting employees was 15 as of December 31, 2009, 35 as of December 31, 2008 and 25 as of December 31, 2007.
Operating Expenses
Operating expenses consist of the following:
|
lResearch and development expenses consist primarily of salaries, employee-related benefit costs and consulting fees incurred in association with the development of our products. Costs incurred for the research and development
of new software products are expensed as incurred until such time that technological feasibility, in the form of a working model, is established at which time such costs are capitalized and recorded at the lower of unamortized cost or net realizable value. The costs incurred subsequent to the establishment of a working model but prior to general release of the product have not been significant. To date, we have not capitalized any costs related to the development of software for external use. |
|
lSales and marketing expenses consist primarily of salaries, employee-related benefit costs, commissions and other incentive compensation, travel and entertainment and marketing program-related expenditures such as collateral
materials, trade shows, public relations, advertising and creative services. |
|
lGeneral and administrative expenses consist primarily of salaries, employee-related benefit costs, provisions and credits related to uncollectible accounts receivable and professional service fees. |
|
lGoodwill impairment represents costs to write-off goodwill. |
|
lRestructuring (credits) charges represent costs incurred to restructure our operations. These charges, including charges for excess facilities, severance and certain non-cash items, were recorded under the provisions
of ASC 420-10. |
A summary of operating expenses is set forth in the following table (dollars in thousands, percentages are based on total revenues):
|
Years Ended December 31, |
||||||||||||||||||||||||
|
2009 |
% |
2008 |
% |
2007 |
% |
|||||||||||||||||||
|
Research and development |
$ |
8,573 |
28 |
% |
$ |
9,183 |
26 |
% |
$ |
9,668 |
19 |
% | ||||||||||||
|
Sales and marketing |
7,932 |
26 |
7,772 |
22 |
8,131 |
16 |
||||||||||||||||||
|
General and administrative |
4,509 |
15 |
6,412 |
18 |
6,293 |
13 |
||||||||||||||||||
|
Goodwill impairment |
- |
- |
25,066 |
70 |
- |
- |
||||||||||||||||||
|
Restructuring charges (credits) |
71 |
- |
(26 |
) |
- |
649 |
1 |
|||||||||||||||||
|
Total operating expenses |
$ |
21,085 |
69 |
% |
$ |
48,407 |
136 |
% |
$ |
24,741 |
49 |
% | ||||||||||||
Research and development. Research and development expenses decreased $0.6 million, or 7% in 2009 compared to 2008 and decreased $0.5 million, or 5% in 2008 compared to 2007. The decrease from 2008 to 2009 was primarily attributable to a reduction of
contractor expenses. The decrease from 2007 to 2008 was primarily attributable to different reductions in a number of areas, including a reduction in bonus payments, computer supplies and depreciation expenses in computers and software.
Sales and marketing. Sales and marketing expenses increased $0.2 million, or 2% in 2009 compared to 2008 and decreased $0.4 million, or 4% in 2008 compared to 2007. The increase from 2008 to 2009 was primarily due to additional expenses on sales and marketing
campaigns in 2009. The decrease from 2007 to 2008 was primarily due to a reduction of commission cost as a result of declining revenue.
General and administrative. General and administrative expenses decreased $1.9 million, or 30% in 2009 compared to 2008, due to a $567,000 reduction in outside professional fees, a $406,000
reduction in employee related expenses, a $432,000 one time refund on prior years franchise and sales tax payments as well as a $289,000 reduction in insurance and stockholders expenses. Our general and administrative expenses in 2008 were comparable to such expenses in 2007.
Goodwill impairment. On April 14, 2000, we acquired all of the outstanding common stock of Interleaf, Inc. in a transaction accounted for as a purchase business combination. As a result of this transaction, we recorded goodwill and other intangible
assets of $767.0 million. Since the fair value of these assets as of December 31, 2007 was determined to be greater than book value, we determined that no impairment was necessary in 2007. In the fourth quarter of 2008, we determined that an impairment of the goodwill had occurred, and therefore we recorded a write-off of $25.1 million as an impairment amount. From 2000 to 2008, we have amortized or written off the entire $767.0 million of goodwill we recorded in connection with
the Interleaf Inc. acquisition. There were no identifiable intangible assets or goodwill in 2009.
Restructuring charges (credits), net. During 2009 we recorded a restructuring charge of $71,000 relating to our facilities in Redwood City, California and New York, New York. This is the result of the recalculation of our restructuring liability due to the early
termination of our sublease in our Redwood City facility. During 2008 we recorded a restructuring credit of $26,000 relating to our facilities in Redwood City, California and New York, New York. This is the result of excess sublease income over our rent expense for such facilities. In fiscal 2007, one of our leases located in Redwood City, California expired. We incurred an asset retirement obligation of $40,000 before returning the property back to the landlord in 2007. We have
also reversed the severance accruals due to the expiration of the statute of limitations related to these accruals. This resulted in a reversal of a $347,000 accrual in 2007.
The following table summarizes the restructuring accrual activity recorded during the three-years ended December 31, 2009 (in thousands):
|
Severance
and
Benefits |
Facilities/
Excess
Assets |
Total |
||||||||||
|
Accrual balances, December 31, 2006 |
$ |
347 |
$ |
2,215 |
$ |
2,562 |
||||||
|
Restructuring (credits) charges |
(347 |
) |
996 |
649 |
||||||||
|
Cash payments |
- |
(1,877 |
) |
(1,877 |
) | |||||||
|
Accrual balances, December 31, 2007 |
- |
1,334 |
1,334 |
|||||||||
|
Restructuring charges (credits) |
- |
(26 |
) |
(26 |
) | |||||||
|
Cash payments |
- |
(463 |
) |
(463 |
) | |||||||
|
Accrual balances, December 31, 2008 |
- |
845 |
845 |
|||||||||
|
Restructuring charges (credits) |
- |
71 |
71 |
|||||||||
|
Cash payments |
- |
(517 |
) |
(517 |
) | |||||||
|
Accrual balances, December 31, 2009 |
$ |
- |
$ |
399 |
$ |
399 |
||||||
Other Income
Other income consists of the following (dollars in thousands, percentages are based upon total revenues) for the indicated periods:
|
Years Ended December 31, |
||||||||||||||||||||||||
|
2009 |
% |
2008 |
% |
2007 |
% |
|||||||||||||||||||
|
Interest income, net |
$ |
711 |
2 |
% |
$ |
1,628 |
5 |
% |
$ |
1,906 |
4 |
% | ||||||||||||
|
Income (expense) from revaluation of warrants |
155 |
1 |
4,040 |
11 |
(3,147 |
) |
(6 |
) | ||||||||||||||||
|
Other income, net |
528 |
2 |
1,257 |
4 |
2,175 |
4 |
||||||||||||||||||
|
Total other income |
$ |
1,394 |
$ |
6,925 |
$ |
934 |
||||||||||||||||||
Net interest income includes interest income on invested funds. We generated $711,000 in interest income from our cash and cash equivalents balances in 2009. Due to a decline in interest rates, our interest income decreased by $917,000 in 2009 as compared to 2008. We generated $1,628,000 in interest income from our
cash and cash equivalents balances in 2008.
Income from revaluation of warrants in 2009 included $155,000 from the revaluation of the warrants issued in connection with senior subordinated secured convertible notes we issued in November 2004 and the real estate buyout in August 2004. The warrants issued in connection with a real estate buyout in August 2004 were not exercised
and expired in July 2009. Income (expense) from revaluation of warrants in 2009, 2008 and 2007 are primarily due to fluctuations in our stock price during the relevant periods.
Other income, net decreased from $1,257,000 in 2008 to $528,000 in 2009. In 2009, the changes were primarily due to unrealized gain or loss on foreign exchange transactions. Other income, net decreased from $2,175,000 in 2007 to $1,257,000 in 2008. In 2008, we reversed prior year accruals of $458,000 for foreign
goods and services taxes liability, which we have determined are not owed anymore.
Income Taxes
We recorded income tax (benefits) provisions of ($27,000), $520,000, and ($73,000) for the years ended December 31, 2009, 2008, and 2007, respectively. The tax benefit from 2009 was primarily due to the reversal of the prior period tax reserve and true up of California tax liability for the 2008 tax year. The
tax provision from 2008 was primarily due to foreign income taxes. The tax benefit for 2007 was primarily due to the reversal of tax accruals determined to be no longer required and partially offset by foreign income taxes.
Liquidity and Capital Resources
Background and Overview
At December 31, 2009, our current assets exceeded our current liabilities by approximately $56.0 million. Our management believes that cash resources at December 31, 2009 will be sufficient to fund operations through at least December 31, 2010. If our existing cash resources are not sufficient to meet our obligations, we will seek
to raise additional capital through public or private equity financing or from other sources. If adequate funds are not available or are not available on acceptable terms as needed, we may be unable to pay our debts as they become due, develop our products, take advantage of future opportunities or respond to competitive pressures or unanticipated requirements.
We continued to maintain our cash and cash equivalents position on our Consolidated Balance Sheet throughout 2008 and 2009. As of December 31, 2008, we had $52.9 million of cash and $9.0 short-term investments, with no long-term debt borrowings. This represents a 15% increase from the prior year’s starting cash
and cash equivalents position of $54.0 million. Positive cash flow from business operations contributed approximately all cash generated during 2008. As of December 31, 2009, we had $21.6 million of cash and $40.2 of short-term investments, with no long-term debt borrowings. The combined cash and short-term investment balances at December 31, 2009 is comparable to December 31, 2008 levels.
Revenues in year 2008 of $35.9 million were down 28% from 2007 revenues of $50.0 million, due primarily to declines in licenses revenues, which were down 43%. Maintenance revenues were down 22% and consulting revenues down 2%. The decrease was caused primarily by the weak macroeconomic conditions domestically and abroad. Economic
uncertainties also negatively impacted the timing of spending decisions and the spending levels of current and prospective customers, particularly those in the financial services and government segments.
Revenues in year 2009 of $30.9 million were down 14% from 2008 revenues of $35.9 million. Licenses revenues were down 8%. Maintenance revenues were down 16% and consulting revenues down 18%. The decrease was due to the global recession that has impacted the timing of spending decisions and the spending levels of current and prospective
customers.
The following table represents our liquidity at December 31, 2009 and 2008 (dollars in thousands):
|
December 31, |
||||||||
|
2009 |
2008 |
|||||||
|
Cash and cash equivalents |
$ |
21,580 |
$ |
52,884 |
||||
|
Short-term investments |
$ |
40,209 |
$ |
9,004 |
||||
|
Restricted cash, current portion |
$ |
20 |
$ |
20 |
||||
|
Restricted cash, net of current portion |
$ |
1,000 |
$ |
1,000 |
||||
|
Working capital |
$ |
55,977 |
$ |
51,070 |
||||
|
Working capital ratio |
4.70 |
3.37 |
||||||
Cash Provided By Operating Activities
Cash provided by operating activities was $122,000 for fiscal 2009. Net cash provided by operating activities in this period consisted primarily of $3.1 million in operating profit (excluding restructuring charges and revaluation of warrants) mainly generated from company-wide cost reduction efforts and adjusted for non-cash
items such as $196,000 depreciation and amortization expenses and $1.1 million of stock-based compensation expenses. These amounts were partially offset by an increase in unearned revenue accounts of $5.3 million.
Cash provided by operating activities was $8.2 million for fiscal 2008. Net cash provided by operating activities in this period consisted primarily of $5.5 million in operating profit (excluding restructuring charges, goodwill impairment and revaluation of warrants) mainly generated from company-wide cost reduction efforts
and cash collected from customers of $3.5 million.
Cash flow from operating activities was $14.6 million for fiscal 2007. Net cash provided by operating activities in this period consisted primarily of $16.3 million in operating profit generated from sales margin improvement and company-wide cost reduction efforts. Also impacting cash flows from operations in fiscal 2007 was
cash collected from accounts receivable of $2.2 million, offset by payment of $2.8 million of accounts payable and accrued expenses and a $6.3 million reduction in unearned revenue accounts.
|
Cash (Used for) Provided By Investing Activities |
Cash used for investing activities in fiscal 2009 was $31.3 million, primarily as a result of purchasing short-term investments of $61.4 million offset by maturities of such short-term investments of $30.2 million. Cash used for investing activities in fiscal 2008 was $9.1 million, primarily as a result of purchasing short-term investments
of $9.0 million. Cash provided by investing activities in fiscal 2007 was $542,000, primarily as a result of transferring restricted cash to cash equivalents of $977,000, offset by capital expenditures of $517,000.
Our capital expenditures substantially consist of purchases of operating resources to manage our operations and included computer hardware and software, office furniture and fixtures and leasehold improvements.
Cash Provided By Financing Activities
Cash provided by financing activities was $537,000 in fiscal 2009, primarily due to cash received in connection with employee purchases of common stock under the Employee Stock Purchase Plan. Cash provided by financing activities was $332,000 in fiscal 2008, primarily due to cash received in connection with employee purchases of common
stock under the Employee Stock Purchase Plan of $657,000, offset by a $325,000 payment by us for fractional shares due to a reverse stock split transaction. Cash provided by financing activities was $2.0 million in fiscal 2007, primarily due to issuance of common stock in relation to option and warrant exercises.
Off-Balance Sheet Arrangements
As of December 31, 2009, we had no off-balance sheet arrangements (as defined in Item 303(a)(4)(ii) of Regulation S-K under the Securities Exchange Act of 1934, as amended) that create potential material risks for us and that are not recognized on our balance sheets.
Leases and Other Contractual Obligations
We lease our headquarters and other facilities under non-cancelable operating lease agreements expiring 2014. Under the terms of the agreements, we are required to pay lease costs, property taxes, insurance, and normal maintenance costs.
We expect to incur significant operating expenses for the foreseeable future in order to execute our business plan. A summary of total future minimum lease payments as of December 31, 2009, under non-cancelable operating lease agreements is as follows (in millions):
|
Operating
Leases |
|||||
|
Years Ending December 31, |
|||||
|
2010 |
$ |
1.8 |
|||
|
2011 |
1.3 |
||||
|
2012 |
0.7 |
||||
|
2013 |
0.1 |
||||
|
2014 |
0.1 |
||||
|
Total minimum lease payments |
$ |
4.0 |
|||
As of December 31, 2009, we have accrued $0.4 million of estimated future facilities costs as a restructuring accrual. This accrual includes the above minimum lease payments that are related to excess space under lease and certain lease related allowances, fees and expenses, partially offset by estimated future sublease income (See Note 8
– Restructuring in the Notes to our Consolidated Financial Statements).
Additional Factors That May Affect Future Liquidity
The following table summarizes our contractual obligations as of December 31, 2009 and the effect such obligations are expected to have on our liquidity and cash flows in future years. Restricted cash represents the collateral for our letter
of credit.
|
Total |
Less Than
1 Year |
1-3
Years |
4-5
Years |
Over
5 Years |
||||||||||||||||
|
(In millions) |
||||||||||||||||||||
|
Letter of credit |
$ |
1.0 |
$ |
- |
$ |
1.0 |
$ |
- |
$ |
- |
||||||||||
We anticipate that future operating expenses and cash payments under operating leases will constitute a material use of our existing cash resources. As a result, our net cash flows will depend heavily on the level of future revenues, and our ability to manage infrastructure costs.
Quarterly Results of Operations
The following tables set forth certain unaudited Consolidated Statement of Operations data for the eight quarters ended December 31, 2009, as well as that data expressed as a percentage of our total revenues for the periods indicated.
This data has been derived from unaudited Consolidated Financial Statements that, in the opinion of management, include all adjustments consisting only of normal recurring adjustments, necessary for a fair presentation of such information when read in conjunction with our Consolidated Financial Statements and the Notes thereto.
The unaudited quarterly information should be read in conjunction with our Consolidated Financial Statements and the Notes thereto included in this Form 10-K. We believe that period-to-period comparisons of our financial results are not
necessarily meaningful and should not be relied upon as an indication of future performance.
|
Three Months Ended |
||||||||||||||||||||||||||||||||
|
Dec 31,
2009 |
Sep 30,
2009 |
Jun 30,
2009 |
Mar 31,
2009 |
Dec 31,
2008 |
Sep 30,
2008 |
Jun 30,
2008 |
Mar 31,
2008 |
|||||||||||||||||||||||||
|
(In thousands)
(Unaudited) |
||||||||||||||||||||||||||||||||
|
Statement of Operations Data: |
||||||||||||||||||||||||||||||||
|
Revenues: |
||||||||||||||||||||||||||||||||
|
Software licenses |
$ |
2,478 |
$ |
2,663 |
$ |
3,161 |
$ |
2,852 |
$ |
3,616 |
$ |
2,096 |
$ |
2,448 |
$ |
3,977 |
||||||||||||||||
|
Services |
4,768 |
4,879 |
5,011 |
5,149 |
6,036 |
6,095 |
5,582 |
6,053 |
||||||||||||||||||||||||
|
Total revenues |
7,246 |
7,542 |
8,172 |
8,001 |
9,652 |
8,191 |
8,030 |
10,030 |
||||||||||||||||||||||||
|
Cost of revenues: |
||||||||||||||||||||||||||||||||
|
Cost of software licenses |
6 |
6 |
14 |
6 |
6 |
7 |
6 |
7 |
||||||||||||||||||||||||
|
Cost of services |
1,824 |
1,784 |
1,959 |
1,964 |
2,259 |
2,218 |
2,155 |
2,253 |
||||||||||||||||||||||||
|
Total cost of revenues |
1,830 |
1,790 |
1,973 |
1,970 |
2,265 |
2,225 |
2,161 |
2,260 |
||||||||||||||||||||||||
|
Gross profit |
5,416 |
5,752 |
6,199 |
6,031 |
7,387 |
5,966 |
5,869 |
7,770 |
||||||||||||||||||||||||
|
Operating expenses: |
||||||||||||||||||||||||||||||||
|
Research and development |
2,227 |
2,169 |
2,009 |
2,168 |
2,320 |
2,217 |
2,309 |
2,337 |
||||||||||||||||||||||||
|
Sales and marketing |
1,930 |
2,024 |
1,942 |
2,036 |
1,989 |
1,937 |
1,961 |
1,885 |
||||||||||||||||||||||||
|
General and administrative |
906 |
1,006 |
1,146 |
1,451 |
1,452 |
1,659 |
1,603 |
1,698 |
||||||||||||||||||||||||
|
Goodwill impairment |
- |
- |
- |
- |
25,066 |
- |
- |
- |
||||||||||||||||||||||||
|
Restructuring charges (credits) |
21 |
(4 |
) |
56 |
(2 |
) |
(9 |
) |
6 |
(5 |
) |
(18 |
) | |||||||||||||||||||
|
Total operating expenses |
5,084 |
5,195 |
5,153 |
5,653 |
30,818 |
5,819 |
5,868 |
5,902 |
||||||||||||||||||||||||
|
Operating income (loss) |
332 |
557 |
1,046 |
378 |
(23,431 |
) |
147 |
1 |
1,868 |
|||||||||||||||||||||||
|
Income (expense) from revaluation of warrants |
8 |
154 |
24 |
(31 |
) |
380 |
581 |
625 |
2,454 |
|||||||||||||||||||||||
|
Other (expense) income, net |
(31 |
) |
984 |
1,118 |
(832 |
) |
1,148 |
(398 |
) |
813 |
1,322 |
|||||||||||||||||||||
|
Income taxes benefit (expense) |
143 |
104 |
(79 |
) |
(141 |
) |
(192 |
) |
(41 |
) |
(4 |
) |
(283 |
) | ||||||||||||||||||
|
Net income (loss) |
$ |
452 |
$ |
1,799 |
$ |
2,109 |
$ |
(626 |
) |
$ |
(22,095 |
) |
$ |
289 |
$ |
1,435 |
$ |
5,361 |
||||||||||||||
|
Basic net income (loss) per share |
$ |
0.10 |
$ |
0.41 |
$ |
0.48 |
$ |
(0.14 |
) |
$ |
(5.04 |
) |
$ |
0.07 |
$ |
0.33 |
$ |
1.23 |
||||||||||||||
|
Diluted net income (loss) per share |
$ |
0.10 |
$ |
0.41 |
$ |
0.48 |
$ |
(0.14 |
) |
$ |
(5.04 |
) |
$ |
0.06 |
$ |
0.33 |
$ |
1.21 |
||||||||||||||
|
Shares used in computing basic net income (loss) per share |
4,429 |
4,415 |
4,396 |
4,381 |
4,382 |
4,431 |
4,372 |
4,358 |
||||||||||||||||||||||||
|
Shares used in computing diluted net income (loss) per share |
4,432 |
4,435 |
4,399 |
4,381 |
4,382 |
4,466 |
4,412 |
4,413 |
||||||||||||||||||||||||
As a Percent of Revenue
|
Three Months Ended |
||||||||||||||||||||||||||||||||
|
Dec 31,
2009 |
Sep 30,
2009 |
Jun 30,
2009 |
Mar 31,
2009 |
Dec 31,
2008 |
Sep 30,
2008 |
Jun 30,
2008 |
Mar 31,
2008 |
|||||||||||||||||||||||||
|
(Unaudited) |
||||||||||||||||||||||||||||||||
|
Statement of Operations Data: |
||||||||||||||||||||||||||||||||
|
Revenues: |
||||||||||||||||||||||||||||||||
|
Software licenses |
34 |
% |
35 |
% |
39 |
% |
36 |
% |
37 |
% |
26 |
% |
30 |
% |
40 |
% | ||||||||||||||||
|
Services |
66 |
65 |
61 |
64 |
63 |
74 |
70 |
60 |
||||||||||||||||||||||||
|
Total revenues |
100 |
100 |
100 |
100 |
100 |
100 |
100 |
100 |
||||||||||||||||||||||||
|
Cost of revenues: |
||||||||||||||||||||||||||||||||
|
Cost of software licenses |
- |
- |
- |
- |
- |
- |
- |
- |
||||||||||||||||||||||||
|
Cost of services |
25 |
24 |
24 |
25 |
23 |
27 |
27 |
22 |
||||||||||||||||||||||||
|
Total cost of revenues |
25 |
24 |
24 |
25 |
23 |
27 |
27 |
22 |
||||||||||||||||||||||||
|
Gross profit |
75 |
76 |
76 |
75 |
77 |
73 |
73 |
78 |
||||||||||||||||||||||||
|
Operating expenses: |
||||||||||||||||||||||||||||||||
|
Research and development |
31 |
29 |
25 |
27 |
24 |
27 |
29 |
23 |
||||||||||||||||||||||||
|
Sales and marketing |
27 |
27 |
24 |
25 |
21 |
24 |
24 |
19 |
||||||||||||||||||||||||
|
General and administrative |
13 |
13 |
14 |
18 |
15 |
20 |
20 |
17 |
||||||||||||||||||||||||
|
Goodwill impairment |
- |
- |
- |
- |
260 |
- |
- |
- |
||||||||||||||||||||||||
|
Restructuring charges (credits) |
- |
- |
- |
- |
- |
- |
- |
- |
||||||||||||||||||||||||
|
Total operating expenses |
71 |
69 |
63 |
70 |
320 |
71 |
73 |
59 |
||||||||||||||||||||||||
|
Operating income (loss) |
4 |
7 |
13 |
5 |
(243 |
) |
2 |
- |
19 |
|||||||||||||||||||||||
|
Other income (expense) |
2 |
17 |
13 |
(13 |
) |
13 |
2 |
18 |
35 |
|||||||||||||||||||||||
|
Net income (loss) |
6 |
% |
24 |
% |
26 |
% |
(8) |
% |
(230) |
% |
4 |
% |
18 |
% |
54 |
% | ||||||||||||||||
Our quarterly operating results have fluctuated in the past and may fluctuate significantly in the future as a result of a variety of factors, many of which are outside of our control. It is likely that our operating results in one or more future quarters may be below the expectations of securities analysts and investors. In that
event, the trading price of our common stock almost certainly would decline.
RECENT ACCOUNTING PRONOUNCEMENTS
In October 2009, the FASB issued ASU 2009-13 (an update to ASC 605-25), Revenue Recognition: Multiple-Element Arrangements ("ASU 2009-13"), which is effective
for annual periods beginning on or after June 15, 2010; however, early adoption is permitted. In arrangements with multiple deliverables, ASU 2009-13 permits entities to use management’s best estimate of selling price to value individual deliverables when those deliverables have never been sold separately or when third-party evidence is not available. In addition, any discounts provided in multiple element arrangements will be allocated on the basis of the relative selling price of each deliverable.
We are currently evaluating the impact of adopting the provisions of ASU 2009-13.
In June 2009, the FASB issued the FASB Accounting Standards CodificationTM (the “Codification”) which was effective for us in the third quarter ended September 30, 2009. The Codification became the single authoritative source
for U.S. GAAP. Accordingly, we no longer use previous references to U.S. GAAP accounting standards in our disclosures including these Notes to our Consolidated Financial Statements. The Codification does not affect our Consolidated Financial Statements.
In May 2009, the FASB issued ASC 855-10, Subsequent Events ("ASC 855-10"). ASC 855-10 establishes accounting principles and requirements for subsequent
events. We adopted this standard effective as of June 30, 2009.
In April 2009, we adopted ASC 820-10, Fair Value Measurements and Disclosures ("ASC 820-10"), and ASC 825, Financial Instruments ("ASC 825-10"). We also adopted ASC 320-10, Investment – Debt and Equity Securities ("ASC 320-10"), which provides guidance on determining other-than-temporary impairments for debt securities. These adoptions did not have a material impact on our Consolidated Financial Statements.
Our exposure to market risk for changes in interest rates relates primarily to our investment portfolio. We had no derivative financial instruments as of December 31, 2009 and 2008. We place our investments in instruments that meet high credit quality standards and the amount of credit exposure to any one issue, issuer and type of
instrument is limited.
Cash and Cash Equivalents, and Short-term Investments
We consider all debt and equity securities with remaining maturities of three months or less at the date of purchase to be cash equivalents. Short-term investments consist of debt and equity securities that have a remaining maturity of less than one year as of the date of the balance sheet. Cash and cash equivalents that serve as collateral
for financial instruments such as letters of credit are classified as restricted cash. Restricted cash in which the underlying instrument has a term of greater than twelve months from the balance sheet date are classified as non-current.
Management determines the appropriate classification of short-term investments at the time of purchase and evaluates such designation as of each balance sheet date. All short-term investments to date have been classified as held to maturity and carried at amortized cost, which approximates fair value. Our short-term investments’
contractual maturities are before November 2010. Total realized gains during fiscal years 2009 and 2008 were $711,000 and $1,628,000, respectively. Our cash and cash equivalents, and restricted cash consisted of the following as of December 31, 2009 and 2008 (in thousands):
|
Classified on Consolidated Balance Sheet as: |
||||||||||||||||||||||||||||||||
|
Purchase/
Amortized
Cost |
Gross
Unrealized
Gains |
Gross
Unrealized
Losses |
Aggregate
Fair Value |
Cash and
Cash
Equivalents |
Short-Term
Investment |
Restricted
Cash,
Current |
Restricted
Cash,
Non-Current |
|||||||||||||||||||||||||
|
As of December 31, 2009: |
||||||||||||||||||||||||||||||||
|
Cash and cash equivalents |
$ |
6,690 |
$ |
- |
$ |
- |
$ |
6,690 |
$ |
5,670 |
$ |
- |
$ |
20 |
$ |
1,000 |
||||||||||||||||
|
Money market funds |
15,910 |
- |
- |
15,910 |
15,910 |
- |
- |
- |
||||||||||||||||||||||||
|
Held-to-maturity securities (Short-term Bonds and Certificates of deposit) |
40,209 |
- |
- |
40,209 |
- |
40,209 |
- |
- |
||||||||||||||||||||||||
|
Total |
$ |
62,809 |
$ |
- |
$ |
- |
$ |
62,809 |
$ |
21,580 |
$ |
40,209 |
$ |
20 |
$ |
1,000 |
||||||||||||||||
|
As of December 31, 2008: |
||||||||||||||||||||||||||||||||
|
Cash and cash equivalents |
$ |
16,776 |
$ |
- |
$ |
- |
$ |
16,776 |
$ |
15,756 |
$ |
- |
$ |
20 |
$ |
1,000 |
||||||||||||||||
|
Money market funds |
37,128 |
- |
- |
37,128 |
37,128 |
- |
- |
- |
||||||||||||||||||||||||
|
Held-to-maturity securities (Short-term Bonds and Certificates of deposit) |
9,004 |
- |
- |
9,004 |
- |
9,004 |
- |
- |
||||||||||||||||||||||||
|
Total |
$ |
62,908 |
$ |
- |
$ |
- |
$ |
62,908 |
$ |
52,884 |
$ |
9,004 |
$ |
20 |
$ |
1,000 |
||||||||||||||||
Concentrations of Credit Risk
Financial instruments that potentially subject us to concentrations of credit risk consist primarily of cash and cash equivalents, short-term investments, and accounts receivable. We maintain our cash and cash equivalents and short-term investments with high-quality institutions. Our management performs ongoing credit evaluations of our
customers and requires certain of these customers to provide security deposits or letters of credit.
Cash deposits in foreign countries of approximately $4.9 million are subject to local banking laws and may bear higher or lower risk than cash deposited in the United States. As part of our cash and investment management processes, we perform periodic evaluations of the credit standing of the financial institutions we use and we have not
sustained any credit losses from instruments held at these financial institutions. From time to time, our financial instruments maintained in our foreign subsidiaries may be subject to political risks or instability that may arise in foreign countries where we operate.
At December 31, 2009, one customer in the medical device industry accounted for more than 10% of our accounts receivable balance. At December 31, 2008, no customer accounted for more than 10% of our accounts receivable balance. For the year ended December 31, 2009, one customer in the retail industry accounted for 10% of
our total revenues. For the years ended December 31, 2008 and 2007, no customer accounted for 10% or more of our total revenues.
Fair Value of Financial Instruments
Effective January 1, 2008, we adopted the provision of ASC 820-10, Fair Value Measurement ("ASC 820-10"). ASC 820-10 establishes a framework for measuring fair value
and requires disclosures about fair value measurements by establishing a hierarchy that prioritizes the inputs to valuation techniques used to measure fair value. The hierarchy gives the highest priority to unadjusted quoted prices in active markets for identical assets or liabilities (Level 1 measurements) and lowest priority to unobservable inputs (Level 3 measurements). The three levels of the fair value hierarchy are described below:
|
· |
Level 1 – Quoted prices in active markets for identical assets or liabilities. |
|
· |
Level 2 – Inputs other than Level 1 that are observable, either directly or indirectly, such as quoted prices for similar assets or liabilities; quoted prices in markets that are not active; or other inputs that are observable or can be corroborated by observable market data for substantially the full term of the assets or liabilities. |
|
· |
Level 3 — Unobservable inputs that are supported by little or no market activity and that are significant to the fair value of the assets or liabilities. |
We measure the following financial assets at fair value on a recurring basis. The fair value of these financial assets as of December 31, 2009 (in thousands) were as follows:
|
Fair Value measurements at Reporting Date Using |
||||||||||||||||||||
|
Balance at December 31, 2009 |
Quoted Prices in Active Markets for Identical Assets (Level 1) |
Significant Other Observable Inputs (Level 2) |
Significant Unobservable Input (Level 3) |
Total Gains (Losses) |
||||||||||||||||
|
Cash and cash equivalents (1) |
$ |
21,580 |
$ |
21,580 |
$ |
- |
$ |
- |
$ |
- |
||||||||||
|
Short-term investments (2) |
40,209 |
12,843 |
27,366 |
- |
- |
|||||||||||||||
|
Total |
$ |
61,789 |
$ |
34,423 |
$ |
27,366 |
$ |
- |
$ |
- |
||||||||||
(1) Includes money market funds.
(2) Includes held-to-maturity bonds and certificates of deposit.
Our financial instruments consist of cash equivalents, short-term investments, accounts receivable, and accounts payable. We do not have any derivative financial instruments. We believe the reported carrying amounts of our financial instruments approximates fair value, based upon the short maturity of cash equivalents, accounts receivable
and payable, and based on the current rates available to us on short-term investments.
Foreign Currency
We license our products and maintain significant operations in foreign countries. Fluctuations in the value of foreign currencies, principally the Euro, British Pound and Japanese Yen, relative to the United States dollar have impacted our operating results in the past and may do so in the future. We expect that international licenses,
maintenance and consulting revenues will continue to account for a significant portion of our total revenues in the future. We pay the expenses of our international operations in local currencies and do not currently engage in hedging transactions with respect to such obligations.
Equity Investments
Our equity investments consist of equity investments in public and non-public companies that are accounted for under either the cost method of accounting or the equity method of accounting. Equity investments are accounted for under the cost method of accounting when we have a minority interest and do not have the ability to exercise significant
influence. These investments are classified as available for sale and are carried at fair value when readily determinable market values exist or at cost when such market values do not exist. Adjustments to fair value are recorded as a component of other comprehensive income unless the investments are considered permanently impaired in which case the adjustment is recorded as a component of other income (expense), net in the Consolidated Statement of Operations. Equity investments are accounted for under the equity
method of accounting when we have a minority interest and have the ability to exercise significant influence. These investments are classified as available for sale and are carried at cost with periodic adjustments to carrying value for equity in net income (loss) of the equity investee. Such adjustments are recorded as a component of other income, net. Any decline in value of our investments, which is other than a temporary decline, is charged to earnings during the period in which the impairment occurs. These
investments were either liquidated or written-off in 2005 and a net gain of $17,000 was recorded. There was no net gain or loss in 2007. In 2008, we received approximately $35,000 cash related to investments we made and wrote-off in prior years. In 2009, we received approximately $22,000 cash related to investments in prior years. Those investments were accounted for under the lower of cost or market method and were written off in prior years. The gain is reported under "Other
Income , net" in the accompanying Consolidated Statements of Operations.
The following Consolidated Financial Statements and the related Notes thereto of BroadVision, Inc. and the Report of the Company’s Independent Registered Public Accounting Firm are filed as a part of this Form 10-K.
REPORT OF INDEPENDENT REGISTERED PUBLIC ACCOUNTING FIRM
Board of Directors and Stockholders of
BroadVision, Inc.
We have audited the accompanying consolidated balance sheets of BroadVision, Inc. and its subsidiaries as of December 31, 2009 and 2008 and the related consolidated statements of operations, stockholders' equity (deficit) and comprehensive income (loss), and cash flows for each of the years in the three-year period ended December 31, 2009.
In connection with our audits of the financial statements, we have also audited the financial statement schedule listed in the accompanying index at item 15(a)2. These financial statements and schedule are the responsibility of the Company’s management. Our responsibility is to express an opinion on these financial statements and schedule based on our audits.
We conducted our audits in accordance with the standards of the Public Company Accounting Oversight Board (United States). Those standards require that we plan and perform the audits to obtain reasonable assurance about whether the financial statements are free of material misstatement. The Company has determined that
it is not required to have, nor were we engaged to perform, an audit of its internal control over financial reporting. Our audits included consideration of internal control over financial reporting as a basis for designing audit procedures that are appropriate in the circumstances, but not for the purpose of expressing an opinion on the effectiveness of the Company’s internal control over financial reporting. Accordingly, we express no such opinion. An audit also includes examining,
on a test basis, evidence supporting the amounts and disclosures in the financial statements, assessing the accounting principles used and significant estimates made by management, as well as evaluating the overall presentation of the financial statements and schedule. We believe that our audits provide a reasonable basis for our opinion.
In our opinion, the consolidated financial statements referred to above present fairly, in all material respects, the financial position of BroadVision, Inc. as of December 31, 2009 and 2008, and the results of its operations and its cash flows for each of the years in the three-year period ended December 31, 2009, in
conformity with U.S generally accepted accounting principles. Also, in our opinion, the financial statement schedule, when considered in relation to the basic consolidated financial statements taken as a whole, presents fairly, in all material respects, the information set forth therein.
/s/ Odenberg Ullakko Muranishi & Co. LLP
San Francisco, California
March 5, 2010
BROADVISION, INC. AND SUBSIDIARIES
CONSOLIDATED BALANCE SHEETS
(In thousands, except par value amounts)
|
December 31, |
||||||||
|
2009 |
2008 |
|||||||
|
ASSETS |
||||||||
|
Current assets: |
||||||||
|
Cash and cash equivalents |
$ |
21,580 |
$ |
52,884 |
||||
|
Short-term investments |
40,209 |
9,004 |
||||||
|
Accounts receivable, net of reserves of $274 and $366 as of December 31, 2009 and 2008, respectively |
7,099 |
8,167 |
||||||
|
Restricted cash |
20 |
20 |
||||||
|
Prepaids and other |
2,190 |
2,585 |
||||||
|
Total current assets |
71,098 |
72,660 |
||||||
|
Property and equipment, net |
384 |
514 |
||||||
|
Restricted cash, net of current portion |
1,000 |
1,000 |
||||||
|
Other non-current assets |
385 |
563 |
||||||
|
Total assets |
$ |
72,867 |
$ |
74,737 |
||||
|
LIABILITIES AND STOCKHOLDERS' EQUITY |
||||||||
|
Current liabilities: |
||||||||
|
Accounts payable |
$ |
788 |
$ |
1,251 |
||||
|
Accrued expenses |
4,827 |
5,415 |
||||||
|
Warrant liability |
- |
155 |
||||||
|
Unearned revenue |
2,010 |
5,810 |
||||||
|
Deferred maintenance |
7,496 |
8,959 |
||||||
|
Total current liabilities |
15,121 |
21,590 |
||||||
|
Other non-current liabilities |
2,353 |
2,429 |
||||||
|
Total liabilities |
17,474 |
24,019 |
||||||
|
Commitments and contingencies (Note 7) |
||||||||
|
Stockholders' equity: |
||||||||
|
Convertible preferred stock, $0.0001 par value; 1,000 shares authorized; none issued and outstanding |
- |
- |
||||||
|
Common stock, $0.0001 par value; 11,200 shares authorized; 4,433 and 4,376 shares issued and outstanding as of December 31, 2009 and 2008, respectively |
- |
- |
||||||
|
Additional paid-in capital |
1,260,257 |
1,258,604 |
||||||
|
Accumulated other comprehensive loss |
(1,195 |
) |
(483 |
) | ||||
|
Accumulated deficit |
(1,203,669 |
) |
(1,207,403 |
) | ||||
|
Total stockholders' equity |
55,393 |
50,718 |
||||||
|
Total liabilities and stockholders' equity |
$ |
72,867 |
$ |
74,737 |
||||
The accompanying Notes are an integral part of these Consolidated Financial Statements
BROADVISION, INC. AND SUBSIDIARIES
CONSOLIDATED STATEMENTS OF OPERATIONS
(In thousands, except per share amounts)
|
Years Ended December 31, |
||||||||||||
|
2009 |
2008 |
2007 |
||||||||||
|
Revenues: |
||||||||||||
|
Software licenses |
$ |
11,154 |
$ |
12,137 |
$ |
21,127 |
||||||
|
Services |
19,807 |
23,766 |
28,891 |
|||||||||
|
Total revenues |
30,961 |
35,903 |
50,018 |
|||||||||
|
Cost of revenues: |
||||||||||||
|
Cost of software licenses |
32 |
26 |
45 |
|||||||||
|
Cost of services |
7,531 |
8,885 |
8,961 |
|||||||||
|
Total cost of revenues |
7,563 |
8,911 |
9,006 |
|||||||||
|
Gross profit |
23,398 |
26,992 |
41,012 |
|||||||||
|
Operating expenses: |
||||||||||||
|
Research and development |
8,573 |
9,183 |
9,668 |
|||||||||
|
Sales and marketing |
7,932 |
7,772 |
8,131 |
|||||||||
|
General and administrative |
4,509 |
6,412 |
6,293 |
|||||||||
|
Goodwill impairment |
- |
25,066 |
- |
|||||||||
|
Restructuring charges (credits), net |
71 |
(26 |
) |
649 |
||||||||
|
Total operating expenses |
21,085 |
48,407 |
24,741 |
|||||||||
|
Operating income (loss) |
2,313 |
(21,415 |
) |
16,271 |
||||||||
|
Other income: |
||||||||||||
|
Interest income, net |
711 |
1,628 |
1,906 |
|||||||||
|
Income (expense) from revaluation of warrants |
155 |
4,040 |
(3,147 |
) | ||||||||
|
Other income, net |
528 |
1,257 |
2,175 |
|||||||||
|
Total other income |
1,394 |
6,925 |
934 |
|||||||||
|
Income (loss) before income taxes |
3,707 |
(14,490 |
) |
17,205 |
||||||||
|
Income taxes benefit (expense) |
27 |
(520 |
) |
73 |
||||||||
|
Net income (loss) |
$ |
3,734 |
$ |
(15,010 |
) |
$ |
17,278 |
|||||
|
Basic net income (loss) per share |
$ |
0.85 |
$ |
(3.43 |
) |
$ |
4.01 |
|||||
|
Diluted net income (loss) per share |
$ |
0.85 |
$ |
(3.43 |
) |
$ |
3.90 |
|||||
|
Shares used in computing basic net income (loss) per share |
4,406 |
4,374 |
4,310 |
|||||||||
|
Shares used in computing diluted net income (loss) per share |
4,407 |
4,374 |
4,430 |
|||||||||
The accompanying Notes are an integral part of these Consolidated Financial Statements
BROADVISION, INC. AND SUBSIDIARIES
CONSOLIDATED STATEMENTS OF STOCKHOLDERS' EQUITY (DEFICIT)
AND COMPREHENSIVE INCOME (LOSS)
(In thousands)
|
Common Stock |
||||||||||||||||||||||||||||
|
Shares |
Amount |
Additional
Paid-in
Capital |
Accumulated
Other
Comprehensive
Income (Loss) |
Accumulated
Deficit |
Comprehensive
Income (Loss) |
Total
Stockholders'
Equity
(Deficit) |
||||||||||||||||||||||
|
Balances as of
December 31, 2006 |
4,261 |
$ |
- |
$ |
1,253,145 |
$ |
168 |
$ |
(1,210,059 |
) |
$ |
43,254 |
||||||||||||||||
|
Cumulative-effect adjustments from the adoption of ASC 740-10 (Note 6) |
- |
- |
- |
- |
388 |
388 |
||||||||||||||||||||||
|
Adjusted Balances as of December 31, 2006 |
4,261 |
- |
1,253,145 |
168 |
(1,209,671 |
) |
43,642 |
|||||||||||||||||||||
|
Comprehensive income: |
||||||||||||||||||||||||||||
|
Net income |
- |
- |
17,278 |
$ |
17,278 |
17,278 |
||||||||||||||||||||||
|
Foreign currency translations |
- |
- |
(152 |
) |
(152 |
) |
(152 |
) | ||||||||||||||||||||
|
Total comprehensive income |
$ |
17,126 |
||||||||||||||||||||||||||
|
Stock-based compensation |
- |
1,447 |
1,447 |
|||||||||||||||||||||||||
|
Issuance of common stock from restricted stocks awards |
1 |
- |
- |
- |
||||||||||||||||||||||||
|
Issuance of common stock under employee stock purchase plan |
46 |
- |
863 |
863 |
||||||||||||||||||||||||
|
Issuance of common stock from exercise of warrants |
13 |
- |
1,066 |
1,066 |
||||||||||||||||||||||||
|
Issuance of common stock from exercise of options |
36 |
- |
621 |
621 |
||||||||||||||||||||||||
|
Balances as of December 31, 2007 |
4,357 |
- |
1,257,142 |
16 |
(1,192,393 |
) |
64,765 |
|||||||||||||||||||||
|
Comprehensive loss: |
||||||||||||||||||||||||||||
|
Net loss |
- |
- |
(15,010 |
) |
$ |
(15,010 |
) |
(15,010 |
) | |||||||||||||||||||
|
Foreign currency translations |
- |
- |
(499 |
) |
(499 |
) |
(499 |
) | ||||||||||||||||||||
|
Total comprehensive loss |
$ |
(15,509 |
) |
|||||||||||||||||||||||||
|
Stock-based compensation |
- |
1,130 |
1,130 |
|||||||||||||||||||||||||
|
Issuance of common stock from restricted stock awards |
2 |
- |
- |
- |
||||||||||||||||||||||||
|
Issuance of common stock under employee stock purchase plan |
32 |
- |
586 |
586 |
||||||||||||||||||||||||
|
Retirements of fractional shares due to reverse stock splits |
(20 |
) |
- |
(325 |
) |
(325 |
) | |||||||||||||||||||||
|
Issuance of common stock from exercise of options |
5 |
- |
71 |
71 |
||||||||||||||||||||||||
|
Balances as of December 31, 2008 |
4,376 |
- |
1,258,604 |
(483 |
) |
(1,207,403 |
) |
50,718 |
||||||||||||||||||||
|
Comprehensive income: |
||||||||||||||||||||||||||||
|
Net income |
- |
- |
3,734 |
$ |
3,734 |
3,734 |
||||||||||||||||||||||
|
Foreign currency translations |
- |
- |
(712 |
) |
(712 |
) |
(712 |
) | ||||||||||||||||||||
|
Total comprehensive loss |
$ |
3,022 |
||||||||||||||||||||||||||
|
Stock-based compensation |
- |
1,116 |
1,116 |
|||||||||||||||||||||||||
|
Issuance of common stock from restricted stock awards |
3 |
- |
- |
- |
||||||||||||||||||||||||
|
Issuance of common stock under employee stock purchase plan |
54 |
- |
537 |
537 |
||||||||||||||||||||||||
|
Balances as of December 31, 2009 |
4,433 |
$ |
- |
$ |
1,260,257 |
$ |
(1,195 |
) |
$ |
(1,203,669 |
) |
$ |
55,393 |
|||||||||||||||
The accompanying Notes are an integral part of these Consolidated Financial Statements
BROADVISION, INC. AND SUBSIDIARIES
CONSOLIDATED STATEMENTS OF CASH FLOWS
(In thousands)
|
Years Ended December 31, |
||||||||||||
|
2009 |
2008 |
2007 |
||||||||||
|
Cash flows from operating activities: |
||||||||||||
|
Net income (loss) |
$ |
3,734 |
$ |
(15,010 |
) |
$ |
17,278 |
|||||
|
Adjustments to reconcile net income (loss) to net cash provided by operating activities: |
||||||||||||
|
Depreciation and amortization |
196 |
378 |
969 |
|||||||||
|
Stock-based compensation charge |
1,116 |
1,130 |
1,447 |
|||||||||
|
Provision for receivable reserves |
32 |
72 |
248 |
|||||||||
|
Amortization of prepaid royalties |
- |
- |
7 |
|||||||||
|
Gain on cost method investments |
(22 |
) |
(35 |
) |
- |
|||||||
|
Loss (gain) on sale or abandonment of fixed assets |
2 |
- |
(78 |
) | ||||||||
|
Goodwill impairment |
- |
25,066 |
- |
|||||||||
|
Restructuring charge (credit) |
71 |
(26 |
) |
649 |
||||||||
|
(Income) expense on revaluation of warrants |
(155 |
) |
(4,040 |
) |
3,147 |
|||||||
|
Changes in operating assets and liabilities: |
||||||||||||
|
Accounts receivable |
1,036 |
(625 |
) |
2,244 |
||||||||
|
Prepaids and other |
395 |
(1,175 |
) |
(304 |
) | |||||||
|
Other non-current assets |
178 |
(61 |
) |
(27 |
) | |||||||
|
Accounts payable and accrued expenses |
(870 |
) |
(937 |
) |
(2,828 |
) | ||||||
|
Restructuring accrual |
(517 |
) |
(463 |
) |
(1,877 |
) | ||||||
|
Unearned revenue and deferred maintenance |
(5,263 |
) |
4,186 |
(6,278 |
) | |||||||
|
Other non-current liabilities |
189 |
(248 |
) |
(6 |
) | |||||||
|
Net cash provided by operating activities |
122 |
8,212 |
14,591 |
|||||||||
|
Cash flows from investing activities: |
||||||||||||
|
Purchase of property and equipment |
(68 |
) |
(165 |
) |
(517 |
) | ||||||
|
Dividends received from cost method investments |
22 |
35 |
- |
|||||||||
|
Purchase of short-term investments |
(61,385 |
) |
(9,004 |
) |
- |
|||||||
|
Maturities of short-term investments |
30,180 |
- |
- |
|||||||||
|
Proceeds from sale of property and equipment |
- |
- |
82 |
|||||||||
|
Transfer from restricted cash |
- |
- |
977 |
|||||||||
|
Net cash (used for) provided by investing activities |
(31,251 |
) |
(9,134 |
) |
542 |
|||||||
|
Cash flows from financing activities: |
||||||||||||
|
Proceeds from issuance of common stock, net |
537 |
657 |
1,484 |
|||||||||
|
Payments of fractional shares due to reverse stock split |
- |
(325 |
) |
- |
||||||||
|
Proceeds from issuance of common stock from warrant exercise |
- |
- |
505 |
|||||||||
|
Net cash provided by financing activities |
537 |
332 |
1,989 |
|||||||||
|
Effect of exchange rates on cash and cash equivalents |
(712 |
) |
(499 |
) |
(152 |
) | ||||||
|
Net (decrease) increase in cash and cash equivalents |
(31,304 |
) |
(1,089 |
) |
16,970 |
|||||||
|
Cash and cash equivalents, beginning of year |
52,884 |
53,973 |
37,003 |
|||||||||
|
Cash and cash equivalents, end of year |
$ |
21,580 |
$ |
52,884 |
$ |
53,973 |
||||||
|
Supplemental cash flows disclosures: |
||||||||||||
|
Cash paid for income taxes |
$ |
91 |
$ |
525 |
$ |
1 |
||||||
|
Supplemental information of noncash financing and investing activities: |
||||||||||||
|
Retirement of fully depreciated property and equipment |
$ |
1,131 |
$ |
494 |
$ |
13,598 |
||||||
|
Cumulative effect adjustment from the adoption of ASC 740-10 |
$ |
- |
$ |
- |
$ |
388 |
||||||
|
Conversion of warrant liability to equity |
$ |
- |
$ |
- |
$ |
561 |
||||||
The accompanying Notes are an integral part of these Consolidated Financial Statements
BROADVISION, INC. AND SUBSIDIARIES
Notes to Consolidated Financial Statements
Note 1---Organization and Summary of Significant Accounting Policies
Nature of Business
BroadVision, Inc. (collectively with its subsidiaries, "BroadVision" or "we") was incorporated in the state of Delaware on May 13, 1993 and has been a publicly traded corporation since 1996. We develop, market, and support enterprise portal applications that enable companies to unify their e-business infrastructure and conduct
both interactions and transactions with employees, partners, and customers through a personalized self-service model that increases revenues, reduces costs, and improves productivity.
On September 9, 2008, we announced that our Board of Directors and requisite stockholders had approved a reverse stock split of our common stock on a one-for-twenty-five ratio, effective October 24, 2008. Our common stock began trading on a
post-split basis at the opening of trading on October 27, 2008. The accompanying Consolidated Financial Statements and related financial information contained herein for all periods presented have been retroactively restated to give effect to the stock split in accordance with U.S. GAAP.
Our common stock began trading on a post-split basis at the opening of trading on October 27, 2008. Our stock was quoted under the trading symbol "BVIS.OB" on the OTC Bulletin Board from October 27, 2008 to November 7, 2008. Since November 10, 2008, we have transferred the quotation of our common stock from the OTC
Bulletin Board to the NASDAQ Global Market under the trading symbol "BVSN".
Principles of Consolidation
The accompanying Consolidated Financial Statements include our and our subsidiaries’ accounts. All significant intercompany accounts and transactions have been eliminated in consolidation.
Use of Estimates
The preparation of Consolidated Financial Statements in conformity with U.S. GAAP requires management to make certain assumptions and estimates that affect reported amounts of assets and liabilities as of the date of the financial statements and the reported amounts of revenues and expenses during the reporting period. On an ongoing basis,
we evaluate the reasonableness of our estimates, including those related to receivable reserves, stock-based compensation, investments, impairment assessments, income taxes and restructuring, as well as contingencies and litigation. We base our estimates on historical experience and on various other assumptions that we believe are reasonable, the results of which form the basis for making judgments about the carrying values of assets and liabilities that are not readily apparent from other sources. Actual results
may differ from these estimates using different assumptions or conditions. We believe the following critical accounting policies reflect the more significant judgments and estimates used in the preparation of our Consolidated Financial Statements.
Revenue Recognition
Overview
Our revenue consists of fees for licenses of our software products, maintenance, consulting services and customer training. We generally charge fees for licenses of our software products either based on the number of persons using the product or based on the number of CPUs on which the product is installed. Licenses for software for
which fees are charged based upon the number of persons using the product include licenses for development use and licenses for use by registered users of the customer's website (deployment use). Licenses for software for which fees are charged on a per-CPU basis differentiate between development and deployment usage. Our revenue recognition policies comply with Accounting Standards Codificationä(“ASC”) 985-605, Software:
Revenue Recognition ("ASC 985-605") and Staff Accounting Bulletin ("SAB") 104, Revenue Recognition ("SAB 104"). We apply the separation criteria in ASC 605-25, Revenue Recognition: Multiple-Element Arrangements ("ASC 605-25"), to determine whether our arrangements with multiple
deliverables should be treated as separate units of accounting. ASC 985-605 indicates that revenue recognized for any multiple-element contract is to be allocated to each element of the arrangement based on the relative fair value of each element. The determination of the fair value of each element is based on our analysis of objective evidence from comparable sales of the individual element.
Revenues for consulting services are generally recognized as the services are performed. If there is a significant uncertainty about the project completion or receipt of payment for the consulting services, revenue is deferred until the uncertainty is sufficiently resolved. For the "fixed" or "not to exceed" fees contracts, revenues are
recognized based on ASC 605-35, Revenue Recognition: Construction-Type and Production-Type Contracts ("ASC 605-35"). We estimate the proportional performance on contracts on a basis of utilizing hours incurred to date as a percentage of total estimated hours to complete the project.
Software License Revenue
We license our products through our direct sales force and indirectly through resellers and Application Service Providers ("ASP"). In general, software license revenues are recognized when a non-cancelable license agreement has been signed and the customer acknowledges an unconditional obligation to pay, the software product has been delivered,
there are no uncertainties surrounding product acceptance, the fees are fixed and determinable and collection is reasonably assured. Delivery is considered to have occurred when title and risk of loss have been transferred to the customer, which generally occurs when media containing the licensed programs is provided to a common carrier. In the case of electronic delivery, delivery occurs when the customer is given access to the licensed programs. For products that cannot be used without a licensing key, the
delivery requirement is met when the licensing key is made available to the customer. If collectability is not reasonably assured, revenue is recognized when the fee is collected. Subscription-based license revenues are recognized ratably over the subscription period. We enter into reseller arrangements that typically provide for sublicense fees payable to us based upon a percentage of list prices. We do not grant resellers the right of return.
We recognize revenue using the residual method pursuant to the requirements of ASC 985-605. Revenues recognized from multiple-element software arrangements are allocated to each element of the arrangement based on the fair values of the elements, such as licenses for software products, maintenance, consulting services or customer training.
The determination of fair value is based on vendor-specific objective evidence, which is specific to us. We limit our assessment of objective evidence for each element to either the price charged when the same element is sold separately or the price established by management having the relevant authority to do so, for an element not yet sold separately. If evidence of fair value of all undelivered elements exists but evidence does not exist for one or more delivered elements, then revenue is recognized using
the residual method. Under the residual method, the fair value of the undelivered elements is deferred and the remaining portion of the arrangement fee is recognized as revenue. We have not yet adopted Accounting Standards Update ("ASU") 2009-13 (an update to ASC 605-25), Revenue Recognition: Multiple-Element Arrangements ("ASU
2009-13"). However, we do not expect the adoption of ASU 2009-13 to have a material impact on our Consolidated Financial Statements.
We record unearned revenue for software license agreements when cash has been received from the customer and the agreement does not qualify for revenue recognition under our revenue recognition policy. We record accounts receivable for software license agreements when the agreement qualifies for revenue recognition but cash or other consideration
has not been received from the customer.
Services Revenue
Consulting services revenues and customer training revenues are recognized as such services are performed.
Maintenance revenues, which include revenues bundled with software license agreements that entitle the customers to technical support and future unspecified enhancements to our products, are deferred and recognized ratably over the related agreement period, generally twelve months.
Our consulting services, which consist of consulting, maintenance and training, are delivered through the BroadVision Global Services ("BVGS") organization. In January 2008, we renamed BVGS to Worldwide E-Business Solution Organization ("WebSo"). In order to support our customers’ expanded needs relating to recently launched
products, WebSo involves more internal departments than did the BVGS organization. The services that we provide are not essential to the functionality of the software. We record reimbursement from our customers for out-of-pocket expenses as an increase to services revenues.
Cash and Cash Equivalents, Restricted Cash, and Short-term Investments
We consider all debt and equity securities with remaining maturities of three months or less at the date of purchase to be cash equivalents. Short-term investments consist of debt and equity securities that have a remaining maturity of less than one year as of the date of the balance sheet. Cash and cash equivalents that serve as collateral
for financial instruments such as letters of credit are classified as restricted cash. Restricted cash in which the underlying instrument has a term of greater than twelve months from the balance sheet date are classified as non-current. At December 31, 2009, a letter of credit of $1.0 million secured by an equal amount of restricted cash is available to the landlord securing certain facilities leases as more fully described in Note 7 – Commitments and Contingencies in the Notes to our Consolidated Financial
Statements.
Management determines the appropriate classification of short-term investments at the time of purchase and evaluates such designation as of each balance sheet date. All short-term investments to date have been classified as held-to-maturity and carried at amortized cost, which approximates fair market value, on our Consolidated Balance
Sheets. Our short-term investments’ contractual maturities occur before November 2010. Total realized gains during fiscal years 2009 and 2008 were $720,000 and $1,628,000, respectively, and are included in other income in the accompanying Consolidated Statements of Operations.
Our cash and cash equivalents, restricted cash, and short-term investments consisted of the following as of December 31, 2009 and 2008 (in thousands):
|
Classified on Consolidated Balance Sheet as: |
||||||||||||||||||||||||||||||||
|
Purchase/
Amortized
Cost |
Gross
Unrealized
Gains |
Gross
Unrealized
Losses |
Aggregate
Fair Value |
Cash and
Cash
Equivalents |
Short-Term
Investment |
Restricted
Cash,
Current |
Restricted
Cash,
Non-Current |
|||||||||||||||||||||||||
|
As of December 31, 2009: |
||||||||||||||||||||||||||||||||
|
Cash and cash equivalents |
$ |
6,690 |
$ |
- |
$ |
- |
$ |
6,690 |
$ |
5,670 |
$ |
- |
$ |
20 |
$ |
1,000 |
||||||||||||||||
|
Money market funds |
15,910 |
- |
- |
15,910 |
15,910 |
- |
- |
- |
||||||||||||||||||||||||
|
Held-to-maturity securities (Short-term Bonds and Certificates of deposit) |
40,209 |
- |
- |
40,209 |
- |
40,209 |
- |
- |
||||||||||||||||||||||||
|
Total |
$ |
62,809 |
$ |
- |
$ |
- |
$ |
62,809 |
$ |
21,580 |
$ |
40,209 |
$ |
20 |
$ |
1,000 |
||||||||||||||||
|
As of December 31, 2008: |
||||||||||||||||||||||||||||||||
|
Cash and cash equivalents |
$ |
16,776 |
$ |
- |
$ |
- |
$ |
16,776 |
$ |
15,756 |
$ |
- |
$ |
20 |
$ |
1,000 |
||||||||||||||||
|
Money market funds |
37,128 |
- |
- |
37,128 |
37,128 |
- |
- |
- |
||||||||||||||||||||||||
|
Held-to-maturity securities (Short-term Bonds and Certificates of deposit) |
9,004 |
- |
- |
9,004 |
- |
9,004 |
- |
- |
||||||||||||||||||||||||
|
Total |
$ |
62,908 |
$ |
- |
$ |
- |
$ |
62,908 |
$ |
52,884 |
$ |
9,004 |
$ |
20 |
$ |
1,000 |
||||||||||||||||
Research and Development and Software Development Costs
ASC 985-20, Cost of Software to be Sold, Leased, or Marketed ("ASC 985-20"), requires capitalization of certain software development costs subsequent to the establishment of technological feasibility. Based on our product development process, technological feasibility is established
upon the completion of a working model. To date, costs incurred by us from the completion of the working model to the point at which the product is ready for general release have been insignificant. Accordingly, we have charged all such costs to research and development expense in the period incurred.
Advertising Costs
Advertising costs are expensed as incurred. Advertising expense, which is included in sales and marketing expense, amounted to $45,000, $76,000 and $146,000 in 2009, 2008 and 2007, respectively.
Prepaid Royalties
Prepaid royalties relating to purchased software to be incorporated and sold with our software products are amortized as a cost of software licenses either on a straight-line basis over the remaining term of the royalty agreement or on the basis of projected product revenues, whichever results in greater amortization.
Receivable Reserves
Occasionally, our customers experience financial difficulty after we record the revenue but before payment has been received. We maintain receivable reserves for estimated losses resulting from the inability of our customers to make required
payments. Our normal payment terms are generally 30 to 90 days from the invoice date. If the financial condition of our customers were to deteriorate, resulting in their inability to make the contractual payments, additional reserves may be required. Losses from customer receivables in the three-year period ended December 31, 2009, have not been significant. If all efforts to collect a receivable fail, and the receivable is considered uncollectible, such receivable would be written off against the receivable
reserve.
Concentrations of Credit Risk
Financial instruments that potentially subject us to concentrations of credit risk consist primarily of cash and cash equivalents, short-term investments, and accounts receivable. We maintain our cash and cash equivalents and short-term investments with high-quality institutions. Our management performs ongoing credit evaluations of our
customers and requires certain of these customers to provide security deposits or letters of credit.
Cash deposits and cash equivalents in foreign countries of approximately $6.1 million and $14.0 million on December 31, 2009 and 2008, respectively, are subject to local banking laws and may bear higher or lower risk than cash deposited in the United States. As part of our cash and investment management processes, we perform periodic evaluations
of the credit standing of the financial institutions and we have not sustained any credit losses from instruments held at these financial institutions. From time to time, our financial instruments maintained in our foreign subsidiaries may be subject to political risks or instability that may arise in foreign countries where we operate.
At December 31, 2009, one customer in the medical device industry accounted for 10% of our accounts receivable balance. As of December 31, 2008, no customer accounted for more than 10% of our accounts receivable balance. For the year ended December 31, 2009, one customer in the retail industry accounted for 10% of our
total revenues. For the years ended December 31, 2008 and 2007, no customer accounted for 10% or more of our total revenues.
Restructuring
Through December 31, 2009, we have approved certain restructuring plans to, among other things, reduce our workforce and consolidate facilities. Restructuring and asset impairment charges were taken to align our cost structure with changing market conditions and to create a more efficient organization. Our restructuring charges are
comprised primarily of: (1) lease termination costs and/or costs associated with permanently vacating and sub-leasing our facilities; (2) other incremental costs incurred as a direct result of the restructuring plan; (3) impairment costs related to certain long-lived assets abandoned, and (4) severance and benefits termination costs related to the reduction of our workforce. We account for each of these costs in accordance with SAB 100, Restructuring
and Impairment Charges.
We account for severance and benefits termination costs in accordance with ASC 420-10, Exit or Disposal Cost Obligations ("ASC 420-10"), for exit or disposal activities initiated on or prior to December 31, 2002. Accordingly, we record the liability related to these termination costs
when the following conditions have been met: (i) management with the appropriate level of authority approves a termination plan that commits us to such plan and establishes the benefits the employees will receive upon termination; (ii) the benefit arrangement is communicated to the employees in sufficient detail to enable the employees to determine the termination benefits; (iii) the plan specifically identifies the number of employees to be terminated, their locations and their job classifications;
and (iv) the period of time to implement the plan does not indicate changes to the plan are likely. The termination costs recorded by us are not associated with nor do they benefit continuing activities. ASC 420-10 requires that a liability for a cost associated with an exit or disposal activity for severance and benefits termination costs initiated after December 31, 2002 be recognized and measured initially at fair value only when the liability is incurred.
We record the costs associated with lease termination and/or abandonment when the leased property has no substantive future use or benefit to us. We record the liability associated with lease termination and/or abandonment as the sum of the total remaining lease costs and related exit costs, less probable sublease income. Under ASC 420-10,
we record a liability for lease termination and/or abandonment cost initially at fair value on the cease-use date of that facility. We account for costs related to long-lived assets abandoned by expensing the net carrying value of the long-lived assets when we cease to use the assets.
Inherent in the estimation of the costs related to our restructuring efforts are assessments related to the most likely expected outcome of the significant actions to accomplish the restructuring. In determining the charge related to the restructuring, the majority of estimates made by management related to the charge for excess
facilities. In determining the charge for excess facilities, we were required to estimate future sublease income, future net operating expenses of the facilities, and brokerage commissions, among other expenses. The most significant of these estimates related to the timing and extent of future sublease income that may reduce our lease obligations. We based our estimates of sublease income, in part, on the opinions of independent real estate experts, current market conditions and rental rates, an assessment of
the time period over which reasonable estimates could be made, the status of negotiations with potential subtenants, and the location of the respective facility, among other factors.
We have recorded restructuring charges at the low-end of a range of assumptions modeled for restructuring charges. Adjustments to the facilities accrual will be required if actual lease exit costs or sublease income differ from amounts currently expected. We will review the status
of restructuring activities on a quarterly basis and, if appropriate, record changes to our restructuring obligations in current operations based on management's most current estimates.
Property and Equipment
Property and equipment are stated at cost and depreciated on a straight-line basis over their estimated useful lives (generally two years for software, three years for computer equipment and four years for furniture and fixtures). Leasehold improvements are amortized over the lesser of the remaining life of the lease term or their estimated
useful lives.
Maintenance and repairs are charged to operations as incurred. When assets are retired or otherwise disposed of, the cost and accumulated depreciation and amortization are removed from the accounts and any resulting gain or loss is reflected in operations in the period realized.
Valuation of Long-Lived Assets
We adopted ASC 350-20, Intangibles - Goodwill and Other ("ASC 350-20"), on January 1, 2002. We are required to test our goodwill for impairment annually or more often if events or changes in circumstances indicate that our goodwill might be impaired. ASC 350-20 provides for
a two-step approach in determining whether, and by how much, goodwill has been impaired. The first step requires a comparison of our fair value to our net book value. If the fair value is greater, then no impairment is deemed to have occurred. If the fair value is less, then the second step must be completed to determine the amount, if any, of actual impairment. See Note 3 – Goodwill in the Notes to our Consolidated Financial Statements.
During the fourth quarter ended December 31, 2008, we recognized a goodwill impairment charge of $25.1 million, which represented a full write-off of our remaining goodwill balance in accordance with the requirements of ASC 350-20. As of December 31, 2008, we performed Step 1 under the provisions of ASC 350-20 by determining
that we have a single reporting unit and then comparing our net book value to our market capitalization based upon the quoted market price of our stock. Based upon the results of Step 1, which showed impairment indicators of our goodwill balance, we completed Step 2 and recognized an impairment charge of $25.1 million in the quarter ended December 31, 2008. There were no goodwill or identifiable intangible assets in the year ended December 31, 2009.
The impairment charge was recorded in 2008 as a component of operating expenses in our Consolidated Statements of Operations and was determined by comparing the implied fair value of the goodwill, with its carrying amount on the balance sheet. The decline in our fair value is attributed to continued competition and a decline in the revenues
of current generation products due to weaker market conditions and the ongoing transition to next-generation software platforms. In addition, our stock price has been affected by the general deterioration in the capital markets caused by the financial crisis in year 2008. Our fair value was determined using a weighted average of a discounted cash flows method as well as a market valuation method.
Fair Value of Financial Instruments
Effective January 1, 2008, we adopted the provisions of ASC 820-10, Fair Value Measurement ("ASC 820-10 "). ASC
820-10 establishes a framework for measuring fair value and requires disclosures about fair value measurements by establishing a hierarchy that prioritizes the inputs to valuation techniques used to measure fair value. The hierarchy gives the highest priority to unadjusted quoted prices in active markets for identical assets or liabilities (Level 1 measurements) and lowest priority to unobservable inputs (Level 3 measurements). The three levels of the fair value hierarchy are described below:
|
· |
Level 1 – Quoted prices in active markets for identical assets or liabilities. |
|
· |
Level 2 – Inputs other than Level 1 that are observable, either directly or indirectly, such as quoted prices for similar assets or liabilities; quoted prices in markets that are not active; or other inputs that are observable or can be corroborated by observable market data for substantially the full term of the assets or liabilities. |
|
· |
Level 3 — Unobservable inputs that are supported by little or no market activity and that are significant to the fair value of the assets or liabilities. |
We measure the following financial assets at fair value on a recurring basis. The fair value of these financial assets as of December 31, 2009 (in thousands) were as follows:
|
Fair Value measurements at Reporting Date Using |
||||||||||||||||||||
|
Balance at December 31, 2009 |
Quoted Prices in Active Markets for Identical Assets (Level 1) |
Significant Other Observable Inputs (Level 2) |
Significant Unobservable Input (Level 3) |
Total Gains (Losses) |
||||||||||||||||
|
Cash and cash equivalents (1) |
$ |
21,580 |
$ |
21,580 |
$ |
- |
$ |
- |
$ |
- |
||||||||||
|
Short-term investments (2) |
40,209 |
12,843 |
27,366 |
- |
- |
|||||||||||||||
|
Total |
$ |
61,789 |
$ |
34,423 |
$ |
27,366 |
$ |
- |
$ |
- |
||||||||||
(1) Includes money market funds.
(2) Includes held-to-maturity bonds and certificates of deposit.
The fair value of cash and cash equivalents, short-term investments, accounts receivable and accounts payable for all periods presented approximates their respective carrying amounts due to the short-term nature of these balances.
Employee Benefit Plans
Amended and Restated 2006 Equity Incentive Plan: At our 2006 annual meeting held on August 8, 2006, our stockholders approved the adoption of our 2006 Equity Incentive Plan (the "Equity Plan"). At that time, our 1996 Equity Incentive Plan (the "Prior Equity
Plan") was terminated and replaced by the Equity Plan. On January 21, 2009, our Board of Directors adopted the Amended and Restated BroadVision, Inc. 2006 Equity Incentive Plan (the " “Amended and Restated Plan"), which was subsequently approved by our stockholders on April 30, 2009. The Amended and Restated Plan includes an "evergreen" provision that provides for automatic annual increases
in the number of shares authorized for issuance. As of December 31, 2009, we had 434,807 shares of our Common Stock reserved for issuance under the plan. In addition, the number of shares of our Common Stock available for issuance under the Plan will automatically increase on January 1st of each year for a period of ten (10) years, commencing on January 1, 2010 and ending on (and including) January 1, 2019. Further, our Board of Directors may grant incentive or nonqualified stock options
at prices not less than 100% of the fair market value of our common stock, as determined by the Board of Directors, at the date of grant. The vesting of individual options may vary but in each case at least 20% of the total number of shares subject to vesting will become exercisable per year. These options generally expire ten years after the grant date. When an employee option is exercised prior to vesting, any unvested shares so purchased are subject to repurchase by us at the original purchase price of the
stock upon termination of employment. Our right to repurchase lapses at a minimum rate of 20% per year over five years from the date the option was granted or, for new employees, the date of hire. Such right is exercisable only within 90 days following termination of employment. During the years ended December 31, 2009, 2008, and 2007, no shares were repurchased since no options were exercised prior to vesting.
2000 Non-Officer Plan: In February 2000, we adopted our 2000 Non-Officer Plan under which 106,666 shares of common stock were reserved for issuance to selected employees, consultants, and our affiliates who are not Officers or Directors. As of December 31, 2009, we had 45,290 shares
available for issuance under the 2000 Non-Officer Plan. Under the 2000 Non-Officer Plan, we may grant non-statutory stock options at prices not less than 85% of the fair market value of our common stock at the date of grant. Options granted under the 2000 Non-Officer Plan generally vest over two years and are exercisable for not more than ten years.
Employee Stock Purchase Plan: We also have a compensatory Employee Stock Purchase Plan (the "Purchase Plan") that enables employees to
purchase, through payroll deductions, shares of our common stock at a discount from the market price of the stock at the time of purchase. The Board of Directors has authorized sequential one-year offerings beginning on July 1 of each year and extending until June 30 of the following year. Commencing on the first day of the fiscal year that begins on January 1, 2004 and ending on (and including) the first day of the fiscal year that begins on January 1, 2014 (each such day, a "Calculation Date"), our
Purchase Plan's reserved shares can be increased by a number equal to the lesser of (i) one and one-half percent (1.5%) of the shares of Common Stock outstanding on each such Calculation Date (rounded down to the nearest whole share); or (ii) thirty two thousand (32,000) shares of Common Stock.
As of December 31, 2009, we had 57,227 shares available for issuance under the Purchase Plan. The Purchase Plan permits eligible employees to purchase common stock with a value equivalent to a percentage of the employee's earnings, not to exceed the lesser of 15% of the employee's earnings or $25,000, at a price equal to the lesser of
85% of the fair market value of the common stock on the date of the offering or the date of purchase. Upon adoption of ASC 718-10, Compensation – Stock Compensation ("ASC 718-10"), we began recording stock-based compensation expense related to the fair value of the employee purchase rights in our Consolidated Statements of Operations. During 2009 and 2008, we received a total of $537,000 and $657,000, respectively, primarily from the purchase
of shares under the Purchase Plan.
Stock-Based Compensation
Effective January 1, 2006, we adopted the fair value recognition provisions of ASC 718-10, using the modified-prospective transition method. Under the fair value recognition provisions of ASC 718-10, share-based compensation cost is estimated at the grant date based on the fair value of the award and is recognized as expense,
net of estimated pre-vesting forfeitures, ratably over the vesting period of the award. In addition, the adoption of ASC 718-10 requires additional accounting related to the income tax effects and disclosure regarding the cash flow effects resulting from share-based payment arrangements. Calculating share-based compensation expense requires the input of highly subjective assumptions, including the expected term of the share-based awards, stock price volatility, dividend yield, risk free interest rates, and pre-vesting
forfeitures. The assumptions used in calculating the fair value of stock-based awards represent our best estimates, but these estimates involve inherent uncertainties and the application of management judgment. As a result, if factors change and we use different assumptions, our share-based compensation expense could be materially different in the future. In addition, we are required to estimate the expected pre-vesting forfeiture rate and only recognize expense for those shares expected to vest. If our actual
forfeiture rate is materially different from our estimate, our share-based compensation expense could be significantly different from what we have recorded in the current period. The total amount of stock-based compensation expense recognized during the years ended December 31, 2009, 2008 and 2007 are as follows:
|
Years Ended December 31, |
||||||||||||
|
2009 |
2008 |
2007 |
||||||||||
|
Cost of services |
$ |
115,693 |
$ |
163,681 |
$ |
266,735 |
||||||
|
Research and development |
411,236 |
311,564 |
567,041 |
|||||||||
|
Sales and marketing |
245,143 |
309,323 |
319,145 |
|||||||||
|
General and administrative |
343,837 |
345,095 |
294,166 |
|||||||||
|
$ |
1,115,909 |
$ |
1,129,663 |
$ |
1,447,087 |
|||||||
For our reverse stock split effected in October 2008, we were not required to recognize any incremental compensation cost for this equity restructuring. Based on ASC 718-10, if an award is adjusted based on an existing antidilution provision that requires adjustment in the event of an equity restructuring, and is properly structured
to preserve the value of the awards upon completion of the equity restructuring, incremental fair value generally should not result from the modification.
We adopted the alternative transition method for calculating the tax effects of stock-based compensation pursuant to ASC 718-10 in the fourth quarter of fiscal 2006. The alternative transition method includes simplified methods to establish the beginning balance of the additional paid-in capital pool ("APIC
pool") related to the tax effects of employee stock-based compensation, and to determine the subsequent impact on the APIC pool and Consolidated Statements of Cash Flows of the tax effects of employee stock-based compensation awards that are outstanding upon adoption of ASC 718-10. The adoption did not have a material impact on our Consolidated Financial Statements.
The fair value of each option award is estimated on the date of grant using the Black-Scholes option valuation model based on assumptions noted in the following table below. The expected term of our options represents the period that our stock-based awards are expected to be outstanding based on the simplified method provided for in SAB
107, as amended by SAB No. 110, Share-Based Payment. Because we do not have sufficient historical exercise data, we used the simplified method for estimating the stock option expected term. The risk-free interest rate for periods related to the expected life of the options is based on the U.S. Treasury yield curve in effect at the time of grant. The expected volatility
is based on historical volatilities of our stock over the expected life of the option. The expected dividend yield is zero, as we do not anticipate paying dividends in the near future. During the years ended December 31, 2009, 2008 and 2007, we used forfeiture rates of 20%, 12% and 9%, respectively, based on an analysis of historical data as we reasonably approximate the currently anticipated rate of forfeiture for granted and outstanding options that have not vested.
The following assumptions were used to determine stock-based compensation during the years ended December 31, 2009, 2008 and 2007:
|
Years Ended December 31, |
||||||||||||
|
2009 |
2008 |
2007 |
||||||||||
|
Weighted average expected volatility |
83 |
% |
90 |
% |
96 |
% | ||||||
|
Expected dividends |
- |
% |
- |
% |
- |
% | ||||||
|
Expected term (in years) |
6.25 |
year |
6.00 |
year |
6.00 |
year | ||||||
|
Risk free interest rate |
2 |
% |
3 |
% |
4 |
% | ||||||
|
Forfeiture rate |
20 |
% |
12 |
% |
9 |
% | ||||||
The following assumptions were used to determine the expense related to the Employee Stock Purchase Plan:
|
Years Ended December 31, | ||||||||||||
|
2009 |
2008 |
2007 |
||||||||||
|
Expected volatility |
52 |
% |
81 |
% |
90 |
% | ||||||
|
Weighted average volatility |
81 |
% |
67 |
% |
89 |
% | ||||||
|
Risk-free interest rate |
0.2 |
% |
2 |
% |
5 |
% | ||||||
|
Expected term (in years) |
1 |
year |
1 |
year |
1 |
year | ||||||
|
Expected dividend yield |
- |
% |
- |
% |
- |
% | ||||||
The weighted-average fair value of the purchase rights granted in the years ended December 31, 2009, 2008, and 2007, was $4.29, $8.81, and $19.44, respectively.
In anticipation of the reporting requirements under ASC 718-10, our Board of Directors on November 29, 2005 unanimously approved accelerating the vesting of the following out-of-the-money, unvested stock options held by current employees, including executive officers, and members of the Board of Directors. The acceleration applied
only to those options with an exercise price of $28.25 per share or higher. The closing market price of our common stock on November 28, 2005, the last full trading day before the date of the acceleration, was $18.00 per share.
|
Aggregate |
|||||
|
Number of |
|||||
|
Common Shares |
|||||
|
Issuable Under |
Weighted Average |
||||
|
Accelerated Stock |
Exercise Price |
||||
|
Options |
per Share |
||||
|
Total Non-Employee Directors |
4,887 |
$ |
74.50 |
||
|
Total Named Executive Officers |
15,675 |
71.75 |
|||
|
Total Directors and Named Executive Officers |
20,562 |
72.25 |
|||
|
Total All Other Employees |
24,428 |
74.25 |
|||
|
Total |
44,990 |
73.50 |
|||
The decision to accelerate vesting of these options was made to avoid recognizing compensation cost in our statements of operations as required under the provisions of ASC 718-10, which was effective as of January 1, 2006.
Earnings Per Share Information
We effected a one-for-twenty-five reverse stock split of our common stock, effective October 24, 2008. Our common stock began trading on a post-split basis at the opening of trading on October 27, 2008. The accompanying Consolidated Financial Statements and related financial information contained herein for all periods
presented have been retroactively restated to give effect to the stock split in accordance with U.S. GAAP.
Basic income (loss) per share is computed using the weighted-average number of shares of common stock outstanding, less shares subject to repurchase. Diluted income (loss) per share is computed using the weighted-average number of shares of common stock outstanding and, when dilutive, common equivalent shares from outstanding stock options
and warrants using the treasury stock method. The following table sets forth the basic and diluted net income (loss) per share computational data for the periods presented (in thousands, except per share amounts):
|
Years Ended December 31, |
||||||||||||
|
2009 |
2008 |
2007 |
||||||||||
|
Net income (loss) |
$ |
3,734 |
$ |
(15,010 |
) |
$ |
17,278 |
|||||
|
Weighted-average common shares outstanding used to compute basic income (loss) per share |
4,406 |
4,374 |
4,310 |
|||||||||
|
Weighted-average common equivalent shares from outstanding common stock options and warrants |
1 |
- |
120 |
|||||||||
|
Total weighted-average common and common equivalent shares outstanding used to compute diluted income (loss) per share |
4,407 |
4,374 |
4,430 |
|||||||||
|
Basic income (loss) per share |
$ |
0.85 |
$ |
(3.43 |
) |
$ |
4.01 |
|||||
|
Diluted income (loss) per share |
$ |
0.85 |
$ |
(3.43 |
) |
$ |
3.90 |
|||||
In the years ended December 31, 2009, 2008, and 2007, there were 596,128, 467,125, and 180,097 common shares, respectively, issuable upon the exercise of stock options and warrants excluded from the above earnings per share calculations as their effect was anti-dilutive.
Foreign Currency Transactions
During fiscal 2004, we changed the functional currencies of all foreign subsidiaries from the U.S. dollar to the local currency of the respective countries. Assets and liabilities of these subsidiaries are translated into U.S. dollars at the balance sheet date. Income and expense items are translated at average exchange rates for the period.
Foreign exchange gains and losses resulting from the remeasurement of foreign currency assets and liabilities are included as other income (expense) in the Consolidated Statements of Operations. During 2009, three of our foreign subsidiaries' operations had substantially ceased and were effectively liquidated. During 2008, one of our foreign subsidiaries' operations was also liquidated. As a result, we wrote off $175,000 and ($87,000) in year 2009 and 2008, respectively, of related cumulative translation
adjustments which were recorded as incomes (charges) to other income, net in the accompanying Consolidated Statements of Operations. For the years ended December 31, 2009, 2008, and 2007, translation (loss) gain was ($712,000), ($499,000), and ($152,000), respectively, and is included in the Comprehensive income (loss) account in the Consolidated Statements of Stockholder's Equity.
Comprehensive Income (Loss)
Comprehensive income (loss) includes net income (loss) and other comprehensive income (loss), which may consist of unrealized gains and losses on available-for-sale securities and cumulative translation adjustments. Total comprehensive income (loss) is presented in the accompanying Consolidated Statement of Stockholders' Equity (Deficit).
Total accumulated other comprehensive income (loss) is displayed as a separate component of Consolidated Statement of Stockholder's Equity (Deficit) in the accompanying Consolidated Balance Sheets. The accumulated balance of other comprehensive income (loss), consisting primarily of foreign currency translation, net of taxes is as follows (in thousands):
|
Accumulated
Other
Comprehensive
Income (Loss) |
||||
|
Balance, December 31, 2006 |
$ |
168 |
||
|
Net change during the year |
(152 |
) | ||
|
Balance, December 31, 2007 |
16 |
|||
|
Net change during the year |
(499 |
) | ||
|
Balance, December 31, 2008 |
(483 |
) | ||
|
Net change during the year |
(712 |
) | ||
|
Balance, December 31, 2009 |
$ |
(1,195 |
) | |
Income Taxes and Deferred Tax Assets
Income taxes are computed using an asset and liability approach in accordance with ASC 740-10, Income Taxes ("ASC 740-10"), which requires the recognition of taxes payable or refundable for the current year and deferred tax assets and liabilities for the future tax consequences of events that have been recognized in our Consolidated Financial Statements or tax returns. The measurement of current and deferred tax assets and liabilities is based on provisions of the enacted tax law; the effects of future changes in tax laws or rates are not anticipated. The measurement of deferred tax assets is reduced, if necessary, by the amount of any tax benefits that, based on available evidence, is not expected to be realized.
We analyze our deferred tax assets with regard to potential realization. We have established a valuation allowance on our deferred tax assets to the extent that management has determined that it is more likely than not that some portion or all of the deferred tax asset will not be realized based upon the uncertainty of their realization.
We consider the effects of estimated future taxable income, current economic conditions and ongoing prudent and feasible tax planning strategies in assessing the amount of the valuation allowance.
Segment and Geographic Information
We operate in one segment, electronic commerce business solutions. Our chief operating decision maker is considered to be our Chief Executive Officer ("CEO"). The CEO reviews financial information presented on a consolidated basis accompanied by disaggregated information about revenues by geographic region and by product for purposes of
making operating decisions and assessing financial performance.
Recent Accounting Pronouncements
In October 2009, the FASB issued ASU 2009-13 (an update to ASC 605-25), Revenue Recognition: Multiple-Element Arrangements ("ASU 2009-13") which is effective
for annual periods beginning on or after June 15, 2010; however, early adoption is permitted. In arrangements with multiple deliverables, ASU 2009-13 permits entities to use management’s best estimate of selling price to value individual deliverables when those deliverables have never been sold separately or when third-party evidence is not available. In addition, any discounts provided in multiple element arrangements will be allocated on the basis of the relative selling price of each deliverable.
We are currently evaluating the impact of adopting the provisions of ASU 2009-13 in our Consolidated Financial Statements.
In June 2009, the FASB issued the FASB Accounting Standards Codificationä (the "Codification ") which was effective for us in the third
quarter ended September 30, 2009. The Codification became the single authoritative source for U.S. GAAP. Accordingly, we no longer use previous references to U.S. GAAP in our disclosures included in these Notes to our Consolidated Financial Statements. The Codification did not have a significant impact on the reporting of our Consolidated Financial Statements.
In May 2009, the FASB issued ASC 855-10, Subsequent Events ("ASC 855-10"). ASC 855-10 establishes accounting principles and requirements for subsequent
events. We adopted this standard effective as of June 30, 2009.
In April 2009, we adopted ASC 820-10, Fair Value Measurements and Disclosures ("ASC 820-10"), and ASC 825, Financial Instruments ("ASC 825-10").
We also adopted ASC 320-10, Investment – Debt and Equity Securities ("ASC 320-10"), which provides guidance on determining other-than-temporary impairments for debt securities. These adoptions did not have a material impact on our Consolidated Financial Statements.
Note 2---Property and Equipment
|
December 31, |
||||||||
|
2009 |
2008 |
|||||||
|
Furniture and fixtures |
$ |
548 |
$ |
522 |
||||
|
Computer and software |
3,956 |
4,996 |
||||||
|
Leasehold improvements |
1,275 |
1,277 |
||||||
|
5,779 |
6,795 |
|||||||
|
Less accumulated depreciation and amortization |
(5,395 |
) |
(6,281 |
) | ||||
|
Total property and equipment, net |
$ |
384 |
$ |
514 |
||||
Depreciation and amortization expense for the years ended December 31, 2009, 2008, and 2007 was $0.2 million, $0.4 million, and $1.0 million, respectively. In 2009, we retired $1.1 million in property and equipment and wrote off $1.1 million in related accumulated depreciation. In 2008, we retired $495,000 in property and equipment and wrote off $495,000 in related accumulated depreciation. In 2007, we retired $13.6 million in property and equipment and wrote off $13.6 million in related accumulated depreciation. In 2007, we received $82,000 in proceeds from the sale of fixed assets and recorded a gain on sale or abandonment of property and equipment of $78,000.
Note 3---Goodwill
Goodwill is tested for impairment in the event of an impairment indicator or, in the absence of any impairment indicators, at least annually. In the quarter ended December 31, 2008, we recognized a goodwill impairment charge of $25.1 million, which represented a full write-off of our remaining goodwill
balance in accordance with the requirements ASC 350-20. As of December 31, 2008, we performed Step 1 under the provisions of ASC 350-20 by determining that we have a single reporting unit and then comparing our net book value to our market capitalization based upon the quoted market price of our stock. Based upon the results of Step 1, which showed impairment indicators of our goodwill balance, we completed Step 2 and recognized an impairment charge of $25.1 million in the quarter ended December 31,
2008.
The impairment charge was recorded as a component of operating expenses in our Consolidated Statements of Operations and was determined by comparing the implied fair value of the goodwill with its carrying amount on the balance sheet. The decline in our fair value is attributed to continued competition and a decline in the revenues
of current generation products due to weaker market conditions and the ongoing transition to next-generation software platforms. In addition, our stock price has been affected by the general deterioration in the capital markets caused by the year 2008 financial crisis. Our fair value was determined using a weighted average of a discounted cash flows method as well as a market valuation method.
The process of evaluating the potential impairment of goodwill is highly subjective and requires significant judgment. In estimating the fair value, we made estimates and judgments about future revenues and cash flows. Our forecasts were based on assumptions that are consistent with the plans and estimates we are using to manage the
business.
From 2000 through 2008, we have amortized and written off the entire $767.0 million goodwill incurred as a result of a statutory merger involving a stock-for-stock exchange with another company. There were no goodwill or
identifiable intangible assets in the year ended December 31, 2009.
Note 4---Accrued Expenses
Accrued expenses consisted of the following (in thousands):
|
December 31, |
||||||||
|
2009 |
2008 |
|||||||
|
Employee benefits |
$ |
1,033 |
$ |
1,041 |
||||
|
Commissions and bonuses |
975 |
667 |
||||||
|
Sales and other taxes |
743 |
792 |
||||||
|
Income tax and tax contingency reserves |
75 |
301 |
||||||
|
Restructuring |
244 |
426 |
||||||
|
Customer advances |
81 |
283 |
||||||
|
Royalty |
1,086 |
1,376 |
||||||
|
Other |
590 |
529 |
||||||
|
Total accrued expenses |
$ |
4,827 |
$ |
5,415 |
||||
Note 5---Other Non-Current Liabilities
Other non-current liabilities consist of the following (in thousands):
|
December 31, |
||||||||
|
2009 |
2008 |
|||||||
|
Restructuring |
$ |
155 |
$ |
419 |
||||
|
Deferred maintenance and unearned revenue |
1,444 |
1,326 |
||||||
|
Other |
754 |
684 |
||||||
|
Total other non-current liabilities |
$ |
2,353 |
$ |
2,429 |
||||
Note 6---Income Taxes
Pretax income (loss) is as follows (in thousands):
|
Years Ended December 31, |
||||||||||||
|
2009 |
2008 |
2007 |
||||||||||
|
Domestic |
$ |
(8,389 |
) |
$ |
(13,000 |
) |
$ |
17,690 |
||||
|
Foreign |
|
12,096 |
|
(1,490 |
) |
|
(485) |
|||||
|
Income before tax benefit (expense) |
$ |
3,707 |
$ |
(14,490 |
) |
$ |
17,205 |
|||||
The components of benefit (expense) for income taxes are as follows (in thousands):
|
Years Ended December 31, |
||||||||||||
|
2009 |
2008 |
2007 |
||||||||||
|
Current: |
||||||||||||
|
Federal |
$ |
23 |
$ |
(30 |
) |
$ |
440 |
|||||
|
State |
201 |
(94 |
) |
(61 |
) | |||||||
|
Foreign |
(197 |
) |
(396 |
) |
(306 |
) | ||||||
|
Total current |
27 |
(520 |
) |
73 |
||||||||
|
Deferred: |
||||||||||||
|
Federal |
- |
- |
- |
|||||||||
|
State |
- |
- |
- |
|||||||||
|
Total deferred |
- |
- |
- |
|||||||||
|
Income tax benefit (expense) |
$ |
27 |
$ |
(520 |
) |
$ |
73 |
|||||
The differences between the benefit (expense) for income taxes computed at the federal statutory rate of 35% and our actual income tax benefit (expense) for the periods presented are as follows (in thousands):
|
Years Ended December 31, |
||||||||||||
|
2009 |
2008 |
2007 |
||||||||||
|
Expected income tax (expense) benefit |
$ |
(1,304 |
) |
$ |
5,072 |
$ |
(6,022 |
) | ||||
|
Expected state income taxes benefit (expense), net of federal tax benefit |
157 |
(95 |
) |
(39 |
) | |||||||
|
Research and development credit |
129 |
172 |
89 |
|||||||||
|
Foreign taxes and foreign loss not benefited |
4,037 |
(848 |
) |
(894 |
) | |||||||
|
Change in valuation allowance |
3,567 |
1,390 |
7,116 |
|||||||||
|
Stock based compensation and warrants revaluation |
(26 |
) |
1,526 |
(1,039 |
) | |||||||
|
True-ups |
(938 |
) |
883 |
261 |
||||||||
|
Goodwill impairment |
- |
(8,773 |
) |
- |
||||||||
|
Unrecognized tax benefits |
(894 |
) |
(120 |
) |
424 |
|||||||
|
Tax credits and other permanent items |
(376 |
) |
67 |
199 |
||||||||
|
Expired federal capital loss carryover |
(2,405 |
) |
- |
- |
||||||||
|
Disallowed loss from foreign investment |
(1,883 |
) |
- |
- |
||||||||
|
Others |
(37 |
) |
206 |
(22 |
) | |||||||
|
Income tax benefit (expense) |
$ |
27 |
$ |
(520 |
) |
$ |
73 |
|||||
The individual components of our deferred tax assets are as follows (in thousands):
|
December 31, |
||||||||
|
2009 |
2008 |
|||||||
|
Deferred tax assets: |
||||||||
|
Depreciation and amortization |
$ |
1,613 |
$ |
1,768 |
||||
|
Accrued, allowance and others |
8,059 |
8,754 |
||||||
|
Capitalized research and development |
637 |
808 |
||||||
|
Net operating losses |
204,430 |
202,773 |
||||||
|
Tax credits |
7,017 |
7,510 |
||||||
|
Unrealized loss on marketable securities |
1,500 |
1,482 |
||||||
|
Total deferred tax assets |
223,256 |
223,095 |
||||||
|
Less: valuation allowance |
(223,256 |
) |
(223,095 |
) | ||||
|
Net deferred tax assets |
$ |
- |
$ |
- |
||||
We have provided a valuation allowance for all of our deferred tax assets as of December 31, 2009 and 2008, due to the uncertainty regarding their future realization. The total valuation allowance increased $161,000 from December 31, 2008 to December 31, 2009. The total valuation allowance increased $1,558,000
from December 31, 2007 to December 31, 2008.
As of December 31, 2009, we had federal and state net operating loss ("NOL") carryforwards of approximately $540,031,000 and $159,139,000, net of Section 382 of the Internal Revenue Code ("IRC") limitations respectively, available to offset future regular and alternative minimum taxable income. The NOLs include deductions for stock
based compensation for which a benefit would be recorded in additional paid-in capital when realized of $1,799,000 and $1,447,000 respectively. Our federal net operating loss carryforwards expire in various years from 2016 through 2025, if not used. The state net operating loss carryforwards expire in various years from 2014 to 2017, if not used.
In addition, we had federal and state research and development credit carryforwards of approximately $5,774,000 and $4,294,000 as of December 31, 2009, respectively, available to offset future tax liabilities. We had federal and state research and development credit carryforwards of approximately $5,570,000 and $3,970,000 as
of December 31, 2008, respectively, available to offset future tax liabilities. The federal tax credit carryforwards expire in the tax years 2010 through 2030, if not utilized. The state research and development credits can be carried forward indefinitely.
Federal and state tax laws impose substantial restrictions on the utilization of net operating loss (“NOL”) and credit carryforwards in the event of an "ownership change" for tax purposes, as defined in IRC Section 382. Based on an IRC Section 382 study completed in February 2007, we determined that there were ownership changes
during the year 1998. Consequently, a portion of our tax carryforwards will expire before they can be fully utilized. Therefore, in 2007, we reduced our reported available federal NOL carryforwards by approximately $5.3 million. Based on an updated study completed in January 2009, we determined that there were no additional ownership changes through December 2008. We performed an ownership change analysis for 2009 and concluded that there were no additional ownership changes during 2009.
Effective January 1, 2007, we adopted ASC 740-10-25, Income Taxes: Recognition ("ASC 740-10-25"). The cumulative effect of adopting ASC 740-10-25 was recognized as a change in accounting principle, recorded as an adjustment to the opening balance of retained earnings
on the adoption date.
Our total amount of unrecognized tax benefits as of December 31, 2008 and December 31, 2009 were $2,237,000 and $2,421,000, respectively. The total amount of unrecognized tax benefits that, if recognized, would affect its effective tax rate were $329,000 and $273,000 as of December 31, 2008 and 2009, respectively.
A reconciliation of the beginning and ending balances of the total amounts of unrecognized tax benefits for the year ended December 31, 2009 is as follows:
|
Balance at January 1, 2009 |
$ |
2,237,000 |
||
|
Additions based on tax positions related to the current year |
201,000 |
|||
|
Additions for tax positions of prior years |
152,000 |
|||
|
Reduction for tax positions of prior years |
(169,000 |
) | ||
|
Balance at December 31, 2009 |
$ |
2,421,000 |
We recognize interest and penalties accrued related to unrecognized tax benefits in our provision for income taxes. During the years ended December 31, 2009 and 2008, we recognized approximately $17,000 and $0, respectively, for interest and penalties.
We are subject to taxation in the United States and various foreign jurisdictions. Our tax years 1996 to 2009 remain open in several jurisdictions due to the NOL carryover from those tax years. In January 2009, the Italian tax authority commenced an income tax audit for the 2006 tax year. We concluded that it is not
more likely than not that our tax position will be sustainable and therefore recorded a tax reserve of $113,000.
It is possible that the amount of our liability for unrecognized tax benefits may change within the next 12 months. However, an estimate of the range of possible changes cannot be made at this time. In addition, over the next twelve months, our existing tax positions will continue to generate an increase in liabilities
for unrecognized tax benefits.
Note 7 - Commitments and Contigencies
Warranties and Indemnification
We provide a warranty to our customers that our software will perform substantially in accordance with the documentation we provide with the software, typically for a period of 90 days following receipt of the software. Historically, costs related to these warranties have been immaterial. Accordingly, we have not recorded any warranty
liabilities as of December 31, 2009 and 2008, respectively.
Our software license agreements typically provide for indemnification of customers for intellectual property infringement claims caused by use of a current release of our software consistent with the terms of the license agreement. The term of these indemnification clauses is generally perpetual. The potential future payments we could
be required to make under these indemnification clauses is generally limited to the amount the customer paid for the software. Historically, costs related to these indemnification provisions have been immaterial. We also maintain liability insurance that limits our exposure. As a result, we believe the potential liability of these indemnification clauses is minimal. Accordingly, we have not recorded any liabilities for these agreements as of December 31, 2009 and 2008, respectively.
We entered into agreements whereby we indemnify our officers and directors for certain events or occurrences while the officer is, or was, serving in such capacity. The term of the indemnification period is for so long as such officer or director is subject to an indemnifiable event by reason of the fact that such person was serving
in such capacity. The maximum potential amount of future payments we could be required to make under these indemnification agreements may be unlimited; however, we have a director and officer insurance policy that limits our exposure and enables us to recover a portion of any future amounts paid. As a result of our insurance policy coverage, we believe the estimated fair value of these indemnification agreements is insignificant. Accordingly, we have no liabilities recorded for these agreements as of either December
31, 2009 or December 31, 2008. We assess the need for an indemnification reserve on a quarterly basis and there can be no guarantee that an indemnification reserve will not become necessary in the future.
Leases
We lease our headquarters facility and our other facilities under noncancelable operating lease agreements expiring through the year 2014. Under the terms of the agreements, we are required to pay property taxes, insurance and normal maintenance costs.
A summary of total future minimum lease payments under noncancelable operating lease agreements is as follows (in millions):
|
Operating
Leases |
|||||
|
Years Ending December 31, |
|||||
|
2010 |
$ |
1.8 |
|||
|
2011 |
1.3 |
||||
|
2012 |
0.7 |
||||
|
2013 |
0.1 |
||||
|
2014 |
0.1 |
||||
|
Total minimum lease payments |
$ |
4.0 |
|||
These future minimum lease payments exclude approximately $74,000 of sublease income to be received under non-cancelable sublease agreements. As of December 31, 2009, we have accrued $0.4 million of estimated future facilities costs as a restructuring accrual.
Rent expense for the years ended December 31, 2009, 2008 and 2007 was $1,606,000, $1,605,000, and $1,598,000, respectively.
Standby Letter of Credit Commitments
Commitments totaling $1.0 million as of December 31, 2009, and as of December 31, 2008, in the form of standby letters of credit, were issued on our behalf from financial institutions, in favor of our various landlords to secure obligations under our facility leases.
Legal Proceedings
We are subject from time to time to various legal actions and other claims arising in the ordinary course of business. We are not presently a party to any material legal proceedings.
Note 8---Restructuring
The following table summarizes the restructuring accrual activity recorded during the three-years ended December 31, 2009 (in thousands):
|
Severance
and
Benefits |
Facilities/
Excess
Assets |
Total |
||||||||||
|
Accrual balances, December 31, 2006 |
$ |
347 |
$ |
2,215 |
$ |
2,562 |
||||||
|
Restructuring (credits) charges |
(347 |
) |
996 |
649 |
||||||||
|
Cash payments |
- |
(1,877 |
) |
(1,877 |
) | |||||||
|
Accrual balances, December 31, 2007 |
- |
1,334 |
1,334 |
|||||||||
|
Restructuring charges (credits) |
- |
(26 |
) |
(26 |
) | |||||||
|
Cash payments |
- |
(463 |
) |
(463 |
) | |||||||
|
Accrual balances, December 31, 2008 |
- |
845 |
845 |
|||||||||
|
Restructuring charges (credits) |
- |
71 |
71 |
|||||||||
|
Cash payments |
- |
(517 |
) |
(517 |
) | |||||||
|
Accrual balances, December 31, 2009 |
$ |
- |
$ |
399 |
$ |
399 |
||||||
The severance and benefits accrual for each period includes severance, payroll taxes and COBRA benefits related to restructuring plans implemented prior to the balance sheet date. The facilities/excess assets accrual for each period includes future minimum lease payments, fees and expenses, net of estimated sublease income and planned
company occupancy, and related leasehold improvement amounts payable subsequent to the balance sheet date for which the provisions of ASC 420-10, as applicable, were satisfied. See further discussion below. In determining estimated future sublease income, the following factors were considered, among others: opinions of independent real estate experts, current market conditions and rental rates, an assessment of the time period over which reasonable estimates could be made, the status of negotiations with potential
subtenants, and the location of the respective facilities.
In September 2006, we decided not to exercise a $4.5 million buy-out option for a 50,000 square foot lease for 66 months from January 1, 2007 through June 30, 2012 at Pacific Shores Center in Redwood City, California. We instead decided to occupy a portion of the new space and sub-lease the remaining excess space. In January 2007,
we moved into our current worldwide headquarters at Pacific Shores Center, occupying approximately 27,000 square feet of office facilities used for research and development, technical support, sales, marketing, consulting, training and administration. We subleased approximately 22,500 square feet effective on January 8, 2007 and our subtenant signed early termination agreement for this sublease with us in year 2009.
The nature of the charges and credits in 2009 were as follows:
|
l |
Severance and benefits -- In 2009, we did not incur any severance and benefits expense. |
|
l |
Facilities/excess assets – During 2009, we signed a Sublease Termination and Release Agreement (the "Sublease Termination Agreement")
with our subtenant Dexterra Inc. Under the terms of the Sublease Termination Agreement, Dexterra Inc. was to (i) surrender the premises, on an as-is basis, and all of its rights and interest in the premises, (ii) pay a termination fee to us and (iii) be entitled to a partial refund of the termination fee if any party subleases the office space during the period from June 10, 2009 through January 7, 2010. In addition to the termination fee, we retained Dexterra Inc.'s security deposit of $128,000. The
termination fee of $678,000 (less the retained security deposit of $128,000) is payable in two installments. Dexterra Inc. paid the first installment of $472,000 to us on June 10, 2009, and shall pay the second installment of $78,000 on June 10, 2010, subject to certain conditions set forth in the Sublease Termination Agreement. The second installment of the termination fee is being amortized into restructuring charges over the remaining term of the lease, which will expire on June 30, 2012. Because
of the early termination of our sublease agreement, we recalculated our restructuring liability in accordance with ASC 420-10. As a result, we recognized restructuring charges of $71,000 as operating expenses in our Consolidated Statements of Operations. As of March 5, 2010, the 22,500 square feet of formerly subleased space remains vacant. We are making the lease payments and paying operating expenses, and actively seeking to sublease the space. |
The nature of the charges and credits in 2008 were as follows:
|
l |
Severance and benefits -- In 2008, we did not incur any severance and benefits expense. |
|
l |
Facilities/excess assets -- During 2008, we recorded a facilities-related restructuring credit of $26,000 due to an excess of subleases income. |
The nature of the charges and credits in 2007 were as follows:
|
l |
Severance and benefits -- In 2007, we have reversed severance accruals due to the expiration of the relevant statute of limitations. This resulted into a reversal of the related accrual of $347,000. |
|
l |
Facilities/excess assets -- During 2007, one of the leases located in Redwood City, California expired. We incurred an asset retirement obligation of $40,000 before returning the property to the landlord. This amount was included in the restructuring charge of $996,000. |
As of December 31, 2009, we have remaining lease obligations of approximately $2.9 million. As a component of the settlement of one of the previous leases, we have a residual lease obligation beginning in 2008 of approximately $5.6 million. We would have made an additional cash payment of $4.5 million had we exercised
an option to terminate this residual real estate obligation prior to the commencement of the lease term (January 2007). This option to terminate the residual lease obligation is accounted for in accordance with ASC 420-10 and is a part of the restructuring credit of $24.6 million recorded in fiscal 2004. As discussed above, in the third quarter of 2006, we did not exercise the $4.5 million option to buy out the residual lease obligation, and the buy-out option expired.
In connection with one of the buyout transactions, we issued to the landlord a five-year warrant to purchase approximately 28,000 shares of our common stock at an exercise price of $125.00 per share, exercisable beginning in August 2005. The shares underlying the warrants issued in connection with a real estate buyout transaction
in August 2004 were not exercised and expired in July 2009. See Note 9 – Stockholders’ Equity in the Notes to our Consolidated Financial Statements.
As of December 31, 2009, the total restructuring accrual of $399,000 consisted of the following (in thousands):
|
Current |
Non-Current |
Total |
||||||||||
|
Excess facilities |
$ |
244 |
$ |
155 |
$ |
399 |
||||||
We no longer have excess facilities related to restructured or abandoned leased space.
The following table summarizes the activity related to the restructuring plans initiated after January 1, 2003, and accounted for in accordance with ASC 420-10 (in thousands):
|
Accrued Restructuring Costs, Beginning |
Amounts Charged to Restructuring Costs and Other |
Amounts Reversed to Restructuring Costs and Other |
Amounts Paid or Written Off |
Accrued Restructuring Costs, Ending |
||||||||||||||||
|
Year Ended December 31, 2009: |
||||||||||||||||||||
|
Lease cancellations and commitments |
$ |
65 |
$ |
70 |
$ |
- |
$ |
150 |
$ |
285 |
||||||||||
|
Year Ended December 31, 2008: |
||||||||||||||||||||
|
Lease cancellations and commitments |
$ |
8 |
$ |
24 |
$ |
33 |
$ |
- |
$ |
65 |
||||||||||
|
Year Ended December 31, 2007: |
||||||||||||||||||||
|
Lease cancellations and commitments |
$ |
77 |
$ |
126 |
$ |
- |
$ |
(195 |
) |
$ |
8 |
|||||||||
The following table summarizes the activity related to the restructuring plans initiated prior to January 1, 2003, and accounted for in accordance with ASC 420-10 (in thousands):
|
Accrued Restructuring Costs, Beginning |
Amounts Charged to Restructuring Costs and Other |
Amounts Reversed to Restructuring Costs and Other |
Amounts Paid or Written Off |
Accrued Restructuring Costs, Ending |
||||||||||||||||
|
Year Ended December 31, 2009: |
||||||||||||||||||||
|
Lease cancellations and commitments |
$ |
780 |
$ |
1 |
$ |
(100 |
) |
$ |
(567 |
) |
$ |
114 |
||||||||
|
Year Ended December 31, 2008: |
||||||||||||||||||||
|
Lease cancellations and commitments |
$ |
1,326 |
$ |
(51 |
) |
$ |
- |
$ |
(495 |
) |
$ |
780 |
||||||||
|
Year Ended December 31, 2007: |
||||||||||||||||||||
|
Lease cancellations and commitments |
$ |
2,138 |
$ |
870 |
$ |
- |
$ |
(1,682 |
) |
$ |
1,326 |
|||||||||
|
Termination payments to employees and related costs |
347 |
- |
(347 |
) |
- |
- |
||||||||||||||
|
$ |
2,485 |
$ |
870 |
$ |
(347 |
) |
$ |
(1,682 |
) |
$ |
1,326 |
|||||||||
Note 9---Stockholders' Equity
Convertible Preferred Stock
As of December 31, 2009, there were no outstanding shares of convertible preferred stock. Our Board of Directors and our stockholders have authorized 1,000,000 shares of convertible preferred stock that are available for issuance.
Common Stock
We effected a one-for-twenty-five reverse split of our common stock on October 24, 2008. Our common stock began trading on a post-split basis at the opening of trading on October 27, 2008. The accompanying consolidated financial statements and related financial information contained herein for all periods presented
have been retroactively restated to give effect to the stock split in accordance with U.S. GAAP. We paid cash in lieu of issuing fractional shares, based upon the closing sales price of our stock as reported on the OTC Bulletin Board on October 24, 2008.
As of December 31, 2009, we had reserved 351,751 common shares for future issuance upon the exercise of stock options and warrants.
Our CEO has options to purchase 48,176 shares of common stock at a weighted average exercise price of $965 per share. The table below is a summary of shares granted through December 31, 2009:
|
Date Granted |
Options Granted |
Options Price |
Vested |
Vesting Period (Months) |
||||||||||||
|
5/25/2001 |
20,000 |
$ |
1,662.75 |
20,000 |
48 |
|||||||||||
|
11/27/2001 |
177 |
875.25 |
177 |
24 |
||||||||||||
|
2/19/2002 |
2,222 |
465.75 |
2,222 |
48 |
||||||||||||
|
10/30/2002 |
25,777 |
54.00 |
25,777 |
48 |
||||||||||||
|
Totals |
48,176 |
48,176 |
||||||||||||||
Activity in the Amended and Restated Plan is as follows:
|
Years Ended December 31, |
||||||||||||||||||||||||||||||||
|
2009 |
2008 |
2007 |
||||||||||||||||||||||||||||||
|
Options (000's) |
Weighted-Average Exercise Price |
Weighted-Average Remaining Contractual Term |
Aggregate Intrinsic Value |
Options (000's) |
Weighted-Average Exercise Price |
Options (000's) |
Weighted-Average Exercise Price |
|||||||||||||||||||||||||
|
Outstanding at beginning of period |
311 |
$ |
267.51 |
233 |
$ |
353.54 |
249 |
$ |
336.39 |
|||||||||||||||||||||||
|
Granted |
11 |
14.03 |
98 |
29.32 |
24 |
42.47 |
||||||||||||||||||||||||||
|
Exercised |
- |
- |
(4 |
) |
15.18 |
(32 |
) |
14.89 |
||||||||||||||||||||||||
|
Forfeited |
(13 |
) |
19.95 |
(7 |
) |
29.74 |
(5 |
) |
17.50 |
|||||||||||||||||||||||
|
Expired |
(45 |
) |
762.36 |
(9 |
) |
214.16 |
(3 |
) |
660.88 |
|||||||||||||||||||||||
|
Outstanding at end of period |
264 |
$ |
183.42 |
6.05 |
$ |
2,250 |
311 |
$ |
267.51 |
233 |
353.54 |
|||||||||||||||||||||
|
Options exercisable at end of period |
221 |
$ |
213.62 |
5.60 |
$ |
- |
226 |
$ |
357.50 |
193 |
$ |
421.66 |
||||||||||||||||||||
|
Option vested and expected to vest at end of period |
258 |
$ |
187.13 |
5.99 |
$ |
1,572 |
303 |
$ |
273.82 |
231 |
$ |
357.37 |
||||||||||||||||||||
|
Weighted-average fair value of options granted during the period |
$ |
10 |
$ |
22 |
$ |
33.32 |
||||||||||||||||||||||||||
|
Aggregate Intrinsic Value: |
||||||||||||||||||||||||||||||||
|
Options exercised |
$ |
- |
$ |
60,459 |
$ |
1,303,673 |
||||||||||||||||||||||||||
We granted 933 shares of restricted stock to the non-employee members of our Board of Directors in June 2007, and recorded a stock-based compensation expense of $28,541. We granted 2,018 shares of restricted stock to the non-employee members of our Board of Directors in June 2008, and recorded a stock-based compensation
expense of $51,950. We granted 3,864 shares of restricted stock to the non-employee members of our Board of Directors in April 2009, and recorded a stock-based compensation expense of $53,626. These 3,864 shares of restricted stock will vest over a one-year period measured from the date of the annual meeting of stockholders held in April 2009, with one quarter of the shares included in such Director Grant vesting on each of the dates that are three months, six months, nine months and twelve months
from the April 2009 annual meeting, so long as each board member continues to serve as a member of our board of directors on such vesting date.
The following table summarizes stock options outstanding under the Amended and Restated Plan as of December 31, 2009:
|
Range of Exercise Prices |
Options (000's) |
Outstanding Weighted-Average Remaining Contractual Life in Years |
Weighted Exercise Price |
Exercisable Options (000's) |
Weighted Exercise Price |
||||||||||||||||||||||||||
|
$ |
12.75 |
- |
$ |
12.75 |
3 |
9.56 |
$ |
12.75 |
- |
$ |
- |
||||||||||||||||||||
|
14.25 |
- |
14.25 |
73 |
6.17 |
14.25 |
73 |
14.25 |
||||||||||||||||||||||||
|
15.04 |
- |
28.25 |
24 |
7.33 |
22.02 |
21 |
21.84 |
||||||||||||||||||||||||
|
29.25 |
- |
29.25 |
75 |
8.29 |
29.25 |
42 |
29.25 |
||||||||||||||||||||||||
|
33.50 |
- |
55.25 |
49 |
4.65 |
51.00 |
44 |
51.09 |
||||||||||||||||||||||||
|
59.00 |
- |
7,495.31 |
40 |
2.32 |
1,049.50 |
41 |
1,049.50 |
||||||||||||||||||||||||
|
12.75 |
- |
7,495.31 |
264 |
6.05 |
$ |
183.42 |
221 |
$ |
213.62 |
||||||||||||||||||||||
We grant options outside of our Amended and Restated Plan (2000 Non-Officer Plan and Non-Plan Grants). The terms of these options are generally identical to those granted under our Amended and Restated Plan. A summary of options granted outside of the plan is presented below:
|
Years Ended December 31, |
||||||||||||||||||||||||||||||||
|
2009 |
2008 |
2007 |
||||||||||||||||||||||||||||||
|
Options (000's) |
Weighted-Average Exercise Price |
Weighted Average Remaining Contractual Term |
Aggregate Intrinsic Value |
Options (000's) |
Weighted-Average Exercise Price |
Options (000's) |
Weighted-Average Exercise Price |
|||||||||||||||||||||||||
|
Outstanding at beginning of period |
44 |
$ |
150.61 |
25 |
$ |
274.42 |
30 |
$ |
241.58 |
|||||||||||||||||||||||
|
Granted |
- |
- |
26 |
26.71 |
- |
- |
||||||||||||||||||||||||||
|
Exercised |
- |
- |
(1 |
) |
14.25 |
(5 |
) |
31.57 |
||||||||||||||||||||||||
|
Forfeited |
(1 |
) |
12.75 |
(5 |
) |
29.25 |
- |
- |
||||||||||||||||||||||||
|
Expired |
(4 |
) |
412.23 |
(1 |
) |
860.35 |
- |
470.30 |
||||||||||||||||||||||||
|
Outstanding at end of period |
39 |
$ |
127.16 |
6.41 |
$ |
16,583 |
44 |
150.61 |
25 |
$ |
274.42 |
|||||||||||||||||||||
|
Options exercisable at end of period |
31 |
$ |
153.97 |
5.89 |
$ |
15,533 |
28 |
$ |
224.01 |
23 |
$ |
300.98 |
||||||||||||||||||||
|
Option vested and expected to vest at end of period |
38 |
$ |
130.24 |
6.35 |
$ |
16,401 |
43 |
$ |
155.80 |
25 |
$ |
274.84 |
||||||||||||||||||||
|
Weighted-average fair value of options granted during the period |
$ |
- |
$ |
20.14 |
$ |
- |
||||||||||||||||||||||||||
|
Aggregate Intrinsic Value: |
||||||||||||||||||||||||||||||||
|
Options exercised |
$ |
- |
$ |
3,420 |
$ |
150,998 |
||||||||||||||||||||||||||
The following table summarizes stock options, granted outside the Amended and Restated Plan (2000 Non-Officer Plan and non-plan grants), outstanding as of December 31, 2009:
|
Range of Exercise Prices |
Options
(000's) |
Outstanding Weighted-Average Remaining Contractual Life in Years |
Weighted Exercise
Price |
Exercisable Options
(000's) |
Weighted Exercise
Price |
||||||||||||||||||||||||||
|
$ |
11.38 |
- |
$ |
12.75 |
9 |
7.11 |
$ |
11.85 |
8 |
$ |
11.72 |
||||||||||||||||||||
|
14.25 |
- |
14.25 |
4 |
6.17 |
14.25 |
4 |
14.25 |
||||||||||||||||||||||||
|
29.25 |
- |
29.25 |
16 |
8.29 |
29.25 |
9 |
29.25 |
||||||||||||||||||||||||
|
37.50 |
- |
37.50 |
7 |
2.81 |
37.50 |
7 |
37.50 |
||||||||||||||||||||||||
|
52.50 |
- |
875.25 |
2 |
3.07 |
314.92 |
2 |
314.92 |
||||||||||||||||||||||||
|
6,046.88 |
- |
6,046.88 |
1 |
0.30 |
6,046.88 |
1 |
6,046.88 |
||||||||||||||||||||||||
|
11.38 |
- |
6,046.88 |
39 |
6.41 |
$ |
127.16 |
31 |
$ |
153.97 |
||||||||||||||||||||||
As of December 31, 2009, total unrecognized compensation cost related to unvested stock options was $1,157,422, which is expected to be recognized over the remaining weighted-average vesting periods of 0.71 year. During the year ended December 31, 2009 and 2008, we have received cash of $537,000 and $657,000, respectively from
the exercise of stock options and employee stock purchases.
Warrants
Effective January 1, 2007, we adopted ASC 815-40, Contracts in Entity’s own Equity ("ASC 815-40"). ASC 815-40 addresses how to account for registration payment arrangements and clarifies
that a financial instrument subject to a registration payment arrangement should be accounted for in accordance with other generally accepted accounting principles ("GAAP") without regard to the contingent obligation to transfer consideration pursuant to the registration payment arrangement. This accounting pronouncement further clarifies that a liability for liquidated damages resulting from registration payment obligations should be recorded in accordance with ASC 450, Contingencies ("ASC
450"), when the payment of liquidated damages becomes probable and can be reasonably estimated. We do not believe that we have any contingencies as of December 31, 2009 relating to our registration payment arrangements, nor do we believe that there is a material impact on our Consolidated Financial Statements as a result of implementing this ASC 815-40.
As of December 31, 2009, the following warrants to purchase our common stock were outstanding (dollars in thousands, except shares and per share data):
|
Shares at
December 31, |
Price per
Share |
Fair Value at
December 31, |
||||||||||||||||||
|
Description |
2009 |
2008 |
2009 |
2008 |
||||||||||||||||
|
Issued to landlord in real estate buyout transaction in August 2004 |
- |
28,000 |
$ |
125.00 |
$ |
- |
$ |
1 |
||||||||||||
|
Issued to convertible debenture investors in November 2004 |
154,631 |
154,631 |
37.00 |
- |
154 |
|||||||||||||||
|
Total |
154,631 |
182,631 |
$ |
- |
$ |
155 |
||||||||||||||
The warrants issued in connection with a real estate buyout in August 2004 were not exercised and expired in July 2009. The warrant issued in connection with the convertible debentures also has a term of five years and is exercisable beginning in May 2005. All our outstanding warrants have been retroactively restated to give
effect to our reverse stock-split transaction effective October 2008.
In accordance with ASC 815-40, the warrants have been included as a short-term liability and were originally valued at fair value on the date of issuance. During the years 2009 and 2008, we recorded credits related to the change in the fair value of warrants of approximately $155,000 and $4.0 million, respectively. During
year 2007, we recorded charges related to the change in fair value of the warrants of approximately $3.1 million. During year 2007, certain convertible debenture investors exercised 13,640 warrants to purchase an equivalent number of Company common shares for total cash proceeds of $505,000.
Note 10---Employee Benefit Plan
We provide for a defined contribution employee retirement plan in accordance with section 401(k) of the Internal Revenue Code. Eligible employees are entitled to contribute up to 50% of their annual compensation, subject to certain limitations. The Plan allows for discretionary contributions by us. We made no contributions during
each of the three years ended December 31, 2009.
Note 11---Geographic, Segment and Significant Customer Information
We operate in one segment: electronic business commerce solutions. Our reportable segment includes our facilities in North and South America (Americas), Europe and Asia Pacific and the Middle East (Asia/Pacific). Our chief operating decision maker is considered to be the CEO. The CEO reviews financial information presented on a consolidated
basis accompanied by disaggregated information about revenues by geographic region and by product for purposes of making operating decisions and assessing financial performance. The disaggregated revenue information reviewed by the CEO is as follows (in thousands):
|
Years Ended December 31, |
||||||||||||
|
2009 |
2008 |
2007 |
||||||||||
|
Software licenses |
$ |
11,154 |
$ |
12,137 |
$ |
21,127 |
||||||
|
Services |
4,957 |
6,051 |
6,204 |
|||||||||
|
Maintenance |
14,850 |
17,715 |
22,687 |
|||||||||
|
Total revenues |
$ |
30,961 |
$ |
35,903 |
$ |
50,018 |
||||||
We sell our products and provide services worldwide through a direct sales force and through a channel of independent distributors, value-added resellers ("VARs") and Application Service Providers ("ASPs"). In addition, the sales of our products are promoted through independent professional consulting organizations known as systems
integrators ("SIs"). We provide services worldwide through our BroadVision WEBSO and indirectly through distributors, VARs, ASPs, and SIs. We currently operate in three primary geographical territories.
Disaggregated financial information regarding our products and services and geographic revenues is as follows (in thousands):
|
Years Ended December 31, |
||||||||||||
|
2009 |
2008 |
2007 |
||||||||||
|
Revenues: |
||||||||||||
|
Americas |
$ |
17,027 |
$ |
16,893 |
$ |
31,714 |
||||||
|
Europe |
10,530 |
13,500 |
12,092 |
|||||||||
|
Asia/ Pacific |
3,404 |
5,510 |
6,212 |
|||||||||
|
Total Company |
$ |
30,961 |
$ |
35,903 |
$ |
50,018 |
||||||
During the year ended December 31, 2009, one customer in the retail industry accounted for 10% of our revenues. For the years ended December 31, 2008 and 2007, no customer accounted for 10% or more of our revenues.
In 2009, license sales through independent distributors, VARs, ASPs, and SIs became significant. Although it was immaterial in Americas and Europe, license sales via these channels accounted for 67% Asia Pacific in 2009.
The following represents property and equipment and goodwill (long-lived assets) by geographic region (in thousands):
|
December 31, |
||||||||||||
|
2009 |
2008 |
2007 |
||||||||||
|
Long-Lived Assets: |
||||||||||||
|
Americas |
$ |
265 |
$ |
359 |
$ |
25,581 |
||||||
|
Europe |
12 |
16 |
62 |
|||||||||
|
Asia/ Pacific |
107 |
139 |
111 |
|||||||||
|
Total Company |
$ |
384 |
$ |
514 |
$ |
25,754 |
||||||
The long-lived assets at December 31, 2009 compared to 2008 decreased by $130,000, primarily due to the continuous depreciation on the existing property and equipment.
Note 12---Related Party Transactions
On November 14, 2008, BroadVision (Delaware) LLC, a Delaware limited liability company ("BVD"), which was then our wholly owned subsidiary, entered into a Share Purchase Agreement with CHRM LLC, a Delaware limited liability company, that is controlled by Dr. Pehong Chen, our CEO and largest stockholder. We and CHRM
LLC then entered into an Amended and Restated Operating Agreement of BroadVision (Delaware) LLC dated as of November 14, 2008 (the "BVD Operating Agreement"). Under these agreements, CHRM LLC received, in exchange for the assignment of certain intellectual property rights, 20 Class B Shares of BVD, representing the right to receive 20% of any "net profit" from a "capital transaction" (as such terms are defined in the BVD Operating Agreement) of BroadVision (Barbados) Limited ("BVB"), an entity wholly owned by
BVD. A "capital transaction" under that agreement is any merger or sale of substantially all of the assets of BVB as a result of which the members of BVB will no longer have an interest in BVB or the assets of BVB will be distributed to its members.
In 2009, we executed a renewal contract with a third party in which Dr. Pehong Chen, our CEO and largest stockholder, is a board member. The total renewal license value $103,000. For the year ended December 31, 2009, $89,000 was recognized as license revenue. We have received payment of $103,000 for the
renewal contract as of December 31, 2009. We incurred $35,000 in direct costs and expenses relating to this contract.
In 2008, we executed a renewal contract with a third party in which Dr. Pehong Chen, our CEO and largest stockholder, is a board member. The total renewal license value is $73,000. We recognized $64,000 and $9,000 of license revenue related to this contract for year 2008 and year 2009, respectively. For the year ended
December 31, 2008, we also recognized $17,835 as consulting revenue. We have received payment of $73,000 for the renewal contract as December 31, 2008. We incurred $70,000 in direct costs and expenses relating to this contract.
In June 2007, we executed a software license agreement with a third party in which Dr. Pehong Chen, our CEO and largest stockholder, is a board member. The total contract value is $132,000. We recognized $112,000 and $20,000 revenue for year 2007 and year 2008, respectively. We have received payment of $126,000
and $6,000 for the contract for year 2007 and year 2008, respectively. We incurred $50,000 in direct costs and expenses relating to this contract.
Note 13---Quarterly Results of Operations (Unaudited)
The following tables set forth certain unaudited Consolidated Statement of Operations data for the eight quarters ended December 31, 2009, as well as that data expressed as a percentage of total revenues for the periods indicated.
This data has been derived from unaudited Consolidated Financial Statements that, in the opinion of management, include all adjustments consisting only of normal recurring adjustments necessary for a fair presentation of such information
when read in conjunction with our Consolidated Financial Statements and the Notes thereto. We believe that period-to-period comparisons of our financial results are not necessarily meaningful and should not be relied upon as an indication of future performance.
|
Three Months Ended |
||||||||||||||||||||||||||||||||
|
Dec 31,
2009 |
Sep 30,
2009 |
Jun 30,
2009 |
Mar 31,
2009 |
Dec 31,
2008 |
Sep 30,
2008 |
Jun 30,
2008 |
Mar 31,
2008 |
|||||||||||||||||||||||||
|
(In thousands)
(Unaudited) |
||||||||||||||||||||||||||||||||
|
Statement of Operations Data: |
||||||||||||||||||||||||||||||||
|
Revenues: |
||||||||||||||||||||||||||||||||
|
Software licenses |
$ |
2,478 |
$ |
2,663 |
$ |
3,161 |
$ |
2,852 |
$ |
3,616 |
$ |
2,096 |
$ |
2,448 |
$ |
3,977 |
||||||||||||||||
|
Services |
4,768 |
4,879 |
5,011 |
5,149 |
6,036 |
6,095 |
5,582 |
6,053 |
||||||||||||||||||||||||
|
Total revenues |
7,246 |
7,542 |
8,172 |
8,001 |
9,652 |
8,191 |
8,030 |
10,030 |
||||||||||||||||||||||||
|
Cost of revenues: |
||||||||||||||||||||||||||||||||
|
Cost of software licenses |
6 |
6 |
14 |
6 |
6 |
7 |
6 |
7 |
||||||||||||||||||||||||
|
Cost of services |
1,824 |
1,784 |
1,959 |
1,964 |
2,259 |
2,218 |
2,155 |
2,253 |
||||||||||||||||||||||||
|
Total cost of revenues |
1,830 |
1,790 |
1,973 |
1,970 |
2,265 |
2,225 |
2,161 |
2,260 |
||||||||||||||||||||||||
|
Gross profit |
5,416 |
5,752 |
6,199 |
6,031 |
7,387 |
5,966 |
5,869 |
7,770 |
||||||||||||||||||||||||
|
Operating expenses: |
||||||||||||||||||||||||||||||||
|
Research and development |
2,227 |
2,169 |
2,009 |
2,168 |
2,320 |
2,217 |
2,309 |
2,337 |
||||||||||||||||||||||||
|
Sales and marketing |
1,930 |
2,024 |
1,942 |
2,036 |
1,989 |
1,937 |
1,961 |
1,885 |
||||||||||||||||||||||||
|
General and administrative |
906 |
1,006 |
1,146 |
1,451 |
1,452 |
1,659 |
1,603 |
1,698 |
||||||||||||||||||||||||
|
Goodwill impairment |
- |
- |
- |
- |
25,066 |
- |
- |
- |
||||||||||||||||||||||||
|
Restructuring charges (credits) |
21 |
(4 |
) |
56 |
(2 |
) |
(9 |
) |
6 |
(5 |
) |
(18 |
) | |||||||||||||||||||
|
Total operating expenses |
5,084 |
5,195 |
5,153 |
5,653 |
30,818 |
5,819 |
5,868 |
5,902 |
||||||||||||||||||||||||
|
Operating income (loss) |
332 |
557 |
1,046 |
378 |
(23,431 |
) |
147 |
1 |
1,868 |
|||||||||||||||||||||||
|
Income (expense) from revaluation of warrants |
8 |
154 |
24 |
(31 |
) |
380 |
581 |
625 |
2,454 |
|||||||||||||||||||||||
|
Other (expense) income, net |
(31 |
) |
984 |
1,118 |
(832 |
) |
1,148 |
(398 |
) |
813 |
1,322 |
|||||||||||||||||||||
|
Income taxes benefit (expense) |
143 |
104 |
(79 |
) |
(141 |
) |
(192 |
) |
(41 |
) |
(4 |
) |
(283 |
) | ||||||||||||||||||
|
Net income (loss) |
$ |
452 |
$ |
1,799 |
$ |
2,109 |
$ |
(626 |
) |
$ |
(22,095 |
) |
$ |
289 |
$ |
1,435 |
$ |
5,361 |
||||||||||||||
|
Basic net income (loss) per share |
$ |
0.10 |
$ |
0.41 |
$ |
0.48 |
$ |
(0.14 |
) |
$ |
(5.04 |
) |
$ |
0.07 |
$ |
0.33 |
$ |
1.23 |
||||||||||||||
|
Diluted net income (loss) per share |
$ |
0.10 |
$ |
0.41 |
$ |
0.48 |
$ |
(0.14 |
) |
$ |
(5.04 |
) |
$ |
0.06 |
$ |
0.33 |
$ |
1.21 |
||||||||||||||
|
Shares used in computing basic net income (loss) per share |
4,429 |
4,415 |
4,396 |
4,381 |
4,382 |
4,431 |
4,372 |
4,358 |
||||||||||||||||||||||||
|
Shares used in computing diluted net income (loss) per share |
4,432 |
4,435 |
4,399 |
4,381 |
4,382 |
4,466 |
4,412 |
4,413 |
||||||||||||||||||||||||
BroadVision's quarterly operating results have fluctuated in the past and may fluctuate significantly in the future as a result of a variety of factors, many of which are outside of our control. It is likely that our operating results in one or more future quarters may be below the expectations of securities analysts and investors.
In that event, the trading price of our common stock almost certainly would decline.
None.
Management's Annual Report on Internal Control Over Financial Reporting
Our management is responsible for establishing and maintaining adequate internal control over financial reporting, as such term is defined in Exchange Act Rule 13a-15(f). Our internal control system is designed to provide reasonable assurance regarding the preparation and fair presentation of financial statements for external purposes
in accordance with generally accepted accounting principles. All internal control systems, no matter how well designed, have inherent limitations and can provide only reasonable assurance that the objectives of the internal control system are met.
Under the supervision and with the participation of our management, including our Chief Executive Officer and our Chief Financial Officer, we conducted an evaluation of the effectiveness of our internal control over financial reporting, based on criteria established in Internal Control Integrated Framework issued by the Committee
of Sponsoring Organizations of the Treadway Commission (COSO). Based on our evaluation, we concluded that our internal control over financial reporting was effective as of December 31, 2009.
Evaluation of Disclosure Controls and Procedures
An evaluation as of December 31, 2009 was carried out under the supervision and with the participation of our management, including our Chief Executive Officer and our Chief Financial Officer, of the effectiveness of the design and operation of our "disclosure controls and procedures," which are defined under the Securities and Exchange
Commission’s rules as controls and other procedures of a company that are designed to ensure that information required to be disclosed by a company in the reports that it files under the Securities Exchange Act of 1934, as amended, is recorded, processed, summarized and reported within required time periods. Based upon that evaluation, our Chief Executive Officer and our Chief Financial Officer concluded that our disclosure controls and procedures were effective as of December 31, 2009.
Our management, including our Chief Executive Officer and Chief Financial Officer, has evaluated any changes in our internal control over financial reporting that occurred during the quarter ended December 31, 2009, and has concluded that there was no change during such quarter that has materially affected, or is reasonably likely
to materially affect, our internal control over financial reporting.
This annual report does not include an attestation report of our registered public accounting firm regarding internal control over financial reporting. Management’s report was not subject to attestation by our registered public accounting firm pursuant to temporary rules of the Securities and Exchange Commission that permit us to
provide only management’s report in this annual report. Management’s report shall not be deemed to be filed for purposes of Section 18 of the Securities Exchange Act of 1934, as amended.
Inherent Limitations on Effectiveness of Controls
Commencing with this annual report on Form 10-K we are not deemed to be an "accelerated filer" (as defined in Rule 12b-2 of the Securities Exchange Act of 1934, as amended) because our public float
was below the required threshold as of the last business day of our second fiscal quarter of 2009. As a result of becoming a non-accelerated filer, we are not required to provide an attestation report of our registered public accounting firm regarding our internal control over financial reporting. We have elected to not include such an attestation report in this annual report, which election was approved by the Audit Committee of our Board of Directors.
None.
The information required by this Item is incorporated by reference to sections of our Definitive Proxy Statement to be filed with the Securities and Exchange Commission pursuant to Regulation 14A in connection with the Annual Meeting of Stockholders to be held in June 2010 (the Proxy Statement) under the sections captioned "Proposal
1 -- Election of Directors", "Executive Compensation", "Information about the Board of Directors -- Code of Business Ethics and Conduct", "Board Committees and Meetings" and "Section 16(a) Beneficial Ownership Reporting Compliance".
The information required by this Item is incorporated by reference to the Proxy Statement under the sections captioned "Executive Compensation", "Compensation Committee Interlocks and Insider Participation", "Compensation Committee Report"
and "Overview of Director Compensation and Procedures".
The information required by this Item is incorporated by reference to the Proxy Statement under the sections captioned "Security Ownership of Certain Beneficial Owners and Management" and "Equity Compensation Plan Information".
The information required by this Item is incorporated by reference to the Proxy Statement under the sections captioned "Certain Relationships and Related Party Transactions" and "Information about the Board of Directors".
The information required by this Item is incorporated by reference to the Proxy Statement under the section captioned "Principal Accountant Fees and Services".
(a) The following documents are filed as a part of this Report.
1. Consolidated Financial Statements. The following Consolidated Financial Statements are included at Part II, Item 8, of this Annual Report on Form 10-K
Reports of Independent Registered Public Accounting Firm
Consolidated Balance Sheets as of December 31, 2009 and 2008
Consolidated Statements of Operations for each of the three years in the period ended December 31, 2009
Consolidated Statements of Stockholders' Equity (Deficit) and Comprehensive Income (Loss) for each of the years in the three-year period ended December 31, 2009
Consolidated Statements of Cash Flows for each of the three years in the period ended December 31, 2009
Notes to Consolidated Financial Statements
2. Financial Statement Schedule. Attached to this Annual Report on Form 10-K.
Schedule II---Valuation and Qualifying Accounts
3. Exhibits. The exhibits listed on the accompanying Index to Exhibits immediately following the consolidated financial statement schedule are filed as part of, or incorporated by reference
into, this Annual Report on Form 10-K.
Pursuant to the requirements of Section 13 or 15(d) of the Securities Exchange Act of 1934, the registrant has duly caused this report to be signed on its behalf by the undersigned, thereunto duly authorized, in Redwood City, State of California, on this 5th day
of March 2010.
BROADVISION, INC.
|
|
By: |
/s/ PEHONG CHEN | |
| Pehong Chen | |||
| Chairman of the Board, President, and Chief Executive Officer | |||
POWER OF ATTORNEY
KNOW ALL MEN BY THESE PRESENTS, that each person whose signature appears below constitutes and appoints Pehong Chen to sign any amendments to this Annual Report on Form 10-K, and to file the same, with exhibits thereto and other documents
in connection therewith, with the Securities and Exchange Commission, hereby ratifying and confirming all that the said attorney-in-fact, or his substitute or substitutes, may do or cause to be done by virtue hereof. Pursuant to the requirements of the Securities Exchange Act of 1934, this report has been signed below by the following persons on behalf of the registrant and in the capacities and on the dates indicated.
|
Signature |
Title |
Date | ||
|
/s/ Pehong Chen |
March 5, 2010 | |||
|
Pehong Chen |
Chairman of the Board, President and Chief Executive Officer (Principal Executive Officer) |
|||
|
/s/ Shin-Yuan Tzou |
||||
|
Shin-Yuan Tzou |
Chief Financial Officer
(Principal Financial and Accounting Officer) |
March 5, 2010 | ||
|
/s/ Francois Stieger |
March 5, 2010 | |||
|
Francois Stieger |
Director |
|||
|
/s/ James D. Dixon |
March 5, 2010 | |||
|
James D. Dixon |
Director |
|||
|
/s/ Robert Lee |
March 5, 2010 | |||
|
Robert Lee |
Director |
BROADVISION, INC. AND SUBSIDIARIES
SCHEDULE II---VALUATION AND QUALIFYING ACCOUNTS
(In thousands)
|
Balance at Beginning of Period |
Charged (Credited) to Costs and Expenses |
Deductions (1) |
Balance at End of Period |
|||||||||||||
|
Receivable reserves: |
||||||||||||||||
|
Year Ended December 31, 2009 |
$ |
366 |
$ |
32 |
$ |
(124 |
) |
$ |
274 |
|||||||
|
Year Ended December 31, 2008 |
$ |
585 |
$ |
72 |
$ |
(291 |
) |
$ |
366 |
|||||||
|
Year Ended December 31, 2007 |
$ |
1,141 |
$ |
248 |
$ |
(804 |
) |
$ |
585 |
|||||||
BROADVISION, INC. ANNUAL REPORT ON FORM 10-K DECEMBER 31, 2009
INDEX TO EXHIBITS
|
Exhibit |
Description |
|
3.1(1) |
Amended and Restated Certificate of Incorporation. |
|
3.2(18) |
Certificate of Amendment of Certificate of Incorporation. |
|
3.3(6) |
Certificate of Amendment of Certificate of Incorporation. |
|
3.4(14) |
Amended and Restated Bylaws. |
|
4.1(1) |
References are hereby made to Exhibits 3.1 to 3.4. |
|
4.2(16) |
Registration Rights Agreement, dated November 10, 2004, among the Company and certain investors listed on Exhibit A thereto. |
|
4.3(21) |
Registration Rights Agreement, dated March 8, 2006, between the Company and Honu Holdings LLC. |
|
10.1(8)(a) |
Equity Incentive Plan, as amended (the "2000 Equity Incentive Plan"). |
|
10.2(1)(a) |
Form of Incentive Stock Option under the 2000 Equity Incentive Plan. |
|
10.3(1)(a) |
Form of Nonstatutory Stock Option under the 2000 Equity Incentive Plan. |
|
10.4(1)(a) |
Form of Nonstatutory Stock Option (Performance-Based) under 2000 Equity Incentive Plan. |
|
10.5(2)(a) |
1996 Employee Stock Purchase Plan, as amended. |
|
10.6(1)(b) |
Terms and Conditions, dated January 1, 1995, between the Company and IONA Technologies LTD. |
|
10.7(5) |
BroadVision, Inc. Severance Benefit Plan, as amended, effective October 21, 2009. |
|
10.8(10) |
Lease Termination Agreement, dated November 6, 2007, by and between the Company and The Board of Trustees of The Leland Stanford Junior University. |
|
10.9(3)(a) |
2000 Non-Officer Equity Incentive Plan, as amended. |
|
10.10(4)(b) |
Independent Software Vendor Agreement, effective January 1, 1998, between the Company and IONA Technologies, PLC, as amended. |
|
10.11(7) |
Form of Indemnity Agreement between the Company and each of its directors and executive officers. |
|
10.12(9) |
BroadVision, Inc. Change of Control Severance Benefit Plan, established effective May 22, 2003. |
|
10.13(9) |
BroadVision, Inc. Executive Severance Benefit Plan, established effective May 22, 2003. |
|
10.14(11) |
Assignment and Assumption of Master Lease, Partial Termination of Master Lease and Assignment and Assumption of Subleases, dated July 7, 2004, between Pacific Shores Investors, LLC and the Company. |
|
10.15(11) |
Warrant to Purchase up to 28,000 share of common stock, dated July 7, 2004, issued to Pacific Shores Investors, LLC. |
|
10.16(11) |
Triple Net Space Lease, dated as of July 7, 2004, between Pacific Shores Investors, LLC and the Company. |
|
10.17(12) |
Securities Purchase Agreement, dated as of November 10, 2004, by and among the Company and the investors listed on Exhibit A thereto. |
|
10.18(20) |
Agreement to Restructure Lease and To Assign Subleases, dated as of October 1, 2004, between VEF III Funding, LLC and the Company. |
|
10.19(15) |
Amendment No. 5 to IONA Independent Software Vendor Agreement, dated December 20, 2004, between IONA Technologies, Inc. and the Company. |
|
10.20(13) |
Debt Conversion Agreement, dated as of December 20, 2005, between the Company and Honu Holdings, LLC. |
|
10.21(17) |
Sublease, dated as of December 21, 2006, between the Company and Dexterra, Inc. |
|
10.22(19) |
Share Purchase Agreement, dated November 14, 2008, between BroadVision (Delaware) LLC and CHRM LLC. |
|
10.23(22) |
Amended & Restated 2006 Equity Incentive Plan, as amended (the "Amended & Restated Plan"). |
|
10.24(23)(a) |
2009 Employee Profit Sharing Plan. |
|
10.25(24) |
Form of Restricted Stock Bonus Agreement under the Amended and Restated Plan. |
|
10.26(25) |
Form of Option Grant Notice under the Amended and Restated Plan. |
|
10.27(26) |
Form of Stock Option Agreement under the Amended & Restated Plan. |
|
10.28(27) |
Sublease Termination and Release Agreement, dated June 10, 2009, by and between the Company and Dexterra, Inc. |
|
21.1 |
Subsidiaries of the Company. |
|
23.1 |
Consent of Odenberg, Ullakko, Muranishi & Co. LLP, an independent registered public accounting firm. |
|
24.1 |
Power of Attorney, pursuant to which amendments to this Annual Report on Form 10-K may be filed, is included on the signature pages hereto. |
|
31.1 |
Certification of the Chief Executive Officer of the Company. |
|
31.2 |
Certification of the Chief Financial Officer of the Company. |
|
32.1 |
Certification of the Chief Executive Officer and Chief Financial Officer of the Company pursuant to Section 906 of the Sarbanes-Oxley Act of 2002. |
|
(a) Represents a management contract or compensatory plan or arrangement. | |
|
(b) Confidential treatment requested. | |
|
(1) Incorporated by reference to the Company's Registration Statement on Form S-1 filed on April 19, 1996 as amended by Amendment No. 1 filed on May 9, 1996, Amendment No. 2 filed on May 29, 1996 and Amendment No. 3 filed on June 17, 1996. | |
|
(2) Incorporated by reference to the Company's Registration Statement on Form S-8 filed on August 29, 2007. | |
|
(3) Incorporated by reference to the Company's Registration Statement on Form S-8 filed on October 15, 2003 | |
|
(4) Incorporated by reference to the Company's Form 10-Q for the quarter ended June 30, 2001 filed on August 14, 2001. | |
|
(5) Incorporated by reference to the Company's Current Report on Form 8-K filed on October 27, 2009. | |
|
(6) Incorporated by reference to the Company's Quarterly Report on Form 10-Q for the quarter ended September 30, 2008, filed on November 6, 2008. | |
|
(7) Incorporated by reference to the Company's Form 10-Q for the quarter ended September 30, 2002 filed on November 14, 2002. | |
|
(8) Incorporated by reference to the Company's Registration Statement on Form S-8 filed on August 1, 2002. | |
|
(9) Incorporated by reference to the Company's Form 10-Q for the quarter ended June 30, 2003 filed on August 14, 2003. | |
|
(10) Incorporated by reference to the Company's Current Report on Form 8-K filed on November 09, 2007. | |
|
(11) Incorporated by reference to the Company's Current Report on Form 8-K filed on August 9, 2004. | |
|
(12) Incorporated by reference to the Company's Current Report on Form 8-K filed on November 10, 2004. | |
|
(13) Incorporated by reference to the Company's Current Report on Form 8-K filed on December 22, 2005. | |
|
(14) Incorporated by reference to the Company's Current Report on Form 8-K filed on October 16, 2008. | |
|
(15) Incorporated by reference to the Company's Current Report on Form 8-K filed on December 23, 2004. | |
|
(16) Incorporated by reference to the Company's Registration Statement on Form S-1 filed on December 17, 2004. | |
|
(17) Incorporated by reference to the Company's Current Report on Form 8-K filed on January 10, 2007. | |
|
(18) Incorporated by reference to the Company's Form 10-K for the fiscal year ended December 31, 2006 filed on March 27, 2007. | |
|
(19) Incorporated by reference to the Company’s Current Report on Form 8-K filed on November 18, 2008. | |
|
(20) Incorporated by reference to the Company’s Current Report on Form 8-K filed on November 19, 2004. | |
|
(21) Incorporated by reference to the Company’s Form 10-K for the fiscal year ended December 31, 2005 filed on June 9, 2006. | |
|
(22) Incorporated by reference to the Company's Proxy Statement filed on March 17, 2009. | |
|
(23) Incorporated by reference to the Company's Current Report on Form 8-K filed on July 23, 2009. | |
|
(24) Incorporated by reference to the Company’s Current Report on Form 8-K filed on March 30, 2007. | |
|
(25) Incorporated by reference to the Company’s Registration Statement on Form S-8 filed on November 6, 2006. | |
|
(26) Incorporated by reference to the Company’s Registration Statement on Form S-8 filed on May 8, 2009. | |
|
(27) Incorporated by reference to the Company's Current Report on Form 8-K filed on June 5, 2009. | |