Attached files
UNITED
STATES
SECURITIES
AND EXCHANGE COMMISSION
WASHINGTON,
D.C. 20549
___________________
FORM
10-K
|
[x]
|
ANNUAL
REPORT PURSUANT TO SECTION 13 OR 15(d) OF THE SECURITIES EXCHANGE ACT OF
1934
|
For
the fiscal year ended December 31, 2009
OR
|
[ ]
|
TRANSITION
REPORT PURSUANT TO SECTION 13 OR 15(d) OF THE
SECURITIES
|
|
|
EXCHANGE
ACT OF 1934
|
For
the transition period from _______________ to
________________
Commission
file number 1-13647
__________________
DOLLAR
THRIFTY AUTOMOTIVE GROUP, INC.
(Exact
name of registrant as specified in its charter)
|
Delaware
(State
or other jurisdiction of
incorporation
or organization)
|
73-1356520
(I.R.S.
Employer
Identification
No.)
|
5330
East 31st Street, Tulsa, Oklahoma 74135
(Address
of principal executive offices and zip code)
Registrant’s
telephone number, including area code: (918) 660-7700
Securities
registered pursuant to Section 12(b) of the Act:
|
Title
of each class:
Common
Stock, $.01 par value
|
Name
of each exchange on which registered:
New
York Stock Exchange
|
Securities
registered pursuant to Section 12(g) of the Act: None
Indicate
by check mark if the registrant is a well-known seasoned issuer, as defined in
Rule 405 of the Securities Act:Yes X
No___
Indicate
by check mark if the registrant is not required to file reports pursuant to
Section 13 or Section 15(d) of the Act:Yes___ No X
Indicate
by check mark whether the registrant (1) has filed all reports required to be
filed by Section 13 or 15(d) of the Securities Exchange Act of 1934 during the
preceding 12 months (or for such shorter period that the registrant was required
to file such reports), and (2) has been subject to such filing requirements for
the past 90 days: Yes X
No___
Indicate
by a check mark whether the registrant has submitted electronically and posted
on its corporate Web site, if any, every Interactive Data File required to be
submitted and posted pursuant to Rule 405 of Regulation S-T during the preceding
12 months (or for such shorter period that the registrant was required to submit
and post such files): Yes___
No___
Indicate
by check mark if disclosure of delinquent filers pursuant to Item 405 of
Regulation S-K is not contained herein, and will not be contained, to the best
of registrant’s knowledge, in definitive proxy or information statements
incorporated by reference in Part III of this Form 10-K or any amendment to this
Form 10-K: ____
Indicate
by check mark whether the registrant is a large accelerated filer, an
accelerated filer, a non-accelerated filer, or a smaller reporting
company. See the definitions of “large accelerated filer”,
“accelerated filer” and “smaller reporting company” in Rule 12b-2 of the
Exchange Act (Check one):
|
Large
accelerated filer ____
|
Accelerated
filer X
|
Non-accelerated
filer ____
|
Smaller
reporting company____
|
Indicate by check mark whether the
registrant is a shell company (as defined in Rule 12b-2 of the Act):Yes___
No X
The
aggregate market value of the voting and non-voting common equity held by
non-affiliates of the registrant as of June 30, 2009, the last business day of
the registrant’s most recently completed second fiscal quarter, based on the
closing price of the stock on the New York Stock Exchange on such date was
$298,027,200.
The
number of shares outstanding of the registrant’s Common Stock as of February 24,
2010 was 28,597,079.
DOCUMENTS
INCORPORATED BY REFERENCE
Portions
of the definitive Proxy Statement for the Annual Meeting of Stockholders to be
held on June 10, 2010 are incorporated by reference in Part III.
- 1
-
DOLLAR THRIFTY AUTOMOTIVE GROUP, INC.
FORM
10-K
TABLE OF
CONTENTS
|
PART
I
|
||||
|
ITEM
1.
|
5
|
|||
|
ITEM
1A.
|
18
|
|||
|
ITEM
1B.
|
24
|
|||
|
ITEM
2.
|
24
|
|||
|
ITEM
3.
|
24
|
|||
|
ITEM
4.
|
25
|
|||
|
PART
II
|
||||
|
ITEM
5.
|
26
|
|||
|
ITEM
6.
|
28
|
|||
|
ITEM
7.
|
30
|
|||
|
ITEM
7A.
|
46
|
|||
|
ITEM
8.
|
49
|
|||
|
ITEM
9.
|
87
|
|||
|
ITEM
9A.
|
87
|
|||
|
ITEM
9B.
|
91
|
|||
|
PART
III
|
||||
|
ITEM
10.
|
91
|
|||
|
ITEM
11.
|
91
|
|||
|
ITEM
12.
|
91
|
|||
|
ITEM
13.
|
92
|
|||
- 2
-
|
ITEM
14.
|
92
|
||
|
PART
IV
|
|||
|
ITEM
15.
|
93
|
||
|
107
|
|||
|
108
|
|||
- 3
-
FACTORS
AFFECTING FORWARD-LOOKING STATEMENTS
Some of
the statements herein under “Business” and “Management’s Discussion and Analysis
of Financial Condition and Results of Operations” contain “forward-looking
statements” about our expectations, plans and performance. These
statements use such words as “may,” “will,” “expect,” “believe,” “intend,”
“should,” “could,” “anticipate,” “estimate,” “forecast,” “project,” “plan” and
similar expressions. These statements do not guarantee future
performance and Dollar Thrifty Automotive Group, Inc. assumes no obligation to
update them. Risks and uncertainties that could materially affect
future results include:
|
·
|
the
impact of persistent pricing and demand pressures, particularly in light
of the continuing volatility in the global financial and credit markets
and concerns about global economic prospects and the timing and strength
of a recovery, which have continued to depress consumer confidence and
spending levels;
|
|
·
|
whether
ongoing governmental and regulatory initiatives in the United States and
elsewhere to stabilize the financial markets will be
successful;
|
|
·
|
the
effectiveness of actions we take to manage costs and liquidity and whether
further reductions in the scope of our operations will be necessary in
light of the economic environment;
|
|
·
|
our
ability to obtain cost-effective financing as needed (including
replacement of asset backed medium term notes and other indebtedness as it
comes due) without unduly restricting operational flexibility,
particularly if global economic conditions and credit markets fail to
improve;
|
|
·
|
our
ability to comply with financial covenants or to obtain necessary
amendments or waivers, and the impact of the terms of any required
amendments or waivers, such as potential reductions in lender
commitments;
|
|
·
|
whether
efforts to revitalize the U.S. automotive industry are successful,
particularly in light of our dependence on vehicle supply from U.S.
automotive manufacturers;
|
|
·
|
the
impact of pricing and other actions by
competitors;
|
|
·
|
our
ability to manage the consequences under our financing agreements of an
event of bankruptcy with respect to any of the monoline insurers that
provide credit support for our asset backed financing
structures;
|
|
·
|
the
cost and other terms of acquiring and disposing of automobiles and the
impact of conditions in the used car market on our ability to reduce our
fleet capacity as and when projected by our
plans;
|
|
·
|
the
potential for significant cash tax payments in 2010 as a result of the
reduction in our fleet size and the resulting impact of our inability to
defer gains on the disposition of our vehicles under our like-kind
exchange program;
|
|
·
|
our
ability to manage our fleet mix to match demand and reduce vehicle
depreciation costs, particularly in light of the significant increase in
the level of Non-Program Vehicles (i.e., those vehicles not acquired
through a guaranteed residual value program) in our fleet and our exposure
to the used car market;
|
|
·
|
the
impact of our strategy to increase holding periods for vehicles in our
fleet, including potential adverse customer perceptions of the quality of
our fleet and increased servicing
costs;
|
|
·
|
airline
travel patterns, including disruptions or reductions in air travel
resulting from airline bankruptcies, industry consolidation, capacity
reductions and pricing actions;
|
|
·
|
local
market conditions where we and our franchisees do business, including
whether franchisees will continue to have access to capital as
needed;
|
|
·
|
volatility
in gasoline prices;
|
|
·
|
access
to reservation distribution
channels;
|
|
·
|
disruptions
in the operation or development of information and communication systems
that we rely on, including those relating to methods of
payment;
|
|
·
|
the
cost of regulatory compliance, costs and other effects of potential future
initiatives, including those directed at climate change and its effects,
and the costs and outcome of pending litigation;
and
|
|
·
|
the
impact of natural catastrophes and
terrorism.
|
- 4
-
PART I
|
BUSINESS
|
Company
Overview
General
Dollar
Thrifty Automotive Group, Inc., a Delaware corporation (“DTG”), owns DTG
Operations, Inc. (“DTG Operations”), Dollar Rent A Car, Inc. and Thrifty, Inc.
Thrifty, Inc. owns Thrifty Rent-A-Car System, Inc. and Thrifty Car Sales, Inc.
(“Thrifty Car Sales”). Thrifty Rent-A-Car System, Inc. owns Dollar
Thrifty Automotive Group Canada Inc. (“DTG Canada”). DTG operates
under a corporate structure that combines the management of operations and
administrative functions for both the Dollar and Thrifty brands. DTG
Operations operates company-owned stores under the Dollar brand and the Thrifty
brand, operates reservation centers for both brands and conducts sales and
marketing activities for both brands. Thrifty Rent-A-Car System, Inc.
and Dollar Rent A Car, Inc. conduct franchising activities for their respective
brands. Thrifty Car Sales operates a franchised retail used car sales
network. The Company has two additional subsidiaries, Rental Car
Finance Corp. (“RCFC”) and Dollar Thrifty Funding Corp., which are special
purpose financing entities and have been consolidated in the financial
statements of the Company. Dollar Rent A Car, Inc., the Dollar brand
and DTG Operations operating under the Dollar brand are individually and
collectively referred to hereafter as “Dollar”. Thrifty, Inc.,
Thrifty Rent-A-Car System, Inc., Thrifty Car Sales, the Thrifty brand and DTG
Operations operating under the Thrifty brand are individually and collectively
referred to hereafter as “Thrifty”. DTG, Dollar and Thrifty and each
of their subsidiaries are individually or collectively referred to herein as the
“Company”, as the context may require.
The
Company is the successor to Pentastar Transportation Group, Inc., which was
formed in 1989 to acquire and operate the rental car subsidiaries of Chrysler
Group, LLC, the new legal entity following the restructuring of Chrysler LLC
(formerly known as DaimlerChrysler Corporation) (such successor or predecessor
entity, as the context may require, and its subsidiaries and members of its
affiliated group are hereinafter referred to as “Chrysler”). DTG
Operations, formerly known as Dollar Rent A Car Systems, Inc., was incorporated
in 1965. Thrifty Rent-A-Car System, Inc. was incorporated in 1950 and Dollar
Rent A Car, Inc. was incorporated in December 2002. Thrifty, Inc. was
incorporated in December 1998.
Operating
Structure
Dollar
and Thrifty and their respective independent franchisees operate the Dollar and
Thrifty vehicle rental systems. The Dollar and Thrifty brands represent a
value-priced rental vehicle generally appealing to leisure customers, including
foreign tourists, and to small businesses, government business and independent
business travelers. As of December 31, 2009, Dollar and Thrifty had 613
locations in the U.S. and Canada of which 296 were company-owned stores and 317
were locations operated by franchisees.
In the
U.S., Dollar's main focus is operating company-owned stores located in major
airports, and it derives substantial revenues from leisure and tour package
rentals. Thrifty focuses on serving both the airport and local markets operating
through a network of company-owned stores and franchisees. Dollar and
Thrifty currently derive the majority of their U.S. revenues from providing
rental vehicles and services directly to rental customers. Consequently, Dollar
and Thrifty incur the costs of operating company-owned stores, and their
revenues are directly affected by changes in rental demand and
pricing. While Dollar and Thrifty have franchisees in countries
outside the U.S. and Canada, revenues from these franchisees have not been
material to results of operations of the Company.
- 5
-
Company
Strategy
In light of the financial crisis of 2008 and continued
challenging operating environment in 2009, the Company made significant changes
to its business strategy. The principal changes were as
follows:
|
|
·
|
Focus on Profitability of Core
Operations. The Company reoriented its strategy
to emphasize the profitability of its core operations and maximize return on assets, rather than revenue
growth. Key to this effort has been a focus on the optimal
balance between transaction volume and pricing, including particularly
enhancing rate per day, even where achieving this objective has resulted
in reduced transaction days. The Company also refocused
operating initiatives and investments to the top 75 airport markets
in the U.S. and in key leisure destinations. As part of this
process, beginning in late 2008 and continuing throughout 2009, the
Company closed over 100 company-owned stores that did not meet financial
return objectives. The Company does not anticipate significant
additional location closures in the foreseeable future. As the
economy recovers from recession, the Company expects further opportunity
to increase revenues and profitability through expansion of its commercial
and tour business and continued improvements
in the convenience, value and service it offers to
customers.
|
|
|
·
|
Enhanced Fleet Diversification
and Fleet Management. In 2009, the Company also
enhanced its fleet diversification, with its expected fleet composition
for the 2010 model year comprising vehicles from Ford Motor Company
(“Ford”) (34%), Chrysler (30%), General Motors Company (such entity or its
predecessor entity, as the context may require, and its affiliates,
“General Motors”) (20%) and other manufacturers (16%). In
addition to reducing the Company’s historical dependence on Chrysler,
these initiatives enable the Company to offer customers a wider range of
vehicle options. To better match its fleet with expected demand
levels and reduce its funding requirements, the Company significantly
reduced its fleet size. The Company also reduced its credit
exposure to the major vehicle manufacturers by shifting its fleet mix to a
greater proportion of vehicles purchased outside manufacturer residual
value programs, which also reduced funding requirements and vehicle
depreciation rates. Finally, the Company extended fleet holding
periods, which not only reduced the amount, and therefore the cost of
vehicle financing required, but also reduced vehicle holding costs as the
economic depreciation of the vehicle would be incurred over a longer
period of time.
|
|
|
·
|
Expand Brand Representation in
Select Markets Through Franchising. The Company has a
strong franchisee network, which provides it with brand representation in
international markets, smaller U.S. airport locations and local markets
that are not part of the Company’s core
strategic focus. In those markets, franchised operations can
provide the Company with recurring and stable sources of
profit. In optimizing its ownership mix, the Company may
continue to acquire franchisees on a limited and opportunistic basis for purposes of
brand consolidation or to improve its representation in larger markets
that may be under-served. In international markets outside of
North America, the Company exclusively utilizes its franchise network to
promote its operations, and will continue to pursue international
franchise expansion as a growth opportunity. During 2009, the
Company granted 21 and 18 new franchises to international and domestic
franchisees, respectively, and re-franchised 11 of its company-owned
stores.
|
|
|
·
|
Financial
Discipline. To preserve
liquidity and improve its capital position, the Company implemented strict
cost controls beginning in late 2008 and continuing through 2009, such as
a significant reduction in personnel. The Company also
significantly reduced its leverage, both through repayments of outstanding
debt and the completion of a $120 million equity offering in October
2009.
|
Available
Information
The
Company makes available free of charge on or through its Internet Web site its
annual report on Form 10-K, quarterly reports on Form 10-Q, current reports on
Form 8-K and all amendments to such reports filed or furnished pursuant to
Section 13(a) or 15(d) of the Securities Exchange Act of 1934 as soon as
reasonably practicable after such material has been electronically filed with,
or furnished to, the Securities
and Exchange Commission (“SEC”). The Company’s Internet address is
http://www.dtag.com. The SEC also maintains a Web site that contains
all of the Company’s filings at http://www.sec.gov.
- 6
-
The
Company has a code of business conduct, which is available on the Company’s Web
site under the heading, “About DTG”. The Company’s Board of Directors
has adopted a corporate governance policy and Board committee charters, which
are updated periodically and can be found on the Company’s Web site under the
heading, “Corporate Governance”. A copy of the code of business
conduct, the corporate governance policy and the charters are available without
charge upon request to the Company’s headquarters as listed on the front of this
Form 10-K, attention “Investor Relations” department.
The
annual Chief Executive Officer certification required by the New York Stock
Exchange (“NYSE”) Listed Company Manual was submitted to the NYSE on May 19,
2009.
Industry
Overview
The
Company competes primarily in the U.S. car rental industry. The U.S. daily car
rental industry has two principal markets: the airport market and the local
market. Vehicle rental companies that focus on the airport market rent primarily
to business and leisure travelers. Companies focusing on the local market rent
primarily to persons who need a vehicle periodically for personal or business
use or who require a temporary replacement vehicle. Rental companies also sell
used vehicles and ancillary products such as refueling services, navigation
systems and loss damage waivers to vehicle renters. As a general matter, the car rental industry is
significantly dependent on conditions in the overall leisure and business travel
markets. Beginning in late 2008, both markets were affected by the
recessionary economic environment, which not only depressed consumer and
business spending levels, but resulted in the consolidation or bankruptcy of a
number of key participants in the travel industry, notably
airlines.
Vehicle
rental companies typically incur substantial debt to finance their fleets which
makes them dependent on access to the fleet financing and capital markets to
fund operations, and
also has a direct impact on profitability due to the interest costs associated
with the debt and fluctuations in interest rates. During 2009, these
markets were significantly disrupted which constrained access to capital, and
although the fleet financing market has improved significantly in the latter
part of 2009, new issuances in these markets have required significantly higher
interest rates and higher collateral enhancement rates than the industry has
faced historically. These increases in interest costs and collateral
enhancements will have a direct impact on profitability and the capital required
to support operations in future periods.
Vehicle
rental companies are also dependent on vehicle manufacturers and overall
economic conditions in the new and used vehicle markets, as these factors
directly impact the cost of acquiring vehicles, and the ultimate disposition
value of vehicles, both of which impact operating cost. Historically,
rental companies acquired a large portion of their fleets under residual value
programs (“Residual Value Programs”), under which vehicle manufacturers
repurchase or guarantee the resale value of the vehicle in future periods,
thereby allowing the rental companies to fix their holding cost of the
vehicle. Most vehicle rental companies have in recent periods
increased their vehicle purchases made outside of Residual Value Programs to
lower fleet costs and reduce the risk related to the creditworthiness of the
vehicle manufacturers, which has increased their dependence on the used vehicle
market in terms of both determining holding cost, and for ultimate disposition
of the vehicles. Vehicle rental companies bear residual value risk
for these vehicles, which are referred to as “Non-Program Vehicles” or “risk
vehicles”.
The U.S.
rental car industry has eight top brands which are owned by four companies.
Three of the companies are publicly held: Dollar and Thrifty operated by the
Company; Avis and Budget operated by Avis Budget Group, Inc.; and Hertz operated
by Hertz Global Holdings, Inc. The remaining three brands of Alamo, National and
Enterprise are operating subsidiaries of Enterprise Rent-A-Car Company, which is
privately held. The Company also faces competition from local and
regional car rental companies in the United States. There is intense competition
in the U.S. car rental industry on the basis of price, service levels, vehicle
quality, vehicle availability and the convenience and condition of rental
locations.
Seasonality
The
Company’s business is subject to seasonal variations in customer demand, with
the summer vacation period representing the peak season for vehicle
rentals. This general seasonal variation in demand, along with more
localized changes in demand, causes the Company to vary its fleet size over the
course of the year. To accommodate increased demand in the summer vacation
periods, the Company increases its available fleet and staff and as demand
declines, the fleet and staff are decreased accordingly.
- 7
-
Certain
operating expenses, such as minimum concession fees, rent, insurance and
administrative overhead represent fixed costs and cannot be adjusted for
seasonal increases or decreases in demand. In 2009, the Company’s average
monthly fleet size ranged from a low of approximately 92,000 vehicles in the
fourth quarter to a high of approximately 111,000 vehicles in the third
quarter.
The
Company
The
Company has two value rental car brands, Dollar and Thrifty, with a strategy to
operate company-owned stores in the top 75 airport markets and in key leisure
destinations in the United States. In the U.S., the Dollar and
Thrifty brands are marketed separately, but operate under a single management
structure and share vehicles, back-office employees and facilities, where
possible. The Company also operates company-owned stores in five of
the eight largest airport markets in Canada under DTG Canada. In
Canada, the company-owned stores are primarily co-branded.
The
Company is focused on maximizing profitability of its company-owned stores and
will close or consolidate its stores that underperform. Beginning in
late 2008 and continuing throughout 2009, based on a review of the financial
performance of its company-owned stores, the Company closed over 100
company-owned stores that were underperforming. While the Company has
substantially completed its review of company-owned stores and the closure of
unprofitable stores, it will continue to monitor any stores that do not meet
minimum return on asset and profitability requirements for closure.
The
Company also offers franchise opportunities in smaller markets in the U.S. and
Canada and in all other international markets so that franchisees can operate
under the Dollar or Thrifty trademarks or dual franchise and operate both brands
in one market. Additionally, the Company may re-franchise
company-owned stores outside its strategic markets.
|
Summary
Operating Data of the Company
|
||||||||||||
|
Year
Ended December 31,
|
||||||||||||
|
2009
|
2008
|
2007
|
||||||||||
| (in thousands) | ||||||||||||
|
Revenues:
|
||||||||||||
|
Revenue
from U.S. and
|
||||||||||||
|
Canada
company-owned
|
||||||||||||
|
stores
|
$ | 1,491,599 | $ | 1,637,119 | $ | 1,694,064 | ||||||
|
Revenue
from franchisees
|
||||||||||||
|
and
other
|
54,650 | 60,874 | 66,727 | |||||||||
|
Total
revenues
|
$ | 1,546,249 | $ | 1,697,993 | $ | 1,760,791 | ||||||
|
As
of December 31,
|
||||||||||||
| 2009 | 2008 | 2007 | ||||||||||
|
Rental
locations:
|
||||||||||||
|
U.S.
and Canada company-
|
||||||||||||
|
owned
stores
|
296 | 400 | 466 | |||||||||
|
U.S.
and Canada franchisee
|
||||||||||||
|
locations
|
317 | 341 | 365 | |||||||||
|
Franchisee
agreements:
|
||||||||||||
|
U.S.
and Canada
|
181 | 222 | 234 | |||||||||
|
International
|
135 | 139 | 117 | |||||||||
- 8
-
Dollar
and Thrifty Brands
Dollar
Dollar’s
main focus is serving the airport vehicle rental market, which is comprised of
business and leisure travelers. The majority of its locations are on or near
airport facilities. Dollar operates primarily through company-owned
stores in the U.S. and Canada, and also licenses to independent franchisees
which operate as a part of the Dollar brand system. At December 31, 2009, Dollar
had 81 company-owned stores at airports and 70 in local markets, and 49
franchised in-terminal airport locations and 82 franchised local market
operations in the U.S. and Canada. In Canada, Dollar operates
company-owned stores in five of the eight largest airport markets of Calgary,
Toronto, Montreal, Halifax and Vancouver.
As of
December 31, 2009, Dollar’s vehicle rental system included 282 locations in the
U.S. and Canada, consisting of 151 company-owned stores and 131 franchisee
locations. Dollar’s total rental revenue generated by company-owned
stores was $845 million for the year ended December 31, 2009.
Thrifty
Thrifty
serves both the airport and local markets through company-owned stores and its
franchisees which derive approximately 85% of their combined rental revenues
from the airport market and approximately 15% from the local market. At December
31, 2009, Thrifty had 80 company-owned stores at airports and 65 in local
markets, and 60 franchised in-terminal airport locations and 126 franchised
local market operations in the U.S. and Canada.
At
December 31, 2009, Thrifty’s vehicle rental system included 331 rental locations
in the U.S. and Canada, consisting of 145 company-owned stores and 186
franchisee locations. Thrifty’s total rental revenue generated by
company-owned stores was $628 million for the year ended December 31,
2009.
Corporate
Operations
United
States
The
Company’s operating model for U.S. Dollar and Thrifty company-owned stores
includes generally maintaining separate airport counters, reservations,
marketing and all other customer contact activities, while using a single
management team for both brands. In addition, this operating model
includes sharing vehicles, bussing operations, back-office employees and service
facilities, where possible.
As of
December 31, 2009, the Company operates each of the Dollar brand and the Thrifty
brand in 56 of the top 75 airport markets in the U.S. and operates both brands
in 47 of those top 75 airport markets.
Canada
The
Company operates in Canada through DTG Canada. The Company currently
operates company-owned
stores in five of the eight largest airport markets in Canada, which include
Calgary, Toronto, Montreal, Halifax and Vancouver. The majority of
the markets are operated under the Company’s co-branding strategy in Canada
where both the Dollar and Thrifty brands are represented at one shared
location.
Tour
Rentals
Vehicle
rentals by customers of foreign and U.S. tour operators generated approximately
$206 million or 14% of the Company’s rental revenues for the year ended December
31, 2009. These rentals are usually part of tour packages that can
also include air travel and hotel accommodations. No single tour
operator account generated in excess of 2% of the Company’s 2009 rental
revenues.
Other
As of
December 31, 2009, the Company had 142 vehicle rental concessions for
company-owned stores at 83 airports in the United States. Its payments for these
concessions are usually based upon a specified percentage of airport-generated
revenue, subject to a minimum annual fee, and typically include fixed
rent for
terminal counters or other leased properties and
facilities.
- 9
-
A growing
number of larger airports are building consolidated airport rental car
facilities to alleviate congestion at the airport. These consolidated rental
facilities may eliminate certain competitive advantages among the brands as
competitors operate out of one centralized facility for both customer rental and
return operations, share consolidated bussing operations and maintain image
standards mandated by the airports.
|
Summary
of Corporate Operations Data
|
||||||||||||
|
Year
Ended December 31,
|
||||||||||||
|
2009
|
2008
|
2007
|
||||||||||
|
(in
thousands)
|
||||||||||||
|
Rental
revenues:
|
||||||||||||
|
United
States - Dollar
|
$ | 835,935 | $ | 933,072 | $ | 964,416 | ||||||
|
United
States - Thrifty
|
576,230 | 602,653 | 621,043 | |||||||||
|
Total
U.S. rental revenues
|
1,412,165 | 1,535,725 | 1,585,459 | |||||||||
|
Canada
- Dollar
|
9,178 | 15,642 | 16,635 | |||||||||
|
Canada
- Thrifty
|
51,575 | 64,786 | 74,255 | |||||||||
|
Total
Canada rental revenues
|
60,753 | 80,428 | 90,890 | |||||||||
|
Total
rental revenues
|
1,472,918 | 1,616,153 | 1,676,349 | |||||||||
|
Other
|
18,681 | 20,966 | 17,715 | |||||||||
|
Total
revenues from U.S. and
|
||||||||||||
|
Canadian
Corporate Operations
|
$ | 1,491,599 | $ | 1,637,119 | $ | 1,694,064 | ||||||
|
As
of December 31,
|
||||||||||||
| 2009 | 2008 | 2007 | ||||||||||
|
Rental
locations (U.S. and Canada):
|
||||||||||||
|
Dollar
|
151 | 181 | 213 | |||||||||
|
Thrifty
|
145 | 219 | 253 | |||||||||
|
Total
corporate rental locations
|
296 | 400 | 466 | |||||||||
Franchising
United
States and Canada
Both
Dollar and Thrifty sell U.S. franchises on an exclusive basis for specific
geographic areas, generally outside the top 75 U.S. airport
markets. Most franchisees are located at or near airports that
generate a lower volume of vehicle rentals than the airports served by
company-owned stores. In Canada, Dollar and Thrifty sell franchises
in markets generally outside the top eight airport markets. The
typical length of a franchise is ten years with a renewal option for five years
if certain conditions are met. The franchisee may terminate the
franchise for convenience upon 120 days written notice and Dollar and Thrifty
may terminate upon breach of the agreement or for cause as defined in the
agreement.
Dollar
and Thrifty offer franchisees the opportunity to dual franchise in smaller U.S.
and Canadian markets. Under a dual franchise, one franchisee can
operate both the Dollar and the Thrifty brand, thus allowing them to generate
more business in their market while leveraging fixed costs.
- 10
-
Dollar
and Thrifty license to franchisees the use of their respective brand service
marks in the vehicle rental and leasing and parking
businesses. Franchisees of Dollar and Thrifty pay an initial
franchise fee generally based on the population, number of airline passengers,
total airport vehicle rental revenues and the level of any other vehicle rental
activity in the franchised territory, as well as other
factors. Dollar and Thrifty offer their respective franchisees a wide
range of products and services which may not be easily or cost effectively
available from other sources.
Due to
the continued weak economic environment and volatile credit markets, some of the
Company’s franchisees have experienced financial challenges. During
2009, a limited number of franchisees have either closed or consolidated their
operations, resulting in reduced fee revenue to the Company and a potential for
increased bad debt exposure on amounts owed by franchisees.
System
Fees in the U.S.
Dollar - In addition to an
initial franchise fee, each Dollar U.S. franchisee is generally required to pay
a system fee equal to 8% of rental revenue at airport locations and 6% at
suburban operations.
Thrifty - In addition to the
initial franchise fee, each Thrifty U.S. franchisee pays a fee generally ranging
from 5.5% to 8% of base rental revenue.
System
Fees in Canada
All
Dollar and Thrifty Canadian franchisees whether operating a single-brand or
co-brand location pay a monthly fee generally equal to 8% of rental
revenue.
Franchisee
Services and Products
Dollar
and Thrifty provide their U.S. and Canadian franchisees a wide range of products
and services, including reservations, marketing programs and assistance, branded
supplies, image and standards, rental rate management analysis and customer
satisfaction programs. Additionally, Dollar and Thrifty offer their respective
franchisees centralized corporate account and tour billing and travel agent
commission payments.
|
Summary
of U.S. and Canada Franchise Operations Data
|
|||||
|
As
of December 31,
|
|||||
|
2009
|
2008
|
2007
|
|||
|
Franchisee
locations:
|
|||||
|
Dollar
|
131
|
143
|
146
|
||
|
Thrifty
|
186
|
198
|
219
|
||
|
Total
franchisee locations
|
317
|
341
|
365
|
||
|
Franchisee
agreements:
|
|||||
|
Dollar
|
80
|
92
|
92
|
||
|
Thrifty
|
101
|
130
|
142
|
||
|
Total
franchisee agreements
|
181
|
222
|
234
|
||
International
Dollar
and Thrifty offer master franchises outside the U.S. and Canada, generally on a
countrywide basis. Each master franchisee is permitted to operate
within its franchised territory directly or through
subfranchisees. At December 31, 2009, exclusive of the U.S. and
Canada, Dollar had franchised locations in 60 countries and Thrifty had
franchised locations in 75 countries. These locations are in Latin
America, Europe, the Middle East, and the Asia-Pacific regions. The Company
offers franchisees the opportunity to license the rights to operate either the
Dollar or the Thrifty brand or both brands in certain markets on a dual
franchise or co-brand basis.
- 11
-
Revenue
generated by the Company from franchised operations
outside the U.S. and Canada totaled $10.5 million in 2009, comprised primarily
of system, reservation and advertising fees.
Thrifty
Car Sales
Thrifty
Car Sales provides an opportunity to franchised rental service providers to
enhance or build their used car operations under a well-recognized national
brand name. In addition to the use of the brand name, dealers have
access to a variety of products and services offered by Thrifty Car
Sales. These products and services include participation in a full
service business development center, a nationally supported Internet strategy
and Web site, operational and marketing support, vehicle supply services and
customized retail and wholesale financing programs as well as national accounts
and supply programs. At December 31, 2009, Thrifty Car Sales had 35
franchise locations.
Other
Services
Supplemental Equipment and Optional
Products – Dollar and Thrifty rent global positioning system (GPS)
equipment, ski racks, infant and child seats and other supplemental equipment,
offer a Rent-a-Toll product for electronic toll payments, sell pre-paid gasoline
and roadside emergency benefit programs (Road Safe and TripSaver) and, subject
to availability and applicable local law, make available loss damage waivers and
insurance products related to the vehicle rental.
Parking Services – Airport
parking operations are a natural complement to vehicle rental operations. The
Company operates 16 corporate parking operations.
Supplies and National Account
Programs – The Company makes bulk purchases of items used by its
franchisees, which it sells to franchisees at prices that are often lower than
they could obtain on their own. The Company also negotiates national account
programs to allow its franchisees to take advantage of volume discounts for many
products or services such as tires, glass and long distance telephone and
overnight mail services.
Reservations
The
Internet is the primary source of reservations for the Company. For
the year ended December 31, 2009, approximately 78% of the Company’s total
non-tour reservations came through the Internet, increasing from approximately
76% in 2008. During 2009, the Company’s Internet Web sites
(dollar.com and thrifty.com) provided approximately 46% of total non-tour
reservations. Third-party Internet sites provided 32% of non-tour reservations,
with two third-party sites each providing approximately 11% of total non-tour
reservations and the remainder coming from various smaller sites. The
remaining non-tour reservations were primarily provided by the reservation call
centers and travel agents. The Company outsources a significant
portion of its call center operations to PRC, a global leader in the operation
of outsourced call centers. In addition, the Company still maintains
some call center operations at its Tahlequah, Oklahoma
facility. Dollar and Thrifty reservation systems are linked to all
major airline reservation systems and to travel agencies in the U.S., Canada and
abroad.
Marketing
Dollar
and Thrifty are positioned as value car rental companies in the travel industry,
providing on-airport convenience with low rates on quality
vehicles. Customers who rent from Dollar and Thrifty are
cost-conscious leisure, government and business travelers who want to save money
on car rentals without compromising the quality of car rental products and
services.
Dollar
and Thrifty acquire these value-oriented customers through a multi-faceted
marketing approach that involves traditional and Internet advertising, Internet
search marketing, sales teams, strategic marketing partners, and investments in
traditional and emerging distribution channels. Each of these
disciplines has a specific focus on selected customer segment
opportunities.
- 12
-
Strategic
Marketing Partners
Dollar
and Thrifty have aligned themselves with certain strategic marketing partners to
facilitate the growth of their business.
Dollar
has strong relationships with many significant international tour operators and
brokers who specialize in inbound travel to the U.S., as well as domestic tour
operators, who generate inbound business to Hawaii, Florida and other leisure
destinations.
Major
travel agents and consortia operate under preferred supplier agreements with
Dollar and Thrifty. Under these agreements, Dollar and Thrifty
provide travel agency groups additional commissions or benefits in return for
featuring Dollar and Thrifty
in their advertising or giving Dollar and Thrifty a priority in their
reservation systems. In general, these arrangements are not exclusive
to Dollar and Thrifty.
Both
Dollar and Thrifty have also developed strategic partnerships with certain
hotels, credit card companies, and with most U.S. airlines through participation
in airline frequent flyer programs. In addition, Dollar and Thrifty
actively participate with our partner airlines in their respective branded Web
sites.
Internet
Marketing and Distribution Channels
Dollar
and Thrifty focus on Internet advertising and marketing, which continues to be
the most cost-efficient means of reaching travel customers. Dollar
and Thrifty promote their respective brands via Internet banner advertising,
keywords and rate guarantees to encourage travelers to book reservations on
their own branded sites, dollar.com and thrifty.com. In addition,
Dollar and Thrifty both continue to make technology investments in their
respective Web sites, dollar.com and thrifty.com, to provide enhancements to
best meet their customer’s changing travel needs.
In 2009,
to provide a more personal and relevant customer experience, Dollar and Thrifty
began online targeted behavioral marketing to consumers on the site and to our
email subscribers utilizing both online and offline data. The Company
believes that this type of targeted marketing can increase the probability and
frequency of reservations and deepen customer loyalty through frequent contact
with customers, including the promotion of special offers and
programs. From a new product perspective, dollar.com and thrifty.com
launched the ability to reserve commonly requested rental options such as GPS
units and toll passes.
Dollar
and Thrifty are among the leading car rental companies in direct-connect
technology, which bypasses global distribution systems and reduces reservation
costs. Dollar and Thrifty have entered into direct-connect
relationships with certain airline and other travel partners.
In
addition, Dollar and Thrifty are featured with numerous national online booking
agents where customers frequently shop for travel services and are in regular
discussions with owners of other emerging travel channels to secure inclusion of
the Dollar and Thrifty brands in those channels.
Dollar
and Thrifty have made filings under the intellectual property laws of
jurisdictions in which they and their respective franchisees operate, including
the U.S. Patent and Trademark Office, to protect the names, logos and designs
identified with Dollar and Thrifty. These marks are important for
customer brand awareness and selection of Dollar and Thrifty for vehicle rental
and for dollar.com and thrifty.com for reservation services.
Customer
Service
The
Company’s commitment to delivering consistent customer service is a key element
of our strategy. At its headquarters and in company-owned stores, the Company
has programs involving customer satisfaction training and team-based problem
solving focused on improving customer service. The Company’s customer service
centers measure customer service through third-party customer satisfaction
surveys, track service quality trends, respond to customer inquiries and provide
recommendations to senior management and vehicle rental location management. The
Company conducts initial and ongoing training
for headquarters, company-owned store and franchisee employees, using
professional trainers, performance coaches and computer-based training
programs.
- 13
-
Information
Systems
The
Company depends upon a number of core information systems to operate its
business, primarily its counter automation, Web sites, distribution network,
reservations, fleet and revenue management systems. The counter automation
system in company-owned stores processes rental transactions, facilitates the
sale of additional products and services and facilitates the monitoring of the
fleet and financial assets. The Company also relies on a revenue management
system that enables the Company to better determine rental demand based on
historical reservation patterns and adjust its rental rates accordingly. The
Company’s Internet Web sites and various distribution networks allow the
Company’s products to be marketed and reserved directly or through our various
channel partners.
The
Company continues to invest in new business system capabilities to facilitate
operations and reduce operating costs to operate them. In 2009, the
Company deployed a new counter automation system, redesigned and enhanced Web
sites and upgraded the revenue management system to incorporate new products and
handle greater volumes. The Company also deployed newer technologies,
consolidated platforms and renegotiated key supplier agreements that helped
reduce ongoing information technology (“IT”) operating
cost.
Hewlett-Packard Company (“HP”) provides the
majority of the Company’s IT services, including applications development
and maintenance, network, workplace and storage management, back-up and recovery
and mid-range hosting services. HP also manages and monitors the
majority of the Company’s data network and its daily information
processing. The Company’s counter automation, reservations, revenue
management, Internet Web sites and fleet processing systems are housed in a
secure underground HP facility in Oklahoma designed to withstand
disasters.
U.S.
franchisees receiving a certain volume of reservations are required to use an
approved automated counter system. In addition to providing an
electronic data link with the Company’s worldwide reservations centers, the
automated counter system produces rental agreements and provides the Company and
its franchisees with customer and vehicle inventory information as well as
financial and operating reports.
Fleet
Acquisition and Management
Vehicle
Supply
In August
2009, the Company and Chrysler executed a new vehicle supply agreement (the “New
VSA”) covering vehicle purchases through model year
2012. Historically, Dollar and Thrifty maintained U.S. vehicle supply
agreements with Chrysler, which included a 75% minimum purchase requirement. The
New VSA replaces the 75% minimum purchase requirement with a minimum vehicle
fixed volume requirement per model year, which is expected to be
significantly less than 75% of vehicle purchases.
In
February 2009, the Company signed a secondary vehicle supply agreement with Ford
that, beginning with the 2009 model year, will allow the Company to source a
portion of its annual vehicle purchases, with certain minimum and maximum
volumes, through Ford until August 2012. This agreement may be
renewed for a three-year term, upon written agreement by the Company and Ford
prior to August 31, 2012. In February 2010, the Company extended its
vehicle supply agreement with Ford until August 2013. In addition,
the Company has a vehicle purchase agreement for model year 2010 vehicles with
General Motors.
For the
2009 model year, Chrysler vehicles represented approximately 63% of the total
U.S. fleet purchases by DTG Operations. The Company expects that for
the 2010 model year, Ford, Chrysler and General Motors, will represent
approximately 34%, 30% and 20%, respectively, of total U.S. fleet purchases of
DTG Operations.
- 14
-
Vehicle
Residual Value Risk
Vehicle
depreciation is the largest single cost element in the Company’s operations, and
is dependent upon the future residual values of vehicles in the fleet, in
addition to the overall mix of Program and Non-Program Vehicles.
DTG
Operations primarily purchases Non-Program Vehicles, for which it bears the full
residual value risk because the vehicles are not covered by a manufacturer’s
Residual Value Program. Non-Program Vehicles typically have lower
acquisition costs and lower depreciation rates than comparable Program Vehicles,
and also allow the Company to reduce its risk related to the creditworthiness of
the vehicle manufacturers. The manufacturer does not set any terms or
conditions on the resale of Non-Program Vehicles other than requiring minimum
holding periods. At December 31, 2009, approximately 95% of all
vehicles operated by DTG Operations were Non-Program Vehicles.
Under
Residual Value Programs, the manufacturer either guarantees the aggregate
depreciated value upon resale of covered vehicles of a given model year, or
agrees to repurchase vehicles at specified prices during established repurchase
periods. These programs provide the Company with a guaranteed
depreciation rate per vehicle during the holding period, while minimizing the
Company’s residual value risk.
As the
level of Non-Program Vehicles in the fleet has increased, the Company has
assumed additional risk related to fluctuations in the residual value of the
vehicle, and has increased its reliance on the used vehicle
markets. Residual values depend on levels of supply and demand for
both new and used vehicles and directly affect vehicle depreciation
rates. The level of the Company’s future investment in Program
Vehicles will depend on the availability and attractiveness of Residual Value
Programs.
Vehicle
Remarketing
DTG
Operations typically holds Program Vehicles in rental service for approximately
six to seven months. Generally, Program Vehicles must be removed from
service before they reach 30,000 miles to avoid excess mileage penalties under
manufacturers’ Residual Value Programs. DTG Operations must bear the
risk on the resale of Program Vehicles that cannot be returned.
DTG
Operations historically has held Non-Program Vehicles in rental service for
approximately ten months but extended holding periods in 2009 to approximately
18 to 20 months. DTG Operations remarketed 67% of its Non-Program
Vehicles through auctions and 33% directly to used car dealers, wholesalers and
its franchisees during the year ended December 31, 2009.
Fleet
Management
The
Company utilizes fleet optimization software (the “Pros Fleet Management
Software”) from PROS Holdings, Inc., a leading provider of pricing and revenue
optimization software. The Pros Fleet Management Software allows the
Company to improve fleet planning and efficiencies in its vehicle acquisition
and remarketing efforts.
Vehicle
Financing
The
Company requires a substantial amount of debt to finance the purchase of
vehicles used in its rental fleets. The Company primarily utilizes
asset backed medium term notes to finance its vehicles. Under these
programs, the Company is required to provide collateral at different levels
depending on whether vehicle manufacturers maintain investment grade or
non-investment grade credit ratings, and whether inventory is comprised of
Program Vehicles or Non-Program Vehicles. See Item 8 - Note 10 of
Notes to Consolidated Financial Statements.
Fleet
Leasing Programs
DTG
Operations has historically made fleet leasing programs available to Dollar and
Thrifty U.S. and Canadian franchisees for each new model year. For
the 2009 model year, this program was offered to franchisees on a limited basis
due to constrained financing capacity and instability in the credit
markets.
- 15
-
For the
2010 model year, fleet leasing will again be offered on a limited basis to U.S.
and Canadian franchisees.
|
U.S.
Fleet Data
|
|||||
|
Year
Ended December 31,
|
|||||
|
2009
|
2008
|
2007
|
|||
|
DTG
|
|||||
| Average number of vehicles leased to | |||||
|
franchisees
|
1,666
|
2,754
|
4,309
|
||
| Average number of vehicles in | |||||
|
combined fleets of franchisees
|
15,382
|
18,171
|
22,696
|
||
| Average number of vehicles in combined | |||||
|
fleets of company-owned stores
|
99,223
|
115,129
|
117,488
|
||
|
Total
|
114,605
|
133,300
|
140,184
|
||
Competition
There is
intense competition in the vehicle rental industry on the basis of price,
service levels, vehicle quality, vehicle availability and the convenience and
condition of rental locations. Dollar and Thrifty and their
franchisees operate mainly in the U.S. airport market, relying on leisure, tour
and small business customers. In addition to local and regional
vehicle rental companies, Dollar and Thrifty and their franchisees’ principal
competitors are Alamo, Avis, Budget, Enterprise, Hertz and
National.
The
Canadian vehicle rental markets are also intensely competitive. Most of the
Canadian market is operated either directly or through franchisees of the major
U.S. vehicle rental companies, including Alamo, Avis, Budget, Enterprise, Hertz
and National, as well as Dollar and Thrifty.
Insurance
The
Company is subject to third-party bodily injury liability and property damage
claims resulting from accidents involving its rental vehicles. In
2007, the Company retained the risk of loss up to $4.0 million per occurrence
for public liability and property damage claims, plus a self-insured corridor of
$1.0 million per occurrence for losses in excess of $4.0 million with an
aggregate limit of $7.0 million for losses within this corridor. In
February 2008, the Company increased its retained risk of loss up to $5.0
million per occurrence and in February 2009, the Company further increased its
retained risk of loss up to $7.5 million per occurrence for public liability and
property damage claims, including third-party bodily injury and property
damage. The Company maintains insurance coverages at certain amounts
in excess of its retained risk. The Company retains the risk of loss
on supplemental liability insurance sold to vehicle rental
customers.
The
Company retains risk of loss up to $5.0 million for general and garage
liability. The Company retains the risk of loss for any catastrophic
and comprehensive damage to its vehicles. In addition, the Company
carries workers' compensation coverage with retentions in various amounts up to
$500,000. The Company also carries excess liability and directors'
and officers' liability insurance coverage.
Provisions
for bodily injury liability and property damage liability on self-insured claims
and for supplemental liability insurance claims (collectively referred to as
“Vehicle Insurance Reserves”) are made by charges to expense based upon periodic
actuarial evaluations of estimated ultimate liabilities on reported and
unreported claims. As of December 31, 2009, the Company had Vehicle
Insurance Reserves of $108.6 million. The Company’s obligations to
pay insurance related losses and indemnify the insurance carriers for fronted
policies are collateralized by surety bonds and letters of credit. As of
December 31, 2009, these letters of credit and surety bonds totaled
approximately $52.7 million and $3.4 million, respectively.
- 16
-
The
Company also maintains various letters of credit and surety bonds to secure
performance under airport concession agreements and other obligations which
totaled approximately $18.6 million and $37.4 million, respectively, as of
December 31, 2009.
Regulation
Loss
Damage Waivers
Loss
damage waivers relieve customers from financial responsibility for vehicle
damage. Legislation affecting the sale of loss damage waivers has been adopted
in 25 states. These laws typically require notice to customers that
the loss damage waiver may duplicate their own coverage or may not be necessary,
limit customer responsibility for damage to the vehicle or cap the price charged
for loss damage waivers. Adoption of national or additional state
legislation affecting or limiting the sale, or capping the rates, of loss damage
waivers could result in the loss of this revenue for Dollar, Thrifty and their
franchisees.
Franchising
Regulation
As
franchisors, Dollar and Thrifty are subject to federal, state and foreign laws
regulating various aspects of franchise operations and sales. These laws impose
registration and disclosure requirements on franchisors in the offer and sale of
franchises and, in certain states, also apply substantive standards to the
relationship between the franchisor and the franchisee, including those
pertaining to default, termination and non-renewal of franchises.
Other
Matters
Certain
states previously made vehicle owners (including vehicle rental companies)
vicariously liable for the actions of any person lawfully driving an owned
vehicle, regardless of fault. Until August 10, 2005, when a change in the
vicarious liability law was imposed, some of these states, primarily New York,
did not limit this liability. With the passage of the federal “Highway Bill”, unlimited vicarious
liability for vehicle rental and leasing companies has been removed, thus,
limiting exposure to state minimum financial responsibility
amounts. Vehicle rental companies are also subject to various
federal, state and local consumer protection laws and regulations including
those relating to advertising and disclosure of charges to
customers.
Dollar
and Thrifty are subject to federal, state and local laws and regulations
relating to taxing and licensing of vehicles, franchise sales, franchise
relationships, vehicle liability, used vehicle sales, insurance,
telecommunications, vehicle rental transactions, environmental protection,
privacy and labor matters. The Company believes that Dollar’s and Thrifty’s
practices and procedures are in substantial compliance with federal, state and
local laws and is not aware of any material expenditures necessary to meet legal
or regulatory requirements. Nevertheless, considering the nature and scope of
Dollar’s and Thrifty’s businesses, it is possible that regulatory compliance
problems could be encountered in the future.
Environmental
Matters
The
principal environmental regulatory requirements applicable to Dollar and Thrifty
operations relate to the ownership, storage or use of petroleum products such as
gasoline, diesel fuel and new and used motor oil; the treatment or discharge of
waste waters; and the generation, storage, transportation and off-site treatment
or disposal of waste materials. Dollar and Thrifty own 23 and lease 128
locations where petroleum products are stored in underground or above-ground
tanks. For owned and leased properties, Dollar and Thrifty have programs
designed to maintain compliance with applicable technical and operational
requirements, including leak detection testing of underground storage tanks, and
to provide financial assurance for remediation of spills or
releases.
The
historical and current uses of the Dollar and Thrifty facilities may have
resulted in spills or releases of various hazardous materials or wastes or
petroleum products (“Hazardous Substances”) that now, or in the future,
could require remediation. The Company may also be subject to
requirements related to remediation of Hazardous Substances that have been
released into the environment at properties it owns or operates, or owned or
operated in the past, or at properties to which it sends, or has sent, Hazardous
Substances
for treatment or disposal. Such remediation requirements generally are imposed
without regard to fault and liability for any required environmental remediation
can be substantial.
- 17
-
Dollar
and Thrifty may be eligible for reimbursement or payment of remediation costs
associated with releases from registered underground storage tanks in states
that have established funds to assist in the payment of such remediation costs.
Subject to certain deductibles, the availability of funds, the compliance status
of the tanks and the nature of the release, these tank funds may be available to
Dollar and Thrifty for use in remediating releases from their tank
systems.
At
certain facilities, Dollar and Thrifty are investigating or remediating soil or
groundwater contamination. Based on currently available information, the Company
does not believe that the costs associated with environmental investigation or
remediation will be material. However, additional contamination could
be identified or occur in the future.
The use
of automobiles and other vehicles is subject to various governmental
requirements designed to limit environmental damage, including that caused by
emissions and noise. Generally, these requirements are met by the
manufacturer except, on occasion, equipment failure requiring repair by the
Company.
Environmental
legislation and regulations and related administrative policies have changed
rapidly in recent years. There is a risk that governmental
environmental requirements, or enforcement thereof, may become more stringent in
the future and that the Company may be subject to additional legal proceedings
at other locations brought by government agencies or private parties for
environmental matters. In addition, with respect to cleanup of
contamination, additional locations at which wastes generated by the Company may
have been released or disposed, and of which the Company is currently unaware,
may in the future become the subject of cleanup for which the Company may be
liable, in whole or part. Accordingly, while the Company believes
that it is in substantial compliance with applicable requirements of
environmental laws, there can be no assurance that the Company’s future
environmental liabilities will not be material to the Company’s consolidated
financial position or results of operations or cash flows.
Employees
As of
December 31, 2009, the Company employed approximately 6,000 full-time and
part-time employees. Approximately 200 of the Company’s employees
were subject to collective bargaining agreements as of December 31, 2009. The
Company believes its relationship with its employees is good.
|
RISK
FACTORS
|
Expanding
upon the factors discussed in the Forward-Looking Statements section provided at
the beginning of this Annual Report on Form 10-K, the following are important
factors that could cause actual results or events to differ materially from
those contained in any forward-looking statements that we made. Risks
that we do not know about could arise and issues we now view as minor could
become more important. If we are unable to adequately respond to any
of these risks, our financial condition and results of operations could be
materially adversely affected.
Economic
Conditions
Our
results are dependent on general economic conditions in the U.S. and Canada, our
principal markets, and on the U.S. automotive industry in particular. Adverse
economic conditions negatively impacted our operations in 2008 and 2009, and
necessitated significant actions to mitigate their impact, including reductions
in our rental fleet in response to declining demand, and reduction in our
workforce. While the economic outlook for 2010 has improved slightly, as
compared to 2009, the timing and strength of a recovery remains uncertain, and
we believe that consumer confidence and spending levels will remain at
relatively low levels, including spending on leisure travel from which we derive
a significant portion of our revenues.
Adverse
economic conditions have also affected some of our customers and franchisees.
For example, in 2008, one of our largest tour operator customers filed for
bankruptcy. Additionally, some of our franchisees experienced financial
challenges and a limited number of them either closed or consolidated their
operations in 2009. These circumstances have resulted in reduced fee
revenue to the Company
and a potential for increased bad debt exposure. Depending on the timing and
strength of a recovery, we may lose other customers or our franchisees may
become unable to meet their payment obligations to us.
- 18
-
Liquidity
Considerations
In 2009,
our primary objective was to preserve liquidity and enhance operating cash flow
to ensure our flexibility to withstand continued adverse economic conditions in
2009 and the potential that these conditions could persist in
2010. The actions we have taken may not be adequate if economic
conditions deteriorate further or do not improve in line with our
expectations. In that event, we may need to take additional material
actions, including further reductions in our fleet that could in turn cause
disruptions to our business, operations and prospects, which could in turn
adversely affect our cash flow and liquidity.
Vehicle
Financing Considerations
We depend
on the capital markets for financing our vehicles using primarily asset backed
medium term notes. We use cash and letters of credit under our bank loan
facility to provide enhancement collateral for these asset backed medium term
notes. We expect to have substantial debt and debt service
requirements in the foreseeable future.
The
financial crisis that began in 2008 affected our access to financing and our
results. In late 2008 and 2009, we amended our credit arrangements
repeatedly to address matters affecting our covenant compliance, the impact of
the bankruptcy of Chrysler and a potential event of bankruptcy relating
to any monoline or bond insurer that provides credit support for our
medium term note obligations (“Monoline”). As a condition to some of these
amendments, we reduced outstanding debt and agreed to permanent reductions in
the lending commitments. If a default were to occur under our financing
arrangements, our lenders could be entitled to accelerate our repayment of
outstanding debt and exercise their remedies against any collateral securing the
debt, all of which would have a material adverse effect on our results,
financial condition and prospects. An event of bankruptcy by one or more of the
Monolines could also result in accelerating the payoff schedule of a portion or
all of those notes.
Collateral
requirements for our credit arrangements vary depending on the manufacturer’s
credit rating and whether the vehicle is a risk vehicle or is covered by a
manufacturer's Residual Value Program. We substantially increased the level of
risk vehicles in our fleet in 2009 and expect that risk vehicles will account
for approximately 90% to 95% of our fleet in 2010. If the residual
value of our risk vehicles declines significantly or we experience cumulative
losses on disposition of a specified percentage of our fleet, we could be
required to increase the monthly depreciation payments under our asset backed
medium term notes during the remaining life of the vehicles, increase the level
of collateral enhancement, or both. These payments would reduce our
liquidity available for other purposes.
We
believe conditions in the asset backed medium term note market have improved
during late 2009, and we expect to have adequate access to the credit markets to
fund our operations and refinance existing debt. We believe that any
new financing could bear higher interest rates and require a substantially
higher collateral enhancement rate than our current asset backed medium term
notes. Our ability to provide increased collateral enhancement with
respect to future debt will depend on the amount of operating cash and letters
of credit available to us. In the event we are unable to meet these
higher collateral requirements, we will be required to reduce the size of our
financing and our operating fleet, which could in turn negatively affect our
operations, results and prospects. In addition, our financing costs affect the
amount we must charge our customers to be profitable. Interest rates on future
debt issuances that exceed our current effective rates could adversely affect
our results if we are unable to pass those costs through to our customers or if
we lose customers to competitors due to increased rental rates.
Dependence
on Domestic Automotive Manufacturers
The
domestic automotive industry has been materially adversely affected by
recessionary conditions in 2008 and 2009, with two of the
three manufacturers restructuring their operations under U.S.
bankruptcy laws. Historically, Chrysler has been our principal
vehicle supplier and, while we have diversified our suppliers as part of our
2010 vehicle ordering cycle, we will remain highly dependent
on the domestic automotive manufacturers with approximately 84% of our
2010 orders attributable to Ford, Chrysler and General Motors. It
remains uncertain whether actions by these companies, coupled with the impact of
federal assistance they have received and other governmental stimulus programs
will be sufficient to withstand continued pressures on the domestic automotive
manufacturers.
- 19
-
We have
exposure to these manufacturers in three primary areas: their ability
to manufacture and deliver vehicles to us in a timely manner for use in our
operations; the level of residual values of their vehicles in the overall used
vehicle market, which could be adversely impacted by negative public perception
regarding their products or financial prospects and in turn affect our vehicle
depreciation costs and collateral requirements; and their ability to meet
financial obligations to us for Residual Value Programs and other
purchase-related incentives. If any of these companies experiences
significant financial difficulties, fails to meet its financial or supply
obligations to us, or is forced to seek protection under applicable bankruptcy
laws, our results, financial position, cash flow and prospects could be
materially adversely affected.
Highly
Competitive Nature of the Vehicle Rental Industry
In
addition to local and regional vehicle rental companies, the vehicle rental
industry primarily consists of eight major brands, all of which compete
intensely for rental customers based on price and service. The
Internet has increased brand exposure and gives more details on rental prices to
consumers and increases price competition, requiring companies to be highly
competitive in pricing in order to attract consumers. In addition to
consumer demand, pricing in the industry is significantly impacted by the size
of the rental fleets and the supply of vehicles available to consumers in the
market. While we have achieved improvements in our pricing as part of
our strategic focus on return on assets in addition to the overall fleeting
actions taken by the industry to balance supply with demand, we cannot provide
assurance that we will continue to realize improved pricing or whether our
attempts to do so will further adversely affect transaction days. A
significant increase in the supply of rental vehicles available in the market
due to fleet actions taken by our competitors, or actions by our competitors to
significantly reduce their prices in order to increase market share could
negatively affect our pricing and other operating plans in material ways and
adversely affect our results and prospects.
Risks
Relating to Event of Bankruptcy with Respect to the Monolines
Our
obligations under our asset backed medium term notes are supported by the
Monolines, which have faced significant financial challenges and credit
downgrades as a result of constrained financial markets. The Monolines have
undertaken significant restructuring actions and the financial guaranty industry
as a whole continues to face substantial pressures. An event of
bankruptcy with respect to any of the Monolines could trigger an amortization of
our obligations under the affected medium term notes, which would require a more
rapid repayment of those notes, and could also (subject to certain conditions)
result in cross-defaults under certain of our other financing agreements.
Although conditions in the asset backed credit market have improved in recent
months, there is no assurance that those conditions will continue or that we
would be able to access the markets in a timely manner in order to refinance the
affected notes, and if we are unable to do so, we would need to take immediate
action to preserve our operations. These actions could include further extending
the holding period of our vehicles to maximize their useful life prior to sale,
as well as further reductions of our operations and workforce. These and other
actions we may take may not be successful to enable us to meet our obligations
under the affected notes and, even if successful, they would likely have an
adverse affect on our results and cash flow available to fund ongoing
operations. If we curtailed our operations, our ability to compete effectively
would also be adversely affected.
Exposure
to Used Vehicle Market Conditions
We
retained the used car market value risk on approximately 95% of our vehicles at
December 31, 2009 and expect that risk vehicles will account for approximately
90% to 95% of our fleet in 2010. The depreciation costs for these
vehicles are highly dependent on used car prices at the time of sale, requiring
us to make assumptions regarding the age and mileage of the vehicles at the time
of disposal, as well as the general used vehicle auction market. The
costs of our risk vehicles may be materially affected by the relative strength
of the used car market, particularly the market for one to two year old used
cars. A decline in the prices at which we sell risk vehicles could have an
adverse impact on our fleet holding
costs and results of operations.
- 20
-
Throughout
2008, the used car market experienced significant volatility and an overall
decline in residual values, including many types of vehicles in our fleet. While
the market has experienced improving trends during 2009, the strength and
duration of further improvement in 2010 remains uncertain. In the
event of renewed pricing pressure in the used car market, our results could be
materially and adversely affected. Operating more risk vehicles could
also have a negative impact on the vehicle utilization and profitability if we
are unable or elect not to sell those vehicles in periods of weaker rental
demand.
Like-Kind
Exchange Program
We use a
like-kind exchange program for our vehicles where we dispose of our vehicles and
acquire replacement vehicles in such a way that we defer the gain on these
dispositions for tax purposes. The use of this like-kind exchange program has
allowed us to defer a material amount of federal and state income taxes
beginning in 2002. In order to obtain the benefit of the deferral of the gains
on disposal of our vehicles, we must acquire replacement vehicles within a
specified time frame, and must also maintain or increase the overall size of our
fleet comparable to the prior tax year. Our ability to defer the gains on the
disposition of our vehicles under our like-kind exchange program will be
affected by the recent significant downsizing of our fleet. We utilized existing
federal net operating loss (“NOL”) carryforwards to offset the majority of these
gains; however, the taxable gains exceeded the available federal NOL
carryforwards and resulted in cash tax payments during 2009 tax
year. Projection of the results of the like-kind exchange process is
complex, requires numerous assumptions and is not subject to precise
estimation. Actual results depend upon future sale and purchase
transactions extending up to 180 days after year-end and actual results may
differ from current projections. Increased cash tax payments may be
incurred in 2010 and beyond, depending on future vehicle purchase and sale
transactions.
Dependence
on Air Travel
We get
approximately 90% of our rental revenues from airport locations and airport
arriving customers. The number of airline passengers has a significant impact on
our business. Mergers and acquisitions in the airline industry, airline
restructuring through bankruptcy, and continued challenging economic conditions
are causing airlines to further reduce flight schedules which could adversely
impact the number of airline passengers. The airline industry has also faced
considerable challenges in light of current global economic conditions and an
overall decline in air travel. In 2009, airline enplanements decreased
approximately 5%. A further significant reduction in airline
passengers or any event that significantly disrupts air travel could negatively
impact our results.
Concentration
in Leisure Destinations
We have a
significant presence in key leisure destinations and earn a large portion of our
revenue from these markets. Rental revenue from Florida, Hawaii, California and
Texas represented approximately 56% of our total rental revenue for the year
ended December 31, 2009. The severe decline in consumer spending in recent
periods has materially adversely affected leisure travel and can be expected to
continue to do so in the foreseeable future. Reductions in leisure travel
resulting from natural disasters, terrorist acts, or other factors could also
have a material adverse impact on our results.
Seasonality
Our
business is subject to seasonal variations in customer demand, with the summer
vacation period representing the peak season for vehicle rentals. In 2009, the
second and third quarters were adversely affected by low levels of consumer
confidence and spending. Any event that disrupts rental activity, fleet supply,
or industry fleet capacity during these quarters could have a disproportionately
material adverse effect on our liquidity, our cash flows and/or our results of
operations in those periods and for the full year.
Customer
Surcharges
In almost
every state, we recover various costs associated with the title and registration
of our vehicles and, where permitted, the concession cost imposed by airport
authorities or the owners and/or operators of the premises from which our
vehicles are rented. Consistent with industry-wide business practices,
we separately state these additional surcharges in our rental agreements and
invoices and disclose the existence of these surcharges to customers together
with an estimated total price, inclusive of these surcharges, in all
distribution channels.
- 21
-
This
standard practice complies with the Federal Trade Commission Act and has been
upheld by several courts. However, there are several legislative proposals in
certain states that, if enacted, would define which surcharges are permissible
and establish calculation formulas that may differ from the manner in which we
set our surcharges.
Enactment
of any of these proposals could restrict our ability to recover all of the
surcharges we currently charge and may have a material adverse impact on our
results of operations.
Laws
and Regulations
We are
subject to a wide variety of laws and regulations in the U.S. and Canada and
other jurisdictions in which we operate, and changes in the level of government
regulation of our business have the potential to materially alter our business
practices and adversely affect our financial position and results of
operations, including our profitability. Depending on the jurisdiction,
those changes may come about through new legislation, the issuance of new laws
and regulations or changes in the interpretation of existing laws and
regulations by a court, regulatory body or governmental official.
Optional
insurance products, including supplemental liability insurance, personal
accident insurance and personal effects protection, we offer to renters
providing various insurance coverages in our domestic vehicle rental operations
are regulated under state laws governing the licensing of such products. Any
changes in U.S. or foreign law that change our operating requirements with
respect to optional insurance products could increase our costs of compliance or
make it uneconomical to offer such products, which would lead to a reduction in
revenue. As a result of any changes in these laws or otherwise, if customers
decline to purchase supplemental liability insurance products through us, our
results of operations could be materially adversely affected.
The U.S.
Congress and other legislative and regulatory authorities in the U.S. and
internationally have considered, and will likely continue to consider, numerous
measures related to climate change and greenhouse gas emissions. Should rules
establishing limitations on greenhouse gas emissions or rules imposing fees on
entities deemed to be responsible for greenhouse gas emissions become effective,
demand for car rental services could be affected, or our vehicle costs and/or
other costs could increase and our business could be adversely
affected.
Fuel
Costs
Prices
for petroleum-based products, including gasoline, have experienced significant
volatility in recent periods and affected automotive travel patterns in material
ways. A variety of factors, including the current economic environment and
geopolitical unrest in oil-producing nations, could cause further price
volatility. Limitations in fuel supplies or significant increases in fuel prices
could have an adverse effect on our financial condition, results of operations
and cash flows, either by directly discouraging customers from renting cars,
causing a decline in airline passenger traffic, or increasing our operating
costs, if these increased costs cannot be passed through to our
customers.
Dependence
on Third-Party Internet Sales
The
Internet has had a significant impact on the way travel companies get
reservations. For 2009 and 2008, we received 78% and 76% of our non-tour
reservations from the Internet, respectively, with 46% and 44%, respectively,
coming from our own Internet Web sites, dollar.com and thrifty.com. The
remaining portion of non-tour reservations derived from the Internet were
provided by third-party sites with two third-party sites each providing
approximately 11% of non-tour reservations and the remainder coming from various
smaller sites. Future changes in the way travel is sold over the
Internet or changes in our relationship with third-party Internet sites could
result in reduced reservations from one or more of these sites and less
revenue.
Liability
Insurance Risk
We are
exposed to claims for personal injury, death and property damage resulting from
accidents involving our rental customers and the use of our cars. In 2008 and
2009, we maintained the level of self-insurance of $5.0 million and $7.5
million, respectively, per occurrence for public liability and property damage
claims, including third-party bodily injury and property damage, and maintain
the level of self-insurance for general and garage liability of $5.0
million. We maintain insurance coverage for liability claims above
these self-insurance levels. We self-insure for all losses on supplemental
liability insurance policies sold to vehicle rental customers. A significant
change in amount and frequency of uninsured liability claims could negatively
impact our results.
- 22
-
Litigation
Relating to the Constitutionality of the Removal of Vicarious
Liability
The
federal Highway Bill removed unlimited vicarious liability for vehicle rental
and leasing companies, limiting exposure to state minimum financial
responsibility amounts. Before vicarious liability was removed, the owner of a
vehicle in certain states would be liable for acts by vehicle drivers even
though the vehicle owner was not directly responsible. This federal law
supersedes all state laws on vicarious liability for automobile lessors. Since
the Highway Bill became law, its constitutionality has been challenged in some
state courts, including subsequent appeals. If these provisions of the Highway
Bill were overturned, we would be subject to significant exposure to insurance
liabilities and higher insurance costs, which would materially impact our
results.
Environmental
Regulations
We are
subject to numerous environmental regulatory requirements related to the
ownership, storage or use of petroleum products such as gasoline, diesel fuel
and new and used motor oil; the treatment or discharge of waste waters; and the
generation, storage, transportation and off-site treatment or disposal of waste
materials. We have made, and expect to continue to make, expenditures to comply
with environmental laws and regulations. These expenditures may be material to
our financial position, results of operations and cash flows. We have designed
programs to maintain compliance with applicable technical and operational
requirements, including leak detection testing of underground storage tanks, and
to provide financial assurance for remediation of spills or releases. However,
we cannot be certain that our programs will guarantee compliance with all
regulations to which we are subject.
Environmental
legislation and regulations and related administrative policies have changed
rapidly in recent years. There is a risk that governmental environmental
requirements, or enforcement thereof, may become more stringent in the future
and that we may be subject to additional legal proceedings brought by government
agencies or private parties for environmental matters. In addition, there may be
additional locations of which we are currently unaware at which wastes generated
by us may have been released or disposed. In the future, these locations may
become the subject of cleanup for which we may be liable, in whole or part.
Accordingly, there can be no assurance that the Company’s future environmental
liabilities will not be material to the Company’s consolidated financial
position or results of operations or cash flows.
Dependence
on Outsourcing Arrangements
HP
handles the majority of our IT services. If HP fails to meet its
obligations in all material respects as and when required under our agreement,
we may suffer a loss of business functionality and productivity, which would
adversely affect our results. Additionally, if there is a disruption in our
relationship with HP, we may not be able to secure another IT supplier to
adequately meet our IT needs on acceptable terms, which could result in
performance issues and a significant increase in costs.
Dependence
on Communication Networks and Centralized Information Systems
We
heavily rely on information systems to conduct our business specifically in the
areas of reservations, rental transaction processing, fleet management and
accounting. We have centralized information systems in disaster resistant
facilities maintained by HP in Tulsa, Oklahoma and we rely on communication
service providers to link our system with the business locations these systems
serve. A failure of a major system, or a major disruption of communications
between the system and the locations it serves, could cause a loss of
reservations, slow the rental transaction processing, interfere with our ability
to manage our fleet and otherwise materially adversely affect our ability to
manage our business effectively. Our system back-up plans, continuity plans and
insurance programs are designed to mitigate such a risk, but not to eliminate
it.
Our
systems contain personal information about our customers. Our failure to
maintain the security of the data we hold, whether the result of our own error
or that of others, could harm our reputation or give rise to legal liabilities,
resulting in a material adverse effect on our results of operations or cash
flows.
- 23
-
Potential
for Impairment of Long-Lived Assets
A
significant decline in operations on both an individual location and overall
company basis could indicate that certain long-lived assets are impaired. We
will continue to test our long-lived assets for potential impairment and may be
required to write down a portion or all of the remaining long-lived
assets, comprising property and equipment and software totaling
approximately $122.3 million at December 31, 2009.
|
UNRESOLVED STAFF
COMMENTS
|
None.
|
PROPERTIES
|
The
Company owns its headquarters located at 5330 East 31st Street, Tulsa, Oklahoma.
This location is a three building office complex that houses the headquarters
for Dollar and Thrifty. These buildings and the related improvements
were pledged as collateral to Deutsche Bank Trust Company Americas (“Deutsche
Bank”), as administrative agent for a syndicate of banks under the Senior
Secured Credit Facilities (as defined below).
In
connection with the Senior Secured Credit Facilities, the Company also executed
liens in favor of Deutsche Bank encumbering its real property located in Tampa,
Las Vegas, Ft. Lauderdale, Dallas, Houston, Salt Lake City, San Diego, Chicago,
Memphis, Tulsa, Little Rock, Fort Myers, Florida and Harlingen,
Texas.
The
Company owns or leases real property used for company-owned stores and office
facilities, and in some cases owns real property that is leased to franchisees
or other third-parties. As of December 31, 2009, the Company’s
company-owned operations were carried on at 296 locations in the U.S. and
Canada, the majority of which are leased. Dollar and Thrifty each
operate company-owned stores under concession agreements with various
governmental authorities charged with the operation of
airports. Concession agreements for airport locations, which are
usually competitively bid, are important for securing air traveler business.
These
concession agreements typically provide that the airport will receive a
specified percentage of vehicle rental revenue or a guaranteed minimum
concession fee, whichever is greater. Additionally, certain
concession agreements require the payment or reimbursement of operating
expenses.
|
LEGAL
PROCEEDINGS
|
On
November 14, 2007, a purported class action was filed against the Company, by
Michael Shames and Gary Gramkow, individually and on behalf of all others
similarly situated, in the Southern District Court of California, claiming that
the pass through of the California Trade and Tourism Commission and airport
concession fee authorized by legislation effective in January 2007 constitute
antitrust violations of the Sherman Act and the California Unfair Competition
Act. The case is styled Michael Shames; Gary Gramkow, on
behalf of themselves and on behalf of all persons similarly situated v. The
Hertz Corporation, Dollar Thrifty Automotive Group, Inc., Avis Budget Group,
Inc., Vanguard Car Rental USA, Inc., Enterprise Rent-A-Car Company, Fox
Rent-A-Car, Inc., Coast Leasing Corp., The California Travel and Tourism
Commission and Caroline Beteta (No. 07 CV 2174 H BLM (S.D.
Cal.)). The defendants filed a motion to dismiss the amended
complaint, and on July 25, 2008 the Court issued an order denying the motion as
to the antitrust claims but granting the motion to dismiss state law
claims. The Court also dismissed The California Travel and Tourism
Commission from the litigation based on state action immunity. The
Company intends to vigorously defend this matter.
On
December 13, 2007 and December 14, 2007, purported class actions were filed
against the Company, by Thomas Comisky and Isabel Cohen, respectively,
individually and on behalf of all others similarly situated, in the Central
District Court of California. These lawsuits claim (among other
matters) a violation of rights guaranteed under the Free Speech and Free
Association Clauses by compelling out-of-state visitors to subsidize the
Passenger Car Rental Tourism Assessment Program. On February 19,
2009, these actions were dismissed with prejudice. The plaintiffs
have filed their notice of appeal with the Ninth Circuit Court of
Appeals.
On
September 22, 2009, a purported class action complaint was filed in Illinois
state court by Susan and Jeffrey Dillon, individually and on behalf of all
persons who rented a vehicle from Thrifty Car Rental in Colorado from September
22, 2006 forward, who signed a rental agreement which obligated them to pay
for loss
of use of a vehicle if damaged, and who were charged for loss of use or an
administrative fee related to the vehicle damage claim. Plaintiffs assert
claims for breach of contract, violations of the Colorado Consumer
Protection Act, and for declaratory judgment under the Colorado Uniform
Declaratory Judgment Law related to the assessment of loss of use and
administrative fees in connection with vehicle damage claims against
renters. The case is styled: Susan and Jeffrey Dillon v. DTG
Operations, Inc. d/b/a Thrifty Car Rental (Case No. 09CH34874, Cook County
Circuit Court, Chancery Division, Illinois). The Company
intends to vigorously defend this matter.
- 24
-
Given the
inherent uncertainties of litigation, the ultimate outcome of these matters
cannot be predicted at this time, nor can the amount of ultimate loss, if any,
be reasonably estimated.
Various
other legal actions, claims and governmental inquiries and proceedings are
pending or may be instituted or asserted in the future against the Company.
Litigation is subject to many uncertainties, and the outcome of the individual
litigated matters is not predictable with assurance. It is possible that certain
of the actions, claims, inquiries or proceedings could be decided unfavorably to
the Company. Although the final resolution of any such matters could have a
material effect on the Company's consolidated operating results for the
particular reporting period in which an adjustment of the estimated liability is
recorded, the Company believes that any resulting liability should not
materially affect its consolidated financial position.
|
RESERVED
|
- 25
-
PART II
|
MARKET FOR
REGISTRANT’S COMMON EQUITY, RELATED STOCKHOLDER MATTERS AND ISSUER
PURCHASES OF EQUITY
SECURITIES
|
DTG’s
common stock is listed on the NYSE under the trading symbol
“DTG.” The high and low closing sales prices for the common stock for
each quarterly period during 2009 and 2008 were as follows:
|
|
First
|
Second
|
Third
|
Fourth
|
||||||||||||
|
|
Quarter
|
Quarter
|
Quarter
|
Quarter
|
||||||||||||
|
2009
|
||||||||||||||||
|
High
|
$ | 1.60 | $ | 14.14 | $ | 25.84 | $ | 27.23 | ||||||||
|
Low
|
$ | 0.62 | $ | 1.29 | $ | 13.80 | $ | 18.01 | ||||||||
|
2008
|
||||||||||||||||
|
High
|
$ | 26.02 | $ | 15.47 | $ | 6.59 | $ | 1.99 | ||||||||
|
Low
|
$ | 11.58 | $ | 9.45 | $ | 1.93 | $ | 0.77 | ||||||||
The
28,597,079 shares of common stock outstanding at February 24, 2010 were held by
approximately 7,397 record and beneficial holders.
The
Company has not paid cash dividends since completion of its initial public
offering in December 1997. The Company intends to reinvest its
earnings in its business and therefore does not anticipate paying any cash
dividends in the foreseeable future.
Under the
terms of the revolving credit facility (as amended, the “Revolving Credit
Facility”), cash dividends and share repurchases are prohibited. See
“Management’s Discussion and Analysis of Financial Condition and Results of
Operations – Liquidity and Capital Resources”.
- 26
-
Performance
Graph
The
following graph compares the cumulative total stockholder return on DTG common
stock with the Hemscott Industry Group 761 – Rental & Leasing Services and
the Russell 2000 Index. The Hemscott Industry Group 761 – Rental
& Leasing Services is a published index of 35 stocks including DTG, which
covers companies that rent or lease various durable goods to the commercial and
consumer market including cars and trucks, medical and industrial equipment,
appliances, tools and other miscellaneous goods.
The
results are based on an assumed $100 invested on December 31, 2004, and
reinvestment of dividends through December 31, 2009.
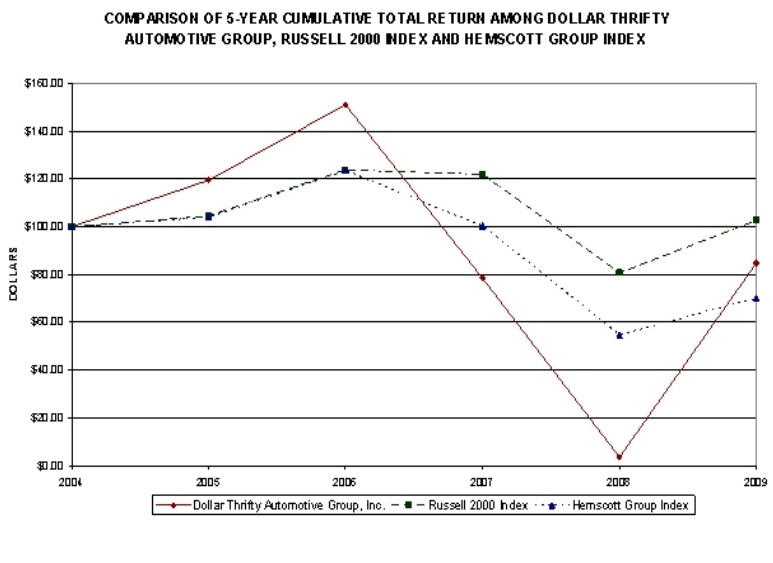
|
Company/Index/Market
|
12/31/2004
|
12/31/2005
|
12/30/2006
|
12/29/2007
|
12/31/2008
|
12/31/2009
|
|
Dollar
Thrifty Automotive Group, Inc.
|
100.00
|
119.44
|
151.03
|
78.41
|
3.61
|
84.80
|
|
Hemscott
Industry Group 761 - Rental & Leasing Services
|
100.00
|
103.95
|
123.47
|
100.39
|
54.71
|
70.19
|
|
Russell
2000 Index
|
100.00
|
104.55
|
123.76
|
121.82
|
80.66
|
102.58
|
- 27
-
|
SELECTED FINANCIAL
DATA
|
The
selected consolidated financial data was derived from the audited consolidated
financial statements of the Company. The system-wide data and
company-owned stores data were derived from Company records.
|
Year
Ended December 31,
|
||||||||||||||||||||
|
2009
|
2008
|
2007
|
2006
|
2005
|
||||||||||||||||
|
|
||||||||||||||||||||
|
Statements
of Operations:
|
||||||||||||||||||||
|
(in
thousands except per share amounts)
|
||||||||||||||||||||
|
Revenues:
|
||||||||||||||||||||
|
Vehicle
rentals
|
$ | 1,472,918 | $ | 1,616,153 | $ | 1,676,349 | $ | 1,538,673 | $ | 1,380,172 | ||||||||||
|
Other
|
73,331 | 81,840 | 84,442 | 122,004 | 127,382 | |||||||||||||||
|
Total
revenues
|
1,546,249 | 1,697,993 | 1,760,791 | 1,660,677 | 1,507,554 | |||||||||||||||
|
Costs
and expenses:
|
||||||||||||||||||||
|
Direct
vehicle and operating
|
768,456 | 888,294 | 887,178 | 827,440 | 787,714 | |||||||||||||||
|
Vehicle
depreciation and lease
|
||||||||||||||||||||
|
charges,
net
|
426,092 | 539,406 | 477,853 | 380,005 | 294,757 | |||||||||||||||
|
Selling,
general and
|
||||||||||||||||||||
|
administrative
|
200,389 | 213,734 | 230,515 | 259,474 | 236,055 | |||||||||||||||
|
Interest
expense, net
|
96,560 | 110,424 | 109,728 | 95,974 | 88,208 | |||||||||||||||
|
Goodwill
and long-lived asset impairment
|
2,592 | 366,822 | 3,719 | - | - | |||||||||||||||
|
Total
costs and expenses
|
1,494,089 | 2,118,680 | 1,708,993 | 1,562,893 | 1,406,734 | |||||||||||||||
|
(Increase)
decrease in fair value of derivatives
|
(28,848 | ) | 36,114 | 38,990 | 9,363 | (29,725 | ) | |||||||||||||
|
Income
(loss) before income taxes
|
81,008 | (456,801 | ) | 12,808 | 88,421 | 130,545 | ||||||||||||||
|
Income
tax expense (benefit)
|
35,986 | (110,083 | ) | 11,593 | 36,729 | 54,190 | ||||||||||||||
|
Net
income (loss)
|
$ | 45,022 | $ | (346,718 | ) | $ | 1,215 | $ | 51,692 | $ | 76,355 | |||||||||
|
Basic
Earnings (Loss) Per Share
|
$ | 1.98 | $ | (16.22 | ) | $ | 0.05 | $ | 2.14 | $ | 3.04 | |||||||||
|
Diluted
Earnings (Loss) Per Share
|
$ | 1.88 | $ | (16.22 | ) | $ | 0.05 | $ | 2.04 | $ | 2.89 | |||||||||
|
Balance
Sheet Data:
|
||||||||||||||||||||
|
(in
thousands)
|
||||||||||||||||||||
|
Cash
and cash equivalents
|
$ | 400,404 | $ | 229,636 | $ | 101,025 | $ | 191,981 | $ | 274,299 | ||||||||||
|
Cash
and cash equivalents required minimum balance
|
$ | 100,000 | $ | - | $ | - | $ | - | $ | - | ||||||||||
|
Restricted
cash and investments
|
$ | 622,540 | $ | 596,588 | $ | 132,945 | $ | 389,794 | $ | 785,290 | ||||||||||
|
Revenue-earning
vehicles, net
|
$ | 1,228,637 | $ | 1,946,079 | $ | 2,808,354 | $ | 2,623,719 | $ | 2,202,890 | ||||||||||
|
Total
assets
|
$ | 2,645,937 | $ | 3,238,181 | $ | 3,891,452 | $ | 4,011,498 | $ | 3,986,784 | ||||||||||
|
Total
debt
|
$ | 1,727,810 | $ | 2,488,245 | $ | 2,656,562 | $ | 2,744,284 | $ | 2,724,952 | ||||||||||
|
Stockholders'
equity
|
$ | 393,914 | $ | 208,420 | $ | 578,865 | $ | 647,700 | $ | 690,428 | ||||||||||
|
Note:
Certain 2008 amounts have been restated. See Item 8 - Note 14 of Notes
to Consolidated Financial Statements.
|
||||||||||||||||||||
- 28
-
|
U.
S. and Canada
|
||||||||||||||||||||
|
Year
Ended December 31,
|
||||||||||||||||||||
|
2009
|
2008
|
2007
|
2006
|
2005
|
||||||||||||||||
|
System-wide
Data:
|
||||||||||||||||||||
|
Rental
locations:
|
||||||||||||||||||||
|
Company-owned
stores
|
296 | 400 | 466 | 407 | 369 | |||||||||||||||
|
Franchisee
locations
|
317 | 341 | 365 | 429 | 483 | |||||||||||||||
|
Total
rental locations
|
613 | 741 | 831 | 836 | 852 | |||||||||||||||
|
Company-owned
Stores Data:
|
||||||||||||||||||||
|
Vehicle
rental data:
|
||||||||||||||||||||
|
Average
number of vehicles operated
|
102,948 | 120,309 | 123,484 | 119,648 | 113,002 | |||||||||||||||
|
Number
of rental days
|
30,616,395 | 36,879,641 | 37,231,340 | 36,642,026 | 34,909,560 | |||||||||||||||
|
Vehicle
utilization
|
81.5 | % | 83.8 | % | 82.6 | % | 83.9 | % | 84.6 | % | ||||||||||
|
Average
revenue per day
|
$ | 48.11 | $ | 43.82 | $ | 45.03 | $ | 41.99 | $ | 39.54 | ||||||||||
|
Monthly
average revenue per vehicle
|
$ | 1,192 | $ | 1,119 | $ | 1,131 | $ | 1,072 | $ | 1,018 | ||||||||||
|
Average
depreciable fleet
|
105,301 | 123,673 | 127,979 | 128,739 | 124,373 | |||||||||||||||
|
Monthly
average depreciation
|
||||||||||||||||||||
|
(net)
per vehicle
|
$ | 337 | $ | 363 | $ | 311 | $ | 246 | $ | 197 | ||||||||||
- 29
-
|
MANAGEMENT’S
DISCUSSION AND ANALYSIS OF FINANCIAL CONDITION AND
RESULTS
OF OPERATIONS
|
Overview
The
Company operates two value rental car brands, Dollar and Thrifty. The
majority of its customers pick up their vehicles at airport
locations. Both brands are value priced and the Company seeks to be
the industry’s low cost provider. Leisure customers typically rent
vehicles for longer periods than business customers, on average, providing lower
transaction costs.
Both
Dollar and Thrifty operate through a network of company-owned stores and
franchisees. The majority of the Company’s revenue is generated from
renting vehicles to customers through company-owned stores, with lesser amounts
generated through parking income, vehicle leasing, royalty fees and services
provided to franchisees.
In 2009,
the Company’s revenues were negatively impacted compared to 2008 by rental day
volume declines of 17.0% due to challenging economic conditions, coupled with
the Company’s efforts in closing unprofitable company-owned stores, partially
offset by a 9.8% increase in revenue per day. Airline passenger enplanements, an
important driver for airport rental car demand, decreased slightly in
2009.
During
2009, the Company had lower vehicle depreciation and lease charges due to lower
fleet levels, in addition to a reduction in the depreciation rate per vehicle
due to improved residual values, extended holding periods, a continued move
towards a greater proportion of Non-Program Vehicles, mix optimization and
improved remarketing efforts. Additionally, the Company experienced
lower direct vehicle and operating expenses due to lower transaction levels, a
reduced fleet, and a continued focus on cost reduction initiatives.
In 2009,
the Company recorded a non-cash charge of $2.6 million relating to long-lived
asset impairments compared to a non-cash charge of $366.8 million in 2008
relating to goodwill and long-lived asset impairments.
The
Company uses mark-to-market accounting for the majority of its interest rate
swap agreements. This accounting treatment results in significant
volatility to the Company’s operating results but does not impact cash
flow. In 2009, the change in fair value of these interest rate swap
agreements was an increase of $28.8 million compared to a decrease of $36.1
million in 2008.
The
Company’s profitability is primarily a function of the volume and pricing of
rental transactions, utilization of the vehicles and vehicle depreciation costs.
Significant changes in the purchase or sales price of vehicles or interest rates
can also have a significant effect on the Company’s profitability, depending on
the ability of the Company to adjust its pricing for these
changes. The Company’s business requires significant expenditures for
vehicles and, consequently, requires substantial liquidity to finance such
expenditures.
The
combinations of these factors contributed to the net income of $45.0 million for
the year ended December 31, 2009, compared to a net loss of $346.7 million for
the year ended December 31, 2008. Presenting the comparable non-GAAP
financial measures, which excludes the change in fair value of derivatives and
non-cash charges related to the impairment of goodwill and long-lived assets,
net of tax, the non-GAAP net income was $29.6 million for the year ended
December 31, 2009 compared to a non-GAAP net loss of $40.9 million for the year
ended December 31, 2008. Corporate Adjusted EBITDA for 2009 was $99.4
million compared to a loss of $2.3 million in 2008. Reconciliations
of non-GAAP financial measures to the comparable GAAP financial measures are
presented below.
Certain
amounts for 2008 have been restated. See Item 8 – Note 14 and 17 of
Notes to Consolidated Financial Statements for further information on the
amounts restated.
- 30
-
Use
of Non-GAAP Measures For Measuring Results
Non-GAAP
pretax income (loss), non-GAAP net income (loss) and non-GAAP EPS exclude the
impact of the (increase) decrease in fair value of derivatives and the impact of
goodwill and long-lived asset impairments, net of related tax impact (as
applicable), from the reported GAAP measure. Due to volatility
resulting from the mark-to-market treatment of the derivatives and the nature of
the non-cash impairments, which are both non-operating items, the Company
believes non-GAAP measures provide an important assessment of year over year
operating results. See table below for a reconciliation of non-GAAP
to GAAP results.
|
Reconciliation
of reported GAAP pretax income (loss) per the
|
|||||||||||||
|
income
statement to non-GAAP pretax income (loss):
|
|||||||||||||
|
Year
Ended December 31,
|
|||||||||||||
|
2009
|
2008
|
2007
|
|||||||||||
|
(in
thousands)
|
|||||||||||||
|
Income
(loss) before income taxes - as reported
|
$ | 81,008 | $ | (456,801 | ) | $ | 12,808 | ||||||
|
(Increase)
decrease in fair value of derivatives
|
(28,848 | ) | 36,114 | 38,990 | |||||||||
|
Goodwill
and long-lived asset impairment
|
2,592 | 366,822 | 3,719 | ||||||||||
|
Pretax
income (loss) - non-GAAP
|
$ | 54,752 | $ | (53,865 | ) | $ | 55,517 | ||||||
|
Reconciliation
of reported GAAP net income (loss) per the
|
|||||||||||||
|
income
statement to non-GAAP net income (loss):
|
|||||||||||||
|
Net
income (loss) - as reported
|
$ | 45,022 | $ | (346,718 | ) | $ | 1,215 | ||||||
|
(Increase)
decrease in fair value of derivatives, net of tax (a)
|
(16,917 | ) | 21,271 | 22,813 | |||||||||
|
Goodwill
and long-lived asset impairment, net of tax (b)
|
1,497 | 284,537 | 2,236 | ||||||||||
|
Net
income (loss) - non-GAAP
|
$ | 29,602 | $ | (40,910 | ) | $ | 26,264 | ||||||
|
Reconciliation
of reported GAAP diluted earnings (loss)
|
|||||||||||||
|
per
share (“EPS”) to non-GAAP diluted EPS:
|
|||||||||||||
|
EPS,
diluted - as reported
|
$ | 1.88 | $ | (16.22 | ) | $ | 0.05 | ||||||
|
EPS
impact of (increase) decrease in fair value of derivatives, net of
tax
|
(0.71 | ) | 1.00 | 0.97 | |||||||||
|
EPS
impact of goodwill and long-lived asset impairment, net of
tax
|
0.06 | 13.31 | 0.09 | ||||||||||
|
EPS,
diluted - non-GAAP (c)
|
$ | 1.24 | $ | (1.91 | ) | $ | 1.11 | ||||||
|
(a)
|
The
tax effect of the (increase) decrease in fair value of derivatives is
calculated using the entity-specific, U.S. federal and blended
state tax rate applicable to the derivative instruments which amounts
are ($11,931,000), $14,843,000 and $16,177,000
for the years ended December 31, 2009, 2008 and 2007,
respectively.
|
||||||||||||
|
|
|||||||||||||
|
(b)
|
The
tax effect of the goodwill and long-lived asset impairment is calculated
using the tax-deductible portion of the
impairment and applying the entity-specific, U.S. federal and blended
state tax rate which amounts are $1,095,000,
$82,285,000 and $1,483,000 for the years ended December 31, 2009, 2008 and
2007, respectively.
|
||||||||||||
|
|
|||||||||||||
|
(c)
|
Since
each category of earnings per share is computed independently for each
period, total per share amounts may not
equal the sum of the respective categories.
|
||||||||||||
- 31
-
Corporate
Adjusted EBITDA means earnings, excluding the impact of the (increase) decrease
in fair value of derivatives, before non-vehicle interest expense, income taxes,
non-vehicle depreciation, amortization, and certain other items as recapped
below. The Company believes Corporate Adjusted EBITDA is important as it
provides investors with a supplemental measure of the Company's liquidity by
adjusting earnings to exclude non-cash items. The items excluded from
Corporate Adjusted EBITDA but included in the calculation of the Company’s
reported net income are significant components of the accompanying consolidated
statements of operations, and must be considered in performing a comprehensive
assessment of overall financial performance. EBITDA is not defined
under GAAP and should not be considered as an alternative measure of the
Company's net income, operating performance, cash flow or
liquidity. Corporate Adjusted EBITDA amounts presented may not be
comparable to similar measures disclosed by other companies. See
table below for a reconciliation of non-GAAP to GAAP results.
|
Year
Ended December 31,
|
||||||||||||
|
2009
|
2008
|
2007
|
||||||||||
| (in thousands) | ||||||||||||
|
Reconciliation
of net income (loss) to
|
||||||||||||
|
Corporate Adjusted EBITDA
|
||||||||||||
|
Net
income (loss) - as reported
|
$ | 45,022 | $ | (346,718 | ) | $ | 1,215 | |||||
|
(Increase)
decrease in fair value of derivatives
|
(28,848 | ) | 36,114 | 38,990 | ||||||||
|
Non-vehicle
interest expense
|
12,797 | 17,620 | 16,068 | |||||||||
|
Income
tax expense (benefit)
|
35,986 | (110,083 | ) | 11,593 | ||||||||
|
Non-vehicle
depreciation
|
19,200 | 22,722 | 21,704 | |||||||||
|
Amortization
|
7,994 | 7,355 | 6,386 | |||||||||
|
Non-cash
stock incentives
|
4,698 | 3,917 | 7,682 | |||||||||
|
Goodwill
and long-lived asset impairment
|
2,592 | 366,822 | 3,719 | |||||||||
|
Other
|
(6 | ) | - | 178 | ||||||||
|
Corporate
Adjusted EBITDA
|
$ | 99,435 | $ | (2,251 | ) | $ | 107,535 | |||||
|
Reconciliation
of Corporate Adjusted EBITDA
|
||||||||||||
|
to Cash Flows From Operating
Activities
|
||||||||||||
|
Corporate
Adjusted EBITDA
|
$ | 99,435 | $ | (2,251 | ) | $ | 107,535 | |||||
|
Vehicle
depreciation, net of gains/losses from disposal
|
425,574 | 538,250 | 474,967 | |||||||||
|
Non-vehicle
interest expense
|
(12,797 | ) | (17,620 | ) | (16,068 | ) | ||||||
|
Change
in assets and liabilities, net of acquisitions, and other
|
23,712 | (11,224 | ) | (10,115 | ) | |||||||
|
Net
cash provided by operating activities
|
$ | 535,924 | $ | 507,155 | $ | 556,319 | ||||||
|
Memo:
|
||||||||||||
|
Net
cash provided by (used in) investing activites
|
$ | 278,955 | $ | (198,366 | ) | $ | (465,318 | ) | ||||
|
Net
cash used in financing activities
|
$ | (644,111 | ) | $ | (180,178 | ) | $ | (181,957 | ) | |||
- 32
-
Results
of Operations
The
following table sets forth the percentage of total revenues in the Company’s
consolidated statements of operations:
|
Year
Ended December 31,
|
|||||||||
|
2009
|
2008
|
2007
|
|||||||
|
Revenues:
|
|||||||||
|
Vehicle
rentals
|
95.3
|
%
|
95.2
|
%
|
95.2
|
%
|
|||
|
Other
|
4.7
|
4.8
|
4.8
|
||||||
|
Total
revenues
|
100.0
|
100.0
|
100.0
|
||||||
|
Costs
and expenses:
|
|||||||||
|
Direct
vehicle and operating
|
49.7
|
52.3
|
50.4
|
||||||
|
Vehicle
depreciation and lease charges, net
|
27.6
|
31.8
|
27.1
|
||||||
|
Selling,
general and administrative
|
13.0
|
12.6
|
13.1
|
||||||
|
Interest
expense, net
|
6.2
|
6.5
|
6.3
|
||||||
|
Goodwill
and long-lived asset impairment
|
0.1
|
21.6
|
0.2
|
||||||
|
Total
costs and expenses
|
96.6
|
124.8
|
97.1
|
||||||
|
(Increase)
decrease in fair value of derivatives
|
(1.8)
|
2.1
|
2.2
|
||||||
|
Income
(loss) before income taxes
|
5.2
|
(26.9)
|
0.7
|
||||||
|
Income
tax expense (benefit)
|
2.3
|
(6.5)
|
0.6
|
||||||
|
Net
income (loss)
|
2.9
|
%
|
(20.4)
|
%
|
0.1
|
%
|
|||
The
Company’s revenues consist of:
|
|
•
|
Vehicle
rental revenue generated from renting vehicles to customers through
company-owned stores, and
|
|
|
•
|
Other
revenue generated from leasing vehicles to franchisees, continuing
franchise and service fees, parking income and miscellaneous
sources.
|
|
|
The
Company’s expenses consist of:
|
|
•
|
Direct
vehicle and operating expense related to the rental of revenue-earning
vehicles to customers and the leasing of vehicles to
franchisees,
|
|
|
•
|
Vehicle
depreciation and lease charges net of gains and losses on vehicle
disposal,
|
|
|
•
|
Selling,
general and administrative expense, which primarily includes headquarters
personnel expenses, advertising and marketing expenses, most IT expenses
and administrative expenses,
|
|
|
•
|
Interest
expense, net, which includes interest expense on vehicle related debt and
non-vehicle debt, net of interest earned on restricted and unrestricted
cash, and
|
|
|
•
|
Goodwill
and long-lived asset impairment relates to the write-off of goodwill,
reacquired franchise rights, software no longer in use and property and
equipment deemed to be impaired.
|
The
Company’s (increase) decrease in fair value of derivatives consists of the
changes in the fair market value of its interest rate swap agreements that did
not qualify for hedge accounting treatment.
- 33
-
Year
Ended December 31, 2009 Compared with Year Ended December 31, 2008
Operating
Results
The
Company had income before income taxes of $81.0 million for 2009 compared to a
loss before income taxes of $456.8 million in 2008.
Revenues
|
$
Increase/
|
%
Increase/
|
|||||||||||||||
|
2009
|
2008
|
(decrease)
|
(decrease)
|
|||||||||||||
|
(in
millions)
|
||||||||||||||||
|
Vehicle
rentals
|
$ | 1,472.9 | $ | 1,616.2 | $ | (143.3 | ) | (8.9 | %) | |||||||
|
Other
|
73.3 | 81.8 | (8.5 | ) | (10.4 | %) | ||||||||||
|
Total
revenues
|
$ | 1,546.2 | $ | 1,698.0 | $ | (151.8 | ) | (8.9 | %) | |||||||
|
Vehicle
rental metrics:
|
||||||||||||||||
|
Average
number of vehicles operated
|
102,948 | 120,309 | (17,361 | ) | (14.4 | %) | ||||||||||
|
Average
revenue per day
|
$ | 48.11 | $ | 43.82 | $ | 4.29 | 9.8 | % | ||||||||
|
Number
of rental days
|
30,616,395 | 36,879,641 | (6,263,246 | ) | (17.0 | %) | ||||||||||
|
Vehicle
utilization
|
81.5 | % | 83.8 | % |
(2.3)
p.p.
|
N/M | ||||||||||
Vehicle
rental revenue decreased 8.9% due to a 17.0% decrease in rental days totaling
$274.6 million, primarily due to challenging economic conditions and location
closures, partially offset by a 9.8% increase in revenue per day totaling $131.3
million.
Other
revenue decreased $8.5 million. This decrease was primarily due to an $8.8
million decline in leasing revenue, primarily due to offering the franchise
leasing program on a limited basis beginning in 2009, a $4.3 million decrease in
fees and services revenue, and a $1.3 million decrease in parking income,
partially offset by a $7.1 million increase in the market value of investments
in the Company’s deferred compensation and retirement plans. The revenue
relating to the deferred compensation and retirement plans is attributable to
the mark to market valuation of the corresponding investments and is offset in
selling, general and administrative expenses and, therefore, has no impact on
net income.
Expenses
|
$
Increase/
|
%
Increase/
|
|||||||||||||||
|
2009
|
2008
|
(decrease)
|
(decrease)
|
|||||||||||||
|
(in
millions)
|
||||||||||||||||
|
Direct
vehicle and operating
|
$ | 768.5 | $ | 888.3 | $ | (119.8 | ) | (13.5 | %) | |||||||
|
Vehicle
depreciation and lease charges, net
|
426.1 | 539.4 | (113.3 | ) | (21.0 | %) | ||||||||||
|
Selling,
general and administrative
|
200.3 | 213.7 | (13.4 | ) | (6.2 | %) | ||||||||||
|
Interest
expense, net of interest income
|
96.6 | 110.5 | (13.9 | ) | (12.6 | %) | ||||||||||
|
Goodwill
and long-lived asset impairment
|
2.6 | 366.8 | (364.2 | ) | N/M | |||||||||||
|
Total
expenses
|
$ | 1,494.1 | $ | 2,118.7 | $ | (624.6 | ) | (29.5 | %) | |||||||
|
(Increase)
decrease in fair value of derivatives
|
$ | (28.8 | ) | $ | 36.1 | $ | 64.9 | 179.9 | % | |||||||
Direct
vehicle and operating expense decreased $119.8 million, primarily due to lower
transaction levels, as well as an ongoing focus on cost reduction
initiatives. As a percent of revenue, direct vehicle and operating
expenses were 49.7% in 2009, compared to 52.3% in 2008.
- 34
-
Significant
fluctuations within direct vehicle and operating expense in 2009 primarily
resulted from the following:
|
|
Ø
|
Vehicle
related costs decreased $61.4 million. This decrease resulted primarily
from a $35.6 million decrease in gasoline expense resulting from lower
average gas prices and lower fuel consumption due to a decreased fleet
(primarily offset in revenue), an $18.1 million decrease in net vehicle
damages resulting from improved damage recovery collections along with
lower aggregate damages due to a lower value of the vehicles, primarily
related to the extended holding periods and a reduced fleet, and a $10.3
million decrease in vehicle insurance expenses primarily due to a change
in insurance reserves resulting from favorable developments in claim
history. These decreases were partially offset by an increase
in vehicle maintenance expense of $13.8 million primarily resulting from
the increased holding period of the
fleet.
|
|
|
Ø
|
Personnel
related expenses decreased $33.4 million. Approximately $38.5
million of the decrease resulted from a reduction in the number of
employees attributable to lower transaction levels and cost efficiency
initiatives, in addition to a $4.5 million decrease in group insurance
expense. These decreases were partially offset by a $6.5
million increase due to a change in the proportion of seasonal employees,
coupled with $3.2 million of incentive compensation expense in 2009,
related to the employees at company-owned
stores.
|
|
|
Ø
|
Bad
debt expense decreased $4.7 million primarily as a result of the
bankruptcy of one of the Company’s largest tour operators during
2008.
|
|
|
Ø
|
Facility
and airport concession expenses decreased $3.0 million due to a decrease
in rent expense of $1.6 million, and a decrease in concession fees of $1.3
million due to the overall decline in concessionable
revenue.
|
Net
vehicle depreciation and lease charges decreased $113.3 million. The decrease is
primarily due to a 14.9% decrease in depreciable vehicles, which resulted from
efforts to match the fleet with current demand levels. In addition,
net vehicle depreciation expense and lease charges were $337 per unit in 2009,
compared to $363 per unit in 2008. The decrease in the depreciation
rate is due to extended vehicle holding periods, improved conditions in the
used car market and increased residual values in 2009 as compared to 2008,
partially offset by an increase due to the one-time $12.9 million settlement of
certain manufacturer incentives that lowered per vehicle depreciation expense in
2008 and did not recur in 2009. As a percent of revenue, net vehicle
depreciation expense and lease charges were 27.6% in 2009, compared to 31.8% in
2008.
Selling,
general and administrative expenses for 2009 decreased $13.4
million. As a percent of revenue, selling, general and administrative
expenses were 13.0% in 2009, compared to 12.6% in 2008.
The
decrease in selling, general and administrative expenses in 2009 resulted from
the following:
|
|
Ø
|
Sales
and marketing expense decreased $14.5 million due primarily to a decrease
in print media, marketing programs tied to transaction levels and reduced
promotion advertising expenses.
|
|
|
Ø
|
Outsourcing
expenses decreased $7.6 million related to IT and
reservations. The IT-related reductions were primarily due to
fewer IT-related projects outsourced in 2009, and the reductions related
to reservations were primarily due to decreased rental
volume.
|
|
|
Ø
|
The
increase in the market value of investments in the Company’s deferred
compensation and retirement plans increased selling, general and
administrative expenses by $7.1 million in 2009 compared to 2008, which
was offset by a corresponding gain on those investments that is recognized
in other revenue and, therefore, did not impact net
income.
|
|
|
Ø
|
Personnel
related expenses increased $2.3 million primarily due to $6.8 million of
incentive compensation expense recorded in 2009 and a $3.0 million
increase in stock option, performance share, and retirement
expense. These expenses were partially offset by a $7.2 million
decrease in expense related to workforce reductions implemented during the
fourth quarter of 2008.
|
- 35
-
Net
interest expense decreased $13.9 million in 2009 primarily due to lower average
vehicle debt, partially offset by a decrease in interest reimbursements due to
significantly reduced vehicle purchasing activity and the write-off of deferred
financing fees related to the reduction in the capacity of the Revolving Credit
Facility (hereinafter defined) and the Term Loan (hereinafter defined) during
2009. As a percent of revenue, net interest expense was 6.2% in 2009,
compared to 6.5% in 2008.
Goodwill
and long-lived asset impairment expense decreased $364.2 million in 2009, due to
non-cash charges in 2008 relating to goodwill impairment of $281.2 million,
reacquired franchise rights impairment of $69.0 million, certain IT initiative
write-offs of $10.5 million and impairment of substantially all of the Company’s
Canadian operations long-lived assets of $6.1 million. In 2009, the
Company wrote off $2.6 million related to the impairment of long-lived assets at
its company-owned stores and software no longer in use.
The
change in fair value of the Company’s interest rate swap agreements was an
increase of $28.8 million in 2009 compared to a decrease of $36.1 million in
2008 resulting in a year-over-year increase of $64.9 million, primarily due to
an increase in interest rates in 2009.
The
income tax expense for 2009 was $36.0 million. The effective income
tax rate was 44.4% for 2009 compared to 24.1% for 2008. The increase in the
effective tax rate was primarily due to the income tax expense related to the
pre-tax income in 2009 compared to the pre-tax loss in 2008 and the non-cash
write-off of goodwill and reacquired franchise rights (of which only a portion
of these write-offs receive a deferred tax benefit) and other long-lived
assets. The Company reports taxable income for the U.S. and Canada in
separate tax jurisdictions and establishes provisions separately for each
jurisdiction. On a separate, domestic basis, the U.S. effective tax
rate approximates the statutory tax rate including the effect of state income
taxes and the impact of establishing valuation allowances for net operating
losses that could expire. However, no income tax benefit was recorded
for Canadian losses in 2009 or 2008, thus increasing the consolidated effective
tax rate in 2009, and reducing the consolidated effective tax rate in 2008, due
to an overall pre-tax loss.
Year
Ended December 31, 2008 Compared with Year Ended December 31, 2007
Operating
Results
The
Company had a loss before income taxes of $456.8 million for 2008 compared to
income of $12.8 million in 2007.
Revenues
|
$
Increase/
|
%
Increase/
|
|||||||||||||||
|
2008
|
2007
|
(decrease)
|
(decrease)
|
|||||||||||||
|
(in
millions)
|
||||||||||||||||
|
Vehicle
rentals
|
$ | 1,616.2 | $ | 1,676.4 | $ | (60.2 | ) | (3.6 | %) | |||||||
|
Other
|
81.8 | 84.4 | (2.6 | ) | (3.1 | %) | ||||||||||
|
Total
revenues
|
$ | 1,698.0 | $ | 1,760.8 | $ | (62.8 | ) | (3.6 | %) | |||||||
|
Vehicle
rental metrics:
|
||||||||||||||||
|
Average
number of vehicles operated
|
120,309 | 123,484 | (3,175 | ) | (2.6 | %) | ||||||||||
|
Average
revenue per day
|
$ | 43.82 | $ | 45.03 | $ | (1.21 | ) | (2.7 | %) | |||||||
|
Number
of rental days
|
36,879,641 | 37,231,340 | (351,699 | ) | (0.9 | %) | ||||||||||
|
Vehicle
utilization
|
83.8 | % | 82.6 | % |
1.2
p.p.
|
N/M | ||||||||||
Vehicle
rental revenue decreased 3.6% due to a 2.7% decrease in revenue per day totaling
$44.4 million coupled with a 0.9% decrease in rental days totaling $15.8
million.
Other
revenue decreased $2.6 million. This decrease was due to an $11.2 million
decline in vehicle leasing revenue and fees and services revenue primarily due
to the shift of several locations from franchised operations to corporate
operations. This decrease in other revenue was partially offset by a
$5.5
million reduction in the loss resulting from the change in the market value of
investments in the Company’s deferred compensation and retirement plans.
- 36
-
The loss
relating to the deferred compensation and retirement plans is attributable to
the mark to market valuation of the corresponding investments and is offset in
selling, general and administrative expenses and, therefore, has no impact on
net income. Additionally, there was a $2.5 million increase in
parking income and a $0.6 million increase in franchise sales
income.
Expenses
|
$
Increase/
|
%
Increase/
|
|||||||||||||||
|
2008
|
2007
|
(decrease)
|
(decrease)
|
|||||||||||||
|
(in
millions)
|
||||||||||||||||
|
Direct
vehicle and operating
|
$ | 888.3 | $ | 887.2 | $ | 1.1 | 0.1 | % | ||||||||
|
Vehicle
depreciation and lease charges, net
|
539.4 | 477.9 | 61.5 | 12.9 | % | |||||||||||
|
Selling,
general and administrative
|
213.7 | 230.5 | (16.8 | ) | (7.3 | %) | ||||||||||
|
Interest
expense, net of interest income
|
110.5 | 109.7 | 0.8 | 0.6 | % | |||||||||||
|
Goodwill
and long-lived asset impairment
|
366.8 | 3.7 | 363.1 | N/M | ||||||||||||
|
Total
expenses
|
$ | 2,118.7 | $ | 1,709.0 | $ | 409.7 | 24.0 | % | ||||||||
|
(Increase)
decrease in fair value of derivatives
|
$ | 36.1 | $ | 39.0 | $ | 2.9 | 7.4 | % | ||||||||
Direct
vehicle and operating expense increased $1.1 million, primarily due to higher
costs per transaction, partially offset by lower transaction
levels. As a percent of revenue, direct vehicle and operating
expenses were 52.3% in 2008, compared to 50.4% in
2007.
Significant
fluctuations within direct vehicle and operating expense in 2008 primarily
resulted from the following:
|
|
Ø
|
Vehicle
related costs increased $15.3 million. This increase resulted primarily
from higher fuel expense of $11.1 million resulting from higher average
gas prices on fuel inventory consumed, increased fuel consumption
associated with the transportation of vehicles to auction, and a
significant increase in fuel expense in conjunction with the reduction of
the fleet. In addition, vehicle maintenance expense increased
$5.2 million and vehicle insurance expense increased $3.0
million. These increases were partially offset by a decrease in
net vehicle damage of $7.5 million. All other fleet related
expenses increased $3.5 million.
|
|
|
Ø
|
Bad
debt expense increased $6.7 million of which $5.5 million relates to one
of the Company’s largest tour operators filing for bankruptcy during the
third quarter of 2008.
|
|
|
Ø
|
Facility
and airport concession expenses increased $1.1 million. This increase
primarily resulted from increases in rent expense of $2.6 million,
partially offset by a decrease in concession fees of $1.4 million, which
are primarily based on a percentage of revenue generated from the airport
facility.
|
|
|
Ø
|
Personnel
related expenses decreased $20.0 million. The decrease
primarily resulted from a transaction driven reduction in the number of
employees, resulting in a decrease of $24.4 million, partially offset by a
$7.4 million increase in salary cost. Additionally, there was a decrease
of $2.9 million in 401(k) expense due to the suspension of matching
contributions that began during the first quarter of
2008.
|
Net
vehicle depreciation and lease charges increased $61.5 million. Net vehicle
depreciation expense and lease charges were $363 per unit in 2008, compared to
$311 per unit in 2007. As a percent of revenue, net vehicle
depreciation expense and lease charges were 31.8% in 2008, compared to 27.1% in
2007.
- 37
-
The
increase in net vehicle depreciation and lease charges in 2008 resulted from the
following:
|
|
Ø
|
Vehicle
depreciation expense increased $45.3 million, resulting primarily from a
12.9% increase in the average depreciation rate due to vehicle
manufacturer price increases on Program Vehicles and lower residual values
on Non-Program Vehicles due to a soft used car market. These
increases were partially offset by a higher mix of Non-Program Vehicles,
which typically have lower depreciation rates, and resolving outstanding
incentive negotiations relating to prior model years with the Company’s
primary vehicle supplier, which resulted in increased incentive income
recognition.
|
|
|
Ø
|
Net
vehicle gains on the disposal of Non-Program Vehicles, which reduce
vehicle depreciation and lease charges, decreased $17.9
million. This decrease resulted primarily from significantly
fewer units sold in 2008, as a result of the longer hold periods, and a
lower average gain per unit due to softness in the used car
market.
|
|
|
Ø
|
Leasing
charges, for vehicles leased from third-parties, decreased $1.7 million
due to a decrease in the average number of vehicles
leased.
|
Selling,
general and administrative expenses for 2008 decreased $16.8
million. As a percent of revenue, selling, general and administrative
expenses were 12.6% in 2008, compared to 13.1% in 2007.
The
decrease in selling, general and administrative expenses in 2008 resulted from
the following:
|
|
Ø
|
Personnel
related expenses decreased $7.9 million primarily due to a $4.7 million
decrease in performance share expense related to declining results
compared to performance targets for 2008 compared to 2007, a $1.8 million
decrease in retirement expense and a $1.4 million decrease in 401(k)
expense due to the suspension of matching contributions during the first
quarter of 2008. These decreases were partially offset by a
$1.0 million increase in stock options
expense.
|
|
|
Ø
|
Transition
costs relating to the outsourcing of IT and call center operations
decreased $4.6 million, including salary related
expenses.
|
|
|
Ø
|
Sales
and marketing expense decreased $3.2 million due primarily to decreased
Internet-related spending and other marketing related
costs.
|
|
|
Ø
|
Software
expenses decreased $2.8 million primarily due to a decrease in outsourcing
expenses.
|
|
|
Ø
|
Separation
costs, primarily related to the elimination of certain positions from the
organizational structure, were lower by $1.0
million.
|
|
|
Ø
|
The
change in the market value of investments in the Company’s deferred
compensation and retirement plans increased selling, general and
administrative expenses $5.5 million due to a reduction in the loss on
these plans in 2008 compared to 2007, which is offset in other revenue
and, therefore, did not impact net
income.
|
Net
interest expense increased $0.8 million in 2008 primarily due to a decrease in
interest reimbursements relating to vehicle programs and lower earnings on
invested funds resulting from lower interest rates, partially offset by lower
average vehicle debt. As a percent of revenue, net interest expense
was 6.5% in 2008, compared to 6.3% in 2007.
Goodwill
and long-lived asset impairment expense increased $363.1 million in 2008, due to
non-cash charges in 2008 relating to goodwill impairment of $281.2 million,
reacquired franchise rights impairment of $69.0 million, certain IT initiative
write-offs of $10.5 million and impairment of substantially all of the Company’s
Canadian operations long-lived assets of $6.1 million. In 2007, the
Company wrote off certain fleet related software totaling $3.7 million made
obsolete by the Pros Fleet Management Software the Company began implementing
during the third quarter of 2007.
- 38
-
The
change in fair value of the Company’s interest rate swap agreements was a
decrease of $36.1 million in 2008 compared to a decrease of $39.0 million in
2007 resulting in a year-over-year increase of $2.9 million.
The
income tax benefit for 2008 was $110.1 million. The effective income
tax rate was 24.1% for 2008 compared to 90.5% for 2007. The decrease in the
effective tax rate was primarily due to the taxable benefit related to the
pre-tax loss in 2008 compared to the pre-tax income in 2007 and the non-cash
write-off of goodwill and reacquired franchise rights (of which only a portion
of these write-offs receive a deferred tax benefit) and other long-lived
assets. The Company reports taxable income for the U.S. and Canada in
separate tax jurisdictions and establishes provisions separately for each
jurisdiction. On a separate, domestic basis, the U.S. effective tax
rate approximates the statutory tax rate including the effect of state income
taxes and the impact of establishing valuation allowances for net operating
losses that could expire. However, no income tax benefit was recorded
for Canadian losses in 2008, due to an overall pre-tax loss, thus reducing the
consolidated effective tax rate and increasing the consolidated effective tax
rate in 2007.
Liquidity
and Capital Resources
The
Company’s primary uses of liquidity are for the purchase of vehicles for its
rental fleets, including required collateral enhancement under its fleet
financing structures, non-vehicle capital expenditures and for working
capital. The Company uses both cash and letters of credit to support
asset backed vehicle financing programs. The Company also uses
letters of credit or insurance bonds to secure certain commitments related to
airport concession agreements, insurance programs, and for other
purposes. The Company’s primary sources of liquidity are cash
generated from operations, secured vehicle financing, the Senior Secured Credit
Facilities and insurance bonds. Also, in October 2009, the Company
completed an equity offering of its common stock which generated $120.6 million
of proceeds, net of fees paid to underwriters and other expenses.
The
Company believes that its cash generated from operations, cash balances and
secured vehicle financing programs are adequate to meet its liquidity
requirements during 2010. The Company has asset backed medium term
note maturities totaling $400 million that amortize ratably from January
2010 through June 2010, and an additional $100 million in maturities in December
2010. The Company has adequate cash on hand to fund these maturities
without the need for additional financing, although it intends to pursue
additional financing capacity on an opportunistic basis. Despite
improving conditions in the asset backed medium term note market, the Company
expects that new financing will require a substantially higher collateral
enhancement rate than its current medium term notes, but will have similar
interest rates. Although the financial markets were constrained
during the first half of 2009, the fleet financing markets improved during the
second half of 2009 and into 2010, and the Company believes it will be able to
access funding to add capacity for future growth. In addition, based
on its current cash position which was enhanced by the equity offering in the
fourth quarter of 2009, the Company has the ability to meet such higher
collateral requirements, and believes it would be able to refinance or replace
its asset backed medium term notes with other debt upon their maturity or in the
event of an early amortization.
Operating
Activities
Cash
generated by operating activities of $535.9 million, $507.2 million and $556.3
million for 2009, 2008, and 2007, respectively, are primarily the result of net
income, adjusted for depreciation, goodwill impairments net of deferred tax
benefits in 2008 and the change in fair value of derivatives. The
liquidity necessary for purchasing vehicles is primarily obtained from secured
vehicle financing, most of which is proceeds from sale of asset backed medium
term notes, sales proceeds from disposal of used vehicles and cash generated by
operating activities. The asset backed medium term notes require
varying levels of credit enhancement or overcollateralization, which are
provided by a combination of cash, vehicles, and letters of
credit. These letters of credit are provided under the Revolving
Credit Facility.
Investing
Activities
Cash
provided by investing activities was $279.0 million for 2009. The
principal source of cash in investing activities was the sale of revenue-earning
vehicles, which totaled $1.5 billion in proceeds. This source of cash
was partially offset by the purchase of revenue-earning vehicles, which totaled
$1.1 billion and the $100 million of cash and cash equivalents required to
be maintained at all times under the Company’s amendment of the Senior Secured
Credit Facilities separately identified on the face of the
balance sheet as cash and cash equivalents – required minimum balance (see Item
8 - Note 1 of Notes to Consolidated Financial
Statements).
- 39
-
The
Company’s need for cash to finance vehicles typically peaks in the second and
third quarters of the year when fleet levels build to meet seasonal rental
demand. Fleet levels are typically the lowest in the first and fourth
quarters when rental demand is at a seasonal low. During 2009, the
Company reduced its overall fleet to match its fleet levels with expected demand
levels and to reduce its financing requirements. Restricted cash at
December 31, 2009 increased $26.0 million from the previous year, including
$22.8 million available for vehicle purchases or debt payoffs coupled with $3.2
million of interest income earned on restricted cash and
investments. The Company expects to continue to fund its
revenue-earning vehicles with cash provided from operations and from disposal of
used vehicles. The Company also used net cash for non-vehicle capital
expenditures of $15.5 million. These expenditures consist primarily
of airport facility improvements for the Company’s rental locations and
investments in IT equipment and systems. The Company estimates
non-vehicle capital expenditures to be approximately $25 million in 2010 related
to airport facility projects and IT equipment and systems.
Cash used
in investing activities was $198.4 million for 2008. The principal
use of cash in investing activities was the purchase of revenue-earning
vehicles, which totaled $2.2 billion. This use of cash offset $2.5
billion in proceeds from the sale of used revenue-earning vehicles. The
Company’s need for cash to finance vehicles is seasonal and typically peaks in
the second and third quarters of the year when fleet levels build to meet
seasonal rental demand. Fleet levels are typically the lowest in the
first and fourth quarters when rental demand is at a seasonal
low. Restricted cash at December 31, 2008 increased $463.6 million
from the previous year, including $454.7 million available for vehicle purchases
or debt payoffs coupled with $8.9 million of interest income earned on
restricted cash and investments. The Company expects to continue to
fund its revenue-earning vehicles with cash provided from operations and from
disposal of used vehicles. The Company also used net cash for
non-vehicle capital expenditures of $28.9 million. These expenditures
consist primarily of airport facility improvements for the Company’s rental
locations and investments in IT equipment and systems. In addition,
the Company used cash for franchise acquisitions of $2.1 million in
2008.
Cash used
in investing activities was $465.3 million for 2007. The principal
use of cash in investing activities was the purchase of revenue-earning
vehicles, which totaled $4.0 billion. This use of cash was primarily
offset by $3.4 billion in proceeds from the sale of used revenue-earning
vehicles. The Company’s need for cash to finance vehicles is seasonal and
typically peaks in the second and third quarters of the year when fleet levels
build to meet seasonal rental demand. Fleet levels are the lowest in
the first and fourth quarters when rental demand is at a seasonal
low. Restricted cash at December 31, 2007 decreased $256.8 million
from the previous year, including $270.8 million used for vehicle financing
partially offset by interest income earned on restricted cash and investments of
$14.0 million. The Company used cash for non-vehicle capital
expenditures of $40.6 million. These expenditures consist primarily
of airport facility improvements for the Company’s rental locations and
investments in IT equipment and systems. In addition, the Company
used cash for franchise acquisitions of $30.3 million in 2007.
Financing
Activities
Cash used
in financing activities was $644.1 million for 2009 primarily due to the
repayment of amounts outstanding under the Liquidity Facility and the Conduit
Facility in the amount of $274.9 million and $215.0 million,
respectively. Additionally, due to non-renewal of its vehicle
manufacturer and bank lines of credit, the Company repaid $233.7 million of debt
outstanding under these arrangements. The Company also prepaid $20
million of its Term Loan and paid $6.6 million in deferred financing cost
associated with the amendments to the Senior Secured Credit
Facilities. The Company also paid $6.6 million in fees related
to the issuance of an additional 6.6 million shares of common stock in November
2009. These uses of cash were partially offset by $129.6 million of
proceeds from issuance of common shares.
Cash used
in financing activities was $180.2 million for 2008 primarily due to the
maturity of the 2004 Series asset backed medium term notes totaling $500
million, a pay down of $70.6 million in the Term Loan and a decrease of $49.0
million in the limited partner interest in the Canadian funding limited
partnership (Canadian fleet financing), partially offset by a net increase in
the issuance of commercial paper, including the Liquidity Facility (hereinafter
defined) of $249.1 million and an increase of $203.0 million under the Conduit
Facility.
- 40
-
Cash used
in financing activities was $182.0 million for 2007 primarily due to a decrease
of $413.0 million under the Conduit Facility, the maturity of asset backed
medium term notes totaling $312.5 million, a net decrease in the issuance of
commercial paper totaling $153.1 million and share repurchases totaling $71.5
million. Cash used in financing activities was partially offset by
the issuance of $500 million in asset backed medium term notes in May 2007, the
proceeds of the $250 million Term Loan in June 2007, and an increase of $42.1
million in other existing bank vehicle lines of credit.
Contractual
Obligations and Commitments
The
Company has various contractual commitments primarily related to asset backed
medium term notes and short-term borrowings outstanding for vehicle purchases, a
non-vehicle related term loan, airport concession fee and operating lease
commitments related to airport and other facilities, technology contracts, and
vehicle purchases. The Company expects to fund these commitments with
cash generated from operations, sales proceeds from disposal of used vehicles
and future issuances of asset backed notes as existing medium term notes
mature. The following table provides details regarding the Company’s
contractual cash obligations and other commercial commitments subsequent to
December 31, 2009:
|
Payments due or commitment expiration by
period
|
||||||||||||||||||||
|
(in thousands)
|
||||||||||||||||||||
|
Beyond
|
||||||||||||||||||||
|
2010
|
2011-2012 | 2013-2014 | 2014 |
Total
|
||||||||||||||||
|
Contractual
cash obligations:
|
||||||||||||||||||||
|
Asset
backed medium term notes (1)
|
$ | 562,569 | $ | 1,041,321 | $ | - | $ | - | $ | 1,603,890 | ||||||||||
|
Other
short-term borrowings (1)
|
70,535 | - | - | - | 70,535 | |||||||||||||||
|
Subtotal
- Vehicle debt and obligations
|
633,104 | 1,041,321 | - | - | 1,674,425 | |||||||||||||||
|
Term
Loan
|
14,871 | 34,422 | 132,134 | - | 181,427 | |||||||||||||||
|
Subtotal
- Non-vehicle debt
|
14,871 | 34,422 | 132,134 | - | 181,427 | |||||||||||||||
|
Total
debt and other obligations
|
647,975 | 1,075,743 | 132,134 | - | 1,855,852 | |||||||||||||||
|
Operating
lease commitments
|
41,477 | 60,889 | 34,770 | 56,722 | 193,858 | |||||||||||||||
|
Airport
concession fee commitments
|
76,363 | 122,720 | 80,437 | 104,216 | 383,736 | |||||||||||||||
|
Vehicle
purchase commitments
|
1,409,129 | - | - | - | 1,409,129 | |||||||||||||||
|
Other
commitments
|
24,463 | 24,033 | - | - | 48,496 | |||||||||||||||
|
Total
contractual cash obligations
|
$ | 2,199,407 | $ | 1,283,385 | $ | 247,341 | $ | 160,938 | $ | 3,891,071 | ||||||||||
|
Other
commercial commitments:
|
||||||||||||||||||||
|
Letters
of credit
|
$ | 147,142 | $ | - | $ | - | $ | - | $ | 147,142 | ||||||||||
|
|
(1)
|
Further
discussion of asset backed medium term notes and short-term borrowings is
below and in Item 8 - Note 10 of Notes to Consolidated Financial
Statements. Amounts include both principal and interest
payments. Amounts exclude related discounts, where
applicable.
|
The
Company also has self-insured liabilities related to third-party bodily injury
and property damage claims totaling $108.6 million that are not included in the
contractual obligations and commitments table above. See Item 8 -
Note 15 of Notes to Consolidated Financial Statements.
Asset
Backed Medium Term Notes
The asset
backed medium term note program is comprised of $1.5 billion in asset backed
medium term notes with maturities ranging from 2010 to
2012. Borrowings under the asset backed medium term notes are secured
by eligible vehicle collateral and bear interest at fixed rates ranging from
4.58% to 5.27% including certain floating rate notes swapped to fixed
rates.
- 41
-
The
Company typically accesses the medium term note
market each year to replace maturing notes; however, the Company did not need to
access this market in 2008 or 2009. Proceeds from the asset backed
medium term notes that are temporarily not utilized for financing vehicles and
certain related receivables are maintained in restricted cash and investment
accounts and are available for the purchase of vehicles. These
amounts totaled approximately $590.8 million at December 31, 2009.
In
February 2009, the Company amended all series of its asset backed medium term
note program to be able to operate a fleet comprised of 100% Non-Program
Vehicles, while retaining the ability to purchase Program Vehicles at
its discretion to meet seasonal demand and allow flexibility in its defleeting
cycle.
In June
2009, the Company amended all series of its asset backed medium term note
program to provide the Company with flexibility to manage its inventory by
allowing re-designation of vehicles from the Series 2005-1 Notes to the Series
2006-1 Notes and Series 2007-1 Notes given the scheduled maturity of the Series
2005-1 Notes. In November 2009, the Company had fully utilized the
$200 million re-designation capacity. In relation to the amendments
to the medium term note programs, the Company amended its Senior Secured Credit
Facilities, whereby the Company may not increase the available amount of the
letters of credit issued as enhancement for the Company’s Series 2005-1 Notes at
any time prior to the occurrence of an event of bankruptcy or insolvency event
with respect to a Monoline under the Series 2005-1 Notes if, at any time, the
aggregate undrawn amount of such letters of credit and unpaid reimbursement
obligations in respect thereof were greater than $24.4 million or if the
requested increase would cause the Series 2005-1 letter of credit amount to
exceed that amount.
In August
2009, the Company further amended all series of its asset backed medium term
notes in order to add Chrysler and General Motors as eligible vehicle
manufacturers under the indenture supplements. The related indenture
supplements were also amended to cure any and all conditions that may have been
triggered as a result of the Chrysler bankruptcy and that could have constituted
a “Manufacturer Event of Default” as defined in the indenture supplements. In
conjunction with this amendment, the Company amended its Senior Secured Credit
Facilities under which letters of credit are issued as enhancement for the asset
backed medium term notes. Under the terms of this amendment, letters
of credit to be issued as enhancement for future fleet financing will be limited
to a maximum of 7% of the initial face amount of each series of asset backed
medium term notes issued, up to the existing sub-limit under the facility of
$100 million. This amendment does not apply to, nor have any impact
on, the Company’s existing medium term notes and enhancement letters of
credit.
The asset
backed medium term note programs each contain a minimum net worth condition and
an interest coverage condition in the Monoline agreements. The
Company was in compliance with these conditions at December 31,
2009.
Commercial
Paper Program, Conduit and Liquidity Facility
In
February 2009, the Company paid in full the outstanding balance of its
Commercial Paper Program (the “Commercial Paper Program”), including the related
liquidity facility, and its Variable Funding Note Purchase Facility (the
“Conduit Facility”). The Company terminated these programs in April
2009.
Other
Vehicle Debt and Obligations
The
Company finances its Canadian vehicle fleet through a fleet securitization
program. This program provides DTG Canada vehicle financing up to
CAD$200 million funded through a bank commercial paper conduit; however, in
2009, the committed funding was reduced from CAD$200 million to CAD$125 million
in December 2009 (approximately US$118.9 million at December 31, 2009), with a
final reduction in January 2010 to CAD$100 million, which will remain in effect
until the partnership agreement expires on May 31, 2010. At December
31, 2009, DTG Canada had approximately CAD$73.3 million (US$69.7 million) funded
under this program. The Company is working on a new CAD$150 million
financing facility to replace this facility prior to its
maturity. The Canadian fleet securitization program contains a
tangible net worth covenant and DTG Canada was in compliance with this covenant
at December 31, 2009.
In 2009,
the Company paid in full the outstanding balance under its vehicle manufacturer
line of credit and its remaining bank lines of credit.
- 42
-
Senior
Secured Credit Facilities
At
December 31, 2009, the Company’s Senior Secured Credit Facilities were comprised
of a $231.3 million Revolving Credit Facility and a $158.1 million Term Loan,
both of which expire on June 15, 2013. The Senior Secured Credit
Facilities contain certain financial and other covenants, including a covenant
to maintain a minimum adjusted tangible net worth of $150 million and a minimum
of $100 million of unrestricted cash and cash equivalents, including $60 million
that is required to be held in separate accounts with the Collateral Agent to
secure payment of amounts outstanding under the Term Loan and letters of credit
issued under the Revolving Credit Facility. The Senior Secured Credit Facilities
contain certain other restrictive covenants, including annual limitations on
non-vehicle capital expenditures, and a prohibition against cash dividends and
share repurchases. Additionally, the Company executed liens in
favor of the banks encumbering seven additional properties not previously
encumbered as well as certain vehicles not pledged as collateral under another
vehicle financing facility. The Senior Secured Credit Facilities are
collateralized by a first priority lien on substantially all material
non-vehicle assets and certain vehicle assets not pledged as collateral under a
vehicle financing facility. Additionally, in connection with the amendment, the
Company expensed approximately $1.0 million of unamortized deferred financing
costs as a result of the extinguishment of debt in the first quarter of 2009. As
of December 31, 2009, the Company is in compliance with all
covenants.
The
Revolving Credit Facility expires on June 15, 2013, and is restricted to use for
letters of credit as no revolving credit borrowings are permitted under the
amended facility. The Revolving Credit Facility contains sub-limits
of $40 million and $100 million that restrict the amount of capacity available
for letters of credit to be used as vehicle enhancement in both its Canadian and
U.S. operations, respectively. The Company had letters of credit
outstanding under the Revolving Credit Facility of approximately $141.6 million
and remaining available capacity of $89.7 million at December 31,
2009.
The
amended Term Loan requires the Company to make minimum quarterly principal
payments of $2.5 million beginning in March 2010, with a final payment of $128
million in June 2013.
Debt
Servicing Requirements
The
Company will continue to have substantial debt and debt service requirements
under its financing arrangements. As of December 31, 2009, the
Company’s total consolidated debt and other obligations were approximately $1.7
billion, of which $1.6 billion was secured debt for the purchase of
vehicles. The majority of the Company’s vehicle debt is issued by
special purpose finance entities as described herein, all of which are fully
consolidated into the Company’s financial statements. The Company has
scheduled annual principal payments for vehicle debt of approximately $570
million in 2010 and approximately $500 million per year for 2011 and
2012.
The
Company intends to use cash generated from operations to fund non-vehicle
capital expenditures, subject to restrictions under its debt instruments, and
proceeds from the sale of vehicles for debt service and vehicle purchases. The
Company has historically repaid its debt and funded its capital investments
(aside from growth in its rental fleet) with cash provided from operations and
from the sale of vehicles. The Company has funded growth in its vehicle fleet by
incurring additional secured vehicle debt and with cash generated from
operations.
The
Company has significant requirements for bonds and letters of credit to support
its insurance programs, airport concession and other obligations. At
December 31, 2009, various insurance companies had $40.8 million in surety bonds
and various banks had $71.3 million in letters of credit to secure these
obligations. At December 31, 2009, these surety bonds and letters of credit had
not been drawn upon.
Interest
Rate Risk
The
Company’s results of operations depend significantly on prevailing levels of
interest rates because of the large amount of debt it incurs to purchase
vehicles. In addition, the Company is exposed to increases in interest rates
because a portion of its debt bears interest at floating rates. The Company
estimates that, in 2010, approximately 25% of its average debt will bear
interest at floating rates. The amount of the Company’s financing costs affects
the amount the Company must charge its customers to be
profitable. See Item 8 - Note 10 of Notes to Consolidated Financial
Statements.
- 43
-
Like-Kind Exchange
Program
The
Company utilizes a like-kind exchange program for its vehicles whereby tax basis
gains on disposal of eligible revenue-earning vehicles are deferred (the
“Like-Kind Exchange Program”). To qualify for Like-Kind Exchange
Program treatment, the Company exchanges (through a qualified intermediary)
vehicles being disposed of with vehicles being purchased allowing the Company to
carry-over the tax basis of vehicles sold to replacement vehicles, with certain
adjustments. The Company’s ability to defer the gains on the
disposition of its vehicles under its like-kind exchange program is affected by
the recent significant downsizing of its fleet. The Company utilized its
existing federal net operating loss (“NOL”) carryforwards to offset the majority
of these gains; however, the taxable gains exceeded the available federal NOL
carryforwards and resulted in cash tax payments during 2009 tax
year. Projection of the results of the like-kind exchange process is
complex, requires numerous assumptions and is not subject to precise
estimation. Actual results depend upon future sale and purchase
transactions extending up to 180 days after year-end and actual results may
differ from current projections. Increased cash tax payments may be
incurred in 2010 and beyond, depending on future vehicle purchase and sale
transactions.
The
Like-Kind Exchange Program has historically increased the amount of cash and
investments restricted for the purchase of replacement vehicles, especially
during seasonally reduced fleet periods. At December 31, 2009,
restricted cash and investments totaled $622.5 million and are restricted for
the acquisition of revenue-earning vehicles and other specified uses as defined
under asset backed financing programs, the Canadian fleet securitization
partnership program and the Like-Kind Exchange Program. The majority
of the restricted cash and investments balance is normally utilized in the
second and third quarters for seasonal purchases.
Inflation
The
increased acquisition cost of vehicles is the primary inflationary factor
affecting the Company. Many of the Company’s other operating expenses are also
expected to increase with inflation. Management does not expect that the effect
of inflation on the Company’s overall operating costs will be greater for the
Company than for its competitors. Inflation did not have a material
impact on the Company’s results of operations for the three years in the period
ended December 31, 2009.
Critical
Accounting Policies and Estimates
As with
most companies, the Company must exercise judgment due to the level of
subjectivity used in estimating certain costs included in its results of
operations. The more significant items include:
Revenue-earning vehicles and related
vehicle depreciation expense – Revenue-earning vehicles are stated at
cost, net of related discounts. In 2009, the Company continued to
increase the level of Non-Program Vehicles in its fleet. At December 31, 2009,
Non-Program Vehicles accounted for approximately 95% of the total
fleet.
For
Non-Program Vehicles, the Company must estimate what the residual values of
these vehicles will be at the expected time of disposal to determine monthly
depreciation rates. The estimation of residual values requires the Company to
make assumptions regarding the age and mileage of the car at the time of
disposal, as well as expected used vehicle auction market
conditions. The Company reevaluates estimated residual values
periodically. Differences between actual residual values and those
estimated by the Company result in a gain or loss on disposal and are recorded
as an adjustment to depreciation expense at the time of sale. Actual timing of
disposal shorter than the life used for depreciation purposes could result in a
significant loss on sale. A one percent change in the expected
residual value of Non-Program Vehicles sold during 2009 would have impacted
vehicle depreciation expense net by $4.7 million. In 2009, the
Company increased the holding term on its Non-Program Vehicles substantially to
help lower its overall vehicle costs. The average holding term for
vehicles was approximately 18 to 20 months for 2009.
For
Program Vehicles, the Company is required to depreciate the vehicle according to
the terms of the guaranteed depreciation or repurchase program and in doing so
is guaranteed to receive the full
net book value in proceeds upon the sale of the
vehicle.
- 44
-
In some
cases, the sales proceeds are received directly from the auctions, with any
shortfall in value being paid by the vehicle manufacturer. With
certain other vehicle manufacturers, the entire balance of proceeds from vehicle
sales comes directly from the manufacturer. In either case, the
Company bears the risk of collectibility on that receivable from the vehicle
manufacturer. The Company monitors its vehicle manufacturer
receivables based on time outstanding, manufacturer strength and length of the
relationship.
Vehicle insurance reserves –
The Company self-insures or retains a portion of the exposure for losses related
to bodily injury and property damage liability claims along with the risk
retained for the supplemental liability insurance program. The
obligation for Vehicle Insurance Reserves represents an estimate of both
reported accident claims not yet paid and claims incurred but not yet reported,
up to the Company’s risk retention level. The Company records expense
related to Vehicle Insurance Reserves on a monthly basis based on rental volume
in relation to historical accident claim experience and trends, projections of
ultimate losses, expenses, premiums and administrative
costs. Management monitors the adequacy of the liability and monthly
accrual rates based on actuarial analysis of the development of the claim
reserves, the accident claim history and rental volume. Since the
ultimate disposition of the claims is uncertain, the likelihood of materially
different results is possible. However, the potential volatility of
these estimates is reduced due to the frequency of actuarial reviews and
significant historical data available for similar claims.
Income taxes – The Company
estimates its consolidated effective state income tax rate using a process that
estimates state income taxes by entity and by tax
jurisdiction. Changes in the Company’s operations in these tax
jurisdictions may have a material impact on the Company’s effective state income
tax rate and deferred state income tax assets and
liabilities. Additionally, the Company records deferred income tax
assets and liabilities based on the temporary differences between the financial
reporting basis and the tax basis of the Company’s assets and liabilities by
applying enacted statutory tax rates that management believes will be applicable
to future years for these differences. Changes in tax laws and rates
in future periods may materially affect the amount of recorded deferred tax
assets and liabilities. The Company also utilizes a like-kind
exchange program to defer tax basis gains on disposal of eligible
revenue-earning vehicles. This program requires the Company to make
material estimates related to future fleet activity. The Company’s
income tax returns are periodically examined by various tax authorities who may
challenge the Company’s tax positions. While the Company believes its
tax positions are more likely than not supportable by tax rulings,
interpretations, precedents or administrative practices, there may be instances
in which the Company may not succeed in defending a position being
examined. Resulting adjustments could have a material impact on the
Company’s financial position or results of operations.
Share-based payment plans –
The Company has share-based compensation plans under which the Company grants
performance shares, non-qualified option rights and restricted stock to key
employees and non-employee directors. The Company’s performance share awards
contain both a performance condition and a market condition. The Company uses
the closing market price of DTG’s common stock on the date of grant to estimate
the fair value of the nonvested stock awards and performance based performance
shares, and uses a lattice-based option valuation model to estimate the fair
value of market based performance shares. The lattice-based option valuation
model requires the input of somewhat subjective assumptions, including expected
stock price volatility, term, risk-free interest rate and dividend
yield. The Company relies on observations of historical volatility
trends of the Company and its peers (defined as the Russell 2000 Index), as
determined by an independent third-party, to determine expected
volatility. In determining the expected term, the Company observes
the actual terms of prior grants and the actual vesting schedule of the
grant. The risk-free interest rate is the actual U.S. Treasury
zero-coupon rate for bonds matching the expected term of the award on the date
of grant. The expected dividend yield was estimated based on the
Company’s current dividend yield, and adjusted for anticipated future changes.
The number of performance shares ultimately earned will range from zero to 200%
of the target award, depending on the Company’s achievement of the performance
and market conditions. Estimates of achievement of market conditions
are incorporated into the determination of the performance shares’ fair value at
the beginning of the performance
period.
- 45
-
At the
end of each reporting period, the Company must estimate whether the performance
conditions will be achieved in order to determine the value of the performance
shares awarded. In making this determination, the Company has
observed actual past performance of the Company.
New
Accounting Standards
For a
discussion on new accounting standards refer to Item 8 - Note 1 of Notes to
Consolidated Financial Statements.
Outlook
for 2010
The
Company expects industry conditions to improve slightly in 2010 as a result of
several factors. Continued improvement in the overall economy,
combined with ongoing recovery in the credit markets, is expected to result in
low single-digit growth in transaction days in 2010. The Company
believes that customer demand for its value-oriented leisure brands and
continued industry pricing discipline will result in moderate price increases in
revenue per day on a year-over-year basis. Finally, the Company
believes that recent favorable trends in the used vehicle markets will continue
throughout 2010, resulting in solid residual values and improvements in monthly
fleet operating costs year over year.
Based on
the above expectations, the Company is targeting Corporate Adjusted EBITDA for
the full year of 2010 to be within a range of $120 million to $140
million. The Company provided the following additional information
with respect to its full year guidance:
|
|
·
|
Vehicle
rental revenues are projected to be up 2 – 4 percent compared to 2009,
resulting from low single-digit increases in both
transaction days and revenue per
day.
|
|
|
·
|
Vehicle
depreciation costs for the full year of 2010 are expected to be
approximately $325 per vehicle per month. The Company noted
that disposition of vehicles is expected to create some volatility in the
level of these costs on a quarter-to-quarter
basis.
|
ITEM
7A. QUANTITATIVE AND QUALITATIVE
DISCLOSURES ABOUT MARKET RISK
The table
below provides information about the Company’s market sensitive financial
instruments and constitutes a “forward-looking statement.” The
Company’s primary market risk exposure is volatility of interest rates,
primarily in the United States. The Company manages interest rates
through use of a combination of fixed and floating rate debt and interest rate
swap agreements (see Item 8 - Note 11 of Notes to Consolidated Financial
Statements). All items described are non-trading and are stated in
U.S. dollars. Because a portion of the Company’s debt is denominated
in Canadian dollars, its carrying value is impacted by exchange rate
fluctuations. However, this foreign currency risk is mitigated by the
underlying collateral which is the Canadian fleet. Other foreign
exchange risk is immaterial to the consolidated results and financial condition
of the Company. The fair value and average receive rate of the interest rate
swaps is calculated using projected market interest rates over the term of the
related debt instruments as provided by the counterparties.
- 46
-
|
|
Fair
Value
|
|||||||||||||||||||||||||||||||
|
Expected
Maturity Dates
|
|
December
31,
|
||||||||||||||||||||||||||||||
|
as
of December 31, 2009
|
2010
|
2011
|
2012
|
2013
|
2014
|
Thereafter
|
Total
|
2009
|
||||||||||||||||||||||||
|
(in
thousands)
|
||||||||||||||||||||||||||||||||
|
Debt:
|
||||||||||||||||||||||||||||||||
|
Vehicle
debt and obligations-
|
||||||||||||||||||||||||||||||||
|
floating
rates (1)
|
$ | 390,000 | $ | 500,000 | $ | 500,000 | $ | - | $ | - | $ | - | $ | 1,390,000 | $ | 1,307,100 | ||||||||||||||||
|
Weighted
average interest rates
|
1.05 | % | 2.57 | % | 3.66 | % | - | - | - | |||||||||||||||||||||||
|
Vehicle
debt and obligations-
|
||||||||||||||||||||||||||||||||
|
fixed
rates
|
$ | 110,000 | $ | - | $ | - | $ | - | $ | - | $ | - | $ | 110,000 | $ | 110,408 | ||||||||||||||||
|
Weighted
average interest rates
|
4.59 | % | - | - | - | - | - | |||||||||||||||||||||||||
|
Vehicle
debt and obligations-
|
||||||||||||||||||||||||||||||||
|
Canadian
dollar denominated
|
$ | 69,690 | $ | - | $ | - | $ | - | $ | - | $ | - | $ | 69,690 | $ | 69,690 | ||||||||||||||||
|
Weighted
average interest rates
|
1.21 | % | - | - | - | - | - | |||||||||||||||||||||||||
|
Non-vehicle
debt - term loan
|
$ | 10,000 | $ | 10,000 | $ | 10,000 | $ | 128,125 | $ | - | $ | - | $ | 158,125 | $ | 143,894 | ||||||||||||||||
|
Weighted
average interest rates
|
3.18 | % | 4.65 | % | 5.82 | % | 6.57 | % | - | - | ||||||||||||||||||||||
|
Interest
Rate Swaps:
|
||||||||||||||||||||||||||||||||
|
Variable
to Fixed
|
$ | 390,000 | $ | 500,000 | $ | 500,000 | $ | - | $ | - | $ | - | $ | 1,390,000 | $ | 1,465,371 | ||||||||||||||||
|
Average
pay rate
|
4.89 | % | 5.27 | % | 5.16 | % | - | - | - | |||||||||||||||||||||||
|
Average
receive rate
|
0.68 | % | 2.15 | % | 3.32 | % | - | - | - | |||||||||||||||||||||||
|
(1)
Floating rate vehicle debt and obligations include $290 million relating
to the Series 2005 Notes, the $600 million Series 2006
Notes
|
||||||||||||||||||||||||||||||||
|
and
the $500 million Series 2007 Notes swapped from floating interest rates to
fixed interest rates.
|
||||||||||||||||||||||||||||||||
- 47
-
|
|
Fair
Value
|
|||||||||||||||||||||||||||||||
|
Expected
Maturity Dates
|
|
December
31,
|
||||||||||||||||||||||||||||||
|
as
of December 31, 2008
|
2009
|
2010
|
2011
|
2012
|
2013
|
Thereafter
|
Total
|
2008
|
||||||||||||||||||||||||
|
(in
thousands)
|
||||||||||||||||||||||||||||||||
|
Debt:
|
||||||||||||||||||||||||||||||||
|
Vehicle
debt and obligations-
|
||||||||||||||||||||||||||||||||
|
floating
rates (1)
|
$ | 719,974 | $ | 392,283 | $ | 500,910 | $ | 500,432 | $ | - | $ | - | $ | 2,113,599 | $ | 1,467,599 | ||||||||||||||||
|
Weighted
average interest rates
|
4.09 | % | 1.95 | % | 2.65 | % | 3.11 | % | - | - | ||||||||||||||||||||||
|
Vehicle
debt and obligations-
|
||||||||||||||||||||||||||||||||
|
fixed
rates
|
$ | - | $ | 110,000 | $ | - | $ | - | $ | - | $ | - | $ | 110,000 | $ | 83,586 | ||||||||||||||||
|
Weighted
average interest rates
|
- | 4.59 | % | - | - | - | - | |||||||||||||||||||||||||
|
Vehicle
debt and obligations-
|
||||||||||||||||||||||||||||||||
|
Canadian
dollar denominated
|
$ | 86,535 | $ | - | $ | - | $ | - | $ | - | $ | - | $ | 86,535 | $ | 86,535 | ||||||||||||||||
|
Weighted
average interest rates
|
3.27 | % | - | - | - | - | - | |||||||||||||||||||||||||
|
Non-vehicle
debt - term loan
|
$ | - | $ | - | $ | - | $ | - | $ | - | $ | 178,125 | $ | 178,125 | $ | 35,625 | ||||||||||||||||
|
Weighted
average interest rates
|
- | - | - | - | - | 4.87 | % | |||||||||||||||||||||||||
|
Interest
Rate Swaps:
|
||||||||||||||||||||||||||||||||
|
Variable
to Fixed
|
$ | - | $ | 390,000 | $ | 500,000 | $ | 500,000 | $ | - | $ | - | $ | 1,390,000 | $ | 1,509,620 | ||||||||||||||||
|
Average
pay rate
|
- | 4.89 | % | 5.27 | % | 5.16 | % | - | - | |||||||||||||||||||||||
|
Average
receive rate
|
- | 1.59 | % | 2.24 | % | 2.78 | % | - | - | |||||||||||||||||||||||
|
(1)
Floating rate vehicle debt and obligations include $290 million relating
to the Series 2005 Notes, the $600 million Series 2006
Notes
|
||||||||||||||||||||||||||||||||
|
and
the $500 million Series 2007 Notes swapped from floating interest rates to
fixed interest rates.
|
||||||||||||||||||||||||||||||||
Interest
rate sensitivity – Based on the Company’s level of floating rate debt (excluding
notes with floating interest rates swapped to effectively fixed interest rates)
at December 31, 2009, a 50 basis point fluctuation in short-term interest rates
would have an approximate $1 million impact on the Company’s expected pre-tax
income.
- 48
-
|
FINANCIAL STATEMENTS
AND SUPPLEMENTARY DATA
|
REPORT
OF INDEPENDENT REGISTERED PUBLIC ACCOUNTING FIRM
To the
Board of Directors and Stockholders of
Dollar
Thrifty Automotive Group, Inc.:
We have
audited the accompanying consolidated balance sheets of Dollar Thrifty
Automotive Group, Inc. and subsidiaries (the “Company”) as of December 31, 2009
and 2008, and the related consolidated statements of operations, stockholders’
equity and comprehensive income (loss), and cash flows for each of the three
years in the period ended December 31, 2009. Our audits also included the
financial statement schedule listed in the Index at Item 15. These
financial statements and financial statement schedule are the responsibility of
the Company’s management. Our responsibility is to express an opinion on
the financial statements and financial statement schedule based on our
audits.
We
conducted our audits in accordance with the standards of the Public Company
Accounting Oversight Board (United States). Those standards require that
we plan and perform the audit to obtain reasonable assurance about whether the
financial statements are free of material misstatement. An audit includes
examining, on a test basis, evidence supporting the amounts and disclosures in
the financial statements. An audit also includes assessing the accounting
principles used and significant estimates made by management, as well as
evaluating the overall financial statement presentation. We believe that
our audits provide a reasonable basis for our opinion.
In our
opinion, such consolidated financial statements present fairly, in all material
respects, the financial position of Dollar Thrifty Automotive Group, Inc. and
subsidiaries as of December 31, 2009 and 2008, and the results of their
operations and their cash flows for each of the three years in the period ended
December 31, 2009, in conformity with accounting principles generally accepted
in the United States of America. Also, in our opinion, such financial
statement schedule, when considered in relation to the basic consolidated
financial statements taken as a whole, presents fairly, in all material
respects, the information set forth therein.
We have
also audited, in accordance with the standards of the Public Company Accounting
Oversight Board (United States), the Company’s internal control over financial
reporting as of December 31, 2009, based on the criteria established in Internal Control—Integrated
Framework issued by the Committee of Sponsoring Organizations of the
Treadway Commission and our report dated March 4, 2010 expressed an unqualified
opinion on the Company’s internal control over financial reporting.
/s/ DELOITTE
& TOUCHE LLP
Tulsa,
Oklahoma
March 4,
2010
- 49
-
|
DOLLAR
THRIFTY AUTOMOTIVE GROUP, INC. AND SUBSIDIARIES
|
||||||||||||
|
CONSOLIDATED
STATEMENTS OF OPERATIONS
|
||||||||||||
|
YEAR
ENDED DECEMBER 31, 2009, 2008 AND 2007
|
||||||||||||
|
(In
Thousands Except Per Share Data)
|
||||||||||||
|
2009
|
2008
|
2007
|
||||||||||
|
REVENUES:
|
||||||||||||
|
Vehicle
rentals
|
$ | 1,472,918 | $ | 1,616,153 | $ | 1,676,349 | ||||||
|
Other
|
73,331 | 81,840 | 84,442 | |||||||||
|
Total
revenues
|
1,546,249 | 1,697,993 | 1,760,791 | |||||||||
|
COSTS
AND EXPENSES:
|
||||||||||||
|
Direct
vehicle and operating
|
768,456 | 888,294 | 887,178 | |||||||||
|
Vehicle depreciation and lease charges, net
|
426,092 | 539,406 | 477,853 | |||||||||
|
Selling,
general and administrative
|
200,389 | 213,734 | 230,515 | |||||||||
|
Interest expense, net of interest income of
|
||||||||||||
|
$6,218,
$13,239 and $24,250
|
96,560 | 110,424 | 109,728 | |||||||||
|
Goodwill and long-lived asset impairment
|
2,592 | 366,822 | 3,719 | |||||||||
|
Total
costs and expenses
|
1,494,089 | 2,118,680 | 1,708,993 | |||||||||
|
(Increase)
decrease in fair value of derivatives
|
(28,848 | ) | 36,114 | 38,990 | ||||||||
|
INCOME
(LOSS) BEFORE INCOME TAXES
|
81,008 | (456,801 | ) | 12,808 | ||||||||
|
INCOME
TAX EXPENSE (BENEFIT)
|
35,986 | (110,083 | ) | 11,593 | ||||||||
|
NET
INCOME (LOSS)
|
$ | 45,022 | $ | (346,718 | ) | $ | 1,215 | |||||
|
BASIC
EARNINGS (LOSS) PER SHARE
|
$ | 1.98 | $ | (16.22 | ) | $ | 0.05 | |||||
|
DILUTED
EARNINGS (LOSS) PER SHARE
|
$ | 1.88 | $ | (16.22 | ) | $ | 0.05 | |||||
|
See
notes to consolidated financial statements.
|
||||||||||||
- 50
-
|
DOLLAR
THRIFTY AUTOMOTIVE GROUP, INC. AND SUBSIDIARIES
|
||||||||
|
CONSOLIDATED
BALANCE SHEETS
|
||||||||
|
DECEMBER
31, 2009 AND 2008
|
||||||||
|
(In
Thousands Except Share and Per Share Data)
|
||||||||
|
2009
|
2008
|
|||||||
|
ASSETS
|
||||||||
|
Cash
and cash equivalents
|
$ | 400,404 | $ | 229,636 | ||||
|
Cash
and cash equivalents-required minimum balance
|
100,000 | - | ||||||
|
Restricted
cash and investments
|
622,540 | 596,588 | ||||||
|
Receivables,
net
|
104,645 | 261,565 | ||||||
|
Prepaid
expenses and other assets
|
63,377 | 69,248 | ||||||
|
Revenue-earning
vehicles, net
|
1,228,637 | 1,946,079 | ||||||
|
Property
and equipment, net
|
96,198 | 104,442 | ||||||
|
Income
taxes receivable
|
4,065 | 845 | ||||||
|
Intangible
assets, net
|
26,071 | 29,778 | ||||||
| Total assets | $ | 2,645,937 | $ | 3,238,181 | ||||
|
LIABILITIES
AND STOCKHOLDERS' EQUITY
|
||||||||
|
LIABILITIES:
|
||||||||
|
Accounts
payable
|
$ | 48,366 | $ | 48,898 | ||||
|
Accrued
liabilities
|
204,340 | 242,369 | ||||||
|
Deferred
income tax liability
|
162,923 | 139,939 | ||||||
|
Vehicle insurance reserves
|
108,584 | 110,310 | ||||||
|
Debt
and other obligations
|
1,727,810 | 2,488,245 | ||||||
|
Total
liabilities
|
2,252,023 | 3,029,761 | ||||||
|
COMMITMENTS
AND CONTINGENCIES
|
||||||||
|
STOCKHOLDERS'
EQUITY:
|
||||||||
|
Preferred
stock, $.01 par value:
|
- | - | ||||||
|
Authorized 10,000,000 shares; none outstanding
|
||||||||
|
Common
stock, $.01 par value:
|
||||||||
|
Authorized
50,000,000 shares;
|
||||||||
|
34,951,351
and 28,039,658 issued, respectively, and
|
||||||||
|
28,536,445
and 21,624,752 outstanding, respectively
|
349 | 280 | ||||||
|
Additional
capital
|
932,693 | 803,304 | ||||||
|
Accumulated
deficit
|
(293,185 | ) | (338,207 | ) | ||||
|
Accumulated other comprehensive loss
|
(18,374 | ) | (29,388 | ) | ||||
|
Treasury stock, at cost (6,414,906 shares)
|
(227,569 | ) | (227,569 | ) | ||||
|
Total
stockholders' equity
|
393,914 | 208,420 | ||||||
| Total liabilities and stockholders' equity | $ | 2,645,937 | $ | 3,238,181 | ||||
|
See
notes to consolidated financial statements.
|
||||||||
- 51
-
|
DOLLAR
THRIFTY AUTOMOTIVE GROUP, INC. AND SUBSIDIARIES
|
||||||||||||||||||||||||||||||||
|
CONSOLIDATED
STATEMENT OF STOCKHOLDERS' EQUITY AND COMPREHENSIVE INCOME
(LOSS)
|
||||||||||||||||||||||||||||||||
|
YEAR
ENDED DECEMBER 31, 2009, 2008 AND 2007
|
||||||||||||||||||||||||||||||||
|
(In
Thousands Except Share and Per Share Data)
|
||||||||||||||||||||||||||||||||
|
Retained
|
Accumulated
|
|||||||||||||||||||||||||||||||
|
Common
Stock
|
Earnings
|
Other
|
Total
|
|||||||||||||||||||||||||||||
|
$.01
Par Value
|
Additional
|
(Accumulated
|
Comprehensive
|
Treasury
Stock
|
Stockholders’
|
|||||||||||||||||||||||||||
|
Shares
|
Amount
|
Capital
|
Deficit)
|
Income
(Loss)
|
Shares
|
Amount
|
Equity
|
|||||||||||||||||||||||||
|
BALANCE,
JANUARY 1, 2007
|
27,594,867 | $ | 275 | $ | 791,452 | $ | 7,782 | $ | 4,217 | (4,110,500 | ) | $ | (156,026 | ) | $ | 647,700 | ||||||||||||||||
|
Issuance
of common shares for director compensation
|
38,148 | - | 573 | - | - | - | - | 573 | ||||||||||||||||||||||||
|
Stock
option transactions
|
61,865 | 1 | 1,093 | - | - | - | - | 1,094 | ||||||||||||||||||||||||
|
Purchase
of common stock for the treasury
|
- | - | - | - | - | (2,304,406 | ) | (71,543 | ) | (71,543 | ) | |||||||||||||||||||||
|
Performance
share incentive plan
|
- | - | 5,317 | - | - | - | - | 5,317 | ||||||||||||||||||||||||
|
Issuance
of common stock in settlement of vested performance
shares
|
201,665 | 2 | - | - | - | - | - | 2 | ||||||||||||||||||||||||
|
Restricted
stock for director compensation
|
- | - | 1,014 | - | - | - | - | 1,014 | ||||||||||||||||||||||||
|
Issuance
of common shares
|
6,713 | - | - | - | - | - | - | - | ||||||||||||||||||||||||
|
Comprehensive
income (loss):
|
||||||||||||||||||||||||||||||||
|
Net
income
|
1,215 | 1,215 | ||||||||||||||||||||||||||||||
|
Cumulative
effect of adopting FIN No. 48
|
- | - | - | (486 | ) | - | - | - | (486 | ) | ||||||||||||||||||||||
|
Interest
rate swap
|
(11,978 | ) | (11,978 | ) | ||||||||||||||||||||||||||||
|
Foreign
currency translation
|
5,957 | 5,957 | ||||||||||||||||||||||||||||||
|
Total
comprehensive income (loss)
|
(5,292 | ) | ||||||||||||||||||||||||||||||
|
BALANCE,
DECEMBER 31, 2007
|
27,903,258 | 278 | 799,449 | 8,511 | (1,804 | ) | (6,414,906 | ) | (227,569 | ) | 578,865 | |||||||||||||||||||||
|
Issuance
of common shares for director
compensation
|
23,250 | - | 280 | - | - | - | - | 280 | ||||||||||||||||||||||||
|
Stock
option transactions
|
2,733 | 1 | 31 | - | - | - | - | 32 | ||||||||||||||||||||||||
|
Performance
share incentive plan
|
- | - | 3,195 | - | - | - | - | 3,195 | ||||||||||||||||||||||||
|
Issuance
of common stock in settlement of vested performance
shares
|
110,417 | 1 | - | - | - | - | - | 1 | ||||||||||||||||||||||||
|
Restricted
stock for director compensation
|
- | - | 349 | - | - | - | - | 349 | ||||||||||||||||||||||||
|
Issuance
of common shares
|
- | - | - | - | - | - | - | - | ||||||||||||||||||||||||
|
Comprehensive
loss:
|
||||||||||||||||||||||||||||||||
|
Net
loss
|
(346,718 | ) | (346,718 | ) | ||||||||||||||||||||||||||||
|
Interest
rate swap
|
(20,973 | ) | (20,973 | ) | ||||||||||||||||||||||||||||
|
Foreign
currency translation
|
(6,611 | ) | (6,611 | ) | ||||||||||||||||||||||||||||
|
Total
comprehensive loss
|
(374,302 | ) | ||||||||||||||||||||||||||||||
|
BALANCE,
DECEMBER 31, 2008
|
28,039,658 | 280 | 803,304 | (338,207 | ) | (29,388 | ) | (6,414,906 | ) | (227,569 | ) | 208,420 | ||||||||||||||||||||
|
Issuance
of common shares for director compensation
|
49,995 | 1 | 531 | - | - | - | - | 532 | ||||||||||||||||||||||||
|
Tax
benefit of stock option transactions
|
- | - | 1,281 | - | - | - | - | 1,281 | ||||||||||||||||||||||||
|
Stock
option transactions
|
136,500 | 1 | 2,289 | - | - | - | - | 2,290 | ||||||||||||||||||||||||
|
Share-based
payment plans
|
- | - | 4,698 | - | - | - | - | 4,698 | ||||||||||||||||||||||||
|
Issuance
of common stock in settlement of vested performance
shares
|
64,190 | 1 | - | - | - | - | - | 1 | ||||||||||||||||||||||||
|
Issuance
of common stock in settlement of vested restricted stock
|
48,508 | - | - | - | - | - | - | - | ||||||||||||||||||||||||
|
Public
stock offering, net of fees
|
6,612,500 | 66 | 120,590 | 120,656 | ||||||||||||||||||||||||||||
|
Comprehensive
Income:
|
||||||||||||||||||||||||||||||||
|
Net
income
|
45,022 | 45,022 | ||||||||||||||||||||||||||||||
|
Interest
rate swap
|
8,662 | 8,662 | ||||||||||||||||||||||||||||||
|
Foreign
currency translation
|
2,352 | 2,352 | ||||||||||||||||||||||||||||||
|
Total
comprehensive income
|
56,036 | |||||||||||||||||||||||||||||||
|
BALANCE,
DECEMBER 31, 2009
|
34,951,351 | $ | 349 | $ | 932,693 | $ | (293,185 | ) | $ | (18,374 | ) | (6,414,906 | ) | $ | (227,569 | ) | $ | 393,914 | ||||||||||||||
|
See
notes to consolidated financial statements.
|
||||||||||||||||||||||||||||||||
- 52
-
|
DOLLAR
THRIFTY AUTOMOTIVE GROUP, INC. AND SUBSIDIARIES
|
||||||||||||
|
CONSOLIDATED
STATEMENTS OF CASH FLOWS
|
||||||||||||
|
YEAR
ENDED DECEMBER 31, 2009, 2008 AND 2007
|
||||||||||||
|
(In
Thousands)
|
||||||||||||
|
2009
|
2008
|
2007
|
||||||||||
|
CASH
FLOWS FROM OPERATING ACTIVITIES:
|
||||||||||||
|
Net
income (loss)
|
$ | 45,022 | $ | (346,718 | ) | $ | 1,215 | |||||
|
Adjustments
to reconcile net income (loss) to net cash provided by
|
||||||||||||
|
operating activities:
|
||||||||||||
|
Depreciation:
|
||||||||||||
|
Vehicle depreciation
|
460,660 | 539,024 | 493,712 | |||||||||
|
Non-vehicle depreciation
|
19,200 | 22,722 | 21,704 | |||||||||
|
Net gains from disposition of revenue-earning vehicles
|
(35,086 | ) | (774 | ) | (18,745 | ) | ||||||
|
Amortization
|
7,994 | 7,355 | 6,386 | |||||||||
|
Goodwill and long-lived asset impairment
|
2,592 | 366,822 | 3,719 | |||||||||
|
Interest income earned on restricted cash and investments
|
(3,202 | ) | (8,922 | ) | (13,975 | ) | ||||||
|
Performance share incentive, stock option and restricted stock
plans
|
4,698 | 3,917 | 7,682 | |||||||||
|
Provision for losses on receivables
|
3,129 | 7,878 | 1,022 | |||||||||
|
Deferred income taxes
|
16,854 | (112,107 | ) | 7,977 | ||||||||
|
(Increase)/decrease in fair value of derivatives
|
(28,848 | ) | 36,114 | 38,990 | ||||||||
|
Change in assets and liabilities, net of acquisitions:
|
||||||||||||
|
Income taxes receivable/payable
|
(3,220 | ) | 10,489 | (8,577 | ) | |||||||
|
Receivables
|
28,574 | 4,942 | 9,531 | |||||||||
|
Prepaid expenses and other assets
|
12,275 | 33,973 | 16,167 | |||||||||
|
Accounts payable
|
(2,522 | ) | (27,931 | ) | 13,194 | |||||||
|
Accrued liabilities
|
6,761 | (24,175 | ) | (34,226 | ) | |||||||
|
Vehicle insurance reserves
|
(1,726 | ) | 276 | 6,113 | ||||||||
|
Other
|
2,769 | (5,730 | ) | 4,430 | ||||||||
|
Net
cash provided by operating activities
|
535,924 | 507,155 | 556,319 | |||||||||
|
CASH
FLOWS FROM INVESTING ACTIVITIES:
|
||||||||||||
|
Revenue-earning
vehicles:
|
||||||||||||
|
Purchases
|
(1,060,251 | ) | (2,249,227 | ) | (4,040,219 | ) | ||||||
|
Proceeds
from sales
|
1,477,368 | 2,536,146 | 3,373,801 | |||||||||
|
Change
in cash and cash equivalents - required minimum balance
|
(100,000 | ) | - | - | ||||||||
|
Net
change in restricted cash and investments
|
(22,750 | ) | (454,721 | ) | 270,824 | |||||||
|
Property,
equipment and software:
|
||||||||||||
|
Purchases
|
(15,508 | ) | (28,895 | ) | (40,647 | ) | ||||||
|
Proceeds from sales
|
104 | 399 | 1,215 | |||||||||
|
Acquisition
of businesses, net of cash acquired
|
(8 | ) | (2,068 | ) | (30,292 | ) | ||||||
|
Net
cash provided by (used in) investing activities
|
278,955 | (198,366 | ) | (465,318 | ) | |||||||
|
(Continued)
|
||||||||||||
- 53
-
|
DOLLAR
THRIFTY AUTOMOTIVE GROUP, INC. AND SUBSIDIARIES
|
||||||||||||
|
CONSOLIDATED
STATEMENTS OF CASH FLOWS
|
||||||||||||
|
YEAR
ENDED DECEMBER 31, 2009, 2008 AND 2007
|
||||||||||||
|
(In
Thousands)
|
||||||||||||
|
2009
|
2008
|
2007
|
||||||||||
|
CASH
FLOWS FROM FINANCING ACTIVITIES:
|
||||||||||||
|
Debt
and other obligations:
|
||||||||||||
|
Proceeds
from vehicle debt and other obligations
|
44,781 | 9,874,526 | 3,650,743 | |||||||||
|
Payments
of vehicle debt and other obligations
|
(785,225 | ) | (9,972,227 | ) | (3,987,224 | ) | ||||||
|
Proceeds
from non-vehicle debt
|
- | - | 250,000 | |||||||||
|
Payments
of non-vehicle debt
|
(20,000 | ) | (70,625 | ) | (1,250 | ) | ||||||
|
Payments
of debt assumed through acquisition
|
- | - | (14,092 | ) | ||||||||
|
Issuance
of common shares
|
129,583 | 33 | 1,669 | |||||||||
|
Common stock offering costs
|
(6,635 | ) | - | - | ||||||||
|
Net
settlement of employee withholding taxes on share-based
awards
|
- | (373 | ) | - | ||||||||
|
Purchase
of common stock for the treasury
|
- | - | (71,543 | ) | ||||||||
|
Financing
issue costs
|
(6,615 | ) | (11,512 | ) | (10,260 | ) | ||||||
|
Net
cash used in financing activities
|
(644,111 | ) | (180,178 | ) | (181,957 | ) | ||||||
|
CHANGE
IN CASH AND CASH EQUIVALENTS
|
170,768 | 128,611 | (90,956 | ) | ||||||||
|
CASH
AND CASH EQUIVALENTS:
|
||||||||||||
|
Beginning
of year
|
229,636 | 101,025 | 191,981 | |||||||||
|
End
of year
|
$ | 400,404 | $ | 229,636 | $ | 101,025 | ||||||
|
See
notes to consolidated financial statements, including Note 17 for
supplemental cash flow information.
|
||||||||||||
|
(Concluded)
|
||||||||||||
- 54
-
DOLLAR
THRIFTY AUTOMOTIVE GROUP, INC. AND SUBSIDIARIES
NOTES
TO CONSOLIDATED FINANCIAL STATEMENTS
YEAR
ENDED DECEMBER 31, 2009, 2008 AND 2007
|
1.
|
BASIS
OF PRESENTATION AND SUMMARY OF SIGNIFICANT ACCOUNTING
POLICIES
|
Dollar
Thrifty Automotive Group, Inc. (“DTG”) is the successor to Pentastar
Transportation Group, Inc. Prior to December 23, 1997, DTG was a wholly
owned subsidiary of Chrysler LLC (such entity or its successor entity, Chrysler
Group LLC, as the context may require, and the relevant entity’s subsidiaries
and members of its affiliated group are hereinafter referred to as “Chrysler”).
On December 23, 1997, DTG completed an initial public offering of all its
outstanding common stock owned by Chrysler together with additional shares
issued by DTG.
The
Company operates under a corporate structure that combines the management of
operations and administrative functions for both the Dollar and Thrifty
brands. Management makes business and operating decisions on an
overall company basis. Financial results are not available by
brand.
DTG’s
significant wholly owned subsidiaries include DTG Operations, Inc., Dollar Rent
A Car, Inc., Thrifty, Inc., Rental Car Finance Corp. (“RCFC”) and Dollar Thrifty
Funding Corp. (“DTFC”). Thrifty, Inc. is the parent company of Thrifty Car
Sales, Inc. and Thrifty Rent-A-Car System, Inc., which is the parent company of
Thrifty Rent-A-Car System, Inc. National Advertising Committee (“Thrifty
National Ad”) and Dollar Thrifty Automotive Group Canada Inc. (“DTG
Canada”). Thrifty National Ad was terminated effective January 1,
2008. DTG Canada has a partnership agreement with an unrelated bank’s
conduit, which included the creation of a limited partnership, TCL Funding
Limited Partnership, which is appropriately consolidated with DTG and
subsidiaries. RCFC and DTFC are special purpose financing entities,
which were formed in 1995 and 1998, respectively, and are appropriately
consolidated with DTG and subsidiaries. RCFC and DTFC are each separate legal
entities whose assets are not available to satisfy any claims of creditors of
DTG or any of its other subsidiaries. The term the “Company” is used to refer to
DTG and subsidiaries, individually or collectively, as the context may require.
Dollar Rent A Car, Inc., the Dollar brand and DTG Operations, Inc. operating
under the Dollar brand are individually and collectively referred to hereinafter
as “Dollar”. Thrifty, Inc., Thrifty Rent-A-Car System, Inc., Thrifty
Car Sales, Inc., the Thrifty brand and DTG Operations, Inc. operating under the
Thrifty brand are individually and collectively referred to hereinafter as
“Thrifty”. Intercompany accounts and transactions have been
eliminated in consolidation.
Nature of
Business – The Company operates in the U.S. and Canada, and through its
Dollar and Thrifty brands, is primarily engaged in the business of the daily
rental of vehicles to business and leisure customers through company-owned
stores. The Company also sells vehicle rental franchises worldwide
and provides sales and marketing, reservations, data processing systems,
insurance and other services to franchisees. RCFC and DTFC provide vehicle
financing to the Company.
Estimates
– The preparation of the Company’s consolidated financial statements in
conformity with accounting principles generally accepted in the United States of
America requires management to make estimates and assumptions that affect the
reported amounts and disclosures in the consolidated financial
statements. Actual results could differ materially from those
estimates.
Cash and Cash
Equivalents – Cash and cash equivalents include cash on hand and on
deposit, including highly liquid investments with initial maturities of three
months or less.
Cash and Cash
Equivalents – Required Minimum Balance – In February 2009, the Company
amended its Senior Secured Credit Facilities (hereinafter
defined). Under the terms of this amendment, the Company is required
to maintain a minimum of $100 million at all times with $60 million in separate
accounts with the Collateral Agent pledged to secure payment of amounts
outstanding under the Term Loan and letters of credit issued under the Revolving
Credit Facility (hereinafter defined) (Note 10). Due to the minimum
cash requirement covenant, the Company has separately
identified the $100 million of cash on the face of the Consolidated Balance
Sheet.
- 55
-
These
funds are primarily held in highly rated money market funds with investments
primarily in government and corporate obligations. Interest earned on
these funds is included in Cash and Cash Equivalents on the face of the
Consolidated Balance Sheet.
Restricted Cash
and Investments – Restricted cash and investments are restricted for the
acquisition of vehicles and other specified uses under the rental car asset
backed note indenture and other agreements (Note 10). A portion
of these funds is restricted due to the like-kind exchange tax program for
deferred tax gains on eligible vehicle remarketing. These funds are
held in highly rated money market funds with investments primarily in government
and corporate obligations, as permitted by the indenture. Restricted cash and
investments are excluded from cash and cash equivalents. Interest earned on
restricted cash and investments was $3.2 million, $8.9 million and $14.0
million, for 2009, 2008 and 2007, respectively, and remains in restricted cash
and investments.
Concentration of
Credit Risk – Financial instruments which potentially subject the Company
to concentrations of credit risk consist principally of cash and cash
equivalents, cash and cash equivalents - required minimum balance, restricted
cash and investments, interest rate swaps, vehicle manufacturer receivables and
trade receivables. The Company limits its exposure on cash and cash equivalents,
cash and cash equivalents - required minimum balance and restricted cash
and investments by investing in Aaa or P-1 rated funds and short-term time
deposits with a diverse group of high quality financial institutions. The
Company’s exposure relating to interest rate swaps is mitigated by diversifying
the financial instruments among various counterparties, which consist of major
financial institutions. Receivables from vehicle manufacturers
consist primarily of amounts due under guaranteed residual, buyback, incentive
and promotion programs. The Company’s financial condition and results
of operations could be adversely affected if one or more of its primary vehicle
manufacturers were unable to meet their obligations to the
Company. Concentrations of credit risk with respect to trade
receivables are limited due to the large number of customers comprising the
Company’s customer base and their dispersion across different geographic
areas. Additionally, the Company limits its exposure to credit risk
through performing credit reviews and monitoring the financial strength of its
significant accounts.
Allowance for
Doubtful Accounts – An allowance for doubtful accounts is generally
established during the period in which receivables are recorded. The allowance
is maintained at a level deemed appropriate based on loss experience and other
factors affecting collectibility.
Financing Issue
Costs – Financing issue costs related to vehicle debt and the Senior
Secured Credit Facilities are deferred and amortized to interest expense over
the term of the related debt using the effective interest method.
Revenue-Earning
Vehicles and Related Vehicle Depreciation Expense – Revenue-earning
vehicles are stated at cost, net of related discounts. In 2009, the
Company continued to increase the level of Non-Program Vehicles in its fleet and
at December 31, 2009, Non-Program Vehicles accounted for approximately 95% of
the total fleet.
For these
Non-Program Vehicles, the Company must estimate what the residual values of
these vehicles will be at the expected time of disposal to determine monthly
depreciation rates. The estimation of residual values requires the Company to
make assumptions regarding the age and mileage of the car at the time of
disposal, as well as the general used vehicle auction market. The Company
evaluates estimated residual values periodically. Differences between
actual residual values and those estimated by the Company result in a gain or
loss on disposal and are recorded as an adjustment to depreciation expense.
Actual timing of disposal shorter than the life used for depreciation purposes
could result in a significant loss on sale. For 2009, the average
holding term for Non-Program Vehicles was approximately 18 to 20 months and for
Program Vehicles was approximately six to seven months.
For
Program Vehicles, the Company is required to depreciate the vehicle according to
the terms of the guaranteed depreciation or repurchase program and in doing so
is guaranteed to receive the full net book value in proceeds upon the sale of
the vehicle. In some cases, the sales proceeds are received directly
from auctions, with any shortfall in value being paid by the vehicle
manufacturer.
- 56
-
With
certain other vehicle manufacturers, the entire balance of proceeds from vehicle
sales comes directly from the manufacturer. In either case,
the Company bears the risk of collectibility on the receivable from the vehicle
manufacturer. The Company monitors its vehicle manufacturer
receivables based on time outstanding, manufacturer strength and length of the
relationship.
Property and
Equipment – Property and equipment are recorded at cost and are
depreciated using principally the straight-line method over the estimated
useful lives of the related assets. Estimated useful lives generally range from
ten to thirty years for buildings and improvements and three to seven years for
furniture and equipment. Leasehold improvements are amortized over the estimated
useful lives of the related assets or leases, whichever is shorter.
Intangible Assets
– Software is recorded at cost and amortized using the straight-line
method primarily over five years. The remaining useful life of all intangible
assets is evaluated annually to assess whether events and circumstances warrant
a revision to the remaining amortization period.
Reacquired
franchise rights, established upon reacquiring a previously franchised location,
are not amortized as they have an indefinite life, rather they are tested
annually for impairment (Note 8).
Website
Development Costs – The Company capitalizes qualifying internal-use
software development, including Website development, incurred subsequent to the
completion of the preliminary project stage. Development costs are
amortized over the shorter of the expected useful life of the software or five
years. Costs related to planning, maintenance, and minor upgrades are
expensed as incurred.
Goodwill –
The excess of acquisition costs over the fair value of net assets acquired is
recorded as goodwill. Goodwill is tested for impairment at least annually
(Note 9).
Long–Lived Assets
– The Company reviews the value of long-lived assets, including software
and other intangible assets, for impairment whenever events or changes in
circumstances indicate that the carrying amount of an asset may not be
recoverable based upon estimated future cash flows.
Accounts
Payable – Book overdrafts of $20.5 million and $7.6 million, which
represent outstanding checks not yet presented to the bank, are included in
accounts payable at December 31, 2009 and 2008,
respectively. These amounts do not represent bank overdrafts, which
would constitute checks presented in excess of cash on hand, and would be
effectively a loan to the Company.
Derivative
Instruments – The Company records all derivatives on the balance sheet as
either assets or liabilities measured at their fair value, and changes in the
derivatives’ fair value are recognized currently in earnings unless specific
hedge accounting criteria are met. In 2005 and 2006, the Company entered into
interest rate swap agreements, which do not qualify for hedge accounting
treatment; therefore, the changes in the interest rate swap agreements’ fair
values have been recognized as an (increase) decrease in fair value of
derivatives in the consolidated statement of operations. In May 2007,
the Company entered into an interest rate swap agreement related to the 2007
Series notes (hereinafter defined) which constitutes a cash flow hedge and
qualifies for hedge accounting treatment; therefore, changes in fair value are
recorded in accumulated other comprehensive loss (Note 11).
Vehicle Insurance
Reserves – Provisions for public liability and property damage and
supplemental liability insurance (“SLI”) on self-insured claims are made by
charges primarily to direct vehicle and operating expense. Accruals for such
charges are based upon actuarially determined evaluations of estimated ultimate
liabilities on reported and unreported claims, prepared on at least an annual
basis. Historical data related to the amount and timing of payments for
self-insured claims is utilized in preparing the actuarial evaluations. The
accrual for public liability and property damage claims is discounted based upon
the actuarially determined estimated timing of payments to be made in the
future. Management reviews the actual timing of payments as compared with the
annual actuarial estimate of timing of payments and has determined that there
have been no material differences in the timing of payments for each of the
three years in the period ended December 31, 2009. Because of
less predictability, self-insured reserves for SLI are not
discounted.
- 57
-
Foreign Currency
Translation – Foreign assets and liabilities are translated using the
exchange rate in effect at the balance sheet date, and results of operations are
translated using an average rate for the period. Translation adjustments are
accumulated and reported as a component of accumulated other comprehensive
loss.
Revenue
Recognition – Revenues from vehicle rentals are recognized as earned on a
daily basis under the related rental contracts with customers. Revenues from
leasing vehicles to franchisees are principally under operating leases with
fixed monthly payments and are recognized as earned over the lease terms.
Revenues from fees and services include providing sales and marketing,
reservations, information systems and other services to franchisees. Revenues
from these services are generally based on a percentage of franchisee rental
revenue or upon providing reservations and are recognized as earned on a monthly
basis. Initial franchise fees, which are recorded to other revenues, are
recognized upon substantial completion of all material services and conditions
of the franchise sale, which coincides with the date of sale and commencement of
operations by the franchisee.
Advertising
Costs – Advertising costs are primarily expensed as incurred. The Company
incurred advertising expense of $21.2 million, $29.5 million and $34.1 million,
for 2009, 2008 and 2007, respectively.
Environmental
Costs – The Company’s operations include the storage of gasoline in
underground storage tanks at certain company-owned stores. Liabilities incurred
in connection with the remediation of accidental fuel discharges are recorded
when it is probable that obligations have been incurred and the amounts can be
reasonably estimated.
Operating
Leases –
Contingent
Rent – The Company recognizes contingent rent expense associated with
certain airport concession agreements monthly as incurred when the
Company’s achievement of the annual targeted qualifying revenue is
probable.
Scheduled Rent
Increases - The Company recognizes scheduled rent increases on a
straight-line basis over the remaining lease term.
Income
Taxes – The Company has provided for income taxes on its separate taxable
income or loss and other tax attributes. Deferred income taxes are provided for
the temporary differences between the financial reporting basis and the tax
basis of the Company’s assets and liabilities. A valuation allowance is recorded
for deferred income tax assets when management determines it is more likely than
not that such assets will not be realized. The Company has
established a valuation allowance related to DTG Canada and a portion of the
Company’s net operating losses for state tax purposes. The Company
evaluates its tax policies quarterly under ASC Topic 740, “Income Taxes” (“ASC
Topic 740”) to identify uncertain tax positions.
Earnings Per
Share – Basic earnings per share (“EPS”) is computed by dividing net
income (loss) by the weighted average number of common shares outstanding during
the period. Diluted EPS is based on the combined weighted average number of
common shares and common share equivalents outstanding which include, where
appropriate, the assumed exercise of options. In computing diluted EPS, the
Company has utilized the treasury stock method.
Stock-Based
Compensation – The Company uses the fair value-based method of accounting
for stock-based compensation. All performance share, restricted stock
and stock option awards are accounted for using the fair value-based method for
the 2009, 2008, and 2007 periods. The Company issued common shares to
its Board of Directors for attendance at Board of Director committee meetings in
2008 and 2007. Payment for attendance at Board of Directors committee
meetings was paid in cash in 2009. The fair value of these common shares is
determined based on the closing market price of the Company’s common shares at
the specific date on which the shares were earned and is recorded as a liability
on the Company’s books until they are issued. In 2009 and 2008, the Company
issued approximately 1,120,000 and 1,258,000 stock options at a weighted
average
grant-date fair value per share of $4.44 and $7.58, respectively. The Company
did not issue stock options in 2007.
- 58
-
Subsequent Events
– In preparing the accompanying consolidated financial statements, the
Company has reviewed events that have occurred after December 31, 2009 through
the issuance of the financial statements. The Company noted no
reportable subsequent events.
New
Accounting Standards –
In
September 2006, the Financial Accounting Standards Board (“FASB”) defined fair
value, issued a framework to account for measuring fair value, and expanded the
related disclosure requirements. The provisions are included in
Accounting Standards Codification (“ASC”) topic 820, “Fair Value Measurements”
and are effective for fiscal years beginning after November 15,
2007. The Company adopted the fair value amendments as required on
January 1, 2008, except for nonfinancial assets and nonfinancial liabilities
that are subject to delayed adoption until fiscal years and interim periods
beginning after November 15, 2008. The Company adopted the provisions
related to nonfinancial assets and nonfinancial liabilities as required on
January 1, 2009. See Note 12 for the required
disclosure.
In
December 2007, the FASB issued new requirements for accounting for business
combinations and noncontrolling interests. The requirements are
included in ASC topics 805, “Business Combinations” and 810, “Consolidation,”
respectively, and are both effective for fiscal years beginning after December
15, 2008. The provisions relating to business combinations require
the acquirer to recognize assets and liabilities and any noncontrolling interest
in the acquiree at the acquisition date at fair value and requires the acquirer
in a step-acquisition to recognize the identifiable assets and liabilities at
the full amounts of their fair value. The noncontrolling interest
provisions establish accounting and reporting standards for the noncontrolling
interest in a subsidiary and the deconsolidation of a subsidiary and changes the
layout of the consolidated income statement and classifies noncontrolling
interests as equity in the consolidated balance sheet. The Company
adopted the provisions as required on January 1, 2009. The provisions
had no impact on the Company’s consolidated financial position or results of
operations upon adoption and will be applied to any future
acquisitions.
In March
2008, the FASB issued new requirements for disclosures related to derivative
instruments and hedging activities, which are included in ASC topic 815,
“Derivatives and Hedging” and are effective for fiscal years beginning after
December 15, 2008. The provision requires expanded disclosures
related to an entity’s derivative instruments and hedging
activities. The Company adopted the provisions as required on January
1, 2009. See Note 11 for the required disclosure.
In May
2009, the FASB issued guidance related to subsequent events, which is included
in ASC topic 855, “Subsequent Events” ("ASC Topic 855”) and are effective for
interim periods ending after June 15, 2009. In February 2010, the
FASB amended ASC Topic 855 for clarification of disclosure requirements for
subsequent events. The provisions require Company management to
evaluate events or transactions occurring subsequent to the balance sheet date
but prior to the issuance of the financial statements for potential recognition
or disclosure in the financial statements and to disclose the results of
management’s findings in the financial statements. In addition, the
provisions identify the circumstances under which an entity shall recognize
events or transactions occurring after the balance sheet date in its financial
statements and the required disclosures of such events. The Company
adopted the provisions as required beginning with the period ended June 30,
2009. See required disclosure above.
In
December 2009, the FASB issued Accounting Standards Update (“ASU”) 2009-17,
“Consolidations (ASC Topic 810): Improvements to Financial Reporting by
Enterprises Involved with Variable Interest Entities” (“ASU 2009-17”), which is
effective for annual periods beginning after November 15, 2009. ASU
2009-17 requires Company management to consider the other entity’s purpose and
design and the reporting entity’s ability to direct the activities of the other
entity that most significantly impact the other entity’s economic performance
when determining whether a variable interest entity should be
consolidated. The Company adopted the provisions of ASU 2009-17 as
required on January 1, 2010 and does not believe it will have a significant
impact on the Company’s consolidated financial statements.
- 59
-
In June
2009, the FASB issued “The FASB Accounting Standards CodificationTM and
the Hierarchy of Generally Accepted Accounting Principles” which is effective
for interim periods ending after September 15, 2009 and is included in ASC topic
105, “Generally Accepted Accounting Principles.” This establishes the
FASB Accounting Standards CodificationTM as
the only source of authoritative accounting principles recognized by the FASB to
be applied by nongovernmental entities in the preparation of financial
statements in conformity with GAAP, with the exception of Statements of
Financial Accounting Standards not yet included in the
Codification. The Company adopted the FASB ASC as required for the
period ended September 30, 2009.
In
January 2010, the FASB issued ASU 2010-06, “Fair Value Measurements and
Disclosures (ASC Topic 820): Improving Disclosures about Fair Value
Measurements” which amends ASC Subtopic 820, “Fair Value Measurements and
Disclosures” (“ASU 2010-06”) to add new requirements for disclosures about
transfers into and out of Levels 1 and 2 and separate disclosures about
purchases, sales, issuances, and settlements relating to Level 3
measurements. ASU 2010-06 also clarifies existing fair value
disclosures about the level of disaggregation and about inputs and valuation
techniques used to measure fair value. The Company adopted the
provisions of ASU 2010-06 as required on January 1, 2010 and will include the
required disclosures in the first quarter 2010 Form 10-Q.
|
2.
|
PUBLIC
STOCK OFFERING
|
On
October 28, 2009, the Company entered into a terms agreement with certain
underwriters to issue and sell 5,750,000 shares of the Company’s common stock,
par value $0.01 per share, at a price to the public of $19.25 per share. The
Company also granted the underwriters an option to purchase up to an additional
862,500 shares of common stock. The sale was made pursuant to the Company’s
registration statement on Form S-3 filed with the Securities and Exchange
Commission. The sale of the initial shares closed on November 3, 2009, and the
sale of the additional shares pursuant to the underwriters’ option to purchase
additional shares closed on November 11, 2009. The 6,612,500 shares
issued resulted in $120.6 million of net proceeds to the Company after deducting
underwriting discounts, commissions and expenses of the offering of $6.6
million. The Company intends to use the net proceeds from the offering for
general corporate purposes.
- 60
-
|
3.
|
EARNINGS
PER SHARE
|
The
computation of weighted average common and common equivalent shares used in the
calculation of basic and diluted EPS is shown below:
|
Year
Ended December 31,
|
||||||||||||
|
2009
|
2008
|
2007
|
||||||||||
|
(In
Thousands, Except Share and Per Share Data)
|
||||||||||||
|
Net
income (loss)
|
$ | 45,022 | $ | (346,718 | ) | $ | 1,215 | |||||
|
Basic
EPS:
|
||||||||||||
|
Weighted
average common shares
|
22,687,077 | 21,375,589 | 22,580,298 | |||||||||
|
Basic
EPS
|
$ | 1.98 | $ | (16.22 | ) | $ | 0.05 | |||||
|
Diluted
EPS:
|
||||||||||||
|
Weighted
average common shares
|
22,687,077 | 21,375,589 | 22,580,298 | |||||||||
|
Shares
contingently issuable:
|
||||||||||||
|
Stock
options
|
762,673 | - | 168,075 | |||||||||
|
Performance
awards
|
255,775 | - | 283,161 | |||||||||
|
Employee
compensation shares deferred
|
105,402 | - | 414,518 | |||||||||
|
Director
compensation shares deferred
|
155,611 | - | 179,560 | |||||||||
|
Shares
applicable to diluted
|
23,966,538 | 21,375,589 | 23,625,612 | |||||||||
|
Diluted
EPS
|
$ | 1.88 | $ | (16.22 | ) | $ | 0.05 | |||||
At
December 31, 2009 and 2008, 356,970 and 1,049,778 outstanding common stock
equivalents that were anti-dilutive were excluded from the computation of
diluted EPS, respectively. At December 31, 2007, all options to purchase shares
of common stock were included in the computation of diluted EPS because no
exercise price was greater than the average market price of the common
shares.
|
4.
|
RECEIVABLES
|
Receivables
consist of the following:
|
December
31,
|
||||||||
|
2009
|
2008
|
|||||||
|
(In
Thousands)
|
||||||||
|
Trade
accounts receivable
|
$ | 76,288 | $ | 105,759 | ||||
|
Other
vehicle manufacturer receivables
|
24,907 | 109,859 | ||||||
|
Car
sales receivable
|
5,677 | 17,717 | ||||||
|
Due
from Chrysler
|
5,287 | 41,313 | ||||||
|
Other
|
16 | 116 | ||||||
| 112,175 | 274,764 | |||||||
|
Less
allowance for doubtful accounts
|
(7,530 | ) | (13,199 | ) | ||||
| $ | 104,645 | $ | 261,565 | |||||
- 61
-
Trade accounts
receivable include primarily amounts due from rental customers,
franchisees and tour operators arising from billings under standard credit terms
for services provided in the normal course of business.
Other vehicle
manufacturer receivables include primarily amounts due under guaranteed
residual, buyback and Non-Program Vehicle incentive programs, which are paid
according to contract terms and are generally received within 60
days. This receivable does not include expected payments on Program
Vehicles remaining in inventory as those residual value guarantee obligations
are not triggered until the vehicles are sold.
Car sales
receivable include primarily amounts due from car sale auctions for the
sale of both Program and Non-Program Vehicles.
Due from
Chrysler is comprised primarily of amounts due under various guaranteed
residual, buyback, incentive and promotion programs, which are paid according to
contract terms and are generally received within 60 days. The Due
from Chrysler balance varies based on fleet activity and timing of incentive and
guaranteed depreciation payments. This receivable does not include
expected payments on Program Vehicles remaining in inventory as those residual
value guarantee obligations are not triggered until the vehicles are
sold. As of December 31, 2009, there were approximately 400 vehicles
at auction awaiting sale.
Allowance for
doubtful accounts represents potentially uncollectible amounts owed to
the Company from franchisees, tour operators, corporate account customers and
others. In 2009, the Company wrote off approximately $5.5 million due
to one of the Company’s largest U.K. tour operator’s bankruptcy.
|
5.
|
REVENUE–EARNING
VEHICLES
|
Revenue-earning
vehicles consist of the following:
|
December
31,
|
||||||||
|
2009
|
2008
|
|||||||
|
(In
Thousands)
|
||||||||
|
Revenue-earning
vehicles
|
$ | 1,608,855 | $ | 2,358,573 | ||||
|
Less
accumulated depreciation
|
(380,218 | ) | (412,494 | ) | ||||
| $ | 1,228,637 | $ | 1,946,079 | |||||
On August
4, 2009, DTG and Chrysler executed a new vehicle supply agreement (the “New
VSA”) covering vehicle purchases beginning with the 2010 model year through
the 2012 model year. Historically, Dollar and Thrifty had
maintained U.S. vehicle supply agreements (the “VSA”) with Chrysler, which
included a 75% minimum purchase requirement. The New VSA replaces and
supersedes the existing VSA, eliminating the 75% minimum purchase requirement
and replacing it with a minimum fixed volume requirement per model year.
Purchases of revenue-earning vehicles from Chrysler were $0.3 billion, $1.7
billion and $3.4 billion during 2009, 2008 and 2007, respectively.
Prior to
2009, vehicle acquisition terms provided for guaranteed residual values in the
U.S. or buybacks in Canada on the majority of vehicles, under specified
conditions. Guaranteed residual and buyback payments provide the Company
sufficient proceeds on disposition of revenue-earning vehicles to realize the
carrying value of these vehicles. Additionally, the Company receives
promotional payments under the VSA, incentives primarily related to the disposal
of revenue-earning vehicles and interest reimbursement for Program Vehicles
while at auction and for certain delivery related interest costs. The
aggregate amount of payments recognized from Chrysler for guaranteed residual
value program payments, promotional payments, interest reimbursement and other
incentives, other than recovery costs, totaled $181.6 million, $670.4 million
and $771.5 million in 2009, 2008 and 2007, respectively, of which a substantial
portion of the payments relate to the Company’s guaranteed residual value
program and outstanding balances at year-end are included in Due
from Chrysler within Receivables, net on the consolidated balance sheet.
- 62
-
Buyback
payments received from the Canadian subsidiary of Chrysler were $38.2 million,
$132.9 million and $133.1 million in 2009, 2008 and 2007, respectively, and
outstanding balances at year-end are included in Due from Chrysler within
Receivables, net on the consolidated balance sheet.
Additionally,
the Company acquires both Program and Non-Program Vehicles from other
manufacturers. The aggregate amount of payments recognized from all
manufacturers other than Chrysler for buyback or repurchase payments, guaranteed
residual value program payments, interest reimbursement and other incentives,
other than recovery costs, totaled $304.6 million, $251.1 million and $188.6
million in 2009, 2008 and 2007, respectively, of which a substantial portion of
the payments relate to the manufacturers’ buyback programs, and are included in
Other Vehicle Manufacturer Receivables within Receivables, net on
the consolidated balance sheet.
Rent
expense for vehicles leased from other vehicle manufacturers and third parties
under operating leases was $0.5 million, $1.2 million and $2.9 million for 2009,
2008 and 2007, respectively, and is included in vehicle depreciation and lease
charges, net.
|
6.
|
VEHICLE
DEPRECIATION AND LEASE CHARGES, NET
|
Vehicle depreciation and lease charges include the following:
|
Year
Ended December 31,
|
||||||||||||
|
2009
|
2008
|
2007
|
||||||||||
| (In Thousands) | ||||||||||||
|
Depreciation
of revenue-earning vehicles
|
$ | 460,660 | $ | 539,024 | $ | 493,712 | ||||||
|
Net
gains from disposal of revenue-earning vehicles
|
(35,086 | ) | (774 | ) | (18,745 | ) | ||||||
|
Rents
paid for vehicles leased
|
518 | 1,156 | 2,886 | |||||||||
| $ | 426,092 | $ | 539,406 | $ | 477,853 | |||||||
|
7.
|
PROPERTY
AND EQUIPMENT
|
Major
classes of property and equipment consist of the following:
|
December
31,
|
||||||||
|
2009
|
2008
|
|||||||
|
(In
Thousands)
|
||||||||
|
Land
|
$ | 12,209 | $ | 12,135 | ||||
|
Buildings
and improvements
|
23,212 | 21,069 | ||||||
|
Furniture
and equipment
|
94,919 | 93,008 | ||||||
|
Leasehold
improvements
|
123,054 | 125,589 | ||||||
|
Construction
in progress
|
9,453 | 7,759 | ||||||
| 262,847 | 259,560 | |||||||
|
Less
accumulated depreciation and amortization
|
(166,649 | ) | (155,118 | ) | ||||
| $ | 96,198 | $ | 104,442 | |||||
During
2009, the Company recorded a $1.6 million non-cash charge (pre-tax) related
primarily to the impairment of assets at its company-owned stores.
During
2008 upon completion of its long-lived assets impairment testing under ASC Topic
360, “Property, Plant and Equipment”, the Company concluded that substantially
all of the long-lived assets in its Canadian operation were
impaired. The Company recorded a $5.9 million non-cash charge
(pre-tax) related to this impairment in 2008.
- 63
-
|
8.
|
INTANGIBLE
ASSETS
|
|
December
31,
|
||||||||
|
2009
|
2008
|
|||||||
|
(In
Thousands)
|
||||||||
|
Amortized
intangible assets
|
||||||||
|
Software
|
$ | 82,227 | $ | 78,663 | ||||
|
Less
accumulated amortization
|
(56,156 | ) | (48,885 | ) | ||||
|
Total
intangible assets
|
$ | 26,071 | $ | 29,778 | ||||
Intangible
assets with finite useful lives are amortized over their respective useful
lives. The aggregate amortization expense recognized for intangible
assets subject to amortization was $8.0 million, $7.4 million and $6.4 million
for the years ended December 31, 2009, 2008 and 2007, respectively. The
estimated aggregate amortization expense for assets existing at December 31,
2009 for each of the next five years is as follows: $7.0 million,
$6.2 million, $5.0 million, $3.1 million and $1.7 million.
During
2009, the Company wrote off $1.0 million (pre-tax) of software no longer in use
or considered impaired ($0.6 million after-tax).
Historically,
when the Company acquired locations from franchisees, it established unamortized
separately identifiable intangible assets, referred to as reacquired franchise
rights. Intangible assets with indefinite useful lives, such as
reacquired franchise rights, are not amortized, but are subject to impairment
testing annually or more frequently if events and circumstances indicate there
may be impairment.
In March
2008, based on the operating environment and in conjunction with reassessment of
goodwill impairment (see discussion in Note 9 below), the Company reassessed its
reacquired franchise rights for impairment. Impairment testing under
ASC Topic 350, “Intangibles – Goodwill and Other” (“ASC Topic 350”) also applies
to reacquired franchise rights. Based on the assessment at March 31,
2008, management concluded that reacquired franchise rights were impaired, and
the Company recorded a $69.0 million non-cash charge (pre-tax) related to the
impairment of the entire reacquired franchise rights ($48.5 million
after-tax). Additionally, in December 2008, the Company wrote off
$10.7 million (pre-tax) of software related to the discontinuation of the Kiosk
project announced during the fourth quarter of 2008 and other software no longer
in use or considered impaired ($6.6 million after-tax).
During
2007, the Company wrote off $3.7 million (pre-tax) of software, of which $3.2
million was made obsolete by the Pros Fleet Management Software and $0.5 million
related to software no longer in use ($2.2 million after-tax).
The $1.0
million, $79.7 million and $3.7 million of impairments in 2009, 2008 and 2007,
respectively, are reflected in the goodwill and long-lived asset impairment line
on the consolidated statements of operations.
|
9.
|
GOODWILL
|
Under ASC
Topic 350, the Company is required on at least an annual basis to perform a
goodwill impairment assessment, which requires, among other things, a
reconciliation of current equity market capitalization to stockholders’
equity. As a result of the decline in the Company’s stock price
during the first quarter of 2008, the Company’s total stockholders’ equity
exceeded its equity market capitalization including applying a reasonable
control premium. The Company was required to place greater emphasis
on the current stock price than on management’s long-range forecast in
performing its impairment assessment. Based on this evaluation,
management concluded that the entire amount of goodwill was impaired and the
Company recorded a $281.2 million non-cash charge (pre-tax) related to the
impairment of goodwill ($223.5 million after-tax) during the first quarter
of 2008, which represents the total accumulated impairment loss. The
Company had no goodwill on its balance sheet at December 31, 2009 or
2008.
- 64
-
|
10.
|
DEBT
AND OTHER OBLIGATIONS
|
Debt and
other obligations consist of the following:
|
December
31,
|
||||||||
|
2009
|
2008
|
|||||||
| (In Thousands) | ||||||||
|
Vehicle
debt and other obligations
|
||||||||
|
Asset
backed medium term notes
|
||||||||
|
2007
Series notes (matures July 2012)
|
$ | 500,000 | $ | 500,000 | ||||
|
2006
Series notes (matures May 2011)
|
600,000 | 600,000 | ||||||
|
2005
Series notes (matures June 2010)
|
400,000 | 400,000 | ||||||
| 1,500,000 | 1,500,000 | |||||||
|
Discounts
on asset backed medium term notes
|
(5 | ) | (14 | ) | ||||
|
Asset
backed medium term notes, net of discount
|
1,499,995 | 1,499,986 | ||||||
|
Conduit
Facility
|
- | 215,000 | ||||||
|
Commercial
paper (including draws on Liquidity Facility)
|
- | 274,901 | ||||||
|
Other
vehicle debt
|
- | 233,698 | ||||||
|
Limited
partner interest in limited partnership (Canadian fleet
financing)
|
69,690 | 86,535 | ||||||
|
Total
vehicle debt and other obligations
|
1,569,685 | 2,310,120 | ||||||
|
Non-vehicle
debt
|
||||||||
|
Term
Loan
|
158,125 | 178,125 | ||||||
|
Total
non-vehicle debt
|
158,125 | 178,125 | ||||||
|
Total
debt and other obligations
|
$ | 1,727,810 | $ | 2,488,245 | ||||
Asset Backed
Medium Term Notes are comprised of rental car asset backed medium term
notes issued by RCFC in May 2007 (the “2007 Series notes”), March 2006 (the
“2006 Series notes”) and April 2005 (the “2005 Series notes”).
The 2007
Series notes are floating rate notes that were converted to a fixed rate of
5.16% by entering into interest rate swap agreements (Note 11) in conjunction
with the issuance of the notes.
The 2006
Series notes are floating rate notes that were converted to a fixed rate of
5.27% by entering into interest rate swap agreements (Note 11) in conjunction
with the issuance of the notes.
The 2005
Series notes are comprised of $110.0 million 4.59% fixed rate notes and $290.0
million of floating rate notes. In conjunction with the issuance of
the 2005 Series notes, the Company also entered into interest rate swap
agreements (Note 11) to convert $190.0 million of the floating rate debt to
fixed rate debt at a 4.58% interest rate. Additionally, in December
2006, the Company entered into an interest rate swap agreement to convert the
remaining $100.0 million of the floating rate debt to fixed rate debt at a 5.09%
interest rate.
The
assets of RCFC, including revenue-earning vehicles related to the asset backed
medium term notes, restricted cash and investments, and certain receivables
related to revenue-earning vehicles are available to satisfy the claims of its
creditors. Dollar and Thrifty lease vehicles from RCFC under the terms of a
master lease and servicing agreement. The asset backed medium term note
indentures also provide for additional credit enhancement through over
collateralization of the vehicle fleet, cash or letters of credit and
maintenance of a liquidity reserve. RCFC is in compliance with the terms of the
indentures.
Each of
the asset backed medium term note programs have financial guarantee insurance
underwritten by a monoline or bond insurer (“Monoline”), and each contains a
minimum net worth condition and an interest coverage condition. The
2005 Series notes, the 2006 Series notes and the 2007 Series notes are insured
by Syncora Guarantee Inc., Ambac Assurance Corporation and Financial Guaranty
Insurance Company, respectively. An event of bankruptcy involving a Monoline
could trigger an early amortization of the Company’s obligations under the
affected medium term notes, which would require a more rapid repayment of those
notes, and could also (subject to certain conditions) result in cross-defaults
under certain of the Company’s other financing
agreements.
- 65
-
During an
early amortization period, amortization is required at the earliest of (i) the
sale of the vehicle financed under the affected medium term note program, (ii)
three years from the original invoice date of that vehicle, or (iii) the
final maturity date of such medium term notes.
In 2009,
the Company executed amendments to its asset backed medium term notes to operate
a fleet comprised of 100% Non-Program Vehicles, while retaining the ability to
purchase Program Vehicles at its discretion to meet seasonal demand and allow
flexibility in its defleeting cycle. The Company further amended all series of
its asset backed medium term notes to provide the Company with the flexibility
to manage its inventory by allowing re-designation of vehicles from the 2005
Series notes to the 2006 Series notes and 2007 Series notes given the scheduled
maturity of the 2005 Series notes. In November 2009, the Company had
fully utilized the $200 million re-designation capacity. In relation
to the amendments to the asset backed medium term notes, the Company amended its
Senior Secured Credit Facilities, whereby the Company may not increase the
available amount of the letters of credit issued as enhancement for the
Company’s 2005 Series notes at any time prior to the occurrence of an event of
bankruptcy or insolvency event with respect to Syncora Guarantee Inc. if, at any
time, the aggregate amount of such letters of credit would exceed $24.4
million.
The
Company believes that conditions in the asset backed medium term note market
have improved during the last half of 2009. The Company intends
to use a combination of cash on its balance sheet and new vehicle financing
to replace its asset backed medium term notes upon their maturity or
in the event of an early amortization.
The
Company further amended all series of its asset backed medium term notes in
order to add Chrysler and General Motors Company as eligible vehicle
manufacturers under the indenture supplements. The related indenture
supplements were also amended to cure any and all conditions that may have been
triggered as a result of the Chrysler bankruptcy and that could have constituted
a “Manufacturer Event of Default” as defined in the indenture
supplements. In conjunction with this amendment, the Company
amended its Senior Secured Credit Facilities under which letters of credit are
issued as enhancement for the asset backed medium term notes. Under
the terms of this amendment, letters of credit to be issued as enhancement for
future fleet financing will be limited to a maximum of 7% of the initial face
amount of each series of asset backed medium term notes issued, up to the
existing sub-limit under the facility of $100 million. This amendment
does not apply to, nor have any impact on, the Company’s existing medium term
notes and enhancement letters of credit. The Company is in compliance with these
conditions at December 31, 2009.
The asset
backed medium term notes mature from 2010 through 2012 and are generally subject
to repurchase by the Company on any payment date subject to a prepayment
penalty.
Conduit
Facility – In February 2009, the Company paid in full the outstanding
balance of its Conduit Facility and terminated the facility in April
2009.
Commercial Paper
and Liquidity Facility – In February 2009, the Company paid in full the
outstanding balance of its Commercial Paper Program, including its related
Liquidity Facility. The Company terminated the program in April
2009.
Other Vehicle
Debt – In 2009, the Company paid in full the outstanding balance under
its vehicle manufacturer line of credit and its remaining bank lines of
credit.
Limited Partner
Interest in Limited Partnership – DTG Canada has a partnership agreement
(the “Partnership Agreement”) with an unrelated bank’s conduit (the “Limited
Partner”). This transaction included the creation of a limited partnership (TCL
Funding Limited Partnership, the “Partnership”). DTG Canada is the General
Partner of the Partnership. The purpose of the Partnership is to facilitate
financing of Canadian vehicles. The Partnership Agreement of the
Partnership expires on May 31, 2010. Due to a 2009 amendment, the
Limited Partner is committed to funding CAD$125.0 million (approximately
US$118.9 million at December 31, 2009), which is funded through issuance and
sale of notes in the Canadian commercial paper market.
- 66
-
This
amendment also established a final
reduction in January 2010 to CAD$100 million, which will remain in effect until
the partnership agreement expires on May 31, 2010. DTG Canada is
working on a new financing facility to replace this facility prior to its
maturity.
DTG
Canada, as General Partner, is allocated the remainder of the Partnership net
income after distribution of the income share of the Limited
Partner. The income share of the Limited Partner, which amounted to
$1.4 million, $5.4 million and $7.8 million for the years ended December 31,
2009, 2008 and 2007, respectively, is included in interest expense. Due to the
nature of the relationship between DTG Canada and the Partnership, the accounts
of the Partnership are appropriately consolidated with the Company. The
Partnership Agreement requires the maintenance of certain letters of credit and
contains various restrictive covenants, including a tangible net worth
covenant. DTG Canada was in compliance with all such covenants and
requirements at December 31, 2009.
Senior Secured
Credit Facilities – On June 15, 2007, the Company entered into the senior
secured credit facilities (as amended, the “Senior Secured Credit Facilities”)
initially comprised of a $350.0 million revolving credit facility (the
“Revolving Credit Facility”) and a $250.0 million term loan (the “Term
Loan”). However, throughout 2008, Company entered into three separate
amendments to the Senior Secured Credit Facilities primarily to modify certain
terms relating to the leverage ratio test. In order to facilitate
such amendments, the Company agreed to reductions in capacity on the Revolving
Credit Facility to $340 million and paid the Term Loan down to $178.1
million. The Senior Secured Credit Facilities contain certain other
covenants, including annual limitations on non-vehicle capital expenditures, and
a prohibition against cash dividends and share repurchases, and are
collateralized by a first priority lien on substantially all material
non-vehicle assets of the Company. The Term Loan bears interest at LIBOR plus
2.5% at December 31, 2009 and LIBOR plus 2.0% at December 31, 2008, which was
2.73% and 2.46% at December 31, 2009 and 2008, respectively. As of
December 31, 2009, the Company is in compliance with all
covenants.
In
February 2009, the Company amended the Senior Secured Credit Facilities
through the term in June 2013, replacing the leverage ratio test with two
new covenants comprised of a minimum adjusted tangible net worth of $150 million
and a minimum unrestricted cash and cash equivalents of $100
million.
In order
to facilitate such amendments, the Company agreed to reductions in capacity on
the Revolving Credit Facility to $231.3 million and paid the Term Loan down to
$158.1 million. Within the $100 million of unrestricted cash and cash
equivalents, the Company must also maintain at least $60 million in separate
accounts with the Collateral Agent to secure payment of amounts outstanding
under the Term Loan and letters of credit issued under the Revolving Credit
Facility. Additionally, the Company agreed to a 50 basis point
increase in the interest rate on its Term Loan and its letter of credit fee,
executed liens in favor of the banks encumbering seven additional
properties not previously encumbered as well as certain vehicles not pledged as
collateral under another vehicle financing facility, and will be required to
make minimum quarterly principal payments of $2.5 million per quarter beginning
in March 2010.
The
Revolving Credit Facility is restricted to use for letters of credit as no
revolving credit borrowings are permitted under the amended
facility. The Revolving Credit Facility also contains sub-limits that
limit the amount of capacity available for letters of credit to be used as
vehicle enhancement in both its Canadian and U.S. operations. As of
December 31, 2009, the Company was required to pay a 0.375% commitment fee on
the unused available line, a 2.50% letter of credit fee on the aggregate amount
of outstanding letters of credit and a 0.125% letter of credit issuance
fee. The Company had letters of credit of approximately $141.6
million and $312.8 million outstanding under the Revolving Credit Facility at
December 31, 2009 and 2008, respectively. Additionally, in connection
with the amendment, the Company expensed approximately $1.0 million of
unamortized deferred financing costs as a result of the extinguishment of debt
in the first quarter of 2009.
Additionally,
during 2009, the Company amended its Senior Secured Credit Facilities, whereby
the Company may not increase the available amount of the letters of credit
issued as enhancement for the Company’s 2005 Series notes at any time
prior to the occurrence of an event of bankruptcy with respect to a Monoline
under the 2005 Series notes if, at the time, the 2005
Series notes letter of credit amount is greater than $24.4 million or if
the requested increase would cause the 2005
Series notes letter of credit amount to exceed that amount, and
whereby letters of credit to be issued as enhancement for future fleet financing
will be limited to a maximum of 7% of the initial face amount of each series of
asset backed medium term notes issued, up to the existing sub-limit under the
facility of $100 million.
- 67
-
This
amendment does not apply to, nor have any impact on, the Company’s existing
medium term notes and enhancement letters of credit.
During
2009, the Company paid $6.6 million in financing issue costs primarily related
to various amendments of its asset backed medium term notes and Senior
Secured Credit Facilities.
Expected
maturities of debt and other obligations outstanding at December 31, 2009 are as
follows:
|
2010
|
2011
|
2012
|
2013
|
2014
|
Thereafter
|
|||||||||||||||||||
| (In Thousands) | ||||||||||||||||||||||||
|
Asset
backed medium term notes
|
$ | 500,000 | $ | 500,000 | $ | 500,000 | $ | - | $ | - | $ | - | ||||||||||||
|
Limited
partner interest (CAD fleet financing)
|
69,690 | - | - | - | - | - | ||||||||||||||||||
|
Term
Loan
|
10,000 | 10,000 | 10,000 | 128,125 | - | - | ||||||||||||||||||
|
Total
|
$ | 579,690 | $ | 510,000 | $ | 510,000 | $ | 128,125 | $ | - | $ | - | ||||||||||||
|
11.
|
DERIVATIVE
FINANCIAL INSTRUMENTS
|
The
Company is exposed to market risks, such as changes in interest
rates. Consequently, the Company manages the financial exposure as
part of its risk management program, by striving to reduce the potentially
adverse effects that the volatility of the financial markets may have on the
Company’s operating results. The Company has used interest rate swap
agreements, for each related new asset backed medium term note issuance in 2005
through 2007, to effectively convert variable interest rates on a total of $1.4
billion in asset backed medium term notes to fixed interest
rates. These swaps have termination dates through July
2012. The fair value of derivatives outstanding for the years ended
December 31, 2009 and 2008 are as follows (in thousands):
|
Fair
Values of Derivative Instruments
|
||||||||||||||||||||
|
Asset
Derivatives
|
Liability
Derivatives
|
|||||||||||||||||||
|
December
31,
|
December
31,
|
December
31,
|
December
31,
|
|||||||||||||||||
|
2009
|
2008
|
2009
|
2008
|
|||||||||||||||||
|
Balance
Sheet Location
|
Fair
Value
|
Balance
Sheet Location
|
Fair
Value
|
Balance
Sheet Location
|
Fair
Value
|
Balance
Sheet Location
|
Fair
Value
|
|||||||||||||
|
Derivatives
designated as hedging instruments
|
||||||||||||||||||||
|
Interest
rate contracts
|
Receivables
|
$ | - |
Receivables
|
$ | - |
Accrued
liabilities
|
$ | 40,639 |
Accrued
liabilities
|
$ | 56,069 | ||||||||
|
Total
derivatives designated as hedging instruments
|
||||||||||||||||||||
| $ | - | $ | - | $ | 40,639 | $ | 56,069 | |||||||||||||
|
Derivatives
not designated as hedging instruments
|
||||||||||||||||||||
|
Interest
rate contracts
|
Receivables
|
$ | 16 |
Receivables
|
$ | 63 |
Accrued
liabilities
|
$ | 34,732 |
Accrued
liabilities
|
$ | 63,564 | ||||||||
|
Total
derivatives not designated as hedging instruments
|
||||||||||||||||||||
| $ | 16 | $ | 63 | $ | 34,732 | $ | 63,564 | |||||||||||||
|
Total
derivatives
|
$ | 16 | $ | 63 | $ | 75,371 | $ | 119,633 | ||||||||||||
- 68
-
The
interest rate swap agreements related to the asset backed medium term note
issuances in 2005 and 2006 do not qualify for hedge accounting
treatment. The (gain) loss recognized in income on derivatives not
designated as hedging instruments for the years ended December 31, 2009 and 2008
are as follows (in thousands):
|
Amount
of (Gain) or Loss Recognized in Income on Derivative
|
Location
of (Gain) or Loss Recognized in Income on Derivative
|
||||||||
|
Years
Ended
|
|||||||||
|
December
31,
|
|||||||||
|
Derivatives
Not Designated as Hedging Instruments
|
2009
|
2008
|
|||||||
|
|
|||||||||
|
Interest
rate contracts
|
$ | (28,848 | ) | $ | 36,114 | Net (increase) decrease in fair value of derivatives | |||
|
Total
|
$ | (28,848 | ) | $ | 36,114 | ||||
The
interest rate swap agreement entered into in May 2007 related to the 2007 asset
backed medium term note issuance (“2007 Swap”) constitutes a cash flow hedge and
satisfies the criteria for hedge accounting. Gains (losses)
recognized on derivatives are initially recorded in other comprehensive income
(loss) (“OCI”) and are reclassified into income (loss) as the hedge impacts
interest expense. The amount of gain (loss) recognized on derivatives
in OCI and the amount of the gain (loss) reclassified from Accumulated OCI
into income (loss) for the years ended December 31, 2009 and 2008 are as follows
(in thousands):
|
Amount
of Gain or (Loss) Recognized in OCI on Derivative (Effective
Portion)
|
Amount
of Gain or (Loss) Reclassified from AOCI into Income (Effective
Portion)
|
Location
of (Gain) or Loss reclassified from AOCI in Income (Effective
Portion)
|
|||||||||||||||
|
Derivatives
in Cash Flow Hedging Relationships
|
2009
|
2008
|
2009
|
2008
|
|||||||||||||
|
Years
Ended
|
|||||||||||||||||
|
December
31,
|
|||||||||||||||||
|
Interest
rate contracts
|
$ | 8,662 | $ | (20,973 | ) | $ | (13,953 | ) | $ | (6,415 | ) | Interest expense, net of interest income | |||||
|
Total
|
$ | 8,662 | $ | (20,973 | ) | $ | (13,953 | ) | $ | (6,415 | ) | ||||||
At
December 31, 2009, the Company’s interest rate contracts related to the 2007
Swap were effectively hedged, and no ineffectiveness was recorded in
income. Based on projected market interest rates, the Company
estimates that approximately $13.2 million of net deferred loss related to the
2007 Swap will be reclassified into earnings within the next 12
months.
|
12.
|
FAIR
VALUE MEASUREMENTS
|
Financial
instruments are presented at fair value in the Company’s balance sheets. Fair
value is defined as the price which would be received to sell an asset or paid
to transfer a liability in an orderly transaction between market participants at
the measurement date. Assets and liabilities recorded at fair value in the
balance sheets are categorized based upon the level of judgment associated with
the inputs used to measure their fair values. These categories include (in
descending order of priority): Level 1, defined as observable inputs such as
quoted prices in active markets; Level 2, defined as inputs other than quoted
prices in active markets that are either directly or
indirectly observable; and Level 3, defined as unobservable inputs in which
little or no market data exists, therefore requiring an entity to develop its
own assumptions.
- 69
-
The
following table shows assets and liabilities measured at fair value as of
December 31, 2009 and December 31, 2008 on the Company’s balance sheet and the
input categories associated with those assets and liabilities:
|
Fair
Value Measurements at Reporting Date Using
|
||||||||||||||||
|
Total
Fair
|
Quoted
Prices in
|
Significant
Other
|
Significant
|
|||||||||||||
|
(in
thousands)
|
Value
Assets
|
Active
Markets for
|
Observable
|
Unobservable
|
||||||||||||
|
(Liabilities)
|
Identical
Assets
|
Inputs
|
Inputs
|
|||||||||||||
|
Description
|
at
12/31/09
|
(Level
1)
|
(Level
2)
|
(Level
3)
|
||||||||||||
|
Derivative
Assets
|
$ | 16 | $ | - | $ | 16 | $ | - | ||||||||
|
Derivative
Liabilities
|
(75,371 | ) | - | (75,371 | ) | - | ||||||||||
|
Marketable
Securities (available for sale)
|
424 | 424 | - | - | ||||||||||||
|
Deferred
Compensation Plan Assets (a)
|
1,546 | - | 1,546 | - | ||||||||||||
|
Total
|
$ | (73,385 | ) | $ | 424 | $ | (73,809 | ) | $ | - | ||||||
|
(a)
|
The Company also has an offsetting liability related to the Deferred Compensation Plan, which is not disclosed in the table as it is not independently measured at fair value. The liability was not reported at fair value as of the transition, but rather set to equal fair value of the assets held in the related rabbi trust. |
|
Fair
Value Measurements at Reporting Date Using
|
||||||||||||||||
|
Total
Fair
|
Quoted
Prices in
|
Significant
Other
|
Significant
|
|||||||||||||
|
(in
thousands)
|
Value
Assets
|
Active
Markets for
|
Observable
|
Unobservable
|
||||||||||||
|
(Liabilities)
|
Identical
Assets
|
Inputs
|
Inputs
|
|||||||||||||
|
Description
|
at
12/31/08
|
(Level
1)
|
(Level
2)
|
(Level
3)
|
||||||||||||
|
Derivative
Assets
|
$ | 63 | $ | - | $ | 63 | $ | - | ||||||||
|
Derivative
Liabilities
|
(119,633 | ) | - | (119,633 | ) | - | ||||||||||
|
Marketable
Securities (available for sale)
|
348 | 348 | - | - | ||||||||||||
|
Deferred
Compensation Plan Assets (a)
|
352 | - | 352 | - | ||||||||||||
|
Total
|
$ | (118,870 | ) | $ | 348 | $ | (119,218 | ) | $ | - | ||||||
|
(a)
|
The
Company also has an offsetting liability related to the Deferred
Compensation Plan, which is not disclosed
in the table as it is not independently measured at fair value. The
liability was not reported at fair
value as of the transition, but rather set to equal fair value of the
assets held in the related rabbi
trust.
|
|
Note:
|
Deferred Compensation Plan Liabilities, which were disclosed in the fair value disclosure table above in the Consolidated Financial Statements for the year ended December 31, 2008 have been excluded from the table and are disclosed in note (a) above. |
- 70
-
The fair
value of derivative assets and liabilities, consisting of interest rate cap and
swaps as discussed above, is calculated using proprietary models utilizing
observable inputs as well as future assumptions related to interest rates and
other applicable variables. These calculations are performed by the
financial institutions which are counterparties to the applicable swap
agreements and reported to the Company on a monthly basis. The
Company uses these reported fair values to adjust the asset or liability as
appropriate. The Company evaluates the reasonableness of the
calculations by comparing similar calculations from other counterparties for the
applicable period.
The
following estimated fair values of financial instruments have been determined by
the Company using available market information and valuation
methodologies.
Cash and Cash
Equivalents, Cash and Cash Equivalents - Required Minimum Balance, Restricted
Cash and Investments, Receivables, Accounts Payable, Accrued Liabilities and
Vehicle Insurance Reserves – The carrying amounts of these items are a
reasonable estimate of their fair value. The Company maintains its cash and cash
equivalents in accounts that may not be federally insured. The
Company has not experienced any losses in such accounts and believes it is not
exposed to significant credit risk.
Debt and Other
Obligations – At December 31, 2009, the fair value of the asset backed
medium term notes with fixed interest rates of $110.4 million was more than the
carrying value of $110.0 million by approximately $0.4
million. Additionally, the fair value of debt with variable interest
rates of $1.5 billion was less than the carrying value of $1.6 billion by
approximately $97.1 million. The fair values of the asset backed
medium term notes were developed using a valuation model that utilizes current
market and industry conditions, assumptions related to the Monolines providing
financial guaranty policies on those notes and the limited market liquidity for
such notes. Additionally, the fair value of the Term Loan was
similarly developed using a valuation model and current market
conditions.
Letters of Credit
and Surety Bonds – The letters of credit and surety bonds of $147.1
million and $40.8 million, respectively, have no fair value as they support the
Company's corporate operations and are not anticipated to be drawn
upon.
Foreign Currency
Translation Risk – A portion of the Company’s debt is denominated in
Canadian dollars, thus, its carrying value is impacted by exchange rate
fluctuations. However, this foreign currency risk is mitigated by the
underlying collateral, which is the Canadian fleet.
|
13.
|
EMPLOYEE
BENEFIT PLANS INCLUDING SHARE-BASED PAYMENT
PLANS
|
Employee
Benefit Plans
The
Company sponsors a retirement savings plan that incorporates the salary
reduction provisions of Section 401(k) of the Internal Revenue Code and covers
substantially all employees of the Company meeting specific age and length of
service requirements. In 2007, the Company matched the employee’s contribution
up to 6% of the employee’s eligible compensation in cash, subject to statutory
limitations. Effective February 22, 2008, the Company suspended its
employer matching contribution through December 31, 2008. However, in 2009, the
Company re-instituted its match of the employee’s contribution up to 2% of the
employee’s eligible compensation in cash, subject to statutory
limitations.
Contributions
expensed by the Company totaled $1.8 million, $1.3 million and $5.4 million in
2009, 2008 and 2007, respectively.
Included
in accrued liabilities at December 31, 2009 and 2008 is $2.8 million and $3.0
million, respectively, for employee health claims which are self-insured by the
Company. The accrual includes amounts for incurred and incurred but not reported
claims. The Company expensed $20.2 million, $20.6 million, and $23.1
million for self-insured health claims incurred in 2009, 2008 and 2007,
respectively.
The
Company has bonus plans for its executive and middle management based on Company
performance. Expense related to these plans was $10.0 million in
2009. For the years ended December
31, 2008 and 2007, the Company fell short of the stated performance objectives;
consequently, no expense related to these plans was recorded.
- 71
-
Deferred
Compensation and Retirement Plans
The
Company has deferred compensation and retirement plans, which are defined
contribution plans that provide key executives with the opportunity to defer
compensation, including related investment income. Under the deferred
compensation plan, the Company contributes up to 7% of participant cash
compensation. The Company also contributes annually to the retirement
plan.
Participants
generally become fully vested in the Company contribution under both the
deferred compensation and retirement plans after five years of service.
Contributions to the deferred compensation and retirement plans are at the
discretion of the Board of Directors based on the Company’s
performance. In 2008, the Company suspended the contributions to the
deferred compensation plan, in conjunction with the suspension of the matching
contributions in the Company’s 401(k) plan in 2008. Likewise, the
Company did not fund the retirement plan in 2008. Expense related to
these plans for contributions made by the Company totaled $2.1 million in
2007. No expense related to these plans was recorded in 2008.
Effective
January 1, 2009, the Company adopted a 2009 Deferred Compensation Plan wherein
key executives will receive contributions equal to 15% of such executives’
current annual base compensation for the year ended December 31, 2009 and
thereafter. Beginning in 2009, all Company contributions will be made into this
plan. Under this Plan, participants are immediately vested in the
Company’s contributions. Expense related to these plans for contributions
made by the Company totaled $0.8 million in 2009.
The balance in the deferred compensation and retirement plans,
which is reflected in accrued liabilities, was $1.5 million and $0.4 million as
of December 31, 2009 and 2008, respectively.
Share-Based
Payment Plans
Long-Term
Incentive Plan
The
Company has a long-term incentive plan (“LTIP”) for employees and non-employee
directors under which the Human Resources and Compensation Committee of the
Board of Directors of the Company (the “Committee”) is authorized to provide for
grants in the form of incentive option rights, non-qualified option rights,
tandem appreciation rights, free-standing appreciation rights, restricted stock,
restricted stock units, performance shares, performance units and other awards
to key employee and non-employee directors that may be payable or related to
common stock or factors that may influence the value of common
stock. The Company’s policy is to issue shares of remaining
authorized common stock to satisfy option exercises and grants under the
LTIP. At December 31, 2009, the Company’s common stock authorized for
issuance under the LTIP was 3,137,271 shares. The Company has 442,711
shares available for future LTIP awards at December 31, 2009 after reserving for
the maximum potential shares that could be awarded under existing LTIP
grants.
The
Company recognized compensation costs of $6.2 million, $3.9 million and $7.7
million during 2009, 2008 and 2007, respectively, related to LTIP
awards. The total income tax benefit recognized in the statements of
operations for share-based compensation payments was $2.7 million, $1.6 million
and $3.1 million for 2009, 2008 and 2007, respectively.
Option Rights Plan – Under the
LTIP, the Committee may grant non-qualified option rights to key employees and
non-employee directors. The exercise prices for non-qualified option
rights are equal to the fair market value of the Company’s common stock at the
date of grant, except for the initial grant, which was made at the initial
public offering price. The non-qualified option rights have a term not exceeding
ten years from the date of grant. The maximum number of shares for which option
rights may be granted under the LTIP to any participant during any calendar year
is 285,000.
The
Company recognized $2.7 million and $1.0 million in compensation costs (included
in the $6.2 million and $3.9 million discussed above) during 2009 and 2008,
respectively, related to the 2009 and 2008 stock option awards. No
expense was recorded during 2007 because all previously issued stock options
were fully vested at January 1, 2007.
- 72
-
The
Black-Scholes option valuation model was
used to estimate the fair value of the options at the date of the
grant. The assumptions used to calculate compensation expense
relating to the stock option awards granted during 2009 and 2008 were as
follows:
|
2009
|
2008
|
||
|
Weighted-average
expected life (in years)
|
5
|
5
|
|
|
Expected
price volatility
|
80.24%
|
53.31%
|
|
|
Risk-free
interest rate
|
2.36%
|
3.19%
|
|
|
Dividend
payments
|
0
|
0
|
The
weighted average grant-date fair value of options issued in 2009 and 2008 was
$4.44 and $7.58, respectively. The options issued in May 2009 vest in
installments over three years with 20% exercisable in each of 2010 and 2011 and
the remaining 60% exercisable in 2012. The options issued in October
2008 vest ratably over three years and the options issued in January 2008 vest
at the end of three years. Expense is recognized over the service
period which is the vesting period. Unrecognized expense remaining
for the options at December 31, 2009 and 2008 was $3.0 million and $2.9 million,
respectively.
The
following table sets forth the non-qualified option rights activity for
non-qualified option rights under the LTIP for the periods
indicated:
|
Weighted
|
||||||||||||||||
|
Weighted
|
Average
|
Aggregate
|
||||||||||||||
|
Number
of
|
Average
|
Remaining
|
Intrinsic
|
|||||||||||||
|
Shares
|
Exercise
|
Contractual
|
Value
|
|||||||||||||
|
(In
Thousands)
|
Price
|
Term
|
(In
Thousands)
|
|||||||||||||
|
Outstanding
at December 31, 2006
|
527 | $ | 17.51 | 3.56 | $ | 14,804 | ||||||||||
|
Granted
|
- | - | ||||||||||||||
|
Exercised
|
(62 | ) | 17.67 | |||||||||||||
|
Canceled
|
- | - | ||||||||||||||
|
Outstanding
at December 31, 2007
|
465 | 17.49 | 2.63 | 2,883 | ||||||||||||
|
Granted
|
1,258 | 7.58 | ||||||||||||||
|
Exercised
|
(3 | ) | 11.10 | |||||||||||||
|
Canceled
|
(118 | ) | 18.44 | |||||||||||||
|
Outstanding
at December 31, 2008
|
1,602 | 9.65 | 7.05 | 122 | ||||||||||||
|
Granted
|
1,120 | 4.44 | ||||||||||||||
|
Exercised
|
(137 | ) | 16.78 | |||||||||||||
|
Canceled
|
(134 | ) | 15.43 | |||||||||||||
|
Outstanding
at December 31, 2009
|
2,451 | $ | 6.55 | 8.11 | $ | 46,702 | ||||||||||
|
Fully
vested options at:
|
||||||||||||||||
|
December
31, 2009
|
483 | $ | 8.41 | 5.70 | $ | 8,311 | ||||||||||
|
Options
expected to vest at:
|
||||||||||||||||
|
December
31, 2009
|
1,968 | $ | 6.10 | 9.01 | $ | 38,391 | ||||||||||
The total
intrinsic value of options exercised during 2009, 2008 and 2007 was
$0.6 million, $28,000, and $1.4 million,
respectively. Total cash received for non-qualified option rights
exercised during 2009, 2008 and 2007 totaled $2.3 million, $30,000 and $1.1
million, respectively. The Company deems a tax benefit to be realized
when the benefit provides incremental benefit by reducing current taxes payable
that it otherwise would have had to pay absent the share-based compensation
deduction (the “with-and-without” approach). Under this approach,
share-based compensation deductions are, effectively, always considered last to
be realized. Due to full utilization of the net operating losses in
2009, the Company realized $1.3 million in tax benefits from the options
exercised.
- 73
-
The
Company did not realize any tax benefits from option exercises during 2008 or
2007.
The
following table summarizes information regarding fixed non-qualified option
rights that were outstanding at December 31, 2009:
|
Weighted-Average
|
Weighted-
|
Weighted-
|
|||||||||||||||||||
|
Range
of
|
Number
|
Remaining
|
Average
|
Number
|
Average
|
||||||||||||||||
|
Exercise
|
Outstanding
|
Contractual
Life
|
Exercise
|
Exercisable
|
Exercise
|
||||||||||||||||
|
Prices
|
(In
Thousands)
|
(In
Years)
|
Price
|
(In
Thousands)
|
Price
|
||||||||||||||||
| $0.77 - $0.97 | 846 | 8.75 | $ | 0.95 | 284 | $ | 0.95 | ||||||||||||||
| $4.44 - $11.45 | 1,122 | 9.25 | 4.54 | 16 | 11.45 | ||||||||||||||||
| $13.98 - $24.38 | 483 | 4.34 | 21.02 | 183 | 19.75 | ||||||||||||||||
| $0.77 - $24.38 | 2,451 | 8.11 | $ | 6.55 | 483 | $ | 8.41 | ||||||||||||||
Performance Shares –
Performance shares are granted to Company officers and certain key employees. No
awards were granted in 2009. The awards granted in 2008 and 2007
established a target number of shares that generally vest at the end of a
three-year requisite service period following the grant-date. The
number of performance shares ultimately earned will range from zero to 200% of
the target award, depending on the level of corporate performance over each of
the three years, which is considered the performance period. Values of the
performance shares earned will be recognized as compensation expense over the
period the shares are earned. The maximum amount for which
performance shares may be granted under the LTIP during any year to any
participant is 160,000 common shares. The Company recognized
compensation costs of $1.9 million, $2.8 million and $6.7 million in 2009, 2008
and 2007, respectively, for performance shares (included in the $6.2 million,
$3.9 million and $7.7 million discussed above).
For the
awards granted in 2008 and 2007, the expense related to performance shares is
based on a market based condition for 50% of the target award and on defined
performance indicators for the other 50% of the target award. The
grant-date fair value for the performance indicator portion of the award was
based on the closing market price of the Company’s common shares at the date of
grant. The market condition based portion of the award was estimated
on the date of grant using a lattice-based option valuation model and the
following assumptions: weighted-average expected life of awards of three years,
volatility factor of 35.30% and risk-free rate of 2.32% for 2008, and
weighted-average expected life of awards of three years, volatility factor of
28.10% and risk-free rate of 4.88% for 2007.
To arrive
at the assumptions used to estimate the fair value of the Company’s market
condition based performance shares, as noted above, the Company relies on
observations of historical trends, actual results and anticipated future
changes. To determine expected volatility, the Company examines
historical volatility trends of the Company and its peers (defined as the
Russell 2000 Index), as determined by an independent third party. In
determining the expected term, the Company observes the actual terms of prior
grants and the actual vesting schedule of the grant. The risk-free
interest rate is the actual U.S. Treasury zero-coupon rate for bonds matching
the expected term of the award on the date of grant. The expected
dividend yield was estimated based on the Company’s current dividend yield, and
adjusted for anticipated future changes.
Performance
shares earned are delivered based upon vesting of the grant, provided the
grantee is then employed by the Company. For instances of retirement,
involuntary termination without cause, disability or death, performance share
awards vest on a pro-rata basis based on the current accounting accrual, but
will not be issued until the end of the performance period or earlier, if needed
to comply with the Internal Revenue Code Section 409A. Any
performance share installments not earned at the end of the requisite service
period are forfeited. In March 2009, the 2006 grant of performance
shares earned from January 1, 2006 through December 31, 2008 and the 2007 and
2008 grants of performance shares for terminated employees, net of
forfeitures, totaling 64,000 shares vested, were settled through the issuance of
common
stock totaling approximately $2.5 million.
- 74
-
No shares
were used for net settlement to offset taxes. In January 2008, the
2005 grant of performance shares earned from January 1, 2005 through December
31, 2007, net of forfeitures, totaling 138,000 shares vested, were settled
through the issuance of approximately 110,000 shares of common stock totaling
approximately $4.0 million, and approximately 28,000 shares were used for net
settlement to offset taxes totaling approximately $1.0 million. In
January 2007, the 2004 grant of performance shares earned from January 1, 2004
through December 31, 2006, net of forfeitures, totaling approximately 230,000
shares vested, were settled through the issuance of approximately 202,000 shares
of common stock totaling approximately $5.8 million, and approximately 28,000
shares were used for net settlement to offset taxes totaling approximately $0.9
million. Historically, substantially all of these shares were
directed to the deferred compensation plan by the Company at the request and for
the benefit of the employees. In 2009 and 2008, substantially all of
these shares were issued to the employees.
The
following table presents the status of the Company’s nonvested performance
shares for the periods indicated:
|
Weighted-Average
|
||||||||
|
Shares
|
Grant-Date
|
|||||||
|
Nonvested Shares
|
(In Thousands)
|
Fair Value
|
||||||
|
Nonvested
at January 1, 2007
|
702 | $ | 35.67 | |||||
|
Granted
|
152 | 55.94 | ||||||
|
Vested
|
(230 | ) | 28.89 | |||||
|
Forfeited
|
(102 | ) | 35.34 | |||||
|
Nonvested
at December 31, 2007
|
522 | 44.69 | ||||||
|
Granted
|
162 | 25.21 | ||||||
|
Vested
|
(138 | ) | 37.47 | |||||
|
Forfeited
|
(205 | ) | 38.00 | |||||
|
Nonvested
at December 31, 2008
|
341 | 41.93 | ||||||
|
Granted
|
- | - | ||||||
|
Vested
|
(64 | ) | 46.36 | |||||
|
Forfeited
|
(89 | ) | 46.05 | |||||
|
Nonvested
at December 31, 2009
|
188 | $ | 39.75 | |||||
At
December 31, 2009, the total compensation cost related to nonvested performance
share awards not yet recognized is estimated at approximately $0.3 million,
depending upon the Company’s performance against targets specified in the
performance share agreement. This estimated compensation cost is
expected to be recognized over the weighted-average period of 1.0
years. Values of the performance shares earned will be recognized as
compensation expense over the requisite service period. The total
intrinsic value of vested and issued performance shares during 2009, 2008 and
2007 was $0.1 million, $1.5 million and $9.5 million,
respectively. As of December 31, 2009, the intrinsic value of the
nonvested performance shares was $4.8 million.
Restricted Stock Units – Under
the LTIP, the Committee may grant restricted stock units to key employees and
non-employee directors. The grant-date fair value of the award is
based on the closing market price of the Company’s common shares at the date of
the grant. The Company recognizes compensation expense on a
straight-line basis over the vesting period.
In
January 2009, non-employee directors were granted 95,812 shares with a
grant-date fair value of $1.23 and 56,910 shares that have the right to receive
cash payments at the settlement date price, which vested on December 31,
2009. In 2008, non-employee directors were granted 7,000 shares with
a grant-date fair value of $11.58 and the right to receive cash payments
representing 15,295 shares at
the settlement date price, which vested on December 31,
2008.
- 75
-
In 2007,
non-employee directors were granted 21,610 restricted stock units with a
grant-date fair value of $46.90, which vested on December 31,
2007. The Company recognized compensation costs of $1.6 million, $0.1
million and $1.0 million in 2009, 2008 and 2007, respectively, for restricted
stock units. In 2009, compensation costs included $1.5 million
related to liability-based restricted stock units, based on director
elections. The Committee generally grants restricted stock units to
non-employee directors. These grants generally vest at the end of the
fiscal year in which the grants were made.
In May
2008, an employee director was granted 13,550 shares that vest in equal
installments over four years with a grant-date fair value of $13.98 per share
and 50,000 shares in October 2008 that vest in equal installments over three
years with a grant-date fair value of $0.97 per share. The employee
director was also granted 50,000 shares in May 2009 with a grant-date fair value
of $4.44 per share that vest in installments over three years with 20% vesting
in each of 2010 and 2011 and the remaining 60% vesting in 2012. In
2009, an employee director was issued 20,053 restricted stock units that vested
during the year. At December 31, 2009, the total compensation cost
related to nonvested restricted stock unit awards not yet recognized is
approximately $0.1 million, which will be recognized over the vesting period of
the restricted stock.
The
following table presents the status of the Company’s nonvested restricted stock
units for the periods indicated:
|
Weighted-Average
|
||||||||
|
Shares
|
Grant-Date
|
|||||||
|
Nonvested Shares
|
(In Thousands)
|
Fair Value
|
||||||
|
Nonvested
at January 1, 2007
|
- | $ | - | |||||
|
Granted
|
22 | 46.90 | ||||||
|
Vested
|
(22 | ) | 46.90 | |||||
|
Forfeited
|
- | - | ||||||
|
Nonvested
at December 31, 2007
|
- | - | ||||||
|
Granted
|
71 | 4.52 | ||||||
|
Vested
|
(7 | ) | 11.58 | |||||
|
Forfeited
|
- | - | ||||||
|
Nonvested
at December 31, 2008
|
64 | 3.74 | ||||||
|
Granted
|
146 | 2.33 | ||||||
|
Vested
|
(116 | ) | 1.57 | |||||
|
Forfeited
|
- | - | ||||||
|
Nonvested
at December 31, 2009
|
94 | $ | 4.24 | |||||
- 76
-
|
14.
|
INCOME
TAXES
|
Income
tax expense consists of the following:
| Year Ended December 31, | ||||||||||||
|
2009
|
2008
|
2007
|
||||||||||
|
(In
Thousands)
|
||||||||||||
|
Current:
|
||||||||||||
|
Federal
|
$ | 4,867 | $ | 201 | $ | 2,979 | ||||||
|
State
and local
|
13,417 | 989 | 124 | |||||||||
|
Foreign
|
848 | 834 | 513 | |||||||||
| 19,132 | 2,024 | 3,616 | ||||||||||
|
Deferred:
|
||||||||||||
|
Federal
|
19,365 | (93,259 | ) | 3,287 | ||||||||
|
State
and local
|
(2,511 | ) | (18,848 | ) | 4,690 | |||||||
| 16,854 | (112,107 | ) | 7,977 | |||||||||
| $ | 35,986 | $ | (110,083 | ) | $ | 11,593 | ||||||
Deferred
tax assets and liabilities consist of the following:
|
December
31,
|
||||||||
|
2009
|
2008
|
|||||||
|
(In
Thousands)
|
||||||||
|
Deferred
tax assets:
|
||||||||
|
Intangible
asset amortization
|
$ | 43,255 | $ | 56,827 | ||||
|
Vehicle
insurance reserves
|
38,741 | 39,689 | ||||||
|
Other
accrued liabilities
|
32,790 | 30,752 | ||||||
|
Interest
rate swap
|
30,707 | 49,277 | ||||||
|
AMT
credit carryforward
|
17,670 | 16,966 | ||||||
|
Canadian
NOL carryforwards
|
16,609 | 10,672 | ||||||
|
Other
Canadian temporary differences
|
7,419 | 8,716 | ||||||
|
Federal
and state NOL carryforwards
|
5,759 | 104,986 | ||||||
|
Allowance
for doubtful accounts and notes receivable
|
2,768 | 1,886 | ||||||
|
Canadian
depreciation
|
795 | 2,039 | ||||||
| 196,513 | 321,810 | |||||||
|
Valuation
allowance
|
(24,918 | ) | (22,162 | ) | ||||
|
Total
|
$ | 171,595 | $ | 299,648 | ||||
|
Deferred
tax liabilities:
|
||||||||
|
Depreciation
|
$ | 332,991 | $ | 439,066 | ||||
|
Other
|
1,527 | 521 | ||||||
|
Total
|
$ | 334,518 | $ | 439,587 | ||||
For the
year ended December 31, 2009, the change in the net deferred tax liabilities
constituted $16.9 million of deferred tax expense, $7.3 million of other
comprehensive income that relates to the interest
rate swap and foreign currency translation, and ($1.3 million) of tax benefit of
equity compensation recognized as an increase to paid-in capital.
- 77
-
During
2009, the Company utilized all of the remaining federal net operating loss
(“NOL”) and has no remaining federal NOL carryforwards at December 31,
2009. The Company has net operating loss carryforwards available in
certain states to offset future state taxable income. A valuation allowance of
approximately $0.1 million and $0.7 million existed at December 31, 2009 and
2008, respectively, for state net operating losses. At
December 31, 2009, DTG Canada has net operating loss carryforwards of
approximately $61.3 million available to offset future taxable income in Canada,
which expire beginning in 2010 through 2029. Valuation allowances have been
established for the total estimated future tax effect of the Canadian net
operating losses and other deferred tax assets.
The
Company’s effective tax rate differs from the maximum U.S. statutory income tax
rate. The following summary reconciles taxes at the maximum U.S. statutory rate
with recorded taxes:
|
Year
Ended December 31,
|
||||||||||||||||||||||||
|
2009
|
2008
|
2007
|
||||||||||||||||||||||
|
Amount
|
Percent
|
Amount
|
Percent
|
Amount
|
Percent
|
|||||||||||||||||||
| (Amounts in Thousands) | ||||||||||||||||||||||||
|
Tax
expense computed at the
|
||||||||||||||||||||||||
|
maximum
U.S. statutory rate
|
$ | 28,353 | 35.0 | % | $ | (159,880 | ) | 35.0 | % | $ | 4,483 | 35.0 | % | |||||||||||
|
Difference
resulting from:
|
||||||||||||||||||||||||
|
State
and local taxes, net of
|
||||||||||||||||||||||||
|
federal
income tax benefit
|
7,007 | 8.6 | % | (12,117 | ) | 2.7 | % | 3,130 | 24.4 | % | ||||||||||||||
|
Foreign
losses
|
1,111 | 1.4 | % | 7,701 | (1.7 | %) | 3,617 | 28.2 | % | |||||||||||||||
|
Foreign
taxes
|
633 | 0.8 | % | 588 | (0.1 | %) | 275 | 2.2 | % | |||||||||||||||
|
Nondeductible
impairment
|
- | 0.0 | % | 50,045 | (11.0 | %) | - | 0.0 | % | |||||||||||||||
|
Other
|
(1,118 | ) | (1.4 | %) | 3,580 | (0.8 | %) | 88 | 0.7 | % | ||||||||||||||
|
Total
|
$ | 35,986 | 44.4 | % | $ | (110,083 | ) | 24.1 | % | $ | 11,593 | 90.5 | % | |||||||||||
The
Company had no material liability for unrecognized tax benefits and no material
adjustments to the Company’s opening financial position were required under ASC
Topic 740, upon adoption or at December 31, 2009. There are no
material tax positions for which it is reasonably possible that unrecognized tax
benefits will significantly change in the twelve months subsequent to December
31, 2009.
The
Company files income tax returns in the U.S. federal and various state, local
and foreign jurisdictions. In the Company’s significant tax
jurisdictions, the tax years 2006 and later are subject to examination by
federal taxing authorities and the tax years 2005 and later are subject to
examination by state and foreign taxing authorities.
The
Company accrues interest and penalties on underpayment of income taxes related
to unrecognized tax benefits as a component of income tax expense in the
consolidated statement of operations. No amounts were recognized for
interest and penalties under ASC Topic 740 during the years ended December 31,
2009, 2008 and 2007.
Restatement
Relating to 2008 Income Tax Benefit and Deferred Tax Liability
In late
2009, the Company’s management determined that the income tax benefit for 2008
was overstated by $6.3 million resulting from an error in calculating the tax
benefit of the write-off of reacquired franchise rights. During the
first quarter of 2008, the Company wrote off approximately $69 million of
reacquired franchise rights, all of which resulted from asset acquisitions
except for $17 million from a stock acquisition. Reacquired franchise rights
acquired in a stock acquisition are considered a permanent difference that does
not create a tax benefit. Income tax benefit of approximately
$110.1 million was decreased from the originally reported amount of $116.4
million and net loss of approximately $346.7 million was increased from the
originally reporting amount of approximately $340.4
million.
- 78
-
Basic and
diluted loss per share of $16.22, increased from the originally reported amount
of $15.93 per share. The deferred tax liability of approximately
$139.9 million increased from approximately $133.6 million as originally
reported and accumulated deficit of approximately $338.2 million increased from
approximately $331.9 million as originally reported. This error is a book basis
difference only and therefore had no cash impact in 2008 and will not impact
cash taxes in future periods.
|
15.
|
COMMITMENTS
AND CONTINGENCIES
|
Concessions
and Operating Leases
The
Company has certain concession agreements principally with airports throughout
the U.S. and Canada. Typically, these agreements provide airport terminal
counter space in return for a minimum rent. In many cases, the Company’s
subsidiaries are also obligated to pay insurance and maintenance costs and
additional rents generally based on revenues earned at the location. Certain of
the airport locations are operated by franchisees who are obligated to make the
required rent and concession fee payments under the terms of their franchise
arrangements with the Company’s subsidiaries.
The
Company’s subsidiaries operate from various leased premises under operating
leases with terms up to 25 years. Some of the leases contain renewal
options.
Expenses
incurred under operating leases and concessions were as follows:
| Year Ended December 31, | ||||||||||||
|
2009
|
2008
|
2007
|
||||||||||
| (In Thousands) | ||||||||||||
|
Rent
|
$ | 49,543 | $ | 51,535 | $ | 49,270 | ||||||
|
Concession
expenses:
|
||||||||||||
|
Minimum
fees
|
101,938 | 94,678 | 87,416 | |||||||||
|
Contingent
fees
|
32,263 | 40,866 | 49,493 | |||||||||
| 183,744 | 187,079 | 186,179 | ||||||||||
|
Less
sublease rental income
|
(785 | ) | (1,078 | ) | (1,011 | ) | ||||||
|
Total
|
$ | 182,959 | $ | 186,001 | $ | 185,168 | ||||||
Future
minimum rentals and fees under noncancelable operating leases and the Company’s
obligations for minimum airport concession fees at December 31, 2009 are
presented in the following table:
|
Company-Owned
|
||||||||||||
|
Stores
|
Operating
|
|||||||||||
|
Concession
Fees
|
Leases
|
Total
|
||||||||||
| (In Thousands) | ||||||||||||
|
2010
|
$ | 76,363 | $ | 41,477 | $ | 117,840 | ||||||
|
2011
|
65,104 | 33,960 | 99,064 | |||||||||
|
2012
|
57,616 | 26,929 | 84,545 | |||||||||
|
2013
|
49,422 | 20,886 | 70,308 | |||||||||
|
2014
|
31,015 | 13,884 | 44,899 | |||||||||
|
Thereafter
|
104,216 | 56,722 | 160,938 | |||||||||
| 383,736 | 193,858 | 577,594 | ||||||||||
|
Less
sublease rental income
|
- | (623 | ) | (623 | ) | |||||||
| $ | 383,736 | $ | 193,235 | $ | 576,971 | |||||||
- 79
-
Vehicle
Insurance Reserves
The
Company is self insured for a portion of vehicle insurance claims. In
2007, the Company retained the risk of loss up to $4.0 million per occurrence
for public liability and property damage claims, including third-party bodily
injury and property damage, plus a self-insured corridor of $1.0 million per
occurrence for losses in excess of $4.0 million with an aggregate limit of $7.0
million for losses within this corridor. In February 2008, the
Company increased its retained risk of loss up to $5.0 million per occurrence
and in February 2009, the Company further increased its retained risk of loss up
to $7.5 million per occurrence for public liability and property damage claims,
including third-party bodily injury and property damage. The Company
maintains insurance for losses above these levels. The Company
continues to retain the risk of loss on SLI policies sold to vehicle rental
customers.
The
Company records reserves for its vehicle liability exposure using
actuarially-based loss estimates, which are updated semi-annually in June and
December of each year. As a result of favorable overall claims loss
development determined in 2009, the Company recorded insurance reserve
adjustments of $9.4 million during 2009.
The
accrual for Vehicle Insurance Reserves includes amounts for incurred and
incurred but not reported losses. Such liabilities are necessarily based on
actuarially determined estimates and management believes that the amounts
accrued are adequate. At December 31, 2009 and 2008, the public liability
and property damage amounts have been discounted at 1.7% and 1.0% (assumed risk
free rate), respectively, based upon the actuarially determined estimated timing
of payments to be made in future years. Discounting resulted in reducing the
accrual for public liability and property damage by $2.0 million and $1.2
million at December 31, 2009 and 2008, respectively. SLI amounts are not
discounted. Estimated future payments of Vehicle Insurance Reserves
as of December 31, 2009 are as follows (in thousands):
|
2010
|
$ | 25,067 | ||
|
2011
|
16,713 | |||
|
2012
|
11,444 | |||
|
2013
|
7,031 | |||
|
2014
|
4,043 | |||
|
Thereafter
|
4,305 | |||
|
Aggregate
undiscounted public liability and property damage
|
68,603 | |||
|
Effect
of discounting
|
(2,039 | ) | ||
|
Public
liability and property damage, net of discount
|
66,564 | |||
|
Supplemental
liability insurance
|
42,020 | |||
|
Total
vehicle insurance reserves
|
$ | 108,584 |
Contingencies
The
Company is a defendant in several class action lawsuits in California and one in
Colorado. The lawsuits allege that the pass through of the California
trade and tourism commission and airport concession fees violate antitrust laws
and various other rights and laws by compelling out-of-state visitors to
subsidize the passenger car rental tourism assessment program, violation of the
California Business and Professions Code, breach of contract, and violation of
the Colorado Consumer Protection Act. The Company intends to
vigorously defend these matters. Given the inherent uncertainties of
litigation, the Company cannot predict the ultimate outcome or reasonably
estimate the amount of ultimate loss that may arise from these
lawsuits.
Various
other claims and legal proceedings have been asserted or instituted against the
Company, including some purporting to be class actions, and some which demand
large monetary damages or other relief which could result in significant
expenditures. Litigation is subject to many uncertainties and the outcome of
individual matters is not predictable with assurance. The Company is also
subject to potential liability related to environmental matters. The Company
establishes reserves for litigation and environmental matters when the loss is
probable and reasonably estimable. It is reasonably possible that the final
resolution of some of these matters may require the Company to make
expenditures, in excess of established reserves, over an extended period of time
and in a range of amounts that cannot be reasonably estimated. The term
“reasonably possible” is used herein to mean that the chance of a future
transaction or event occurring is more than remote but less than likely.
Although the final resolution of any such matters could have a material effect
on the Company’s consolidated operating results for the particular reporting
period in which an adjustment of the estimated liability is recorded, the
Company believes that any resulting liability should not materially affect its
consolidated financial position.
- 80
-
Other
The
Company is party to a data processing services agreement which requires annual
payments totaling approximately $21.5 million for 2010 and $20.9 million for
2011. The Company also has a telecommunications contract which will
require annual payments totaling $2.0 million for 2010 and 2011, and $1.1
million for 2012. Additionally, the Company has software and hardware
maintenance agreements which require annual payments totaling approximately $1.0
million for 2010.
In
addition to the letters of credit described in Note 10, the Company had letters
of credit totaling $5.5 million and $8.5 million at December 31, 2009 and 2008,
respectively, which are primarily used to support its insurance programs and
airport concession obligations in Canada. The Company may also
provide guarantees on behalf of franchisees to support compliance with airport
concession bids. Non-performance of the obligation by the franchisee
would trigger the obligation of the Company. At December 31, 2009,
there were no such guarantees on behalf of franchisees.
At
December 31, 2009, the Company had outstanding vehicle purchase commitments
of approximately $1.4 billion.
|
16.
|
BUSINESS
SEGMENTS
|
The
Company’s corporate operating structure is based on a functional structure and
combines the management of operations and administrative functions for both the
Dollar and Thrifty brands. Consistent with this structure, management makes
business and operating decisions on an overall company basis.
Included
in the consolidated financial statements are the following amounts relating to
geographic locations:
| Year Ended December 31, | ||||||
|
2009
|
2008
|
2007
|
||||
| (In Thousands) | ||||||
|
Revenues:
|
||||||
|
United
States
|
$ 1,466,508
|
$ 1,594,283
|
$ 1,646,420
|
|||
|
Foreign
countries
|
79,741
|
103,710
|
114,371
|
|||
|
$ 1,546,249
|
$ 1,697,993
|
$ 1,760,791
|
||||
|
Long-lived
assets:
|
||||||
|
United
States
|
$ 94,606
|
$ 103,260
|
$ 115,654
|
|||
|
Foreign
countries
|
1,592
|
1,182
|
6,649
|
|||
|
$ 96,198
|
$ 104,442
|
$ 122,303
|
||||
Revenues
are attributed to geographic regions based on the location of the transaction.
Long-lived assets represent property and equipment.
- 81
-
|
17.
|
SUPPLEMENTAL
CASH FLOW DISCLOSURES
|
|
Year
Ended December 31,
|
||||||||||||
|
2009
|
2008
|
2007
|
||||||||||
| (In Thousands) | ||||||||||||
|
SUPPLEMENTAL
DISCLOSURES OF CASH FLOW INFORMATION:
|
||||||||||||
|
Cash
paid for/(refund of):
|
||||||||||||
|
Income
taxes to (from) taxing authorities
|
$ | 22,350 | $ | (8,486 | ) | $ | 12,396 | |||||
|
Interest
|
$ | 96,569 | $ | 114,753 | $ | 128,779 | ||||||
|
SUPPLEMENTAL
DISCLOSURES OF INVESTING AND FINANCING
|
||||||||||||
|
NONCASH
ACTIVITIES:
|
||||||||||||
|
Sales
and incentives related to revenue-earning vehicles
|
||||||||||||
|
included
in receivables
|
$ | 33,704 | $ | 158,952 | $ | 121,846 | ||||||
|
Purchases
of property, equipment and software included
|
||||||||||||
|
in
accounts payable
|
$ | 2,914 | $ | 924 | $ | 4,632 | ||||||
Restatement
of Cash Flow Statement Presentation Related to Purchases and Sales of
Revenue-Earning Vehicles
The
Company has restated its consolidated statement of cash flows for the years
ended December 31, 2008 and 2007 to exclude the impact of sales of
revenue-earning vehicles for which proceeds had not yet been received, as well
as changes in certain vehicle-related incentives due from manufacturers, both of
which were included in Receivables at the end of each period. The
Company has historically included changes in accounts receivable that arose from
the sales of its revenue-earning vehicles and for incentives due from
manufacturers’ vehicle purchases in its cash flows from operating
activities. These amounts were directly offset by corresponding
amounts reported in proceeds from sales of revenue-earning vehicles and
purchases of revenue-earning vehicles in the investing section of the statement
of cash flows.
Upon
further review, management has concluded that the appropriate presentation of
sales of revenue-earning vehicles and incentives related to vehicle purchases
for which cash has not been received is to exclude them from both the operating
and investing sections of the cash flow statement, with supplemental disclosure
of such amounts reported in the footnotes. The impact of the
restatement on amounts reported in the operating and investing sections of the
cash flow statements are equal in amount and fully offset. There is
no impact on the Company’s previously reported results of operations or
financial position and this restatement does not affect the Company’s previously
reported disclosures relating to liquidity or its compliance with debt
covenants. As such, management has concluded that this restatement is
not material to its previously issued financial statements. A summary
of the cash flow amounts affected by the restatement are as
follows:
- 82
-
|
Year
Ended December 31, 2008
|
||||||||
|
As
Previously
|
As
|
|||||||
|
Reported
|
Adjustment
|
Restated
|
||||||
| (In Thousands) | ||||||||
|
Net
cash provided by operating activities
|
$ |
470,049
|
$ |
37,106
|
$ |
507,155
|
||
|
Net
cash used in investing activities
|
(161,260)
|
(37,106)
|
(198,366)
|
|||||
|
CHANGE
IN CASH AND CASH EQUIVALENTS
|
128,611
|
-
|
128,611
|
|||||
|
Year
Ended December 31, 2007
|
||||||||
|
As
Previously
|
As
|
|||||||
|
Reported
|
Adjustment
|
Restated
|
||||||
| (In Thousands) | ||||||||
|
Net
cash provided by operating activities
|
$ |
537,310
|
$ |
19,009
|
$ |
556,319
|
||
|
Net
cash used in investing activities
|
(446,309)
|
(19,009)
|
(465,318)
|
|||||
|
CHANGE
IN CASH AND CASH EQUIVALENTS
|
(90,956)
|
-
|
(90,956)
|
|||||
See Note
18 for the effect of this error on the three, six and nine month periods ended
March 31, 2009, June 30, 2009 and September 30, 2009,
respectively.
- 83
-
|
18.
|
SELECTED
QUARTERLY FINANCIAL DATA
(UNAUDITED)
|
A summary
of the quarterly operating results during 2009 and 2008 follows:
|
Year
Ended
|
First
|
Second
|
Third
|
Fourth
|
2009
|
|||||||||||||||||
|
December
31, 2009
|
Quarter
|
Quarter
|
Quarter
|
Quarter
|
Total
|
|||||||||||||||||
| (In Thousands Except Per Share Amounts) | ||||||||||||||||||||||
|
Revenues
|
$ | 362,422 | $ | 399,613 | $ | 438,892 | $ | 345,322 | $ | 1,546,249 | ||||||||||||
|
Operating
income
|
$ | 10,535 | $ | 33,567 | $ | 67,766 | $ | 39,444 | $ | 151,312 | ||||||||||||
|
Net
income (loss)
|
$ | (8,940 | ) | $ | 12,404 | $ | 30,094 | $ | 11,464 | $ | 45,022 | |||||||||||
|
Earnings
(loss) per share: (a)
|
||||||||||||||||||||||
|
Basic
|
$ | (0.42 | ) | $ | 0.58 | $ | 1.38 | $ | 0.44 | $ | 1.98 | |||||||||||
|
Diluted
|
$ | (0.42 | ) | $ | 0.55 | $ | 1.29 | $ | 0.42 | $ | 1.88 | |||||||||||
|
Year
Ended
|
First
|
Second
|
Third
|
Fourth
|
2008 | |||||||||||||||||
|
December
31, 2008
|
Quarter
|
Quarter
|
Quarter
|
Quarter
|
Total | |||||||||||||||||
| (In Thousands Except Per Share Amounts) | ||||||||||||||||||||||
|
Revenues
|
$ | 396,506 | $ | 445,730 | $ | 500,648 | $ | 355,109 | $ | 1,697,993 | ||||||||||||
|
Operating
income (loss)
|
$ | 4,809 | $ | 19,918 | $ | 62,465 | $ | (30,633 | ) | $ | 56,559 | |||||||||||
|
Net
income (loss)
|
$ | (304,238 | ) | (b) | $ | 10,765 | $ | 18,933 | $ | (72,178 | ) | $ | (346,718 | ) | (b) | |||||||
|
Earnings
(loss) per share: (a)
|
||||||||||||||||||||||
|
Basic
|
$ | (14.37 | ) | (b) | $ | 0.50 | $ | 0.88 | $ | (3.36 | ) | $ | (16.22 | ) | (b) | |||||||
|
Diluted
|
$ | (14.37 | ) | (b) | $ | 0.49 | $ | 0.87 | $ | (3.36 | ) | $ | (16.22 | ) | (b) | |||||||
|
(a)
|
The earnings (loss) per share is calculated from the weighted average common and common stock equivalents outstanding during each quarter, which may fluctuate based on quarterly income levels, market prices and share repurchases. Therefore, the sum of earnings per share information for each quarter may not equal the total year amounts. |
|
(b)
|
See Note 14 for restatement of 2008 income tax benefit, which occurred in the first quarter and increased net loss by $6.3 million or $0.30 per share. |
Operating
income (loss) in the table above represents pre-tax income before interest,
goodwill and long-lived asset impairment and (increase) decrease in fair value
of derivatives.
During
the second and fourth quarters of 2009, the Company recorded favorable changes
in vehicle insurance reserve estimates of $3.8 million and $5.6 million,
respectively, in conjunction with receiving actuarial updates on its vehicle
insurance programs. See Note 15 for further discussion.
In 2009,
the majority relating to the fourth quarter, the Company wrote off $2.6 million
(pre-tax) related primarily to the impairment of assets at its
company-owned stores and for software no longer in use.
During
the first quarter of 2008, based on a continued decline in the Company’s stock
price, the Company recorded goodwill impairment of $281.2 million (pre-tax) and
reacquired franchise rights impairment of $69.0 million (pre-tax) based on
performing updated impairment analysis.
During
the fourth quarter of 2008, due to continued deterioration in the operating
environment, the Company performed impairment testing related to long-lived
assets and wrote off $16.6 million (pre-tax) related to certain IT initiatives
and substantially all of the long-lived assets in its Canadian
operations.
- 84
-
Supplemental
Quarterly Cash Flow Disclosures
The
Company will restate its condensed consolidated statements of cash flows for the
three, six and nine month periods ended March 31, 2009, June 30, 2009 and
September 30, 2009, respectively, when it files its Forms 10-Q for the
corresponding periods during 2010. See Note 17 above for a discussion of
the restatement. The prospective restatements of 2009 amounts in 2010
quarterly periods will be as follows:
|
Three
Months Ended March 31, 2009 (unaudited)
|
||||||||
|
As
Previously
|
As
|
|||||||
|
Reported
|
Adjustment
|
Restated
|
||||||
| (In Thousands) | ||||||||
|
Net
cash provided by operating activities
|
$ |
241,698
|
$ |
(94,321)
|
$ |
147,377
|
||
|
Net
cash provided by investing activities
|
262,826
|
94,321
|
357,147
|
|||||
|
CHANGE
IN CASH AND CASH EQUIVALENTS
|
(136,635)
|
-
|
(136,635)
|
|||||
|
Six
Months Ended June 30, 2009 (unaudited)
|
||||||||
|
As
Previously
|
As
|
|||||||
|
Reported
|
Adjustment
|
Restated
|
||||||
| (In Thousands) | ||||||||
|
Net
cash provided by operating activities
|
$ |
394,367
|
$ |
(134,853)
|
$ |
259,514
|
||
|
Net
cash provided by investing activities
|
188,987
|
134,853
|
323,840
|
|||||
|
CHANGE
IN CASH AND CASH EQUIVALENTS
|
(67,128)
|
-
|
(67,128)
|
|||||
|
Nine
Months Ended September 30, 2009 (unaudited)
|
||||||||
|
As
Previously
|
As
|
|||||||
|
Reported
|
Adjustment
|
Restated
|
||||||
| (In Thousands) | ||||||||
|
Net
cash provided by operating activities
|
$ |
539,276
|
$ |
(114,394)
|
$ |
424,882
|
||
|
Net
cash provided by investing activities
|
169,107
|
114,394
|
283,501
|
|||||
|
CHANGE
IN CASH AND CASH EQUIVALENTS
|
(23,650)
|
-
|
(23,650)
|
|||||
******
- 85
-
SCHEDULE
II
DOLLAR
THRIFTY AUTOMOTIVE GROUP, INC. AND SUBSIDIARIES
VALUATION
AND QUALIFYING ACCOUNTS
YEAR
ENDED DECEMBER 31, 2009, 2008 AND 2007
|
Balance
at
|
Additions
|
Balance
at
|
||||||||||||||||||
|
Beginning
|
Charged
to
|
Charged
to
|
End
of
|
|||||||||||||||||
|
of
Year
|
costs
and
|
other
|
Deductions
|
Year
|
||||||||||||||||
|
expenses
|
accounts
|
|||||||||||||||||||
|
(In
Thousands)
|
||||||||||||||||||||
|
2009
|
||||||||||||||||||||
|
Allowance
for doubtful accounts
|
$ | 13,199 | $ | 3,129 | $ | - | $ | (8,798 | ) | $ | 7,530 | |||||||||
|
Vehicle
insurance reserves
|
$ | 110,310 | $ | 43,356 | $ | - | $ | (45,082 | ) | $ | 108,584 | |||||||||
|
Valuation
allowance for deferred
|
||||||||||||||||||||
|
tax
assets
|
$ | 22,162 | $ | 2,756 | $ | - | $ | - | $ | 24,918 | ||||||||||
|
2008
|
||||||||||||||||||||
|
Allowance
for doubtful accounts
|
$ | 5,991 | $ | 7,878 | $ | - | $ | (670 | ) | $ | 13,199 | |||||||||
|
Vehicle
insurance reserves
|
$ | 110,034 | $ | 55,535 | $ | - | $ | (55,259 | ) | $ | 110,310 | |||||||||
|
Valuation
allowance for deferred
|
||||||||||||||||||||
|
tax
assets
|
$ | 23,186 | $ | (1,024 | ) | $ | - | $ | - | $ | 22,162 | |||||||||
|
2007
|
||||||||||||||||||||
|
Allowance
for doubtful accounts
|
$ | 9,961 | $ | 1,022 | $ | - | $ | (4,992 | ) | $ | 5,991 | |||||||||
|
Vehicle
insurance reserves
|
$ | 103,921 | $ | 51,794 | $ | - | $ | (45,681 | ) | $ | 110,034 | |||||||||
|
Valuation
allowance for deferred
|
||||||||||||||||||||
|
tax
assets
|
$ | 18,572 | $ | 4,614 | $ | - | $ | - | $ | 23,186 | ||||||||||
The
“deductions” column of allowance for doubtful accounts represents write-offs of
fully reserved franchisee accounts receivable.
- 86
-
|
CHANGES IN AND
DISAGREEMENTS WITH ACCOUNTANTS ON ACCOUNTING AND FINANCIAL
DISCLOSURE
|
None.
|
CONTROLS AND
PROCEDURES
|
Disclosure
Controls and Procedures
The
Company maintains a set of disclosure controls and procedures designed to ensure
that information required to be disclosed by the Company in reports that it
files or submits under the Securities Exchange Act of 1934 is recorded,
processed, summarized and reported within the time periods specified in
Securities and Exchange Commission (“SEC”) rules and forms. The
disclosure controls and procedures are also designed with the objective of
ensuring such information is accumulated and communicated to the Company’s
management, including the Chief Executive Officer (“CEO”) and Chief Financial
Officer (“CFO”), as appropriate, to allow timely decisions regarding required
disclosures. In designing and evaluating the disclosure controls and
procedures, management recognized that disclosure controls and procedures, no
matter how well conceived and operated, can provide only reasonable, not
absolute, assurance that the objectives of the disclosure controls and
procedures are met. Additionally, in designing the disclosure
controls and procedures, the Company’s management was required to apply its
judgment in evaluating the cost-benefit relationship of possible disclosure
controls and procedures.
As
required by SEC Rule 13a-15(b), the Company carried out an evaluation, under the
supervision and with the participation of the Company’s management, including
the CEO and CFO, of the effectiveness of the design and operation of the
Company’s disclosure controls and procedures as of the end of the period covered
by this report. Based on that evaluation, the CEO and CFO have
concluded that the Company’s disclosure controls and procedures are effective at
the reasonable assurance level as of the end of the period covered by this
report.
Internal
Control Over Financial Reporting
Management’s
Annual Report on Internal Control Over Financial Reporting
The
management of the Company is responsible for establishing and maintaining
adequate internal control over financial reporting. The internal control system
was designed to provide reasonable assurance to the Company’s management and
board of directors regarding the preparation and fair presentation of published
financial statements.
All
internal control systems, no matter how well designed, have inherent
limitations. Therefore, even those systems determined to be effective can
provide only reasonable assurance with respect to financial statement
preparation and presentation.
The
Company’s management assessed the effectiveness of the Company’s internal
control over financial reporting as of December 31, 2009. In making this
assessment, the Company used the criteria for effective internal control over
financial reporting set forth in Internal Control – Integrated Framework issued
by the Committee of Sponsoring Organizations of the Treadway Commission (COSO).
Based on management’s assessment, management asserts that as of December 31,
2009, the Company’s internal control over financial reporting is effective based
on those criteria.
Deloitte
& Touche LLP has issued its report with respect to the Company’s internal
control over financial reporting, which appears below under “Attestation Report
of the Registered Public Accounting Firm”.
- 87
-
Changes
in Internal Control Over Financial Reporting
There has
been no change in the Company’s internal control over financial reporting as
defined in Rules 13(a)-15(f) and 15(d)-15(f) under the Exchange Act during the
last fiscal quarter that has materially affected or is reasonably likely to
materially affect, the Company’s internal control over financial
reporting.
- 88
-
Attestation
Report of the Registered Public Accounting Firm
REPORT
OF INDEPENDENT REGISTERED PUBLIC ACCOUNTING FIRM
To the
Board of Directors and Stockholders of
Dollar
Thrifty Automotive Group, Inc.:
We have
audited the internal control over financial reporting of Dollar Thrifty
Automotive Group, Inc. and subsidiaries (the “Company”) as of December 31, 2009,
based on criteria established in Internal Control—Integrated
Framework issued by the Committee of Sponsoring Organizations of the
Treadway Commission. The Company’s management is responsible for
maintaining effective internal control over financial reporting and for its
assessment of the effectiveness of internal control over financial reporting,
included in the accompanying Management’s Annual Report on Internal Control Over
Financial Reporting. Our responsibility is to express an opinion on the
Company’s internal control over financial reporting based on our
audit.
We
conducted our audit in accordance with the standards of the Public Company
Accounting Oversight Board (United States). Those standards require that
we plan and perform the audit to obtain reasonable assurance about whether
effective internal control over financial reporting was maintained in all
material respects. Our audit included obtaining an understanding of
internal control over financial reporting, assessing the risk that a material
weakness exists, testing and evaluating the design and operating effectiveness
of internal control based on assessed risk, and performing such other procedures
as we considered necessary in the circumstances. We believe that our audit
provides a reasonable basis for our opinion.
A
company’s internal control over financial reporting is a process designed by, or
under the supervision of, the company’s principal executive and principal
financial officers, or persons performing similar functions, and effected by the
company’s board of directors, management, and other personnel to provide
reasonable assurance regarding the reliability of financial reporting and the
preparation of financial statements for external purposes in accordance with
generally accepted accounting principles. A company’s internal control
over financial reporting includes those policies and procedures that (1) pertain
to the maintenance of records that, in reasonable detail, accurately and fairly
reflect the transactions and dispositions of the assets of the company; (2)
provide reasonable assurance that transactions are recorded as necessary to
permit preparation of financial statements in accordance with generally accepted
accounting principles, and that receipts and expenditures of the company are
being made only in accordance with authorizations of management and directors of
the company; and (3) provide reasonable assurance regarding prevention or timely
detection of unauthorized acquisition, use, or disposition of the company’s
assets that could have a material effect on the financial
statements.
Because
of the inherent limitations of internal control over financial reporting,
including the possibility of collusion or improper management override of
controls, material misstatements due to error or fraud may not be prevented or
detected on a timely basis. Also, projections of any evaluation of the
effectiveness of the internal control over financial reporting to future periods
are subject to the risk that the controls may become inadequate because of
changes in conditions, or that the degree of compliance with the policies or
procedures may deteriorate.
In our
opinion, the Company maintained, in all material respects, effective internal
control over financial reporting as of December 31, 2009, based on the criteria
established in Internal
Control—Integrated Framework issued by the Committee of Sponsoring
Organizations of the Treadway Commission.
- 89
-
We have
also audited, in accordance with the standards of the Public Company Accounting
Oversight Board (United States), the consolidated financial statements and
financial statement schedule as of and for the year ended December 31, 2009 of
the Company and our report dated March 4, 2010 expressed an unqualified opinion
on those financial statements and financial statement schedule.
/s/ DELOITTE
& TOUCHE LLP
Tulsa,
Oklahoma
March 4,
2010
- 90
-
|
OTHER
INFORMATION
|
None.
PART III
|
DIRECTORS, EXECUTIVE
OFFICERS AND CORPORATE
GOVERNANCE
|
Reference
is made to the information appearing under the captions “Biographical
Information Regarding Director Nominees and Executive Officers”,
“Independence, Meetings, Committees and Compensation of the Board of Directors -
Audit Committee”, “Section 16(a) Beneficial Ownership Reporting Compliance” and
“Code of Ethics” in the Company’s definitive Proxy Statement which will be filed
pursuant to Regulation 14A promulgated by the SEC not later than 120 days after
the end of the Company’s fiscal year ended December 31, 2009, and is
incorporated herein by reference.
|
EXECUTIVE
COMPENSATION
|
Reference
is made to the information appearing under the captions “Independence, Meetings,
Committees and Compensation of the Board of Directors - Compensation,” and
“Executive Compensation” in the Company’s definitive Proxy Statement which will
be filed pursuant to Regulation 14A promulgated by the SEC not later than 120
days after the end of the Company’s fiscal year ended December 31, 2009, and is
incorporated herein by reference.
|
SECURITY OWNERSHIP OF
CERTAIN BENEFICIAL OWNERS AND MANAGEMENT AND RELATED STOCKHOLDER
MATTERS
|
Except as
set forth below regarding securities authorized for issuance under equity
compensation plans, the information required by this Item 12 will be set
forth under the heading “Security Ownership of Certain Beneficial Owners,
Directors, Director Nominees and Executive Officers” in the Company’s definitive
Proxy Statement which will be filed pursuant to Regulation 14A promulgated by
SEC not later than 120 days after the end of the Company’s fiscal year ended
December 31, 2009, and is incorporated herein by reference.
Equity
Compensation Plan Information
The
following table sets forth certain information for the fiscal year ended
December 31, 2009 with respect to the Second Amended and Restated Long-Term
Incentive Plan and Director Equity Plan (“LTIP”) under which Common Stock of the
Company is authorized for issuance:
- 91
-
|
Number
of Securities
|
||||||||
|
Remaining
Available for
|
||||||||
|
Number
of Securities
|
Weighted-Average
|
Future
Issuance Under
|
||||||
|
to
be Issued Upon
|
Exercise
Price of
|
Equity
Compensation
|
||||||
|
Exercise
of Outstanding
|
Outstanding
Options,
|
Plans
(Excluding
|
||||||
|
Plan
Category
|
Options,
Warrants and Rights
|
Warrants
and Rights
|
Securities
in Column (a))
|
|||||
|
(a)
|
(b)
|
(c)
|
||||||
|
Equity
compensation plans
|
||||||||
|
approved
by security holders
|
2,450,397
|
$6.55
|
442,711
|
|||||
|
Equity
compensation plans not
|
||||||||
|
approved
by security holders
|
None
|
None
|
None
|
|||||
|
Total
|
2,450,397
|
$6.55
|
442,711
|
(1)
|
||||
|
(1)
|
At
December 31, 2009, total common stock authorized for issuance was
3,137,271 shares, which included 2,450,397
|
|||||||
|
unexercised
option rights and 244,163 Performance Shares, assuming a
maximum payout for all nonvested Performance
|
||||||||
|
Shares. The
Performance Shares ultimately issued will likely be less (refer to Item 8
- Note 13 of Notes to Consolidated
|
||||||||
|
Financial
Statements). The remaining common stock available for future
issuance at December 31, 2009 is 442,711 shares.
|
||||||||
|
CERTAIN RELATIONSHIPS
AND RELATED TRANSACTIONS AND DIRECTOR
INDEPENDENCE
|
Reference
is made to the information appearing under the caption “Independence, Meetings,
Committees and Compensation of the Board of Directors - Independence” in the
Company’s definitive Proxy Statement which will be filed pursuant to Regulation
14A promulgated by the SEC not later than 120 days after the end of the
Company’s fiscal year ended December 31, 2009, and is incorporated herein by
reference.
|
PRINCIPAL ACCOUNTING
FEES AND SERVICES
|
Reference
is made to the information appearing under “Proposal No. 2 – Appointment of
Independent Registered Public Accounting Firm” in the Company’s definitive Proxy
Statement which will be filed pursuant to Regulation 14A promulgated by the SEC
not later than 120 days after the end of the Company’s fiscal year ended
December 31, 2009, and is incorporated herein by reference.
- 92
-
PART IV
|
EXHIBITS AND FINANCIAL
STATEMENT SCHEDULES
|
|
(a)
|
Documents filed as a
part of this report
|
|
|
(1)
|
All Financial
Statements. The response to this portion of Item 15 is
submitted as a separate section herein under Part II, Item 8 - Financial
Statements and Supplementary Data.
|
|
|
(2)
|
Financial Statement
Schedules. Schedule II - Valuation and Qualifying
Accounts - Years Ended December 31, 2009, 2008 and 2007 is set forth under
Part II, Item 8 - Financial Statements and Supplementary
Data. All other schedules are omitted because they are not
applicable or the information is shown in the financial statements or
notes thereto.
|
|
|
(3)
|
Index of
Exhibits
|
|
Exhibit No.
|
Description
|
|
3.1
|
Certificate
of Incorporation of DTG, filed as the same numbered exhibit with DTG’s
Registration Statement on Form S-1, as amended, Registration No.
333-39661*
|
|
3.2
|
Fourth
Amended and Restated By-Laws of Dollar Thrifty Automotive Group, Inc.,
adopted effective as of December 9, 2008, filed as the same numbered
exhibit with DTG’s Form 8-K, filed December 15, 2008, Commission File No.
1-13647*
|
|
4.1
|
Form
of Certificate of Common Stock, filed as the same numbered exhibit with
DTG’s Registration Statement on Form S-1, as amended, Registration No.
333-39661*
|
|
4.46
|
Master
Exchange and Trust Agreement dated as of July 23, 2001 among Rental Car
Finance Corp., Dollar, Thrifty, Chicago Deferred Exchange Corporation,
VEXCO, LLC and The Chicago Trust Company, filed as the same numbered
exhibit with DTG’s Form 10-Q for the quarterly period ended September 30,
2001, filed November 13, 2001, Commission File No.
1-13647*
|
|
4.64
|
Amendment
No. 3 to Note Purchase Agreement dated as of April 16, 2002 among Rental
Car Finance Corp., DTG, the Conduit Purchasers parties thereto, the
Committed Purchasers parties thereto, the Managing Agents parties thereto,
and Bank One, NA, filed as the same numbered exhibit with DTG’s Form 10-Q
for the quarterly period ended June 30, 2002, filed August 13, 2002,
Commission File No. 1-13647*
|
|
4.66
|
Amended
and Restated Collateral Assignment of Exchange Agreement dated as of April
16, 2002 by and among Rental Car Finance Corp., Dollar, Thrifty, and
Deutsche Bank Trust Company Americas, formerly known as Bankers Trust
Company, filed as the same numbered exhibit with DTG’s Form 10-Q for the
quarterly period ended June 30, 2002, filed August 13, 2002, Commission
File No. 1-13647*
|
- 93
-
|
4.70
|
Amended
and Restated Collateral Assignment of Exchange Agreement dated as of June
4, 2002 by and among Rental Car Finance Corp., Dollar, Thrifty, and
Deutsche Bank Trust Company Americas, formerly known as Bankers Trust
Company, filed as the same numbered exhibit with DTG’s Form 10-Q for the
quarterly period ended June 30, 2002, filed August 13, 2002, Commission
File No. 1-13647*
|
|
4.117
|
Amendment
and Assignment Agreement dated as of April 1, 2004 among DTG, DTG
Operations, Inc., formerly known as Dollar Rent A Car Systems, Inc.,
Thrifty, Various Financial Institutions named therein, Credit Suisse First
Boston, The Bank of Nova Scotia and Dresdner Bank AG, filed as the same
numbered exhibit with DTG’s Form 10-Q for the quarterly period ended June
30, 2004, filed August 6, 2004, Commission File No. 1-13647*
|
|
4.140
|
Note
Purchase Agreement dated as of April 14, 2005 among Rental Car Finance
Corp., Dollar Thrifty Automotive Group, Inc., Deutsche Bank Securities
Inc., J.P. Morgan Securities Inc., ABN AMRO Incorporated, Credit Suisse
First Boston LLC, Dresdner Kleinwort Wasserstein Securities LLC, and
Scotia Capital (USA) Inc., filed as the same numbered exhibit with DTG's
Form 8-K, filed April 18, 2005, Commission No. 1-13647*
|
|
4.141
|
Series
2005-1 Supplement dated as of April 21, 2005 between Rental Car Finance
Corp. and Deutsche Bank Trust Company Americas, filed as the same numbered
exhibit with DTG's Form 8-K, filed April 26, 2005, Commission No.
1-13647*
|
|
4.143
|
Financial
Guaranty Insurance Policy No. CA01914A issued by XL Capital Assurance Inc.
to Deutsche Bank Trust Company Americas for the benefit of the Series
2005-1 Noteholders, filed as the same numbered exhibit with DTG's Form
8-K, filed April 26, 2005, Commission No. 1-13647*
|
|
4.147
|
Note
Purchase Agreement dated as of March 23, 2006 among Rental Car Finance
Corp., Dollar Thrifty Automotive Group, Inc., J.P. Morgan Securities Inc.,
Deutsche Bank Securities Inc., ABN AMRO Incorporated, BNP Paribas
Securities Corp., Credit Suisse Securities (USA) LLC, Dresdner Kleinwort
Wasserstein Securities LLC, and Scotia Capital (USA) Inc., filed as the
same numbered exhibit with DTG's Form 8-K, filed March 29, 2006,
Commission No. 1-13647*
|
|
4.153
|
Series
2006-1 Supplement dated as of March 28, 2006 between Rental Car Finance
Corp. and Deutsche Bank Trust Company Americas, filed as the same numbered
exhibit with DTG's Form 8-K, filed April 3, 2006, Commission No.
1-13647*
|
|
4.156
|
Collateral
Assignment of Exchange Agreement dated as of March 28, 2006 among Rental
Car Finance Corp., DTG Operations, Inc. and Deutsche Bank Trust Company
Americas, filed as the same numbered exhibit with DTG's Form 8-K, filed
April 3, 2006, Commission No. 1-13647*
|
|
4.158
|
Note
Guaranty Insurance Policy No. AB0981BE issued by Ambac Assurance
Corporation to Deutsche Bank Trust Company Americas for the benefit of the
Series 2006-1 Noteholders, filed as the same numbered exhibit with DTG's
Form 8-K, filed April 3, 2006, Commission No. 1-13647*
|
- 94
-
|
4.163
|
Amended
and Restated Base Indenture dated as of February 14, 2007 between Rental
Car Finance Corp. and Deutsche Bank Trust Company Americas, filed as the
same numbered exhibit with DTG’s Form 10-Q for the quarterly period ended
March 31, 2007, filed May 8, 2007, Commission File No.
1-13647*
|
|
4.168
|
Amendment
No. 1 to Series 2005-1 Supplement dated as of February 14, 2007 between
Rental Car Finance Corp. and Deutsche Bank Trust Company Americas, filed
as the same numbered exhibit with DTG’s Form 10-Q for the quarterly period
ended March 31, 2007, filed May 8, 2007, Commission File No.
1-13647*
|
|
4.169
|
Amendment
No. 1 to Series 2006-1 Supplement dated as of February 14, 2007 between
Rental Car Finance Corp. and Deutsche Bank Trust Company Americas, filed
as the same numbered exhibit with DTG’s Form 10-Q for the quarterly period
ended March 31, 2007, filed May 8, 2007, Commission File No.
1-13647*
|
|
4.170
|
Second
Amended and Restated Master Collateral Agency Agreement dated as of
February 14, 2007 among Dollar Thrifty Automotive Group, Inc., Rental Car
Finance Corp., DTG Operations, Inc. and Deutsche Bank Trust Company
Americas, filed as the same numbered exhibit with DTG’s Form 10-Q for the
quarterly period ended March 31, 2007, filed May 8, 2007, Commission File
No. 1-13647*
|
|
4.171
|
Amended
and Restated Master Motor Vehicle Lease and Servicing Agreement (Group II)
dated as of February 14, 2007 among Rental Car Finance Corp., DTG
Operations, Inc., Dollar Thrifty Automotive Group, Inc. and Deutsche Bank
Trust Company Americas, filed as the same numbered exhibit with DTG’s Form
10-Q for the quarterly period ended March 31, 2007, filed May 8, 2007,
Commission File No. 1-13647*
|
|
4.172
|
Amended
and Restated Master Motor Vehicle Lease and Servicing Agreement (Group
III) dated as of February 14, 2007 among Rental Car Finance Corp., DTG
Operations, Inc., Dollar Thrifty Automotive Group, Inc. and Deutsche Bank
Trust Company Americas, filed as the same numbered exhibit with DTG’s Form
10-Q for the quarterly period ended March 31, 2007, filed May 8, 2007,
Commission File No. 1-13647*
|
|
4.173
|
Amended
and Restated Master Motor Vehicle Lease and Servicing Agreement (Group IV)
dated as of February 14, 2007 among Rental Car Finance Corp., DTG
Operations, Inc., Dollar Thrifty Automotive Group, Inc. and Deutsche Bank
Trust Company Americas, filed as the same numbered exhibit with DTG’s Form
10-Q for the quarterly period ended March 31, 2007, filed May 8, 2007,
Commission File No. 1-13647*
|
|
4.175
|
Note
Purchase Agreement dated as of May 15, 2007 among Rental Car Finance
Corp., Dollar Thrifty Automotive Group, Inc., Credit Suisse Securities
(USA) LLC, Deutsche Bank Securities Inc., J.P. Morgan Securities Inc., ABN
AMRO Incorporated, BNP Paribas Securities Corp., Dresdner Kleinwort
Securities LLC, and Scotia Capital (USA) Inc., filed as the same numbered
exhibit with DTG’s Form 8-K, filed May 18, 2007, Commission File No.
1-13647*
|
- 95
-
|
4.176
|
Series
2007-1 Supplement dated as of May 23, 2007 between Rental Car Finance
Corp. and Deutsche Bank Trust Company Americas, filed as the same numbered
exhibit with DTG’s Form 8-K, filed May 29, 2007, Commission File No.
1-13647*
|
|
4.178
|
Financial
Guaranty Insurance Policy No. 07030024 issued by Financial Guaranty
Insurance Company to Deutsche Bank Trust Company Americas for the benefit
of the Series 2007-1 Noteholders, filed as the same numbered exhibit with
DTG’s Form 8-K, filed May 29, 2007, Commission File No.
1-13647*
|
|
4.181
|
Enhancement
Letter of Credit Application and Agreement dated as of June 15, 2007 among
DTG Operations, Inc., Rental Car Finance Corp., Dollar Thrifty Automotive
Group, Inc. and Deutsche Bank Trust Company Americas (Series 2004-1),
filed as the same numbered exhibit with DTG’s Form 8-K, filed June 20,
2007, Commission File No. 1-13647*
|
|
4.182
|
Enhancement
Letter of Credit Application and Agreement dated as of June 15, 2007 among
DTG Operations, Inc., Rental Car Finance Corp., Dollar Thrifty Automotive
Group, Inc. and Deutsche Bank Trust Company Americas (Series 2005-1),
filed as the same numbered exhibit with DTG’s Form 8-K, filed June 20,
2007, Commission File No. 1-13647*
|
|
4.183
|
Enhancement
Letter of Credit Application and Agreement dated as of June 15, 2007 among
DTG Operations, Inc., Rental Car Finance Corp., Dollar Thrifty Automotive
Group, Inc. and Deutsche Bank Trust Company Americas (Series 2006-1),
filed as the same numbered exhibit with DTG’s Form 8-K, filed June 20,
2007, Commission File No. 1-13647*
|
|
4.184
|
Enhancement
Letter of Credit Application and Agreement dated as of June 15, 2007 among
DTG Operations, Inc., Rental Car Finance Corp., Dollar Thrifty Automotive
Group, Inc. and Deutsche Bank Trust Company Americas (Series 2007-1),
filed as the same numbered exhibit with DTG’s Form 8-K, filed June 20,
2007, Commission File No. 1-13647*
|
|
4.187
|
Extension
Agreement dated as of June 19, 2007 among Dollar Thrifty Funding Corp.,
certain financial institutions, as the Liquidity Lenders, Credit Suisse
and Deutsche Bank Trust Company Americas, filed as the same numbered
exhibit with DTG’s Form 8-K, filed June 27, 2007, Commission File No.
1-13647*
|
|
4.190
|
Amendment
No. 1 dated as of June 19, 2007 to Amended and Restated Master Motor
Vehicle Lease and Servicing Agreement (Group II) among Rental Car Finance
Corp., DTG Operations, Inc. and Dollar Thrifty Automotive Group, Inc.,
filed as the same numbered exhibit with DTG’s Form 8-K, filed June 27,
2007, Commission File No. 1-13647*
|
|
4.191
|
Amendment
No. 2 to Series 2006-1 Supplement dated as of May 23, 2007 between Rental
Car Finance Corp. and Deutsche Bank Trust Company Americas, filed as the
same numbered exhibit with DTG’s Form 10-Q for the quarterly period ended
June 30, 2007, filed August 7, 2007, Commission File No.
1-13647*
|
- 96
-
|
4.192
|
Amendment
No. 1 dated as of May 22, 2007 to Amended and Restated Master Motor
Vehicle Lease and Servicing Agreement (Group IV) among Rental Car Finance
Corp., DTG Operations, Inc. and Dollar Thrifty Automotive Group, Inc.,
filed as the same numbered exhibit with DTG’s Form 10-Q for the quarterly
period ended June 30, 2007, filed August 7, 2007, Commission File No.
1-13647*
|
|
4.198
|
Amendment
No. 2 dated as of May 8, 2008 to Amended and Restated Master Motor Vehicle
Lease and Servicing Agreement (Group II) among Rental Car Finance Corp.,
DTG Operations, Inc. and Dollar Thrifty Automotive Group, Inc., filed as
the same numbered exhibit with DTG’s Form 8-K, filed May 14, 2008,
Commission File No. 1-13647*
|
|
4.199
|
Master
Consent Agreement dated as of May 8, 2008 among Rental Car Finance Corp.,
Dollar Thrifty Automotive Group, Inc., DTG Operations, Inc., Dollar
Thrifty Funding Corp., Deutsche Bank Trust Company Americas, Deutsche Bank
AG, New York Branch, JPMorgan Chase Bank, N.A., The Bank of Nova Scotia,
Credit Suisse, acting through its New York Branch, Bank of Montreal, The
Bank of Tokyo-Mitsubishi UFJ, Ltd., New York Branch, Comerica Bank, Credit
Industriel et Commercial and Wells Fargo Bank, filed as the same numbered
exhibit with DTG’s Form 8-K, filed May 14, 2008, Commission File No.
1-13647*
|
|
4.202
|
Amendment
No. 2 to Series 2005-1 Supplement dated as of September 12, 2008 between
Rental Car Finance Corp. and Deutsche Bank Trust Company Americas, filed
as the same numbered exhibit with DTG’s Form 10-Q filed November 5, 2008,
Commission File No. 1-13647*
|
|
4.203
|
Amendment
No. 3 to Series 2006-1 Supplement dated as of September 12, 2008 between
Rental Car Finance Corp. and Deutsche Bank Trust Company Americas, filed
as the same numbered exhibit with DTG’s Form 10-Q filed November 5, 2008,
Commission File No. 1-13647*
|
|
4.204
|
Amendment
No. 1 to Series 2007-1 Supplement dated as of September 12, 2008 between
Rental Car Finance Corp. and Deutsche Bank Trust Company Americas, filed
as the same numbered exhibit with DTG’s Form 10-Q filed November 5, 2008,
Commission File No. 1-13647*
|
|
4.205
|
Amendment
No. 3 to Series 2005-1 Supplement dated as of February 3, 2009 between
Rental Car Finance Corp. and Deutsche Bank Trust Company Americas, filed
as the same numbered exhibit with DTG’s Form 10-K for the fiscal year
ended December 31, 2008, filed March 3, 2009, Commission File No.
1-13647*
|
|
4.206
|
Amendment
No. 4 to Series 2006-1 Supplement dated as of February 3, 2009 between
Rental Car Finance Corp. and Deutsche Bank Trust Company Americas, filed
as the same numbered exhibit with DTG’s Form 10-K for the fiscal year
ended December 31, 2008, filed March 3, 2009, Commission File No.
1-13647*
|
|
4.207
|
Amendment
No. 2 to Series 2007-1 Supplement dated as of February 3, 2009 between
Rental Car Finance Corp. and Deutsche Bank Trust Company Americas, filed
as the same numbered exhibit with DTG’s Form 10-K for the fiscal year
ended December 31, 2008, filed March 3, 2009, Commission File No.
1-13647*
|
- 97
-
|
4.208
|
Amendment
No. 1 to Amended And Restated Master Motor Vehicle Lease And Servicing
Agreement (Group III), dated as of February 3, 2009 among Rental Car
Finance Corp., as Lessor, DTG Operations, Inc. as Lessee and Servicer, and
those Subsidiaries of Dollar Thrifty Automotive Group, Inc. from time to
time becoming Lessees and Servicers thereunder and Dollar Thrifty
Automotive Group, Inc. as Guarantor and Master Servicer, filed as the same
numbered exhibit with DTG’s Form 10-K for the fiscal year ended December
31, 2008, filed March 3, 2009, Commission File No. 1-13647*
|
|
4.209
|
Amendment
No.2 to Amended And Restated Master Motor Vehicle Lease And Servicing
Agreement (Group IV), dated as of February 3, 2009 among Rental Car
Finance Corp., as Lessor, DTG Operations, Inc., as Lessee and Servicer,
and those Subsidiaries of Dollar Thrifty Automotive Group, Inc. from time
to time becoming Lessees and Servicers thereunder and Dollar Thrifty
Automotive Group, Inc., as Guarantor and Master Servicer, filed as the
same numbered exhibit with DTG’s Form 10-K for the fiscal year ended
December 31, 2008, filed March 3, 2009, Commission File No.
1-13647*
|
|
4.210
|
Amendment
No. 1, dated as of June 2, 2009 to the Second Amended and Restated Master
Collateral Agency Agreement (the “Master Collateral Agreement”), dated as
of February 14, 2007, among Dollar Thrifty Automotive Group, Inc., DTG
Operations, Inc., Rental Car Finance Corp., the Financing Sources named
therein and Deutsche Bank Trust Company Americas, as Master Collateral
Agent, filed as the same numbered exhibit with DTG’s Form 8-K, filed June
8, 2009, Commission File No. 1-13647*
|
|
4.211
|
Letter
Agreement, dated as of June 2, 2009, among Dollar Thrifty Automotive
Group, Inc., Ambac Assurance Corporation and Financial Guaranty Insurance
Company, relating to Amendment No. 1 to the Second Amended and Restated
Master Collateral Agency Agreement, dated as of February 14, 2007, filed
as the same numbered exhibit with DTG’s Form 8-K, filed June 8, 2009,
Commission File No. 1-13647*
|
|
4.212
|
Amendment
No. 4 to Series 2005-1 Supplement dated as of August 3, 2009 between
Rental Car Finance Corp. and Deutsche Bank Trust Company Americas, filed
as the same numbered exhibit with DTG’s Form 10-Q, filed August 6, 2009,
Commission File No. 1-13647*
|
|
4.213
|
Amendment
No. 5 to Series 2006-1 Supplement dated as of August 3, 2009, between
Rental Car Finance Corp. and Deutsche Bank Trust Company Americas, filed
as the same numbered exhibit with DTG’s Form 10-Q, filed August 6, 2009,
Commission File No. 1-13647*
|
|
4.214
|
Amendment
No. 3 to Series 2007-1 Supplement dated as of August 3, 2009, between
Rental Car Finance Corp. and Deutsche Bank Trust Company Americas, filed
as the same numbered exhibit with DTG’s Form 10-Q, filed August 6, 2009,
Commission File No. 1-13647*
|
|
10.8
|
Pentastar
Transportation Group, Inc. Deferred Compensation Plan, filed as the same
numbered exhibit with DTG’s Registration Statement on Form S-1, as
amended, Registration No. 333-39661†*
|
|
10.10
|
Dollar
Thrifty Automotive Group, Inc. Long-Term Incentive Plan, filed as the same
numbered exhibit with DTG’s Registration Statement on Form S-1, as
amended, Registration No. 333-39661†*
|
- 98
-
|
10.13
|
Amendment
to Long-Term Incentive Plan dated as of September 29, 1998, filed as the
same numbered exhibit with DTG’s Form S-8, Registration No. 333-79603,
filed May 28, 1999†*
|
|
10.30
|
Vehicle
Supply Agreement dated as of October 31, 2002 between DaimlerChrysler
Motors Company, LLC and DTG, filed as the same numbered exhibit with DTG’s
Form 10-K for the fiscal year ended December 31, 2002, filed March 18,
2003, Commission File No. 1-13647*
|
|
10.36
|
Letter
agreement dated as of July 16, 2004 amending the Vehicle Supply Agreement
between DaimlerChrysler Motors Company, LLC and DTG, filed as the same
numbered exhibit with DTG’s Form 10-Q for the quarterly period ended June
30, 2004, filed August 6, 2004, Commission File No. 1-13647*
|
|
10.38
|
Dollar
Thrifty Automotive Group, Inc. Retirement Savings Plan under the Bank of
Oklahoma N.A. Defined Contribution Prototype Plan & Trust, as adopted
by the Company pursuant to the Adoption Agreement (Exhibit 10.39), filed
as the same numbered exhibit with DTG’s Form 10-Q for the quarterly period
ended September 30, 2004, filed November 4, 2004, Commission File No.
1-13647†*
|
|
10.39
|
Adoption
Agreement #005 Nonstandardized 401(k) Profit Sharing Plan, filed as the
same numbered exhibit with DTG’s Form 10-Q for the quarterly period ended
September 30, 2004, filed November 4, 2004, Commission File No.
1-13647†*
|
|
10.40
|
Unanimous
Consent to Action of the Human Resources and Compensation Committee of the
Board of Directors of Dollar Thrifty Automotive Group, Inc. Taken in Lieu
of Special Meeting effective December 2, 2004 regarding the Fourth
Amendment to Retirement Plan dated December 2, 2004, with amendment
attached, filed as the same numbered exhibit with DTG’s Form 8-K, filed
December 8, 2004, Commission File No. 1-13647†*
|
|
10.41
|
Unanimous
Consent to Action of the Human Resources and Compensation Committee of the
Board of Directors of Dollar Thrifty Automotive Group, Inc. Taken in Lieu
of Special Meeting effective December 2, 2004 regarding the amendment to
the Dollar Thrifty Automotive Group, Inc. Retirement Savings Plan under
the Bank of Oklahoma N.A. Defined Contribution Prototype Plan & Trust
dated January 1, 2005, with amendment attached, filed as the same numbered
exhibit with DTG’s Form 8-K, filed December 8, 2004, Commission File No.
1-13647†*
|
|
10.54
|
Amended
and Restated Long-Term Incentive Plan and Director Equity Plan dated as of
March 23, 2005 and Adopted by Shareholders on May 20, 2005, filed as the
same numbered exhibit with DTG’s Form 8-K, filed May 25, 2005, Commission
File No. 1-13647†*
|
|
10.58
|
Indemnification
Agreement dated as of May 20, 2005 between Dollar Thrifty Automotive
Group, Inc. and Thomas P. Capo, non-employee director, filed as the same
numbered exhibit with DTG’s Form 8-K, filed May 25, 2005, Commission File
No. 1-13647*
|
|
10.59
|
Indemnification
Agreement dated as of May 20, 2005 between Dollar Thrifty Automotive
Group, Inc. and Maryann N. Keller, non-employee director, filed as the
same numbered exhibit with DTG’s Form 8-K, filed May 25, 2005, Commission
File No. 1-13647*
|
- 99
-
|
10.60
|
Indemnification
Agreement dated as of May 20, 2005 between Dollar Thrifty Automotive
Group, Inc. and Edward C. Lumley, non-employee director, filed as the same
numbered exhibit with DTG’s Form 8-K, filed May 25, 2005, Commission File
No. 1-13647*
|
|
10.61
|
Indemnification
Agreement dated as of May 20, 2005 between Dollar Thrifty Automotive
Group, Inc. and John C. Pope, non-employee director, filed as the same
numbered exhibit with DTG’s Form 8-K, filed May 25, 2005, Commission File
No. 1-13647*
|
|
10.67
|
Indemnification
Agreement dated as of May 20, 2005 between Dollar Thrifty Automotive
Group, Inc. and R. Scott Anderson, Senior Executive Vice President, filed
as the same numbered exhibit with DTG’s Form 8-K, filed May 25, 2005,
Commission File No. 1-13647†*
|
|
10.70
|
Indemnification
Agreement dated as of May 20, 2005 between Dollar Thrifty Automotive
Group, Inc. and Vicki J. Vaniman, Executive Vice President and General
Counsel, filed as the same numbered exhibit with DTG’s Form 8-K, filed May
25, 2005, Commission File No. 1-13647†*
|
|
10.71
|
Indemnification
Agreement dated as of May 20, 2005 between Dollar Thrifty Automotive
Group, Inc. and Pamela S. Peck, Vice President and Treasurer, filed as the
same numbered exhibit with DTG’s Form 8-K, filed May 25, 2005, Commission
File No. 1-13647†*
|
|
10.78
|
Letter
agreement effective as of September 15, 2005 extending the Vehicle Supply
Agreement between DaimlerChrysler Motors Company, LLC and Dollar Thrifty
Automotive Group, Inc., filed as the same numbered exhibit with DTG's Form
8-K, filed September 20, 2005, Commission File No. 1-13647*
|
|
10.82
|
Notice
of Election Regarding Payment of Director’s Fees (As Amended and Restated)
dated December 2, 2005 executed by Maryann N. Keller, filed as the same
numbered exhibit with DTG's Form 8-K, filed December 8, 2005, Commission
File No. 1-13647*
|
|
10.97
|
Unanimous
Consent to Action of the Human Resources and Compensation Committee of the
Board of Directors of Dollar Thrifty Automotive Group, Inc. Taken in Lieu
of Special Meeting effective February 1, 2006 regarding the amendment and
restatement of Appendix C to the Dollar Thrifty Automotive Group, Inc.
Retirement Savings Plan, with Appendix C attached, filed as the same
numbered exhibit with DTG’s Form 8-K, filed February 7, 2006, Commission
File No. 1-13647†*
|
|
10.98
|
First
Amendment to Amended and Restated Long-Term Incentive Plan and Director
Equity Plan effective as of February 1, 2006, filed as the same numbered
exhibit with DTG’s Form 8-K, filed February 7, 2006, Commission File No.
1-13647†*
|
|
10.100
|
Form
of Performance Share Grant Agreement between Dollar Thrifty Automotive
Group, Inc. and the applicable employee, filed as the same numbered
exhibit with DTG’s Form 8-K, filed February 7, 2006, Commission File No.
1-13647†*
|
- 100
-
|
10.106
|
Indemnification
Agreement dated as of March 22, 2006 between Dollar Thrifty Automotive
Group, Inc. and Richard W. Neu, non-employee director, filed as the same
numbered exhibit with DTG’s Form 8-K, filed March 27, 2006, Commission
File No. 1-13647*
|
|
10.107
|
Roth
401(k) Amendment effective as of March 1, 2006 for the Dollar Thrifty
Automotive Group, Inc. Retirement Savings Plan, filed as the same numbered
exhibit with DTG’s Form 10-Q for the quarterly period ended March 31,
2006, filed May 5, 2006, Commission File No. 1-13647†*
|
|
10.119
|
Mandatory
Retirement Policy approved by the Human Resources and Compensation
Committee of the Board of Directors of Dollar Thrifty Automotive Group,
Inc. on July 26, 2006, filed as the same numbered exhibit with DTG’s Form
8-K, filed August 1, 2006, Commission File No. 1-13647†*
|
|
10.122
|
Letter
agreement effective as of September 8, 2006 extending the Vehicle Supply
Agreement between DaimlerChrysler Motors Company, LLC and Dollar Thrifty
Automotive Group, Inc., filed as the same numbered exhibit with DTG’s Form
8-K, filed September 14, 2006, Commission File No. 1-13647*
|
|
10.123
|
Second
Amended and Restated Data Processing Services Agreement dated as of August
1, 2006 by and among Dollar Thrifty Automotive Group, Inc., Electronic
Data Systems Corporation and EDS Information Services L.L.C., filed as the
same numbered exhibit with DTG’s Form 10-Q for the quarterly period ended
September 30, 2006, filed November 8, 2006, Commission File No.
1-13647*
|
|
10.125
|
Form
of Performance Shares Grant Agreement between the Company and the
applicable employee, filed as the same numbered exhibit with DTG’s Form
8-K, filed February 6, 2007, Commission File No. 1-13647†*
|
|
10.128
|
Second
Amendment to Amended and Restated Long-Term Incentive Plan and Director
Equity Plan approved by the Human Resources and Compensation Committee of
the Board of Directors of Dollar Thrifty Automotive Group, Inc. on
February 1, 2007, filed as the same numbered exhibit with DTG’s Form 8-K,
filed February 6, 2007, Commission File No. 1-13647†*
|
|
10.143
|
Credit
Agreement dated as of June 15, 2007 among Dollar Thrifty Automotive Group,
as the borrower, various financial institutions as are or may become
parties thereto, Deutsche Bank Trust Company Americas, as the
administrative agent, The Bank of Nova Scotia, as the syndication agent,
and Deutsche Bank Securities Inc. and The Bank of Nova Scotia as the joint
lead arrangers and joint bookrunners, filed as the same numbered exhibit
with DTG’s Form 8-K, filed June 20, 2007, Commission File No.
1-13647*
|
|
10.159
|
Form
of Performance Unit Grant Agreement between the Company and the applicable
employee, filed as the same numbered exhibit with DTG’s Form 8-K, filed
February 6, 2008, Commission File No. 1-13647†*
|
|
10.160
|
Form
of Stock Option Grant Agreement between the Company and the applicable
employee, filed as the same numbered exhibit with DTG’s Form 8-K, filed
February 6, 2008, Commission File No. 1-13647†*
|
- 101
-
|
10.177
|
Amendment
to Notice of Election Regarding Payment of Director’s Fees (Earned and
Deferred through December 31, 2007) dated December 31, 2007 executed by
Thomas P. Capo, filed as the same numbered exhibit with DTG’s Form 10-K
for fiscal year ended December 31, 2007, filed February 29, 2008,
Commission File No. 1-13647†*
|
|
10.178
|
Amendment
to Notice of Election Regarding Payment of Director’s Fees (Earned and
Deferred through December 31, 2007) dated December 26, 2007 executed by
Richard W. Neu, filed as the same numbered exhibit with DTG’s Form 10-K
for fiscal year ended December 31, 2007, filed February 29, 2008,
Commission File No. 1-13647†*
|
|
10.179
|
Amendment
to Notice of Election Regarding Payment of Director’s Fees (Earned and
Deferred through December 31, 2007) dated December 31, 2007 executed by
John C. Pope, filed as the same numbered exhibit with DTG’s Form 10-K for
fiscal year ended December 31, 2007, filed February 29, 2008, Commission
File No. 1-13647†*
|
|
10.180
|
Consent
to Action in Lieu of Meeting of the Board of Directors of Dollar Thrifty
Automotive Group, Inc. effective January 1, 2008 regarding the amendment
to the Dollar Thrifty Automotive Group, Inc. Retirement Savings Plan under
the Bank of Oklahoma N.A. Defined Contribution Prototype Plan and Trust
dated November 29, 2007, filed as the same numbered exhibit with DTG’s
Form 10-K for fiscal year ended December 31, 2007, filed February 29,
2008, Commission File No. 1-13647†*
|
|
10.181
|
Amendment
to Notice of Election Regarding Payment of Director’s Fees for Calendar
Year 2008 dated December 31, 2007 executed by Thomas P. Capo, filed as the
same numbered exhibit with DTG’s Form 10-K for fiscal year ended December
31, 2007, filed February 29, 2008, Commission File No.
1-13647†*
|
|
10.182
|
Amendment
to Notice of Election Regarding Payment of Director’s Fees for Calendar
Year 2008 dated December 27, 2007 executed by Maryann N. Keller, filed as
the same numbered exhibit with DTG’s Form 10-K for fiscal year ended
December 31, 2007, filed February 29, 2008, Commission File No.
1-13647†*
|
|
10.183
|
Amendment
to Notice of Election Regarding Payment of Director’s Fees for Calendar
Year 2008 dated December 28, 2007 executed by Edward C. Lumley, filed as
the same numbered exhibit with DTG’s Form 10-K for fiscal year ended
December 31, 2007, filed February 29, 2008, Commission File No.
1-13647†*
|
|
10.184
|
Amendment
to Notice of Election Regarding Payment of Director’s Fees for Calendar
Year 2008 dated December 26, 2007 executed by Richard W. Neu, filed as the
same numbered exhibit with DTG’s Form 10-K for fiscal year ended December
31, 2007, filed February 29, 2008, Commission File No.
1-13647†*
|
|
10.185
|
Amendment
to Notice of Election Regarding Payment of Director’s Fees for Calendar
Year 2008 dated December 20, 2007 executed by John C. Pope, filed as the
same numbered exhibit with DTG’s Form 10-K for fiscal year ended December
31, 2007, filed February 29, 2008, Commission File No.
1-13647†*
|
- 102
-
|
10.188
|
Indemnification
Agreement dated as of April 8, 2008 between Dollar Thrifty Automotive
Group, Inc. and Kimberly D. Paul, Vice President and Chief Accounting
Officer, filed as the same numbered exhibit with DTG’s Form 8-K, filed
April 14, 2008, Commission File No. 1-13647†*
|
|
10.190
|
Third
Amendment to Amended and Restated Long-Term Incentive Plan and Director
Equity Plan, filed as the same numbered exhibit with DTG’s Form 8-K, filed
May 21, 2008, Commission File No. 1-13647†*
|
|
|
10.191
|
Indemnification
Agreement dated as of May 23, 2008 between Dollar Thrifty Automotive
Group, Inc. and Scott L. Thompson, Senior Executive Vice President and
Chief Financial Officer, filed as the same numbered exhibit with DTG’s
Form 8-K, filed May 28, 2008, Commission File No. 1-13647†*
|
|
|
10.192
|
First
Amendment to Credit Agreement dated as of July 9, 2008 among Dollar
Thrifty Automotive Group, Inc., as borrower, Deutsche Bank Trust Company
Americas, as administrative agent, and various financial institutions as
are party to the Credit Agreement, filed as the same numbered exhibit with
DTG’s Form 8-K, filed July 10, 2008, Commission File No.
1-13647*
|
|
|
10.200
|
Second
Amendment to Credit Agreement dated as of September 29, 2008 among Dollar
Thrifty Automotive Group, Inc., as borrower, Deutsche Bank Trust Company
Americas, as administrative agent, and various financial institutions as
are party to the Credit Agreement, filed as the same numbered exhibit with
DTG’s Form 8-K, filed September 30, 2008, Commission File No.
1-13647*
|
|
|
10.201
|
Dollar
Thrifty Automotive Group, Inc. 2008/2009 Executive Retention Bonus Plan,
filed as the same numbered exhibit with DTG’s Form 10-Q for the quarterly
period ended September 30, 2008, filed November 5, 2008, Commission File
No. 1-13647†*
|
|
|
10.203
|
Third
Amendment to Credit Agreement dated, as of November 17, 2008 and effective
as of November 24, 2008, among Dollar Thrifty Automotive Group, Inc., as
borrower, Deutsche Bank Trust Company Americas, as administrative agent,
and various financial institutions as are party thereto, filed as the same
numbered exhibit with DTG’s Form 8-K, filed November 24, 2008, Commission
File No. 1-13647*
|
|
|
10.204
|
Second
Amended and Restated Employment Continuation Plan for Key Employees of
Dollar Thrifty Automotive Group, Inc. dated as of December 9, 2008, filed
as the same numbered exhibit with DTG’s Form 8-K, filed December 15, 2008,
Commission File No. 1-13647†*
|
|
|
10.205
|
Employment
Continuation Agreement dated December 9, 2008 between the Company and
Scott L. Thompson, filed as the same numbered exhibit with DTG’s Form 8-K,
filed December 15, 2008, Commission File No. 1-13647†*
|
|
- 103
-
|
10.206
|
Fourth
Amendment to Credit Agreement dated as of February 4, 2009 among Dollar
Thrifty Automotive Group, Inc., as borrower, Deutsche Bank Trust Company
Americas, as administrative agent, and various financial institutions as
are party thereto, filed as the same numbered exhibit with DTG’s Form 8-K,
filed February 10, 2009, Commission File No. 1-13647*
|
|
10.207
|
Fifth
Amendment to Credit Agreement dated as of February 25, 2009 among Dollar
Thrifty Automotive Group, Inc., as borrower, Deutsche Bank Trust Company
Americas, as administrative agent, and various financial institutions as
are party thereto, filed as the same numbered exhibit with DTG’s Form 8-K,
filed February 25, 2009, Commission File No. 1-13647*
|
|
10.210
|
Umbrella
409A Amendment for Performance Shares effective December 9, 2008, filed as
the same numbered exhibit with DTG’s Form 10-K for the fiscal year ended
December 31, 2008, filed March 3, 2009, Commission File No.
1-13647†*
|
|
10.211
|
Amended
and Restated Deferred Compensation Plan dated December 9, 2008, filed as
the same numbered exhibit with DTG’s Form 10-K for the fiscal year ended
December 31, 2008, filed March 3, 2009, Commission File No.
1-13647†*
|
|
10.212
|
Second
Amended and Restated Long-Term Incentive Plan and Director Equity Plan (As
Amended and Restated Effective December 9, 2008), filed as the same
numbered exhibit with DTG’s Form 10-K for the fiscal year ended December
31, 2008, filed March 3, 2009, Commission File No. 1-13647†*
|
|
10.213
|
Amended
and Restated Retirement Plan effective as of December 9, 2008, filed
as the same numbered exhibit with DTG’s Form 10-K for the fiscal year
ended December 31, 2008, filed March 3, 2009, Commission File No.
1-13647†*
|
|
10.214
|
2009
Deferred Compensation Plan effective January 1, 2009, filed as the same
numbered exhibit with DTG’s Form 10-K for the fiscal year ended December
31, 2008, filed March 3, 2009, Commission File No. 1-13647†*
|
|
10.215
|
Dollar
Thrifty Automotive Group, Inc. Summary of Non-employee Director’s
Compensation effective January 1, 2009 Until Further Modified, filed as
the same numbered exhibit with DTG’s Form 10-K for the fiscal year ended
December 31, 2008, filed March 3, 2009, Commission File No.
1-13647†*
|
|
10.216
|
Vehicle
Policy for Directors Restated effective January 29, 2009, filed as
the same numbered exhibit with DTG’s Form 10-K for the fiscal year ended
December 31, 2008, filed March 3, 2009, Commission File No.
1-13647†*
|
|
10.217
|
Form
of Indemnification Agreement between the Company and the applicable
employee, filed as the same numbered exhibit with DTG’s Form 10-K for the
fiscal year ended December 31, 2008, filed March 3, 2009, Commission File
No. 1-13647†*
|
|
10.218
|
Vehicle
Supply Agreement dated as of February 9, 2009 between Ford Motor Company
and DTG (portions of the exhibit have been omitted pursuant to a request
for confidential treatment), filed as the same numbered exhibit with DTG’s
Form 10-K for the fiscal year ended December 31, 2008, filed March 3,
2009, Commission File No. 1-13647*
|
- 104
-
|
10.219
|
First
Amendment to Second Amended and Restated Long-Term Incentive Plan and
Director Equity Plan effective as of March 31, 2009, filed as the same
numbered exhibit with DTG’s Form 10-Q for the quarterly period ended March
31, 2009, filed May 6, 2009, Commission File No. 1-13647†*
|
|
10.220
|
Dollar
Thrifty Automotive Group, Inc. 2009 Executive Incentive Compensation Plan,
filed as the same numbered exhibit with DTG’s Form 10-Q for the quarterly
period ended March 31, 2009, filed May 6, 2009, Commission File No.
1-13647†*
|
|
10.221
|
Second
Amendment to Second Amended and Restated Long-Term Incentive Plan and
Director Equity Plan, effective March 16, 2009, filed as the same numbered
exhibit with DTG’s Form 8-K filed May 20, 2009, Commission File No.
1-13647†*
|
|
10.222
|
Letter
Agreement, dated as of June 2, 2009, between Dollar Thrifty Automotive
Group, Inc., and Deutsche Bank Trust Company Americas, as letter of credit
Issuer, relating to the Credit Agreement, dated as of June 15, 2007, filed
as the same numbered exhibit with DTG’s Form 8-K filed June 8, 2009,
Commission File No. 1-13647*
|
|
10.223
|
Sixth
Amendment to Credit Agreement, dated as of June 25, 2009 and effective as
of June 26, 2009, among Dollar Thrifty Automotive Group, Inc., as
borrower, Deutsche Bank Trust Company Americas, as administrative agent
and letter of credit issuer, and various financial institutions as are
party thereto, filed as the same numbered exhibit with DTG’s Form 8-K
filed June 30, 2009, Commission File No. 1-13647*
|
|
10.224
|
Form
of Restricted Stock Unit Grant Agreement Between the Company and the
applicable employee, filed as the same numbered exhibit with DTG’s Form
10-Q for the quarterly period ended June 30, 2009, filed August 6, 2009,
Commission File No. 1-13647†*
|
|
10.225
|
First
Amendment effective as of July 22, 2009, to the Vehicle Supply Agreement
dated as of February 9, 2009, between Ford Motor Company and DTG (portions
of the exhibit have been omitted pursuant to a request for confidential
treatment) , filed as the same numbered exhibit with DTG’s Form 10-Q for
the quarterly period ended June 30, 2009, filed August 6, 2009, Commission
File No. 1-13647*
|
|
10.226
|
Seventh
Amendment to Credit Agreement, dated as of August 7, 2009, among Dollar
Thrifty Automotive Group, Inc., as borrower, Deutsche Bank Trust Company
Americas, as administrative agent and letter of credit issuer, and various
financial institutions as are party thereto, filed as the same numbered
exhibit with DTG’s Form 8-K, filed August 11, 2009, Commission File No.
1-13647*
|
|
10.227
|
Vehicle
Supply Agreement dated as of August 4, 2009 between Chrysler Group LLC and
DTG, filed as the same numbered exhibit with DTG’s Form 10-Q for the
quarterly period ended September 30, 2009, filed October 26, 2009,
Commission File No. 1-13647*
|
|
10.228
|
Vehicle
Purchase Agreement dated December 15, 2009 between General Motors LLC and
Dollar Thrifty Automotive Group, Inc. (portions of the exhibit have been
omitted pursuant to a request for confidential treatment)**
|
- 105
-
|
10.229
|
Form
of Director's Deferred Compensation Election between the Company
and the applicable director†**
|
|
10.230
|
Dollar
Thrifty Automotive Group, Inc. Summary of Non-employee Director’s
Compensation effective January 1, 2010 Until Further Modified†**
|
|
10.231
|
Form
of Restricted Stock Units Grant Agreement between Dollar Thrifty
Automotive Group, Inc. and the applicable director†**
|
|
10.232
|
Dollar
Thrifty Automotive Group, Inc. 2010 Executive Incentive Compensation
Plan†**
|
|
10.233
|
Second
Amendment effective as of February 24, 2010, to the Vehicle Supply
Agreement dated as of February 9, 2009, between Ford Motor Company and DTG
(portions of the exhibit have been omitted pursuant to a request for
confidential treatment)**
|
| 21 |
Subsidiaries
of DTG**
|
|
23.40
|
Consent
of HoganTaylor LLP regarding Registration Statement on Form S-8,
Registration No. 333-89189, filed as the same numbered exhibit with Dollar
Thrifty Automotive Group, Inc. Retirement Savings Plan’s Form 11-K for the
fiscal year ended December 31, 2008, filed June 24, 2009, Commission File
No. 1-13647*
|
|
23.41 |
Consent
of Deloitte & Touche LLP regarding DTG’s Forms S-8, Registration No.
333-79603, Registration No. 333-89189, Registration No. 333-33144,
Registration No. 333-33146, Registration No. 333-50800, Registration No.
333-128714, Registration No. 333-152401 and Registration No. 333-161509
and Form S-3, Registration No. 333-161027** |
|
31.63
|
Certification
by the Chief Executive Officer Pursuant to Section 302 of the
Sarbanes-Oxley Act of 2002**
|
|
31.64
|
Certification
by the Chief Financial Officer Pursuant to Section 302 of the
Sarbanes-Oxley Act of 2002**
|
|
32.63
|
Certification
by the Chief Executive Officer Pursuant to Section 906 of the
Sarbanes-Oxley Act of 2002**
|
|
32.64
|
Certification
by the Chief Financial Officer Pursuant to Section 906 of the
Sarbanes-Oxley Act of 2002**
|
__________
† Denotes
management contact or compensatory plan
* Incorporated
by reference
** Filed
herewith
(b) Filed
Exhibits
The response to this item is submitted
as a separate section of this report.
- 106
-
Pursuant
to the requirements of Section 13 or 15(d) of the Securities Exchange Act of
1934, the registrant has duly caused this report to be signed on its behalf by
the undersigned, thereunto duly authorized.
Date: March
4,
2010 DOLLAR
THRIFTY AUTOMOTIVE GROUP, INC.
|
By:
|
/s/ SCOTT L.
THOMPSON
|
|
|
Name:
|
Scott
L. Thompson
|
|
|
Title:
|
President
and Principal Executive
Officer
|
Pursuant
to the requirements of the Securities Exchange Act of 1934, this report has been
signed below by the following persons on behalf of the registrant and in the
capacities and on the dates indicated.
|
Name
|
Title
|
Date
|
|
/s/ SCOTT L.
THOMPSON
Scott
L. Thompson
|
Chief
Executive Officer,
President
and Director
|
March
4, 2010
|
|
/s/ H. CLIFFORD BUSTER
III
H.
Clifford Buster III
|
Chief
Financial Officer,
Senior
Executive Vice President
and
Principal Financial Officer
|
March
4, 2010
|
|
/s/ KIMBERLY D.
PAUL
Kimberly
D. Paul
|
Chief
Accounting Officer,
Vice
President and
Principal
Accounting Officer
|
March
4, 2010
|
|
/s/ THOMAS P. CAPO
Thomas
P.
Capo
|
Director
and
Chairman
of the Board
|
March
4, 2010
|
|
/s/ MARYANN N.
KELLER
Maryann
N. Keller
|
Director
|
March
4, 2010
|
|
/s/ EDWARD C.
LUMLEY
Edward
C. Lumley
|
Director
|
March
4, 2010
|
|
/s/ RICHARD W. NEU
Richard
W. Neu
|
Director
|
March
4, 2010
|
|
/s/ JOHN C. POPE
John
C. Pope
|
Director
|
March
4, 2010
|
- 107
-
Exhibit
Number Description
|
10.228
|
Vehicle
Purchase Agreement dated December 15, 2009 between General Motors LLC and
Dollar Thrifty Automotive Group, Inc. (portions of the exhibit have been
omitted pursuant to a request for confidential treatment)
|
|
|
10.229
|
Form
of Directors Deferred Compensation Election between the Company and its
applicable directors
|
|
|
10.230
|
Dollar
Thrifty Automotive Group, Inc. Summary of Non-employee Director’s
Compensation effective January 1, 2010 Until Further Modified
|
|
|
10.231
|
Form
of Restricted Stock Units Grant Agreement between Dollar Thrifty
Automotive Group, Inc. and the applicable director
|
|
|
10.232
|
Dollar
Thrifty Automotive Group, Inc. 2010 Executive Incentive Compensation
Plan
|
|
|
10.233
|
Second
Amendment effective as of February 24, 2010, to the Vehicle Supply
Agreement dated as of February 9, 2009, between Ford Motor Company and DTG
(portions of the exhibit have been omitted pursuant to a request for
confidential treatment)
|
|
|
21
|
Subsidiaries
of DTG
|
|
|
23.41
|
Consent
of Deloitte & Touche LLP regarding DTG’s Forms S-8, Registration No.
333-79603, Registration No. 333-89189, Registration No. 333-33144,
Registration No. 333-33146, Registration No. 333-50800, Registration No.
333-128714, Registration No. 333-152401 and Registration No. 333-161509
and Form S-3, Registration No. 333-161027
|
|
|
31.63
|
Certification
by the Chief Executive Officer Pursuant to Section 302 of the
Sarbanes-Oxley Act of 2002
|
|
|
31.64
|
Certification
by the Chief Financial Officer Pursuant to Section 302 of the
Sarbanes-Oxley Act of 2002
|
|
|
32.63
|
Certification
by the Chief Executive Officer Pursuant to Section 906 of the
Sarbanes-Oxley Act of 2002
|
|
|
32.64
|
Certification
by the Chief Financial Officer Pursuant to Section 906 of the
Sarbanes-Oxley Act of 2002
|
|
- 108
-