Attached files
Table of Contents
UNITED STATES
SECURITIES AND EXCHANGE COMMISSION
Washington, D.C. 20549
FORM 10-K
| x | ANNUAL REPORT PURSUANT TO SECTION 13 OR 15(d) OF THE SECURITIES EXCHANGE ACT OF 1934 |
For the fiscal year ended December 31, 2009
OR
| ¨ | TRANSITION REPORT PURSUANT TO SECTION 13 OR 15(d) OF THE SECURITIES EXCHANGE ACT OF 1934 |
For the transition period from to
Commission file number 0-18561
AMERICANWEST BANCORPORATION
(Exact name of registrant as specified in its charter)
| Washington | 91-1259511 | |
| (State or other jurisdiction of incorporation) |
(IRS Employer Identification No.) |
41 West Riverside Avenue, Suite 400
Spokane, Washington 99201
(Address of principal executive offices, including zip code)
Registrant’s telephone number, including area code (509) 467-6993
Securities registered pursuant to Section 12(b) of the Act:
| Title of each class: |
Name of each exchange on which registered: | |
| None |
Securities registered pursuant to section 12(g) of the Act:
Common Stock, no par value
Indicate by a check mark if the registrant is a well-known seasoned issuer, as defined in Rule 405 of the Securities Act. YES ¨ NO x
Indicate by a check mark if the registrant is not required to file reports pursuant to Section 13 or 15(d) of the Exchange Act. YES ¨ NO x
Indicate by check mark whether the registrant (1) has filed all reports required to be filed by Section 13 or 15 (d) of the Securities Exchange Act of 1934 during the preceding 12 months (or for such shorter period that the registrant was required to file such reports), and (2) has been subject to such filing requirements for the past 90 days. YES x NO ¨
Indicate by a check mark whether the registrant has submitted electronically and posted on its corporate Website, if any, every Interactive Data File required to be submitted and posted pursuant to Rule 405 of Regulation S-T (§ 229.405 of this chapter) during the preceding 12 months (or for such shorter period that the registrant was required to submit and post such files). YES ¨ NO ¨
Indicate by check mark if disclosure of delinquent filers pursuant to Item 405 of Regulation S-K is not contained herein, and will not be contained, to the best of registrant’s knowledge, in definitive proxy or information statements incorporated by reference in Part III of this Form 10-K or any amendments to this Form 10-K. ¨
Indicate by check mark whether the registrant is a “large accelerated filer,” “an accelerated filer,” or a “smaller reporting company” (as defined in Exchange Act Rule 12b-2). Large accelerated filer ¨ Accelerated filer ¨ Non-accelerated filer ¨ Smaller reporting company x
Indicate by check mark whether the registrant is a shell company (as defined by Rule 12b-2 of the Exchange Act. YES ¨ NO x
The aggregate market value of the common stock held by non-affiliates of the registrant is approximately $9.4 million based on the June 30, 2009 closing price of the registrant’s common stock as quoted on the NASDAQ Global Select Market of $0.56.
The number of shares of the registrant’s common stock outstanding at February 25, 2010 was 17,216,288.
DOCUMENTS INCORPORATED BY REFERENCE
| Documents of the Registrant |
Form 10-K Reference Locations | |
| Portions of the Proxy Statement for the 2010 |
PART III |
Table of Contents
ANNUAL REPORT ON FORM 10-K FOR THE FISCAL YEAR
ENDED DECEMBER 31, 2009
| Page | ||||||
| Item 1. | Business | 1 | ||||
| Item 1A. | Risk Factors | 14 | ||||
| Item 1B. | Unresolved Staff Comments | 21 | ||||
| Item 2. | Properties | 21 | ||||
| Item 3. | Legal Proceedings | 21 | ||||
| Item 4. | 21 | |||||
| Item 5. | 22 | |||||
| Item 6. | Selected Financial Data | 24 | ||||
| Item 7. | Management’s Discussion and Analysis of Financial Condition and Results of Operations |
25 | ||||
| Item 7A. | Quantitative and Qualitative Disclosures About Market Risk | 44 | ||||
| Item 8. | Financial Statements and Supplementary Data | 48 | ||||
| Item 9. | Changes in and Disagreements with Accountants on Accounting and Financial Disclosure |
90 | ||||
| Item 9A. | Controls and Procedures | 90 | ||||
| Item 9B. | Other Information | 90 | ||||
| Item 10. | Directors, Executive Officers and Corporate Governance | 91 | ||||
| Item 11. | Executive Compensation | 91 | ||||
| Item 12. | Security Ownership of Certain Beneficial Owners and Management and Related Stockholder Matters |
91 | ||||
| Item 13. | Certain Relationships, Related Transactions and Director Independence | 91 | ||||
| Item 14. | Principal Accountant Fees and Services | 92 | ||||
| Item 15. | Exhibits and Financial Statement Schedules | 93 | ||||
| 95 | ||||||
Table of Contents
Forward Looking Statements.
Certain matters discussed or incorporated by reference in this Annual Report on Form 10-K including, but not limited to, matters described in Item 7, “Management’s Discussion and Analysis of Financial Condition and Results of Operation,” are forward-looking statements within the meaning of the Private Securities Litigation Reform Act of 1995 (PSLRA). Such forward-looking statements may include statements or forecasts about the Company’s financial condition and results of operations, expectations for future financial performance, and assumptions for those forecasts and expectations. The Company makes forward-looking statements about potential problem loans, cash flows, strategic initiatives, capital initiatives, and the adequacy of the allowance for loan losses. Actual results might differ significantly from the Company’s forecasts and expectations due to several factors. Some of these factors include, but are not limited to, impact of the current national and regional economy (including real estate values), borrower financial capacity in the Company’s market, changes in loan portfolio composition, the ability of the Company to comply with the FDIC’s Order to Cease and Desist and Supervisory Prompt Corrective Action Directive and Federal Reserve Written Agreement, the Company’s ability to raise additional regulatory capital and the dilutive effect of capital raising, the Company’s access to liquidity sources, the Company’s ability to attract and retain quality customers, interest rate movements and the impact on net interest margins such movements may cause, the Company’s products and services, the Company’s ability to attract and retain qualified employees, regulatory changes, and competition with other banks and financial institutions. Words such as “targets,” “expects,” “anticipates,” “believes,” and other similar expressions, and future or conditional verbs such as “will,” “may,” “should,” “would,” and “could,” are intended to identify such forward-looking statements. Readers should not place undue reliance on the forward-looking statements, which reflect management’s view only as of the date hereof. The Company undertakes no obligation to publicly revise these forward-looking statements to reflect subsequent events or circumstances. This statement is included for the express purpose of protecting the Company under PSLRA’s safe harbor provisions.
AmericanWest Bancorporation
AmericanWest Bancorporation, which was formed in 1983, is a Washington corporation registered as a bank holding company under the Bank Holding Company Act of 1956, and is headquartered in Spokane, Washington. The Company’s wholly-owned subsidiary is AmericanWest Bank (Bank), a Washington state chartered bank that operates in Eastern and Central Washington, Northern Idaho and in Utah doing business as Far West Bank. Unless otherwise indicated, reference to “the Company” includes the Bank and its Far West Bank division. The Company’s unconsolidated information will be referred to as that of the Parent Company. At December 31, 2009, the Company had total assets of $1.7 billion, net loans of $1.2 billion, deposits of $1.5 billion and stockholders’ equity of $19.6 million. The Company also has four statutory trust subsidiaries which were formed for the sole purpose of issuing trust preferred securities.
The discussion in this Annual Report of the Company and its financial statements reflect the Company’s acquisitions of Far West Bancorporation and its subsidiary on April 1, 2007 and Columbia Trust Bancorp and its subsidiaries on March 15, 2006. The operating results of these acquisitions are reported in the consolidated financial results from the dates the acquisitions were completed.
Available Information
The Company’s internet address is www.awbank.net. Copies of the following documents, free of charge, are available from the Company’s website by using the “Investor Relations” hyperlink on that website:
| • | Annual Reports on Form 10-K; |
| • | Quarterly Reports on Form 10-Q; and |
| • | Current Reports on Form 8-K. |
1
Table of Contents
The Company makes these reports and certain other information that it files with the Securities and Exchange Commission (SEC) available on the Company’s website as soon as reasonably practicable after electronically filing them with or furnishing them to the SEC. These and other SEC filings of the Company are also available, free of charge, from the SEC on its website at www.sec.gov. The information contained on the Company’s website is not incorporated by reference into this document and should not be considered a part of this Annual Report. The Company’s website address is included in this document as an inactive textual reference only.
Recent Events
On February 24, 2010, the Federal Deposit Insurance Corporation (FDIC) issued a Supervisory Prompt Corrective Action Directive to the Bank. Refer to the Supervision and Regulation section for further discussion.
On December 18, 2009, Rick E. Shamberger tendered his resignation as Executive Vice President and Chief Credit Officer of the Bank effective February 12, 2010. The Bank has initiated a search for his replacement and in the interim the duties and responsibilities will be assigned to other officers of the Bank and to a consultant that has been working with the Bank for the past year.
On September 15, 2009, the Company entered into a Written Agreement with the Federal Reserve Bank of San Francisco. Refer to the Supervision and Regulation section for further discussion.
On May 8, 2009, the Bank entered into a Stipulation and Consent to the Issuance of an Order to Cease and Desist with the FDIC and the Washington State Department of Financial Institution, Division of Banks. Refer to the Supervision and Regulation section for further discussion.
Products and Services
The Bank’s business consists mainly of gathering deposits and providing loans to enable its customers to meet their financial objectives.
The Bank offers a variety of deposit accounts designed to attract both short-term and long-term deposits from its retail and business customers. These accounts include checking accounts, negotiable order of withdrawal (NOW) accounts, money market demand accounts (MMDA), savings accounts and time deposits. Interest bearing accounts earn interest at rates established by the Bank’s management based on competitive market factors, regulatory compliance requirements, and management’s desire to increase or decrease certain deposit types or maturities of deposits based on anticipated future funding needs. The Bank places significant emphasis on attracting low cost-of-funds deposits through targeted marketing for checking and money market balances. During 2008 and part of 2009, the Bank emphasized higher costing certificate of deposit accounts to increase the overall liquidity position of the Bank. Refer to the restrictions discussed in the Supervision and Regulation section regarding pricing of deposits.
The Bank offers numerous services that provide customers convenient access and have a positive impact on the Bank’s non-interest income through fee generation. Commercial services include ACH origination, merchant bankcard services, remote capture, sweep accounts and currency services. Additional services offered to both consumers and business customers include ATM and debit cards, wire transfers, official checks, online banking and bill payment, safe deposit boxes and night deposit boxes. In addition, the Bank generates non-interest income by offering both consumer and business credit card and merchant products on an affinity basis. Prior to the sale of the credit card portfolio acquired from Far West Bank in 2008, credit card products were also a source of non-interest income.
The Bank’s loan portfolio consists of the classifications described below. The majority of the loans held by the Bank were to borrowers within the Bank’s principal market areas.
2
Table of Contents
Commercial Real Estate Loans. Commercial real estate loans primarily consist of loans extended to investors or occupying owners to purchase or refinance commercial and multifamily properties. These loans are secured by real estate, generally mature in one to ten years and can have fixed or adjustable rates. Commercial real estate loans involve risks associated with real estate values, tenant performance on lease arrangements and interest rate volatility.
Construction Loans. Construction loans include commercial construction and residential construction. Construction loans are secured by real estate and the project under construction and generally mature in one to two years. Construction loans may involve additional risks as loan funds are collateralized by the project under construction, which is of uncertain value prior to completion. Additional risks associated with speculative construction lending include the borrower’s ability to complete the construction process on time and within budget, the leasing or sale of the project at projected lease or sale rates within expected absorption periods, and the economic risks associated with the real estate collateral including the potential of interest rate volatility. The Bank’s policies generally require that a permanent financing commitment be in place before a commercial construction loan is made to an individual borrower. Delays may arise from labor problems, material shortages, and other unpredictable contingencies. It is important to evaluate accurately the total loan funds required to complete a project and related loan-to-value and cost ratios. Due to these factors, the analysis of prospective construction loan projects require an expertise that is different in significant respects from the expertise required for other commercial or residential real estate lending. The Bank’s underwriting criteria are designed to evaluate and minimize the risks of each construction loan. Among other things, the Bank’s management considers evidence of the availability of permanent financing for the borrower, the reputation of the borrower, the amount of the borrower’s equity in the project, the independent appraisal and review of cost estimates, the pre-construction sale and leasing information, and the cash flow projections of the borrower.
Land Development and Other Land Loans. Land development loans include commercial and residential developments. No residential development loans have been originated since the third quarter of 2007. In addition, in accordance with the Stipulation and Consent to the Issuance of an Order to Cease and Desist, entered into on May 8, 2009, the Bank is prohibited from extending any additional land development loans except in certain limited situations. Land development loans are generally subject to additional risks as loan funds are collateralized by land that may be in various stages of development, with the highest and best value not realized until completion of the development. Additional risks associated with land development lending include the borrower’s ability to complete the construction of infrastructure and improvements on time and within budget, the leasing or sale of the project at projected lease or sale rates within expected absorption periods, and the economic risks associated with the real estate collateral including the potential of interest rate volatility. Both land development and land loans are often dependent on the demand for housing, which has suffered significant declines in the Bank’s market area since 2006. Absent demand for finished product, these loans have significant risk of default. The risks associated with lending on land parcels include failure to obtain appropriate improvement entitlements, inability to convert the loan to development and construction financing, devaluation of real estate and increased interest rates.
Residential Real Estate Loans. Residential mortgage loans include various types of loans for which residential real property is held as collateral. These loans include adjustable and fixed rate first mortgage loans secured by one to four family residential properties, second mortgage loans secured by one to four family residential properties and home equity lines of credit. Mortgage loans that are held in portfolio typically mature or reprice in one to five years and require payments on amortization schedules ranging from one year to 30 years shortly after origination. The Bank sells most of its fixed rate real estate mortgage loans with maturities of more than ten years. The risks associated with real estate mortgage lending include economic changes, including devaluation of real estate values, decreasing rental rates and increased interest rates. Loans are generally made to well-qualified applicants meeting secondary market underwriting criteria.
Commercial and Industrial Loans. Commercial loans primarily consist of loans to businesses for various purposes, including term loans, revolving lines of credit, equipment financing loans and letters of credit. These loans generally mature within one to five years, have adjustable rates and are typically secured by inventory,
3
Table of Contents
accounts receivable or equipment, although certain loans are unsecured. Commercial lending risk results from dependence on borrower income production for future repayment, capture of proceeds from conversion of inventory and accounts receivable, and, in certain circumstances, the lack of tangible collateral. Commercial loans are underwritten based on the financial strength and the repayment ability of the borrower, as well as the value of any collateral securing the loans. Commercial lending operations rely on a strong credit culture that combines prudent credit policies and individual lender accountability.
Agricultural Loans. Agricultural loans primarily consist of farm loans to finance operating expenses, purchase equipment and finance agricultural land acquisition. Loans to finance operating expenses generally mature within one year, have adjustable rates and are secured by farm real estate, equipment, crops or livestock. Equipment loans generally mature within three to five years and carry either a variable or fixed rate of interest and are secured with equipment, crops or real estate. Real estate loans are secured by real estate, generally mature in five to ten years and carry a fixed or adjustable rate. Since agricultural loans present risks not associated with other types of lending, such as weather, in most cases the Bank grants such loans only to agricultural producers that carry crop insurance, thereby mitigating the risk of loss attributable to a crop failure caused by weather factors. Other risks include crop value, commodity prices and interest rate volatility.
Installment and Other Loans. Installment and other loans are primarily automobile and personal loans, otherwise known as consumer loans. These loans generally have maturities of five years or less, and are offered at adjustable and fixed interest rates. Prior to the sale of the bankcard portfolio in 2008, which was sold to a third party at a gain of $589 thousand, these loans were included in the installment and other loan category. Consumer lending may involve special risks, including decreases in the value of collateral and transaction costs associated with foreclosure and repossession.
Principal Market Area and Competition
The Bank’s financial centers are located in the four largest metropolitan areas in Eastern and Central Washington (Spokane, Yakima, Walla Walla and the Tri-Cities area, comprised of Pasco, Kennewick and Richland), and in principally suburban and rural communities in Eastern and Central Washington, Northern Idaho and Utah.
The Bank competes primarily with large national and regional banks, community banks, credit unions, savings and loans, mortgage companies and other financial service providers. Management believes that its competitive position has been strengthened by its fundamental community banking model with strong local connections, community involvement and an emphasis on relationship banking.
4
Table of Contents
The following table presents the Bank’s market share percentage and rank for total deposits in each county where it has financial center operations. All information in the table was obtained from SNL Financial of Charlottesville, Virginia, which compiles deposit data published by the FDIC as of June 30, 2009 and updates the information for any bank closures and mergers completed subsequent to the reporting date. The number of financial centers is as of December 31, 2009.
| Utah | Number of Financial Centers | ||||||
| County |
Market Share |
Market Rank |
|||||
| Carbon |
17.1 | % | 3 | 1 | |||
| Juab |
42.4 | % | 2 | 1 | |||
| Salt Lake |
0.1 | % | 18 | 3 | |||
| Sanpete |
29.0 | % | 2 | 4 | |||
| Utah |
3.9 | % | 6 | 7 | |||
| Washington |
1.8 | % | 9 | 1 | |||
| Wayne |
100.0 | % | 1 | 1 | |||
| Total |
18 | ||||||
Employees
As of December 31, 2009, the Company had 531 full-time equivalent employees, none of which are covered by a collective bargaining agreement. Management believes employee relations are currently good.
Supervision and Regulation
Laws and regulations governing the banking industry are extensive, and those applicable to the Company and the Bank are primarily intended to protect depositors of the Bank and not shareholders. Aspects of the Company’s public disclosure, corporate governance principles, internal control environment and the roles of auditors and counsel are subject to the Sarbanes-Oxley Act of 2002 and related regulations as well as federal securities laws and the rules and regulations of the Securities and Exchange Commission (SEC) and NASDAQ listing standards. Proposals to change these laws and regulations are frequently introduced in U.S. Congress, in state legislatures and by various bank regulatory agencies. Changes in applicable laws and regulations or in the policies of banking and other government regulators may have a material effect on the business and prospects of
5
Table of Contents
the Company or the Bank. The likelihood and timing of any such proposals or legislation and the impact they might have on the Company or the Bank cannot be determined.
Since 2008, federal regulators and agencies responded to the significant disruption in financial markets with a number of initiatives. Substantial regulatory and legislative initiates, including a comprehensive overhaul of the bank and holding company regulatory system have been discussed. Proposals for additional legislation and revamped regulation of the financial services industry are expected to be introduced in the U.S. Congress and in state legislatures. Any such action could have a materially adverse effect on the business, financial condition and results of operations of the Company.
The U.S. Department of the Treasury (Treasury), the Board of Governors of the Federal Reserve System and the Federal Deposit Insurance Corporation (FDIC) took steps to enhance the liquidity support available to financial institutions. Under the Temporary Liquidity Guarantee Program, the FDIC agreed to temporarily guarantee certain senior unsecured debt of FDIC-insured institutions (Debt Guaranty Program) and to temporarily guarantee deposits in certain transaction accounts of FDIC-insured institutions or branches (Transaction Account Guaranty Program). The Bank is participating in the Transaction Account Guaranty Program and has incurred fees assessed in connection with such programs.
On October 3, 2008, the Emergency Economic Stabilization Act of 2008 (introduced as the Troubled Asset Relief Program or TARP) was enacted. Under the TARP Capital Purchase Program the Treasury injected capital into many financial institutions and is also authorized to purchase troubled assets.
During the fourth quarter of 2008, the Company submitted an application to issue $57 million of preferred stock under the TARP Capital Purchase Program, with an indication that a significant private equity co-investment would be concurrently obtained. On April 28, 2009, the Company submitted a letter to the FDIC, which serves as the primary regulator for the Bank, indicating its intention to withdraw its TARP application. The decision to withdraw the application was based upon a number of factors, including the expectation that the required private equity co-investment would not be consummated prior to the deadline for the processing of final TARP applications.
As of the date of this report, the Company and its financial advisor are continuing efforts to obtain approximately $100 million or more in private capital commitments. There can be no assurance the Company will be successful in obtaining additional capital through a private placement or public offering.
As a result of an interim examination, effective August 8, 2008, the Bank was subject to a Supervisory Directive (Directive) of the Washington State Department of Financial Institutions, Division of Banks (DFI). The Directive required the Bank to provide periodic liquidity and credit quality reports, update the DFI regarding the status of liquidity planning and previously announced capital raising initiatives, notify the DFI on significant changes in management and financial condition, retain a permanent Chief Executive Officer, and seek prior written consent of the DFI before paying dividends. On September 17, 2009, the Bank received written notification that the Directive was rescinded, because the Directive had been effectively replaced by the Order to Cease and Desist discussed below.
On May 8, 2009, the Bank entered into a Stipulation and Consent to the Issuance of an Order to Cease and Desist (Stipulation) with the FDIC and DFI that was issued in connection with a routine regulatory examination of the Bank completed during December 2008 (Examination). Pursuant to the Stipulation, the FDIC and the DFI issued an Order to Cease and Desist (Order) on May 11, 2009. Neither the Bank nor the Company admitted any wrongdoing and no monetary penalties were imposed in connection with the Order. Copies of the Stipulation and the Order were included as Exhibits 10.1 and 10.2 of the Form 10-Q filed on May 15, 2009.
On February 26, 2010, the Bank received from the FDIC a Supervisory Prompt Corrective Action Directive (PCA Directive) directing the Bank to recapitalize within 30 days of receipt, and reiterating various requirements already imposed on the Bank by the Order. The PCA Directive informed the Bank that its Capital Restoration Plan dated July 2, 2009 was unacceptable.
6
Table of Contents
The Order and the PCA Directive requires the Bank to:
| • | Recapitalize the Bank. The Order required the Bank to increase its Tier 1 leverage ratio to 10.0% by September 9, 2009. The PCA Directive directed the Bank to sell its securities or obligations so that the Bank will be adequately capitalized or accept an offer to be acquired by or combine with another financial institution, by March 28, 2010. The Bank did not meet the Tier 1 leverage ratio requirement by the prescribed deadline, and management and its financial advisors are continuing aggressive efforts with respect to enhancing the Bank’s regulatory capital ratios through sale of new equity securities to private investors and divestiture of selected assets. Prior to the receipt of the PCA Directive, the Company engaged an additional investment banker to enhance its continuing efforts. |
| • | Retain qualified senior executive officers, including a chief financial officer and a chief credit officer, with written authority from the Board of Directors to implement the provisions of the Order, and obtain an independent study of the Bank’s lending and credit functions to determine if additional personnel were necessary. The independent study was completed on June 15, 2009 and a related plan to implement its recommendations was approved by the Board of Directors on July 30, 2009. A copy of the study and the plan were furnished to the FDIC and DFI. The Bank believes that it has the appropriate management and lending and credit personnel, as required by the Order, but with the recent departure of Mr. Shamberger the Bank intends to seek qualified internal and external applicants for the Chief Credit Officer position. |
| • | Provide 30 days’ prior notice to the FDIC and the DFI of the addition of any new member on the Board of Directors or the employment of any new senior executive officer. The Bank has not added anyone to the Board of Directors or employed any new senior executive officer since the effective date of the Order. |
| • | Not pay any bonuses to or increase the compensation of any director or senior officer of the Bank. The Bank has no plans to increase compensation of directors or senior officers. |
| • | Refrain from paying cash dividends without the prior written consent of the FDIC and the DFI. The Bank has not paid any cash dividends since the first quarter of 2008. |
| • | Maintain and implement a policy for determining the adequacy of the allowance for loan and lease losses (ALLL), to include a review of the ALLL at least quarterly and correction of any deficiency in the ALLL indicated by the review. The Board of Directors has reviewed the Bank’s policies and practices with respect to determining the adequacy of the ALLL and believes that such policies and practices are adequate and appropriate. The Board of Directors has reviewed the ALLL monthly and believes that it has been adequate. |
| • | Charge-off, by June 30, 2009, all assets classified as “loss” and 50% of loans classified as “doubtful” as of the Report of Examination issued in February 2009 (ROE). These actions were completed prior to June 30, 2009, with no additional material loss recognized. |
| • | Reduce the level of assets classified as “substandard” or “doubtful” noted in the ROE to 75% of capital by September 8, 2009. As of December 31, 2009, the assets classified as “substandard” or “doubtful’ were reduced by $123.2 million since the ROE, and the related ratio was 113%. This target was not achieved by the deadline primarily due to the lack of additional capital. |
| • | Develop a written plan for reduction and collection of delinquent loans, develop written asset disposition plans for all adversely classified assets of $1 million or more, develop and implement enhanced policies and procedures for the monitoring and reporting of certain types of loans, and take other specified actions to strengthen the credit administration and collection processes by July 10, 2009. An initial plan covering collection of delinquent loans was approved by the Board of Directors on June 30, 2009, and a copy of that plan was furnished to the FDIC and DFI. In addition, the Bank has developed a written asset disposition plan for each classified asset of $1 million or greater, and intends to develop such plans for assets of $1 million or more that become classified in the future. A plan and |
7
Table of Contents
| related amendments to the Bank’s lending policy, designed to improve loan monitoring and other matters, was approved by the Board of Directors on July 20, 2009, and a copy of that plan was furnished to the FDIC and DFI. |
| • | Refrain from extending credit to or for the benefit of (i) any borrower who has an extension of credit from the Bank that has been charged off or classified, in whole or in part, “Loss,” (ii) any borrower who has an extension of credit from the Bank that has been classified, in whole or in part, “Doubtful,” without prior approval of the Board of Directors or loan committee and collection of all interest due, or (iii) any borrower who has an extension of credit from the Bank in excess of $500,000 that has been classified “Substandard,” without prior approval of the Board of Directors or loan committee and collection of all interest due. Since the date of the Order, the Bank has not made any extensions of credit in violation of the limitations. |
| • | Develop a written plan for reducing extensions of credit to borrowers in the Land Development and Construction (LDC) Loan concentrations by June 10, 2009, and refrain from making any additional LDC loans, except in accordance with such plan. A written plan to reduce such extensions of credit was adopted by the Board of Directors on June 6, 2009, and a copy was provided to the FDIC and DFI. Since that date, the Bank has not made any additional LDC loans except in accordance with such plan and with the prior approval of the Board of Directors. As of December 31, 2009, the aggregate amount of LDC loans has been reduced by $223.2 million since December 31, 2008, representing 58% of the December 31, 2008 total of LDC loans. |
| • | Develop policies for maintenance of an adequate level of liquidity, restrict the interest rates the Bank pays on deposits to maintain compliance with Section 337.6 of the FDIC Rules and Regulations, and refrain from accepting or renewing any brokered certificates of deposit. The Board of Directors determined that the Bank had in place adequate policies and procedures for maintenance of liquidity. The Bank provided written certification to the FDIC and DFI on June 4, 2009 that the Bank’s deposit pricing complied with the requirements of Section 337.6 and continues to monitor interest rates to maintain compliance with such requirements. The Bank has not accepted or renewed any brokered certificates of deposit since August 2008, and has reduced the level of such deposits from $240.7 million at June 30, 2008 to $2.5 million at December 31, 2009. |
| • | Formulate and implement a written profit plan and multi-year strategic plan by August 9, 2009. These plans were approved by the Board of Directors on August 7, 2009 and copies were furnished to the FDIC and DFI. |
| • | Not permit its average total assets to increase from quarter to quarter. |
In addition, the Order requires that the Board of Directors continue its participation in the affairs of the Bank, and increase such participation as appropriate, including approval of sound policies and objectives and supervision of the Bank’s activities. The Board of Directors believes that it is appropriately fulfilling its participation, oversight and supervision responsibilities.
Although management has undertaken actions to comply with all aspects of the Order and the PCA Directive there is no assurance that full compliance will be achieved. As a result, the Bank could become subject to further restrictions or to penalties. Full satisfaction of the Order’s and PCA Directive’s requirements will depend almost exclusively on raising a significant amount of additional capital.
Bank Holding Company Regulation. As a bank holding company, the Company is subject to the Bank Holding Company Act of 1956 (BHCA), as amended, which places it under the supervision of the Board of Governors of the Federal Reserve System (FRB). The Company must file periodic reports with the FRB and must provide it with such additional information as it may require. In addition, the FRB periodically examines the Company. Under Federal Reserve policy, the Company is expected to act as a source of financial and managerial strength to its subsidiary bank. The Company is required to commit, as necessary, resources to support the Bank.
8
Table of Contents
The BHCA limits bank holding company business to owning or controlling banks and engaging in other banking-related activities. Bank holding companies must obtain the FRB’s approval before they: (1) acquire direct or indirect ownership or control of any voting shares of any bank that results in total ownership or control, directly or indirectly, of more than 5% of the voting shares of such bank, (2) merge or consolidate with another bank holding company; or (3) acquire substantially all of the assets of any additional bank. Subject to certain state laws, a bank holding company that is adequately capitalized and adequately managed may acquire the assets of both in-state and out-of-state banks.
Under the Gramm-Leach-Bliley Financial Modernization Act of 1999 (GLBA), a bank holding company may apply to the FRB to become a financial holding company, and thereby engage (directly or through a subsidiary) in certain activities deemed financial in nature, such as securities brokerage and insurance underwriting. The Company has not made this application and is not currently engaged in such activities.
On September 15, 2009, the Company entered into a Written Agreement with the FRB. Under the terms of the Written Agreement, the Company cannot do any of the following without prior written approval of the FRB:
| • | Declare or pay any dividends. |
| • | Make any distributions of principal or interest on junior subordinated debentures. |
| • | Incur, increase or guarantee any debt. |
| • | Redeem any outstanding stock. |
The Written Agreement also requires the Company to:
| • | Submit a written capital plan that provides for sufficient capitalization of both the Parent and the Bank. The written capital plan was originally submitted on November 13, 2009. The FRB informed the Company in writing that the plan was not acceptable on December 8, 2009, and an amended plan was resubmitted on January 29, 2010. |
| • | Comply with FRB regulations governing affiliate transactions. |
| • | Comply with notice and approval requirements of the FDI Act related to the appointment of directors and senior executive officers or change in the responsibility of any current senior executive officer. |
| • | Comply with restrictions on paying or agreeing to pay certain indemnification and severance payments without prior written approval. |
| • | Submit a quarterly progress report to the FRB. |
Substantially all of the requirements of the Written Agreement are similar to requirements imposed on the Company and the Bank pursuant to other regulatory orders and agreements, and the Company and the Bank have been operating in a manner consistent with those requirements. In addition, the Company took various actions on its own initiative, such as ceasing payment of dividends on its common stock and deferring distributions on subordinated debentures (trust preferred securities), before those actions were required by the regulators.
State Law Restrictions. As Washington business corporations, the Company and the Bank are subject to certain limitations and restrictions as provided under applicable Washington corporate law. In addition, the banking laws of Washington, Idaho and Utah and related regulations may restrict certain activities of the Company or the Bank.
Transactions with Affiliates. The Company and the Bank are deemed affiliates of each other within the meaning of the Federal Reserve Act, and transactions between affiliates are subject to certain restrictions, including compliance with Sections 23A and 23B of the Federal Reserve Act and their implementing regulations. Generally, Sections 23A and 23B: (1) limit the extent to which a financial institution or its subsidiaries may
9
Table of Contents
engage in covered transactions (a) with an affiliate (as defined in such sections) to an amount equal to 10% of such institution’s capital and surplus, and (b) with all affiliates, in the aggregate to an amount equal to 20% of such capital and surplus; and (2) require all transactions with an affiliate, whether or not covered transactions, to be on terms substantially the same, or at least as favorable to the institution or subsidiary, as the terms provided or that would be provided to a non-affiliate. The term “covered transaction” includes the making of loans, purchase of assets, issuance of a guarantee and other similar types of transactions.
The Company and the Bank have entered into a management services agreement for the allocation of certain expenses between the Company and the Bank, including the Company’s obligation to reimburse the Bank for certain management services performed by the Bank for the Company. The Company and the Bank periodically review and revise the allocation of expenses and the rate of reimbursement under the agreement, and believe that the Company has appropriately paid the Bank as required by Sections 23A and 23B and their implementing regulations. However, in light of the restrictions on payments of dividends by the Bank to the Company, and the Company’s lack of any other source of revenue, there is no assurance that the Company will have sufficient funds in the future to fulfill its obligations to the Bank under the agreement and in accordance with Sections 23A and 23B and related regulations.
Bank Regulation. The Bank is subject to regulation by the DFI and the FDIC. The federal and state laws that apply to the Bank regulate, among other things, the scope of its business, its investments, its reserves against deposits, the timing of the availability of deposited funds and the nature and amount of collateral for loans.
Premiums for Deposit Insurance. The deposits of the Bank are currently insured to the maximum amount allowable per depositor through the Deposit Insurance Fund (DIF) administered by the FDIC. In October 2008, the FDIC temporarily increased the amount of deposit insurance from $100,000 to $250,000 per depositor through December 31, 2009, and in May 2009 further extended this increased coverage through December 31, 2013. The FDIC also made unlimited deposit insurance coverage available for non-interest bearing transactions accounts and certain low-interest NOW accounts through December 31, 2009 at institutions participating in the Transaction Account Guaranty Program (TAGP) of the FDIC’s Temporary Liquidity Guarantee Program. The TAGP has been extended through June 30, 2010.
The FDIC implemented a new risk-based insurance premium system effective January 1, 2007 under which banks are assessed insurance premiums based on how much risk they present to the DIF. Banks with higher levels of capital and a lower degree of supervisory risk are assessed lower premium rates than banks with lower levels of capital and/or a higher degree of supervisory risk. These premium rates are applied to the average balance of deposits in the prior quarter. Due to the changes in the Bank’s regulatory capital levels and other risk factors, the deposit insurance rate as a percentage of total deposits increased from 28 basis points (annualized) for the fourth quarter of 2008 to 45 basis points (annualized) for the second through fourth quarters of 2009.
In December 2008, as a result of the recent bank failures, the FDIC issued a proposed change to the risk-based deposit insurance premium structure in response to increased demands on the DIF. The expected deposit insurance premium cost for the Bank, based on its current risk classification, is expected to be approximately 45 basis points for 2010. Because the Bank is participating in the TAGP, an additional 10 basis point annual rate surcharge was applied to non-interest bearing transaction deposit accounts in excess of $250,000 during 2009 and an expected 25 basis points will be applied in 2010.
The FDIC may increase or decrease the assessment rate schedule in order to manage the DIF to prescribed statutory target levels. An increase in the assessment rate could have an adverse effect on the Bank’s earnings, depending upon the amount of the increase. The FDIC may terminate deposit insurance if it determines the institution involved has engaged in or is engaging in unsafe or unsound banking practices, is in an unsafe or unsound condition, or has violated applicable laws, regulations or orders.
On May 22, 2009, the FDIC adopted a final rule to impose a 5 basis point special assessment on a financial institution’s assets minus Tier 1 capital as of June 30, 2009. The special assessment of $850 thousand was paid on September 30, 2009. The FDIC could impose additional special assessments if needed in the future.
10
Table of Contents
On November 12, 2009, the FDIC adopted a final rule that requires financial institutions to prepay their estimated quarterly risk-based assessments on December 30, 2009 through the fourth quarter of 2012. The Bank received an exemption from this requirement in December of 2009 from the FDIC.
Community Reinvestment Act (CRA). The CRA requires that, in connection with examinations of financial institutions within their jurisdiction, regulators must evaluate the records of the financial institutions in meeting the credit needs of their local communities, including low and moderate income neighborhoods, consistent with the safe and sound operation of those financial institutions. These factors are also considered in evaluating mergers, acquisitions and applications to open a branch or facility. As of the Bank’s most recent CRA examination in January 2009, the Bank’s CRA rating was “satisfactory.”
Insider Credit Transactions. Banks are also subject to certain restrictions imposed by the Federal Reserve Act on extensions of credit to certain executive officers, directors, principal shareholders and any related interests of such persons. Extensions of credit to such persons must: (1) be made on substantially the same terms, including interest rates and collateral, and follow credit underwriting procedures that are not less stringent than those prevailing at the time for comparable transactions with persons not covered by such restrictions and (2) not involve more than the normal risk of repayment or present other unfavorable features. Banks are also subject to certain lending limits and restrictions on overdrafts to such persons. A violation of these restrictions may result in the assessment of substantial civil monetary penalties on the affected bank or any officer, director, employee, agent or other person participating in the conduct of the affairs of that bank, the imposition of a cease and desist order, and other regulatory sanctions.
Federal Deposit Insurance Corporation Improvement Act of 1991 (FDICIA). Under FDICIA, each federal banking agency has prescribed, by regulation, non-capital safety and soundness standards for institutions under its authority. These standards cover internal controls, information and internal audit systems, loan documentation, credit underwriting, interest rate exposure, asset growth, compensation, fees and benefits, such other operational and managerial standards as the agency determines to be appropriate, and standards for asset quality, earnings and stock valuation. An institution which fails to meet these standards must develop a plan acceptable to the agency, specifying the steps that the institution will take to meet the standards. Failure to submit or implement such a plan may subject the institution to regulatory sanctions. Management believes that the Bank met all such standards as of December 31, 2009.
Privacy. The FDIC and other bank regulatory agencies, pursuant to GLBA, have published guidelines and adopted final regulations (Privacy Rules) which, among other things, require each financial institution to: (1) develop, implement and maintain, under the supervision and ongoing oversight of its Board of Directors or committee thereof, a comprehensive written information security program designed to ensure the security and confidentiality of customer information, protect against anticipated threats to the security or integrity of such information, and protect against unauthorized access to or use of such information; (2) provide notice to customers (and other consumers under certain circumstances) about its privacy policies, describe the conditions under which the institution may disclose nonpublic information to nonaffiliated third parties, and provide a method for consumers to prevent the institution from disclosing that information to most nonaffiliated third parties by opting out of its disclosure policy, subject to certain exceptions; and (3) establish appropriate policies, procedures and processes relating to administrative, technical and physical safeguards for customer records and information. Management believes the Bank is currently in substantive compliance with the Privacy Rules and GLBA.
Dividends. The Bank is subject to restrictions on the payment of cash dividends to the Company. Regulatory authorities may prohibit banks and bank holding companies from paying dividends which would constitute an unsafe or unsound banking practice. In addition, a bank may not pay cash dividends if that payment could reduce the amount of its capital below that necessary to meet the adequately capitalized level in accordance with regulatory capital requirements. Also, the payment of cash dividends by the Bank must satisfy a net profits test and an undivided profits test or the Bank must obtain prior approval of its regulators before such dividend is
11
Table of Contents
paid. The net profits test limits the dividend declared in any calendar year to the net profits of the current year plus retained net income of the preceding two years. The undivided profits test limits the dividends declared to the undivided profits on hand after deducting bad debts in excess of the allowance for loan losses.
As a result of the Order and the Written Agreement discussed above, the Company and the Bank are prohibited from paying any dividends without prior regulatory approval.
During the year ended December 31, 2008, the Company paid a single cash dividend of $688 thousand, or $0.04 per share, which was declared and paid during the first quarter. In accordance with the Company’s dividend policy and in light of a review of operating results and capital levels, the Board of Directors determined that the cash dividend would be discontinued effective with the second quarter of 2008. During the year ended December 31, 2008, the Bank paid $2.2 million of dividends to the Company. A dividend of $350 thousand was issued during the third quarter of 2008 after receiving requisite regulatory approvals. The Bank paid no dividends to the Company during the year ended December 31, 2009.
The Company has four wholly-owned trusts (Trusts) that were formed to issue trust preferred securities and related common securities of the Trusts. In accordance with the provisions of the related indentures, the Company notified the trustees of the Trusts that the payment of dividends was deferred effective with the distributions scheduled for the third quarter of 2008. The deferral of these dividends decreases the annual cash requirement at the Company by approximately $3.0 million during the period of deferral. The Company has the right to defer distributions for up to 20 consecutive quarters. The Company may defer payments of dividends for another 14 quarters. As of December 31, 2009, interest totaling $4.0 million was deferred and in arrears.
The Bank and the Company are also subject to Washington State law, which provides that no cash dividend may be paid if, after giving effect to the dividend, (1) the corporation would not be able to pay its debts as they become due in the usual course of business, or (2) the corporation’s total assets would be less than the sum of its total liabilities.
Capital Adequacy and Prompt Corrective Action. Federal bank regulatory agencies use capital adequacy guidelines in the examination and regulation of banks and bank holding companies. If regulatory capital falls below minimum guideline levels, a bank or bank holding company may be denied approval, among other things, to acquire or establish additional banks or non-bank businesses or to open new facilities.
The FDIC and FRB use risk-based capital guidelines for banks and bank holding companies. These are designed to make such capital requirements more sensitive to differences in risk profiles among banks and bank holding companies, to account for off-balance sheet exposure and to minimize disincentives for holding liquid assets. Under the guidelines, an institution’s regulatory capital is divided into two categories, Tier I capital and Tier II capital. Tier I capital generally consists of common stockholders’ equity, surplus, undivided profits, and certain trust preferred obligations, less intangibles. Tier II capital generally consists of the allowance for credit losses subject to certain limitations and hybrid capital instruments, such as preferred stock and mandatory convertible debt. Tier II capital is limited to 100% of Tier I capital. Total capital is the sum of Tier I and Tier II capital. Capital adequacy is primarily measured with reference to the institution’s risk-weighted assets. The guidelines assign risk weightings to an institution’s assets and certain off balance sheet items, such as commitments, in an effort to quantify the relative risk of each asset and to determine the minimum capital required to support the risk. These risk-weighted assets are then divided by Tier I capital and to total capital to arrive at the Tier I risk-based ratio and the total risk-based ratio, respectively. Current guidelines require all bank holding companies and federally regulated banks to maintain a minimum risk-based total capital ratio equal to 8%, of which at least 4% must be Tier I capital. However, the FRB may require that a banking organization maintain ratios in excess of the minimums, particularly organizations contemplating significant expansion programs. The Company’s and Bank’s regulatory capital ratios are reported in Note 24 to the Consolidated Financial Statements under Item 8.
12
Table of Contents
The federal regulations also establish, as a supplement to risk-based guidelines, minimum requirements for a leverage ratio, which is Tier I capital as a percentage of total average assets less intangibles. The principal objective of the leverage ratio is to constrain the maximum degree to which a bank or bank holding company may leverage its tangible equity capital base.
FDICIA created a statutory framework of supervisory actions indexed to the capital level of a bank. Under regulations adopted by the FDIC, an institution is assigned to one of five capital categories depending on its total risk-based capital ratio, Tier I risk-based capital ratio, leverage ratio and certain subjective factors. As of December 31, 2009, the Bank was considered significantly under-capitalized which is the fourth of the five categories. An institution which is deemed to be under-capitalized, or worse, may be subject to certain mandatory supervisory corrective actions and face restrictions on increasing its average total assets, making acquisitions, establishing branches, engaging in new lines of business, accepting or renewing brokered deposits, paying interest rates on deposits in excess of regulatory limits and making senior executive management changes without prior regulatory approval.
Additional broad regulatory authority is granted with respect to the lowest two capital categories—significantly under-capitalized and critically under-capitalized – including forced mergers, ordering new elections for directors, forcing divestiture by its holding company, requiring management changes and prohibiting the payment of bonuses to senior management. Additional mandatory and discretionary regulatory actions apply to significantly under-capitalized and critically under-capitalized banks, the latter being a bank with a leverage ratio of 2% or less. The primary federal regulatory agency may appoint a receiver or conservator for a critically under-capitalized bank after 90 days, even if the bank is still solvent. Failure of a bank to maintain the required level of capital could result in such bank being declared insolvent and closed. Refer to the restrictions imposed by the Order and the PCA Directive discussed above under the heading of Supervision and Regulation.
Effects of Government Monetary Policy. The earnings and growth of the Company are affected not only by general economic conditions, but also by the fiscal and monetary policies of the federal government, particularly the FRB. The FRB can and does implement national monetary policy for such purposes as curbing inflation and combating recession, but its open market operations in U.S. government securities, control of the discount rate applicable to borrowings from the FRB, and establishment of reserve requirements against certain deposits also influence the growth of bank loans, investments and deposits, and affect interest rates charged on loans or paid on deposits. The nature and impact of future changes in monetary policies and their impact on the Company and the Bank cannot be predicted with certainty.
Sarbanes-Oxley Controls and Procedures. The Sarbanes-Oxley Act of 2002 and related rulemaking by the SEC, which effected corporate disclosure and financial reporting reform, generally require public companies to maintain and carefully monitor a system of disclosure and internal controls and procedures. As a result, public companies must make disclosures about the adequacy of controls and procedures in periodic SEC reports, and their principal executive and principal financial officers must certify that they are responsible for establishing and maintaining disclosure controls and procedures, and disclose their conclusions about the effectiveness of such controls and procedures based on their evaluation as of the end of the period covered by the relevant report. The Company is monitoring the status of other related ongoing rulemaking by the SEC. Management believes that the Company is in compliance with the Sarbanes-Oxley Act of 2002.
Anti-Terrorism Legislation. The Uniting and Strengthening America by Providing Appropriate Tools Required to Intercept and Obstruct Terrorism Act of 2001 (USA PATRIOT Act), which was designed to (among other things) deny terrorists and others the ability to obtain anonymous access to the U.S. financial system, had a significant impact on depository institutions. The USA PATRIOT Act, together with the implementing regulations of various federal regulatory agencies, required financial institutions to implement additional or amend existing policies and procedures with respect to, among other things, anti-money laundering compliance, suspicious activity and currency transaction reporting and due diligence on customers. They also permit information sharing for counter-terrorist purposes between federal law enforcement agencies and financial
13
Table of Contents
institutions, as well as among financial institutions, subject to certain conditions, and require the FRB and other federal banking agencies to evaluate the effectiveness of an applicant in combating money laundering activities when considering applications filed under Section 3 of the BHCA or the Bank Merger Act. Management believes that the Bank is currently in compliance with all effective requirements prescribed by the USA PATRIOT Act.
The following risk factors should not be considered to include all risks to the Company or all risks related to an investment in the Company.
The Company may not be able to continue to operate as a going concern. The Company has determined that significant additional sources of liquidity and capital will likely be required to continue operations in the future. The Company has engaged financial advisors to explore strategic alternatives to resolve the capital and liquidity deficiencies. However, there can be no assurance that the Company will be able to maintain sufficient liquidity or to raise additional capital to satisfy regulatory requirements and meet obligations as they occur. Further, federal and state regulators are continually monitoring the Bank’s liquidity and capital adequacy and evaluating the Company’s ability to continue to operate in a safe and sound manner. The Bank’s regulators could, if deemed warranted, take further actions, including the assumption of control of the Bank, to protect the interests of the depositors insured by the FDIC. The uncertainty regarding the Company’s ability to obtain additional capital or meet future liquidity requirements raises doubt about the Company’s ability to continue as a going concern. The consolidated financial statements included under Part II, item 8 of this report, however, do not include any adjustments that may result as an outcome of these uncertainties.
The Company is required to raise additional capital, but that capital may not be available. The Company and the Bank are required by federal regulatory authorities to maintain adequate levels of capital to support operations. Additional capital is also required for the Company to support future growth, absorb loan losses and use brokered deposits without regulatory approval. The Company’s ability to raise additional capital depends on conditions in the capital markets, which are outside the Company’s control, and on the Company’s financial performance and prospects. Accordingly, the Company cannot be certain of its ability to raise additional capital. If capital is available, the costs of such capital may be very high and extremely dilutive to existing shareholders. If the Company cannot raise additional capital the Bank may be subject to additional adverse regulatory action. If capital levels continue to deteriorate, it is likely that the Company will need to seek to merge with another institution or raise capital through new investors in an extremely dilutive transaction on terms that could be considered unfavorable by current shareholders, or face the prospect of being placed into receivership, resulting in a complete loss of an investment in the Company.
Difficult market conditions have adversely affected the financial services industry. The capital and credit markets have been experiencing unprecedented volatility and disruption for more than twenty four months. Dramatic declines in the housing market over the past year, with falling home prices and increasing foreclosures and unemployment, have negatively impacted the credit performance of mortgage loans and resulted in significant write-downs of asset values by financial institutions, including government-sponsored entities and major commercial and investment banks. These write-downs have caused many financial institutions to seek additional capital, to merge with larger and stronger institutions and, in some cases, to fail. Reflecting concern about the stability of the financial markets generally and the strength of counterparties, many lenders and institutional investors have reduced or ceased providing funding to borrowers, including to other financial institutions. This market turmoil and tightening of credit have led to an increased level of commercial and consumer loan delinquencies and defaults, lack of consumer confidence, increased market volatility and widespread reduction of business activity generally. The resulting economic pressures on consumers and lack of confidence in the financial markets have adversely affected the Bank’s business, financial condition and results of operations. The Company does not expect that the difficult conditions in the financial markets are likely to improve in the near future. A worsening of these conditions would likely exacerbate the adverse effects of these
14
Table of Contents
difficult market conditions on the Bank and others in the financial institutions industry. In particular, the Bank may face the following risks in connection with these events:
| • | There could be increased regulation of the industry. |
| • | The Bank’s ability to assess the creditworthiness of its customers may be impaired if the models and approaches the Bank uses to select, manage, and underwrite its loans become less predictive of future behaviors and performance. |
| • | The process the Bank uses to estimate losses inherent in its credit exposure requires difficult, subjective, and complex judgments, including forecasts of economic conditions and how these economic predictions might impair the ability of the Bank’s borrowers to repay their loans, which may no longer be capable of accurate estimation which may, in turn, impact the reliability of the process. |
| • | The Bank’s ability to engage in routine funding transactions could be adversely affected by the actions and commercial soundness of other financial institutions and government sponsored entities. |
| • | The Bank may face increased competition due to intensified consolidation of the financial services industry. |
If current levels of market disruption and volatility continue or worsen, there can be no assurance that the Company will not experience an adverse effect, which may be material, on its ability to access capital and on its business, financial condition and results of operations.
The Company’s liquidity could be impaired by an inability to access the capital markets or an unforeseen outflow of cash. Liquidity is essential to the Company’s business and the Bank relies on external sources to finance a significant portion of operations. Due to circumstances that the Company may be unable to control, such as a general capital markets disruption or negative news about banks generally, liquidity could be impaired by an inability to access the capital markets, an unforeseen outflow of cash due to depositor withdrawals or a disruption in lending programs of the FRB or FHLB. As a result of the Bank’s regulatory capital falling below the requirements for adequately capitalized status as of December 31, 2008, the Bank has been unable to issue brokered certificates of deposit and faces regulatory limits in the rates it can pay to depositors. The Bank participates in the TAGP, which provides that all noninterest-bearing transaction accounts are fully guaranteed by the FDIC for the entire amount in the account. The TAG Program is scheduled to expire on June 30, 2010, and depositors may choose to lower balances in noninterest-bearing transaction accounts or move such accounts prior to the expiration, which would have an adverse impact on the Bank’s liquidity.
Most of the Company’s assets are loans, which if not repaid would result in losses to the Bank. The Bank is subject to credit risk, which is the risk of losing principal or interest due to borrowers’ failure to repay loans in accordance with their terms. Underwriting and documentation controls do not always work effectively. A further downturn in the economy or the real estate market in the market areas or a rapid increase in interest rates could have a negative effect on collateral values and borrowers’ ability to repay. To the extent loans are not paid timely by borrowers, the loans are placed on non-accrual status, thereby reducing interest income. Further, under these circumstances, an additional provision for loan and lease losses or unfunded commitments may be required.
The Bank has a significant concentration in real estate loans and continued deterioration in the economy of the markets served or the real estate market specifically could significantly harm its business and prospects for growth. As of December 31, 2009, the loan portfolio consisted of:
| • | 49% commercial real estate loans; |
| • | 15% residential real estate loans; |
| • | 13% construction, land development and other land loans; |
15
Table of Contents
| • | 11% agricultural loans; |
| • | 10% commercial and industrial; and |
| • | 2% installment and other loans. |
As of December 31, 2009, approximately 77% of the Bank’s loan portfolio is secured by real estate, the majority of which is commercial real estate. As a result of increased levels of commercial and consumer delinquencies and declining real estate values, the Bank has experienced increasing levels of net charge-offs and allowances for loan and lease reserves. Continued increases in commercial and consumer delinquency levels or continued declines in real estate market values would require increased net charge-offs and increases in the allowance for loan and lease losses, which could have a material adverse effect on the Bank’s business, financial condition and results of operations and prospects.
The allowance for credit losses may not be adequate to cover actual losses. In accordance with generally accepted accounting principles, the Company maintains an allowance for credit losses. The allowance for credit losses may not be adequate to cover actual loan losses, and future provisions for loan losses could adversely impact operating results. The allowance for credit losses is based on prior experience, as well as an evaluation of the inherent risks in the current portfolio. The amount of future losses is susceptible to changes in economic, operating and other conditions that may be beyond the Company’s control, and these losses may exceed current estimates. Federal regulatory agencies, as an integral part of their examination process, review the loans and allowance for credit losses. While management believes that the allowance for credit losses is adequate to cover current potential losses, management may decide to increase the allowance for credit losses or regulators may require the Company to increase this allowance. Either of these occurrences could reduce future earnings and regulatory capital ratios.
A substantial amount of the Company’s real property collateral is located in Central and Eastern Washington and Utah and a further downturn in the real estate markets or prolonged recessionary climate could harm the Company’s business. The effects of the current economic recession have been particularly severe in the Company’s primary market areas. The States of Washington, Idaho and Utah and certain local governments in the market area presently face fiscal challenges the long term impact of which on State or local economies cannot be predicted. Significant declines in housing prices and property values have been particularly severe in Utah. A further downturn in economic conditions or a prolonged delay in recovery could result in the following consequences, any of which could have a material adverse effect on the business: loan delinquencies may increase; problem assets and foreclosures may increase resulting in further price pressures on valuations generally; demand for products and services may decrease; low cost or noninterest bearing deposits may decrease; and collateral for loans made by the Bank, especially real estate, may decline in value, in turn reducing customers’ borrowing power, and reducing the value of assets and collateral associated with existing loans.
If the Bank is not able to reduce nonperforming assets and the related losses being recognized, the Bank’s ability to continue as a going concern becomes doubtful. The existing capital levels will not support further deterioration in asset quality and the corresponding recognition of losses. Additional capital is needed both to meet regulatory “well capitalized” levels and to support any potential future losses.
The Company may be subject to additional regulatory enforcement action that could place significant restrictions on the Company’s operations. Under applicable laws, the FDIC and the DFI have the ability to impose substantial sanctions, restrictions and requirements on the Bank if they determine, upon examination or otherwise, violations of laws with which the Company must comply, or weaknesses or failures with respect to general standards of safety and soundness. Applicable law prohibits disclosure of specific examination findings by the institution although formal enforcement actions are routinely disclosed by the regulatory authorities. The FDIC and DFI may require certain corrective steps, impose limits on activities, prescribe lending parameters and require additional capital to be raised. Failure to adhere to the requirements, if imposed, could result in more severe restrictions including seizure of the Bank. Generally, these enforcement actions can be lifted only after subsequent examinations substantiate complete correction of the underlying issues.
16
Table of Contents
The Company’s common stock will likely no longer qualify for listing on the NASDAQ Global Select Market after March 14, 2010. On March 4, 2010, the Company informed NASDAQ of the Company’s decision to voluntary delist its common stock effective March 15, 2010. This decision was based upon the consideration of a number of factors, including available alternatives to cure a minimum bid price deficiency under NASDAQ rules, the direct and indirect costs of listing and compliance, the limited trading volume in its common stock and other factors. Once the Company’s shares are subject to delisting from the NASDAQ Global Select Market, there is no assurance that a liquid and efficient market for AmericanWest Bancorporation common stock will be available or develop. Although the shares may be eligible for trading on other exchanges, such as the “OTC Bulletin Board,” it is possible that the ability of a selling shareholder to realize the best market price will be impeded as the result of wider bid-ask spreads.
Conditions in the financial markets may limit the Company’s access to additional funding to meet liquidity needs. Liquidity is essential to the Bank’s business. An inability to raise funds through deposits, borrowings, or the sale or pledging as collateral of loans and other assets could have a substantial negative effect on the Bank’s liquidity. The Bank’s access to funding sources in amounts adequate to finance its activities could be impaired by factors that affect the Bank specifically or the financial services industry in general. Factors that could detrimentally impact the Bank’s access to liquidity sources include a decrease in the level of business activity due to a market down turn or adverse regulatory action against the Bank. The Bank’s ability to borrow could also be impaired by factors that are nonspecific to the Bank, such as severe disruption of the financial markets or negative developments and expectations about the prospects for the financial services industry as a whole as evidenced by recent turmoil in the domestic and worldwide credit markets.
The Bank’s wholesale funding sources and balance sheet liquidity may prove insufficient to replace deposits at maturity or withdrawal. The Bank must maintain sufficient funds to respond to the needs of depositors and borrowers. As a part of its liquidity management, the Bank depends upon a number of funding sources in addition to core deposit growth and repayments and maturities of loans and investments The Company’s financial flexibility will be severely constrained if the Bank is unable to maintain access to funding or if adequate financing is not available at acceptable interest rates. The Bank’s ability to borrow on a secured basis may be reduced as a result of adjustments in collateral coverage requirements. In the case of the FHLB, the Bank’s borrowing capacity may be reduced due to concerns regarding the Bank’s financial condition and/or the FHLB’s unilateral decision to curtail certain lending in an effort to improve regulatory capital ratios.
The Company’s business is subject to interest rate risk, and variations in interest rates may harm financial performance. Unfavorable changes in the interest rate environment may reduce profits. It is expected that the Company will continue to realize income from the differential, or spread, between the interest earned on loans, securities and other interest earning assets and the interest paid on deposits, borrowings and other interest bearing liabilities. Net interest spreads are affected by the difference between the maturities and repricing characteristics of interest earning assets and interest bearing liabilities. In addition, loan volume and yields are affected by market interest rates on loans, and rising interest rates generally are associated with a lower volume of loan originations. An increase in the general level of interest rates may increase the net interest margin and loan yield, but it may adversely affect the ability of borrowers with variable rate loans to pay the interest on and principal of their obligations. The Company cannot control of these factors. Accordingly, changes in levels of market interest rates could materially harm the net interest spread, asset quality, loan origination volume and overall profitability.
If the Company’s foreclosed assets are not properly valued or sufficiently reserved to cover actual losses, or if the Company is required to increase its valuation reserves, it could suffer additional losses. The Bank obtains updated valuations when a loan has been foreclosed and the property taken in as real estate owned and at certain other times. The net book value in the loan at the time of foreclosure and thereafter is compared to the updated market value, or fair value, of the foreclosed property less estimated selling costs. A charge-off is recorded for any excess in the asset’s net book value over its fair value. If property values decline, the fair value of the foreclosed assets may not be sufficient to recover the carrying value in such assets, resulting in the need
17
Table of Contents
for additional charge-offs. Significant charge-offs to the foreclosed assets could have a material adverse effect on the financial condition and results of operations of the Company. In addition, bank regulators periodically review the foreclosed assets and may require the Company to recognize further charge-offs. Any increase in the charge-offs, as required by the bank regulators, may have a material adverse effect on the financial condition and results of operations of the Company.
The Company has continuing losses and continuing volatility in quarterly results. The Company reported a net loss of $71.1 million during the year ended December 31, 2009 and $192.4 million during the year ended December 31, 2008. Losses resulted from the high level of non-performing assets and the related reduction in interest income and increased provision for loan losses, and goodwill impairment charges. All of the goodwill has been written off, however, the Company may continue to suffer further losses as a result of credit-related factors. In addition, several other factors affecting the business can cause significant variations in the quarterly results of operations. In particular, variations in the volume of loan originations and sales, the differences between the costs of funds and the average interest rate earned on investments and other-than-temporary impairment charges in the Company’s investment securities portfolio could have a material adverse effect on the results of operations and financial condition.
Increases in deposit insurance premiums and special FDIC assessments will reduce the Company’s earnings. Beginning in late 2008, the economic environment caused higher levels of bank failures, which dramatically increased FDIC resolution costs and led to a significant reduction in the Deposit Insurance Fund. As a result, the FDIC has significantly increased the initial base assessment rates paid by financial institutions for deposit insurance. The base assessment annual rate was increased by seven basis points (seven cents for every $100 of deposits) for the first quarter of 2009. Effective April 1, 2009, initial base assessment rates were changed to range from 12 basis points to 45 basis points across all risk categories with possible adjustments to these rates based on certain debt-related components. These increases in the base assessment rate have increased the Company’s deposit insurance costs and negatively impacted earnings. In addition, in May 2009, the FDIC imposed a special assessment on all insured institutions due to recent bank and savings association failures. The emergency assessment amounted to five basis points on each institution’s assets minus Tier 1 capital as of June 30, 2009, subject to a maximum equal to 10 basis points times the institution’s assessment base. The Company’s FDIC deposit insurance expense for 2009 was $7.8 million.
The Bank’s investment in FHLB stock may become impaired. As of December 31, 2009, the Bank held $10.3 million of FHLB stock as required under certain borrowing agreements. During the first quarter of 2009, the FHLB indicated that its ability to pay future dividends was uncertain due to reduction of its retained earnings resulting from the recognition of investment security impairments. The valuation of the FHLB stock with the Bank may become impaired if the FHLB is unable to pay a cash dividend or continues to experience significant losses for an extended period. During 2009, the Company did not recognize any dividend income from FHLB stock.
The Company faces strong competition from financial services companies and other companies that offer banking services, which could harm business. The Company currently conducts its banking operations primarily in Central and Eastern Washington, Northern Idaho and Utah. Increased competition in its markets may result in reduced loans and deposits. Ultimately, the Company may not be able to compete successfully against current and future competitors. Many competitors offer the same banking services within the Company’s market area, including national banks, regional banks and other community banks. The Company also faces competition from many other types of financial institutions, including savings and loan institutions, finance companies, brokerage firms, insurance companies, credit unions, mortgage banks and other financial intermediaries. In particular, the competitors include several major financial companies whose greater resources may afford them a marketplace advantage by enabling them to maintain numerous banking locations and ATMs and conduct extensive promotional and advertising campaigns.
Additionally, banks and other financial institutions with larger capitalization and financial intermediaries not subject to bank regulatory restrictions have larger lending limits and are thereby able to serve the credit needs
18
Table of Contents
of larger customers. Areas of competition include interest rates for loans and deposits, efforts to obtain deposits, and the range and quality of products and services provided, including new technology-driven products and services. Technological innovation continues to contribute to greater competition in domestic and international financial services markets as technological advances enable more companies to provide financial services. The Company also faces competition from out-of-state financial intermediaries that have opened low-end production offices or that solicit deposits in its market areas. If the Company is unable to attract and retain banking customers, the Company may be unable to continue to grow the loan and deposit portfolios and results of operations and financial condition may otherwise be harmed.
The Bank is unable to pay the holding company cash dividends to meet its cash obligations. Dividends paid by the Bank to the Parent Company provided cash flow used to service the interest payments on trust preferred securities. Various statutory provisions restrict the amount of dividends the Bank can pay to the Parent Company without regulatory approval. Currently, the Bank’s payment of dividends is restricted. Effective the third quarter of 2008 the Parent Company deferred the interest payments on the trust preferred securities, in accordance with the provisions of the related indentures, in an effort to minimize the required dividend from the Bank and since the Supervisory Directive (as superseded by the Order) requires approval and consent before paying any such dividends. The Parent Company will not be able to service its debt or pay its obligations until it receives dividends from the Bank or receives new capital.
Federal and state governments could pass legislation responsive to current credit conditions. The Bank could experience higher credit losses because of federal or state legislation or regulatory action that reduces the amount the Bank’s borrowers are otherwise contractually required to pay under existing loan contracts. Also, the Bank could experience higher credit losses because of federal or state legislation or regulatory action that limits the Bank’s ability to foreclose on property or other collateral or that makes foreclosure less economically feasible.
The value of securities in the investment securities portfolio may be negatively affected by continued disruptions in securities markets. The market for some investment securities held in the Bank’s portfolio has become extremely volatile over the past twelve months. Volatile market conditions may detrimentally affect the value of these securities, such as through reduced valuations due to the perception of heightened credit and liquidity risks. There can be no assurance that the declines in market value associated with these disruptions will not result in other than temporary impairments of these assets, which would lead to accounting charges that could have a material adverse effect on the results of operations and capital levels.
Recent legislative and regulatory initiatives to support the financial services industry have been coupled with numerous restrictions and requirements that could detrimentally affect the Company’s business and require the Company to raise additional capital. In addition to the U.S. Treasury’s Capital Purchase Program (CPP) under the TARP announced in the fall of 2008, the U.S. Treasury, Federal Reserve and the FDIC have taken further steps to support and regulate the financial services industry, that include enhancing the liquidity support available to financial institutions, establishing a commercial paper funding facility, temporarily guaranteeing money market funds and certain types of debt issuances, and increasing insurance on bank deposits. Also, the U.S. Congress, through the Emergency Economic Stabilization Act (EESA) and the American Recovery and Reinvestment Act (ARRA), have imposed a number of restrictions and limitations on the operations of financial services firms participating in the federal programs. These programs subject the Company and other financial institutions who participate in them to additional restrictions, oversight, reporting obligations and costs, which could have an adverse impact on the business, financial condition, results of operations or the price of the Company’s common stock. In addition, new proposals for legislation continue to be introduced in the U.S. Congress that could further substantially increase regulation of the financial services industry and impose restrictions on the ability of firms within the industry to conduct business consistent with historical practices, including aspects such as compensation, interest rates, new and inconsistent consumer protection regulations and mortgage regulation, among others. Federal and state legislatures could also adopt laws reducing the amount that borrowers are otherwise contractually required to pay under existing loan contracts or require lenders to extend or restructure certain loans. Federal and state regulatory agencies also frequently adopt
19
Table of Contents
changes to their regulations or change the manner in which existing regulations are applied. The Company cannot predict the substance or impact of pending or future legislation or regulation, or the application thereof. Compliance with such current and potential regulation and scrutiny may significantly increase costs, impede the efficiency of internal business processes, require the Company to increase regulatory capital and limit the Company’s ability to pursue business opportunities in an efficient manner.
Supervisory guidance on commercial real estate concentrations could restrict the Company’s activities and impose financial requirements or limitations on the conduct of our business. The Office of the Comptroller of the Currency, the Board of Governors of the Federal Reserve System, and the FDIC adopted guidance on sound risk management practices for concentrations in commercial real estate lending. This guidance is intended to help ensure that institutions pursuing a significant commercial real estate lending strategy remain healthy and profitable while continuing to serve the credit needs of their communities. The federal agencies are concerned that rising commercial real estate loan concentrations may expose institutions to unanticipated earnings and capital volatility in the event of adverse changes in commercial real estate markets. The regulatory guidance reinforces and enhances existing regulations and guidelines for safe and sound real estate lending. The guidance provides supervisory criteria, including numerical indicators to assist in identifying institutions with potentially significant commercial real estate loan concentrations that may warrant greater supervisory scrutiny.
There are two numerical measures in the regulatory guidance. The thresholds of numerical indicators in the guidance that indicate significant commercial real estate loan concentrations are as follows: (1) loans in the Call Report (the quarterly Report of Condition required to be filed with federal banking regulators) categories of Construction, Land Development and Other Land loans are greater than 100% of an institution’s total Capital; and (2) commercial real estate loans, as defined in the guidance, are greater than 300% of an institution’s total Capital. The first numerical indicator, the aggregate of construction, land development and other land loans divided by the Bank’s total Capital was 328% as of December 31, 2009. The second numerical indicator, the aggregate of non-owner-occupied commercial real estate loans, divided by the Bank’s total Capital was 1082% as of December 31, 2009. Accordingly, the Bank’s portfolio meets the definition of a concentration, as set forth in the guidelines.
The guidance does not limit banks’ commercial real estate lending, but rather guides institutions in developing risk management practices and levels of capital that are commensurate with the level and nature of their commercial real estate concentrations. The Bank’s lending and risk management practices are taken into account in supervisory evaluations of its capital adequacy.
The Company is dependent on key personnel and the loss of one or more of those key personnel may harm prospects. The Company currently depends heavily on the services of its key management personnel. The loss of services of key personnel in the future could harm the results of operations and financial condition. Success also depends in part on the ability to attract and retain additional qualified management personnel. Competition for such personnel is strong in the banking industry, and the Company may not be successful in attracting or retaining the personnel required or obtaining required regulatory approval for new personnel.
The Company is exposed to risk of environmental and other liabilities with respect to properties to which it takes title. In the ordinary course of business, the Bank may own or foreclose and take title to real estate and could be or become subject to environmental liabilities with respect to these properties. The Bank may be held liable to a governmental entity or to third parties for property damage, personal injury, investigation and clean-up costs incurred by these parties in connection with environmental contamination, or may be required to investigate or clean up hazardous or toxic substances, or chemical releases at a property. The costs associated with investigation or remediation activities could be substantial. In addition, as the owner or former owner of a contaminated site, the Bank may be subject to common law claims by third parties based on damages and costs resulting from environmental contamination emanating from the property. If the Bank ever became subject to significant environmental liabilities, the business, financial condition, liquidity and results of operations could be harmed.
20
Table of Contents
Changes in accounting standards may impact how the Company reports its financial condition and results of operations. The Company’s accounting policies and methods are fundamental to how it records and reports its financial condition and results of operations. From time to time the Financial Accounting Standards Board changes the financial accounting and reporting standards that govern the preparation of financial statements. These changes can be difficult to predict and can materially impact how the Company records and reports its financial condition and results of operations. In some cases, the Company could be required to apply a new or revised standard retroactively, resulting in a restatement of prior period financial statements.
Item 1B. Unresolved Staff Comments.
None.
At December 31, 2009, the Bank had 58 banking locations including 31 in Eastern and Central Washington, 9 in Northern Idaho and 18 in Utah. The Company’s main office, which is leased, is located in downtown Spokane, Washington. The Bank owns 32 banking facilities, leases 16 banking facilities and has 10 owned buildings on leased land at which banking services are provided. Additionally, the Company has 2 owned buildings and 1 leased building which are not being used as banking facilities and are either being subleased or marketed for sale or sublease. Approximately 3,000 square feet is leased for Administrative Offices and approximately 48,000 square feet is leased for the Bank’s operations center.
Periodically and in the ordinary course of business, various claims and lawsuits are brought against the Company or the Bank, such as claims to enforce liens, condemnation proceedings on properties in which the Bank held a security interest, claims involving the making and servicing of real property loans, actions relating to employee claims and other issues incident to the business of the Company and the Bank. In the opinion of management, the ultimate liability, if any, resulting from current claims or lawsuits will not have a material adverse effect on the financial position or results of operations of the Company.
21
Table of Contents
Item 5. Market for Registrant’s Common Equity, Related Stockholder Matters and Issuer Purchases of Equity Securities.
As of the date of this Report, the common stock of AmericanWest Bancorporation is traded on the NASDAQ Global Select Market under the symbol “AWBC.” The following table sets out the high and low prices per share and cash dividends per share for the common stock for each quarter of 2009 and 2008 as reported by NASDAQ. The following quotes reflect inter-dealer prices, without retail mark-up, mark-down or commission and may not necessarily represent actual transactions:
| Quarter Ended |
High | Low | Cash Dividends Declared Per Share | ||||||
| December 31, 2009 |
$ | 0.56 | $ | 0.28 | — | ||||
| September 30, 2009 |
$ | 0.69 | $ | 0.38 | — | ||||
| June 30, 2009 |
$ | 1.15 | $ | 0.35 | — | ||||
| March 31, 2009 |
$ | 1.59 | $ | 0.27 | — | ||||
| December 31, 2008 |
$ | 1.75 | $ | 0.74 | — | ||||
| September 30, 2008 |
$ | 2.45 | $ | 1.12 | — | ||||
| June 30, 2008 |
$ | 9.53 | $ | 1.60 | — | ||||
| March 31, 2008 |
$ | 17.58 | $ | 7.85 | $ | 0.04 | |||
As of February 22, 2010, there were 1,797 holders of record of the Company’s common stock.
The payment of future cash dividends is at the discretion of the Board of Directors and is subject to a number of factors, including regulatory restrictions, results of operations, general business conditions, growth, financial condition and other factors deemed relevant. Further, the Company’s ability to pay future cash dividends is subject to certain regulatory requirements and restrictions discussed in the Supervision and Regulation section in Item 1 above. Given the Company’s regulatory restrictions, operating results and need to raise additional capital, it is highly unlikely that dividends will be paid in the foreseeable future.
The following table provides information as of December 31, 2009 with respect to the Company’s compensation plans under which shares of the Company’s common stock are authorized for issuance:
| Plan Category |
Number of securities to be issued upon exercise of outstanding options, warrants and rights |
Weighted average exercise price of outstanding options, warrants and rights |
Number of securities remaining available for future issuance under equity compensation plans (excluding securities reflected in column (a) | ||||
| (a) | (b) | (c) | |||||
| Equity compensation plans approved by security holders |
256,681 | $ | 14.57 | 677,854 | |||
| Equity compensation plans not approved by security holders |
— | — | — | ||||
| Total |
256,681 | $ | 14.57 | 677,854 | |||
22
Table of Contents
The following graph, which is “furnished” not “filed,” compares the cumulative total shareholder return on the Company’s common stock during the period beginning December 31, 2004, and ending December 31, 2009, with cumulative total returns on the NASDAQ Composite, SNL Bank Index and the SNL Western Bank Index for the same period. The graph and table assume that $100 was invested on December 31, 2004, and that all dividends were reinvested during each year presented. The information shown within the graph is not necessarily indicative of future performance. The source for the information is SNL Financial LC, Charlottesville, VA.
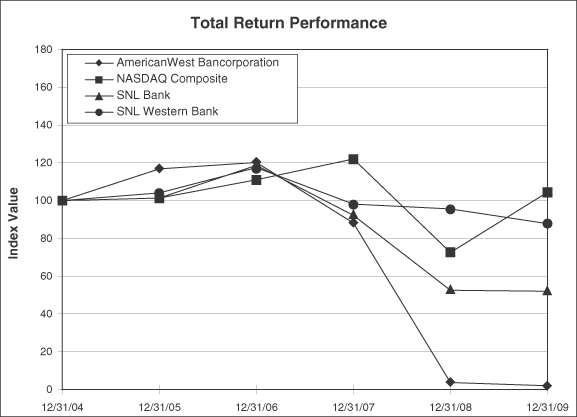
| Period Ending | ||||||||||||
| Index |
12/31/04 | 12/31/05 | 12/31/06 | 12/31/07 | 12/31/08 | 12/31/09 | ||||||
| AmericanWest Bancorporation |
100.00 | 116.69 | 120.10 | 88.11 | 3.76 | 2.03 | ||||||
| NASDAQ Composite |
100.00 | 101.37 | 111.03 | 121.92 | 72.49 | 104.31 | ||||||
| SNL Bank |
100.00 | 101.36 | 118.57 | 92.14 | 52.57 | 52.03 | ||||||
| SNL Western Bank |
100.00 | 104.11 | 117.48 | 98.12 | 95.54 | 87.73 | ||||||
23
Table of Contents
Item 6. Selected Financial Data.
The following table sets forth certain selected consolidated financial data of the Company at and for the years ended December 31:
| (in thousands, except per share amounts) |
2009 | 2008 | 2007 | 2006 | 2005 | |||||||||||||||
| Statements of Income | ||||||||||||||||||||
| Net interest income |
$ | 56,126 | $ | 73,954 | $ | 84,089 | $ | 60,286 | $ | 53,987 | ||||||||||
| Loan loss provision |
50,330 | 97,170 | 17,341 | 5,376 | 2,092 | |||||||||||||||
| Non-interest income |
20,928 | 18,667 | 16,316 | 9,782 | 8,383 | |||||||||||||||
| Non-interest expense |
111,008 | 193,617 | 70,767 | 52,705 | 41,408 | |||||||||||||||
| (Loss) income before income tax (benefit) provision |
(84,284 | ) | (198,166 | ) | 12,297 | 11,987 | 18,870 | |||||||||||||
| Income tax (benefit) provision |
(13,160 | ) | (5,806 | ) | 3,759 | 4,357 | 4,998 | |||||||||||||
| Net (loss) income |
$ | (71,124 | ) | $ | (192,360 | ) | $ | 8,538 | $ | 7,630 | $ | 13,872 | ||||||||
| Basic (loss) earnings per common share |
$ | (4.13 | ) | $ | (11.18 | ) | $ | 0.54 | $ | 0.68 | $ | 1.33 | ||||||||
| Diluted (loss) earnings per common share |
$ | (4.13 | ) | $ | (11.18 | ) | $ | 0.54 | $ | 0.67 | $ | 1.31 | ||||||||
| Basic weighted average shares outstanding |
17,213 | 17,211 | 15,766 | 11,183 | 10,407 | |||||||||||||||
| Diluted weighted average shares outstanding |
17,213 | 17,211 | 15,864 | 11,355 | 10,594 | |||||||||||||||
| Statements of Condition | ||||||||||||||||||||
| Securities |
$ | 48,986 | $ | 65,270 | $ | 66,985 | $ | 39,518 | $ | 31,364 | ||||||||||
| Total assets |
1,655,553 | 1,874,623 | 2,120,245 | 1,416,528 | 1,109,600 | |||||||||||||||
| Gross loans: |
||||||||||||||||||||
| Commercial real estate |
627,984 | 630,540 | 580,627 | 529,699 | 427,368 | |||||||||||||||
| Construction, land development and other land |
168,454 | 388,381 | 523,913 | 230,313 | 158,289 | |||||||||||||||
| Commercial and industrial |
130,705 | 215,776 | 321,638 | 200,217 | 172,402 | |||||||||||||||
| Residential real estate |
183,320 | 200,047 | 153,043 | 86,371 | 59,226 | |||||||||||||||
| Agricultural |
142,404 | 160,944 | 157,196 | 155,433 | 126,044 | |||||||||||||||
| Installment and other |
19,040 | 28,777 | 31,455 | 18,853 | 19,554 | |||||||||||||||
| Total gross loans |
1,271,907 | 1,624,465 | 1,767,872 | 1,220,886 | 962,883 | |||||||||||||||
| Deposits |
1,505,540 | 1,573,533 | 1,529,427 | 1,123,939 | 897,430 | |||||||||||||||
| Borrowings |
104,922 | 184,201 | 285,902 | 126,686 | 81,847 | |||||||||||||||
| Stockholders’ equity |
$ | 19,605 | $ | 89,788 | $ | 283,987 | $ | 152,037 | $ | 121,477 | ||||||||||
| Financial Ratios | ||||||||||||||||||||
| Return on average assets |
-3.98 | % | -9.32 | % | 0.45 | % | 0.58 | % | 1.29 | % | ||||||||||
| Return on average equity |
-110.79 | % | -83.46 | % | 3.36 | % | 5.33 | % | 12.34 | % | ||||||||||
| Net interest margin (1) |
3.43 | % | 4.03 | % | 5.09 | % | 5.06 | % | 5.47 | % | ||||||||||
| Non-interest income to average assets |
1.17 | % | 0.90 | % | 0.85 | % | 0.71 | % | 0.78 | % | ||||||||||
| Non-interest expense to average assets |
6.21 | % | 9.38 | % | 3.74 | % | 3.99 | % | 3.87 | % | ||||||||||
| Efficiency ratio |
88.8 | % | 83.0 | % | 66.4 | % | 72.3 | % | 64.7 | % | ||||||||||
| Cash dividends declared per share |
$ | — | $ | 0.04 | $ | 0.15 | $ | 0.09 | $ | — | ||||||||||
| Cash dividend payout ratio |
— | (2) | — | (2) | 27.8 | % | 13.2 | % | — | |||||||||||
| Book value per share |
$ | 1.14 | $ | 5.22 | $ | 16.51 | $ | 13.35 | $ | 11.58 | ||||||||||
| Tangible book value per share |
$ | 0.52 | $ | 3.34 | $ | 8.09 | $ | 9.79 | $ | 10.20 | ||||||||||
| Average equity to average assets |
3.59 | % | 11.16 | % | 13.48 | % | 10.95 | % | 10.50 | % | ||||||||||
| Ending tangible equity to tangible assets |
0.55 | % | 3.12 | % | 7.05 | % | 8.10 | % | 9.77 | % | ||||||||||
| Non-performing loans to gross loans (3) |
8.28 | % | 5.65 | % | 2.21 | % | 0.94 | % | 1.50 | % | ||||||||||
| Allowance for credit losses to gross loans (4) |
3.10 | % | 2.79 | % | 1.51 | % | 1.31 | % | 1.49 | % | ||||||||||
| (1) | Tax-exempt securities included using a tax equivalent basis and an assumed tax rate of 34%. |
| (2) | Calculation of cash dividend payout ratio for 2009 and 2008 is not meaningful |
| (3) | Ratio shown net of government guarantees. |
| (4) | Includes the allowance for loan losses and reserve for unfunded commitments. |
24
Table of Contents
Item 7. Management’s Discussion and Analysis of Financial Condition and Results of Operations.
The following discussion should be read together with the Company’s consolidated financial statements, related notes and supplementary data of the Company and its subsidiaries, which are included under Item 8. The following discussion contains forward-looking statements that reflect plans, estimates and beliefs. The actual results of the Company could differ materially from those discussed in the forward-looking statements.
Critical Accounting Policies
The SEC defines critical accounting policies as those that require application of management’s most difficult, subjective or complex judgments, often as a result of the need to make estimates about the effect of matters that are inherently uncertain and may change in future periods. The Company’s significant accounting policies are described in Note 1 in the Notes to the Consolidated Financial Statements. Not all of these accounting policies require management to make difficult, subjective or complex judgments or estimates. However, management believes that the following policies should be considered critical within the SEC’s definition.
Reserves and Contingencies. The Company must manage and control certain inherent risks in the normal course of its business. These include, credit risk, fraud risk, operations and settlement risk, and interest rate risk. The Company has established reserves for risk of losses, including the allowance for loan losses and tax contingencies. The allowance for loan losses represents management’s estimate of the probable losses that have occurred as of the date of the financial statements, as further described in Note 1 in the Notes to the Consolidated Financial Statements. As a matter of internal policy, the Company generally recognizes as charge-offs the amount of any specific reserves required for loans that are classified as impaired and determined to be a confirmed loss.
As of December 31, 2009 and 2008, the Company provided a 100% valuation allowance against its net deferred tax assets, resulting in a reduction in the benefit for income taxes of approximately $19.9 million and $26.9 million, respectively, for 2009 and 2008. This valuation allowance was established based upon management’s evaluation of the Company’s current prospects for generating future taxable income and consideration of its current regulatory capital level. The deferred tax valuation allowance will be reviewed on a periodic basis and, if conditions warrant, adjusted to reflect any amount that is expected to be realized.
If the Company prevails in a matter for which an accrual has been established or is required to pay an amount exceeding recorded reserves, the financial impact will be reflected in the period in which the matter is resolved.
Goodwill and Intangible Assets. At December 31, 2009, the Company had $10.6 million of core deposit intangible assets which were recorded in connection with various business combinations. Generally accepted accounting principles require that core deposit intangible assets be amortized against expense over the deposits’ estimated useful lives. Goodwill is evaluated on at least an annual basis for impairment. Management performs an impairment analysis on an annual basis (as of September 30), or more frequently if circumstances indicate an impairment may exist. As a result of that evaluation, a goodwill impairment charge of $18.9 million was recorded during the third quarter of 2009, eliminating the remaining carrying value of goodwill. Additionally, in 2008, $27.0 million was recognized as an impairment charge during the first quarter and an additional $82.0 million was recognized in the third quarter. The impairment analyses required management to make subjective judgments regarding a variety of factors, including but not limited to competitive forces, customer behaviors and attrition, changes in revenue growth trends and delivery channel costs, changes in discount rates and specific industry and market valuation conditions. Additional information is included in Note 9 of the Notes to Consolidated Financial Statements.
Foreclosed Real Estate and Other Foreclosed Assets. As of December 31, 2009, approximately 77% of the Company’s loan portfolio was secured by real estate. Additionally, the Company had $53.4 million of
25
Table of Contents
foreclosed real estate as of December 31, 2009. In the event of customer default, the Company’s principal source of repayment is derived through the foreclosure and ultimate liquidation of real estate collateral. Upon receiving title to a property, the Company transfers the related balance from loans to other real estate owned in an amount equal to the lesser of the carrying value of the loan less estimated selling costs, or the appraised amount of the property less estimated selling costs and market discount. Any loss realized upon the initial transfer to other real estate owned is recognized as a loan charge-off.
The estimated selling costs are based upon current real estate commission rates for comparable properties. Appraised values are discounted if, in the opinion of management, the values do not fully reflect current market conditions. In determining the amount of a market discount, if any, management considers bona fide offers received on the subject or similar properties, the level of supply of similar properties, management’s judgment of other property specific attributes, and expectations about future market conditions.
The Company complies in all respects with regulatory guidance regarding real estate appraisals prepared by third parties, including a requirement that appraisal firms be approved and that appraisal reports be reviewed by properly credentialed staff appraisers. In addition, updated property appraisals are generally procured every six months if a property has not been sold. Any additional impairment, along with any costs associated with insurance or maintenance, is recognized as a charge to current period earnings.
Fair Value of Financial Instruments. Effective January 1, 2007, the Company adopted accounting guidance related to fair value measurements, which among other things, requires enhanced disclosures about financial instruments carried at fair value. This guidance established a hierarchical disclosure framework associated with the level of pricing observability utilized in measuring financial instruments at fair value. The degree of judgment utilized in measuring the fair value of financial instruments generally correlates to the level of pricing observability. Financial instruments with readily available active quoted prices or for which fair value can be measured from actively quoted prices generally will have a higher degree of pricing observability and a lesser degree of judgment utilized in measuring fair value. Conversely, financial instruments rarely traded or not quoted will generally have little or no pricing observability and a higher degree of judgment utilized in measuring fair value. Pricing observability is impacted by a number of factors, including the type of financial instrument, whether the financial instrument is new to the market and not yet established, and the characteristics specific to the transaction. See Note 17 of the Notes to Consolidated Financial Statements for additional information about the level of pricing transparency associated with financial instruments carried at fair value.
Executive Overview
Results of Operations
| % Change | |||||||||||||||||
| ($ in thousands, except per share) |
2009 | 2008 | 2007 | 2009 | 2008 | ||||||||||||
| Interest income |
$ | 87,710 | $ | 119,670 | $ | 134,292 | -27 | % | -11 | % | |||||||
| Interest expense |
31,584 | 45,716 | 50,203 | -31 | % | -9 | % | ||||||||||
| Net interest income |
56,126 | 73,954 | 84,089 | -24 | % | -12 | % | ||||||||||
| Loan loss provision |
50,330 | 97,170 | 17,341 | -48 | % | 460 | % | ||||||||||
| Net interest (loss) income after loan loss provision |
5,796 | (23,216 | ) | 66,748 | -125 | % | -135 | % | |||||||||
| Non-interest income |
20,928 | 18,667 | 16,316 | 12 | % | 14 | % | ||||||||||
| Non-interest expense |
111,008 | 193,617 | 70,767 | -43 | % | 174 | % | ||||||||||
| (Loss) Income before income tax (benefit) provision |
(84,284 | ) | (198,166 | ) | 12,297 | -57 | % | -1711 | % | ||||||||
| Income Tax (Benefit) Provision |
(13,160 | ) | (5,806 | ) | 3,759 | 127 | % | -254 | % | ||||||||
| Net (loss) income |
$ | (71,124 | ) | $ | (192,360 | ) | $ | 8,538 | -63 | % | -2353 | % | |||||
| Basic (loss) earnings per common share |
$ | (4.13 | ) | $ | (11.18 | ) | $ | 0.54 | |||||||||
| Diluted (loss) earnings per common share |
$ | (4.13 | ) | $ | (11.18 | ) | $ | 0.54 | |||||||||
26
Table of Contents
The Company’s net loss for 2009 was $71.1 million as compared to $192.4 million in 2008 and net income of $8.5 million in 2007. The diluted loss per share in 2009 was $4.13 as compared to $11.18 in 2008 and diluted net income per share in 2007 of $0.54. Excluding the goodwill impairment charges of $18.9 million in 2009 and $109.0 million in 2008, which is a non-GAAP disclosure, the net loss would have been $52.3 million and $83.4 million, respectively, or $3.04 per share and $4.84 per share, respectively.
The return on average assets was -3.98% for 2009 as compared to a return on average assets of -9.32% in 2008 and 0.45% for 2007. Excluding the goodwill impairment charges, the return on average assets would have been -2.92% and -4.04% for the years ended December 31, 2009 and 2008, respectively. The return on average equity for 2009 was -110.79% as compared to a return on average equity for 2008 of -83.46%, and 3.36% for 2007. Excluding the goodwill impairment charges, the return on average equity would have been -81.43% and -36.17% for 2009 and 2008, respectively.
The 2009 financial results were shaped by the following:
| • | Provision for loan losses of $50.3 million, principally related to continuing decline in the residential construction and development markets. |
| • | Net interest margin decreased 60 basis points from the prior year, mainly due to an increased impact related to non-accrual loans, ongoing competitive market pressures to retain deposits and increased on-balance sheet liquidity and lower loan fees. |
| • | Non-interest income increase of $2.3 million, or 12%, related mainly to an increase of mortgage loan sale activity in the first half of the year which resulted in a increase of $3.2 million over the prior year. This was partially offset by a decline in fees and service charges on deposits of $1.6 million due mainly to overdraft fees declining $1.4 million as compared to the prior year related to changes in customer behavior and stricter decision criteria for the payment of overdraft items. The other non-interest income category includes $1.3 million of refunds related to a state excise tax audit, $1.4 million of gains on a merchant bankcard portfolio sale and securities sale income of $213 thousand. |
| • | Non-interest expense declined $82.6 million, or 43%, mainly related to: |
| • | Goodwill impairment charges of $18.9 million as compared to $109.0 million for the prior year. |
| • | Salaries and employee benefits decreased by $7.9 million due to a decline in the number of employees from the prior year as a result of cost saving efforts. |
| • | Occupancy and equipment costs decreased $796 thousand or 5% due to the closures of six branches in the first quarter of 2009. |
| • | The intangible amortization declined as compared to the prior year as the amounts related to the Far West Bancorporation (FWBC) merger are being amortized on an accelerated basis. |
| • | FDIC insurance expense of $7.8 million, or an increase of $5.1 million or 187%, due to increased assessment rates and a special assessment of $850 thousand. |
| • | Foreclosed assets expense increased $16.6 million, or 392%, to $20.9 million, including $16.7 million of valuation adjustments. |
The 2008 financial results were shaped by the following:
| • | Provision for loan losses of $97.2 million, principally related to an increase in non-performing loans and an overall decline in the residential construction and development markets. |
| • | Net interest margin decreased 106 basis points over the prior year related mainly to declines in the market interest rates, an increase in non-accrual loans and competitive market pressures to retain deposits. |
| • | Non-interest income increase of $2.4 million, or 14.4%, related mainly to increases in fees and service charges on deposits of $1.7 million, or 18.2%, increases in fees on mortgage loan sales of $668 |
27
Table of Contents
| thousand, or 21%. The other non-interest income category included income of $589 thousand related to the sale of the bankcard portfolio acquired through the FWBC merger. |
| • | Non-interest expense increase of $122.9 million, or 174%, mainly related to: |
| • | Goodwill impairment charges totaling $109.0 million. |
| • | Salaries and employee benefits increased by $120 thousand, despite only three quarters of expense recorded in 2007 related to the FWBC merger, net of costs associated with the reduction in force initiative of $781 thousand. |
| • | Occupancy and equipment costs increased $3.1 million or 25% due to new facilities acquired in the FWBC merger and new financial centers opened during the prior year. |
| • | Impairment charges related to premises of $693 thousand related mainly to the branch closures which occurred in the first quarter of 2009. |
| • | Other than temporary impairment charge taken on one security of $492 thousand. |
| • | FDIC insurance and other regulatory assessment expense of $2.7 million. |
Net Interest Income. Net interest income decreased 24% to $56.1 million in 2009 compared to $74.0 million in 2008. The decrease in 2009 is primarily due to a smaller earning asset base and increases in non-performing assets for which no interest income is accrued or recognized.
The Company’s tax equivalent net interest margin for 2009 was 3.43% as compared to 4.03% in 2008. The tax equivalent net interest margin for 2007 was 5.09%. The earning assets yield decreased to 5.35% as compared to 6.51% in 2008 and 8.11% in 2007. The decrease in the average yield on loans during 2009 and 2008 is due primarily to the increase in average non-performing loans and decreasing market rates. The interest income on loans includes $2.2 million, $4.4 million and $5.5 million in loan fees for the years ended December 31, 2009, 2008 and 2007, respectively. The decrease in loan fees is related mainly to lower originations over the past two years. The additional on balance sheet liquidity maintained during 2009, impacted net interest income by approximately $1.2 million.
The average cost of funds decreased to 2.25% in 2009 as compared to 3.07% in 2008 and 3.88% in 2007. The decrease from 2008 is due partially to lower market interest rates as compared to the prior year, which were slightly offset by increased market competition for deposits throughout the year.
28
Table of Contents
The following table sets forth information with regard to average balances of assets and liabilities, and interest income from interest earning assets and interest expense on interest bearing liabilities, resultant yields or costs, net interest income, net interest spread (the difference between the average yield on interest earning assets and the average cost of interest bearing liabilities) and the net interest margin:
| Year Ended December 31, | |||||||||||||||||||||||||||
| 2009 | 2008 | 2007 | |||||||||||||||||||||||||
| ($ in thousands) |
Average Balance |
Interest | % | Average Balance |
Interest | % | Average Balance |
Interest | % | ||||||||||||||||||
| Assets | |||||||||||||||||||||||||||
| Loans (1) |
$ | 1,482,606 | $ | 84,704 | 5.71 | % | $ | 1,754,209 | $ | 116,028 | 6.61 | % | $ | 1,585,078 | $ | 130,980 | 8.26 | % | |||||||||
| Taxable securities |
42,307 | 2,053 | 4.85 | % | 49,863 | 2,494 | 5.00 | % | 44,195 | 2,240 | 5.07 | % | |||||||||||||||
| Nontaxable securities (2) |
14,832 | 915 | 6.17 | % | 19,450 | 1,177 | 6.05 | % | 17,127 | 1,047 | 6.11 | % | |||||||||||||||
| Federal Home Loan Bank stock |
10,099 | — | 0.00 | % | 9,303 | 97 | 1.04 | % | 7,367 | 45 | 0.61 | % | |||||||||||||||
| Overnight deposits with other banks and other |
94,790 | 349 | 0.37 | % | 12,680 | 273 | 2.15 | % | 5,970 | 336 | 5.63 | % | |||||||||||||||
| Total interest earning assets |
1,644,634 | 88,021 | 5.35 | % | 1,845,505 | 120,069 | 6.51 | % | 1,659,737 | 134,648 | 8.11 | % | |||||||||||||||
| Non-interest earning assets |
144,325 | 219,468 | 226,912 | ||||||||||||||||||||||||
| Total assets |
$ | 1,788,959 | $ | 2,064,973 | $ | 1,886,649 | |||||||||||||||||||||
| Liabilities | |||||||||||||||||||||||||||
| Interest bearing demand deposits |
$ | 172,634 | $ | 724 | 0.42 | % | $ | 135,167 | $ | 712 | 0.53 | % | $ | 130,553 | $ | 996 | 0.76 | % | |||||||||
| Savings and MMDA deposits |
401,026 | 5,471 | 1.36 | % | 498,807 | 9,904 | 1.99 | % | 500,367 | 15,227 | 3.04 | % | |||||||||||||||
| Time deposits |
667,261 | 19,380 | 2.90 | % | 618,594 | 24,601 | 3.98 | % | 493,323 | 24,079 | 4.88 | % | |||||||||||||||
| Total interest bearing deposits |
1,240,921 | 25,575 | 2.06 | % | 1,252,568 | 35,217 | 2.81 | % | 1,124,243 | 40,302 | 3.58 | % | |||||||||||||||
| Overnight borrowings |
48,621 | 438 | 0.90 | % | 51,109 | 1,564 | 3.06 | % | 34,422 | 1,856 | 5.39 | % | |||||||||||||||
| Junior subordinated debt |
41,239 | 2,547 | 6.18 | % | 41,239 | 2,762 | 6.70 | % | 36,720 | 2,754 | 7.50 | % | |||||||||||||||
| Other borrowings |
75,101 | 3,024 | 4.03 | % | 146,170 | 6,173 | 4.22 | % | 98,819 | 5,291 | 5.35 | % | |||||||||||||||
| Total interest bearing liabilities |
1,405,882 | 31,584 | 2.25 | % | 1,491,086 | 45,716 | 3.07 | % | 1,294,204 | 50,203 | 3.88 | % | |||||||||||||||
| Non-interest bearing demand deposits |
292,974 | 319,089 | 318,878 | ||||||||||||||||||||||||
| Other non-interest bearing liabilities |
25,908 | 24,308 | 19,301 | ||||||||||||||||||||||||
| Total liabilities |
1,724,764 | 1,834,483 | 1,632,383 | ||||||||||||||||||||||||
| Total Stockholders’ Equity | 64,195 | 230,490 | 254,266 | ||||||||||||||||||||||||
| Total liabilities and stockholders’ equity |
$ | 1,788,959 | $ | 2,064,973 | $ | 1,886,649 | |||||||||||||||||||||
| Net interest income and spread |
$ | 56,437 | 3.10 | % | $ | 74,353 | 3.44 | % | $ | 84,445 | 4.23 | % | |||||||||||||||
| Net interest margin to average earning assets |
3.43 | % | 4.03 | % | 5.09 | % | |||||||||||||||||||||
29
Table of Contents
The following table sets forth a summary of changes in the components of net interest income due to changes in average interest earning assets and interest earning liabilities and the resultant changes in interest income and interest expense:
| 2009 vs 2008 | 2008 vs 2007 | |||||||||||||||||||||||
| ($ in thousands) |
Increase (decrease) in net interest income due to changes in | |||||||||||||||||||||||
| Volume | Rate | Total | Volume | Rate | Total | |||||||||||||||||||
| Interest earning assets |
||||||||||||||||||||||||
| Loans (1) |
$ | (17,953 | ) | $ | (13,371 | ) | $ | (31,324 | ) | $ | 13,938 | $ | (28,890 | ) | $ | (14,952 | ) | |||||||
| Securities (2) |
(643 | ) | (60 | ) | (703 | ) | 428 | (44 | ) | 384 | ||||||||||||||
| Overnight deposits with other banks and FHLB stock |
1,392 | (1,413 | ) | (21 | ) | 247 | (258 | ) | (11 | ) | ||||||||||||||
| Total interest earning assets |
$ | (17,204 | ) | $ | (14,844 | ) | $ | (32,048 | ) | $ | 14,613 | $ | (29,192 | ) | $ | (14,579 | ) | |||||||
| Interest bearing liabilities |
||||||||||||||||||||||||
| Interest bearing demand deposits |
$ | 199 | $ | (187 | ) | $ | 12 | $ | 35 | $ | (319 | ) | $ | (284 | ) | |||||||||
| Savings and MMDA deposits |
(1,946 | ) | (2,487 | ) | (4,433 | ) | (47 | ) | (5,276 | ) | (5,323 | ) | ||||||||||||
| Time deposits |
1,937 | (7,158 | ) | (5,221 | ) | 6,098 | (5,576 | ) | 522 | |||||||||||||||
| Total interest bearing deposits |
190 | (9,832 | ) | (9,642 | ) | 6,086 | (11,171 | ) | (5,085 | ) | ||||||||||||||
| Overnight borrowings |
(76 | ) | (1,050 | ) | (1,126 | ) | 897 | (1,189 | ) | (292 | ) | |||||||||||||
| Junior subordinated debt |
— | (215 | ) | (215 | ) | 338 | (330 | ) | 8 | |||||||||||||||
| Other borrowings |
(2,999 | ) | (150 | ) | (3,149 | ) | 2,528 | (1,646 | ) | 882 | ||||||||||||||
| Total interest bearing liabilities |
(2,885 | ) | (11,247 | ) | (14,132 | ) | 9,849 | (14,336 | ) | (4,487 | ) | |||||||||||||
| Total increase (decrease) in net interest income |
$ | (14,319 | ) | $ | (3,597 | ) | $ | (17,916 | ) | $ | 4,764 | $ | (14,856 | ) | $ | (10,092 | ) | |||||||
| (1) | Includes loans held for sale and non-performing loans in average loans. Interest income includes loan fee income. |
| (2) | Tax-exempt securities income has been presented using a tax equivalent basis and an assumed tax rate of 34%. |
The interest rates on loans vary with the degree of risk and amount of the loan, and are further subject to competitive pressures, market rates, the availability of funds and government regulations. As of December 31, 2009 and 2008, approximately 70% and 71%, respectively, of the total loans had interest rates that adjust based on a spread to market reference rates. The market reference rates are based on various indices such as the prime rates of interest charged by money center banks, the Federal Home Loan Bank of Seattle (FHLB) borrowing rates or London Interbank Offering Rates (LIBOR). Some of these rate adjustments are immediate while some will reprice at intervals of up to five years.
Provision for Loan Losses. The provision for loan losses was $50.3 million in 2009 as compared to $97.2 million in 2008 and $17.3 million in 2007. The decrease as compared to the previous year is due principally to the charge-offs of $59.9 million as compared to $78.6 million in 2008. Additionally, both years continue to reflect the deterioration in the residential construction and development segment of the loan portfolio which began in late 2007.
The provision for loan losses is an estimate and the use of different estimates or assumptions could produce a different provision for loan losses. If negative trends and expectations of management do not materialize, the allowance may be high relative to the actual loss performance of the loan portfolio. This may lead to decreased future provisions. Additionally, if negative trends and expectations of management are worse than anticipated, it may lead to increased future provisions.
30
Table of Contents
Non-interest Income. Non-interest income increased $2.3 million to $20.9 million for 2009 as compared to $18.7 million in 2008. Non-interest income was $16.3 million in 2007. The following table summarizes certain non-interest income categories for the years ended December 31, 2009, 2008 and 2007.
| 2009 compared to 2008 | 2008 compared to 2007 | ||||||||||||||||||||||||||
| ($ in thousands) |
2009 | 2008 | Dollar Change |
Percent Change |
2008 | 2007 | Dollar Change |
Percent Change |
|||||||||||||||||||
| Fees and service charges on deposits |
$ | 9,279 | $ | 10,870 | $ | (1,591 | ) | -15 | % | $ | 10,870 | $ | 9,199 | $ | 1,671 | 18 | % | ||||||||||
| Fees on mortgage loan sales |
7,005 | 3,843 | 3,162 | 82 | % | 3,843 | 3,175 | 668 | 21 | % | |||||||||||||||||
| Bankcard revenue |
666 | 1,266 | (600 | ) | -47 | % | 1,266 | 1,110 | 156 | 14 | % | ||||||||||||||||
| Bank owned life insurance |
1,014 | 1,089 | (75 | ) | -7 | % | 1,089 | 1,007 | 82 | 8 | % | ||||||||||||||||
| Asset sale income |
1,003 | 822 | 181 | 22 | % | 822 | 507 | 315 | 62 | % | |||||||||||||||||
| Foreclosed asset gain (loss) and income |
(254 | ) | 86 | (340 | ) | -395 | % | 86 | 320 | (234 | ) | -73 | % | ||||||||||||||
| Other |
2,215 | 691 | 1,524 | 221 | % | 691 | 998 | (307 | ) | -31 | % | ||||||||||||||||
| Total |
$ | 20,928 | $ | 18,667 | $ | 2,261 | 12.1 | % | $ | 18,667 | $ | 16,316 | $ | 2,351 | 14.4 | % | |||||||||||
The decreased income related to fees and service charges on deposits in 2009 is mainly attributable to overdraft fees and debit card fees declining as a result of changes in customer behavior. The increase in fees on mortgage loan sales is related to increased activity during the first half of year as mortgage rates and secondary market pricing were favorable. Asset sale income increased due to gains recorded in connection with the sale of a merchant bankcard portfolio of $1.4 million during the year. The increase in other non-interest income is related mainly to an excise tax audit which resulted in a refund of $1.3 million, net of professional fees.
Non-interest Expense. Non-interest expense decreased by 43% to $111.0 million in 2009 compared to $193.6 million in 2008. Excluding the goodwill impairment charges in 2009 and 2008, non-interest expense increased 9% or $7.5 million. Non-interest expense for 2007 was $70.8 million. The following table summarizes the major non-interest expense categories for the years ended December 31, 2009, 2008 and 2007.
| 2009 compared to 2008 | 2008 compared to 2007 | ||||||||||||||||||||||||||||
| ($ in thousands) |
2009 | 2008 | Dollar change |
Percent change |
2008 | 2007 | Dollar Change |
Percent Change |
|||||||||||||||||||||
| Salaries and employee benefits |
$ | 33,444 | $ | 41,332 | $ | (7,888 | ) | -19 | % | $ | 41,332 | $ | 41,212 | $ | 120 | 0 | % | ||||||||||||
| Foreclosed assets |
20,869 | 4,241 | 16,628 | 392 | % | 4,241 | 644 | 3,597 | 559 | % | |||||||||||||||||||
| Goodwill impairment |
18,852 | 109,000 | (90,148 | ) | -83 | % | 109,000 | — | 109,000 | 100 | % | ||||||||||||||||||
| Occupancy and equipment |
14,618 | 15,414 | (796 | ) | -5 | % | 15,414 | 12,316 | 3,098 | 25 | % | ||||||||||||||||||
| FDIC insurance |
7,776 | 2,711 | 5,065 | 187 | % | 2,711 | 105 | 2,606 | 2482 | % | |||||||||||||||||||
| Amortization of intangible assets |
2,864 | 3,475 | (611 | ) | -18 | % | 3,475 | 3,480 | (5 | ) | 0 | % | |||||||||||||||||
| Bankcard and Debit card |
1,429 | 1,692 | (263 | ) | -16 | % | 1,692 | 1,318 | 374 | 28 | % | ||||||||||||||||||
| Loans |
1,150 | 1,203 | (53 | ) | -4 | % | 1,203 | 428 | 775 | 181 | % | ||||||||||||||||||
| State business and occupancy tax |
632 | 1,120 | (488 | ) | -44 | % | 1,120 | 1,290 | (170 | ) | -13 | % | |||||||||||||||||
| Advertising |
553 | 894 | (341 | ) | -38 | % | 894 | 972 | (78 | ) | -8 | % | |||||||||||||||||
| Regulatory and audit |
510 | 549 | (39 | ) | -7 | % | 549 | 503 | 46 | 9 | % | ||||||||||||||||||
| Supplies |
390 | 766 | (376 | ) | -49 | % | 766 | 1,041 | (275 | ) | -26 | % | |||||||||||||||||
| FRB and correspondent bank fees |
266 | 515 | (249 | ) | -48 | % | 515 | 572 | (57 | ) | -10 | % | |||||||||||||||||
| Impairment of premises and securities |
202 | 1,185 | (983 | ) | -83 | % | 1,185 | 219 | 966 | 441 | % | ||||||||||||||||||
| Legal |
100 | 794 | (694 | ) | -87 | % | 794 | 286 | 508 | 178 | % | ||||||||||||||||||
| Provision for unused commitments |
(204 | ) | (714 | ) | 510 | -71 | % | (714 | ) | 236 | (950 | ) | -403 | % | |||||||||||||||
| Other |
7,557 | 9,440 | (1,883 | ) | -20 | % | 9,440 | 6,145 | 3,295 | 54 | % | ||||||||||||||||||
| Total |
$ | 111,008 | $ | 193,617 | $ | (82,609 | ) | -43 | % | $ | 193,617 | $ | 70,767 | $ | 122,850 | 174 | % | ||||||||||||
31
Table of Contents
The years ended December 31, 2009 and 2008 included goodwill impairment charges of $18.9 million and $109.0 million, respectively. Excluding these items non-interest expenses would have been $92.2 million and $84.6 million for 2009 and 2008, respectively, representing an increase of 9% for 2009. The significant increase in the foreclosed assets expense is due mainly to $16.7 million of valuation adjustments recorded in 2009 as compared to $3.1 million in 2008, and $4.2 million of associated costs, such as legal, tax and insurance costs, recorded in 2009 as compared to $1.1 million in 2008. The increase in the FDIC insurance expense is related to a special assessment during the year and increased assessment rates. The decrease in salaries and employee benefits from 2009 to 2008 is due mainly to fewer employees as compared to the prior year.
Benefit or Provision for Income Tax. The income tax benefit as a percentage of the net loss before the benefit for income tax for the year ended December 31, 2009 was 15.6%. Excluding the benefit for the goodwill impairment charge of $18.9 million, the benefit of the 5 year carry back election, and the deferred tax valuation allowance of $37.6 million, the benefit for income tax would have been 35.8% for 2009. The benefit recorded in the current year is due to the new law enacted which allowed the Company to carry back net losses for 5 years, subject to certain limitations, as compared to the prior 2 year carry back limitation. The income tax benefit as a percentage of the net loss before the benefit for income tax for the year ended December 31, 2008 was 2.9%. For the year ended December 31, 2008, excluding the goodwill impairment charge of $109.0 million and the deferred tax valuation allowance of $26.9 million, the benefit for income tax would have been 35.7%. These compare to a provision for income tax of 30.6% for the year ended December 31, 2007.
As of December 31, 2009, the Company had $37.6 million of deferred tax assets, for which a corresponding valuation allowance was recorded. The valuation allowance was deemed appropriate given the cumulative loss position and income tax carry-back and carry-forward availability and the difficulty of predicting future operating results. Management concluded that it is more likely than not that the majority of the net deferred tax assets will not be utilized in light of uncertainties surrounding the Company’s ability to generate sufficient future taxable income. At December 31, 2008, the Company had $26.9 million of net deferred tax assets and a corresponding valuation allowance recorded. During the year ended December 31, 2008, an income tax provision was recognized of $26.9 million related to the valuation allowance.
To the extent that the Company can generate taxable income in the future sufficient to offset the tax deductions represented by the net deferred tax asset, the non-cash valuation allowance that has been established may be partially or entirely reduced. If the valuation allowance is reduced or eliminated, future tax benefits will be recognized that will have a positive non-cash impact on the Company’s net income and stockholders’ equity.
Balance Sheet Management
Lending and Credit Risk Management. The Company follows loan policies that establish limits on loan commitments by loan type, credit review and grading criteria, and other matters such as loan administration, loans to affiliates, loan costs, problem loans and loan loss reserves, and related items. Loans are analyzed at origination and on a periodic basis as conditions warrant as outlined in the Company’s loan policies.
Management has established guidelines and underwriting policies for approval of all loan applications. Delegated credit approval limits generally vary according to the type of loan and the lender’s experience. The maximum loan approval limits per aggregate relationship that are available to any one employee are established up to $7.5 million. Aggregate lending relationships in excess of $7.5 million require the approval of the credit committee, which is comprised of members of executive management with oversight provided by the Board of Directors.
In addition to its internal credit approval and review processes, the Company engages independent third parties to review a significant sample of the loan portfolio on a periodic basis to determine any weaknesses in the portfolio and to assess the general quality of credit underwriting and monitoring. The results of the reviews are presented to the Chief Credit Officer, Credit and Risk Committee and the Audit and Compliance Committee. If an individual loan or credit relationship has a weakness identified during the review process, the loans comprising a credit relationship will generally be downgraded to a classification that most closely matches the current risk level.
32
Table of Contents
Under applicable state laws, loans by the Bank to a single borrower or related entity are limited. The Bank may purchase or sell whole or portions of loans without recourse to third parties. At December 31, 2009 and 2008, the outstanding balance of loan participations sold was $42.8 million and $43.0 million, respectively. At December 31, 2009 and 2008, the Bank had outstanding purchased loans of $59.4 million and $63.2 million, respectively.
During the year ended December 31, 2005, the Bank purchased $76.2 million loans at a premium. At December 31, 2009 and 2008, the remaining unamortized premium on these purchased loans was $246 thousand and $301 thousand, respectively, and is included in the commercial real estate loan category with the remaining principal on these loans. The remaining balance of these loans at December 31, 2009 was $52.9 million, all of which was classified as performing.
Loan Portfolio. The aggregate maturities of Commercial, Industrial and Agricultural and Construction – Real Estate loans in the Bank’s portfolio at December 31, 2009 are shown in the following table. Additionally, the table identifies the balance of loans with variable and adjustable interest rates which mature in greater than one year. Actual maturities may differ from the contractual maturities shown below as a result of renewals and prepayments:
| Maturity | Loans Over One Year By Rate Sensitivity | |||||||||||||||||
| ($ in thousands) |
Less than 1 year |
1-5 years | Thereafter | Total | Fixed Rate |
Variable Rate | ||||||||||||
| Commercial, Industrial and Agriculture |
$ | 127,568 | $ | 91,671 | $ | 53,871 | $ | 273,110 | $ | 71,411 | $ | 201,699 | ||||||
| Construction—Real Estate |
103,943 | 10,711 | — | 114,654 | 51,876 | 62,778 | ||||||||||||
| Total |
$ | 231,511 | $ | 102,382 | $ | 53,871 | $ | 387,764 | $ | 123,287 | $ | 264,477 | ||||||
The following table provides a summary of the major categories of loans and the percentage of the total composition for each as of December 31, 2009 and 2008:
| ($ in thousands) |
2009 | % of Total |
2008 | % of Total |
||||||||
| Commercial real estate |
$ | 627,984 | 49 | % | $ | 630,540 | 39 | % | ||||
| Residential Real Estate |
183,320 | 15 | % | 200,047 | 12 | % | ||||||
| Construction, land development and other land |
168,454 | 13 | % | 388,381 | 24 | % | ||||||
| Agricultural |
142,404 | 11 | % | 160,944 | 10 | % | ||||||
| Commercial and industrial |
130,705 | 10 | % | 215,776 | 13 | % | ||||||
| Installment and other |
19,040 | 2 | % | 28,777 | 2 | % | ||||||
| Total loans |
$ | 1,271,907 | 100 | % | $ | 1,624,465 | 100 | % | ||||
Management has assessed, and will continue to assess on an on-going basis, the effect of the economy within the Bank’s principal market area on the credit risk in the loan portfolio, and of overall economic conditions on the entire balance sheet. Management recognizes certain geographical concentrations in the market areas serviced and continues to closely monitor the Bank’s credit quality and to focus on identifying potential problem credits and any loss exposure in a timely manner. Industry concentration and related limits will continue to be subject to on-going assessments.
The commercial real estate category in the table above includes investor commercial real estate balances of $385.5 million and $377.0 million at December 31, 2009 and 2008, respectively. The investor commercial real estate balances include $94.0 million and $106.1 million of multi-family commercial real estate as of December 31, 2009 and 2008, respectively.
33
Table of Contents
The following table provides a further breakdown of the construction, land development and other land loans category as of December 31, 2009 and 2008. The Order limits the origination of future construction and land development loans except in certain limited circumstances.
| ($ in thousands) |
2009 | % of Total |
2008 | % of Total |
||||||||
| Residential land development |
$ | 68,389 | 41 | % | $ | 173,065 | 45 | % | ||||
| Investor commercial construction |
45,611 | 27 | % | 87,241 | 22 | % | ||||||
| Raw land |
21,717 | 13 | % | 10,074 | 3 | % | ||||||
| Owner occupied commercial construction |
10,657 | 6 | % | 42,922 | 11 | % | ||||||
| Builder spec |
8,397 | 5 | % | 38,895 | 10 | % | ||||||
| Residential consumer |
5,917 | 4 | % | 31,223 | 8 | % | ||||||
| Builder custom |
152 | 0 | % | 576 | 0 | % | ||||||
| Other |
7,614 | 4 | % | 4,385 | 1 | % | ||||||
| Total construction, land development and other land |
$ | 168,454 | 100 | % | $ | 388,381 | 100 | % | ||||
As of December 31, 2009, the Bank’s largest 20 credit relationships consisted of loans and loan commitments ranging from $5.9 million to $17.9 million, with an aggregate total credit exposure of $167.7 million and outstanding balances of $161.2 million. Bank management believes that these credits were originally underwritten in an appropriate manner and structured to minimize the Bank’s potential exposure to loss. Of this total $56.8 million is related to commercial construction or land acquisition and development loans of which $29.8 million was classified as non-performing as of December 31, 2009. Charge-offs totaling $7.7 million were recorded during the year ended December 31, 2009, related to these relationships.
Asset Quality and Non-performing Assets. Non-performing assets include loans that are 90 or more days past due or in non-accrual status, and real estate and other loan collateral acquired through foreclosure and repossession. Accruing loans 90 days or more past due may remain on an accrual basis if they are adequately collateralized and in the process of collection. For non-accrual loans, no interest income is recognized unless the borrower demonstrates an ability to resume payments of principal and interest, and the loan is returned to accrual status. Interest previously accrued, but not collected, is reversed and charged against income at the time a loan is placed on non-accrual status.
The following table provides information related to the Company’s non-performing assets:
| As December 31, | ||||||||||||||||||||
| ($ in thousands) |
2009 | 2008 | 2007 | 2006 | 2005 | |||||||||||||||
| Non-performing loans: |
||||||||||||||||||||
| Non-accrual loans |
$ | 105,271 | $ | 91,744 | $ | 39,098 | $ | 11,500 | $ | 14,452 | ||||||||||
| Accruing loans 90 days or more past due |
— | — | — | — | 31 | |||||||||||||||
| Total non-performing loans |
105,271 | 91,744 | 39,098 | 11,500 | 14,483 | |||||||||||||||
| Other real estate owned and other repossessed assets |
53,383 | 15,781 | 1,230 | 644 | 2,221 | |||||||||||||||
| Total non-performing assets |
$ | 158,654 | $ | 107,525 | $ | 40,328 | $ | 12,144 | $ | 16,704 | ||||||||||
| Allowance for loan losses |
$ | 38,999 | $ | 44,722 | $ | 25,258 | $ | 15,136 | $ | 13,895 | ||||||||||
| Reserve for unfunded commitments |
456 | 660 | 1,374 | 881 | 466 | |||||||||||||||
| Allowance for credit losses |
$ | 39,455 | $ | 45,382 | $ | 26,632 | $ | 16,017 | $ | 14,361 | ||||||||||
| Restructured loans (1) |
$ | 6,995 | $ | — | $ | — | $ | — | $ | — | ||||||||||
| Restructured loans included in non-accrual loans |
$ | 9,173 | $ | — | $ | — | $ | — | $ | — | ||||||||||
| Government guarantee portion of loans excluded from non-performing loans |
$ | 2,629 | $ | 1,572 | $ | 992 | $ | 3,978 | $ | 1,225 | ||||||||||
| Ratio of total non-performing assets to total assets |
9.58 | % | 5.74 | % | 1.90 | % | 0.86 | % | 1.51 | % | ||||||||||
| Ratio of total non-performing loans to total loans |
8.28 | % | 5.65 | % | 2.21 | % | 0.94 | % | 1.50 | % | ||||||||||
| Ratio of allowance for credit losses to total non-performing loans |
37.48 | % | 49.47 | % | 68.12 | % | 139.28 | % | 99.16 | % | ||||||||||
34
Table of Contents
| (1) | Represents accruing restructured loans performing according to their restructured terms. |
Total non-performing assets were $158.7 million or 9.58% of total assets as of December 31, 2009. This compares to $107.5 million or 5.74% of total assets, at December 31, 2008. These amounts exclude government guarantees of $2.6 million and $1.6 million for the years ended December 31, 2009 and 2008, respectively. The total non-performing loans, net of government guarantees, consisted of the following categories at December 31, 2009 and 2008:
| ($ in thousands) |
2009 | % of Non-performing |
2008 | % of Non-performing |
||||||||
| Construction, land development and other land |
$ | 60,849 | 58 | % | $ | 73,729 | 80 | % | ||||
| Commercial real estate |
25,999 | 25 | % | 11,097 | 12 | % | ||||||
| Residential Real Estate |
7,659 | 7 | % | 1,156 | 1 | % | ||||||
| Commercial and industrial |
6,099 | 6 | % | 5,214 | 6 | % | ||||||
| Agricultural |
4,588 | 4 | % | 516 | 1 | % | ||||||
| Installment and other |
77 | 0 | % | 32 | 0 | % | ||||||
| Total loans |
$ | 105,271 | 100 | % | $ | 91,744 | 100 | % | ||||
The total non-performing loans, net of government guarantees, by state at December 31, 2009 and 2008 are summarized below:
| ($ in thousands) |
2009 | % of Non-performing |
2008 | % of Non-performing |
||||||||
| Utah |
$ | 68,684 | 65 | % | $ | 51,103 | 56 | % | ||||
| Washington |
20,836 | 20 | % | 24,528 | 27 | % | ||||||
| New Hampshire |
10,632 | 10 | % | — | 0 | % | ||||||
| Idaho |
4,980 | 5 | % | 502 | 1 | % | ||||||
| California |
139 | 0 | % | 3,548 | 4 | % | ||||||
| Arizona |
— | 0 | % | 11,998 | 13 | % | ||||||
| Oregon |
— | 0 | % | 65 | 0 | % | ||||||
| Total loans |
$ | 105,271 | 100 | % | $ | 91,744 | 100 | % | ||||
The following is a summary of the activity of the non-performing loans during the years ended December 31, 2009 and 2008:
| ($ in thousands) |
2009 | 2008 | ||||||
| Beginning balance |
$ | 91,744 | $ | 39,098 | ||||
| Additions and other |
178,750 | 185,385 | ||||||
| Charge-offs |
(59,904 | ) | (78,560 | ) | ||||
| Paydowns and sales |
(24,399 | ) | (24,635 | ) | ||||
| Reclassified to foreclosed real estate |
(80,920 | ) | (29,544 | ) | ||||
| Ending balance |
$ | 105,271 | $ | 91,744 | ||||
The Bank has evaluated adequacy for all collateral dependent impaired loans that are included in non-performing loans and believes the carrying values are supported by underlying collateral values as of the date of this Report. Had the non-performing loans been performing during the years ended December 31, 2009, 2008 and 2007, the Company would have recognized an additional $4.3 million, $4.3 million and $1.3 million in interest income, respectively. During the year ended December 31, 2009, the Bank recognized $3.3 million of interest income related to non-performing loans through interest payments received prior to the loan being moved
35
Table of Contents
to non-accrual status. There has not been any interest income recognized during the year ended December 31, 2009, on loans after they were moved to non-accrual status.
As of December 31, 2009, other real estate owned (OREO) totaled $53.4 million, as compared to $15.8 million at December 31, 2008. The OREO at December 31, 2009 was all comprised of real estate.
OREO at December 31, 2009 was comprised of 45 properties, the largest of which is a residential land development project in Spokane County, Washington with a carrying value of $9.7 million. The weighted average holding period for properties held as of December 31, 2009 was approximately five months. The OREO properties held at December 31, 2009 have had prior loan and OREO charge-offs totaling $75.7 million.
The Company pursues an active liquidation strategy designed to condense holding periods and carrying costs associated with OREO. Marketing strategies commence during the foreclosure process, prior to ownership of the foreclosed asset. During 2009, the Company liquidated 44 OREO properties that had a weighted average duration of time from foreclosure to sale of approximately four months.
The following table sets forth the major components of the changes in OREO and foreclosed property during 2009:
| For the year ending December 31, | ||||||||||||||
| 2009 | 2008 | |||||||||||||
| ($ in thousands) |
Amount | Number | Amount | Number | ||||||||||
| Beginnng balance |
$ | 15,781 | 22 | $ | 1,230 | 4 | ||||||||
| Additions to OREO |
80,920 | 67 | 29,544 | 48 | ||||||||||
| Valuation adjustments |
(16,669 | ) | — | (3,071 | ) | — | ||||||||
| Disposition of OREO |
(26,649 | ) | (44 | ) | (11,922 | ) | (30 | ) | ||||||
| Ending balance |
$ | 53,383 | 45 | $ | 15,781 | 22 | ||||||||
The following table sets forth the OREO balances by type as of December 31, 2009 and 2008:
| As of December 31, | ||||||||||
| 2009 | 2008 | |||||||||
| ($ in thousands) |
Amount | Properties | Amount | Properties | ||||||
| Land development |
$ | 35,283 | 21 | $ | 4,722 | 5 | ||||
| Commercial |
7,814 | 9 | 211 | 1 | ||||||
| Multi-family |
7,862 | 8 | 7,804 | 2 | ||||||
| Single family residential |
2,424 | 7 | 2,994 | 14 | ||||||
| Other foreclosed assets |
— | — | 50 | — | ||||||
| Total |
$ | 53,383 | 45 | $ | 15,781 | 22 | ||||
The following table sets forth the OREO balances by state as of December 31, 2009 and 2008:
| ($ in thousands) |
As of December 31, | |||||||||
| 2009 | 2008 | |||||||||
| Amount | Number | Amount | Number | |||||||
| Utah |
$ | 34,272 | 28 | $ | 11,933 | 15 | ||||
| Washington |
13,024 | 11 | 364 | 2 | ||||||
| Arizona |
3,885 | 1 | — | — | ||||||
| Idaho |
2,202 | 5 | 3,484 | 5 | ||||||
| Total |
$ | 53,383 | 45 | $ | 15,781 | 22 | ||||
36
Table of Contents
Analysis of Allowance for Loan Losses
The allowance for loan losses is established to absorb known losses primarily resulting from loans outstanding as of the statement of financial condition date. Accordingly, all loan losses are charged to the allowance and all recoveries are credited to it. The provision for loan losses charged to operating expense is based on past credit loss experience and other factors which in management’s judgment deserve current recognition in estimating probable credit losses. Such other factors include growth and composition of the loan portfolio, credit concentrations, trends in portfolio volume, maturities, delinquencies and non-accruals, historical loss trends and general economic conditions. While management uses the best information available to base its estimates, future adjustments to the allowance may be necessary if economic conditions, particularly in the Company’s market areas, differ substantially from the assumptions initially used. In addition, various regulatory agencies, as an integral part of their examination process, periodically review the Company’s allowance for loan losses. Such agencies may require the Company to recognize additions to the allowance based on their judgments about information available to them at the time of their examination.
The Company utilizes a loan loss reserve methodology and documentation process which it believes is consistent with SEC, GAAP, and bank regulatory requirements. These accounting rules require specific identification of an allowance for loan loss for an impaired loan. To this end, the Company developed a systematic methodology using a nine-grade risk rating system to determine its allowance for loan losses. Current collateral values, less costs to sell, are considered in cases where this type of analysis is applicable. On a quarterly basis, the allowance is recalculated using the methodology to determine if the allowance is adequate.
This methodology includes a detailed analysis of the loan portfolio that is performed by competent and well-trained personnel who have the skills and experience to perform analyses, estimates, reviews and other loan loss methodology functions. All loans are considered in the analysis, either on an individual or group basis, using current data. Loans are evaluated for impairment on an individual basis, if applicable, and the remainder of the portfolio is segmented into groups of loans with similar risk characteristics. The methodology considers the probability of default and severity of the loss by loan category based on empirical portfolio information. These probabilities and severities were determined based on a historical analysis of the loan portfolio. Additionally, the methodology includes consideration of particular risks inherent in different kinds of lending. Management believes that the allowance for loan losses is adequate as of December 31, 2009.
At December 31, 2009 and 2008, the Company had $80.6 million and $102.9 million, respectively of loans that were not classified as non-performing but for which known information about the borrowers’ financial conditions caused management to have concern about the ability of the borrowers to comply with the repayment terms of the loans. These loans were identified through the loan review process described above that provides for assignment of a risk rating based on a nine-grade scale. Based on the evaluation of current market conditions, loan collateral, other secondary sources of repayment and cash flow generation, management does not anticipate any significant losses related to these loans. These loans are subject to continuing management attention and are considered in the determination of the allowance for loan losses. A decline in the economic conditions in the Company’s market areas or other factors could adversely impact individual borrowers or the loan portfolio in general. Accordingly, there can be no assurance that other loans will not become 90 days or more past due, be placed on non-accrual status or transferred to foreclosed real estate and other foreclosed assets in the future.
37
Table of Contents
The following table sets forth information by loan type regarding charge-offs and recoveries in the Company’s allowance for loan losses for the years ended December 31:
| ($ in thousands) |
2009 | 2008 | 2007 | 2006 | 2005 | |||||||||||||||
| Balance of allowance for loan losses at beginning of period |
$ | 44,722 | $ | 25,258 | $ | 15,136 | $ | 13,895 | $ | 18,282 | ||||||||||
| Charge-offs |
||||||||||||||||||||
| Commercial real estate |
5,255 | 1,335 | 1,383 | 218 | 3,394 | |||||||||||||||
| Construction, land development, and other land |
39,124 | 71,292 | 2,475 | 54 | 614 | |||||||||||||||
| Commercial and industrial |
6,163 | 4,114 | 9,449 | 6,015 | 1,023 | |||||||||||||||
| Agricultural |
1,087 | 627 | 211 | 363 | 908 | |||||||||||||||
| Residential real estate |
7,204 | 692 | 649 | 43 | 160 | |||||||||||||||
| Installment and other |
1,071 | 500 | 1,103 | 328 | 826 | |||||||||||||||
| Total charge-offs |
59,904 | 78,560 | 15,270 | 7,021 | 6,925 | |||||||||||||||
| Recoveries |
||||||||||||||||||||
| Commercial real estate |
147 | 351 | 10 | 93 | 87 | |||||||||||||||
| Construction, land development, and other land |
622 | 208 | — | — | 17 | |||||||||||||||
| Commercial and industrial |
2,656 | 57 | 245 | 171 | 88 | |||||||||||||||
| Agricultural |
192 | 20 | — | 341 | 10 | |||||||||||||||
| Residential real estate |
79 | 8 | 28 | 2 | 72 | |||||||||||||||
| Installment and other |
155 | 210 | 239 | 211 | 172 | |||||||||||||||
| Total recoveries |
3,851 | 854 | 522 | 818 | 446 | |||||||||||||||
| Net charge-offs |
56,053 | 77,706 | 14,748 | 6,203 | 6,479 | |||||||||||||||
| Provision for loan losses |
50,330 | 97,170 | 17,341 | 5,376 | 2,092 | |||||||||||||||
| Allowance acquired through acquisition |
— | — | 7,529 | 2,068 | — | |||||||||||||||
| Balance of allowance for loan losses at end of period |
$ | 38,999 | $ | 44,722 | $ | 25,258 | $ | 15,136 | $ | 13,895 | ||||||||||
| Ratio of net charge-offs to average loans |
3.78 | % | 4.43 | % | 0.93 | % | 0.54 | % | 0.68 | % | ||||||||||
| Ratio of provision for loan losses to average loans |
3.39 | % | 5.54 | % | 1.09 | % | 0.47 | % | 0.22 | % | ||||||||||
| Recoveries as a percentage of charge-offs |
6.43 | % | 1.09 | % | 3.42 | % | 11.65 | % | 6.44 | % | ||||||||||
| Average loans outstanding during the period |
$ | 1,482,606 | $ | 1,754,209 | $ | 1,585,078 | $ | 1,145,558 | $ | 952,151 | ||||||||||
38
Table of Contents
The following table presents an allocation of the allowance for loan losses by category. In making the allocation, consideration was given to such factors as management’s evaluation of risk in each category, current economic conditions and charge-off experience. An allocation of the allowance for loan losses is an estimate of the portion of the allowance which will be used to cover future charge-offs in each loan category, but it does not preclude any portion of the allowance allocated to one type of loan from being used to absorb losses of another loan type. It is the Company’s general policy to recognize as charge-offs any specific loan impairments for known losses in lieu of carrying such amounts as a specific component of the allowance for loan losses. As of December 31, 2009, the Company had $4.6 million of specific reserves. At December 31, 2008, the Company did not have any specific reserves.
| For the year ended December 31, | ||||||||||||||||||||||||||||||
| 2009 | 2008 | 2007 | 2006 | 2005 | ||||||||||||||||||||||||||
| ($ in thousands) |
Amount of Allowance |
Loans to Gross Loans |
Amount of Allowance |
Loans to Gross Loans |
Amount of Allowance |
Loans to Gross Loans |
Amount of Allowance |
Loans to Gross Loans |
Amount of Allowance |
Loans to Gross Loans |
||||||||||||||||||||
| Commercial real estate |
$ | 16,169 | 49 | % | $ | 9,636 | 39 | % | $ | 6,281 | 33 | % | $ | 5,251 | 43 | % | $ | 4,769 | 44 | % | ||||||||||
| Construction, land development and other land |
11,313 | 13 | % | 21,405 | 24 | % | 9,611 | 30 | % | 2,197 | 19 | % | 1,719 | 17 | % | |||||||||||||||
| Commercial and industrial |
3,558 | 10 | % | 5,557 | 13 | % | 4,444 | 18 | % | 2,922 | 16 | % | 3,403 | 18 | % | |||||||||||||||
| Agricultural |
1,808 | 11 | % | 2,230 | 10 | % | 2,672 | 9 | % | 3,513 | 13 | % | 2,933 | 13 | % | |||||||||||||||
| Residential real estate |
5,468 | 15 | % | 5,245 | 12 | % | 1,261 | 8 | % | 890 | 7 | % | 729 | 6 | % | |||||||||||||||
| Installment and other |
683 | 2 | % | 649 | 2 | % | 989 | 2 | % | 363 | 2 | % | 342 | 2 | % | |||||||||||||||
| Total |
$ | 38,999 | 100 | % | $ | 44,722 | 100 | % | $ | 25,258 | 100 | % | $ | 15,136 | 100 | % | $ | 13,895 | 100 | % | ||||||||||
Investments
Investment activities are undertaken in accordance with the Asset/Liability Management Policy that has been approved by the Board of Directors of the Company. Activities are reviewed by the Asset/Liability Management Committee and the Board of Directors of the Company. The following table sets forth the carrying value, by type, of the securities in the Company’s portfolio at December 31, 2009, 2008 and 2007:
| ($ in thousands) |
2009 | % of Total |
2008 | % of Total |
2007 | % of Total |
||||||||||||
| Obligations of federal government agencies |
$ | 3,400 | 7 | % | $ | 5,814 | 9 | % | $ | 17,446 | 26 | % | ||||||
| Obligations of states, municipalities and political subdivisions |
20,293 | 41 | % | 21,451 | 33 | % | 19,585 | 29 | % | |||||||||
| Mortgage-backed securities |
24,414 | 50 | % | 36,606 | 56 | % | 26,360 | 40 | % | |||||||||
| Corporate Securities |
— | — | — | — | 1,487 | 2 | % | |||||||||||
| Other securities |
879 | 2 | % | 1,399 | 2 | % | 2,107 | 3 | % | |||||||||
| Total securities |
$ | 48,986 | 100 | % | $ | 65,270 | 100 | % | $ | 66,985 | 100 | % | ||||||
At December 31, 2009, 2008 and 2007, the fair value of the Company’s securities exceeded amortized cost by $1.1 million, $102 thousand and $197 thousand, respectively. Government agency and privately issued securities comprised 79% and 21%, respectively, of total mortgage-backed securities at December 31, 2009. There were no sub-prime securities in the portfolio at December 31, 2009, 2008 or 2007. No portion of the Company’s investment portfolio is invested in derivative securities (meaning securities whose value derives from
39
Table of Contents
the value of an underlying security or securities, or market index of underlying securities’ values). During the year ended December 31, 2008, the Company determined one security, a Sallie Mae preferred stock, was other than temporarily impaired and recorded a $492 thousand charge to operations. During 2009, the Company sold this stock and recorded a gain of $133 thousand.
The following table sets forth the carrying values, maturities and approximate average aggregate yields of securities in the Company’s investment portfolio by type at December 31, 2009:
| ($ in thousands) |
Yield | Amount | ||||
| U.S. Treasury and other U.S. government agencies: |
||||||
| 1 year or less |
4.99 | % | $ | 756 | ||
| Over 1 through 5 years |
1.62 | % | 2,202 | |||
| Over 5 through 10 years |
3.65 | % | 442 | |||
| Total |
2.64 | % | $ | 3,400 | ||
| States and political subdivisions: |
||||||
| 1 year or less |
4.83 | % | $ | 498 | ||
| Over 1 through 5 years |
4.84 | % | 2,991 | |||
| Over 5 through 10 years |
4.70 | % | 4,787 | |||
| Over 10 Years |
4.88 | % | 12,017 | |||
| Total |
4.83 | % | $ | 20,293 | ||
| Mortgage-backed securities and other: |
||||||
| 1 year or less |
5.19 | % | $ | 1,348 | ||
| Over 1 through 5 years |
5.29 | % | 827 | |||
| Over 5 through 10 years |
5.31 | % | 4,641 | |||
| Over 10 years |
4.12 | % | 18,477 | |||
| Total |
4.44 | % | $ | 25,293 | ||
| Total investment securities: |
||||||
| 1 year or less |
5.06 | % | $ | 2,602 | ||
| Over 1 through 5 years |
3.72 | % | 6,020 | |||
| Over 5 through 10 years |
4.94 | % | 9,870 | |||
| Over 10 years |
4.42 | % | 30,494 | |||
| Total |
4.47 | % | $ | 48,986 | ||
The weighted average yield related to states and political subdivisions reflects the actual yield and is not presented on a tax equivalent basis. Mortgage-backed securities have been classified above based on contractual maturities. Other non-maturity securities have been included in the over 10 years classification above.
Goodwill and Intangible Assets
At December 31, 2009, the Company had intangible assets of $10.6 million as compared to $13.5 million at December 31, 2008. A portion of the purchase price for FWBC and Columbia Trust Bancorp (CTB) was allocated to the value of FWBC’s and CTB’s core deposits, which included all deposits except time deposits. Additionally, the intangible assets include covenants not to compete. The FWBC core deposit intangible is being amortized on an accelerated basis with an anticipated life of 10 years. The CTB core deposit intangible asset is being amortized on a straight-line basis with an anticipated life of 8 years. The goodwill recorded in connection with the FWBC and CTB mergers represented the excess of the purchase price over the estimated fair value of the net assets acquired. Goodwill is evaluated for impairment on an annual basis, or sooner if events or circumstances indicate a potential impairment. During the years ended December 31, 2009 and 2008, the Company recorded goodwill impairment charges of $18.9 million and $109.0 million, respectively, in accordance with accounting guidance.
40
Table of Contents
The impact of deteriorating economic conditions significantly impacted the banking industry during 2009 and 2008, including the Company’s financial results and market capitalization. The financial results for both years have been negatively impacted by an increase in credit losses in the loan portfolio, a lower net interest margin principally due to the increase in non-accrual loans, foreclosed assets expenses and legal costs related to the workout of troubled credits, which were all considered as part of the goodwill impairment analysis.
Deposits
The Bank’s primary source of funds is customer deposits. The Bank strives to maintain a high percentage of non-interest bearing deposits, which lowers the Bank’s cost of funds and results in higher net interest margins. At December 31, 2009, 2008 and 2007, the Company’s ratios of non-interest bearing deposits to total deposits were 20.3%, 20.4% and 22.4%, respectively.
The following table sets forth the average balances for each major category of deposits and the weighted average interest rate paid for deposits for the years ended December 31, 2009, 2008 and 2007:
| 2009 | 2008 | 2007 | ||||||||||||||||
| ($ in thousands) |
Average Balance |
Interest Rate |
Average Balance |
Interest Rate |
Average Balance |
Interest Rate |
||||||||||||
| Interest bearing demand deposits |
$ | 172,634 | 0.42 | % | $ | 135,167 | 0.53 | % | $ | 130,553 | 0.76 | % | ||||||
| Savings and MMDA deposits |
401,026 | 1.36 | % | 498,807 | 1.99 | % | 500,367 | 3.04 | % | |||||||||
| Time deposits |
667,261 | 2.90 | % | 618,594 | 3.98 | % | 493,323 | 4.88 | % | |||||||||
| Non-interest bearing demand deposits |
292,974 | — | 319,089 | — | 318,878 | — | ||||||||||||
| Total |
$ | 1,533,895 | 1.67 | % | $ | 1,571,657 | 2.24 | % | $ | 1,443,121 | 2.79 | % | ||||||
The following table reports the amounts and maturities of time deposits that had balances of $100,000 or more at December 31, 2009, 2008 and 2007:
| ($ in thousands) |
2009 | 2008 | 2007 | ||||||
| Less than three months |
$ | 35,511 | $ | 138,795 | $ | 104,825 | |||
| Three months to six months |
45,662 | 119,951 | 66,401 | ||||||
| Six months to one year |
46,595 | 58,143 | 95,548 | ||||||
| Over one year |
49,608 | 25,133 | 21,430 | ||||||
| Total |
$ | 177,376 | $ | 342,022 | $ | 288,204 | |||
Time deposits in the table above include brokered certificates of deposits of $2.5 million, $52.5 million, and $103.1 million as of December 31, 2009, 2008 and 2007, respectively. The remaining brokered certificate of deposit at December 31, 2009, matures in June 2011. Brokered certificates of deposit provided a significant source of liquidity for the Bank through June 30, 2008. The liquidity provided by these brokered certificates has been replaced with retail certificates and a reduction in loans as they matured.
The Bank’s top 20 depositors totaled $101.8 million in deposits at December 31, 2009, inclusive of $65.2 million public deposits. As of December 31, 2009, the Bank had $102.4 million of public deposits. The largest public depositor balance was $23.1 million at December 31, 2009. The Washington Public Deposit Protection Commission, which governs all Washington public deposits, adopted a resolution in January 2010, which requires public depositories to reduce their balances with Banks to less than 50% by March 31, 2010, less than 25% by April 30, 2010 and eliminate all balances by May 31, 2010. This is expected to negatively impact the public deposits in Washington which totaled $66.0 million at December 31, 2009.
As a result of the Bank’s regulatory capital classification, it has not been able to accept or renew any brokered certificates of deposits since August 2008. In addition, the rate paid by the Bank on any new or renewed
41
Table of Contents
certificates of deposits is limited by regulation to 0.75% over the average prevailing rate in the market for deposits with a comparable term. Effective January 2010, the FDIC has implemented a rate limitation framework that sets the rate limit based upon a national rate survey plus 0.75%. The Company does not expect that this change will have a material adverse impact on the Bank’s liquidity as compared with the existing restriction.
Borrowings
Overnight borrowings consist of borrowings with the FHLB and the Federal Reserve Discount Window (FRDW). Prior to September 2008, overnight borrowings also included federal funds (Fed Funds) purchased through correspondent institutions. As of December 31, 2009 and 2008, overnight borrowings were available from FHLB and FRDW and all borrowings at December 31, 2009 and 2008 were with FHLB. The following table sets forth the outstanding overnight borrowings and the maximum amount outstanding at any month-end during the respective years:
| ($ in thousands) |
December 31, | |||||||
| 2009 | 2008 | |||||||
| Overnight advances outstanding at year-end |
$ | 3,000 | $ | 39,128 | ||||
| Average overnight advances |
$ | 48,621 | $ | 51,109 | ||||
| Maximum amount of outstanding advances at any month-end |
$ | 109,595 | $ | 109,861 | ||||
| Interest rate at year-end |
0.64 | % | 0.80 | % | ||||
| Average interest rate during the year |
0.90 | % | 3.06 | % | ||||
Borrowings decreased $79.3 million to $63.7 million at December 31, 2009 as compared to December 31, 2008. The decrease in borrowings from the prior year is related mainly to a decrease in total loans and a smaller decrease in total deposits.
The Company had four wholly-owned trusts (Trusts) at December 31, 2009 that were formed to issue trust preferred securities in the form of junior subordinated debt, and related common securities of the Trusts. Junior subordinated debt totaled $41.2 million at December 31, 2009. In accordance with the provisions of the related indentures, the Company has notified the trustees of the Trusts each quarter since the third quarter of 2008 that the payment of interest on the junior subordinated debt will be deferred. The Company has the right to defer payment of interest for up to 20 consecutive quarters, although it will continue to accrue the cost and recognize the expense of the interest at the normal rate on a compounded basis until such time as the deferred arrearage has been paid current. As of December 31, 2009, interest totaling $4.0 million, which is included in accrued interest payable on the Consolidated Statements of Condition, was deferred and in arrears.
Liquidity and Capital Resources
While the Company’s liquidity resources, and specifically deposit balances, remained relatively stable throughout 2009, the Company’s financial condition and its standing with regulatory authorities could result in a significant adverse change in liquidity at any time. Cash flows from operations contribute significantly to liquidity, as do proceeds from maturities of securities and increasing customer deposits. In 2009, the Company generated $16.8 million in net cash flows from its operating activities, compared to $35.0 million in 2008. Additionally, the Company generated $265.1 million in net cash from investing activities in 2009, compared to $43.1 million in 2008. The increase in the cash generated by investing activities is due to a significant decrease in loans. Cash used by financing activities was $147.3 million for the year ended December 31, 2009 as compared to $58.3 million for 2008.
The Bank’s primary source of funds is its deposits. In addition, the Bank has the ability to borrow from various sources, including FHLB and FRDW. At December 31, 2009, the Bank had $184.3 million of available credit from these sources. As of December 31, 2009, the Bank had pledged as collateral for these borrowings $420.4 million in loans and $17.9 million of securities. As of December 31, 2008, the Bank had $251.5 million of available credit with the FHLB and FRDW.
42
Table of Contents
The Parent Company had cash balances of $109 thousand and $194 thousand as of December 31, 2009 and 2008, respectively. The Parent Company received cash dividends of $2.2 million from the Bank during the year ended December 31, 2008, which was principally used to pay interest costs related to junior subordinated debt, cash dividends and operating expenses. In addition, the Parent Company paid dividends of $0.04 per share on its common stock during 2008. There were no common stock repurchases during the year ended December 31, 2009 or 2008.
The Parent Company’s ability to service borrowings is generally dependent upon the availability of dividends from the Bank. The payments of dividends by the Bank are subject to limitations imposed by law and governmental regulations. In accordance with the Order and the prior Directive, the Bank was prohibited from paying dividends to the Parent without the prior approval of the FDIC and the Washington Department of Financial Institutions (DFI). In determining whether the Bank or the Company will declare a dividend, the respective Boards of Directors consider factors including financial condition, anticipated growth, acquisition opportunities, and applicable laws, regulations and regulatory capital requirements. As of December 31, 2009 and 2008, the Parent Company did not have any borrowing capacity.
The Company’s total stockholders’ equity decreased to $19.6 million at December 31, 2009 as compared to $89.8 million at December 31, 2008. The decrease is related primarily to the net loss recorded during the year ended December 31, 2009. At December 31, 2009, stockholders’ equity was 1.2% of total assets, compared to 4.8% at December 31, 2008. At December 31, 2009 and 2008, the Company also held cash and cash equivalent assets of $201.6 million and $67.0 million, respectively.
The regulatory capital levels of the Company and the Bank were considered significantly under-capitalized at December 31, 2009. The regulatory capital levels of the Company and the Bank were considered under-capitalized at December 31, 2008. Regulatory capital ratios can be reviewed in Note 24 Regulatory Matters under Item 8 of this report.
Effects of Inflation and Changing Prices. The primary impact of inflation on the Company’s operations is increased asset yields, deposit costs and operating overhead. Unlike most industrial companies, virtually all of the assets and liabilities of a financial institution are monetary in nature. As a result, interest rates generally have a more significant impact on a financial institution’s performance than the effects of general levels of inflation. Although interest rates do not necessarily move in the same direction or to the same extent as the prices of goods and services, increases in inflation generally have resulted in increased interest rates. The effects of inflation can magnify the growth of assets, and if significant, would require that equity capital increase at a faster rate than would otherwise be necessary.
Contractual Obligations
The following summarizes the Company’s contractual obligations at December 31, 2009:
| ($ in thousands) |
Less than 1 year | 1-3 years | 3-5 years | Thereafter | Total | ||||||||||
| FHLB advances |
$ | 53,000 | $ | 10,600 | $ | — | $ | — | $ | 63,600 | |||||
| Capital lease obligations |
83 | — | — | — | 83 | ||||||||||
| Junior subordinated debentures |
— | — | — | 41,239 | 41,239 | ||||||||||
| Operating lease obligations |
3,698 | 7,563 | 6,912 | 26,781 | 44,954 | ||||||||||
| Salary continuation agreements |
520 | 1,247 | 1,392 | 9,070 | 12,229 | ||||||||||
| Other contractual obligations |
3,806 | 4,559 | 1,563 | — | 9,928 | ||||||||||
| Total Contractual Obligations |
$ | 61,107 | $ | 23,969 | $ | 9,867 | $ | 77,090 | $ | 172,033 | |||||
The table above does not include time deposit liabilities or accrued interest liabilities.
43
Table of Contents
Off-balance Sheet Arrangements
In the ordinary course of business, the Company has entered into off-balance sheet financial instruments consisting of commitments to extend credit, commercial letters of credit and standby letters of credit. Such financial instruments are held for purposes other than trading and are recorded in the financial statements when they are funded or related fees are incurred or received. Since many of the commitments will expire without being drawn upon, the total commitment amounts do not necessarily reflect future cash requirements. The following summarizes the amount of commitments per expiration period:
| ($ in thousands) |
Less than 1 year | 1-3 years | 3-5 years | Thereafter | Total | ||||||||||
| Commitments to extend credit |
$ | 113,686 | $ | 8,731 | $ | 4,009 | $ | 39,756 | $ | 166,182 | |||||
| Standby letters of credit |
5,400 | 11,113 | 25 | 72 | 16,610 | ||||||||||
| Total |
$ | 119,086 | $ | 19,844 | $ | 4,034 | $ | 39,828 | $ | 182,792 | |||||
The following table summarizes the outstanding off-balance sheet arrangements at December 31, 2009 and 2008 by type:
| ($ in thousands) |
2009 | 2008 | ||||
| Construction, land development and other land |
$ | 9,385 | $ | 61,857 | ||
| Commercial real estate |
15,291 | 23,077 | ||||
| Residential Real Estate |
39,404 | 54,484 | ||||
| Commercial and industrial |
54,159 | 104,512 | ||||
| Agricultural |
55,398 | 59,297 | ||||
| Installment and other |
9,155 | 7,667 | ||||
| Total loans |
$ | 182,792 | $ | 310,894 | ||
Recent Accounting Pronouncements
Refer to Note 3 under Item 8 of this Report.
Item 7A. Quantitative and Qualitative Disclosures about Market Risk.
Market Risk
The primary form of market risk to which financial institutions are exposed is interest rate risk. This is the effect of changes in market interest rates on a financial institution’s income, fair values of assets and liabilities and capital. Any changes in market interest rates may impact the financial institution’s net interest income, which is the spread between the interest earned on loans, securities and other interest earning assets, and interest paid on deposits, borrowings and other interest bearing liabilities.
The Company has an Asset/Liability Management Committee (ALCO), consisting of senior managers and a Board of Directors representative, to monitor interest rate risk. The ALCO meets at least quarterly to review current interest rate sensitivity and plan balance sheet and pricing strategies. The ALCO looks at many components of interest rate risk. Repricing risk results from differences between the timing of market rate changes and the timing of cash flows of the Bank’s assets and liabilities. Basis risk comes from changes in the relationship between different market rates on assets and liabilities and their impact on the Bank’s earnings. Yield curve risk arises from changes in the shape of the yield curve. All of these aspects of interest rate risk are considered by management in monitoring the Bank’s market risk profile.
As is true for any banking services provider, unfavorable changes in the interest rate environment may reduce the Bank’s net interest income. Net interest spreads are affected by the difference between the maturities
44
Table of Contents
and repricing characteristics of interest earning assets and interest bearing liabilities. In addition, loan volumes and yields are affected by market interest rates on loans. While an increase in the general level of interest rates may increase the net interest margin and loan yields, it may adversely affect the ability of borrowers with variable rate loans to make principal and interest payments. Accordingly, changes in levels of market interest rates could materially and adversely affect the net interest spread, asset quality, loan origination volume and overall profitability.
Net Interest Income Sensitivity
To monitor the impact of changing interest rates on net interest income, the Company employs an interest rate simulation model. The model integrates existing balance sheet maturity and repricing detail with various assumptions including prepayment projections and interest rate spreads over key index rates. As of December 31, 2009 and 2008, this simulation measures changes in net interest income over one year that would occur if market interest rates move in even increments up by 100 and 200 basis points. All yield curve shifts are parallel in this simulation and any loans or deposits that prepay or mature are replaced by like instruments to keep the balance sheet composition constant.
Based on the simulation results, shown below as of December 31, 2009 and 2008, the Company’s net interest income may increase under rising interest rates. Due to the current low rate environment, no scenarios were evaluated using decreasing rates.
| Percentage Change in Net Interest Income over 12 Months |
||||||
| Rate Scenario |
2009 | 2008 | ||||
| Rates increase 200 basis points |
3.32 | % | 3.96 | % | ||
| Rates increase 100 basis points |
1.59 | % | 1.94 | % | ||
| Rates decrease 100 basis points |
N/A | (1) | N/A | (1) | ||
| Rates decrease 200 basis points |
N/A | (1) | N/A | (1) | ||
| (1) | Market rates in effect at 12/31/09 and 12/31/08 were less than 1.0% thus these downward rate simulation scenarios are not applicable. |
The Company’s rate sensitivity at December 31, 2009, was similar to the prior year. The table above includes the impact of $259.0 million of loans which were at a floor rate as of December 31, 2009. If rates were to rise 100 and 200 basis points, then $170.1 million and $64.3 million, respectively, of loans would remain at the floor rate.
It should be noted that the preceding interest rate sensitivity analysis does not represent a forecast by the Company and should not be relied upon as being indicative of future operating results. These hypothetical estimates are based on numerous assumptions including, but not limited to: the nature and timing of interest rate levels; yield curve shape; repayments on loans and securities; and pricing decisions on loans and deposits. As market conditions vary from those assumed in the sensitivity analysis, actual results may also differ due to prepayment and refinancing levels deviating from those assumed, the varying impact on adjustable rate assets of interest rate change caps and floors, the potential effect of changing debt service levels on customers with adjustable rate loans, and depositor early withdrawals and product preference changes. Also, the sensitivity analysis does not reflect future actions that the ALCO might take in responding to or anticipating changes in interest rates. While assumptions are developed based upon current economic and local market conditions, the Company cannot give any assurance as to the predictive nature of these assumptions, including how customer preferences or competitor influences might change.
The Company’s policy sets limits on the allowable change in one year of net interest income if rates rise or fall by 200 basis points. Percentage changes noted in the table above are within these limits.
45
Table of Contents
Economic Value of Equity
As a further means of quantifying interest rate risk, the Company’s management looks at the economic perspective by capturing the impact of interest rate changes on the net value of future cash flows, or Economic Value of Equity (EVE).
To determine the EVE, cash flows projected from the Company’s current assets and liabilities are discounted based on current market rates. Investment securities are valued using current market prices. Loans are discounted at current Bank pricing spreads to market reference rates. Deposits and borrowings are discounted based on the FHLB yield curve as of the simulation date. Deposit cash flows include FRB estimates of operating costs for each deposit type.
The table below shows the effect on EVE of market value changes of the Company’s financial assets and liabilities if interest rates change immediately up by 100 or 200 basis points as of December 31, 2009:
| Rate Scenario |
Percentage Change in EVE |
||
| Rates increase 200 basis points |
36.74 | % | |
| Rates increase 100 basis points |
18.82 | % | |
| Rates decrease 100 basis points |
N/A | (1) | |
| Rates decrease 200 basis points |
N/A | (1) |
| (1) | Market rates in effect at 12/31/09 were less than 1.0% thus these downward rate simulation scenarios are not applicable. |
The Company’s policy sets limits on allowable changes in EVE if rates rise or fall by 200 basis points. Percentage changes noted in the table above are outside these limits, due to the low level of equity. Had the Bank had enough equity to have been classified as well-capitalized at December 31, 2009, changes to the EVE would have been within the guidelines. Since the market value of the Company’s equity would increase with a 200 basis point rise in interest rates, this table again indicates the Company is slightly asset sensitive.
46
Table of Contents
Interest Rate Sensitivity Gap
The table below presents the Company’s balance sheet with estimated repricing information as of December 31, 2009. It indicates that the Company has more liabilities than assets repricing during the first year. It should be noted that transaction deposits (interest bearing demand deposits, savings and MMDA) comprise the major portion of these liabilities, and changes in rates on these deposits often occur after changes to key index rates on loans.
| Repricing Interval | |||||||||||||||||||||||
| ($ in thousands) |
1 - 3 Months |
4 - 12 Months |
1 - 5 Years | Over 5 Years |
Non Rate Sensitive |
Total | |||||||||||||||||
| Assets |
|||||||||||||||||||||||
| Overnight interest bearing deposits with other banks |
$ | 163,033 | $ | — | $ | — | $ | — | $ | — | $ | 163,033 | |||||||||||
| Securities |
6,584 | 10,741 | 9,578 | 21,021 | 1,062 | 48,986 | |||||||||||||||||
| Loans and loans held for sale, gross |
481,103 | 241,464 | 421,645 | 26,361 | 107,899 | 1,278,472 | |||||||||||||||||
| Non-interest earning assets |
— | — | — | — | 165,062 | 165,062 | |||||||||||||||||
| Total Assets |
$ | 650,720 | $ | 252,205 | $ | 431,223 | $ | 47,382 | $ | 274,023 | $ | 1,655,553 | |||||||||||
| Liabilities and Shareholders’ Equity |
|||||||||||||||||||||||
| Interest bearing demand deposits |
$ | 207,936 | $ | — | $ | — | $ | — | $ | — | $ | 207,936 | |||||||||||
| Savings and MMDA deposits |
366,197 | — | — | — | — | 366,197 | |||||||||||||||||
| Time deposits |
210,228 | 366,237 | 48,921 | 25 | — | 625,411 | |||||||||||||||||
| FHLB advances |
3,000 | 50,000 | 10,600 | — | — | 63,600 | |||||||||||||||||
| Other borrowings and capital lease obligations |
— | 83 | — | — | — | 83 | |||||||||||||||||
| Junior subordinated debt |
13,403 | — | 27,836 | — | — | 41,239 | |||||||||||||||||
| Non-interest bearing liabilities and stockholders’ equity |
— | — | — | — | 351,087 | 351,087 | |||||||||||||||||
| Total Liabilities and Stockholders’ Equity |
$ | 800,764 | $ | 416,320 | $ | 87,357 | $ | 25 | $ | 351,087 | $ | 1,655,553 | |||||||||||
| Interest Rate Repricing Gap |
(150,044 | ) | (164,115 | ) | 343,866 | 47,357 | (77,064 | ) | |||||||||||||||
| Cumulative Repricing Gap |
(150,044 | ) | (314,159 | ) | 29,707 | 77,064 | — | ||||||||||||||||
| Cumulative Gap as a % of Total Earning Assets |
-10.1 | % | -21.1 | % | 2.0 | % | 5.2 | % | |||||||||||||||
47
Table of Contents
Item 8. Financial Statements and Supplementary Data.
Report of Independent Registered Public Accounting Firm
To the Board of Directors and Stockholders
AmericanWest Bancorporation
Spokane, Washington
We have audited the accompanying consolidated statements of financial condition of AmericanWest Bancorporation and subsidiaries (Company) as of December 31, 2009 and 2008, and the related consolidated statements of operations, stockholders’ equity and comprehensive income, and cash flows for the three years in the period ended December 31, 2009. These consolidated financial statements are the responsibility of the Company’s management. Our responsibility is to express an opinion on these financial statements based on our audits.
We conducted our audits in accordance with auditing standards of the Public Company Accounting Oversight Board (United States). Those standards require that we plan and perform the audit to obtain reasonable assurance about whether the financial statements are free of material misstatement. An audit includes examining, on a test basis, evidence supporting the amounts and disclosures in the financial statements. An audit also includes assessing the accounting principles used and significant estimates made by management, as well as evaluating the overall financial statement presentation. We believe that our audits provide a reasonable basis for our opinion.
In our opinion, the consolidated financial statements referred to above present fairly, in all material respects, the consolidated financial position of AmericanWest Bancorporation and subsidiaries as of December 31, 2009 and 2008, and the results of their operations and cash flows for each of the three years in the period ended December 31, 2009, in with accounting principles generally accepted in the United States of America.
The accompanying consolidated financial statements for the years ended December 31, 2009 and 2008, have been prepared assuming that the Company will continue as a going concern. As discussed in Note 2 to the consolidated financial statements, the Company’s significant net loss from operations in 2009 and 2008, deterioration in the credit quality of its loan portfolio, and the decline in the level of its regulatory capital to support operations raise substantial doubt about the Company’s ability to continue as a going concern. Management’s plans concerning these matters are also discussed in Note 2 to the consolidated financial statements. The consolidated financial statements do not include any adjustments that might result from the outcome of this uncertainty.

Portland, Oregon
March 4, 2010
48
Table of Contents
CONSOLIDATED STATEMENTS OF FINANCIAL CONDITION
DECEMBER 31, 2009 and 2008
(in thousands)
| 2009 | 2008 | |||||||
| ASSETS | ||||||||
| Cash and due from banks |
$ | 38,553 | $ | 40,927 | ||||
| Overnight interest bearing deposits with other banks |
163,033 | 26,058 | ||||||
| Cash and cash equivalents |
201,586 | 66,985 | ||||||
| Securities, available-for-sale at fair value |
48,986 | 65,270 | ||||||
| Loans, net of allowance for loan losses of $38,999 and $44,722, respectively |
1,231,300 | 1,577,106 | ||||||
| Loans, held for sale |
6,565 | 12,265 | ||||||
| Accrued interest receivable |
6,515 | 8,193 | ||||||
| FHLB stock |
10,267 | 8,286 | ||||||
| Premises and equipment, net |
35,877 | 41,385 | ||||||
| Foreclosed real estate and other foreclosed assets |
53,383 | 15,781 | ||||||
| Bank owned life insurance |
31,207 | 30,193 | ||||||
| Goodwill |
— | 18,852 | ||||||
| Intangible assets |
10,603 | 13,467 | ||||||
| Other assets |
19,264 | 16,840 | ||||||
| TOTAL ASSETS |
$ | 1,655,553 | $ | 1,874,623 | ||||
| LIABILITIES | ||||||||
| Non-interest bearing demand deposits |
$ | 305,996 | $ | 321,552 | ||||
| Interest bearing deposits: |
||||||||
| NOW, savings account and money market accounts |
574,133 | 559,666 | ||||||
| Time, $100,000 and over |
177,376 | 342,022 | ||||||
| Other time |
448,035 | 350,293 | ||||||
| TOTAL DEPOSITS |
1,505,540 | 1,573,533 | ||||||
| Federal Home Loan Bank advances |
63,600 | 139,668 | ||||||
| Other borrowings and capital lease obligations |
83 | 3,294 | ||||||
| Junior subordinated debt |
41,239 | 41,239 | ||||||
| Accrued interest payable |
7,369 | 7,677 | ||||||
| Other liabilities |
18,117 | 19,424 | ||||||
| TOTAL LIABILITIES |
1,635,948 | 1,784,835 | ||||||
| STOCKHOLDERS’ EQUITY | ||||||||
| Preferred stock, no par, shares authorized 5 million |
— | — | ||||||
| Common stock, no par, shares authorized 50 million; 17,236 issued and 17,213 outstanding at December 31, 2009; 17,259 issued and 17,213 outstanding at December 31, 2008 |
253,431 | 253,450 | ||||||
| Accumulated deficit |
(234,888 | ) | (163,764 | ) | ||||
| Accumulated other comprehensive income, net of tax |
1,062 | 102 | ||||||
| TOTAL STOCKHOLDERS’ EQUITY |
19,605 | 89,788 | ||||||
| TOTAL LIABILITIES AND STOCKHOLDERS’ EQUITY |
$ | 1,655,553 | $ | 1,874,623 | ||||
The accompanying notes are an integral part of the financial statements.
49
Table of Contents
CONSOLIDATED STATEMENTS OF OPERATIONS
YEARS ENDED DECEMBER 31, 2009, 2008 and 2007
(in thousands, except per share amounts)
| 2009 | 2008 | 2007 | |||||||||
| Interest Income |
|||||||||||
| Interest and fees on loans |
$ | 84,704 | $ | 116,028 | $ | 130,980 | |||||
| Interest on securities |
2,657 | 3,272 | 2,931 | ||||||||
| Other interest income |
349 | 370 | 381 | ||||||||
| Total Interest Income |
87,710 | 119,670 | 134,292 | ||||||||
| Interest Expense |
|||||||||||
| Interest on deposits |
25,575 | 35,217 | 40,302 | ||||||||
| Interest on borrowings |
6,009 | 10,499 | 9,901 | ||||||||
| Total Interest Expense |
31,584 | 45,716 | 50,203 | ||||||||
| Net Interest Income |
56,126 | 73,954 | 84,089 | ||||||||
| Provision for loan losses |
50,330 | 97,170 | 17,341 | ||||||||
| Net Interest Income (Loss) After Provision for Loan Losses |
5,796 | (23,216 | ) | 66,748 | |||||||
| Non-interest Income |
|||||||||||
| Fees and service charges on deposits |
9,279 | 10,870 | 9,199 | ||||||||
| Fees on mortgage loan sales, net |
7,005 | 3,843 | 3,175 | ||||||||
| Other |
4,644 | 3,954 | 3,942 | ||||||||
| Total Non-interest Income |
20,928 | 18,667 | 16,316 | ||||||||
| Non-interest Expense |
|||||||||||
| Salaries and employee benefits |
33,444 | 41,332 | 41,212 | ||||||||
| Foreclosed real estate and other foreclosed assets expense |
20,869 | 4,241 | 644 | ||||||||
| Goodwill impairment |
18,852 | 109,000 | — | ||||||||
| FDIC assessment |
7,776 | 2,711 | 105 | ||||||||
| Equipment expense |
7,520 | 8,052 | 6,606 | ||||||||
| Occupancy expense, net |
7,098 | 7,362 | 5,710 | ||||||||
| Amortization of intangible assets |
2,864 | 3,475 | 3,480 | ||||||||
| State business and occupation tax |
632 | 1,120 | 1,290 | ||||||||
| Other |
11,953 | 16,324 | 11,720 | ||||||||
| Total Non-interest Expense |
111,008 | 193,617 | 70,767 | ||||||||
| (Loss) Income Before (Benefit) Provision for Income Tax |
(84,284 | ) | (198,166 | ) | 12,297 | ||||||
| Income Tax (Benefit) Provision |
(13,160 | ) | (5,806 | ) | 3,759 | ||||||
| Net (Loss) Income |
$ | (71,124 | ) | $ | (192,360 | ) | $ | 8,538 | |||
| Basic (loss) earnings per common share |
$ | (4.13 | ) | $ | (11.18 | ) | $ | 0.54 | |||
| Diluted (loss) earnings per common share |
$ | (4.13 | ) | $ | (11.18 | ) | $ | 0.54 | |||
| Basic weighted average shares outstanding |
17,213 | 17,211 | 15,766 | ||||||||
| Diluted weighted average shares outstanding |
17,213 | 17,211 | 15,864 | ||||||||
The accompanying notes are an integral part of the financial statements.
50
Table of Contents
CONSOLIDATED STATEMENTS OF STOCKHOLDERS’ EQUITY AND COMPREHENSIVE INCOME
YEARS ENDED DECEMBER 31, 2009, 2008 and 2007
(in thousands)
| Common Stock | Retained Earnings (Accumulated Deficit) |
Accumulated Other Comprehensive Income (Loss) |
Total | Comprehensive Income |
|||||||||||||||||||
| Shares | Amount | ||||||||||||||||||||||
| Balances, December 31, 2006 |
11,468 | $ | 127,396 | $ | 24,576 | $ | 65 | $ | 152,037 | $ | 7,757 | ||||||||||||
| Net Income |
8,538 | 8,538 | 8,538 | ||||||||||||||||||||
| Cash Dividends ($0.15 per share) |
(2,405 | ) | (2,405 | ) | |||||||||||||||||||
| Issuances of common stock under equity incentive plans, net of tax benefits |
55 | 611 | 611 | ||||||||||||||||||||
| Restricted stock awards activity |
4 | 222 | 222 | ||||||||||||||||||||
| Stock issued in connection with acquisition |
5,744 | 124,423 | 124,423 | ||||||||||||||||||||
| Compensatory stock options issued |
498 | 498 | |||||||||||||||||||||
| Net change in unrealized gain on available-for-sale securities, net of $34 tax liability |
63 | 63 | 63 | ||||||||||||||||||||
| Balances, December 31, 2007 |
17,271 | $ | 253,150 | $ | 30,709 | $ | 128 | $ | 283,987 | $ | 8,601 | ||||||||||||
| Net Loss |
(192,360 | ) | (192,360 | ) | (192,360 | ) | |||||||||||||||||
| Cash Dividend ($0.04 per share) |
(688 | ) | (688 | ) | |||||||||||||||||||
| Adoption of accounting pronouncement related to post-retirement benefits |
(1,425 | ) | (1,425 | ) | |||||||||||||||||||
| Issuances of common stock under equity incentive plans, net of tax benefits |
9 | 29 | 29 | ||||||||||||||||||||
| Restricted stock awards activity |
(21 | ) | 86 | 86 | |||||||||||||||||||
| Compensatory stock options issued |
185 | 185 | |||||||||||||||||||||
| Net change in unrealized gain on available-for-sale securities, net of $69 tax benefit |
(26 | ) | (26 | ) | (26 | ) | |||||||||||||||||
| Balances, December 31, 2008 |
17,259 | $ | 253,450 | $ | (163,764 | ) | $ | 102 | $ | 89,788 | $ | (192,386 | ) | ||||||||||
| Net Loss |
(71,124 | ) | (71,124 | ) | (71,124 | ) | |||||||||||||||||
| Restricted stock awards activity |
(23 | ) | (59 | ) | (59 | ) | |||||||||||||||||
| Compensatory stock options issued |
40 | 40 | |||||||||||||||||||||
| Net change in unrealized gain on available-for-sale securities, net of $0 tax benefit |
960 | 960 | 960 | ||||||||||||||||||||
| Balances, December 31, 2009 |
17,236 | $ | 253,431 | $ | (234,888 | ) | $ | 1,062 | $ | 19,605 | $ | (70,164 | ) | ||||||||||
The accompanying notes are an integral part of the financial statements.
51
Table of Contents
CONSOLIDATED STATEMENTS OF CASH FLOWS
YEARS ENDED DECEMBER 31, 2009, 2008 and 2007
($ in thousands)
| 2009 | 2008 | 2007 | ||||||||||
| CASH FLOWS PROVIDED BY OPERATING ACTIVITIES |
||||||||||||
| Net (Loss) Income |
$ | (71,124 | ) | $ | (192,360 | ) | $ | 8,538 | ||||
| Adjustments to reconcile net income (loss) to net cash provided by operating activities: |
||||||||||||
| Provisions for loan losses, unfunded commitments and foreclosed real estate and other foreclosed assets |
66,795 | 99,528 | 17,654 | |||||||||
| Impairment of Goodwill |
18,852 | 109,000 | — | |||||||||
| Depreciation and amortization |
7,219 | 8,363 | 6,992 | |||||||||
| Deferred income taxes |
— | 4,796 | (4,287 | ) | ||||||||
| Compensatory stock options and restricted stock expense |
(19 | ) | 271 | 720 | ||||||||
| Loss on impairment of premises |
202 | 693 | 219 | |||||||||
| Loss on other than temporary impairment of securities |
— | 492 | — | |||||||||
| Gain on sale of other premises and equipment, investments and foreclosed real estate and other foreclosed assets |
(926 | ) | (889 | ) | (639 | ) | ||||||
| Stock dividends received |
(105 | ) | (105 | ) | — | |||||||
| Originations of loans held for sale |
(305,655 | ) | (193,718 | ) | (159,754 | ) | ||||||
| Proceeds from loans sold |
304,689 | 199,201 | 160,567 | |||||||||
| Changes in assets and liabilities: |
||||||||||||
| Accrued interest receivable |
1,678 | 3,573 | (368 | ) | ||||||||
| Bank owned life insurance |
(1,014 | ) | (1,089 | ) | (1,007 | ) | ||||||
| Other assets |
(2,424 | ) | (7,460 | ) | 425 | |||||||
| Accrued interest payable |
(308 | ) | 2,338 | 661 | ||||||||
| Other liabilities |
(1,103 | ) | 2,376 | (831 | ) | |||||||
| NET CASH PROVIDED BY OPERATING ACTIVITIES |
16,757 | 35,010 | 28,890 | |||||||||
| CASH FLOWS USED IN INVESTING ACTIVITIES |
||||||||||||
| Securities available-for-sale: |
||||||||||||
| Maturities, calls, sales and principal payments |
27,458 | 24,764 | 32,882 | |||||||||
| Purchases |
(9,891 | ) | (23,795 | ) | (29,872 | ) | ||||||
| Purchases of Federal Home Loan Bank stock |
(1,981 | ) | (4,424 | ) | — | |||||||
| Redemptions of Federal Home Loan Bank stock |
— | 3,939 | — | |||||||||
| Cash acquired in merger, net of cash consideration paid |
— | — | 292 | |||||||||
| Proceeds from sale of bankcard portfolio |
— | 4,354 | — | |||||||||
| Net decrease (increase) in loans |
221,222 | 27,597 | (214,252 | ) | ||||||||
| Purchases of premises and equipment |
(450 | ) | (5,115 | ) | (7,984 | ) | ||||||
| Proceeds from sale of premises and equipment |
2,399 | 3,813 | 708 | |||||||||
| Proceeds from foreclosed real estate and other foreclosed assets |
26,359 | 12,007 | 1,791 | |||||||||
| Purchased securities of Capital Trust Subsidiary |
— | — | (619 | ) | ||||||||
| NET CASH PROVIDED BY (USED IN) INVESTING ACTIVITIES |
265,116 | 43,140 | (217,054 | ) | ||||||||
| CASH FLOWS PROVIDED BY FINANCING ACTIVITIES |
||||||||||||
| Net (decrease) increase in deposits |
(67,993 | ) | 44,106 | 22,102 | ||||||||
| Proceeds from Federal Home Loan Bank advances |
— | 530,000 | 495,000 | |||||||||
| Repayments of Federal Home Loan Bank advances and other borrowing activity |
(79,279 | ) | (631,701 | ) | (356,403 | ) | ||||||
| Proceeds from issuances of common stock under equity incentive plans |
— | 29 | 611 | |||||||||
| Proceeds from issuance of junior subordinated debt |
— | — | 20,619 | |||||||||
| Payment of cash dividend |
— | (688 | ) | (2,405 | ) | |||||||
| NET CASH (USED IN) PROVIDED BY FINANCING ACTIVITIES |
(147,272 | ) | (58,254 | ) | 179,524 | |||||||
| NET CHANGE IN CASH AND CASH EQUIVALENTS |
134,601 | 19,896 | (8,640 | ) | ||||||||
| Cash and cash equivalents, beginning of year |
66,985 | 47,089 | 55,729 | |||||||||
| Cash and cash equivalents, end of year |
$ | 201,586 | $ | 66,985 | $ | 47,089 | ||||||
| Supplemental Disclosures: |
||||||||||||
| Cash paid during the period for: |
||||||||||||
| Interest |
$ | 31,892 | $ | 43,378 | $ | 49,542 | ||||||
| Income taxes |
$ | 42 | $ | 105 | $ | 11,301 | ||||||
| Non-cash Investing and Financing Activities: |
||||||||||||
| Foreclosed real estate acquired in settlement of loans |
$ | 80,920 | $ | 29,544 | $ | 2,134 | ||||||
| Change in fair value of investment securities |
$ | 960 | $ | (26 | ) | $ | 63 | |||||
| Fair value of assets acquired |
$ | — | $ | — | $ | 546,000 | ||||||
| Stock-based consideration issued for acquisition |
$ | — | $ | — | $ | (124,423 | ) | |||||
| Liabilities assumed in acquisition |
$ | — | $ | — | $ | 390,384 | ||||||
The accompanying notes are an integral part of the financial statements.
52
Table of Contents
NOTES TO CONSOLIDATED FINANCIAL STATEMENTS
Note 1. Business and Summary of Significant Accounting Policies
Nature of business:
AmericanWest Bancorporation (Company) is a Washington corporation and a bank holding company headquartered in Spokane, Washington. The Company’s wholly-owned banking subsidiary is AmericanWest Bank (Bank), a Washington state chartered bank that operates in Eastern and Central Washington, Northern Idaho and Utah. The Bank’s operations in Utah are doing business as Far West Bank, a division of AmericanWest Bank. Unless otherwise indicated, reference to the Company shall include the Bank. The Company’s unconsolidated information will be referred to as the Parent Company. As of December 31, 2009, the Company had four wholly-owned trusts (Trusts) that were formed to issue trust preferred securities and related common securities of the Trusts.
Basis of Financial Statement Presentation:
The consolidated financial statements have been prepared in accordance with generally accepted accounting principles in the United States of America (GAAP) and with prevailing practices within the banking industry.
Basis of consolidation:
The consolidated financial statements include the accounts of the Company and its wholly-owned subsidiary, excluding the Trusts, after eliminating all intercompany balances and transactions.
Cash and cash equivalents:
Cash equivalents are any highly liquid investment with a remaining maturity of three months or less at the date of purchase. The Company has cash and cash equivalents on deposit with other banks and financial institutions in amounts that periodically exceed the federal insurance limit. The Company evaluates the credit quality of these banks and financial institutions to mitigate its credit risk.
Securities:
All securities are classified as available-for-sale and are carried at fair value. Fair value is determined using published quotes when available or other indicators of value when such are not available. As of December 31, 2009, published quotes were available for approximately 92% of all available-for-sale investment securities. The remaining securities are carried at amortized cost. Unrealized holding gains and losses, net of tax, on available-for-sale securities are excluded from earnings and reported as a net amount in a separate component of stockholders’ equity until realized. Gains and losses on the sale of available-for-sale securities are determined using the specific identification method and are recorded on the trade date. Purchase premiums and discounts are recognized in interest income using the interest method over the terms of the securities.
Declines in the fair value of available-for-sale securities below their cost that are deemed to be other than temporary are reflected in earnings as realized losses. In estimating other than temporary impairment losses, management considers (a) the intent to sell the debt security or, (b) if it is more likely than not it will be required to sell the debt security before its anticipated recovery.
53
Table of Contents
NOTES TO CONSOLIDATED FINANCIAL STATEMENTS—(Continued)
Federal Home Loan Bank stock:
As a member of the Federal Home Loan Bank of Seattle (FHLB), the Bank is required to maintain a minimum level of investment in FHLB stock based on specified percentages of its outstanding FHLB advances. The Bank’s investment in FHLB stock is carried at par value, $100 per share, which reasonably approximates its fair value. The Bank may request redemption at par value of any stock in excess of the amount the Bank is required to hold. However, stock redemptions are at the discretion of the FHLB. Cash dividends received related to the FHLB stock was approximately $97 thousand and $45 thousand for the years ended December 31, 2008 and 2007, respectively. There were no cash dividends received during the year ended December 31, 2009.
FHLB stock is generally viewed as a long-term investment. Accordingly, when evaluating FHLB stock for impairment, its value is determined based on the ultimate recoverability of the par value rather than by recognizing temporary declines in value. The determination of whether the decline affects the ultimate recoverability is influenced by criteria such as (a) the significance of the decline in net assets of the FHLB as compared to the capital stock amount for the FHLB and the length of time this situation has persisted, (b) commitments by the FHLB to make payments required by law or regulation and the level of such payments in relation to the operating performance of the FHLB, (c) the impact of legislative and regulatory changes on the institutions and, accordingly, on the customer base of the FHLB, and (d) the liquidity position of the FHLB.
Loans held for sale:
Loans originated and intended for sale in the secondary market are carried at the lower of aggregate cost or fair value. Net unrealized losses are recognized through a valuation allowance by charges to income. Gains or losses on sales of mortgage loans are recognized based on the differences between the selling price and the carrying value of the mortgage loans sold.
Loans:
Loans that management has the intent and ability to hold for the foreseeable future or until maturity or pay-off are reported at their outstanding principal adjusted for any charge-offs, the allowance for loan losses, any deferred fees or costs on originated loans and unamortized premiums or discounts on purchased loans.
Interest income is accrued on the unpaid principal balance. For loans held for investment, the Bank’s policy is to defer loan origination and commitment fees as well as certain loan origination costs and to amortize the net amount as an adjustment of the yield of the related loan over its contractual life approximating the interest method.
Loans are classified as impaired when, based on current information and events, it is probable the Bank will be unable to collect all amounts as scheduled under the contractual terms of the loan agreement. Impaired loans are measured based on the present value of expected future cash flows discounted at the loan’s effective interest rate or the fair value of the collateral, if the loan is collateral dependent. Changes in these values are reflected in income through charges to the provision for loan losses.
Income recognition on non-accrual loans:
The accrual of interest on impaired loans is discontinued when the loan is 90 days past due or when, in management’s opinion, the borrower may be unable to make payments as they become due. When the interest accrual is discontinued, all unpaid accrued interest is reversed. Payments received at the time a loan is on non-accrual status are applied to principal. Interest income is not recognized until the loan is returned to accrual status. Loans are returned to accrual status when all the principal and interest amounts contractually due are brought current and future payments are reasonably assured as evidenced by agreed upon performance for a period of not less than six months.
54
Table of Contents
NOTES TO CONSOLIDATED FINANCIAL STATEMENTS—(Continued)
Allowance for loan losses and reserve for unfunded commitments:
The allowance for loan losses is maintained at a level management believes is adequate to provide for probable loan losses as of the balance sheet dates. The allowance for loan losses is based on an ongoing review of the loan portfolio, which includes consideration of actual loss experience, changes in the size and character of the portfolio, identification of individual problem situations which may affect a borrower’s ability to repay, and evaluation of the prevailing and anticipated economic conditions. The evaluation is inherently subjective, as it requires estimates that are susceptible to significant revision as more information becomes available.
The allowance for loan losses is increased by charges to income and decreased by charge-offs, net of recoveries. While management uses available information to recognize losses on loans, changes in economic conditions may necessitate revision of the estimate in future periods.
A reserve for unfunded commitments is maintained at a level that, in the opinion of management, is adequate to absorb probable losses associated with the Bank’s commitment to lend funds under existing agreements such as letters or lines of credit. Management determines the adequacy of the reserve for unfunded commitments based upon reviews of individual credit facilities, current economic conditions, the risk characteristics of the various categories of commitments and other relevant factors. The reserve is based on estimates, and ultimate losses may vary from the current estimates. These estimates are evaluated on a regular basis and, as adjustments become necessary, they are recognized in earnings in the periods in which they become known through charges to other non-interest expense. Draws on unfunded commitments that are considered uncollectible at the time funds are advanced are charged to the reserve for unfunded commitments. Provisions for unfunded commitment losses, and recoveries on commitment advances previously charged-off, are added to the reserve for unfunded commitments, which is included in the Other Liabilities section of the Consolidated Statements of Financial Condition.
The factors supporting the allowance for loan losses and the reserve for unfunded commitments do not diminish the fact that the entire allowance for loan losses and reserve for unfunded commitments are each available to absorb losses in the loan portfolio and related commitment portfolio, respectively. The Company’s principal focus, therefore, is on the adequacy of the total allowance for loan losses and reserve for unfunded commitments.
The allowance for loan losses and reserve for unfunded commitments are both subject to review by banking regulators. The Bank’s primary regulators regularly conduct reviews of the allowance for loan losses and reserve for unfunded commitments as an integral part of their examination process. Should the regulators determine that the allowance for loan losses or reserve for unfunded commitments are not, in their opinion, adequate, the Bank may be required to recognize additional provision for loan losses.
Derivative loan commitments:
The Bank enters into forward delivery contracts to sell residential mortgage loans to broker/dealers at specific prices and dates in order to hedge the interest rate risk in its portfolio of mortgage loans held for sale and its residential mortgage loan commitments. The commitments to originate mortgage loans held for sale and the related forward delivery contracts are considered derivatives. Accounting guidance requires recognition of all derivatives as either assets or liabilities in the balance sheet and requires measurement of those instruments at fair value through adjustments to accumulated other comprehensive income and/or current operations, as appropriate. None of the Company’s derivatives qualify for hedge accounting and the Company reports changes in fair values of its derivatives in current period operations.
55
Table of Contents
NOTES TO CONSOLIDATED FINANCIAL STATEMENTS—(Continued)
The fair value of the derivative loan commitments is estimated using the present value of expected future cash flows. Assumptions include a pull-through rate assumption based on historical information, current mortgage interest rates, the stage of completion of the underlying application and underwriting process, and the time remaining until the expiration of the derivative loan commitment.
Foreclosed real estate and other foreclosed assets:
Real estate properties acquired through, or in lieu of, loan foreclosure are to be sold and are initially recorded at the lower of the recorded investment or its fair value at the date of foreclosure establishing a new cost basis. After foreclosure, management periodically obtains valuations and the real estate is carried at the lower of carrying amount or fair value less cost to sell. Any subsequent write-downs are recorded as a decrease in the asset and charged against foreclosed real estate and other foreclosed assets expense. Operating expenses of such properties, net of related income, are included in foreclosed real estate and other foreclosed assets expense, and gains and losses on their disposition are included in other non-interest income.
Premises and equipment:
Premises and equipment are stated at cost less accumulated depreciation over estimated useful lives ranging from 1 to 39 years. Land is carried at cost. Depreciation expense is calculated using the straight-line method for financial statement purposes. Expenditures for new premises and equipment and major betterments are capitalized. Normal costs of maintenance and repairs are charged to expense as incurred.
Management reviews long-lived assets and intangibles any time that a change in circumstance indicates that the carrying amount of these assets may not be recoverable. Recoverability of these assets is determined by comparing the carrying value of the assets to the forecasted undiscounted cash flows of the operation associated with the asset. If the evaluation of the forecasted cash flows indicates that the carrying value of the asset is not recoverable, the asset is written down to fair value. Any buildings held for sale are recorded at the lower of depreciated cost or fair value.
Goodwill and intangible assets:
Net assets of companies acquired in purchase transactions are recorded at fair value at the date of acquisition. Identified intangibles are amortized over the period benefited. Goodwill is not amortized but is reviewed for potential impairment on an annual basis, or more frequently if events or circumstances indicate a potential impairment. An impairment loss is recorded to the extent that the carrying amount of goodwill exceeds its implied fair value. Additional accounting guidance requires that goodwill be evaluated for each reporting unit. The Company evaluates goodwill in terms of having one segment, or reporting unit – commercial banking. The Company evaluated goodwill for impairment and found $18.9 million of impairment for the year ended December 31, 2009. The Company and an independent valuation firm evaluated goodwill for impairment and found $109.0 million of impairment for the year ended December 31, 2008. The Company evaluated goodwill and determined no impairment existed for the year ended December 31, 2007.
Income taxes:
The Company files a United States federal income tax return and state tax returns in Idaho and Utah. With few exceptions, the Company is no longer subject to United States federal or state income tax examinations by tax authorities for years before 2006. The Company accounts for income taxes using the asset—liability method, which requires that deferred tax assets and liabilities be determined based on the temporary differences between the financial statement carrying amounts and tax bases of assets and liabilities and tax attributes using enacted tax rates in effect in the years in which the temporary differences are expected to reverse. The Company allocates
56
Table of Contents
NOTES TO CONSOLIDATED FINANCIAL STATEMENTS—(Continued)
the provision for income taxes, current receivable or payable and deferred assets and liabilities between the Bank and the Parent Company as if they were stand-alone tax reporting entities. Any estimated accrued interest and/or penalties associated with unrecognized tax assets or liabilities are recognized in tax expense. In accordance with accounting guidance, management has determined that all of the deferred tax asset will likely not be realized and has thus set aside a 100% valuation allowance against the deferred tax asset as of December 31, 2009 and 2008.
Earnings (loss) per share:
Basic earnings (loss) per share is computed by dividing net income by the weighted average number of common shares outstanding during the period. Diluted earnings (loss) per share is computed in a similar manner, except that the denominator is increased to include the number of additional common shares that would have been outstanding if potentially dilutive common shares were issued using the treasury stock method. For all periods presented, stock options and unvested restricted stock are the only potentially dilutive instruments issued by the Company.
Stock-based compensation:
Share-based payments to employees, including grants of employee stock options, are recognized in the Consolidated Statements of Operations based on their fair values. The fair values of stock options were calculated using the Black-Scholes-Merton model and are recognized over the vesting period. Compensation cost is recorded as if each vesting portion of the award is a separate award. Key assumptions in the model to derive the fair value of stock options granted include the risk free interest rate, expected volatility, expected cash dividends and the expected life of the award.
Comprehensive income:
Recognized revenue, expenses, gains and losses are included in net income (loss). Although certain changes in assets and liabilities, such as unrealized gains and losses on available-for-sale securities, are reported as a separate component of the equity section of the balance sheet, such items, along with net income (loss), are components of comprehensive income.
The following table summarizes the available-for-sale securities component of comprehensive income (loss) for the periods presented:
| ($ in thousands) |
Year Ended December 31, | |||||||||||
| 2009 | 2008 | 2007 | ||||||||||
| Unrealized holding gains (losses) on available-for-sale securities |
$ | 1,173 | $ | (606 | ) | $ | 73 | |||||
| Reclassification adjustments for impairment gains and losses, net, included in income |
(213 | ) | 511 | 24 | ||||||||
| Net unrealized gains (losses) |
$ | 960 | $ | (95 | ) | $ | 97 | |||||
| Tax benefit (liability) |
— | 69 | (34 | ) | ||||||||
| Net change in unrealized loss on available-for-sale securities |
$ | 960 | $ | (26 | ) | $ | 63 | |||||
Other off-balance sheet instruments:
In the ordinary course of business the Bank has entered into off-balance sheet financial instruments consisting of commitments to extend credit, commercial letters of credit, and standby letters of credit. Such financial instruments are held for purposes other than trading and are recorded in the financial statements when they are funded or related fees are incurred or received.
57
Table of Contents
NOTES TO CONSOLIDATED FINANCIAL STATEMENTS—(Continued)
The Bank has entered into various operating lease agreements mainly for facilities and land on which banking facilities are located. These leases are for terms ranging from month-to-month to up to 45 years. Certain lease agreements have renewal options at the end of the original term and certain lease agreements have escalation clauses in the rent payments. Lease payments are recorded on a straight-line basis over the life of the lease.
Bank owned life insurance:
The Bank has purchased, or acquired through mergers, life insurance policies that provide protection against the adverse financial effects that could result from the death of a key employee and provide tax deferred income. Although the lives of individual current or former management-level employees are insured, the Bank is the owner and beneficiary of all policies. The Bank is exposed to credit risk to the extent an insurance company is unable to fulfill its financial obligations under a policy. In order to mitigate this risk, the policies are placed with multiple insurance companies and the Bank regularly monitors their financial condition.
Transfer of financial assets:
Transfers of financial assets are accounted for as sales when control over the assets has been surrendered. Control over transferred assets is deemed to be surrendered when (1) the assets have been isolated from the Bank, (2) the transferee obtains the right (free of conditions that constrain it from taking advantage of that right) to pledge or exchange the transferred assets, and (3) the Bank does not maintain effective control over the transferred assets through an agreement to repurchase them before their maturity.
Significant group concentrations of credit risk:
Most of the Bank’s business activity is concentrated with customers located within its principal market area. The Bank originates commercial real estate, construction, land development and other land, commercial and industrial, agricultural, residential real estate, installment and other loans. Generally, loans are secured by accounts receivable, inventory, deposit accounts, personal property or real estate. Rights to collateral vary and are legally documented to the extent practicable. Although the Bank has a generally diversified loan portfolio, local economic conditions may affect borrowers’ ability to meet the stated repayment terms. The ability of the Bank’s borrowers to honor their contracts is dependent upon the real estate and general economic conditions in the area.
Advertising:
The Company expenses all costs associated with advertising and promotional efforts as incurred. Advertising costs for the years ended December 31, 2009, 2008 and 2007 were $553 thousand, $894 thousand and $972 thousand, respectively.
Estimates:
In preparing the financial statements, management is required to make estimates and assumptions that affect the reported amounts of certain assets and liabilities and the disclosure of contingent assets and liabilities as of the date of the statement of financial condition and certain revenues and expenses for the period and the accompanying notes. Actual results could differ materially from those estimates. Material estimates that are particularly susceptible to significant changes in the near term relate to the determination of the allowance for loan losses, fair value of investment securities, reserve for unfunded commitments, the valuation of foreclosed real estate and other foreclosed assets and the valuation of goodwill and other intangibles. In connection with the determination of estimated losses on loans and foreclosed real estate and other foreclosed assets, management obtains independent appraisals for significant properties.
58
Table of Contents
NOTES TO CONSOLIDATED FINANCIAL STATEMENTS—(Continued)
Reclassifications:
Certain prior year balances have been reclassified to conform to the current year presentation. These reclassifications had no effect on stockholders’ equity or results of operations as previously presented.
Note 2. Going Concern
The consolidated financial statements have been prepared assuming that the Company will continue as a going concern. The Company and the subsidiary Bank are considered “significantly under-capitalized” as of December 31, 2009 as discussed in Note 24. Due to market conditions discussed below and other factors, there is uncertainty about the Company’s ability to satisfy regulatory requirements, including restoration of the Bank to capital levels stipulated in the Order to Cease and Desist (Order) issued by the FDIC in May 2009 and Supervisory Prompt Corrective Action Directive (PCA Directive) received in February 2010. The Order required the Bank to attain a Tier 1 leverage capital ratio by September 8, 2009. The PCA Directive requires the Bank to attain “adequately capitalized” status by March 28, 2010. The additional capital required to satisfy the requirements of the Order and PCA Directive as of December 31, 2009 were approximately $119 million and $42 million, respectively.
As a part of its capital raising efforts launched during the second quarter of 2008, the Company engaged a highly qualified investment banking firm with expertise in the financial services sector to assist with a review of all strategic opportunities available to the Company. The principal focus of this effort has been on securing a significant private equity investment, and discussions and due diligence have been undertaken by numerous prospective investors.
While there are a number of financial institutions of similar size and condition that have been attempting to raise capital over the past two years, there has been a very limited amount of new equity that has been raised by under-capitalized banks operating under regulatory enforcement actions. The Company is continuing to vigorously pursue contacts and discussions with prospective investors and believes that if the conditions in the capital markets improve, the prospects for success in these efforts will increase.
During the second quarter of 2008, the Company suspended payment of a quarterly cash dividend and, effective with the third quarter of 2008, dividend payments on trust preferred securities were deferred in accordance with provisions of the related indentures. These two actions will allow the Bank to retain approximately $6 million of capital annually. Efforts to improve the Bank’s capital levels through improved internal equity generation were also initiated during the fourth quarter of 2008 in conjunction with a review and realignment of the Bank’s business model. However, elevated loan loss provisions, foreclosure expenses and FDIC insurance assessments precluded the Company from generating internal capital during 2009.
During 2009 and 2008, the Company took decisive actions to address the deterioration in the construction and development sector of the loan portfolio resulting from a general and severe deterioration in the residential real estate valuations and sales activity. Loan charge-offs of $59.9 million were recognized during 2009, of which over 65% were related to construction and land development loans. Loan charge-offs of $78.6 million were recognized during 2008, of which over 90% were related to construction and land development loans. Although additional loan loss provisions and charge-offs will likely be recognized during 2010, the Company does not expect the other segments of the portfolio will suffer from extreme losses and, accordingly, that the regulatory capital levels will not be impacted by the same magnitude in 2010 as they were in the previous two years.
Despite the restrictions on issuance and renewal of brokered certificates of deposit which became effective in August 2008, the Bank maintained an adequate liquidity position during the years ended December 31, 2009 and 2008 through the strength of its core deposit base, issuance of promotional rate retail certificates of deposit
59
Table of Contents
NOTES TO CONSOLIDATED FINANCIAL STATEMENTS—(Continued)
and benefit of the recently increased FDIC deposit insurance limits. Additionally, the reduction in loans and the liquidity generated from the sale of foreclosed assets have contributed significantly to the Bank’s liquidity position.
There can be no assurances that the Company’s actions referred to above will be successful. These events raise substantial doubt about the Company’s ability to continue as a going concern. The consolidated financial statements do not include any adjustments that might result from the outcome of these uncertainties.
Note 3. Recently Issued Accounting Pronouncements
In December 2007, the Financial Accounting Standards Board (FASB) revised FASB ASC 805, Business Combinations. FASB ASC 805 establishes principles and requirements for how an acquirer recognizes and measures in its financial statements the identifiable assets acquired, the liabilities assumed, any noncontrolling interest in the acquired entity and the goodwill acquired. Furthermore, acquisition-related and other costs will now be expensed rather than treated as cost components of the acquisition. FASB ASC 805 also establishes disclosure requirements to enable the evaluation of the nature and financial effects of the business combination. The revision to this guidance applies prospectively to business combinations for which the acquisition date occurs on or after January 1, 2009. The Company does not expect the adoption of revised FASB ASC 805 will have a material impact on the consolidated financial statements as related to business combinations consummated prior to January 1, 2009. The adoption of these revisions will increase the costs charged to operations for acquisitions consummated on or after January 1, 2009.
In December 2007, FASB amended FASB ASC 810, Consolidation. This amendment establishes accounting and reporting standards for the noncontrolling interest in a subsidiary and for the deconsolidation of a subsidiary. The standard also requires additional disclosures that clearly identify and distinguish between the interest of the parent’s owners and the interest of the noncontrolling owners of the subsidiary. This statement is effective on January 1, 2009 for the Company, to be applied prospectively. The impact of adoption did not have a material impact on the Company’s consolidated financial statements.
In January 2009, FASB amended FASB ASC 325-40, Investments—Other. This amendment addressed certain practice issues related to the recognition of interest income and impairment on purchased beneficial interests and beneficial interests that continue to be held by a transferor in securitized financial assets, by making its other-than-temporary impairment (OTTI) assessment guidance consistent with FASB ASC 320, Investments—Debt and Equity Securities. The amendment removes the reference to the consideration of a market participant’s estimates of cash flows and instead requires an assessment of whether it is probable, based on current information and events, that the holder of the security will be unable to collect all amounts due according to the contractual terms. If it is probable that there has been an adverse change in estimated cash flows, an OTTI is deemed to exist, and a corresponding loss shall be recognized in earnings equal to the entire difference between the investment’s carrying value and its fair value at the balance sheet date of the reporting period for which the assessment is made. This amendment became effective for interim and annual reporting periods ending after December 15, 2008, and is applied prospectively. The impact of adoption did not have a material impact on the Company’s consolidated financial statements.
In April 2009, FASB amended FASB ASC 820, Fair Value Measurements and Disclosures, to address issues related to the determination of fair value when the volume and level of activity for an asset or liability has significantly decreased, and identifying transactions that are not orderly. The revisions affirm the objective that fair value is the price that would be received to sell an asset in an orderly transaction (that is not a forced liquidation or distressed sale) between market participants at the measurement date under current market conditions, even if the market is inactive. The amendment provides additional guidance for estimating fair value when the volume and level of activity for the asset or liability have decreased significantly. It also provides guidance on identifying circumstances that indicate a transaction is not orderly. If determined that a quoted price
60
Table of Contents
NOTES TO CONSOLIDATED FINANCIAL STATEMENTS—(Continued)
is distressed (not orderly), and thereby not representative of fair value, the entity may need to make adjustments to the quoted price or utilize an alternative valuation technique (e.g. income approach or multiple valuation techniques) to determine fair value. Additionally, an entity must incorporate appropriate risk premium adjustments, reflective of an orderly transaction under current market conditions, due to uncertainty in cash flows. The revised guidance requires disclosures in interim and annual periods regarding the inputs and valuation techniques used to measure fair value and a discussion of changes in valuation techniques and related inputs, if any, during the period. It also requires financial institutions to disclose the fair values of investment securities by major security type. The changes are effective for the interim reporting period ending after June 15, 2009, and are to be applied prospectively. The effect of these amendments did not have a significant impact on the fair value measurement of any other assets or liabilities.
In April 2009, FASB revised FASB ASC 320, Investments—Debt and Equity Securities, to change the OTTI model for debt securities. Previously, an entity was required to assess whether it has the intent and ability to hold a security to recovery in determining whether an impairment of that security is other-than-temporary. If the impairment was deemed other-than-temporarily impaired, the investment was written-down to fair value through earnings. Under the revised guidance, OTTI is triggered if an entity has the intent to sell the security, it is likely that it will be required to sell the security before recovery, or if the entity does not expect to recover the entire amortized cost basis of the security. If the entity intends to sell the security or it is likely it will be required to sell the security before recovering its cost basis, the entire impairment loss would be recognized in earnings as an OTTI. If the entity does not intend to sell the security and it is not likely that the entity will be required to sell the security but the entity does not expect to recover the entire amortized cost basis of the security, only the portion of the impairment loss representing credit losses would be recognized in earnings as an OTTI. The credit loss is measured as the difference between the amortized cost basis and the present value of the cash flows expected to be collected of a security. Projected cash flows are discounted by the original or current effective interest rate depending on the nature of the security being measured for potential OTTI. The remaining impairment loss related to all other factors, the difference between the present value of the cash flows expected to be collected and fair value, would be recognized as a charge to other comprehensive income (OCI). Impairment losses related to all other factors are to be presented as a separate category within OCI. For investment securities held to maturity, this amount is accreted over the remaining life of the debt security prospectively based on the amount and timing of future estimated cash flows. The accretion of the OTTI amount recorded in OCI will increase the carrying value of the investment, and would not affect earnings. If there is an indication of additional credit losses the security is reevaluated accordingly based on the procedures described above. Upon adoption of the revised guidance, the noncredit portion of previously recognized OTTI shall be reclassified to accumulated OCI by a cumulative-effect adjustment to the opening balance of retained earnings. These revisions became effective in the interim reporting period ending after June 15, 2009. Upon adoption of this guidance the Company analyzed the securities for which OTTI had been previously recognized and determined that as of the adoption date such losses were credit related. As such, there was no cumulative effect adjustment to the opening balance of the accumulated deficit or a corresponding adjustment to accumulated OCI.
In April 2009, FASB revised FASB ASC 825, Financial Instruments, to require fair value disclosures in the notes of an entity’s interim financial statements for all financial instruments, whether or not recognized in the statement of financial position. This revision became effective for the interim reporting period ending after June 15, 2009. The adoption of the revised increased interim financial statement disclosures and did not impact on the Company’s consolidated financial statements.
In June 2009, FASB issued SFAS No. 166, Accounting for Transfers of Financial Assets—an Amendment of FASB Statement No. 140. This statement has not yet been codified into the FASB ASC. SFAS No. 166 eliminates the concept of a qualifying special-purpose entity, creates more stringent conditions for reporting a transfer of a portion of a financial asset as a sale, clarifies other sale-accounting criteria, and changes the initial measurement of a transferor’s interest in transferred financial assets. This statement is effective for annual reporting periods
61
Table of Contents
NOTES TO CONSOLIDATED FINANCIAL STATEMENTS—(Continued)
beginning after November 15, 2009, and for interim periods therein. The Company does not anticipate this guidance will have a material impact on the Company’s consolidated financial statements.
In June 2009, FASB issued SFAS No. 167, Amendments to FASB Interpretation No. 46(R). This statement has not yet been codified into the FASB ASC. SFAS No. 167 eliminates FASB Interpretations 46(R) (FIN 46(R)) exceptions to consolidating qualifying special-purpose entities, contains new criteria for determining the primary beneficiary, and increases the frequency of required reassessments to determine whether a company is the primary beneficiary of a variable interest entity. SFAS No. 167 also contains a new requirement that any term, transaction, or arrangement that does not have a substantive effect on an entity’s status as a variable interest entity, a company’s power over a variable interest entity, or a company’s obligation to absorb losses or its right to receive benefits of an entity must be disregarded in applying FIN 46(R) provisions. The elimination of the qualifying special-purpose entity concept and its consolidation exceptions means more entities will be subject to consolidation assessments and reassessments. This statement requires additional disclosures regarding an entity’s involvement in a variable interest entity. This statement is effective for annual reporting periods beginning after November 15, 2009, and for interim periods therein. The Company does not anticipate this guidance will have a material impact on the Company’s consolidated financial statements.
In June 2009, FASB codified FASB ASC 105, Generally Accepted Accounting Principles, to establish the FASB ASC (Codification). The Codification is not expected to change U.S. GAAP, but combines all authoritative standards into a comprehensive, topically organized online database. Following this guidance, the FASB will not issue new standards in the form of Statements, FASB Staff Positions, or Emerging Issues Task Force Abstracts. Instead, it will issue Accounting Standards Updates (ASU) to update the Codification. After the launch of the Codification on July 1, 2009 only one level of authoritative U.S. GAAP for non governmental entities will exist, other than guidance issued by the Securities and Exchange Commission. This statement is effective for interim and annual reporting periods ending after September 15, 2009. The adoption of the FASB ASC 105 did not have any impact on the Company’s consolidated financial statements, and only affects how the Company references authoritative accounting guidance going forward.
In August 2009, the FASB issued FASB ASU No. 2009-05, Measuring Liabilities at Fair Value. This update amends FASB ASC 820, Fair Value Measurements and Disclosure, in regards to the fair value measurement of liabilities. FASB ASC 820 clarifies that in circumstances in which a quoted price for a identical liability in an active market is not available, a reporting entity shall utilize one or more of the following techniques: i) the quoted price of the identical liability when traded as an asset, ii) the quoted price for a similar liability or a similar liability when traded as an asset, or iii) another valuation technique that is consistent with the principles of FASB ASC 820. In all instances a reporting entity shall utilize the approach that maximizes the use of relevant observable inputs and minimizes the use of unobservable inputs. Also, when measuring the fair value of a liability a reporting entity shall not include a separate input or adjustment to other inputs relating to the existence of a restriction that prevents the transfer of the liability. This update is effective for the Company in the fourth quarter of 2009. The guidance did not have a material impact on the Company’s consolidated financial statements.
In September 2009, the FASB issued ASU No. 2009-12 Fair Value Measurements and Disclosures (Topic 820), Investments in Certain Entities that Calculate Net Asset Values per Share (or Its Equivalent). This applies to investments that are measured at a net asset value per share because the investment’s fair value is not readily available, reducing the required steps in measuring fair value, and increasing associated disclosures and is effective for periods ending after December 15, 2009. The adoption of this guidance is not expected to have a material impact on the Company.
In December 2009, the FASB issued ASU No. 2009-16 Transfers and Servicing (Topic 860), Accounting for Transfers of Financial Assets. This guidance establishes standards for transfers and servicing of financial assets
62
Table of Contents
NOTES TO CONSOLIDATED FINANCIAL STATEMENTS—(Continued)
and the accounting for transfers of servicing assets. The guidance is effective beginning on January 1, 2010 and is not expected to have a material impact on the Company.
In December 2009, the FASB issued ASU No. 2009-17 Consolidations (Topic 810), Improvements to Financial Reporting by Enterprises with Variable Interest Entities. The guidance clarifies the application of the general subsections within the Topic 810 to certain legal entities. The guidance is effective at December 31, 2009 and did not have any impact on the Company.
Note 4. Business Combinations
Far West Bancorporation
On April 1, 2007, the Company acquired Far West Bancorporation (FWBC) and its wholly-owned subsidiary, Far West Bank, in an acquisition accounted for under the purchase method of accounting. The acquisition was consistent with the Company’s strategic plan to expand into high growth markets. The financial results of FWBC have been included in the Company’s consolidated financial statements since that date.
The aggregate purchase price was $155.6 million and included cash of $30.0 million, common stock of $124.4 million and direct merger costs of $1.2 million. The value of the 5,744,197 shares issued was determined based on the $21.66 average closing market price of the Company’s common stock for the two trading days before and after the measurement date of March 28, 2007 when the number of shares to be issued was determined. Total transaction expenses of $1.6 million included $1.2 million of direct expenses noted above and $367 thousand of other miscellaneous merger expenses.
The following table summarizes the estimated fair value of the assets acquired and liabilities assumed at the date of acquisition.
| ($ in thousands) |
|||
| Assets acquired: |
|||
| Cash and cash equivalents |
$ | 31,485 | |
| Securities |
30,217 | ||
| Loans, net of allowance for loan losses |
341,904 | ||
| Goodwill |
94,779 | ||
| Core deposit intangible |
12,916 | ||
| Premises and equipment, net |
13,241 | ||
| Other assets |
21,458 | ||
| Total assets |
$ | 546,000 | |
| Liabilities assumed: |
|||
| Deposits |
383,386 | ||
| Other liabilities |
6,998 | ||
| Total liabilities |
$ | 390,384 | |
| Net assets acquired |
$ | 155,616 | |
The core deposit intangible of $12.9 million is being amortized on an accelerated basis over 10 years. Goodwill of $94.8 million is not amortized but is reviewed for potential impairment on an annual basis, or if events or circumstances indicate a potential impairment (refer to Note 8 of the Notes to Consolidated Financial Statements). An insignificant amount of the goodwill recorded was deductible for tax purposes.
The following table presents unaudited pro forma results of operations related to the acquisition consummated on April 1, 2007 for the year ended December 31, 2007. The cost savings and revenue
63
Table of Contents
NOTES TO CONSOLIDATED FINANCIAL STATEMENTS—(Continued)
enhancements already realized by the Company as a result of the FWBC merger are included in the AWBC column for the year ended December 31, 2007. Additional cost savings and revenue enhancements anticipated are not reflected in the pro forma consolidated condensed statements of income. No assurance can be given with respect to the ultimate level of such cost savings or revenue enhancements. The AWBC column reflects the Company’s actual results reported for the periods shown. The FWBC column reflects the actual results for the periods shown, prior to the acquisition date. The pro forma column represents purchase adjustments which would have occurred during the periods shown if the acquisition would have occurred on January 1, 2006. The pro forma results do not necessarily indicate the results that would have been obtained had the acquisition actually occurred on January 1, 2006.
For the year ended December 31, 2007
| (in thousands, except per share amounts) |
AWBC | FWBC | Pro Forma Adjustments |
Pro Forma Combined | |||||||||
| Net interest income |
$ | 84,089 | $ | 8,718 | $ | (257) | (a) | $ | 92,550 | ||||
| Provision for loan losses |
17,341 | 2,005 | 19,346 | ||||||||||
| Non-interest income |
16,316 | 2,413 | 18,729 | ||||||||||
| Non-interest expense |
70,767 | 8,099 | (49) | (b) | 78,817 | ||||||||
| Income before provision for income tax |
12,297 | 1,027 | (208) | 13,116 | |||||||||
| Provision for income taxes |
3,759 | 387 | (73) | (c) | 4,073 | ||||||||
| Net Income |
$ | 8,538 | $ | 640 | $ | (135) | $ | 9,043 | |||||
| Basic earnings per share |
$ | 0.54 | $ | 0.53 | |||||||||
| Diluted earnings per share |
$ | 0.54 | $ | 0.52 | |||||||||
| Basic weighted average shares outstanding |
15,766 | 17,182 | |||||||||||
| Diluted weighted average shares outstanding |
15,864 | 17,280 | |||||||||||
| (a) | Amount represents amortization of purchase adjustments and interest expense on junior subordinated debt issuance. |
| (b) | Amount represents amortization of intangibles. |
| (c) | Income tax effect of pro forma adjustments. |
Note 5. Cash and Cash Equivalents
The Bank is required to maintain an average reserve balance with the Federal Reserve Bank or maintain such reserve balance in the form of cash or combination thereof. The amount of required reserve balance at December 31, 2009 and 2008 was $7.9 million and $10.3 million, respectively, and was met by holding cash and maintaining an average balance with the Federal Reserve Bank.
The average amounts of federal funds sold and overnight interest bearing deposits with other banks for the years ended December 31, 2009 and 2008 were $93.6 million and $11.4 million, respectively.
64
Table of Contents
NOTES TO CONSOLIDATED FINANCIAL STATEMENTS—(Continued)
Note 6. Securities
Debt and equity securities have been classified according to management’s intent to have them available-for-sale. The amortized cost of securities, their gross unrealized gains and losses and their fair values at the respective dates are shown in the following table:
| December 31, 2009 ($ in thousands) |
Amortized Cost |
Gross Unrealized Gains |
Gross Unrealized Losses |
Fair Value | ||||||||
| Obligations of federal government agencies |
$ | 3,230 | $ | 176 | $ | 6 | $ | 3,400 | ||||
| Obligations of states, municipalities and political subdivisions |
20,126 | 228 | 61 | 20,293 | ||||||||
| Mortgage-backed securities |
23,668 | 751 | 5 | 24,414 | ||||||||
| Other securities |
900 | — | 21 | 879 | ||||||||
| Total |
$ | 47,924 | $ | 1,155 | $ | 93 | $ | 48,986 | ||||
| December 31, 2008 ($ in thousands) |
Amortized Cost |
Gross Unrealized Gains |
Gross Unrealized Losses |
Fair Value | ||||||||
| Obligations of federal government agencies |
$ | 5,597 | $ | 223 | $ | 6 | $ | 5,814 | ||||
| Obligations of states, municipalities and political subdivisions |
21,845 | 168 | 562 | 21,451 | ||||||||
| Mortgage-backed securities |
36,311 | 507 | 212 | 36,606 | ||||||||
| Other securities |
1,415 | — | 16 | 1,399 | ||||||||
| Total |
$ | 65,168 | $ | 898 | $ | 796 | $ | 65,270 | ||||
The following table includes information on investment securities with unrealized losses at the respective dates.
| December 31, 2009 ($ in thousands) |
Less than 12 months | 12 Months or Longer | Total | |||||||||||||||
| Fair Value |
Unrealized Losses |
Fair Value |
Unrealized Losses |
Fair Value |
Unrealized Losses | |||||||||||||
| Obligations of federal government agencies |
$ | — | $ | — | $ | 153 | $ | 6 | $ | 153 | $ | 6 | ||||||
| Obligations of states, municipalities and political subdivisions |
4,021 | 33 | 2,028 | 28 | 6,049 | 61 | ||||||||||||
| Mortgage-backed securities |
— | — | 537 | 5 | 537 | 5 | ||||||||||||
| Other securities |
5 | 8 | 7 | 13 | 12 | 21 | ||||||||||||
| Total |
$ | 4,026 | $ | 41 | $ | 2,725 | $ | 52 | $ | 6,751 | $ | 93 | ||||||
| December 31, 2008 ($ in thousands) |
Less than 12 months | 12 Months or Longer | Total | |||||||||||||||
| Fair Value |
Unrealized Losses |
Fair Value |
Unrealized Losses |
Fair Value |
Unrealized Losses | |||||||||||||
| Obligations of federal government agencies |
$ | — | $ | — | $ | 196 | $ | 6 | $ | 196 | $ | 6 | ||||||
| Obligations of states, municipalities and political subdivisions |
4,925 | 193 | 8,085 | 369 | 13,010 | 562 | ||||||||||||
| Mortgage-backed securities |
11,210 | 212 | — | — | 11,210 | 212 | ||||||||||||
| Other securities |
4 | 16 | — | — | 4 | 16 | ||||||||||||
| Total |
$ | 16,139 | $ | 421 | $ | 8,281 | $ | 375 | $ | 24,420 | $ | 796 | ||||||
65
Table of Contents
NOTES TO CONSOLIDATED FINANCIAL STATEMENTS—(Continued)
Certain investment securities shown above have fair values less than amortized cost and therefore contain unrealized losses. At December 31, 2009, the Company evaluated the securities which had an unrealized loss for other than temporary impairment and determined all declines in value were temporary. There were 19 and 35 investment securities with unrealized losses at December 31, 2009 and 2008, respectively. The Company anticipates full recovery of amortized cost with respect to the securities carried at December 31, 2009 at maturity, or sooner in the event of a more favorable market interest rate environment.
At December 31, 2008, the Company evaluated the securities that had an unrealized loss for other than temporary impairment and determined that one security was other than temporarily impaired. An impairment charge of $492 thousand was recognized during the year ended December 31, 2008. The security that was deemed to be impaired during the year ended December 31, 2008 was sold during the year ended December 31, 2009 resulting in a gain of $133 thousand.
Taxable interest income on securities was $1.9 million, $2.3 million and $2.1 million for 2009, 2008 and 2007, respectively. Non-taxable interest income on securities was $604 thousand, $777 thousand and $691 thousand for 2009, 2008 and 2007, respectively. Dividend income on securities was $167 thousand, $188 thousand and $105 thousand for 2009, 2008 and 2007, respectively. During the year ended December 31, 2009, total proceeds from sales of securities were $11.0 million and included gains of $261 thousand and losses of $48 thousand. During the year ended December 31, 2008, total proceeds from sales of securities were $1.1 million and included gains of $19 thousand and losses of $38 thousand. During the year ended December 31, 2007, total proceeds from sales of securities were $10.4 million and included gains of $20 thousand and losses of $44 thousand.
Securities with an amortized cost of $32.2 million and $53.2 million at December 31, 2009 and 2008, respectively, were pledged for purposes required or permitted by law. The market value of these securities was $33.2 million and $53.2 million at December 31, 2009 and 2008, respectively.
The contractual scheduled maturity of securities at December 31, 2009 was as follows:
| ($ in thousands) |
Amortized Cost |
Fair Value | ||||
| Due in one year or less |
$ | 2,562 | $ | 2,602 | ||
| Due from one to five years |
5,787 | 6,020 | ||||
| Due from five to ten years |
9,655 | 9,870 | ||||
| Due after ten years |
29,020 | 29,615 | ||||
| Other non-maturity securities |
900 | 879 | ||||
| Total |
$ | 47,924 | $ | 48,986 | ||
Expected maturities will differ from contractual maturities as the issuers of certain debt securities have the right to call or prepay their obligations without penalties. Mortgage-backed securities have been classified above based on contractual maturities.
66
Table of Contents
NOTES TO CONSOLIDATED FINANCIAL STATEMENTS—(Continued)
Note 7. Loans, Allowance for Loan Losses and Reserve for Unfunded Commitments
Loan categories as of December 31, 2009 and 2008 were as follows:
| ($ in thousands) |
2009 | 2008 | ||||||
| Commercial real estate |
$ | 627,984 | $ | 630,540 | ||||
| Residential real estate |
183,320 | 200,047 | ||||||
| Construction, land development and other land |
168,454 | 388,381 | ||||||
| Agricultural |
142,404 | 160,944 | ||||||
| Commercial and industrial |
130,705 | 215,776 | ||||||
| Installment and other |
19,040 | 28,777 | ||||||
| Total loans |
1,271,907 | 1,624,465 | ||||||
| Allowance for loan losses |
(38,999 | ) | (44,722 | ) | ||||
| Deferred loan fees, net of deferred costs |
(1,608 | ) | (2,637 | ) | ||||
| Net loans |
$ | 1,231,300 | $ | 1,577,106 | ||||
Installment and other loans included $414 thousand and $960 thousand in overdraft deposits reclassified as loans as of December 31, 2009 and 2008, respectively. At December 31, 2009 and 2008, there were $420.4 million and $671.8 million, respectively, of loans pledged as security for borrowings including excess collateral.
The activity related to the allowance for loan losses for each of the years ended December 31, 2009, 2008 and 2007, is presented below:
| ($ in thousands) |
2009 | 2008 | 2007 | |||||||||
| Balance, beginning of year |
$ | 44,722 | $ | 25,258 | $ | 15,136 | ||||||
| Provision for loan losses |
50,330 | 97,170 | 17,341 | |||||||||
| Allowance related to acquired loans |
— | — | 7,529 | |||||||||
| Loans charged-off |
(59,904 | ) | (78,560 | ) | (15,270 | ) | ||||||
| Recoveries |
3,851 | 854 | 522 | |||||||||
| Balance, end of year |
$ | 38,999 | $ | 44,722 | $ | 25,258 | ||||||
The activity related to the reserve for unfunded commitments, for each of the years ended December 31, 2009, 2008 and 2007, is presented below:
| ($ in thousands) |
2009 | 2008 | 2007 | ||||||||
| Balance, beginning of year |
$ | 660 | $ | 1,374 | $ | 881 | |||||
| Reserve related to acquired unfunded commitments |
— | — | 257 | ||||||||
| Provision for unfunded commitments |
(204 | ) | (714 | ) | 236 | ||||||
| Balance, end of year |
$ | 456 | $ | 660 | $ | 1,374 | |||||
There were no charge-offs or recoveries related to the reserve for unfunded commitments for the years ended December 31, 2009, 2008 and 2007.
67
Table of Contents
NOTES TO CONSOLIDATED FINANCIAL STATEMENTS—(Continued)
Impaired and non-accrual loan information as of December 31, 2009 and 2008 was as follows:
| ($ in thousands) |
2009 | 2008 | ||||
| Impaired loans without a specific allowance for loan losses |
$ | 92,665 | $ | 88,110 | ||
| Impaired loans with a specific allowance for loan losses |
$ | 22,230 | $ | — | ||
| Average impaired loans |
$ | 116,027 | $ | 65,637 | ||
| Non-accrual loans |
$ | 107,900 | $ | 93,316 | ||
As of December 31, 2008, non-performing relationships greater than $500 thousand were included in management’s analysis above as impaired loans. As of December 31, 2009, all non-performing loans and troubled debt restructurings are included in management’s analysis above as impaired loans. The impaired and non-accrual loans shown for December 31, 2009 and 2008 include $2.6 million and $1.6 million, respectively, of government guarantees. Had the impaired loans been performing during the years ended December 31, 2009, 2008 and 2007, the Company would have recognized an additional $4.3 million, $4.3 million and $1.3 million in interest income, respectively. The Company did recognize $3.7 million of interest income during the year ended December 31, 2009 related to the impaired loans in the above table, of which $398 thousand was related to performing restructured loans discussed below.
At December 31, 2009, impaired loans of $7.0 million were classified as performing restructured loans. The restructurings were granted in response to borrower financial difficulty, and generally provide for a temporary modification of loan repayment terms. In order for a restructured loan to be considered performing and on accrual status, the loan’s collateral coverage generally will be greater than or equal to 100% of the loan balance, the loan is current on payments, and the borrower must either prefund an interest reserve or demonstrate the ability to make payments from a verified source of cash flow. The table above includes $9.2 million impaired loans classified as non-performing restructured loans.
Note 8. Premises and Equipment
Major classifications of premises and equipment are summarized as of December 31, 2009 and 2008 as follows:
| ($ in thousands) |
2009 | 2008 | Estimated Useful Life | |||||||
| Premises |
$ | 20,495 | $ | 20,994 | 5-39 Years | |||||
| Furniture, fixtures, and equipment |
18,551 | 19,737 | 3-20 Years | |||||||
| Leasehold improvements |
12,656 | 13,146 | 1-39 Years | |||||||
| 51,702 | 53,877 | |||||||||
| Less accumulated depreciation |
(20,748 | ) | (18,156 | ) | ||||||
| 30,954 | 35,721 | |||||||||
| Land |
4,923 | 5,664 | ||||||||
| Premises and equipment, net |
$ | 35,877 | $ | 41,385 | ||||||
Depreciation expense for the years ended December 31, 2009, 2008 and 2007 was $4.4 million, $4.6 million, and $3.7 million, respectively.
The Company closed six branches in the first quarter of 2009. These branches were evaluated for possible impairment during the year ended December 31, 2008 and the assets were deemed to be impaired by $409 thousand. In addition, certain other premises were evaluated for impairment during 2008 and were determined to
68
Table of Contents
NOTES TO CONSOLIDATED FINANCIAL STATEMENTS—(Continued)
be impaired by $284 thousand. These impairment charges are recorded within other non-interest expense within the Statements of Operations. As of December 31, 2009, the Company had a building held for sale with a carrying value of $780 thousand which is included as premises in the table above.
During the year ended December 31, 2007, the Bank recorded an impairment charge of $219 thousand for a building held for sale due to changing real estate conditions from the prior year. During the year ended December 31, 2008, this building was sold with an insignificant gain.
Note 9. Goodwill and Intangible Assets
The following table summarizes the changes in the Company’s goodwill and intangible assets for the years ended December 31, 2009 and 2008:
| ($ in thousands) |
Goodwill | Intangible Assets |
||||||
| Balance, December 31, 2007 |
$ | 127,852 | $ | 16,942 | ||||
| Impairment |
(109,000 | ) | — | |||||
| Amortization |
— | (3,475 | ) | |||||
| Balance, December 31, 2008 |
$ | 18,852 | $ | 13,467 | ||||
| Impairment |
(18,852 | ) | — | |||||
| Amortization |
— | (2,864 | ) | |||||
| Balance, December 31, 2009 |
$ | — | $ | 10,603 | ||||
During the quarter ended September 30, 2009, management performed its annual analysis to evaluate potential impairment of goodwill. The analysis is a two step test and involves significant assumptions and judgment. The first step, used to identify potential impairment, involves determining and comparing the fair value of the Company, including a control premium, with its carrying value, or stockholders’ equity. If the fair value of the Company exceeds its carrying value, goodwill is not impaired. If the carrying value exceeds the fair value, there is an indication of impairment and the second step is performed to determine the amount of the impairment, if any. The fair value determined in the first test was determined primarily based on the Company’s market capitalization plus a control premium and, to a lesser extent, based on multiples of comparable bank sale transactions. Based on the results of the first step, the Company concluded that the potential for goodwill impairment existed and, therefore, a second step was performed to determine if there was goodwill impairment and the amount of goodwill that might be impaired. The second step compared the fair value of the Company to the aggregate fair values of its individual assets, liabilities and identified intangibles. Based on the second step, management concluded the remaining carrying value of goodwill was impaired. Accordingly, a charge of $18.9 million was recognized in the Consolidated Statements of Operations for the year ended December 31, 2009.
During the year ended December 31, 2008, in connection with its annual impairment review of goodwill, management engaged an independent valuation firm to assist with the impairment valuation of the remaining carrying value of goodwill. The analysis was similar to that discussed above and involved a significant amount of judgment. The independent valuation concluded the impairment of goodwill was $109.0 million which was reflected through charges in the first and third quarters within the Consolidated Statements of Operations for the year ended December 31, 2008.
At December 31, 2009, the Company had $10.6 million of core deposit intangible assets which were recorded in connection with various business combinations. Generally accepted accounting principles require that core deposit intangible assets be amortized to expense over their estimated useful lives. These intangibles were also evaluated as part of the annual 2009 and 2008 impairment analysis and there was no indication of impairment.
69
Table of Contents
NOTES TO CONSOLIDATED FINANCIAL STATEMENTS—(Continued)
The accumulated amortization of intangible assets at December 31, 2009 was $12.5 million and the weighted average remaining amortization period for intangible assets was 6.3 years. The table below presents the forecasted amortization expense for 2010 through 2014 for other intangible assets acquired in all mergers:
| ($ in thousands) |
Expected Amortization | ||
| 2010 |
$ | 2,431 | |
| 2011 |
$ | 2,093 | |
| 2012 |
$ | 1,809 | |
| 2013 |
$ | 1,823 | |
| 2014 |
$ | 1,050 | |
Note 10. Bank Owned Life Insurance
The cash surrender values related to life insurance policies, net of estimated surrender charges, were $31.2 million and $30.2 million at December 31, 2009 and 2008, respectively. For the years ended December 31, 2009, 2008 and 2007, income related to bank owned life insurance was $1.0 million, $1.1 million, and $1.0 million, respectively, and is reflected in other non-interest income within the Consolidated Statements of Operations.
Note 11. Income taxes
The components of income tax (benefit) expense for the years presented were as follows:
| ($ in thousands) |
Years ended December 31, | |||||||||||
| 2009 | 2008 | 2007 | ||||||||||
| Current (benefit) expense |
$ | (13,160 | ) | $ | (10,602 | ) | $ | 8,046 | ||||
| Deferred tax (benefit) expense |
— | 4,796 | (4,287 | ) | ||||||||
| Income tax (benefit) expense |
$ | (13,160 | ) | $ | (5,806 | ) | $ | 3,759 | ||||
The effective tax rate differs from the statutory tax rate for the years presented as follows:
| ($ in thousands) |
Years ended December 31, | |||||||||||
| 2009 | 2008 | 2007 | ||||||||||
| Income tax (benefit) expense at statutory rate |
$ | (29,500 | ) | $ | (69,358 | ) | $ | 4,304 | ||||
| Effect of change in valuation allowance |
19,921 | 26,942 | — | |||||||||
| Effect of goodwill impairment |
6,598 | 38,150 | — | |||||||||
| Effect of law change for carryback period election |
(9,474 | ) | — | — | ||||||||
| Other |
(705 | ) | (1,540 | ) | (545 | ) | ||||||
| Income tax (benefit) expense |
$ | (13,160 | ) | $ | (5,806 | ) | $ | 3,759 | ||||
70
Table of Contents
NOTES TO CONSOLIDATED FINANCIAL STATEMENTS—(Continued)
The following were the significant components of the deferred tax assets and liabilities as of the respective dates:
| ($ in thousands) |
December 31, | |||||||
| 2009 | 2008 | |||||||
| Deferred tax assets: |
||||||||
| Allowance for loan losses and reserve for unfunded commitments |
$ | 13,744 | $ | 16,018 | ||||
| Net operating losses and tax credits |
19,140 | 11,562 | ||||||
| Deferred compensation expense |
3,254 | 3,415 | ||||||
| Interest on non-accrual loans |
1,915 | 1,632 | ||||||
| Other real estate |
5,811 | 1,079 | ||||||
| Acquired intangible asset |
910 | 1,078 | ||||||
| Deferred loan fees |
501 | 831 | ||||||
| Other |
820 | 1,425 | ||||||
| Gross deferred tax assets |
46,095 | 37,040 | ||||||
| Valuation allowance |
(37,606 | ) | (26,942 | ) | ||||
| Total deferred tax asset |
8,489 | 10,098 | ||||||
| Deferred tax liabilities: |
||||||||
| Intangible assets |
3,255 | 4,282 | ||||||
| Depreciation |
3,581 | 4,022 | ||||||
| FHLB stock dividend income |
887 | 909 | ||||||
| Other |
766 | 885 | ||||||
| Total deferred tax liabilities |
8,489 | 10,098 | ||||||
| Net deferred tax assets |
$ | — | $ | — | ||||
As of December 31, 2009 and 2008, income taxes receivable were $13.3 million and $10.6 million, respectively, and are included in other assets on the Consolidated Statements of Financial Condition.
At December 31, 2009 and 2008 the Company had $37.6 million and $26.9 million, respectively, of net deferred tax assets comprised of tax-affected cumulative timing differences primarily related to the provision for loan losses and net operating loss and other tax carry-forwards arising in 2009 and 2008. The Company provided a 100 percent valuation allowance against the net deferred tax assets at December 31, 2009 and 2008, as there was no assurance that the Company would generate future taxable income to utilize such assets. Management will review the valuation allowance requirement periodically and make adjustments as warranted.
At December 31, 2009, the Company had a net operating loss carry-forward of approximately $44.1 million for U.S. federal income tax purposes that will expire in 2029, an alternative minimum tax credit carry-forward of approximately $440 thousand that will not expire and a general business credit carry-forward of approximately $2.1 million that will expire beginning in 2024 through 2028. The Company has an Idaho state net operating loss carry-forward of approximately $10.1 million that will expire beginning in 2028 through 2029 and a Utah state net operating loss carry-forward of approximately $33.1 million that will expire beginning in 2023 through 2024.
During the year ended December 31, 2008 and 2007, historical rehabilitation tax credits of $42 thousand and $120 thousand, respectively, were subject to recapture due to a modification of the usage of a building and uncertain completion of construction of another building for which the Company had previously recognized historical rehabilitation credits. There were no similar recaptures during the year ended December 31, 2009.
71
Table of Contents
NOTES TO CONSOLIDATED FINANCIAL STATEMENTS—(Continued)
At December 31, 2008 the Company recorded a liability of $99 thousand, including $14 thousand of penalties and interest, related to uncertain tax positions taken in prior years. Interest and penalties have been classified in the financial statements as income taxes. A reconciliation of the beginning and ending amount of unrecognized tax benefits is as follows:
| ($ in thousands) |
December 31, | |||||
| 2009 | 2008 | |||||
| Beginning balance, January 1 |
$ | 99 | $ | — | ||
| Increases in tax provision for prior years |
— | 99 | ||||
| Decreases in tax provisions for prior years |
— | — | ||||
| Gross unrecognized tax benefits at December 31 |
$ | 99 | $ | 99 | ||
The Company does not anticipate that the total amount of unrecognized tax benefit will significantly increase or decrease within the next 12 months. The 2006 through 2009 tax years generally remain subject to examination by federal, Idaho and Utah tax authorities.
Note 12. Federal Home Loan Bank advances and other borrowings
Federal Home Loan Bank (FHLB) advances maturities and weighted average interest rates as of December 31, 2009 and 2008 are summarized as follows:
| December 31, | ||||||||||||
| 2009 | 2008 | |||||||||||
| ($ in thousands) Maturity Date |
Amount | Weighted Average Interest Rate |
Amount | Weighted Average Interest Rate |
||||||||
| 2009 |
79,068 | 2.89 | % | |||||||||
| 2010 |
53,000 | 3.49 | % | 50,000 | 3.66 | % | ||||||
| 2011 |
10,000 | 4.06 | % | 10,000 | 4.06 | % | ||||||
| 2012 |
600 | 3.83 | % | 600 | 3.83 | % | ||||||
| Total |
$ | 63,600 | 3.58 | % | $ | 139,668 | 3.25 | % | ||||
The maximum amount of FHLB advances outstanding at any month-end and the average amounts outstanding for each of the respective periods presented are summarized below:
| ($ in thousands) |
December 31, | |||||
| 2009 | 2008 | |||||
| Maximum amount of outstanding FHLB advances at any month-end |
$ | 189,172 | $ | 243,065 | ||
| Average amount of outstanding FHLB advances during the year |
$ | 111,658 | $ | 188,989 | ||
The Bank’s FHLB advances as of December 31, 2009 and 2008 were all fixed-rate. The Bank had one advance at December 31, 2008 of $3.0 million for which the FHLB had the option to convert the advance to a variable rate after a specified period of time. The Bank’s maximum borrowing capacity is the lesser of 20% of total assets or the eligible collateral balance. At December 31, 2009 and 2008, the Bank had borrowing capacity from the FHLB of $171.3 million and $164.0 million, respectively, subject to the availability of collateral. FHLB advances are collateralized by otherwise unencumbered commercial real estate loans, permanent residential mortgages, other eligible real estate mortgages and investment grade securities. Federal statute requires all members of the FHLB to maintain collateral on FHLB advances equivalent to the amount borrowed on a daily basis.
72
Table of Contents
NOTES TO CONSOLIDATED FINANCIAL STATEMENTS—(Continued)
In addition to the FHLB secured borrowing capacity, the Bank had the ability to borrow from the Federal Reserve Bank of San Francisco (FED) Discount Window. At December 31, 2009 and 2008, the available borrowings from this source were $13.0 million and $87.5 million, respectively. These borrowings are collateralized by commercial loans, agricultural loans and public loans. As of December 31, 2009 and 2008, the Parent Company did not have the ability to borrow funds.
Note 13. Junior Subordinated Debentures
As of December 31, 2009, the Company had four wholly-owned trusts (Trusts) that were formed to issue trust preferred securities and related common securities of the Trusts. The Trusts are summarized as follows:
| ($ in thousands) Trust Name |
Issue Date | Outstanding Amount |
Rate | Effective Rate |
Next Call Date |
Maturity Date | |||||||||
| AmericanWest Statutory Trust I |
September 2002 | $ | 10,310 | Floating | (1) | 3.65 | % | March 2010 | September 2032 | ||||||
| Columbia Trust Statutory Trust I |
June 2003 | 3,093 | Floating | (2) | 3.35 | % | March 2010 | June 2033 | |||||||
| AmericanWest Capital Trust II |
March 2006 | 7,217 | 6.76% | (3) | 6.76 | % | March 2011 | March 2036 | |||||||
| AmericanWest Capital Trust III |
March 2007 | 20,619 | 6.53% | (4) | 6.53 | % | March 2012 | June 2037 | |||||||
| $ | 41,239 | ||||||||||||||
| (1) | Rate based on LIBOR plus 3.40%, adjusted quarterly. |
| (2) | Rate based on LIBOR plus 3.10%, adjusted quarterly. |
| (3) | Rate fixed for 5 years from issuance, then adjusted quarterly thereafter based on LIBOR plus 1.50%. |
| (4) | Rate fixed for 5 years from issuance, then adjusted quarterly thereafter based on LIBOR plus 1.63%. |
All of the common securities of the Trusts are owned by the Company. The Trusts issued their preferred securities to investors, and used the proceeds to purchase junior subordinated debt of the Company. The Company has fully and unconditionally guaranteed the trust preferred securities along with all obligations of the Trusts under the trust agreements. Interest income from the junior subordinated debt is the source of revenues for these Trusts. In accordance with generally accepted accounting standards the Trusts are not consolidated in the Company’s financial statements.
In accordance with the provisions of the related indentures, the Company has notified the trustees of the Trusts each quarter since the third quarter of 2008 that the payment of interest on the junior subordinated debt will be deferred. The Company has the right to defer payment of interest for up to 20 consecutive quarters, although it will continue to accrue the cost and recognize the expense of the interest at the normal rate on a compounded basis until such time as the deferred arrearage has been paid current. As of December 31, 2009, interest totaling $4.0 million, which is included in accrued interest payable within the Consolidated Statements of Condition, was deferred and in arrears.
As of December 31, 2009, $6.2 million of the $40.0 million junior subordinated debt (excluding the common stock of the Trusts) qualified as Tier I capital. Under the guidance issued by the Board of Governors of the Federal Reserve Bank of San Francisco (FRB), a portion of the balance may qualify as Tier 2 capital, although Tier 2 capital cannot exceed Tier 1 capital. The FRB adopted a rule, effective March 31, 2011, that permits the inclusion of junior subordinated debt in Tier I capital, but with stricter quantitative limits. This new rule is not expected to impact the Company. There can be no assurance that the FRB will not further limit the amount of junior subordinated debt permitted to be included in Tier I capital for regulatory capital purposes.
73
Table of Contents
NOTES TO CONSOLIDATED FINANCIAL STATEMENTS—(Continued)
Note 14. Time Deposit Maturities
At December 31, 2009, the scheduled maturities of time deposits were as follows:
| ($ in thousands) |
|||
| 2010 |
$ | 502,360 | |
| 2011 |
57,089 | ||
| 2012 |
51,652 | ||
| 2013 |
4,809 | ||
| 2014 |
9,476 | ||
| Thereafter |
25 | ||
| Total |
$ | 625,411 | |
Note 15. Common Stock
In 2006, the Board of Directors authorized the repurchase of up to 250,000 shares at a stock price within certain parameters. There have been no stock repurchases since the authorization. In 2007, there were 1,532 shares tendered as payment for the exercise of stock options.
During the year ended December 31, 2008 and 2007, the Company declared cash dividends of $0.04 and $0.15 per share, respectively. No cash dividends were declared in 2009. No stock dividends were declared in 2009, 2008 or 2007.
Note 16. Stock-Based Compensation
Stock Options
In April 2006, the Company’s shareholders approved the AmericanWest Bancorporation 2006 Equity Incentive Plan (Plan), which superseded the Company’s 2001 Incentive Stock Option Plan (2001 Plan) with respect to any issuance of incentive stock options, nonqualified stock options, restricted stock awards and unrestricted stock awards to key employees, officers and directors made on and after the Plan’s effective date (March 17, 2006). The maximum aggregate number of authorized shares issued under the Plan is 314,666, which was the number of unissued shares remaining under the 2001 Plan on the date of such effective date, plus any shares under the 2001 Plan as to which options or other benefits granted thereunder and outstanding as of March 17, 2006 may lapse, expire, terminate or be cancelled. During the year ended December 31, 2008, the Company’s shareholders approved an amendment to the Plan to increase the number of available shares to grant by 250,000. As of December 31, 2009, the remaining authorized shares available for issuance under the Plan are 677,854. The Compensation Committee, comprised of members of the Board of Directors, administers the Plan. The maximum term of a stock option granted under the Plan is ten years and the Plan will terminate on March 17, 2016.
74
Table of Contents
NOTES TO CONSOLIDATED FINANCIAL STATEMENTS—(Continued)
The status of the Plan as of December 31, 2009, 2008 and 2007 was as follows:
| 2009 | 2008 | 2007 | ||||||||||||||||
| Number | Weighted Average Exercise Price |
Number | Weighted Average Exercise Price |
Number | Weighted Average Exercise Price | |||||||||||||
| Outstanding at beginning of year |
320,701 | $ | 13.38 | 425,394 | $ | 18.14 | 444,049 | $ | 16.51 | |||||||||
| Granted |
— | — | 107,750 | 2.58 | 64,750 | 22.57 | ||||||||||||
| Exercised |
— | — | (9,436 | ) | 6.10 | (56,895 | ) | 8.51 | ||||||||||
| Forfeited and expired |
(64,020 | ) | 8.59 | (203,007 | ) | 17.97 | (26,510 | ) | 22.32 | |||||||||
| Outstanding at year end |
256,681 | $ | 14.57 | 320,701 | $ | 13.38 | 425,394 | $ | 18.14 | |||||||||
| Exercisable at year end |
189,449 | $ | 16.62 | 182,791 | $ | 17.86 | 305,644 | $ | 17.15 | |||||||||
Additional information related to the stock options outstanding and exercisable as of December 31, 2009 and 2008 is below:
| ($ in thousand except per share amounts) |
Options | Weighted Average Exercise Price |
Weighted Average Remaining Contractual Life |
Aggregate Intrinsic Value | ||||||
| Outstanding at December 31, 2009 |
256,681 | $ | 14.57 | 5.5 years | $ | — | ||||
| Exercisable at December 31, 2009 |
189,449 | $ | 16.62 | 4.7 years | $ | — | ||||
| Outstanding at December 31, 2008 |
320,701 | $ | 13.38 | 6.5 years | $ | — | ||||
| Exercisable at December 31, 2008 |
182,791 | $ | 17.86 | 4.7 years | $ | — | ||||
The fair value assumptions for grants in each of the years ending December 31, 2009, 2008, and 2007:
| 2009 | 2008 | 2007 | |||||||
| Risk free interest rate |
N/A | (1) | 3.3 | % | 4.6 | % | |||
| Expected volatility |
N/A | (1) | 44.9 | % | 30.3 | % | |||
| Expected cash dividends |
N/A | (1) | 5.3 | % | 0.5 | % | |||
| Expected life |
N/A | (1) | 4.9 years | 6.0 years |
| (1) | There were no stock options issued during the year ended December 31, 2009. |
The following table summarizes information about stock options outstanding at December 31, 2009:
| Options Outstanding |
Options Exercisable | |||||||||||
| Range of Exercise Prices |
Number Outstanding |
Weighted Average Remaining Contractual Life |
Weighted Average Exercise Price |
Number Exercisable |
Weighted Average Exercise Price | |||||||
| $1.30 - $7.78 |
67,540 | 7.8 years | $ | 2.07 | 26,558 | $ | 2.54 | |||||
| $7.79 - $18.14 |
68,942 | 3.2 years | $ | 14.06 | 61,792 | $ | 14.41 | |||||
| $18.15 -$23.33 |
91,799 | 5.0 years | $ | 20.95 | 82,539 | $ | 20.84 | |||||
| $23.34 -$25.92 |
28,400 | 6.7 years | $ | 24.94 | 18,560 | $ | 25.32 | |||||
| Total |
256,681 | 189,449 | ||||||||||
75
Table of Contents
NOTES TO CONSOLIDATED FINANCIAL STATEMENTS—(Continued)
Accounting guidance requires all share-based payments to employees, including grants of employee stock options, to be recognized in the income statement based on their fair values. The fair values were calculated using the Black-Scholes-Merton model and the weighted average fair values of options granted during the years ended December 31, 2008 and 2007 were $0.70 and $8.35, respectively. There were no options granted during the year ended December 31, 2009. Compensation cost is recorded as if each vesting portion of the award is a separate award. The compensation expense recorded for each of the years ended December 31, 2009, 2008 and 2007 was $40 thousand, $185 thousand, and $498 thousand, respectively. Net of taxes for the year ended December 31, 2009 this did not increase the net loss on a basic or diluted loss per share basis. Total unrecognized compensation cost at December 31, 2009 was approximately $56 thousand which will be recognized through 2013. The aggregate intrinsic value of stock options exercised during the years ended December 31, 2008 and 2007 was $62 thousand and $628 thousand, respectively. There were no options exercised during 2009.
The recognition of stock-based compensation is for the number of awards that are expected to vest. As a result, for most awards, recognized stock compensation expense was reduced by estimated forfeitures primarily based on historical forfeiture rates. Estimated forfeitures will be continually evaluated in subsequent periods and may change based on new facts and circumstances.
Restricted Common Stock Awards
The Company has granted performance restricted common stock awards to certain executives and employees. The performance restricted common stock awards vest between January 2010 and August 2012 and are expensed as compensation over the period earned. Substantially all awards require that the Company or the individual meet performance criteria and, for every year that the goal is not achieved the award recipients forfeit 20% of their performance restricted common stock. Awards are forfeited if an employee is terminated prior to vesting other than pursuant to a change in control.
The purpose of these awards at the time of granting was to promote the long term interests of the Company and its shareholders by providing a financial incentive as a means for retaining certain key executives and employees. For the year ended December 31, 2009, the compensation expense related to these grants was approximately a negative $59 thousand due to the forfeiture of approximately 5,000 shares. For the years ended December 31, 2008 and 2007 compensation expense related to these grants was approximately $86 thousand and $222 thousand, respectively.
The following table summarizes both unvested performance restricted and unvested restricted common stock activity for the years ended December 31, 2009, 2008 and 2007:
| 2009 | 2008 | 2007 | ||||||||||||||||
| Restricted Stock |
Weighted average grant date fair value |
Restricted Stock |
Weighted average grant date fair value |
Restricted Stock |
Weighted average grant date fair value | |||||||||||||
| Unvested, beginning of year |
45,390 | $ | 21.46 | 70,771 | $ | 21.62 | 79,333 | $ | 21.59 | |||||||||
| Granted |
— | — | — | — | 42,705 | 21.83 | ||||||||||||
| Forfeited |
(22,890 | ) | 21.77 | (21,510 | ) | 21.74 | (39,150 | ) | 21.90 | |||||||||
| Vested |
— | — | (3,871 | ) | 22.80 | (12,117 | ) | 21.29 | ||||||||||
| Unvested, end of year |
22,500 | $ | 21.15 | 45,390 | $ | 21.46 | 70,771 | $ | 21.62 | |||||||||
76
Table of Contents
NOTES TO CONSOLIDATED FINANCIAL STATEMENTS—(Continued)
Note 17. Fair Value Measurement
The Company has adopted generally accepted accounting standards which provide enhanced guidance for measuring assets and liabilities using fair value, and apply to situations where other standards require or permit assets or liabilities to be measured at fair value. The standards also require expanded disclosure of items that are measured at fair value, the information used to measure fair value, and the effect of fair value measurements on earnings.
Valuation techniques are based upon observable and unobservable inputs. Observable inputs reflect market data obtained from independent sources, while unobservable inputs reflect the Company’s market assumptions. These two types of inputs create a fair value hierarchy. Level 1 includes quoted prices for identical instruments in active markets. Level 2 includes quoted prices for similar instruments in active markets, quoted prices for identical or similar instruments in markets that are not active, and model-derived valuations whose inputs are observable. Level 3 includes instruments whose significant value input assumptions are unobservable.
The following table summarizes the Company’s financial instruments that were measured at fair value on a recurring basis at December 31, 2009:
| ($ in thousands) |
Fair Value |
Fair Value Measurements Using | ||||||||||
| Level 1 | Level 2 | Level 3 | ||||||||||
| Recurring |
||||||||||||
| Securities available-for-sale |
$ | 45,108 | $ | 20,694 | $ | 24,414 | $ | — | ||||
| Rate lock commitments |
$ | — | $ | — | $ | — | $ | — | ||||
| Forward sales commitments |
$ | — | $ | — | $ | — | $ | — | ||||
During the years ended December 31, 2009 and 2008, the Company recorded income of $91 thousand and a loss of $91 thousand, respectively, related to the derivative loan commitments shown in the table above.
The following table summarizes the changes during the year ended December 31, 2009 for recurring assets (liabilities) measured using level 3:
| ($ in thousands) |
Rate lock commitments |
Forward sales commitments |
|||||
| December 31, 2008 |
$ | — | $ | (91 | ) | ||
| Gains |
— | 91 | |||||
| December 31, 2009 |
$ | — | $ | — | |||
Gains shown in the table above are included in fees on mortgage loan sales, net within the Consolidated Statements of Operations and included in the fair value adjustments on mortgage loan activities in the Consolidated Statements of Cash Flows.
77
Table of Contents
NOTES TO CONSOLIDATED FINANCIAL STATEMENTS—(Continued)
Additionally, certain assets are measured at fair value on a non-recurring basis. Adjustments to fair value based on such non-recurring transactions generally result from the application of lower-of-cost-or-market accounting or write-downs of individual assets due to impairment. The following table summarizes the Company’s financial instruments that were measured at fair value on a non-recurring basis at December 31, 2009, and the total amount charged to operations resulting from fair value adjustments for the year ended December 31, 2009:
| ($ in thousands) |
Fair Value |
Fair Value Measurements Using | Year ended December 31, 2009 | ||||||||||||
| Level 1 | Level 2 | Level 3 | Total Loss | ||||||||||||
| Non-Recurring |
|||||||||||||||
| Impaired loans |
$ | 75,036 | $ | — | $ | — | $ | 75,036 | $ | 59,904 | |||||
| Foreclosed real estate and other foreclosed assets |
$ | 51,924 | $ | — | $ | — | $ | 51,924 | $ | 16,669 | |||||
| Goodwill |
$ | — | $ | — | $ | — | $ | — | $ | 18,852 | |||||
Impaired loans included in the table above are collateral dependent and have been adjusted to fair value based on the estimated fair value of the underlying collateral, less estimated selling costs. If the Bank determines that the value of an impaired loan is less than the recorded investment in the loan, the carrying value is adjusted through a charge-off recorded through the allowance for loan losses. The Total Loss column shown above represents charge-offs related to impaired loans recognized during the year ended December 31, 2009.
The foreclosed real estate and other foreclosed assets referenced in the table above have been adjusted to estimated fair value, less estimated selling costs. At the time of foreclosure, foreclosed assets are recorded at the lower of the carrying amount of the loan or the estimated fair value less estimated selling costs. Any write-downs based on the asset’s fair value at the date of acquisition are charged to the allowance for loan losses. After foreclosure, management periodically obtains updated valuations of the foreclosed assets and, if additional impairments are deemed necessary, the impairment is recorded in foreclosed real estate and other foreclosed assets expense within the Consolidated Statements of Operations. The Total Loss column shown above represents impairments charged to the Consolidated Statements of Operations during the year ended December 31, 2009.
Goodwill included in the table above was evaluated as of September 30, 2009 for impairment as part of management’s annual analysis. Based on the estimated fair value the remaining carrying balance was deemed to be impaired, as further discussed in Note 9 to the Consolidated Financial Statements.
78
Table of Contents
NOTES TO CONSOLIDATED FINANCIAL STATEMENTS—(Continued)
The following fair value table includes those financial instruments for which it is practical to estimate fair value. It does not include the value of premises and equipment and intangible assets such as customer relationships and core deposit intangibles. The table summarizes carrying amounts, estimated fair values, and assumptions used by the Company to estimate fair value as of December 31, 2009 and December 31, 2008:
| As of December 31, 2009: ($ in thousands) |
Assumptions Used in Estimating Fair Value |
Carrying Amount |
Estimated Fair Value | |||||
| Financial Assets: |
||||||||
| Cash and due from banks |
Equal to carrying value |
$ | 38,553 | $ | 38,553 | |||
| Overnight interest bearing deposits with other banks |
Equal to carrying value |
163,033 | 163,033 | |||||
| Securities |
Quoted market prices |
48,986 | 48,986 | |||||
| Federal Home Loan Bank Stock |
Par value |
10,267 | 10,267 | |||||
| Loans, held for sale |
Equal to carrying value |
6,565 | 6,565 | |||||
| Loans |
Fixed-rate loans at discounted expected future cash flows, and variable rate loans equal to carrying value, net of allowance for loan losses and liquidity discount |
1,231,300 | 1,196,386 | |||||
| Bank owned life insurance |
Equal to carrying value |
31,207 | 31,207 | |||||
| Financial Liabilities: |
||||||||
| Deposits |
Fixed-rate certificates of deposit: Discounted expected future cash flows and all other deposits equal to carrying value |
1,505,540 | 1,511,013 | |||||
| Federal Home Loan Bank advances and other borrowings |
Discounted expected future cash flows |
63,683 | 64,831 | |||||
| Junior subordinated debentures |
Discounted expected future cash flows |
41,239 | 27,454 | |||||
| Mortgage loan derivative instruments, net |
Equal to carrying value |
— | — | |||||
| As of December 31, 2008: ($ in thousands) |
Assumptions Used in Estimating Fair Value |
Carrying Amount |
Estimated Fair Value | |||||
| Financial Assets: |
||||||||
| Cash and due from banks |
Equal to carrying value |
$ | 40,927 | $ | 40,927 | |||
| Overnight interest bearing deposits with other banks |
Equal to carrying value |
26,058 | 26,058 | |||||
| Securities |
Quoted market prices |
65,270 | 65,270 | |||||
| Federal Home Loan Bank Stock |
Par value |
8,286 | 8,286 | |||||
| Loans, held for sale |
Equal to carrying value |
12,265 | 12,265 | |||||
| Loans |
Fixed-rate loans at discounted expected future cash flows, and variable rate loans equal to carrying value, net of allowance for loan losses and liquidity discount |
1,577,106 | 1,556,756 | |||||
| Bank owned life insurance |
Equal to carrying value |
30,193 | 30,193 | |||||
79
Table of Contents
NOTES TO CONSOLIDATED FINANCIAL STATEMENTS—(Continued)
| As of December 31, 2008: ($ in thousands) |
Assumptions Used in Estimating Fair Value |
Carrying Amount |
Estimated Fair Value | |||
| Financial Liabilities: |
||||||
| Deposits |
Fixed-rate certificates of deposit: |
|||||
| Discounted expected future cash flows and all other deposits equal to carrying value |
1,573,533 | 1,583,125 | ||||
| Federal Home Loan Bank advances and other borrowings |
Discounted expected future cash flows |
142,962 | 145,465 | |||
| Junior subordinated debentures |
Discounted expected future cash flows |
41,239 | 33,467 | |||
| Mortgage loan derivative instruments, net |
Equal to carrying value |
91 | 91 |
Note 18. Derivatives
The Company may use derivatives to hedge the risk of changes in the fair values of interest rate lock commitments and residential mortgage loans held for sale. These derivatives are accounted for as free-standing derivatives, or economic hedges, with changes in the fair value of the derivatives reported in income. The Company primarily utilizes forward interest rate contracts in its derivative risk management strategy.
The Bank periodically enters into forward delivery contracts to sell residential mortgage loans to investors at specific prices and dates in order to hedge the interest rate risk in its portfolio of mortgage loans held for sale and its residential mortgage loan commitments. Credit risk associated with forward contracts is limited to the replacement cost of those forward contracts in a gain position. There were no counterparty default losses on forward contracts in the years ended December 31, 2009 and 2008. Market risk with respect to forward contracts arises principally from changes in the value of contractual positions due to changes in market interest rates. The Bank limits its exposure to market risk by monitoring differences between commitments to customers and forward contracts with investors. In the event the Company has forward delivery contract commitments in excess of available mortgage loans, the Company completes the transaction by either paying or receiving a fee to or from the investors equal to the increase or decrease in the market value of the forward contract. At December 31, 2009, the Bank had commitments to originate mortgage loans held for sale at pre-determined interest rates totaling $6.5 million. At December 31, 2009, the Bank did have any forward sales commitments.
The following table summarizes the types of derivatives, separately by assets and liabilities, their location on the Consolidated Statements of Condition, and the fair values of such derivatives as of December 31, 2009 and December 31, 2008:
| ($ in thousands) Underlying Risk Exposure |
Description | Balance Sheet Location |
December 31, 2009 |
December 31, 2008 | ||||||
| Asset Derivatives |
||||||||||
| Interest rate contracts |
Rate lock commitments | Other assets | $ | — | $ | — | ||||
| Interest rate contracts |
Forward sales commitments | Other assets | — | — | ||||||
| Total asset derivatives |
$ | — | $ | — | ||||||
| Liability Derivatives |
||||||||||
| Interest rate contracts |
Rate lock commitments | Other liabilities | $ | — | $ | — | ||||
| Interest rate contracts |
Forward sales commitments | Other liabilities | — | 91 | ||||||
| Total liability derivatives |
$ | — | $ | 91 | ||||||
80
Table of Contents
NOTES TO CONSOLIDATED FINANCIAL STATEMENTS—(Continued)
The following table summarizes the types of derivatives, and the gains (losses) recorded during the years ended December 31, 2009 and 2008:
| Years Ended December 31, | |||||||||
| ($ in thousands) Underlying Risk Exposure |
Description | 2009 | 2008 | ||||||
| Interest rate contracts |
Rate lock commitments | $ | — | $ | — | ||||
| Interest rate contracts |
Forward sales commitments | 91 | (91 | ) | |||||
| Total |
$ | 91 | $ | (91 | ) | ||||
Note 19. Commitments and Contingent Liabilities
In the ordinary course of business, the Company has various outstanding commitments and contingent liabilities that are not reflected in the accompanying consolidated financial statements. In addition, the Company is a defendant in certain claims and legal actions arising in the ordinary course of business. In the opinion of management, after consultation with legal counsel, the ultimate disposition of these matters is not expected to have a material effect on the consolidated financial condition or results of operations of the Company.
The minimum annual rental commitments on capital and operating leases at December 31, 2009, exclusive of taxes and other charges, are summarized as follows:
| ($ in thousands) |
Capital Leases |
Operating Leases | |||||
| 2010 |
$ | 95 | $ | 3,698 | |||
| 2011 |
— | 3,761 | |||||
| 2012 |
— | 3,802 | |||||
| 2013 |
— | 3,783 | |||||
| 2014 |
— | 3,129 | |||||
| Thereafter |
— | 26,781 | |||||
| Total minimum amounts due |
$ | 95 | $ | 44,954 | |||
| Less: Amount representing interest |
(12 | ) | |||||
| Present value of net minimum lease payments |
$ | 83 | |||||
The Company’s rental expense for 2009, 2008 and 2007 was $3.4 million, $3.3 million, and $2.3 million, respectively. In addition to the above required lease payments, the Company has contractual obligations related primarily to information technology contracts and other maintenance contracts of $9.9 million in total over the next five years.
The Bank is a party to financial instruments with off-balance sheet risk in the normal course of business to meet the financing needs of its customers. These financial instruments include commitments to extend credit and standby letters of credit. Those instruments involve, to varying degrees, elements of credit and interest rate risk in excess of the amount recognized in the Consolidated Statements of Condition. The contract or notional amounts of those instruments reflect the extent of involvement the Bank has in particular classes of financial instruments.
The Company’s exposure to credit loss in the event of non-performance by the other party to the financial instrument for commitments to extend credit and standby letters of credit is represented by the contractual or notional amount of those instruments. The Company uses the same credit policies in making commitments and conditional obligations as it does for statement of condition instruments. The Bank does not anticipate any material losses as a result of the commitments and standby letters of credit.
81
Table of Contents
NOTES TO CONSOLIDATED FINANCIAL STATEMENTS—(Continued)
The following table summarizes the contract or notional amount at December 31, 2009 and 2008:
| ($ in thousands) |
2009 | 2008 | ||||
| Commitments to extend credit |
$ | 166,182 | $ | 272,139 | ||
| Standby letters of credit |
16,610 | 38,755 | ||||
| Total |
$ | 182,792 | $ | 310,894 | ||
Commitments to extend credit are agreements to lend to a customer as long as there is no violation of any condition established in the contract. Commitments generally have fixed expiration dates or other termination clauses and may require payment of a fee. Since many of the commitments are expected to expire without being drawn upon, the total commitment amount does not necessarily represent future cash requirements. The Bank evaluates each customer’s creditworthiness on a case-by-case basis. The amount of collateral obtained, if deemed necessary by the Bank upon extension of credit, is based on management’s credit evaluation of the counterparty. Collateral required varies but may include accounts receivable, inventory, property, plant and equipment and income producing commercial properties.
Standby letters of credit are conditional commitments issued by the Bank to guarantee to a third party the performance of a customer. Those guarantees are primarily issued to support public and private borrowing arrangements, bond financing and similar transactions. The credit risk involved in issuing letters of credit is essentially the same as that involved in extending loan facilities to customers. The related liability for the Bank’s obligation under standby letters of credit and guarantees is immaterial.
A majority of the Bank’s loans, commitments, and commercial and standby letters of credit have been granted to customers in the Company’s market area. As such, significant changes in economic conditions in the states of Washington, Idaho, or Utah, or within their primary industries, could adversely affect the Company’s ability to collect loans. Substantially all such customers are depositors of the Bank. The concentrations of credit by type of loan are set forth in Note 7. The Bank’s related party loans and deposits are disclosed in Note 23.
Note 20. Restrictions on Dividends and Loans
The Bank is subject to banking regulations relating to the payment of dividends and the amount of loans that it may extend. As of December 31, 2009 and 2008, the accumulated deficit of the Bank was $184.3 million and $116.9 million, respectively. As of December 31, 2007, the amount of retained earnings of the Bank was $76.7 million. During the year ended December 31, 2008 and 2007, the Bank paid dividends to the Parent Company of $2.2 million and $11.5 million, respectively. There were no dividends paid to the Parent Company during the year ended December 31, 2009. In accordance with the Order, the Bank is prohibited from paying the Parent Company dividends without prior regulatory approval.
Note 21. Employee Benefit Plans
The Bank has a 401(k) Retirement Savings Plan (Plan). Employees are eligible to contribute to the Plan after completing six months of employment and attaining age 18. Through April 15, 2009, the Bank matched employee deferrals up to 3% of participant compensation and 50% from 3% to 5% of participant compensation. Employees are fully vested on all contributions made to the Plan. Effective April 16, 2009, the Bank discontinued the matching contributions to the Plan. Contributions to the Plan in 2009, 2008 and 2007 were $266 thousand, $861 thousand, and $875 thousand, respectively. Effective January 1, 2010, the Bank reinstated a matching contribution of 50% on the first 2% of employee deferrals.
82
Table of Contents
NOTES TO CONSOLIDATED FINANCIAL STATEMENTS—(Continued)
The Bank maintains salary and fee continuation agreements for the benefit of certain current and former officers and directors. As of December 31, 2009, there were 36 outstanding agreements, of which four were with active employees or directors. The plans provide for monthly payments to such persons, or their designated beneficiaries, for a period of time following retirement, or in some cases death prior to retirement. At December 31, 2009 and 2008, the reported liabilities for future benefit obligations related to these agreements were $7.1 million and $7.0 million, respectively, and are included in other liabilities within the Consolidated Statements of Financial Condition. For the years ended December 31, 2009, 2008 and 2007, expenses of $497 thousand, $568 thousand, and $734 thousand, respectively, were recognized pursuant to these agreements.
Note 22. Parent Company Only Statements
The following are the condensed statements of condition, operations and cash flows for the Parent Company:
Condensed Statements of Financial Condition
December 31, 2009 and 2008
($ in thousands)
| 2009 | 2008 | |||||
| Cash |
$ | 109 | $ | 194 | ||
| Investment in Bank subsidiary |
63,111 | 129,511 | ||||
| Other assets |
1,621 | 2,789 | ||||
| TOTAL ASSETS |
$ | 64,841 | $ | 132,494 | ||
| Junior Subordinated Debt and other liabilities |
$ | 45,236 | $ | 42,706 | ||
| Stockholders’ equity |
19,605 | 89,788 | ||||
| TOTAL LIABILITIES AND STOCKHOLDERS’ EQUITY |
$ | 64,841 | $ | 132,494 | ||
83
Table of Contents
NOTES TO CONSOLIDATED FINANCIAL STATEMENTS—(Continued)
Condensed Statements of Operations
Years Ended December 31, 2009, 2008 and 2007
($ in thousands)
| 2009 | 2008 | 2007 | ||||||||||
| INCOME |
||||||||||||
| Bank subsidiary dividends |
$ | — | $ | 2,150 | $ | 11,500 | ||||||
| Other income |
77 | 83 | 81 | |||||||||
| 77 | 2,233 | 11,581 | ||||||||||
| EXPENSES |
||||||||||||
| Interest expense |
2,547 | 2,762 | 2,756 | |||||||||
| Other operating expenses |
49 | 1,070 | 1,462 | |||||||||
| 2,596 | 3,832 | 4,218 | ||||||||||
| (LOSS) INCOME BEFORE BENEFIT FOR INCOME TAX AND NET (LOSS) INCOME OF SUBSIDIARY, NET OF DIVIDENDS PAID TO PARENT |
(2,519 | ) | (1,599 | ) | 7,363 | |||||||
| Benefit for income tax |
— | 1,371 | 1,319 | |||||||||
| (LOSS) INCOME BEFORE NET LOSS OF SUBSIDIARY, |
||||||||||||
| NET OF DIVIDENDS PAID TO PARENT |
(2,519 | ) | (228 | ) | 8,682 | |||||||
| Net loss of subsidiary, net of dividends paid to Parent |
(68,605 | ) | (192,132 | ) | (144 | ) | ||||||
| NET (LOSS) INCOME |
$ | (71,124 | ) | $ | (192,360 | ) | $ | 8,538 | ||||
84
Table of Contents
NOTES TO CONSOLIDATED FINANCIAL STATEMENTS—(Continued)
Condensed Statements of Cash Flows
Years Ended December 31, 2009, 2008 and 2007
($ in thousands)
| 2009 | 2008 | 2007 | ||||||||||
| CASH FLOWS PROVIDED BY OPERATING ACTIVITIES |
||||||||||||
| Net (loss) Income |
$ | (71,124 | ) | $ | (192,360 | ) | $ | 8,538 | ||||
| Adjustments to reconcile net income to cash provided by (used in) operating activities: |
||||||||||||
| Net loss of subsidiary, net of dividends paid to Parent |
68,605 | 192,132 | 144 | |||||||||
| Compensation expense for stock based awards |
(19 | ) | 271 | 720 | ||||||||
| Net change in other assets |
(80 | ) | (1,315 | ) | 20 | |||||||
| Net change in other liabilities |
2,533 | 1,368 | (64 | ) | ||||||||
| NET CASH PROVIDED BY OPERATING ACTIVITIES |
(85 | ) | 96 | 9,358 | ||||||||
| CASH FLOWS USED IN INVESTING ACTIVITIES |
||||||||||||
| Purchased trust preferred securities |
— | — | (619 | ) | ||||||||
| Cash acquired in merger, net of cash consideration paid |
— | — | (30,004 | ) | ||||||||
| NET CASH USED IN INVESTING ACTIVITIES |
— | — | (30,623 | ) | ||||||||
| CASH FLOWS (USED IN) PROVIDED BY FINANCING ACTIVITIES |
||||||||||||
| Proceeds from issuances of common stock under equity incentive plans |
— | 29 | 611 | |||||||||
| Cash dividends paid |
— | (688 | ) | (2,405 | ) | |||||||
| Proceeds from issuance of junior subordinated debentures |
— | — | 20,619 | |||||||||
| NET CASH (USED IN) PROVIDED BY FINANCING ACTIVITIES |
— | (659 | ) | 18,825 | ||||||||
| NET CHANGE IN CASH |
(85 | ) | (563 | ) | (2,440 | ) | ||||||
| CASH, beginning of year |
194 | 757 | 3,197 | |||||||||
| CASH, end of year |
$ | 109 | $ | 194 | $ | 757 | ||||||
Note 23. Related Party Transactions
Loans to related parties:
Loans to the Company’s officers and directors are on substantially the same terms, including interest rates and collateral, as those prevailing at the time for comparable transactions with unrelated persons and do not involve more than normal risk of collectability. Such loans had the following balances and activity during the years ended December 31, 2009, 2008 and 2007:
| ($ in thousands) |
2009 | 2008 | 2007 | |||||||||
| Balance at beginning of year |
$ | 11,547 | $ | 15,266 | $ | 507 | ||||||
| New loans or advances |
5,569 | 3,894 | 4,119 | |||||||||
| Repayments |
(5,501 | ) | (7,613 | ) | (1,696 | ) | ||||||
| Other adjustments |
(10,318 | ) | — | 12,336 | ||||||||
| Balance at end of year |
$ | 1,297 | $ | 11,547 | $ | 15,266 | ||||||
The other adjustments above reflect changes in related parties for the respective periods.
85
Table of Contents
NOTES TO CONSOLIDATED FINANCIAL STATEMENTS—(Continued)
Deposits from related parties:
Deposits from related parties were $2.4 million and $1.9 million at December 31, 2009 and 2008, respectively.
Payments to related parties:
The Bank paid $109 thousand, $97 thousand and $97 thousand for the years ended December 31, 2009, 2008 and 2007 for operating lease payments for the Ephrata facility to a partnership of which one of the partners is a related party.
Note 24. Regulatory Matters
The Company and the Bank are subject to various regulatory capital requirements administered by the federal banking agencies. Failure to meet minimum capital requirements can initiate certain mandatory and possibly additional discretionary actions by regulators that, if undertaken, could have a direct material effect on the Company’s financial statements. Under capital adequacy guidelines and the regulatory framework for prompt corrective action, the Company and the Bank must meet specific capital guidelines that involve quantitative measures of their assets, liabilities and certain off-balance sheet items as calculated under regulatory accounting practices. The capital amounts and classification are also subject to qualitative judgments by the regulators about components, risk weightings and other factors.
Quantitative measures established by regulation to ensure capital adequacy require the Company and the Bank to maintain minimum amounts and ratios of total and Tier I capital to risk-weighted assets and of Tier I capital to average assets, as defined in the regulations.
As of December 31, 2009, the most recent notification from the Federal Deposit Insurance Company categorized the Bank as significantly under-capitalized under the regulatory framework for prompt corrective action due to the total capital to risk weighted assets ratio falling below the under-capitalized category. The ratios are set forth in the following tables along with the amounts required for the Bank to be considered adequately and well-capitalized. There are no conditions or events since the notification that management believes have changed the Bank’s category. The Company’s and the Bank’s actual capital amounts and ratios as of December 31, 2009 and 2008 are presented in the below table:
| Actual | Adequately Capitalized |
Well Capitalized | ||||||||||||||||
| ($ in thousands) |
Amount | Ratio | Amount | Ratio | Amount | Ratio | ||||||||||||
| As of December 31, 2009: |
||||||||||||||||||
| Total capital to risk weighted assets: |
||||||||||||||||||
| AWBC |
$ | 28,206 | 2.02 | % | $ | 111,741 | 8.00 | % | N/A | N/A | ||||||||
| AWB |
69,146 | 4.96 | % | 111,610 | 8.00 | % | $ | 139,512 | 10.00 | % | ||||||||
| Tier I capital to risk weighted assets: |
||||||||||||||||||
| AWBC |
14,103 | 1.01 | % | 55,870 | 4.00 | % | N/A | N/A | ||||||||||
| AWB |
51,435 | 3.69 | % | 55,805 | 4.00 | % | 83,707 | 6.00 | % | |||||||||
| Leverage capital, Tier I capital to average assets: |
||||||||||||||||||
| AWBC |
14,103 | 0.82 | % | 68,501 | 4.00 | % | N/A | N/A | ||||||||||
| AWB |
51,435 | 3.01 | % | 68,437 | 4.00 | % | 85,546 | 5.00 | % | |||||||||
86
Table of Contents
NOTES TO CONSOLIDATED FINANCIAL STATEMENTS—(Continued)
| Actual | Adequately Capitalized |
Well Capitalized | ||||||||||||||||
| ($ in thousands) |
Amount | Ratio | Amount | Ratio | Amount | Ratio | ||||||||||||
| As of December 31, 2008: |
||||||||||||||||||
| Total capital to risk weighted assets: |
||||||||||||||||||
| AWBC |
$ | 119,540 | 6.83 | % | $ | 140,111 | 8.00 | % | N/A | N/A | ||||||||
| AWB |
119,227 | 6.82 | % | 139,885 | 8.00 | % | $ | 174,856 | 10.00 | % | ||||||||
| Tier I capital to risk weighted assets: |
||||||||||||||||||
| AWBC |
87,358 | 4.99 | % | 70,055 | 4.00 | % | N/A | N/A | ||||||||||
| AWB |
97,081 | 5.55 | % | 69,942 | 4.00 | % | 104,914 | 6.00 | % | |||||||||
| Leverage capital, Tier I capital to average assets: |
||||||||||||||||||
| AWBC |
87,358 | 4.57 | % | 76,408 | 4.00 | % | N/A | N/A | ||||||||||
| AWB |
97,081 | 5.09 | % | 76,305 | 4.00 | % | 95,381 | 5.00 | % | |||||||||
The amounts and corresponding ratios set forth in the table above for both “adequately capitalized” and “well capitalized” information are based upon Federal banking regulations. As a result of the Bank being subject to the Order previously discussed, it will not be immediately considered “well capitalized” by the FDIC upon attaining the corresponding ratios shown in the table. As of December 31, 2009, the amount of Tier I capital necessary to attain compliance with the order was approximately $171 million, or $119 million more than the actual Tier I capital as of that date. The additional amount to attain compliance with the PCA Directive as of December 31, 2009 was approximately $42 million.
Although the Company is continuing its efforts to improve its and the Bank’s regulatory capital ratios through the issuance of new equity or qualifying debt securities (which would be contributed as common equity to the Bank), there is no assurance that such efforts will ultimately be successful.
Note 25. Earnings Per Share
The following is a reconciliation of the numerators and denominators for basic and diluted (loss) earnings per share computations for the years ended December 31, 2009, 2008 and 2007:
| (in thousands, except per share) |
2009 | 2008 | 2007 | ||||||||
| Numerator: |
|||||||||||
| Net (loss) income |
$ | (71,124 | ) | $ | (192,360 | ) | $ | 8,538 | |||
| Denominator: |
|||||||||||
| Weighted-average number of common shares outstanding |
17,213 | 17,211 | 15,766 | ||||||||
| Incremental shares assumed for stock options |
— | — | 98 | ||||||||
| Total |
17,213 | 17,211 | 15,864 | ||||||||
| Basic (loss) earnings per common share |
$ | (4.13 | ) | $ | (11.18 | ) | $ | 0.54 | |||
| Diluted (loss) earnings per common share |
$ | (4.13 | ) | $ | (11.18 | ) | $ | 0.54 | |||
| Antidilutive stock options and awards not included in diluted earnings per share |
279 | 366 | 160 | ||||||||
87
Table of Contents
NOTES TO CONSOLIDATED FINANCIAL STATEMENTS—(Continued)
Note 26. Other Non-interest Expenses
Components of other non-interest expense which exceed 1% of the aggregate total net interest income and total non-interest income for any of the years ended December 31, 2009, 2008 or 2007 are presented below:
| ($ in thousands) |
2009 | 2008 | 2007 | ||||||
| Bankcard and Debit Card |
$ | 1,429 | $ | 1,692 | $ | 1,318 | |||
| Loans |
1,150 | 1,203 | 428 | ||||||
| Advertising |
553 | 894 | 972 | ||||||
| Impairment of premises and securities |
202 | 1,185 | 219 | ||||||
| Supplies |
390 | 766 | 1,041 | ||||||
| Other |
8,229 | 10,584 | 7,742 | ||||||
| Total |
$ | 11,953 | $ | 16,324 | $ | 11,720 | |||
88
Table of Contents
QUARTERLY UNAUDITED FINANCIAL DATA
CONDENSED CONSOLIDATED STATEMENTS OF QUARTERLY INCOME
(in thousands, except per share)
| Quarter Ended | ||||||||||||||||
| December 31, 2009 |
September 30, 2009 |
June 30, 2009 |
March 31, 2009 |
|||||||||||||
| Statement of Operations: |
||||||||||||||||
| Interest income |
$ | 20,324 | $ | 21,794 | $ | 22,341 | $ | 23,251 | ||||||||
| Interest expense |
6,437 | 7,404 | 8,429 | 9,314 | ||||||||||||
| Net Interest Income |
13,887 | 14,390 | 13,912 | 13,937 | ||||||||||||
| Provision for loan losses |
15,850 | 9,000 | 11,800 | 13,680 | ||||||||||||
| Net interest income after provision for loan losses |
(1,963 | ) | 5,390 | 2,112 | 257 | |||||||||||
| Non-interest income |
3,454 | 4,678 | 6,996 | 5,800 | ||||||||||||
| Non-interest expense |
32,320 | 38,461 | 19,635 | 20,592 | ||||||||||||
| Loss before provision for income tax |
(30,829 | ) | (28,393 | ) | (10,527 | ) | (14,535 | ) | ||||||||
| Income tax benefit |
(13,160 | ) | — | — | — | |||||||||||
| Net loss |
$ | (17,669 | ) | $ | (28,393 | ) | $ | (10,527 | ) | $ | (14,535 | ) | ||||
| Basic loss per common share |
$ | (1.03 | ) | $ | (1.65 | ) | $ | (0.61 | ) | $ | (0.84 | ) | ||||
| Diluted loss per common share |
$ | (1.03 | ) | $ | (1.65 | ) | $ | (0.61 | ) | $ | (0.84 | ) | ||||
| Basic weighted average shares outstanding |
17,213 | 17,213 | 17,213 | 17,213 | ||||||||||||
| Diluted weighted average shares outstanding |
17,213 | 17,213 | 17,213 | 17,213 | ||||||||||||
| December 31, 2008 |
September 30, 2008 |
June 30, 2008 |
March 31, 2008 |
|||||||||||||
| Statement of Operations: |
||||||||||||||||
| Interest income |
$ | 26,203 | $ | 29,058 | $ | 30,739 | $ | 33,670 | ||||||||
| Interest expense |
11,081 | 11,031 | 11,221 | 12,383 | ||||||||||||
| Net Interest Income |
15,122 | 18,027 | 19,518 | 21,287 | ||||||||||||
| Provision for loan losses |
40,320 | 27,650 | 16,400 | 12,800 | ||||||||||||
| Net interest income after provision for loan losses |
(25,198 | ) | (9,623 | ) | 3,118 | 8,487 | ||||||||||
| Non-interest income |
4,074 | 5,268 | 5,105 | 4,220 | ||||||||||||
| Non-interest expense |
27,305 | 101,288 | 19,241 | 45,783 | ||||||||||||
| Loss before provision for income tax |
(48,429 | ) | (105,643 | ) | (11,018 | ) | (33,076 | ) | ||||||||
| Income tax provision (benefit) |
9,267 | (8,748 | ) | (4,806 | ) | (1,519 | ) | |||||||||
| Net loss |
$ | (57,696 | ) | $ | (96,895 | ) | $ | (6,212 | ) | $ | (31,557 | ) | ||||
| Basic loss per common share |
$ | (3.35 | ) | $ | (5.63 | ) | $ | (0.36 | ) | $ | (1.83 | ) | ||||
| Diluted loss per common share |
$ | (3.35 | ) | $ | (5.63 | ) | $ | (0.36 | ) | $ | (1.83 | ) | ||||
| Basic weighted average shares outstanding |
17,213 | 17,213 | 17,211 | 17,206 | ||||||||||||
| Diluted weighted average shares outstanding |
17,213 | 17,213 | 17,211 | 17,206 | ||||||||||||
89
Table of Contents
Item 9. Changes in and Disagreements with Accountants on Accounting and Financial Disclosure.
There were no changes in or disagreements with accountants on accounting and financial disclosure.
Item 9A. Controls and Procedures.
An evaluation of the Company’s disclosure controls and procedures (as defined in Section 13a-15(e) of the Securities Exchange Act of 1934 (Act)) was carried out under the supervision and with the participation of the Company’s Chief Executive Officer, Chief Financial Officer and other members of the Company’s management team as of the end of the period covered by this annual report. The Company’s Chief Executive Officer and Chief Financial Officer concluded that the Company’s disclosure controls and procedures as currently in effect are effective, in all material respects, in ensuring that the information required to be disclosed by the Company in the reports it files or submits under the Act is (1) accumulated and communicated to the Company’s management (including the Chief Executive Officer and Chief Financial Officer) in a timely manner, and (2) recorded, processed, summarized and reported within the time periods specified in the SEC’s rules and forms.
In the year ended December 31, 2009, the Company did not make any changes in its internal controls or other factors that has materially affected, or is reasonably likely to affect, the Company’s internal controls over financial reporting.
Management’s Annual Report on Internal Control Over Financial Reporting
Management of the Company, including its consolidated subsidiaries, is responsible for establishing and maintaining adequate internal control over financial reporting (as defined in Rule 13a-15(f) under the Securities Exchange Act of 1934). The Company’s internal control over financial reporting is a process designed under the supervision of the Company’s management, including its Chief Executive Officer and its Chief Financial Officer, to provide reasonable assurance regarding the reliability of financial reporting and the preparation of the Company’s financial statements for external reporting purposes in accordance with generally accepted accounting principles in the United States of America.
The Company’s internal control over financial reporting includes policies and procedures that: pertain to the maintenance of records which, in reasonable detail, accurately and fairly reflect transactions and dispositions of assets; provide reasonable assurance that transactions are recorded as necessary to permit preparation of financial statements in accordance with generally accepted accounting principles in the United States of America, and that receipts and expenditures are being made only in accordance with authorizations of management and the directors of the Company; and provide reasonable assurance regarding prevention or timely detection of unauthorized acquisition, use or disposition of the Company’s assets that could have a material effect on the Company’s financial statements.
Management recognizes that there are inherent limitations in the effectiveness of any system of internal control and, accordingly, even effective internal control can provide only reasonable assurance with respect to financial statement preparation and fair presentation. Further, because of changes in conditions, the effectiveness of internal control may vary over time.
Under the supervision and with the participation of the Company’s management, including the Company’s Chief Executive Officer and Chief Financial Officer, the Company conducted an assessment of the effectiveness of the Company’s internal control over financial reporting based on the framework established in Internal Control-Integrated Framework issued by the Committee of Sponsoring Organizations of the Treadway Commission. Based on this assessment, management has determined that the Company’s internal control over financial reporting as of December 31, 2009 is effective.
This annual report does not include an attestation report of the Company’s registered public accounting firm regarding internal control over financial reporting. Management’s report was not subject to the attestation by the Company’s registered public accounting firm pursuant to temporary rules of the Securities and Exchange Commission that permit the Company to provide only management’s report in this annual report.
None.
90
Table of Contents
Item 10. Directors, Executive Officers and Corporate Governance.
Information included under the following captions in the Company’s proxy statement relating to its 2010 annual meeting of stockholders (2010 Proxy Statement) which will be filed within 120 days of the Company’s year-end is incorporated herein by reference:
| • | “Proposal 1—Election of Directors”; |
| • | “Board Committees and Meetings”; |
| • | “Audit Committee Matters”; |
| • | “Section 16(a) Beneficial Ownership Reporting Compliance”; |
| • | “Executive Officers”; and |
| • | “Code of Ethics.” |
With the exception of the information expressly incorporated herein by reference, the 2010 Proxy Statement is not deemed filed as part of this Annual Report on Form 10-K.
Item 11. Executive Compensation.
Information included under the following captions in the 2010 Proxy Statement which will be filed with the SEC within 120 days of the Company’s year-end is incorporated herein by reference:
| • | “Executive Compensation”; |
| • | “Disclosure Regarding Post-Termination and Change in Control Benefits; and |
| • | “Directors’ Compensation.” |
With the exception of the information expressly incorporated herein by reference, the 2010 Proxy Statement is not deemed filed as part of this Annual Report on Form 10-K.
Item 12. Security Ownership of Certain Beneficial Owners and Management and Related Stockholder Matters.
Information included under the following caption in the 2010 Proxy Statement which will be filed with the SEC within 120 days of the Company’s year-end is incorporated herein by reference:
| • | “Security Ownership of Certain Beneficial Owners and Management.” |
See also Part I, Item of this report and Note 16 of the Notes to the Consolidated Financial Statements, including the table presenting equity compensation plan information, included in this report.
With the exception of the information expressly incorporated herein by reference, the 2010 Proxy Statement is not deemed filed as part of this Annual Report on Form 10-K.
Item 13. Certain Relationships and Related Transactions, and Director Independence.
Information included under the following captions in the 2010 Proxy Statement which will be filed with the SEC within 120 days of the Company’s year-end is incorporated herein by reference:
| • | “Related Party Transactions and Business Relationships”; and |
| • | “Proposal 1—Election of Directors.” |
91
Table of Contents
With the exception of the information expressly incorporated herein by reference, the 2010 Proxy Statement is not deemed filed as part of this Annual Report on Form 10-K.
Item 14. Principal Accountant Fees and Services.
The information included under the following captions in the 2010 Proxy Statement which will be filed with the SEC within 120 days of the Company’s year-end is incorporated herein by reference:
| • | “Independent Registered Public Accounting Firm.” |
With the exception of the information expressly incorporated herein by reference, the 2010 Proxy Statement is not deemed filed as part of this Annual Report on Form 10-K.
92
Table of Contents
Item 15. Exhibits and Financial Statement Schedules.
| (a) (1) |
All financial statements are included in Item 8 of this report. | |
| (a) (2) |
All schedules are omitted as the required information is not applicable or the information is presented in the Consolidated Financial Statements or related notes. | |
| (a) (3) |
Exhibits. A list of the Company’s exhibits are as follows: | |
EXHIBIT INDEX
| 3.1 | Amended and Restated Articles of Incorporation of AmericanWest (incorporated by reference to Exhibit 3.1 to the Form 10-Q filed on August 11, 2008). | |||
| 3.2 | Amended and Restated Bylaws of AmericanWest (incorporated by reference to Exhibit 3.2 to the Form 10-Q filed on August 11, 2008). | |||
| 4.1 | Specimen certificate for shares of Common Stock (incorporated by reference to Exhibit 4.1 to the Form S-4/A filed on January 23, 2006 and incorporated herein by reference). | |||
| 10.1 | Order to Cease and Desist dated May 11, 2009, issued by the Federal Deposit Insurance Corporation and Washington Department of Financial Institutions (filed as Exhibit 10.1 to the Form 10-Q filed on May 15, 2009, and incorporated herein by this reference). | |||
| 10.2 | Stipulation to Consent to an Order to Cease and Desist dated May 8, 2009, issued by the Federal Deposit Insurance Corporation and Washington Department of Financial Institutions (filed as Exhibit 10.2 to the Form 10-Q filed on May 15, 2009, and incorporated herein by this reference). | |||
| 10.3 | Written Agreement dated September 15, 2009 by and between AmericanWest Bancorporation and Federal Reserve Bank of San Francisco (filed as Exhibit 10.1 to the Form 8-K filed on September 21, 2009, and incorporated herein by this reference). | |||
| 10.4 | Employment Agreement dated as of September 18, 2006 with Patrick J. Rusnak (incorporated by reference to Exhibit 99.1 to the Form 8-K filed on September 19, 2006).* | |||
| 10.5 | (a) | Employment Agreement dated as of January 28, 2005 with Rick Shamberger (incorporated by reference to Exhibit 10.19 to the Form 10-Q filed August 9, 2005).* | ||
| (b) | Amendment No. 1 to Employment Agreement with Rick Shamberger (incorporated by reference to Exhibit 99.2 to the Form 8-K/A filed January 5, 2007).* | |||
| (c) | Amendment No. 2 to Employment Agreement with Rick Shamberger (incorporated by reference to Exhibit 99.2 to the Form 8-K filed July 30, 2008).* | |||
| 10.6 | (a) | Employment Agreement dated as of January 28, 2005 with Nicole Sherman (incorporated by reference to Exhibit 10.20 to the Form 10-Q filed August 9, 2005).* | ||
| (b) | Amendment No. 1 to Employment Agreement with Nicole Sherman (incorporated by reference to Exhibit 99.5 to the Form 8-K/A filed January 5, 2007).* | |||
| (c) | Amendment No. 2 to Employment Agreement with Nicole Sherman (incorporated by reference to Exhibit 10.3 to the Form 10-K filed March 31, 2009).* | |||
| (d) | Amendment No. 3 to Employment Agreement with Nicole Sherman (incorporated by reference to Exhibit 99.1 to the Form 8-K filed November 25, 2008).* | |||
| (e) | Amendment No. 4 to Employment Agreement with Nicole Sherman (incorporated by reference to Exhibit 10.3 to the Form 10-Q filed May 15, 2009).* | |||
93
Table of Contents
| (f) | Amendment No. 5 to Employment Agreement with Nicole Sherman.*+ | |||
| 10.7 | Employment Agreement dated as of April 1, 2008 with Jay B. Simmons (incorporated by reference to Exhibit 99.1 to the Form 8-K filed April 2, 2008).* | |||
| 10.8 | Separation Agreement and Release of Claims with Robert M. Daugherty (incorporated by reference to Exhibit 10.2 to the Form 10-Q filed November 7, 2008).* | |||
| 10.9 | Amended and Restated Equity Incentive Plan (incorporated by reference to Appendix A to the Definitive Proxy Statement for the 2008 Annual Meeting of Shareholders filed on March 18, 2008).* | |||
| 10.10 | Restricted Stock Unit Agreement dated effective September 26, 2006 between the Company and Patrick J. Rusnak (incorporated by reference to Exhibit 10.25 to the Form 10-K filed on March 15, 2007).* | |||
| 10.11 | Grant of Performance Shares to Rick Shamberger dated as of June 6, 2005 (incorporated by reference to Exhibit 10.24 to the Form 10-Q filed August 9, 2005).* | |||
| 10.12 | Grant of Performance Shares to Nicole Sherman dated as of June 6, 2005 (incorporated by reference to Exhibit 10.25 to the Form 10-Q filed August 9, 2005).* | |||
| 10.13 | Indenture dated as of March 22, 2007, by and between AmericanWest Bancorporation and Wilmington Trust Company, as Trustee, for the issuance of Fixed/Floating Junior Subordinated Deferrable Interest Debentures due 2037 (filed as Exhibit 10.6 to the Form 10-Q filed on May 9, 2007, and incorporated herein by this reference). | |||
| 10.14 | Indenture dated as of March 14, 2006, by and between AmericanWest Bancorporation and Wilmington Trust Company, as Trustee, for the issuance of Fixed/Floating Junior Subordinated Deferrable Interest Debentures due 2036 (filed as Exhibit 10.11 to the Form 10-K filed on March 31, 2009, and incorporated herein by this reference). | |||
| 10.15 | Indenture dated as of June 26, 2003, by and between Columbia Trust Bancorp and US Bank National Association, as Trustee, for the issuance of Floating Junior Subordinated Deferrable Interest Debentures due 2033 (filed as Exhibit 10.12 to the Form 10-K filed on March 31, 2009, and incorporated herein by this reference). | |||
| 10.16 | Indenture dated as of September 26, 2002, between AmericanWest Bancorporation, as Issuer, and State Street Bank and Trust Company of Connecticut, National Association, as Trustee, for the issuance of Floating Rate Junior Subordinated Deferrable Interest Debentures due 2032 (filed as Exhibit 10.5 to the Form 10-K filed on March 26, 2003 and incorporated herein by reference). | |||
| 21.1 | Subsidiaries of Registrant.+ | |||
| 23.1 | Consent of Moss Adams LLP, Independent Registered Public Accounting Firm.+ | |||
| 31.1 | Certification of the Chief Executive Officer pursuant to Section 302 of the Sarbanes-Oxley Act of 2002.+ | |||
| 32 | Certification of the Chief Executive Officer and Chief Financial Officer pursuant to 18 U.S.C. Section 1350, as adopted pursuant to Section 906 of the Sarbanes-Oxley Act of 2002.+ | |||
| * | Denotes executive compensation plan or arrangement. |
| + | Denotes items filed herewith. |
94
Table of Contents
Pursuant to the requirements of Section 13 or 15(d) of the Securities Exchange Act of 1934, the registrant has duly caused this report to be signed on its behalf by the undersigned, thereunto duly authorized on the 4th day of March, 2010.
| AMERICANWEST BANCORPORATION | ||
| By: | /s/ PATRICK J. RUSNAK | |
| Patrick J. Rusnak | ||
| President, Chief Executive Officer and Director | ||
Pursuant to the requirements of the Securities Exchange Act of 1934, this report has been signed below by the following persons on behalf of the registrant and in the capacities indicated on the 4th day of March, 2010.
Principal Executive Officer and Principal Financial Officer
| By: |
/s/ PATRICK J. RUSNAK | |
| Patrick J. Rusnak, | ||
| President, Chief Executive Officer and Director | ||
| Principal Accounting Officer | ||
| By: | /s/ SHELLY L. KRASSELT | |
| Shelly L. Krasselt, | ||
| Principal Accounting Officer, Controller and Senior Vice President | ||
| Remaining Directors | ||
| By: | /s/ J. FRANK ARMIJO | |
| J. Frank Armijo, Director | ||
| By: | /s/ KAY C. CARNES | |
| Kay C. Carnes, Director | ||
| By: | /s/ CRAIG D. EERKES | |
| Craig D. Eerkes, Director | ||
| By: | /s/ H. DON NORTON | |
| H. Don Norton, Director | ||
| By: | /s/ DONALD H. SWARTZ, II | |
| Donald H. Swartz, II, Director | ||
| By: | /s/ P. MIKE TAYLOR | |
| P. Mike Taylor, Director | ||
95