Attached files
Table of Contents
UNITED STATES
SECURITIES AND EXCHANGE COMMISSION
Washington, D.C. 20549
Form 10-K
(Mark One)
| x | ANNUAL REPORT PURSUANT TO SECTION 13 OR 15(d) OF THE SECURITIES EXCHANGE ACT OF 1934 |
For the fiscal year ended January 3, 2010
Or
| ¨ | TRANSITION REPORT PURSUANT TO SECTION 13 OR 15(d) OF THE SECURITIES EXCHANGE ACT OF 1934 |
For the transition period from to .
Commission file number: 1-10079
CYPRESS SEMICONDUCTOR CORPORATION
(Exact name of registrant as specified in its charter)
| Delaware | 94-2885898 | |
| (State or other jurisdiction of incorporation or organization) |
(I.R.S. Employer Identification No.) |
198 Champion Court, San Jose, California 95134
(Address of principal executive offices and zip code)
Registrant’s telephone number, including area code: (408) 943-2600
Securities registered pursuant to Section 12(b) of the Act:
| Title of Each Class |
Name of Each Exchange on Which Registered | |
| Common Stock, $.01 par value | The NASDAQ Stock Market |
Securities registered pursuant to Section 12(g) of the Act:
None
Indicate by check mark if the registrant is a well-known seasoned issuer, as defined in Rule 405 of the Securities Act. ¨ Yes x No
Indicate by check mark if the registrant is not required to file reports pursuant to Section 13 or Section 15(d) of the Act. ¨ Yes x No
Indicate by check mark whether the registrant (1) has filed all reports required to be filed by Section 13 or 15(d) of the Securities Exchange Act of 1934 during the preceding 12 months (or for such shorter period that the registrant was required to file such reports), and (2) has been subject to such filing requirements for the past 90 days. x Yes ¨ No
Indicate by check mark whether the registrant has submitted electronically and posted on its corporate Website, if any, every Interactive Data File required to be submitted and posted pursuant to Rule 405 of Regulation S-T during the preceding 12 months ( or for such shorter period that the registrant was required to submit and post such files). ¨ Yes ¨ No
Indicate by check mark if disclosure of delinquent filers pursuant to Item 405 of Regulation S-K is not contained herein, and will not be contained, to the best of registrant’s knowledge, in definitive proxy or information statements incorporated by reference in Part III of this Form 10-K or any amendment to this Form 10-K. ¨
Indicate by check mark whether the registrant is a large accelerated filer, an accelerated filer, a non-accelerated filer, or a smaller reporting company. See the definitions of “larger accelerated filer,” “accelerated filer,” and “smaller reporting company” in Rule 12b-2 of the Exchange Act. (Check one):
Large accelerated filer x Accelerated filer ¨ Non-accelerated filer ¨ Smaller reporting company ¨
Indicate by check mark whether the registrant is a shell company (as defined in Rule 12b-2 of the Act). ¨ Yes x No
The market value of voting and non-voting common stock held by non-affiliates of the registrant, based upon the closing sale price of the common stock on June 28, 2009 as reported on the New York Stock Exchange, was approximately $1.0 billion. Shares of common stock held by each executive officer and director and by each person who owns 5% or more of the outstanding common stock have been excluded from the foregoing calculation in that such persons may be deemed affiliates. This determination of affiliate status is not necessarily a conclusive determination for other purposes.
As of February 24, 2010, 162,008,249 shares of the registrant’s common stock were outstanding.
DOCUMENTS INCORPORATED BY REFERENCE
Portions of the Definitive Proxy Statement for registrant’s Annual Meeting of Stockholders to be filed pursuant to Regulation 14A for the year ended January 3, 2010 are incorporated by reference in Items 10 - 14 of Part III of this Annual Report on Form 10-K.
Table of Contents
2
Table of Contents
FORWARD-LOOKING STATEMENTS
Forward-Looking Statements
The discussion in this Annual Report on Form 10-K contains statements that are not historical in nature, but are forward-looking statements within the meaning of Section 27A of the Securities Act of 1933, as amended, and Section 21E of the Securities Exchange Act of 1934, as amended, that involve risks and uncertainties, including, but not limited to, statements related to our programmability strategy; the markets we intend to pursue; our increased reliance on third party manufacturing; our strategy regarding non-aligned, underperforming businesses; the number and impact of future personnel terminations and the expenses related thereto; our expectations, including the timing, related to our restructuring activities which includes the closure of our Texas manufacturing facility; the sufficiency of our last time build of certain products previously manufactured in our Texas facility, our expectations regarding our active litigation matters and our intent to defend ourselves in those matters; the assumptions and calculations of our unrecognized tax benefits; our expected tax rate on foreign earnings, the adequacy of our cash and working capital positions; our expected return on our yield-enhancement program, our intended use of our line of credit; the value and liquidity of our investments in auction rate securities, and other debt investments, our expectations regarding our outstanding warranty liability, our plans to repurchase stock, whether or not we expect to pay dividends, the volatility of our stock price, the impact of the credit crisis on consumers and our obligations under the Grace guarantees. We use words such as “plan,” “anticipate,” “believe,” “expect,” “future,” “intend” and similar expressions to identify forward-looking statements. Such forward-looking statements are made as of the date hereof and are based on our current expectations, beliefs and intentions regarding future events or our financial performance and the information available to management as of the date hereof. Except as required by law, we assume no responsibility to update any such forward-looking statements. Our actual results could differ materially from those expected, discussed or projected in the forward-looking statements contained in this Annual Report on Form 10-K for any number of reasons, including, but not limited to, the state and future of the general economy and its impact on the markets we serve and our investments; the current credit conditions; our ability to expand our customer base, our ability to transform our business with a leading portfolio of programmable products; the number and nature of our competitors; the changing environment and/or cycles of the semiconductor industry; our ability to efficiently manage our manufacturing facilities and achieve our cost goals emanating from our flexible manufacturing strategy; our ability to maintain the tax-free nature of the SunPower spin-off; our success in our pending litigation matters, our ability to manage our investments and interest rate and exchange rate exposure; our ability to achieve liquidity in our investments, our ability to execute on the key strategies identified in the Business Strategies section of this 10-K and/or the materialization of one or more of the risks set forth above or in Item 1A (Risk Factors) in this Annual Report on Form 10-K.
Spin-Off of SunPower Corporation (“SunPower”)
Following completion of the spin-off of SunPower on September 29, 2008, we no longer consolidated SunPower’s financial results beginning in the fourth quarter of fiscal 2008 or addresses risk factors associated with SunPower’s business, operations, financial condition and results of operations. For a detailed discussion of the risks affecting SunPower, investors should refer to SunPower’s Annual Report on Form 10-K for the fiscal year ended January 3, 2010 and December 28, 2008. The contents of such Form 10-K are expressly not incorporated by reference herein.
3
Table of Contents
| ITEM 1. | BUSINESS |
General
In 2006, Cypress Semiconductor Corporation (“Cypress”) set out on a mission to transform from a traditional, broad-line semiconductor company into a leading supplier of proprietary and programmable solutions in systems everywhere. We are well on our way to achieving this goal. In 2009, Cypress captured a record 81% of revenues from programmable and proprietary products. Approximately 7,000 customers are using Cypress’s flagship PSoC® programmable system-on-chip platform, and the diverse end products they make range from cell phones and MP3 players to washing machines, personal computers (“PCs”) and communications switches.
Cypress’s high-performance, mixed-signal, programmable solutions provide customers with integration, rapid time-to-market and system value. In addition to PSoC, our offerings include capacitive sensing and touchscreen solutions, universal serial bus (“USB”) controllers, and general-purpose programmable clocks. Cypress also provides wired and wireless connectivity solutions, including, respectively, West Bridge® controllers, which enhance sideloading performance in multimedia handsets, and the CyFi™ low-power radio frequency (“RF”) solution, offering reliability, simplicity and power-efficiency. Cypress also offers a wide portfolio of static random access memories (“SRAMs”), nonvolatile memories and image sensor products. Cypress serves numerous markets, including consumer, computation, handsets, data communications, automotive, medical, industrial and white goods.
Cypress was incorporated in California in December 1982. The initial public offering of our common stock took place in May 1986, at which time our common stock commenced trading on the NASDAQ National Market. In February 1987, we were reincorporated in Delaware and in October 1988, we began listing our common stock on the New York Stock Exchange under the symbol “CY.” On November 12, 2009, we voluntarily moved our stock listing back to the NASDAQ Global Select Market, maintaining the “CY” ticker symbol.
Our corporate headquarters are located at 198 Champion Court, San Jose, California 95134, and our main telephone number is (408) 943-2600. We maintain a website at www.cypress.com. The contents of our website are not incorporated into, or otherwise to be regarded as part of, this Annual Report on Form 10-K.
Our fiscal 2009 ended on January 3, 2010, fiscal 2008 ended on December 28, 2008 and fiscal 2007 ended on December 30, 2007. Our fiscal 2009 contained 53 weeks and fiscal 2008 and fiscal 2007 contained 52 weeks.
Business Segments
As of the end of fiscal 2009, our organization included the following business segments:
| Business Segments |
Description | |
| Consumer and Computation Division |
A product division focusing on PSoC, USB and timing solutions. | |
| Data Communications Division |
A product division focusing on data communication devices for wireless handset and professional / personal video systems. | |
| Memory and Imaging Division |
A product division focusing on static random access memories, nonvolatile memories and image sensor products. | |
| Emerging Technologies and Other |
Includes Cypress Envirosystems and AgigA Tech, Inc., both majority-owned subsidiaries of Cypress, the Optical Navigation Systems (“ONS”) business unit, China business unit, foundry-related services and certain corporate expenses. | |
For additional information on our segments, see Note 20 of Notes to Consolidated Financial Statements under Item 8.
4
Table of Contents
Spin-Off of SunPower Corporation (“SunPower”)
On September 29, 2008, the first day of Cypress’s fourth quarter of fiscal 2008, we completed the distribution of all of our 42.0 million shares of SunPower Class B common stock to our stockholders (the “Spin-Off”). The distribution was made pro rata to our stockholders of record as of the close of trading on September 17, 2008. As a result of the Spin-Off, each stockholder received approximately 0.274 of a share of SunPower Class B common stock for each share of Cypress common stock held by such stockholder. The market value of the distribution was approximately $2.6 billion based on the closing price of SunPower common stock on September 29, 2008.
We received a favorable ruling from the Internal Revenue Service in April 2008 with respect to certain tax issues arising under Section 355 of the Internal Revenue Code in connection with the Spin-Off. The distribution was structured to be tax-free to us and our stockholders for U.S. federal income tax purposes, except in respect to cash received in lieu of fractional shares.
See Note 3 of Notes to Consolidated Financial Statements under Item 8 for a detailed discussion of the Spin-Off. Unless otherwise indicated, this Annual Report on Form 10-K includes discussion of our continuing operations.
Business Strategies
Cypress has made substantial progress in its goal to become a leading programmable solutions company. In addition to building a comprehensive programmable product portfolio based on our PSoC platform, we continue to actively manage expenses and maintain a strong balance sheet. We continue to shift certain business operations to lower-cost centers, including India and China. In addition we are utilizing foundry partners for more of our manufacturing.
In 2009, Cypress introduced two new architectures for its PSoC platform, PSoC 3 and PSoC 5, that extend Cypress’s reach into many new and fast-growing markets and increased its total addressable market (“TAM”) by 10x from $1.5 billion to $15 billion. Combining the PSoC family of devices with an intuitive new integrated software development environment called PSoC Creator™, Cypress is positioned to claim new business in the microcontroller, programmable analog and programmable logic markets.
We also continued to focus our sales, marketing, and product development on our “touch” business, which includes touchscreens and button-replacement technologies. As a result, we realized significant revenue growth for our PSoC-based TrueTouch™ touchscreen controllers and CapSense® capacitive-touch-sensing products, particularly in the handset market.
In fiscal 2010, Cypress will continue to pursue the following key strategies:
| Ÿ | Drive programmability. We believe our proprietary programmable technology and programmable product leadership, led by our flagship PSoC family of devices, represents an important competitive advantage for us, and has enabled us to maintain strong average selling prices (“ASPs”) across our product lines. Driven by current and anticipated demand, we continue to define, design and develop new programmable products and solutions that offer our customers increased flexibility and efficiency, higher performance, and higher levels of integration. |
| Ÿ | Extend technology leadership and drive PSoC proliferation. The most important step of our programmability initiative is to drive PSoC adoption in a variety of applications. PSoC devices can be used in applications ranging from MP3 players and handsets to running shoes, appliances, laptops and fitness equipment. The product’s easy-to-use programming software and development kits can facilitate rapid adoption across many different platforms. With the introduction of new PSoC architectures, we expect to see continued market share gains in this area, starting in 2010. |
5
Table of Contents
| Ÿ | Focus on large and growing markets. We will continue to pursue business opportunities in markets, including handheld and human interface/consumer devices, portable medical devices, industrial sensing and control, mobile accessories, and system management. |
| Ÿ | Collaborate with customers to build system-level solutions. We work closely with customers from initial product design through manufacturing and delivery. Our sales, customer and technical support, product marketing and development efforts are organized to optimize our customers’ design efforts, helping them to achieve product differentiation and speed time-to-market. Our engineering expertise is focused on developing whole product solutions, including silicon, software and reference designs. |
| Ÿ | Leverage flexible manufacturing. Our manufacturing strategy combines capacity from leading foundries with output from our internal manufacturing facilities. This initiative allows us to meet rapid swings in customer demand while lessening the burden of high fixed costs, a capability that is particularly important in high-volume consumer markets that we serve with our leading programmable product portfolio. |
| Ÿ | Identify and exit legacy or non-strategic, underperforming businesses. A focused business will allow us to better achieve our current objectives. Over the past three years, we have divested certain business units that were inconsistent with our future business initiatives and long-term plans. Exiting these businesses has allowed us to focus our current resources and efforts on our core programmable and proprietary business model. As part of our growth strategy, we will continue to review our business units to ensure alignment with our short and long-term goals. |
| Ÿ | Pursue complementary strategic relationships. Complementary acquisitions can expand our markets and strengthen our competitive position. As part of our growth strategy, we continue to selectively assess opportunities to develop strategic relationships, including acquisitions, investments and joint development projects with key partners and other businesses. |
As we continue to implement our strategies, there are many internal and external factors that could impact our ability to meet any or all of our objectives. Some of these factors are discussed under Item 1A.
Product / Service Overview
Consumer and Computation Division:
The Consumer and Computation Division designs and develops solutions for many of the world’s leading end-product manufacturers. Its programmable product offerings are the linchpin of our programmable solutions strategy. This division’s products include PSoC devices, CapSense and TrueTouch touch-sensing/touchscreen products and the CyFi low-power RF radio, the industry’s broadest selection of USB controllers and WirelessUSB™ products, and general-purpose programmable clocks. PSoC products are used in various consumer applications such as MP3 players, mass storage, household appliances, laptop computers and toys. USB is used primarily in PC and peripheral applications and is finding increased adoption rates in consumer devices such as MP3 players, mobile handsets and set-top boxes.
6
Table of Contents
The following table summarizes the markets and applications related to our products in this segment:
| Products |
Markets | Applications | ||
| PSoC 1, PSoC 3 and PSoC 5 |
Consumer, handsets, industrial, medical, communications |
Digital still and video cameras, appliances, handheld devices, notebook computers, LCD monitors, medical devices, mice, keyboards, industrial interfaces, toys, mobile accessories and e-Bikes. | ||
| CapSense |
Consumer, industrial, computation, white goods, communication, automotive |
Notebook computers and PCs, appliances, handheld devices, automotive control pads/media centers, digital cameras, toys, consumer products and many other applications. | ||
| TrueTouch |
Consumer, computation, handsets, communication, gaming |
Mobile handsets, portable media players, video games, GPS systems, keyboards and other applications. | ||
| USB controllers |
PC peripherals, consumer electronics |
Mice, keyboards, handheld devices, gamepads and joysticks, VoIP phones, headsets, presenter tool, dongles, point of sale devices and bar code scanners. | ||
| WirelessUSB |
PC peripherals | Mice, keyboards, wireless headsets, consumer electronics, gamepads, remote controllers, toys and presenter tools. | ||
| CyFi low-power RF |
Industrial monitoring and control, building automation, medical, sports and leisure, freight/shipping |
Sensor networks, monitoring systems, remote controls, medical equipment, fitness equipment and asset management systems. | ||
| Programmable clocks |
Consumer, computation | Set-top boxes, copiers, printers, HDTV, industrial automation, printers, single-board computers, IP phones, storage devices, servers and routers. | ||
| RoboClock™ buffers |
Communications | Base stations, high-end telecom equipment (switches, routers), servers and storage. | ||
PSoC® Programmable System-on-Chip products. Our PSoC products are highly integrated, high-performance mixed-signal devices with an on-board microcontroller, programmable digital and analog blocks, SRAM and flash memory. They provide a low-cost, single-chip solution for a variety of consumer, industrial, medical, and system management applications. A single PSoC device can integrate as many as 100 peripheral functions saving customers design time, board space, power consumption, and system costs. Because of its programmability, PSoC allows customers to make modifications at any point during the design cycle, providing unmatched flexibility. Cypress’s flagship PSoC 1 device delivers performance, programmability and flexibility with a cost-optimized 8-bit M8C CPU subsystem.
In fiscal 2009, we launched the next generation of our PSoC family, PSoC 3 and 5. PSoC 3 uses an 8-bit, Intel® 8051-based microcontroller with 7.5 times more computing power than PSoC 1. The 32-bit, ARM®-Cortex™-based PSoC 5 has 25 times more computing power than PSoC 1. The analog-to-digital converters on PSoC 3 and PSoC 5 are 256 times more accurate and 10- to 30-times faster than PSoC 1, and there are 10 times more programmable logic gates available. PSoC Creator™ is a unique design tool that allows engineers to use intuitive schematic-based capture and dozens of certified, firmware-defined, pre-packaged peripherals. Cypress shipped its 600 millionth PSoC device in 2009.
CapSense. Our PSoC-based CapSense capacitive touch-sensing solutions replace mechanical switches and controls with simple, touch-sensitive controls by detecting the presence or absence of a conductive object (such as a
7
Table of Contents
finger) and measuring changes in capacitance. This technology lends itself equally well to buttons, sliders, touchpads, touchscreens and proximity sensors, taking industrial design possibilities to a much higher level. The CapSense family includes CapSense, CapSense Express™ and CapSense Plus™—each supporting different ranges of general purpose inputs/outputs, buttons and slider devices. In 2009, Cypress introduced SmartSense™ technology, an automatic tuning solution for its CapSense devices that dynamically detects and adjusts a system’s capacitive-sensing parameters, eliminating the need for manual tuning. Cypress has replaced more than 3 billion buttons with CapSense technology and is the worldwide capacitive sensing market share leader in handsets.
TrueTouch Touchscreen Solutions. TrueTouch is a single-chip touchscreen solution that can interpret the inputs of more than 10 fingers from all areas of the screen simultaneously. This enables designers to create new usage models for products such as mobile handsets, portable media players (“PMPs”), global positioning systems (“GPS”) and other products. The TrueTouch family also includes devices that perform traditional touchscreen functions including interpreting single touches, and gestures such as tap, double-tap, pan, pinch, scroll, and rotate. In early 2010, Cypress demonstrated a tablet-sized capacitive touchscreen technology with 10-finger tracking, ideal for Windows® 7-based laptops, netbooks and tablet PCs and introduced 1mm stylus support for TrueTouch capacitive touchscreens. This combined portfolio of touchscreen solutions is the industry’s broadest.
USB Controllers. Cypress shipped its one-billionth USB controller in 2009. USB provides the primary connection between a PC and peripherals, including keyboards, mice, printers, joysticks, scanners and modems. It is also used to connect various non-PC systems, such as handheld games, digital still cameras and MP3 players. The USB standard facilitates a “plug-and-play” architecture that enables instant recognition and interoperability when a USB-compatible peripheral is connected to a system. We offer a full range of USB solutions, including low-speed (1.5 Mbps), full-speed (12 Mbps) and high-speed (480 Mbps) USB products. We also offer a variety of USB hubs, transceivers, serial interface engines and embedded-host products for a broad range of applications.
WirelessUSB™. Designed for short-range wireless connectivity, WirelessUSB enables personal computer peripherals, gaming controllers, remote controls, toys, and other point-to-point or multipoint-to-point applications to “cut the cord” with a low-cost, 2.4-GHz wireless solution. The WirelessUSB system acts as a USB human interface device, so the connectivity is transparent to the designer at the operating system level. WirelessUSB also operates as a simple, cost-effective wireless link in a host of other applications including industrial, consumer, and medical markets.
CyFi™ Low-Power RF Solutions. Our CyFi low-power RF solution is the highly reliable, easy-to-use, 2.4-GHz answer to a wide range of wireless embedded control challenges, enabling designers to create wireless systems without compromising reliability, complexity and low power consumption. The solution combines a PSoC device, CyFi transceiver and CyFi network protocol stack. It is ideal for sensor networks, security monitoring systems, remote controls, medical equipment, fitness equipment, asset management systems and other applications.
Programmable Clocks. Programmable timing solutions such as our InstaClock device combine high performance with the flexibility and fast time to market of field-programmable devices at a cost that is competitive against custom clocks at equivalent volumes. Working with our easy-to-use CyberClocks software, designers can optimize device parameters such as drive strength, phased-lock loop bandwidth and crystal input capacitive loading. Our programmable clocks are ideal for devices requiring multiple frequencies including Ethernet, PCI, USB, HDTV, and audio applications. In 2009, Cypress introduced the FleXO™ family of high-performance clock generators that can be instantly programmed in the factory or field to any frequency up to 650 MHz, accelerating time to market and improving manufacturing quality.
RoboClock Clock Buffers. Our RoboClock family of clock buffers feature programmable output skew, programmable multiply/divide factor, and user-selectable redundant reference clocks that provide fault tolerance. Designers can control output skew and multiply and divide factors to help accommodate last-minute design changes. RoboClock offers a high-performance timing solution for designers of communications, computation and storage networking applications.
8
Table of Contents
Data Communications Division:
The Data Communications Division focuses on communication products, peripheral controllers, dual-port interconnects, programmable logic devices and PowerPSoC® which includes our EZ-Color™ LED lighting solutions. Our communication products are primarily used in the networking and telecommunications market. This division also makes a line of legacy switches, cable drivers and equalizers for the professional video market. Our specialty memory products consist of first-in, first-out and dual port memories. First-in, first-out memories are used for applications such as switches and routers, and dual port memories are used in switching applications and handsets, including networking switches and routers, cellular base stations, mass storage devices, mobile handsets, and telecommunication equipment.
The following table summarizes the markets and applications related to our products in this segment:
| Products |
Markets | Applications | ||
| Peripheral bridge controllers | Consumer, mobile handsets |
Cellular phones, portable media players, personal digital assistants, digital cameras and printers. | ||
| Dual-port memories | Networking, telecommunication |
Medical and instrumentation, storage, wireless infrastructure, military communications, image processors and base stations. | ||
| First-in, first-out (“FIFO”) memories | Video, data communications, telecommunications, networking |
Video, data communications, telecommunications, and network switching/routing. | ||
| Physical layer devices | Data communications, consumer |
Converters, professional video cameras, production switchers and video routers and servers, encoders and decoders. | ||
| Programmable logic devices | Storage, military | Storage and military. | ||
| PowerPSoC® controllers | Industrial, lighting | LEDs, motors and other power applications. | ||
| EZ-Color LED controllers | Architecture, entertainment |
Flashlights, architectural lighting, general signage and entertainment lighting. | ||
West Bridge® Peripheral Bridge Controllers. Our West Bridge products enable direct connection between peripherals, creating ultra-fast transfers while offloading the main processor from data-intensive operations. The West Bridge family complements the main processor by adding support for next generation and latest standards and allowing simultaneous transfers between peripherals and processing elements. The inaugural product in the West Bridge family is Antioch. Antioch is a three-ported device designed specifically for handsets to provide a direct path from PC to handset mass storage, freeing baseband/applications processor resources by limiting its involvement in these high-density transfers. Additionally, Antioch creates simultaneous usage models by adding dedicated paths between the three ports to literally create multiple usage models such as using the handset as a modem, while downloading multimedia files, and playing music. The most recent addition to the West Bridge family is Astoria which features Multi-Level Cell (MLC) NAND Flash support that enables designers to use lowest-cost, highest-density flash storage. In 2009, Cypress also introduced Turbo-MTP™, a faster media transfer protocol module for West Bridge controllers. Users can transfer a movie from a PC to their handheld device in less than 45 seconds— four times faster than the next-best alternative.
Dual-Port Memories. Dual ports, which can be accessed by two different processors or buses simultaneously, target shared-memory and switching applications, including networking switches and routers, cellular base stations, mass-storage devices and telecommunications equipment. We offer a portfolio of more than 160 synchronous and asynchronous dual-port interconnects ranging in densities from 8 Kbits to 36 Mbits
9
Table of Contents
with speeds of up to 250 MHz. Our dual ports are the compelling solutions for interprocessor communication in a broad range of applications. For high-volume multiprocessor applications (wireless handsets, PDAs, consumer) we offer the MoBL dual port, providing a low cost, quick time-to-market interconnect solution with the industry’s lowest power-consumption.
FIFO Memories. FIFOs are used as a buffer between systems operating at different frequencies. Our high-performance FIFO products provide the ideal solution to interconnect problems such as flow control, rate matching, and bus matching. Our FIFO portfolio is comprised of more than 100 synchronous and asynchronous memories in a variety of speeds, bus widths, densities and packages. Using industry-standard pinouts, these products are easily integrated into new and existing designs. Unidirectional, bidirectional, tri-bus and double sync configurations are available with built-in expansion logic and message-passing capabilities for various markets including video, data communications, telecommunications and network switching/routing.
Physical Layer Devices. Our portfolio includes HOTLink, HOTLinkDX and HOTLinkII. These transceiver families cover data transmission rates of 50 Mbps up to 1.5 Gbps. These flexible devices are ideal for proprietary serial backplane applications. They also comply with many industry standards such as 10 Gbps Ethernet, gigabit Ethernet, Fibre Channel, Enterprise System Connection, Digital Video Broadcast, and high-definition television. In addition, we supply a chipset for the transmission of digital video signals. This chipset is based on our HOTLink family and is widely used in professional digital video equipment such as editing, routing, recording and storage.
Programmable Logic Devices. System logic performs non-memory functions such as floating-point mathematics or the organization and routing of signals throughout a computer system. We manufacture several types of programmable logic devices that facilitate the replacement of multiple standard logic devices with a single programmable device, increasing flexibility and reducing time to market. Our wide range of programmable logic devices includes products ranging from 32 to more than 3,000 macrocells.
PowerPSoC. Cypress’s PowerPSoC family of embedded power controllers is the industry’s first fully integrated single-chip solution for both controlling and driving high-power LEDs and other power applications such as small motors. The PowerPSoC family integrates four constant-current regulators and four 32V MOSFETs with Cypress’s PSoC® programmable system-on-chip, which includes a microcontroller, programmable analog and digital blocks and memory. This uniquely high level of integration provides customers with a single-chip solution for high-quality LED-based lighting products and extends into other embedded applications such as white goods and industrial control.
EZ-Color Controllers. Our EZ-Color family of devices offers the ideal control solution for high brightness light-emitting diode (“LED”) applications requiring intelligent dimming control. EZ-Color devices combine the power and flexibility of PSoC with Cypress’s precise illumination signal modulation drive technology providing lighting designers a fully customizable and integrated lighting solution platform.
Memory and Imaging Division:
The Memory and Imaging Division consists of our memory business and image sensor business. Our memory business designs and manufactures SRAM products and nonvolatile memories (“nvSRAMs”) which are used to store and retrieve data in networking, wireless infrastructure and handsets, computation, consumer, automotive, industrial and other electronic systems. In 2009, Cypress became the world’s No.1 supplier of SRAMs. Our memory products target a variety of markets including networking, telecommunications, wireless communications and consumer applications. Our image sensor products are used in high-end industrial, medical and aeronautic applications.
10
Table of Contents
The following table summarizes the markets and applications related to our products in this segment:
| Products |
Markets | Applications | ||
| Asynchronous SRAMs |
Consumer, networking |
Consumer electronics, switches and routers, automotive, peripheral and industrial electronics. | ||
| Synchronous SRAMs |
Base station, networking |
Wireline networking, wireless base stations, high bandwidth applications and industrial electronics. | ||
| nvSRAMs |
Servers, industrial |
Redundant array of independent disk servers, point of sale terminals, set-top boxes, copiers, industrial automation, printers, single-board computers and gaming. | ||
| Image sensors |
Consumer, automotive, medical, industrial |
High volume cell phone, digital camera, medical equipment, digital photography and medical imaging. | ||
Asynchronous SRAMs. We manufacture a wide selection of fast asynchronous and micropower SRAMs with densities ranging from 16 Kbits to 64 Mbits. These memories are available in many combinations of bus widths, packages and temperature ranges including automotive. They are ideal for use in point-of-sale terminals, gaming machines, network switches and routers, IP phones, IC testers, DSLAM Cards and various automotive applications.
Synchronous SRAMs. Our high-speed synchronous SRAMs include standard synchronous pipelined, No Bus Latency (“NoBL”), Quad Data Rate, and Double Data Rate SRAMs, and are typically used in networking applications. NoBL synchronous SRAMs are optimized for high-speed applications that require maximum bus bandwidth up to 250 MHz, including those in the networking, instrumentation, video and simulation businesses. Double Data Rate (DDR) SRAMs target network applications and servers that operate at data rates up to 550 MHz. Quad Data Rate (QDR™) products are targeted toward next-generation networking applications, particularly switches and routers that operate at data rates beyond 550 MHz and offer twice the bus bandwidth of DDR SRAMs. In 2009, Cypress introduced the industry’s first 65-nm QDR and DDR SRAMs. The 144-Mbit and 72-Mbit devices, developed with foundry partner UMC, feature the industry’s fastest clock speeds and operate at half the power of their 90-nm predecessors. They are ideal for networking, medical imaging and military signal processing.
nvSRAMs. nvSRAMs are products that operate similar to standard Asynchronous SRAM and reliably store data into an internal nonvolatile array during unanticipated power downs. The competitive advantage of an nvSRAM is infinite endurance and much faster read/write speed than a Serial Flash or EEPROM. Additionally, theses high-speed nonvolatile SRAM devices can store data for more than 20 years without battery backup. These memories are ideal for redundant array of independent disks (“RAID”) storage arrays, metering applications, multifunction printers and other industrial applications, such as PLCs. In 2009, Cypress introduced a 1-Mbit serial nonvolatile SRAM family and new 4-Mbit and 8-Mbit parallel nvSRAMs with an integrated real-time clock, providing failsafe battery-free data backup in mission-critical applications.
Image Sensors. Cypress develops and markets innovative and high-performance standard products and custom design CMOS imager ASICs. Our CMOS active pixel sensors are based on innovative design approaches realized in standard CMOS processing technologies. Our custom design image sensors are produced according to the agreed specification and planning. With more than 15 years of experience in the field of CMOS active pixel sensors, we have proven solutions for multi-megapixel digital photography, large area sensors (w/o stitching), ultra-high-speed, imaging for machine vision, linear and 2D barcode imaging, medical XRAY imaging, single-chip camera integration, and radiation-hardened CMOS image sensors for space and nuclear use.
Emerging Technologies:
The Emerging Technologies consists of businesses outside our core semiconductor business. It includes majority owned subsidiaries Cypress Envirosystems and AgigA Tech Inc., foundry services and other operations.
11
Table of Contents
Cypress Envirosystems, Inc. Formed in fiscal 2007, Cypress Envirosystems (formerly Cypress Systems Corporation) provides and introduces new technologies to older industrial plants and buildings to reduce cost, improve productivity, extend asset life, and improve safety and compliance. Cypress Envirosystems develops and markets products and services for industrial and commercial end-users. It combines the broad portfolio of unique technologies from Cypress with its deep domain and applications experience in Industrial Automation and HVAC to create unique solutions that reduce cost and improve productivity for plants and buildings. Products include a wireless pneumatic thermostat that enables remote temperature sensing and control, a wireless gauge reader that clips onto the face of existing gauges to capture and transmit data, a wireless steam trap monitor that detects leaks and failures, and a wireless transducer reader that provides energy-use characterization and baseline data for audits. It has formed a strategic partnership with Honeywell to sell a custom version of its Wireless Gauge Reader under the Honeywell brand label.
AgigA Tech, Inc. AgigA Tech a majority owned subsidiary of Cypress, produces very-high-density, high-speed, non-volatile memories. Its flagship product, AGIGARAM™ is the industry’s first, battery-free, high-speed high-density, nonvolatile dynamic random access memory (DRAM) system. In the event of a power outage, AGIGARAM provides fail-safe battery-free data backup capabilities for storage, networking, gaming, automotive, industrial and embedded systems. Its CAPRI family of battery-free nonvolatile memory products has an industry-leading two gigabytes of density.
Optical Navigation Sensors.(“ONS”) Our OvationONS™ laser-based optical navigation sensor is targeted at high-end and midrange wired and wireless mice. The sensor delivers fast and precise tracking on more surfaces than other sensors on the market, using our patented OptiCheck™ technology, which offers outstanding accuracy and a variable resolution ranging from 800 to 2,400 counts per inch. The sensors target the handset, tablet gaming, desktop and mobile mouse, high-precision trackball, and industrial applications. Based on Cypress’s PSoC programmable system-on-chip platform, the OvationONS™ II “mouse-on-a-chip” solution is the first product combining a precision laser navigation sensor with an optical signal processor and microcontroller on a single chip.
China Business Unit. Centered in Shanghai, Cypress’s China Business Unit designs and produces semiconductor solutions for the China marketplace. Early product successes include PSoC-based solutions for electric bicycles, consumer electronics, and white goods. The China Business Unit is also licensing Cypress technology to foundries throughout Asia.
Acquisitions and Divestitures
We are committed to the ongoing evaluation of strategic opportunities and, where appropriate, to the acquisition of additional products, technologies or businesses that are complementary to, or broaden the markets for, our products. At the same time, we continuously evaluate our businesses to make sure that they are well-aligned with our programmable and proprietary products strategy. Businesses that do not align with our strategy are considered for divestment. We did not make any acquisitions or divestitures in fiscal 2009.
Manufacturing
During fiscal 2009, we manufactured approximately 65% of our semiconductor products at our wafer manufacturing facility in Bloomington, Minnesota. External wafer foundries manufactured the balance of our products.
We have a strategic foundry partnership with Grace Semiconductor Manufacturing Corporation (“Grace”), located in Shanghai, China. Under the terms of the agreement, we transferred certain proprietary process technologies to Grace and provided additional production capacity to augment output from our manufacturing facilities. During fiscal 2006 and 2007, we completed the transfer of our 0.35-micron SONOS, 0.13-micron SRAM and LOGIC processes and began purchasing products from Grace that were manufactured using these processes.
12
Table of Contents
In conjunction with the agreement, we have entered into a series of guarantees with a financing company for the benefit of Grace. As of January 3, 2010, we continue to serve as guarantor for approximately $9.1 million in lease payments due by Grace. If Grace fails to pay any of the quarterly rental payments, we will be obligated to pay such outstanding amounts. We expect our obligations under the agreement to be reduced to zero by the end of fiscal 2010.
We conduct assembly and test operations at our highly automated assembly and test facility in the Philippines. This facility accounted for approximately 56% of the total assembly output and 75% of the total test output in fiscal 2009. Various subcontractors in Asia performed the balance of the assembly and test operations.
Our facility in the Philippines performs assembly and test operations manufacturing volume products and packages where our ability to leverage manufacturing costs is high. This facility has nine fully integrated, automated manufacturing lines enabling complete assembly and test operations with minimal human intervention. These autolines have shorter manufacturing cycle times than conventional assembly/test operations, which enable us to respond more rapidly to changes in demand.
Research and Development
Research and development efforts are focused on the development and design of new semiconductor products, as well as the continued development of advanced software platforms primarily for our programmable solutions. Our goal is to increase efficiency in order to maintain our competitive advantage. Our research and development organization works closely with our manufacturing facilities, suppliers and customers to improve our semiconductor designs and lower our manufacturing costs. During fiscal 2009, 2008 and 2007, research and development expenses totaled $181.2 million, $193.5 million and $174.2 million, respectively.
We have both central and division-specific design groups that focus on new product creation and improvement of design methodologies. These groups conduct ongoing efforts to reduce design cycle time and increase first pass yield through structured re-use of intellectual property blocks from a controlled intellectual property library, development of computer-aided design tools and improved design business processes. Design and related software development work primarily occurs at design centers located in the United States, Europe, India and China.
Customers, Sales and Marketing
We sell our semiconductor products through several channels: sales through global domestically-based distributors; sales through international distributors, trading companies and manufacturing representative firms; and sales by our sales force to direct original equipment manufacturers. Our marketing and sales efforts are organized around four regions: North America, Europe, Japan and Asia/Pacific. We also have a strategic-account group and a contract-manufacturing group which are responsible for specific customers with worldwide operations. We augment our sales effort with field application engineers, specialists in our products, technologies and services who work with customers to design our products into their systems. Field application engineers also help us to identify emerging markets and new products.
One global distributor accounted for 14% of our total revenues for fiscal 2009. Two distributors accounted for 13% and 11% of our total revenues for fiscal 2008. Two distributors accounted for 14% and 12% of our total revenues for fiscal 2007. There was no single end customer in fiscal 2009, 2008 or 2007 that accounted for more than 10% of total revenue.
Backlog
Our sales typically rely upon standard purchase orders for delivery of products with relatively short delivery lead times. Customer relationships are generally not subject to long-term contracts. However, we have entered into long-term supply agreements with certain customers. These long-term supply agreements generally do not contain minimum purchase commitments. Products to be delivered and the related delivery schedules under these
13
Table of Contents
long-term contracts are frequently revised to reflect changes in customer needs. Accordingly, our backlog at any particular date is not necessarily representative of actual sales for any succeeding period and we believe that our backlog is not a meaningful indicator of future revenues.
Competition
The semiconductor industry is intensely competitive and continually evolving. This intense competition results in a challenging operating environment for most companies in these industries. This environment is characterized by potential erosion of product sale prices over the life of each product, rapid technological change, limited product life cycles, greater brand recognition and strong domestic and foreign competition in many markets. Our ability to compete successfully depends on many factors, including:
| Ÿ | our success in developing new products and manufacturing technologies; |
| Ÿ | delivery, performance, quality and price of our products; |
| Ÿ | diversity of our products and timeliness of new product introductions; |
| Ÿ | cost effectiveness of our design, development, manufacturing and marketing efforts; |
| Ÿ | quality of our customer service, relationships and reputation; |
| Ÿ | pace at which customers incorporate our products into their systems; and |
| Ÿ | number and nature of our competitors and general economic conditions. |
We face competition from domestic and foreign semiconductor manufacturers, many of which have advanced technological capabilities and have increased their participation in the markets in which we operate. We compete with a large number of companies primarily in the telecommunications, networking, data communications, computation and consumer markets. Companies who compete directly with our semiconductor businesses include, but are not limited to, Altera, Analog Devices, Applied Micro Circuits, Atmel, Integrated Device Technology, Integrated Silicon Solution, Lattice Semiconductor, Linear Technology, Maxim Integrated Products, Inc., Microchip Technology, National Semiconductor, Pericom Semiconductor, PMC-Sierra, Renesas, Samsung, Silicon Laboratories, Standard Microsystems, Synaptics, Texas Instruments and Xilinx.
Environmental Regulations
We use, generate and discharge hazardous chemicals and waste in our research and development and manufacturing activities. United States federal, state and local regulations, in addition to those of other foreign countries in which we operate, impose various environmental rules and obligations, which are becoming increasingly stringent over time, intended to protect the environment and in particular regulate the management and disposal of hazardous substances. We also face increasing complexity in our product design as we adjust to new and future requirements relating to the materials composition of our products, including the restrictions on lead and other hazardous substances that apply to specified electronic products put on the market in the European Union (Restriction on the Use of Hazardous Substances Directive 2002/95/EC, also known as the “RoHS Directive”) and similar legislation in China and California. We are committed to the continual improvement of our environmental systems and controls. However, we cannot provide assurance that we have been, or will at all times be, in complete compliance with all environmental laws and regulations. Other laws impose liability on owners and operators of real property for any contamination of the property even if they did not cause or know of the contamination. While to date we have not experienced any material adverse impact on our business from environmental regulations, we cannot provide assurance that environmental regulations will not impose expensive obligations on us in the future, or otherwise result in the incurrence of liability such as the following:
| Ÿ | a requirement to increase capital or other costs to comply with such regulations or to restrict discharges; |
| Ÿ | liabilities to our employees and/or third parties; |
| Ÿ | business interruptions as a consequence of permit suspensions or revocations or as a consequence of the granting of injunctions requested by governmental agencies or private parties; and |
For example, we are currently working with the Texas Commission on Environmental Quality in connection with the shutdown activities related to our Texas manufacturing facility, and will take all reasonable steps to ensure the Texas facility closure complies with all applicable federal, state and local environmental laws.
14
Table of Contents
Intellectual Property
We have an active program to obtain patent and other intellectual property protection for our proprietary technologies, products and other inventions that are aligned with our strategic initiatives. We rely on a combination of patents, copyrights, trade secrets, trademarks and proprietary information to maintain and enhance our competitive position in the domestic and international markets we serve. As of the end of fiscal 2009, we had approximately 1,723 issued patents and approximately 900 additional patent applications on file domestically and internationally. In addition, in fiscal 2010, we are preparing to file up to 70 new patent applications in the United States and 10 foreign applications in countries such as China, Taiwan, Korea and India.
In addition to factors such as innovation, technological expertise and experienced personnel, we believe that patents are increasingly important to remain competitive in our industry and to facilitate the entry of our proprietary products, such as PSoC, into new markets. As our technologies are deployed in new applications and we face new competitors, we will likely subject ourselves to new potential infringement claims. Patent litigation, if and when instituted against us, could result in substantial costs and a diversion of our management’s attention and resources, however, we are committed to vigorously defending and protecting our investment in our intellectual property. Therefore, the strength of our intellectual property program, including the breadth and depth of our portfolio, will be critical to our success in the new markets we intend to pursue.
In connection with our divestiture of unaligned and non-strategic businesses, we performed an analysis of our intellectual property portfolio to ensure we were deriving the full value of our assets. As a result, we are evaluating the sale of certain unaligned patents as well as other monetization models for our portfolio.
Financial Information about Geographic Areas
Financial information about geographic area is incorporated herein by reference to Note 20 of Notes to Consolidated Financial Statements under Item 8.
International revenues have historically accounted for a significant portion of our total revenues. Our manufacturing and certain finance operations in the Philippines, as well as our sales and support offices and design centers in other parts of the world, face risks frequently associated with foreign operations, including, but not limited to:
| Ÿ | currency exchange fluctuations, including the weakening of the U.S. dollar; |
| Ÿ | the devaluation of local currencies; |
| Ÿ | political instability; |
| Ÿ | labor issues; |
| Ÿ | changes in local economic conditions; |
| Ÿ | import and export controls; |
| Ÿ | potential shortage of electric power supply; and |
| Ÿ | changes in tax laws, tariffs and freight rates. |
To the extent any such risks materialize, our business, financial condition or results of operations could be seriously harmed.
Employees
As of January 3, 2010, we had approximately 3,600 employees worldwide, down from approximately 4,400 employees in the third quarter of 2008 as we implemented a broad based restructuring effort and closed our manufacturing facility in Texas. Geographically, approximately 1,300 employees were located in the Philippines, 1,400 employees were located in the United States and 900 employees were located in other countries. Of the total employees, approximately 2,000 employees were associated with manufacturing, 700 employees were associated with research and development, and 900 employees were associated with selling, general and administrative functions.
15
Table of Contents
None of our employees are represented by a collective bargaining agreement, nor have we ever experienced organized work stoppages.
Executive Officers
Certain information regarding each of our executive officers is set forth below:
| Name |
Age | Position | ||
| T. J. Rodgers |
61 | President, Chief Executive Officer and Director | ||
| Brad W. Buss |
45 | Executive Vice President, Finance and Administration and CFO | ||
| Sabbas A. Daniel |
47 | Executive Vice President, Quality | ||
| Paul D. Keswick |
52 | Executive Vice President, New Product Development, Engineering, IT | ||
| Dana C. Nazarian |
43 | Executive Vice President, Memory and Imaging Division | ||
| Cathal Phelan |
46 | Executive Vice President, Chief Technical Officer | ||
| Dinesh Ramanathan |
40 | Executive Vice President, Data Communications Division | ||
| Ronald Sartore |
60 | Chief Executive Officer, AgigA Tech Inc. | ||
| Christopher A. Seams |
47 | Executive Vice President, Sales and Marketing | ||
| Shahin Sharifzadeh |
45 | Executive Vice President of Worldwide Manufacturing and Operations; President, China Operations | ||
| Harry Sim |
47 | Chief Executive Officer, Cypress Envirosystems | ||
| Thomas Surrette |
47 | Executive Vice President, Human Resources | ||
| Norman P. Taffe |
43 | Executive Vice President, Consumer and Computation Division |
T.J. Rodgers is founder of Cypress and has been a Director and its President and Chief Executive Officer since 1982. Mr. Rodgers serves as a director of certain internal subsidiaries, Bloom Energy and SunPower. Mr. Rodgers is also a member of the Board of Trustees of Dartmouth College.
Brad W. Buss joined Cypress in 2005 as Executive Vice President, Finance and Administration and Chief Financial Officer. Prior to joining Cypress, Mr. Buss served as Vice President of Finance at Altera Corporation. Mr. Buss spent seven years as a finance executive with Wyle Electronics, culminating as Chief Financial Officer and Secretary of the Atlas Services division. Mr. Buss was also a member of Cisco Systems’ worldwide sales finance team. In addition, Mr. Buss served as Senior Vice President of Finance and Chief Financial Officer and Secretary at Zaffire. Mr. Buss currently serves as a board member of certain internal subsidiaries and CafePress.com, a private company, as well as Tesla Motors.
Sabbas A. Daniel was appointed Executive Vice President of Quality in 2006. Prior to his current position, Mr. Daniel has held various management positions responsible for Cypress’s reliability and field quality organizations. Mr. Daniel joined Cypress in 1998.
Paul D. Keswick is Executive Vice President of New Product Development since 1996. Prior to his current position, Mr. Keswick has held various management positions, including Vice President and General Manager for various business divisions. Mr. Keswick has been with Cypress since 1986.
Dana C. Nazarian was named Executive Vice President of Memory and Imaging Division in February 2009. Mr. Nazarian started his career with Cypress in 1988. Prior to his current position, Mr. Nazarian held various management positions, which included oversight of significant operations in our Round Rock, Texas facility and Vice President of our Synchronous SRAM business unit.
Cathal Phelan re-joined Cypress in late 2008 as Executive Vice President and Chief Technical Officer, having left Cypress in early 2006. In 2006, Mr. Phelan left to become Chief Executive Officer/President at Ubicom Inc., a venture capital backed company delivering multi-threaded CPUs. Prior to 2006, Mr. Phelan held a number of engineering and management roles at Cypress, predominantly in design and architecture and then as Executive Vice President for the Data Communications Division. Mr. Phelan originally joined Cypress in 1991, has 37 granted U.S. patents and currently serves as a board member of Virage Logic.
16
Table of Contents
Dinesh Ramanathan was named Executive Vice President of Data Communications Division in 2005. Prior to his current appointment, Dr. Ramanathan was a Business Unit Director for the specialty memory and communications business units. Prior to joining Cypress in 2004, Dr. Ramanathan held senior marketing and engineering positions at Raza Microelectronics, Raza Foundries and Forte Design Systems.
Ron Sartore was appointed Chief Executive Officer of AgigA Tech, Inc. in 2007. AgigA Tech, Inc. was originally a subsidiary of Simtek Corporation, a public company Cypress acquired in 2008. Mr. Sartore has over 30 years of experience in the computer and semiconductor fields. Prior to his current role, Mr. Sartore served as an Executive Vice President and director of Simtek Corporation. Prior to tenure at Simtek, Mr. Sartore served as a Vice President of several business units at Cypress, which he joined as a result of Cypress’s 1999 acquisition of Anchor Chips, a company Mr. Sartore founded in 1995. Prior to Anchor Chips, Mr. Sartore held various engineering and management roles, and was a founder of Cheetah International, in 1985.
Christopher A. Seams was named Executive Vice President of Sales and Marketing in 2005. Prior to his current appointment, Mr. Seams was Executive Vice President of Manufacturing and Research and Development. Mr. Seams joined Cypress in 1990 and has held a variety of positions in technical and operational management in manufacturing, development and foundry.
Shahin Sharifzadeh is Executive Vice President of Worldwide Manufacturing and Operations, responsible for directing Cypress’s process technology R&D, wafer manufacturing, test, assembly and operations worldwide. He is also President of Cypress’s China operations, a position he has held since 2008. Prior to his current position, Mr. Sharifzadeh served as Cypress’s Vice President of R&D and Wafer Manufacturing. Mr. Sharifzadeh joined Cypress in 1989.
Harry Sim was appointed Chief Executive Officer of Cypress Envirosystems in 2006. Prior to Cypress Envirosystems, Mr. Sim was with Honeywell from 1991 to 2006, where he was most recently the Global Vice-President of Marketing for Honeywell’s Industrial Process Control division. During his 15 years with Honeywell, Mr. Sim has held executive positions in general management, strategy, mergers and acquisitions. Prior to Honeywell, Mr. Sim worked at GE, where he was a Payload Director at NASA’s Mission Control Center in Houston.
Tom Surrette was named Executive Vice President of Human Resources in September 2008. After working at Philips/Signetics in software, test and product engineering roles, Mr. Surrette joined Cypress in July 1990 and has held a series of engineering, manufacturing and technical management, marketing and product development roles. Mr. Surrette has served as the Business Unit Director for Micropower SRAM and Synchronous SRAM, the Vice President for Non-Volatile Memory and the Sr. Vice President of Worldwide Operations. He served on the board of directors of Simtek Corporation.
Norman P. Taffe was named Executive Vice President of Consumer and Computation Division in 2005. Prior to his current position, Mr. Taffe has held numerous positions, including Marketing Director of the programmable logic and interface products divisions, Managing Director of our mergers and acquisitions and venture funds, Managing Director of the wireless business unit and most recently, Vice President of the Personal Communications Division. Mr. Taffe joined Cypress in 1989 and currently serves as a board member of the Second Harvest Food Bank.
Available Information
We make available our Annual Reports on Form 10-K, Quarterly Reports on Form 10-Q, Current Reports on Form 8-K and amendments to those reports filed or furnished pursuant to Section 13(a) or Section 15(d) of the Securities Exchange Act of 1934, as amended, free of charge on our website at www.cypress.com, as soon as reasonably practicable after they are electronically filed with or furnished to the Securities and Exchange Commission (“SEC”). Additionally, copies of materials filed by us with the SEC may be accessed at the SEC’s Public Reference Room at 100 F Street, N.E., Washington, D.C. 20549 or at www.sec.gov. For information about the SEC’s Public Reference Room, contact 1-800-SEC-0330.
17
Table of Contents
| ITEM 1A. | RISK FACTORS |
Current unfavorable economic and market conditions, domestically and internationally, may adversely affect our business, financial condition, results of operations and cash flows.
We have significant customer sales both in the U.S. and internationally. We are also reliant upon U.S. and international suppliers, manufacturing partners and distributors. We are therefore susceptible to adverse U.S. and international economic and market conditions, including the challenging economic conditions that have prevailed and continue to prevail in the U.S. and worldwide. The recent turmoil in the financial markets has resulted in dramatically higher borrowing costs which have made it more difficult (in some cases, prohibitively so) for many companies to obtain credit and fund their working capital obligations. If any of our manufacturing partners, customers, distributors or suppliers experiences serious financial difficulties or ceases operations, our business will be adversely affected. In addition, the adverse impact of the credit crisis on consumers, including higher unemployment rates, is expected to adversely impact consumer spending, which will adversely impact demand for consumer products such as certain end products in which our chips are embedded. In addition, prices of certain commodities, including oil, metals, grains and other food products, are volatile and are subject to fluctuations arising from changes in domestic and international supply and demand, labor costs, competition, market speculation, government regulations and periodic delays in delivery. High or volatile commodity prices increase the cost of doing business and adversely affect consumers’ discretionary spending. As a result of the difficulty that businesses (including our customers) may have in obtaining credit, the increasing and/or volatile costs of commodities and the decreased consumer spending that is the likely result of the credit market crisis, unemployment and commodities’ price volatility, continued global economic and market turmoil are likely to have an adverse impact on our business, financial condition, results of operations and cash flows.
The trading price of our common stock has been and will likely continue to be volatile due to various factors, some of which are beyond our control, and each of which could adversely affect our stockholders’ value.
The trading price of our common stock has been and will likely continue to be volatile due to various factors, some of which are beyond our control, including, but not limited to:
| Ÿ | quarterly variations in our results of operations or those of our competitors; |
| Ÿ | announcements by us or our competitors of acquisitions, new products, significant contracts, design wins, commercial relationships or capital commitments; |
| Ÿ | the perceptions of general market conditions in the semiconductor industry and global market conditions; |
| Ÿ | our ability to develop and market new and enhanced products on a timely basis; |
| Ÿ | any major change in our board or management; |
| Ÿ | changes in governmental regulations or in the status of our regulatory compliance; |
| Ÿ | recommendations by securities analysts or changes in earnings estimates concerning us or our customers or competitors; |
| Ÿ | announcements about our earnings or the earnings of our competitors that are not in line with analyst expectations; |
| Ÿ | the volume of short sales, hedging and other derivative transactions on shares of our common stock; |
| Ÿ | economic conditions and growth expectations in the markets we serve; and |
| Ÿ | general economic and credit conditions. |
Further, the stock market in general, and the market for technology companies in particular, have experienced extreme price and volume fluctuations. These broad market and industry factors may seriously harm the market price of our common stock, regardless of our actual operating performance. In the past, following periods of volatility in the overall market and the market price of a company’s securities, securities class action litigation has often been instituted against these companies. This litigation, if instituted against us, could result in substantial costs and a diversion of our management’s attention and resources.
18
Table of Contents
We face significant volatility in supply and demand conditions for our products, and this volatility, as well as any failure by us to accurately forecast future supply and demand conditions, could materially and negatively impact our business.
The semiconductor industry has historically been characterized by wide fluctuations in the demand for, and supply of, semiconductors. Demand for our products depends in large part on the continued growth of various electronics industries that use our products, including, but not limited to:
| Ÿ | wireless telecommunications equipment; |
| Ÿ | computers and computer-related peripherals; |
| Ÿ | memory and image sensors; |
| Ÿ | networking equipment and |
| Ÿ | consumer electronics including mobile handsets, automotive electronics and industrial controls. |
Any downturn or reduction in the growth of these industries could seriously harm our business, financial condition and results of operations.
We order materials and build our products based primarily on our internal forecasts, customer and distributor forecasts and secondarily on existing orders, which may be cancelled under many circumstances. Because our markets are volatile and subject to rapid technological and price changes, our forecasts may be wrongly causing us to make too many or too few of certain products.
Also, our customers frequently place orders requesting product delivery almost immediately after the order is made, which makes forecasting customer demand even more difficult, particularly when supply is abundant. If we experience inadequate demand or a significant shift in the mix of product orders that makes our existing capacity and capability inadequate, our fixed costs per semiconductor produced will increase, which will harm our financial condition and results of operations. Alternatively, if we should experience a sudden increase in demand, we will need to quickly ramp our inventory and/or manufacturing capacity to adequately respond to our customers. If we or our manufacturing partners are unable to ramp our inventory or manufacturing capacity in a timely manner or at all, we risk losing our customers’ business, which could have a negative impact on our financial performance and reputation.
In connection with our exit from our Texas facility, we completed a final build of a substantial volume of inventory for certain products previously manufactured at this facility totaling approximately $16.5 million net of sales through fiscal 2009. This inventory now represents our sole source of supply for certain products and is intended to meet forecasted demand for these products for periods ranging from 6 months to 15 years. To the extent that our forecasts of demand for any of these products prove to be inaccurate, we could be unable to meet customer demand and/or write-off significant quantities of obsolete inventory, either of which could adversely affect our business, financial condition and results of operations. For example, in the fourth quarter of 2009 based upon current economic conditions, we re-evaluated the demand forecast related to these long term builds and determined that an additional excess and obsolete write-down was required. As of January 3, 2010, the total excess and obsolete write-down recorded for this inventory was approximately $4.8 million.
Our business, financial condition and results of operations will be seriously harmed if we fail to compete successfully in our highly competitive industry and markets.
The semiconductor industry is intensely competitive. This intense competition results in a difficult operating environment that is marked by erosion of average selling prices over the life of each product and rapid technological change resulting in limited product life cycles. In order to offset selling price decreases, we attempt to decrease the manufacturing costs of our products and to introduce new, higher priced products that incorporate advanced features. If these efforts are not successful or do not occur in a timely manner, or if our newly introduced products do not gain market acceptance, our business, financial condition and results of operations could be seriously harmed.
19
Table of Contents
Our ability to compete successfully in the rapidly evolving semiconductor technology industry depends on many factors, including:
| Ÿ | our success in developing and marketing new products, software platforms and manufacturing technologies and bringing them to market on a timely basis; |
| Ÿ | the quality and price of our products; |
| Ÿ | the diversity of our product lines; |
| Ÿ | the cost effectiveness of our design, development, manufacturing, support and marketing efforts, especially as compared to our competitors; |
| Ÿ | our customer service and customer satisfaction; |
| Ÿ | our ability to successfully execute our flexible manufacturing initiative; |
| Ÿ | the pace at which customers incorporate our products into their systems, as is sometimes evidenced by design wins; |
| Ÿ | the number, strength and nature of our competitors, the markets they target and the rate of their technological advances; |
| Ÿ | general economic conditions; and |
| Ÿ | our access to and the availability of working capital. |
Although we believe we currently compete effectively in the above areas to the extent they are within our control, given the pace of change in the industry, our current abilities are not guarantees of future success. If we are unable to compete successfully in this environment, our business, financial condition and results of operations will be seriously harmed.
Our financial results could be adversely impacted if we fail to develop, introduce and sell new products or fail to develop and implement new technologies.
Like many semiconductor companies, which operate in a highly competitive, quickly changing environment marked by rapid obsolescence of existing products, our future success depends on our ability to develop and introduce new products that customers choose to buy. Our new products, for example PSoC3 and 5 and TrueTouch® are an important strategic focus for us and therefore, they tend to consume a significant amount of resources. The new products the market requires tend to be increasingly complex, incorporating more functions and operating at faster speeds than old products. Increasing complexity generally requires smaller features on a chip. This makes manufacturing new generation of products substantially more difficult than prior generations.
Despite the significant amount of resources we commit to new products, there can be no guarantee that such products will perform as expected or at all, be introduced on time to meet customer schedules or gain market acceptance. If we fail to introduce new product designs in a timely manner or are unable to manufacture products according to the requirements of these designs, or if our customers do not successfully introduce new systems or products incorporating our products, or market demand for our new products does not materialize as anticipated, our business, financial condition and results of operations could be materially harmed.
The complex nature of our manufacturing activities, our broad product portfolio, and our increasing reliance on third party manufacturers makes us highly susceptible to manufacturing problems and these problems can have a substantial negative impact on us if they occur.
Making semiconductors is a highly complex and precise process, requiring production in a tightly controlled, clean environment. Even very small impurities in our manufacturing materials, defects in the masks used to print circuits on a wafer or other problems in the wafer fabrication process can cause a substantial percentage of wafers to be rejected or numerous chips on each wafer to be non-functional. We and, similarly, our third party foundry partners, may experience problems in achieving an acceptable success rate in the manufacture of wafers and the likelihood of facing such difficulties is higher in connection with the transition to new manufacturing methods. The interruption of wafer fabrication or the failure to achieve acceptable manufacturing
20
Table of Contents
yields at any of our facilities, or the facilities of our third-party foundry partners, would seriously harm our business, financial condition and results of operations. We may also experience manufacturing problems in our assembly and test operations and in the introduction of new packaging materials.
We are increasingly dependent upon third-parties to manufacture, distribute, generate a significant portion of our sales, fulfill our customer orders and transport our products and problems in the performance or availability of these companies could seriously harm our financial performance.
Although a majority of our products were fabricated in our manufacturing facilities located in Minnesota and the Philippines, we rely to a significant extent on independent contractors to manufacture our products. We expect to increase this reliance on third party manufacturing in the future. For example, in December 2008, we substantially completed the exit of our manufacturing facility in Texas and transferred certain production to our more cost-competitive facility in Minnesota and outside foundries. In addition, if market demand for our products exceeds our internal manufacturing capacity and available capacity from our foundry partners, we may seek additional foundry manufacturing arrangements.
A shortage in foundry manufacturing capacity, which is more likely to occur at times of increasing demand, could hinder our ability to meet demand for our products and therefore adversely affect our operating results. In addition, greater demand for wafers produced by any such foundries without an offsetting increase in foundry capacity raises the likelihood of potential wafer price increases. Our operations would be disrupted if any of our foundry partners terminates its relationship with us or has financial issues and we are unable to arrange a satisfactory alternative to fulfill customer orders on a timely basis and in a cost-effective manner. However, there are only a few foundry vendors that have the capabilities to manufacture our most advanced products. If we engage alternative sources of supply, we may encounter start-up difficulties and incur additional costs. Also, shipments could be delayed significantly while these sources are qualified for volume production.
While a high percentage of our products are assembled, packaged and tested at our manufacturing facility located in the Philippines, we rely on independent subcontractors to assemble, package and test the balance of our products. We cannot be certain that these subcontractors will continue to assemble, package and test products for us on acceptable economic and quality terms or at all and it might be difficult for us to find alternatives if they do not do so.
Our channel partners include distributors and resellers. We continue to expand and change our relationships with our distributors and see an increase in the proportion of our revenues generated from our distributor channel in the future. Worldwide sales through our distributors accounted for 61.2% of our net sales during 2009. We rely on many distributors to assist us in creating customer demand, providing technical support and other value-added services to our customers, filling customer orders and stocking our products. We face ongoing business risks due to our reliance on our channel partners to create and maintain customer relationships where we have a limited or no direct relationship. Should our relationships with our channel partners or their effectiveness decline, we face the risk of declining demand which could affect our results of operations. Our contracts with our distributor may be terminated by either party upon notice. In addition, our distributors are located all over the world and are of various sizes and financial conditions. Any disruptions to our distributors’ operations such as lower sales, lower earnings, debt downgrades, the inability to access capital markets and higher interest rates could have an adverse impact on our business.
We also rely on independent carriers and freight haulers to move our products between manufacturing plants and our customers’ facilities. Transport or delivery problems due to their error or because of unforeseen interruptions in their business due to factors such as strikes, political instability, terrorism, natural disasters or accidents could seriously harm our business, financial condition and results of operations and ultimately impact our relationship with our customers.
21
Table of Contents
If our products contain defects, it could result in loss of future revenue, decreased market acceptance, injury to our reputation and product liability claims.
The programmability of our products, including PSoC products requires use of our proprietary software products. Our future success increasingly depends on our ability to develop and introduce new software products to enhance our programmable portfolio of products. Further, software products occasionally contain errors or defects, especially when they are first introduced or when new versions are released. Our semiconductor products also may contain defects which affect their performance. We cannot be certain that our products are currently or will be completely free of defects and errors. We could lose revenue as a result of product defects or errors. In addition, the discovery of a defect or error in a new version or product may result in the following consequences, among others:
| Ÿ | delayed shipping of the products; |
| Ÿ | delay in or failure to achieve market acceptance; |
| Ÿ | diversion of development resources; |
| Ÿ | damage to our reputation; |
| Ÿ | material product liability claims; and |
| Ÿ | increased service and warranty costs. |
As we gain market acceptance of our proprietary design software, we expect our software products to become more critical to our customers. Thus, a defect or error in our products could result in a significant disruption to our customers’ businesses. If we are unable to develop products that are free of defects or errors, our business, results of operations and financial condition could be harmed.
Any guidance that we may provide about our business or expected future results may differ significantly from actual results.
From time to time we have shared our views in press releases or SEC filings, on public conference calls and in other contexts about current business conditions and our expectations as to potential future results. Correctly identifying the key factors affecting business conditions and predicting future events is inherently an uncertain process especially in these very uncertain economic times. Our analyses and forecasts have in the past and, given the complexity and volatility of our business, will likely in the future, prove to be incorrect and could be materially incorrect. We offer no assurance that such predictions or analyses will ultimately be accurate, and investors should treat any such predictions or analyses with appropriate caution. Any analysis or forecast that we make which ultimately proves to be inaccurate may adversely affect our stock price.
We may be unable to protect our intellectual property rights adequately and may face significant expenses as a result of ongoing or future litigation.
The protection of our intellectual property rights, as well as those of our subsidiaries, is essential to keeping others from copying the innovations that are central to our existing and future products. It may be possible for an unauthorized third party to reverse-engineer or decompile our software products. The process of seeking patent protection can be long and expensive and we cannot be certain that any currently pending or future applications will actually result in issued patents, or that, even if patents are issued, they will be of sufficient scope or strength to provide meaningful protection or any commercial advantage to us. Furthermore, our flexible fab initiative requires us to enter into technology transfer agreements with external partners, providing third party access to our intellectual property and resulting in additional risk. In some cases, these technology transfer and/or license agreements are with foreign companies and subject our intellectual property to foreign countries which may afford less protection and/or result in increased costs to enforce such agreements. We anticipate that we will continue to enter into these kinds of licensing arrangements in the future. Consequently, we may become involved in litigation, in the United States or abroad, to enforce our patents or other intellectual property rights, to protect our trade secrets and know-how, to determine the validity or scope of the proprietary rights of others or to defend against claims of invalidity. We are also from time to time involved in litigation relating to alleged
22
Table of Contents
infringement by us of others’ patents or other intellectual property rights. Moreover, a key element of our strategy is to enter new markets with our products. If we are successful in entering these new markets, we will likely be subject to additional risks of potential infringement claims against us as our technologies are deployed in new applications and face new competitors. We may be unable to detect the unauthorized use of, or take appropriate steps to enforce, our intellectual property rights, particularly in certain international markets, making misappropriation of our intellectual property more likely. Patent litigation, if necessary or if and when instituted against us, could result in substantial costs and a diversion of our management’s attention and resources.
Intellectual property litigation is frequently expensive to both the winning party and the losing party and could take up significant amounts of management’s time and attention. In addition, if we lose such a lawsuit, a court could find that our intellectual property rights are invalid, enabling our competitors to use our technology, or require us to pay substantial damages and/or royalties or prohibit us from using essential technologies. For these and other reasons, this type of litigation could seriously harm our business, financial condition and results of operations. Also, although in certain instances we may seek to obtain a license under a third party’s intellectual property rights in order to bring an end to certain claims or actions asserted against us, we may not be able to obtain such a license on reasonable terms or at all.
We also rely on trade secret protection for our technology, in part through confidentiality agreements with our employees, consultants and third parties. However, these parties may breach these agreements and we may not have adequate remedies for any breach. In addition, the laws of certain countries in which we develop, manufacture or sell our products may not protect our intellectual property rights to the same extent as the laws of the United States.
If credit market conditions do not continue to improve or if they worsen, it could have a material adverse impact on our investment portfolio.
Recent U.S. sub-prime mortgage defaults and other financial, economic and credit issues have had a significant impact across various sectors of the financial markets, causing global credit and liquidity issues. If the global credit market does not continue to improve or if it deteriorates, our investment portfolio may be impacted and we could determine that some of our investments are impaired. This could materially adversely impact our results of operations and financial condition.
Our investment portfolio includes $32.7 million of auction rate securities which are investments with contractual maturities generally between 20 and 30 years. They are usually found in the form of municipal bonds, preferred stock, a pool of student loans or collateralized debt obligations with interest rates resetting every seven to 49 days through an auction process. At the end of each reset period, investors can sell or continue to hold the securities at par. The auction rate securities held by us are primarily backed by student loans and are over-collateralized, insured and guaranteed by the United States Federal Department of Education.
Since the fourth quarter of 2008 and as of January 3, 2010, 95% of our auction rate securities held by us were rated as either AAA or Aaa by the major independent rating agencies and approximately 5% of the student loan auction rate securities have been downgraded from AAA or Aaa to Baa3. The downgrade event was due to the higher rates the issuer is paying out versus the lending rates, which is preventing the issuer from building excess spread as required under the prospectus. If the financial market continues to deteriorate, future downgrades could potentially impact the rating of our auction rate securities.
As of January 3, 2010, all of our auction rate securities have experienced failed auctions due to sell orders exceeding buy orders. These failures are not believed to be a credit issue with the underlying investments, but rather caused by a lack of liquidity. Under the contractual terms, the issuer is obligated to pay penalty rates should an auction fail. In the event we need to access these funds associated with failed auctions, they are not expected to be accessible until one of the following occurs: a successful auction occurs, the issuer redeems the issue, a buyer is found outside of the auction process or the underlying securities have matured. Given these circumstances and the lack of liquidity, we have classified all of our auction rate securities totaling approximately $32.7 million as long-term investments as of January 3, 2010.
23
Table of Contents
During fiscal 2009, we performed analyses to assess the fair value of the auction rate securities and determined that a decline in value had occurred. As a result of our adoption of this new guidance in the second quarter of 2009, we reclassified the non-credit portion of the previously recognized other-than-temporary impairment losses related to our auction rate securities of $5.3 million from accumulated deficit to accumulated other comprehensive income (loss).
Unfavorable outcome of litigation pending against us could materially impact our business.
We are currently a party to various legal proceedings, claims, disputes and litigation. For example, we are defendants in purported consumer class action lawsuits alleging various claims under the Sherman Antitrust Act, state antitrust laws and unfair competition laws in the static random access memories (“SRAM”) markets. Our financial results could be materially and adversely impacted by unfavorable outcomes to any of these or other pending or future litigation. There can be no assurances as to the outcome of any litigation. Although we believe we have meritorious defenses to each of these matters and we intend to vigorously defend ourselves, such litigation and other claims are subject to inherent uncertainties and our view of these matters may change in the future. There exists the possibility of a material adverse impact on our financial position and the results of operations for the period in which the effect of an unfavorable final outcome becomes probable and reasonably estimable.
We face additional problems and uncertainties associated with international operations that could seriously harm us.
International revenues historically accounted for a significant portion of our total revenues. Our manufacturing, assembly, test operations and certain finance operations located in the Philippines, as well as our international sales offices and design centers, face risks frequently associated with foreign operations including but not limited to:
| Ÿ | currency exchange fluctuations; |
| Ÿ | the devaluation of local currencies; |
| Ÿ | political instability; |
| Ÿ | labor issues; |
| Ÿ | the impact of natural disasters on local infrastructures; |
| Ÿ | changes in local economic conditions; |
| Ÿ | import and export controls; |
| Ÿ | potential shortage of electric power supply; and |
| Ÿ | changes in tax laws, tariffs and freight rates. |
To the extent any such risks materialize, our business, financial condition or results of operations could be seriously harmed.
We compete with others to attract and retain key personnel, and any loss of, or inability to attract, such personnel would harm us.
To a greater degree than most non-technology companies, we depend on the efforts and abilities of certain key members of management and other technical personnel. Our future success depends, in part, upon our ability to retain such personnel and to attract and retain other highly qualified personnel, particularly product and process engineers. We compete for these individuals with other companies, academic institutions, government entities and other organizations. Competition for such personnel is intense and we may not be successful in hiring or retaining new or existing qualified personnel. From time to time we have effected restructurings which eliminate a number of positions. Even if such key personnel are not directly affected by the restructuring effort, such terminations can have a negative impact on morale and our ability to attract and hire new qualified personnel in the future. If we lose existing qualified personnel or are unable to hire new qualified personnel, as needed, our business, financial condition and results of operations could be seriously harmed.
24
Table of Contents
If the spin-off of SunPower does not qualify as a tax-free transaction, tax could be imposed on both our shareholders and us.
We received a private letter ruling from the U.S. Internal Revenue Service (“IRS”), that the spin-off of SunPower was eligible for tax-free treatment under Internal Revenue Code Section 355. In addition, we obtained an opinion of counsel on certain aspects of the spin-off assumed in the ruling. Both the IRS ruling and the opinion rely on certain representations, assumptions and undertakings, including those relating to the past and future conduct of SunPower’s and our business. The IRS could determine that the distribution should be treated as a taxable transaction if it determines that any of the representations, assumptions or undertakings that were included in the request for the private letter ruling are false or have been violated, or if it disagrees with the conclusions in the opinion on the matters not covered by the IRS private letter ruling. If the distribution fails to qualify for tax-free treatment, it will be treated as a material taxable distribution to our stockholders in an amount equal to the fair market value of SunPower’s equity securities (i.e., SunPower’s common stock issued to our stockholders) received by them. In addition, we would be required to recognize a material gain in an amount up to the fair market value of the SunPower equity securities that we distributed on the distribution date.
Furthermore, subsequent events, some of which are not in our control, could cause us to recognize gain on the distribution. For example, acquisitions of our equity securities or SunPower’s equity securities that are deemed by the IRS to be part of a plan or a series of related transactions that include the distribution could cause us to recognize gain on the distribution. Although certain provisions of our tax sharing agreement with SunPower are intended to reduce the likelihood that SunPower will knowingly take actions harmful to the ruling or indemnify us for certain of its actions, there can be no assurance that such provisions will mitigate or eliminate any possible tax risks or that SunPower would have the resources to satisfy any indemnity obligations. In addition, these restrictions could under certain circumstances, limit our flexibility to undertake financings, acquisitions, stock repurchases or other transactions involving our stock which might otherwise be beneficial to us.
We are subject to many different environmental, health and safety laws, regulations and directives, and compliance with them may be costly.
We are subject to many different international, federal, state and local governmental laws and regulations related to, among other things, the storage, use, discharge and disposal of toxic, volatile or otherwise hazardous chemicals used in our manufacturing process and the health and safety of our employees. Compliance with these regulations can be costly. We cannot assure you that we have been, or will be at all times in complete compliance with such laws and regulations. If we violate or fail to comply with these laws and regulations, we could be fined or otherwise sanctioned by the regulators. Under certain environmental laws, we could be held responsible, without regard to fault, for all of the costs relating to any contamination at our or our predecessors’ past or present facilities and at third party waste disposal sites. We could also be held liable for any and all consequences arising out of human exposure to such substances or other environmental damage. For example, certain liabilities could also arise in connection with the shutdown activities related to our Texas manufacturing facility. While we are taking reasonable steps to ensure the Texas facility closure complies with all applicable federal, state and local environmental laws, the shutdown process is complicated, and if issues were to arise, they could delay the sale of certain of the facilities and manufacturing equipment.
Over the last several years, there has been increased public awareness of the potentially negative environmental impact of semiconductor manufacturing operations. This attention and other factors may lead to changes in environmental regulations that could force us to purchase additional equipment or comply with other potentially costly requirements. If we fail to control the use of, or to adequately restrict the discharge of, hazardous substances under present or future regulations, we could face substantial liability or suspension of our manufacturing operations, which could seriously harm our business, financial condition and results of operations.
We face increasing complexity in our product design as we adjust to new and future requirements relating to the material composition of our products, including the restrictions on lead and other hazardous substances that
25
Table of Contents
apply to specified electronic products put on the market in the European Union (Restriction on the Use of Hazardous Substances Directive 2002/95/EC, also known as the “RoHS Directive”) and similar legislation in China and California. Other countries, including at the federal and state levels in the United States, are also considering laws and regulations similar to the RoHS Directive. Certain electronic products that we maintain in inventory may be rendered obsolete if they are not in compliance with the RoHS Directive or similar laws and regulations, which could negatively impact our ability to generate revenue from those products. Our customers and other companies in the supply chain may require us to certify that our products are RoHS compliant. Although we cannot predict the ultimate impact of any such new laws and regulations, they will likely result in additional costs or decreased revenue, and could require that we redesign or change how we manufacture our products.
Our operations and financial results could be severely harmed by certain natural disasters.
Our headquarters in California, manufacturing facilities in the Philippines and some of our major vendors’, subcontractors’ and strategic partners’ facilities are located near major earthquake faults or are subject to seasonal typhoons or other extreme weather conditions. We have not been able to maintain insurance coverage at reasonable costs to address the risks posed by potential natural disasters. Instead, we rely on self-insurance and preventative/safety measures. If a major earthquake or other natural disaster occurs, we may need to spend significant amounts to repair or replace our facilities and equipment, or make alternative arrangements in the event a vendor, subcontractor or partner’s facility or equipment was damaged, and we could suffer damages that could seriously harm our business, financial condition and results of operations.
The failure to integrate our business and technologies with those of companies that we acquire could adversely affect our financial results.
We have made acquisitions and pursued other strategic relationships in the past and may pursue additional acquisitions in the future. If we fail to integrate these businesses successfully, our financial results may be seriously harmed. Integrating these businesses, people, products and services with our existing business could be expensive, time-consuming and a strain on our resources. Specific issues that we face with regard to prior and future acquisitions include:
| Ÿ | integrating acquired technology or products; |
| Ÿ | integrating acquired products into our manufacturing facilities; |
| Ÿ | integrating different accounting policies and methodologies; |
| Ÿ | assimilating and retaining the personnel of the acquired companies; |
| Ÿ | overcoming cultural and operational differences that may arise between two companies; |
| Ÿ | coordinating and integrating geographically dispersed operations; |
| Ÿ | our ability to retain customers of the acquired company; |
| Ÿ | the potential disruption of our and our suppliers’ ongoing business and distraction of management; |
| Ÿ | the maintenance of brand recognition of acquired businesses; |
| Ÿ | the failure to successfully develop acquired in-process technology, resulting in the impairment of amounts currently capitalized as intangible assets; |
| Ÿ | unanticipated expenses related to technology integration; |
| Ÿ | the development and maintenance of uniform standards, controls, procedures and policies; |
| Ÿ | the impairment of relationships with employees and customers as a result of any integration of new management personnel; and |
| Ÿ | the potential unknown liabilities associated with acquired businesses. |
We maintain self-insurance for certain indemnities we have made to our officers and directors.
Our certificate of incorporation, by-laws and indemnification agreements require us to indemnify our officers and directors for certain liabilities that may arise in the course of their service to us. We self-insure with
26
Table of Contents
respect to these indemnifiable claims. If we were required to pay a significant amount on account of these liabilities for which we self-insure, our business, financial condition and results of operations could be seriously harmed.
We may utilize debt financing and such indebtedness could adversely affect our business, financial condition, results of operations, earnings per share and our ability to meet our payment obligations.
We routinely incur indebtedness to finance our operations and at times we have had significant amounts of outstanding indebtedness and substantial debt service requirements. Our ability to meet our payment and other obligations under our indebtedness depends on our ability to generate significant cash flow. This, to some extent, is subject to general economic, financial, competitive, legislative and regulatory factors as well as other factors that are beyond our control. There is no assurance that our business will generate cash flow from operations, or that future borrowings will be available to us under our existing or any amended credit facilities or otherwise, in an amount sufficient to enable us to meet payment obligations under indebtedness we may under take from time to time. If we are not able to generate sufficient cash flow to service our debt obligations, we may need to refinance or restructure our debt, sell assets, reduce or delay capital investments, or seek to raise additional capital. If we are unable to implement one or more of these alternatives, we may not be able to meet our payment obligations under any indebtedness we owe. As of January 3, 2010, we had no debt outstanding.
If Grace Semiconductor Manufacturing Corporation were to default on the leases we have guaranteed on their behalf, our financial condition could be harmed.
As of January 3, 2010, we were continuing to serve as guarantor for approximately $9.1 million in lease payments due by Grace Semiconductor Manufacturing Corporation, a strategic foundry of Cypress. In conjunction with the master lease agreement, we have entered into a series of guarantees with a financing company for the benefit of Grace. If Grace fails to pay any of the quarterly rental payments, we will be obligated to pay such outstanding amounts within 10 days of a written demand from the financing company. If we fail to pay such amount, interest will accrue at a rate of 9% per annum on any unpaid amounts. To date, we have not been required to make any payments under these guarantees. However, if Grace were to default on the leases, it could have a negative impact on our financial position and results of operations.
We have implemented and will implement future new Oracle-based applications to manage our worldwide financial, accounting and operations reporting, and disruptions in such tools could adversely affect the integrity of our financial data and our business generally.
We have implemented various Oracle-based tools, including but not limited to, a trade management system. We have taken what we believe are appropriate measures and performed testing to ensure the successful and timely implementation. However, implementations of this scope have inherent risks that in the extreme could lead to a disruption in our financial, accounting and operations reporting as well as the inability to obtain access to key financial data, any of which would materially and adversely affect our business.
Changes in U.S. tax legislation regarding our foreign earnings could materially impact our business.
A majority of our revenue is generated from customers located outside the U.S. and a substantial portion of our assets, including employees, are located outside the U.S. U.S. income taxes and foreign withholding taxes have not been provided on undistributed earnings for certain non-U.S. subsidiaries, because such earnings are intended to be indefinitely reinvested in the operations of those subsidiaries. The administration has recently announced initiatives could substantially reduce our ability to defer U.S. taxes including: limitations on deferral of U.S. taxation of foreign earnings, eliminate utilization or substantially reduce our ability to claim foreign tax credits, and eliminate various tax deductions until foreign earnings are repatriated to the U.S. If any of these proposals are constituted into law, they could have a negative impact on our financial position and results of operations.
27
Table of Contents
We are subject to examination by the U.S. Internal Revenue Service (the “IRS”), and from time to time we are subject to income tax audits or similar proceedings in other jurisdictions in which we do business, and as a result we may incur additional costs and expenses or owe additional taxes, interest and penalties which will negatively impact our operating result.
We are subject to income taxes in the U.S. and certain foreign jurisdictions, and our determination of our tax liability is subject to review by applicable domestic and foreign tax authorities. For example, we are under examination of certain of our fiscal years by the IRS. The results of these audits are subject to significant uncertainty and could result in our having to pay additional amounts to the applicable tax authority. This would result in a decrease of our current estimate of unrecognized tax benefits or increase of actual tax liabilities which could negatively impact our financial position, results of operations and cash flows.
The accumulation of changes in our shares by “5-percent stockholders” could trigger an ownership change for U.S. income tax purposes, in which case our ability to utilize our net operating losses would be limited and therefore impact our future tax benefits.
Cypress is a publicly traded company whose stockholders change on a daily basis (during normal trading hours). These changes are beyond our control. The U.S. Internal Revenue Code (Section 382) restricts a company’s ability to benefit from net operating loses if a “Section 382 Ownership Change” occurs. An ownership change for purposes of U.S. tax law Section 382 may result from ownership changes that increase the aggregate ownership of “5-percent stockholders,” by more than 50 percentage points over a testing period, generally three years (“Section 382 Ownership Change”). To our knowledge, we have not experienced a Section 382 Ownership Change. We cannot give any assurance that we will not experience a Section 382 Ownership Change in future years.
Our ability to add or replace distributors is limited.
Our distributors are contracted by us to perform two primary, yet distinct, functions that are difficult to replace:
| Ÿ | distributors provide logistics support, such as order entry, credit, forecasting, inventory management, and shipment of product, to end customers. The process of integrating systems to allow for electronic data interchange is complex and can be time consuming. |
| Ÿ | distributors create demand for our products at the engineering level. This mandates the training of an extended distributor sales force, as well as hiring and training specialized applications engineers skilled in promoting and servicing products at the engineering level. |
In addition, our distributors’ expertise in the determination and stocking of acceptable inventory levels may not be easily transferable to a new distributor. Also, end customers may be hesitant to accept the addition or replacement of a distributor.
| ITEM 1B. | UNRESOLVED STAFF COMMENTS |
None.
28
Table of Contents
| ITEM 2. | PROPERTIES |
Our executive offices are located in San Jose, California. The following tables summarize our primary properties as of the end of fiscal 2009:
| Location |
Square Footage | Primary Use | ||
| Owned: |
||||
| United States: |
||||
| San Jose, California |
310,000 | Administrative offices, research and development | ||
| Bloomington, Minnesota |
337,000 | Manufacturing, research and development | ||
| Round Rock, Texas |
100,000 | Property held for sale | ||
| Lynnwood, Washington |
67,000 | Administrative offices, research and development | ||
| Asia: |
||||
| Cavite, Philippines |
221,000 | Manufacturing, research and development | ||
| Leased: |
||||
| Asia: |
||||
| Bangalore, India |
170,000 | Research and development | ||
| Hyberabad, India |
13,000 | Research and development | ||
| Shanghai, China |
29,000 | Research and development | ||
| Europe: |
||||
| Mechelen, Belgium |
23,000 | Administrative offices, research and development |
During fiscal 2008 as part of a restructuring plan, we exited our manufacturing facility in Round Rock, Texas. We expect to complete the sale of the manufacturing equipment and the facility in fiscal 2010. The property was classified as held for sale as of January 3, 2010. See Note 11 of Notes to Consolidated Financial Statements under Item 8 for further discussion.
We have additional leases for sales offices and design centers located in the United States, Asia and Europe. We believe that our current properties are suitable and adequate for our foreseeable needs. We may need to exit facilities as we continue to evaluate our business model and cost structure.
| ITEM 3. | LEGAL PROCEEDINGS |
In October 2006, the Company received a subpoena related to the Antitrust Division of the Department of Justice (“DOJ”)’s investigation into the SRAM market. In December 2008, the DOJ closed its two year investigation without any charge or allegation brought against the Company. As a result of the DOJ’s investigation, in October 2006, we, along with a majority of the other SRAM manufacturers, were named in numerous consumer class action suits that are now consolidated in the U.S. District Court for the Northern District of California. Despite the fact that the DOJ’s investigation was closed without any allegation or charge brought against the Company, the civil cases remain active. The cases variously allege claims under the Sherman Antitrust Act and various state antitrust laws. The lawsuits seek restitution, injunction and damages in an unspecified amount. Direct and indirect purchaser classes have been certified, although the indirect purchaser class decision is currently up for appeal. Trial is tentatively scheduled for January 2011. The Company was also named in purported consumer antitrust class action suits in three provinces of Canada; however, those cases have not been materially active over the last two years. We believe we have meritorious defenses to these allegations asserted in these various cases and we intend to vigorously defend ourselves in each of these matters.
In May 2004, the Company was among four parties to be named in a trade secret misappropriation litigation filed by Silvaco Data Systems in Santa Clara, California Superior Court. On February 10, 2009, summary judgment was granted in our favor in this matter. Silvaco has appealed our victory. As of the date of this filing, the appeal has not been heard by the Court of Appeals. We believe we have meritorious defenses to these allegations and will vigorously defend ourselves in this matter.
29
Table of Contents
On August 21, 2009, X-Point Technologies filed a single patent infringement case against us and 29 other defendants in the U.S. District Court in Delaware. The patent at issue covers X-Point’s technology for data transfer between storage devices and network devices without the use of a CPU or memory. X-Point has made no specific demand for relief in this matter. We believe we have meritorious defenses to the allegations set forth in the complaint and will vigorously defend ourselves in this matter.
We are currently a party to various other legal proceedings, claims, disputes and litigation arising in the ordinary course of business. Based on the our own investigations, we believe the ultimate outcome of our current legal proceedings, individually and in the aggregate, will not have a material adverse effect on our financial position, results of operation or cash flows. However, because of the nature and inherent uncertainties of the litigation, should the outcome of these actions be unfavorable, our business, financial condition, results of operations or cash flows could be materially and adversely affected.
| ITEM 4. | [RESERVED] |
30
Table of Contents
| ITEM 5. | MARKET FOR REGISTRANT’S COMMON EQUITY, RELATED STOCKHOLDER MATTERS AND ISSUER PURCHASES OF EQUITY SECURITIES |
Market Information, Holders of Common Equity, Dividends and Performance Graph
Effective November 12, 2009, our common stock is listed on the NASDAQ Global Select Market under the trading symbol “CY.” Prior to November 12, 2009, our common stock was listed on the New York Stock Exchange. The following table sets forth the high and low per share prices for our common stock:
| Low | High | ||||||
| Fiscal 2009: |
|||||||
| Fourth quarter |
$ | 8.43 | $ | 10.79 | |||
| Third quarter |
$ | 8.61 | $ | 11.27 | |||
| Second quarter |
$ | 6.74 | $ | 9.33 | |||
| First quarter |
$ | 3.87 | $ | 6.94 | |||
| Fiscal 2008: |
|||||||
| Fourth quarter |
$ | 2.72 | * | $ | 19.52 | ||
| Third quarter |
$ | 22.50 | $ | 32.42 | |||
| Second quarter |
$ | 23.61 | $ | 30.57 | |||
| First quarter |
$ | 18.79 | $ | 36.03 | |||
| * | On September 29, 2008, the first day of our fourth quarter of fiscal 2008, we completed the spin-off of SunPower through a tax-free distribution of 42.0 million shares of SunPower Class B common stock to our shareholders. Market prices presented in the tables above are unadjusted and include the value of the SunPower business until September 29, 2008. |
As of February 24, 2010, there were approximately 1,622 holders of record of our common stock
We have not paid cash dividends and have no present plans to do so but may in the future.
31
Table of Contents
The following line graph compares the yearly percentage change in the cumulative total stockholder return on our common stock against the cumulative total return of the Standard and Poor (“S&P”) 500 Index and the S&P Semiconductors Index for the last five fiscal years:
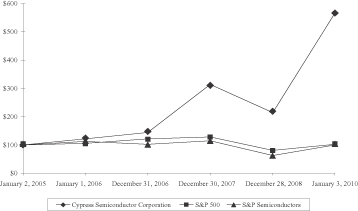
| January 2, 2005 |
January 1, 2006 |
December 31, 2006 |
December 30, 2007 |
December 28, 2008 |
January 3, 2010 |
|||||||||||||
| Cypress* |
$100 | $121 | $144 | $314 | $214 | $566 | ||||||||||||
| S&P 500 Index |
$100 | $105 | $121 | $128 | $81 | $102 | ||||||||||||
| S&P Semiconductors Index |
$100 | $112 | $102 | $114 | $62 | $100 |
| * | All closing prices underlying this table have been adjusted for stock splits and stock dividends including the SunPower spin. |
Securities Authorized for Issuance under Equity Compensation Plans
Equity Compensation Plan Information:
The following table summarizes certain information with respect to our common stock that may be issued under the existing equity compensation plans as of January 3, 2010:
| Plan Category |
Number of Securities to be Issued Upon Exercise of Outstanding Options (a) |
Weighted-Average Exercise Price of Outstanding Options (b) |
Number of Securities Remaining Available for Future Issuance Under Equity Compensation Plans (Excluding Securities Reflected in Column (a)) (c) |
|||||||
| (In thousands, except per-share amounts) | ||||||||||
| Equity compensation plans approved by shareholders |
52,500 | (1) | $ | 4.18 | (3) | 20,900 | (2) | |||
| Equity compensation plans not approved by shareholders |
17,600 | $ | 5.74 | — | ||||||
| Total |
70,100 | $ | 4.70 | (3) | 20,900 | |||||
| (1) | Includes 17.7 million shares of restricted stock units and restricted stock awards granted. |
| (2) | Includes 14.8 million shares available for future issuance under Cypress’s 1994 Amended Stock Option Plan and 6.1 million shares available for future issuance under Cypress’s Employee Stock Purchase Plan. |
| (3) | Excludes impact of 17.7 million shares of restricted stock units and restricted stock which have no exercise price. |
32
Table of Contents
See Note 9 of Notes to Consolidated Financial Statements under Item 8 for further discussion of Cypress’s stock plans.
Recent Sales of Unregistered Securities
None.
Purchases of Equity Securities by the Issuer and Affiliated Purchasers
Stock Repurchase Program:
In fiscal 2007, the Board of Directors (the “Board”) authorized a stock repurchase program of up to $300.0 million. In fiscal 2008, the Board approved an additional $300.0 million, bringing the total amount that may have been used for stock purchases to $600.0 million under the stock repurchase program. The stock repurchase program was in addition to the accelerated share repurchase program associated with the 1.00% Notes.
During fiscal 2008, we used $375.6 million in cash to repurchase a total of approximately 37.1 million shares at an average share price of $10.13. Approximately 12.6 million shares of this repurchase occurred prior to the Spin-Off at an average stock price of $21.95. The remaining 24.5 million shares were purchased after the Spin-Off at an average price of $4.03.
During fiscal 2009, we used $46.3 million to repurchase approximately 5.8 million shares at an average share price of $8.00. In light of certain tax constraints placed on us in connection with the tax-free spin of SunPower, we had no current intentions of repurchasing additional stock under the existing program. Accordingly, on October 28, 2009, the Audit Committee of the Board voted to rescind the remaining $178.1 million available under the program for additional repurchases.
The following table sets forth information with respect to repurchases of our common stock made during the fourth quarter of fiscal 2009:
| Periods |
Total Number of Shares Purchased |
Average Price Paid per Share |
Total Number of Shares Purchased as Part of Publicly Announced Programs |
Total Dollar Value of Shares That May Yet Be Purchased Under the Plans or Programs | ||||||
| (In thousands, except per-share amounts) | ||||||||||
| September 28, 2009—October 25, 2009 |
3,691 | $ | 9.52 | 3,691 | $ | — | ||||
| October 26, 2009—November 22, 2009 |
— | $ | — | — | $ | — | ||||
| November 23, 2009—January 3, 2010 |
— | $ | — | — | $ | — | ||||
| As of January 3, 2010 |
3,691 | $ | — | 3,691 | $ | — | ||||
On October 28, 2009 the Audit Committee also approved a yield enhancement strategy intended to improve the yield on our available non-strategic cash. As part of this program, the Audit Committee authorized us to enter into short-term yield enhanced structured agreements correlated to our stock price. In one such structure, we pay a fixed sum of cash upon execution of an agreement in exchange for the financial institution’s obligations to pay either a pre-determined amount of cash or shares of our common stock depending on the closing market price of our common stock on the expiration date of the agreement. Upon expiration of each agreement, if the closing market price of our common stock is above the pre-determined price, we will have our cash investment returned plus a yield substantially above the yield currently available for short-term cash investments. If the closing market price is at or below the pre-determined price, we will receive the number of shares specified at the agreement’s inception. As the outcome of these arrangements is based entirely on our stock price and does not require us to deliver either shares or cash, other than the original investment, the entire transaction is recorded in equity.
33
Table of Contents
The decision to enter into a yield enhanced structured agreement is based upon a comparison of the yields available in the financial markets for similar maturities against the expected yield to be realized per the structured agreement and the related risks associated with this type of arrangement. We believe the risk associated with these types of agreements is no different than alternative investments available to us with equivalent counterparty credit ratings. All counterparties to a yield enhancement program have a credit rating of at least Aa2 or A as rated by major independent rating agencies. For all such agreements that matured in the fourth quarter of fiscal 2009, the yields of the structured agreements were far superior to the yields available in the financial markets primarily due to the volatility of our stock price and the pre-payment aspect of the agreements. The counterparty is willing to pay a premium over the yields available in the financial markets due to the structure of the agreement.
In the fourth quarter of fiscal 2009, we entered into short-term yield enhanced structured agreements totaling $68.0 million with maturities of 30 days or less. We settled these agreements in the fourth quarter of fiscal 2009 and received $69.1 million in cash. In February 2010, we entered into two additional short-term yield enhanced structured agreements with maturities of 30 days or less totaling $98.0 million. Upon settlement of these agreements, we expect to receive $101.4 million in cash. However if upon settlement of the agreements our stock price is at or below the pre-determined price, we will receive 9.0 million shares of our common stock.
| ITEM 6. | SELECTED FINANCIAL DATA |
Our historical consolidated financial statements have been restated to account for SunPower as discontinued operations and the retrospective application of adopting new guidance on accounting for convertible debt instruments that may be settled in cash upon conversion for and new guidance on presentation for noncontrolling interests in consolidated financial statements. Accordingly, we have reflected the results of operations of SunPower prior to the Spin-Off as discontinued operations in the Consolidated Statement of Operations Data. The assets, liabilities and minority interest related to SunPower were reclassified and reflected as discontinued operations in the Consolidated Balance Sheet Data.
During the third quarter of 2009, we identified historically immaterial errors related to the value of our raw material inventory balances located in the Philippines. We assessed the materiality of these errors on prior period financial statements and concluded that the errors were not material to any prior annual or interim periods but the cumulative error would be material in the third quarter of fiscal 2009, if the entire correction was recorded in the third quarter. Accordingly, we have revised certain prior year amounts and balances to allow for the correct recording of these transactions. See Note 2 of Notes to Consolidated Financial Statements under Item 8 for a detailed discussion.
In addition, certain prior year balances have been restated to conform to current year presentation, including the retrospective application of adopting new accounting guidance. Under ASC 470, the liability and equity components of convertible debt instruments that may be settled wholly or partially in cash upon conversion must be accounted for separately in a manner reflective of our nonconvertible debt borrowing rate. Previous guidance provided for accounting for this type of convertible debt instrument entirely as debt. The requirements under ASC 810 provide that income (loss) shall be presented for both noncontrolling interests and amounts attributable to Cypress. We have retrospectively applied these changes for all periods presented.
34
Table of Contents
The following selected consolidated financial data is not necessarily indicative of results of future operations, and should be read in conjunction with Management’s Discussion and Analysis of Financial Condition and Results of Operations under Item 7, and the Consolidated Financial Statements and Notes to Consolidated Financial Statements under Item 8:
| Year Ended | ||||||||||||||||||||
| January 3, 2010 |
December 28, 2008 |
December 30, 2007 |
December 31, 2006 (1)(2) |
January 1, 2006 (1)(2) |
||||||||||||||||
| (In thousands, except per-share amounts) | ||||||||||||||||||||
| Consolidated Statement of Operations Data: |
||||||||||||||||||||
| Revenues |
$ | 667,786 | $ | 765,716 | $ | 821,597 | $ | 855,043 | $ | 807,660 | ||||||||||
| Cost of revenues |
$ | 397,204 | $ | 426,284 | $ | 448,847 | $ | 451,195 | $ | 460,319 | ||||||||||
| Operating income (loss) |
$ | (149,255 | ) | $ | (471,433 | ) | $ | 6,433 | $ | 6,285 | $ | (81,364 | ) | |||||||
| Gain on sale of SunPower common stock |
$ | — | $ | 192,048 | $ | 373,173 | $ | — | $ | — | ||||||||||
| Income (loss) from continuing operations |
$ | (150,424 | ) | $ | (319,262 | ) | $ | 366,862 | $ | (7,396 | ) | $ | (101,364 | ) | ||||||
| Income (loss) from discontinued operations attributable to Cypress |
$ | — | $ | 34,386 | $ | 16,057 | $ | 20,466 | $ | (15,527 | ) | |||||||||
| Income (loss) from discontinued operations—noncontrolling interest, net of taxes |
$ | — | $ | 34,154 | $ | 12,681 | $ | 6,373 | $ | 273 | ||||||||||
| Noncontrolling interest, net of income taxes |
$ | (946 | ) | $ | (311 | ) | $ | (19 | ) | $ | (4 | ) | $ | (2 | ) | |||||
| Net income (loss) |
$ | (151,370 | ) | $ | (251,033 | ) | $ | 395,581 | $ | 19,439 | $ | (116,620 | ) | |||||||
| Less net income (loss) attributable to noncontrolling interest |
$ | 946 | $ | (33,843 | ) | $ | (12,662 | ) | $ | (6,369 | ) | $ | (271 | ) | ||||||
| Net income (loss) attributable to Cypress |
$ | (150,424 | ) | $ | (284,876 | ) | $ | 382,919 | $ | 13,070 | $ | (116,891 | ) | |||||||
| Net income (loss) per share—basic: |
||||||||||||||||||||
| Continuing operations attributable to Cypress |
$ | (1.03 | ) | $ | (2.12 | ) | $ | 2.36 | $ | (0.05 | ) | $ | (0.76 | ) | ||||||
| Discontinued operations attributable to Cypress |
— | 0.23 | 0.10 | 0.14 | (0.11 | ) | ||||||||||||||
| Net income (loss) per share—basic |
$ | (1.03 | ) | $ | (1.89 | ) | $ | 2.46 | $ | 0.09 | $ | (0.87 | ) | |||||||
| Net income (loss) per share—diluted: |
||||||||||||||||||||
| Continuing operations attributable to Cypress |
$ | (1.03 | ) | $ | (2.12 | ) | $ | 2.13 | $ | (0.05 | ) | $ | (0.76 | ) | ||||||
| Discontinued operations attributable to Cypress |
— | 0.23 | 0.10 | 0.14 | (0.11 | ) | ||||||||||||||
| Net income (loss) per share—diluted |
$ | (1.03 | ) | $ | (1.89 | ) | $ | 2.23 | $ | 0.09 | $ | (0.87 | ) | |||||||
| Shares used in per-share calculation: |
||||||||||||||||||||
| Basic |
145,611 | 150,447 | 155,559 | 140,809 | 133,188 | |||||||||||||||
| Diluted |
145,611 | 150,447 | 171,836 | 146,223 | 133,188 | |||||||||||||||
| As of | ||||||||||||||||||||
| January 3, 2010 |
December 28, 2008 |
December 30, 2007 (1)(2) |
December 31, 2006 (1)(2) |
January 1, 2006 (1)(2) |
||||||||||||||||
| (In thousands) | ||||||||||||||||||||
| Consolidated Balance Sheet Data: |
||||||||||||||||||||
| Cash, cash equivalents and short-term investments |
$ | 299,642 | $ | 237,792 | $ | 1,035,738 | $ | 398,082 | $ | 186,716 | ||||||||||
| Working capital |
$ | 279,643 | $ | 241,370 | $ | 618,012 | $ | 674,304 | $ | 433,847 | ||||||||||
| Total assets |
$ | 912,508 | $ | 928,732 | $ | 3,744,352 | $ | 2,120,507 | $ | 1,695,356 | ||||||||||
| Debt |
$ | — | $ | 27,023 | $ | 549,517 | $ | 557,072 | $ | 532,185 | ||||||||||
| Stockholders’ equity |
$ | 630,384 | $ | 638,427 | $ | 1,817,274 | $ | 1,084,998 | $ | 823,684 | ||||||||||
| Total assets of discontinued operations |
$ | — | $ | — | $ | 1,666,339 | $ | 573,927 | $ | 322,264 | ||||||||||
| Total liabilities of discontinued operations |
$ | — | $ | — | $ | 721,155 | $ | 85,181 | $ | 63,613 | ||||||||||
| (1) | The year ended December 31, 2007 includes an adjustment that results in a decrease to our inventory balances of $5.5 million and an adjustment to accumulated deficit of the same amount. The year ended December 31, 2006 includes a $1.2 million increase to cost of revenues, a decrease in the amount of $2.5 million to inventories and an increase to accumulated deficit by the same amount. The year ended January 1, 2006 includes a $1.3 million increase to cost of revenues, a decrease in the amount of $1.3 million to inventories and an increase to accumulated deficit by the same amount. Refer to Note 2. |
| (2) | The year ended December 31, 2007 includes retrospective application of the new accounting guidance relating to debt to decrease total assets by $6.4 million and convertible notes by $50.5 million and increase stockholders’ equity by $46.0 million. The year ended December 31, 2006 includes additional interest expense (including amortization of debt issuance costs) of $19.7 million, increase to interest income and other income (expense), net of $5.5 million, decrease to basic net income per share of $0.19, decrease to diluted net income per share of $0.17, increase to additional paid in capital of $80.8 million and an increase to accumulated deficit of $80.8 million. The year ended January 1, 2006 includes additional interest expense (including amortization of debt issuance costs) of $23.5 million, decrease to basic and diluted net income per share of $0.18, increase to additional paid in capital of $55.6 million and an increase to accumulated deficit of $55.6 million. Refer to Note 9. |
35
Table of Contents
| ITEM 7. | MANAGEMENT’S DISCUSSION AND ANALYSIS OF FINANCIAL CONDITION AND RESULTS OF OPERATIONS |
The Management’s Discussion and Analysis of Financial Condition and Results of Operations contain forward-looking statements within the meaning of Section 27A of the Securities Act of 1933, as amended, and Section 21E of the Securities Exchange Act of 1934, as amended, that involve risks and uncertainties, which are discussed under Item 1A.
EXECUTIVE SUMMARY
General
Our mission is to continue the transformation of Cypress Semiconductor Corporation (“Cypress”) into a leading supplier of proprietary and programmable solutions in systems everywhere. We deliver high-performance, mixed-signal, programmable solutions that provide customers with integration, rapid time-to-market and system value. Our offerings include Programmable System-on-Chip (“PSoC®”) products, capacitive sensing and touchscreen solutions, universal serial bus (“USB”) controllers, and general-purpose programmable clocks and memories. We also provide wired and wireless connectivity solutions, including, respectively, West Bridge® controllers, which enhance performance in multimedia handsets, and the CyFi low-power RF solution, offering unmatched reliability, simplicity and power-efficiency. We also offer a wide portfolio of static random access memories, nonvolatile memories and image sensor products. We serve numerous markets including consumer, computation, data communications, automotive, medical, industrial and white goods.
As of the end of fiscal 2009, our organization included the following business segments:
| Business Segments |
Description | |
| Consumer and Computation Division | A product division focusing on PSoC, USB and timing solutions. | |
| Data Communications Division | A product division focusing on data communication devices for wireless handset and professional / personal video systems. | |
| Memory and Imaging Division | A product division focusing on static random access memories, nonvolatile memories and image sensor products. | |
| Emerging Technologies and Other | Includes Cypress Envirosystems and AgigA Tech, Inc., both majority-owned subsidiaries of Cypress, the Optical Navigation Systems (“ONS”) business unit, China business unit, foundry-related services and certain corporate expenses. | |
SunPower
On September 29, 2008, the first day of our fourth quarter of fiscal 2008, we completed the distribution of all of our 42.0 million shares of SunPower Class B common stock to our stockholders (the “Spin-Off”). The distribution was made pro rata to our stockholders of record as of the close of trading on September 17, 2008. As a result of the Spin-Off, each stockholder received approximately 0.274 of a share of SunPower Class B common stock for each share of our common stock held by such stockholder. The market value of the distribution was approximately $2.6 billion based on the closing price of SunPower common stock on September 29, 2008.
We received a favorable ruling from the Internal Revenue Service in April 2008 with respect to certain tax issues arising under Section 355 of the Internal Revenue Code in connection with the Spin-Off. The distribution was structured to be tax-free to us and our stockholders for U.S. federal income tax purposes, except in respect to cash received in lieu of fractional shares.
36
Table of Contents
Discontinued Operations Attributable to Cypress:
Our historical consolidated financial statements have been recast to account for SunPower as discontinued operations for all periods presented. Accordingly, we have reflected the results of operations of SunPower prior to the Spin-Off as discontinued operations in the Consolidated Statements of Operations and the Consolidated Statements of Cash Flows. The assets, liabilities and minority interest related to SunPower were reclassified and reflected as discontinued operations in the Consolidated Balance Sheets.
Unless otherwise indicated, the Management’s Discussion and Analysis of Financial Condition and Results of Operations in this Annual Report on Form 10-K relate solely to the discussion of our continuing operations.
Our former subsidiary, SunPower, announced in the fourth quarter of fiscal 2009 that certain of its previously issued financial statements could no longer be relied upon. In the course of the preparation of this annual report on Form 10-K, we evaluated the information available to us to date with respect to SunPower’s ongoing investigation of its historical financial statements and concluded that such information would not give rise to a material impact on our previously issued financial statements.
Adjustments to Cypress’s Stock Plans:
On August 1, 2008, the Board approved certain adjustments to Cypress’s 1999 Plan and 1994 Amended Plan (together, the “Plans”) and outstanding employee equity awards in anticipation of the Spin-Off (see Note 3). These adjustments were consistent with and similar to the provisions in the Plans providing for automatic adjustment of service provider equity awards and share pools pursuant to a stock split or similar change in capitalization effected without receipt of consideration by us. Specifically, the Board approved amendments to the Plans to preserve the intrinsic value of the awards before and after the Spin-Off since only common stock holders, not equity plan holders were able to receive the SunPower stock distribution.
In addition, the Board approved certain adjustments with respect to our Employee Stock Purchase Plan (“ESPP”) to offset the decrease in common stock price resulting from the Spin-Off. These changes included a proportionate adjustment in the offering date price per share of common stock and maximum number of shares participants may purchase under the ESPP.
On September 30, 2008, following the Spin-Off, outstanding employee equity awards under the Plans were adjusted by a conversion ratio of 4.12022 (the “Conversion Ratio”). The number of authorized but unissued shares reserved for issuance under the Plans and the ESPP and the numerical provisions under the Plans’ annual grant limits and automatic option grant provisions, including automatic grants to Board members, were also impacted by the Conversion Ratio.
The modification of the outstanding employee equity awards and the ESPP on August 1, 2008 resulted in additional non-cash stock-based compensation. The amount was measured based upon the difference between the fair value of the awards immediately before and after the modification. Of the total additional non-cash stock-based compensation $59.4 million and $61.9 million, net of forfeitures was recognized in fiscal 2009 and fiscal 2008, respectively. The remaining $27.8 million will be recognized over the remaining vesting periods on an accelerated basis less forfeitures.
Convertible Debt Maturity
On September 15, 2009, our outstanding 1.00% Notes of approximately $28 million in principal matured and were settled. Holders received cash for the principal amount of the 1.00% Notes and the entire premium. The final conversion price per 1.00% Notes as calculated under the Indenture, was $1,841.76 including principal and premium. Consistent with the terms of the Indenture, on September 15, 2009, we paid approximately $51.6 million for the principal amount of 1.00% Notes, premium and accrued and unpaid interest.
37
Table of Contents
Convertible Note Hedge and Warrants
In connection with the issuance of the 1.00% Notes, we had a convertible note hedge transaction with respect to our common stock with two counterparties, at the equivalent amount of common stock that would be issuable upon conversion of the 1.00% Notes. The objective of this hedge was to reduce the potential dilution upon conversion of the 1.00% Notes in the event that the market value per share of our common stock at the time of exercise is greater than the conversion price of the 1.00% Notes. In addition, we had entered into a warrant transaction in which we sold to the same counterparties warrants to acquire the same number of shares of our common stock underlying the 1.00% Notes. On September 15, 2009, the hedge matured and as a result we received $23.6 million from the counterparties. In addition, we repurchased and settled the outstanding warrants, issued in March 2007, through a cash payment of approximately $20.3 million to the counterparties holding the warrants.
Manufacturing Strategy
Our core manufacturing strategy—“flexible manufacturing”—combines capacity from leading foundries with output from our internal manufacturing facilities. This initiative should allow us to meet rapid swings in customer demand while lessening the burden of high fixed costs, a capability that is particularly important in high-volume consumer markets that we serve with our leading programmable product portfolio.
Consistent with this strategy, our Board approved a plan in December 2007 to exit our manufacturing facility in Texas and transfer production to our more cost-competitive facility in Minnesota and outside foundries. We substantially completed our exit plan by the end of fiscal 2008. We continued to hold the property for sale as of January 3, 2010.
RESULTS OF OPERATIONS
Revenues
| Year Ended | |||||||||
| January 3, 2010 |
December 28, 2008 |
December 30, 2007 | |||||||
| (In thousands) | |||||||||
| Consumer and Computation Division |
$ | 274,861 | $ | 315,718 | $ | 357,671 | |||
| Data Communications Division |
96,568 | 129,930 | 117,755 | ||||||
| Memory and Imaging Division |
288,246 | 312,410 | 330,305 | ||||||
| Emerging Technologies and Other |
8,111 | 7,658 | 15,866 | ||||||
| Total revenues |
$ | 667,786 | $ | 765,716 | $ | 821,597 | |||
Consumer and Computation Division:
Revenues from the Consumer and Computation Division decreased $40.9 million in fiscal 2009, or approximately 13%, compared to fiscal 2008. The decrease was primarily attributable to a decrease of approximately $27.4 million in sales of our USB products mainly due to the economic slowdown impacting demand in PC applications and consumer devices and increased competition in the consumer market. The decrease was also attributable to a decrease of $16.8 million in sales of our general purpose timing solutions resulting from reduced demand from certain large consumer and personal computer customers. The decrease was partly offset by an increase in our PSoC® product families. Despite the challenging economic environment, our PSoC® product families, including our touchscreen family, continued to gain new design wins, expand their customer base and increase market penetration in a variety of end-market applications particularly in mobile handsets.
Revenues from the Consumer and Computation Division decreased $42.0 million in fiscal 2008, or approximately 12%, compared to fiscal 2007. The distributor conversion contributed $12.1 million of the decrease between fiscal periods. After giving effect to the distributor conversion, the decrease was primarily
38
Table of Contents
attributable to a decrease of $23.2 million in sales of our USB products and $9.1 million in sales of our general-purpose timing solutions mainly due to softening demand as a result of the economic downturn and increased competition in the consumer market. After giving effect to the distributor conversion, revenues from our PSoC solutions were unchanged in fiscal 2008 compared to fiscal 2007.
Data Communications Division:
Revenues from the Data Communications Division decreased $33.4 million in fiscal 2009, or approximately 26%, compared to fiscal 2008. The decrease was primarily attributable to a decrease of $29.7 million in sales of our specialty memory products due to the continued slow down in demand in the base-station market and our programmable logic devices primarily due to the decline in military and certain end of life shipments.
Revenues from the Data Communications Division increased $12.2 million in fiscal 2008, or approximately 10%, compared to fiscal 2007. The increase was primarily attributable to an increase of $39.3 million in sales of our West Bridge controllers and other products resulting from increased production and shipments to cell phone manufacturers. This increase was partially offset by $12.9 million in sales of our network search engine products as we divested the product families during fiscal 2007, and a decrease of $10.3 million in sales of our physical layer devices primarily due to the decline in military shipments.
Memory and Imaging Division:
Revenues from the Memory and Imaging Division decreased $24.2 million in fiscal 2009, or approximately 8%, compared to fiscal 2008. The decrease was primarily attributable to the economic slowdown impacting us by reducing sales by $17.7 million of our SRAM products in networking, consumer and communications applications.
Revenues from the Memory and Imaging Division decreased $17.9 million in fiscal 2008, or approximately 5%, compared to fiscal 2007. The distributor conversion contributed $7.1 million of the decrease between fiscal periods. After giving effect to the distributor conversion, the decrease was primarily attributable to a decrease of $16.2 million in sales of our pseudo-SRAM products as they were discontinued in fiscal 2007, offset by a $6.2 million increase in sales of other memory products due to increased demand for consumer and communication applications.
Emerging Technologies and Other:
Revenues from Emerging Technologies and Other increased $0.5 million in fiscal 2009, approximately 6%, compared to fiscal 2008. The increased in revenues was primarily attributable to an increase in demand as these business are new and growing.
Revenues from the Emerging Technologies and Other segment decreased $8.2 million in fiscal 2008, or approximately 52%, compared to fiscal 2007. The decrease in revenues was primarily due to the divestiture of our Silicon Valley Technology Center (“SVTC”) business in fiscal 2007, which contributed $6.3 million of revenues in fiscal 2007.
Cost of Revenues / Gross Margin
| Year Ended | ||||||||||
| January 3, 2010 |
December 28, 2008 |
December 30, 2007 |
||||||||
| (In thousands) | ||||||||||
| Cost of revenues |
$ | 397,204 | $ | 426,284 | $ | 448,847 | ||||
| Gross margin percentage |
40.5% | 44.3% | 45.4 | % | ||||||
39
Table of Contents
Cost of revenue decreased from $426.3 million in fiscal 2008 to $397.2 million in fiscal 2009 and gross margin percentage decreased from 44.3% in fiscal 2008 to 40.5% in fiscal 2009. The gross margin decrease is primarily attributable to higher stock compensation of $12.8 million in fiscal 2009 compared to fiscal 2008 due to SunPower Spin-Off. The increase in stock-based compensation was mainly related to certain performance based awards. Additionally, the gross margin percentage was also unfavorably impacted by inventory write-downs, under absorbed costs and reduced revenue in 2009 as a result of the challenging economic conditions as we proactively reduced wafer starts in early 2009 to match supply with demand.
The decrease in the gross margin in fiscal 2008 compared to fiscal 2007 was primarily due to reduced factory utilization as we proactively managed inventory levels to a lowered end-customer demand resulting from the economic downturn. In addition, stock-based compensation expense allocated to cost of revenues increased $14.8 million mainly due to the modification of the outstanding employee equity awards approved by the Board in connection with the Spin-Off. Gross margin has also been impacted by the timing of inventory adjustments related to inventory write-downs and the subsequent sale of these written-down products caused by the general state of our business. During fiscal 2008, the net impact of the inventory adjustments was a charge of $1.0 million compared to a charge of $4.1 million in fiscal 2007.
Research and Development (“R&D”)
| Year Ended | |||||||||
| January 3, 2010 |
December 28, 2008 |
December 30, 2007 | |||||||
| (In thousands) | |||||||||
| R&D expenses |
$ | 181,189 | $ | 193,522 | $ | 174,240 | |||
| As a percentage of revenues |
27.1% | 25.3% | 21.2% | ||||||
R&D expenditures decreased $12.3 million in fiscal 2009 compared to fiscal 2008. The decrease was primarily attributable to a $9.4 million reduction in employee related labor and other costs associated with the implementation of our Fiscal 2008/9 Restructuring Plan. In addition the decrease was also due to lower stock-based compensation expense of $1.6 million.
R&D expenses increased $19.3 million in fiscal 2008 compared to fiscal 2007. The increase was primarily due to an increase of $23.2 million in stock-based compensation expense related to the modification of the outstanding employee equity awards approved by the Board in connection with the Spin-Off. This increase was partially offset by the favorable impact of $4.3 million related to amounts recorded under our employee deferred compensation plan.
Selling, General and Administrative (“SG&A”)
| Year Ended | ||||||||||||
| January 3, 2010 |
December 28, 2008 |
December 31, 2007 |
||||||||||
| (In thousands) | ||||||||||||
| SG&A expenses |
$ | 219,602 | $ | 248,579 | $ | 194,545 | ||||||
| As a percentage of revenues |
32.9 | % | 32.5 | % | 23.7 | % | ||||||
SG&A expenses decreased $29.0 million in fiscal 2009 compared to fiscal 2008. The decrease was primarily attributable to a reduction of $22.0 million in outside services and advertising expense coupled with a decrease in other costs associated with the implementation of our Fiscal 2008/9 Restructuring Plan as well as other cost reduction efforts. This amount was partially offset by an $8.2 million increase in stock-based compensation expense related to certain performance based awards.
SG&A expenses increased $54.0 million in fiscal 2008 compared to fiscal 2007. The increase was primarily attributable to an increase of $22.9 million in stock-based compensation expense mainly due to the modification of the outstanding employee equity awards approved by the Board in connection with the Spin-Off, an increase
40
Table of Contents
of $16.3 million in other employee-related costs primarily due to additional headcount in sales and marketing functions as we continue to invest in new products, a decrease of a $7.3 million benefit related to the release of the loan reserve under our employee stock purchase assistance plan, and an increase of $4.6 million in legal costs and other professional fees. This increase was partially offset by the favorable impact of $6.0 million related to amounts recorded under our employee deferred compensation plan.
Amortization of Acquisition-Related Intangible Assets
| Year Ended | |||||||||
| January 3, 2010 |
December 28, 2008 |
December 30, 2007 | |||||||
| (In thousands) | |||||||||
| Amortization of acquisition-related intangible assets |
$ | 3,804 | $ | 5,830 | $ | 7,901 | |||
| As a percentage of revenues |
0.6% | 0.8% | 1.0% | ||||||
Amortization expense decreased $2.0 million in fiscal 2009 compared to fiscal 2008 and decreased $2.1 million in fiscal 2008 compared to fiscal 2007. The decrease in amortization was primarily due to certain intangible assets that had been fully amortized during fiscal 2008 partially offset by the increase in intangibles acquired as part of the Simtek acquisition.
Impairment of Goodwill
We performed our annual assessment of the carrying value of our goodwill balance during the fourth quarter of fiscal 2009 and 2008. Based on our annual assessment, no impairment was recorded in fiscal 2009. Because of the significant negative industry and economic trends affecting our operations and expected future growth during fiscal year 2008 as well as the general decline of industry valuations impacting our valuation, we determined that our goodwill was impaired and recorded an impairment loss of $351.3 million in fiscal 2008.
The following table indicates the number of reporting units tested for goodwill and the amount of goodwill impairment recorded in each reportable segment during fiscal year 2008:
| Reportable Segments |
Number of Reporting Units |
Goodwill Impairment | |||
| Consumer and Computation Division |
Three | $ | 97.9 million | ||
| Data Communications Division |
Two | $ | 138.4 million | ||
| Memory and Imaging Division |
Two | $ | 115.0 million | ||
Impairment Loss Related to Synthetic Lease
We held a synthetic lease for four facilities located in San Jose, California and one facility located in Bloomington, Minnesota. The lease was terminated in fiscal 2007. In connection with the synthetic lease, we recorded impairment charges of $7.0 million during fiscal 2007.
Restructuring
We recorded restructuring charges of $15.2 million, $21.6 million and $0.6 million during fiscal 2009, 2008 and 2007, respectively. During the fiscal year, the savings from our actions taken to date was approximately $41.3 million. Upon completion of all of our actions we anticipate our annual savings in fiscal year 2010 to be approximately $67.8 million. We estimate the savings will proportionately impact sales general and administrative expense by 24%, cost of goods sold by 49% and research and development expense by 27% although there can be no assurance of this. See Note 11 of our Consolidated Financial Statements.
41
Table of Contents
The following table summarizes the restructuring charges recorded in the Consolidated Statements of Operations:
| Year Ended | |||||||||
| January 3, 2010 |
December 28, 2008 |
December 30, 2007 | |||||||
| (In thousands) | |||||||||
| Fiscal 2008/9 Restructuring Plan |
$ | 15,028 | $ | 11,783 | $ | — | |||
| Fiscal 2007 Restructuring Plan |
214 | 9,860 | 583 | ||||||
| Total restructuring charges |
$ | 15,242 | $ | 21,643 | $ | 583 | |||
Fiscal 2008/9 Restructuring Plan:
During the third quarter of fiscal 2008, we initiated a restructuring plan as part of a companywide cost saving initiative aimed to reduce operating costs in response to the economic downturn (“Fiscal 2008/9 Restructuring Plan”). At January 3, 2010, we recorded a total of $26.8 million under the Fiscal 2008/9 Restructuring Plan, of which $23.1 million was related to personnel costs and $3.7 million was related to other exit costs. The determination of when we accrue for severance costs, and what guidance applies, depends on whether the termination benefits are provided under a one-time benefit arrangement or under an on-going benefit arrangement.
Restructuring activities related to personnel costs are summarized as follows:
| (In thousands) |
||||
| Initial provision |
$ | 11,611 | ||
| Non-cash |
(162 | ) | ||
| Cash payments |
(4,075 | ) | ||
| Balance as of December 28, 2008 |
7,374 | |||
| Provision |
11,516 | |||
| Non-cash |
(1,352 | ) | ||
| Cash payments |
(14,271 | ) | ||
| Balance as of January 3, 2010 |
$ | 3,267 | ||
We eliminated approximately 835 positions and recorded total provisions of $23.1 million related to severance and benefits. The following table summarizes certain information related to the positions:
| Locations |
Number of Employees | |
| Manufacturing facility in the Philippines |
250 | |
| Manufacturing facility in Minnesota |
160 | |
| Corporate and other |
425 | |
| Total |
835 | |
In the fourth quarter of fiscal 2009, we substantially completed the terminations of the manufacturing employees of the Philippines and Minnesota locations. As of year end about 76 employees remained with us and we expect the majority of the employee terminations to be completed by the end of fiscal 2010.
Fiscal 2007 Restructuring Plan:
During the fourth quarter of fiscal 2007, we implemented a restructuring plan to exit our manufacturing facility located in Round Rock, Texas (“Fiscal 2007 Restructuring Plan”). Under the Fiscal 2007 Restructuring
42
Table of Contents
Plan, we transitioned production from the Texas facility to our more cost-effective facility in Bloomington, Minnesota as well as outside third-party foundries. The Fiscal 2007 Restructuring Plan included the termination of employees and the planned disposal of assets, primarily consisting of land, building and manufacturing equipment, located in the Texas facility. The Fiscal 2007 Restructuring Plan did not involve the discontinuation of any material product lines or other functions.
To date, we recorded total restructuring charges of $10.7 million related to the Fiscal 2007 Restructuring Plan, of which $0.2 million was recorded in fiscal 2009, $9.9 million was recorded in fiscal 2008 and $0.6 million was recorded in fiscal 2007. Of the total restructuring charges, $8.0 million was related to personnel costs and $2.7 million was related to property, plant and equipment and other exit costs.
Personnel Costs:
Restructuring activities related to personnel costs are summarized as follows:
| (In thousands) |
||||
| Initial provision |
$ | 355 | ||
| Cash payments |
— | |||
| Balance as of December 30, 2007 |
355 | |||
| Additional provision |
7,029 | |||
| Cash payments |
(4,663 | ) | ||
| Balance as of December 28, 2008 |
2,721 | |||
| Additional provision |
627 | |||
| Cash payments |
(3,348 | ) | ||
| Balance as of January 3, 2010 |
$ | — | ||
We completed the termination of the remaining employees in the first quarter of fiscal 2009; all balances related to benefits were paid by the third quarter of fiscal 2009.
Property, Plant and Equipment:
The Texas facility ceased operations in the fourth quarter of fiscal 2008. As management has committed to a plan to dispose of the assets associated with the facility by sale, we have classified the assets as held for sale and valued the assets at the lower of their carrying amount or fair value. Fair value was determined by prices to be received from buyers of the assets or by market prices estimated by third parties that specialize in sales of such assets. Based on this analysis in fiscal 2008, we recorded a write-down of $1.9 million related to the assets and $1.2 million of related disposal and other facility costs.
The following table summarizes the net book value of the remaining restructured assets that were classified as held for sale and included in “Other current assets” in the Consolidated Balance Sheet as of January 3, 2010:
| (In thousands) |
|||
| Land |
$ | 994 | |
| Equipment |
266 | ||
| Buildings and leasehold improvements |
6,430 | ||
| Total property, plant and equipment, net |
$ | 7,690 | |
We had expected to complete the disposal of the restructured assets by the fourth quarter of fiscal 2009, however, due to the downturn and uncertainty in the commercial real estate market we were unable to secure a buyer for the Texas facility. In response, we have revised the asking price for the property and expect to sell the facility in the next twelve months.
43
Table of Contents
Gain on Divestitures
We recorded gain on divestitures totaling $10.0 million and $18.0 million during fiscal 2008 and fiscal 2007, respectively. We did not complete any divestitures during fiscal 2009.
Fiscal 2008:
In fiscal 2008, we completed the sale of certain product lines of our subsidiary, Silicon Light Machines (“SLM”), to Dainippon Screen Manufacturing Co. Ltd. in Japan for $11.0 million in cash. SLM was a part of our “Emerging Technologies and Other” reportable segment. The divestiture included SLM’s micro-electro-mechanical system solutions for commercial printing and other imaging applications. We retained SLM’s laser optical navigation sensor product family.
In connection with the divestiture, we recorded a gain of $10.0 million in fiscal 2008. The following table summarizes the components of the gain:
| (In thousands) |
||||
| Cash proceeds |
$ | 11,000 | ||
| Assets sold and liabilities assumed: |
||||
| Accounts receivable and inventories |
(1,700 | ) | ||
| Other |
816 | |||
| Transaction costs |
(150 | ) | ||
| Gain on divestiture |
$ | 9,966 | ||
Fiscal 2007:
The following table summarizes the divestitures completed in fiscal 2007:
| Product Families/Businesses |
Reportable Segments |
Buyers |
Total Consideration | |||
| A portion of the image sensors product families |
Memory and Imaging Division | Sensata Technologies | $ 11.0 million in cash | |||
| Silicon Valley Technology Center (“SVTC”) |
Other | Semiconductor Technology Services | $ 53.0 million in cash | |||
| A portion of the network search engine (“NSE”) product families |
Data Communications Division | NetLogic Microsystems | $ 14.4 million in cash |
In connection with the divestitures, we recorded total gain of $18.0 million for the year ended December 30, 2007. The following table summarizes the components of the gain:
| Image Sensors | SVTC | NSE | Total | |||||||||||||
| (In thousands) | ||||||||||||||||
| Cash proceeds |
$ | 11,000 | $ | 52,950 | $ | 14,448 | $ | 78,398 | ||||||||
| Assets sold: |
||||||||||||||||
| Accounts receivable |
— | (3,927 | ) | — | (3,927 | ) | ||||||||||
| Inventories |
(1,438 | ) | — | (2,375 | ) | (3,813 | ) | |||||||||
| Property, plant and equipment |
— | (37,823 | ) | — | (37,823 | ) | ||||||||||
| Intangible assets |
(4,581 | ) | — | — | (4,581 | ) | ||||||||||
| Other |
(515 | ) | — | — | (515 | ) | ||||||||||
| Allocated goodwill |
(2,306 | ) | — | (4,872 | ) | (7,178 | ) | |||||||||
| Employee-related costs |
(1,093 | ) | — | — | (1,093 | ) | ||||||||||
| Transaction costs |
(845 | ) | (640 | ) | (25 | ) | (1,510 | ) | ||||||||
| Gain on divestitures |
$ | 222 | $ | 10,560 | $ | 7,176 | $ | 17,958 | ||||||||
44
Table of Contents
Interest Income
Interest income decreased $19.8 million in fiscal 2009 compared to fiscal 2008. The decrease was primarily driven by the impact of lower market interest rates.
Interest income decreased $16.7 million in fiscal 2008 compared to fiscal 2007. The decrease in interest income was primarily attributable to lower average cash balances in the second half of 2008 due to the reduction of our outstanding debt discussed below, the impact of lower market interest rates and the shift of our portfolio to safer and more liquid investments.
Interest Expense
In May 2008, guidance was issued which clarifies the accounting for convertible debt instruments that may be settled in cash upon conversion, including partial cash settlement. This guidance specifies that an issuer of such instruments should separately account for the liability and equity components of the instruments in a manner that reflects the issuer’s non-convertible debt borrowing rate when interest costs are recognized in subsequent periods. This guidance was effective for fiscal years beginning after December 15, 2008, and retrospective application was required for all periods presented. We adopted this guidance in the first quarter of fiscal 2009. See Note 2 of our Consolidated Financial Statements.
Interest expense was $1.2 million in fiscal 2009 compared to $26.8 million in fiscal 2008. The decrease was primarily attributable to the conversion element of the outstanding 1.00% Notes which resulted in the recording of $22.2 million non-cash interest expense in fiscal 2008 as a result of our retrospective application of the new guidance on convertible debt and lower outstanding debt balances in fiscal year 2009 due to the Note Tender Offer discussed below.
Interest expense was $26.8 million in fiscal 2008 compared to $30.4 million in fiscal 2007. The decrease of $3.6 million was primarily attributable to the conversion element of the outstanding 1.00% Notes which resulted in the recording of $22.2 million non-cash interest expense in fiscal 2008 compared to $24.6 million non-cash interest expense in fiscal 2007 as a result of our retrospective application of the new guidance on convertible debt and lower outstanding debt balances in fiscal 2008 due to the Note Tender Offer discussed below.
Note Tender Offer
In September 2008, we completed a tender offer to purchase for cash up to $531.3 million aggregate principal amount of the outstanding 1.00% Notes. In total $582.4 million aggregate principal of the 1.00% Notes were tendered. We accepted $531.3 million of the tendered 1.00% Notes at a purchase price of $1,321.22 per $1,000 principal amount, plus accrued and unpaid interest. Because more than $531.3 million principal amount was tendered, we purchased the 1.00% Notes on a pro rata basis. The pro-ration was based on the ratio of the principal amount of the 1.00% Notes tendered by a holder to the total principal amount of the 1.00% Notes tendered by all the holders. As a result of the Note Tender Offer, we paid $701.9 million in cash.
Gain on Sale of SunPower Common Stock
In fiscal 2008, we sold 2.5 million shares of SunPower Class A common stock (which were converted from Class B) in a private sale and received net proceeds of $222.5 million. The transaction resulted in a gain of $192.0 million in fiscal 2008.
In fiscal 2007, we sold 7.5 million shares of SunPower Class A common stock (which were converted from class B common stock) in a private sale. As a result of the transaction, we received net proceeds of $437.3 million and recorded a gain of $373.2 million in fiscal 2007.
45
Table of Contents
Other Income (Expense), Net
The following table summarizes the components of other income (expense), net:
| Year Ended | ||||||||||||
| January 3, 2010 |
December 28, 2008 |
December 30, 2007 |
||||||||||
| (In thousands) | ||||||||||||
| Amortization of debt issuance costs |
$ | (114 | ) | $ | (3,051 | ) | $ | (3,530 | ) | |||
| Write-off of debt issuance costs (see Note 15) |
— | (4,800 | ) | (4,226 | ) | |||||||
| Gain on investments (see Note 7) |
822 | — | 929 | |||||||||
| Gain (loss) on debt extinguishment |
— | 2,193 | (2,927 | ) | ||||||||
| Impairment of investments (see Note 8) |
(2,549) | (13,355 | ) | (1,903 | ) | |||||||
| Changes in fair value of investments under the deferred compensation plan (see Note 17) |
5,150 | (10,643 | ) | 1,138 | ||||||||
| Foreign currency exchange gain (loss), net |
(22 | ) | 2,925 | (5,495 | ) | |||||||
| Other |
487 | (335 | ) | 617 | ||||||||
| Total other income (expense), net |
$ | 3,774 | $ | (27,066 | ) | $ | (15,397 | ) | ||||
Impairment of Investments:
The following table summarizes the impairment loss related to our investments:
| Year Ended | |||||||||
| January 3, 2010 |
December 28, 2008 |
December 30, 2007 | |||||||
| (In thousands, except per-share amounts) | |||||||||
| Debt securities: |
|||||||||
| Commercial paper |
$ | 197 | $ | 253 | $ | 435 | |||
| Auction rate securities |
1,393 | 3,860 | — | ||||||
| Corporate bonds |
140 | 562 | — | ||||||
| Equity securities: |
|||||||||
| Marketable equity securities |
— | 86 | 601 | ||||||
| Non-marketable equity securities |
819 | 8,594 | 867 | ||||||
| Total impairment loss |
$ | 2,549 | $ | 13,355 | $ | 1,903 | |||
Auction Rate Securities:
Auction rate securities are investments with contractual maturities generally between 20 and 30 years. They are usually found in the form of municipal bonds, preferred stock, a pool of student loans or collateralized debt obligations with interest rates resetting every seven to 49 days through an auction process. At the end of each reset period, investors can sell or continue to hold the securities at par. The auction rate securities held by us are primarily backed by student loans and are over-collateralized, insured and guaranteed by the United States Federal Department of Education.
As of January 3, 2010, 95% of our auction rate securities held by us were rated as either AAA or Aaa by the major independent rating agencies and approximately 5% of the student loan auction rate securities held by us have been downgraded from AAA or Aaa to Baa3. The downgrade event was due to the higher rates the issuer is paying out versus the lending rates, which is preventing the issuer from building excess spread as required under the prospectus. If the financial market continues to deteriorate, future downgrades could potentially impact the rating of our auction rate securities.
As of January 3, 2010, all of our auction rate securities have experienced failed auctions due to sell orders exceeding buy orders. These failures are not believed to be a credit issue with the underlying investments, but
46
Table of Contents
rather caused by a lack of liquidity. Under the contractual terms, the issuer is obligated to pay penalty rates should an auction fail. The funds associated with failed auctions are not expected to be accessible until one of the following occurs: a successful auction occurs, the issuer redeems the issue, a buyer is found outside of the auction process or the underlying securities have matured. Given these circumstances and the lack of liquidity, our auction rate securities totaling $32.7 million are classified as long-term investments as of January 3, 2010.
During fiscal 2009, we performed analyses to assess the fair value of the auction rate securities. In the absence of a liquid market to value these securities, we prepared a valuation model based on discounted cash flows. The assumptions used at January 3, 2010 were as follows:
| Ÿ | 7 years to liquidity; |
| Ÿ | continued receipt of contractual interest which provides a premium spread for failed auctions; and |
| Ÿ | discount rates of 2.31%—5.78%, which incorporates a spread for both credit and liquidity risk. |
Based on these assumptions, we estimated that the auction rate securities would be valued at approximately 90% of their stated par value as of January 3, 2010, representing a decline in value of approximately $3.7 million. As a result of our adoption of new guidance in the second quarter of 2009, we reclassified the non-credit portion of the previously recognized other-than-temporary impairment losses related to our auction rate securities of $5.3 million from accumulated deficit to accumulated other comprehensive income (loss).
Equity Securities:
We have equity investments in both public and privately held companies. We recognize an impairment charge when the carrying value of an investment exceeds its fair value and the decline in value is deemed other-than-temporary. We consider various factors in determining whether we should recognize an impairment charge on an investment in a public company, including the length of time and extent to which the fair value has been less than our cost basis, the financial condition and near-term prospects of the investee, and our intent and ability to hold the investment for a period of time sufficient to allow for any anticipated recovery in market value. Our impairment assessment on investments in privately held companies includes the review of each investee’s financial condition, the business outlook for its products and technology, its projected results and discounted cash flows, the likelihood of obtaining subsequent rounds of financing and the impact of any relevant contractual equity preferences held by us or others. If an investee obtains additional funding at a valuation lower than our carrying amount, we presume that the investment is impaired, unless specific facts and circumstances indicate otherwise. We recorded impairment charges of $0.8 million, $8.7 million and $1.5 million in fiscal 2009, 2008 and 2007, respectively, as we determined that the decline in value of our equity investments in certain public and privately held companies was other-than-temporary.
Employee Deferred Compensation Plan:
We have a deferred compensation plan, which provides certain key employees, including our executive management, with the ability to defer the receipt of compensation in order to accumulate funds for retirement on a tax-free basis. We do not make contributions to the deferred compensation plan and we do not guarantee returns on the investments. Participant deferrals and investment gains and losses remain our assets and are subject to claims of general creditors.
We account for the deferred compensation plan in accordance with the relevant accounting guidance, under which, the assets are recorded at fair value in each reporting period with the offset being recorded in “Other income (expense), net.” The liabilities are recorded at fair value in each reporting period with the offset being recorded as an operating expense or income.
47
Table of Contents
All non-cash expense and income recorded under the deferred compensation plan were included in the following line items in the Consolidated Statements of Operations:
| Year Ended | ||||||||||||
| January 3, 2010 |
December 28, 2008 |
December 30, 2007 |
||||||||||
| (In thousands) | ||||||||||||
| Changes in fair value of assets recorded in: |
||||||||||||
| Other income (expense), net |
$ | 5,150 | $ | (10,643 | ) | $ | 1,138 | |||||
| Changes in fair value of liabilities recorded in: |
||||||||||||
| Cost of revenues |
(516 | ) | 2,129 | (679 | ) | |||||||
| R&D expenses |
(1,454 | ) | 3,560 | (782 | ) | |||||||
| SG&A expenses |
(3,168 | ) | 5,437 | (596 | ) | |||||||
| Total income (expense), net |
$ | 12 | $ | 483 | $ | (919 | ) | |||||
Income Taxes
We recorded an income tax expense of $5.9 million in fiscal 2009, compared to an expense of $7.9 million in fiscal 2008 and an expense of $5.6 million in fiscal 2007. The tax expense in fiscal 2009 was primarily attributable to income taxes associated with the our non-U.S. operations. The tax expense in fiscal 2008 was attributable to non-deductible goodwill impairment and debt extinguishment losses, utilization of foreign tax credits and the amortization of deferred tax liabilities associated with purchased intangible assets, partially offset by non-U.S. taxes on income earned in certain countries that was not offset by current year net operating losses in other countries and U.S. federal alternative minimum tax and state taxes. The tax expense in fiscal 2007 was attributable to non-U.S. taxes on income earned in certain countries that was not offset by current year net operating losses in other countries and U.S. federal and state alternative minimum tax, partially offset by the amortization of deferred tax liabilities associated with purchased intangible assets. Our effective tax rate varies from the U.S. statutory rate primarily due to earnings of foreign subsidiaries taxed at different rates and a full valuation allowance on net operating losses incurred in the U.S. The calculation of tax liabilities involves dealing with uncertainties in the application of complex global tax regulations. We regularly assess our tax positions in light of legislative, bilateral tax treaty, regulatory and judicial developments in the many countries in which we and our affiliates do business.
During the third quarter of fiscal 2009, we resolved the Swiss income tax examination for fiscal 2006. No material adjustments were proposed.
The IRS is currently conducting audits of our federal income tax returns for fiscal 2006, 2007, and 2008. As of January 3, 2010, no adjustments to the tax liabilities have been proposed by the IRS. However, the IRS has not completed their examination and there can be no assurance that there will be no material adjustments upon completion of their review. In addition, non-U.S. tax authorities have completed their examination of our subsidiary in India for fiscal years 2005 and 2006. As of January 3, 2010, the proposed adjustments are being appealed. We believe the ultimate outcome of this appeal will not result in a material adjustment to the tax liability.
Discontinued Operations Attributable to Cypress:
Our historical consolidated financial statements have been recast to account for SunPower as discontinued operations for all periods presented. Accordingly, we have reflected the results of operations of SunPower prior to the Spin-Off as discontinued operations in the Consolidated Statements of Operations and the Consolidated Statements of Cash Flows. The assets, liabilities and minority interest related to SunPower were reclassified and reflected as discontinued operations in the Consolidated Balance Sheets.
48
Table of Contents
The following table summarizes the results of operations related to the discontinued operations through the date of the Spin-off:
| As of | ||||||||
| December 28, 2008 |
December 30, 2007 |
|||||||
| (In thousands) | ||||||||
| Revenues |
$ | 1,033,952 | $ | 774,790 | ||||
| Costs and expenses, net |
967,716 | 780,817 | ||||||
| Income (loss) from discontinued operations before income taxes |
66,236 | (6,027 | ) | |||||
| Income tax benefit (provision) |
(31,850 | ) | 22,084 | |||||
| Income from discontinued operations attributable to Cypress, net of income taxes |
$ | 34,386 | $ | 16,057 | ||||
LIQUIDITY AND CAPITAL RESOURCES
The following table summarizes our consolidated cash and investments, working capital and convertible debt:
| As of | ||||||
| January 3, 2010 |
December 28, 2008 | |||||
| (In thousands) | ||||||
| Cash, cash equivalents and short-term investments |
$ | 299,642 | $ | 237,792 | ||
| Working capital |
$ | 279,643 | $ | 241,370 | ||
| Convertible debt |
$ | — | $ | 27,023 | ||
Key Components of Cash Flows
| Year Ended | |||||||||||
| January 3, 2010 |
December 28, 2008 |
December 30, 2007 | |||||||||
| (In thousands) | |||||||||||
| Net cash provided by operating activities of continuing operations |
$ | 89,303 | $ | 110,717 | $ | 129,165 | |||||
| Net cash provided by (used in) investing activities of continuing operations |
$ | (43,126 | ) | $ | 337,376 | $ | 402,968 | ||||
| Net cash provided by (used in) financing activities of continuing operations |
$ | (7,368 | ) | $ | (1,051,787 | ) | $ | 28,370 | |||
Fiscal 2009:
Net cash provided by operating activities decreased $21.4 million in fiscal 2009 compared to fiscal 2008. Operating cash flows in fiscal 2009 were primarily driven by a net loss of $150.4 million from continuing operations adjusted for certain non-cash items including depreciation and amortization, stock-based compensation expense, loss on property and equipment, impairment losses, restructuring charges and changes in operating assets and liabilities. The decrease in inventories was primarily attributable to increased demand as well as a decrease in stock-based compensation capitalized into inventory.
Net cash provided by investing activities decreased $380.5 million in fiscal 2009 compared to fiscal 2008. The decrease was primarily due to proceeds of $222.5 million from sale of SunPower stock during fiscal 2008. During fiscal 2009, our investing activities primarily included: (1) purchase of investments of $46.8 million, net of sales or maturities of our investments of $24.4 million, and (2) proceeds of $5.7 million from the sale of property. This cash inflow was offset by $25.8 million of property and equipment expenditures.
49
Table of Contents
Net cash used in financing activities decreased $1.0 billion in fiscal 2009 compared to fiscal 2008. The decrease was primarily due to the redemption of our convertible debt for $743.0 million and repurchase of our common stock of $375.6 million during fiscal 2008. During fiscal 2009, our financing activities primarily included: (1) redemption of our 1.00% Notes which used $51.6 million, and (2) $46.3 million used to repurchase our common shares. These cash outflows were partially offset by: (1) proceeds of $101.6 million from the issuance of common shares under our employee stock plans, and (2) proceeds of $3.3 million from the termination of a portion of the convertible note hedge and warrants related to our 1.00% Notes.
Fiscal 2008:
Net cash provided by operating activities decreased $18.4 million in fiscal 2008 compared to fiscal 2007. Operating cash flows in fiscal 2008 were primarily driven by a net loss of $319.3 million from continuing operations which is primarily due to a $351.3 million impairment of goodwill. The net loss is also adjusted for certain non-cash items including depreciation and amortization, stock-based compensation expense and associated excess tax benefits, interest and expenses on adoption of ASC 470, a gain on sale of SunPower common stock, impairment losses, gain on divestitures, restructuring charges and changes in operating assets and liabilities. The decrease in accounts receivable was primarily driven by lower sales. The increase in inventories was primarily attributable to a last-time build program on certain products manufactured in our Texas facility, as well as an increase in stock-based compensation capitalized into inventory.
Net cash provided by investing activities decreased $65.6 million in fiscal 2008 compared to fiscal 2007. During fiscal 2008, our investing activities primarily included: (1) our sale of SunPower common stock, which generated net proceeds of $222.5 million, (2) proceeds of $185.8 million from sales or maturities of our investments, net of purchases, and (3) proceeds of $11.0 million from a divestiture. These cash inflows were partially offset by: (1) $42.1 million of property and equipment expenditures, and (2) $41.6 million used in acquisitions of businesses, net of cash acquired.
Net cash used in financing activities increased $1.1 billion in fiscal 2008 compared to fiscal 2007. During fiscal 2008, our financing activities primarily included: (1) redemption of our 1.00% Notes which used $742.6 million and (2) $375.6 million used to repurchase our common shares. These cash outflows were partially offset by: (1) proceeds of $55.6 million from the issuance of common shares under our employee stock plans, and (2) proceeds of $7.8 million from the termination of a portion of the convertible note hedge and warrants related to our 1.00% Notes.
Fiscal 2007:
During fiscal 2007, net cash provided by operations decreased $48.9 million in fiscal 2007 compared to fiscal 2006. Operating cash flows in fiscal 2007 were primarily driven by net income of $366.9 million, adjusted for non-cash items including the gain on our sale of SunPower common stock, depreciation and amortization, stock-based compensation expense, interest and expenses on adoption of ASC 470, impairment losses, gain on divestitures, write-off of debt issuance costs, and changes in operating assets and liabilities. The decrease in accounts receivable was primarily attributable to lower sales. The increase in inventories was primarily attributable to the growth in our proprietary products.
Net cash provided by investing activities increased $481.7 million in fiscal 2007 compared to fiscal 2006. For fiscal 2007, investing activities primarily included: (1) our sale of 7.5 million shares of SunPower common stock, which generated net proceeds of $437.3 million, (2) receipt of $78.4 million from our divestitures, and (3) proceeds of $27.6 million from the collection of our employee loans. These cash inflows were partially offset by: (1) purchases of $109.3 million of investments, net of proceeds from sales and maturities, and (2) $36.8 million of property and equipment expenditures.
Net cash provided by financing activities decreased $42.6 million in fiscal 2007 compared to fiscal 2006. For fiscal 2007, financing activities primarily included: (1) receipt of $600.0 million from the issuance of our
50
Table of Contents
1.00% Notes, and (2) issuance of common shares under our employee stock plans, which generated $210.2 million. These cash inflows were partially offset by: (1) repurchases of our common shares under the accelerated share repurchase program, which used $571.0 million, (2) redemption of our 1.25% Notes, which resulted in payments of approximately $179.7 million, (3) purchase of a convertible note hedge and issuance of warrants related to our 1.00% Notes, which used $17.0 million, and (4) payments of approximately $12.9 million in debt issuance costs.
Liquidity
Convertible Debt:
In September 2008, we completed a tender offer to purchase for cash up to $531.3 million aggregate principal amount of the 1.00% Notes. As a result of the tender offer, we paid $701.9 million in cash in the third quarter of fiscal 2008 at a purchase price of $1,321.22 per $1,000 principal amount, plus accrued and unpaid interest.
In November 2008, we made open market purchases of approximately $12.1 million of the outstanding 1.00% Notes at a slight discount to par, plus accrued interest.
Pursuant to the applicable Indenture, the Spin-Off of SunPower constituted both a fundamental change and a make-whole fundamental change to the 1.00% Notes. Consequently, the remaining holders were permitted to require us to purchase their 1.00% Notes on December 17, 2008, in cash at a price equal to $1,000 principal amount of the Notes, plus accrued and unpaid interest to, but excluding, the fundamental change purchase date. On December 17, 2008, we repurchased the principal amount of $28.7 million of the 1.00% Notes.
On September 15, 2009, our outstanding 1.00% Notes of approximately $28.0 million in principal matured and were settled. Holders received cash for the principal amount of the 1.00% Notes and the entire premium. The final conversion price per 1.00% Notes as calculated under the Indenture was $1,841.76 including principal and premium. Consistent with the terms of the Indenture, on September 15, 2009, we paid approximately $51.6 million for the principal amount of 1.00% Notes, premium and accrued and unpaid interest.
Auction Rate Securities:
As of January 3, 2010, all of our auction rate securities have experienced failed auctions due to sell orders exceeding buy orders. Currently, these failures are not believed to be a credit issue with the underlying investments, but rather caused by a lack of liquidity. We have classified our auction rate securities totaling $32.7 million as long-term investments as of January 3, 2010.
During fiscal 2009, we performed analyses to assess the fair value of the auction rate securities. In the absence of a liquid market to value these securities, we prepared a valuation model based on discounted cash flows.
Based on the discounted cash flows, we estimated that the auction rate securities would be valued at approximately 90% of their stated par value as of January 3, 2010. As a result of our adoption of new guidance in fiscal 2009, we reclassified the non-credit portion of the previously recognized other-than-temporary impairment losses related to our auction rate securities of $5.3 million from accumulated deficit to accumulated other comprehensive income (loss).
Stock Repurchase Program:
In fiscal 2007, the Board authorized a stock repurchase program of up to $300.0 million. In fiscal 2008, the Board approved an additional $300.0 million, bringing the total amount that may have been used for stock purchases to $600.0 million under the stock repurchase program. The stock repurchase program was in addition to the accelerated share repurchase program associated with the 1.00% Notes.
51
Table of Contents
During fiscal 2008, we used $375.6 million in cash to repurchase a total of approximately 37.1 million shares at an average share price of $10.13. Approximately 12.6 million shares of this repurchase occurred prior to the Spin-Off at an average stock price of $21.95. The remaining 24.5 million shares were purchased after the Spin-Off at an average price of $4.03.
During fiscal 2009, we used $46.3 million to repurchase approximately 5.8 million shares at an average share price of $8.00. In light of certain tax constraints placed on us in connection with the tax-free spin of SunPower, we had no current intentions of repurchasing additional stock under the existing program. Accordingly, on October 28, 2009, the Audit Committee of the Board voted to rescind the remaining $178.1 million available under the program for additional repurchases.
Equity Option Contracts
As of December 31, 2006, we had outstanding a series of equity options on our common stock with an initial cost of $26.0 million that were originally entered into in fiscal 2001. The contracts required physical settlement. Upon expiration of the options, if our stock price was above the threshold price of $21.00 per share, we would receive a settlement value totaling $30.3 million in cash. If our stock price was below the threshold price of $21.00 per share, we would receive 1.4 million shares of our common stock.
During fiscal 2007, the contracts expired and we did not renew them. We received 1.4 million shares of our common stock, which was accounted for as treasury stock.
On October 28, 2009 the Audit Committee approved a yield enhancement strategy intended to improve the yield on our available non-strategic cash. As part of this program, the Audit Committee authorized us to enter into short-term yield enhanced structured agreements correlated to our stock price. In one such structure, we pay a fixed sum of cash upon execution of an agreement in exchange for the counterparty’s obligations to pay either a pre-determined amount of cash or shares of our stock depending on the closing market price of its common stock on the expiration date of the agreement. Upon expiration of each agreement, if the closing market price of our common stock is above the pre-determined price, we will have our cash investment returned plus a yield substantially above the yield available today for short term cash investments. If the closing market price is at or below the pre-determined price, we will receive the number of shares specified at the agreement’s inception. As the outcome of these arrangements is based entirely on our stock price and does not require us to deliver either shares or cash, other than the original investment, the entire transaction is recorded in equity.
The decision to enter into a yield enhanced structured agreement is based upon a comparison of the yields available in the financial markets for similar maturities against the expected yield to be realized per the structured agreement and the related risks associated with this type of arrangement. We believe the risk associated with these types of agreements is no different than alternative investments available to us with equivalent counterparty credit ratings. All counterparties to a yield enhancement program have a credit rating of at least Aa2 or A as rated by major independent rating agencies. For all such agreements that matured in the fourth quarter of fiscal 2009, the yields of the structured agreements were far superior to the yields available in the financial markets primarily due to the volatility of our stock price and the pre-payment aspect of the agreements. The counterparty is willing to pay a premium over the yields available in the financial markets due to the structure of the agreement.
In the fourth quarter of fiscal 2009, we entered into short-term yield enhanced structured agreements totaling $68.0 million. We settled these agreements in the fourth quarter of fiscal 2009 and received $69.1 million in cash. In February 2010, we entered into two additional short-term yield enhanced structured agreements totaling $98.0 million. Upon settlement of these agreements, we expect to receive $101.4 million in cash. However if upon settlement of the agreements our stock price is at or below the pre-determined price, we will receive 9.0 million shares of our common stock.
52
Table of Contents
Contractual Obligations
The following table summarizes our contractual obligations as of January 3, 2010:
| Payments Due by Years | |||||||||||||||
| Total | 2010 | 2011 and 2012 | 2013 and 2014 | After 2014 | |||||||||||
| (In thousands) | |||||||||||||||
| Operating lease commitments |
$ | 31,666 | $ | 8,207 | $ | 12,915 | $ | 5,437 | $ | 5,107 | |||||
| Purchase obligations (1) |
73,539 | 72,813 | 726 | — | — | ||||||||||
| Total contractual obligations |
$ | 105,205 | $ | 81,020 | $ | 13,641 | $ | 5,437 | $ | 5,107 | |||||
| (1) | Purchase obligations primarily include non-cancelable purchase orders for materials, services, manufacturing equipment, building improvements and supplies in the ordinary course of business. Purchase obligations are defined as enforceable agreements that are legally binding on us and that specify all significant terms, including quantity, price and timing. |
As of January 3, 2010, our unrecognized tax benefits were $39.3 million, which were classified as long-term liabilities. At this time, we are unable to make a reasonably reliable estimate of the timing of payments, if any, in individual years due to uncertainties in the timing or outcomes of either actual or anticipated tax audits.
Capital Resources and Financial Condition
Our long-term strategy is to maintain a minimum amount of cash for operational purposes and to invest the remaining amount of our cash in interest-bearing and highly liquid cash equivalents and debt securities. As of January 3, 2010, in addition to $243.6 million in cash and cash equivalents, we had $56.1 million invested in short-term investments for a total cash and short-term investment position of $299.6 million that is available for use in current operations. In addition, we had $34.4 million of long-term investments primarily consisting of auction rate securities.
We believe that liquidity provided by existing cash, cash equivalents and investments and our borrowing arrangements will provide sufficient capital to meet our requirements for at least the next twelve months. However, should prevailing economic conditions and/or financial, business and other factors beyond our control adversely affect our estimates of our future cash requirements, we could be required to fund our cash requirements by alternative financing. There can be no assurance that additional financing, if needed, would be available on terms acceptable to us or at all. We may choose at any time to raise additional capital or debt to strengthen our financial position, facilitate growth, enter into strategic initiatives and provide us with additional flexibility to take advantage of other business opportunities that arise.
Off-Balance Sheet Arrangement
During fiscal 2005, we entered into a strategic foundry partnership with Grace Semiconductor Manufacturing Corporation (“Grace”), pursuant to which we have transferred certain of our proprietary process technologies to Grace’s Shanghai, China facility. In accordance with a foundry agreement executed in fiscal 2006, we purchase wafers from Grace that are produced using these process technologies.
Pursuant to a master lease agreement, Grace has leased certain semiconductor manufacturing equipment from a financing company. In conjunction with the master lease agreement, we have entered into a series of guarantees with the financing company for the benefit of Grace. Under the guarantees, we have agreed to unconditional guarantees to the financing company of the rental payments payable by Grace for the leased equipment under the master lease agreement. If Grace fails to pay any of the quarterly rental payments, we will be obligated to pay such outstanding amounts within 10 days of a written demand from the financing company. If we fail to pay such amount, interest will accrue at a rate of 9% per annum on any unpaid amounts. To date, we have not been required to make any payments under these guarantees.
53
Table of Contents
Pursuant to the guarantees, we issued irrevocable letters of credit to secure the rental payments under the guarantees in the event a demand is made by the financing company on us. The amount available under the letters of credit will decline according to schedules mutually agreed upon by us and the financing company. If we default, the financing company will be entitled to draw on the letters of credit. We expect our obligations under the letters of credit to be reduced to zero by the end of fiscal 2010.
In connection with the guarantees, we were granted options to purchase ordinary shares of Grace. As of January 3, 2010, we determined that the fair value of the guarantees and the options was not material to our consolidated financial statements.
The following table summarizes the terms and status of the guarantees:
| Fiscal Year |
Number of Guarantees |
Lease Term of Equipment Under Each Guarantee |
Outstanding Rental Payments | Outstanding Irrevocable Letters of Credits |
Grace Options Granted to Cypress | |||||||||||||||||||
| At Inception |
As of | At Inception |
As of | |||||||||||||||||||||
| December 28, 2008 |
January 3, 2010 |
December 28, 2008 |
January 3, 2010 |
|||||||||||||||||||||
| (In thousands) | ||||||||||||||||||||||||
| 2006 |
One | 36 months | $ | 8,255 | $ | 2,752 | $ | — | $ | 6,392 | $ | 2,829 | $ | — | 2,241 | |||||||||
| 2007 |
Five | 36 months | 42,278 | 21,828 | 5,665 | 32,726 | 20,793 | 9,204 | 26,555 | |||||||||||||||
| 2008 |
One | 36 months | 10,372 | 7,778 | 3,457 | 7,918 | 7,010 | 4,206 | 11,524 | |||||||||||||||
| $ | 60,905 | $ | 32,358 | $ | 9,122 | $ | 47,036 | $ | 30,632 | $ | 13,410 | 40,320 | ||||||||||||
NON-GAAP FINANCIAL MEASURES
Regulation G, conditions for use of Non-Generally Accepted Accounting Principles (“Non-GAAP”) financial measures, and other SEC regulations define and prescribe the conditions for use of certain Non-GAAP financial information. To supplement our consolidated financial results presented in accordance with GAAP, we use non-GAAP financial measures which are adjusted from the most directly comparable GAAP financial measures to exclude certain items, as described below. Management believes that these non-GAAP financial measures reflect an additional and useful way of viewing aspects of our operations that, when viewed in conjunction with our GAAP results, provide a more comprehensive understanding of the various factors and trends affecting our business and operations. Non-GAAP financial measures used by us include:
| Gross margin |
| Research and development expenses |
| Selling, general and administrative expenses |
| Operating income (loss) |
| Net income (loss) |
| Diluted net income (loss) per share |
Our Non-GAAP measures primarily exclude stock-based compensation, acquisition-related charges, impairments to goodwill, gain or losses on divestiture, investment-related gains and losses, discontinued operations, restructuring costs and other special charges and credits. Management believes these Non-GAAP financial measures provide meaningful supplemental information regarding our strategic and business decision making, internal budgeting, forecasting and resource allocation processes. In addition, these non-GAAP financial measures facilitate management’s internal comparisons to our historical operating results and comparisons to competitors’ operating results.
We use each of these non-GAAP financial measures for internal managerial purposes, when providing our financial results and business outlook to the public, to facilitate period-to-period comparisons and are used to formulate our formula driven cash bonus plan and any milestone based stock awards. Management believes that these non-GAAP measures provide meaningful supplemental information regarding our operational and financial performance of current and historical results. Management uses these non-GAAP measures for strategic and
54
Table of Contents
business decision making, internal budgeting, forecasting and resource allocation processes. In addition, these non-GAAP financial measures facilitate management’s internal comparisons to our historical operating results and comparisons to competitors’ operating results.
The table below shows our Non-GAAP financial measures:
| Year Ended | |||||||||
| January 3, 2010 |
December 28, 2008 |
December 30, 2007 | |||||||
| (In thousands, except per shares amounts) | |||||||||
| Non-GAAP gross margin |
$ | 314,558 | $ | 373,075 | $ | 385,650 | |||
| Non-GAAP research and development expenses |
145,879 | 153,416 | 158,310 | ||||||
| Non-GAAP selling, general and administrative expenses |
156,027 | 191,953 | 168,690 | ||||||
| Non-GAAP operating income (loss) attributable to Cypress |
12,649 | 27,706 | 58,650 | ||||||
| Non-GAAP net income (loss) attributable to Cypress |
17,743 | 32,647 | 80,566 | ||||||
| Non-GAAP diluted net income (loss) per share attributable to Cypress |
0.10 | 0.20 | 0.47 | ||||||
We believe that providing these non-GAAP financial measures, in addition to the GAAP financial results, are useful to investors because they allow investors to see our results “through the eyes” of management as these non-GAAP financial measures reflect our internal measurement processes. Management believes that these non-GAAP financial measures enable investors to better assess changes in each key element of our operating results across different reporting periods on a consistent basis and provides investors with another method for assessing our operating results in a manner that is focused on the performance of our ongoing operations.
55
Table of Contents
The following is a reconciliation of Non-GAAP measures to GAAP measures:
CYPRESS SEMICONDUCTOR CORPORATION
RECONCILIATION OF GAAP FINANCIAL MEASURES TO NON-GAAP FINANCIAL MEASURES
(In thousands, except per-share data)
(Unaudited)
| Twelve Months Ended | ||||||||||||
| January 3, 2010 |
December 28, 2008 |
December 30, 2007 |
||||||||||
| GAAP gross margin (a) |
$ | 270,582 | $ | 339,432 | $ | 372,750 | ||||||
| Stock-based compensation expense |
40,798 | 27,950 | 13,123 | |||||||||
| Impairment of assets |
— | 1,734 | — | |||||||||
| Write down of final build inventory |
— | 2,475 | — | |||||||||
| Other acquisition-related expense |
559 | 1,616 | 16 | |||||||||
| Changes in value of deferred compensation plan |
5 | (132 | ) | (239 | ) | |||||||
| Other (b) |
2,614 | — | — | |||||||||
| Non-GAAP gross margin |
$ | 314,558 | $ | 373,075 | $ | 385,650 | ||||||
| GAAP research and development expenses |
$ | 181,189 | $ | 193,522 | $ | 174,240 | ||||||
| Stock-based compensation expense |
(37,537 | ) | (39,089 | ) | (15,870 | ) | ||||||
| Other acquisition-related expense |
(75 | ) | (1,601 | ) | (335 | ) | ||||||
| Gain on sale of long-term asset |
2,437 | — | — | |||||||||
| Changes in value of deferred compensation plan |
(135 | ) | 584 | 275 | ||||||||
| Non-GAAP research and development expenses |
$ | 145,879 | $ | 153,416 | $ | 158,310 | ||||||
| GAAP selling, general and administrative expenses |
$ | 219,602 | $ | 248,579 | $ | 194,545 | ||||||
| Stock-based compensation expense |
(63,477 | ) | (55,306 | ) | (32,399 | ) | ||||||
| Other acquisition-related expense |
(52 | ) | (1,665 | ) | (617 | ) | ||||||
| Changes in value of deferred compensation plan |
(46 | ) | 147 | 208 | ||||||||
| Release of allowance for uncollectible employee loans |
— | 198 | 6,953 | |||||||||
| Non-GAAP selling, general and administrative expenses |
$ | 156,027 | $ | 191,953 | $ | 168,690 | ||||||
| GAAP operating income (loss) |
$ | (149,255 | ) | $ | (471,433 | ) | $ | 6,433 | ||||
| Stock-based compensation expense |
141,812 | 122,345 | 61,392 | |||||||||
| License royalty |
2,614 | — | — | |||||||||
| Acquisition-related expense: |
||||||||||||
| Impairment of goodwill |
— | 351,257 | — | |||||||||
| Amortization of acquisition-related intangibles |
3,804 | 5,830 | 7,901 | |||||||||
| Other acquisition-related expense |
686 | 4,882 | 968 | |||||||||
| Gain on sale of long-term asset |
(2,440 | ) | — | — | ||||||||
| Write down of final build inventory |
— | 2,475 | — | |||||||||
| Impairment related to synthetic lease |
— | — | 7,006 | |||||||||
| Changes in value of deferred compensation plan |
186 | (863 | ) | (722 | ) | |||||||
| Release of allowance for uncollectible employee loans |
— | (198 | ) | (6,953 | ) | |||||||
| Impairment of assets |
— | 1,734 | — | |||||||||
| Gains on divestitures |
— | (9,966 | ) | (17,958 | ) | |||||||
| Restructuring charges |
15,242 | 21,643 | 583 | |||||||||
| Non-GAAP operating income |
$ | 12,649 | $ | 27,706 | $ | 58,650 | ||||||
56
Table of Contents
CYPRESS SEMICONDUCTOR CORPORATION
RECONCILIATION OF GAAP FINANCIAL MEASURES TO NON-GAAP FINANCIAL MEASURES
(In thousands, except per-share data)
(Unaudited)
| Year Ended | ||||||||||||
| January 3, 2010 |
December 28, 2008 |
December 30, 2007 |
||||||||||
| GAAP net income (loss) attributable to Cypress |
$ | (150,424 | ) | $ | (284,876 | ) | $ | 382,919 | ||||
| Stock-based compensation expense |
141,812 | 122,345 | 61,392 | |||||||||
| License royalty |
2,614 | — | — | |||||||||
| Acquisition-related expense: |
||||||||||||
| Impairment of goodwill |
— | 351,257 | — | |||||||||
| Amortization of acquisition-related intangibles |
3,804 | 5,830 | 7,901 | |||||||||
| Other acquisition-related expense |
686 | 4,882 | 968 | |||||||||
| Gain on sale of long-term asset |
(2,440 | ) | — | — | ||||||||
| Write down of final build inventory |
— | 2,475 | — | |||||||||
| Impairment related to synthetic lease |
— | — | 7,006 | |||||||||
| Changes in value of deferred compensation plan |
186 | (863 | ) | (722 | ) | |||||||
| Release of allowance for uncollectible employee loans |
— | (198 | ) | (6,953 | ) | |||||||
| Impairment of assets |
— | 1,734 | — | |||||||||
| Gains on divestitures |
— | (9,966 | ) | (17,958 | ) | |||||||
| Restructuring charges |
15,242 | 21,643 | 583 | |||||||||
| Investment-related gains/losses |
3,257 | 38,536 | 36,688 | |||||||||
| Gain on sale of Sunpower shares |
— | (192,048 | ) | (373,173 | ) | |||||||
| Tax effects |
3,006 | 6,282 | (2,028 | ) | ||||||||
| Income from discontinued operations attributable to Cypress |
— | (34,386 | ) | (16,057 | ) | |||||||
| Non-GAAP net income attributable to Cypress |
$ | 17,743 | $ | 32,647 | $ | 80,566 | ||||||
| GAAP net income (loss) per share attributable to Cypress—diluted |
$ | (1.03 | ) | $ | (1.89 | ) | $ | 2.23 | ||||
| Stock-based compensation expense |
0.97 | 0.74 | 0.36 | |||||||||
| License royalty |
0.02 | — | — | |||||||||
| Acquisition-related expense: |
— | — | — | |||||||||
| Impairment of goodwill |
— | 2.11 | — | |||||||||
| Amortization of acquisition-related intangibles |
0.03 | 0.04 | 0.05 | |||||||||
| Other acquisition-related expense |
— | 0.03 | 0.01 | |||||||||
| Gain on sale of long-term asset |
(0.02 | ) | — | — | ||||||||
| Write down of final build inventory |
— | 0.01 | — | |||||||||
| Impairment related to synthetic lease |
— | — | 0.04 | |||||||||
| Changes in value of deferred compensation plan |
— | (0.01 | ) | — | ||||||||
| Release of allowance for uncollectible employee loans |
— | — | (0.04 | ) | ||||||||
| Impairment of assets |
— | 0.01 | — | |||||||||
| Gains on divestitures |
— | (0.06 | ) | (0.10 | ) | |||||||
| Restructuring charges |
0.10 | 0.13 | — | |||||||||
| Investment-related gains/losses |
0.02 | 0.23 | 0.21 | |||||||||
| Gain on sale of Sunpower shares |
— | (1.16 | ) | (2.17 | ) | |||||||
| Tax effects |
0.02 | 0.04 | (0.01 | ) | ||||||||
| Non-GAAP share count adjustment |
(0.01 | ) | 0.18 | (0.02 | ) | |||||||
| Income from discontinued operations attributable to Cypress |
— | (0.20 | ) | (0.09 | ) | |||||||
| Non-GAAP net income per share attributable to Cypress—diluted |
$ | 0.10 | $ | 0.20 | $ | 0.47 | ||||||
57
Table of Contents
| (a) | During the third quarter of 2009, we identified historically immaterial errors related to the value of our raw material inventory balances located in the Philippines. We have determined that these errors were not material to any of the individual prior periods presented and accordingly, the financial statements for the twelve months ended December 28, 2008 have been recast to correct for the immaterial errors in accordance with SAB 108. |
| (b) | Includes license royalties applicable to the total company. |
RECENT ACCOUNTING PRONOUNCEMENTS
In December 2007, the Financial Accounting Standards Board (“FASB”) issued guidance surrounding noncontrolling interest in consolidated financial statements—an amendment to existing authoritative literature. The newly issued guidance requires recharacterizing minority interests as noncontrolling interests in addition to classifiying noncontrolling interest as a component of equity. The guidance also establishes reporting requirements to provide disclosures that identify and distinguish between the interests of the parent and the interests of noncontrolling owners. This guidance requires retroactive adoption of the presentation and disclosure requirements for existing minority interests—all other requirements are to be applied prospectively. All periods presented in these consolidated financial statements reflect the presentation and disclosure required by this guidance. All other requirements under the guidance are being applied prospectively. We adopted this guidance in the first quarter of fiscal 2009. Except for the presentation and disclosure requirements required by this guidance, there was no impact on our consolidated financial statements.
In May 2008, we adopted new accounting guidance which clarifies the accounting for convertible debt instruments as issued by the FASB. The guidance specifies that an issuer of such instruments should separately account for the liability and equity components of the instruments in a manner that reflects the issuer’s non-convertible debt borrowing rate when interest costs are recognized in subsequent periods. The guidance was effective in the first quarter of 2009, and retrospective application is required for all periods presented. As a result of our adoption of this accounting guidance we recorded additional non-cash interest and other income (expense) of approximately $144.4 million and $(19.1) during fiscal 2008 and 2007, respectively.
In April 2009, the FASB issued new accounting guidance on how to determine the fair value of assets and liabilities. The accounting guidance relates to determining fair values when there is no active market or where the price inputs being used represent distressed sales. It reaffirms that the objective of fair value measurement is to reflect how much an asset would be sold for in an orderly transaction (as opposed to a distressed forced transaction) at the date of the financial statements under current market conditions. Specifically, it reaffirms the need to use judgment to ascertain if a formerly active market has become inactive and in determining fair values when markets have become inactive. The new guidance was effective in the second quarter of 2009. The adoption of the guidance did not have a material impact on our consolidated financial statements.
In April 2009, the FASB issued new accounting guidance amending the other-than-temporary impairment guidance for debt securities and it improves the presentation and disclosure of other-than-temporary impairments on debt and equity securities in the financial statements. This guidance does not amend existing recognition and measurement guidance related to other-than-temporary impairments of equity securities. Under this guidance, if the debt security’s market value is below amortized cost and we intend to either sell the security or it is more likely than not that we will be required to sell the security before its anticipated recovery, we would record an other-than-temporary impairment charge to other income and expense, net. If we do not intend to sell the security and it is more likely than not that we will not be required to sell the security before its anticipated recovery, the revised guidance requires us to determine the portion of the other-than-temporary impairment related to credit factors, or the credit loss portion, and the portion that is not related to credit factors, or the non-credit loss portion. The credit loss portion is the difference between the amortized cost of the security and our best estimate of the present value of the cash flows expected to be collected from the debt security and is recorded as a charge to other income and expense, net. The non-credit loss portion is the difference between the decline in fair value and the credit loss portion of the other-than-temporary impairment and is recorded as a separate component of
58
Table of Contents
other comprehensive income (loss). At adoption, the non-credit loss portion of the other-than-temporary impairment to date is to be recorded to accumulated other comprehensive income (loss), offset by an entry to the retained earnings as a one-time adjustment. As a result of our adoption of this accounting guidance in the second quarter of 2009, we reclassified the non-credit portion of the previously recognized other-than-temporary impairment losses related to our auction rate securities of $5.3 million from accumulated deficit to accumulated other comprehensive income (loss).
In January 2010, the FASB issued updated guidance related to fair value measurements and disclosures, which requires a reporting entity to disclose separately the amounts of significant transfers in and out of Level 1 and Level 2 fair value measurements and to describe the reasons for the transfers. In addition, in the reconciliation for fair value measurements using significant unobservable inputs, or Level 3, a reporting entity should disclose separately information about purchases, sales, issuances and settlements (that is, on a gross basis rather than one net number). The updated guidance also requires that an entity should provide fair value measurement disclosures for each class of assets and liabilities and disclosures about the valuation techniques and inputs used to measure fair value for both recurring and non-recurring fair value measurements for Level 2 and Level 3 fair value measurements. The updated guidance is effective for interim or annual financial reporting periods beginning after December 15, 2009, except for the disclosures about purchases, sales, issuances and settlements in the roll forward activity in Level 3 fair value measurements, which are effective for fiscal years beginning after December 15, 2010 and for interim periods within those fiscal years. We do not expect the adoption of the updated guidance to have a material impact on our consolidated financial statements.
CRITICAL ACCOUNTING POLICIES AND ESTIMATES
The discussion and analysis of our financial condition and results of operations are based upon our consolidated financial statements included in this Annual Report on Form 10-K and the data used to prepare them. Our consolidated financial statements have been prepared in accordance with accounting principles generally accepted in the United States and we are required to make estimates, judgments and assumptions in the course of such preparation. Note 1 of Notes to Consolidated Financial Statements under Item 8 describes the significant accounting policies and methods used in the preparation of the consolidated financial statements. On an ongoing basis, we re-evaluate our judgments and estimates including those related to revenue recognition, allowances for doubtful accounts receivable, inventory valuation, valuation of long-lived assets, goodwill and financial instruments, stock-based compensation, litigation and settlement costs, and income taxes. We base our estimates and judgments on historical experience, knowledge of current conditions and our beliefs of what could occur in the future considering available information. Actual results may differ from these estimates under different assumptions or conditions. Our critical accounting policies that are affected by significant estimates, assumptions and judgments used in the preparation of our consolidated financial statements are as follows:
Revenue Recognition:
We generate revenues by selling products to distributors, various types of manufacturers including original equipment manufacturers (“OEMs”) and electronic manufacturing service providers (“EMSs”). We recognize revenue on sales to OEMs and EMSs provided that persuasive evidence of an arrangement exists, the price is fixed or determinable, title has transferred, collection of resulting receivables is reasonably assured, there are no customer acceptance requirements, and there are no remaining significant obligations.
Sales to certain distributors are made under agreements which provide the distributors with price protection, other allowances and stock rotation under certain circumstances. Given the uncertainties associated with the rights given to these distributors, revenues and costs related to distributor sales are deferred until products are sold by the distributors to the end customers. Revenues are recognized upon receiving notification from those distributors that products have been sold to the end customers. Reported information includes product resale price, quantity and end customer shipment information as well as remaining inventory on hand. At the time of shipment to those distributors, we record a trade receivable for the selling price since there is a legally enforceable right to receive payment, relieve inventory for the value of goods shipped since legal title has passed
59
Table of Contents
to the distributors, and defer the related margin as deferred revenue less cost of revenue on sales to distributors in the Consolidated Balance Sheets. The effects of distributor price adjustments are recorded as a reduction to deferred revenue at the time the distributors sell the products to the end customers.
We record as a reduction to revenues reserves for sales returns, price protection and allowances, based upon historical experience rates and for any specific known customer amounts. We also provide certain distributors and EMSs with volume-pricing discounts, such as rebates and incentives, which are recorded as a reduction to revenues at the time of sale. Historically these volume discounts have not been significant.
Our revenue reporting is highly dependent on receiving pertinent, accurate and timely data from our distributors. Distributors provide us periodic data regarding the product, price, quantity, and end customer when products are resold as well as the quantities of our products they still have in stock. Because the data set is large and complex and because there may be errors in the reported data, we must use estimates and apply judgments to reconcile distributors’ reported inventories to their activities. Actual results could vary materially from those estimates.
Allowances for Doubtful Accounts Receivable:
We maintain an allowance for doubtful accounts for losses that we estimate will arise from our customers’ inability to make required payments. We make estimates of the collectibility of our accounts receivable by considering factors such as historical bad debt experience, specific customer creditworthiness, the age of the accounts receivable balances and current economic trends that may affect a customer’s ability to pay. If the data we use to calculate the allowance for doubtful accounts does not reflect the future ability to collect outstanding receivables, additional provisions for doubtful accounts may be needed and our results of operations could be materially affected.
Valuation of Inventories:
Management periodically reviews the adequacy of our inventory reserves. We record a write-down for our inventories which have become obsolete or are in excess of anticipated demand or net realizable value. We perform a detailed review of inventories each quarter that considers multiple factors including demand forecasts, product life cycle status, product development plans and current sales levels. As of January 3, 2010, we had total raw materials of $11.6 million, work-in-process of $56.9 million and finished goods of $22.7 million. Inventory reserves are not relieved until the related inventory has been sold or scrapped. Our inventories may be subject to rapid technological obsolescence and are sold in a highly competitive industry. If there were a sudden and significant decrease in demand for our products, or if there were a higher incidence of inventory obsolescence because of rapidly changing technology and customer requirements, we could be required to record additional write-downs, and our gross margin could be adversely affected.
Valuation of Long-Lived Assets:
Our business requires heavy investment in manufacturing facilities and equipment that are technologically advanced but can quickly become significantly under-utilized or rendered obsolete by rapid changes in demand. In addition, we have recorded intangible assets with finite lives related to our acquisitions.
We evaluate our long-lived assets, including property, plant and equipment and purchased intangible assets with finite lives, for impairment whenever events or changes in circumstances indicate that the carrying value of such assets may not be recoverable. Factors considered important that could result in an impairment review include significant underperformance relative to expected historical or projected future operating results, significant changes in the manner of use of the assets or the strategy for our business, significant negative industry or economic trends, and a significant decline in our stock price for a sustained period of time. Impairments are recognized based on the difference between the fair value of the asset and its carrying value, and fair value is generally measured based on discounted cash flow analysis. If there is a significant adverse change
60
Table of Contents
in our business in the future, we may be required to record impairment charges on our long-lived assets. During the fourth quarter of fiscal 2009, we performed an impairment analysis for our long-lived assets and determined that there was no impairment.
Valuation of Goodwill:
We tested our goodwill on the reporting unit level. We have one reporting unit in our Consumer and Computation Division that has goodwill.
Management determines the fair value of our reporting unit using a combination of the income approach, which is based on a discounted cash flow analysis of the reporting unit, and the market approach, which is based on a competitor multiple assessment, if available. For our reporting unit, we weight the income approach 75% and the market approach 25%. The assumptions supporting the estimated future cash flows, including the discount rates, estimated terminal values and five-year annual growth rates, reflect management’s best estimates. The discount rates were based upon our weighted average cost of capital as adjusted for the risks associated with our operations.
We review goodwill for impairment annually and whenever events or changes in circumstances indicate the carrying value of goodwill may not be recoverable. Determining the fair value of a reporting unit is judgmental in nature and involves the use of significant estimates and assumptions. These estimates and assumptions include revenue growth rates and operating margins used to calculate projected future cash flows, risk-adjusted discount rates, future economic and market conditions and determination of appropriate market comparables. We base our fair value estimates on assumptions we believe to be reasonable. Actual future results may differ from those estimates. In addition, we make certain judgments and assumptions in allocating shared assets and liabilities to determine the carrying values for our reporting unit. We performed our annual assessment of the carrying value of our goodwill balance during the fourth quarter of fiscal 2009. Our annual assessment did not result in an impairment charge. In fiscal 2008, as a result of the significant negative industry and economic trends affecting our operations and expected future growth as well as the general decline of industry valuations impacting our assessment, we determined that a portion of our goodwill was other-than-temporarily impaired and recorded an impairment loss of $351.3 million.
If our assumptions regarding forecasted revenue or growth rates on our remaining reporting unit are not achieved, we may be required to record additional goodwill impairment charges in future periods.
Fair Value of Financial Instruments:
Effective December 31, 2007, we adopted the provisions of the accounting guidance, which defines fair value as the price that would be received to sell an asset or paid to transfer a liability in an orderly transaction between market participants at the measurement date. Our financial assets and financial liabilities that require recognition under the guidance include available-for-sale investments, employee deferred compensation plan and foreign currency derivatives. The guidance establishes a hierarchy for inputs used in measuring fair value that maximizes the use of observable inputs and minimizes the use of unobservable inputs by requiring that the observable inputs be used when available. Observable inputs are inputs that market participants would use in pricing the asset or liability developed based on market data obtained from sources independent of us. Unobservable inputs are inputs that reflect our assumptions about the assumptions market participants would use in pricing the asset or liability developed based on the best information available in the circumstances. As such, fair value is a market-based measure considered from the perspective of a market participant who holds the asset or owes the liability rather than an entity-specific measure. The hierarchy is broken down into three levels based on the reliability of inputs as follows:
| Ÿ | Level 1—Valuations based on quoted prices in active markets for identical assets or liabilities that we have the ability to access. Since valuations are based on quoted prices that are readily and regularly available in an active market, valuation of these products does not entail a significant degree of judgment. Financial assets utilizing Level 1 inputs include U.S. treasuries, most money market funds, marketable equity securities and our employee deferred compensation plan; |
61
Table of Contents
| Ÿ | Level 2—Valuations based on quoted prices in markets that are not active or for which all significant inputs are observable, directly or indirectly. Financial assets and liabilities utilizing Level 2 inputs include foreign currency forward exchange contracts, most commercial paper and corporate notes and bonds; and |
| Ÿ | Level 3—Valuations based on inputs that are unobservable and significant to the overall fair value measurement. Financial assets utilizing Level 3 inputs primarily include auction rate securities. We use an income approach valuation model to estimate the exit price of the auction rate securities, which is derived as the weighted-average present value of expected cash flows over various periods of illiquidity, using a risk adjusted discount rate that is based on the credit risk and liquidity risk of the securities. |
Availability of observable inputs can vary from instrument to instrument and to the extent that valuation is based on inputs that are less observable or unobservable in the market, the determination of fair value requires more judgment. Accordingly, the degree of judgment exercised by our management in determining fair value is greatest for instruments categorized in Level 3. In certain cases, the inputs used to measure fair value may fall into different levels of the fair value hierarchy. In such cases, for disclosure purposes the level in the fair value hierarchy within which the fair value measurement in its entirety falls is determined based on the lowest level input that is significant to the fair value measurement in its entirety. In regards to our auction rate securities, the income approach valuation model was based on both Level 2 (credit quality and interest rates) and Level 3 inputs. We determined that the Level 3 inputs were the most significant to the overall fair value measurement, particularly the estimates of risk adjusted discount rates and ranges of expected periods of illiquidity.
Stock-Based Compensation:
Under the fair value recognition provisions of the guidance, we recognize stock-based compensation net of an estimated forfeiture rate and only recognize compensation cost for those shares expected to vest over the requisite service period of the awards. Determining the appropriate fair value model and calculating the fair value of share-based payment awards require the input of highly subjective assumptions, including the expected life of the share-based payment awards and stock price volatility. The assumptions used in calculating the fair value of share-based payment awards represent management’s best estimates, but these estimates involve inherent uncertainties and the application of management judgment. As a result, if factors change and we use different assumptions, our stock-based compensation expense could be materially different in the future. In addition, we are required to estimate the expected forfeiture rate and only recognize expense for those shares expected to vest. If our actual forfeiture rate is materially different from our estimate, our future stock-based compensation expense could be significantly different from what we have recorded.
Litigation and Settlement Costs:
From time to time, we are involved in legal actions arising in the ordinary course of business. We are aggressively defending our current litigation matters. However, there are many uncertainties associated with any litigation, and we cannot be certain that these actions or other third-party claims against us will be resolved without costly litigation and/or substantial settlement payments. If that occurs, our business, financial condition and results of operations could be materially and adversely affected. If information becomes available that causes us to determine that a loss in any of our pending litigation is probable, and we can reasonably estimate the loss associated with such litigation, we will record the loss in accordance with accounting principles generally accepted in the United States. However, the actual liability in any such litigation may be materially different from our estimates, which could require us to record additional legal costs.
Accounting for Income Taxes:
Our global operations involve manufacturing, research and development and selling activities. Profits from non-U.S. activities are subject to local country taxes but are not subject to U.S. tax until repatriated to the U.S. It is our intention to permanently reinvest these earnings outside the U.S. We record a valuation allowance to reduce our deferred tax assets to the amount that is more likely than not to be realized. We consider historical levels of income, expectations and risks associated with estimates of future taxable income and ongoing prudent
62
Table of Contents
and feasible tax planning strategies in assessing the need for the valuation allowance. Should we determine that we would be able to realize deferred tax assets in the future in excess of the net recorded amount, we would record an adjustment to the deferred tax asset valuation allowance. This adjustment would increase income in the period such determination is made.
The calculation of tax liabilities involves dealing with uncertainties in the application of complex global tax regulations. We recognize potential liabilities for anticipated tax audit issues in the U.S. and other tax jurisdictions based on our estimate of whether, and the extent to which, additional taxes will be due. If payment of these amounts ultimately proves to be unnecessary, the reversal of the liabilities would result in tax benefits being recognized in the period when we determine the liabilities are no longer necessary. If the estimate of tax liabilities proves to be less than the ultimate tax assessment, a further charge to expense would result.
ITEM 7A. QUANTITATIVE AND QUALITATIVE DISCLOSURE ABOUT MARKET RISK
Interest Rate Risks
Our investment portfolio consists of a variety of financial instruments that exposes us to interest rate risk, including, but not limited to, money market funds, commercial paper and corporate securities. These investments are generally classified as available-for-sale and, consequently, are recorded on our balance sheets at fair market value with their related unrealized gain or loss reflected as a component of accumulated other comprehensive income in stockholders’ equity. Due to the relatively short-term nature of our investment portfolio, we do not believe that an immediate 10% increase in interest rates would have a material effect on the fair market value of our portfolio. Since we believe we have the ability to liquidate this portfolio, we do not expect our operating results or cash flows to be materially affected to any significant degree by a sudden change in market interest rates on our investment portfolio.
Auction Rate Securities
As of January 3, 2010, all our auction rate securities are classifies as Level 3 financial instruments. Auction rate securities are investments with contractual maturities generally between 20 and 30 years. The auction rate securities held by us are primarily backed by student loans and are over-collateralized, insured and guaranteed by the U.S. Federal Department of Education.
As of January 3, 2010, 95% of our auction rate securities held by us were rated as either AAA or Aaa by the major independent rating agencies and approximately 5% of the student loan auction rate securities have been downgraded from AAA or Aaa to Baa3. The downgrade event was due to the higher rates the issuer is paying out versus the lending rates, which is preventing the issuer from building excess spread as required under the prospectus. If the financial market continues to deteriorate, future downgrades could potentially impact the rating of our auction rate securities.
As of January 3, 2010, all of our auction rate securities have experienced failed auctions due to sell orders exceeding buy orders. These failures are not believed to be a credit issue with the underlying investments, but rather caused by a lack of liquidity. Under the contractual terms, the issuer is obligated to pay penalty rates should an auction fail. The funds associated with failed auctions are not expected to be accessible until one of the following occurs: a successful auction occurs, the issuer redeems the issue, a buyer is found outside of the auction process or the underlying securities have matured. Given these circumstances and the lack of liquidity, we have classified our auction rate securities totaling $32.7 million as long-term investments as of January 3, 2010.
During fiscal 2009, we performed analyses to assess the fair value of the auction rate securities. In the absence of a liquid market to value these securities, we prepared a valuation model based on discounted cash flows. The assumptions used at January 3, 2010 were as follows:
| Ÿ | 7 years to liquidity; |
63
Table of Contents
| Ÿ | continued receipt of contractual interest which provides a premium spread for failed auctions; and |
| Ÿ | discount rates of 2.31%—5.78%, which incorporates a spread for both credit and liquidity risk. |
Based on these assumptions, we estimated that the auction rate securities would be valued at approximately 90% of their stated par value as of January 3, 2010, representing a decline in value of approximately $3.7 million. As a result of our adoption of new guidance in the second quarter of 2009, we reclassified the non-credit portion of the previously recognized other-than-temporary impairment losses related to our auction rate securities of $5.3 million from accumulated deficit to accumulated other comprehensive income (loss).
The following table summarizes certain information related to our auction rate securities as of January 3, 2010:
| Fair Value | Fair Value Given a 100 Basis Point Increase in Interest Rates |
Fair Value Given a 100 Basis Point Decrease in Interest Rates | |||||||
| (In thousands) | |||||||||
| Auction rate securities |
$ | 32,740 | $ | 36,014 | $ | 29,466 | |||
Investments in Publicly Traded and Privately Held Companies
We have equity investments in certain publicly traded companies. The marketable equity securities are classified as available-for-sale investments and are recorded at fair value with unrealized gain (loss) reported as a component in “Accumulated other comprehensive income (loss)” in the Consolidated Balance Sheets. The fair value of the common stock is subject to market price volatility. The following table summarizes certain information related to these investments as of January 3, 2010:
| Investments |
Fair Value | Fair Value Given a 10% Increase in Stock Prices |
Fair Value Given a 10% Decrease in Stock Prices | ||||||
| (In thousands) | |||||||||
| Marketable equity securities |
$ | 5,053 | $ | 5,558 | $ | 4,548 | |||
We also have equity investments in several privately held companies, many of which are start-ups or in development stages. These investments are inherently risky as the market for the technologies or products they have under development are typically in the early stages and may never materialize. As our equity investments generally do not permit us to exert significant influence or control, these amounts generally represent our cost of the investments, less any adjustments we make when we determine that an investment’s net realizable value is less than its carrying cost. During fiscal 2009, we recorded total impairment charges of $0.8 million related to our investments in certain companies as the carrying value of such investments exceeded the fair value and the decline in value was deemed other-than-temporary. As of January 3, 2010, the carrying value of our investments in privately held companies was $0.4 million.
Foreign Currency Exchange Risk
We operate and sell products in various global markets. As a result, we are exposed to risks associated with changes in foreign currency exchange rates. Changes in exchange rates between foreign currencies and the U.S. dollar may adversely affect our operating margins. For example, when foreign currencies appreciate against the U.S. dollar, expenses denominated in foreign currencies become more expensive. An increase in the value of the U.S. dollar relative to foreign currencies could make our products more expensive for international customers, thus potentially leading to a reduction in demand, sales and profitability. Furthermore, many of our competitors are non U.S. companies that could benefit from such a currency fluctuation, making it more difficult for us to compete with those companies. Historically we have limited our hedging activities to the balance sheet using currency forward contracts between U.S. dollars and EURO as our revenue and expenses are predominantly recorded in the U.S. dollar except for local expenses outside the U.S.
64
Table of Contents
ITEM 8. FINANCIAL STATEMENTS AND SUPPLEMENTARY DATA
INDEX TO CONSOLIDATED FINANCIAL STATEMENTS
| Page | ||
| 66 | ||
| 67 | ||
| 68 | ||
| 70 | ||
| 72 | ||
| 119 | ||
| 129 |
65
Table of Contents
CYPRESS SEMICONDUCTOR CORPORATION
CONSOLIDATED BALANCE SHEETS
| January 3, 2010 |
December 28, 2008 |
|||||||
| (In thousands, except per-share amounts) |
||||||||
| ASSETS | ||||||||
| Current assets: |
||||||||
| Cash and cash equivalents |
$ | 243,558 | $ | 204,749 | ||||
| Short-term investments |
56,084 | 33,043 | ||||||
| Total cash, cash equivalents and short-term investments |
299,642 | 237,792 | ||||||
| Accounts receivable, net |
86,959 | 91,943 | ||||||
| Inventories |
91,198 | 114,862 | ||||||
| Other current assets |
40,906 | 60,755 | ||||||
| Total current assets |
518,705 | 505,352 | ||||||
| Property, plant and equipment, net |
272,620 | 296,789 | ||||||
| Goodwill |
31,836 | 31,836 | ||||||
| Intangible assets, net |
15,132 | 18,678 | ||||||
| Other long-term assets |
74,215 | 76,077 | ||||||
| Total assets |
$ | 912,508 | $ | 928,732 | ||||
| LIABILITIES AND STOCKHOLDERS’ EQUITY | ||||||||
| Current liabilities: |
||||||||
| Accounts payable |
$ | 61,712 | $ | 42,570 | ||||
| Accrued compensation and employee benefits |
37,756 | 44,115 | ||||||
| Deferred revenues less cost of revenues |
75,881 | 82,465 | ||||||
| Income taxes payable |
7,090 | 4,214 | ||||||
| Convertible debt |
— | 27,023 | ||||||
| Other current liabilities |
56,623 | 63,595 | ||||||
| Total current liabilities |
239,062 | 263,982 | ||||||
| Deferred income taxes and other tax liabilities |
39,272 | 22,586 | ||||||
| Other long-term liabilities |
3,790 | 3,737 | ||||||
| Total liabilities |
282,124 | 290,305 | ||||||
| Commitments and contingencies (Note 19) |
||||||||
| Stockholders’ equity: |
||||||||
| Preferred stock, $.01 par value, 5,000 shares authorized; none issued and outstanding |
— | — | ||||||
| Common stock, $.01 par value, 650,000 and 650,000 shares authorized; 235,409 and 204,849 shares issued; 159,382 and 136,503 shares outstanding at January 3, 2010 and December 28, 2008, respectively |
2,354 | 2,048 | ||||||
| Additional paid-in-capital |
2,247,716 | 2,044,936 | ||||||
| Accumulated other comprehensive income (loss) |
(723 | ) | 2,533 | |||||
| Accumulated deficit |
(569,744 | ) | (424,631 | ) | ||||
| 1,679,603 | 1,624,886 | |||||||
| Less: shares of common stock held in treasury, at cost; 76,027 and 68,346 shares at January 3, 2010 and December 28, 2008, respectively |
(1,048,016 | ) | (986,202 | ) | ||||
| Total Cypress stockholders’ equity |
631,587 | 638,684 | ||||||
| Noncontrolling interest |
(1,203 | ) | (257 | ) | ||||
| Total stockholders’ equity |
630,384 | 638,427 | ||||||
| Total liabilities and stockholders’ equity |
$ | 912,508 | $ | 928,732 | ||||
The accompanying notes are an integral part of these consolidated financial statements.
66
Table of Contents
CYPRESS SEMICONDUCTOR CORPORATION
CONSOLIDATED STATEMENTS OF OPERATIONS
| Year Ended | ||||||||||||
| January 3, 2010 |
December 28, 2008 |
December 30, 2007 |
||||||||||
| (In thousands, except per-share amounts) | ||||||||||||
| Revenues |
$ | 667,786 | $ | 765,716 | $ | 821,597 | ||||||
| Costs and expenses (credits): |
||||||||||||
| Cost of revenues |
397,204 | 426,284 | 448,847 | |||||||||
| Research and development |
181,189 | 193,522 | 174,240 | |||||||||
| Selling, general and administrative |
219,602 | 248,579 | 194,545 | |||||||||
| Amortization of acquisition-related intangible assets |
3,804 | 5,830 | 7,901 | |||||||||
| Impairment of goodwill |
— | 351,257 | — | |||||||||
| Impairment related to synthetic lease |
— | — | 7,006 | |||||||||
| Restructuring charges |
15,242 | 21,643 | 583 | |||||||||
| Gain on divestitures |
— | (9,966 | ) | (17,958 | ) | |||||||
| Total costs and expenses, net |
817,041 | 1,237,149 | 815,164 | |||||||||
| Operating income (loss) |
(149,255 | ) | (471,433 | ) | 6,433 | |||||||
| Interest income |
2,101 | 21,904 | 38,644 | |||||||||
| Interest expense |
(1,190 | ) | (26,786 | ) | (30,385 | ) | ||||||
| Gain on sale of SunPower common stock |
— | 192,048 | 373,173 | |||||||||
| Other income (expense), net |
3,774 | (27,066 | ) | (15,397 | ) | |||||||
| Income (loss) from continuing operations before income taxes |
(144,570 | ) | (311,333 | ) | 372,468 | |||||||
| Income tax provision |
(5,854 | ) | (7,929 | ) | (5,606 | ) | ||||||
| Income (loss) from continuing operations |
(150,424 | ) | (319,262 | ) | 366,862 | |||||||
| Income from discontinued operations attributable to Cypress |
— | 34,386 | 16,057 | |||||||||
| Income from discontinued operations–noncontrolling interest, net of taxes |
— | 34,154 | 12,681 | |||||||||
| Noncontrolling interest, net of income taxes |
(946 | ) | (311 | ) | (19 | ) | ||||||
| Net income (loss) |
(151,370 | ) | (251,033 | ) | 395,581 | |||||||
| Less net (income) loss attributable to noncontrolling interest |
946 | (33,843 | ) | (12,662 | ) | |||||||
| Net income (loss) attributable to Cypress |
$ | (150,424 | ) | $ | (284,876 | ) | $ | 382,919 | ||||
| Net income (loss) per share–basic: |
||||||||||||
| Continuing operations attributable to Cypress |
$ | (1.03 | ) | $ | (2.12 | ) | $ | 2.36 | ||||
| Discontinued operations attributable to Cypress |
— | 0.23 | 0.10 | |||||||||
| Net income (loss) per share–basic |
$ | (1.03 | ) | $ | (1.89 | ) | $ | 2.46 | ||||
| Net income (loss) per share–diluted: |
||||||||||||
| Continuing operations attributable to Cypress |
$ | (1.03 | ) | $ | (2.12 | ) | $ | 2.13 | ||||
| Discontinued operations attributable to Cypress |
— | 0.23 | 0.10 | |||||||||
| Net income (loss) per share–diluted |
$ | (1.03 | ) | $ | (1.89 | ) | $ | 2.23 | ||||
| Shares used in net income (loss) per share calculation: |
||||||||||||
| Basic |
145,611 | 150,447 | 155,559 | |||||||||
| Diluted |
145,611 | 150,447 | 171,836 | |||||||||
The accompanying notes are an integral part of these consolidated financial statements.
67
Table of Contents
CYPRESS SEMICONDUCTOR CORPORATION
CONSOLIDATED STATEMENTS OF STOCKHOLDERS’ EQUITY
| Common Stock | Additional Paid-In Capital |
Accumulated Other Comprehensive Income (Loss) |
Accumulated Deficit |
Treasury Stock | Noncontrolling Interest |
Total Stockholders’ Equity |
|||||||||||||||||||||||||
| Shares | Amount | Shares | Amount | ||||||||||||||||||||||||||||
| (In thousands) | |||||||||||||||||||||||||||||||
| Balances at December 31, 2006 |
145,071 | $ | 1,451 | $ | 1,591,771 | $ | (1,293 | ) | $ | (504,466 | ) | 227 | $ | (2,538 | ) | $ | 73 | $ | 1,084,998 | ||||||||||||
| Comprehensive income: |
|||||||||||||||||||||||||||||||
| Net income attributable to Cypress |
— | — | — | — | 382,919 | — | — | — | 382,919 | ||||||||||||||||||||||
| Net unrealized gain on available-for-sale investments |
— | — | — | 5,274 | — | — | — | — | 5,274 | ||||||||||||||||||||||
| Net unrealized loss on derivatives |
— | — | — | (212 | ) | — | — | — | — | (212 | ) | ||||||||||||||||||||
| Total comprehensive income |
— | — | — | — | — | — | — | — | 387,981 | ||||||||||||||||||||||
| Issuance of common shares under employee stock plans |
14,216 | 142 | 210,012 | — | — | — | — | — | 210,154 | ||||||||||||||||||||||
| Withholding of common shares for tax obligations on vested restricted shares |
— | — | — | — | — | 44 | (1,159 | ) | — | (1,159 | ) | ||||||||||||||||||||
| Redemption of convertible debt |
33,045 | 330 | 418,931 | — | — | — | — | — | 419,261 | ||||||||||||||||||||||
| Repurchases of common shares |
— | — | — | — | — | 28,862 | (571,033 | ) | — | (571,033 | ) | ||||||||||||||||||||
| Purchase of convertible note hedge, net of issuance of warrants |
— | — | (16,967 | ) | — | — | — | — | — | (16,967 | ) | ||||||||||||||||||||
| Stock-based compensation |
— | — | 63,146 | — | — | — | — | — | 63,146 | ||||||||||||||||||||||
| Adjustments to accumulated deficit upon adoption of ASC 710 and ASC 740 |
— | — | — | — | (4,961 | ) | — | — | — | (4,961 | ) | ||||||||||||||||||||
| Shares received upon settlement of equity option contract |
— | — | 25,991 | — | — | 1,442 | (25,991 | ) | — | — | |||||||||||||||||||||
| Shares received upon settlement outstanding employee loans under the stock purchase assistance plan |
— | — | — | — | — | 84 | (2,912 | ) | — | (2,912 | ) | ||||||||||||||||||||
| Change of interest and noncontrolling interest of discontinued operations |
— | — | 173,687 | 7,863 | (10,745 | ) | — | (1,975 | ) | (19 | ) | 168,811 | |||||||||||||||||||
| Adjustment for convertible debt |
— | — | 34,118 | — | — | — | — | — | 34,118 | ||||||||||||||||||||||
| Other |
— | — | 926 | — | — | 25 | (500 | ) | — | 426 | |||||||||||||||||||||
| Balances at December 30, 2007 |
192,332 | 1,923 | 2,501,615 | 11,632 | (137,253 | ) | 30,684 | (606,108 | ) | 54 | 1,771,863 | ||||||||||||||||||||
| Comprehensive loss: |
|||||||||||||||||||||||||||||||
| Net loss attributable to Cypress |
— | — | — | — | (284,876 | ) | — | — | — | (284,876 | ) | ||||||||||||||||||||
| Net unrealized loss on available-for-sale investments |
— | — | — | (3,125 | ) | — | — | — | — | (3,125 | ) | ||||||||||||||||||||
| Net unrealized loss on derivatives |
— | — | — | (212 | ) | — | — | — | — | (212 | ) | ||||||||||||||||||||
| Total comprehensive loss |
— | — | — | — | — | — | — | — | (288,213 | ) | |||||||||||||||||||||
| Issuance of common shares under employee stock plans |
12,517 | 125 | 55,522 | — | — | — | — | — | 55,647 | ||||||||||||||||||||||
| Withholding of common shares for tax obligations on vested restricted shares |
— | — | — | — | — | 573 | (6,163 | ) | — | (6,163 | ) | ||||||||||||||||||||
| Excess tax benefits from stock-based award activities |
— | — | 9,132 | — | — | — | — | — | 9,132 | ||||||||||||||||||||||
| Proceeds from termination of convertible note hedge and warrants |
— | — | 7,762 | — | — | — | — | — | 7,762 | ||||||||||||||||||||||
| Repurchases of common shares |
— | — | — | — | — | 37,076 | (375,560 | ) | — | (375,560 | ) | ||||||||||||||||||||
| Stock-based compensation |
— | — | 128,798 | — | — | — | — | — | 128,798 | ||||||||||||||||||||||
| Noncontrolling interest and other |
— | — | (18 | ) | — | — | — | — | (311 | ) | (329 | ) | |||||||||||||||||||
| Shares received upon settlement of outstanding employee loans under the stock purchase assistance plan |
— | — | — | — | — | 13 | (347 | ) | — | (347 | ) | ||||||||||||||||||||
| Adjustment for convertible debt |
— | — | (200,242 | ) | — | — | — | — | — | (200,242 | ) | ||||||||||||||||||||
| Spin-off of SunPower |
— | — | (457,633 | ) | (5,762 | ) | (2,502 | ) | — | 1,976 | — | (463,921 | ) | ||||||||||||||||||
| Balances at December 28, 2008 |
204,849 | $ | 2,048 | $ | 2,044,936 | $ | 2,533 | $ | (424,631 | ) | 68,346 | $ | (986,202 | ) | $ | (257 | ) | $ | 638,427 | ||||||||||||
68
Table of Contents
CYPRESS SEMICONDUCTOR CORPORATION
CONSOLIDATED STATEMENTS OF STOCKHOLDERS’ EQUITY (CONTINUED)
| Common Stock | Additional Paid-In Capital |
Accumulated Other Comprehensive Income (Loss) |
Accumulated Deficit |
Treasury Stock | Noncontrolling Interest |
Total Stockholders’ Equity |
|||||||||||||||||||||||||
| Shares | Amount | Shares | Amount | ||||||||||||||||||||||||||||
| (In thousands) | |||||||||||||||||||||||||||||||
| Balances at December 28, 2008 |
204,849 | $ | 2,048 | $ | 2,044,936 | $ | 2,533 | $ | (424,631 | ) | 68,346 | $ | (986,202 | ) | $ | (257 | ) | $ | 638,427 | ||||||||||||
| Comprehensive loss: |
|||||||||||||||||||||||||||||||
| Net loss attributable to Cypress |
— | — | — | — | (150,424 | ) | — | — | — | (150,424 | ) | ||||||||||||||||||||
| Net unrealized gain on available-for-sale investments |
— | — | — | 1,988 | — | — | — | — | 1,988 | ||||||||||||||||||||||
| Net unrealized gain on derivatives |
— | — | — | 9 | — | — | — | — | 9 | ||||||||||||||||||||||
| Total comprehensive loss |
— | — | — | — | — | — | — | — | (148,427 | ) | |||||||||||||||||||||
| Issuance of common shares under employee stock plans |
30,560 | 306 | 101,332 | — | — | — | — | — | 101,638 | ||||||||||||||||||||||
| Withholding of common shares for tax obligations on vested restricted shares |
— | — | — | — | — | 1,890 | (15,493 | ) | — | (15,493 | ) | ||||||||||||||||||||
| Redemption of convertible debt |
— | — | (23,553 | ) | — | — | — | — | — | (23,553 | ) | ||||||||||||||||||||
| Unwinding of hedge for convertible debt |
— | — | 3,312 | — | — | — | — | — | 3,312 | ||||||||||||||||||||||
| Yield enhancement structured agreements |
— | — | 1,048 | — | — | — | — | — | 1,048 | ||||||||||||||||||||||
| Repurchases of common shares |
— | — | — | — | — | 5,791 | (46,321 | ) | — | (46,321 | ) | ||||||||||||||||||||
| Stock-based compensation, net |
— | — | 120,662 | — | — | — | — | — | 120,662 | ||||||||||||||||||||||
| Reclassification of impairment loss on auction rate securities |
— | — | — | (5,253 | ) | 5,253 | — | — | — | — | |||||||||||||||||||||
| Noncontrolling interest and other |
— | — | (21 | ) | — | 58 | — | — | (946 | ) | (909 | ) | |||||||||||||||||||
| Balances at January 3, 2010 |
235,409 | $ | 2,354 | $ | 2,247,716 | $ | (723 | ) | $ | (569,744 | ) | 76,027 | $ | (1,048,016 | ) | $ | (1,203 | ) | $ | 630,384 | |||||||||||
The accompanying notes are an integral part of these consolidated financial statements.
69
Table of Contents
CYPRESS SEMICONDUCTOR CORPORATION
CONSOLIDATED STATEMENTS OF CASH FLOWS
| Year Ended | ||||||||||||
| January 3, 2010 |
December 28, 2008 |
December 30, 2007 |
||||||||||
| (In thousands) | ||||||||||||
| Cash flows from operating activities: |
||||||||||||
| Net income (loss) |
$ | (151,370 | ) | $ | (251,033 | ) | $ | 395,581 | ||||
| Less income from discontinued operations, net of taxes |
— | (68,540 | ) | (28,738 | ) | |||||||
| Income (loss) from continuing operations |
$ | (151,370 | ) | $ | (319,573 | ) | $ | 366,843 | ||||
| Adjustments to reconcile income (loss) from continuing operations to net cash provided by operating activities of continuing operations: |
||||||||||||
| Depreciation and amortization |
55,799 | 73,876 | 91,683 | |||||||||
| Stock-based compensation expense |
141,812 | 122,345 | 61,392 | |||||||||
| Interest and other non-cash expense related to ASC 470 |
1,090 | (147,044 | ) | 11,996 | ||||||||
| (Gain)/loss on extinguishment of debt |
— | (2,193 | ) | 2,927 | ||||||||
| Excess tax benefits from stock-based award activities |
— | (9,132 | ) | — | ||||||||
| Impairment of goodwill |
— | 351,257 | — | |||||||||
| Impairment related to synthetic lease |
— | — | 7,006 | |||||||||
| Impairment of investments |
2,549 | 13,355 | 1,903 | |||||||||
| Write-off of debt issuance costs |
— | 4,800 | 4,226 | |||||||||
| Loss on property and equipment, net |
2,146 | 8,004 | 245 | |||||||||
| Gain on divestitures |
— | (9,966 | ) | (17,958 | ) | |||||||
| Gain on sale of SunPower’s common stock |
— | (192,048 | ) | (373,173 | ) | |||||||
| (Gain)/loss on investments |
(822 | ) | — | (929 | ) | |||||||
| Gain on deferred compensation plan |
— | — | (2,124 | ) | ||||||||
| Interest on the stock purchase assistance plan (“SPAP”) loans |
15 | (12 | ) | (976 | ) | |||||||
| Reduction in allowance for uncollectible SPAP loans |
(426 | ) | (198 | ) | (7,479 | ) | ||||||
| Restructuring charges |
15,242 | 21,643 | 583 | |||||||||
| Deferred income taxes |
2,056 | (26,443 | ) | 5,797 | ||||||||
| Changes in operating assets and liabilities, net of effects of acquisitions and divestitures: |
||||||||||||
| Accounts receivable |
4,983 | 7,532 | 13,991 | |||||||||
| Inventories |
18,276 | (1,015 | ) | (10,289 | ) | |||||||
| Other assets |
18,810 | 67,850 | (42,787 | ) | ||||||||
| Accounts payable and other accrued liabilities |
(14,273 | ) | 103,713 | 22,753 | ||||||||
| Deferred revenues less cost of revenues |
(6,584 | ) | 43,966 | (6,465 | ) | |||||||
| Net cash provided by operating activities of continuing operations |
89,303 | 110,717 | 129,165 | |||||||||
| Net cash provided by operating activities of discontinued operations |
— | 107,845 | 2,372 | |||||||||
| Net cash provided by operating activities |
89,303 | 218,562 | 131,537 | |||||||||
| Cash flows from investing activities: |
||||||||||||
| Purchases of available-for-sale investments |
(46,768 | ) | (176,458 | ) | (311,824 | ) | ||||||
| Proceeds from sales or maturities of available-for-sale investments |
24,445 | 362,247 | 202,478 | |||||||||
| Proceeds from sale of SunPower’s common stock |
— | 222,474 | 437,250 | |||||||||
| Increase (decrease) in employee deferred compensation plan |
(665 | ) | 1,417 | 76 | ||||||||
| Cash paid for other investments |
(76 | ) | (1,737 | ) | (867 | ) | ||||||
| Acquisition of property, plant and equipment |
(25,823 | ) | (42,132 | ) | (36,779 | ) | ||||||
| Cash used for acquisitions, net of cash acquired |
— | (41,551 | ) | — | ||||||||
| Proceeds from divestitures |
— | 11,000 | 78,398 | |||||||||
| Proceeds from settlement of SPAP loan principal |
45 | 334 | 27,585 | |||||||||
| Proceeds from deferred compensation plan |
— | — | 6,608 | |||||||||
| Proceeds from sales of property and equipment |
5,716 | 1,782 | 43 | |||||||||
| Net cash provided by (used in) investing activities of continuing operations |
(43,126 | ) | 337,376 | 402,968 | ||||||||
| Net cash used in investing activities of discontinued operations |
— | (167,111 | ) | (474,118 | ) | |||||||
| Net cash provided by (used in) investing activities |
(43,126 | ) | 170,265 | (71,150 | ) | |||||||
70
Table of Contents
CYPRESS SEMICONDUCTOR CORPORATION
CONSOLIDATED STATEMENTS OF CASH FLOWS (CONTINUED)
| Year Ended | ||||||||||||
| January 3, 2010 |
December 28, 2008 |
December 30, 2007 |
||||||||||
| (In thousands) | ||||||||||||
| Cash flows from financing activities: |
||||||||||||
| Excess tax benefits from stock-based award activities |
— | 9,132 | — | |||||||||
| Withholding of common shares for tax obligations on vested restricted shares |
(15,493 | ) | (6,163 | ) | (1,159 | ) | ||||||
| Redemption of convertible debt |
(51,552 | ) | (742,605 | ) | (179,735 | ) | ||||||
| Proceeds from issuance of convertible debt |
— | — | 600,000 | |||||||||
| Debt issuance costs |
— | — | (12,890 | ) | ||||||||
| Purchase of convertible note hedge, net of proceeds from issuance of warrants |
— | — | (16,967 | ) | ||||||||
| Proceeds from termination of convertible note hedge and warrants |
3,312 | 7,762 | — | |||||||||
| Repurchase of common shares |
(46,321 | ) | (375,560 | ) | (571,033 | ) | ||||||
| Issuance of common shares and re-issuance of treasury shares under employee stock plans |
101,638 | 55,647 | 210,154 | |||||||||
| Yield enhancement structured agreements |
1,048 | — | — | |||||||||
| Net cash provided by (used in) financing activities of continuing operations |
(7,368 | ) | (1,051,787 | ) | 28,370 | |||||||
| Net cash provided by financing activities of discontinued operations |
— | 31,832 | 584,625 | |||||||||
| Net cash provided by (used in) financing activities |
(7,368 | ) | (1,019,955 | ) | 612,995 | |||||||
| Effect of exchange rate changes on cash and cash equivalents |
— | (1,163 | ) | 6,739 | ||||||||
| Net increase (decrease) in cash and cash equivalents |
38,809 | (632,291 | ) | 680,121 | ||||||||
| Cash and cash equivalents, beginning of year |
204,749 | 1,093,657 | 413,536 | |||||||||
| Cash and cash equivalents, end of year |
243,558 | 461,366 | 1,093,657 | |||||||||
| Less cash and cash equivalents of discontinued operations |
— | (256,617 | ) | (285,214 | ) | |||||||
| Cash and cash equivalents of continuing operations, end of year |
$ | 243,558 | $ | 204,749 | $ | 808,443 | ||||||
| Supplemental disclosures: |
||||||||||||
| Cash paid for interest: |
||||||||||||
| Continuing operations |
$ | 305 | $ | 6,181 | $ | 3,033 | ||||||
| Discontinued operations |
— | 4,856 | 3,316 | |||||||||
| Total |
$ | 305 | $ | 11,037 | $ | 6,349 | ||||||
| Cash paid for income taxes: |
||||||||||||
| Continuing operations |
$ | 3,433 | $ | 13,703 | $ | 2,786 | ||||||
| Discontinued operations |
— | 1,265 | 887 | |||||||||
| Total |
$ | 3,433 | $ | 14,968 | $ | 3,673 | ||||||
| Non-cash items for continuing operations: |
||||||||||||
| Issuance of common shares from redemption of convertible debt |
$ | — | $ | — | $ | 419,261 | ||||||
| Purchase of properties under the synthetic lease, using restricted cash collateral |
$ | — | $ | — | $ | 50,087 | ||||||
| Non-cash items for discontinued operations: |
||||||||||||
| Issuance of common shares and stock options in connection with acquisition |
$ | — | $ | — | $ | 132,546 | ||||||
The accompanying notes are an integral part of these consolidated financial statements.
71
Table of Contents
CYPRESS SEMICONDUCTOR CORPORATION
NOTES TO CONSOLIDATED FINANCIAL STATEMENTS
NOTE 1. DESCRIPTION OF BUSINESS AND SUMMARY OF SIGNIFICANT ACCOUNTING POLICIES
Description of Business
Cypress Semiconductor Corporation (“Cypress” or the “Company”) designs, develops, manufactures and markets high-performance, mixed-signal, programmable solutions that provide customers with rapid time-to-market and system value. Our offerings include the PSoC® programmable system-on-chip, universal serial bus (“USB”) controllers, general-purpose programmable clocks and memories. We also offer wired and wireless connectivity technologies that enhance connectivity and performance in multimedia handsets. We serve numerous markets including consumer, computation, data communications, automotive, and industrial.
Our operations outside of the United States include our manufacturing facilities, assembly and test plants and a regional headquarters in the Philippines, and sales offices and design centers located in various parts of the world.
Financial Statement Preparation
The consolidated financial statements are prepared in accordance with accounting principles generally accepted in the United States and include the accounts of Cypress and all of our subsidiaries. Inter-company transactions and balances have been eliminated in consolidation.
On September 29, 2008, we completed the spin-off of SunPower Corporation (“SunPower”), a majority owned subsidiary through the distribution of a tax-free stock dividend to our stockholders. As a result, our historical financial statements have been restated to account for SunPower as a discontinued operation for all periods presented in this Annual Report on Form 10-K. See Note 3 for further discussion.
In June 2009, the Financial Accounting Standards Board (“FASB”) approved the FASB Accounting Standards Codification (“the Codification”) as the single source of authoritative nongovernmental generally accepted accounting principles (“GAAP”). All existing accounting standard documents, such as FASB, American Institute of Certified Public Accountants, Emerging Issues Task Force (“EITF”) and other related literature, excluding guidance from the Securities and Exchange Commission (“SEC”), have been superseded by the Codification. All other non-grandfathered, non-SEC accounting literature not included in the Codification has become non authoritative. The Codification did not change GAAP, but instead introduced a new structure that combines all authoritative standards into a comprehensive, topically organized online database. The Codification was effective for interim or annual periods ended after September 15, 2009, and impacted our consolidated financial statements as all future references to authoritative accounting literature will be referenced in accordance with the Codification.
Certain prior year balances have been revised to conform to current year presentation, including the retrospective application of adopting the accounting guidance, under which the liability and equity components of convertible debt instruments that may be settled wholly or partially in cash upon conversion must be accounted for separately in a manner reflective of our nonconvertible debt borrowing rate. Previous guidance provided for accounting for this type of convertible debt instrument entirely as debt. We have retrospectively applied this change in accounting to affected accounts for all periods presented. Refer to Note 2 for more information.
Unless otherwise indicated, the Notes to the Consolidated Financial Statements relate to the discussion of our continuing operations.
72
Table of Contents
Fiscal Years
Our fiscal year ends on the Sunday closest to December 31. Fiscal 2009 ended on January 3, 2010, fiscal 2008 ended on December 28, 2008, and fiscal 2007 ended on December 30, 2007. Fiscal 2009 contained 53 weeks, fiscal 2008 and fiscal 2007 contained 52 weeks.
Management Estimates
The preparation of consolidated financial statements in conformity with accounting principles generally accepted in the United States requires management to make estimates and assumptions that affect the amounts reported in the consolidated financial statements and accompanying notes. Significant estimates and assumptions used in these consolidated financial statements primarily include those related to revenue recognition, inventory valuation, valuation of goodwill and intangible assets, valuation of investments, valuation of stock-based payment awards, allowances for doubtful accounts, warranty reserves, restructuring costs, certain other accrued liabilities and tax valuation allowances. Actual results could differ from those estimates. To the extent there are material differences between the estimates and actual results our future results of operations will be impacted.
Fair Value of Financial Instruments
For certain of our financial instruments, including cash and cash equivalents, accounts receivable, accounts payable and other current liabilities, the carrying amounts approximate their fair value due to the relatively short maturity of these items. Certificates of deposit are carried at cost which approximates fair value based on current interest rates. Investments in available-for-sale securities are carried at fair value. See Note 7 for a detailed discussion of the fair value measurements on our available-for-sale investments and Note 15 regarding the fair value of our convertible debt as of December 28, 2008.
Cash and Cash Equivalents
Highly liquid investments with original or remaining maturities of ninety days or less at the date of purchase are considered cash equivalents.
Investments
All of our investments in debt securities and equity securities in publicly traded companies are classified as available-for-sale securities. Available-for-sale debt securities with maturities greater than twelve months are classified as short-term when they are intended for use in current operations. Investments in available-for-sale securities are reported at fair value with unrealized gains and losses, net of tax, as a component of “Accumulated other comprehensive income (loss)” in the Consolidated Balance Sheets. Our certificates of deposit are non-tradable and are carried at cost. We also have equity investments in privately held companies. These investments are generally carried at cost and are included in “Other assets” in the Consolidated Balance Sheets.
We monitor our investments for impairment periodically and record appropriate reductions in carrying values when the declines are determined to be other-than-temporary. See Note 8 for a detailed discussion of the impairment losses recorded on our investments.
Inventories
Inventories are stated at the lower of standard cost (which approximates actual cost on a first-in, first-out basis) or market. Market is based on estimated net realizable value. We write down our inventories which have become obsolete or are in excess of anticipated demand or net realizable value based upon assumptions about demand forecasts, product life cycle status, product development plans and current sales levels. Inventory reserves are not relieved until the related inventory has been sold or scrapped.
73
Table of Contents
Long-Lived Assets
Property, plant and equipment are stated at cost, less accumulated depreciation. Depreciation is computed for financial reporting purposes using the straight-line method over the estimated useful lives of the assets. Leasehold improvements and leasehold interests are amortized over the shorter of the estimated useful lives of the assets or the remaining term of the lease. Estimated useful lives are as follows:
| Equipment |
2 to 7 years | |
| Buildings and leasehold improvements |
5 to 20 years | |
| Furniture and fixtures |
3 to 7 years |
We evaluate our long-lived assets, including property, plant and equipment and intangible assets with finite lives, for impairment whenever events or changes in circumstances indicate that the carrying value of such assets may not be recoverable. Factors considered important that could result in an impairment review include significant underperformance relative to expected historical or projected future operating results, significant changes in the manner of use of acquired assets, significant negative industry or economic trends, and a significant decline in our stock price for a sustained period of time. Impairment is recognized based on the difference between the fair value of the asset and its carrying value. Fair value is generally measured based on either quoted market prices, if available, appraisals or discounted cash flow analyses.
Goodwill and Intangible Assets
Goodwill and intangible assets with indefinite lives are not amortized but are tested for impairment on an annual basis or whenever events or changes in circumstances indicate that the carrying amount of these assets may not be recoverable. Purchased intangible assets with finite useful lives are amortized using the straight-line method over their estimated useful lives and are reviewed for impairment as discussed above. Refer to Note 6 for more information.
Revenue Recognition
We generate revenues by selling products to distributors, various types of manufacturers including original equipment manufacturers (“OEMs”) and electronic manufacturing service providers (“EMSs”). We recognize revenues on sales to OEMs and EMSs upon shipment provided that persuasive evidence of an arrangement exists, the price is fixed or determinable, title has transferred, collection of resulting receivables is reasonably assured, there are no customer acceptance requirements, and there are no significant remaining obligations.
Sales to certain distributors are made under agreements which provide the distributors with price protection, stock rotation and other allowances under certain circumstances. Given the uncertainties associated with the rights given to these distributors, revenues and costs related to distributor sales are deferred until products are sold by the distributors to the end customers. Revenues are recognized upon receiving notification from the distributors that products have been sold to the end customers. Reported information includes product resale price, quantity and end customer shipment information as well as remaining inventory on hand. At the time of shipment to distributors, we record a trade receivable for the selling price since there is a legally enforceable right to receive payment, relieve inventory for the value of goods shipped since legal title has passed to the distributors, and defer the related margin as deferred income on sales to distributors in the Consolidated Balance Sheets. The effects of distributor price adjustments are recorded as a reduction to deferred income at the time the distributors sell the products to the end customers.
We record as a reduction to revenues reserves for sales returns, price protection and allowances based upon historical experience rates and for any specific known customer amounts. We also provide certain distributors and EMSs with volume-pricing discounts, such as rebates and incentives, which are recorded as a reduction to revenues at the time of sale. Historically these volume discounts have not been significant.
74
Table of Contents
Shipping and Handling Costs
We record costs related to shipping and handling in cost of revenues.
Advertising Costs
Advertising costs consist of development and placement costs of our advertising campaigns and are charged to expense when incurred. Advertising expense was approximately $4.5 million, $7.7 million and $5.7 million for fiscal 2009, 2008 and 2007, respectively.
Foreign Currency Transactions
We use the United States dollar predominately as the functional currency for our foreign entities. Assets and liabilities of these entities are remeasured into the United States dollar using exchange rates in effect at the end of the period, except for non-monetary assets and liabilities, such as property, plant and equipment, which are remeasured using historical exchange rates. Revenues and expenses are remeasured using average exchange rates in effect for the period, except for items related to assets and liabilities, such as depreciation, that are remeasured using historical exchange rates. The resulting gains and losses from foreign currency remeasurement are included in “Other income (expense), net” in the Consolidated Statements of Operations.
Concentration of Credit Risk
Financial instruments that potentially subject us to concentrations of credit risk are primarily cash equivalents, debt investments and trade accounts receivable. Our investment policy requires cash investments to be placed with high-credit quality institutions and limits the amount of credit risk from any one issuer.
We perform ongoing credit evaluations of our customers’ financial condition whenever deemed necessary and generally do not require collateral. We maintain an allowance for doubtful accounts based upon the expected collectability of all accounts receivable. One global distributor accounted for 16% of consolidated accounts receivable as of January 3, 2010. One global distributor accounted for 13% of consolidated accounts receivable as of December 28, 2008. One contract manufacturer for an OEM accounted for 11% of consolidated accounts receivable in 2009. No contract manufacturers accounted for more than 10% of consolidated accounts receivable in 2008.
One global distributor accounted for 14% of our total revenues for fiscal 2009. Two distributors accounted for 13% and 11% of our total revenues for fiscal 2008. Two distributors accounted for 14% and 12% of our total revenues for fiscal 2007. There was no single end customer in 2009, 2008 or 2007 that accounted for more than 10% of total revenue
Income Taxes
The provision for income taxes is determined using the asset and liability approach of accounting for income taxes. Under this approach, deferred taxes represent the future tax consequences expected to occur when the reported amounts of assets and liabilities are recovered or paid. The provision for income taxes represents income taxes paid or payable for the current year plus the change in deferred taxes during the year. Deferred taxes result from differences between the financial and tax basis of our assets and liabilities and are adjusted for changes in tax rates and tax laws when changes are enacted. Valuation allowances are recorded to reduce deferred tax assets when management cannot conclude that it is more likely than not that a tax benefit will be realized.
The calculation of tax liabilities involves dealing with uncertainties in the application of complex global tax regulations. We recognize potential liabilities for anticipated tax audit issues in the United States and other tax jurisdictions based on our estimate of whether, and the extent to which, additional taxes will be due. If payment of these amounts ultimately proves to be unnecessary, the reversal of the liabilities would result in tax benefits being recognized in the period when we determine the liabilities are no longer necessary. If the estimate of tax liabilities proves to be less than the ultimate assessment, a further charge to expense would result.
75
Table of Contents
Recent Accounting Pronouncements
In December 2007, the Financial Accounting Standards Board (“FASB”) issued guidance surrounding noncontrolling interest in consolidated financial statements—an amendment to existing authoritative literature. The newly issued guidance requires recharacterizing minority interests as noncontrolling interests in addition to classifiying noncontrolling interest as a component of equity. The guidance also establishes reporting requirements to provide disclosures that identify and distinguish between the interests of the parent and the interests of noncontrolling owners. This guidance requires retroactive adoption of the presentation and disclosure requirements for existing minority interests—all other requirements are to be applied prospectively. All periods presented in these consolidated financial statements reflect the presentation and disclosure required by this guidance. All other requirements under the guidance are being applied prospectively. We adopted this guidance in the first quarter of fiscal 2009. Except for the presentation and disclosure requirements required by this guidance, there was no impact on our consolidated financial statements.
In May 2008, we adopted new accounting guidance which clarifies the accounting for convertible debt instruments as issued by the FASB. The guidance specifies that an issuer of such instruments should separately account for the liability and equity components of the instruments in a manner that reflects the issuer’s non-convertible debt borrowing rate when interest costs are recognized in subsequent periods. The guidance was effective in the first quarter of 2009, and retrospective application is required for all periods presented. As a result of our adoption of this accounting guidance we recorded additional non-cash interest and other income (expense) of approximately $144.4 million and $(19.1) million during fiscal 2008 and 2007, respectively.
In April 2009, the FASB issued new accounting guidance on how to determine the fair value of assets and liabilities. The accounting guidance relates to determining fair values when there is no active market or where the price inputs being used represent distressed sales. It reaffirms that the objective of fair value measurement is to reflect how much an asset would be sold for in an orderly transaction (as opposed to a distressed forced transaction) at the date of the financial statements under current market conditions. Specifically, it reaffirms the need to use judgment to ascertain if a formerly active market has become inactive and in determining fair values when markets have become inactive. The new guidance was effective in the second quarter of 2009. The adoption of the guidance did not have a material impact on our consolidated financial statements.
In April 2009, the FASB issued new accounting guidance amending the other-than-temporary impairment guidance for debt securities and it improves the presentation and disclosure of other-than-temporary impairments on debt and equity securities in the financial statements. This guidance does not amend existing recognition and measurement guidance related to other-than-temporary impairments of equity securities. Under this guidance, if the debt security’s market value is below amortized cost and we intend to either sell the security or it is more likely than not that we will be required to sell the security before its anticipated recovery, we would record an other-than-temporary impairment charge to other income and expense, net. If we do not intend to sell the security and it is more likely than not that we will not be required to sell the security before its anticipated recovery, the revised guidance requires us to determine the portion of the other-than-temporary impairment related to credit factors, or the credit loss portion, and the portion that is not related to credit factors, or the non-credit loss portion. The credit loss portion is the difference between the amortized cost of the security and our best estimate of the present value of the cash flows expected to be collected from the debt security and is recorded as a charge to other income and expense, net. The non-credit loss portion is the difference between the decline in fair value and the credit loss portion of the other-than-temporary impairment and is recorded as a separate component of other comprehensive income (loss). As a result of our adoption of this accounting guidance in the second quarter of 2009, we reclassified the non-credit portion of the previously recognized other-than-temporary impairment losses related to our auction rate securities of $5.3 million from accumulated deficit to accumulated other comprehensive income (loss).
In January 2010, the FASB issued updated guidance related to fair value measurements and disclosures, which requires a reporting entity to disclose separately the amounts of significant transfers in and out of Level 1 and Level 2 fair value measurements and to describe the reasons for the transfers. In addition, in the
76
Table of Contents
reconciliation for fair value measurements using significant unobservable inputs, or Level 3, a reporting entity should disclose separately information about purchases, sales, issuances and settlements (that is, on a gross basis rather than one net number). The updated guidance also requires that an entity should provide fair value measurement disclosures for each class of assets and liabilities and disclosures about the valuation techniques and inputs used to measure fair value for both recurring and non-recurring fair value measurements for Level 2 and Level 3 fair value measurements. The updated guidance is effective for interim or annual financial reporting periods beginning after December 15, 2009, except for the disclosures about purchases, sales, issuances and settlements in the roll forward activity in Level 3 fair value measurements, which are effective for fiscal years beginning after December 15, 2010 and for interim periods within those fiscal years. We do not expect the adoption of the updated guidance to have a material impact on our consolidated financial statements.
NOTE 2. REVISION OF PRIOR PERIOD FINANCIAL STATEMENTS
Impact of the adoption of authoritative guidance regarding convertible debt:
Effective January 1, 2009, we adopted new accounting guidance, which applies to certain convertible debt instruments that have a “net settlement feature”, which means instruments that by their terms may be settled either wholly or partially in cash upon conversion. Under the guidance, the liability and equity components of convertible debt instruments that may be settled wholly or partially in cash upon conversion must be accounted for separately in a manner reflective of our nonconvertible debt borrowing rate. Since our 1.00% Notes and our 1.25% convertible subordinated notes (“1.25% Notes” were issued in 2003 which we redeemed in February 2007), had an equity component that could be settled in cash or equity, both debt instruments qualified for this treatment.
Our effective borrowing rate for nonconvertible debt at the time of issuance of the 1.00% Notes was estimated to be 6.15% and for our 1.25% Notes it was estimated to be 6.20%. For the 1.00% Notes this resulted in $70.6 million of the $600 million aggregate principal amount of debentures issued being attributable to equity. For the 1.25% Notes this resulted in $126.0 million of the $600 million aggregate principal amount of debentures issued being attributable to equity.
The cumulative effect as of December 29, 2008 (the first day of fiscal 2009) of the change in accounting principle was a decrease to convertible debt of approximately $1.0 million for the discount on the 1.00% Notes, a decrease to additional paid-in capital of approximately $43.4 million, a decrease to accumulated deficit of approximately $44.5 million and an increase to debt issuance cost of approximately $0.1 million. As a result of the change in the accounting principle, the cumulative effect of the higher interest cost from both our 1.00% and 1.25% Notes is being offset by the losses on our extinguishment of debt which are now being recorded to equity.
Our adoption resulted in higher interest and other income (expense) of $144.4 million and $(19.1) million in fiscal 2008 and 2007, respectively. As of December 28, 2008, there was $1.0 million of the initial $70.6 million debt discount (1.00% Notes) which remained unamortized. As of September 27, 2009, all of the debt had matured or been redeemed and the debt discount was fully amortized. The tax effect of our adoption was immaterial to our consolidated financial statements.
Inventory Adjustment
During the third quarter of 2009, we identified historically immaterial errors related to the value of our raw material inventory balances located in the Philippines. We assessed the materiality of these errors on prior period financial statements and concluded that the errors were not material to any prior annual or interim periods but the cumulative error would be material in the third quarter of fiscal 2009, if the entire correction was recorded in the third quarter. Accordingly, we have revised certain prior year amounts and balances to allow for the correct recording of these transactions.
77
Table of Contents
The following table summarizes the effects of the new authoritative guidance regarding convertible debt and the correction to inventory and accumulated deficit on our Consolidated Statements of Operations for the year ended December 28, 2008 and December 30, 2007 and on our Consolidated Balance Sheet as of December 28, 2008:
| Year Ended | ||||||
| December 28, 2008 |
December 30, 2007 | |||||
| (In thousands) | ||||||
| Operating income (loss) as reported |
$ | (469,868) | $ | 9,410 | ||
| Correction of inventory error |
(1,565) | (2,977) | ||||
| Operating income (loss) as revised |
$ | (471,433) | $ | 6,433 | ||
| Income (loss) from continuing operations as reported |
$ | (462,136) | $ | 388,988 | ||
| Adjustment per convertible debt |
144,439 | (19,149) | ||||
| Correction of inventory error |
(1,565) | (2,977) | ||||
| Income (loss) from continuing operations as revised |
$ | (319,262) | $ | 366,862 | ||
| As of | |||
| December 28, 2008 | |||
| (In thousands) | |||
| Inventories as reported |
$ | 121,889 | |
| Correction of inventory error |
(7,027) | ||
| Inventories as revised |
$ | 114,862 | |
| Convertible debt as reported |
$ | 27,999 | |
| Adjustment per convertible debt |
(976) | ||
| Convertible debt as revised |
$ | 27,023 | |
There was no tax effect for the inventory error correction for fiscal year 2008 due to the immaterial impact in foreign jurisdictions and the negligible impact on our net operating loss carry forwards in the United States against which we have a full valuation allowance.
For fiscal 2008 and 2007, the impact of the error correction on gross profit was $1.6 million and $3.0 million, respectively. This amount represented 0.5% and 0.8% of the gross margin for fiscal 2008 and 2007, respectively.
There was no impact on the Consolidated Statements of Cash Flows for fiscal year 2008 or 2007.
NOTE 3. SUNPOWER
The following table summarizes our historical ownership interest in SunPower which shares were distributed to our stockholders in the fourth quarter of 2008:
| As of | ||||||
| September 28, 2008 |
December 30, 2007 |
|||||
| Number of shares of SunPower Class B common stock owned by Cypress |
42.0 million | 44.5 million | ||||
| As a percentage of SunPower’s total outstanding capital stock |
50 | % | 56 | % | ||
| As a percentage of SunPower’s total outstanding capital stock on a fully diluted basis |
47 | % | 51 | % | ||
| As a percentage of the total voting power of SunPower’s outstanding capital stock |
89 | % | 90 | % | ||
78
Table of Contents
Sale of SunPower’s Common Stock:
In fiscal 2008, we sold 2.5 million shares of SunPower Class A common stock (which were converted from Class B) in a private sale and received net proceeds of $222.5 million. The transaction resulted in a gain of $192.0 million.
In fiscal 2007, we completed the sale of 7.5 million shares of SunPower Class A common stock (which were converted from class B common stock) in a private sale. As a result of the transaction, we received net proceeds of $437.3 million and recorded a gain of $373.2 million in fiscal 2007.
Sale of Manufacturing Facility:
In fiscal 2003, SunPower entered into a lease agreement with us under which SunPower leased a manufacturing facility owned by us with approximately 215,000 square feet in the Philippines and a sublease for the land owned by an unaffiliated third party. SunPower had the right to purchase the facility from us and assume the lease for the land at any time for an amount equal to our original purchase price of $8.0 million, plus interest computed on a variable index starting on the date of purchase by us until the sale to SunPower. In the second quarter of fiscal 2008, SunPower exercised its right and purchased the facility from us and assumed the lease for the land from the unaffiliated third party for a total purchase price of approximately $9.5 million.
Spin-Off of SunPower
In the third quarter of 2008, a committee of our Board of Directors (the “Board”) approved the distribution of the SunPower Class B common stock held by us to our stockholders. On September 29, 2008, we completed the distribution of 42.0 million shares of SunPower Class B common stock to our stockholders (the “Spin-Off”). The distribution was made pro rata to our stockholders of record as of the close of trading on the New York Stock Exchange on September 17, 2008 (the “Record Date”). As a result of the Spin-Off, each of our stockholders received approximately 0.274 of a share of SunPower Class B common stock for each share of Cypress common stock held as of the Record Date. Our stockholders received cash in lieu of fractional shares for amounts of less than one SunPower share. The market value of the distribution was approximately $2.6 billion based on the closing price of SunPower’s common stock on September 29, 2008.
We received a favorable ruling from the Internal Revenue Service (“IRS”) in April 2008 with respect to certain tax issues arising under Section 355 of the Internal Revenue Code in connection with the Spin-Off. The distribution was structured to be tax-free to us and our stockholders for U.S. federal income tax purposes, except in respect to cash received in lieu of fractional shares.
Our former subsidiary, SunPower, announced in the fourth quarter of fiscal 2009 that certain of its previously issued financial statements could no longer be relied upon. In the course of the preparation of this annual report on Form 10-K, we evaluated the information available to us to date with respect to SunPower’s ongoing investigation of its historical financial statements and concluded that such information would not give rise to a material impact on our previously issued financial statements.
Discontinued Operations Attributable to Cypress:
Our historical consolidated financial statements have been recast to account for SunPower as discontinued operations for all periods presented. Accordingly, we have reflected the results of operations of SunPower prior to the Spin-Off as discontinued operations in the Consolidated Statements of Operations and the Consolidated Statements of Cash Flows. The assets, liabilities and minority interest related to SunPower were reclassified and reflected as discontinued operations in the Consolidated Balance Sheets.
79
Table of Contents
The following table summarizes the results of operations related to the discontinued operations through the date of the Spin-Off:
| Year Ended | ||||||
| December 28, 2008 |
December 30, 2007 | |||||
| (In thousands) | ||||||
| Revenues |
$ | 1,033,952 | $ | 774,790 | ||
| Costs and expenses, net |
967,716 | 780,817 | ||||
| Income (loss) from discontinued operations attributable to Cypress before income taxes |
66,236 | (6,027) | ||||
| Income tax benefit (provision) |
(31,850) | 22,084 | ||||
| Income from discontinued operations attributable to Cypress, net of income taxes |
$ | 34,386 | $ | 16,057 | ||
The distribution of the SunPower Class B common stock on September 29, 2008 resulted in the elimination of $996.6 million of net assets of discontinued operations and a reduction of $463.9 million to stockholders’ equity.
Adjustments to Cypress’s Stock Plans:
See Note 9 for a discussion of the adjustments approved by the Board on our stock plans as a result of the Spin-Off.
Amended Tax Sharing Agreement:
See Note 18 for a discussion of the amended tax sharing agreement between SunPower and us as a result of the Spin-Off.
NOTE 4. BUSINESS COMBINATION
Simtek Corporation (“Simtek”)
In September 2008, we completed the acquisition of Simtek, a publicly traded manufacturer of non-volatile static random access memory integrated circuits used in a variety of systems. The purchase was completed through a step acquisition and the total consideration included $3.6 million which reflects an initial investment we made in Simtek in prior periods. This initial investment consisted of a then 5% equity ownership and warrants to purchase 2.5 million shares of Simtek’s common stock. In September 2008, we completed a cash tender offer and purchased all of Simtek’s outstanding common stock not owned by us at a purchase price of $2.60 per share for a total cash payment of $43.9 million and incurred direct transaction costs of $1.1 million. The following table summarizes the total purchase price:
| (In thousands) |
|||
| Cash |
$ | 43,853 | |
| Initial investment |
3,560 | ||
| Transaction costs |
1,126 | ||
| Total purchase price |
$ | 48,539 | |
The fair value of the assets acquired and liabilities assumed was recorded in our consolidated balance sheet as of the acquisition date. The results of operations of Simtek were included in our consolidated results of operations subsequent to the acquisition date. Simtek is included in our Memory and Imaging Division.
80
Table of Contents
Purchase Price Allocation:
We finalized the purchase price allocation in the fourth quarter of fiscal 2008. The following table summarizes the amounts:
| As Adjusted | |||
| (In thousands) | |||
| Net tangible assets |
$ | 811 | |
| Acquired identifiable intangible assets: |
|||
| Purchased technology |
12,975 | ||
| Backlog |
1,116 | ||
| Customer relationships |
370 | ||
| Goodwill |
33,267 | ||
| Total purchase consideration |
$ | 48,539 | |
Net Tangible Assets:
Net tangible assets consisted of the following:
| (In thousands) |
|||
| Cash and cash equivalents |
$ | 2,302 | |
| Accounts receivable, net |
2,451 | ||
| Inventories |
4,933 | ||
| Other |
1,430 | ||
| Total assets acquired |
11,116 | ||
| Accounts payable |
(8,476) | ||
| Other accrued expenses and liabilities |
(1,829) | ||
| Total liabilities assumed |
(10,305) | ||
| Total net tangible assets |
$ | 811 | |
Acquired Identifiable Intangible Assets:
The following table presents certain information on the acquired identifiable intangible assets:
| Intangible Assets |
Method of Valuation |
Discount Rate Used |
Estimated | ||||
| Purchased technology |
Income Approach |
18 | % | 4–6 years | |||
| Backlog |
Income Approach |
10 | % | 0.5 year | |||
| Customer relationships |
Cost Approach |
— | 1.5 years |
In-Process Research and Development:
We identified in-process research and development projects in areas for which technological feasibility had not been established and no alternative future use existed. In identifying and analyzing Simtek’s potential in-process research and development projects, we considered key characteristics of the technology as well as project stages of development, the time and resources needed to complete the current projects, the expected income-generating abilities of the resulting projects, the target markets and associated risks. We concluded that Simtek had one in-process research and development project, which is a higher density form of non-volatile dynamic random access memory for gaming, automated teller machine and solid state disk drive applications. Using the income approach method with a discount rate of 22%, we determined that the fair value of the in-process research and development project was zero at the date of acquisition.
81
Table of Contents
Goodwill:
Simtek’s non-volatile memory products provide the high-speed memory access of standard static random access memories, but retain data when power is turned off—a feature critical to applications where secure data storage is essential to system functionality. The acquisition will enable us to integrate Simtek’s technology into many of our products, providing a highly integrated control and power failure solution for complex analog and digital systems and accelerating acceptance of our products in various applications and markets. These factors primarily contributed to a purchase price that resulted in goodwill. Goodwill that resulted from the acquisition is not deductible for tax purposes.
Subsequent to the acquisition, we determined that our goodwill was other-than-temporarily impaired and recorded an impairment loss of $351.3 million, which included $33.3 million related to the Simtek acquisition, for the year ended December 28, 2008. See Note 6 for more information.
Preexisting Relationship:
Prior to the acquisition in September 2008, Cypress and Simtek had a joint license and development agreement under which we licensed certain intellectual property from Simtek to develop non-volatile memory products and made a non-refundable prepayment of royalties to Simtek. The agreement was settled upon the completion of the acquisition. In accordance with the accounting guidance relating to the accounting for a preexisting relationship between parties to a business combination, we recorded a settlement loss of $1.1 million as a result of the termination of the agreement in the Consolidated Statement of Operations for fiscal 2008.
Pro Forma Financial Information:
The following unaudited pro forma financial information presents the combined results of operations of Cypress and Simtek as if the acquisitions had occurred as of the beginning of fiscal 2008 and 2007:
| Year Ended | |||||||
| December 28, 2008 |
December 30, 2007 | ||||||
| (In thousands, except per-share amounts) | |||||||
| Revenues |
$ | 784,578 | $ | 854,604 | |||
| Income (loss) from continuing operations |
$ | (336,473 | ) | $ | 358,161 | ||
| Income (loss) per share from continuing operations: |
|
||||||
| Basic |
$ | (2.24 | ) | $ | 2.30 | ||
| Diluted |
$ | (2.24 | ) | $ | 2.09 | ||
The unaudited pro forma financial information should not be taken as representative of our future consolidated results of operations or financial condition.
NOTE 5. DIVESTITURES
Fiscal 2008
In fiscal 2008, we completed the sale of certain product lines of its subsidiary, Silicon Light Machines (“SLM”), to Dainippon Screen Manufacturing Co. Ltd. in Japan for $11.0 million in cash. SLM was a part of our “Other” reportable segment. The divestiture included SLM’s micro-electro-mechanical system solutions for commercial printing and other imaging applications. We retained SLM’s laser optical navigation sensor product family.
82
Table of Contents
In connection with the divestiture, we recorded a gain of $10.0 million for the year ended December 28, 2008. The following table summarizes the components of the gain:
| (In thousands) |
|||
| Cash proceeds |
$ | 11,000 | |
| Assets sold and liabilities assumed: |
|||
| Accounts receivable and inventories |
(1,700) | ||
| Other |
816 | ||
| Transaction costs |
(150) | ||
| Gain on divestiture |
$ | 9,966 | |
Fiscal 2007
The following table summarizes the divestitures completed in fiscal 2007:
| Product Families/Businesses |
Reportable Segments |
Buyers |
Total Consideration | |||
| A portion of the image sensors product families |
Memory and Imaging Division |
Sensata Technologies |
$11.0 million in cash | |||
| Silicon Valley Technology Center (“SVTC”) |
Other |
Semiconductor Technology Services |
$53.0 million in cash | |||
| A portion of the network search engine (“NSE”) product families |
Data Communications Division |
NetLogic Microsystems |
$14.4 million in cash |
In connection with the divestitures, we recorded total gain of $18.0 million for the year ended December 30, 2007. The following table summarizes the components of the gain:
| Image Sensors | SVTC | NSE | Total | |||||||||
| (In thousands) | ||||||||||||
| Cash proceeds |
$ | 11,000 | $ | 52,950 | $ | 14,448 | $ | 78,398 | ||||
| Assets sold: |
||||||||||||
| Accounts receivable |
— | (3,927) | — | (3,927) | ||||||||
| Inventories |
(1,438) | — | (2,375) | (3,813) | ||||||||
| Property, plant and equipment |
— | (37,823) | — | (37,823) | ||||||||
| Intangible assets |
(4,581) | — | — | (4,581) | ||||||||
| Other |
(515) | — | — | (515) | ||||||||
| Allocated goodwill |
(2,306) | — | (4,872) | (7,178) | ||||||||
| Employee-related costs |
(1,093) | — | — | (1,093) | ||||||||
| Transaction costs |
(845) | (640) | (25) | (1,510) | ||||||||
| Gain on divestitures |
$ | 222 | $ | 10,560 | $ | 7,176 | $ | 17,958 | ||||
We included a portion of goodwill in the carrying amount of the image sensor and NSE product families in determining the gain on disposal. The amount was based on the relative fair values of the product families that were disposed of and the remaining portion of the reporting units that are retained by us. SVTC was a part of a reporting unit that does not have any goodwill balance.
In connection with the divestitures in fiscal 2007, approximately 110 employees were either transferred to the buyers or terminated by us.
83
Table of Contents
NOTE 6. GOODWILL AND INTANGIBLE ASSETS
Goodwill
The following table presents the changes in the carrying amount of goodwill by reportable business segments:
| Consumer and Computation Division |
Data Communications Division |
Memory and Imaging Division |
Total | |||||||||||||
| (In thousands) | ||||||||||||||||
| Balance at December 30, 2007 |
$ | 129,740 | $ | 138,436 | $ | 81,613 | $ | 349,789 | ||||||||
| Acquisition of Simtek |
— | — | 33,267 | 33,267 | ||||||||||||
| Other adjustment |
— | — | 37 | 37 | ||||||||||||
| Impairment of goodwill |
(97,904 | ) | (138,436 | ) | (114,917 | ) | (351,257 | ) | ||||||||
| Balance at December 28, 2008 |
31,836 | — | — | 31,836 | ||||||||||||
| Balance at January 3, 2010 |
$ | 31,836 | $ | — | $ | — | $ | 31,836 | ||||||||
For fiscal 2008, changes to goodwill included the addition of $33.3 million related to the acquisition of Simtek (see Note 4) and an impairment of $351.3 million.
Impairment of Goodwill:
We apply a fair value based impairment test to the net book value of goodwill on an annual basis and, if certain events or circumstances indicate that an impairment loss may have been incurred, on an interim basis. The analysis of potential impairment of goodwill requires a two-step process. The first step is a comparison of the estimation of fair value of all reporting units to the carrying value of the calculated net assets. If step one indicates that impairment potentially exists, a second step is performed to measure the amount of impairment, if any. Goodwill impairment exists when the implied fair value of goodwill is less than its carrying value.
In the fourth quarter of fiscal 2009, we performed the annual assessment of the carrying value of our goodwill and no impairment charge was recorded.
In the fourth quarter of fiscal 2008, we performed the annual assessment of the carrying value of our goodwill. The decline in the estimated fair value of the reporting units is a result of significant negative industry and economic trends affecting our current operations and expected future growth as well as the general decline of industry valuations impacting our valuation. We estimate the fair value of its reporting units noting that in all but one instance, the estimated fair value of the reporting units exceeds their underlying net asset value. We performed step two of the analysis and recorded a $351.3 million impairment charge.
We tested our goodwill on the reporting unit level. The following table indicates the number of reporting units tested for goodwill and the amount of goodwill impairment recorded in each reportable segment:
| Reportable Segments |
Number of Reporting Units |
Goodwill Impairment | |||
| Consumer and Computation Division |
Three | $ | 97.9 million | ||
| Data Communications Division |
Two | $ | 138.4 million | ||
| Memory and Imaging Division |
Two | $ | 115.0 million | ||
84
Table of Contents
Management determined the fair value of the reporting units using a combination of the income approach, which is based on a discounted cash flow analysis of each reporting unit, and the market approach, which is based on a competitor multiple assessment, if available. The following table indicates the weight given to each of the approaches:
| Reportable Segments |
Income Approach |
Market Approach | ||
| Consumer and Computation Division |
75% | 25% | ||
| Data Communications Division |
75% | 25% | ||
| Memory and Imaging Division |
90% -100% | 0% - 10% |
The following table summarizes the assumptions used in the income approach:
| Reportable Segments |
Five-Year Annual Growth Rates |
Terminal Values |
Discount Rates | |||||
| Consumer and Computation Division |
5 | % | 2 | % | 24% - 25% | |||
| Data Communications Division |
5 | % | 2 | % | 25% - 26% | |||
| Memory and Imaging Division |
5 | % | 2 | % | 25% - 26% |
The assumptions supporting the estimated future cash flows, including the discount rates and estimated terminal values, reflect management’s best estimates. The discount rates were based upon our weighted average cost of capital as adjusted for the risks associated with our operations.
Intangible Assets
The following tables present details of our total intangible assets:
| As of January 3, 2010 |
Gross | Accumulated Amortization |
Net | ||||||
| (In thousands) | |||||||||
| Purchase technology |
$ | 100,134 | $ | (88,766) | $ | 11,368 | |||
| Patents, tradenames, customer relationships and backlog |
22,009 | (21,937) | 72 | ||||||
| Other |
4,297 | (4,190) | 107 | ||||||
| Total acquisition-related intangible assets |
126,440 | (114,893) | 11,547 | ||||||
| Non-acquisition related intangible assets |
8,713 | (5,128) | 3,585 | ||||||
| Total intangible assets |
$ | 135,153 | $ | (120,021) | $ | 15,132 | |||
| As of December 28, 2008 |
Gross | Accumulated Amortization |
Net | ||||||
| (In thousands) | |||||||||
| Purchase technology |
$ | 100,134 | $ | (86,040) | $ | 14,094 | |||
| Patents, tradenames, customer relationships and backlog |
22,009 | (21,007) | 1,002 | ||||||
| Other |
4,297 | (4,041) | 256 | ||||||
| Total acquisition-related intangible assets |
126,440 | (111,088) | 15,352 | ||||||
| Non-acquisition related intangible assets |
7,474 | (4,148) | 3,326 | ||||||
| Total intangible assets |
$ | 133,914 | $ | (115,236) | $ | 18,678 | |||
As of January 3, 2010, the estimated future amortization expense of intangible assets was as follows:
| (In thousands) |
|||
| 2010 |
$ | 4,149 | |
| 2011 |
3,974 | ||
| 2012 |
3,574 | ||
| 2013 |
2,963 | ||
| 2014 and thereafter |
472 | ||
| Total future amortization expense |
$ | 15,132 | |
85
Table of Contents
Prior to performing our assessment on the carrying value of goodwill, we reviewed the carrying value of our long-lived assets in accordance with the accounting guidance. No impairment of long-lived assets was recorded as the gross, undiscounted cash flows, expected to be generated by the underlying assets (measured at the lowest level of identifiable cash flows) exceeded the carrying value of those assets.
NOTE 7. FAIR VALUE MEASUREMENTS
Assets/Liabilities Measured at Fair Value on a Recurring Basis
The following table presents our fair value hierarchy for our financial assets and liabilities measured at fair value on a recurring basis as of January 3, 2010:
| Level 1 | Level 2 | Level 3 | Total | |||||||||
| (In thousands) | ||||||||||||
| Financial Assets |
||||||||||||
| Investments: |
||||||||||||
| Commercial paper |
$ | — | $ | — | $ | 615 | $ | 615 | ||||
| Money market funds |
122,111 | — | — | 122,111 | ||||||||
| U.S. treasuries |
6,070 | — | — | 6,070 | ||||||||
| Corporate notes / bonds |
— | 20,896 | — | 20,896 | ||||||||
| Federal agency |
— | 5,012 | — | 5,012 | ||||||||
| Auction rate securities |
— | — | 32,740 | 32,740 | ||||||||
| Marketable equity securities |
5,053 | — | — | 5,053 | ||||||||
| Employee deferred compensation plan |
25,664 | — | — | 25,664 | ||||||||
| Derivative instruments: |
||||||||||||
| Foreign currency forward contracts |
— | 8 | — | 8 | ||||||||
| Total financial assets |
$ | 158,898 | $ | 25,916 | $ | 33,355 | $ | 218,169 | ||||
| Financial Liabilities |
||||||||||||
| Employee deferred compensation plan |
$ | 25,071 | $ | — | $ | — | $ | 25,071 | ||||
| Total financial liabilities |
$ | 25,071 | $ | — | $ | — | $ | 25,071 | ||||
The following table presents our fair value hierarchy for our financial assets and liabilities measured at fair value on a recurring basis as of December 28, 2008:
| Level 1 | Level 2 | Level 3 | Total | |||||||||
| (In thousands) | ||||||||||||
| Financial Assets |
||||||||||||
| Investments: |
||||||||||||
| Commercial paper |
$ | — | $ | 4,992 | $ | 812 | $ | 5,804 | ||||
| Money market funds |
176,556 | — | — | 176,556 | ||||||||
| U.S. treasuries |
6,175 | — | — | 6,175 | ||||||||
| Corporate notes / bonds |
— | 22,977 | — | 22,977 | ||||||||
| Auction rate securities |
— | — | 34,890 | 34,890 | ||||||||
| Marketable equity securities |
4,452 | — | — | 4,452 | ||||||||
| Employee deferred compensation plan |
20,246 | — | — | 20,246 | ||||||||
| Derivative instruments: |
||||||||||||
| Foreign currency forward contracts |
— | 141 | — | 141 | ||||||||
| Total financial assets |
$ | 207,429 | $ | 28,110 | $ | 35,702 | $ | 271,241 | ||||
| Financial Liabilities |
||||||||||||
| Employee deferred compensation plan |
$ | 20,478 | $ | — | $ | — | $ | 20,478 | ||||
| Total financial liabilities |
$ | 20,478 | $ | — | $ | — | $ | 20,478 | ||||
86
Table of Contents
Valuation Techniques:
We use quoted prices for identical instruments in active markets to determine the fair value for our Level 1 financial instruments, which include U.S. treasuries, money market funds and marketable equity securities. In addition, our employee deferred compensation plan is classified as Level 1 because the plan invests in mutual funds or our common stock.
If quoted prices in active markets for identical assets or liabilities are not available to determine the fair value of our financial instruments, then we use observable inputs including benchmark yields, reported trades, broker/dealer quotes or alternative pricing sources with reasonable levels of price transparency. These investments are classified as Level 2 and primarily consist of federal agency and corporate notes/bonds. In addition, we have derivative instruments that are classified as Level 2 financial assets. We determine the fair value of these instruments based on modeling techniques that include inputs such as market volatilities, spot rates and interest differentials from published sources.
Our Level 3 financial assets which have unobservable inputs primarily include investments in auction rate securities and a commercial paper investment. The valuation techniques are described as follows:
Auction Rate Securities:
As of January 3, 2010, all of our auction rate securities are classified as Level 3 financial instruments. Auction rate securities are investments with contractual maturities generally between 20 and 30 years. They are usually found in the form of municipal bonds, preferred stock, a pool of student loans or collateralized debt obligations with interest rates resetting every seven to 49 days through an auction process. At the end of each reset period, investors can sell or continue to hold the securities at par. The auction rate securities held by us are primarily backed by student loans and are over-collateralized, insured and guaranteed by the U.S. Federal Department of Education.
As of January 3, 2010, 95% of our auction rate securities held by us were rated as either AAA or Aaa by the major independent rating agencies and approximately 5% of the student loan auction rate securities have been downgraded from AAA or Aaa to Baa3. The downgrade event was due to the higher rates the issuer is paying out versus the lending rates, which is preventing the issuer from building excess spread as required under the prospectus.
As of January 3, 2010, all of our auction rate securities have experienced failed auctions due to sell orders exceeding buy orders. These failures are not believed to be a credit issue with the underlying investments, but rather caused by a lack of liquidity. Under the contractual terms, the issuer is obligated to pay penalty rates should an auction fail. The funds associated with failed auctions are not expected to be accessible until one of the following occurs: a successful auction occurs, the issuer redeems the issue, a buyer is found outside of the auction process or the underlying securities have matured. Given these circumstances and the lack of liquidity, we have classified our auction rate securities totaling $32.7 million as long-term investments.
During fiscal 2009, we performed analyses to assess the fair value of the auction rate securities. In the absence of a liquid market to value these securities, we prepared a valuation model based on discounted cash flows. The assumptions used at January 3, 2010 were as follows:
| Ÿ | 7 years to liquidity; |
| Ÿ | continued receipt of contractual interest which provides a premium spread for failed auctions; and |
| Ÿ | discount rates of 2.31%—5.78%, which incorporates a spread for both credit and liquidity risk. |
Based on these assumptions, we estimated that the auction rate securities would be valued at approximately 90% of their stated par value as of January 3, 2010, representing a decline in value of approximately $3.7 million. As a result of our adoption of this new guidance in the second quarter of 2009, we reclassified the non-credit portion of the previously recognized other-than-temporary impairment losses related to our auction rate securities of $5.3 million from accumulated deficit to accumulated other comprehensive income (loss).
87
Table of Contents
Commercial Paper:
As of January 3, 2010, we have classified one commercial paper investment totaling $0.6 million as a Level 3 financial asset. The investment was issued through a structured investment vehicle that was impaired as the issuer was unable to raise sufficient funding to cover maturing obligations. Accordingly, management determined that the security had suffered other-than-temporary impairment and recorded a $0.2 million charge. The amount of the write-down was determined by comparing the carrying value of the investment to the valuation of the underlying assets of the fund.
The following table presents a summary of changes in our Level 3 investments measured at fair value on a recurring basis:
| Auction Rate Securities |
Commercial Paper |
Total | ||||||||||
| (In thousands) | ||||||||||||
| Balance as of December 30, 2007 |
$ | — | $ | 1,065 | $ | 1,065 | ||||||
| Transfer from Level 2 |
38,750 | — | 38,750 | |||||||||
| Impairment loss |
(3,860 | ) | (253 | ) | (4,113 | ) | ||||||
| Balance as of December 28, 2008 |
$ | 34,890 | $ | 812 | $ | 35,702 | ||||||
| Unrealized gain |
150 | — | 150 | |||||||||
| Impairment loss |
— | (197 | ) | (197 | ) | |||||||
| Called at par |
(2,300 | ) | — | (2,300 | ) | |||||||
| Balance as of January 3, 2010 |
$ | 32,740 | $ | 615 | $ | 33,355 | ||||||
88
Table of Contents
NOTE 8. INVESTMENTS
Available-For-Sale Securities and Other Investments
The following tables summarize our available-for-sale securities and other investments:
| As of January 3, 2010 |
Cost | Gross Unrealized Gains |
Gross Unrealized Losses |
Fair Value | |||||||||
| (In thousands) | |||||||||||||
| Cash equivalents: |
|||||||||||||
| Money market funds |
$ | 122,111 | $ | — | $ | — | $ | 122,111 | |||||
| Total cash equivalents |
122,111 | — | — | 122,111 | |||||||||
| Short-term investments: |
|||||||||||||
| Certificate of deposit |
20,069 | — | — | 20,069 | |||||||||
| U.S. treasuries |
6,013 | 57 | — | 6,070 | |||||||||
| Corporate notes/bonds |
20,813 | 83 | 20,896 | ||||||||||
| Marketable equity securities |
1,053 | 2,983 | 4,036 | ||||||||||
| Federal agency |
4,988 | 26 | (2 | ) | 5,012 | ||||||||
| Total short-term investments |
52,936 | 3,149 | (2 | ) | 56,083 | ||||||||
| Long-term investments: |
|||||||||||||
| Auction rate securities |
36,450 | — | (3,710 | ) | 32,740 | ||||||||
| Commercial paper |
615 | — | — | 615 | |||||||||
| Marketable equity securities |
1,187 | — | (170 | ) | 1,017 | ||||||||
| Total long-term investments |
38,252 | — | (3,880 | ) | 34,372 | ||||||||
| Total available-for-sale securities and other investments |
$ | 213,299 | $ | 3,149 | $ | (3,882 | ) | $ | 212,566 | ||||
| As of December 28, 2008 |
Cost | Gross Unrealized Gains |
Gross Unrealized Losses |
Fair Value | |||||||||
| (In thousands) | |||||||||||||
| Cash equivalents: |
|||||||||||||
| Commercial paper |
$ | 4,992 | $ | — | $ | — | $ | 4,992 | |||||
| Money market funds |
176,556 | — | — | 176,556 | |||||||||
| Total cash equivalents |
181,548 | — | — | 181,548 | |||||||||
| Short-term investments: |
|||||||||||||
| U.S. treasuries |
5,998 | 177 | — | 6,175 | |||||||||
| Corporate notes/bonds |
23,057 | 41 | (121 | ) | 22,977 | ||||||||
| Marketable equity securities |
1,188 | 2,703 | — | 3,891 | |||||||||
| Total short-term investments |
30,243 | 2,921 | (121 | ) | 33,043 | ||||||||
| Long-term investments: |
|||||||||||||
| Auction rate securities |
34,890 | — | — | 34,890 | |||||||||
| Commercial paper |
812 | — | — | 812 | |||||||||
| Marketable equity securities |
1,187 | — | (626 | ) | 561 | ||||||||
| Total long-term investments |
36,889 | — | (626 | ) | 36,263 | ||||||||
| Total available-for-sale securities and other investments |
$ | 248,680 | $ | 2,921 | $ | (747 | ) | $ | 250,854 | ||||
89
Table of Contents
The following tables summarize the fair value and gross unrealized losses related to available-for-sale securities, aggregated by investment category and length of time that individual securities have been in a continuous unrealized loss position:
| As of January 3, 2010 |
Less Than Twelve Months |
Greater Than Twelve Months |
Total | ||||||||||||||||||
| Fair Value |
Gross Unrealized Losses |
Fair Value |
Gross Unrealized Losses |
Fair Value |
Gross Unrealized Losses |
||||||||||||||||
| (In thousands) | |||||||||||||||||||||
| Auction rate securities |
$ | — | $ | — | $ | 32,740 | $ | (3,710 | ) | $ | 32,740 | $ | (3,710 | ) | |||||||
| Federal agency |
2,003 | (2 | ) | — | — | 2,003 | (2 | ) | |||||||||||||
| Marketable equity securities |
— | — | 1,017 | (170 | ) | 1,017 | (170 | ) | |||||||||||||
| Total |
$ | 2,003 | $ | (2 | ) | $ | 33,757 | $ | (3,880 | ) | $ | 35,760 | $ | (3,882 | ) | ||||||
| Less Than Twelve Months |
Greater Than Twelve Months |
Total | |||||||||||||||||||
| As of December 28, 2008 | Fair Value |
Gross Unrealized Losses |
Fair Value |
Gross Unrealized Losses |
Fair Value |
Gross Unrealized Losses |
|||||||||||||||
| (In thousands) | |||||||||||||||||||||
| Corporate notes/bonds |
$ | 10,033 | $ | (121 | ) | $ | — | $ | — | $ | 10,033 | $ | (121 | ) | |||||||
| Marketable equity securities |
561 | (626 | ) | — | — | 561 | (626 | ) | |||||||||||||
| Total |
$ | 10,594 | $ | (747 | ) | $ | — | $ | — | $ | 10,594 | $ | (747 | ) | |||||||
Currently, the available-for-sale debt investments that we hold are all high investment grade. The unrealized losses on our investments are due primarily to changes in interest rates and market and credit conditions of the underlying securities. Because we have the ability and intent to hold these investments until a recovery of fair value, which may be maturity, we did not consider these investments to be other-than-temporarily impaired as of January 3, 2010 and December 28, 2009.
For individual marketable equity securities with unrealized losses, we evaluated the near-term prospects in relation to the severity and duration of the impairment. Based on that evaluation and our ability and intent to hold these investments for a reasonable period of time, we did not consider these investments to be other-than-temporarily impaired as of January 3, 2010 and December 28, 2009.
As of January 3, 2010, contractual maturities of our available-for-sale non-equity investments and certificates of deposit were as follows:
| Cost | Fair Value | |||||
| (In thousands) | ||||||
| Maturing within one year |
$ | 142,180 | $ | 142,180 | ||
| Maturing in one to three years |
31,814 | 31,978 | ||||
| Maturing in more than three years |
37,065 | 33,356 | ||||
| Total |
$ | 211,059 | $ | 207,514 | ||
Realized gains from sales of available-for-sale and non equity investments were $0.8 million in fiscal 2009. Realized gains and losses from sales of available-for sale and non-equity investments were immaterial in fiscal 2008.
Proceeds from sales or maturities of available-for-sale investments were $24.4 million, $362.2 million and $202.5 million for fiscal 2009, 2008 and 2007, respectively.
90
Table of Contents
Investments in Equity Securities
The following table summarizes our equity investments:
| As of | ||||||
| January 3, 2010 |
December 28, 2008 | |||||
| (In thousands) | ||||||
| Short-term investments: |
||||||
| Marketable equity securities |
$ | 4,036 | $ | 3,891 | ||
| Long-term investments: |
||||||
| Marketable equity securities |
1,017 | 561 | ||||
| Non-marketable equity securities |
408 | 1,227 | ||||
| Total long-term investments |
1,425 | 1,788 | ||||
| Total equity investments |
$ | 5,461 | $ | 5,679 | ||
Sale of Equity Securities:
During fiscal 2007, we sold our equity investments in two publicly traded companies for $4.5 million and recognized total gains of $0.9 million.
Impairment of Investments
We review our investments periodically for impairment and recognize an impairment loss when the carrying value of an investment exceeds its fair value and the decline in value is considered other-than-temporary. The following table summarizes the impairment loss recorded in the Consolidated Statements of Operations:
| Year Ended | |||||||||
| January 3, 2010 |
December 30, 2008 |
December 31, 2007 | |||||||
| (In thousands, except per-share amounts) | |||||||||
| Debt securities: |
|||||||||
| Commercial paper |
$ | 197 | $ | 253 | $ | 435 | |||
| Auction rate securities |
1,393 | 3,860 | — | ||||||
| Corporate bonds |
140 | 562 | — | ||||||
| Equity securities: |
|||||||||
| Marketable equity securities |
— | 86 | 601 | ||||||
| Non-marketable equity securities |
819 | 8,594 | 867 | ||||||
| Total impairment loss |
$ | 2,549 | $ | 13,355 | $ | 1,903 | |||
NOTE 9. EMPLOYEE STOCK PLANS AND STOCK-BASED COMPENSATION
We currently have the following employee stock plans:
1999 Stock Option Plan (“1999 Plan”):
Under the terms of the 1999 Plan, which was a non-shareholder approved plan, stock options could have been granted to qualified employees, including those of acquired companies and consultants of the Company or its subsidiaries, but stock options could not be granted to executive officers or directors. As of January 3, 2010, there are no shares available for grant under the 1999 Plan as the plan expired in March 2009. All unissued grants became unavailable for future grant.
91
Table of Contents
1994 Amended Stock Option Plan (“1994 Amended Plan”):
In fiscal 1994, we adopted, and in fiscal 2004 and 2008 amended, the 1994 Stock Option Plan, which is a shareholder-approved plan. Under the terms of the 1994 Amended Plan, stock options, restricted stock units, restricted stock awards and stock appreciation rights may be granted to qualified employees, consultants, officers and directors of Cypress or our subsidiaries. Awards become exercisable over a vesting period as determined by the Board and expire over terms not exceeding ten years from the date of grant for awards granted prior to May 2008, and eight years from the date of grant for awards granted after May 2008. As of January 3, 2010, approximately 14.8 million shares of stock options or 7.9 million shares of restricted stock units and restricted stock awards were available for grant under the 1994 Amended Plan. The 1994 Amended Plan will expire in April 2014.
Employee Stock Purchase Plan (“ESPP”):
Our ESPP allows eligible employees to purchase shares of our common stock through payroll deductions. The ESPP contains consecutive 18-month offering periods composed of three six-month exercise periods. The shares can be purchased at the lower of 85% of the fair market value of the common stock at the date of commencement of the offering period or at the last day of each six-month exercise period. Purchases are limited to 10% of an employee’s eligible compensation, subject to a maximum annual employee contribution limit of $25,000. As of January 3, 2010, approximately 6.1 million shares were available for future issuance under the ESPP. The ESPP will expire in May 2013.
Modification of Outstanding Employee Equity Awards
On August 1, 2008, the Board approved certain adjustments to the 1999 Plan and 1994 Amended Plan (together, the “Plans”) and outstanding employee equity awards in anticipation of the Spin-Off (see Note 3). These adjustments were consistent with and similar to the provisions in the Plans providing for automatic adjustment of service provider equity awards and share pools pursuant to a Cypress stock split or similar change in capitalization effected without receipt of consideration by us. Specifically, the Board approved amendments to make proportionate adjustments, effective immediately following the Spin-Off, to: (a) the number of authorized but unissued shares reserved for issuance under the Plans, (b) the numerical provisions under the Plans’ annual grant limits and automatic option grant sections, including automatic grants to Board members, and (c) outstanding employee equity awards, including stock options, restricted stock units and restricted stock awards, under the Plans to preserve the intrinsic value of the awards before and after the Spin-Off. The Board further approved the amendment of outstanding options under the Plans to permit, subject to timing limitations and management discretion, both net exercise (a portion of the shares subject to options surrendered as payment of the aggregate exercise price) and early exercise (exercise of unvested shares subject to a stock restriction agreement).
In addition, the Board approved certain adjustments with respect to our ESPP to offset the decrease in our common stock price resulting from the Spin-Off. These changes included a proportionate adjustment in the offering date price per share of our common stock and maximum number of shares participants may purchase under the ESPP.
On September 30, 2008, following the Spin-Off, outstanding employee equity awards under the Plans were adjusted by a conversion ratio of 4.12022 (the “Conversion Ratio”). Specifically, the number of shares issuable pursuant to the outstanding awards was multiplied by the Conversion Ratio, rounded down to the nearest whole share. In addition, the per-share exercise price of options was divided by the Conversion Ratio, rounded up to the nearest whole cent. Also, the number of authorized but unissued shares reserved for issuance under the Plans and the ESPP and the numerical provisions under the Plans’ annual grant limits and automatic option grant provisions, including automatic grants to Board members, were multiplied by the Conversion Ratio, rounded down to the nearest whole share.
92
Table of Contents
The ESPP offering date price for the then current offering period was divided by the Conversion Ratio, rounded up to the nearest whole cent and the maximum number of shares participants may purchase under the ESPP was multiplied by the Conversion Ratio, rounded down to the nearest whole share.
The modification of the outstanding employee equity awards and the ESPP on August 1, 2008 resulted in additional non-cash stock-based compensation. The amount was measured based upon the difference between the fair value of the awards immediately before and after the modification. Of the total additional non-cash stock-based compensation $59.4 million and $61.9 million, net of forfeitures was recognized in fiscal 2009 and fiscal 2008, respectively. The remaining $27.8 million will be recognized over the remaining vesting periods on an accelerated basis less forfeitures.
Stock-Based Compensation
The number of shares and price per share for fiscal 2007 have not been adjusted to reflect the Conversion Ratio or the Spin-Off.
The following table summarizes the stock-based compensation expense by line item in the Consolidated Statement of Operations:
| Year Ended | |||||||||
| January 3, 2010 |
December 28, 2008 |
December 30, 2007 | |||||||
| (In thousands) | |||||||||
| Cost of revenues |
$ | 40,798 | $ | 27,950 | $ | 13,123 | |||
| Research and development |
37,537 | 39,089 | 15,870 | ||||||
| Selling, general and administrative |
63,477 | 55,306 | 32,399 | ||||||
| Total stock-based compensation expense |
$ | 141,812 | $ | 122,345 | $ | 61,392 | |||
As stock-based compensation expense recognized in the Consolidated Statements of Operations is based on awards ultimately expected to vest, it has been reduced for estimated forfeitures. The accounting guidance requires forfeitures to be estimated at the time of grant and revised, if necessary, in subsequent periods if actual forfeitures differ from those estimates.
Consolidated cash proceeds from the issuance of shares under the employee stock plans were $101.6 million, $55.6 million and $210.2 million for fiscal 2009, 2008 and 2007, respectively. We recognized an income tax benefit from stock option exercises of $9.1 million for fiscal 2008. No income tax benefit was realized from stock option exercises for fiscal 2009 and 2007. As of January 3, 2010 and December 28, 2008, stock-based compensation capitalized in inventories totaled $5.7 million and $11.0 million, respectively.
The following tables summarize the stock-based compensation expense by type of awards:
| Year Ended | |||||||||
| January 3, 2010 |
December 28, 2008 |
December 30, 2007 | |||||||
| (In thousands) | |||||||||
| Stock options |
$ | 56,386 | $ | 75,513 | $ | 31,573 | |||
| Restricted stock units and restricted stock awards |
74,842 | 38,252 | 25,700 | ||||||
| ESPP |
10,584 | 8,580 | 4,119 | ||||||
| Total stock-based compensation expense |
$ | 141,812 | $ | 122,345 | $ | 61,392 | |||
93
Table of Contents
The following table summarizes the unrecognized stock-based compensation balance by type of awards as of January 3, 2010:
| (In thousands) |
Weighted-Average Amortization Period | ||||
| (In years) | |||||
| Stock options |
$ | 46,670 | 1.97 | ||
| Restricted stock units and restricted stock awards |
102,536 | 3.76 | |||
| ESPP |
2,078 | 0.47 | |||
| Total unrecognized stock-based compensation balance |
$ | 151,284 | 3.16 | ||
Valuation Assumptions
We estimate the fair value of our stock-based equity awards using the Black-Scholes valuation model. Assumptions used in the Black-Scholes valuation model were as follows:
| Year Ended | |||||||||
| January 3, 2010 |
December 30, 2008 |
December 31, 2007 |
|||||||
| Stock Option Plans: |
|||||||||
| Expected life |
2.4-7.4 years | 0.5-9.9 years | 2.1-8.4 years | ||||||
| Volatility |
50.09%-60.75 | % | 43.5%-74.35 | % | 32.1%-53.2 | % | |||
| Risk-free interest rate |
0.7%-3.2 | % | 0.68%-4.22 | % | 3.2%-5.1 | % | |||
| Dividend yield |
0.0 | % | 0.0 | % | 0.0 | % | |||
| ESPP: |
|||||||||
| Expected life |
0.5-1.5 years | 0.5-1.5 years | 0.5-1.5 years | ||||||
| Volatility |
52.6%-85.8 | % | 43.7%-57.8 | % | 31.5%-35.6 | % | |||
| Risk-free interest rate |
0.2%-0.7 | % | 1.2%-2.3 | % | 4.6%-5.0 | % | |||
| Dividend yield |
0.0 | % | 0.0 | % | 0.0 | % | |||
Expected life: Expected life is based on historical exercise patterns, giving consideration to the contractual terms of the awards and vesting schedules. In addition, employees who display similar historical exercise behavior are grouped separately into two classes (executive officers and other employees) in determining the expected life.
Volatility: We determined that implied volatility of publicly traded call options and quotes from option traders is more reflective of market conditions and, therefore, can reasonably be a better indicator of expected volatility than historical volatility. Therefore, our volatility is based on a blend of historical volatility of its common stock and implied volatility.
Risk-free interest rate: The risk-free interest rate is based on the U.S. Treasury yield curve in effect at the time of grant.
Dividend yield: Since we did not pay and do not expect to pay dividends, the expected dividend yield is zero.
94
Table of Contents
Employee Equity Award Activities
Stock Options:
The following table summarizes our stock option activities:
| Year Ended | ||||||||||||||||||
| January 3, 2010 | December 28, 2008 | December 30, 2007 | ||||||||||||||||
| Shares | Weighted- Average Exercise Price per Share |
Shares | Weighted- Average Exercise Price per Share |
Shares | Weighted- Average Exercise Price per Share | |||||||||||||
| (In thousands, except per-share amounts) | ||||||||||||||||||
| Options outstanding, beginning of year |
70,273 | $ | 4.43 | 81,011 | $ | 4.08 | 32,152 | $ | 15.50 | |||||||||
| Granted |
6,444 | $ | 6.68 | 8,113 | $ | 5.85 | 2,557 | $ | 25.29 | |||||||||
| Exercised |
(19,433 | ) | $ | 4.21 | (14,852 | ) | $ | 3.22 | (12,962 | ) | $ | 15.15 | ||||||
| Forfeited or expired |
(4,873 | ) | $ | 5.35 | (3,999 | ) | $ | 4.70 | (2,085 | ) | $ | 17.60 | ||||||
| Options outstanding, end of year |
52,411 | $ | 4.70 | 70,273 | $ | 4.43 | 19,662 | $ | 16.80 | |||||||||
| Options exercisable, end of year |
33,895 | $ | 4.18 | 42,121 | $ | 4.13 | 10,570 | $ | 15.78 | |||||||||
| Options outstanding, end of year adjusted for conversion |
52,411 | 70,273 | 81,011 | |||||||||||||||
The weighted-average grant-date fair value was $2.97 per share for options granted during fiscal 2009, $2.55 per share for options granted during fiscal 2008 and $8.90 per share for options granted during fiscal 2007.
The total intrinsic value of options exercised was $88.8 million for fiscal 2009, $47.9 million for fiscal 2008 and $156.8 million for fiscal 2007.
Total fair value of options vested was $25.2 million for fiscal 2009, $27.4 million for fiscal 2008 and $32.2 million for fiscal 2007.
Information regarding stock options outstanding as of January 3, 2010 was as follows:
| Options Outstanding | Options Exercisable | |||||||||||||||||||
| Range of Exercise |
Shares | Weighted- Average Remaining Contractual Life |
Weighted- Average Exercise Price per Share |
Aggregate Intrinsic Value |
Shares | Weighted- Average Remaining Contractual Life |
Weighted- Average Exercise Price per Share |
Aggregate Intrinsic Value | ||||||||||||
| (In thousands) | (In years) | (In thousands) | (In thousands) | (In years) | (In thousands) | |||||||||||||||
| $0.35-$2.77 |
6,426 | 4.32 | $ | 2.16 | $ | 53,995 | 5,746 | 3.90 | $ | 2.10 | $ | 48,624 | ||||||||
| $2.77-$3.53 |
9,511 | 5.40 | $ | 3.45 | $ | 67,594 | 7,773 | 5.36 | $ | 3.45 | $ | 55,246 | ||||||||
| $3.54-$4.06 |
6,383 | 4.96 | $ | 3.89 | $ | 42,543 | 4,402 | 4.41 | $ | 3.91 | $ | 29,268 | ||||||||
| $4.09-$4.76 |
7,761 | 4.19 | $ | 4.41 | $ | 47,708 | 6,253 | 3.64 | $ | 4.41 | $ | 38,458 | ||||||||
| $4.79-$5.55 |
5,302 | 5.42 | $ | 5.18 | $ | 28,534 | 3,669 | 4.30 | $ | 5.17 | $ | 19,792 | ||||||||
| $5.59-$6.16 |
5,518 | 4.35 | $ | 5.88 | $ | 25,813 | 3,289 | 1.59 | $ | 5.71 | $ | 15,938 | ||||||||
| $6.17-$6.22 |
5,255 | 8.72 | $ | 6.18 | $ | 23,027 | 709 | 8.78 | $ | 6.18 | $ | 3,106 | ||||||||
| $6.35-$9.38 |
5,496 | 7.48 | $ | 7.35 | $ | 17,639 | 1,885 | 6.65 | $ | 7.48 | $ | 5,814 | ||||||||
| $9.62-$12.33 |
759 | 6.08 | $ | 10.38 | $ | 216 | 168 | 1.06 | $ | 10.81 | $ | 26 | ||||||||
| $13.15-$13.15 |
— | 0.34 | $ | 13.15 | — | — | 0.34 | $ | 13.15 | — | ||||||||||
| 52,411 | 5.49 | $ | 4.70 | $ | 307,069 | 33,894 | 4.31 | $ | 4.18 | $ | 216,272 | |||||||||
The aggregate intrinsic value in the preceding table represents the total pre-tax intrinsic value, based on our closing stock price of $10.56 at the end of the fiscal 2009, which would have been received by the option holders had all option holders exercised their options as of that date and do not include substantial tax payments. The total number of in-the-money options exercisable was 33.8 million shares as of January 3, 2010.
95
Table of Contents
As of January 3, 2010, stock options vested and expected to vest totaled approximately 49.9 million shares, with a weighted-average remaining contractual life of 5.36 years and a weighted-average exercise price of $4.63 per share. The aggregate intrinsic value was approximately $295.9 million.
Restricted Stock Units and Restricted Stock Awards:
The following table summarizes our restricted stock unit and restricted stock award activities:
| Year Ended | ||||||||||||||||||
| January 3, 2010 | December 28, 2008 | December 30, 2007 | ||||||||||||||||
| Shares | Weighted- Average Fair Value per Share |
Shares | Weighted- Average Fair Value per Share |
Shares | Weighted- Average Fair Value per Share | |||||||||||||
| (In thousands, except per-share amounts) | ||||||||||||||||||
| Non-vested, beginning of year |
28,745 | $ | 5.78 | 27,819 | $ | 5.43 | 1,007 | $ | 16.23 | |||||||||
| Granted |
1,970 | $ | 7.86 | 8,008 | $ | 6.25 | 6,156 | $ | 23.45 | |||||||||
| Released |
(7,510 | ) | $ | 5.07 | (5,993 | ) | $ | 5.07 | (222 | ) | $ | 27.62 | ||||||
| Forfeited |
(5,472 | ) | $ | 3.73 | (1,089 | ) | $ | 4.29 | (189 | ) | $ | 18.26 | ||||||
| Non-vested, end of year |
17,733 | $ | 5.51 | 28,745 | $ | 5.78 | 6,752 | $ | 22.38 | |||||||||
| Non-vested, end of year adjusted for conversion |
17,733 | 28,745 | 27,819 | |||||||||||||||
The balance as of January 3, 2010 included approximately 10.7 million performance-based restricted stock units and restricted stock awards granted under the 1994 Amended Plan. The awards were issued to certain senior-level employees of Cypress in fiscal 2007 and 2008 and can be earned ratably over a remaining period of two to three years subject to the achievement of certain performance milestones. If the milestones are not achieved, the shares are forfeited and cannot be earned in future periods. Early in fiscal 2008, the Compensation Committee of the Board (“the Committee”) established the milestones for approximately 4.7 million of the outstanding performance-based awards. These performance-based milestones include the achievement of certain performance results of our common stock appreciation target against the Philadelphia Semiconductor Sector Index (“SOXX”), non-GAAP semiconductor gross margin and operating income milestones and non-GAAP semiconductor operating income performance goals versus a pre-determined peer group.
On March 12, 2009, the Committee approved the performance milestone achievements for 2008. The Committee, in its review of the performance achievements under 2008 PARS and other factors, exercised its discretion under our 1994 Stock Plan and adjusted the calculation methodology for certain performance milestones under the 2008 PARS. The adjusted methodology allowed us to calculate performance achievements based on financial operational results for the first three fiscal quarters of 2008 with respect to 75% of the participants targeted PARS, and the performance calculations for the remaining 25% targeted PARS to be based on financial and operations results of the fourth quarter of 2008. The targeted gross margins for the fourth fiscal quarter of 2008 were adjusted to account for product mix and under loading of the our manufacturing facilities as we proactively took steps to manage down inventory in a rapidly declining market. In exercising its discretion, the Committee considered the sharp global economic downturn which hit heavily in the fourth quarter of 2008; a sharp downturn not foreseen in industry forecasts or the Cypress plan for 2008. The Committee also factored in the impact of the final separation of SunPower Corporation, a major project and point of discontinuity in the operations of the Company, as part of the basis for the exercise of its discretion. As a result we recorded additional stock-based compensation of approximately $11.1 million in fiscal 2009.
During the first quarter of fiscal 2009, the Committee established the milestones for the first half of fiscal 2009 for approximately 2.3 million of the outstanding performance-based awards. These performance-based milestones include the achievement of certain performance results of our common stock appreciation target against the SOXX, certain levels of non-GAAP free cash flows and certain levels of non-GAAP operating expense. These awards are earned upon the Committee’s certification that the specified market and/or performance milestones have been achieved.
96
Table of Contents
The fair value of the shares with the market-condition milestone was determined using a Monte Carlo valuation methodology with the following weighted-average assumptions: volatility of our common stock of 69.6%; volatility of the SOXX of 57.4%; correlation coefficient of 0.69; and risk-free interest rate of 0.3%. The fair value of the shares with the performance-related milestones was equivalent to the grant-date fair value of our common stock.
On August 6, 2009, the Committee approved the performance milestones for the first half of 2009 which resulted in the release of 2.1 million shares of performance-based restricted stock units and restricted stock awards, prior to required tax payments. In addition on August 6, 2009, the Committee set three performance milestones required for the second half of fiscal 2009 for approximately 2.3 million of the outstanding performance-based awards currently set to be achieved by the end of the fourth fiscal quarter of 2009. These performance-based milestones include the achievement of certain performance results of our common stock appreciation target against the SOXX, certain levels of non-GAAP gross margin percentage and certain levels of non-GAAP operating income for the performance period. These milestones are adjusted for any non-planned, one-time and unusual transactions as designated by the Committee. These awards are earned upon the Committee’s certification that the specified market and/or performance milestones have been achieved. If the milestones are not achieved, the shares are forfeited and cannot be earned in future periods.
The fair value of the shares with the market-condition milestone was determined using a Monte Carlo valuation methodology with the following weighted-average assumptions: volatility of our common stock of 43.5%; volatility of the SOXX of 40.4%; correlation coefficient of 0.71; and risk-free interest rate of 0.2%. The fair value of the shares with the performance-related milestones was equivalent to the grant-date fair value of our common stock.
ESPP:
During fiscal 2009, 2008 and 2007, we issued 5.2 million, 0.4 million and 1.1 million shares under our ESPP with weighted-average prices of $12.79, $19.93 and $12.88 per share and grant-date fair value of $3.84, $9.34 and $5.07 per share, respectively.
NOTE 10. BALANCE SHEET COMPONENTS
Accounts Receivable, Net
| As of | ||||||||
| January 3, 2010 |
December 28, 2008 |
|||||||
| (In thousands) | ||||||||
| Accounts receivable, gross |
$ | 91,468 | $ | 96,027 | ||||
| Allowances for doubtful accounts receivable and sales returns |
(4,509 | ) | (4,084 | ) | ||||
| Total accounts receivable, net |
$ | 86,959 | $ | 91,943 | ||||
Inventories
| As of | ||||||
| January 3, 2010 |
December 28, 2008 | |||||
| (In thousands) | ||||||
| Raw materials |
$ | 11,551 | $ | 9,962 | ||
| Work-in-process |
56,947 | 76,049 | ||||
| Finished goods |
22,700 | 28,851 | ||||
| Total inventories |
$ | 91,198 | $ | 114,862 | ||
97
Table of Contents
Other Current Assets
| As of | ||||||
| January 3, 2010 |
December 28, 2008 | |||||
| (In thousands) | ||||||
| Deferred tax assets |
$ | 28 | $ | 1,233 | ||
| Receivable from SunPower |
2,255 | 18,697 | ||||
| Prepaid expenses |
22,725 | 24,093 | ||||
| Assets held for sale (see Note 11) |
7,690 | 8,536 | ||||
| Other current assets |
8,208 | 8,196 | ||||
| Total other current assets |
$ | 40,906 | $ | 60,755 | ||
Property, Plant and Equipment, Net
| As of | ||||||||
| January 3, 2010 |
December 28, 2008 |
|||||||
| (In thousands) | ||||||||
| Land |
$ | 29,048 | $ | 29,405 | ||||
| Equipment |
946,817 | 1,008,187 | ||||||
| Buildings and leasehold improvements |
204,107 | 207,294 | ||||||
| Furniture and fixtures |
10,820 | 10,643 | ||||||
| Total property, plant and equipment, gross |
1,190,792 | 1,255,529 | ||||||
| Less: accumulated depreciation and amortization |
(918,172 | ) | (958,740 | ) | ||||
| Total property, plant and equipment, net |
$ | 272,620 | $ | 296,789 | ||||
Other Long-term Assets
| As of | ||||||
| January 3, 2010 |
December 28, 2008 | |||||
| (In thousands) | ||||||
| Employee deferred compensation plan (see Note 17) |
$ | 25,664 | $ | 20,246 | ||
| Investments: |
||||||
| Debt securities (see Note 7) |
33,356 | 35,701 | ||||
| Equity securities (see Note 7) |
1,425 | 1,788 | ||||
| Other assets |
13,770 | 18,342 | ||||
| Total other assets |
$ | 74,215 | $ | 76,077 | ||
Other Current Liabilities
| As of | ||||||
| January 3, 2010 |
December 28, 2008 | |||||
| (In thousands) | ||||||
| Employee deferred compensation plan (see Note 17) |
$ | 25,071 | $ | 20,478 | ||
| Accrued sales representative commissions |
1,134 | 2,686 | ||||
| Accrued royalties |
129 | 4,385 | ||||
| Restructuring accrual |
3,740 | 10,095 | ||||
| Other current liabilities |
26,549 | 25,951 | ||||
| Total other current liabilities |
$ | 56,623 | $ | 63,595 | ||
98
Table of Contents
Deferred Income Taxes and Other Tax Liabilities
| As of | |||||||
| January 3, 2010 |
December 28, 2008 | ||||||
| (In thousands) | |||||||
| Deferred income taxes |
$ | (42 | ) | $ | 540 | ||
| Non-current tax liabilities |
39,314 | 22,046 | |||||
| Total deferred income taxes and other tax liabilities |
$ | 39,272 | $ | 22,586 | |||
NOTE 11. RESTRUCTURING
The following table summarizes the restructuring charges recorded in the Consolidated Statements of Operations:
| Year Ended | |||||||||
| January 3, 2010 |
December 28, 2008 |
December 30, 2007 | |||||||
| (In thousands) | |||||||||
| Fiscal 2008/9 Restructuring Plan |
$ | 15,028 | $ | 11,783 | $ | — | |||
| Fiscal 2007 Restructuring Plan |
214 | 9,860 | 583 | ||||||
| Total restructuring charges |
$ | 15,242 | $ | 21,643 | $ | 583 | |||
Fiscal 2008/9 Restructuring Plan
During the third quarter of fiscal 2008, we initiated a restructuring plan as part of a companywide cost saving initiative aimed to reduce operating costs in response to the economic downturn (“Fiscal 2008/9 Restructuring Plan”). At January 3, 2010, we recorded a total of $26.8 million under the Fiscal 2008/9 Restructuring Plan, of which $23.1 million was related to personnel costs and $3.7 million was related to other exit costs. The determination of when we accrue for severance costs, and what guidance applies depends on whether the termination benefits are provided under a one-time benefit arrangement or under an on-going benefit arrangement.
Restructuring activities related to personnel costs are summarized as follows:
| (In thousands) |
|||
| Initial provision |
$ | 11,611 | |
| Non-cash |
(162) | ||
| Cash payments |
(4,075) | ||
| Balance as of December 28, 2008 |
7,374 | ||
| Provision |
11,516 | ||
| Non-cash |
(1,352) | ||
| Cash payments |
(14,271) | ||
| Balance as of January 3, 2010 |
$ | 3,267 | |
We expect to eliminate approximately 835 positions and recorded total provisions of $23.1 million related to severance and benefits. The following table summarizes certain information related to the positions:
| Locations |
Number of Employees | |
| Manufacturing facility in the Philippines |
250 | |
| Manufacturing facility in Minnesota |
160 | |
| Corporate and other |
425 | |
| Total |
835 | |
99
Table of Contents
As of year end about 76 employees remained with us and the majority of these remaining employee terminations are to be completed by the end of fiscal 2010.
Fiscal 2007 Restructuring Plan
During the fourth quarter of fiscal 2007, we implemented a restructuring plan to exit our manufacturing facility located in Round Rock, Texas (“Fiscal 2007 Restructuring Plan”). Under the Fiscal 2007 Restructuring Plan, we transitioned production from the Texas facility to our more cost-effective facility in Bloomington, Minnesota as well as outside third-party foundries. The Fiscal 2007 Restructuring Plan includes the termination of employees and the disposal of assets, primarily consisting of land, building and manufacturing equipment, located in the Texas facility. The Fiscal 2007 Restructuring Plan does not involve the discontinuation of any material product lines or other functions.
To date, we recorded total restructuring charges of $10.7 million related to the Fiscal 2007 Restructuring Plan, of which $0.2 million was recorded in fiscal 2009, $9.9 million was recorded in fiscal 2008 and $0.6 million was recorded in fiscal 2007. Of the total restructuring charges, $8.0 million was related to personnel costs and $2.7 million was related to property, plant and equipment and other exit costs.
Personnel Costs:
Restructuring activities related to personnel costs are summarized as follows:
| (In thousands) |
|||
| Initial provision |
$ | 355 | |
| Cash payments |
— | ||
| Balance as of December 30, 2007 |
355 | ||
| Additional provision |
7,029 | ||
| Cash payments |
(4,663) | ||
| Balance as of December 28, 2008 |
2,721 | ||
| Additional provision |
627 | ||
| Cash payments |
(3,348) | ||
| Balance as of January 3, 2010 |
$ | — | |
We completed the termination of the remaining employees in the first quarter of fiscal 2009, all balances related to benefits were paid by the third quarter of fiscal 2009.
Property, Plant and Equipment:
The Texas facility ceased operations in the fourth quarter of fiscal 2008. As management has committed to a plan to dispose of the assets associated with the facility by sale, we have classified the assets as held for sale and valued the assets at the lower of their carrying amount or fair value. Fair value was determined by an analysis of market prices for similar assets. Based on this analysis, we recorded a write-down of $1.9 million related to the assets. In addition, we recorded $1.2 million of related disposal and other facility costs.
The following table summarizes the net book value of the remaining restructured assets that were classified as held for sale and included in “Other current assets” in the Consolidated Balance Sheet as of January 3, 2010:
| (In thousands) |
|||
| Land |
$ | 994 | |
| Equipment |
266 | ||
| Buildings and leasehold improvements |
6,430 | ||
| Total property, plant and equipment, net |
$ | 7,690 | |
100
Table of Contents
We had expected to complete the disposal of the restructured assets by the fourth quarter of fiscal 2009, however, due to the downturn and uncertainty in the commercial real estate market we were unable to secure a buyer for the Texas facility. In response, we have revised the asking price for the property and expect to sell the facility in the next twelve months.
NOTE 12. FOREIGN CURRENCY DERIVATIVES
We operate and sell products in various global markets and purchase capital equipment using the U.S. dollar and foreign currencies. As a result, we are exposed to risks associated with changes in foreign currency exchange rates. We may use various hedge instruments from time to time to manage the exposures associated with purchases of foreign sourced equipment, net asset or liability positions of our subsidiaries and forecasted revenues and expenses. We do not enter into foreign currency derivative financial instruments for speculative or trading purposes. The counterparties to these hedging transactions are creditworthy multinational banks and the risk of counterparty nonperformance associated with these contracts is not considered to be material as of January 3, 2010.
As of January 3, 2010 and December 28, 2008, our hedge instruments consisted primarily of foreign currency forward contracts. We estimate the fair value of our forward contracts based on spot and forward rates from published sources.
We record hedges of certain foreign currency denominated monetary assets and liabilities at fair value at the end of each reporting period with the related gains or losses recorded in “Other income (expense), net” in the Consolidated Statements of Operations. The gains or losses on these contracts are substantially offset by transaction gains or losses on the underlying balances being hedged. As of January 3, 2010 and December 28, 2008, we had outstanding forward contracts with an aggregate notional value of $1.0 million and $1.4 million, respectively, to hedge the risks associated with foreign currency denominated assets and liabilities.
NOTE 13. ACCUMULATED OTHER COMPREHENSIVE INCOME (LOSS)
The components of accumulated other comprehensive income (loss) were as follows:
| As of | |||||||
| January 3, 2010 |
December
28, 2008 | ||||||
| (In thousands) | |||||||
| Accumulated net unrealized gains on available-for-sale investments |
$ | 4,415 | $ | 2,427 | |||
| Accumulated net unrealized gains on derivatives |
115 | 106 | |||||
| Impairment loss on auction rate securities |
(5,253 | ) | — | ||||
| Total accumulated other comprehensive income (loss) |
$ | (723 | ) | $ | 2,533 | ||
101
Table of Contents
NOTE 14. OTHER INCOME (EXPENSE), NET
The following table summarizes the components of other income (expense), net, recorded in the Consolidated Statements of Operations:
| Year Ended | ||||||||||||
| January 3, 2010 |
December 28, 2008 |
December 30, 2007 |
||||||||||
| (In thousands) | ||||||||||||
| Amortization of debt issuance costs |
$ | (114 | ) | $ | (3,051 | ) | $ | (3,530 | ) | |||
| Write-off of debt issuance costs (see Note 15) |
— | (4,800 | ) | (4,226 | ) | |||||||
| Gain on investments (see Note 7) |
822 | — | 929 | |||||||||
| Gain (loss) on debt extinguishment |
— | 2,193 | (2,927 | ) | ||||||||
| Impairment of investments (see Note 8) |
(2,549 | ) | (13,355 | ) | (1,903 | ) | ||||||
| Changes in fair value of investments under the deferred |
5,150 | (10,643 | ) | 1,138 | ||||||||
| Foreign currency exchange gain (loss), net |
(22 | ) | 2,925 | (5,495 | ) | |||||||
| Other |
487 | (335 | ) | 617 | ||||||||
| Total other income (expense), net |
$ | 3,774 | $ | (27,066 | ) | $ | (15,397 | ) | ||||
NOTE 15. DEBT AND EQUITY TRANSACTIONS
1.00% Convertible Senior Notes (“1.00% Notes”)
In March 2007, we entered into the following transactions: (1) the issuance of $600.0 million in principal amount of the 1.00% Notes, (2) a convertible note hedge and warrant transactions with respect to our common stock, and (3) an accelerated share repurchase program.
1.00% Notes:
We issued $600.0 million in principal amount of the 1.00% Notes with interest payable semiannually in arrears in cash on March 15 and September 15 of each year, beginning on September 15, 2007. The 1.00% Notes matured on September 15, 2009. The 1.00% Notes were initially convertible, subject to certain conditions, into cash up to the lesser of the principal amount or the conversion value. If the conversion value was greater than $1,000, then the excess conversion value was convertible into cash, common stock or a combination of cash and common stock, at our election. The initial effective conversion price of the 1.00% Notes was $23.90 per share, which represented a premium of 26.5% to the closing price of our common stock on the date of issuance. Holders who converted their 1.00% Notes in connection with certain types of corporate transactions constituting a fundamental change were entitled to a make-whole premium in the form of an increase in the conversion rate. Additionally, in the event of a fundamental change, holders could require us to purchase all or a portion of their 1.00% Notes at a purchase price equal to 100% of the principal amount, plus accrued and unpaid interest, if any, to, but not including, the fundamental change repurchase date. In connection with the offering of the 1.00% Notes, we incurred approximately $12.9 million of debt issuance costs.
The 1.00% Notes were unsubordinated and unsecured senior obligations of Cypress, and ranked equal in right of payment with all of our other existing and future unsubordinated and unsecured obligations, ranked junior in right of payment to any of our secured obligations to the extent of the value of the collateral securing such obligations, and were subordinated in right of payment to all existing and future obligations of our subsidiaries.
As of December 28, 2008, the carrying value of the 1.00% Notes was $27.0 million and the fair value was $28.0 million. The value of the 1.00% Notes was determined based on quoted market prices.
102
Table of Contents
Tender Offer:
In September 2008, we completed a tender offer to purchase for cash up to $531.3 million in aggregate principal amount of the 1.00% Notes. Based on the final results of the tender offer, $582.4 million aggregate principal amount of the 1.00% Notes were tendered. We accepted $531.3 million of the tendered 1.00% Notes at a purchase price of $1,321.22 per $1,000 principal amount, plus accrued and unpaid interest. Because more than $531.3 million principal amount was tendered, we purchased the 1.00% Notes on a pro-rata basis. The pro-ration was based on the ratio of the principal amount of the 1.00% Notes tendered by a holder to the total principal amount of the 1.00% Notes tendered by all the holders. As a result of the tender offer, we paid $701.9 million in cash.
Open Market Purchase:
In November 2008, we made open market purchases of approximately $12.1 million of the outstanding 1.00% Notes at a slight discount to par, plus accrued interest.
Fundamental Change:
Pursuant to the applicable Indenture, the Spin-Off of SunPower (see Note 3) constituted both a fundamental change and a make-whole fundamental change to the 1.00% Notes. Consequently, the remaining holders were permitted to require us to purchase their 1.00% Notes on December 17, 2008, the fundamental change purchase date, in cash at a price equal to $1,000 principal amount of the Notes, plus accrued and unpaid interest to, but excluding, the fundamental change purchase date. On December 17, 2008, we repurchased $28.7 million of the 1.00% Notes.
Debt Maturity:
On September 15, 2009, our outstanding 1.00% Notes of approximately $28.0 million in principal matured and were settled. Holders received cash for the principal amount of the 1.00% Notes and the entire premium. The final conversion price per 1.00% Notes as calculated under the Indenture, was $1,841.76 including principal and premium. Consistent with the terms of the Indenture, on September 15, 2009, we paid approximately $51.6 million for the principal amount of 1.00% Notes, premium and accrued and unpaid interest.
Convertible Note Hedge and Warrants:
In connection with the issuance of the 1.00% Notes, we had a convertible note hedge transaction with respect to our common stock with two counterparties at the equivalent amount of common stock that would be issuable upon conversion of the 1.00% Notes. The objective of this hedge was to reduce the potential dilution upon conversion of the 1.00% Notes in the event that the market value per share of our common stock at the time of exercise is greater than the conversion price of the 1.00% Notes. In addition, we had a warrant transaction in which we sold to the same counterparties warrants to acquire the same number of shares of our common stock underlying the 1.00% Notes. On September 15, 2009, the hedge matured and as a result we received $23.6 million from the counterparties. In addition, we repurchased and settled the outstanding warrants, issued in March 2007, through a cash payment of approximately $20.3 million to the counterparties holding the warrants.
During fiscal 2008, we terminated a portion of the convertible note hedge and warrant agreements with respect to the amount of the 1.00% Notes that were purchased by us in transactions described above. As a result of the termination, we received total net cash proceeds of $7.8 million from the option counterparties, which was recorded in “Additional paid-in capital” in the Consolidated Balance Sheet in fiscal 2008. The portion of the convertible note hedge and the warrant agreements associated with the outstanding principal amount of the 1.00% Notes remained outstanding as of December 28, 2008.
Accelerated Share Repurchase Program:
In connection with the issuance of the 1.00% Notes, we had entered into an accelerated share repurchase program. Pursuant to the program, we repurchased shares of our common stock on the open market based on the
103
Table of Contents
volume weighted-average price of our common stock, subject to a per-share floor price and cap price, calculated over a period of approximately three months. The accelerated share repurchase program was funded with approximately $571.0 million of net proceeds from the offering of the 1.00% Notes. We completed the accelerated share repurchase program in fiscal 2007 and repurchased a total of 28.9 million shares at an average price of $19.78.
1.25% Convertible Subordinated Notes (“1.25% Notes”)
During fiscal 2003, we issued $600.0 million in principal amount of the 1.25% Notes with interest payable on June 15 and December 15. The 1.25% Notes were due in June 2008. The 1.25% Notes, which could be converted at anytime by the holders prior to maturity, were convertible into 55.172 shares of our common stock per $1,000 principal amount, plus a cash payment of $300. The 1.25% Notes were callable by us at anytime.
In February 2007, we called for redemption of the outstanding 1.25% Notes. Holders had the option to convert the 1.25% Notes into 55.172 shares of our common stock per $1,000 principal amount plus $300 in cash. Alternatively, holders had the option to have their 1.25% Notes redeemed. Upon redemption, holders would receive $1,000 plus accrued interest per $1,000 principal amount. As a result of the redemption, we issued approximately 33.0 million shares of our common stock and paid approximately $179.7 million in cash to the holders in fiscal 2007. In addition, we wrote off approximately $4.2 million of related unamortized debt issuance costs in fiscal 2007.
Stock Repurchase Program
In fiscal 2007, the Board authorized a stock repurchase program of up to $300.0 million. In fiscal 2008, the Board approved an additional $300.0 million, bringing the total amount that may have been used for stock purchases to $600.0 million under the stock repurchase program. The stock repurchase program was in addition to the accelerated share repurchase program associated with the 1.00% Notes.
During fiscal 2008, we used $375.6 million in cash to repurchase a total of approximately 37.1 million shares at an average share price of $10.13. Approximately 12.6 million shares of this repurchase occurred prior to the Spin-Off at an average stock price of $21.95. The remaining 24.5 million shares were purchased after the Spin-Off at an average price of $4.03.
During fiscal 2009, we used $46.3 million to repurchase approximately 5.8 million shares at an average share price of $8.00. In light of certain tax constraints placed on us in connection with the tax-free spin of SunPower, we had no current intentions of repurchasing additional stock under the existing program. Accordingly, on October 28, 2009, the Audit Committee of the Board voted to rescind the remaining $178.1 million available under the program for additional repurchases.
Equity Option Contracts
As of December 31, 2006, we had outstanding a series of equity options on our common stock with an initial cost of $26.0 million that were originally entered into in fiscal 2001. The contracts required physical settlement. Upon expiration of the options, if our stock price was above the threshold price of $21.00 per share, we would receive a settlement value totaling $30.3 million in cash. If our stock price was below the threshold price of $21.00 per share, we would receive 1.4 million shares of our common stock.
During fiscal 2007, the contracts expired and we did not renew them. We received 1.4 million shares of our common stock, which was accounted for as treasury stock.
On October 28, 2009 the Audit Committee also approved a yield enhancement strategy intended to improve the yield on our available non-strategic cash. As part of this program, the Audit Committee authorized us to enter into short-term yield enhanced structured agreements correlated to our stock price. In one such structure, we pay a fixed sum of cash upon execution of an agreement in exchange for the financial institution’s obligations to pay
104
Table of Contents
either a pre-determined amount of cash or shares of our common stock depending on the closing market price of our common stock on the expiration date of the agreement. Upon expiration of each agreement, if the closing market price of our common stock is above the pre-determined price, we will have our cash investment returned plus a yield substantially above the yield currently available for short-term cash investments. If the closing market price is at or below the pre-determined price, we will receive the number of shares specified at the agreement’s inception. As the outcome of these arrangements is based entirely on our stock price and does not require us to deliver either shares or cash, other than the original investment, the entire transaction is recorded in equity.
The decision to enter into a yield enhanced structured agreement is based upon a comparison of the yields available in the financial markets for similar maturities against the expected yield to be realized per the structured agreement and the related risks associated with this type of arrangement. We believe the risk associated with these types of agreements is no different than alternative investments available to us with equivalent counterparty credit ratings. All counterparties to a yield enhancement program have a credit rating of at least Aa2 or A as rated by major independent rating agencies. For all such agreements that matured in the fourth quarter of fiscal 2009, the yields of the structured agreements were far superior to the yields available in the financial markets primarily due to the volatility of our stock price and the pre-payment aspect of the agreements. The counterparty is willing to pay a premium over the yields available in the financial markets due to the structure of the agreement.
In the fourth quarter of fiscal 2009, we entered into short-term yield enhanced structured agreements totaling $68.0 million with maturities of 30 days or less. We settled these agreements in the fourth quarter of fiscal 2009 and received $69.1 million in cash. In February 2010, we entered into two additional short-term yield enhanced structured agreements with maturities of 30 days or less totaling $98.0 million. Upon settlement of these agreements, we expect to receive $101.4 million in cash. However if upon settlement of the agreements our stock price is at or below the pre-determined price, we will receive 9.0 million shares of our common stock.
Line of Credit
In March 2009, we extended our line of credit with Silicon Valley Bank to March 2010 with a total available amount of $55.0 million. Loans made under the line of credit bear interest based upon the Wall Street Journal Prime Rate (3.25% as of January 3, 2010 and 3.25% as of December 28, 2008) or LIBOR plus 1.5% (1.75% as of January 3, 2010 and 2.96% as of December 28, 2008). The line of credit agreement includes a variety of covenants including restrictions on the incurrence of indebtedness, incurrence of loans, the payment of dividends or distribution on its capital stock, and transfers of assets and financial covenants with respect to net worth. As of January 3, 2010, we were in compliance with all of the financial covenants. Our obligations under the line of credit are guaranteed and collateralized by the common stock of certain of our business entities. We intend to use the line of credit on an as-needed basis to fund working capital and capital expenditures. To date, there have been no borrowings under the line of credit.
In conjunction with certain guarantees, we issued irrevocable standby letters of credit in the aggregate amount of $47.0 million to secure payments under an equipment lease. As of January 3, 2010, the letters of credit have been reduced to $13.4 million. See “Lease Guarantees” under Note 19 for further discussion.
NOTE 16. NET INCOME (LOSS) PER SHARE
Basic net income (loss) per share is computed using the weighted-average common shares outstanding. Diluted net income per share is computed using the weighted-average common shares outstanding and any dilutive potential common shares. Diluted net loss per common share is computed using the weighted-average common shares outstanding and excludes all dilutive potential common shares when we are in a net loss position their inclusion would be anti-dilutive. Our dilutive securities primarily include stock options, restricted stock units, restricted stock awards, convertible debt and warrants.
105
Table of Contents
The following table sets forth the computation of basic and diluted net income (loss) per share:
| Year Ended | ||||||||||||
| January 3, 2010 |
December 28, 2008 |
December 30, 2007 |
||||||||||
| (In thousands, except per-share amounts) | ||||||||||||
| Net Income (Loss) per Share—Basic: |
||||||||||||
| Income (loss) from continuing operations |
$ | (150,424 | ) | $ | (319,262 | ) | $ | 366,862 | ||||
| Income from discontinued operations attributable to Cypress |
— | 34,386 | 16,057 | |||||||||
| Income from discontinued operations—noncontrolling interest, net of taxes |
— | 34,154 | 12,681 | |||||||||
| Noncontrolling interest, net of income taxes |
(946 | ) | (311 | ) | (19 | ) | ||||||
| Net income (loss) |
(151,370 | ) | (251,033 | ) | 395,581 | |||||||
| Less income (loss) attributable to noncontrolling interest |
946 | (33,843 | ) | (12,662 | ) | |||||||
| Net income (loss) for basic computation attributable to Cypress |
$ | (150,424 | ) | $ | (284,876 | ) | $ | 382,919 | ||||
| Weighted-average common shares for basic computation |
145,611 | 150,447 | 155,559 | |||||||||
| Net income (loss) per share—basic: |
||||||||||||
| Continuing operations attributable to Cypress |
$ | (1.03 | ) | $ | (2.12 | ) | $ | 2.36 | ||||
| Discontinued operations attributable to Cypress |
— | 0.23 | 0.10 | |||||||||
| Net income (loss) per share—basic |
$ | (1.03 | ) | $ | (1.89 | ) | $ | 2.46 | ||||
| Net Income (Loss) per Share—Diluted: |
||||||||||||
| Income (loss) from continuing operations |
$ | (150,424 | ) | $ | (319,262 | ) | $ | 366,862 | ||||
| Adjustments: |
||||||||||||
| Interest expense and related costs associated with the 1.25% Notes |
— | — | 5,759 | |||||||||
| Other |
— | — | (717 | ) | ||||||||
| Income (loss) from continuing operations for diluted computation |
(150,424 | ) | (319,262 | ) | 371,904 | |||||||
| Income from discontinued operations attributable to Cypress |
— | 34,386 | 16,057 | |||||||||
| Income from discontinued operations—noncontrolling interest, net of taxes |
— | 34,154 | 12,681 | |||||||||
| Noncontrolling interest, net of income taxes |
(946 | ) | (311 | ) | (19 | ) | ||||||
| Net income (loss) |
(151,370 | ) | (251,033 | ) | 400,623 | |||||||
| Less income (loss) attributable to noncontrolling interest |
946 | (33,843 | ) | (12,662 | ) | |||||||
| Net income (loss) for diluted computation attributable to Cypress |
$ | (150,424 | ) | $ | (284,876 | ) | $ | 387,961 | ||||
| Weighted-average common shares |
145,611 | 150,447 | 155,559 | |||||||||
| Effect of dilutive securities: |
||||||||||||
| Stock options, restricted stock units and restricted stock awards |
— | — | 8,288 | |||||||||
| 1.00% Notes |
— | — | 2,282 | |||||||||
| 1.25% Notes |
— | — | 4,455 | |||||||||
| Warrants |
— | — | 1,252 | |||||||||
| Weighted-average common shares for diluted computation |
145,611 | 150,447 | 171,836 | |||||||||
| Net income (loss) per share—diluted: |
||||||||||||
| Continuing operations attributable to Cypress |
$ | (1.03 | ) | $ | (2.12 | ) | $ | 2.26 | ||||
| Discontinued operations attributable to Cypress |
— | 0.23 | 0.10 | |||||||||
| Net income (loss) per share—diluted |
$ | (1.03 | ) | $ | (1.89 | ) | $ | 2.36 | ||||
Convertible Debt and Warrants:
The 1.00% Notes were convertible debt which required us to settle the principal value of the debt in cash and any conversion premiums in either cash or stock, at our election. In connection with the issuance of the 1.00% Notes, we entered into a convertible note hedge transaction. In addition, we entered into a warrant transaction in which we sold to the option counterparties warrants to acquire the same number of shares of our common stock underlying the 1.00% Notes. We apply the treasury stock method in determining the dilutive impact of both the 1.00% Notes and the warrants. In accordance with the relevant guidance, the convertible note hedge is excluded from the diluted earnings per share computation as it is anti-dilutive.
106
Table of Contents
Anti-Dilutive Securities:
The following securities were excluded from the computation of diluted net income (loss) per share as their impact was anti-dilutive:
| Year Ended | ||||||
| January 3, 2010 |
December 28, 2008 |
December 30, 2007 | ||||
| (In thousands) | ||||||
| Stock options, restricted stock units and restricted stock awards |
83,689 | 103,250 | 27,820 | |||
| 1.00% Notes |
841 | 77,852 | — | |||
| Warrants |
948 | 77,852 | — | |||
NOTE 17. EMPLOYEE BENEFIT PLANS
Key Employee Bonus Plan
We have a key employee bonus plan, which provides for incentive payments to certain key employees including all executive officers except the Chief Executive Officer. Payments under the plan are determined based upon certain performance measures, including our actual earnings per share compared to the annual operating plan as well as achievement of strategic, operational and financial goals established for each key employee. We recorded total charges of $7.3 million under the plan in fiscal 2009, $6.2 million in fiscal 2008 and $10.7 million in fiscal 2007.
Performance Profit Sharing Plan
We have a performance profit sharing plan, which provides incentive payments to all our employees. The plan was adopted in fiscal 2006. Payments under the plan are determined based upon our earnings per share and the employees’ percentage of success in achieving certain performance goals. We recorded total charges of $4.9 million under the plan in fiscal 2009, $5.2 million in fiscal 2008 and $6.7 million in fiscal 2007.
Performance Bonus Plan
In fiscal 2008, we established the performance bonus plan, which provides for incentive payments to executive officers and key employees who are recommended by our senior management and approved solely at the discretion of the Committee of the Board. Payments under the plan are determined based upon the attainment and certification of certain objective performance criteria established by the Committee. The sole participant in the performance bonus plan for fiscal 2009 and fiscal 2008 was our Chief Executive Officer. We recorded total charges of $0.5 million under the plan in fiscal 2009 and $0.6 million in fiscal 2008.
Deferred Compensation Plan
We have a deferred compensation plan, which provides certain key employees, including our executive management, with the ability to defer the receipt of compensation in order to accumulate funds for retirement on a tax-free basis. We did not make contributions to the deferred compensation plan or guarantee returns on the investments. Participant deferrals and investment gains and losses remain our assets and are subject to claims of general creditors.
Under the deferred compensation plan the assets are recorded at fair value in each reporting period with the offset being recorded in “Other income (expense), net.” The liabilities are recorded at fair value in each reporting period with the offset being recorded as an operating expense or income. As of January 3, 2010 and December 28, 2008, the fair value of the assets was $25.7 million and $20.2 million, respectively, and the fair value of the liabilities was $25.1 million and $20.5 million, respectively.
107
Table of Contents
All expense and income recorded under the deferred compensation plan were included in the following line items in the Consolidated Statements of Operations:
| Year Ended | ||||||||||||
| January 3, 2010 |
December 30, 2007 |
December 30, 2007 |
||||||||||
| (In thousands) | ||||||||||||
| Changes in fair value of assets recorded in: |
||||||||||||
| Other income (expense), net |
$ | 5,150 | $ | (10,643 | ) | $ | 1,138 | |||||
| Changes in fair value of liabilities recorded in: |
||||||||||||
| Cost of revenues |
(516 | ) | 2,129 | (679 | ) | |||||||
| Research and development expenses |
(1,454 | ) | 3,560 | (782 | ) | |||||||
| Selling, general and administrative expenses |
(3,168 | ) | 5,437 | (596 | ) | |||||||
| Total income (expense), net |
$ | 12 | $ | 483 | $ | (919 | ) | |||||
During fiscal 2003, we entered into an arrangement with a major financial institution, wherein we purchased a forward contract to hedge the impact of market changes of our common stock held by the plan. The forward contract was carried at fair value with any changes in the fair value recorded as an operating expense or credit in the Consolidated Statements of Operations. In fiscal 2007, we recorded credits of $2.8 million related to the forward contract.
During fiscal 2007, we terminated the forward contract and received proceeds of $5.4 million from the settlement. In addition, we received proceeds of $1.2 million following the death of a plan participant.
Pension Plans
We sponsor defined benefit pension plans covering employees in certain of our international locations. We do not have pension plans for our United States-based employees. As of January 3, 2010 and December 28, 2008, projected benefit obligations totaled $4.7 million and $4.5 million, respectively, and the fair value of plan assets was $2.6 million and $1.9 million, respectively.
401(k) Plan
We sponsor a 401(k) plan which provides participating employees with an opportunity to accumulate funds for retirement. We do not make contributions to the 401(k) plan.
108
Table of Contents
NOTE 18. INCOME TAXES
The geographic distribution of income (loss) from continuing operations before income taxes and the components of income tax benefit (provision) are summarized below:
| Year Ended | ||||||||||||
| January 3, 2010 |
December 28, 2008 |
December 30, 2007 |
||||||||||
| (In thousands) | ||||||||||||
| United States income (loss) |
$ | (182,858 | ) | $ | (295,359 | ) | $ | 341,553 | ||||
| Foreign income (loss) |
38,288 | (15,974 | ) | 30,915 | ||||||||
| Income (loss) from continuing operations before income taxes |
(144,570 | ) | (311,333 | ) | 372,468 | |||||||
| Income tax benefit (provision): |
||||||||||||
| Current tax benefit (expense): |
||||||||||||
| Federal |
(1,986 | ) | (5,775 | ) | — | |||||||
| State |
(250 | ) | (587 | ) | (351 | ) | ||||||
| Foreign |
(3,618 | ) | (2,564 | ) | (7,005 | ) | ||||||
| Total current tax expense |
(5,854 | ) | (8,926 | ) | (7,356 | ) | ||||||
| Deferred tax benefit: |
||||||||||||
| Foreign |
— | 997 | 1,750 | |||||||||
| Total deferred tax benefit |
— | 997 | 1,750 | |||||||||
| Income tax benefit (provision) |
$ | (5,854 | ) | $ | (7,929 | ) | $ | (5,606 | ) | |||
Income tax benefit (provision) differs from the amounts obtained by applying the statutory United States federal income tax rate to income (loss) before taxes as shown below:
| Year Ended | ||||||||||||
| January 3, 2010 |
December 28, 2008 |
December 30, 2007 |
||||||||||
| (In thousands) | ||||||||||||
| Benefit (provision) at U.S. statutory rate of 35% |
$ | 50,930 | $ | 108,967 | $ | (130,364 | ) | |||||
| Foreign income at other than U.S. rates |
5,967 | (27,617 | ) | 12,786 | ||||||||
| Future benefits not recognized |
(61,474 | ) | 6,970 | — | ||||||||
| Non-deductible executive compensation |
(1,181 | ) | — | — | ||||||||
| SunPower tax sharing agreement |
(1,154 | ) | — | — | ||||||||
| State income taxes, net of federal benefit |
(250 | ) | (587 | ) | (228 | ) | ||||||
| Tax credits |
676 | 1,248 | — | |||||||||
| Alternative minimum tax |
— | (23,677 | ) | — | ||||||||
| Recognition of prior-year benefits |
— | 85,820 | 102,455 | |||||||||
| Convertible bond interest |
— | 6,857 | 9,858 | |||||||||
| Non-deductible goodwill and bond tender losses |
— | (185,071 | ) | — | ||||||||
| Reversal of previously accrued taxes |
506 | 19,612 | — | |||||||||
| Other, net |
126 | (451 | ) | (113 | ) | |||||||
| Income tax benefit (provision) |
$ | (5,854 | ) | $ | (7,929 | ) | $ | (5,606 | ) | |||
109
Table of Contents
The components of deferred tax assets and liabilities were as follows:
| As of | ||||||||
| January 3, 2010 |
December 28, 2008 |
|||||||
| (In thousands) | ||||||||
| Deferred tax assets: |
||||||||
| Credits and net operating loss carryovers |
$ | 140,812 | $ | 119,812 | ||||
| Excess of book over tax depreciation |
15,206 | 20,739 | ||||||
| Reserves and accruals |
79,242 | 84,672 | ||||||
| Deferred income |
9,108 | 2,356 | ||||||
| Total deferred tax assets |
244,368 | 227,579 | ||||||
| Less valuation allowance |
(239,946 | ) | (214,267 | ) | ||||
| Deferred tax assets, net |
4,422 | 13,312 | ||||||
| Deferred tax liabilities: |
||||||||
| Intangible assets arising from acquisitions |
(4,422 | ) | (12,619 | ) | ||||
| Total deferred tax liabilities |
(4,422 | ) | (12,619 | ) | ||||
| Net deferred tax assets (liabilities) |
$ | — | $ | 693 | ||||
As of January 3, 2010 and December 28, 2008, deferred tax assets of $239.9 million and $214.3 million, respectively, were fully reserved due to uncertainty of realization in accordance with the accounting guidance, under which current and long-term net deferred taxes have been netted to the extent they are in the same tax jurisdiction.
At January 3, 2010, we had U.S. federal net operating loss carryovers of approximately $478.4 million, which, if not utilized, will expire from 2024 through 2029. Of the $478.4 million, $29.0 million is subject to Section 382 limitation. When recognized, $270.8 million of the tax benefit will be accounted for as a credit to additional paid-in capital rather than a reduction of the income tax provision. We had state net operating loss carryovers of approximately $144.1 million which, if not utilized, will expire from 2011 through 2019. A portion of these net operating loss carryovers relate to recent acquisitions and are subject to certain limitations. We had U.S. federal tax credit carryforwards of approximately $97.3 million, which, if not utilized, will expire from 2018 through 2029, and state tax credit carryforwards of approximately $70.6 million, which currently do not have any expiration date. In addition, utilization of the net operating losses and tax credit carryovers may be limited if certain ownership changes occur subsequent to January 3, 2010.
We received tax deductions from the gains realized by employees on the exercise of certain non-qualified stock options for which the benefit is recognized as a component of stockholders’ equity. Historically, we have evaluated the deferred tax assets relating to these stock option deductions along with its other deferred tax assets and concluded that a valuation allowance is not required for that portion of the total deferred tax assets that are considered more likely than not to be realized in future periods. To the extent that the deferred tax assets with a valuation allowance become realizable in future periods, we will have the ability, subject to carryforward limitations, to benefit from these amounts. When realized, the tax benefits of tax deductions related to stock options are accounted for as an increase to additional paid-in capital rather than a reduction of the income tax provision.
United States income taxes and foreign withholding taxes have not been provided on a cumulative total of $184.2 million and $143.2 million of undistributed earnings for certain non-United States subsidiaries as of January 3, 2010 and December 28, 2008, respectively, because such earnings are intended to be indefinitely reinvested in the operations and potential acquisitions of our international operations. Upon distribution of those earnings in the form of dividends or otherwise, we would be subject to U.S. income taxes (subject to an adjustment for foreign tax credits). It is not practicable to determine the income tax liability that might be incurred if these earnings were to be distributed.
110
Table of Contents
Our global operations involve manufacturing, research and development, and selling activities. Our operations outside the U.S. are in certain countries that impose a statutory tax rate both higher and lower than the U.S. We are subject to tax holidays in the Philippines and India where we manufacture and design certain of our products. These tax holidays are scheduled to expire at varying times within the next one and four years. Our tax benefit of these tax holidays for the year ended January 3, 2010 was $1.0 million which had an insignificant impact on earnings per share. Overall, we expect our foreign earnings to be taxed at rates lower than the statutory tax rate in the U.S.
Unrecognized Tax Benefits
We adopted the new accounting guidance as issued by the FASB related to unrecognized tax benefits on January 1, 2007. A reconciliation of unrecognized tax benefits is as follows:
| (In thousands) |
||||
| Unrecognized tax benefits, as of January 1, 2007 |
$ | 38,893 | ||
| Increase based on tax positions related to fiscal 2007 |
4,760 | |||
| Increase based on tax positions related to prior years |
3,154 | |||
| Unrecognized tax benefits, as of December 30, 2007 |
46,807 | |||
| Decrease based on tax positions related to fiscal 2008 |
(14,251 | ) | ||
| Decrease related to settlements with taxing authorities |
(10,511 | ) | ||
| Unrecognized tax benefits, as of December 28, 2008 |
22,045 | |||
| Increase based on tax positions related to current year |
17,775 | |||
| Decrease related to settlements with taxing authorities |
(506 | ) | ||
| Unrecognized tax benefits, as of January 3, 2010 |
$ | 39,314 | ||
As of January 3, 2010, December 28, 2008 and December 30, 2007, the amounts of unrecognized tax benefits that, if recognized, would affect our effective tax rate totaled $37.2 million, $20.4 million and $42.0 million, respectively.
Management believes events that could occur in the next 12 months and cause a material change in unrecognized tax benefits include, but are not limited to, the following:
| Ÿ | completion of examinations by the U.S. or foreign taxing authorities; and |
| Ÿ | expiration of statue of limitations on our tax returns. |
The calculation of unrecognized tax benefits involves dealing with uncertainties in the application of complex global tax regulations. Management regularly assesses our tax positions in light of legislative, bilateral tax treaty, regulatory and judicial developments in the countries in which we do business. Currently management does not expect a material change in unrecognized tax benefits to occur during the next 12 months.
Classification of Interest and Penalties
Our policy is to classify interest expense and penalties, if any, as components of income tax provision in the Consolidated Statements of Operations. As of January 3, 2010, and December 28, 2008, and December 30, 2007, the amount of accrued interest and penalties totaled $6.4 million, and $4.4 million, and $4.6 million, respectively. We recorded interest and penalties of approximately $2.1 million, $(0.2) million and $1.4 million during fiscal 2009, 2008 and 2007, respectively.
111
Table of Contents
Examinations by Tax Authorities
The following table summarizes our major tax jurisdictions and the tax years that remain subject to examination by such jurisdictions as of January 3, 2010:
| Tax Jurisdictions |
Tax Years | |
| United States |
2006 and onward | |
| Philippines |
2007 and onward | |
| India |
2005 and onward | |
| California |
2005 and onward |
The IRS is currently conducting audits of our federal income tax returns for fiscal 2006, 2007, and 2008. As of January 3, 2010, no adjustments to the tax liabilities have been proposed by the IRS. However, the IRS has not completed their examination and there can be no assurance that there will be no material adjustments upon completion of their review. In addition, non-U.S. tax authorities have completed their examination of our subsidiary in India for fiscal years 2005 and 2006. As of January 3, 2010, the proposed adjustments are being appealed. We believe the ultimate outcome of this appeal will not result in a material adjustment.
While years prior to 2006 for the United States corporate tax return are not open for assessment, the IRS can adjust net operating loss and various credit carryovers that were generated in prior years and carried forward to 2006 and subsequent years.
Spin-Off of SunPower
We have a tax sharing agreement with SunPower providing for each of the parties’ obligations concerning various tax liabilities. The tax sharing agreement is structured such that we will pay all federal, state, local and foreign taxes that are calculated on a consolidated or combined basis (as defined under applicable federal, state or foreign law) reduced by SunPower’s portion of such tax liability or benefit determined based upon its separate return tax liability as defined under the tax sharing agreement. Such liability or benefit will be based on a pro forma calculation as if SunPower were filing a separate income tax return in each jurisdiction, rather than on a combined or consolidated basis with us subject to adjustments as set forth in the tax sharing agreement.
SunPower ceased to be a member of our (1) consolidated group for federal income tax purposes and most state income tax purposes (in those states which require or allow the filing of a consolidated state income tax return based upon U.S. federal consolidation rules), as of June 6, 2006, and (2) remaining state combined group for state income tax purposes, as of September 29, 2008 (the date of the Spin-Off). To the extent that SunPower becomes entitled to utilize on its separate tax returns portions of those credit or loss carry forwards existing as of such dates, SunPower will pay us the tax effect, measured at 35% for federal income tax purposes, of the amount of such tax loss carry forwards so utilized, and the amount of any credit carry forwards so utilized. SunPower will pay these amounts to us in cash or in SunPower’s shares, at SunPower’s option. As of December 28, 2008, SunPower had $43.1 million of federal net operating loss carry forwards and $5.0 million of federal and state tax credits subject to payment to us under the tax sharing agreement which amounted to a potential obligation to Cypress of approximately $20.0 million. As of January 3, 2010, SunPower has utilized $43.1 million of federal net operating loss carryforwards and $1.4 million of state tax credits. Accordingly, in fiscal 2008 we recorded a receivable from SunPower in the amount of $16.5 million which was received in the fourth quarter of fiscal 2009. In connection with the Spin-Off (see Note 3), Cypress and SunPower entered into an amendment to the existing tax sharing agreement between the parties to address certain transactions that may affect the tax treatment of the Spin-Off and certain other matters. Under the amended tax sharing agreement, SunPower is required to provide us notice of certain transactions that could give rise to SunPower’s indemnification obligation relating to taxes resulting from the application of Section 355(e) of the Internal Revenue Code or similar provision of other applicable law to the Spin-Off as a result of one or more acquisitions (within the meaning of Section 355(e)) of SunPower’s stock after the Spin-Off.
112
Table of Contents
In addition, under the amended tax sharing agreement and subject to certain exceptions, SunPower agreed that, for a period of 25 months following the Spin-Off, it will not: (a) effect a transaction that would result in a recapitalization as defined by the parties (“Recapitalization”) or (b) enter into or facilitate any other transaction resulting in an acquisition (within the meaning of Section 355(e) of the Internal Revenue Code) of SunPower’s stock without first obtaining our written consent. SunPower further agreed that it will not: (a) effect a Recapitalization during the 36 month period following the Spin-Off without first obtaining a tax opinion to the effect that such Recapitalization (either alone or when taken together with any other transaction or transactions) will not cause the Spin-Off to become taxable under Section 355(e), or (b) seek any private ruling, including any supplemental private ruling, from the IRS with regard to the Spin-Off, or any transaction having any bearing on the tax treatment of the Spin-Off, without our prior written consent.
NOTE 19. COMMITMENTS AND CONTINGENCIES
Lease Guarantees
During fiscal 2005, we entered into a strategic foundry partnership with Grace Semiconductor Manufacturing Corporation (“Grace”), pursuant to which we have transferred certain of our proprietary process technologies to Grace’s Shanghai, China facility. In accordance with a foundry agreement executed in fiscal 2006, we purchase wafers from Grace that are produced using these process technologies.
Pursuant to a master lease agreement, Grace has leased certain semiconductor manufacturing equipment from a financing company. In conjunction with the master lease agreement, we have entered into a series of guarantees with the financing company for the benefit of Grace. Under the guarantees, we have agreed to unconditional guarantees to the financing company of the rental payments payable by Grace for the leased equipment under the master lease agreement. If Grace fails to pay any of the quarterly rental payments, we will be obligated to pay such outstanding amounts within 10 days of a written demand from the financing company. If we fail to pay such amount, interest will accrue at a rate of 9% per annum on any unpaid amounts. To date, we have not been required to make any payments under these guarantees.
Pursuant to the guarantees, we issued irrevocable letters of credit to secure the rental payments under the guarantees in the event a demand is made by the financing company on us. The amount available under the letters of credit will decline according to schedules mutually agreed upon by us and the financing company. If we default, the financing company will be entitled to draw on the letters of credit.
In connection with the guarantees, we were granted options to purchase ordinary shares of Grace. At the time of entering into the guarantee and at the time of the option grants, we determined that the fair value of the guarantees and the options was not material to our consolidated financial statements. As of January 3, 2010, we updated our assessment of the likelihood that we would have to settle the outstanding lease payments and determined that it was not probable. As a result, we have not recorded any liability relating to the outstanding lease payments.
The following table summarizes the terms and status of the guarantees:
| Fiscal Year |
Number of Guarantees |
Lease Term of Equipment Under Each Guarantee |
Outstanding Rental Payments | Outstanding Irrevocable Letters of Credits |
Grace Options Granted to Cypress | |||||||||||||||||||
| At Inception | As of | At Inception | As of | |||||||||||||||||||||
| December 28, 2008 |
January 3, 2010 |
December 28, 2008 |
January 3, 2010 |
|||||||||||||||||||||
| (In thousands) | ||||||||||||||||||||||||
| 2006 |
One | 36 months | $ | 8,255 | $ | 2,752 | $ | — | $ | 6,392 | $ | 2,829 | $ | — | 2,241 | |||||||||
| 2007 |
Five | 36 months | 42,278 | 21,828 | 5,665 | 32,726 | 20,793 | 9,204 | 26,555 | |||||||||||||||
| 2008 |
One | 36 months | 10,372 | 7,778 | 3,457 | 7,918 | 7,010 | 4,206 | 11,524 | |||||||||||||||
| $ | 60,905 | $ | 32,358 | $ | 9,122 | $ | 47,036 | $ | 30,632 | $ | 13,410 | 40,320 | ||||||||||||
113
Table of Contents
Indemnification Obligations
We are a party to a variety of agreements pursuant to which we may be obligated to indemnify another party to such agreements with respect to certain matters. Typically, these obligations arise in the context of contracts we have entered into, under which we customarily agree to hold the other party harmless against losses arising from a breach of representations and covenants or terms and conditions related to such matters as the sale and/or delivery of our products, title to assets sold, certain intellectual property claims, defective products, specified environmental matters and certain income taxes. In these circumstances, payment by us is customarily conditioned on the other party making a claim pursuant to the procedures specified in the particular contract, which procedures typically allow us to challenge the other party’s claims and vigorously defend ourselves and the third party against such claims. Further, our obligations under these agreements may be limited in terms of time, amount or the scope of our responsibility and in some instances, we may have recourse against third parties for certain payments made under these agreements.
It is not possible to predict the maximum potential amount of future payments under these agreements due to the conditional nature of our obligations and the unique facts and circumstances involved in each particular agreement. Historically, payments we have made under these agreements have not had a material effect on our business, financial condition or results of operations. We believe that if we were to incur a loss in any of these matters, such loss would not have a material effect on our business, financial condition, cash flows or results of operations, although there can be no assurance of this.
Product Warranties
We generally warrant our products against defects in materials and workmanship for a period of one year and that product warranty is generally limited to a refund of the original purchase price of the product or a replacement part. We estimate our warranty costs based on historical warranty claim experience. Warranty returns are recorded as an allowance for sales returns. The allowance for sales returns is reviewed quarterly to verify that it properly reflects the remaining obligations based on the anticipated returns over the balance of the obligation period.
The following table presents our warranty reserve activities:
| Year Ended | ||||||||||||
| January 3, 2010 |
December 28, 2008 |
December 30, 2007 |
||||||||||
| (In thousands) | ||||||||||||
| Beginning balance |
$ | 3,341 | $ | 3,074 | $ | 2,578 | ||||||
| Settlements made |
(9,015 | ) | (7,759 | ) | (4,357 | ) | ||||||
| Provisions |
8,825 | 8,026 | 4,853 | |||||||||
| Ending balance |
$ | 3,151 | $ | 3,341 | $ | 3,074 | ||||||
Operating Lease Commitments
We lease certain facilities and equipment under non-cancelable operating lease agreements that expire at various dates through fiscal 2018. Some leases include renewal options, which would permit extensions of the expiration dates at rates approximating fair market rental values.
114
Table of Contents
As of January 3, 2010, future minimum lease payments under non-cancelable operating leases were as follows:
| (In thousands) |
|||
| 2010 |
$ | 8,207 | |
| 2011 |
6,880 | ||
| 2012 |
6,035 | ||
| 2013 |
4,233 | ||
| 2014 |
1,204 | ||
| 2015 and Thereafter |
5,107 | ||
| Total |
$ | 31,666 | |
Rental expenses totaled approximately $6.6 million, $8.2 million and $7.9 million in fiscal 2009, 2008 and 2007, respectively.
Synthetic Lease
In June 2003, we entered into a synthetic lease agreement for four facilities located in San Jose, California and one facility located in Bloomington, Minnesota. The synthetic lease required us to purchase the properties from the lessor for $62.7 million or to arrange for the properties to be acquired by a third party at lease expiration, which was June 2008. The synthetic lease obligation of $62.7 million was not recorded in the Consolidated Balance Sheets. The synthetic lease required monthly payments to the lessor that varied based on LIBOR plus a spread. Such payments totaled approximately $0.7 million in fiscal 2007.
We were required to evaluate periodically the expected fair value of the properties at the end of the lease term. As we determined that it was estimable and probable that the expected fair value of the properties at the end of the lease term would be less than $62.7 million, we ratably accrued for the impairment loss over the remaining lease term. The fair value analysis on the properties was performed by management with the assistance of independent appraisal firms.
During fiscal 2007, we exercised our option to purchase the properties under the synthetic lease, which included land and buildings, for $62.7 million from the lessor. The payment was made using the restricted cash collateral. At the date of termination, we determined that an impairment loss of $12.7 million existed, representing the difference between the properties’ fair value of $50.0 million determined at the date of termination and the lease obligation of $62.7 million. As a result, we recorded an additional impairment loss of $7.0 million in fiscal 2007, representing the difference between the total impairment loss of $12.7 million and $5.7 million that had previously been accrued. In addition, we recorded $50.0 million related to the properties in “Property, plant and equipment, net” in the Consolidated Balance Sheet in fiscal 2007.
Litigation and Asserted Claims
In October 2006, we received a subpoena related to the Antitrust Division of the Department of Justice (“DOJ”)’s investigation into the SRAM market. In December 2008, the DOJ closed its two year investigation without any charge or allegation brought against us. As a result of the DOJ’s investigation, in October 2006, we, along with a majority of the other SRAM manufacturers, were named in numerous consumer class action suits that are now consolidated in the U.S. District Court for the Northern District of California. Despite the fact that the DOJ’s investigation was closed without any allegation or charge brought against us, the civil cases remain active. The cases variously allege claims under the Sherman Antitrust Act and various state antitrust laws. The lawsuits seek restitution, injunction and damages in an unspecified amount. Direct and indirect purchaser classes have been certified, although the indirect purchaser class decision is currently up for appeal. Trial is tentatively scheduled for January 2011. We are also named in purported consumer antitrust class action suits in three provinces of Canada; however, those cases have not been materially active over the last two years. We believe we have meritorious defenses to these allegations asserted in these various cases and we intend to vigorously defend ourselves in each of these matters.
115
Table of Contents
In May 2004, we were among four parties to be named in a trade secret misappropriation litigation filed by Silvaco Data Systems in Santa Clara, California Superior Court. On February 10, 2009, summary judgment was granted in our favor in this matter. Silvaco has appealed our victory. As of the date of this filing, the appeal has not been heard by the Court of Appeals. We believe we have meritorious defenses to these allegations and will vigorously defend ourselves in this matter.
On August 21, 2009, X-Point Technologies filed a single patent infringement case against us and 29 other defendants in the U.S. District Court in Delaware . The patent at issue covers X-Point’s technology for data transfer between storage devices and network devices without the use of a CPU or memory. X-Point has made no specific demand for relief in this matter. We believe we have meritorious defenses to the allegations set forth in the complaint and will vigorously defend ourselves in this matter.
We are currently a party to various other legal proceedings, claims, disputes and litigation arising in the ordinary course of business. Based on the our own investigations, we believe the ultimate outcome of our current legal proceedings, individually and in the aggregate, will not have a material adverse effect on our financial position, results of operation or cash flows. However, because of the nature and inherent uncertainties of the litigation, should the outcome of these actions be unfavorable, our business, financial condition, results of operations or cash flows could be materially and adversely affected.
NOTE 20. SEGMENT, GEOGRAPHICAL AND CUSTOMER INFORMATION
Segment Information
We design, develop, manufacture and market a broad range of programmable system solutions for various markets including consumer, computation, data communications, automotive and industrial. We evaluate our reportable business segments in accordance with the accounting guidance. We operate in the following four reportable business segments:
| Reportable Segments |
Description | |
| Consumer and Computation Division | A product division focusing on PSoC, USB and timing solutions. | |
| Data Communications Division | A product division focusing on data communication devices for wireless handset and professional / personal video systems. | |
| Memory and Imaging Division | A product division focusing on static random access memories, nonvolatile memories and image sensor products. | |
| Emerging Technologies and Other | Includes Cypress Envirosystems and AgigA Tech, Inc., both majority-owned subsidiaries of Cypress, the Optical Navigation Systems (“ONS”) business unit, China business unit, foundry-related services and certain corporate expenses. | |
The following tables set forth certain information relating to the reportable business segments:
Revenues:
| Year Ended | |||||||||
| January 03, 2010 |
December 28, 2008 |
December 30, 2007 | |||||||
| (In thousands) | |||||||||
| Consumer and Computation Division |
$ | 274,861 | $ | 315,718 | $ | 357,671 | |||
| Data Communications Division |
96,568 | 129,930 | 117,755 | ||||||
| Memory and Imaging Division |
288,246 | 312,410 | 330,305 | ||||||
| Emerging Technologies and Other |
8,111 | 7,658 | 15,866 | ||||||
| Total revenues |
$ | 667,786 | $ | 765,716 | $ | 821,597 | |||
116
Table of Contents
Income (Loss) from Continuing Operations Attributable to Cypress, before Income Taxes:
| Year Ended | ||||||||||||
| January 03, 2010 |
December 28, 2008 |
December 30, 2007 |
||||||||||
| (In thousands) | ||||||||||||
| Consumer and Computation Division |
$ | (674 | ) | $ | (2,471 | ) | $ | 46,180 | ||||
| Data Communications Division |
13,314 | 27,248 | 21,040 | |||||||||
| Memory and Imaging Division |
31,872 | 30,857 | 41,240 | |||||||||
| Emerging Technologies and Other |
(24,863 | ) | (21,284 | ) | (19,855 | ) | ||||||
| Unallocated items: |
||||||||||||
| Stock-based compensation expense |
(141,812 | ) | (122,345 | ) | (61,392 | ) | ||||||
| Amortization of intangibles and other acquisition-related costs |
(3,804 | ) | (9,199 | ) | (8,864 | ) | ||||||
| Restructuring charges |
(15,242 | ) | (21,643 | ) | (583 | ) | ||||||
| Reduction in allowance for uncollectible SPAP loans |
426 | 198 | 7,479 | |||||||||
| Gain on divestitures |
— | 9,966 | 17,958 | |||||||||
| Write off of debt issuance costs |
— | (4,800 | ) | (4,226 | ) | |||||||
| Gain on sale of SunPower common stock |
— | 192,048 | 373,173 | |||||||||
| Gain (loss) on debt redemption |
— | 2,193 | (2,927 | ) | ||||||||
| Impairment of goodwill |
— | (351,257 | ) | — | ||||||||
| Interest and non-cash expense for convertible debt |
(1,090 | ) | (25,213 | ) | (28,159 | ) | ||||||
| Impairment related to synthetic lease |
— | — | (7,006 | ) | ||||||||
| Impairment of investments |
(2,549 | ) | (13,355 | ) | (1,903 | ) | ||||||
| Other |
(148 | ) | (2,276 | ) | 313 | |||||||
| Income (loss) from continuing operations attributable to Cypress, before income taxes |
$ | (144,570 | ) | $ | (311,333 | ) | $ | 372,468 | ||||
Depreciation:
| Year Ended | |||||||||
| January 03, 2010 |
December 28, 2008 |
December 30, 2007 | |||||||
| (In thousands) | |||||||||
| Consumer and Computation Division |
$ | 20,912 | $ | 27,408 | $ | 33,531 | |||
| Data Communications Division |
7,309 | 11,186 | 11,459 | ||||||
| Memory and Imaging Division |
21,875 | 27,080 | 31,001 | ||||||
| Emerging Technologies and Other |
599 | 741 | 1,994 | ||||||
| Total depreciation |
$ | 50,695 | $ | 66,415 | $ | 77,985 | |||
Geographical Information
The following table presents our total revenues by geographical locations:
| Year Ended | |||||||||
| January 3, 2010 |
December 28, 2008 |
December 30, 2007 | |||||||
| (In thousands) | |||||||||
| United States |
$ | 113,009 | $ | 163,542 | $ | 223,276 | |||
| Europe |
79,864 | 114,922 | 96,851 | ||||||
| Asia: |
|||||||||
| China |
162,664 | 188,658 | 61,447 | ||||||
| Hong Kong |
66,367 | 42,812 | 121,478 | ||||||
| Taiwan |
63,900 | 49,824 | 103,699 | ||||||
| Rest of world |
181,982 | 205,958 | 214,846 | ||||||
| Total revenues |
$ | 667,786 | $ | 765,716 | $ | 821,597 | |||
117
Table of Contents
Property, plant and equipment, net, by geographic locations were as follows:
| As of | ||||||
| January 3, 2010 |
December 28, 2008 | |||||
| (In thousands) | ||||||
| United States |
$ | 207,529 | $ | 225,180 | ||
| Philippines |
57,302 | 62,968 | ||||
| Other |
7,789 | 8,641 | ||||
| Total property, plant and equipment, net |
$ | 272,620 | $ | 296,789 | ||
Customer Information
One global distributor accounted for 14% of our total revenues for fiscal 2009. Two distributors accounted for 13% and 11% of our total revenues for fiscal 2008. Two distributors accounted for 14% and 12% of our total revenues for fiscal 2007. There was no single end customer in fiscal 2009, 2008 or 2007 that accounted for more than 10% of total revenue.
NOTE 21. SUBSEQUENT EVENTS
Performance-Based Awards
In February 2010, the Committee of the Board established the milestones for approximately 4.6 million of outstanding performance-based awards for fiscal 2010. These performance based milestones include the achievement of certain performance results of our common stock appreciation target against the SOXX, certain levels of annual non-GAAP profit-before-taxes percentage, certain annual revenue growth and certain annual revenue growth in the PSoC® family. These awards are earned upon the Committee’s certification that the specified market and/or performance milestones have been achieved. If the milestones are not achieved, the shares are forfeited and cannot be earned in future periods.
The fair value of the market-condition milestone will be determined using a Monte Carlo valuation. The fair value of the shares with performance-related milestones will be the grant-date fair value of our common stock.
Line of Credit
In March 2010, we extended our line of credit with Silicon Valley Bank to March 2011 with a total available amount of $25.0 million. No amounts have ever been drawn under the line of credit. The principal objective of this line of credit was to support the Grace lease guaranty, discussed in Note 19, whose requirement has been reduced significantly from as much as $60.9 million to $9.1 million as of March 1, 2010.
118
Table of Contents
Report of Independent Registered Public Accounting Firm
To the Board of Directors and Stockholders of Cypress Semiconductor Corporation:
In our opinion, the consolidated financial statements listed in the index appearing under Item 15(a)(1) present fairly, in all material respects, the financial position of Cypress Semiconductor Corporation and its subsidiaries (the “Company”) at January 3, 2010 and December 28, 2008 and the results of their operations and their cash flows for each of the three years in the period ended January 3, 2010 in conformity with accounting principles generally accepted in the United States of America. In addition, in our opinion, the financial statement schedule listed in the index appearing under Item 15(a)(2) presents fairly, in all material respects, the information set forth therein when read in conjunction with the related consolidated financial statements. Also in our opinion, the Company maintained, in all material respects, effective internal control over financial reporting as of January 3, 2010, based on criteria established in Internal Control — Integrated Framework issued by the Committee of Sponsoring Organizations of the Treadway Commission (COSO). The Company’s management is responsible for these financial statements and financial statement schedule, for maintaining effective internal control over financial reporting and for its assessment of the effectiveness of internal control over financial reporting, included in the accompanying Management’s Report on Internal Control over Financial Reporting appearing under Item 9A. Our responsibility is to express opinions on these financial statements, on the financial statement schedule, and on the Company’s internal control over financial reporting based on our integrated audits. We conducted our audits in accordance with the standards of the Public Company Accounting Oversight Board (United States). Those standards require that we plan and perform the audits to obtain reasonable assurance about whether the financial statements are free of material misstatement and whether effective internal control over financial reporting was maintained in all material respects. Our audits of the financial statements included examining, on a test basis, evidence supporting the amounts and disclosures in the financial statements, assessing the accounting principles used and significant estimates made by management, and evaluating the overall financial statement presentation. Our audit of internal control over financial reporting included obtaining an understanding of internal control over financial reporting, assessing the risk that a material weakness exists, and testing and evaluating the design and operating effectiveness of internal control based on the assessed risk. Our audits also included performing such other procedures as we considered necessary in the circumstances. We believe that our audits provide a reasonable basis for our opinions.
As discussed in Note 2 of Notes to Consolidated Financial Statements, the Company changed the manner in which it accounts for convertible debt instruments in fiscal 2009.
A company’s internal control over financial reporting is a process designed to provide reasonable assurance regarding the reliability of financial reporting and the preparation of financial statements for external purposes in accordance with generally accepted accounting principles. A company’s internal control over financial reporting includes those policies and procedures that (i) pertain to the maintenance of records that, in reasonable detail, accurately and fairly reflect the transactions and dispositions of the assets of the company; (ii) provide reasonable assurance that transactions are recorded as necessary to permit preparation of financial statements in accordance with generally accepted accounting principles, and that receipts and expenditures of the company are being made only in accordance with authorizations of management and directors of the company; and (iii) provide reasonable assurance regarding prevention or timely detection of unauthorized acquisition, use, or disposition of the company’s assets that could have a material effect on the financial statements.
Because of its inherent limitations, internal control over financial reporting may not prevent or detect misstatements. Also, projections of any evaluation of effectiveness to future periods are subject to the risk that controls may become inadequate because of changes in conditions, or that the degree of compliance with the policies or procedures may deteriorate.
/s/ PricewaterhouseCoopers LLP
San Jose, California
March 3, 2010
119
Table of Contents
UNAUDITED QUARTERLY FINANCIAL DATA
| Three Months Ended | ||||||||||||||||
| January 3, 2010 |
September 27, 2009 (3) |
June 28, 2009 (3) |
March 29, 2009 (3) |
|||||||||||||
| (In thousands, except per-share amounts) | ||||||||||||||||
| Revenues |
$ | 193,974 | $ | 178,719 | $ | 155,784 | $ | 139,309 | ||||||||
| Gross margin |
$ | 94,920 | $ | 84,535 | $ | 57,112 | $ | 34,015 | ||||||||
| Income (loss) from continuing operations |
$ | 2,852 | $ | (19,656 | ) | $ | (45,285 | ) | $ | (88,335 | ) | |||||
| Income from discontinued operations and non-controlling interest, net of income taxes |
(383 | ) | (178 | ) | (178 | ) | (207 | ) | ||||||||
| Net income (loss) |
2,469 | (19,834 | ) | (45,463 | ) | (88,542 | ) | |||||||||
| Less net income (loss) attributable to non-controlling interest |
(383 | ) | (178 | ) | (178 | ) | (207 | ) | ||||||||
| Net income (loss) attributable to Cypress |
$ | 2,852 | $ | (19,656 | ) | $ | (45,285 | ) | $ | (88,335 | ) | |||||
| Net income (loss) per share–basic |
$ | 0.02 | $ | (0.13 | ) | $ | (0.32 | ) | $ | (0.66 | ) | |||||
| Net income (loss) per share–diluted |
$ | 0.02 | $ | (0.13 | ) | $ | (0.32 | ) | $ | (0.66 | ) | |||||
| Three Months Ended | ||||||||||||||||
| December 28, 2008 (2)(3) |
September 28, 2008 (3) |
June 29, 2008 (3) |
March 30, 2008 (1)(3) |
|||||||||||||
| (In thousands, except per-share amounts) | ||||||||||||||||
| Revenues |
$ | 165,073 | $ | 222,681 | $ | 209,580 | $ | 168,382 | ||||||||
| Gross margin |
$ | 60,473 | $ | 98,516 | $ | 100,902 | $ | 79,541 | ||||||||
| Income (loss) from continuing operations |
$ | (414,211 | ) | $ | 127,150 | $ | (1,544 | ) | $ | (30,657 | ) | |||||
| Income from discontinued operations and non-controlling interest, net of income taxes |
2,362 | 22,773 | 31,051 | 12,043 | ||||||||||||
| Net income (loss) |
(411,849 | ) | 149,923 | 29,507 | (18,614 | ) | ||||||||||
| Less net income (loss) attributable to non-controlling interest |
3,171 | 11,942 | 13,652 | 5,078 | ||||||||||||
| Net income (loss) attributable to Cypress |
$ | (415,020 | ) | $ | 137,981 | $ | 15,855 | $ | (23,692 | ) | ||||||
| Net income (loss) per share–basic: |
||||||||||||||||
| Continuing operations attributable to Cypress |
$ | (2.87 | ) | $ | 0.84 | $ | (0.01 | ) | $ | (0.19 | ) | |||||
| Discontinued operations attributable to Cypress |
(0.01 | ) | 0.07 | 0.12 | 0.04 | |||||||||||
| Net income (loss) per share–basic |
$ | (2.88 | ) | $ | 0.91 | $ | 0.11 | $ | (0.15 | ) | ||||||
| Net income (loss) per share–diluted: |
||||||||||||||||
| Continuing operations attributable to Cypress |
$ | (2.87 | ) | $ | 0.79 | $ | (0.01 | ) | $ | (0.19 | ) | |||||
| Discontinued operations attributable to Cypress |
(0.01 | ) | 0.07 | 0.11 | 0.04 | |||||||||||
| Net income (loss) per share–diluted |
$ | (2.88 | ) | $ | 0.86 | $ | 0.10 | $ | (0.15 | ) | ||||||
Basic and diluted earnings per share are computed independently for each of the quarters presented. Therefore, the sum of quarterly basic and diluted per share information may not equal annual basic and diluted earnings per share.
120
Table of Contents
| (1) | Prior to fiscal 2008, we had sales agreements with certain independent distributors in Asia, including Japan, that did not provide these distributors with price protection or rights of return. As such, revenues were recognized upon shipment. During the first quarter of fiscal 2008, we negotiated new terms with these distributors. Under the new terms, these distributors were provided with allowances such as price protection and stock rotation rights. Given the uncertainties associated with the rights provided to these distributors, revenues and costs related to sales to these distributors are deferred until the products are sold by the distributors to the end customers. |
As a result of changing the terms of these distributor agreements, we were required to change from recognizing revenue at the time of shipment to recognizing revenue upon sales to the ultimate end customers. The impact of this change resulted in: (1) the deferral of approximately $20.8 million of revenue that would have been recognized under the previous sales terms, and (2) an increase in our net loss of approximately $10.8 million for the first quarter of fiscal 2008.
| (2) | During the fourth quarter the net loss includes an impairment of goodwill of $351.3 million. |
| (3) | New accounting guidance requires disclosure of net income attributable to minority interests on the face of the consolidated statements of operations. The financial information above has been revised to include this disclosure. Adoption of this guidance had no impact on the reported operating results attributable to the Company’s stockholders or reported earnings per share. |
| ITEM 9. | CHANGES IN AND DISAGREEMENTS WITH ACCOUNTANTS ON ACCOUNTING AND FINANCIAL DISCLOSURES |
None.
| ITEM 9A. | CONTROLS AND PROCEDURES |
Evaluation of Disclosure Controls and Procedures
We maintain “disclosure controls and procedures,” as such term is defined in Rules 13a-15(e) and 15d-15(e) under the Securities Exchange Act of 1934, as amended (the “Exchange Act”), that are designed to ensure that information required to be disclosed by us in reports that we file or submit under the Exchange Act is recorded, processed, summarized, and reported within the time periods specified in Securities and Exchange Commission rules and forms, and that such information is accumulated and communicated to our management, including our Chief Executive Officer and Chief Financial Officer, as appropriate, to allow timely decisions regarding required disclosure. In designing and evaluating our disclosure controls and procedures, management recognized that disclosure controls and procedures, no matter how well conceived and operated, can provide only reasonable, not absolute, assurance that the objectives of the disclosure controls and procedures are met. Additionally, in designing disclosure controls and procedures, our management necessarily was required to apply its judgment in evaluating the cost-benefit relationship of possible disclosure controls and procedures. The design of any disclosure controls and procedures also is based in part upon certain assumptions about the likelihood of future events, and there can be no assurance that any design will succeed in achieving its stated goals under all potential future conditions.
Based on their evaluation as of the end of the period covered by this Annual Report on Form 10-K and subject to the foregoing, our Chief Executive Officer and Chief Financial Officer have concluded that our disclosure controls and procedures were effective.
Management’s Report on Internal Control over Financial Reporting
Our management is responsible for establishing and maintaining adequate internal control over financial reporting as defined in Rule 13a-15(f) of the Exchange Act. Because of its inherent limitations, internal control over financial reporting may not prevent or detect misstatements and can only provide reasonable assurance with respect to financial statement preparation. Also, projections of any evaluation of effectiveness to future periods are subject to the risk that controls may become inadequate because of changes in conditions, or that the degree of compliance with the policies or procedures may deteriorate.
121
Table of Contents
We assessed the effectiveness of our internal control over financial reporting as of January 3, 2010. In making this assessment, we used the criteria set forth by the Committee of Sponsoring Organizations of the Treadway Commission (“COSO”) in Internal Control—Integrated Framework. Based on our assessment using those criteria, our management (including our Chief Executive Officer and Chief Financial Officer) concluded that our internal control over financial reporting was effective as of January 3, 2010.
Our independent registered public accounting firm, PricewaterhouseCoopers LLP, has issued an attestation report on our internal control over financial reporting. The report on the audit of internal control over financial reporting appears on page 119 of this Annual Report on Form 10-K.
Changes in Internal Control over Financial Reporting
There were no changes in our internal control over financial reporting that occurred during the fourth quarter of fiscal 2009 that has materially affected, or is reasonably likely to materially affect, our internal control over financial reporting.
| ITEM 9B. | OTHER INFORMATION |
None.
122
Table of Contents
Certain information required by Part III is omitted from this Annual Report on Form 10-K. We will file a definitive proxy statement pursuant to Regulation 14A (the “Proxy Statement”) not later than 120 days after the end of the fiscal year covered by this Annual Report on Form 10-K, and certain information included therein is incorporated herein by reference.
| ITEM 10. | DIRECTORS, EXECUTIVE OFFICERS AND CORPORATE GOVERNANCE |
The information required by this item concerning our directors is incorporated by reference from the information set forth in the sections titled “Proposal One—Election of Directors” and “Section 16(a) Beneficial Ownership Reporting Compliance” in our Proxy Statement.
The information required by this item concerning our executive officers is incorporated by reference from the information set forth in the sections titled “Executive Officers” under Item 1 of this Annual Report on Form 10-K and “Section 16(a) Beneficial Ownership Reporting Compliance” in our Proxy Statement.
The information required by this item concerning our audit committee and its financial expert is incorporated by reference from the information set forth in the section titled “Board Structure and Compensation” in our Proxy Statement.
We have adopted a code of ethics that applies to all of our directors, officers and employees. We have made the code of ethics available, free of charge, on our website at www.cypress.com.
The information required by this item concerning recommendations of director nominees by security holders is incorporated by reference from the information set forth in the section titled “Board Structure and Compensation” in our Proxy Statement. There have been no changes to the procedures by which security holders may recommend nominees to our Board of Directors in fiscal 2009.
On June 4, 2008, we submitted our 303A Annual Chief Executive Officer Certification to the New York Stock Exchange.
| ITEM 11. | EXECUTIVE COMPENSATION |
The information required by this item concerning executive compensation is incorporated by reference from the information set forth in the section titled “Executive Compensation” in our Proxy Statement.
The information required by this item concerning compensation of directors is incorporated by reference from the information set forth in the section titled “Board Structure and Compensation” in our Proxy Statement.
The information required by this item concerning our compensation committee is incorporated by reference from the information set forth in the sections titled “Compensation Committee Interlocks and Insider Participation” and “Report of the Compensation Committee of the Board of Directors” in our Proxy Statement.
Quarterly Executive Incentive Payments
On February 25, 2010, Cypress’s Compensation Committee of the Board of Directors (the “Compensation Committee”) approved the incentive payments to our executive officers for the fourth quarter and annual portion of fiscal 2009 performance incentive plans. These payments were earned in accordance with the terms of our Key Employee Bonus Plan (the “KEBP”), the Performance Profit Sharing Plan (the “PPSP”) and the Performance Bonus Plan (the “PBP”).
The payments were determined based upon the financial performance of Cypress and each executive’s performance. The performance measures under the KEBP include our earnings per share as well as individual strategic, operational and financial goals established for each executive, and the performance measures under the
123
Table of Contents
PPSP include our earnings per share and the individual’s percentage of success in achieving certain quarterly goals. The following table sets forth the cash payments to our Named Executive Officers (as determined in our Proxy Statement filed with the Securities and Exchange Commission on April 8, 2009) under the KEBP, the PPSP and the PBP in the fourth quarter of fiscal 2009:
| Named Executive Officers |
KEBP | PPSP | PBP | ||||||
| T.J. Rodgers, President and Chief Executive Officer |
— | $ | 10,495 | $ | 342,495 | ||||
| Christopher Seams, Executive Vice President, Sales, Marketing and Operations |
$ | 113,386 | $ | 7,714 | — | ||||
| Brad W. Buss, Executive Vice President, Finance and Administration and Chief Financial Officer |
$ | 96,910 | $ | 6,324 | — | ||||
| Paul Keswick, Executive Vice President, New Product Development |
$ | 17,948 | $ | 4,315 | — | ||||
| Norman Taffe, Executive Vice President, Consumer and Computation Division |
$ | 56,829 | $ | 5,175 | — | ||||
Additionally, the Compensation Committee authorized quarterly and annual incentive payments under the KEBP and PPSP, totaling $419,256 and $28,981, respectively, to six other senior executive officers who are not Named Executive Officers.
Release of Second Half of 2009 PARS
In 2007, the Compensation Committee (the “Committee”) of the Company’s Board of Directors granted, under the Company’s 1994 Stock Plan, performance-based restricted stock units (“PARS”) to certain employees of the Company, including our Named Executive Officers. The PARS awarded in 2007 may be earned ratably over five years subject to performance milestones that are determined on at least a yearly basis.
On February 26, 2010, the Committee approved the performance milestone achievements for the second half of 2009. In connection with the Committee’s determination of the achievement of the second half of the 2010 PARS performance milestones, the following shares were released to our Named Executive Officers:
| Named Executive Officer |
Target | Earned | ||
| T.J. Rodgers, President and Chief Executive Officer |
329,618 | 263,693 | ||
| Brad W. Buss, Executive Vice President, Finance and Administration and Chief Financial Officer |
206,011 | 164,809 | ||
| Christopher Seams, Executive Vice President, Sales and Marketing |
164,809 | 131,847 | ||
| Paul Keswick, Executive Vice President, New Product Development |
164,809 | 131,847 | ||
| Norman P. Taffe, Executive Vice President, Consumer and Computation Division |
141,633 | 113,305 |
Setting of Performance Milestones of 2010 PARS
In February 2010, the Committee of the Board established the milestones for approximately 4.6 million of outstanding performance-based awards for fiscal 2010. These performance based milestones include the achievement of certain performance results of our common stock appreciation target against the SOXX, certain levels of annual non-GAAP profit-before-taxes percentage, certain annual revenue growth and certain annual revenue growth in the PSoC® family. These awards are earned upon the Committee’s certification that the specified market and/or performance milestones have been achieved. If the milestones are not achieved, the shares are forfeited and cannot be earned in future periods.
The fair value of the market-condition milestone will be determined using a Monte Carlo valuation. The fair value of the shares with performance-related milestones will be the grant-date fair value of our common stock.
124
Table of Contents
The following table sets forth our Named Executive Officers’ target shares for the performance period subject to performance:
| Named Executive Officer |
Minimum | Target | ||
| T.J. Rodgers, President and Chief Executive Officer |
0 | 659,236 | ||
| Brad W. Buss, Executive Vice President, Finance and Administration and Chief Financial Officer |
0 | 412,022 | ||
| Christopher Seams, Executive Vice President, Sales and Marketing |
0 | 329,618 | ||
| Paul Keswick, Executive Vice President, New Product Development |
0 | 329,618 | ||
| Norman P. Taffe, Executive Vice President, Consumer and Computation Division |
0 | 283,266 |
The target number of shares is the maximum that may be earned for the performance period.
| ITEM 12. | SECURITY OWNERSHIP OF CERTAIN BENEFICIAL OWNERS AND MANAGEMENT AND RELATED STOCKHOLDER MATTERS |
The information required by this item regarding security ownership of certain beneficial owners, directors and executive officers is incorporated by reference from the information set forth in the section titled “Security Ownership of Certain Beneficial Owners and Management” in our Proxy Statement.
The information required by this item regarding our equity compensation plans is incorporated by reference from Item 5 of this Annual Report on Form 10-K.
| ITEM 13. | CERTAIN RELATIONSHIPS AND RELATED TRANSACTIONS AND DIRECTOR INDEPENDENCE |
The information required by this item regarding transactions with certain persons is incorporated by reference from the information set forth in the section titled “Certain Relationships and Related Transactions” in our Proxy Statement.
The information required by this item regarding director independence is incorporated by reference from the information set forth in the section titled “Board Structure and Compensation” in our Proxy Statement.
| ITEM 14. | PRINCIPAL ACCOUNTANT FEES AND SERVICES |
The information required by this item regarding fees and services is incorporated by reference from the information set forth in the section titled “Proposal Two—Ratification of the Selection of Independent Registered Public Accounting Firm” in our Proxy Statement.
The information required by this item regarding the audit committee’s pre-approval policies and procedures is incorporated by reference from the information set forth in the section titled “Report of the Audit Committee of the Board of Directors” in our Proxy Statement.
125
Table of Contents
| ITEM 15. | EXHIBITS AND FINANCIAL STATEMENT SCHEDULE |
(a) The following documents are filed as a part of this Annual Report on Form 10-K:
1. Financial Statements:
| Page | ||
| 66 | ||
| 67 | ||
| 68 | ||
| 70 | ||
| 72 |
2. Financial Statement Schedule:
| Page | ||
| 129 |
All other schedules are omitted as the required information is inapplicable or the information is presented in the Consolidated Financial Statements or Notes to Consolidated Financial Statements under Item 8.
3. Exhibits:
| Exhibit |
Exhibit Description |
Incorporated by References | ||||||
| Form | Filing Date/ Period End Date |
Filed Herewith | ||||||
| 2.1 | Agreement and Plan of Reorganization dated as of January 16, 2001 by and among Cypress Semiconductor Corporation, Clock Acquisition Corporation, International Microcircuits, Inc. and with respect to Article VII, U.S. Bank Trust, N.A., as Escrow Agent, and Kurt R. Jaggers, as Securityholder Agent. | 10-Q | 4/1/2001 | |||||
| 2.2 | Agreement and Plan of Reorganization dated as of January 26, 2001 by and among Cypress Semiconductor Corporation, Hilo Acquisition Corporation, HiB and Semiconductors, Inc., certain shareholder parties thereto, and U.S. Bank Trust, National Association, as Escrow Agent. | 10-Q | 4/1/2001 | |||||
| 2.3 | Stock Purchase Agreement dated as of May 29, 2001 by and among Cypress Semiconductor Corporation, ScanLogic Holding Company, ScanLogic Corporation, certain shareholder parties thereto, and with respect to Article VII, U.S. Bank Trust, N.A., as Escrow Agent, and Israel Zilberman, as Securityholder Agent. | 10-Q | 7/1/2001 | |||||
| 2.4 | Agreement and Plan of Reorganization dated as of June 2, 2001 by and among Cypress Semiconductor Corporation, Lion Acquisition Corporation, Lara Networks, Inc., U.S. Bank Trust National Association, as Escrow Agent (with respect to Article VII only), and Kenneth P. Lawler, as Securityholder Agent (with respect to Articles I and VII only). | 10-Q | 9/30/2001 | |||||
| 2.5 | First Amendment to Agreement and Plan of Reorganization dated as of July 3, 2001 by and among Cypress Semiconductor Corporation, Lion Acquisition Corporation, Lara Networks, Inc., U.S. Bank Trust, N.A., as Escrow Agent, and Kenneth P. Lawler, as Securityholder Agent. | 10-Q | 9/30/2001 | |||||
| 2.6 | Agreement and Plan of Reorganization dated as of August 19, 2001 by and among Cypress Semiconductor Corporation, In-System Design, Inc., and with respect to Article VII, U.S. Bank Trust, N.A., as Escrow Agent, and Lynn Watson, as Securityholder Agent. | 10-Q | 9/30/2001 | |||||
| 2.7 | First Amendment to Agreement and Plan of Reorganization dated as of September 10, 2001 by and among Cypress Semiconductor Corporation, Idaho Acquisition Corporation, In-System Design, Inc., U.S. Bank Trust, N.A., as Escrow Agent, and Lynn Watson, as Securityholder Agent. | 10-Q | 9/30/2001 | |||||
| 2.8 | Agreement and Plan of Reorganization dated as of November 17, 2001 by and among Cypress Semiconductor Corporation, Steelers Acquisition Corporation, Silicon Packets, Inc., and with respect to Article VII only, U.S. Bank Trust, N.A., as Escrow Agent, and Robert C. Marshall, as Securityholder Agent. | 10-K | 12/30/2001 | |||||
| 2.9 | Stock Purchase Agreement dated as of June 21, 2004 by and among Cypress Semiconductor Corporation, in the name and on behalf of Cypress Semiconductor (Belgium) BVBA in Formation, FillFactory NV, certain stockholders of FillFactory NV and with respect to Article VIII and Article X only, U.S. Bank, National Association, as Escrow Agent, and Luc De Mey and IT-Partners NV, as Stockholder Agents. | 8-K | 8/13/2004 | |||||
126
Table of Contents
| Exhibit |
Exhibit Description |
Incorporated by References | ||||||
| Form | Filing Date/ Period End Date |
Filed Herewith | ||||||
| 2.10 | Agreement and Plan of Reorganization dated as of June 30, 2004 by and among Cypress Semiconductor Corporation, SP Acquisition Corporation and SunPower Corporation. | 10-K | 1/2/2005 | |||||
| 2.11 | Agreement and Plan of Merger dated as of February 11, 2005 by and among Cypress Semiconductor Corporation, SMaL Camera Technologies, Inc., Summer Acquisition Corporation, and with respect to Articles VII and IX only, U.S. Bank, National Association, as Escrow Agent, and Allan Thygesen, as Securityholder Agent. | 8-K | 2/15/2005 | |||||
| 2.12 | Agreement and Plan of Merger dated November 7, 2005 by and between Cypress Semiconductor Corporation, CMS Acquisition Corporation and Cypress Microsystems, Inc. | 8-K | 12/8/2005 | |||||
| 2.13 | Agreement for the Purchase and Sale of Assets and Amendment No. 1 dated as of February 15, 2006 by and between Cypress Semiconductor Corporation and NetLogic Microsystems, Inc. | 8-K | 2/21/2006 | |||||
| 2.14 | Asset Purchase Agreement, dated February 27, 2007, by and between Sensata Technologies, Inc. and Cypress Semiconductor Corporation. | 8-K | 3/20/2007 | |||||
| 2.15 | Agreement for the Purchase and Sale of Assets, dated August 29, 2007, by and between NetLogic Microsystems, Inc. and Cypress Semiconductor Corporation. | 8-K | 9/5/2007 | |||||
| 2.16 | Agreement and Plan of Merger, dated as of August 1, 2008, by and among Cypress Semiconductor Corporation, Copper Acquisition Corporation and Simtek Corporation. | 8-K | 8/1/2008 | |||||
| 3.1 | Second Restated Certificate of Incorporation of Cypress Semiconductor Corporation. | 10-K | 12/31/2000 | |||||
| 3.2 | Bylaws, as Amended, of Cypress Semiconductor Corporation. | 10-K | 12/29/2002 | |||||
| 3.3 | Restated Bylaws of Cypress Semiconductor Corporation. | 10-Q | 4/3/2005 | |||||
| 3.4 | Amended and Restated Bylaws of Cypress Semiconductor Corporation. | 8-K | 6/23/2005 | |||||
| 3.5 | Amended and Restated Bylaws of Cypress Semiconductor Corporation. | 10-Q | 7/3/2005 | |||||
| 3.6 | Amended and Restated Bylaws of Cypress Semiconductor Corporation. | 8-K | 3/31/2006 | |||||
| 4.1 | Subordinated Indenture dated as of January 15, 2000 between Cypress Semiconductor Corporation and State Street Bank and Trust Company of California, N.A., as Trustee. | 8-K | 3/17/2000 | |||||
| 4.2 | Supplemental Trust Indenture dated as of June 15, 2000 between Cypress Semiconductor Corporation and State Street Bank and Trust Company of California, N.A., as Trustee. | 8-K | 7/11/2000 | |||||
| 4.3 | Indenture dated as of June 3, 2003 between Cypress Semiconductor Corporation and U.S. Bank National Association, as Trustee. | S-3 | 6/30/2003 | |||||
| 4.4 | Indenture dated as of March 13, 2007 between Cypress Semiconductor Corporation and U.S. Bank National Association, as Trustee. | S-3 | 5/17/2007 | |||||
| 4.5 | Registration Rights Agreement—1.00% Convertible Senior Notes due September 15, 2009. | 10-Q | 7/1/2007 | |||||
| 10.1 | Form of Indemnification Agreement. | S-1 | 3/4/1987 | |||||
| 10.2 | Cypress Semiconductor Corporation 1994 Stock Option Plan. | 10-K | 1/2/2000 | |||||
| 10.3 | Cypress Semiconductor Corporation Employee Qualified Stock Purchase Plan, Amended and Restated Effective as of May 15, 1998. | S-8 | 12/10/1998 | |||||
| 10.4 | Cypress Semiconductor Corporation 1998 Key Employee Bonus Plan. | 10-K | 1/3/1999 | |||||
| 10.5 | Cypress Semiconductor Corporation 1999 Non-statutory Stock Option Plan. | S-8 | 4/20/1999 | |||||
| 10.6 | Cypress Semiconductor Corporation Non-Qualified Deferred Compensation Plan I. | S-8 | 9/6/2002 | |||||
| 10.7 | Cypress Semiconductor Corporation Non-Qualified Deferred Compensation Plan II. | S-8 | 9/6/2002 | |||||
| 10.8 | Amendment to 1999 Nonstatutory Stock Option Plan. | 10-Q | 6/29/2003 | |||||
| 10.9 | Lease Agreement dated as of June 27, 2003 between Wachovia Development Corporation and Cypress Semiconductor Corporation. | 10-Q | 6/29/2003 | |||||
| 10.10 | Participation Agreement dated as of June 27, 2003 by and among Cypress Semiconductor Corporation, Wachovia Development Corporation and Wachovia Bank, National Association. | 10-Q | 6/29/2003 | |||||
| 10.11 | Call Spread Option Confirmation dated May 29, 2003 among Cypress Semiconductor Corporation, Credit Suisse First Boston International, and Credit Suisse First Boston. | 10-Q | 6/29/2003 | |||||
| 10.12 | Loan and Security Agreement dated as of September 25, 2003 by and between Silicon Valley Bank and Cypress Semiconductor Corporation. | 10-Q | 9/28/2003 | |||||
| 10.13 | Amended and Restated Call Spread Option Confirmation dated as of May 11, 2004 among Cypress Semiconductor Corporation, Credit Suisse First Boston International, and Credit Suisse First Boston. | 10-Q | 6/27/2004 | |||||
| 10.14 | Amendment No. 1 to Loan and Security Agreement dated as of December 13, 2004 by and between Silicon Valley Bank and Cypress Semiconductor Corporation. | 10-K | 1/2/2005 | |||||
| 10.15 | Cypress Semiconductor Corporation Employee Qualified Stock Purchase Plan, Amended and Restated Effective as of the Offering Period Commencing December 31, 2004 | 10-K | 1/2/2005 | |||||
| 10.16 | SMaL Camera Technologies, Inc. 2000 Stock Option and Incentive Plan. | S-8 | 3/8/2005 | |||||
127
Table of Contents
| Exhibit |
Exhibit Description |
Incorporated by References | ||||||
| Form | Filing Date/ Period End Date |
Filed Herewith | ||||||
| 10.17 | First Amendment to Certain Operative Agreements dated March 28, 2005 between Wachovia Development Corporation and Cypress Semiconductor Corporation. | 10-Q | 4/3/2005 | |||||
| 10.18 | Cypress Semiconductor Corporation 2006 Key Employee Bonus Plan (KEBP) Summary. | 10-K | 1/1/2006 | |||||
| 10.19 | Cypress Semiconductor Corporation Performance Profit Sharing Plan (PPSP) Summary. | 10-K | 1/1/2006 | |||||
| 10.20* | Memorandum of Agreement between GNPower Ltd. Co. and Cypress Manufacturing Ltd. | 10-Q | 10/1/2006 | |||||
| 10.21 | Letter of Agreement between Cypress Semiconductor Corporation and SunPower Corporation. | 8-K | 11/16/2006 | |||||
| 10.22 | Letter of Agreement between Cypress Semiconductor Corporation and PowerLight Corporation. | 8-K | 11/16/2006 | |||||
| 10.23 | Amended Letter of Agreement between Cypress Semiconductor Corporation and PowerLight Corporation. | 8-K | 1/5/2007 | |||||
| 10.24 | Amendment No. 2 to Loan and Security Agreement dated as of December 11, 2006 by and between Silicon Valley Bank and Cypress Semiconductor Corporation. | 10-K | 12/31/2006 | |||||
| 10.25 | Amendment No. 3 to Loan and Security Agreement dated as of December 21, 2006 by and between Silicon Valley Bank and Cypress Semiconductor Corporation. | 10-K | 12/31/2006 | |||||
| 10.26 | Guaranty dated December 12, 2006 by and between Grace Semiconductor USA, Inc., CIT Technologies Corporation and Cypress Semiconductor Corporation. | 10-K | 12/31/2006 | |||||
| 10.27 | Guaranty dated February 1, 2007 by and between Grace Semiconductor USA, Inc., CIT Technologies Corporation and Cypress Semiconductor Corporation. | 10-K | 12/31/2006 | |||||
| 10.28 | Cypress Semiconductor Corporation 1994 Stock Plan, as amended and restated on May 3, 2007. | 8-K | 5/7/2007 | |||||
| 10.29 | Consent and Amendment No. 4 to Loan and Security Agreement dated March 5, 2007 by and between Silicon Valley Bank and Cypress Semiconductor Corporation. | 10-Q | 4/1/2007 | |||||
| 10.30 | Guaranty dated March 19, 2007 by and between Grace Semiconductor USA, Inc., CIT Technologies Corporation and Cypress Semiconductor Corporation. | 10-Q | 4/1/2007 | |||||
| 10.31 | Guaranty dated May 15, 2007 by and between Grace Semiconductor USA, Inc., CIT Technologies Corporation and Cypress Semiconductor Corporation. | 10-Q | 7/1/2007 | |||||
| 10.32 | Guaranty dated June 15, 2007 by and between Grace Semiconductor USA, Inc., CIT Technologies Corporation and Cypress Semiconductor Corporation. | 10-Q | 7/1/2007 | |||||
| 10.33 | Cypress Semiconductor Corporation 1994 Stock Plan, as amended and restated on May 11, 2007. | 10-Q | 7/1/2007 | |||||
| 10.34 | Guaranty dated December 15, 2007 by and between Grace Semiconductor USA, Inc., CIT Technologies Corporation and Cypress Semiconductor Corporation. | 10-K | 12/30/2007 | |||||
| 10.35 | Amendment No. 5 to Loan and Security Agreement dated December 20, 2007 by and between Silicon Valley Bank and Cypress Semiconductor Corporation. | 10-K | 12/30/2007 | |||||
| 10.36 | Guaranty, dated March 24, 2008, by and between Grace Semiconductor USA, Inc., CIT Technologies Corporation and Cypress Semiconductor Corporation. | 10-Q | 3/30/2008 | |||||
| 10.37 | Form of Transaction Support Agreement by and among Cypress Semiconductor Corporation, Copper Acquisition Corporation and the individuals listed on the signatures pages thereto, dated as of August 1, 2008. | 8-K | 8/1/2008 | |||||
| 10.38 | Amendment No. 1 to Tax Sharing Agreement, dated as of August 12, 2008, by and between Cypress Semiconductor Corporation and SunPower Corporation. | 8-K | 8/11/2008 | |||||
| 10.39 | 1994 Stock Plan, as amended and restated. | S-8 | 10/24/2008 | |||||
| 10.40 | 1999 Non-Statutory Stock Option Plan, as amended and restated. | S-8 | 10/24/2008 | |||||
| 10.41 | Employee Qualified Stock Purchase Plan, as amended and restated. | S-8 | 10/24/2008 | |||||
| 10.42 | International Microcircuits Inc. 2000 Nonstatutory Stock Option Plan. | S-8 | 10/24/2008 | |||||
| 10.43 | Amendment No. 6 to Loan and Security Agreement dated December 18, 2008 by and between Silicon Valley Bank and Cypress Semiconductor Corporation. | 8-K | 12/17/2008 | |||||
| 10.44 | Amended and Restated Loan and Security Agreement with Silicon Valley Bank dated March 1, 2010. | 10-K | 3/3/2010 | X | ||||
| 21.1 | Subsidiaries of Cypress Semiconductor Corporation. | 10-K | 3/3/2010 | X | ||||
| 23.1 | Consent of Independent Registered Public Accounting Firm. | 10-K | 3/3/2010 | X | ||||
| 24.1 | Power of Attorney (reference is made to page 127 of this Annual Report on Form 10-K). | 10-K | 3/3/2010 | X | ||||
| 31.1 | Certification of Chief Executive Officer Pursuant to Section 302 of the Sarbanes-Oxley Act of 2002. | 10-K | 3/3/2010 | X | ||||
| 31.2 | Certification of Chief Financial Officer Pursuant to Section 302 of the Sarbanes-Oxley Act of 2002. | 10-K | 3/3/2010 | X | ||||
| 32.1 | Certification of Chief Executive Officer Pursuant to 18 U.S.C. Section 1350, as Adopted Pursuant to Section 906 of the Sarbanes-Oxley Act of 2002. | 10-K | 3/3/2010 | X | ||||
| 32.2 | Certification of Chief Financial Officer Pursuant to 18 U.S.C. Section 1350, as Adopted Pursuant to Section 906 of the Sarbanes-Oxley Act of 2002. | 10-K | 3/3/2010 | X | ||||
* Confidential treatment has been requested for portions of this exhibit.
128
Table of Contents
VALUATION AND QUALIFYING ACCOUNTS
| Balance at Beginning of Period |
Charges (Releases) to Expenses/Revenues |
Deductions | Balance at End of Period | |||||||||||
| (In thousands) | ||||||||||||||
| Allowance for doubtful accounts receivable: |
||||||||||||||
| Year ended January 3, 2010 |
$ | 777 | $ | 1,120 | $ | (539 | ) | $ | 1,358 | |||||
| Year ended December 28, 2008 |
$ | 1,171 | $ | 358 | $ | (752 | ) | $ | 777 | |||||
| Year ended December 30, 2007 |
$ | 1,706 | $ | 1,071 | $ | (1,606 | ) | $ | 1,171 | |||||
| Allowance for sales returns: |
||||||||||||||
| Year ended January 3, 2010 |
$ | 3,341 | $ | 8,825 | $ | (9,015 | ) | $ | 3,151 | |||||
| Year ended December 28, 2008 |
$ | 3,074 | $ | 8,026 | $ | (7,759 | ) | $ | 3,341 | |||||
| Year ended December 30, 2007 |
$ | 2,578 | $ | 4,853 | $ | (4,357 | ) | $ | 3,074 | |||||
| Allowance for uncollectible loans under the stock purchase assistance plan: |
||||||||||||||
| Year ended January 3, 2010 |
$ | 538 | $ | (378 | ) | $ | (51 | ) | $ | 109 | ||||
| Year ended December 28, 2008 |
$ | 782 | $ | (198 | ) | $ | (46 | ) | $ | 538 | ||||
| Year ended December 30, 2007 |
$ | 8,345 | $ | (7,479 | ) | $ | (84 | ) | $ | 782 | ||||
129
Table of Contents
Pursuant to the requirements of Section 13 or 15(d) of the Securities Exchange Act of 1934, the registrant has duly caused this report to be signed on its behalf by the undersigned, thereto duly authorized.
| CYPRESS SEMICONDUCTOR CORPORATION | ||||
| Dated: March 3, 2010 | By: | /s/ BRAD W. BUSS | ||
| Brad W. Buss Executive Vice President, Finance and Administration and Chief Financial Officer | ||||
POWER OF ATTORNEY
KNOW ALL PERSONS BY THESE PRESENTS, that each person whose signature appears below constitutes and appoints T.J. Rodgers and Brad W. Buss, jointly and severally, his attorneys-in-fact, each with the power of substitution, for him in any and all capacities, to sign any amendments to this report, and to file the same, with exhibits thereto and other documents in connection therewith, with the Securities and Exchange Commission, hereby ratifying and confirming all that each of said attorneys-in-fact, or his substitute or substitutes, may do or cause to be done by virtue hereof.
Pursuant to the requirements of the Securities Exchange Act of 1934, this report has been signed by the following persons on behalf of the registrant and in the capacities and on the dates indicated.
| Signature |
Title |
Date | ||
| /s/ T. J. RODGERS T. J. Rodgers |
President, Chief Executive Officer and Director (Principal Executive Officer) | March 2, 2010 | ||
| /s/ BRAD W. BUSS Brad W. Buss |
Executive Vice President, Finance and Administration and Chief Financial Officer (Principal Financial and Accounting Officer) | March 2, 2010 | ||
| /s/ W. STEVE ALBRECHT W. Steve Albrecht |
Director | March 2, 2010 | ||
| /s/ ERIC A. BENHAMOU Eric A. Benhamou |
Director | March 2, 2010 | ||
| /s/ LLOYD A. CARNEY Lloyd A. Carney |
Director | March 2, 2010 | ||
| /s/ JAMES R. LONG James R. Long |
Director | March 2, 2010 | ||
| /s/ J. DANIEL MCCRANIE J. Daniel McCranie |
Director | March 2, 2010 | ||
| /s/ EVERT P. VAN DE VEN Evert P. van de Ven |
Director | March 2, 2010 | ||
130