Attached files
| file | filename |
|---|---|
| EX-99.1 - PRESS RELEASE - TRIMAS CORP | a10-4841_1ex99d1.htm |
| 8-K - 8-K - TRIMAS CORP | a10-4841_18k.htm |
Exhibit 99.2
|
|
Fourth Quarter 2009 Earnings Presentation March 2, 2010 |
|
|
Safe Harbor Statement Any “forward-looking” statements contained herein, including those relating to market conditions or the Company’s financial condition and results, expense reductions, liquidity expectations, business goals and sales growth, involve risks and uncertainties, including, but not limited to, risks and uncertainties with respect to general economic and currency conditions, various conditions specific to the Company’s business and industry, the Company’s substantial leverage, liabilities imposed by the Company’s debt instruments, market demand, competitive factors, the Company’s ability to maintain compliance with the listing requirements of NASDAQ, supply constraints, material and energy costs, technology factors, litigation, government and regulatory actions, the Company’s accounting policies, future trends, and other risks which are detailed in the Company’s Annual Report on Form 10-K for the fiscal year ending December 31, 2008, and in the Company’s Quarterly Reports on Form 10-Q. These risks and uncertainties may cause actual results to differ materially from those indicated by the forward-looking statements. All forward-looking statements made herein are based on information currently available, and the Company assumes no obligation to update any forward-looking statements. |
|
|
Agenda Fourth Quarter Overview Fourth Quarter and Full Year 2009 Financial Highlights 2009 Key Initiatives Segment Highlights Outlook and Summary Questions and Answers Appendix |
|
|
4 Fourth Quarter Overview Recession still holding top-line down overall – but margins improving Packaging and Cequent leading Profit improvement initiatives exceeded expectations with $32M of cost savings realized in 2009 Reduced operating working capital as a % of sales to 14.5%, compared to 17.3% at Q408 Solid free cash flow despite historical seasonality Investments in new products and markets showing results Refinanced in Q4 securing greater financial flexibility The TriMas Operating Model is working. |
|
|
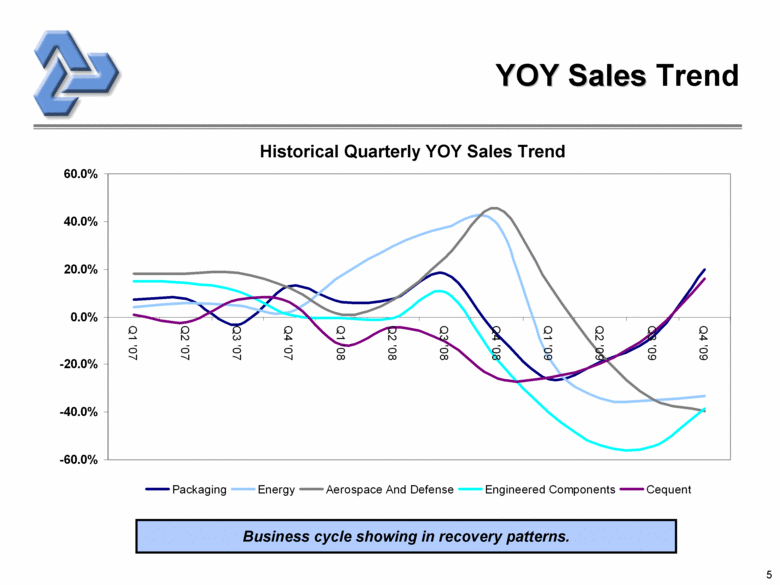
YOY Sales Trend Historical Quarterly YOY Sales Trend Business cycle showing in recovery patterns. -60.0% -40.0% -20.0% 0.0% 20.0% 40.0% 60.0% Q1 '07 Q2 '07 Q3 '07 Q4 '07 Q1 '08 Q2 '08 Q3 '08 Q4 '08 Q1 '09 Q2 '09 Q3 '09 Q4 '09 Packaging Energy Aerospace And Defense Engineered Components Cequent |
|
|
Fourth Quarter and Full Year 2009 Financial Highlights and Key Initiatives |
|
|
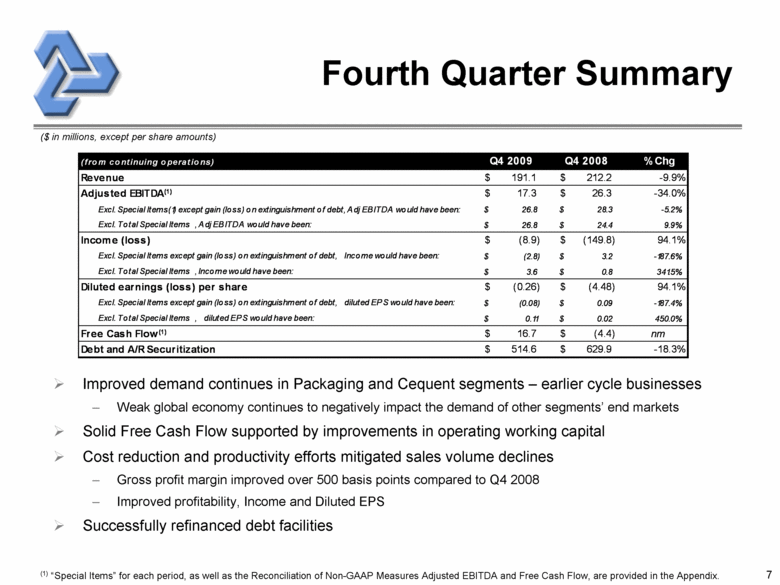
Fourth Quarter Summary ($ in millions, except per share amounts) Improved demand continues in Packaging and Cequent segments – earlier cycle businesses Weak global economy continues to negatively impact the demand of other segments’ end markets Solid Free Cash Flow supported by improvements in operating working capital Cost reduction and productivity efforts mitigated sales volume declines Gross profit margin improved over 500 basis points compared to Q4 2008 Improved profitability, Income and Diluted EPS Successfully refinanced debt facilities (1) “Special Items” for each period, as well as the Reconciliation of Non-GAAP Measures Adjusted EBITDA and Free Cash Flow, are provided in the Appendix. (from continuing operations) Q4 2009 Q4 2008 % Chg Revenue 191.1 $ 212.2 $ -9.9% Adjusted EBITDA (1) 17.3 $ 26.3 $ -34.0% Excl. Special Items(1) except gain (loss) on extinguishment of debt, Adj EBITDA would have been: 26.8 $ 28.3 $ -5.2% Excl. Total Special Items , Adj EBITDA would have been: 26.8 $ 24.4 $ 9.9% Income (loss) (8.9) $ (149.8) $ 94.1% Excl. Special Items except gain (loss) on extinguishment of debt, Income would have been: (2.8) $ 3.2 $ -187.6% Excl. Total Special Items , Income would have been: 3.6 $ 0.8 $ 341.5% Diluted earnings (loss) per share (0.26) $ (4.48) $ 94.1% Excl. Special Items except gain (loss) on extinguishment of debt, diluted EPS would have been: (0.08) $ 0.09 $ -187.4% Excl. Total Special Items , diluted EPS would have been: 0.11 $ 0.02 $ 450.0% Free Cash Flow (1) 16.7 $ (4.4) $ nm Debt and A/R Securitization 514.6 $ 629.9 $ -18.3% |
|
|
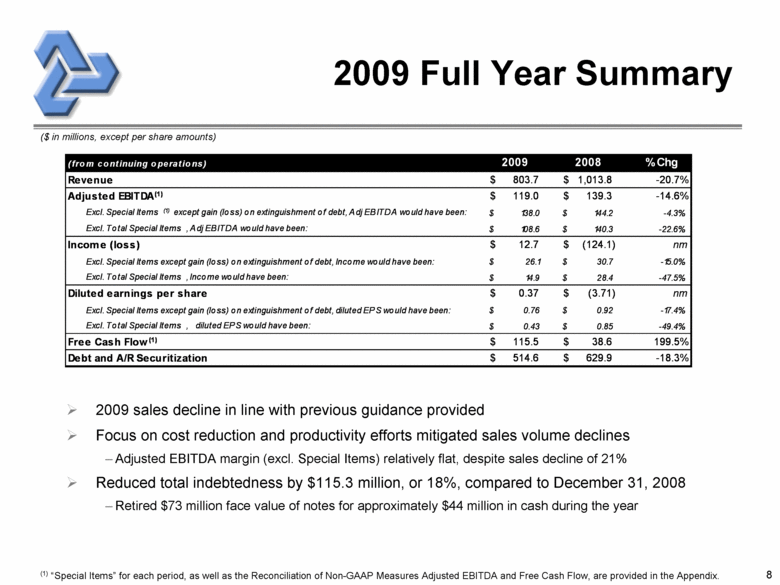
2009 Full Year Summary ($ in millions, except per share amounts) 2009 sales decline in line with previous guidance provided Focus on cost reduction and productivity efforts mitigated sales volume declines Adjusted EBITDA margin (excl. Special Items) relatively flat, despite sales decline of 21% Reduced total indebtedness by $115.3 million, or 18%, compared to December 31, 2008 Retired $73 million face value of notes for approximately $44 million in cash during the year (1) “Special Items” for each period, as well as the Reconciliation of Non-GAAP Measures Adjusted EBITDA and Free Cash Flow, are provided in the Appendix. (from continuing operations) 2009 2008 % Chg Revenue 803.7 $ 1,013.8 $ -20.7% Adjusted EBITDA (1) 119.0 $ 139.3 $ -14.6% Excl. Special Items (1) except gain (loss) on extinguishment of debt, Adj EBITDA would have been: 138.0 $ 144.2 $ -4.3% Excl. Total Special Items , Adj EBITDA would have been: 108.6 $ 140.3 $ -22.6% Income (loss) 12.7 $ (124.1) $ nm Excl. Special Items except gain (loss) on extinguishment of debt, Income would have been: 26.1 $ 30.7 $ -15.0% Excl. Total Special Items , Income would have been: 14.9 $ 28.4 $ -47.5% Diluted earnings per share 0.37 $ (3.71) $ nm Excl. Special Items except gain (loss) on extinguishment of debt, diluted EPS would have been: 0.76 $ 0.92 $ -17.4% Excl. Total Special Items , diluted EPS would have been: 0.43 $ 0.85 $ -49.4% Free Cash Flow (1) 115.5 $ 38.6 $ 199.5% Debt and A/R Securitization 514.6 $ 629.9 $ -18.3% |
|
|
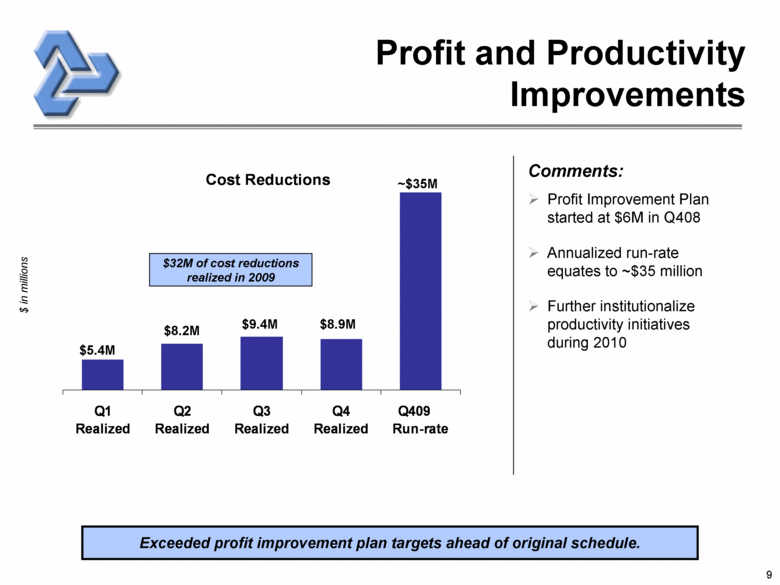
Profit and Productivity Improvements $ in millions Exceeded profit improvement plan targets ahead of original schedule. Comments: Profit Improvement Plan started at $6M in Q408 Annualized run-rate equates to ~$35 million Further institutionalize productivity initiatives during 2010 $5.4M $8.2M $8.9M $9.4M ~$35M $32M of cost reductions realized in 2009 Q1 Realized Q2 Realized Q3 Realized Q4 Realized Q409 Run-rate Cost Reductions |
|
|
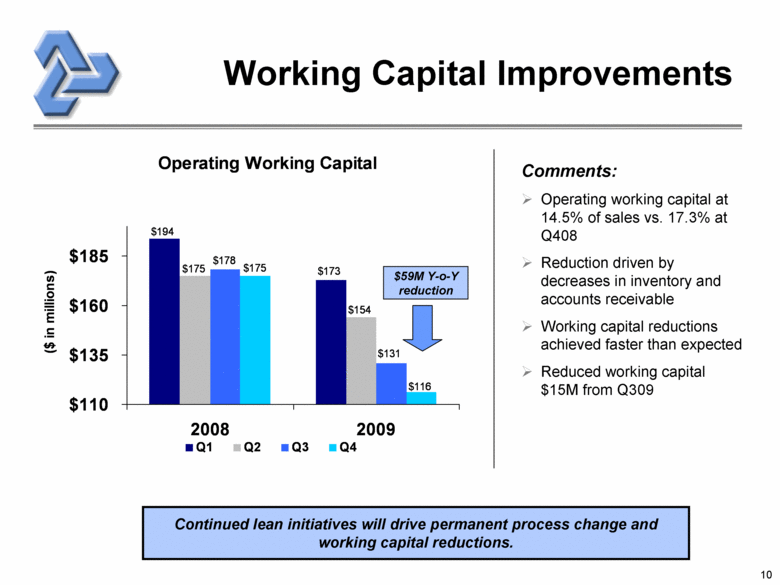
10 Working Capital Improvements Continued lean initiatives will drive permanent process change and working capital reductions. Comments: Operating working capital at 14.5% of sales vs. 17.3% at Q408 Reduction driven by decreases in inventory and accounts receivable Working capital reductions achieved faster than expected Reduced working capital $15M from Q309 $59M Y-o-Y reduction Operating Working Capital $173 $194 $154 $175 $131 $178 $116 $175 $110 $135 $160 $185 2008 2009 ($ in millions) Q1 Q2 Q3 Q4 |
|
|
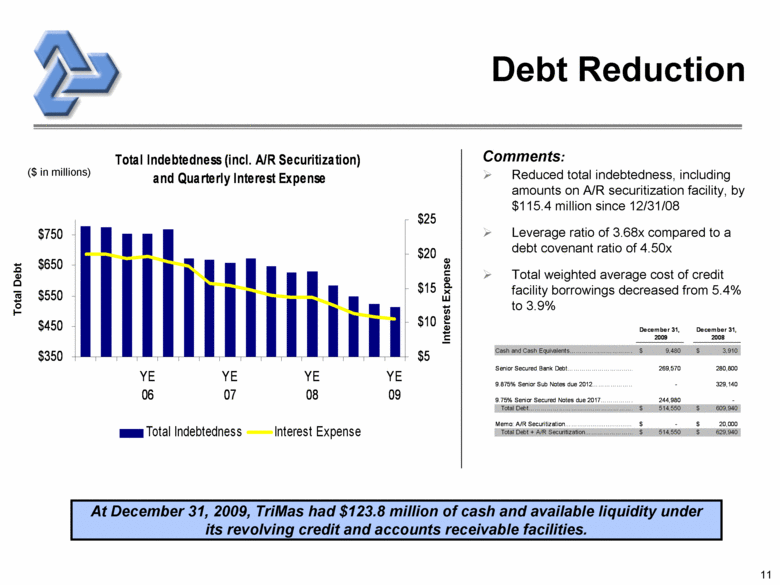
11 Debt Reduction Reduced total indebtedness, including amounts on A/R securitization facility, by $115.4 million since 12/31/08 Leverage ratio of 3.68x compared to a debt covenant ratio of 4.50x Total weighted average cost of credit facility borrowings decreased from 5.4% to 3.9% Total Debt Interest Expense ($ in millions) Comments: At December 31, 2009, TriMas had $123.8 million of cash and available liquidity under its revolving credit and accounts receivable facilities. December 31, 2009 December 31, 2008 Cash and Cash Equivalents 9,480 $ 3,910 $ Senior Secured Bank Debt 269,570 280,800 9.875% Senior Sub Notes due 2012 - 329,140 9.75% Senior Secured Notes due 2017 244,980 - Total Debt 514,550 $ 609,940 $ Memo: A/R Securitization - $ 20,000 $ Total Debt + A/R Securitization 514,550 $ 629,940 $ |
|
|
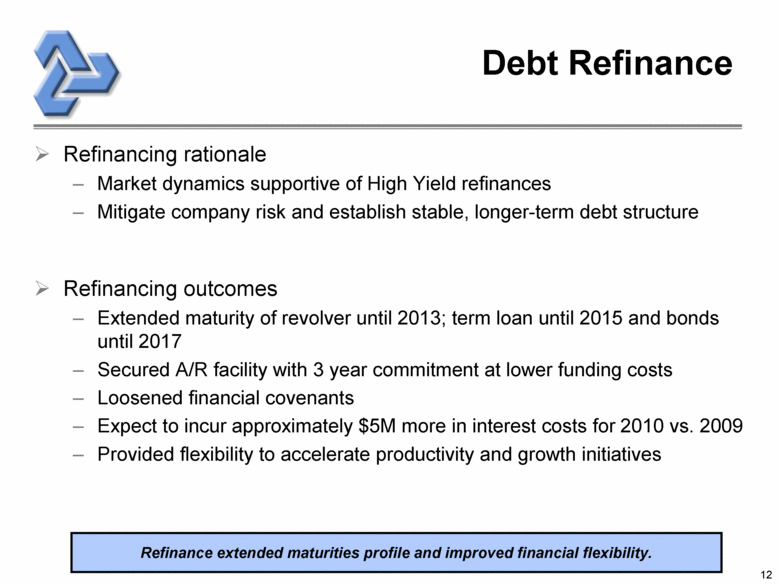
Debt Refinance Refinancing rationale Market dynamics supportive of High Yield refinances Mitigate company risk and establish stable, longer-term debt structure Refinancing outcomes Extended maturity of revolver until 2013; term loan until 2015 and bonds until 2017 Secured A/R facility with 3 year commitment at lower funding costs Loosened financial covenants Expect to incur approximately $5M more in interest costs for 2010 vs. 2009 Provided flexibility to accelerate productivity and growth initiatives Refinance extended maturities profile and improved financial flexibility. |
|
|
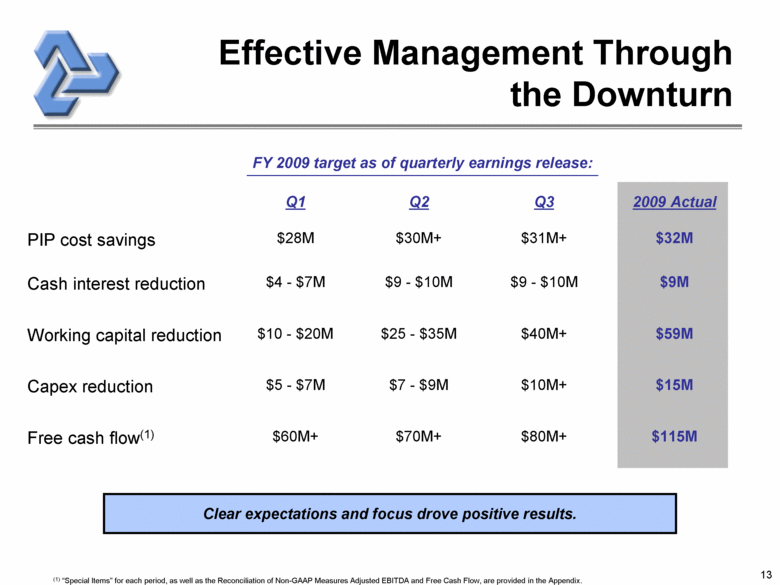
13 Effective Management Through the Downturn $80M+ $10M+ $40M+ $9 - $10M $31M+ Q3 $115M $15M $59M $9M $32M 2009 Actual Q1 Q2 PIP cost savings $28M $30M+ Cash interest reduction $4 - $7M $9 - $10M Working capital reduction $10 - $20M $25 - $35M Capex reduction $5 - $7M $7 - $9M Free cash flow(1) $60M+ $70M+ (1) “Special Items” for each period, as well as the Reconciliation of Non-GAAP Measures Adjusted EBITDA and Free Cash Flow, are provided in the Appendix. FY 2009 target as of quarterly earnings release: Clear expectations and focus drove positive results. |
|
|
Segment Highlights |
|
|
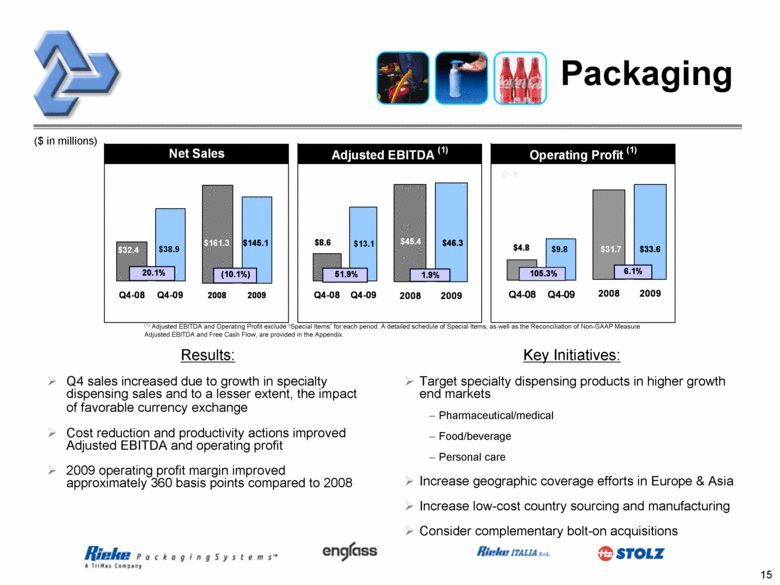
15 Packaging Results: Q4 sales increased due to growth in specialty dispensing sales and to a lesser extent, the impact of favorable currency exchange Cost reduction and productivity actions improved Adjusted EBITDA and operating profit 2009 operating profit margin improved approximately 360 basis points compared to 2008 ($ in millions) Key Initiatives: Target specialty dispensing products in higher growth end markets Pharmaceutical/medical Food/beverage Personal care Increase geographic coverage efforts in Europe & Asia Increase low-cost country sourcing and manufacturing Consider complementary bolt-on acquisitions (1) Adjusted EBITDA and Operating Profit exclude “Special Items” for each period. A detailed schedule of Special Items, as well as the Reconciliation of Non-GAAP Measure Adjusted EBITDA and Free Cash Flow, are provided in the Appendix. |
|
|
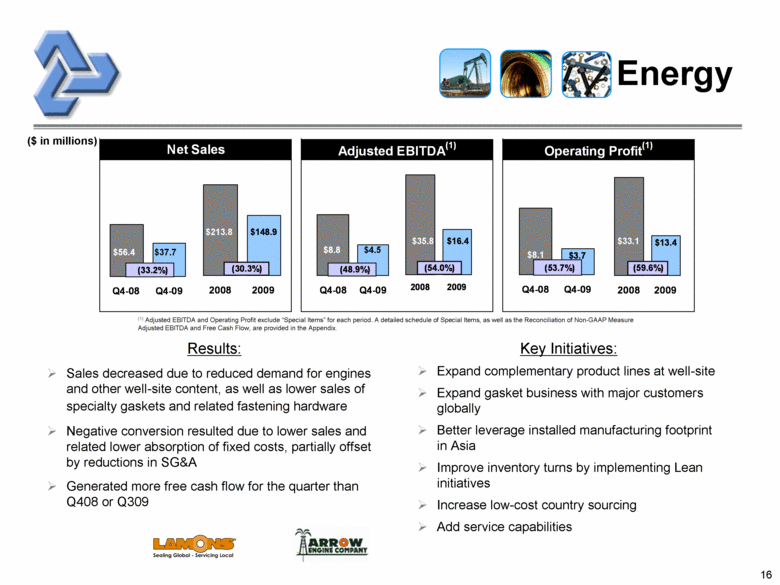
16 Energy ($ in millions) (1) Adjusted EBITDA and Operating Profit exclude “Special Items” for each period. A detailed schedule of Special Items, as well as the Reconciliation of Non-GAAP Measure Adjusted EBITDA and Free Cash Flow, are provided in the Appendix. Results: Sales decreased due to reduced demand for engines and other well-site content, as well as lower sales of specialty gaskets and related fastening hardware Negative conversion resulted due to lower sales and related lower absorption of fixed costs, partially offset by reductions in SG&A Generated more free cash flow for the quarter than Q408 or Q309 Key Initiatives: Expand complementary product lines at well-site Expand gasket business with major customers globally Better leverage installed manufacturing footprint in Asia Improve inventory turns by implementing Lean initiatives Increase low-cost country sourcing Add service capabilities |
|
|
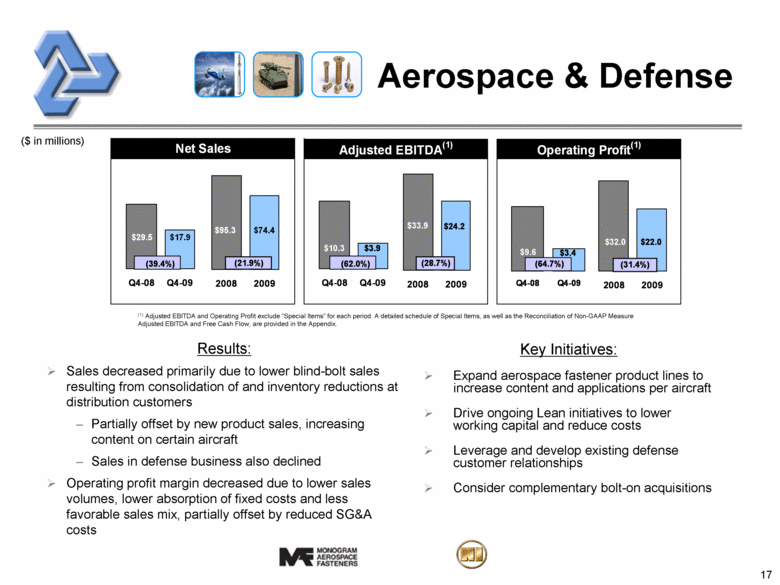
17 Aerospace & Defense Key Initiatives: Expand aerospace fastener product lines to increase content and applications per aircraft Drive ongoing Lean initiatives to lower working capital and reduce costs Leverage and develop existing defense customer relationships Consider complementary bolt-on acquisitions ($ in millions) Results: Sales decreased primarily due to lower blind-bolt sales resulting from consolidation of and inventory reductions at distribution customers Partially offset by new product sales, increasing content on certain aircraft Sales in defense business also declined Operating profit margin decreased due to lower sales volumes, lower absorption of fixed costs and less favorable sales mix, partially offset by reduced SG&A costs (1) Adjusted EBITDA and Operating Profit exclude “Special Items” for each period. A detailed schedule of Special Items, as well as the Reconciliation of Non-GAAP Measure Adjusted EBITDA and Free Cash Flow, are provided in the Appendix. |
|
|
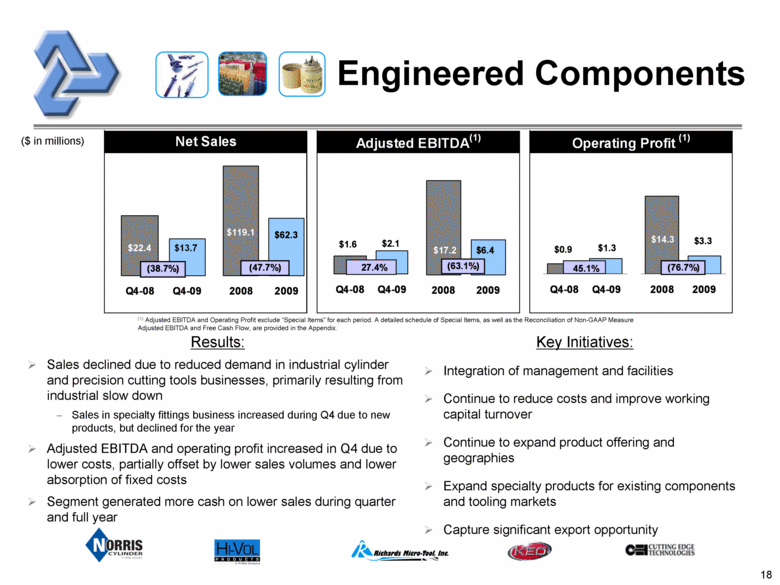
18 Engineered Components ($ in millions) Results: Sales declined due to reduced demand in industrial cylinder and precision cutting tools businesses, primarily resulting from industrial slow down Sales in specialty fittings business increased during Q4 due to new products, but declined for the year Adjusted EBITDA and operating profit increased in Q4 due to lower costs, partially offset by lower sales volumes and lower absorption of fixed costs Segment generated more cash on lower sales during quarter and full year Key Initiatives: Integration of management and facilities Continue to reduce costs and improve working capital turnover Continue to expand product offering and geographies Expand specialty products for existing components and tooling markets Capture significant export opportunity (1) Adjusted EBITDA and Operating Profit exclude “Special Items” for each period. A detailed schedule of Special Items, as well as the Reconciliation of Non-GAAP Measure Adjusted EBITDA and Free Cash Flow, are provided in the Appendix. |
|
|
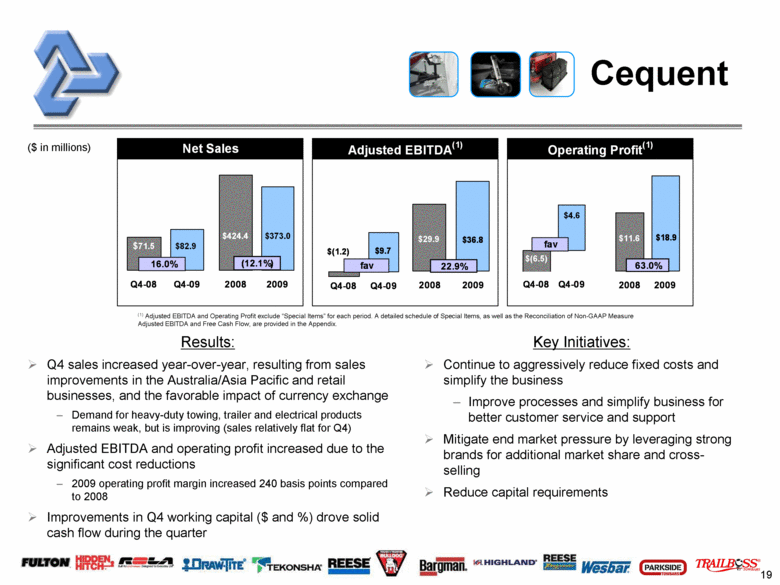
19 Cequent ($ in millions) $46.4 Results: Q4 sales increased year-over-year, resulting from sales improvements in the Australia/Asia Pacific and retail businesses, and the favorable impact of currency exchange Demand for heavy-duty towing, trailer and electrical products remains weak, but is improving (sales relatively flat for Q4) Adjusted EBITDA and operating profit increased due to the significant cost reductions 2009 operating profit margin increased 240 basis points compared to 2008 Improvements in Q4 working capital ($ and %) drove solid cash flow during the quarter Key Initiatives: Continue to aggressively reduce fixed costs and simplify the business Improve processes and simplify business for better customer service and support Mitigate end market pressure by leveraging strong brands for additional market share and cross-selling Reduce capital requirements (1) Adjusted EBITDA and Operating Profit exclude “Special Items” for each period. A detailed schedule of Special Items, as well as the Reconciliation of Non-GAAP Measure Adjusted EBITDA and Free Cash Flow, are provided in the Appendix. |
|
|
Outlook & Summary |
|
|
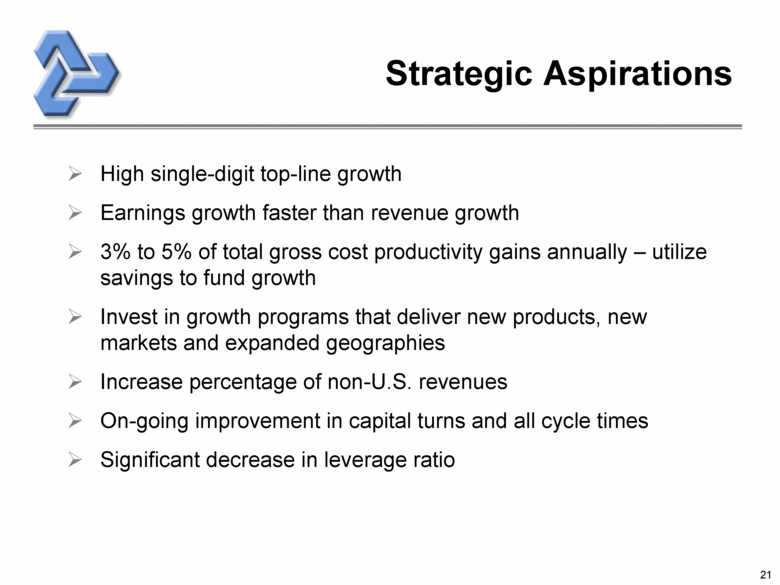
Strategic Aspirations High single-digit top-line growth Earnings growth faster than revenue growth 3% to 5% of total gross cost productivity gains annually – utilize savings to fund growth Invest in growth programs that deliver new products, new markets and expanded geographies Increase percentage of non-U.S. revenues On-going improvement in capital turns and all cycle times Significant decrease in leverage ratio |
|
|
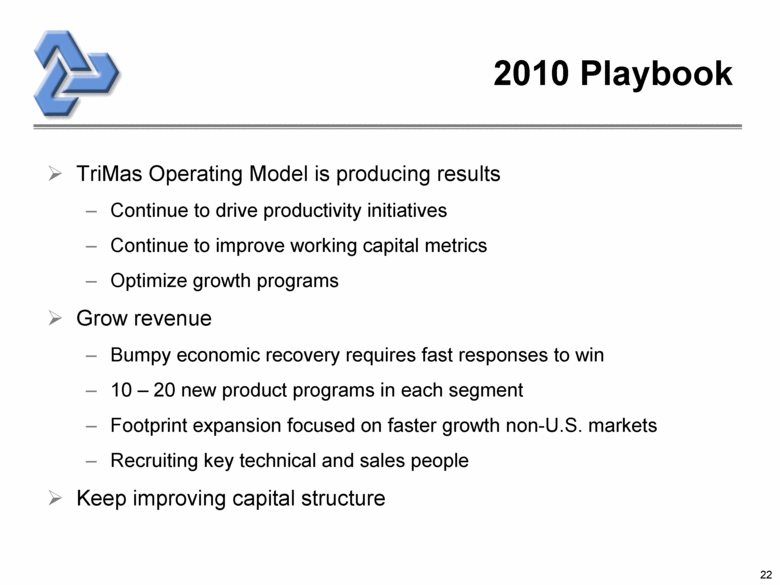
2010 Playbook TriMas Operating Model is producing results Continue to drive productivity initiatives Continue to improve working capital metrics Optimize growth programs Grow revenue Bumpy economic recovery requires fast responses to win 10 – 20 new product programs in each segment Footprint expansion focused on faster growth non-U.S. markets Recruiting key technical and sales people Keep improving capital structure |
|
|
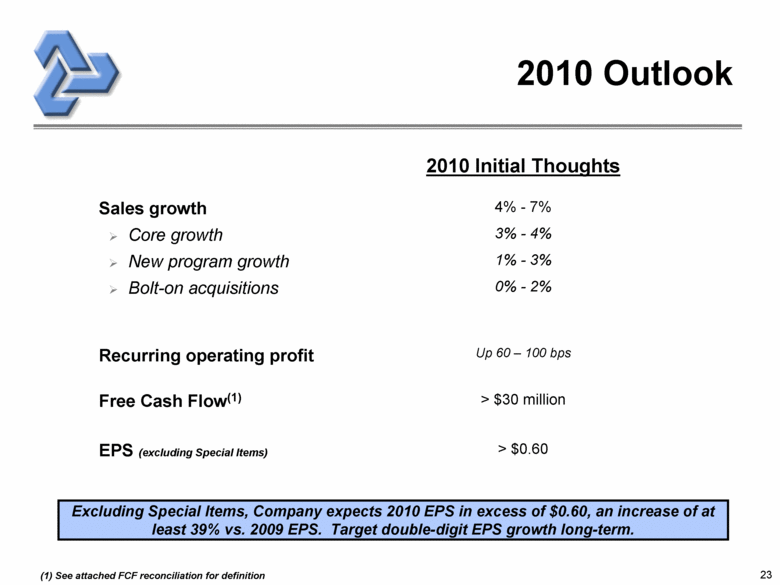
2010 Outlook Excluding Special Items, Company expects 2010 EPS in excess of $0.60, an increase of at least 39% vs. 2009 EPS. Target double-digit EPS growth long-term. > $30 million Free Cash Flow(1) Up 60 – 100 bps Recurring operating profit 0% - 2% Bolt-on acquisitions > $0.60 EPS (excluding Special Items) 1% - 3% New program growth 3% - 4% Core growth 4% - 7% Sales growth 2010 Initial Thoughts (1) See attached FCF reconciliation for definition |
|
|
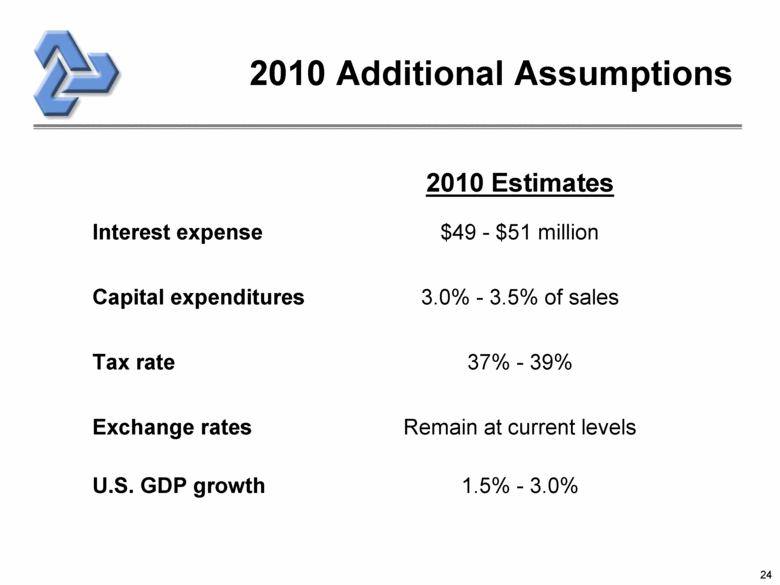
2010 Additional Assumptions Remain at current levels Exchange rates 1.5% - 3.0% U.S. GDP growth 37% - 39% Tax rate 3.0% - 3.5% of sales Capital expenditures $49 - $51 million Interest expense 2010 Estimates |
|
|
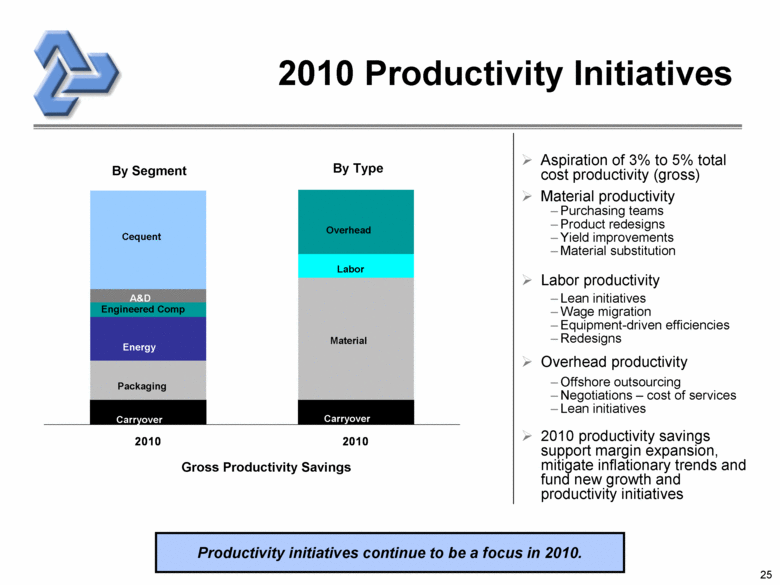
2010 Productivity Initiatives Aspiration of 3% to 5% total cost productivity (gross) Material productivity Purchasing teams Product redesigns Yield improvements Material substitution Labor productivity Lean initiatives Wage migration Equipment-driven efficiencies Redesigns Overhead productivity Offshore outsourcing Negotiations – cost of services Lean initiatives 2010 productivity savings support margin expansion, mitigate inflationary trends and fund new growth and productivity initiatives Gross Productivity Savings Productivity initiatives continue to be a focus in 2010. Carryover Labor Material Overhead Carryover Packaging Energy Engineered Comp Cequent A&D By Segment By Type 2010 2010 |
|
|
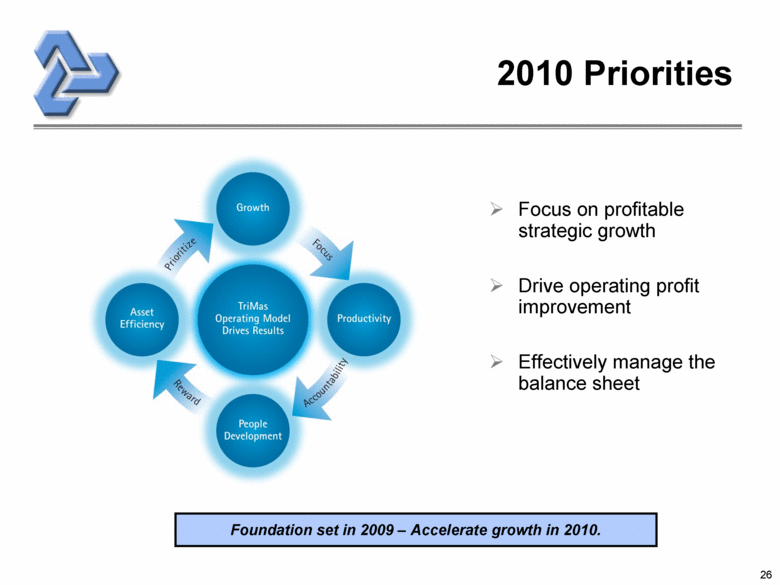
26 2010 Priorities Focus on profitable strategic growth Drive operating profit improvement Effectively manage the balance sheet Foundation set in 2009 – Accelerate growth in 2010. |
|
|
Questions & Answers |
|
|
Appendix |
|
|
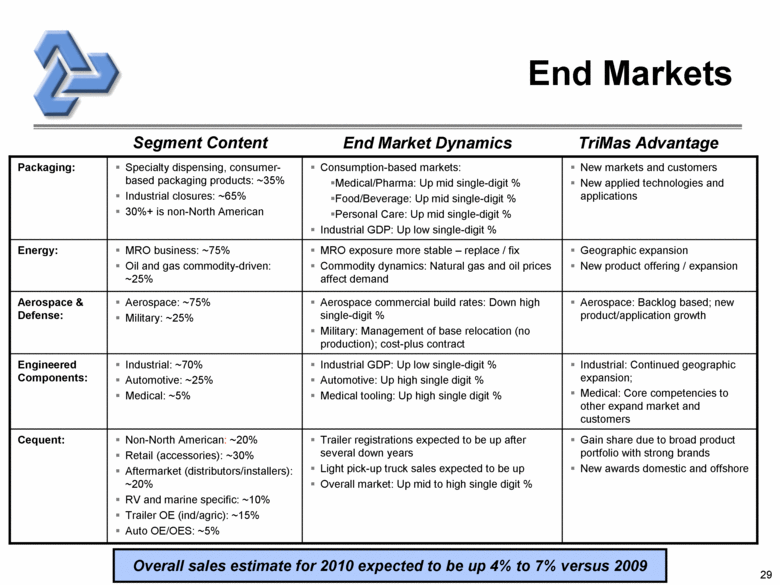
End Markets Aerospace: Backlog based; new product/application growth Aerospace commercial build rates: Down high single-digit % Military: Management of base relocation (no production); cost-plus contract Aerospace: ~75% Military: ~25% Aerospace & Defense: Gain share due to broad product portfolio with strong brands New awards domestic and offshore Trailer registrations expected to be up after several down years Light pick-up truck sales expected to be up Overall market: Up mid to high single digit % Non-North American: ~20% Retail (accessories): ~30% Aftermarket (distributors/installers): ~20% RV and marine specific: ~10% Trailer OE (ind/agric): ~15% Auto OE/OES: ~5% Cequent: Industrial: Continued geographic expansion; Medical: Core competencies to other expand market and customers Industrial GDP: Up low single-digit % Automotive: Up high single digit % Medical tooling: Up high single digit % Industrial: ~70% Automotive: ~25% Medical: ~5% Engineered Components: Geographic expansion New product offering / expansion MRO exposure more stable – replace / fix Commodity dynamics: Natural gas and oil prices affect demand MRO business: ~75% Oil and gas commodity-driven: ~25% Energy: New markets and customers New applied technologies and applications Consumption-based markets: Medical/Pharma: Up mid single-digit % Food/Beverage: Up mid single-digit % Personal Care: Up mid single-digit % Industrial GDP: Up low single-digit % Specialty dispensing, consumer-based packaging products: ~35% Industrial closures: ~65% 30%+ is non-North American Packaging: Segment Content End Market Dynamics TriMas Advantage Overall sales estimate for 2010 expected to be up 4% to 7% versus 2009 |
|
|
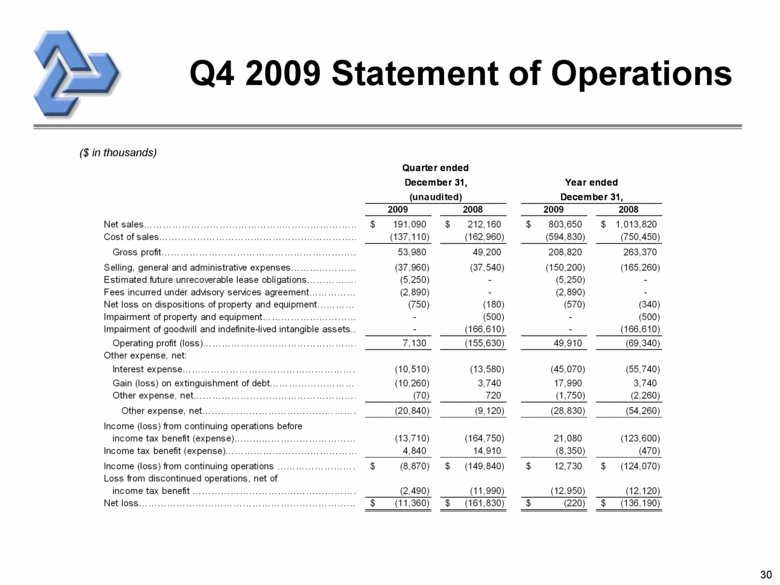
30 Q4 2009 Statement of Operations ($ in thousands) 2009 2008 2009 2008 Net sales 191,090 $ 212,160 $ 803,650 $ 1,013,820 $ Cost of sales (137,110) (162,960) (594,830) (750,450) Gross profit. 53,980 49,200 208,820 263,370 Selling, general and administrative expenses (37,960) (37,540) (150,200) (165,260) Estimated future unrecoverable lease obligations (5,250) - (5,250) - Fees incurred under advisory services agreement (2,890) - (2,890) - Net loss on dispositions of property and equipment (750) (180) (570) (340) Impairment of property and equipment - (500) - (500) Impairment of goodwill and indefinite-lived intangible assets. - (166,610) - (166,610) Operating profit (loss). 7,130 (155,630) 49,910 (69,340) Other expense, net: Interest expense (10,510) (13,580) (45,070) (55,740) Gain (loss) on extinguishment of debt (10,260) 3,740 17,990 3,740 Other expense, net (70) 720 (1,750) (2,260) Other expense, net (20,840) (9,120) (28,830) (54,260) Income (loss) from continuing operations before income tax benefit (expense) (13,710) (164,750) 21,080 (123,600) Income tax benefit (expense). 4,840 14,910 (8,350) (470) Income (loss) from continuing operations (8,870) $ (149,840) $ 12,730 $ (124,070) $ Loss from discontinued operations, net of income tax benefit (2,490) (11,990) (12,950) (12,120) Net loss (11,360) $ (161,830) $ (220) $ (136,190) $ (unaudited) December 31, December 31, Year ended Quarter ended |
|
|
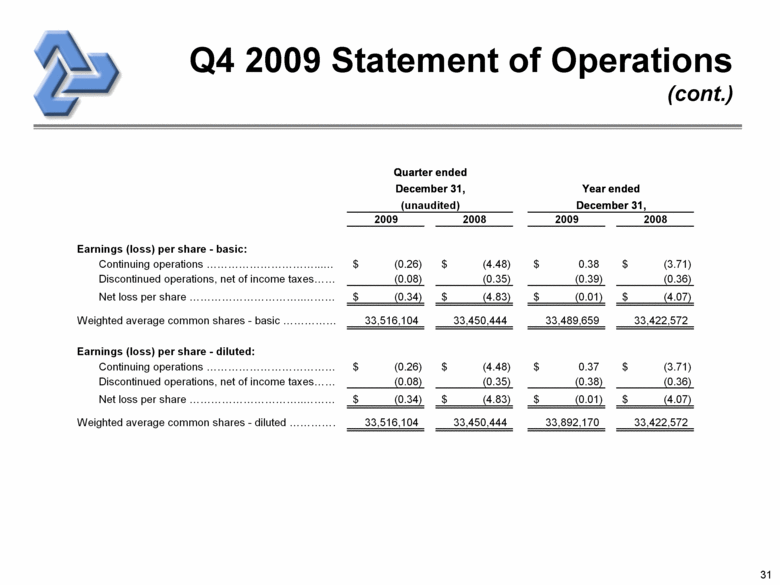
31 Q4 2009 Statement of Operations (cont.) ($ in thousands) 2009 2008 2009 2008 Earnings (loss) per share - basic: Continuing operations (0.26) $ (4.48) $ 0.38 $ (3.71) $ Discontinued operations, net of income taxes (0.08) (0.35) (0.39) (0.36) Net loss per share (0.34) $ (4.83) $ (0.01) $ (4.07) $ Weighted average common shares - basic 33,516,104 33,450,444 33,489,659 33,422,572 Earnings (loss) per share - diluted: Continuing operations (0.26) $ (4.48) $ 0.37 $ (3.71) $ Discontinued operations, net of income taxes (0.08) (0.35) (0.38) (0.36) Net loss per share (0.34) $ (4.83) $ (0.01) $ (4.07) $ Weighted average common shares - diluted 33,516,104 33,450,444 33,892,170 33,422,572 (unaudited) December 31, December 31, Year ended Quarter ended |
|
|
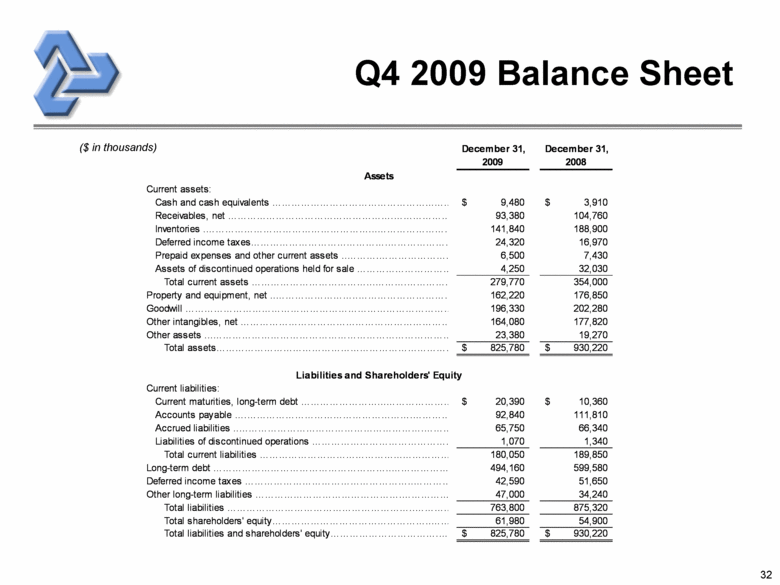
32 Q4 2009 Balance Sheet ($ in thousands) December 31, December 31, 2009 2008 Current assets: Cash and cash equivalents 9,480 $ 3,910 $ Receivables, net 93,380 104,760 Inventories 141,840 188,900 Deferred income taxes 24,320 16,970 Prepaid expenses and other current assets 6,500 7,430 Assets of discontinued operations held for sale 4,250 32,030 Total current assets 279,770 354,000 Property and equipment, net 162,220 176,850 Goodwill 196,330 202,280 Other intangibles, net 164,080 177,820 Other assets 23,380 19,270 Total assets 825,780 $ 930,220 $ Current liabilities: Current maturities, long-term debt 20,390 $ 10,360 $ Accounts payable 92,840 111,810 Accrued liabilities 65,750 66,340 Liabilities of discontinued operations 1,070 1,340 Total current liabilities 180,050 189,850 Long-term debt 494,160 599,580 Deferred income taxes 42,590 51,650 Other long-term liabilities 47,000 34,240 Total liabilities 763,800 875,320 Total shareholders' equity 61,980 54,900 Total liabilities and shareholders' equity 825,780 $ 930,220 $ Assets Liabilities and Shareholders' Equity |
|
|
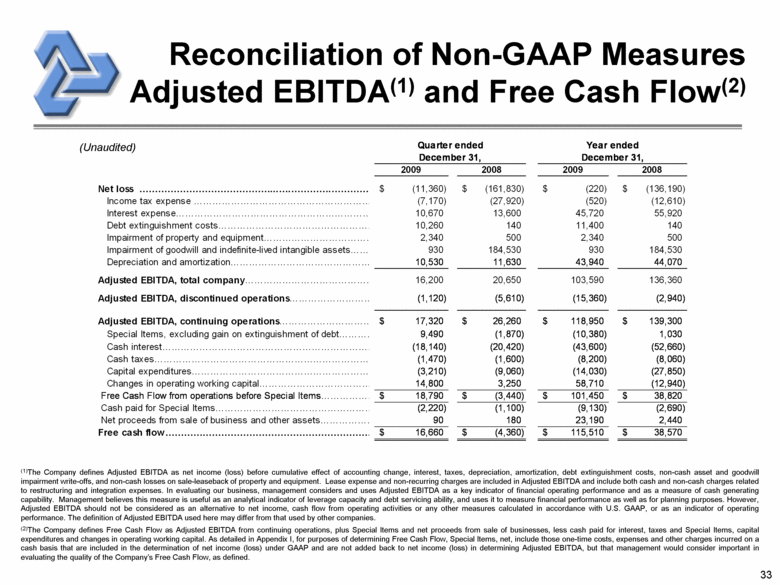
33 Reconciliation of Non-GAAP Measures Adjusted EBITDA(1) and Free Cash Flow(2) (1)The Company defines Adjusted EBITDA as net income (loss) before cumulative effect of accounting change, interest, taxes, depreciation, amortization, debt extinguishment costs, non-cash asset and goodwill impairment write-offs, and non-cash losses on sale-leaseback of property and equipment. Lease expense and non-recurring charges are included in Adjusted EBITDA and include both cash and non-cash charges related to restructuring and integration expenses. In evaluating our business, management considers and uses Adjusted EBITDA as a key indicator of financial operating performance and as a measure of cash generating capability. Management believes this measure is useful as an analytical indicator of leverage capacity and debt servicing ability, and uses it to measure financial performance as well as for planning purposes. However, Adjusted EBITDA should not be considered as an alternative to net income, cash flow from operating activities or any other measures calculated in accordance with U.S. GAAP, or as an indicator of operating performance. The definition of Adjusted EBITDA used here may differ from that used by other companies. (2)The Company defines Free Cash Flow as Adjusted EBITDA from continuing operations, plus Special Items and net proceeds from sale of businesses, less cash paid for interest, taxes and Special Items, capital expenditures and changes in operating working capital. As detailed in Appendix I, for purposes of determining Free Cash Flow, Special Items, net, include those one-time costs, expenses and other charges incurred on a cash basis that are included in the determination of net income (loss) under GAAP and are not added back to net income (loss) in determining Adjusted EBITDA, but that management would consider important in evaluating the quality of the Company’s Free Cash Flow, as defined. (Unaudited) 2009 2008 2009 2008 Net loss (11,360) $ (161,830) $ (220) $ (136,190) $ Income tax expense . (7,170) (27,920) (520) (12,610) Interest expense 10,670 13,600 45,720 55,920 Debt extinguishment costs. 10,260 140 11,400 140 Impairment of property and equipment. 2,340 500 2,340 500 Impairment of goodwill and indefinite-lived intangible assets. 930 184,530 930 184,530 Depreciation and amortization. 10,530 11,630 43,940 44,070 Adjusted EBITDA, total company . 16,200 20,650 103,590 136,360 Adjusted EBITDA, discontinued operations (1,120) (5,610) (15,360) (2,940) Adjusted EBITDA, continuing operations . 17,320 $ 26,260 $ 118,950 $ 139,300 $ Special Items, excluding gain on extinguishment of debt 9,490 (1,870) (10,380) 1,030 Cash interest (18,140) (20,420) (43,600) (52,660) Cash taxes (1,470) (1,600) (8,200) (8,060) Capital expenditures (3,210) (9,060) (14,030) (27,850) Changes in operating working capital 14,800 3,250 58,710 (12,940) Free Cash Flow from operations before Special Items 18,790 $ (3,440) $ 101,450 $ 38,820 $ Cash paid for Special Items (2,220) (1,100) (9,130) (2,690) Net proceeds from sale of business and other assets 90 180 23,190 2,440 Free cash flow. 16,660 $ (4,360) $ 115,510 $ 38,570 $ Quarter ended Year ended December 31, December 31, |
|
|
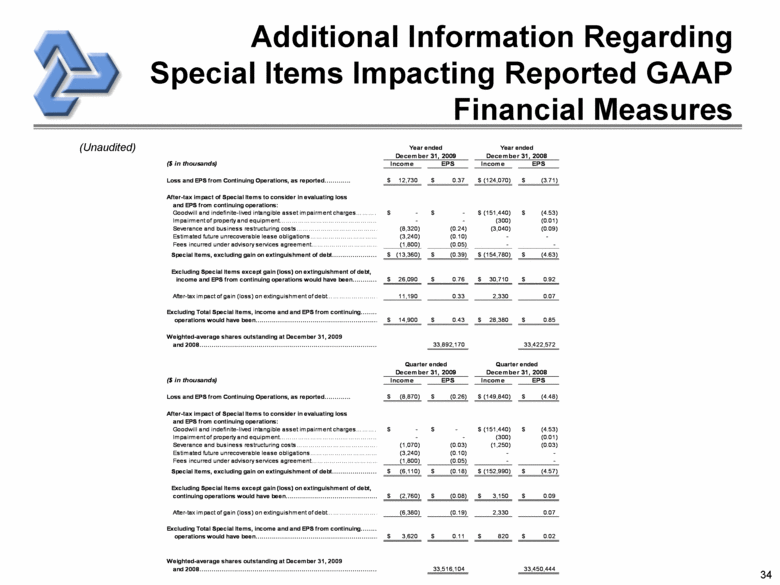
34 Additional Information Regarding Special Items Impacting Reported GAAP Financial Measures (Unaudited) Year ended Year ended December 31, 2009 December 31, 2008 ($ in thousands) Income EPS Income EPS Loss and EPS from Continuing Operations, as reported. 12,730 $ 0.37 $ (124,070) $ (3.71) $ After-tax impact of Special Items to consider in evaluating loss and EPS from continuing operations: Goodwill and indefinite-lived intangible asset impairment charges - $ - $ (151,440) $ (4.53) $ Impairment of property and equipment. - - (300) (0.01) Severance and business restructuring costs (8,320) (0.24) (3,040) (0.09) Estimated future unrecoverable lease obligations (3,240) (0.10) - - Fees incurred under advisory services agreement (1,800) (0.05) - - Special Items, excluding gain on extinguishment of debt (13,360) $ (0.39) $ (154,780) $ (4.63) $ Excluding Special Items except gain (loss) on extinguishment of debt, income and EPS from continuing operations would have been 26,090 $ 0.76 $ 30,710 $ 0.92 $ After-tax impact of gain (loss) on extinguishment of debt 11,190 0.33 2,330 0.07 Excluding Total Special Items, income and and EPS from continuing. operations would have been 14,900 $ 0.43 $ 28,380 $ 0.85 $ Weighted-average shares outstanding at December 31, 2009 and 2008. 33,892,170 33,422,572 Quarter ended Quarter ended December 31, 2009 December 31, 2008 ($ in thousands) Income EPS Income EPS Loss and EPS from Continuing Operations, as reported. (8,870) $ (0.26) $ (149,840) $ (4.48) $ After-tax impact of Special Items to consider in evaluating loss and EPS from continuing operations: Goodwill and indefinite-lived intangible asset impairment charges - $ - (151,440) $ (4.53) Impairment of property and equipment. - - (300) (0.01) Severance and business restructuring costs (1,070) (0.03) (1,250) (0.03) Estimated future unrecoverable lease obligations (3,240) (0.10) - - Fees incurred under advisory services agreement (1,800) (0.05) - - Special Items, excluding gain on extinguishment of debt (6,110) $ (0.18) $ (152,990) $ (4.57) $ Excluding Special Items except gain (loss) on extinguishment of debt, continuing operations would have been (2,760) $ (0.08) $ 3,150 $ 0.09 $ After-tax impact of gain (loss) on extinguishment of debt (6,380) (0.19) 2,330 0.07 Excluding Total Special Items, income and and EPS from continuing. operations would have been 3,620 $ 0.11 $ 820 $ 0.02 $ Weighted-average shares outstanding at December 31, 2009 and 2008. 33,516,104 33,450,444 |
|
|
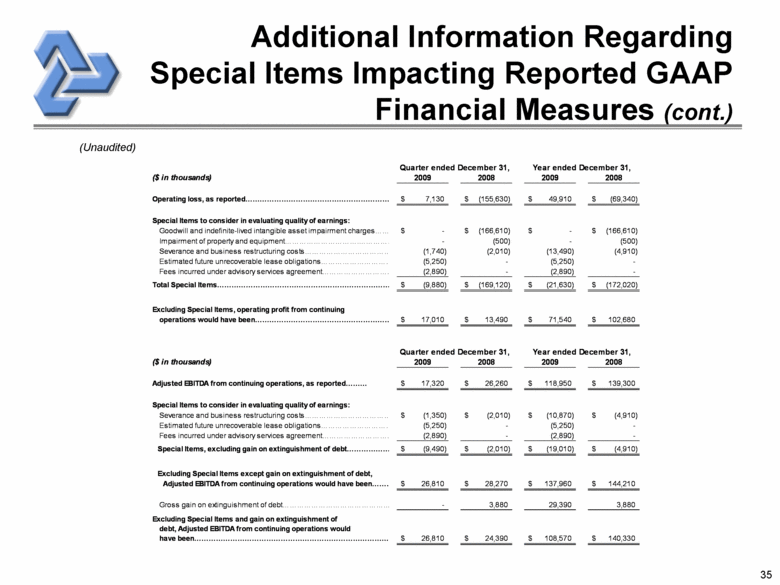
35 Additional Information Regarding Special Items Impacting Reported GAAP Financial Measures (cont.) (Unaudited) Quarter ended December 31, Year ended December 31, ($ in thousands) 2009 2008 2009 2008 Operating loss, as reported 7,130 $ (155,630) $ 49,910 $ (69,340) $ Special Items to consider in evaluating quality of earnings: Goodwill and indefinite-lived intangible asset impairment charges - $ (166,610) $ - $ (166,610) $ Impairment of property and equipment. - (500) - (500) Severance and business restructuring costs (1,740) (2,010) (13,490) (4,910) Estimated future unrecoverable lease obligations (5,250) - (5,250) - Fees incurred under advisory services agreement (2,890) - (2,890) - Total Special Items (9,880) $ (169,120) $ (21,630) $ (172,020) $ Excluding Special Items, operating profit from continuing operations would have been 17,010 $ 13,490 $ 71,540 $ 102,680 $ Quarter ended December 31, Year ended December 31, ($ in thousands) 2009 2008 2009 2008 Adjusted EBITDA from continuing operations, as reported 17,320 $ 26,260 $ 118,950 $ 139,300 $ Special Items to consider in evaluating quality of earnings: Severance and business restructuring costs (1,350) $ (2,010) $ (10,870) $ (4,910) $ Estimated future unrecoverable lease obligations (5,250) - (5,250) - Fees incurred under advisory services agreement (2,890) - (2,890) - Special Items, excluding gain on extinguishment of debt (9,490) $ (2,010) $ (19,010) $ (4,910) $ Excluding Special Items except gain on extinguishment of debt, Adjusted EBITDA from continuing operations would have been 26,810 $ 28,270 $ 137,960 $ 144,210 $ Gross gain on extinguishment of debt - 3,880 29,390 3,880 Excluding Special Items and gain on extinguishment of debt, Adjusted EBITDA from continuing operations would have been. 26,810 $ 24,390 $ 108,570 $ 140,330 $ |
|
|
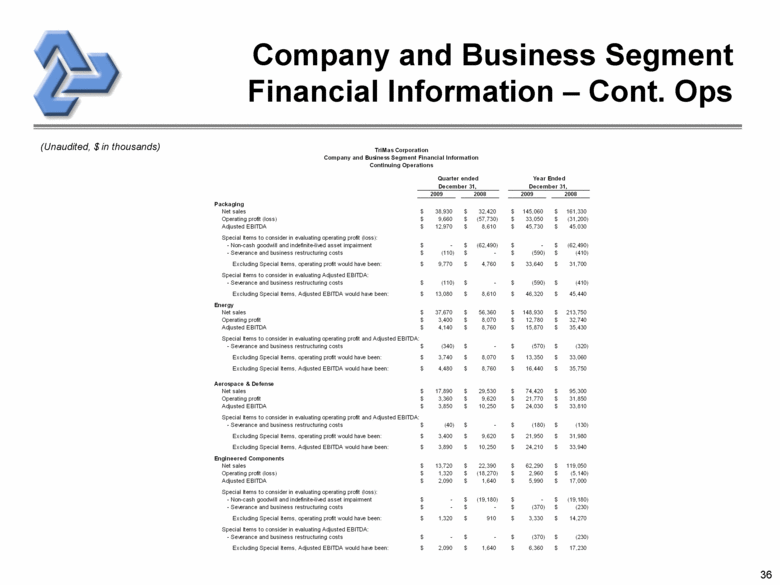
36 Company and Business Segment Financial Information – Cont. Ops (Unaudited, $ in thousands) Quarter ended 2009 2008 2009 2008 Packaging Net sales 38,930 $ 32,420 $ 145,060 $ 161,330 $ Operating profit (loss) 9,660 $ (57,730) $ 33,050 $ (31,200) $ Adjusted EBITDA 12,970 $ 8,610 $ 45,730 $ 45,030 $ Special Items to consider in evaluating operating profit (loss): - Non-cash goodwill and indefinite-lived asset impairment - $ (62,490) $ - $ (62,490) $ - Severance and business restructuring costs (110) $ - $ (590) $ (410) $ Excluding Special Items, operating profit would have been: 9,770 $ 4,760 $ 33,640 $ 31,700 $ Special Items to consider in evaluating Adjusted EBITDA: - Severance and business restructuring costs (110) $ - $ (590) $ (410) $ Excluding Special Items, Adjusted EBITDA would have been: 13,080 $ 8,610 $ 46,320 $ 45,440 $ Energy Net sales 37,670 $ 56,360 $ 148,930 $ 213,750 $ Operating profit 3,740 $ 8,070 $ 12,780 $ 32,740 $ Adjusted EBITDA 4,140 $ 8,760 $ 15,870 $ 35,430 $ Special Items to consider in evaluating operating profit and Adjusted EBITDA: - Severance and business restructuring costs (340) $ - $ (570) $ (320) $ Excluding Special Items, operating profit would have been: 3,730 $ 8,070 $ 13,350 $ 33,060 $ Excluding Special Items, Adjusted EBITDA would have been: 4,480 $ 8,760 $ 16,440 $ 35,750 $ Aerospace & Defense Net sales 17,890 $ 29,530 $ 74,420 $ 95,300 $ Operating profit 3,360 $ 9,620 $ 21,770 $ 31,850 $ Adjusted EBITDA 3,850 $ 10,250 $ 24,030 $ 33,810 $ Special Items to consider in evaluating operating profit and Adjusted EBITDA: - Severance and business restructuring costs (40) $ - $ (180) $ (130) $ Excluding Special Items, operating profit would have been: 3,400 $ 9,620 $ 21,950 $ 31,980 $ Excluding Special Items, Adjusted EBITDA would have been: 3,890 $ 10,250 $ 24,210 $ 33,940 $ Engineered Components Net sales 13,720 $ 22,390 $ 62,290 $ 119,050 $ Operating profit (loss) 1,320 $ (18,270) $ 2,960 $ (5,140) $ Adjusted EBITDA 2,090 $ 1,640 $ 5,990 $ 17,000 $ Special Items to consider in evaluating operating profit (loss): - Non-cash goodwill and indefinite-lived asset impairment - $ (19,180) $ - $ (19,180) $ - Severance and business restructuring costs - $ - $ (370) $ (230) $ Excluding Special Items, operating profit would have been: 1,320 $ 910 $ 3,330 $ 14,270 $ Special Items to consider in evaluating Adjusted EBITDA: - Severance and business restructuring costs - $ - $ (370) $ (230) $ Excluding Special Items, Adjusted EBITDA would have been: 2,090 $ 1,640 $ 6,360 $ 17,230 $ December 31, December 31, TriMas Corporation Company and Business Segment Financial Information Continuing Operations Year Ended |
|
|
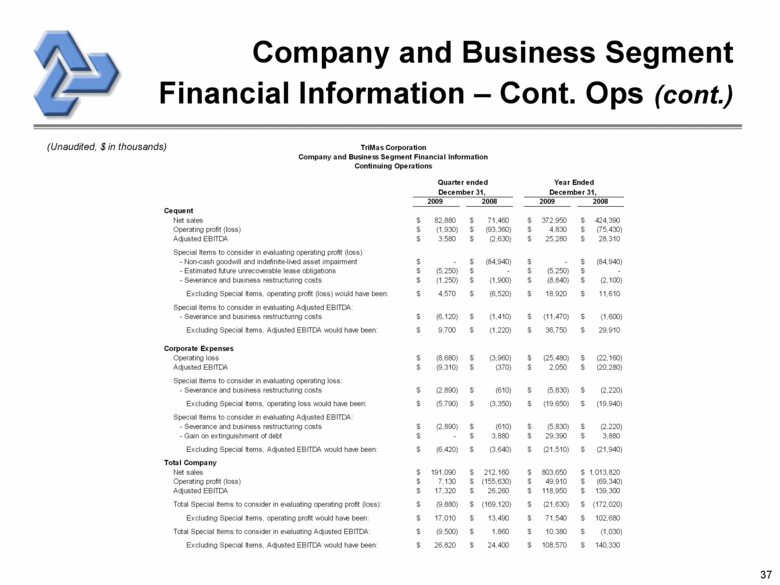
37 Company and Business Segment Financial Information – Cont. Ops (cont.) (Unaudited, $ in thousands) Quarter ended Year Ended 2009 2008 2009 2008 Cequent Net sales 82,880 $ 71,460 $ 372,950 $ 424,390 $ Operating profit (loss) (1,930) $ (93,360) $ 4,830 $ (75,430) $ Adjusted EBITDA 3,580 $ (2,630) $ 25,280 $ 28,310 $ Special Items to consider in evaluating operating profit (loss): - Non-cash goodwill and indefinite-lived asset impairment - $ (84,940) $ - $ (84,940) $ - Estimated future unrecoverable lease obligations (5,250) $ - $ (5,250) $ - $ - Severance and business restructuring costs (1,250) $ (1,900) $ (8,840) $ (2,100) $ Excluding Special Items, operating profit (loss) would have been: 4,570 $ (6,520) $ 18,920 $ 11,610 $ Special Items to consider in evaluating Adjusted EBITDA: - Severance and business restructuring costs (6,120) $ (1,410) $ (11,470) $ (1,600) $ Excluding Special Items, Adjusted EBITDA would have been: 9,700 $ (1,220) $ 36,750 $ 29,910 $ Corporate Expenses Operating loss (8,680) $ (3,960) $ (25,480) $ (22,160) $ Adjusted EBITDA (9,310) $ (370) $ 2,050 $ (20,280) $ Special Items to consider in evaluating operating loss: - Severance and business restructuring costs (2,890) $ (610) $ (5,830) $ (2,220) $ Excluding Special Items, operating loss would have been: (5,790) $ (3,350) $ (19,650) $ (19,940) $ Special Items to consider in evaluating Adjusted EBITDA: - Severance and business restructuring costs (2,890) $ (610) $ (5,830) $ (2,220) $ - Gain on extinguishment of debt - $ 3,880 $ 29,390 $ 3,880 $ Excluding Special Items, Adjusted EBITDA would have been: (6,420) $ (3,640) $ (21,510) $ (21,940) $ Total Company Net sales 191,090 $ 212,160 $ 803,650 $ 1,013,820 $ Operating profit (loss) 7,130 $ (155,630) $ 49,910 $ (69,340) $ Adjusted EBITDA 17,320 $ 26,260 $ 118,950 $ 139,300 $ Total Special Items to consider in evaluating operating profit (loss): (9,880) $ (169,120) $ (21,630) $ (172,020) $ Excluding Special Items, operating profit would have been: 17,010 $ 13,490 $ 71,540 $ 102,680 $ Total Special Items to consider in evaluating Adjusted EBITDA: (9,500) $ 1,860 $ 10,380 $ (1,030) $ Excluding Special Items, Adjusted EBITDA would have been: 26,820 $ 24,400 $ 108,570 $ 140,330 $ TriMas Corporation Company and Business Segment Financial Information Continuing Operations December 31, December 31, |
|
|
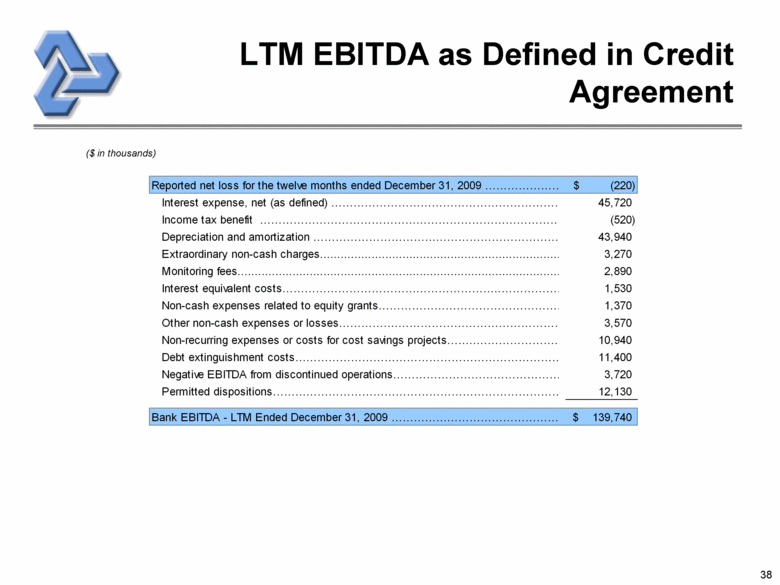
38 ($ in thousands) LTM EBITDA as Defined in Credit Agreement Reported net loss for the twelve months ended December 31, 2009 (220) $ Interest expense, net (as defined) 45,720 Income tax benefit (520) Depreciation and amortization . 43,940 Extraordinary non-cash charges 3,270 Monitoring fees 2,890 Interest equivalent costs 1,530 Non-cash expenses related to equity grants. 1,370 Other non-cash expenses or losses 3,570 Non-recurring expenses or costs for cost savings projects 10,940 Debt extinguishment costs. 11,400 Negative EBITDA from discontinued operations 3,720 Permitted dispositions 12,130 Bank EBITDA - LTM Ended December 31, 2009 139,740 $ |

