Attached files
| file | filename |
|---|---|
| 10-K - 10-K - TOOTSIE ROLL INDUSTRIES INC | a09-36223_210k.htm |
| EX-21 - EX-21 - TOOTSIE ROLL INDUSTRIES INC | a09-36223_2ex21.htm |
| EX-32 - EX-32 - TOOTSIE ROLL INDUSTRIES INC | a09-36223_2ex32.htm |
| EX-31.1 - EX-31.1 - TOOTSIE ROLL INDUSTRIES INC | a09-36223_2ex31d1.htm |
| EX-31.2 - EX-31.2 - TOOTSIE ROLL INDUSTRIES INC | a09-36223_2ex31d2.htm |
Exhibit 13

Ellen R. Gordon, President and Chief Operating Officer and Melvin J. Gordon, Chairman and Chief Executive Officer.
Corporate Profile
Tootsie Roll Industries, Inc. has been engaged in the manufacture and sale of confectionery products for 113 years. Our products are primarily sold under the familiar brand names: Tootsie Roll, Tootsie Roll Pops, Caramel Apple Pops, Child’s Play, Charms, Blow Pop, Blue Razz, Cella’s chocolate covered cherries, Tootsie Dots, Tootsie Crows, Junior Mints, Junior Caramels, Charleston Chew, Sugar Daddy, Sugar Babies, Andes, Fluffy Stuff cotton candy, Dubble Bubble, Razzles, Cry Baby, Nik-L-Nip and EI Bubble.
![]()
Corporate Principles
We believe that the differences among companies are attributable to the caliber of their people, and therefore we strive to attract and retain superior people for each job.
We believe that an open family atmosphere at work combined with professional management fosters cooperation and enables each individual to maximize his or her contribution to the Company and realize the corresponding rewards.
We do not jeopardize long-term growth for immediate, short-term results.
We maintain a conservative financial posture in the deployment and management of our assets.
We run a trim operation and continually strive to eliminate waste, minimize cost and implement performance improvements.
We invest in the latest and most productive equipment to deliver the best quality product to our customers at the lowest cost.
We seek to outsource functions where appropriate and to vertically integrate operations where it is financially advantageous to do so.
We view our well known brands as prized assets to be aggressively advertised and promoted to each new generation of consumers.
We conduct business with the highest ethical standards and integrity which are codified in the Company’s “Code of Business Conduct and Ethics.”
To Our Shareholders
Net product sales in 2009 were $496 million as compared with 2008 net product sales of $492 million. Most of our core brands posted solid results and Halloween was once again our largest selling season of the year.
Net earnings grew to $53 million from $39 million in 2008. The increase in earnings was attributable to margin improvements stemming from selected price increases and product weight adjustments as well as from lower energy and fuel costs and from foreign income tax benefits.
Commodity and packaging costs have risen significantly in recent years. While some of these costs abated during 2009, as a whole they remain at historically high levels. We are challenged to look for every feasible way to keep our operations lean and costs in check so that we can continue to deliver maximum value to our consumers.
We take a long-term view of our business and strive to implement measures that improve our operating results without jeopardizing the long-term strength of the Company and its well known brands. As a value oriented confectioner, we deem it essential to be a low cost producer and actively pursue investments in the latest technology to keep us so.
Financial Highlights
|
|
|
December 31, |
|
||||
|
|
|
2009 |
|
2008 |
|
||
|
|
|
(in thousands except per share data) |
|
||||
|
Net Product Sales |
|
$ |
495,592 |
|
$ |
492,051 |
|
|
Net Earnings |
|
53,475 |
|
38,777 |
|
||
|
Working Capital |
|
155,812 |
|
129,967 |
|
||
|
Net Property, Plant and Equipment |
|
220,721 |
|
217,628 |
|
||
|
Shareholders’ Equity |
|
652,485 |
|
634,770 |
|
||
|
Average Shares Outstanding* |
|
56,072 |
|
56,799 |
|
||
|
Per Share Items* |
|
|
|
|
|
||
|
Net Earnings |
|
$ |
0.95 |
|
$ |
0.68 |
|
|
Cash Dividends Paid |
|
.32 |
|
.32 |
|
||
*Adjusted for stock dividends.
To that end, capital expenditures in 2009 were $21 million. In addition to new state of the art equipment installations at a number of our plants, a portion of this figure was directed toward the latest phase of implementing our enterprise resource planning system, a comprehensive system of leading edge business software.
During 2009 we paid cash dividends of 32 cents per share and again distributed a 3% stock dividend. This was the sixty-seventh consecutive year the Company has paid cash dividends and the forty-fifth consecutive year that a stock dividend was distributed. We also repurchased 937,956 shares of common stock on the open market for an aggregate cost of $21 million.
We ended 2009 with $158 million in cash and investments and we remain poised to continue investing in our business, improving manufacturing productivity and quality, supporting our brands, paying dividends and repurchasing common stock. We also continue to seek appropriate complementary business acquisitions.
Sales and Marketing
During 2009 we again used carefully executed promotions to drive sales. Targeted initiatives, directed to the trade and to consumers, help to move our products into distribution and subsequently to move them off the retail shelf.
Retailers are highly selective as to the products they carry and consumers have many choices in the candy isle. We find that emphasizing high sell-through and attractive profit margins to the trade and high quality at an attractive value to the consumer is a winning strategy.
Our diverse and highly recognizable brand portfolio remains popular across all trade channels. We have a range of offerings suitable for virtually every major consumer group. Our product line undergoes continual refinement in order to retain its appeal to ever-evolving preferences and life styles. The candy marketplace is highly competitive and we are vigilant in keeping our products contemporary even as they remain iconic.
Halloween has long been our largest selling period with third quarter sales nearly double those of any other quarter in the year. We posted strong results in all major trade classes including grocery, mass merchandisers, warehouse clubs, dollar stores and drug chains. Especially popular at Halloween are our large bags of Child’s Play and other mixed candy assortments, which are offered in a variety of merchandising presentations.
Our bagged goods have traditionally been limited to “lay down” format that is commonly found on retailer’s shelves. In addition to “lay down” bags, in 2009 we introduced a number of packs in a “vertical” format. These gusseted bags really
do “stand up” on the shelf and offer a more visible, billboard-like front panel with room for expanded graphic content while creating an enhanced consumer value perception.
Other traditional merchandising presentations such as pallet packs, off shelf displays and display ready cases also continue to generate high sales volume in our Halloween packaged goods line. We continue to have some of the top selling theater box and home video items. This line was expanded in 2009 with two new Dots items that made trick-or-treating tastier. Candy Corn Dots are the classic Halloween flavor in a new gumdrop format and Bat Dots are black gumdrops with a new, mouth-watering “blood orange” flavor.
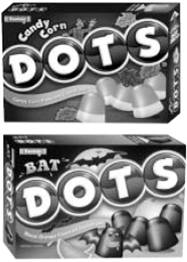
Candy Corn and Bat Dots
In addition to full size theater boxes, these two new frightfully good confections were packed in mini-boxes and, together with Ghost Dots, formed the new Dots Halloween Mix. Each bag of this mix features “spook-tacular” Halloween designs, and is metallized to ensure fresh gumdrops for every trick-or-treater.

Halloween Dots Mini Mix
Other additions to our Halloween offerings promoted the apple theme which is so readily associated with the fall season. Apple Orchard is a mix of three mouth watering caramel apple pop flavor profiles: sour green apple, tart red Macintosh and sweet Golden Delicious. All three apple flavored hard candies are blended with luscious caramel.
Another Halloween item, Caramel Apple Sugar Babies in snack size pouches, have a caramel center encased in a tart green apple shell. The caramel apple combination is a delicious hit.
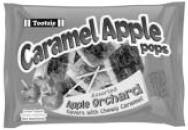
Apple Orchard Pops
Our unique line of wax candy products was expanded with the addition of Nik-L-Nip fruit flavored mini drinks individually wrapped and packed in a 60 count bag for sharing. For fun, we introduced Mr. Stache, a chewable wax candy moustache. These items designed for sharing are perfect for kids parties, trick or treating or anytime.

Mr. Stache Wax Candy
Blow Pop sales were boosted by the introduction of an innovative new Super Blow Pop counter display. This gravity fed dispenser has a small foot print so it can be used as a counter display or it can be attached to a power wing if counter space is not available. Vivid graphics on the prominent display panel increase exposure and promote trial of this classic confection.

Blow Pop Counter Display
Our Andes Crème de Menthe thins have a strong selling history during the Thanksgiving and Christmas holiday seasons. Andes has also had great success selling outside the candy aisle with Andes Crème de Menthe Baking Chips, which have grown every year since their introduction.
Building on this success, in 2009 we introduced Andes Crème de Menthe Cookies. Rich chocolate mint Andes cookies feature a crunchy
cocoa cookie center, covered in a melt-in-your-mouth minty green layer, and enveloped in a rich layer of delicious chocolate. This decadent chocolate mint cookie parallels the iconic Andes Crème de Menthe thins candy, with its rectangular shape, three layers and a green center, for instant consumer recognition. Andes cookies were a sensational seasonal success for Halloween and Christmas.
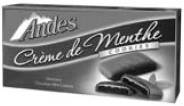
Andes Crème de Menthe Cookies
Advertising and Public Relations
We again promoted our long-standing “How Many Licks” Tootsie Pop message through campaigns on several children’s channels on cable television in 2009. This renowned theme was further reinforced by a How Many Licks Sweepstakes that encouraged entrants to guess the correct number of licks it would take to get to the chewy Tootsie Roll center. Having evaluated thousands of estimates, we can only conclude that the answer to this riddle remains “the world may never know!”
On a whimsical note, in 2009 Tootsie Roll was featured as its own category on the long running game show Jeopardy. Also, Tootsie Pops were profiled on the Travel Channel’s special interest program Extreme Mega Factories. Repeated showing of segments such as these generate extensive exposure and awareness among viewing consumers.
Tootsie Rolls became kosher certified during 2009, making our flagship product available to a whole new group of consumers. This announcement received wide press coverage and we heard positive feedback from many enthusiastic consumers. Also, our Chairman Melvin Gordon was honored with the Kettle Award, the candy industry’s highest tribute, in recognition of his lifetime achievements and dedication to the industry.
Purchasing
Although energy costs decreased during 2009 from the record levels of 2008, other commodity prices generally remained at historically high levels. Cost decreases in edible oils, dairy products and corn based sweeteners were largely offset by surging sugar prices. In packaging, decreases in the cost of films and folding cartons were more than offset by increases in corrugated and specialty papers.
Competitive bidding, selective hedging and leveraging our high volume of purchases are some of the means we use to mitigate rising costs to the greatest extent feasible. We also embarked on an extensive internal review of cost drivers during 2009 which is a key element in our ongoing efforts to eliminate waste. A number of cost-saving ideas were identified during this review and have been implemented across all of our plants.
Supply Chain
We continue to invest capital and resources in projects that keep our production and distribution facilities as efficient as possible, support evolving distribution patterns, improve quality and promote growing product lines. Much of this is driven by technology, which offers continuing advancements in automation that we can incorporate on the shop floor.
2009 was also the third year of a multi-year, company-wide enterprise resource planning system upgrade. The scope of this project is comprehensive, affecting nearly every facet of the Company. We are carefully phasing in this implementation to achieve maximum results.
International
Sales and profits in Mexico were lower in 2009 due to the devaluation of the peso. Although we promote our products in many countries throughout the world, our export business continued to be adversely affected by the relative strength of the U.S. dollar, which increases the relative cost of our products in foreign markets. Canadian sales were ahead of 2009 but profits declined due to product mix, higher commodity costs and foreign exchange rates.
In Appreciation
We wish to express our appreciation to our many loyal employees, customers, suppliers, sales brokers and distributors throughout the world for their support in 2009. We also thank our fellow shareholders as we remain committed to the pursuit of excellence in every aspect of our operations and face the increasing challenges of today’s business environment.
![]()
Melvin J.
Gordon
Chairman of the Board and
Chief Executive Officer
![]()
Ellen R.
Gordon
President and
Chief Operating Officer
Management’s
Discussion and Analysis of Financial
Condition and Results of Operations
(in thousands except per share, percentage and ratio figures)
FINANCIAL REVIEW
This financial review discusses the Company’s financial condition, results of operations, liquidity and capital resources, significant accounting policies and estimates, new accounting pronouncements, market risks and other matters. It should be read in conjunction with the Consolidated Financial Statements and related footnotes that follow this discussion.
FINANCIAL CONDITION
The Company’s overall financial position remains very strong as a result of its 2009 net earnings and related cash flows provided by operating activities.
During 2009, the Company’s cash flows from operating activities aggregated $75,281 compared to $57,042 in 2008. The Company used its cash flows to pay cash dividends of $17,825, repurchase and retire $20,723 of its outstanding shares, and make capital expenditures of $20,831. In addition, the Company’s net working capital increased from $129,967 at December 31, 2008 to $155,812 at December 31, 2009.
As of December 31, 2009, the Company’s aggregate cash, cash equivalents and investments, including all long-term investments in marketable securities, was $157,789 compared to $136,680 at December 31, 2008, an increase of $21,109. The 2009 amount reflects a $4,524 appreciation in market value of trading securities. The Company invests in trading securities to provide an economic hedge for its deferred compensation liabilities, as further discussed herein and in Note 7 to the Consolidated Financial Statements.
Shareholders’ equity increased from $634,770 at December 31, 2008 to $652,485 as of December 31, 2009, principally reflecting 2009 net earnings of $53,475 less cash dividends and share repurchases of $17,825 and $20,723, respectively.
The Company has a relatively straight-forward financial structure and has historically maintained a conservative financial position. Except for an immaterial amount of operating leases, the Company has no special financing arrangements or “off-balance sheet” special purpose entities. Cash flows from operations plus maturities of short-term investments are expected to be adequate to meet the Company’s overall financing needs, including capital expenditures, in 2010. Occasionally, the Company considers possible acquisitions, and if the Company were to pursue and complete such an acquisition, that could result in bank borrowings.
Results of Operations
2009 vs. 2008
Net product sales were $495,592 in 2009 compared to $492,051 in 2008, an increase of $3,541 or 1%. Although the increase in 2009 consolidated sales benefited from higher U.S. domestic sales, they were adversely affected by declines in export sales and sales of the Company’s Mexican subsidiary when translated into U.S. dollar sales from a devalued foreign currency.
Product cost of goods sold were $318,645 in 2009 compared to $333,314 in 2008, a decrease of $14,669 or 4.4%. Product cost of goods sold reflects a $2,876 increase in deferred compensation expense in 2009 compared to 2008. This increase principally results from changes in the market value of investments in trading securities relating to compensation deferred in previous years and is not reflective of current operating results. Adjusting for the aforementioned, product cost of goods sold as a percentage of net product sales favorably decreased from 68.1% in 2008 to 64.1% in 2009, a decrease of 4.0% as a percent of sales. This improvement principally reflects the benefits of selective price increases, product weight declines (indirect price increases) and the favorable effects of foreign currency exchange rates on products manufactured in Canada and principally sold in the United States. Ingredient unit costs favorably decreased by approximately $700 in 2009. However, the Company was adversely affected by approximately $400 of packaging material unit cost increases in 2009 compared to 2008. The Company generally experienced significant cost increases in sugar and cocoa. However, the Company experienced favorable declines in dairy products, corn syrup and edible oils.
Due to the seasonal nature of the Company’s business and corresponding variations in product mix, gross margins have historically been lower in the second half of the year, and second half of 2009 and 2008 were consistent with this trend.
Selling, marketing and administrative expenses were $103,755 in 2009 compared to $95,254 in 2008, an increase of $8,501 or 8.9%. Selling, marketing and administrative expenses reflect an $8,982 increase in deferred compensation expense in 2009 compared to 2008. This increase principally results from changes in the market value of investments in trading securities relating to compensation deferred in previous years and is not reflective of current operating results. Adjusting for the
aforementioned, selling, marketing and administrative expenses favorably decreased from $100,711 in 2008 to $100,230 in 2009, a decrease of $481 or 0.5%. As a percent of net product sales, these expenses decreased from 20.5% of net product sales in 2008 to 20.2% of product sales in 2009. The favorable decrease in such expenses principally resulted from lower freight, delivery and warehousing and distribution expenses partially offset by higher incentive compensation awards. Such higher incentive awards are due to the substantial improvement in 2009 results compared to 2008.
Selling, marketing and administrative expenses include $38,628 and $45,570 of freight, delivery and warehousing and distribution expenses in 2009 and 2008, respectively. Freight, delivery and warehousing and distribution expenses decreased from 9.3% of net product sales in 2008 to 7.8% of net product sales in 2009, primarily due to lower energy costs including lower freight fuel surcharges.
The Company believes that the carrying values of its trademarks and goodwill have indefinite lives as they are expected to generate cash flows indefinitely. In accordance with current accounting guidance, goodwill and indefinite-lived intangible assets are assessed at least annually for impairment as of December 31 or whenever events or circumstances indicate that the carrying values may not be recoverable from future cash flows. As of December 31, 2009, management ascertained that certain trademarks were impaired, and recorded a pre-tax charge of $14,000. This 2009 impairment charge was principally driven by an increase in the discount rate required by market participants. No impairments of intangibles were recorded in 2008.
The fair values of indefinite lived intangible assets are primarily assessed using the present value of estimated future cash flows. Management believes that all assumptions used for the impairment tests are consistent with those utilized by market participants performing similar valuations. The Company’s fair value estimates based on these assumptions were used to prepare projected financial information which it believes to be reasonable. Actual future results may differ from those projections and the differences may be material. Holding all other assumptions constant at the test date, a 100 basis point increase in the discount rate or a 100 basis point decrease in the royalty rate would reduce the fair value of certain trademarks by approximately 14% and 10%, respectively, indicating potential additional impairment of approximately $14,000 and $10,000, respectively, as of December 31, 2009.
Earnings from operations were $62,079 in 2009 compared to $66,527 in 2008, a decrease of $4,448. Earnings from operations includes changes in deferred compensation liabilities relating to corresponding changes in the market value of trading securities that hedge these liabilities as discussed above. Adjusting for the aforementioned deferred compensation charges of $11,858 and excluding the nonrecurring $14,000 non-cash impairment charge in 2009 relating to trademarks as discussed above, operating earnings were $80,603 and $59,193 in 2009 and 2008, respectively, an increase of $21,410 or 36.2%. Management believes this comparison is more reflective of the underlying operations of the Company. This increase principally reflects the favorable improvement in product cost of goods sold and gross profit margins, and more favorable freight, distribution and warehousing expenses as discussed above.
Other income (expense), net, was $2,100 in 2009 compared to $(10,618) in 2008, an increase of $12,718. This increase principally reflects the $11,858 favorable net change in the fair value of trading securities investments used to hedge deferred compensation liabilities, offset by a pre-tax impairment charge of $4,400 in 2009 to write down to market value the Company’s 50% investment in a Spanish joint venture, and a pre-tax charge of $5,140 in prior year 2008 to write down to market value an auction rate security as discussed below.
The Company has a 50% interest in a Spanish joint venture which is accounted for under the equity method. As of December 31, 2009, management determined, based on operating losses and expectations of future results, that the carrying value of this asset was impaired. As a result, the Company recorded a pre-tax impairment charge of $4,400 in the fourth quarter 2009, resulting in an adjusted carrying value of $4,961 as of December 31, 2009. The fair value was primarily assessed using the present value of estimated future cash flows. Other income (expense), net also includes the operating results of the Company’s joint venture which was a loss of $233 and $477 in 2009 and 2008, respectively.
As of December 31, 2009 and 2008, the Company’s long-term investments include $7,710 and $8,410 ($13,550 original cost), respectively, of Jefferson County Alabama Sewer Revenue Refunding Warrants, originally purchased with an insurance-backed AAA rating. This is an auction rate security (ARS) that is classified as an available for sale security. Due to adverse events related to Jefferson County and its bond insurance carrier, Financial Guaranty Insurance Company (FGIC), as well as events in the credit markets, the auctions for this ARS failed throughout 2008 and 2009 (and subsequent to
December 31, 2009). As such, the Company estimated the fair value of this ARS as of December 31, 2009 and 2008 utilizing a valuation model with Level 3 inputs. This valuation model considered, among others items, the credit risk of the collateral underlying the ARS, the credit risk of the bond insurer, interest rates, and the amount and timing of expected future cash flows including assumptions about the market expectation of the next successful auction.
During the prior year fourth quarter of 2008, the Company determined that the market decline in fair value of its Jefferson County ARS became other-than-temporarily impaired, as defined, and recorded a pre-tax impairment of $5,140. During the fourth quarter of 2009, the Company further evaluated this investment and concluded that an additional decline in the market value was temporary because it was not related to further credit impairment and recorded this $700 of additional decline in the market value as a charge to accumulated other comprehensive loss. Notwithstanding, the Company continues to receive all contractual interest payments on its ARS on a timely basis, there has been no default, it is insured by FGIC and the Company has the intent and ability to hold this ARS until recovery of its amortized cost basis.
The Company has classified this ARS as non-current and has included it in long-term investments at December 31, 2009 and 2008 because the Company believes that the current financial conditions of Jefferson County and FGIC, as well as the conditions in the auction rate securities market, may take more than twelve months to resolve. Future evaluations of the fair value of this ARS could also result in additional other-than-temporary classification of declines in market value, and therefore result in additional charges to earnings.
Other income (expenses), net also includes the results of the Company’s trading securities which provide an economic hedge to the Company’s deferred compensation liabilities. The income (expense), on such trading securities was $4,524 and $(7,334) in 2009 and 2008, respectively. Such income or (expense) was substantially offset by a like amount of (expense) or income in aggregate product cost of goods sold and selling, marketing, and administrative expenses in the respective years as discussed above. The 2009 income principally reflects market appreciation in the equity markets in 2009, and the 2008 (expense) principally reflects the market decline in the equity markets in 2008.
The consolidated effective tax rate was 16.7% and 30.6% in 2009 and 2008, respectively. This favorable decrease in the effective tax rate principally reflects the release of Canadian income tax valuation allowances in 2009. Prior to fourth quarter 2009, Canadian income tax valuation allowances were recorded against Canadian deferred tax assets as a result of losses generated in 2009 and prior years. These Canadian income tax losses were principally the result of interest expense deductions for income tax purposes relating to an inter-company financing transaction which was eliminated in the Company’s consolidated financial statements. Because the realization of such prior net operating loss (NOL) carry-forward benefits were not more-likely-than-not, a full valuation allowance was recorded as of December 31, 2008, and through third quarter 2009. In response to the Fifth Protocol to the Canada-U.S. Income Tax Convention (Treaty), during fourth quarter 2009 the Company decided to restructure its Canadian operations effective January 1, 2010. This restructuring eliminated the inter-company financing structure and related interest deduction for Canadian income taxes effective January 1, 2010. Going forward, management now expects its Canadian operation to report taxable income rather than losses for the foreseeable future. Accordingly, management determined that the Canadian NOL carry-forward benefits were more-likely-than-not realizable as of December 31, 2009. As such, the Company reversed approximately $10,700 of valuation allowances as a credit to income tax expense as of December 31, 2009. Management believes that its assessment is based on reasonable assumptions and is in accordance with accounting guidance regarding the release of valuation allowances on deferred tax assets. See also Note 4 to the Consolidated Financial Statements for further discussion. The Treaty also provided for the phase-out of Canadian withholding tax rates for interest and allowed the Company to qualify for the 0% withholding rate effective January 1, 2010, resulting in a current tax benefit of $1,500 in 2009.
Net earnings were $53,475 in 2009 compared to $38,777 in 2008, and earnings per share were $.95 and $.68 in 2009 and 2008, respectively, an increase of $.27 or 40%. Earnings per share did benefit from the reduction in average shares outstanding resulting from common stock purchases in the open market by the Company. Average shares outstanding decreased from 56,799 in 2008 to 56,072 in 2009.
2008 vs. 2007
Net product sales were $492,051 in 2008 compared to $492,742 in 2007, a decrease of $691 or 0.1%. Although 2008 domestic sales increased by 0.5%, the reported consolidated net sales reflect declines in sales outside of the U.S., including the effects of a
stronger dollar, which offset these domestic sales increases.
Product cost of goods sold were $333,314 in 2008 compared to $327,695 in 2007, an increase of $5,619 or 1.7%. This increase reflects a $1,877 decrease in deferred compensation expense principally resulting from the decline in the market value of investments in trading securities relating to compensation deferred in previous years. Adjusting for the aforementioned, product cost of goods sold as a percentage of net sales increased from 64.5% in 2007 to 68.1% in 2008, an increase of 3.6% as a percent of sales. This increase principally reflects significant cost increases in major ingredients, as well as higher labor and fringe benefits, including health insurance benefits, the adverse effects of foreign currency exchange rates on products manufactured in Canada and principally sold in the United States, and generally higher plant energy costs. In 2008, increases in ingredient costs approximated $9,300, however, the Company benefited from an approximate $1,200 decrease in overall packaging material costs. The Company generally experienced significant cost increases in substantially all of its major ingredients, including sugar, corn syrup, vegetable oils, dextrose, cocoa, chocolate and gum base inputs. The adverse impact of changes in Canadian exchange rates as discussed above approximated $900 in 2008.
Due to the seasonal nature of the Company’s business and corresponding variations in product mix, gross margins have historically been lower in the second half of the year, and second half of 2008 and 2007 were consistent with this trend.
Selling, marketing and administrative expenses were $95,254 in 2008 compared to $97,821 in 2007, a decrease of $2,567 or 2.6%. This decrease reflects a $5,457 decrease in deferred compensation expense principally resulting from the decline in the market value of investments in trading securities relating to compensation deferred in previous years. Adjusting for the aforementioned, selling, marketing and administrative expenses increased by $2,890 or 3.0%, and as a percent of net product sales increased from 19.9% of net product sales in 2007 to 20.5% of net product sales in 2008. These expenses include $45,570 and $41,775 of freight, delivery and warehousing and distribution expenses in 2008 and 2007 respectively. Freight, delivery and warehousing and distribution expenses increased from 8.5% of net product sales in 2007 to 9.3% of net product sales in 2008, primarily due to higher energy costs including higher freight fuel surcharges.
Earnings from operations were $66,527 in 2008 compared to $70,852 in 2007, a decrease of $4,325 or 6.1%. Earnings from operations includes changes in deferred compensation liabilities relating to corresponding changes in the market value of trading securities that hedge these liabilities as discussed above. Adjusting for the aforementioned, operating earnings were $59,193 and $72,850 in 2008 and 2007, respectively, a decrease of $13,657 or 18.7%. This decrease principally reflects the decrease in gross profit resulting from higher input costs, principally ingredients and freight and delivery, as discussed above.
Goodwill and indefinite-lived intangible assets are assessed at least annually for impairment as of December 31 or whenever events or circumstances indicate that the carrying values may not be recoverable from future cash flows. No impairments were recorded in either 2008 or 2007
Other income (expense), net, was $(10,618) in 2008 compared to $6,315 in 2007, a decrease of $16,933. This decrease principally reflects a $5,140 write-down to market value of an investment security and $9,332 relating to changes in the fair value of trading securities investments during 2008 used to hedge deferred compensation liabilities, both of which are discussed below.
As of December 31, 2008, the Company’s long-term investments include $8,410 ($13,550 original cost) of Jefferson County Alabama Sewer Revenue Refunding Warrants originally purchased with an AAA rating. As discussed above, the Company estimated the fair value of this ARS utilizing a valuation model with Level 3 inputs. During the fourth quarter 2008, the Company determined that the market decline in fair value of its Jefferson County ARS became other than temporary, as defined, and recorded an after-tax impairment of $3,328 ($5,140 pre-tax charge). Previous to fourth quarter 2008, the Company concluded that the decline in market value was temporary, as defined, and recorded declines in the market value to accumulated other comprehensive income.
Other income (expenses), net includes the results of the Company’s trading securities which hedge the Company’s deferred compensation liabilities. The income (expense) on such trading securities was $(7,334) and $1,998 in 2008 and 2007, respectively; such income or (expense) was substantially offset by a like amount of (expense) or income in aggregate product cost of goods sold and selling, marketing, and administrative expenses in the respective years. The 2008 (expense) of $(7,334) principally reflects the market declines in the equity markets in 2008.
Other income (expense), net also includes the results of the Company’s 50% interest in a Spanish joint venture, accounted for
under the equity method, which was a loss of $(477) in 2008 compared to income of $182 in 2007.
The consolidated effective tax rate was 30.6% and 33.1% in 2008 and 2007, respectively. The decrease in the effective tax rate principally reflects approximately $1,400 of reduction in tax positions resulting from the effective settlement of a state income tax audit, and approximately $700 relating to changes in foreign income tax expense due to the favorable effects of certain tax treaty provisions between the U.S. and Canada. In addition, the 2007 effective tax rate was adversely impacted by $1,040 relating to the adoption of an interpretation of accounting guidance relating to uncertain income tax positions. During 2008 and 2007, the Company recorded $3,218 and $3,145 of valuation allowances, respectively, relating to its Canadian subsidiary tax loss carry-forwards to reduce the future income tax benefits to amounts expected to be realized.
Net earnings were $38,777 in 2008 compared to $51,625 in 2007, and earnings per share were $.68 and $.89 in 2008 and 2007, respectively, a decrease of $.21 or 24%. 2008 results were adversely affected by higher input costs, primarily relating to ingredients and freight and delivery, as well as the items discussed above in other income (expense), net. Earnings per share did benefit from the reduction in average shares outstanding resulting from common stock purchases in the open market by the Company. Average shares outstanding decreased from 58,227 in 2007 to 56,799 in 2008.
The Company has taken actions and implemented programs, including selected price increases as well as cost reduction programs, with the objective of recovering some of these higher input costs. However, these actions have not allowed the Company to recover all of these increases in ingredient and other input costs in 2008.
LIQUIDITY AND CAPITAL RESOURCES
Cash flows from operating activities were $75,281, $57,042 and $90,064 in 2009, 2008 and 2007, respectively. The $18,239 increase in cash flows from operating activities from 2008 to 2009 principally reflects an increase of $14,698 in net income in 2009 compared to 2008, an increase of $13,260 of non-cash pre-tax impairment charges in 2009, changes in deferred income taxes, including the release of $10,700 of Canadian deferred income tax asset valuation allowances, the Company’s 2008 investment in a voluntary employee association trust (VEBA) of $16,050 which is controlled solely by the Company as discussed herein, and changes in other current assets and liabilities, principally inventories and accounts receivable.
As discussed above, during 2009 the Company recorded pre-tax non-cash impairment charges of $14,000 and $4,400 relating to certain trademarks and its 50% owned Spanish joint venture, respectively; and during prior year 2008, the Company recorded a pre-tax non-cash impairment charge of $5,140 relating to its Jefferson County ARS investment.
During 2008, the Company contributed $16,050 to a VEBA trust to fund the estimated future costs of certain employee health, welfare and other benefits. The Company used the funds, as well as investment income in this VEBA trust, to pay the actual cost of such benefits during 2009 and will continue to do so through 2011. At December 31, 2009, the VEBA trust holds $12,678 of aggregate cash, cash equivalents and investments; this asset value is included in prepaid expenses in the Company’s current and other assets.
Cash flows from investing activities reflect capital expenditures of $20,831, $34,355, and $14,767 in 2009, 2008 and 2007, respectively. Capital expenditures in prior year 2008 reflect $12,400 relating to the purchase of real estate that the Company placed into service as a distribution center in 2009. The 2009 and 2008 capital additions include $2,326 and $4,755, respectively, relating to computer systems and related implementation.
The Company had no bank borrowing or repayments in 2007, 2008, or 2009, and had no outstanding bank borrowings as of December 31, 2008 or 2009.
Financing activities include common stock purchases and retirements of $20,723, $21,109, and $27,300 in 2009, 2008 and 2007, respectively. Cash dividends of $17,825, $17,557, and $17,542 were paid in 2009, 2008 and 2007, respectively. The increase in cash dividends each year reflects the annual 3% stock dividend issued in each of these years less the effects of Company Common Stock purchases and retirements.
SIGNIFICANT ACCOUNTING POLICIES AND ESTIMATES
Preparation of the Company’s financial statements involves judgments and estimates due to uncertainties affecting the application of accounting policies, and the likelihood that different amounts would be reported under different conditions or using different assumptions. The Company bases its estimates on historical experience and other assumptions, as discussed herein, that it believes are reasonable. If actual amounts are ultimately different from previous estimates, the revisions are included in the Company’s results of operations for
the period in which the actual amounts become known. The Company’s significant accounting policies are discussed in Note 1 to the Consolidated Financial Statements.
Following is a summary and discussion of the more significant accounting policies which management believes to have a significant impact on the Company’s operating results, financial position, cash flows and footnote disclosure.
Revenue recognition
Revenue, net of applicable provisions for discounts, returns, allowances and certain advertising and promotional costs, is recognized when products are delivered to customers based on a customer purchase order, and collectability is reasonably assured. The accounting for promotional costs is discussed under “Customer incentive programs, advertising and marketing” below.
Provisions for bad debts are recorded as selling, marketing and administrative expenses. Write-offs of bad debts did not exceed 0.05% of net product sales in each of 2009, 2008 and 2007, and accordingly, have not been significant to the Company’s financial position or results of operations.
Intangible assets
The Company’s intangible assets consist primarily of acquired trademarks and related goodwill. In accordance with accounting guidance, goodwill and other indefinite-lived assets are not amortized, but are instead subjected to annual testing for impairment unless certain triggering events or circumstances are noted. The Company performs its annual testing impairment testing as of December 31. The Company may utilize third-party professional valuation firms to assist in the determination of certain intangibles.
The impairment test is performed by comparing the carrying value of the asset with its estimated fair value, which is calculated using estimates, including discounted projected future cash flows. These projected future cash flows are dependent on a number of factors including the execution of business plans, achievement of projected sales, including but not limited to future price increases, projected operating margins, and projected capital expenditures. Such operating results are also dependent upon future ingredient and packaging material costs, exchange rates for products manufactured or sold in foreign countries, operational efficiencies, cost savings initiatives, and competitive factors. Although the majority of the Company’s trademarks relate to well established brands with a long history of consumer acceptance, projected cash flows are inherently uncertain. A change in the assumptions underlying the impairment analysis, including but not limited to a reduction in projected cash flows, the use of a different discount rate to discount future cash flows or a different royalty rate applied to the Company’s trademarks, could cause impairment in the future. See above discussion and Note 12 to the Consolidated Financial Statements regarding the impairment of certain trademarks in 2009.
Customer incentive programs, advertising and marketing
Advertising and marketing costs are recorded in the period to which such costs relate. The Company does not defer the recognition of any amounts on its consolidated balance sheet with respect to such costs. Customer incentives and other promotional costs are recorded at the time of sale based upon incentive program terms and historical utilization statistics, which are generally consistent from year to year.
The liabilities associated with these programs are reviewed quarterly and adjusted if utilization rates differ from management’s original estimates. Such adjustments have not historically been material to the Company’s operating results.
Split dollar officer life insurance
The Company provides split dollar life insurance benefits to certain executive officers and records an asset equal to the cumulative premiums paid. The Company will fully recover these premiums in future years under the terms of the plan. The Company retains a collateral assignment of the cash surrender values and policy death benefits payable to insure recovery of these premiums.
Valuation of long-lived assets
Long-lived assets, primarily property, plant and equipment, and investment in joint ventures accounted for under the equity method are reviewed for impairment as events or changes in business circumstances occur indicating that the carrying value of the asset may not be recoverable. The Company may utilize third-party professional valuation firms as necessary to assist in the determination of the fair value of long-lived assets or investments accounted for under the equity method. The estimated cash flows produced by assets, asset groups, or investments accounted for under the equity method result in an estimated fair value and are compared to the asset carrying value to determine whether impairment exists. Such estimates involve considerable management judgment and are based upon assumptions about expected future operating performance, and cash flows in the case of investments accounted for under the equity method. As a result, actual cash flows could differ from management’s estimates due to changes in business conditions,
operating performance, and economic and competitive conditions. See above discussion and Note 6 regarding the impairment of the Company’s Spanish joint venture recorded in 2009.
Income taxes
Deferred income taxes are recognized for future tax effects of temporary differences between financial and income tax reporting using tax rates in effect for the years in which the differences are expected to reverse. The Company records valuation allowances in situations where the realization of deferred tax assets, including those relating to net operating tax losses, is not more-likely-than-not; and the Company adjusts and releases such valuation allowances when realization becomes more-likely-than-not as defined by accounting guidance. The Company periodically reviews assumptions and estimates of the Company’s probable tax obligations using informed judgment, projections of income and losses, and historical experience.
Valuation of investments
Investments, primarily municipal bonds and mutual funds, are reviewed for impairment at each reporting period by comparing the carrying value or amortized cost to the fair market value. The Company may utilize third-party professional valuation firms as necessary to assist in the determination of the value of investments using a valuation model with Level 3 inputs as defined. In the event that an investment security’s fair value is below carrying value or amortized cost, the Company will record an other-than-temporary impairment or a temporary impairment based on accounting guidance. See above discussion and Note 10 regarding Jefferson County ARS.
Other matters
In the opinion of management, other than contracts for foreign currency forwards and raw materials, including currency and commodity hedges and outstanding purchase orders for packaging, ingredients, supplies, and operational services, all entered into in the ordinary course of business, the Company does not have any significant contractual obligations or future commitments. The Company’s outstanding contractual commitments as of December 31, 2009, all of which are generally normal and generally recurring in nature, are summarized in the chart on page 13.
RECENT ACCOUNTING PRONOUNCEMENTS
In February 2008, the FASB delayed the effective date of guidance for non-financial assets and non-financial liabilities, except for items that are recognized or disclosed at fair value in the financial statements on a recurring basis until fiscal and interim periods beginning after November 15, 2008. The non-financial assets and non-financial liabilities for which the Company has applied the fair value provisions of this guidance include long-lived assets, goodwill and other intangible assets. See Note 10 to the Consolidated Financial Statements.
During the first quarter of 2009, the Company adopted the authoritative guidance for disclosures about derivative instruments and hedging activities. It requires qualitative disclosures about objectives and strategies for using derivatives, quantitative disclosures about fair value amounts of derivative instruments and related gains and losses, and disclosures about credit-risk-related contingent features in derivative agreements. The adoption did not impact the Company’s financial condition, results of operations or cash flow.
In April 2009, the FASB issued guidance on (1) estimating the fair value of an asset or liability when the volume and level of activity for the asset or liability have significantly decreased and (2) identifying transactions that are not orderly. It is effective for interim and annual periods ending after June 15, 2009. The Company’s adoption of the guidance during second quarter 2009 did not have a material impact on the Company’s consolidated financial statements.
In April 2009, the FASB amended the other-than-temporary impairment guidance for debt securities to make the guidance more operational and to improve the presentation and disclosure of other-than-temporary impairments on debt and equity securities. It is effective for interim and annual periods ending after June 15, 2009. The Company’s adoption of the guidance during second quarter 2009 did not have a material impact on the Company’s consolidated financial statements.
In April 2009, the FASB issued guidance which required disclosures about the fair value of financial instruments in interim reporting periods of publicly traded companies as well as in annual financial statements. It is effective for interim periods ending after June 15, 2009. The Company’s adoption of the guidance during second quarter 2009 did not have a material impact on the Company’s consolidated financial statements. See Note 10 to the Consolidated Financial Statements.
In May 2009, the FASB issued guidance which established general standards of accounting for, and disclosure of, events that occur after the balance sheet date but before financial statements are issued. It includes a requirement to disclose the date through which subsequent events were evaluated. See Note 1 to the Consolidated Financial Statements.
In June 2009, the FASB issued guidance which establishes the
FASB Accounting Standards Codification to become the source of authoritative U.S. generally accepted accounting principles to be applied by non-governmental entities. It is effective for interim or annual financial periods ending after September 15, 2009. The Company adopted this guidance during the third quarter of fiscal year 2009.
MARKET RISKS
The Company is exposed to market risks related to commodity prices, interest rates, investments in marketable securities, equity price and foreign exchange.
The Company’s ability to forecast the direction and scope of changes to its major input costs is impacted by significant volatility in crude oil, sugar, corn, soybean and edible oils, cocoa and dairy products markets. The prices of these commodities are influenced by changes in global demand, changes in weather and crop yields, changes in governments’ farm policies, including mandates for bio-fuels and environmental matters, including global warming, and fluctuations in the U.S. dollar relative to dollar-denominated commodities in world markets. The Company believes that its competitors face the same or similar challenges.
In order to address the impact of rising input and other costs, the Company periodically reviews each item in its product portfolio to ascertain if price increases, weight declines (indirect price increases) or other actions may be taken. These reviews include an evaluation of the risk factors relating to market place acceptance of such changes and their potential effect on future sales volumes. In addition, the estimated cost of packaging modifications associated with weight changes is evaluated.
The Company also maintains ongoing cost reduction and productivity improvement programs under which cost savings initiatives are encouraged and progress monitored. The Company is not able to accurately predict the outcome of these cost savings initiatives and their effects on its future results.
Commodity future and foreign currency forward contracts
Commodity price risks relate to ingredients, primarily sugar, cocoa, chocolate, corn syrup, dextrose, soybean and edible oils, milk, whey and gum base ingredients. The Company believes its competitors face similar risks, and the industry has historically adjusted prices to compensate for adverse fluctuations in commodity costs. The Company, as well as competitors in the confectionery industry, have taken actions, including price increases and selective product weight declines (indirect price increases) to mitigate rising input costs for ingredients, energy, freight and delivery. Although management seeks to substantially recover cost increases over the long-term, there is risk that price increases and weight declines cannot be fully passed on to customers and, to the extent they are passed on, they could adversely affect customer and consumer acceptance and resulting sales volume.
The Company utilizes commodity futures contracts and options programs as well as annual supply agreements to hedge and plan for anticipated purchases of certain ingredients, including sugar, in order to mitigate commodity cost fluctuation. The Company also purchases forward foreign exchange contracts to hedge its costs of manufacturing certain products in Canada for sale and distribution in the United States, and periodically does so for purchases of equipment or raw materials from foreign suppliers. Such commodity futures and currency forward contracts are cash flow hedges and are effective as hedges as defined by accounting guidance. The unrealized gains and losses on such contracts are deferred as a component of accumulated other comprehensive loss and are recognized as a component of product cost of goods sold when the related inventory is sold. The Company has elected not to apply hedge accounting to commodity options contracts.
The potential change in fair value of commodity and foreign currency derivative instruments held by the Company at December 31, 2009, assuming a 10% change in the underlying contract price, was $3,018. The analysis only includes commodity and foreign currency derivative instruments and, therefore, does not consider the offsetting effect of changes in the price of the underlying commodity or foreign currency. This amount is not significant compared with the net earnings and shareholders’ equity of the Company.
Interest rates
Interest rate risks primarily relate to the Company’s investments in tax exempt marketable securities, including ARS, with maturities or auction dates of generally up to three years.
The majority of the Company’s investments, which are classified as available for sale, have historically been held until they mature, which limits the Company’s exposure to interest rate fluctuations. The accompanying chart summarizes the maturities of the Company’s investments in debt securities at December 31, 2009.
|
Less than 1 year |
|
$ |
8,607 |
|
|
1 – 2 years |
|
7,858 |
|
|
|
2 – 3 years |
|
10,328 |
|
|
|
Over 3 years |
|
7,710 |
|
|
|
Total |
|
$ |
34,503 |
|
The Company had no outstanding debt at December 31, 2009 or 2008 other than $7,500 in an industrial revenue bond in which interest rates reset each week based on the current market rate. Therefore, the Company does not believe that it has significant interest rate risk with respect to its interest bearing debt.
Investment in marketable securities
As stated above, the Company invests primarily in tax exempt marketable securities, including ARS, with maturities or auction dates generally up to three years. The Company utilizes professional money managers and maintains investment policy guidelines which emphasize quality and liquidity in order to minimize the potential loss exposures that could result in the event of a default or other adverse event, including failed auctions.
However, given events in the municipal bond and ARS markets, including failed auctions, the Company continues to monitor these investments and markets, as well as its investment policies. Nonetheless, the financial markets have been experiencing unprecedented events, and future outcomes are less predictable than in the past.
Equity price
Equity price risk relates to the Company’s investments in mutual funds which are principally used to fund and hedge the Company’s deferred compensation liabilities. At December 31, 2009, the Company has investments in mutual funds, classified as trading securities, of $32,238. Any change in the fair value of these trading securities is completely offset by a corresponding change in the respective hedged deferred compensation liability.
Foreign currency exchange
Foreign currency exchange risk principally relates to the Company’s foreign operations in Canada and Mexico, as well as periodic purchase commitments of machinery and equipment from foreign sources.
Certain of the Company’s Canadian manufacturing costs, including local payroll and plant operations, and a portion of its packaging and ingredients are sourced in Canadian dollars. The Company purchases Canadian forward contracts to receive Canadian dollars at a specified date in the future and uses its Canadian dollar collections on Canadian sales as a partial hedge of its overall Canadian manufacturing obligations sourced in Canadian dollars. The Company also periodically purchases and holds Canadian dollars to facilitate the risk management of these currency changes.
From time to time the Company may use forward foreign exchange contracts and derivative instruments to mitigate its exposure to foreign exchange risks, as well as those related to firm commitments to purchase equipment from foreign vendors. As of December 31, 2009 the Company held foreign exchange forward contracts with a fair value of $3,674.
RISK FACTORS
The Company’s operations and financial results are subject to a number of risks and uncertainties that could adversely affect the Company’s operating results and financial condition. Significant risk factors, without limitations that could impact the Company are the following: (i) significant competitive activity, including advertising, promotional and price competition, and changes in consumer demand for the Company’s products; (ii) fluctuations in the cost and availability of various ingredients and packaging materials; (iii) inherent risks in the marketplace, including uncertainties about trade and consumer acceptance and seasonal events such as Halloween; (iv) the effect of acquisitions on the Company’s results of operations and financial condition; (v) the effect of changes in foreign currencies on the Company’s foreign subsidiaries operating results, and the effect of the fluctuation of the Canadian dollar on products manufactured in
Open Contractual Commitments as of December 31, 2009
|
Payable in |
|
Total |
|
Less than |
|
1 to 3 |
|
3 to 5 |
|
More than |
|
|||||
|
Commodity options |
|
$ |
12,405 |
|
$ |
12,405 |
|
$ |
— |
|
$ |
— |
|
$ |
— |
|
|
Foreign currency hedges |
|
17,772 |
|
14,200 |
|
3,572 |
|
— |
|
— |
|
|||||
|
Purchase obligations |
|
18,340 |
|
18,340 |
|
— |
|
— |
|
— |
|
|||||
|
Interest bearing debt |
|
7,500 |
|
— |
|
— |
|
— |
|
7,500 |
|
|||||
|
Operating leases |
|
3,281 |
|
1,058 |
|
1,139 |
|
723 |
|
361 |
|
|||||
|
Total |
|
$ |
59,298 |
|
$ |
46,003 |
|
$ |
4,711 |
|
$ |
723 |
|
$ |
7,861 |
|
Note: Commodity options and foreign currency hedges reflect the notional amounts. The above amounts exclude deferred income tax liabilities of $44,582, liabilities for uncertain tax positions of $21,101, postretirement health care and life insurance benefits of $16,674 and deferred compensation and other liabilities of $39,839 because the timing of payments relating to these items cannot be reasonably determined.
Canada and marketed and sold in the United States in U.S. dollars; (vi) the Company’s reliance on third party vendors for various goods and services; (vii) the Company’s ability to successfully implement new production processes and lines; (viii) the effect of changes in assumptions, including discount rates, sales growth and profit margins and the capability to pass along higher ingredient and other input costs through price increases, relating to the Company’s impairment testing and analysis of its goodwill and trademarks; (ix) changes in the confectionery marketplace including actions taken by major retailers and customers; (x) customer, consumer and competitor response to marketing programs and price and product weight adjustments, and new products; (xi) dependence on significant customers, including the volume and timing of their purchases, and availability of shelf space; (xii) increases in energy costs, including freight and delivery, that cannot be passed along to customers through increased prices due to competitive reasons; (xiii) any significant labor stoppages, strikes or production interruptions; (xiv) changes in governmental laws and regulations including taxes and tariffs; (xv) the risk that the market value of Company’s investments could decline including being classified as “other-than-temporary” as defined; and (xvi) the potential effects of current and future macroeconomic conditions.
Forward-looking statements
This discussion and certain other sections contain forward-looking statements that are based largely on the Company’s current expectations and are made pursuant to the safe harbor provision of the Private Securities Litigation Reform Act of 1995. Forward-looking statements can be identified by the use of the words such as “anticipated,” “believe,” “expect,” “intend,” “estimate,” “project,” and other words of similar meaning in connection with a discussion of future operating or financial performance and are subject to certain factors, risks, trends and uncertainties that could cause actual results and achievements to differ materially from those expressed in the forward-looking statements. Such factors, risks, trends and uncertainties which in some instances are beyond the Company’s control, including the overall competitive environment in the Company’s industry, changes in assumptions and judgments discussed above under the heading “Significant Accounting Policies and Estimates”, and factors identified and referred to above under the heading “Risk Factors.”
The risk factors identified and referred to above are believed to be significant factors, but not necessarily all of the significant factors that could cause actual results to differ from those expressed in any forward-looking statement. Readers are cautioned not to place undue reliance on such forward-looking statements, which are made only as of the date of this report. The Company undertakes no obligation to update such forward-looking statements.
Management’s
Report on Internal Control Over
Financial Reporting
The management of Tootsie Roll Industries, Inc. is responsible for establishing and maintaining adequate internal control over financial reporting, as such term is defined in the Securities Exchange Act of 1934 (SEC) Rule 13a-15(f). Our management conducted an evaluation of the effectiveness of the Company’s internal control over financial reporting as of December 31, 2009 as required by SEC Rule 13a-15(c). In making this assessment, we used the criteria established in Internal Control—Integrated Framework issued by the Committee of Sponsoring Organizations of the Treadway Commission (the COSO criteria). Based on our evaluation under the COSO criteria, our management concluded that our internal control over financial reporting was effective as of December 31, 2009.
The effectiveness of the Company’s internal control over financial reporting as of December 31, 2009 has been audited by PricewaterhouseCoopers LLP, an independent registered public accounting firm, as stated in their report which appears on page 27.
Tootsie Roll Industries, Inc.
Chicago,
Illinois
March 1, 2010
CONSOLIDATED STATEMENTS OF
Financial Position
|
TOOTSIE ROLL INDUSTRIES, INC. AND SUBSIDIARIES |
|
(in thousands) |
|
Assets
|
|
|
December 31, |
|
||||
|
|
|
2009 |
|
2008 |
|
||
|
CURRENT ASSETS: |
|
|
|
|
|
||
|
Cash and cash equivalents |
|
$ |
90,990 |
|
$ |
68,908 |
|
|
Investments |
|
8,663 |
|
17,963 |
|
||
|
Accounts receivable trade, less allowances of $2,356 and $1,923 |
|
37,512 |
|
31,213 |
|
||
|
Other receivables |
|
8,397 |
|
2,983 |
|
||
|
Inventories: |
|
|
|
|
|
||
|
Finished goods and work-in-process |
|
35,570 |
|
34,862 |
|
||
|
Raw materials and supplies |
|
20,817 |
|
20,722 |
|
||
|
Prepaid expenses |
|
8,562 |
|
11,328 |
|
||
|
Deferred income taxes |
|
1,367 |
|
609 |
|
||
|
Total current assets |
|
211,878 |
|
188,588 |
|
||
|
PROPERTY, PLANT AND EQUIPMENT, at cost: |
|
|
|
|
|
||
|
Land |
|
21,559 |
|
19,307 |
|
||
|
Buildings |
|
102,374 |
|
89,077 |
|
||
|
Machinery and equipment |
|
296,787 |
|
279,100 |
|
||
|
Construction in progress |
|
6,877 |
|
20,701 |
|
||
|
|
|
427,597 |
|
408,185 |
|
||
|
Less—Accumulated depreciation |
|
206,876 |
|
190,557 |
|
||
|
Net property, plant and equipment |
|
220,721 |
|
217,628 |
|
||
|
OTHER ASSETS: |
|
|
|
|
|
||
|
Goodwill |
|
73,237 |
|
73,237 |
|
||
|
Trademarks |
|
175,024 |
|
189,024 |
|
||
|
Investments |
|
58,136 |
|
49,809 |
|
||
|
Split dollar officer life insurance |
|
74,642 |
|
74,808 |
|
||
|
Prepaid expenses |
|
8,068 |
|
10,333 |
|
||
|
Investment in joint venture |
|
4,961 |
|
9,274 |
|
||
|
Deferred income taxes |
|
11,580 |
|
824 |
|
||
|
Total other assets |
|
405,648 |
|
407,309 |
|
||
|
Total assets |
|
$ |
838,247 |
|
$ |
813,525 |
|
(The accompanying notes are an integral part of these statements.)
|
|
|
(in thousands except per share data) |
|
Liabilities and Shareholders’ Equity
|
|
|
December 31, |
|
||||
|
|
|
2009 |
|
2008 |
|
||
|
|
|
|
|
|
|
||
|
CURRENT LIABILITIES: |
|
|
|
|
|
||
|
Accounts payable |
|
$ |
9,140 |
|
$ |
13,885 |
|
|
Dividends payable |
|
4,458 |
|
4,401 |
|
||
|
Accrued liabilities |
|
42,468 |
|
40,335 |
|
||
|
Total current liabilities |
|
56,066 |
|
58,621 |
|
||
|
NONCURRENT LIABILITES: |
|
|
|
|
|
||
|
Deferred income taxes |
|
44,582 |
|
45,410 |
|
||
|
Postretirement health care and life insurance benefits |
|
16,674 |
|
15,468 |
|
||
|
Industrial development bonds |
|
7,500 |
|
7,500 |
|
||
|
Liability for uncertain tax positions |
|
21,101 |
|
19,412 |
|
||
|
Deferred compensation and other liabilities |
|
39,839 |
|
32,344 |
|
||
|
Total noncurrent liabilities |
|
129,696 |
|
120,134 |
|
||
|
SHAREHOLDERS’ EQUITY: |
|
|
|
|
|
||
|
Common
stock, $.69-4/9 par value— |
|
24,862 |
|
24,762 |
|
||
|
Class B
common stock, $.69-4/9 par value— |
|
13,833 |
|
13,442 |
|
||
|
Capital in excess of par value |
|
482,250 |
|
470,927 |
|
||
|
Retained earnings, per accompanying statement |
|
145,928 |
|
142,872 |
|
||
|
Accumulated other comprehensive loss |
|
(12,396 |
) |
(15,241 |
) |
||
|
Treasury stock (at cost)— 67 shares and 65 shares, respectively |
|
(1,992 |
) |
(1,992 |
) |
||
|
Total shareholders’ equity |
|
652,485 |
|
634,770 |
|
||
|
Total liabilities and shareholders’ equity |
|
$ |
838,247 |
|
$ |
813,525 |
|
CONSOLIDATED STATEMENTS OF
Earnings, Comprehensive Earnings and Retained Earnings
|
TOOTSIE ROLL INDUSTRIES, INC. AND SUBSIDIARIES |
|
(in thousands except per share data) |
|
|
|
|
For the year ended December 31, |
|
|||||||
|
|
|
2009 |
|
2008 |
|
2007 |
|
|||
|
|
|
|
|
|
|
|
|
|||
|
Net product sales |
|
$ |
495,592 |
|
$ |
492,051 |
|
$ |
492,742 |
|
|
Rental and royalty revenue |
|
3,739 |
|
3,965 |
|
4,975 |
|
|||
|
Total revenue |
|
499,331 |
|
496,016 |
|
497,717 |
|
|||
|
Product cost of goods sold |
|
318,645 |
|
333,314 |
|
327,695 |
|
|||
|
Rental and royalty cost |
|
852 |
|
921 |
|
1,349 |
|
|||
|
Total costs |
|
319,497 |
|
334,235 |
|
329,044 |
|
|||
|
Product gross margin |
|
176,947 |
|
158,737 |
|
165,047 |
|
|||
|
Rental and royalty gross margin |
|
2,887 |
|
3,044 |
|
3,626 |
|
|||
|
Total gross margin |
|
179,834 |
|
161,781 |
|
168,673 |
|
|||
|
Selling, marketing and administrative expenses |
|
103,755 |
|
95,254 |
|
97,821 |
|
|||
|
Impairment charges |
|
14,000 |
|
— |
|
— |
|
|||
|
Earnings from operations |
|
62,079 |
|
66,527 |
|
70,852 |
|
|||
|
Other income (expense), net |
|
2,100 |
|
(10,618 |
) |
6,315 |
|
|||
|
Earnings before income taxes |
|
64,179 |
|
55,909 |
|
77,167 |
|
|||
|
Provision for income taxes |
|
10,704 |
|
17,132 |
|
25,542 |
|
|||
|
Net earnings |
|
$ |
53,475 |
|
$ |
38,777 |
|
$ |
51,625 |
|
|
|
|
|
|
|
|
|
|
|||
|
Net earnings |
|
$ |
53,475 |
|
$ |
38,777 |
|
$ |
51,625 |
|
|
Other comprehensive earnings (loss) |
|
2,845 |
|
(3,514 |
) |
810 |
|
|||
|
Comprehensive earnings |
|
$ |
56,320 |
|
$ |
35,263 |
|
$ |
52,435 |
|
|
|
|
|
|
|
|
|
|
|||
|
Retained earnings at beginning of year |
|
$ |
142,872 |
|
$ |
156,752 |
|
$ |
169,233 |
|
|
Net earnings |
|
53,475 |
|
38,777 |
|
51,625 |
|
|||
|
Cash dividends |
|
(17,790 |
) |
(17,492 |
) |
(17,421 |
) |
|||
|
Stock dividends |
|
(32,629 |
) |
(35,165 |
) |
(46,685 |
) |
|||
|
Retained earnings at end of year |
|
$ |
145,928 |
|
$ |
142,872 |
|
$ |
156,752 |
|
|
Earnings per share |
|
$ |
0.95 |
|
$ |
0.68 |
|
$ |
0.89 |
|
|
Average Common and Class B Common shares outstanding |
|
56,072 |
|
56,799 |
|
58,227 |
|
|||
(The accompanying notes are an integral part of these statements.)
CONSOLIDATED STATEMENTS OF
Cash Flows
|
TOOTSIE ROLL INDUSTRIES, INC. AND SUBSIDIARIES |
|
(in thousands) |
|
|
|
|
For the year ended December 31, |
|
|||||||
|
|
|
2009 |
|
2008 |
|
2007 |
|
|||
|
CASH FLOWS FROM OPERATING ACTIVITIES: |
|
|
|
|
|
|
|
|||
|
Net earnings |
|
$ |
53,475 |
|
$ |
38,777 |
|
$ |
51,625 |
|
|
Adjustments to reconcile net earnings to net cash provided by operating activities: |
|
|
|
|
|
|
|
|||
|
Depreciation |
|
17,862 |
|
17,036 |
|
15,859 |
|
|||
|
Impairment charges |
|
14,000 |
|
— |
|
— |
|
|||
|
Impairment of equity investment in joint venture |
|
4,400 |
|
— |
|
— |
|
|||
|
Loss from joint venture |
|
233 |
|
477 |
|
— |
|
|||
|
Return on investment in joint venture |
|
— |
|
— |
|
1,419 |
|
|||
|
Other than temporary impairment |
|
— |
|
5,140 |
|
— |
|
|||
|
Amortization of marketable securities |
|
320 |
|
396 |
|
521 |
|
|||
|
Purchase of trading securities |
|
(1,713 |
) |
(491 |
) |
(84 |
) |
|||
|
Changes in operating assets and liabilities: |
|
|
|
|
|
|
|
|||
|
Accounts receivable |
|
(5,899 |
) |
(261 |
) |
2,591 |
|
|||
|
Other receivables |
|
(2,088 |
) |
(33 |
) |
7 |
|
|||
|
Inventories |
|
(675 |
) |
1,352 |
|
6,506 |
|
|||
|
Prepaid expenses and other assets |
|
5,203 |
|
(15,139 |
) |
283 |
|
|||
|
Accounts payable and accrued liabilities |
|
(2,755 |
) |
967 |
|
(3,234 |
) |
|||
|
Income taxes payable and deferred |
|
(11,731 |
) |
8,642 |
|
13,481 |
|
|||
|
Postretirement health care and life insurance benefits |
|
1,028 |
|
3,394 |
|
1,272 |
|
|||
|
Deferred compensation and other liabilities |
|
3,316 |
|
(2,385 |
) |
(12 |
) |
|||
|
Other |
|
305 |
|
(830 |
) |
(170 |
) |
|||
|
Net cash provided by operating activities |
|
75,281 |
|
57,042 |
|
90,064 |
|
|||
|
CASH FLOWS FROM INVESTING ACTIVITIES: |
|
|
|
|
|
|
|
|||
|
Proceeds from sale of real estate and other assets |
|
— |
|
— |
|
434 |
|
|||
|
Return of investment in joint venture |
|
— |
|
— |
|
1,206 |
|
|||
|
Capital expenditures |
|
(20,831 |
) |
(34,355 |
) |
(14,767 |
) |
|||
|
Purchase of available for sale securities |
|
(11,331 |
) |
(33,977 |
) |
(59,132 |
) |
|||
|
Sale and maturity of available for sale securities |
|
17,511 |
|
61,258 |
|
28,914 |
|
|||
|
Net cash used in investing activities |
|
(14,651 |
) |
(7,074 |
) |
(43,345 |
) |
|||
|
CASH FLOWS FROM FINANCING ACTIVITIES: |
|
|
|
|
|
|
|
|||
|
Shares repurchased and retired |
|
(20,723 |
) |
(21,109 |
) |
(27,300 |
) |
|||
|
Dividends paid in cash |
|
(17,825 |
) |
(17,557 |
) |
(17,542 |
) |
|||
|
Net cash used in financing activities |
|
(38,548 |
) |
(38,666 |
) |
(44,842 |
) |
|||
|
Increase in cash and cash equivalents |
|
22,082 |
|
11,302 |
|
1,877 |
|
|||
|
Cash and cash equivalents at beginning of year |
|
68,908 |
|
57,606 |
|
55,729 |
|
|||
|
Cash and cash equivalents at end of year |
|
$ |
90,990 |
|
$ |
68,908 |
|
$ |
57,606 |
|
|
Supplemental cash flow information: |
|
|
|
|
|
|
|
|||
|
Income taxes paid |
|
$ |
22,364 |
|
$ |
12,728 |
|
$ |
11,343 |
|
|
Interest paid |
|
$ |
182 |
|
$ |
252 |
|
$ |
537 |
|
|
Stock dividend issued |
|
$ |
32,538 |
|
$ |
35,042 |
|
$ |
46,520 |
|
(The accompanying notes are an integral part of these statements.)
Notes to Consolidated Financial Statements ($ in thousands except per share data)
TOOTSIE ROLL INDUSTRIES, INC. AND SUBSIDIARIES
NOTE 1—SIGNIFICANT ACCOUNTING POLICIES:
Basis of consolidation:
The consolidated financial statements include the accounts of Tootsie Roll Industries, Inc. and its wholly-owned subsidiaries (the Company), which are primarily engaged in the manufacture and sales of candy products. All significant intercompany transactions have been eliminated.
The preparation of financial statements in conformity with generally accepted accounting principles in the United States of America requires management to make estimates and assumptions that affect the reported amounts of assets and liabilities and disclosure of contingent assets and liabilities at the date of the financial statements and the reported amounts of revenues and expenses during the reporting period. Actual results could differ from those estimates.
Certain reclassifications have been made to the prior year financial statements to conform to the current year presentation.
Revenue recognition:
Products are sold to customers based on accepted purchase orders which include quantity, sales price and other relevant terms of sale. Revenue, net of applicable provisions for discounts, returns, allowances and certain advertising and promotional costs, is recognized when products are delivered to customers and collectability is reasonably assured. Shipping and handling costs of $38,628, $45,570, and $41,775 in 2009, 2008 and 2007, respectively, are included in selling, marketing and administrative expenses. Accounts receivable are unsecured. Revenues from a major customer aggregated approximately 22.9%, 23.5% and 22.4% of net product sales during the years ended December 31, 2009, 2008 and 2007, respectively.
Cash and cash equivalents:
The Company considers temporary cash investments with an original maturity of three months or less to be cash equivalents.
Investments:
Investments consist of various marketable securities with maturities of generally up to three years. The Company classifies debt and equity securities as either available for sale or trading. Available for sale are not actively traded and are carried at fair value. The Company follows current fair value measurement guidance and unrealized gains and losses on these securities are excluded from earnings and are reported as a separate component of shareholders’ equity, net of applicable taxes, until realized. Trading securities relate to deferred compensation arrangements and are carried at fair value. The Company invests in trading securities to economically hedge changes in its deferred compensation liabilities.
The Company regularly reviews its investments to determine whether a decline in fair value below the cost basis is other than temporary. If the decline in fair value is judged to be other than temporary, the cost basis of the security is written down to fair value and the amount of the write-down is included in other income (expense), net. Further information regarding the fair value of the Company’s investments is included in Note 10 to the Consolidated Financial Statements.
Derivative instruments and hedging activities:
During the first quarter of 2009, the Company adopted the new authoritative guidance for disclosures about derivative instruments and hedging activities. This guidance requires qualitative disclosures about objectives and strategies for using derivatives, quantitative disclosures about fair value amounts of derivative instruments and related gains and losses, and disclosures about credit-risk-related contingent features in derivative agreements. The adoption of this standard did not impact the Company’s consolidated financial statements.
From time to time, the Company enters into futures contracts. Commodity futures are intended and are effective as hedges of market price risks associated with the anticipated purchase of certain raw materials (primarily sugar). Foreign currency forward contracts are intended and are effective as hedges of the Company’s exposure to the variability of cash flows, primarily related to the foreign exchange rate changes of products manufactured in Canada and sold in the United States, and periodic equipment purchases from foreign suppliers denominated in a foreign currency. The Company does not engage in trading or other speculative use of derivative instruments.
The Company’s foreign currency forward contracts are accounted for as cash flow hedges and are recorded on the balance sheet at fair value. Changes therein are recorded in accumulated other comprehensive loss, net of tax, and are reclassified to earnings in the periods in which earnings are affected by the hedged item. Realized gains/losses are recorded as foreign exchange gains/losses in other income (expense), net.
As of December 31, 2009, the Company had foreign currency forward contracts outstanding with a notional amount of $17,772 that hedged its exposure to changes in foreign currency exchange rates for its costs of manufacturing certain products in Canada for the U.S. market. The fair value of foreign currency forward contracts, using Level 1 inputs, as discussed in Note 10, resulted in an asset of $3,674 as of December 31, 2009 which is included in other receivables. In entering into these contracts, the Company has assumed the risk that might arise from the possible inability of counterparties to meet the terms of their contracts and does not expect any significant losses from counterparty defaults.
During 2009, the Company recorded $3,365 of net derivative gains in accumulated other comprehensive loss which is a component of shareholders’ equity in the statement of financial position. The Company also recognized a gain of $989, related to foreign currency contracts settled during 2009. At December 31, 2009, the Company expects to reclassify existing net gains of approximately $1,871 from accumulated other comprehensive loss to net earnings during the next twelve months.
As of December 31, 2009, the Company had commodity options contracts with a notional value of $12,405. These options have not been designated as hedges. The fair value of $1,686 is included in other receivables. In 2009 the Company recorded a gain of $1,562 in cost of goods sold.
Inventories:
Inventories are stated at cost, not to exceed market. The cost of substantially all of the Company’s inventories ($53,724 and $53,557 at December 31, 2009 and 2008, respectively) has been determined by the last-in, first-out (LIFO) method. The excess of current cost over LIFO cost of inventories approximates $13,107 and $12,432 at December 31, 2009 and 2008, respectively. The cost of certain foreign inventories ($2,663 and $2,027 at December 31, 2009 and 2008, respectively) has been determined by the first-in, first-out (FIFO) method. Rebates, discounts and other cash consideration received from vendors related to inventory purchases is reflected as a reduction in the cost of the related inventory item, and is therefore reflected in cost of sales when the related inventory item is sold.
Property, plant and equipment:
Depreciation is computed for financial reporting purposes by use of the straight-line method based on useful lives of 20 to 35 years for buildings and 5 to 20 years for machinery and equipment. Depreciation expense was $17,862, $17,036 and $15,859 in 2009, 2008 and 2007, respectively.
Carrying value of long-lived assets:
The Company reviews long-lived assets to determine if there are events or circumstances indicating that the amount of the asset reflected in the Company’s balance sheet may not be recoverable. When such indicators are present, the Company compares the carrying value of the long-lived asset, or asset group, to the future undiscounted cash flows of the underlying assets to determine if an impairment exists. If applicable, an impairment charge would be recorded to write down the carrying value to its fair value. The determination of fair value involves the use of estimates of future cash flows that involve considerable management judgment and are based upon assumptions about expected future operating performance. The actual cash flows could differ from management’s estimates due to changes in business conditions, operating performance, and economic conditions. No impairment charges of long-lived assets were recorded by the Company during 2009, 2008 and 2007.
Postretirement health care and life insurance benefits:
The Company provides certain postretirement health care and life insurance benefits. The cost of these postretirement benefits is accrued during employees’ working careers. The Company also provides split dollar life benefits to certain executive officers. The Company records an asset equal to the cumulative insurance premiums paid that will be recovered upon the death of a covered employee(s) or earlier under the terms of the plan. Split dollar premiums paid were $1,586 in 2007. No premiums were paid in 2009 and 2008.
Goodwill and intangible assets:
In accordance with authoritative guidance, goodwill and intangible assets with indefinite lives are not amortized, but rather tested for impairment at least annually unless certain interim triggering events or circumstances require more frequent testing. All trademarks have been assessed by management to have indefinite lives because they are expected to generate cash flows indefinitely. The Company has completed its annual impairment testing of its goodwill and trademarks at December 31 of each of the years presented. As of December 31, 2009, management ascertained that certain trademarks were impaired, and recorded a pre-tax charge of $14,000. No impairments of intangibles were recorded in 2008 and 2007.
This determination is made by comparing the carrying value of the asset with its estimated fair value, which is calculated using estimates including discounted projected future cash flows. Management believes that all assumptions used for the impairment tests are consistent with those utilized by market participants performing similar valuations.
Income taxes:
Deferred income taxes are recorded and recognized for future tax effects of temporary differences between financial and income tax reporting. The Company records valuation allowances in situations where the realization of deferred tax assets is not more—likely-than-not. Federal income taxes are provided on the portion of income of foreign subsidiaries that is expected to be remitted to the U.S. and become taxable, but not on the portion that is considered to be permanently invested in the foreign subsidiary.
Foreign currency translation:
The U.S. dollar is used as the functional currency where a substantial portion of the subsidiary’s business is indexed to the U.S. dollar or where its manufactured products are principally sold in the U.S. All other foreign subsidiaries use the local currency as their functional currency. Where the U.S. dollar is used as the functional currency, foreign currency remeasurements are recorded as a charge or credit to other income (expense), net in the statement of earnings. Where the foreign local currency is used as the functional currency, translation adjustments are recorded as a separate component of accumulated other comprehensive (loss).
Joint venture:
The Company’s 50% interest in two companies is accounted for using the equity method. The Company records an increase in its investment in the joint venture to the extent of its share of the joint venture’s earnings, and reduces its investment to the extent of losses and dividends received. A dividend of $861 was paid in 2007 by the joint venture. No dividends were paid in 2009 and 2008.
As of December 31, 2009, management determined that the fair value of the asset was less than the carrying value. As a result, the Company recorded a pre-tax impairment charge $4,400 in the fourth quarter 2009, resulting in an adjusted carrying value of $4,961 as of December 31, 2009. The fair value was primarily assessed using the present value of estimated future cash flows.
Comprehensive earnings:
Comprehensive earnings includes net earnings, foreign currency translation adjustments and unrealized gains/losses on commodity and/or foreign currency hedging contracts, available for sale securities and certain postretirement benefit obligations.
Earnings per share:
A dual presentation of basic and diluted earnings per share is not required due to the lack of potentially dilutive securities under the Company’s simple capital structure. Therefore, all earnings per share amounts represent basic earnings per share.
The Class B Common Stock has essentially the same rights as Common Stock, except that each share of Class B Common Stock has ten votes per share (compared to one vote per share of Common Stock), is not traded on any exchange, is restricted as to transfer and is convertible on a share-for-share basis, at any time and at no cost to the holders, into shares of Common Stock which are traded on the New Stock Exchange.
Use of estimates:
The preparation of consolidated financial statements in conformity with accounting principles generally accepted in the U.S. requires management to make estimates and assumptions that affect the amounts reported. Estimates are used when accounting for sales discounts, allowances and incentives, product liabilities, assets recorded at fair value, income taxes, depreciation, amortization, employee benefits, contingencies and intangible asset and liability valuations. For instance, in determining the annual post-employment benefit costs, the Company estimates the cost of future health care benefits. Actual results may or may not differ from those estimates.
Recent accounting pronouncements:
In February 2008, the FASB delayed the effective date of guidance for non-financial assets and non-financial liabilities, except for items that are recognized or disclosed at fair value in the financial statements on a recurring basis until fiscal and interim periods beginning after November 15, 2008. The non-financial assets and non-financial liabilities for which the Company has applied the fair value provisions of this guidance include long lived assets, goodwill and other intangible assets. See Note 10 to the Consolidated Financial Statements.
During the first quarter of 2009 the Company adopted the authoritative guidance for disclosures about derivative instruments and hedging activities. It requires qualitative disclosures about objectives and strategies for using derivatives, quantitative disclosures about fair value amounts of derivative instruments and related gains and losses, and disclosures about credit-risk-related contingent features in derivative agreements. The adoption did not impact the Company’s financial condition, results of operations or cash flow.
In April 2009, the FASB issued guidance on (1) estimating the fair value of an asset or liability when the volume and level of activity for the asset or liability have significantly decreased and
(2) identifying transactions that are not orderly. It is effective for interim and annual periods ending after June 15, 2009. The Company’s adoption of the guidance during second quarter 2009 did not have a material impact on the Company’s consolidated financial statements.
In April 2009, the FASB amended the other-than-temporary impairment guidance for debt securities to make the guidance more operational and to improve the presentation and disclosure of other-than-temporary impairments on debt and equity securities. It is effective for interim and annual periods ending after June 15, 2009. The Company’s adoption of the guidance during second quarter 2009 did not have a material impact on the Company’s consolidated financial statements.
In April 2009, the FASB issued guidance which required disclosures about the fair value of financial instruments in interim reporting periods of publicly traded companies as well as in annual financial statements. It is effective for interim periods ending after June 15, 2009. The Company’s adoption of the guidance during second quarter 2009 did not have a material impact on the Company’s consolidated financial statements. See Note 10 to the Consolidated Financial Statements.
In May 2009, the FASB issued guidance which established general standards of accounting for, and disclosure of, events that occur after the balance sheet date but before financial statements are issued. It includes a requirement to disclose the date through which subsequent events were evaluated. See Note 1 to the Consolidated Financial Statements.
In June 2009, the FASB issued guidance which establishes the FASB Accounting Standards Codification to become the source of authoritative U.S. generally accepted accounting principles to be applied by non-governmental entities. It is effective for interim or annual financial periods ending after September 15, 2009. The Company adopted this guidance during the third quarter of fiscal year 2009.
NOTE 2—ACCRUED LIABILITIES:
Accrued liabilities are comprised of the following:
|
|
|
December 31, |
|
||||
|
|
|
2009 |
|
2008 |
|
||
|
Compensation |
|
$ |
9,254 |
|
$ |
11,028 |
|
|
Other employee benefits |
|
2,309 |
|
2,552 |
|
||
|
Taxes, other than income |
|
1,899 |
|
1,755 |
|
||
|
Advertising and promotions |
|
19,350 |
|
17,345 |
|
||
|
Other |
|
9,656 |
|
7,655 |
|
||
|
|
|
$ |
42,468 |
|
$ |
40,335 |
|
NOTE 3—INDUSTRIAL DEVELOPMENT BONDS:
Industrial development bonds are due in 2027. The average floating interest rate was 0.5% and 2.6% in 2009 and 2008, respectively. See Note 10 to the Consolidated Financial Statements for fair value disclosures.
NOTE 4—INCOME TAXES:
The domestic and foreign components of pretax income are as follows:
|
|
|
2009 |
|
2008 |
|
2007 |
|
|||
|
Domestic |
|
$ |
69,779 |
|
$ |
50,313 |
|
$ |
69,250 |
|
|
Foreign |
|
(5,600 |
) |
5,596 |
|
7,917 |
|
|||
|
|
|
$ |
64,179 |
|
$ |
55,909 |
|
$ |
77,167 |
|
The provision for income taxes is comprised of the following:
|
|
|
2009 |
|
2008 |
|
2007 |
|
|||
|
Current: |
|
|
|
|
|
|
|
|||
|
Federal |
|
$ |
22,239 |
|
$ |
6,856 |
|
$ |
21,785 |
|
|
Foreign |
|
500 |
|
502 |
|
(702 |
) |
|||
|
State |
|
1,665 |
|
355 |
|
737 |
|
|||
|
|
|
24,404 |
|
7,713 |
|
21,820 |
|
|||
|
Deferred: |
|
|
|
|
|
|
|
|||
|
Federal |
|
(23 |
) |
8,733 |
|
2,671 |
|
|||
|
Foreign |
|
(12,987 |
) |
264 |
|
918 |
|
|||
|
State |
|
(690 |
) |
422 |
|
133 |
|
|||
|
|
|
(13,700 |
) |
9,419 |
|
3,722 |
|
|||
|
|
|
$ |
10,704 |
|
$ |
17,132 |
|
$ |
25,542 |
|
Significant components of the Company’s net deferred tax liability at year end were as follows:
|
|
|
December 31, |
|
||||
|
|
|
2009 |
|
2008 |
|
||
|
Deferred tax assets: |
|
|
|
|
|
||
|
Accrued customer promotions |
|
$ |
4,475 |
|
$ |
4,299 |
|
|
Deferred compensation |
|
10,667 |
|
9,788 |
|
||
|
Postretirement benefits |
|
5,983 |
|
5,447 |
|
||
|
Other accrued expenses |
|
5,705 |
|
4,785 |
|
||
|
Foreign subsidiary tax loss carry forward |
|
14,001 |
|
6,068 |
|
||
|
Tax credit carry forward |
|
1,286 |
|
2,540 |
|
||
|
Unrealized capital loss |
|
6,393 |
|
1,799 |
|
||
|
|
|
48,510 |
|
34,726 |
|
||
|
Valuation reserve |
|
(912 |
) |
(8,506 |
) |
||
|
Total deferred tax assets |
|
$ |
47,598 |
|
$ |
26,220 |
|
|
Deferred tax liabilities: |
|
|
|
|
|
||
|
Depreciation |
|
$ |
29,657 |
|
$ |
23,696 |
|
|
Deductible goodwill and trademarks |
|
30,585 |
|
25,292 |
|
||
|
Accrued export company commissions |
|
4,179 |
|
4,313 |
|
||
|
Employee benefit plans |
|
4,437 |
|
5,614 |
|
||
|
Inventory reserves |
|
2,311 |
|
2,463 |
|
||
|
Prepaid insurance |
|
363 |
|
392 |
|
||
|
Accounts receivable |
|
57 |
|
455 |
|
||
|
Deferred gain on sale of real estate |
|
7,644 |
|
7,972 |
|
||
|
Total deferred tax liabilities |
|
$ |
79,233 |
|
$ |
70,197 |
|
|
Net deferred tax liability |
|
$ |
31,635 |
|
$ |
43,977 |
|
At December 31, 2009, the tax benefits of foreign subsidiary tax loss carry forwards expiring by year are as follows: $1,083 in 2014, $2,586 in 2015, $354 in 2026, $619 in 2027, $6,365 in 2028, and $2,994 in 2029.
Also at December 31, 2009, the amounts of the foreign subsidiary tax credit carry forwards expiring by year are as follows: $152 in 2010, $152 in 2011, $152 in 2012, $152 in 2013, $152 in 2014, $152 in 2015, $222 in 2016 and $152 in 2017. A valuation allowance has been established for these carry forward credits to reduce the future income tax benefits to amounts expected to be realized.
The effective income tax rate differs from the statutory rate as follows:
|
|
|
2009 |
|
2008 |
|
2007 |
|
|
U.S. statutory rate |
|
35.0 |
% |
35.0 |
% |
35.0 |
% |
|
State income taxes, net |
|
1.7 |
|
1.0 |
|
0.9 |
|
|
Exempt municipal bond interest |
|
(0.6 |
) |
(1.9 |
) |
(1.4 |
) |
|
Foreign tax rates |
|
(4.8 |
) |
(0.7 |
) |
(1.6 |
) |
|
Release of prior period valuation allowances |
|
(13.1 |
) |
— |
|
— |
|
|
Qualified domestic production activities deduction |
|
(2.0 |
) |
(1.4 |
) |
(1.9 |
) |
|
Tax credits receivable |
|
(0.4 |
) |
(1.3 |
) |
— |
|
|
Reserve for uncertain tax benefits |
|
1.9 |
|
0.6 |
|
1.3 |
|
|
Other, net |
|
(1.0 |
) |
(0.7 |
) |
0.8 |
|
|
Effective income tax rate |
|
16.7 |
% |
30.6 |
% |
33.1 |
% |
In connection with the acquisition in 2004 of Concord Confections, a Canadian subsidiary, the Company established an inter-company financing structure which included a loan from the U.S. parent to the Canadian subsidiary. By December of 2006, significant operating losses had accumulated in Canada and management determined that the realization of the net operating loss carry forward benefits was not more-likely-than-not, and provided a full tax valuation allowance. Consistent with relevant accounting guidance, these benefits continued to be reserved through 2008 and through the third quarter of 2009.
In December of 2008, a new U.S./Canada income tax treaty (Treaty) was ratified which effectively denies certain inter-company interest benefits to the U.S. shareholder of a Canadian company. Accordingly, in December of 2009, the Company decided to recapitalize its Canadian operations effective January 1, 2010. During the fourth quarter of 2009, the Company considered of all the evidence and relevant accounting guidance related to this recapitalization and based on reasonable assumptions, the Company concluded that it was more-likely-than-not that it would realize substantially all of the deferred tax assets related to the Canadian net operating loss carry forward benefits because it is expected that sufficient levels of income will be generated in the foreseeable future. As a result, the Company released $8.4 million of prior period valuation allowances and $2.3 million of allowances that were provided through the first nine months of 2009.
The Treaty also introduced a phase out of the withholding tax on payments from Canada to the U.S. allowing the Company to qualify for a zero percent withholding rate in 2010 if certain requirements of the Treaty were met. On January 4, 2010, the Canadian subsidiary repaid accrued interest to its U.S. parent in a manner consistent with these requirements. As a result, $1.5 million of withholding taxes accrued for 2007 and 2008 and through the third quarter of 2009 were released in the fourth quarter of 2009.
The Company has not provided for U.S. federal or foreign withholding taxes on $5,294 and $3,445 of foreign subsidiaries’ undistributed earnings as of December 31, 2009 and December 31, 2008, respectively, because such earnings are considered to be permanently reinvested. It is not practicable to determine the amount of income taxes that would be payable upon remittance of the undistributed earnings.
The Company adopted the provisions of the authoritative guidance relating to unrecognized tax benefits effective January 1, 2007. The Company recognizes interest and penalties related to unrecognized tax benefits in the provision for income taxes on the Consolidated Statements of Earnings.
At December 31, 2009 and 2008, the Company had unrecognized tax benefits of $16,816 and $15,138, respectively. Included in this balance is $8,819 and $7,727, respectively, of unrecognized tax benefits that, if recognized, would favorably affect the annual effective income tax rate. As of December 31, 2009 and 2008, $4,285 and $4,274, respectively, of interest and penalties were included in the Liability for Uncertain Tax Positions.
A reconciliation of the beginning and ending balances of the total amounts of unrecognized tax benefits is as follows:
|
|
|
2009 |
|
2008 |
|
2007 |
|
|||
|
Unrecognized tax benefits at January 1 |
|
$ |
15,138 |
|
$ |
15,867 |
|
$ |
14,987 |
|
|
Increases in tax positions for the current year |
|
3,414 |
|
1,404 |
|
1,895 |
|
|||
|
Reductions in tax positions for lapse of statute of limitations |
|
(890 |
) |
(1,225 |
) |
(1,015 |
) |
|||
|
Reductions in tax positions for effective settlements |
|
(846 |
) |
(908 |
) |
— |
|
|||
|
Unrecognized tax benefits at December 31 |
|
$ |
16,816 |
|
$ |
15,138 |
|
$ |
15,867 |
|
The Company is subject to taxation in the U.S. and various state and foreign jurisdictions. The Company remains subject to examination by U.S. federal and state and foreign tax authorities for the years 2006 through 2008. With few exceptions, the Company is no longer subject to examinations by tax authorities for the year 2005 and prior.
The Company is not currently subject to a U.S. federal examination. The Company’s Canadian subsidiary is currently subject to examination by the Canada Revenue Agency for tax years 2005 and 2006. The Company is unable to determine the outcome of the examination at this time. In addition, the Company is currently subject to various state tax examinations. One of those state examinations has been effectively settled and the corresponding liability for unrecognized tax benefits has been reduced. Although the Company is unable to determine the ultimate outcome of the ongoing examinations, the Company believes that its liability for uncertain tax positions relating to these jurisdictions for such years is adequate.
Beginning in 2008, statutory income tax rates in Canada will be reduced five percentage points with the final rate reduction coming in 2014. Accordingly, the Company’s Canadian subsidiary has revalued its deferred tax assets and liabilities based on the rate in effect for the year the differences are expected to reverse. Additional deferred tax expense of $1.5 million was recognized during the current period.
NOTE 5—SHARE CAPITAL AND CAPITAL IN EXCESS OF PAR VALUE:
|
|
|
Common Stock |
|
Class B |
|
Treasury Stock |
|
Capital
in |
|
||||||||||
|
|
|
Shares |
|
Amount |
|
Shares |
|
Amount |
|
Shares |
|
Amount |
|
Value |
|
||||
|
|
|
(000’s) |
|
|
|
(000’s) |
|
|
|
(000’s) |
|
|
|
|
|
||||
|
Balance at January 1, 2007 |
|
35,364 |
|
$ |
24,558 |
|
18,390 |
|
$ |
12,771 |
|
(62 |
) |
$ |
(1,992 |
) |
$ |
438,648 |
|
|
Issuance of 3% stock dividend |
|
1,056 |
|
733 |
|
550 |
|
383 |
|
(1 |
) |
— |
|
45,404 |
|
||||
|
Conversion of Class B common shares to common shares |
|
48 |
|
34 |
|
(48 |
) |
(34 |
) |
— |
|
— |
|
— |
|
||||
|
Purchase and retirement of common shares |
|
(1,064 |
) |
(739 |
) |
— |
|
— |
|
— |
|
— |
|
(26,561 |
) |
||||
|
Balance at December 31, 2007 |
|
35,404 |
|
24,586 |
|
18,892 |
|
13,120 |
|
(63 |
) |
(1,992 |
) |
457,491 |
|
||||
|
Issuance of 3% stock dividend |
|
1,043 |
|
724 |
|
565 |
|
391 |
|
(2 |
) |
— |
|
33,927 |
|
||||
|
Conversion of Class B common shares to common shares |
|
100 |
|
69 |
|
(100 |
) |
(69 |
) |
— |
|
— |
|
— |
|
||||
|
Purchase and retirement of common shares |
|
(889 |
) |
(617 |
) |
— |
|
— |
|
— |
|
— |
|
(20,491 |
) |
||||
|
Balance at December 31, 2008 |
|
35,658 |
|
24,762 |
|
19,357 |
|
13,442 |
|
(65 |
) |
(1,992 |
) |
470,927 |
|
||||
|
Issuance of 3% stock dividend |
|
1,064 |
|
739 |
|
580 |
|
403 |
|
(2 |
) |
— |
|
31,396 |
|
||||
|
Conversion of Class B common shares to common shares |
|
18 |
|
12 |
|
(18 |
) |
(12 |
) |
— |
|
— |
|
— |
|
||||
|
Purchase and retirement of common shares |
|
(938 |
) |
(651 |
) |
— |
|
— |
|
— |
|
— |
|
(20,073 |
) |
||||
|
Balance at December 31, 2009 |
|
35,802 |
|
$ |
24,862 |
|
19,919 |
|
$ |
13,833 |
|
(67 |
) |
$ |
(1,992 |
) |
$ |
482,250 |
|
Average shares outstanding and all per share amounts included in the financial statements and notes thereto have been adjusted retroactively to reflect annual three percent stock dividends.
While the company does not have a formal or publicly announced stock repurchase program, the Company’s board of directors periodically authorizes a dollar amount for share repurchases.
Based upon this policy, shares were purchased and retired as follows:
|
Year |
|
Total Number of Shares |
|
Average Price Paid Per Share |
|
|
|
2009 |
|
938 |
|
$ |
22.05 |
|
|
2008 |
|
889 |
|
$ |
23.71 |
|
|
2007 |
|
1,064 |
|
$ |
25.61 |
|
NOTE 6—OTHER INCOME (EXPENSE), NET:
Other income (expense), net is comprised of the following:
|
|
|
2009 |
|
2008 |
|
2007 |
|
|||
|
Interest and dividend income |
|
$ |
1,439 |
|
$ |
3,451 |
|
$ |
3,497 |
|
|
Gains (losses) on trading securities relating to deferred compensation plans |
|
4,524 |
|
(7,334 |
) |
1,998 |
|
|||
|
Interest expense |
|
(243 |
) |
(378 |
) |
(535 |
) |
|||
|
Impairment of equity investment in joint venture |
|
(4,400 |
) |
— |
|
— |
|
|||
|
Joint venture income (loss) |
|
(233 |
) |
(477 |
) |
182 |
|
|||
|
Foreign exchange gains (losses) |
|
951 |
|
(963 |
) |
656 |
|
|||
|
Other than temporary impairment |
|
— |
|
(5,140 |
) |
— |
|
|||
|
Capital gains (losses) |
|
(38 |
) |
88 |
|
228 |
|
|||
|
Insurance recovery |
|
— |
|
— |
|
128 |
|
|||
|
Miscellaneous, net |
|
100 |
|
135 |
|
161 |
|
|||
|
|
|
$ |
2,100 |
|
$ |
(10,618 |
) |
$ |
6,315 |
|
As of December 31, 2009, management determined that the carrying value of an equity investment in a joint venture was impaired as a result of accumulated losses from operations and review of future expectations. The Company recorded a pre-tax impairment charge of $4,400 resulting in an adjusted carrying value of $4,961 as of December 31, 2009. The fair value was primarily assessed using the present value of estimated future cash flows.
NOTE 7—EMPLOYEE BENEFIT PLANS:
Pension plans:
The Company sponsors defined contribution pension plans covering certain non-union employees with over one year of credited service. The Company’s policy is to fund pension costs accrued based on compensation levels. Total pension expense for 2009, 2008 and 2007 approximated $4,178, $3,944 and $3,589, respectively. The Company also maintains certain profit sharing and retirement savings-investment plans. Company contributions in 2009, 2008 and 2007 to these plans were $1,011, $1,003 and $873, respectively.
The Company also contributes to multi-employer defined benefit pension plans for its union employees. Such contributions aggregated $1,633, $1,392 and $1,257 in 2009, 2008 and 2007, respectively. Although the Company has been advised that the plan is currently in an underfunded status, the relative position of each employer associated with the multi-employer plan with respect to the actuarial present value of benefits and net plan assets is not determinable by the Company.
Deferred compensation:
The Company sponsors three deferred compensation plans for selected executives and other employees: (i) the Excess Benefit Plan, which restores retirement benefits lost due to IRS limitations on contributions to tax-qualified plans, (ii) the Supplemental Plan, which allows eligible employees to defer the receipt of eligible compensation until designated future dates and (iii) the Career Achievement Plan, which provides a deferred annual incentive award to selected executives. Participants in these plans earn a return on amounts due them based on several investment options, which mirror returns on underlying investments (primarily mutual funds). The Company economically hedges its obligations under the plans by investing in the actual underlying investments. These investments are classified as trading securities and are carried at fair value. At December 31, 2009 and 2008, these investments totaled $32,238 and $26,001, respectively. All gains and losses in these investments, which are recorded in other income (expense), net, are equally offset by corresponding increases and decreases in the Company’s deferred compensation liabilities. The Company recorded a gain of $4,524 in 2009 and a loss of $7,334 in 2008 on these investments.
Postretirement health care and life insurance benefit plans:
The Company provides certain postretirement health care and life insurance benefits for corporate office and management employees. Employees become eligible for these benefits based upon their age, service and date of hire and if they agree to contribute a portion of the cost. The Company has the right to modify or terminate these benefits. The Company does not fund postretirement health care and life insurance benefits in advance of payments for benefit claims.
Amounts recognized in accumulated other comprehensive loss (pre-tax) at December 31, 2009 are as follows:
|
Prior service credit |
|
$ |
(877 |
) |
|
Net actuarial loss |
|
2,523 |
|
|
|
Net amount recognized in accumulated other comprehensive loss |
|
$ |
1,646 |
|
The estimated actuarial loss and prior service credit to be amortized from accumulated other comprehensive income into net periodic benefit cost during 2010 are $253 and $(125), respectively.
The changes in the accumulated postretirement benefit obligation at December 31, 2009 and 2008 consist of the following:
|
|
|
December 31 |
|
||||
|
|
|
2009 |
|
2008 |
|
||
|
Benefit obligation, beginning of year |
|
$ |
15,468 |
|
$ |
13,214 |
|
|
Service cost |
|
704 |
|
646 |
|
||
|
Interest cost |
|
853 |
|
740 |
|
||
|
Actuarial (gain)/loss |
|
(38 |
) |
1,172 |
|
||
|
Benefits paid |
|
(313 |
) |
(304 |
) |
||
|
Benefit obligation, end of year |
|
$ |
16,674 |
|
$ |
15,468 |
|
Net periodic postretirement benefit cost included the following components:
|
|
|
2009 |
|
2008 |
|
2007 |
|
|||
|
Service cost—benefits attributed to service during the period |
|
$ |
704 |
|
$ |
646 |
|
$ |
667 |
|
|
Interest cost on the accumulated postretirement benefit obligation |
|
853 |
|
740 |
|
694 |
|
|||
|
Net amortization |
|
140 |
|
33 |
|
90 |
|
|||
|
Net periodic postretirement benefit cost |
|
$ |
1,697 |
|
$ |
1,419 |
|
$ |
1,451 |
|
For measurement purposes, the 2010 annual rate of increase in the per capita cost of covered health care benefits was assumed to be 6.0% for pre-age 65 retirees, 7.5% for post 65 retirees and 9.0% for prescription drugs; these rates were assumed to decrease gradually to 5.0% for 2014 and remain at that level thereafter. The health care cost trend rate assumption has a significant effect on the amounts reported. The weighted-average discount rate used in determining the accumulated postretirement benefit obligation was 5.84% and 5.6% at December 31, 2009 and 2008, respectively.
Increasing or decreasing the health care trend rates by one percentage point in each year would have the following effect:
|
|
|
1% Increase |
|
1% Decrease |
|
||
|
Postretirement benefit obligation |
|
$ |
2,337 |
|
$ |
(1,930 |
) |
|
Total of service and interest cost components |
|
$ |
258 |
|
$ |
(209 |
) |
The company estimates future benefit payments will be $539, $584, $693, $782 and $911 in 2010 through 2014, respectively, and a total of $5,976 in 2015 through 2019. The future benefit payments are net of the annual Medicare Part D subsidy of approximately $1,062 beginning in 2010.
NOTE 8—COMMITMENTS:
Rental expense aggregated $1,180, $1,311 and $1,090 in 2009, 2008 and 2007, respectively.
Future operating lease commitments are not significant.
NOTE 9—SEGMENT AND GEOGRAPHIC INFORMATION:
The Company operates as a single reportable segment encompassing the manufacture and sale of confectionery products. Its principal manufacturing operations are located in the United States and Canada, and its principal market is the United States. The company also manufactures and sells confectionery products in Mexico, and exports products to Canada and other countries worldwide.
The following geographic data include net product sales summarized on the basis of the customer location and long-lived assets based on their physical location.
|
|
|
2009 |
|
2008 |
|
2007 |
|
|||
|
Net product sales: |
|
|
|
|
|
|
|
|||
|
United States |
|
$ |
455,517 |
|
$ |
448,268 |
|
$ |
445,820 |
|
|
Foreign |
|
40,075 |
|
43,783 |
|
46,922 |
|
|||
|
|
|
$ |
495,592 |
|
$ |
492,051 |
|
$ |
492,742 |
|
|
Long-lived assets: |
|
|
|
|
|
|
|
|||
|
United States |
|
$ |
176,044 |
|
$ |
172,299 |
|
$ |
155,340 |
|
|
Foreign |
|
44,677 |
|
45,329 |
|
46,061 |
|
|||
|
|
|
$ |
220,721 |
|
$ |
217,628 |
|
$ |
201,401 |
|
NOTE 10—FAIR VALUE MEASUREMENTS:
Current accounting guidance defines fair value as the price that would be received in the sale of an asset or paid to transfer a liability in an orderly transaction between market participants at the measurement date. Guidance requires disclosure of the extent to which fair value is used to measure financial assets and liabilities, the inputs utilized in calculating valuation measurements, and the effect of the measurement of significant unobservable inputs on earnings, or changes in net assets, as of the measurement date. Guidance establishes a three-level valuation hierarchy based upon the transparency of inputs utilized in the measurement and valuation of financial assets or liabilities as of the measurement date. Level 1 inputs include quoted prices for identical instruments and are the most observable. Level 2 inputs include quoted prices for similar assets and observable inputs such as interest rates, foreign currency exchange rates, commodity rates and yield curves. Level 3 inputs are not observable in the market and include management’s own judgments about the assumptions market participants would use in pricing the asset or liability. The use of observable and unobservable inputs is reflected in the hierarchy assessment disclosed in the table below.
As of December 31, 2009 and 2008, the Company held certain financial assets that are required to be measured at fair value on a recurring basis. These included derivative hedging instruments related to the foreign currency forward contracts and purchase of certain raw materials, investments in trading securities and available for sale securities, including an auction rate security (ARS). The Company’s available for sale and trading securities principally consist of municipal bonds and mutual funds that are publicly traded.
The following tables present information about the Company’s financial assets measured at fair value as of December 31, 2009 and 2008, and indicate the fair value hierarchy and the valuation techniques utilized by the Company to determine such fair value:
|
|
|
Estimated Fair Value December 31, 2009 |
|
||||||||||
|
|
|
Total |
|
Input Levels Used |
|
||||||||
|
|
|
Fair Value |
|
Level 1 |
|
Level 2 |
|
Level 3 |
|
||||
|
Cash and equivalents |
|
$ |
90,990 |
|
$ |
90,990 |
|
$ |
— |
|
$ |
— |
|
|
Auction rate security (ARS) |
|
7,710 |
|
— |
|
— |
|
7,710 |
|
||||
|
Available-for-sale securities, excluding ARS |
|
26,851 |
|
— |
|
26,851 |
|
— |
|
||||
|
Foreign currency forward contracts |
|
3,674 |
|
3,674 |
|
— |
|
— |
|
||||
|
Commodity option contracts |
|
1,686 |
|
1,686 |
|
— |
|
— |
|
||||
|
Trading securities |
|
32,238 |
|
32,238 |
|
— |
|
— |
|
||||
|
Total assets measured at fair value |
|
$ |
163,149 |
|
$ |
128,588 |
|
$ |
26,851 |
|
$ |
7,710 |
|
|
|
|
Estimated Fair Value December 31, 2008 |
|
||||||||||
|
|
|
Total |
|
Input Levels Used |
|
||||||||
|
|
|
Fair Value |
|
Level 1 |
|
Level 2 |
|
Level 3 |
|
||||
|
Cash and equivalents |
|
$ |
68,908 |
|
$ |
68,908 |
|
$ |
— |
|
$ |
— |
|
|
Auction rate security (ARS) |
|
8,410 |
|
— |
|
— |
|
8,410 |
|
||||
|
Available-for-sale securities excluding ARS |
|
33,361 |
|
— |
|
33,361 |
|
— |
|
||||
|
Foreign currency forward contracts |
|
349 |
|
349 |
|
— |
|
— |
|
||||
|
Trading securities |
|
26,001 |
|
26,001 |
|
— |
|
— |
|
||||
|
Total assets measured at fair value |
|
$ |
137,029 |
|
$ |
95,258 |
|
$ |
33,361 |
|
$ |
8,410 |
|
Available for sale securities which utilize Level 2 inputs consist primarily of municipal bonds, which are valued based on quoted market prices or alternative pricing sources with reasonable levels of price transparency.
A summary of the aggregate fair value, gross unrealized gains, gross unrealized losses, realized losses and amortized cost basis of the Company’s investment portfolio by major security type is as follows:
|
|
|
December 31, 2009 |
|
|||||||||||||
|
|
|
Amortized |
|
Fair |
|
Unrealized |
|
Realized |
|
|||||||
|
Available for Sale: |
|
Cost |
|
Value |
|
Gains |
|
Losses |
|
Losses |
|
|||||
|
Auction rate security (ARS) |
|
$ |
8,410 |
|
$ |
7,710 |
|
$ |
— |
|
$ |
(700 |
) |
$ |
— |
|
|
Municipal bonds |
|
26,502 |
|
26,793 |
|
291 |
|
— |
|
— |
|
|||||
|
Mutual funds |
|
56 |
|
58 |
|
2 |
|
— |
|
— |
|
|||||
|
|
|
$ |
34,968 |
|
$ |
34,561 |
|
$ |
293 |
|
$ |
(700 |
) |
$ |
— |
|
|
|
|
December 31, 2008 |
|
|||||||||||||
|
|
|
Amortized |
|
Fair |
|
Unrealized |
|
Realized |
|
|||||||
|
Available for Sale: |
|
Cost |
|
Value |
|
Gains |
|
Losses |
|
Losses |
|
|||||
|
Auction rate security (ARS) |
|
$ |
13,550 |
|
$ |
8,410 |
|
$ |
— |
|
$ |
— |
|
$ |
(5,140 |
) |
|
Municipal bonds |
|
33,003 |
|
33,303 |
|
300 |
|
— |
|
— |
|
|||||
|
Mutual funds |
|
56 |
|
58 |
|
2 |
|
— |
|
— |
|
|||||
|
|
|
$ |
46,609 |
|
$ |
41,771 |
|
$ |
302 |
|
$ |
— |
|
$ |
(5,140 |
) |
As of December 31, 2008, the Company’s long-term investments included an auction rate security (ARS),Jefferson County Alabama Sewer Revenue Refunding Warrants, reported at a fair value of $8,410, after reflecting a $5,140 other-than-temporary impairment against its $13,550 par value. This other-than-temporary impairment was recorded in other income (expense), net in 2008. As of December 31, 2008, this ARS was determined to be other-than-temporarily impaired due to the duration and severity of the decline in fair value. An other-than-temporary impairment must be recorded when a credit loss exists; that is when the present value of the expected cash flows from a debt security is less than the amortized cost basis of the security. The Company determined the 2008 loss to be 100% related to credit loss. The Company estimated the fair value of this ARS utilizing a valuation model with Level 3 inputs as of December 31, 2008. This valuation model considered, among other items, the credit risk of the collateral underlying the ARS, the credit risk of the bond insurer, interest rates, and the amount and timing of expected future cash flows including the Company’s assumption about the market expectation of the next successful auction. During the fourth quarter of 2009, the Company further evaluated this investment and concluded that an additional decline in the fair market value was temporary, as defined, and recorded $700 of such additional decline in the fair market value as a charge to accumulated other comprehensive loss. The impairment recorded in 2009 is considered temporary as it relates to liquidity and timing of cash flows and does not represent further credit loss.
The Company classified this ARS as non-current and has included it in long-term investments on the Consolidated Statements of Financial Position at December 31, 2009 and 2008, because the Company believes that the current condition of the ARS market may take more than twelve months to improve and the Company has the ability and intent to hold the security for the foreseeable future.
Based on market conditions, the Company changed its valuation methodology for the ARS to a discounted cash flow analysis during the first quarter of 2008. Accordingly, these securities changed from Level 2 to Level 3 within the accounting guidance hierarchy.
The following tables present additional information about the Company’s financial instruments (all ARS) measured at fair value on a recurring basis using Level 3 inputs at December 31, 2009 and 2008:
|
|
|
2009 |
|
2008 |
|
||
|
Balance at January 1 |
|
$ |
8,410 |
|
$ |
— |
|
|
Transfers to Level 3 |
|
— |
|
27,250 |
|
||
|
Other-than-temporary impairment loss recognized in earnings |
|
— |
|
(5,140 |
) |
||
|
Unrealized loss recognized in other comprehensive loss |
|
(700 |
) |
— |
|
||
|
Sales, net |
|
— |
|
(13,700 |
) |
||
|
Balance at December 31 |
|
$ |
7,710 |
|
$ |
8,410 |
|
The $7,500 carrying amount of the Company’s industrial revenue development bonds at December 31, 2009 and 2008 approximates its estimated fair value as the bonds have a floating interest rate.
In addition to assets and liabilities that are recorded at fair value on a recurring basis, guidance requires the Company to record assets and liabilities at fair value on a nonrecurring basis generally as a result of impairment charges. Assets measured at fair value on a nonrecurring basis during 2009 are summarized below:
|
|
|
Twelve Months Ended December 31, 2009 |
|
||||||||||||||||
|
|
|
Pre-Impairment |
|
2009 |
|
|
|
Level Used to Determine |
|
||||||||||
|
|
|
Cost |
|
Impairment |
|
New Cost |
|
New Cost Basis |
|
||||||||||
|
|
|
Basis |
|
Charge |
|
Basis |
|
Level 1 |
|
Level 2 |
|
Level 3 |
|
||||||
|
Investment in joint venture |
|
$ |
9,361 |
|
$ |
4,400 |
|
$ |
4,961 |
|
$ |
— |
|
$ |
— |
|
$ |
4,961 |
|
|
Trademarks |
|
189,024 |
|
14,000 |
|
175,024 |
|
— |
|
— |
|
175,024 |
|
||||||
|
Total |
|
$ |
198,385 |
|
$ |
18,400 |
|
$ |
179,985 |
|
$ |
— |
|
$ |
— |
|
$ |
179,985 |
|
As discussed in Note 6, during the fourth quarter of 2009 the Company recognized an impairment of $4,400 in an equity method investment based on Level 3 inputs.
As discussed in Note 12, during the fourth quarter of 2009 the Company recognized a trademark impairment of $14,000 based on Level 3 inputs.
NOTE 11—COMPREHENSIVE EARNINGS (LOSS):
The following table sets forth information with respect to accumulated other comprehensive earnings (loss):
|
|
|
Foreign |
|
Unrealized Gain (Loss) on |
|
Accumulated |
|
|||||||||
|
|
|
Currency |
|
Investments |
|
Derivatives |
|
Postretirement |
|
Other |
|
|||||
|
Balance at January 1, 2007 |
|
$ |
(11,224 |
) |
$ |
(149 |
) |
$ |
(271 |
) |
$ |
(893 |
) |
$ |
(12,537 |
) |
|
Unrealized gains (losses) |
|
(272 |
) |
469 |
|
(462 |
) |
588 |
|
323 |
|
|||||
|
(Gains) losses reclassified to net earnings |
|
— |
|
(61 |
) |
1,202 |
|
— |
|
1,141 |
|
|||||
|
Tax effect |
|
— |
|
(151 |
) |
(273 |
) |
(230 |
) |
(654 |
) |
|||||
|
Net of tax amount |
|
(272 |
) |
257 |
|
467 |
|
358 |
|
810 |
|
|||||
|
Balance at December 31, 2007 |
|
(11,496 |
) |
108 |
|
196 |
|
(535 |
) |
(11,727 |
) |
|||||
|
Unrealized gains (losses) |
|
(2,296 |
) |
(4,923 |
) |
504 |
|
(1,484 |
) |
(8,199 |
) |
|||||
|
(Gains) losses reclassified to net earnings |
|
— |
|
5,055 |
|
(467 |
) |
— |
|
4,588 |
|
|||||
|
Tax effect |
|
(500 |
) |
(49 |
) |
(13 |
) |
659 |
|
97 |
|
|||||
|
Net of tax amount |
|
(2,796 |
) |
83 |
|
24 |
|
(825 |
) |
(3,514 |
) |
|||||
|
Balance at December 31, 2008 |
|
(14,292 |
) |
191 |
|
220 |
|
(1,360 |
) |
(15,241 |
) |
|||||
|
Unrealized gains (losses) |
|
1,183 |
|
(709 |
) |
4,341 |
|
109 |
|
4,924 |
|
|||||
|
(Gains) losses reclassified to net earnings |
|
— |
|
— |
|
(1,015 |
) |
— |
|
(1,015 |
) |
|||||
|
Tax effect |
|
(118 |
) |
263 |
|
(1,232 |
) |
23 |
|
(1,064 |
) |
|||||
|
Net of tax amount |
|
1,065 |
|
(446 |
) |
2,094 |
|
132 |
|
2,845 |
|
|||||
|
Balance at December 31, 2009 |
|
$ |
(13,227 |
) |
$ |
(255 |
) |
$ |
2,314 |
|
$ |
(1,228 |
) |
$ |
(12,396 |
) |
NOTE 12—GOODWILL AND INTANGIBLE ASSETS:
All of the Company’s intangible indefinite-lived assets are trademarks.
As of December 31, 2009, management ascertained certain trademarks were impaired, and recorded a pre-tax charge of $14,000. The principal driver of this impairment charge was an increase in the discount rate required by market participants. The fair value of indefinite-lived intangible assets was primarily assessed using the present value of estimated future cash flows. No impairments of intangibles were recorded in 2008.
The changes in the carrying amount of trademarks for 2009 and 2008 were as follows:
|
|
|
2009 |
|
2008 |
|
||
|
Original cost |
|
$ |
193,767 |
|
$ |
193,767 |
|
|
Accumulated impairment losses as of January 1 |
|
(4,743 |
) |
(4,743 |
) |
||
|
Balance at January 1 |
|
$ |
189,024 |
|
$ |
189,024 |
|
|
Current year impairment losses |
|
(14,000 |
) |
— |
|
||
|
Balance at December 31 |
|
$ |
175,024 |
|
$ |
189,024 |
|
|
Accumulated impairment losses as of December 31 |
|
$ |
(18,743 |
) |
$ |
(4,743 |
) |
The Company has no accumulated impairment losses of goodwill.
Performance Graph
The following performance graph compares the Company’s cumulative total shareholder return on the Company’s Common Stock for a five-year period (December 31, 2004 to December 31, 2009) with the cumulative total return of Standard & Poor’s 500 Stock Index (“S&P 500”) and the Dow Jones Industry Food Index (“Peer Group,” which includes the Company), assuming (i) $100 invested on December 31 of the first year of the chart in each of the Company’s Common Stock, S&P 500 and the Dow Jones Industry Food Index and (ii) the reinvestment of dividends.
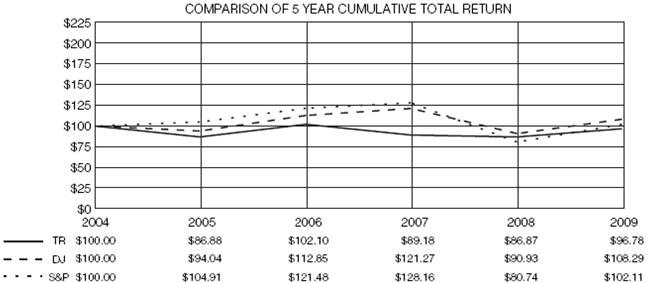
Report of Independent Registered Public Accounting Firm
To the Board of Directors and Shareholders of Tootsie Roll Industries, Inc.:
In our opinion, the accompanying consolidated statements of financial position and the related consolidated statements of earnings, comprehensive earnings and retained earnings, and of cash flows present fairly, in all material respects, the financial position of Tootsie Roll Industries, Inc. and its subsidiaries at December 31, 2009 and December 31, 2008, and the results of their operations and their cash flows for each of the three years in the period ended December 31, 2009 in conformity with accounting principles generally accepted in the United States of America. Also in our opinion, the Company maintained, in all material respects, effective internal control over financial reporting as of December 31, 2009, based on criteria established in Internal Control—Integrated Framework issued by the Committee of Sponsoring Organizations of the Treadway Commission (COSO). The Company’s management is responsible for these financial statements and financial statement schedules, for maintaining effective internal control over financial reporting and for its assessment of the effectiveness of internal control over financial reporting, included in Management’s Report on Internal Control over Financial Reporting on page 14 of the 2009 Annual Report to Shareholders. Our responsibility is to express opinions on these financial statements and on the Company’s internal control over financial reporting based on our integrated audits. We conducted our audits in accordance with the standards of the Public Company Accounting Oversight Board (United States). Those standards require that we plan and perform the audits to obtain reasonable assurance about whether the financial statements are free of material misstatement and whether effective internal control over financial reporting was maintained in all material respects. Our audits of the financial statements included examining, on a test basis, evidence supporting the amounts and disclosures in the financial statements, assessing the accounting principles used and significant estimates made by management, and evaluating the overall financial statement presentation. Our audit of internal control over financial reporting included obtaining an understanding of internal control over financial reporting, assessing the risk that a material weakness exists, and testing and evaluating the design and operating effectiveness of internal control based on the assessed risk. Our audits also included performing such other procedures as we considered necessary in the circumstances. We believe that our audits provide a reasonable basis for our opinions.
A company’s internal control over financial reporting is a process designed to provide reasonable assurance regarding the reliability of financial reporting and the preparation of financial statements for external purposes in accordance with generally accepted accounting principles. A company’s internal control over financial reporting includes those policies and procedures that (i) pertain to the maintenance of records that, in reasonable detail, accurately and fairly reflect the transactions and dispositions of the assets of the company; (ii) provide reasonable assurance that transactions are recorded as necessary to permit preparation of financial statements in accordance with generally accepted accounting principles, and that receipts and expenditures of the company are being made only in accordance with authorizations of management and directors of the company; and (iii) provide reasonable assurance regarding prevention or timely detection of unauthorized acquisition, use, or disposition of the company’s assets that could have a material effect on the financial statements.
Because of its inherent limitations, internal control over financial reporting may not prevent or detect misstatements. Also, projections of any evaluation of effectiveness to future periods are subject to the risk that controls may become inadequate because of changes in conditions, or that the degree of compliance with the policies or procedures may deteriorate.

Chicago, IL
March 1, 2010
Quarterly Financial Data (Unaudited)
TOOTSIE ROLL INDUSTRIES, INC. AND SUBSIDIARIES
|
|
|
(Thousands of dollars except per share data) |
|
|||||||||||||
|
2009 |
|
First |
|
Second |
|
Third |
|
Fourth |
|
Total |
|
|||||
|
Net product sales |
|
$ |
94,054 |
|
$ |
107,812 |
|
$ |
183,408 |
|
$ |
110,318 |
|
$ |
495,592 |
|
|
Product gross margin |
|
33,335 |
|
39,005 |
|
65,701 |
|
38,906 |
|
176,947 |
|
|||||
|
Net earnings |
|
8,320 |
|
10,338 |
|
27,247 |
|
7,570 |
|
53,475 |
|
|||||
|
Net earnings per share |
|
0.15 |
|
0.18 |
|
0.49 |
|
0.14 |
|
0.95 |
|
|||||
|
2008 |
|
|
|
|
|
|
|
|
|
|
|
|||||
|
Net product sales |
|
$ |
90,341 |
|
$ |
101,591 |
|
$ |
184,687 |
|
$ |
115,432 |
|
$ |
492,051 |
|
|
Product gross margin |
|
29,712 |
|
32,850 |
|
59,293 |
|
36,882 |
|
158,737 |
|
|||||
|
Net earnings |
|
6,453 |
|
7,246 |
|
19,715 |
|
5,363 |
|
38,777 |
|
|||||
|
Net earnings per share |
|
0.11 |
|
0.13 |
|
0.35 |
|
0.09 |
|
0.68 |
|
|||||
The 2009 fourth quarter net earnings included the release of tax valuation allowances, charges related to the impairment of an equity investment in joint venture and impairment charges related to certain trademarks as discussed in Notes 4, 6 and 12 to the Consolidated Financial Statements, respectively.
The 2008 fourth quarter net earnings included a charge for the other-than-temporary impairment of an auction rate security as discussed in Note 10 to the Consolidated Financial Statements.
Net earnings per share is based upon average outstanding shares as adjusted for 3% stock dividends issued during the second quarter of each year. The sum of the per share amounts may not equal annual amounts due to rounding.
2009-2008 QUARTERLY SUMMARY OF TOOTSIE ROLL INDUSTRIES, INC. STOCK PRICES AND DIVIDENDS PER SHARE
STOCK PRICES*
|
|
|
2009 |
|
2008 |
|
||||||||
|
|
|
High |
|
Low |
|
High |
|
Low |
|
||||
|
1st Qtr |
|
$ |
25.77 |
|
$ |
19.46 |
|
$ |
26.33 |
|
$ |
21.80 |
|
|
2nd Qtr |
|
$ |
24.42 |
|
$ |
21.82 |
|
$ |
27.26 |
|
$ |
23.27 |
|
|
3rd Qtr |
|
$ |
24.64 |
|
$ |
22.67 |
|
$ |
31.35 |
|
$ |
23.67 |
|
|
4th Qtr |
|
$ |
28.06 |
|
$ |
23.60 |
|
$ |
28.88 |
|
$ |
21.45 |
|
*NYSE - Closing Price
Estimated Number of shareholders at February 2010:
|
Common Stock |
|
18,000 |
|
|
Class B Common Stock |
|
5,000 |
|
DIVIDENDS
|
|
|
2009 |
|
2008 |
|
||
|
1st Qtr |
|
$ |
.08 |
|
$ |
.08 |
|
|
2nd Qtr |
|
$ |
.08 |
|
$ |
.08 |
|
|
3rd Qtr |
|
$ |
.08 |
|
$ |
.08 |
|
|
4th Qtr |
|
$ |
.08 |
|
$ |
.08 |
|
NOTE: In addition to the above cash dividends, a 3% stock dividend was issued on April 9, 2009 and April 10, 2008. Cash dividends are restated to reflect 3% stock dividends.
Five Year Summary of Earnings and Financial Highlights
TOOTSIE ROLL INDUSTRIES, INC. AND SUBSIDIARIES
(See management’s comments starting on page 5)
|
|
|
(Thousands of dollars except per share, percentage and ratio figures) |
|
|||||||||||||
|
|
|
2009 |
|
2008 |
|
2007 |
|
2006 |
|
2005 |
|
|||||
|
Sales and Earnings Data (2)(3)(4) |
|
|
|
|
|
|
|
|
|
|
|
|||||
|
Net product sales |
|
$ |
495,592 |
|
$ |
492,051 |
|
$ |
492,742 |
|
$ |
495,990 |
|
$ |
487,739 |
|
|
Product gross margin |
|
176,947 |
|
158,737 |
|
165,047 |
|
184,723 |
|
188,056 |
|
|||||
|
Interest expense |
|
243 |
|
378 |
|
535 |
|
726 |
|
2,537 |
|
|||||
|
Provision for income taxes |
|
10,704 |
|
17,132 |
|
25,542 |
|
28,796 |
|
36,425 |
|
|||||
|
Net earnings |
|
53,475 |
|
38,777 |
|
51,625 |
|
65,919 |
|
77,227 |
|
|||||
|
% of net product sales |
|
10.8 |
% |
7.9 |
% |
10.5 |
% |
13.3 |
% |
15.8 |
% |
|||||
|
% of shareholders’ equity |
|
8.2 |
% |
6.1 |
% |
8.1 |
% |
10.5 |
% |
12.5 |
% |
|||||
|
|
|
|
|
|
|
|
|
|
|
|
|
|||||
|
Per Common Share Data (1)(3)(4) |
|
|
|
|
|
|
|
|
|
|
|
|||||
|
Net earnings |
|
$ |
0.95 |
|
$ |
0.68 |
|
$ |
0.89 |
|
$ |
1.12 |
|
$ |
1.29 |
|
|
Cash dividends declared |
|
0.32 |
|
0.32 |
|
0.32 |
|
0.32 |
|
0.29 |
|
|||||
|
Stock dividends |
|
3 |
% |
3 |
% |
3 |
% |
3 |
% |
3 |
% |
|||||
|
|
|
|
|
|
|
|
|
|
|
|
|
|||||
|
Additional Financial Data (2)(3)(4) |
|
|
|
|
|
|
|
|
|
|
|
|||||
|
Working capital |
|
$ |
155,812 |
|
$ |
129,967 |
|
$ |
141,754 |
|
$ |
128,706 |
|
$ |
132,940 |
|
|
Net cash provided by operating activities |
|
75,281 |
|
57,042 |
|
90,064 |
|
55,656 |
|
82,524 |
|
|||||
|
Net cash provided by (used in) investing activities |
|
(14,651 |
) |
(7,074 |
) |
(43,345 |
) |
11,026 |
|
21,872 |
|
|||||
|
Net cash provided by (used in) financing activities |
|
(38,548 |
) |
(38,666 |
) |
(44,842 |
) |
(79,959 |
) |
(92,379 |
) |
|||||
|
Property, plant & equipment additions |
|
20,831 |
|
34,355 |
|
14,767 |
|
39,207 |
|
14,690 |
|
|||||
|
Net property, plant & equipment |
|
220,721 |
|
217,628 |
|
201,401 |
|
202,898 |
|
178,760 |
|
|||||
|
Total assets |
|
838,247 |
|
813,525 |
|
812,725 |
|
791,639 |
|
813,696 |
|
|||||
|
Long-term debt |
|
7,500 |
|
7,500 |
|
7,500 |
|
7,500 |
|
7,500 |
|
|||||
|
Shareholders’ equity |
|
652,485 |
|
634,770 |
|
638,230 |
|
630,681 |
|
617,405 |
|
|||||
|
Average shares outstanding (1) |
|
56,072 |
|
56,799 |
|
58,227 |
|
59,048 |
|
59,980 |
|
|||||
(1) Adjusted for annual 3% stock dividends.
(2) Certain reclassifications have been made to prior year numbers to conform to current year presentation.
(3) The 2009 data included the release of tax valuation allowances, charges related to the impairment of an equity investment in joint venture and impairment charges related to certain trademarks as discussed in Notes 4, 6 and 12 to the Consolidated Financial Statements, respectively.
(4) The 2008 data included a charge for the other-than-temporary impairment of an auction rate security. Further information is included in Note 10 to the Consolidated Financial Statements.
Board of Directors
|
Melvin J. Gordon(1) |
|
Chairman of the Board
and |
|
|
|
|
|
Ellen R. Gordon(1) |
|
President and Chief Operating Officer |
|
|
|
|
|
Barre A. Seibert(2)(3) |
|
Retired First Vice
President, |
|
|
|
|
|
Lana Jane Lewis-Brent(2)(3) |
|
President, Paul Brent
Designer, Inc., |
|
|
|
|
|
Richard P. Bergeman(2)(3) |
|
Retired Senior Vice President, Bestfoods |
(1) Executive Committee
(2) Audit Committee
(3) Compensation Committee
Officers
|
Melvin J. Gordon |
|
Chairman of the Board
and |
|
|
|
|
|
Ellen R. Gordon |
|
President and Chief Operating Officer |
|
|
|
|
|
G. Howard Ember, Jr. |
|
Vice President,
Finance & Chief |
|
|
|
|
|
John W. Newlin, Jr. |
|
Vice President, Manufacturing |
|
|
|
|
|
Thomas E. Corr |
|
Vice President, Marketing & Sales |
|
|
|
|
|
John P. Majors |
|
Vice President, Physical Distribution |
|
|
|
|
|
Barry P. Bowen |
|
Treasurer & Assistant Secretary |
|
|
|
|
|
Richard F. Berezewski |
|
Controller |
Offices, Plants
|
Executive Offices |
|
7401 S. Cicero Ave. |
|
|
|
|
|
Plants/Warehouses |
|
Illinois |
|
|
|
|
|
Foreign Sales Offices |
|
Mexico City, Mexico |
Subsidiaries
|
Andes Candies L.P. |
|
|
Andes Manufacturing LLC |
|
|
Andes Services LLC |
|
|
C.C.L.P., INC. |
|
|
C.G.P., INC. |
|
|
Cambridge Brands Manufacturing, Inc. |
|
|
Cambridge Brands Services, Inc. |
|
|
Cambridge Brands, Inc. |
|
|
Cella’s Confections, Inc. |
|
|
Charms LLC |
|
|
Concord (GP) Inc. |
|
|
Concord Brands, ULC |
|
|
Concord Canada Holdings ULC |
|
|
Concord Confections Holdings USA, Inc. |
|
|
Concord Partners LP |
|
|
JT Company, Inc. |
|
|
The Sweets Mix Company, Inc. |
|
|
Tootsie Roll Company, Inc. |
|
|
Tootsie Roll Industries, LLC |
|
|
Tootsie Roll Management, Inc |
|
|
Tootsie Roll Mfg., LLC |
|
|
Tootsie Roll of Canada, ULC |
|
|
Tootsie Roll Worldwide, Ltd. |
|
|
Tootsie Rolls—Latin America |
|
|
TRI de Latinoamerica S.A. de C.V. |
|
|
TRI Finance, Inc. |
|
|
TRI International Inc. |
|
|
TRI Sales Co. |
|
|
TRI Sales Finance LLC |
|
|
TRI-Mass, Inc. |
|
|
Tutsi S.A. de C.V. |
|
|
World Trade & Marketing Ltd. |
|
Other Information
|
Stock Exchange |
|
New York Stock
Exchange, Inc. |
|
|
|
|
|
Stock Identification |
|
Ticker Symbol: TR |
|
|
|
|
|
Stock Transfer Agent and Stock Registrar |
|
American Stock Transfer
|
|
|
|
|
|
Independent Registered Public Accounting Firm |
|
PricewaterhouseCoopers
LLP |
|
|
|
|
|
General Counsel |
|
Becker Ross, LLP |
|
|
|
|
|
Annual Meeting |
|
May 3, 2010 |

|
|
Printed on recycled paper. |