Attached files
UNITED
STATES SECURITIES AND EXCHANGE COMMISSION
WASHINGTON,
D.C. 20549
FORM
10-K
þ ANNUAL
REPORT PURSUANT TO SECTION 13 OR 15(d) OF THE SECURITIES EXCHANGE ACT OF
1934:
For
the fiscal year ended December 31, 2009
Commission
file number 1-14368
|
Titanium
Metals Corporation
|
|
|
|
(Exact
name of registrant as specified in its
charter)
|
||
|
Delaware
|
13-5630895 |
|
|||
|
(State or other jurisdiction of incorporation or
organization)
|
(IRS employer identification no.)
|
||||
5430 LBJ
Freeway, Suite 1700, Dallas, Texas 75240
(Address
of principal executive offices, including zip code)
Registrant’s
telephone number, including area code: (972) 233-1700
Securities
registered pursuant to Section 12(b) of the Act:
| Common Stock ($.01 par value) | New York Stock Exchange |
|
|||
|
(Title of each class)
|
(Name
of each exchange on which
registered)
|
||||
Securities
registered pursuant to Section 12(g) of the Act:
| 6¾% Series A Convertible Preferred Stock ($.01 par Value) |
|
|
|
(Title
of class)
|
||
Indicate by check mark if the
Registrant is a well-known seasoned issuer, as defined in Rule 405 of the
Securities Act. Yes þ No o
Indicate by check mark if the
Registrant is not required to file reports pursuant to Section 13 or Section
15(d) of the Act. Yes o No þ
Indicate by check mark whether the
Registrant (1) has filed all reports required to be filed by Section 13 or 15(d)
of the Securities Exchange Act of 1934 during the preceding 12 months and (2)
has been subject to such filing requirements for the past 90
days. Yes þ No o
Indicate by check mark whether the
registrant has submitted electronically and posted on its corporate Web site, if
any, every Interactive Data File required to be submitted and posted pursuant to
Rule 405 of Regulation S-T during the preceding 12 months (or for such shorter
period that the registrant was required to submit and post such
files).
* Yes oNo o * the registrant has not yet been phased into the interactive data requirements
* Yes oNo o * the registrant has not yet been phased into the interactive data requirements
Indicate
by check mark if disclosure of delinquent filers pursuant to Item 405 of
Regulation S-K is not contained herein, and will not be contained, to the best
of Registrant’s knowledge, in definitive proxy or information statements
incorporated by reference in Part III of this Form 10-K or any amendment to this
Form 10-K o
Indicate by check mark whether the registrant is a
large accelerated filer, an accelerated filer, a non-accelerated filer or a
smaller reporting company (as defined in Rule 12b-2 of the
Act).
Large
accelerated filer þ
Accelerated
filer o Non-accelerated
filer o
Smaller reporting company o
Indicate by check mark whether the
Registrant is a shell company (as defined in Rule 12b-2 of the Act).
Yes o No þ
The aggregate market value of the 85.2
million shares of voting stock held by nonaffiliates of Titanium Metals
Corporation as of June 30, 2009 approximated $0.8 billion. There are
no shares of non-voting common stock outstanding. As of February 19,
2010, 179,646,134 shares of common stock were outstanding.
Documents
incorporated by reference: The information required by Part III is incorporated
by reference from the Registrant’s definitive proxy statement to be filed with
the Commission pursuant to Regulation 14A not later than 120 days after the end
of the fiscal year covered by this report.
Forward-Looking
Information
The
statements contained in this Annual Report on Form 10-K (“Annual Report”) that
are not historical facts, including, but not limited to, statements found in the
Notes to Consolidated Financial Statements and in Item 1 - Business, Item 1A –
Risk Factors, Item 2 – Properties, Item 3 - Legal Proceedings and Item 7 -
Management’s Discussion and Analysis of Financial Condition and Results of
Operations (“MD&A”), are forward-looking statements that represent our
beliefs and assumptions based on currently available
information. Forward-looking statements can generally be identified
by the use of words such as “believes,” “intends,” “may,” “will,” “looks,”
“should,” “could,” “anticipates,” “expects” or comparable terminology or by
discussions of strategies or trends. Although we believe that the
expectations reflected in such forward-looking statements are reasonable, we do
not know if these expectations will prove to be correct. Such
statements by their nature involve substantial risks and uncertainties that
could significantly affect expected results. Actual future results
could differ materially from those described in such forward-looking statements,
and we disclaim any intention or obligation to update or revise any
forward-looking statements, whether as a result of new information, future
events or otherwise. Among the factors that could cause actual
results to differ materially are the risks and uncertainties discussed in this
Annual Report, including risks and uncertainties in those portions referenced
above and those described from time to time in our other filings with the
Securities and Exchange Commission (“SEC”) which include, but are not limited
to:
|
|
·
|
the
cyclicality of the commercial aerospace
industry;
|
|
|
·
|
the
performance of our customers and us under our long-term
agreements;
|
|
|
·
|
the
existence or renewal of certain long-term
agreements;
|
|
|
·
|
the
difficulty in forecasting demand for titanium
products;
|
|
|
·
|
global
economic, financial and political
conditions;
|
|
|
·
|
global
productive capacity for titanium;
|
|
|
·
|
changes
in product pricing and costs;
|
|
|
·
|
the
impact of long-term contracts with vendors on our ability to reduce or
increase supply;
|
|
|
·
|
the
possibility of labor disruptions;
|
|
|
·
|
fluctuations
in currency exchange rates;
|
|
|
·
|
fluctuations
in the market price of marketable
securities;
|
|
|
·
|
uncertainties
associated with new product or new market
development;
|
|
|
·
|
the
availability of raw materials and
services;
|
|
|
·
|
changes
in raw material prices and other operating costs (including energy
costs);
|
|
|
·
|
possible
disruption of business or increases in the cost of doing business
resulting from terrorist activities or global
conflicts;
|
|
|
·
|
competitive
products and strategies; and
|
|
|
·
|
other
risks and uncertainties.
|
Should
one or more of these risks materialize (or the consequences of such a
development worsen), or should the underlying assumptions prove incorrect,
actual results could differ materially from those forecasted or
expected.
1
PART
I
ITEM
1: BUSINESS
General. Titanium Metals
Corporation is one of the world’s leading producers of titanium melted and mill
products. We are the only producer with major titanium production
facilities in both the United States and Europe, the world’s principal markets
for titanium consumption. We are currently the largest U.S. producer
of titanium sponge, a key raw material, and a major recycler of titanium
scrap. Titanium Metals Corporation was formed in 1950 and was
incorporated in Delaware in 1955. Unless otherwise indicated,
references in this report to “we”, “us” or “our” refer to TIMET and its
subsidiaries, taken as a whole.
Titanium
was first manufactured for commercial use in the 1950s. Titanium’s
unique combination of corrosion resistance, elevated-temperature performance and
high strength-to-weight ratio makes it particularly desirable for use in
commercial and military aerospace applications where these qualities satisfy
essential design requirements for certain critical parts such as wing supports
and jet engine components. While aerospace applications have
historically accounted for a substantial portion of the worldwide demand for
titanium, other end-use applications for titanium in military and industrial
markets have continued to develop, including the use of titanium-based alloys in
armor plating, structural components, chemical plants, power plants,
desalination plants and pollution control equipment. Demand for
titanium is also increasing in emerging markets with diverse uses including oil
and gas production installations, automotive, geothermal facilities and
architectural applications.
Our
products include titanium sponge, melted products, mill products and industrial
fabrications. The titanium industry is comprised of several
manufacturers that, like us, produce a relatively complete range of titanium
products and a significant number of producers worldwide that manufacture a
limited range of titanium mill products.
Our
long-term strategy is to maximize the value of our core aerospace business while
expanding our presence in non-aerospace markets and developing new applications
and products. Our existing productive capacity and the availability
of our secure third-party conversion capabilities allow us to efficiently
respond to the industry’s demand volatility. As the titanium industry
progresses through its demand cycle, we will continue to evaluate opportunities
to strategically expand our existing production and conversion capacities
through internal expansion and long-term third-party arrangements, as well as
potential joint ventures and acquisitions.
Titanium
industry. We
develop certain industry estimates based on our extensive experience within the
titanium industry as well as information obtained from publicly available
external resources (e.g., United States Geological Survey, International
Titanium Association and Japan Titanium Society). We estimate we
accounted for approximately 16% of 2008 and 18% of 2009 worldwide industry
shipments of titanium mill products and approximately 6% of worldwide titanium
sponge production in each of 2008 and 2009. The following chart
illustrates our estimates of aggregate industry mill product shipments over the
past ten years:
Industry
Mill Product Shipments by Sector
(Volumes
Exclude Shipments within China and Russia)
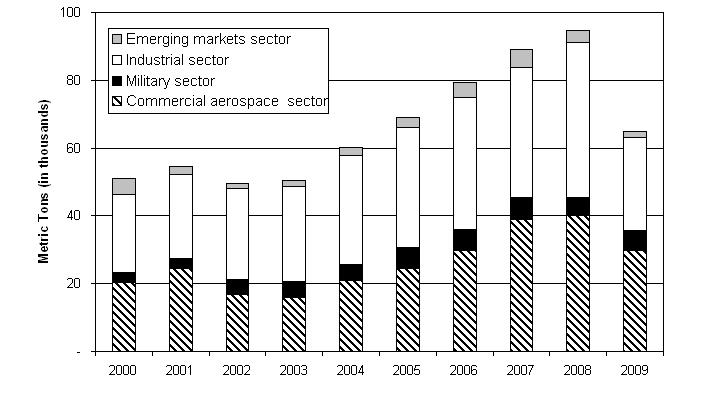
The
cyclical nature of the commercial aerospace sector has been the principal driver
of the historical fluctuations in titanium mill product shipment
volume. Over the past 30 years, the titanium industry has had various
cyclical peaks and troughs in mill product shipments. Over the last
ten years, titanium mill product demand in the military, industrial and emerging
market sectors has increased, primarily due to the continued development of
innovative uses for titanium products in these industries. Over the
last several years we, and the industry as a whole, have experienced
significantly increased demand with periods of increased
volatility. We estimate that industry shipments approximated 95,000
metric tons in 2008 and 65,000 metric tons in 2009. The estimated 32%
decline in 2009 was driven by significant reductions in the commercial aerospace
and industrial sectors. We currently expect 2010 total industry mill
product shipments to be consistent with 2009 with slight improvements in
commercial aerospace.
Commercial aerospace sector -
Demand for titanium products within the commercial aerospace sector is derived
from both jet engine components (e.g., blades, discs, rings and engine cases)
and airframe components (e.g., bulkheads, tail sections, landing gear, wing
supports and fasteners). The commercial aerospace sector has a
significant influence on titanium companies, particularly mill product
producers. Industry shipments decreased approximately 26% in 2009 due
in part to excess supply chain inventories, particularly as a result of
adjustments to production schedules for Boeing and Airbus, and other factors,
including delays in the completion of development and testing of the Boeing 787,
which suppressed customer demand for titanium products during
2009. Deliveries of titanium generally precede aircraft deliveries by
about one year, and our business cycle generally correlates to this timeline,
although the actual timeline can vary considerably depending on the titanium
product.
Our
business is more dependent on commercial aerospace demand than is the overall
titanium industry. We shipped approximately 67% of our mill products
to the commercial aerospace sector in 2009, whereas we estimate approximately
46% of the overall titanium industry’s mill products were shipped to the
commercial aerospace sector in 2009.
The Airline Monitor, a
leading aerospace publication, traditionally issues worldwide forecasts each
January and July for commercial aircraft deliveries, approximately one-third of
which are expected to be required by the U.S. over the next 20
years. The Airline
Monitor’s most recently issued forecast (January 2010) estimates deliveries of
large commercial aircraft (aircraft with over 100 seats) totaled 1,061
(including 205 twin aisle aircraft which require more titanium) in 2009, and the
following table summarizes the forecasted deliveries of large commercial
aircraft over the next five years:
|
Forecasted
deliveries
|
%
increase (decrease) over
previous year
|
|||||||
|
Year
|
Total
|
Twin
aisle
|
Total
|
Twin
aisle
|
||||
|
2010
|
1,020
|
220
|
(4)%
|
7%
|
||||
|
2011
|
1,070
|
302
|
5%
|
37%
|
||||
|
2012
|
1,065
|
310
|
-
|
3%
|
||||
|
2013
|
1,070
|
335
|
-
|
8%
|
||||
|
2014
|
1,035
|
365
|
(3)%
|
9%
|
||||
The
latest forecast from The
Airline Monitor reflects a moderate 1.6% decrease in forecasted
deliveries over the next five years compared to the July 2009 forecast, mainly
due to The Airline Monitor’s
expectation that in spite of push-outs and cancellations due to the
recent reduction in air travel, demand for more fuel efficient aircraft and
growth within the Asian markets will allow build rates to remain near current
levels. Boeing and Airbus booked orders for 573 planes in 2009, and
The Airline Monitor
forecasts that aggregate new orders in 2010 will be lower than
2009.
2
Changes
in the economic environment and the financial condition of airlines can result
in rescheduling or cancellation of orders. Accordingly, aircraft
manufacturer backlogs are not necessarily a reliable indicator of near-term
business activity, but may be indicative of potential business levels over a
longer-term horizon. The latest forecast from The Airline Monitor estimates
decreases for firm order backlog for both Airbus and Boeing as deliveries are
expected to be higher than orders for the next three years. Airbus’
firm order backlog is estimated at 1,085 twin aisle planes and 2,403 single
aisle planes, and Boeing’s firm order backlog is estimated at 1,299 twin aisle
planes and 2,049 single aisle planes. Boeing has previously announced
that its does not plan to increase its build rates on the 787 aircraft to make
up for delayed deliveries, with the first commercial deliveries expected in late
2010.
At
year-end 2009, a total of 202 firm orders have been placed for the Airbus A380,
and a total of 851 firm orders have been placed for the Boeing
787. The 787 will contain more composite materials than other Boeing
aircraft, and increased utilization of composite materials in an aircraft’s
structural components, such as on the Boeing 787 and other next generation
aircraft, require additional titanium on a per unit basis. In early
years of the manufacturing cycle for the Boeing 787, or with any aircraft model,
we believe additional titanium will be required to produce each aircraft, and as
the program reaches maturity, less titanium will be required for each aircraft
manufactured. During 2006, Airbus officially launched the A350 XWB
program, which is a major derivative of the Airbus A330, with first deliveries
scheduled for 2013. As of December 31, 2009, a total of 505 firm
orders had been placed for the A350 XWB. These A350 XWBs will use
composite materials and new engines similar to those used on the Boeing 787 and
are expected to require significantly more titanium as compared with earlier
Airbus models. However, the final titanium buy weight may change as
the A350 XWB is still in the design phase.
Twin
aisle planes (e.g., Boeing 747, 767, 777 and 787 and Airbus A330, A340, A350 and
A380) tend to use a higher percentage of titanium in their airframes, engines
and parts than single aisle planes (e.g., Boeing 737 and 757 and Airbus A318,
A319 and A320), and new generation models require a significantly higher
percentage of titanium. Additionally, Boeing generally uses a higher
percentage of titanium in its airframes than Airbus. Based on
information we receive from airframe and engine manufacturers and other industry
sources, we estimate approximately 18 metric tons of titanium products are
required to manufacture each Boeing 737, approximately 76 metric tons are
required to manufacture each Boeing 747, approximately 59 metric tons
are required to manufacture each Boeing 777 and approximately 116 metric tons
will be required to manufacture each Boeing 787, including both the airframes
and engines. Additionally, based on these same sources, we estimate
approximately 12 metric tons of titanium products are required to manufacture
each Airbus A320, approximately 18 metric tons are required to manufacture each
Airbus A330, approximately 32 metric tons are required to manufacture each
Airbus A340, approximately 127 metric tons will be required to manufacture each
Airbus A350 XWB and approximately 146 metric tons are required to manufacture
each Airbus A380, including both the airframes and engines.
Military sector - Titanium
shipments into the military sector are largely driven by government defense
spending in North America and Europe. Military aerospace programs
were the first to utilize titanium’s unique properties on a large scale,
beginning in the 1950s. Titanium shipments to military aerospace
markets reached a peak in the 1980s before falling to historical lows in the
early 1990s after the end of the Cold War. Since 2001, titanium
shipments to military aerospace have increased, as discussed
below. Based on its physical and performance properties, titanium has
also become widely accepted for use in applications for ground combat vehicles
as well as in naval vessels. The importance of military markets to
the titanium industry is expected to continue to rise in coming years as defense
spending budgets increase in reaction to terrorist activities and global
conflicts and to replace aging conventional armaments. Defense
spending for most systems is expected to remain strong through at least
2010. Current and anticipated future military strategy leading to
light armament and mobility favor the use of titanium due to light weight and
improved ballistic performance.
As the
strategic military environment demands greater global lift and mobility, the
U.S. military needs more airlift capacity and capability. Airframe
programs are expected to drive the military market demand for titanium through
2015. Several of today’s active U.S. military programs, including the
C-17, F-15, F/A 18 and F-16, are currently expected to continue in production
into the middle of this decade. European military programs also have
active aerospace programs offering the possibility for increased titanium
consumption. Production levels for the Saab Gripen, Eurofighter
Typhoon, Dassault Rafale and Dassault Mirage 2000 are all forecasted to remain
steady through the middle or end of this decade.
In
addition to the established programs, newer U.S. programs offer growth
opportunities for increased titanium consumption. The F/A-22 Raptor
was given full-rate production approval in April 2005, but based on proposed
defense budgets, the Raptor program could be diminished or phased out as early
as 2011. Additionally, the F-35 Joint Strike Fighter, now known as
the Lightning II, has begun low-rate initial production and assembly with
delivery of the first production aircraft planned in 2010. Although
no specific delivery schedules have been announced, according to The Teal Group, a leading
aerospace publication, procurement of the F-35 is expected to extend over the
next 30 to 40 years and may include production of as many as 4,000 planes,
including sales to foreign nations.
Utilization
of titanium on military ground combat vehicles for armor appliqué and integrated
armor or structural components continues to gain acceptance within the military
market segment. Titanium armor components provide the necessary
ballistic performance while achieving a mission critical vehicle performance
objective of reduced weight in new generation vehicles. In order to
counteract increased threat levels globally, titanium is being utilized on
vehicle upgrade programs in addition to new builds. Based on active
programs, as well as programs currently under evaluation, we believe there will
be additional usage of titanium on ground combat vehicles that will provide
continued growth in the military market sector. In armor and
armament, we sell plate and sheet products for fabrication into appliqué plate
and reactive armor for protection of the entire ground combat vehicle as well as
the vehicle’s primary structure.
Industrial and emerging markets
sectors - The number of end-use markets for titanium has expanded
significantly over the past several years. Established industrial
uses for titanium include chemical plants, power plants, desalination plants and
pollution control equipment. Rapid growth of the Chinese and other
Southeast Asian economies has brought unprecedented demand for
titanium-intensive industrial equipment. In November 2005, we entered
into a joint venture with XI'AN BAOTIMET VALINOX TUBES CO. LTD. (“BAOTIMET”) to
produce welded titanium tubing in the Peoples Republic of
China. BAOTIMET's production facilities are located in Xi'an, China,
and production began in January 2007.
Titanium
is widely accepted for many emerging market applications, including
transportation, energy (including oil and gas) and
architecture. Although titanium is often more expensive than other
competing metals, over the entire life cycle of the application, we believe
titanium is a better value alternative due to its durability, longevity and
overall environmental impact. In many cases customers also find the
physical properties of titanium to be attractive from the standpoint of weight,
performance, design alternatives and other factors. The oil and gas
market, a relatively new, potentially large growth area, utilizes titanium in
down-hole casing, critical riser components, tapered stress joints, fire water
systems and saltwater-cooling systems. Additionally, as offshore
development of new oil and gas fields moves into the ultra deep-water depths and
as geothermal energy production expands, market demand for titanium’s
light-weight, high-strength and corrosion-resistance properties is creating new
growth opportunities. We have focused additional resources on
development of alloys and production processes to promote the expansion of
titanium use in this market and in other non-aerospace
applications.
Although
we estimate emerging market demand presently represents less than 5% of the
total industry demand for titanium mill products, we believe emerging market
demand, in the aggregate, will continue to grow over the next several
years. We have ongoing initiatives to actively pursue and expand our
presence in these markets.
Products and operations. We
are a vertically integrated titanium manufacturer whose products
include:
|
|
(i)
|
titanium
sponge, the basic form of titanium metal used in titanium
products;
|
|
|
(ii)
|
melted
products (ingot, electrode and slab), the result of melting titanium
sponge and titanium scrap, either alone or with various
alloys;
|
|
|
(iii)
|
mill
products that are forged and rolled from ingot or slab, including long
products (billet and bar), flat products (plate, sheet and strip) and
pipe; and
|
|
|
(iv)
|
fabrications
(spools, pipe fittings, manifolds, vessels, etc.) that are cut, formed,
welded and assembled from titanium mill
products.
|
All of
our net sales were generated by our integrated titanium operations (our
“Titanium melted and mill products” segment), which is our only business
segment. Business and geographic financial information is included in
Note 17 to the Consolidated Financial Statements.
Titanium
sponge is the commercially pure, elemental form of titanium metal with a porous
and sponge-like appearance. The first step in our sponge production
involves the combination of titanium-containing rutile ores (derived from beach
sand) with chlorine and petroleum coke to produce titanium
tetrachloride. Titanium tetrachloride is purified and then reacted
with magnesium in a closed system, producing titanium sponge and magnesium
chloride as a by-product. Our titanium sponge production facility in
Henderson, Nevada uses vacuum distillation process (“VDP”) technology, which
removes the magnesium and magnesium chloride residues by applying heat to the
sponge mass while maintaining a vacuum in a chamber. The combination
of heat and vacuum boils the residues from the sponge mass, and then the sponge
mass is mechanically pushed out of the distillation vessel, sheared and crushed
to prepare the sponge for incorporation into one of our melted
products. We electrolytically separate and recycle the residual
magnesium chloride, a by-product of the VDP process, to improve cost efficiency
and reduce environmental impact.
Melted
products (ingot, electrode and slab) are produced by melting sponge and titanium
scrap, either alone or with alloys, to produce various grades of titanium
products suited to the ultimate application of the product. By
introducing other alloys such as vanadium, aluminum, molybdenum, tin and
zirconium, the melted titanium product is engineered to produce quality grades
with varying combinations of certain physical attributes such as
strength-to-weight ratio, corrosion-resistance and milling
compatibility. Titanium ingot is a cylindrical solid shape that, in
our case, weighs up to 8 metric tons. Titanium slab is a rectangular
solid shape that, in our case, weighs up to 16 metric tons. The
melting process for ingot and slab is closely controlled and monitored utilizing
computer control systems to maintain product quality and consistency and to meet
customer specifications. In most cases, we use our ingot and slab as
the intermediate material for further processing into mill
products. However, we also sell melted products to our
customers.
Mill
products are forged or rolled from our melted products (ingot or
slab). Mill products include long products (billet and bar), flat
products (plate, sheet and strip) and pipe. Our mill products can be
further machined to meet customer specifications with respect to size and
finish.
3
We send
certain products to outside vendors for further processing (e.g., certain
rolling, forging, finishing and other processing steps in the U.S., and certain
melting and forging steps in France) before being shipped to
customers. In France, our primary processor is also a partner in our
70%-owned subsidiary, TIMET Savoie, S.A. During 2006, we entered into
a 20-year conversion services agreement with a U.S. supplier, whereby they will
provide an annual output capacity of 4,500 metric tons of titanium mill rolling
services until 2026, with our option to increase the output capacity to 9,000
metric tons. Additionally, during 2007, we entered into a long-term
agreement with another U.S. supplier whereby they will provide us dedicated
annual forging capacity of 3,000 metric tons and increasing to 8,900 metric tons
for 2011 through at least 2019. These agreements provide us with
long-term secure sources for processing round and flat products, resulting in a
significant increase in our existing mill product conversion capabilities, which
allows us to assure our customers of our long-term ability to meet their
needs.
During
the production process and following the completion of manufacturing, we perform
extensive testing on our products. Sonic inspection as well as
chemical and mechanical testing procedures are critical to ensuring that our
products meet our customers’ high quality requirements, particularly in
aerospace component production. We certify that our products meet
customer specification at the time of shipment for substantially all customer
orders.
Titanium
scrap is a by-product of the forging, rolling and machining operations, and
significant quantities of scrap are generated in the production process for
finished titanium products and components. Scrap by-products from our
mill production processes, as well as the scrap purchased from our customers or
on the open metals market, is typically recycled and introduced into the melting
process once the scrap is sorted and cleaned. We have the capacity to
recycle 14,000 to 16,000 metric tons of titanium scrap annually at our facility
in Morgantown, Pennsylvania depending on the scrap and end-use product
mix. We believe our capability and expertise in recycling titanium
scrap provides us with a competitive advantage in the titanium
industry.
Distribution. We
sell our products through our own sales force based in the U.S. and Europe and
through independent agents and distributors worldwide. We also own
eight service centers (five in the U.S. and three in Europe), which we use to
sell our products on a just-in-time basis. The service centers
primarily sell value-added and customized mill products, including bar, sheet,
plate, tubing and strip. We believe our service centers provide us
with a competitive advantage because of our ability to foster customer
relationships, customize products to suit specific customer requirements and
respond quickly to customer needs.
Raw
materials. The principal raw materials used in the production
of titanium melted and mill products are titanium sponge, titanium scrap and
alloys. The proportions and grades of sponge and scrap are sometimes
dictated by the product mix or customer requirements for the end-use product;
however, we generally have the operating flexibility to vary the raw material
components to optimize our manufacturing efficiency and maximize our
profitability. The following table summarizes our raw material usage
requirements in the production of our melted and mill products:
|
2007
|
2008
|
2009
|
|||
|
Internally
produced sponge
|
24%
|
24%
|
27%
|
||
|
Purchased
sponge
|
31%
|
31%
|
16%
|
||
|
Titanium
scrap
|
39%
|
39%
|
51%
|
||
|
Alloys
|
6%
|
6%
|
6%
|
||
|
Total
|
100%
|
100%
|
100%
|
Sponge - The primary raw
materials used in the production of titanium sponge are titanium-containing
rutile ore, chlorine, magnesium and petroleum coke. Rutile ore is
currently available from a limited number of suppliers around the world,
principally located in Australia, South Africa and Sri Lanka. We
purchase the majority of our supply of rutile ore from Australia and South
Africa. We believe the availability of rutile ore will be adequate
for the foreseeable future and do not anticipate any interruptions of our rutile
supplies.
We
currently obtain chlorine from a single supplier near our sponge plant in
Henderson, Nevada. While we do not anticipate any chlorine supply
problems, we have taken steps to mitigate this risk in the event of supply
disruption, including establishing the feasibility of certain equipment
modifications to enable us to utilize material from alternative chlorine
suppliers or to purchase and utilize an intermediate product which will allow us
to eliminate the purchase of chlorine if needed. Magnesium and
petroleum coke are generally available from a number of suppliers.
We are
currently the largest U.S. producer of titanium sponge. In 2007, we
completed an expansion of our existing premium-grade titanium sponge facility at
our Henderson plant. This expansion increased our annual productive
sponge capacity to approximately 12,600 metric tons. We operated our
sponge plant significantly below full capacity during 2009, and we anticipate
comparable production volumes during 2010. We supplement our
internally produced sponge with purchases from third parties. From
2006 through 2009, other sponge producers have also undertaken additional
capacity expansion projects. However, we do not know the degree to
which the quality and cost of the sponge produced by our competitors will be
comparable to the premium-grade sponge we produce in our Henderson
facility.
We are
party to long-term sponge supply agreements that require us to make minimum
annual purchases. These long-term supply agreements, together with
our current sponge production capacity in Henderson, should provide us with a
total annual available sponge supply at levels ranging from 19,000 metric tons
up to 24,000 metric tons through 2025, which we expect to meet our sponge supply
requirements. We will continue to purchase sponge from a variety of
sources in 2010, including those sources under existing supply
agreements. We continuously evaluate alternatives to strategically
balance our internal and external sources for titanium sponge.
Scrap - We recycle titanium
scrap into melted products that will be sold to our customers or used as
intermediate feedstock for our mill production process. Our titanium
scrap is generated from our melted and mill product production processes,
purchased from certain of our customers under contractual agreements or acquired
in the open metals market. Such scrap consists of alloyed and
commercially pure solids and turnings. Scrap obtained through
customer arrangements provides a “closed-loop” arrangement resulting in
certainty of supply and price stability, and due to our successful efforts to
increase the volume of scrap obtained through “closed-loop” arrangements and
reduced melting demand in 2009, we were only required to purchase 16% of our
scrap requirement from the open metals market in 2009 compared to 27% in
2008. Externally purchased scrap comes from a wide range of sources,
including customers, collectors, processors and brokers. We expect
our open market scrap purchases to account for 20% to 25% of our scrap
requirement during 2010. We expect our scrap consumption to remain at
high levels as we continue to emphasize the utilization of scrap for our
electron beam cold hearth (“EB”) melting activity. We also
occasionally sell scrap, usually in a form or grade we cannot economically
recycle for use in our production operations.
Overall
market forces can significantly impact the supply or cost of externally produced
scrap, as the amount of scrap generated in the supply chain varies during
titanium business cycles. Early in the titanium cycle, the demand for
titanium melted and mill products begins to increase the scrap requirements for
titanium manufacturers. This demand precedes the increase in scrap
generation by downstream customers and the supply chain. The reduced
availability of scrap at this stage of the cycle places upward pressure on the
market price of scrap. The opposite situation occurs when demand for
titanium melted and mill products begins to decline, resulting in greater
availability of scrap supply and downward pressure on the market price of
scrap. During the middle of the cycle, scrap generation and
consumption are in relative equilibrium, minimizing disruptions in supply or
significant changes in the available supply and market price for
scrap. Increasing or decreasing cycles tend to cause significant
changes in both the supply and market price of scrap. These supply
chain dynamics result in selling prices for melted and mill products which
generally tend to correspond with the changes in raw material
costs.
All of
our major competitors utilize scrap as a raw material in their titanium melt
operations, and steel manufacturers also use titanium scrap as an alloy to
produce interstitial-free steels, stainless steels and high-strength-low-alloy
steels. Prices for all forms and grades of titanium scrap declined
steadily during the first half of 2008 due to increased availability and reduced
demand. The global recession reduced demand for titanium scrap in the
second half of 2008 and the first nine months of 2009, which resulted in sharp
declines in scrap prices over the same period. Overall demand and
prices for titanium scrap increased in late 2009 as a result of the market
forces described above, and we currently believe general economic conditions
will continue to cause the price of titanium scrap to increase in
2010.
Other - Various alloy
additions used in the production of titanium products, such as vanadium and
molybdenum, are also available from a number of suppliers. The
decline in demand from steel manufacturers for vanadium and molybdenum also
resulted in dramatic drops in cost for these alloys in 2009, as compared to
2008. However, we currently believe that demand for alloys will
increase in 2010, likely causing the price of alloys to increase as
well.
Customer
agreements. We have long-term agreements (“LTAs”) with certain
major customers, including, among others, The Boeing Company (“Boeing”),
Rolls-Royce plc and its German and U.S. affiliates (“Rolls-Royce”), United
Technologies Corporation (“UTC,” Pratt & Whitney and related companies), the
Safran companies (“Safran,” Snecma and related companies), Wyman-Gordon Company
(“Wyman-Gordon,” a unit of Precision Castparts Corporation (“PCC”)) and VALTIMET
SAS. These agreements expire at various times through 2017, are
subject to certain conditions and generally provide for (i) minimum market
shares of the customers’ titanium requirements or firm annual volume
commitments, (ii)
formula-determined prices (including some elements based on market
pricing) and (iii) price adjustments for certain raw material, labor and energy
cost fluctuations. Generally, the LTAs require our service and
product performance to meet specified criteria and contain a number of other
terms and conditions customary in transactions of these
types. Certain provisions of these LTAs have been amended in the past
and may be amended in the future to meet changing business
conditions. Our 2009 sales revenues to customers under LTAs were 64%
of our total sales revenues.
In
certain events of nonperformance by us or the customer, an LTA may be terminated
early. Although it is possible that some portion of the business
would continue on a non-LTA basis, the termination or expiration without renewal
of one or more of the LTAs could result in a material adverse effect on our
business, results of operations, financial position or liquidity. The
LTAs were designed to limit selling price volatility to the customer and to us,
while providing us with a committed volume base throughout the titanium industry
business cycles and certain mechanisms to adjust pricing for changes in certain
cost elements.
4
Markets and
customer base. As discussed previously, we produce a wide
range of melted and mill titanium products for our customers, and selling prices
generally reflect raw material and other productions costs as well as reasonable
profit margins. Selling prices are generally influenced by industry
and global economic conditions. For instance, increases in global
capacity and manufacturing activity for titanium products throughout the supply
chain in 2007 and 2008 increased the availability of titanium scrap, which
resulted in declining costs for this raw material through the first nine months
of 2009. This decline in raw material costs has, in turn, contributed
to lower selling prices for certain products under LTAs, due in part to raw
material indexed pricing adjustments included in certain of these agreements, as
well as for our non-contract sales volume.
The
demand for our titanium products is global, and our global productive
capabilities allow us to respond to our customers’ needs. The
following table summarizes our sales revenue by geographical
location:
|
Year
ended December 31,
|
|||||
|
2007
|
2008
|
2009
|
|||
|
(Percentage
of total sales revenue)
|
|||||
|
Sales
revenue to customers within:
|
|||||
|
North America
|
61%
|
59%
|
65%
|
||
|
Europe
|
29%
|
29%
|
27%
|
||
|
Other
|
10%
|
12%
|
8%
|
||
|
Total
|
100%
|
100%
|
100%
|
||
Further
information regarding our external sales, net income, long-lived assets and
total assets can be found in our Consolidated Balance Sheets, Consolidated
Statements of Income and Notes 5 and 17 to the Consolidated Financial
Statements.
Our
concentration of customers, primarily in commercial aerospace, may impact our
overall exposure to credit and other risks because all of these customers may be
similarly affected by the same economic or other conditions. The
following table provides supplemental sales revenue information:
|
Year
ended December 31,
|
|||||||
| 2007 |
2008
|
2009 | |||||
|
(Percentage
of total sales revenue)
|
|||||||
|
Ten largest
customers
|
49%
|
49%
|
57%
|
||||
|
Significant
customers:
|
|||||||
|
Boeing
|
10%
|
12%
|
17%
|
||||
|
PCC and PCC-related entities
(1)
|
11%
|
10%
|
15%
|
||||
|
Total LTAs
|
47%
|
56%
|
64%
|
||||
|
Significant
LTAs:
|
|||||||
|
Boeing
|
10%
|
12%
|
17%
|
||||
|
Rolls-Royce (1)
|
12%
|
13%
|
13%
|
||||
|
(1)
PCC and PCC-related
entities serve as suppliers to certain commercial aerospace manufacturers,
including Rolls-Royce. Certain sales we make directly to PCC
and PCC-related entities also count towards, and are reflected in, the
table above as sales to Rolls-Royce under the Rolls-Royce
LTA.
|
|||||||
The
following table provides supplemental sales revenue information by industry
sector:
|
Year
ended December 31,
|
|||||
|
2007
|
2008
|
2009
|
|||
|
(Percentage
of total sales revenue)
|
|||||
|
Commercial
aerospace
|
55%
|
59%
|
60%
|
||
|
Military
|
19%
|
16%
|
20%
|
||
|
Industrial and emerging
markets
|
16%
|
15%
|
11%
|
||
|
Other titanium
products
|
10%
|
10%
|
9%
|
||
|
Total
|
100%
|
100%
|
100%
|
||
The
primary market for titanium products in the commercial aerospace sector consists
of two major manufacturers of large commercial airframes, Boeing Commercial
Airplanes Group (a unit of Boeing) and Airbus, as well as manufacturers of large
civil aircraft engines including Rolls-Royce, General Electric Aircraft Engines,
Pratt & Whitney and Safran. We sell directly to these major
manufacturers, as well as to companies (including forgers such as Wyman-Gordon)
that use our titanium to produce parts and other materials for such
manufacturers. If any of the major aerospace manufacturers were to
significantly reduce aircraft and/or jet engine build rates from those currently
expected, there could be a material adverse effect, both directly and
indirectly, on our business, results of operations, financial position and
liquidity.
The
market for titanium in the military sector includes sales of melted and mill
titanium products engineered for applications for military aircraft (both
engines and airframes), armor and component parts, armor appliqué on ground
combat vehicles and other integrated armor or structural
components. We sell directly to many of the major manufacturers
associated with military programs on a global basis.
Outside
of commercial aerospace and military sectors, we manufacture a wide range of
products for customers in the chemical process, oil and gas, consumer, sporting
goods, healthcare, automotive and power generation sectors.
In
addition to melted and mill products, which are sold into all market sectors, we
sell certain other products such as titanium fabrications, titanium scrap and
titanium tetrachloride.
Our
backlog was approximately $695 million at December 31, 2008 and $440
million at December 31, 2009. Over 90% of our 2009 year-end backlog
is scheduled for shipment during 2010. Our order backlog may not be a
reliable indicator of future business activity.
We have
explored and will continue to explore strategic arrangements in the areas of
product development, production and distribution. We will also
continue to work with existing and potential customers to identify and develop
new or improved applications for titanium that take advantage of its unique
properties and qualities.
Competition. The
titanium metals industry is highly competitive on a worldwide basis. Producers
of melted and mill products are located primarily in the United States, Japan,
France, Germany, Italy, Russia, China and the United Kingdom. There
are also several producers of titanium sponge in the world that are currently in
some stage of increasing sponge production capacity. We believe entry
as a new producer of titanium sponge would require a significant capital
investment, substantial technical expertise and significant lead
time. Additionally, producers of other metal products, such as steel
and aluminum, maintain forging, rolling and finishing facilities that could be
used or modified to process titanium products.
Our
principal competitors in the aerospace titanium market are Allegheny
Technologies Incorporated (“ATI”) and RTI International Metals, Inc. (“RTI”),
both based in the United States, and Verkhnaya Salda Metallurgical Production
Organization (“VSMPO”), based in Russia. UNITI (a joint venture
between ATI and VSMPO), RTI and certain Japanese producers are our principal
competitors in the industrial and emerging markets. We compete
primarily on the basis of price, quality of products, technical support and the
availability of products to meet customers’ delivery schedules.
In the
U.S. market, the increasing presence of foreign participants has become a
significant competitive factor. Prior to 1993, imports of foreign
titanium products into the U.S. were not significant, primarily attributable to
relative currency exchange rates and, with respect to Japan, Russia, Kazakhstan
and Ukraine, import duties (including antidumping duties). However,
since 1993, imports of titanium sponge, ingot and mill products, principally
from Russia and Kazakhstan, have increased and have had a significant
competitive impact on the U.S. titanium industry.
5
Trade and tariffs -
Generally, imports of titanium products into the U.S. are subject to a 15%
“normal trade relations” tariff. For tariff purposes, titanium
products are broadly classified as either wrought (billet, bar, sheet, strip,
plate and tubing) or unwrought (sponge, ingot and slab). Because a
significant portion of end-use products made from titanium products are
ultimately exported, we, along with our principal competitors and many
customers, actively utilize the duty-drawback mechanism to recover most of the
tariff paid on imports.
From
time-to-time, the U.S. government has granted preferential trade status to
certain titanium products imported from particular countries (notably wrought
titanium products from Russia, which carried no U.S. import duties from
approximately 1993 until 2004). It is possible that such preferential
status could be granted again in the future.
The
Japanese government has raised the elimination or harmonization of tariffs on
titanium products, including titanium sponge, for consideration in multi-lateral
trade negotiations through the World Trade Organization (the so-called “Doha
Round”). As part of the Doha Round, the United States has proposed
the staged elimination of all industrial tariffs, including those on
titanium. The Japanese government has specifically asked that
titanium in all its forms be included in the tariff elimination
program. We have urged that no change be made to these tariffs,
either on wrought or unwrought products. The negotiations are ongoing
and are expected to continue during 2010.
We will
continue to resist efforts to eliminate duties on titanium products, although we
may not be successful in these activities. Further reductions in, or
the complete elimination of, any or all of these tariffs could lead to increased
imports of foreign sponge, ingot, slab and mill products into the U.S. and an
increase in the amount of such products on the market generally, which could
adversely affect pricing for titanium sponge, ingot, slab and mill products and
thus our business, results of operations, financial position or
liquidity.
Section
2533b of Title 10, United States Code, legislation formerly known as the “Berry
Amendment,” requires that subject to certain exceptions the United States
Department of Defense (“DoD”) expend funds for products containing specialty
metals, including titanium, only if the specialty metals have been melted or
produced in the United States. In 2009, the DoD adopted regulations
regarding the implementation of this specialty metals law that may reduce its
effectiveness. We will continue to resist attempts to undermine this
specialty metals law. A weakening in the enforcement of this
specialty metals law could increase foreign competition for sales of titanium
for defense products, adversely affecting our business, results of operations,
financial position or liquidity.
Research and
development. Our research and development activities are
directed toward expanding the use of titanium and titanium alloys in all market
sectors. Key research activities include the development of new
alloys, development of technology required to enhance the performance of our
products in the traditional industrial and aerospace markets and applications
development for emerging markets. In addition, we continue to work in
partnership with the United States Defense Advanced Research Projects Agency
("DARPA") and others to explore means to reduce the cost of titanium
production. The work with DARPA complements our research, development
and exploration of innovative technologies and improvements to the existing
processes such as Vacuum Distillation of sponge and Vacuum Arc Remelting
processes. We conduct the majority of our research and development
activities at our Henderson Technical Laboratory, with additional activities at
our Witton, England facility. We incurred research and development
costs of $4.2 million in 2007, $4.3 million in 2008 and $7.8 million in
2009.
Patents and
trademarks. We hold U.S. and non-U.S. patents applicable to
certain of our titanium alloys and manufacturing technology, which expire at
various times from 2010 through 2026 and we have certain other patent
applications pending. We continually seek patent protection with
respect to our technology base and have occasionally entered into
cross-licensing arrangements with third parties. We believe the
trademarks TIMET® and
TIMETAL®,
which are protected by registration in the U.S. and other countries, are
important to our business. However, the majority of our titanium
alloys and manufacturing technologies do not benefit from patent
protection.
Employees. Our
employee headcount varies due to the cyclical nature of the aerospace industry
and its impact on our business. Our employee headcount includes both
our full and part-time employees. The following table shows our
approximate employee headcount at the end of the past 3 years:
|
Employees
at December 31,
|
|||||
|
2007
|
2008
|
2009
|
|||
|
U.S.
|
1,670
|
1,775
|
1,455
|
||
|
Europe
|
860
|
895
|
750
|
||
|
Total
|
2,530
|
2,670
|
2,205
|
||
Our
production and maintenance workers in Henderson and our production, maintenance,
clerical and technical workers in Toronto, Ohio (approximately half of our total
U.S. employees) are represented by the United Steelworkers of America under
contracts expiring in January 2011 and June 2011,
respectively. Employees at our other U.S. facilities are not covered
by collective bargaining agreements. A majority of the salaried and
hourly employees at our European facilities are represented by various European
labor unions. Our labor agreement with our U.K. managerial and
professional employees expires in March 2011, and our labor agreement with our
U.K. production and maintenance employees expires in December
2011. Our labor agreements with our French and Italian employees are
renewed annually. We currently consider our employee relations to be
good. However, it is possible that there could be future work
stoppages or other labor disruptions that could materially and adversely affect
our business, results of operations, financial position or
liquidity.
Regulatory and
environmental matters. Our operations are governed by various
federal, state, local and foreign environmental, security and worker safety and
health laws and regulations. In the U.S., such laws include the
Occupational, Safety and Health Act, the Clean Air Act, the Clean Water Act, the
Toxic Substances Control Act and the Resource Conservation and Recovery
Act. We use and manufacture substantial quantities of substances that
are considered hazardous, extremely hazardous or toxic under environmental and
worker safety and health laws and regulations. We have used and
manufactured such substances throughout the history of our
operations. Although we have substantial controls and procedures
designed to reduce continuing risk of environmental, health and safety issues,
we could incur substantial cleanup costs, fines and civil or criminal sanctions,
third party property damage or personal injury claims as a result of violations
or liabilities under these laws, common law theories of liability or
non-compliance with environmental permits required at our
facilities. In addition, government environmental requirements or the
enforcement thereof may become more stringent in the future. It is
possible that some, or all, of these risks could result in liabilities that
would be material to our business, results of operations, financial position or
liquidity.
Our
policy is to maintain compliance in all material respects with applicable
requirements of environmental and worker health and safety laws and strive to
improve environmental, health and safety performance. We incurred
capital expenditures related to health, safety and environmental compliance and
improvement of approximately $3.0 million in 2007, $2.1 million in 2008 and $1.7
million in 2009.
From time
to time, we may be subject to health, safety or environmental regulatory
enforcement under various statutes, resolution of which typically involves the
establishment of compliance programs. Occasionally, resolution of
these matters may result in the payment of penalties or the expenditure of
additional funds on compliance. Furthermore, the imposition of more
strict standards or requirements under environmental, health or safety laws and
regulations could result in expenditures in excess of amounts currently
estimated to be required for such matters.
As a result of Environmental Protection
Agency (“EPA”) inspections, in April 2009 the EPA issued a Notice of Violation
(“Notice”) to us alleging that we violated certain provisions of the Resource
Conservation and Recovery Act and the Toxic Substances Control Act at our
Henderson plant. We responded to the EPA and are currently in ongoing
discussions with them concerning the nature and extent of required follow-up
testing and potential remediation that may be required to address the
allegations of non-compliance. We anticipate submitting detailed
proposals for testing during the first quarter of 2010 that will provide the
basis for negotiating the scope and methods of any remediation required by the
Notice.
As part
of our continuing environmental assessment with respect to our plant site in
Henderson, during 2008 we completed and submitted to the Nevada Department of
Environmental Protection (“NDEP”) a Remedial Alternative Study (“RAS”) with
respect to the groundwater located beneath the plant site. The RAS,
which was submitted pursuant to an existing agreement between the NDEP and us,
addressed the presence of certain contaminants in the plant site groundwater
that require remediation. The NDEP completed its review of the RAS
and our proposed remedial alternatives during 2008, and the NDEP issued its
record of decision in February 2009, which selected our preferred groundwater
remedial alternative action plan. We commenced the work to implement
the plan in the fourth quarter of 2009. See Note 15 to the
Consolidated Financial Statements.
Related
parties. At December 31, 2009, Contran Corporation and other
entities or persons related to Harold C. Simmons held approximately 52.2% of our
outstanding common stock. See Notes 1 and 14 to the Consolidated
Financial Statements.
Available
information. We maintain an Internet website at www.timet.com. Our
Annual Reports on Form 10-K, Quarterly Reports on Form 10-Q and Current Reports
on Form 8-K, and any amendments thereto, are or will be available free of charge
on our website as soon as reasonably practicable after they are filed or
furnished, as applicable, with the SEC. Additionally, our (i)
Corporate Governance Guidelines, (ii) Code of Business Conduct and Ethics and
(iii) Audit Committee, Management Development and Compensation Committee and
Nominations Committee charters are also available on our
website. Information contained on our website is not part of this
Annual Report. We will provide these documents to shareholders upon
request. Requests should be directed to the attention of our Investor
Relations Department at our corporate offices located at 5430 LBJ Freeway, Suite
1700, Dallas, Texas 75240.
The
general public may read and copy any materials on file with the SEC at the SEC’s
Public Reference Room at 100 F Street, NE, Washington, DC 20549 and may obtain
information on the operation of the Public Reference Room by calling the SEC at
1-800-SEC-0330. We are an electronic filer, and the SEC maintains an
Internet website at www.sec.gov that
contains reports, proxy and information statements, and other information
regarding issuers that file electronically with the SEC.
6
ITEM
1A: RISK FACTORS
Listed
below are certain risk factors associated with our business. In
addition to the potential effect of these risk factors discussed below, any risk
factor that could result in reduced earnings, liquidity or operating losses,
could in turn adversely affect our ability to meet our liabilities or adversely
affect the quoted market prices for our securities.
The cyclical
nature of the commercial aerospace industry, which represents a significant
portion of our business, creates uncertainty regarding our future
profitability. In addition, adverse changes to, or interruptions in,
our relationships with our major commercial aerospace customers could reduce our
revenues and impact our profitability. The commercial
aerospace sector has a significant influence on titanium companies, particularly
mill product producers. The cyclical nature of the commercial
aerospace sector has been the principal driver of the fluctuations in the
performance of most titanium product producers. Our business is more
dependent on commercial aerospace demand than is the overall titanium
industry. We shipped approximately 67% of our mill products to
commercial aerospace customers in 2009, whereas we estimate approximately 46% of
the overall titanium industry’s mill products were shipped to commercial
aerospace customers in 2009. Our melted and mill product sales to
commercial aerospace customers accounted for 55% of our total sales in 2007, 59%
in 2008 and 60% in 2009. We estimate that 2010 industry mill product
shipments into the commercial aerospace sector will be comparable to 2009
levels. Events that could adversely affect the commercial aerospace
sector, such as future terrorist attacks, world health crises, the general
economic downturn or unforeseen reductions in orders from commercial airlines,
could significantly decrease our results of operations and financial
condition. See “Business – Titanium industry – Commercial aerospace
sector.”
Sales
under LTAs with customers in the commercial aerospace sector accounted for
approximately 42% of our 2009 total sales. These LTAs expire at
various times beginning in 2011 through 2017. If we are unable to
maintain our relationships with our major commercial aerospace customers,
including Boeing, Rolls-Royce, Safran, UTC and Wyman-Gordon, under the LTAs we
have with these customers, our sales could decrease substantially, negatively
impacting our profitability. See “Business – Customer agreements” and
“Business - Markets and
customer base.”
Global economic
conditions may affect pricing and demand for our products which could lead to
reduced revenues and profitability. Pricing and demand for our
products are affected by a number of factors, including changes in demand for
our customer’s products, changes in general economic conditions, availability of
credit, changes in market demand, lower overall pricing due to overcapacity,
lower priced imports and increases in the use of substitute
materials. The recent global economic downturn could continue, which
could lead to further reductions in demand for our products and our customers’
products, excess inventory within the titanium supply chain and excess capacity
throughout the industry, including our manufacturing
locations. Furthermore, reductions in credit generally available in
the financial markets could have adverse impacts to the industry including our
business. In addition to the impact that global economic conditions
have already had on our business, if these conditions persist or worsen, our
financial condition and results of operations may be further
impacted.
The titanium
metals industry is highly competitive, and we may not be able to compete
successfully. The global titanium markets in which we operate
are highly competitive. Competition is based on a number of factors,
such as price, product quality and service. Some of our competitors
may be able to drive down market prices because their costs are lower than our
costs. In addition, some of our competitors' financial, technological
and other resources may be greater than our resources, and such competitors may
be better able to withstand changes in market conditions. Our
competitors may be able to respond more quickly than we can to new or emerging
technologies and changes in customer requirements. Further,
consolidation of our competitors or customers in any of the industries in which
we compete may result in reduced demand for our products. In
addition, producers of metal products, such as steel and aluminum, maintain
forging, rolling and finishing facilities. Such facilities could be
used or modified to process titanium mill products, which could lead to
increased competition and decreased pricing for our titanium
products. In addition, many factors, including excess capacity
resulting from reduced demand in the titanium industry, work to intensify the
price competition for available business at low points in the business
cycle.
Our dependence
upon certain critical raw materials that are subject to price and availability
fluctuations could lead to increased costs or delays in the manufacture and sale
of our products. We rely on a limited number of suppliers
around the world, and principally on those located in Australia and South
Africa, for our supply of titanium-containing rutile ore, one of the primary raw
materials used in the production of titanium sponge. While chlorine,
another of the primary raw materials used in the production of titanium sponge,
is generally widely available, we currently obtain our chlorine from a single
supplier near our sponge plant in Henderson. Also, we cannot supply
all our needs for all grades of titanium sponge and scrap internally and are
therefore dependent on third parties for a substantial portion of our raw
material requirements. All of our major competitors utilize sponge
and scrap as raw materials in their melt operations. Titanium scrap
is also used in certain steel-making operations, and demand for these steel
products, especially from China, also influences demand for titanium
scrap. Purchase prices and availability of these critical materials
are subject to volatility. At any given time, we may be unable to
obtain an adequate supply of these critical materials on a timely basis, on
price and other terms acceptable to us, or at all. To help stabilize
our supply of titanium sponge, we have entered into LTAs with certain sponge
suppliers that contain fixed annual supply obligations. These LTAs
contain minimum annual purchase requirements and, in certain cases, include
take-or-pay provisions which require us to pay penalties if we do not meet the
minimum annual purchase requirements. See “Business – Products and Operations –
Raw materials,”
“Management’s Discussion and Analysis of Financial Condition and Results of
Operations – Liquidity and Capital Resources – Contractual commitments” and
Note 15 to the Consolidated Financial Statements.
Although
overall inflationary trends in recent years have been moderate, during the same
period certain critical raw material costs in our industry, including titanium
sponge and scrap, have been volatile. While we are able to mitigate
some of the adverse impact of fluctuating raw material costs through LTAs with
suppliers and customers, rapid increases in raw material costs may adversely
affect our results of operations.
We may be forced
to decrease prices. We change prices on certain of our
products from time-to-time. Prices for our products are dependent on
market conditions, economic factors, raw material costs and availability,
competitive factors, operating costs and other factors, some of which are beyond
our control. These factors may force us to reduce the prices we
charge our customers. In some instances, we may realize cost savings
in connection with the price reductions, but the cost savings may lag behind due
to long manufacturing lead times and the terms of existing
contracts. Pricing under our LTAs, which were designed to limit
selling price volatility to our customers and us, are generally revised on an
annual basis. These factors have had, and may have, an adverse impact
on our revenues, operating results and financial condition.
Our failure to
develop new markets would result in our continued dependence on the cyclical
commercial aerospace sector, and our operating results would, accordingly,
remain cyclical. In an effort to reduce dependence on the
commercial aerospace market and to increase participation in other markets, we
have devoted certain resources to developing new markets and applications for
our products. Developing these emerging market applications involves
substantial risk and uncertainties due to the fact that titanium must compete
with less expensive alternative materials in these potential markets or
applications. We may not be successful in developing new markets or
applications for our products, significant time may be required for such
development and uncertainty exists as to the extent to which we will face
competition in this regard.
Because we are
subject to environmental and worker safety laws and regulations, we may be
required to remediate the environmental effects of our operations or take steps
to modify our operations to comply with these laws and regulations, which could
reduce our profitability. Various federal, state, local and
foreign environmental and worker safety laws and regulations govern our
operations. Throughout the history of our operations, we have used
and manufactured, and currently use and manufacture, substantial quantities of
substances that are considered hazardous, extremely hazardous or toxic under
environmental and worker safety and health laws and
regulations. Although we have substantial controls and procedures
designed to reduce the risk of environmental, health and safety issues, we could
incur substantial cleanup costs, fines and civil or criminal sanctions, third
party property damage or personal injury claims as a result of violations or
liabilities under these laws or non-compliance with environmental permits
required at our facilities. In addition, government environmental
requirements or the enforcement thereof may become more stringent in the
future. Some or all of these risks may result in liabilities that
could reduce our profitability.
Reductions in, or
the complete elimination of, any or all tariffs on imported titanium products
into the United States could lead to increased imports of foreign sponge, ingot,
slab and mill products into the U.S. and an increase in the amount of such
products on the market generally, which could decrease pricing for our
products. In the U.S. titanium market, the increasing presence
of foreign participants has become a significant competitive
factor. Until 1993, imports of foreign titanium products into the
U.S. had not been significant. This was primarily attributable to
relative currency exchange rates and, with respect to Japan, Russia, Kazakhstan
and Ukraine, import duties (including antidumping duties). However,
since 1993, imports of titanium sponge, ingot and mill products, principally
from Russia and Kazakhstan, have increased and have had a significant
competitive impact on the U.S. titanium industry.
Generally,
imports of titanium products into the U.S. are subject to a 15% “normal trade
relations” tariff. For tariff purposes, titanium products are broadly
classified as either wrought (billet, bar, sheet, strip, plate and tubing) or
unwrought (sponge, ingot and slab). From time-to-time, the U.S.
government has granted preferential trade status to certain titanium products
imported from particular countries (notably wrought titanium products from
Russia, which carried no U.S. import duties from approximately 1993 until
2004). It is possible that such preferential status could be granted
again in the future, and we may not be successful in resisting efforts to
eliminate duties or tariffs on titanium products. See discussion of
Doha Round in “Business – Competition.”
We may be unable
to reach or maintain satisfactory collective bargaining agreements with unions
representing a significant portion of our employees. Our
production and maintenance workers in Henderson and our production, maintenance,
clerical and technical workers in Toronto, are represented by the United
Steelworkers of America under contracts expiring in January 2011 and June 2011,
for the respective locations. A majority of the salaried and hourly
employees at our European facilities are represented by various European labor
unions. Our labor agreement with our managerial and professional U.K.
employees expires in March 2011, and our labor agreement with our U.K.
production and maintenance employees expires in December 2011. The
agreements with our French and Italian employees are renewed
annually. A prolonged labor dispute or work stoppage could materially
impact our operating results. We may not succeed in concluding
collective bargaining agreements with the unions on terms acceptable to us or
maintaining satisfactory relations under existing collective bargaining
agreements. If our employees were to engage in a strike, work
stoppage or other slowdown, we could experience a significant disruption of our
operations or higher ongoing labor costs.
7
Global climate
change legislation could negatively impact our financial results or limit our
ability to operate our businesses. We operate production
facilities in several countries, and we believe all of our worldwide production
facilities are in substantial compliance with applicable environmental
laws. In many of the countries in which we operate, legislation has
been passed, or proposed legislation is being considered, to limit green house
gases through various means, including emissions permits and/or energy
taxes. In several of our production facilities, we consume large
amounts of energy, including electricity and natural gas. The permit
system currently in effect in the various countries in which we operate has not
had a material adverse effect on our financial results. However, if
green house gas legislation were to be enacted in one or more countries, it
could negatively impact our future results of operations through increased costs
of production, particularly as it relates to our energy
requirements. If such increased costs of production were to
materialize, we may be unable to pass price increases onto our customers to
compensate for those costs, which may decrease our liquidity, operating
income and results of operations.
ITEM
1B: UNRESOLVED STAFF COMMENTS
Not
applicable.
ITEM
2: PROPERTIES
Set forth
below is a listing of our major production facilities. In addition to
our U.S. sponge capacity discussed below, our worldwide melting capacity
aggregates approximately 68,450 metric tons (estimated 20% of
worldwide annual practical capacity) as of December 31, 2009, and our mill
product capacity aggregates approximately 27,700 metric tons (estimated 18% of
worldwide annual practical capacity) as of December 31, 2009. Of our
worldwide melting capacity, 46% is represented by EB melting furnaces, 53% by
vacuum arc remelting (“VAR”) furnaces and 1% by a vacuum induction melting
(“VIM”) furnace.
|
December
31, 2009
Annual
Practical Capacity (3)
|
||||||||
|
Manufacturing
Location
|
Products
Manufactured
|
Sponge
|
Melted
Products
|
Mill
Products
|
||||
|
(metric
tons)
|
||||||||
|
Henderson,
Nevada (1)
|
Sponge,
Ingot
|
12,600
|
12,250
|
-
|
||||
|
Morgantown,
Pennsylvania (1)
|
Slab,
Ingot
|
-
|
40,700
|
-
|
||||
|
Toronto,
Ohio (1)
|
Billet,
Bar, Plate, Sheet, Strip
|
-
|
-
|
15,000
|
||||
|
Vallejo,
California (2)
|
Ingot
(including non- titanium superalloys)
|
-
|
1,600
|
-
|
||||
|
Ugine,
France (2)
(4)
|
Ingot,
Billet
|
-
|
3,200
|
2,600
|
||||
|
Waunarlwydd,
Wales(1)
|
Bar,
Plate, Sheet
|
-
|
-
|
3,100
|
||||
|
Witton,
England (2)
|
Ingot,
Billet, Bar
|
-
|
10,700
|
7,000
|
||||
(1) Owned
facility.
(2) Leased
facility.
|
(3)
|
Practical
capacities are variable based on product mix and in some cases are not
additive. These capacities are as of December 31,
2009.
|
(4) Practical
capacities are based on the approximate maximum equivalent product that CEZUS is
contractually obligated to provide.
During
the past three years, our major production facilities have operated at varying
levels of practical capacity. Overall our plants operated at 88% of practical
capacity in 2007, 81% in 2008 and 47% in 2009, with our melting operations at
44% utilization and our mill product operations at 49% utilization during
2009. While practical capacity and utilization measures can vary
significantly based upon the mix of products produced, we anticipate operating
our plants at slightly increased production levels in 2010.
United States
production. We produce premium-grade titanium sponge at our
facility in Henderson. Our U.S. melting facilities in Henderson,
Morgantown and Vallejo produce ingot and slab, which are either used as
feedstock for our mill products operations or sold to third
parties. In early 2009, we completed an 8,500 metric ton expansion of
our EB melt capacity in Morgantown, which became operational in the fourth
quarter of 2009, increasing our total EB melt capacity by approximately
26%. We produce titanium mill products in the U.S. at our forging and
rolling facility in Toronto, which receives ingot and slab principally from our
U.S. melting facilities.
Under
various conversion services agreements with third-party vendors, we have access
to a dedicated annual capacity at certain of our vendors’
facilities. Our access to outside conversion services includes
dedicated annual rolling capacity of at least 4,500 metric tons until 2026, with
the option to increase the output capacity to 9,000 metric
tons. Additionally, we have access to dedicated annual forging
capacity of 3,300 metric tons and ramping up to 8,900 metric tons for 2011
through at least 2019. These agreements provide us with long-term
secure sources for processing round and flat products, resulting in a
significant increase in our existing mill product conversion capabilities, which
allows us to assure our customers of our long-term ability to meet their
needs.
European
production. We conduct our operations in Europe primarily
through our wholly owned subsidiaries, TIMET UK, Ltd. and Loterios S.p.A., and
our 70% owned subsidiary, TIMET Savoie. TIMET UK’s Witton laboratory
and manufacturing facilities are leased pursuant to long-term operating leases
expiring in 2014 and 2024, respectively. TIMET UK’s melting facility
in Witton produces VAR ingot used primarily as feedstock for our Witton forging
operations. TIMET UK forges the ingot into billet products for sale
to third parties or into an intermediate product for further processing into bar
or plate at our facility in Waunarlwydd.
TIMET
Savoie has the right to utilize portions of the Ugine plant of Compagnie
Européenne du Zirconium-CEZUS, S.A. (“CEZUS”), the owner of the 30%
noncontrolling interest in TIMET Savoie, pursuant to a conversion services
agreement which runs through 2015. TIMET Savoie’s capacity is to a
certain extent dependent upon the level of activity in CEZUS’ zirconium
business, which may from time to time provide TIMET Savoie with capacity in
excess of that which CEZUS is contractually required to provide. Our
agreement with CEZUS requires them to provide us with melt capacity up to 3,200
metric tons annually and mill product capacity up to 2,600 metric tons
annually.
Loterios
manufactures large industrial use fabrications, generally on a project
engineering and design basis, and therefore, measures of annual capacity are not
practical or meaningful.
ITEM
3: LEGAL PROCEEDINGS
From time
to time, we are involved in litigation relating to our business. See
Note 15 to the Consolidated Financial Statements.
ITEM
4: RESERVED
8
PART
II
ITEM
5: MARKET
FOR REGISTRANT’S COMMON EQUITY, RELATED STOCKHOLDER MATTERS AND ISSUER PURCHASES
OF EQUITY SECURITIES
Our
common stock is traded on the New York Stock Exchange (symbol:
TIE). The high and low sales prices for our common stock during 2008,
2009 and the first two months of 2010 are set forth below. All prices
(as well as all share numbers referenced herein) have been adjusted to reflect
previously affected stock splits.
|
Year
ended December 31, 2008:
|
High
|
Low
|
||||||
|
First quarter
|
$ | 26.79 | $ | 13.05 | ||||
|
Second quarter
|
$ | 19.65 | $ | 13.33 | ||||
|
Third quarter
|
$ | 15.00 | $ | 9.80 | ||||
|
Fourth quarter
|
$ | 11.32 | $ | 5.31 | ||||
|
Year
ended December 31, 2009:
|
||||||||
|
First quarter
|
$ | 9.89 | $ | 4.04 | ||||
|
Second quarter
|
$ | 11.52 | $ | 5.25 | ||||
|
Third quarter
|
$ | 10.63 | $ | 7.34 | ||||
|
Fourth quarter
|
$ | 13.18 | $ | 8.39 | ||||
|
January
1, 2009 to February 19, 2010
|
$ | 15.33 | $ | 10.54 | ||||
On
February 19, 2010, the closing price of TIMET common stock was
$12.06 per share, and there were approximately 2,275 stockholders of
record of TIMET common stock.
Our
Series A Preferred Stock is not mandatorily redeemable but is redeemable at our
option at any time after September 1, 2007. Holders of the Series A
Preferred Stock are entitled to receive cumulative cash dividends at the rate of
6.75% of the $50 per share liquidation preference per annum per share
(equivalent to $3.375 per annum per share), when, as and if declared by our
board of directors. Whether or not declared, cumulative dividends on
Series A Preferred Stock are deducted from net income to arrive at net income
attributable to common stockholders. Our U.S. long-term credit
agreement contains certain financial covenants that may restrict our ability to
make dividend payments on the Series A Preferred Stock.
During
2007, an aggregate of 1.6 million shares of our Series A Preferred Stock were
converted into 21.3 million shares of our common stock, and a nominal number of
our Series A Preferred shares were converted into a nominal number of shares of
our common stock in 2008. No Series A Preferred Stock was converted
during 2009. As a result of these conversions, approximately 0.1
million shares of Series A Preferred Stock remain outstanding as of December 31,
2008 and 2009.
We
initiated a quarterly dividend on our common stock during the fourth quarter of
2007 resulting in dividends of $13.7 million, or $0.075 per common share during
2007, and we paid an aggregate of $54.5 million, or $0.30 per common share, in
dividends on our common stock during 2008. In February 2009, our
board of directors suspended our quarterly common stock dividend after
considering the current economic and financial
environment. Declaration and payment of future dividends on our
common stock, and the amount thereof, is discretionary and is dependent upon our
results of operations, financial condition, cash requirements for our business,
contractual requirements and restrictions and other factors deemed relevant by
our board of directors. The amount and timing of past dividends is
not necessarily indicative of the amount and timing of future dividends which we
might pay. In this regard, our U.S. long-term credit agreement
contains certain financial covenants that may restrict our ability to make
dividend payments on our common stock.
During
2007, our board of directors authorized the repurchase of up to $100 million of
our common stock in open market transactions or in privately negotiated
transactions, with any repurchased shares to be retired and
cancelled. During 2008 and 2009, we purchased 2.3 million and 1.5
million shares, respectively, of our common stock in open market transactions
for an aggregate purchase price of $36.5 million and $14.7 million,
respectively, and all shares acquired under this repurchase program during 2008
and 2009 have been cancelled. The following table discloses certain
information regarding the shares of our common stock we purchased during the
fourth quarter of 2009 (we made no purchases during November
2009). All of these purchases were made under the repurchase program
in open market transactions.
|
Period
|
Total
number of shares purchased
|
Average
price paid per share
|
Total
number of shares purchased as part of the publicly announced
plan
|
Maximum
dollar value that may yet be purchased under the publicly announced
plan
|
||||||||||||
|
(In
millions)
|
||||||||||||||||
|
October
1, 2009 to October 31, 2009
|
485,437 | $ | 10.35 | 485,437 | $ | 52.6 | ||||||||||
|
December
1, 2009 to December 31, 2009
|
375,000 | $ | 10.00 | 375,000 | $ | 48.8 | ||||||||||
Performance
graph. Set forth below is a line graph comparing, for the
period December 31, 2004 through December 31, 2009, the cumulative total
stockholder return on our common stock against the cumulative total return of
(a) the S&P Composite 500 Stock Index and (b) a self-selected peer group,
comprised solely of RTI International Metals, Inc. (NYSE: RTI), our principal
U.S. competitor with significant operations primarily in the titanium metals
industry for which meaningful stockholder return information is
available. The graph shows the value at December 31 of each year,
assuming an original investment of $100 in each and reinvestment of cash
dividends and other distributions to stockholders.
Comparison
of Cumulative Return among Titanium Metals Corporation,
S&P
500 Composite Index and Self-Selected Peer Group
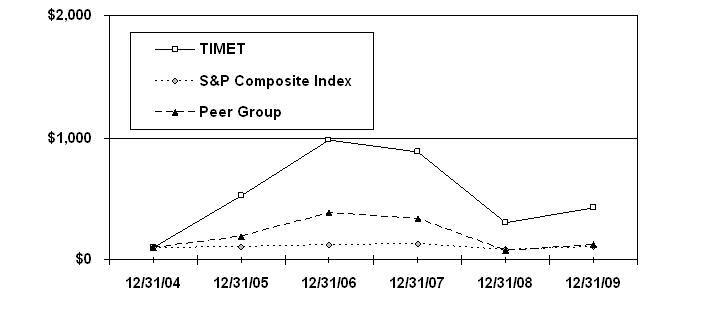
The information contained in the
performance graph shall not be deemed “soliciting material” or “filed” with the
SEC, or subject to the liabilities of Section 18 of the Securities Exchange Act,
except to the extent we specifically request that the material be treated as
soliciting material or specifically incorporates this performance graph by
reference into a document filed under the Securities Act or the Securities
Exchange Act.
9
Equity
compensation plan information. We have certain equity
compensation plans, all of which were approved by our stockholders, which
provide for the discretionary grant to our employees and directors of, among
other things, options to purchase our common stock and stock
awards. As of December 31, 2008, there were a nominal number of
options under all such plans to purchase shares of our common stock, all of
which were exercised on or before February 23, 2009. We issued a
nominal number of unrestricted common shares to our non-employee directors
during 2008 and 2009, and awards representing an aggregate total of up to 0.5
million common shares were available for future grant or issuance under the
plans. See Note 9 to the Consolidated Financial
Statements.
ITEM
6: SELECTED FINANCIAL
DATA
The
selected financial data set forth below should be read in conjunction with our
Consolidated Financial Statements and Item 7 – MD&A:
|
Year
ended December 31,
|
||||||||||||||||||||
|
2005
|
2006
|
2007
|
2008
|
2009
|
||||||||||||||||
|
($
in millions, except per share and product shipment data)
|
||||||||||||||||||||
|
STATEMENT
OF INCOME DATA:
|
||||||||||||||||||||
|
Net sales
|
$ | 749.8 | $ | 1,183.2 | $ | 1,278.9 | $ | 1,151.5 | $ | 774.0 | ||||||||||
|
Gross margin
|
199.4 | 436.1 | 447.4 | 287.7 | 113.3 | |||||||||||||||
|
Operating income
|
171.1 | 382.8 | 372.0 | 219.7 | 54.9 | |||||||||||||||
|
Interest expense
|
4.0 | 3.4 | 2.6 | 1.8 | 0.8 | |||||||||||||||
|
Net income
|
160.8 | 290.0 | 276.7 | 168.2 | 35.8 | |||||||||||||||
|
Net income attributable to TIMET
common stockholders
|
143.7 | 274.5 | 263.1 | 162.2 | 34.3 | |||||||||||||||
|
Earnings per share attributable to
TIMET
stockholders:
|
||||||||||||||||||||
|
Basic (1)
|
$ | 1.10 | $ | 1.77 | $ | 1.62 | $ | 0.89 | $ | 0.19 | ||||||||||
|
Diluted (1)
|
0.86 | 1.53 | 1.46 | 0.89 | 0.19 | |||||||||||||||
|
Dividends per common
share
|
- | - | 0.075 | 0.30 | - | |||||||||||||||
|
BALANCE
SHEET DATA:
|
||||||||||||||||||||
|
Cash and cash
equivalents
|
$ | 17.7 | $ | 29.4 | $ | 90.0 | $ | 45.0 | $ | 169.4 | ||||||||||
|
Total assets (2)
|
907.3 | 1,216.9 | 1,419.9 | 1,367.7 | 1,378.6 | |||||||||||||||
|
Outstanding indebtedness (4)
|
51.6 | 0.7 | 0.5 | 0.2 | 0.1 | |||||||||||||||
|
Debt payable to Capital
Trust
|
5.9 | - | - | - | - | |||||||||||||||
| TIMET stockholders’ equity (2) (3) | 562.2 | 878.9 | 1,132.7 | 1,079.6 | 1,107.0 | |||||||||||||||
| Total equity (3) | 575.7 | 900.2 | 1,156.6 | 1,100.3 | 1,124.1 | |||||||||||||||
|
CASH
FLOW DATA:
|
||||||||||||||||||||
|
Cash flows provided by (used
in):
|
||||||||||||||||||||
|
Operating
activities
|
$ | 72.9 | $ | 79.1 | $ | 192.1 | $ | 197.6 | $ | 206.8 | ||||||||||
|
Investing
activities
|
(61.5 | ) | (26.5 | ) | (108.2 | ) | (142.6 | ) | (64.1 | ) | ||||||||||
|
Financing
activities
|
- | (42.5 | ) | (24.5 | ) | (97.7 | ) | (20.3 | ) | |||||||||||
|
Net cash provided
(used)
|
$ | 11.4 | $ | 10.1 | $ | 59.4 | $ | (42.7 | ) | $ | 122.4 | |||||||||
|
Melted
product shipments:
|
||||||||||||||||||||
|
Volume (metric
tons)
|
5,655 | 5,900 | 4,720 | 3,850 | 2,750 | |||||||||||||||
|
Average selling price (per
kilogram)
|
$ | 19.85 | $ | 38.30 | $ | 40.65 | $ | 30.00 | $ | 25.10 | ||||||||||
|
Mill
product shipments:
|
||||||||||||||||||||
|
Volume (metric
tons)
|
12,660 | 14,160 | 14,230 | 15,050 | 11,425 | |||||||||||||||
|
Average selling price (per
kilogram)
|
$ | 41.75 | $ | 57.85 | $ | 66.90 | $ | 60.70 | $ | 55.60 | ||||||||||
|
Order
backlog at December 31 (5)
|
$ | 870 | $ | 1,125 | $ | 1,000 | $ | 695 | $ | 440 | ||||||||||
|
Capital
expenditures
|
$ | 61.1 | $ | 100.9 | $ | 100.9 | $ | 121.3 | $ | 33.0 | ||||||||||
|
(1)
|
All
share and per share disclosures for all periods presented have been
adjusted to give effect of all stock splits to
date.
|
|
(2)
|
We
adopted the accounting and disclosure requirements for the funding status
of pension and OPEB plans within ASC Topic 715 effective December 31,
2006.
|
|
(3)
|
We
adopted the accounting and disclosure requirements for noncontrolling
interest within ASC Topic 810 effective January 1, 2007. See
Note 2 to our Consolidated Financial
Statements.
|
|
(4)
|
Outstanding
indebtedness represents notes payable, current and noncurrent debt and
capital lease obligations.
|
|
(5)
|
Order
backlog is defined as unfilled purchase orders (including those under
consignment arrangements), which are generally subject to deferral or
cancellation by the customer under certain
conditions.
|
10
ITEM
7: MANAGEMENT’S
DISCUSSION AND ANALYSIS OF FINANCIAL CONDITION AND
RESULTS OF OPERATIONS
SUMMARY
General
overview. We are a vertically integrated producer of titanium
sponge, melted products and a variety of mill products for commercial aerospace,
military, industrial and other applications. We are one of the
world’s leading producers of titanium melted products (ingot, electrode and
slab) and mill products (billet, bar, plate, sheet and strip). We are
the only producer with major titanium production facilities in both the United
States and Europe, the world’s principal markets for titanium. We are
currently the largest producer of titanium sponge, a key raw material, in the
United States.
We sell
our titanium melted and mill products into four worldwide market
sectors. Aggregate shipment volumes for titanium mill products in
2009 were derived from the following sectors:
|
TIMET
|
Titanium
Industry (1)
|
|||||||
|
Mill
product shipments
|
%
of total
|
Mill
product shipments
|
%
of total
|
|||||
|
(Metric
tons)
|
(Metric
tons)
|
|||||||
|
Commercial
aerospace
|
7,643
|
67%
|
29,800
|
46%
|
||||
|
Military
|
1,942
|
17%
|
5,800
|
9%
|
||||
|
Industrial
|
1,558
|
14%
|
27,600
|
43%
|
||||
|
Emerging
markets
|
282
|
2%
|
1,700
|
2%
|
||||
|
11,425
|
100%
|
64,900
|
100%
|
|||||
|
(1) Estimates
based on our titanium industry experience and information obtained from
publicly-available external resources (e.g., United States Geological
Survey, International Titanium Association and Japan Titanium
Society).
|
||||||||
The
titanium industry derives a substantial portion of its demand from the highly
cyclical commercial aerospace sector. As shown in the table above,
our business is more dependent on commercial aerospace demand than is the
overall titanium industry.
CRITICAL
ACCOUNTING POLICIES AND ESTIMATES
We
prepare our Consolidated Financial Statements in accordance with accounting
principles generally accepted in the United States of America. In the
preparation of these financial statements, we are required to make estimates and
judgments, and select from a range of possible estimates and assumptions, that
affect the reported amounts of assets and liabilities and disclosure of
contingent assets and liabilities at the date of the financial statements and
the reported amount of revenues and expenses during the reported
period. On an on-going basis, we evaluate our estimates, including
those related to allowances for uncollectible accounts receivable, inventory
allowances, asset lives, impairments of investments, the recoverability of other
long-lived assets, including property and equipment, pension and other
postretirement benefit obligations and the related underlying actuarial
assumptions, the realization of deferred income tax assets, and accruals for
asset retirement obligations, environmental remediation, litigation, income tax
and other contingencies. We base our estimates and judgments, to
varying degrees, on historical experience, advice of external specialists and
various other factors we believe to be prudent under the
circumstances. Actual results may differ from previously estimated
amounts and such estimates, assumptions and judgments are regularly subject to
revision.
We
consider the policies and estimates discussed below to be critical to an
understanding of our financial statements because their application requires our
most significant judgments in estimating matters for financial reporting that
are inherently uncertain. See Notes to the Consolidated Financial
Statements for additional information on these policies and estimates, as well
as discussion of additional accounting policies and estimates.
Inventory
valuation. We provide reserves for estimated obsolete or
unmarketable inventories equal to the difference between the cost of inventories
and the estimated net realizable value using assumptions about future demand for
our products, alternate uses of the inventory and market
conditions. If actual market conditions are less favorable than those
projected by us, we may be required to recognize additional inventory
reserves.
Impairment of
marketable securities. We evaluate our investments whenever
events or conditions occur to indicate that the fair value of such investments
has declined below their carrying amounts. If the carrying amount for
an investment declines below its historical cost basis, we evaluate all
available positive and negative evidence including, but not limited to, the
extent and duration of the impairment, business prospects for the investee and
our intent and ability to hold the investment for a reasonable period of time
sufficient for the recovery of fair value. If the decline in fair
value is judged to be other than temporary, the carrying amount of the
investment is written down to fair value. See Note 4 to the
Consolidated Financial Statements for a discussion of our analysis of our
investment in Valhi common stock.
Impairment of
long-lived assets. Generally, when events or changes in
circumstances indicate that the carrying amount of long-lived assets, including
property and equipment and intangible assets may not be recoverable, we
undertake an evaluation of the assets or asset group. If this
evaluation indicates that the carrying amount of the asset or asset group is not
recoverable, the amount of the impairment would typically be calculated using
discounted expected future cash flows or appraised values. All
relevant factors are considered in determining whether an impairment
exists. We did not evaluate any long-lived assets for impairment
during 2009 because no such impairment indicators were present. If
decreased demand for our products continues or worsens, we may be required to
reduce our production levels by idling certain equipment or
facilities. In that event, we may be required to evaluate certain of
our long-lived assets for impairment, in which case it is possible we might
conclude that recognition of an impairment charge was appropriate.
Income
taxes. We record a
valuation allowance if realization of our gross deferred income tax assets is
not more-likely-than-not after giving consideration to recent historical results
and near-term projections, and we also consider the availability of tax planning
strategies that might impact the need for, or amount of, any valuation
allowance.
We also
evaluate at the end of each reporting period whether some or all of the
undistributed earnings of our foreign subsidiaries are permanently reinvested
(as that term is defined in generally accepted accounting
principles). While we may have concluded in the past that some
undistributed earnings are permanently reinvested, facts and circumstances can
change in the future, such as a change in the expectation regarding the capital
needs of our foreign subsidiaries, which could result in a conclusion that some
or all of the undistributed earnings are no longer permanently
reinvested. If our prior conclusions change, we would recognize a
deferred income tax liability in an amount equal to the estimated incremental
U.S. income tax and withholding tax liability that would be generated if all of
such previously-considered permanently reinvested undistributed earnings were
distributed to us. We did not change our conclusions on our
undistributed foreign earnings in 2009.
Beginning
in 2007, we began recording reserves for uncertain tax positions in accordance
with the provisions of ASC Topic 740, Income Taxes, for tax positions where we
believe it is more-likely-than-not our position will not prevail with the
applicable tax authorities. From time to time, tax authorities will
examine certain of our income tax returns. Tax authorities may
interpret tax regulations differently than we do. Judgments and
estimates made at a point in time may change based on the outcome of tax audits
and changes to or further interpretations of regulations, thereby resulting in
an increase or decrease in the amount we are required to accrue for uncertain
tax positions (and therefore a decrease or increase in our reported net income
in the period of such change). Our reserve for uncertain tax positions changed
during 2009. See “Results of Operations – Income taxes” for discussion
of our analysis of our deferred income tax valuation allowances and Note 2 to
the Consolidated Financial Statements for a discussion of our uncertain tax
positions.
Pension and OPEB
expenses and obligations. Our pension and OPEB expenses and
obligations are calculated based on several estimates, including discount rates
and expected rates of return on plan assets. We review these rates
annually with the assistance of our actuaries. See further discussion
of the factors considered and potential effect of these estimates in “Liquidity
and Capital Resources – Defined benefit pension
plans” and “Liquidity and Capital Resources – Postretirement benefit plans other
than pensions.”
11
RESULTS
OF OPERATIONS
Comparison
of 2009 to 2008
Summarized
financial information. The following table summarizes certain
information regarding our results of operations for the years ended December 31,
2008 and 2009. Our reported average selling prices reflect actual
selling prices after the effects of currency exchange rates, customer and
product mix and other related factors throughout the periods
presented.
|
For
the year ended December 31,
|
||||||||||||||||
|
2008
|
%
of total
net
sales
|
2009
|
%
of total
net
sales
|
|||||||||||||
|
(In
millions, except product shipment data)
|
||||||||||||||||
|
Net
sales:
|
||||||||||||||||
|
Melted products
|
$ | 115.5 | 10 | % | $ | 69.0 | 9 | % | ||||||||
|
Mill products
|
913.5 | 79 | % | 635.2 | 82 | % | ||||||||||
|
Other titanium
products
|
122.5 | 11 | % | 69.8 | 9 | % | ||||||||||
|
Total net sales
|
1,151.5 | 100 | % | 774.0 | 100 | % | ||||||||||
|
Cost
of sales
|
863.8 | 75 | % | 660.7 | 85 | % | ||||||||||
|
Gross
margin
|
287.7 | 25 | % | 113.3 | 15 | % | ||||||||||
|
Selling,
general, administrative and development
expense
|
66.5 | 6 | % | 60.4 | 8 | % | ||||||||||
|
Other
(expense) income, net
|
(1.5 | ) | - | 2.0 | - | |||||||||||
|
Operating
income
|
$ | 219.7 | 19 | % | $ | 54.9 | 7 | % | ||||||||
|
Melted
product shipments:
|
||||||||||||||||
|
Volume (metric
tons)
|
3,850 | 2,750 | ||||||||||||||
|
Average selling price (per
kilogram)
|
$ | 30.00 | $ | 25.10 | ||||||||||||
|
Mill
product shipments:
|
||||||||||||||||
|
Volume (metric
tons)
|
15,050 | 11,425 | ||||||||||||||
|
Average selling price (per
kilogram)
|
$ | 60.70 | $ | 55.60 | ||||||||||||
Net
sales. Our net sales were $774.0 million for 2009 compared to
net sales of $1,151.5 million for 2008. The 33% decrease in net sales
was principally the result of reduced volumes and, to a lesser extent, lower
average selling prices in 2009 compared to 2008. Product shipment
volumes decreased 29% for melted products and 24% for mill products from 2008 to
2009, as overall titanium demand declined due to the weak global economy and the
effects of production delays within the commercial aerospace
sector. Additionally, as a result of these production delays, we
believe many of our customers implemented strategies to reduce excess
inventories and to maximize operating cash flows. Average selling
prices decreased 16% for melted products and 8% for mill products over these
same periods due to competitive pricing pressures resulting from lower demand
for titanium products and a decline in raw material costs, primarily titanium
scrap. The decline in raw material costs has contributed to lower
selling prices for certain products under long-term customer agreements, in part
due to raw material indexed pricing adjustments included in certain of these
agreements.
Gross
margin. For 2009, our
gross margin was $113.3 million as compared to $287.7 million for 2008,
primarily reflecting the effects of lower volumes and average selling prices for
our melted and mill products. Due to low utilization of our
production capacity, the favorable impacts on our gross margin from declining
raw material costs, primarily titanium scrap, were largely offset by higher
per-unit overhead costs. In addition, abnormally low production
throughout our major manufacturing operations resulted in unabsorbed fixed
overhead costs of $23.2 million for 2009.
Operating
income. Our operating income for 2009 was $54.9 million
compared to $219.7 million during 2008 primarily reflecting the decline in gross
margin.
Net other
non-operating income and expense. During 2009, we recognized
other non-operating income of $2.4 million. During 2008, we
recognized other non-operating income of $19.4 million consisting primarily of
$9.9 million in foreign currency gains as the dollar strengthened against the
pound sterling and the euro in the second half of 2008 and a $6.7 million gain
on sale of an investment discussed in Note 11 to the Consolidated Financial
Statements.
Income taxes.
Our effective income tax rate was 37% in 2009 compared to 29% in
2008. Our effective income tax rate for 2009 was higher than the U.S.
statutory rate, primarily due to the net effects of lower earnings, changes in
foreign tax law that caused us to revise our judgments regarding our ability to
utilize certain foreign tax attributes and incremental taxes on foreign
earnings. We operate in multiple tax jurisdictions, and as a result,
the geographic mix of our pre-tax income or loss can impact our overall
effective tax rate. Our effective income tax rate in the 2008 period
was lower than the U.S. statutory rate due to the implementation of an internal
corporate reorganization prior to 2008. See Note 12 to the
Consolidated Financial Statements for a tabular reconciliation of our statutory
income tax expense to our actual tax expense. Some of the more
significant items impacting this reconciliation are summarized
below.
Our
income tax expense in 2009 includes:
|
|
·
|
An
income tax benefit of $5.4 million related to an internal reorganization
we implemented in the second quarter of 2007;
and
|
|
|
·
|
An
income tax expense of $3.0 million related to an increase in our reserve
for uncertain tax positions.
|
Our
income tax expense in 2008 includes:
|
|
·
|
An
income tax benefit of $14.4 million related to an internal reorganization
we implemented in the second quarter of
2007;
|
|
|
·
|
An
income tax benefit of $1.9 million related to the reversal of our deferred
income tax asset valuation allowance related to our capital loss
carryforward following the sale of an investment;
and
|
|
|
·
|
An
income tax expense of $2.7 million related to an increase in our reserve
for uncertain tax positions.
|
U.K.
legislation enacted in 2009 will increase our future effective income tax rate
and our cash tax payments.
12
Comparison
of 2008 to 2007
Summarized
financial information. The following table summarizes certain
information regarding our results of operations for the years ended December 31,
2007 and 2008. Our reported average selling prices reflect actual
selling prices after the effects of currency exchange rates, customer and
product mix and other related factors throughout the periods
presented.
|
For
the year ended December 31,
|
||||||||||||||||
|
2007
|
%
of total net sales
|
2008
|
%
of total net sales
|
|||||||||||||
|
(In
millions, except product shipment data)
|
||||||||||||||||
|
Net
sales:
|
||||||||||||||||
|
Melted products
|
$ | 191.9 | 15 | % | $ | 115.5 | 10 | % | ||||||||
|
Mill products
|
952.0 | 74 | % | 913.5 | 79 | % | ||||||||||
|
Other titanium
products
|
135.0 | 11 | % | 122.5 | 11 | % | ||||||||||
|
Total net sales
|
1,278.9 | 100 | % | 1,151.5 | 100 | % | ||||||||||
|
Cost
of sales
|
831.5 | 65 | % | 863.8 | 75 | % | ||||||||||
|
Gross
margin
|
447.4 | 35 | % | 287.7 | 25 | % | ||||||||||
|
Selling,
general, administrative and development
expense
|
69.0 | 5 | % | 66.5 | 6 | % | ||||||||||
|
Other
expense, net
|
6.4 | 1 | % | 1.5 | - | |||||||||||
|
Operating
income
|
$ | 372.0 | 29 | % | $ | 219.7 | 19 | % | ||||||||
|
Melted
product shipments:
|
||||||||||||||||
|
Volume (metric
tons)
|
4,720 | 3,850 | ||||||||||||||
|
Average selling price (per
kilogram)
|
$ | 40.65 | $ | 30.00 | ||||||||||||
|
Mill
product shipments:
|
||||||||||||||||
|
Volume (metric
tons)
|
14,230 | 15,050 | ||||||||||||||
|
Average selling price (per
kilogram)
|
$ | 66.90 | $ | 60.70 | ||||||||||||
Net
sales. Our net sales were $1,151.5 million for 2008 compared
to net sales of $1,278.9 million for 2007. Average selling prices for
melted and mill products decreased 26% and 9%, respectively, from 2007 to
2008. Revisions and delays in the build-out schedules of certain
commercial aircraft, and the resulting effects on production and inventory
levels throughout the supply-chain, negatively impacted demand and selling
prices for titanium products in 2008 compared to 2007. Declines in
raw material costs, primarily titanium scrap, also contributed to lower selling
prices for certain products under long-term agreements during 2008, due in part
to raw material indexed pricing adjustments included in certain of these
agreements.
Gross
margin. During 2008, our
gross margin was $287.7 million as compared to $447.4 million for 2007,
primarily reflecting decreases in the average selling prices for our melted and
mill products. The favorable impacts of declining costs for titanium
scrap in 2008 were substantially offset by higher costs of production, primarily
energy, and certain other raw materials.
Operating
income. Our operating income for 2008 was $219.7 million
compared to $372.0 million during 2007 primarily due to the decline in gross
margin. The 2007 period also includes a $6.0 million expense related
to previously capitalized costs associated with the planning and engineering for
a new VDP sponge plant, based on our decision to delay the project
indefinitely.
Net other
non-operating income and expense. During 2008, we recognized
other non-operating income of $19.4 million consisting primarily of $9.9 million
in foreign currency gains as the dollar strengthened against the pound sterling
and the euro in the second half of 2008 and a $6.7 million gain on sale of an
investment discussed in Note 11 to the Consolidated Financial
Statements. During 2007, we recognized other non-operating income of
$24.2 million consisting primarily of an $18.3 million gain on the sale of our
investment in CompX discussed in Note 11 to the Consolidated Financial
Statements.
Income taxes.
Our effective income tax rate was 29% in 2008 compared to 30% in
2007. We operate in multiple tax jurisdictions, and as a result, the
geographic mix of our pre-tax income or loss can impact our overall effective
tax rate. Our effective income tax rate for 2008 was lower than the
U.S. statutory rate, primarily due to a change in the mix of our pre-tax
earnings, with a higher percentage of earnings in lower tax rate jurisdictions
in 2008, primarily as a result of the implementation of an internal corporate
reorganization in 2007. See Note 12 to the Consolidated Financial
Statements for a tabular reconciliation of our statutory income tax expense to
our actual tax expense. Some of the more significant items impacting
this reconciliation are summarized below.
Our
income tax expense in 2008 includes:
|
|
·
|
An
income tax benefit of $14.4 million related to an internal reorganization
we implemented in the second quarter of
2007;
|
|
|
·
|
An
income tax benefit of $1.9 million related to the reversal of our deferred
income tax asset valuation allowance related to our capital loss
carryforward following the sale of an investment;
and
|
|
|
·
|
An
income tax expense of $2.7 million related to an increase in our reserve
for uncertain tax positions.
|
Our
income tax expense in 2007 includes:
|
|
·
|
An
income tax benefit of $12.6 million related to an internal reorganization
we implemented in the second quarter of 2007
and
|
|
|
·
|
An
income tax benefit of $6.5 million related primarily to the reversal of a
portion of our deferred income tax asset valuation allowance related to
our capital loss carryforward following the sale of our interest in
CompX.
|
European
operations
We have
substantial operations located in the United Kingdom, France and
Italy. Approximately 33% of our sales originated in Europe
for 2009, a portion of which were denominated in foreign currency, principally
the British pound sterling or the euro. Certain raw material costs,
principally purchases of titanium sponge and alloys for our European operations,
are denominated in U.S. dollars, while labor and other production costs are
primarily denominated in local currencies. The functional currencies
of our European subsidiaries are those of their respective countries, and the
European subsidiaries are subject to exchange rate fluctuations that may impact
reported earnings and may affect the comparability of period-to-period operating
results. Our European operations may incur borrowings denominated in
U.S. dollars or in their respective functional currencies. Our export
sales from the U.S. are denominated in U.S. dollars and are not subject to
currency exchange rate fluctuations. We do not use currency contracts
to hedge our currency exposures.
The
translated U.S. dollar value of our foreign sales and operating results are
subject to currency exchange rate fluctuations which may favorably or adversely
impact reported earnings and may affect the comparability of period-to-period
operating results. By applying the exchange rates prevailing during
the prior year period to our local currency results of operations for the
current year period, the translation impact of currency rate fluctuations can be
estimated.
13
As the
U.S. dollar strengthened versus the British pound but weakened versus the euro
in 2008 compared to 2007 and strengthened versus the British pound and the euro
in 2009 compared to 2008, fluctuations in foreign currency exchange rates had
the following effects on our sales and operating income:
|
2008
versus 2007
|
2009
versus 2008
|
|||||||
|
(In
millions)
|
||||||||
|
Increase
(decrease) in:
|
||||||||
|
Net sales
|
$ | (4.3 | ) | $ | (38.4 | ) | ||
|
Operating income
|
0.9 | 1.1 | ||||||
Outlook
Shipments
of our titanium mill products for 2009 were 24% lower than shipments in 2008,
which reflects softness in demand, particularly within the commercial aerospace
sector. In addition to the ongoing weakness in the global economy,
circumstances within the commercial aerospace market contributed to weak demand
and lower prices for titanium products. Reduced passenger traffic and
reduced financing available to commercial airlines and aircraft leasing
companies have contributed to reduced order rates and uncertainty regarding
production schedules for commercial aircraft. Further, excess supply
chain inventories, particularly as a result of adjustments to production
schedules for Boeing and Airbus, and other factors, including delays in
development and delivery of the Boeing 787, continue to impact demand for
titanium products. We expect customer demand for our products to
stabilize and show improvement as these factors begin to be resolved and
inventory levels begin to stabilize during the next year.
As a
result of long-term agreements with a majority of our major customers, many of
which specify annual pricing mechanisms and minimum purchase commitments, we do
not anticipate significant changes in our overall sales volumes for 2010 as
compared to levels achieved during 2009, but average selling prices will likely
be somewhat lower in 2010 compared to 2009, primarily as a result of raw
materials index price adjustments in certain of our long-term
agreements. Current customer order levels indicate that the
significant destocking activity in the titanium supply chain during 2009 has
abated. Also, in recent months, open market scrap prices have been
increasing, which we believe is an indication that industry demand has
stabilized and may soon begin to increase. Boeing recently completed
successful initial test flights for the Boeing 787 and continues to target first
customer deliveries of the aircraft in the fourth quarter of 2010. If
Boeing achieves this timeline, we anticipate production rates throughout the
commercial aerospace supply chain will accelerate over the next two to three
years, which should increase customer demand for our products and positively
affect our sales and operating results. We continue to monitor our
production rates, global workforce and cost structures in response to
anticipated demand for our products. Although per-unit costs for both
melted and mill products were favorably impacted during 2009 by declining raw
material costs, primarily titanium scrap, such cost reductions have been offset
by higher per-unit production and overhead costs resulting from allocation of
such costs over lower production volumes.
Through
prudent management of production rates and costs, as well as conservative
capital investment, we continue to maintain positive cash flows and a strong
balance sheet, including $169.4 million of cash, borrowing availability under
our bank credit agreements of approximately $211.4 million and no bank debt as
of December 31, 2009. We have maintained positive earnings and
generated significant operating cash flows during the most severe recession in
decades, and we expect to continue to adjust our cost structure and production
rates as necessary to achieve positive operating cash flow and preserve our
financial strength.
We
continue to believe the overall industry outlook supports a long-term favorable
trend in demand for titanium products. This trend is driven in part
by the long-term demand in the commercial aerospace industry for a new
generation of more fuel-efficient aircraft that require a significantly higher
percentage of titanium than earlier models. In January 2010, The Airline Monitor, a
leading aerospace publication, issued its semi-annual forecast for commercial
aircraft deliveries. Aggregate annual deliveries of aircraft for
Boeing and Airbus are expected to reach record numbers during each year from
2011 through 2013 (totaling at least 1,010 aircraft deliveries each year during
the period). Even after the next expected peak in overall deliveries
of Boeing and Airbus aircraft (forecast for 2012 at 1,025 units), the demand for
titanium is expected to continue to increase significantly due to increased
deliveries of twin-aisle aircraft and the increased production rates of next
generation commercial aircraft, both of which consume large amounts of titanium
metal. Beyond 2014, projected aircraft deliveries remain strong as
fuel efficiency and expansion of the global fleet in developing areas, such as
Asia, are expected to be key drivers of long-term demand. Although
the duration of the current global recession may impact the timing and rate of
the demand recovery, this recent forecast supports our belief that long-term
industry-wide demand trends will remain strong for the foreseeable
future.
Our
strategic plans to improve our production capabilities are focused on
opportunities to improve our operating flexibility, efficiency and cost
structure to meet our customers’ long-term needs. In particular, we
continue to enhance our ability to meet our current and prospective customers’
needs and strengthen our position as a reliable supplier in markets where
technical ability and precision are critical. We have been successful
over the last several years in establishing significant flexibility and cost
advantages in our entire manufacturing process. We believe our
efficient manufacturing processes and strong balance sheet have kept us
well-positioned in the current economic environment, and we believe our
financial strength will allow us to continue to invest in our business, fully
serve our current and prospective customers and pursue strategic opportunities
when appropriate.
LIQUIDITY
AND CAPITAL RESOURCES
Our
consolidated cash flows for each of the past three years are presented
below. The following should be read in conjunction with our
Consolidated Financial Statements and notes thereto.
|
Year
ended December 31,
|
||||||||||||
|
2007
|
2008
|
2009
|
||||||||||
|
(In
millions)
|
||||||||||||
|
Cash
provided by (used in):
|
||||||||||||
|
Operating
activities
|
$ | 192.1 | $ | 197.6 | $ | 206.8 | ||||||
|
Investing
activities
|
(108.2 | ) | (142.6 | ) | (64.1 | ) | ||||||
|
Financing
activities
|
(24.5 | ) | (97.7 | ) | (20.3 | ) | ||||||
|
Net cash provided by (used in) operating, investing and financing
activities
|
$ | 59.4 | $ | (42.7 | ) | $ | 122.4 | |||||
Operating
activities. Cash flow from
operations is considered a primary source of our liquidity. Changes
in pricing, production volume and customer demand, among other things, could
significantly affect our liquidity. Cash provided by operating
activities increased $9.2 million, from $197.6 million in 2008 to $206.8 million
in 2009. The net effects of the following significant items
contributed to the overall increase in cash provided by operating
activities:
|
|
·
|
operating
income declined by $164.8 million in
2009;
|
|
|
·
|
net
cash provided by operations resulting from changes in receivables,
inventories, payables and accrued liabilities increased by $129.2 million
in 2009 in response to changing working capital requirements resulting
primarily from declining inventory levels;
and
|
|
|
·
|
net
cash paid for income taxes declined by $38.2 million in 2009 primarily due
to lower taxable income in 2009.
|
Cash
provided by operating activities increased $5.5 million, from $192.1 million in
2007 to $197.6 in 2008. The net effects of the following significant
items contributed to the overall increase in cash provided by operating
activities:
|
|
·
|
operating
income declined by $152.3 million in
2008;
|
|
|
·
|
net
cash used in operations resulting from changes in receivables,
inventories, payables and accrued liabilities declined by $42.1 million in
2008 in response to changing working capital requirements and improved
collections of receivables; and
|
|
|
·
|
net
cash paid for income taxes declined by $105.0 million in 2008 primarily
due to lower taxable income in
2008.
|
Investing
activities. Cash flows used in our investing activities
changed from $108.2 million in 2007 to $142.6 million in 2008 to $64.1 million
in 2009. Our capital expenditures were $100.9 million during 2007,
$121.3 million in 2008 and $33.0 million in 2009. Capital projects
and other significant investing activities include the following:
|
|
·
|
During
2007 and 2008, we had construction underway for the first and second
phases of our EB melt capacity expansion at our facility in Morgantown and
other capacity expansion projects in the U.S. and Europe. Most
of our capacity expansion projects are now substantially complete, and
2009 capital spending was primarily limited to those projects required to
properly maintain our equipment and
facilities.
|
14
|
|
·
|
We
purchased $26.4 million in marketable equity securities during 2008 and
$0.7 million during 2009.
|
|
|
·
|
We
entered into an unsecured revolving credit facility with Contran
Corporation during 2009, pursuant to which we loaned Contran an
aggregate of $33.8 million as of December 31,
2009.
|
|
|
·
|
We
received principal payments on notes receivable from CompX International
Inc. of $2.6 million in 2007, $7.3 million in 2008 and $0.5 million in
2009.
|
Financing
activities. We had no net borrowing activity during 2007, 2008
and 2009. Other significant items included in our cash flows from
financing activities included:
|
|
·
|
dividends
paid on our common stock of $13.7 million in 2007 and $54.5 million in
2008;
|
|
|
·
|
dividends
paid on our Series A Preferred Stock of $5.6 million in 2007, $0.3 million
in 2008 and $0.2 million in 2009;
|
|
|
·
|
dividends
paid to CEZUS of $8.1 million in 2007, $6.8 million in 2008 and $5.5
million in 2009; and
|
|
|
·
|
treasury
stock purchases of $36.5 million during 2008 and $14.7 million in
2009.
|
In
February 2009, our board of directors decided to suspend our quarterly dividend
after considering the current economic and financial environment.
Future
cash requirements
Liquidity. Our primary
source of liquidity on an ongoing basis is our cash flows from operating
activities and borrowing availability under various credit
facilities. We generally use these amounts to (i) fund capital
expenditures, (ii) repay indebtedness incurred primarily for working capital
purposes and (iii) provide for the payment of dividends. From
time-to-time we will incur indebtedness, generally to (i) fund short-term
working capital needs, (ii) refinance existing indebtedness, (iii) make
investments in marketable and other securities (including the acquisition of
securities issued by our subsidiaries and affiliates) or (iv) fund major capital
expenditures or the acquisition of other assets outside the ordinary course of
business.
We
routinely evaluate our liquidity requirements, capital needs and availability of
resources in view of, among other things, our alternative uses of capital, debt
service requirements, the cost of debt and equity capital and estimated future
operating cash flows. As a result of this process, we have in the
past, and in light of our current outlook, may in the future, seek to raise
additional capital, modify our common and preferred dividend policies,
restructure ownership interests, incur, refinance or restructure indebtedness,
repurchase shares of common stock, purchase or redeem Series A Preferred Stock,
sell assets, or take a combination of such steps or other steps to increase or
manage our liquidity and capital resources. In the normal course of
business, we investigate, evaluate, discuss and engage in acquisition, joint
venture, strategic relationship and other business combination opportunities in
the titanium, specialty metal and other industries. In the event of
any future acquisition or joint venture opportunities, we may consider using
then-available liquidity, issuing equity securities or incurring additional
indebtedness.
We paid a
quarterly cash dividend of $0.075 per share in 2007 and four such quarterly cash
dividends in 2008. In the first quarter of 2009, our board of
directors decided to suspend our quarterly dividend after considering the
current economic and financial environment. We believe it is in our
best interest to enhance our financial strength which will allow us to continue
investing in our business and taking advantage of potential opportunities in our
industry, including acquisitions, long-term partnering agreements or joint
ventures, if and when such strategic opportunities
arise. Additionally, we will have the flexibility to repurchase
shares of our common stock under our previously announced repurchase programs
without sacrificing our ability to pursue other opportunities in our
industry. The declaration and payment of future dividends will be
dependent upon the board's consideration of our cash requirements, contractual
commitments, including applicable credit facility covenants, strategic plans and
other factors deemed relevant by our board of directors.
At
December 31, 2009, we had aggregate borrowing availability under our existing
U.S and European credit facilities of $211.4 million, and we could borrow all
such amounts without violating any covenants of our credit
facilities. We had an aggregate of $169.4 million of cash and cash
equivalents. Our U.S. credit facility matures in February 2011, and
our U.K. credit facilities mature in August 2012. See Note 8 to the
Consolidated Financial Statements. Based upon our expectations of our
operating performance, the anticipated demands on our cash resources, borrowing
availability under our existing credit facilities and anticipated borrowing
capacity after the maturity of these credit facilities, we expect to have
sufficient liquidity to meet our obligations for the short-term (defined as the
next twelve-month period) and our long-term obligations.
Repurchases of
common stock. At February 19, 2010, we had approximately $48.8
million available for repurchase of our common stock under the authorizations
described in Note 9 to the Consolidated Financial Statements.
Capital
expenditures. We currently estimate we will invest a total of
approximately $35 million to $40 million for capital expenditures during
2010. In response to current economic conditions, our planned capital
expenditures are limited to those required to properly maintain our equipment
and facilities. Capital spending for 2010 is expected to be funded by
cash flows from operating activities or existing cash resources and available
credit facilities.
We
continue to evaluate additional opportunities to improve or replace productive
assets including capital projects, acquisitions or other investments which, if
consummated, any required funding would be provided by existing cash resources
or borrowings under our U.S. or European credit facilities.
Contractual
commitments. As more fully
described in Notes 14 and 15 to the Consolidated Financial Statements, we were a
party to various agreements at December 31, 2009 that contractually commit us to
pay certain amounts in the future. The following table summarizes
such contractual commitments that are enforceable and legally binding on us and
that specify all significant terms, including pricing, quantity and date of
payment:
|
Payment
Due Date
|
||||||||||||||||||||
|
2010
|
2011/2012 | 2013/2014 |
2015
& After
|
Total
|
||||||||||||||||
|
(In
millions)
|
||||||||||||||||||||
|
Operating
leases
|
$ | 6.6 | $ | 10.9 | $ | 8.2 | $ | 25.0 | $ | 50.7 | ||||||||||
|
Purchase
obligations:
|
||||||||||||||||||||
|
Raw materials (1)
|
82.7 | 159.6 | 136.7 | 449.6 | 828.6 | |||||||||||||||
|
Other (2)
|
46.4 | 38.1 | 31.6 | 50.7 | 166.8 | |||||||||||||||
|
Other
contractual obligations (3)
|
10.1 | 0.2 | - | - | 10.3 | |||||||||||||||
| $ | 145.8 | $ | 208.8 | $ | 176.5 | $ | 525.3 | $ | 1,056.4 | |||||||||||
|
(1)
|
These
obligations generally relate to the purchase of titanium sponge pursuant
to LTAs that expire at varying dates (as described in Item 1: Business)
and various other open orders or commitments for the purchase of raw
materials. Certain of the LTAs have annually negotiated prices
and ranges of volumes, and we have assumed minimum required volumes and
minimum or estimated prices, as deemed appropriate. Certain of
the LTAs contain automatic renewal provisions; however, we have only
included the purchase commitments associated with the initial terms of
each LTA.
|
|
(2)
|
These
obligations generally relate to contractual purchase obligations for
conversion services, certain operating fees paid to CEZUS for use of a
portion of its Ugine plant pursuant to an agreement expiring in 2015 (as
described in Item 2: Properties), and various other open orders for the
purchase of energy, utilities and property and equipment. These
obligations are generally based on an average price and an assumed
constant mix of services purchased, as appropriate. All open
orders are primarily for delivery in
2010.
|
|
(3)
|
These
other obligations include an obligation under a worker’s compensation
bond, capital and interest payments under capital lease agreements and
income taxes payable, all of which are recorded on our balance sheet as of
December 31, 2009. Additionally, we have an obligation to
Contran under an intercorporate services agreement (“ISA”) which will be
recorded ratably over the 2010 service period. We expect to
renew the ISA annually.
|
The above
table does not reflect any amounts that we might pay to fund our defined benefit
pension plans and OPEB plans, as the timing and amount of any such future
funding are unknown and dependent on, among other things, the future performance
of defined benefit pension plan assets, interest rate assumptions and inflation
rate assumptions. See Note 13 to the Consolidated Financial
Statements and “Liquidity and Capital Resources - Defined benefit pension
plans” and “Liquidity and Capital Resources - Postretirement benefit plans other
than pensions.”
Off-balance sheet
arrangements. We do not have any off-balance sheet
financing agreements other than the outstanding letters of credit and operating
leases discussed in Notes 8 and 15 to our Consolidated Financial
Statements.
15
Recent accounting
pronouncements. See Note 2 to the Consolidated Financial
Statements.
Defined benefit
pension plans. As of December 31, 2009, we maintain three
defined benefit pension plans – one each in the U.S., the U.K. and
France. The majority of the discussion below relates to the U.S. and
U.K. plans, as the French plan is not material to our Consolidated Balance
Sheets, Statements of Income or Statements of Cash Flows.
We
recorded net consolidated pension expense of $4.6 million in 2007, $2.0 million
in 2008 and $15.6 million in 2009. Pension expense for these periods
was calculated based upon a number of actuarial assumptions, most significant of
which are the discount rate and the expected long-term rate of
return. Actual returns on plan assets during 2008 were significantly
lower than our expected long-term rate of return for both the U.S. and U.K.
plans, and the resulting actuarial losses were recorded as a component of
accumulated other comprehensive income (“AOCI”) as of December 31,
2008. As these actuarial losses began amortizing during 2009, pension
expense increased during 2009 as compared to 2008.
The
discount rate we utilize for determining pension expense and pension obligations
for our U.S. plan is based on discount rates derived from our expected future
cash flows, and the discount rate we utilize for determining pension expense and
pension obligations for our U.K. plan is based on the yields available on high
quality corporate bond indices over the same duration as the U.K. plan’s
expected future cash flows. Changes in our discount rate over the
past three years reflect the fluctuations in such expected cash flows during
that period. We establish a rate that is used to determine
obligations as of the year-end date and expense or income for the subsequent
year. We used the following discount rate assumptions for our defined
benefit pension plans:
|
Discount
rates used for:
|
|||||
|
Obligation
at
December
31, 2007
and
expense in 2008
|
Obligation
at
December
31, 2008
and
expense in 2009
|
Obligation
at
December
31, 2009
and
expense in 2010
|
|||
|
U.S.
plan
|
5.90%
|
5.75%
|
5.80%
|
||
|
U.K.
plan
|
5.60%
|
6.20%
|
5.65%
|
||
Lowering
the discount rate assumption by 0.25% (from 5.75% to 5.50%) would have increased
our U.S. plan’s 2009 pension expense by approximately $0.2 million, and lowering
the discount rate assumption by 0.25% (from 6.20% to 5.95%) would have increased
our U.K. plan’s 2009 pension expense by approximately $0.6 million.
Benefit
payments to participants in our U.K. plan are adjusted for inflation annually,
impacting both pension expense and pension obligations. The inflation
rate we utilize for our U.K. plan is derived from the risk adjusted spread
between fixed-rate and variable-rate U.K. government bond
indices. Changes in our inflation rate over the past three years
reflect the fluctuations in such indices during that period. We
establish a rate that is used to determine obligations as of the year-end date
and expense or income for the subsequent year. We used the following
inflation rate assumptions for our U.K. defined benefit pension
plan:
|
Inflation
rates used for:
|
|||||
|
Obligation
at
December
31, 2007
and
expense in 2008
|
Obligation
at
December
31, 2008
and
expense in 2009
|
Obligation
at
December
31, 2009
and
expense in 2010
|
|||
|
U.K.
plan
|
3.20%
|
2.60%
|
3.60%
|
||
In
developing our expected long-term rate of return assumptions, we evaluate
historical market rates of return and input from our actuaries, including a
review of asset class return expectations as well as long-term inflation
assumptions. Projected returns are based on broad equity (large cap,
small cap and international) and bond (corporate and government) indices as well
as anticipation that the plans’ active investment managers will generate
premiums above the standard market projections.
All of
our U.S. plan’s assets are invested in the Combined Master Retirement Trust
("CMRT"). The CMRT is a collective investment trust sponsored by
Contran to permit the collective investment by certain master trusts which fund
certain employee benefit plans sponsored by Contran and related
companies. However, our U.S. plan assets are invested only in the
portion of the CMRT that does not hold our common stock. See Note 13 to the
Consolidated Financial Statements.
The
CMRT's long-term investment objective is to provide a rate of return exceeding a
composite of broad market equity and fixed income indices (including the S&P
500 and certain Russell indices) utilizing both third-party investment managers
as well as investments directed by Mr. Simmons. Mr. Simmons is the
sole trustee of the CMRT. The trustee of the CMRT, along with the
CMRT’s investment committee, of which Mr. Simmons is a member, actively manages
the investments of the CMRT. The trustee and investment committee
periodically change the asset mix of the CMRT based upon, among other things,
advice from third-party advisors and their respective expectations as to what
asset mix will generate the greatest overall return. At December 31,
2009, our portion of the CMRT had an aggregate asset value of $48.1
million. During 2007, 2008 and 2009, the assumed long-term rate of
return for our U.S. plan assets that were invested in the CMRT was
10%. In determining the appropriateness of the long-term rate of
return assumption, we considered, among other things, the historical rates of
return, the current and projected asset mix and the investment objectives of the
CMRT’s managers for our portion of the CMRT. During the history of
the CMRT from its inception in 1988 through December 31, 2009, the average
annual rate of return earned by our portion of the CMRT, as calculated based on
the average percentage change in the net asset value per unit for each
applicable year, has been 11%.
All of
our U.K. plan’s assets are invested in equity securities, fixed-income
securities and cash or cash equivalents with a target asset allocation
determined by an investment committee appointed by the plan’s
trustee. As a result of market fluctuations experienced and the
strategic movement toward our long-term funding and asset allocation strategies,
actual asset allocation as of December 31, 2009 was 79% equity securities and
21% debt and other securities. Our future expected long-term rate of
return on plan assets for our U.K. plan is based on our target asset allocation
assumption of 80% equity securities and 20% fixed income
securities. Based on various factors, including economic and market
conditions, gains on the plan assets during each of the preceding years and
projected asset mix, our assumed long-term rate of return for our pension
expense was 6.50% for 2007, 6.65% for 2008 and 6.80% for 2009.
Although
the expected rate of return is a long-term measure, we continue to evaluate our
expected rate of return annually and adjust it as considered
necessary. As part of this evaluation, we considered the historical
long-term average annual rates of return and recent economic downturn impacting
virtually all global equity markets, and based on our evaluation, the recent
declines in value for our plans’ assets are not indicative of a long-term trend
requiring an adjustment to our long-term expected rate of return for any of our
defined benefit pension plans. Actual returns on plan assets for a
given year that are greater than the assumed rates of return result in an
actuarial gain, while actual returns on plan assets for a given year that are
less than the assumed rates of return result in an actuarial
loss. All of these actuarial gains and losses are not recognized in
earnings currently, but instead are deferred as part of AOCI and amortized into
net income in the future as part of pension expense. However, any
actuarial gains generated in future periods reduce the negative amortization
effect of any cumulative actuarial losses, while any actuarial losses generated
in future periods reduce the favorable amortization effect of any cumulative
actuarial gains. We used the following long-term rate of return
assumptions for our defined benefit pension plans:
|
Long-term
rates of return used for pension expense for the year ended December
31:
|
|||||
|
2008
|
2009
|
2010
|
|||
|
U.S.
plan
|
10.00%
|
10.00%
|
10.00%
|
||
|
U.K.
plan
|
6.65%
|
6.80%
|
7.50%
|
||
Lowering
the expected long-term rate of return on our U.S. plan’s assets by 0.5% (from
10.00% to 9.50%) would have increased 2009 pension expense by approximately $0.2
million, and lowering the expected long-term rate of return on our U.K. plan’s
assets by 0.5% (from 6.80% to 6.30%) would have increased 2009 pension expense
by approximately $0.6 million.
Based on
an expected rate of return on plan assets of 10%, a discount rate of 5.80% and
various other assumptions, we estimate that our U.S. plan will have pension
expense of approximately $5.6 million in 2010 as compared to $6.9 million in
2009. A 0.25% increase or decrease in the discount rate would
decrease or increase estimated pension expense by approximately $0.1 million in
2010, respectively. A 0.5% increase or decrease in the long-term rate
of return would decrease or increase estimated pension expense by approximately
$0.2 million in 2010, respectively. Pension expense for our U.S. plan
will decrease in 2010 primarily as the result of actuarial gains recognized in
AOCI as of December 31, 2009 resulting from our actual rate of return on plan
assets exceeding our expected rate of return during 2009.
Based on
an expected rate of return on plan assets of 7.50%, a discount rate of 5.65% and
various other assumptions (including an exchange rate of $1.61/£1.00), we
estimate that pension expense for our U.K. plan will approximate $11.2 million
in 2010 compared to $8.5 million in 2009. A 0.25% increase or
decrease in the discount rate would decrease or increase estimated pension
expense by approximately $0.9 million in 2010, respectively. A 0.5%
increase or decrease in the long-term rate of return would decrease or increase
estimated pension expense by approximately $0.7 million in 2010,
respectively. Actual future pension expense will depend on actual
future investment performance, changes in future discount rates and various
other factors related to the participants in our pension
plans. Pension expense for our U.K. plan will increase in 2010
primarily due to amortization related to actuarial losses recognized in AOCI as
of December 31, 2009, higher interest costs resulting from decreases to our
discount rate assumption and higher interest and service costs resulting from
increases to our inflation rate assumption. Actuarial gains resulting
from our actual rate of return on plan assets exceeding our expected rate of
return during 2009 and the increase in our expected long-term rate of return on
plan assets as a result of a more aggressive asset allocation partially offset
the impact of lowering the discount rate and raising the inflation rate for our
U.K. plan.
16
We made
cash contributions of $0.1 million in 2007 and nil in 2008 and 2009 to our U.S.
plan and $10.5 million in 2007 and 2008 and $8.5 million in 2009 to our U.K.
plan. Based upon the current funded status of the plans and the
actuarial assumptions being used for 2009, we believe that we will be required
to make contributions of $4.8 million to our U.S. plan and $6.9
million to our U.K. plan in 2010.
The
recent global economic downturn negatively impacted the performance of each
plans’ assets during 2008, but the fair values of the plans’ assets recovered
somewhat during 2009. The fair value of the assets of the U.S. plan
was $98.4 million at December 31, 2007, $46.9 million at December 31, 2008 and
$48.1 at December 31, 2009, and the fair value of the assets of the U.K. plan
was $202.6 million at December 31, 2007, $114.9 million at December 31, 2008 and
$145.6 million at December 31, 2009.
The
combination of actual investment returns, changing discount rates and changes in
other assumptions has a significant effect on our funded plan status (plan
assets compared to projected benefit obligations). The effect of
negative investment returns and a decrease to the discount rate during 2008
resulted in an underfunded status of our U.S. plan of $30.0 million at December
31, 2008 compared to a $23.4 million overfunded status at December 31,
2007. During 2009, investment returns slightly reduced the
underfunded status of our U.S. plan to $29.0 million at December 31,
2009. During 2008, negative investment returns and a strengthening
dollar versus the pound sterling both contributed to an increase in the
underfunded status of our U.K. plan from $34.8 million at December 31, 2007 to
$46.2 million at December 31, 2008, while the decrease in the discount rate and
increase to the inflation rate, partially offset by the increases to the
long-term rate of return, for December 31, 2009 further increased the
underfunded status for our U.K. plan to $90.6 million at December 31,
2009.
Postretirement
benefit plans other than pensions. We provide limited OPEB
benefits to a portion of our U.S. employees upon retirement. We fund
such OPEB benefits as they are incurred, net of any retiree
contributions. We paid OPEB benefits, net of retiree contributions,
of $1.3 million in each of 2007, 2008 and 2009.
We
recorded consolidated OPEB expense of $3.1 million in 2007, $2.9 million in 2008
and $3.1 million in 2009. OPEB expense for these periods was
calculated based upon a number of actuarial assumptions, most significant of
which are the discount rate and the expected long-term health care trend
rate.
The
discount rate we utilize for determining OPEB expense and OPEB obligations is
based on discount rates derived from our expected future cash
flows. Changes in our discount rate over the past three years reflect
the fluctuations in such expected cash flows during that period. We
establish a rate that is used to determine obligations as of the year-end date
and expense or income for the subsequent year. We used the following
discount rate assumptions for our OPEB plan:
|
Discount
rates used for:
|
|||||
|
Obligation
at
December
31, 2007
and
expense in 2008
|
Obligation
at
December
31, 2008
and
expense in 2009
|
Obligation
at
December
31, 2009
and
expense in 2010
|
|||
|
OPEB
plan
|
5.90%
|
5.75%
|
5.65%
|
||
Lowering
the discount rate assumption by 0.25% (from 5.75% to 5.50%) would have had a
nominal impact on our 2009 OPEB expense. Beginning January 1, 2010,
we amended the benefit formula and the funding methodology for the majority of
our participants. This plan amendment and other factors cause the
expected future cash flows for our OPEB plan to differ from cash flows for our
U.S. pension plan, and based on these cash flows, we will utilize a discount
rate of 5.65% for our December 31, 2009 OPEB obligations and for our 2010 OPEB
expense.
We
estimate the expected long-term health care trend rate based upon input from
specialists in this area, as provided by our actuaries. In estimating
the health care trend rate, we consider industry trends, our actual healthcare
cost experience and our future benefit structure. For 2009, we used a
beginning health care trend rate of 5.46%. If the health care trend
rate were increased or decreased by 1.0% for each year, OPEB expense for 2009
would have increased by approximately $0.5 million or decreased by approximately
$0.4 million, respectively. Due to the plan amendments discussed
above, we revised our health care trend assumptions. For our OPEB
obligations as of December 31, 2009 and our 2010 OPEB expense, we are using a
beginning health care trend rate of 8.5%, which is projected to be reduced to an
ultimate rate of 4.5% in 2017.
Based on
a discount rate of 5.65%, a health care trend rate as discussed above and
various other assumptions, we estimate that OPEB expense will approximate $1.0
million in 2010 compared to $3.1 million in 2009. A 0.25% increase or
decrease in the discount rate would have a nominal impact on estimated OPEB
expense in 2010. A 1.0% increase or decrease in the health care trend
rate for each year would increase or decrease the estimated service and interest
cost components of OPEB expense by approximately $0.2 million in 2010,
respectively. Based upon the actuarial assumptions being used in
2009, we believe we will be required to pay OPEB benefits of $1.4 million in
2010, net of retiree contributions. OPEB expense will decrease in
2010 primarily as the result of actuarial gains recognized in AOCI as of
December 31, 2009 resulting from plan amendments and changing assumptions
regarding health care trends and other demographic data.
Environmental
matters. See “Business – Regulatory and environmental
matters” in Item 1 and Note 15 to the
Consolidated Financial Statements for a discussion of environmental
matters.
Affiliate
transactions. Corporations that may be deemed to be controlled
by or affiliated with Mr. Simmons sometimes engage in (i) intercorporate
transactions such as guarantees, management and expense sharing arrangements,
shared fee arrangements, joint ventures, partnerships, loans, options, advances
of funds on open account, and sales, leases and exchanges of assets, including
securities issued by both related and unrelated parties, and (ii) common
investment and acquisition strategies, business combinations, reorganizations,
recapitalizations, securities repurchases, and purchases and sales (and other
acquisitions and dispositions) of subsidiaries, divisions or other business
units, which transactions have involved both related and unrelated parties and
have included transactions which resulted in the acquisition by one related
party of a publicly-held minority equity interest in another related
party. We continuously consider, review and evaluate such
transactions, and we understand that Contran and related entities consider,
review and evaluate such transactions. Depending upon the business,
tax and other objectives then relevant, it is possible that we might be a party
to one or more such transactions in the future. See Notes 1 and 14 to
the Consolidated Financial Statements for a discussion of certain related party
transactions that we were a party to during 2007, 2008 and 2009.
ITEM 7A: QUANTITATIVE AND QUALITATIVE
DISCLOSURES ABOUT MARKET RISK
Interest
rates. If we utilize our borrowing capacity in the future, we
would be exposed to market risk from changes in interest rates related to
indebtedness. We typically do not enter into interest rate swaps or
other types of contracts in order to manage our interest rate market
risk. We had no outstanding bank indebtedness at December 31, 2008
and 2009. Our borrowings accrue interest at variable rates, generally
related to spreads over bank prime rates and LIBOR. Because our bank
indebtedness reprices with changes in market interest rates, the carrying amount
of such debt is believed to approximate fair value.
Foreign currency
exchange rates. We are exposed to market risk arising from
changes in foreign currency exchange rates as a result of our international
operations. We do not enter into currency forward contracts to manage
our foreign exchange market risk associated with receivables, payables or
indebtedness denominated in a currency other than the functional currency of the
particular entity. See “Results of Operations – European operations” in
Item 7 - MD&A for further discussion.
Commodity
prices. We are exposed to market risk arising from changes in
commodity prices as a result of our long-term purchase and supply agreements
with certain suppliers and customers. These agreements, which offer
various fixed or formula-determined pricing arrangements, effectively obligate
us to bear (i) the risk of increased raw material and other costs to us that
cannot be passed on to our customers through increased titanium product prices
(in whole or in part) or (ii) the risk of decreasing raw material costs to our
suppliers that are not passed on to us in the form of lower raw material
prices. However, our ability to offset increased material costs with
higher selling prices increased in the last several years, as many of our LTAs
have either expired or have been renegotiated with price adjustments that take
into account raw material, labor and energy cost fluctuations. We do
not engage in commodity hedging programs.
Raw
materials. We are exposed to market risk arising from changes
in availability and prices for our critical raw materials. From time
to time we enter into long-term supply agreements for certain critical raw
materials, including sponge, rutile and certain alloys, and we have long-term
agreements in place for the majority of our expected requirements for titanium
sponge through 2025. We also have closed-loop arrangements with
certain of our customers for the purchase of titanium scrap, which provide
certainty of supply and price stability. We do not generally enter
into long-term supply agreements for all of our other critical raw material
requirements. We believe the risk of unavailability of our critical
raw materials is low considering our existing LTAs with our raw material
suppliers and other sources available to us, and the risk of price variability
for our critical raw materials will be somewhat mitigated by our ability to
increase the prices charged to our customers as noted above.
Securities
prices. As of December 31, 2008 and 2009, we held certain
marketable securities that are exposed to market risk due to changes in prices
of the securities. The aggregate market value of these equity
securities was $16.4 million at December 31, 2008 and $20.6 million at December
31, 2009. The potential change in the aggregate market value of these
securities, assuming a 10% change in prices, would have been $1.6 million at
December 31, 2008 and $2.1 million at December 31, 2009. See Note 4
to the Consolidated Financial Statements.
Interest bearing
notes receivable. We held a note receivable from CompX with a
principal amount of $42.7 million at December 31, 2008 and $42.5 million at
December 31, 2009. Our note receivable accrues interest at variable
rates, related to the spread over LIBOR. Because our note receivable
reprices with changes in market interest rates, the carrying amount of such note
receivable is believed to approximate fair value. See Notes 11 and 14
to the Consolidated Financial Statements.
17
We held
two notes receivable from Contran with a combined principal amount of $50.5
million at December 31, 2009. Our notes receivable accrue interest at
variable rates, related to the prime rate, or in some cases, a specified spread
under the prime rate. Because interest rates of our notes receivable
reprice with changes in market interest rates, the carrying amount of such note
receivable are believed to approximate fair value. See Notes 11 and
14 to the Consolidated Financial Statements.
ITEM
8: FINANCIAL
STATEMENTS AND SUPPLEMENTARY DATA
The
information required by this Item is contained in a separate section of this
Annual Report. See Index of Financial Statements on page
F.
ITEM
9: CHANGES
IN AND DISAGREEMENTS WITH ACCOUNTANTS ON ACCOUNTING AND FINANCIAL
DISCLOSURE
Not applicable.
ITEM
9A: CONTROLS
AND PROCEDURES
Evaluation of
disclosure controls and procedures. We
maintain a system of disclosure controls and procedures. The term
"disclosure controls and procedures," as defined by Rule 13a-15(e) of the
Securities Exchange Act of 1934, as amended (the "Exchange Act"), means controls
and other procedures that are designed to ensure that information required to be
disclosed in the reports that we file or submit to the SEC under the Exchange
Act is recorded, processed, summarized and reported within the time periods
specified in the SEC's rules and forms. Disclosure controls and
procedures include, without limitation, controls and procedures designed to
ensure that information required to be disclosed by us in the reports that we
file or submit to the SEC under the Exchange Act is accumulated and communicated
to our management, including our principal executive officer and our principal
financial officer, or persons performing similar functions, as appropriate to
allow timely decisions to be made regarding required disclosure. Each
of Bobby D. O’Brien, our Chief Executive Officer, and James W. Brown, our Chief
Financial Officer, have evaluated the design and operating effectiveness of our
disclosure controls and procedures as of December 31, 2009. Based
upon their evaluation, these executive officers have concluded that our
disclosure controls and procedures were effective as of December 31,
2009.
Scope of
management’s report on internal control over financial
reporting. We also maintain internal control over financial
reporting. The term "internal control over financial reporting," as
defined by Rule 13a-15(f) of the Exchange Act, means a process designed by, or
under the supervision of, our principal executive and principal financial
officers, or persons performing similar functions, and effected by our board of
directors, management and other personnel, to provide reasonable assurance
regarding the reliability of financial reporting and the preparation of
financial statements for external purposes in accordance with GAAP, and includes
those policies and procedures that:
|
|
·
|
Pertain
to the maintenance of records that in reasonable detail accurately and
fairly reflect the transactions and dispositions of our
assets;
|
|
|
·
|
Provide
reasonable assurance that transactions are recorded as necessary to permit
preparation of financial statements in accordance with GAAP, and that our
receipts and expenditures are being made only in accordance with
authorizations of our management and directors;
and
|
|
|
·
|
Provide
reasonable assurance regarding prevention or timely detection of
unauthorized acquisition, use or disposition of our assets that could have
a material effect on our Consolidated Financial
Statements.
|
Section
404 of the Sarbanes-Oxley Act of 2002 (“Sarbanes-Oxley Act”) requires us to
include annually a management report on internal control over financial
reporting and such report is included below. Our independent
registered public accounting firm is also required to annually attest to our
internal control over financial reporting.
Management’s
report on internal control over financial reporting. Our management is
responsible for establishing and maintaining adequate internal control over
financial reporting, as such term is defined in Exchange Act Rule
13a-15(f). Our evaluation of the effectiveness of our internal
control over financial reporting is based upon the criteria established in Internal Control – Integrated
Framework issued by the Committee of Sponsoring Organizations of the
Treadway Commission (“COSO”). Based on our evaluation under the COSO
framework, management has concluded that our internal control over financial
reporting was effective as of December 31, 2009.
The
effectiveness of our internal control over financial reporting as of December
31, 2009 has been audited by PricewaterhouseCoopers LLP, an independent
registered public accounting firm, as stated in their report which is included
in this Annual Report on Form 10-K.
Changes in
internal control over financial reporting. There have been no
changes to our internal control over financial reporting during the quarter
ended December 31, 2009 that have materially affected our internal control over
financial reporting.
Certifications. Our
chief executive officer is required to annually file a certification with the
New York Stock Exchange (“NYSE”), certifying our compliance with the corporate
governance listing standards of the NYSE. During 2009, our chief
executive officer filed such annual certification with the NYSE, which was not
qualified in any respect, indicating that he was not aware of any violations by
us of the NYSE corporate governance listing standards. Our principal
executive officer and principal financial officer are also required to, among
other things, file quarterly certifications with the SEC regarding the quality
of our public disclosures, as required by Section 302 of the Sarbanes-Oxley
Act. Such certifications for the year ended December 31, 2009 have
been filed as exhibits 31.1 and 31.2 to this Annual Report on Form
10-K.
ITEM
9B: OTHER
INFORMATION
Not
applicable.
18
PART
III
ITEM
10: DIRECTORS,
EXECUTIVE OFFICERS AND CORPORATE GOVERNANCE
The
information required by this Item is incorporated by reference to our definitive
proxy statement to be filed with the SEC pursuant to Regulation 14A within 120
days after the end of the fiscal year covered by this Annual Report (the “Proxy
Statement”).
ITEM
11: EXECUTIVE
COMPENSATION
The
information required by this Item is incorporated by reference to the Proxy
Statement.
ITEM
12: SECURITY
OWNERSHIP OF CERTAIN BENEFICIAL OWNERS AND MANAGEMENT
AND RELATED STOCKHOLDER MATTERS
The
information required by this Item is incorporated by reference to the Proxy
Statement.
ITEM
13: CERTAIN
RELATIONSHIPS AND RELATED TRANSACTIONS, AND DIRECTOR INDEPENDENCE
The
information required by this Item is incorporated by reference to the Proxy
Statement. See also Note 14 to the Consolidated Financial
Statements.
ITEM
14: PRINCIPAL
ACCOUNTANT FEES AND SERVICES
The
information required by this Item is incorporated by reference to the Proxy
Statement.
19
PART
IV
ITEM
15:
EXHIBITS AND FINANCIAL STATEMENT SCHEDULES
(a) and
(c) Financial
Statements and Schedules
The
Consolidated Financial Statements of the Registrant listed on the accompanying
Index of Financial Statements (see page F) are filed as part of this Annual
Report.
All financial statement schedules have
been omitted either because they are not applicable or required, or the
information that would be required to be included is disclosed in the notes to
the consolidated financial statements.
(b) Exhibits
The items
listed in the Exhibit Index are included as exhibits to this Annual
Report. We have retained a signed original of any of these exhibits
that contain signatures, and we will provide such exhibit to the SEC or its
staff upon request. We will furnish a copy of any of the exhibits
listed below upon request and payment of $4.00 per exhibit to cover the costs of
furnishing the exhibits. Such requests should be directed to the
attention of our Investor Relations Department at our corporate offices located
at 5430 LBJ Freeway, Suite 1700, Dallas, Texas 75240. Pursuant to
Item 601(b)(4)(iii) of Regulation S-K, any instrument defining the rights of
holders of long-term debt issues and other agreements related to indebtedness
which do not exceed 10% of consolidated total assets as of December 31, 2009
will be furnished to the SEC upon request.
|
Item
No.
|
Exhibit
Index
|
|
|
3.1
|
Amended
and Restated Certificate of Incorporation of Titanium Metals Corporation,
as amended effective February 14, 2003, incorporated by reference to
Exhibit 3.1 to the Registrant’s Annual Report on Form 10-K for the year
ended December 31, 2003.
|
|
|
3.2
|
Certificate
of Amendment of Amended and Restated Certificate of Incorporation of
Titanium Metals Corporation, effective August 5, 2004, incorporated by
reference to Exhibit 3.1 to the Registrant’s Quarterly Report on Form 10-Q
for the quarter ended June 30, 2004.
|
|
|
3.3
|
Certificate
of Amendment of Amended and Restated Certificate of Incorporation of
Titanium Metals Corporation, effective February 15, 2006, incorporated by
reference to Exhibit 99.1 the Registrant’s Current Report on Form 8-K
filed with the SEC on February 15, 2006.
|
|
|
3.4
|
Bylaws
of Titanium Metals Corporation as Amended and Restated, dated November 1,
2007, incorporated by reference to Exhibit 3.1 to the Registrant’s Current
Report on Form 8-K filed with the SEC on November 1,
2007.
|
|
|
4.1
|
Form
of Certificate of Designations, Rights and Preferences of 6 3/4 % Series A
Convertible Preferred Stock, incorporated by reference to Exhibit 4.1 to
the Registrant’s Pre-effective Amendment No. 1 to Registration Statement
on Form S-4 (File No. 333-114218).
|
|
|
10.1
|
Form
of Lease Agreement, dated November 12, 2004, between The Prudential
Assurance Company Limited. and TIMET UK Ltd. related to the premises known
as TIMET Number 2 Plant, The Hub, Birmingham, England, incorporated by
reference to Exhibit 10.1 to the Registrant’s Current Report on Form 8-K
filed with the SEC on November 17, 2004
|
|
|
10.2
|
Credit
Agreement among U.S. Bank National Association, Comerica Bank, Harris
N.A., JP Morgan Chase Bank, N.A., The CIT Group/Business Credit, Inc., and
Wachovia Bank, National Association as lenders and Titanium Metals
Corporation as Borrower and U.S. Bank National Association, as Agent,
dated February 17, 2006, incorporated by reference to Exhibit 10.1 to the
Registrant’s Current Report on Form 8-K filed with the SEC on February 23,
2006.
|
|
|
10.3*
|
1996
Long Term Performance Incentive Plan of Titanium Metals Corporation,
incorporated by reference to Exhibit 10.19 to the Registrant’s Amendment
No. 1 to Registration Statement on Form S-1 (File No.
333-18829).
|
|
|
10.4*
|
2005
Titanium Metals Corporation Profit Sharing Plan (Amended and Restated as
of April 6, 2005), incorporated by reference to Appendix A to the
Registrant’s Proxy Statement dated April 8, 2005 filed with the SEC on
April 11, 2005.
|
|
|
10.5*
|
Titanium
Metals Corporation Amended and Restated 1996 Non-Employee Director
Compensation Plan, as amended and restated effective May 23, 2006,
incorporated by reference to Exhibit 10.1 to the Registrant’s Quarterly
Report on Form 10-Q for the quarter ended June 30,
2006.
|
|
|
10.6*
|
Amendment
to the 2005 Titanium Metals Corporation Profit Sharing Plan (amended as of
February 21, 2008), incorporated by reference to Exhibit 10.5 to the
Registrant’s Annual Report on Form 10-K for the year ended December 21,
2007.
|
|
|
10.7*
|
Titanium
Metal Corporation 2008 Long-Term Incentive Plan, incorporated by reference
to Exhibit 4.6 of the Registrant’s Registration Statement on Form S-8
(File No. 333-151101) filed with the SEC on May 22,
2008.
|
|
|
10.8*
|
2008
Discretionary Bonus Plan (as of February 21, 2008), incorporated by
reference to exhibit 10.6 to the Registrant’s Annual Report on Form 10-K
for the year ended December 21, 2007. Certain exhibits to this
Exhibit 10.6 have not been filed; upon request, the Registrant will
furnish supplementally to the Commission a copy of any omitted
exhibit.
|
|
|
10.9*
|
Consulting
Agreement with Charles H. Entrekin, PhD, effective April 14, 2008,
incorporated by reference to Exhibit 10.1 to the Registrant’s Current
Report on Form 8-K filed with the SEC on April 16,
2008.
|
|
|
10.10
|
Intercorporate
Services Agreement among Contran Corporation and Titanium Metals
Corporation, effective as of January 1, 2008, incorporated by reference to
Exhibit 10.8 to the Registrant’s Annual Report on Form 10-K for the year
ended December 31, 2007.
|
|
|
10.11
|
Agreement
Regarding Shared Insurance by and between CompX International Inc.,
Contran Corporation, Keystone Consolidated Industries, Inc., Kronos
Worldwide, Inc., NL Industries, Inc., Titanium Metals Corporation and
Valhi, Inc. dated October 30, 2003, incorporated by reference to Exhibit
10.20 to the Registrant’s Annual Report on Form 10-K for the year ended
December 31, 2003.
|
|
|
10.12
|
Stock
Purchase Agreement dated as of October 16, 2007 between TIMET Finance
Management Company and CompX International Inc., incorporated by reference
to Exhibit 10.1 to the Current Report on Form 8-K filed by CompX
International Inc. with the SEC on October 22, 2007 (File No.
1-13905).
|
|
|
10.13
|
Agreement
and Plan of Merger dated as of October 16, 2007 among CompX International
Inc., CompX Group, Inc. and CompX KDL LLC, incorporated by reference to
Exhibit 10.2 to the Current Report on Form 8-K filed by CompX
International Inc. with the SEC on October 22, 2007 (File No.
1-13905).
|
|
|
10.14
|
Form
of Subordination Agreement among TIMET Finance Management Company, CompX
International Inc., CompX Security Products, Inc., CompX Precision Slides
Inc., CompX Marine Inc., Custom Marine Inc., Livorsi Marine Inc., Wachovia
Bank, National Association as administrative agent for itself, Compass
Bank and Comerica Bank, incorporated by reference to Exhibit 10.4 to the
Current Report on Form 8-K filed by CompX International Inc. with the SEC
on October 22, 2007 (File No. 1-13905).
|
|
|
10.15
|
Subordinated
Term Loan Promissory Note dated October 26, 2007 executed by CompX
International Inc. and payable to the order of TIMET Finance Management
Company, incorporated by reference to Exhibit 10.4 to the Current Report
on Form 8-K filed by CompX International Inc. with the SEC on October 30,
2007 (File No. 1-13905).
|
|
|
10.16
|
First
Amendment to Subordination Agreement dated as of September 21, 2009 by
TIMET Finance Management Company and Wachovia Bank, National Association,
incorporated by reference to Exhibit 10.2 to the Current Report on Form
8-K filed by CompX International Inc. with the SEC on September 24, 2009
(File No. 1-13905). Appendix A to Exhibit A to this Exhibit
10.2 has been filed as Exhibit 10.3 to such current report filed by CompX
International Inc. The rest of Exhibit A has been omitted, and
upon request, the Registrant will furnish supplementally to the SEC a copy
of the omitted part of Exhibit A to this Exhibit
10.2.
|
20
|
|
||
|
10.17
|
Amended
and Restated Subordinated Term Loan Promissory Note dated September 21,
2009 executed by CompX International Inc. and payable to the order of
TIMET Finance Management Company, incorporated by reference to Exhibit
10.3 to the Current Report on Form 8-K filed by CompX International Inc.
with the SEC on September 24, 2009 (File No. 1-13905).
|
|
|
10.18
|
Stock
Purchase Agreement dated as of December 31, 2008 between Titanium Metals
Corporation and Contran Corporation, incorporated by reference to Exhibit
10.1 to the Registrant’s Current Report on Form 8-K filed with the SEC on
January 7, 2009.
|
|
|
10.19
|
Form
of Secured Promissory Note dated as of December 31, 2008 made by Contran
Corporation payable to Titanium Metals Corporation, incorporated by
reference to Exhibit 10.2 to the Registrant’s Current Report on Form 8-K
filed with the SEC on January 7, 2009.
|
|
|
10.20
|
Pledge
and Security Agreement dated as of December 31, 2008 between Contran
Corporation and Titanium Metals Corporation, incorporated by reference to
Exhibit 10.3 to the Registrant’s Current Report on Form 8-K filed with the
SEC on January 7, 2009.
|
|
|
10.21
|
Unsecured
Revolving Demand Promissory Note as of November 4, 2009 made by Contran
Corporation payable to TIMET Finance Management Company, incorporated by
reference to Exhibit 10.1 to the Registrant’s Form 10-Q for the quarter
ended September 30, 2009.
|
|
|
10.22
|
First
Amended and Restated Unsecured Revolving Demand Promissory Note as of
December 11, 2009 made by Contran Corporation payable to TIMET Finance
Management Company, filed herewith.
|
|
|
10.23**
|
General
Terms Agreement between The Boeing Company and Titanium Metals
Corporation, incorporated by reference to Exhibit 10.2 to the Registrant’s
Current Report on Form 8-K/A filed with the SEC on November 17,
2006.
|
|
|
10.24**
|
Special
Business Provisions between The Boeing Company and Titanium Metals
Corporation, incorporated by reference to Exhibit 10.3 to the Registrant’s
Current Report on Form 8-K/A filed with the SEC on November 17,
2006.
|
|
|
10.25**
|
First
Amendment to the Special Business Provisions between The Boeing Company
and Titanium Metals Corporation dated as of August 2, 2005, effective
November 12, 2009, filed herewith.
|
|
|
10.26**
|
General
Terms Agreement between The Boeing Company and Titanium Metals Corporation
dated as of November 12, 2009, filed herewith.
|
|
|
10.27**
|
Special
Business Provisions between The Boeing Company and Titanium Metals
Corporation dated as of November 12, 2009, filed
herewith.
|
|
|
10.28**
|
Agreement
for the Purchase and Supply of Materials between Titanium Metals
Corporation and certain subsidiaries and Rolls-Royce plc and certain
subsidiaries effective January 1, 2007, incorporated by reference to
Exhibit 10.1 to the Registrant’s Quarterly Report on Form 10-Q for the
quarter ended March 31, 2007.
|
|
|
10.29
|
Access
and Security Agreement between Titanium Metals Corporation and Haynes
International, Inc. effective November 17, 2006, incorporated by reference
to Exhibit 10.21 to the Registrant’s Annual Report on Form 10-K for the
year ended December 31, 2006. Certain exhibits to this Exhibit
10.21 have not been filed; upon request, the Registrant will furnish
supplementally to the Commission, subject to the Registrant’s request for
confidential treatment of portions thereof, a copy of any omitted
exhibit.
|
|
|
10.30**
|
Conversion
Services Agreement between Titanium Metals Corporation and Haynes
International, Inc. effective November 17, 2006, incorporated by reference
to Exhibit 10.22 to the Registrant’s Annual Report on Form 10-K for the
year ended December 31, 2006.
|
|
|
10.31**
|
Titanium
Sponge Supply Agreement dated November 14, 2007 between Toho Titanium Co.,
Ltd. and Titanium Metals Corporation, incorporated by reference Exhibit
10.23 to the Registrant’s Annual Report on Form 10-K for the year ended
December 31, 2007. Certain exhibits and appendices to this
Exhibit 10.23 have not been filed; upon request, the Registrant will
furnish supplementally to the Commission, subject to the Registrant’s
request for confidential treatment of portions thereof, a copy of any
omitted exhibit.
|
|
|
10.32**
|
First
Amendment to Titanium Sponge Supply Agreement dated April 20, 2009 between
Toho Titanium Co., Ltd. and Titanium Metals Corporation, incorporated by
reference Exhibit 10.1 to the Registrant’s Quarterly Report on Form 10-Q
for the quarter ended June 30, 2009.
|
|
|
10.33**
|
Titanium
Sponge Supply Agreement dated as of December 18, 2009 between Toho
Titanium Co., Ltd. and Titanium Metals Corporation, filed
herewith. Certain exhibits and appendices to this Exhibit 10.33
have not been filed; upon request, the Registrant will furnish
supplementally to the Commission, subject to the Registrant’s request for
confidential treatment of portions thereof, a copy of any omitted
exhibit.
|
|
|
21.1
|
Subsidiaries
of the Registrant.
|
|
|
23.1
|
Consent
of PricewaterhouseCoopers LLP.
|
|
|
31.1
|
Certification
pursuant to Section 302 of the Sarbanes-Oxley Act of
2002.
|
|
|
31.2
|
Certification
pursuant to Section 302 of the Sarbanes-Oxley Act of
2002.
|
|
|
32.1
|
Certification
pursuant to Section 906 of the Sarbanes-Oxley Act of
2002.
|
|
* Management
contract, compensatory plan or arrangement.
** Portions
of the exhibit have been omitted pursuant to a request for confidential
treatment.
21
SIGNATURES
Pursuant to the requirements of Section
13 or 15(d) of the Securities Exchange Act of 1934, the registrant has duly
caused this report to be signed on its behalf by the undersigned, thereunto duly
authorized.
|
TITANIUM
METALS CORPORATION
|
|
|
(Registrant)
|
|
By /s/ Bobby
D.
O’Brien
|
|
|
Bobby D. O’Brien, March 1,
2010
President and Chief Executive
Officer
|
Pursuant
to the requirements of the Securities Exchange Act of 1934, this report has been
signed below by the following persons on behalf of the registrant and in the
capacities and on the dates indicated:
|
By /s/
Harold C.
Simmons
|
By /s/ Terry
N.
Worrell
|
|
Harold C. Simmons, March 1,
2010
Chairman of the
Board
|
Terry N. Worrell, March 1,
2010
Director
|
|
By /s/
Steven L.
Watson
|
By /s/ Paul
J.
Zucconi
|
|
Steven L. Watson, March 1,
2010
Vice Chairman of the
Board
|
Paul J. Zucconi, March 1,
2010
Director
|
|
By /s/ Keith
R.
Coogan
|
By /s/ James
W.
Brown
|
|
Keith R. Coogan, March 1,
2010
Director
|
James W. Brown, March 1,
2010
Vice President and Chief
Financial Officer
Principal Financial
Officer
|
|
By /s/ Glenn
R.
Simmons
|
By /s/ Scott
E.
Sullivan
|
|
Glenn R. Simmons, March 1,
2010
Director
|
Scott E. Sullivan, March 1,
2010
Vice President and
Controller
Principal Accounting
Officer
|
|
By /s/
Thomas P.
Stafford
|
|
|
Thomas P. Stafford, March 1,
2010
Director
|
|
22
TITANIUM METALS CORPORATION
ANNUAL
REPORT ON FORM 10-K
ITEMS 8
and 15(a)
INDEX
OF FINANCIAL STATEMENTS
|
Page
|
|
|
Financial
Statements
|
|
|
F-1
|
|
|
F-3
|
|
|
F-5
|
|
|
F-6
|
|
|
F-7
|
|
|
F-9
|
|
|
F-10
|
|
|
We
omitted all schedules to the Consolidated Financial Statements because
they are not applicable or the required amounts are either not material or
are presented in the Notes to the Consolidated Financial
Statements.
|
|
F
REPORT OF INDEPENDENT REGISTERED PUBLIC ACCOUNTING
FIRM
To the
Stockholders and Board of Directors of Titanium Metals Corporation:
In our
opinion, the accompanying consolidated balance sheets and the related
consolidated statements of income, of comprehensive income, of changes in equity
and of cash flows present fairly, in all material respects, the financial
position of Titanium Metals Corporation and its subsidiaries at December 31,
2008 and 2009 and the results of their operations and their cash flows for each
of the three years in the period ended December 31, 2009 in conformity with
accounting principles generally accepted in the United States of
America. Also in our opinion, the Company maintained, in all material
respects, effective internal control over financial reporting as of December 31,
2009, based on criteria established in Internal Control - Integrated Framework
issued by the Committee of Sponsoring Organizations of the Treadway Commission
(COSO). The Company's management is responsible for these financial
statements, for maintaining effective internal control over financial reporting
and for its assessment of the effectiveness of internal control over financial
reporting, included in the accompanying Management’s Report on Internal Control
Over Financial Reporting under Item 9A. Our responsibility is to
express opinions on these financial statements and on the Company's internal
control over financial reporting based on our integrated audits. We
conducted our audits in accordance with the standards of the Public Company
Accounting Oversight Board (United States). Those standards require
that we plan and perform the audits to obtain reasonable assurance about whether
the financial statements are free of material misstatement and whether effective
internal control over financial reporting was maintained in all material
respects. Our audits of the financial statements included examining,
on a test basis, evidence supporting the amounts and disclosures in the
financial statements, assessing the accounting principles used and significant
estimates made by management, and evaluating the overall financial statement
presentation. Our audit of internal control over financial reporting
included obtaining an understanding of internal control over financial
reporting, assessing the risk that a material weakness exists, and testing and
evaluating the design and operating effectiveness of internal control based on
the assessed risk. Our audits also included performing such other
procedures as we considered necessary in the circumstances. We believe that our
audits provide a reasonable basis for our opinions.
As
discussed in Note 2 to the Consolidated Financial Statements, the Company
changed the manner in which it classified its noncontrolling interests in
2009.
A
company’s internal control over financial reporting is a process designed to
provide reasonable assurance regarding the reliability of financial reporting
and the preparation of financial statements for external purposes in accordance
with generally accepted accounting principles. A company’s internal
control over financial reporting includes those policies and procedures that (i)
pertain to the maintenance of records that, in reasonable detail, accurately and
fairly reflect the transactions and dispositions of the assets of the company;
(ii) provide reasonable assurance that transactions are recorded as necessary to
permit preparation of financial statements in accordance with generally accepted
accounting principles, and that receipts and expenditures of the company are
being made only in accordance with authorizations of management and directors of
the company; and (iii) provide reasonable assurance regarding prevention or
timely detection of unauthorized acquisition, use, or disposition of the
company’s assets that could have a material effect on the financial
statements.
Because
of its inherent limitations, internal control over financial reporting may not
prevent or detect misstatements. Also, projections of any evaluation
of effectiveness to future periods are subject to the risk that controls may
become inadequate because of changes in conditions, or that the degree of
compliance with the policies or procedures may deteriorate.
/s/
PricewaterhouseCoopers LLP
Dallas,
Texas
March 1,
2010
TITANIUM METALS CORPORATION
CONSOLIDATED
BALANCE SHEETS
(In
millions, except per share data)
|
December
31,
|
||||||||
|
ASSETS
|
2008
|
2009
|
||||||
|
Current
assets:
|
||||||||
|
Cash and cash
equivalents
|
$ | 45.0 | $ | 169.4 | ||||
|
Accounts and other
receivables
|
144.4 | 85.0 | ||||||
|
Notes receivable from
affiliates
|
1.0 | 33.8 | ||||||
|
Inventories
|
569.7 | 475.6 | ||||||
|
Refundable income
taxes
|
2.3 | 8.2 | ||||||
|
Deferred income
taxes
|
21.7 | 25.3 | ||||||
|
Other
|
4.8 | 10.0 | ||||||
|
Total current
assets
|
788.9 | 807.3 | ||||||
|
Marketable
securities
|
16.4 | 20.6 | ||||||
|
Notes
receivable from affiliates
|
58.4 | 59.2 | ||||||
|
Property
and equipment, net
|
427.1 | 416.1 | ||||||
|
Deferred
income taxes
|
17.8 | 16.8 | ||||||
|
Other
|
59.1 | 58.6 | ||||||
|
Total assets
|
$ | 1,367.7 | $ | 1,378.6 | ||||
TITANIUM
METALS CORPORATION
CONSOLIDATED
BALANCE SHEETS (CONTINUED)
(In
millions, except per share data)
|
December
31,
|
||||||||
|
2008
|
2009
|
|||||||
|
LIABILITIES
AND EQUITY
|
||||||||
|
Current
liabilities:
|
||||||||
|
Accounts payable
|
$ | 58.5 | $ | 30.1 | ||||
|
Accrued and other current
liabilities
|
76.1 | 52.4 | ||||||
|
Customer advances
|
17.6 | 20.8 | ||||||
|
Income taxes
payable
|
- | 0.9 | ||||||
|
Deferred income
taxes
|
- | 0.4 | ||||||
|
Total current
liabilities
|
152.2 | 104.6 | ||||||
|
Accrued
OPEB cost
|
28.5 | 19.9 | ||||||
|
Accrued
pension cost
|
77.5 | 120.8 | ||||||
|
Deferred
income taxes
|
- | 1.6 | ||||||
|
Other
|
9.2 | 7.6 | ||||||
|
Total liabilities
|
267.4 | 254.5 | ||||||
|
Equity:
|
||||||||
|
TIMET stockholders’
equity:
|
||||||||
|
Series A Preferred Stock,
$0.01 par value; $3.6 million liquidation preference; 4.0 million shares
authorized, 0.1
million shares issued
and outstanding
|
3.2 | 3.2 | ||||||
|
Common stock, $0.01 par value;
200 million shares authorized,181.1
and 179.6 million shares issued and outstanding,
respectively
|
1.8 | 1.8 | ||||||
|
Additional paid-in
capital
|
523.4 | 509.0 | ||||||
|
Retained
earnings
|
696.7 | 731.0 | ||||||
|
Accumulated other comprehensive
loss
|
(145.5 | ) | (138.0 | ) | ||||
|
Total TIMET stockholders’
equity
|
1,079.6 | 1,107.0 | ||||||
|
Noncontrolling interest in
subsidiary
|
20.7 | 17.1 | ||||||
|
Total equity
|
1,100.3 | 1,124.1 | ||||||
|
Total liabilities and
equity
|
$ | 1,367.7 | $ | 1,378.6 | ||||
|
Commitments
and contingencies (Note 15)
|
||||||||
TITANIUM METALS CORPORATION
CONSOLIDATED
STATEMENTS OF INCOME
(In
millions, except per share data)
|
Year
ended December 31,
|
||||||||||||
|
2007
|
2008
|
2009
|
||||||||||
|
Net
sales
|
$ | 1,278.9 | $ | 1,151.5 | $ | 774.0 | ||||||
|
Cost
of sales
|
831.5 | 863.8 | 660.7 | |||||||||
|
Gross margin
|
447.4 | 287.7 | 113.3 | |||||||||
|
Selling,
general, administrative and development
expense
|
69.0 | 66.5 | 60.4 | |||||||||
|
Other
(expense) income, net
|
(6.4 | ) | (1.5 | ) | 2.0 | |||||||
|
Operating income
|
372.0 | 219.7 | 54.9 | |||||||||
|
Interest
expense
|
2.6 | 1.8 | 0.8 | |||||||||
|
Other
non-operating income, net
|
24.2 | 19.4 | 2.4 | |||||||||
|
Income before income
taxes
|
393.6 | 237.3 | 56.5 | |||||||||
|
Provision
for income taxes
|
116.9 | 69.1 | 20.7 | |||||||||
|
Net income
|
276.7 | 168.2 | 35.8 | |||||||||
|
Noncontrolling
interest in net income of subsidiary
|
8.5 | 5.7 | 1.3 | |||||||||
|
Net income attributable to TIMET
stockholders
|
268.2 | 162.5 | 34.5 | |||||||||
|
Dividends
on Series A Preferred Stock
|
5.1 | 0.3 | 0.2 | |||||||||
|
Net income attributable to TIMET
common
stockholders
|
$ | 263.1 | $ | 162.2 | $ | 34.3 | ||||||
|
Earnings
per share attributable to TIMET common stockholders:
|
||||||||||||
|
Basic
|
$ | 1.62 | $ | 0.89 | $ | 0.19 | ||||||
|
Diluted
|
$ | 1.46 | $ | 0.89 | $ | 0.19 | ||||||
|
Weighted
average shares outstanding:
|
||||||||||||
|
Basic
|
162.8 | 181.4 | 180.7 | |||||||||
|
Diluted
|
184.3 | 182.5 | 180.7 | |||||||||
|
Cash
dividends per common share
|
$ | 0.075 | $ | 0.30 | $ | - | ||||||
TITANIUM METALS CORPORATION
CONSOLIDATED
STATEMENTS OF COMPREHENSIVE INCOME
(In
millions)
|
Year
ended December 31,
|
||||||||||||
|
2007
|
2008
|
2009
|
||||||||||
|
Net
income
|
$ | 276.7 | $ | 168.2 | $ | 35.8 | ||||||
|
Other
comprehensive income, net of tax:
|
||||||||||||
|
Currency translation
adjustment
|
11.7 | (65.5 | ) | 22.8 | ||||||||
|
Unrealized (losses) gains and
reclassification adjustment on marketable securities
|
(19.9 | ) | (8.2 | ) | 2.2 | |||||||
|
Pension plans
|
12.0 | (54.1 | ) | (23.8 | ) | |||||||
|
OPEB plan
|
0.4 | 1.7 | 6.9 | |||||||||
|
Total other comprehensive
income (loss)
|
4.2 | (126.1 | ) | 8.1 | ||||||||
|
Comprehensive
income
|
280.9 | 42.1 | 43.9 | |||||||||
|
Comprehensive income attributable
to noncontrolling
interest
|
10.7 | 4.7 | 1.9 | |||||||||
|
Comprehensive income attributable
to TIMET
|
$ | 270.2 | $ | 37.4 | $ | 42.0 | ||||||
TITANIUM
METALS CORPORATION
CONSOLIDATED STATEMENTS OF CASH FLOWS
(In
millions)
|
Year
ended December 31,
|
||||||||||||
|
2007
|
2008
|
2009
|
||||||||||
|
Cash
flows from operating activities:
|
||||||||||||
|
Net income
|
$ | 276.7 | $ | 168.2 | $ | 35.8 | ||||||
|
Depreciation and
amortization
|
41.1 | 47.7 | 51.5 | |||||||||
|
Gain on sale of marketable and
other securities
|
(18.3 | ) | (6.7 | ) | - | |||||||
|
Loss (gain) on disposal of
property and equipment
|
7.7 | 0.4 | (0.1 | ) | ||||||||
|
Deferred income
taxes
|
(14.7 | ) | (4.1 | ) | 3.2 | |||||||
|
Other, net
|
0.4 | 1.8 | 2.2 | |||||||||
|
Change in assets and
liabilities:
|
||||||||||||
|
Receivables
|
7.7 | 46.9 | 64.2 | |||||||||
|
Inventories
|
(51.4 | ) | (45.3 | ) | 108.0 | |||||||
|
Accounts payable and accrued
liabilities
|
(10.6 | ) | (13.8 | ) | (55.2 | ) | ||||||
|
Income taxes
|
(35.5 | ) | 12.2 | (5.1 | ) | |||||||
|
Pensions and other postretirement
benefit plans
|
(9.6 | ) | (9.9 | ) | (1.4 | ) | ||||||
|
Other, net
|
(1.4 | ) | 0.2 | 3.7 | ||||||||
|
Net cash provided by operating
activities
|
192.1 | 197.6 | 206.8 | |||||||||
|
Cash
flows from investing activities:
|
||||||||||||
|
Capital
expenditures
|
(100.9 | ) | (121.3 | ) | (33.0 | ) | ||||||
|
Purchases of marketable
securities
|
- | (26.4 | ) | (0.7 | ) | |||||||
|
Proceeds from sale of property,
plant and equipment
|
- | - | 3.6 | |||||||||
|
Notes receivable from
affiliates:
|
||||||||||||
|
Loans
|
- | - | (33.8 | ) | ||||||||
|
Collections of principal
payments
|
2.6 | 7.3 | 0.5 | |||||||||
|
Other, net
|
(9.9 | ) | (2.2 | ) | (0.7 | ) | ||||||
|
Net cash used in investing
activities
|
(108.2 | ) | (142.6 | ) | (64.1 | ) | ||||||
|
Cash
flows from financing activities:
|
||||||||||||
|
Indebtedness:
|
||||||||||||
|
Borrowings
|
- | 63.9 | - | |||||||||
|
Repayments
|
- | (63.9 | ) | - | ||||||||
|
Dividends paid:
|
||||||||||||
|
Common stock
|
(13.7 | ) | (54.5 | ) | - | |||||||
|
Series A Preferred
Stock
|
(5.6 | ) | (0.3 | ) | (0.2 | ) | ||||||
|
Noncontrolling
interest
|
(8.1 | ) | (6.8 | ) | (5.5 | ) | ||||||
|
Treasury stock
purchases
|
- | (36.5 | ) | (14.7 | ) | |||||||
|
Other, net
|
2.9 | 0.4 | 0.1 | |||||||||
|
Net cash used in financing
activities
|
(24.5 | ) | (97.7 | ) | (20.3 | ) | ||||||
|
Net
cash provided by (used in) operating, investing and financing
activities
|
$ | 59.4 | $ | (42.7 | ) | $ | 122.4 | |||||
TITANIUM
METALS CORPORATION
CONSOLIDATED
STATEMENTS OF CASH FLOWS (CONTINUED)
(In
millions)
|
Year
ended December 31,
|
||||||||||||
|
2007
|
2008
|
2009
|
||||||||||
|
Cash
and cash equivalents:
|
||||||||||||
|
Net increase (decrease)
from:
|
||||||||||||
|
Operating, investing and
financing activities
|
$ | 59.4 | $ | (42.7 | ) | $ | 122.4 | |||||
|
Effect of exchange rate changes
on cash
|
1.2 | (2.3 | ) | 2.0 | ||||||||
|
Net cash provided (used) during
year
|
60.6 | (45.0 | ) | 124.4 | ||||||||
|
Cash and cash equivalents at
beginning of year
|
29.4 | 90.0 | 45.0 | |||||||||
|
Cash and cash equivalents at end
of year
|
$ | 90.0 | $ | 45.0 | $ | 169.4 | ||||||
|
Supplemental
disclosures:
|
||||||||||||
|
Cash paid for:
|
||||||||||||
|
Interest
|
$ | 2.8 | $ | 1.6 | $ | 0.6 | ||||||
|
Income taxes
|
$ | 165.9 | $ | 60.9 | $ | 22.7 | ||||||
|
Non-cash investing and financing
activities:
|
||||||||||||
|
Promissory notes received from
affiliates upon sale of marketable
and other securities
|
$ | 52.6 | $ | 16.7 | $ | - | ||||||
TITANIUM METALS CORPORATION
CONSOLIDATED
STATEMENTS OF CHANGES IN EQUITY
FOR THE
YEARS ENDED DECEMBER 31, 2007, 2008 AND 2009
(In
millions)
|
TIMET
stockholders’ equity
|
||||||||||||||||||||||||||||||||||||
|
Common
shares
|
Common
stock
|
Series
A
Preferred
Stock
|
Additional
paid-in capital
|
Retained
earnings
|
Accumulated
other comprehensive loss
|
Treasury
stock and other
|
Non-controlling
interest
|
Total
|
||||||||||||||||||||||||||||
|
Balance
at January 1, 2007
|
161.5 | $ | 1.6 | $ | 75.0 | $ | 484.4 | $ | 340.3 | $ | (22.4 | ) | $ | - | $ | 21.3 | $ | 900.2 | ||||||||||||||||||
|
Net income
|
- | - | - | - | 268.2 | - | - | 8.5 | 276.7 | |||||||||||||||||||||||||||
|
Other comprehensive
income
|
- | - | - | - | - | 2.0 | - | 2.2 | 4.2 | |||||||||||||||||||||||||||
|
Issuance of common
stock
|
0.2 | - | - | 1.0 | - | - | - | - | 1.0 | |||||||||||||||||||||||||||
|
Conversion of Series A
Preferred Stock |
21.3 | 0.2 | (70.9 | ) | 70.7 | - | - | - | - | - | ||||||||||||||||||||||||||
|
Tax benefit of stock
options
exercised |
- | - | - | 2.1 | - | - | - | - | 2.1 | |||||||||||||||||||||||||||
|
Dividends
declared:
|
||||||||||||||||||||||||||||||||||||
|
Series A Preferred
Stock
|
- | - | - | - | (5.6 | ) | - | - | - | (5.6 | ) | |||||||||||||||||||||||||
|
Common stock
|
- | - | - | - | (13.7 | ) | - | - | - | (13.7 | ) | |||||||||||||||||||||||||
|
Noncontrolling
interest
|
- | - | - | - | - | - | - | (8.1 | ) | (8.1 | ) | |||||||||||||||||||||||||
|
Other
|
- | - | - | - | (0.2 | ) | - | - | - | (0.2 | ) | |||||||||||||||||||||||||
|
Balance
at December 31, 2007
|
183.0 | $ | 1.8 | $ | 4.1 | $ | 558.2 | $ | 589.0 | $ | (20.4 | ) | $ | - | $ | 23.9 | $ | 1,156.6 | ||||||||||||||||||
|
Net income
|
- | - | - | - | 162.5 | - | - | 5.7 | 168.2 | |||||||||||||||||||||||||||
|
Other comprehensive
loss
|
- | - | - | - | - | (125.1 | ) | - | (1.0 | ) | (126.1 | ) | ||||||||||||||||||||||||
|
Conversion of Series
A
Preferred Stock |
0.3 | - | (0.9 | ) | 0.9 | - | - | - | - | - | ||||||||||||||||||||||||||
|
Treasury stock
purchases
|
- | - | - | - | - | - | (36.5 | ) | - | (36.5 | ) | |||||||||||||||||||||||||
|
Treasury stock
retirement
|
(2.3 | ) | - | - | (36.5 | ) | - | - | 36.5 | - | - | |||||||||||||||||||||||||
|
Dividends
declared:
|
||||||||||||||||||||||||||||||||||||
|
Series A Preferred
Stock
|
- | - | - | - | (0.3 | ) | - | - | - | (0.3 | ) | |||||||||||||||||||||||||
|
Common stock
|
- | - | - | - | (54.5 | ) | - | - | - | (54.5 | ) | |||||||||||||||||||||||||
|
Noncontrolling
interest
|
- | - | - | - | - | - | - | (6.8 | ) | (6.8 | ) | |||||||||||||||||||||||||
|
Other, net
|
0.1 | - | - | 0.8 | - | - | - | (1.1 | ) | (0.3 | ) | |||||||||||||||||||||||||
|
Balance
at December 31, 2008
|
181.1 | $ | 1.8 | $ | 3.2 | $ | 523.4 | $ | 696.7 | $ | (145.5 | ) | $ | - | $ | 20.7 | $ | 1,100.3 | ||||||||||||||||||
|
Net income
|
- | - | - | - | 34.5 | - | - | 1.3 | 35.8 | |||||||||||||||||||||||||||
|
Other comprehensive
loss
|
- | - | - | - | - | 7.5 | - | 0.6 | 8.1 | |||||||||||||||||||||||||||
|
Treasury stock
purchases
|
- | - | - | - | - | - | (14.7 | ) | - | (14.7 | ) | |||||||||||||||||||||||||
|
Treasury stock
retirement
|
(1.5 | ) | - | - | (14.7 | ) | - | - | 14.7 | - | - | |||||||||||||||||||||||||
|
Dividends to
noncontrolling
interest |
- | - | - | - | (5.5 | ) | (5.5 | ) | ||||||||||||||||||||||||||||
|
Other, net
|
- | - | - | 0.3 | (0.2 | ) | - | - | - | 0.1 | ||||||||||||||||||||||||||
|
Balance
at December 31, 2009
|
179.6 | $ | 1.8 | $ | 3.2 | $ | 509.0 | $ | 731.0 | $ | (138.0 | ) | $ | - | $ | 17.1 | $ | 1,124.1 | ||||||||||||||||||
TITANIUM METALS CORPORATION
NOTES
TO CONSOLIDATED FINANCIAL STATEMENTS
Note
1 – Basis of presentation and organization
Titanium
Metals Corporation (NYSE: TIE), a Delaware corporation, is a vertically
integrated producer of titanium sponge, melted products and a variety of mill
products for commercial aerospace, military, industrial and other
applications.
Basis of
presentation. The Consolidated Financial Statements contained
in this Annual Report include the accounts of Titanium Metals Corporation and
its majority owned subsidiaries (collectively referred to as
“TIMET”). Unless otherwise indicated, references in this report to
“we”, “us” or “our” refer to TIMET and its subsidiaries, taken as a
whole. All material intercompany transactions and balances with
consolidated subsidiaries have been eliminated. Our first three
fiscal quarters reported are the approximate 13-week periods ending on the
Saturday generally nearest to March 31, June 30 and September 30. Our
fourth fiscal quarter and fiscal year always end on December 31. For
presentation purposes, disclosures of quarterly information in the accompanying
notes have been presented as ended on March 31, June 30, September 30 and
December 31, as applicable. Certain reclassifications have been made
to conform the presentation of noncontrolling interest in prior year’s
Consolidated Financial Statements to the current year’s
classifications.
Organization. At December 31,
2009, subsidiaries of Contran Corporation held 27.5% of our outstanding common
stock. Substantially all of Contran's outstanding voting stock is
held by trusts established for the benefit of certain children and grandchildren
of Harold C. Simmons, of which Mr. Simmons is sole trustee, or is held by Mr.
Simmons or persons or other entities related to Mr. Simmons. At
December 31, 2009, Mr. Simmons and his spouse owned an aggregate of 16.1% of our
common stock, and the Combined Master Retirement Trust (“CMRT”), a collective
investment trust sponsored by Contran to permit the collective investment by
certain master trusts that fund certain employee benefits plans sponsored by
Contran and certain of its affiliates., held an additional 8.6% of our common
stock. Mr. Simmons is the sole trustee of the CMRT and a member of
its trust investment committee. Consequently, Mr. Simmons may be
deemed to control each of Contran and us.
Note
2 – Summary of significant accounting policies
Management’s
estimates. The preparation of
financial statements in conformity with accounting principles generally accepted
in the United States of America (“GAAP”) requires us to make estimates and
assumptions that affect the reported amounts of assets and liabilities and
disclosure of contingent assets and liabilities at the date of the financial
statements, and the reported amount of revenues and expenses during the
reporting period. We use estimates in accounting for, among other
things, allowances for uncollectible accounts, inventory costing and allowances,
environmental accruals, self insurance accruals, deferred tax valuation
allowances, loss contingencies, valuation and impairment of financial
instruments, the determination of sales discounts and other rate assumptions for
pension and other postretirement employee benefit costs, asset impairments,
useful lives of property and equipment, asset retirement obligations and other
special items. Actual results may, in some instances, differ from
previously estimated amounts. We review estimates and assumptions
periodically, and the effects of revisions are reflected in the period they are
determined to be necessary.
Foreign currency
translation. We translate the assets
and liabilities of our subsidiaries whose functional currency is deemed to be
other than the U.S. dollar at year-end rates of exchange, while we translate
their revenues and expenses at average exchange rates prevailing during the
year. The functional currencies of our foreign subsidiaries are
generally the local currency of their respective countries. We
accumulate the resulting translation adjustments in the currency translation
adjustments component of other comprehensive income. We recognize
currency transaction gains and losses in income in the period they are
incurred. We recognized net currency transaction losses of $1.2
million in 2007 and gains of $9.9 million in 2008 and $0.3 million in
2009.
Cash and cash
equivalents. We classify highly
liquid investments with original maturities of three months or less as cash
equivalents.
Accounts
receivable. We provide an allowance for doubtful accounts for
known and estimated potential losses arising from sales to customers based on a
periodic review of these accounts. Our periodic review of these accounts results
in an estimate of uncollectible accounts. Our estimate of the
collectability of trade accounts receivable is based on a historical analysis of
write-offs and evaluations of the aging trends and specific facts and
circumstances.
Inventories and
cost of sales. We state inventories at the lower of cost or market
generally based on the specific identification cost method, with certain raw
materials stated based on the average cost method. Inventories
include the costs for raw materials, the cost to manufacture the raw materials
into finished goods and overhead. Unallocated fixed overhead costs
resulting from periods with abnormally low production levels are charged to cost
of sales in the period incurred. Depending on the inventory’s stage
of completion, our manufacturing costs can include the costs of packing and
finishing, utilities, maintenance and depreciation, shipping and handling, and
salaries and benefits associated with our manufacturing process. As
inventory is sold to third parties, we recognize the cost of sales in the same
period that the sale occurs. We periodically review our inventory for
estimated obsolescence or instances when inventory is no longer marketable for
its intended use, and we record any write-down equal to the difference between
the cost of inventory and its estimated net realizable value based upon
assumptions about alternative uses, market conditions and other
factors.
Marketable
securities. We carry marketable equity securities at fair
value. GAAP establishes a consistent framework for measuring fair
value, and beginning on January 1, 2008 (with certain exceptions), this
framework is generally applied to all financial instruments by requiring fair
value measurements to be classified and disclosed in one of the following three
categories:
|
|
·
|
Level
1 – Unadjusted quoted prices in active markets that are accessible at the
measurement date for identical, unrestricted assets or
liabilities;
|
|
|
·
|
Level
2 – Quoted prices in markets that are not active, or inputs which are
observable, either directly or indirectly, for substantially the full term
of the assets or liability; and
|
|
|
·
|
Level
3 – Prices or valuation techniques that require inputs that are both
significant to the fair value measurement and
unobservable.
|
We
classify all of our marketable securities as available-for-sale, and unrealized
gains or losses on these securities are recognized through other comprehensive
income, except for any decline in value we conclude is other than
temporary. We base realized gains and losses upon the specific
identification of the securities sold.
We
evaluate our investments whenever events or conditions occur to indicate that
the fair value of such investments has declined below their carrying
amounts. If the carrying amount for an investment declines below its
historical cost basis, we evaluate all available positive and negative evidence
including, but not limited to, the extent and duration of the impairment,
business prospects for the investee and our intent and ability to hold the
investment for a reasonable period of time sufficient for the recovery of fair
value. If we determine the decline in fair value is other than
temporary, the carrying amount of the investment is written down to fair
value.
Property,
equipment and depreciation. We state property and
equipment at cost. We record depreciation and amortization expense on
the straight-line method over the estimated useful lives of the assets as
follows:
|
Asset
|
Useful
life
|
|
|
Building and
improvements
|
5 to 30
years
|
|
|
Machinery and equipment
|
2 to 25
years
|
|
|
Computer equipment and software
|
2 to 5 years
|
We
expense maintenance (including planned major maintenance) and repairs as
incurred and include such expenses in cost of sales. We capitalize
major improvements.
In
addition, we recognize the fair value of a liability for an asset retirement
obligation during the period in which the liability becomes reasonably
estimable, with an offsetting increase in the carrying amount of the related
long-lived asset. Over time, the liability is accreted to its future
value, and the capitalized cost is depreciated over the remaining useful life of
the related asset. The settlement dates and methods of asset
retirement obligations identified at certain of our locations are indeterminate
and, therefore, we cannot reasonably estimate the fair value of such
liability. We are aware of the existence of asbestos and other
environmental contaminants at certain owned facilities, and other instances of
asbestos or other environmental contaminants may be identified in the
future. If in the future we decide to remove the asbestos or other
environmental contaminants in connection with a major renovation or demolition
of an affected property, or if the settlement dates and methods otherwise become
determinate, our obligation to remove and dispose of or remediate such
contaminants in accordance with the applicable environmental regulations may
become reasonably estimable.
Impairment of
long-lived assets. We review long-lived assets for impairment
whenever events or changes in circumstances indicate the carrying amount of such
assets may not be recoverable. We perform the impairment test
comparing the carrying amount of the assets to the undiscounted expected future
operating cash flows of the assets or asset group. If this comparison
indicates the carrying amount is not recoverable, the amount of the impairment
would typically be calculated using discounted expected future cash flows or
appraised values. We consider all relevant factors in determining
whether an impairment exists.
Fair value of
financial instruments. Carrying amounts of
certain of our financial instruments including, among others, cash and cash
equivalents and accounts receivable, approximate fair value because of their
short maturities. We carry our investments in marketable equity
securities at fair value based upon quoted market prices, and the carrying value
of our notes receivable from affiliates approximates fair value because the
applicable interest rates are variable based upon stated market
indices.
Employee benefit
plans. Accounting and funding
policies for retirement plans and postretirement benefits other than pensions
(“OPEB”) are described in Note 13.
Environmental
remediation costs. We record liabilities related to
environmental remediation obligations when estimated future expenditures are
probable and reasonably estimable. We adjust our accruals as further
information becomes available to us or as circumstances change. We
generally do not discount estimated future expenditures to their present value
due to the uncertainty of the timing of the ultimate payout. In the
future, if the standards or requirements under environmental laws or regulations
become more stringent, if our testing and analysis at our operating facilities
identify additional environmental remediation, or if we determine that we are
responsible for the remediation of hazardous substance contamination at other
sites, then we may incur additional costs in excess of our current
estimates. We do not know if actual costs will exceed our current
estimates, if additional sites or matters will be identified which require
remediation or if the estimated costs associated with previously identified
sites requiring environmental remediation will become estimable in the
future. Additional information regarding our alternative solutions
for our environmental remediation obligations obtained from the results of our
testing and analysis, various regulatory agencies or other sources allows us to
refine our estimates of future remediation expenditures, and as a result, we
recognized environmental remediation costs of a nominal amount in 2007, $2.6
million in 2008 and $0.4 million in 2009. We recognize any recoveries
of remediation costs from other parties when we deem their receipt to be
probable. At December 31, 2008 and 2009, we had not recognized any
receivables for recoveries.
Revenue
recognition. We record sales revenue
when we have certified that our product meets the related customer
specifications, the product has been shipped, and title and all the risks and
rewards of ownership have passed to the customer. We record payments
we receive from customers in advance of these criteria being met as customer
advances or deferred revenue, depending on our products’ stage of completion,
until earned. For inventory consigned to customers, we recognize
sales revenue when (i) the terms of the consignment end, (ii) we have completed
performance of all significant obligations and (iii) title and all of the risks
and rewards of ownership have passed to the customer. We include
amounts charged to customers for shipping and handling in net
sales. We state sales revenue net of price and early payment
discounts. We report any tax assessed by a governmental authority
that we collect from our customers that is both imposed on and concurrent with
our revenue-producing activities (such as sales, use, value added and excise
taxes) on a net basis (meaning we do not recognize these taxes either in our
revenues or in our costs and expenses).
Research and
development. We recognize research
and development expense, which includes activities directed toward expanding the
use of titanium and titanium alloys in all market sectors, as incurred, and we
classify research and development expense as part of selling, general,
administrative and development expense. We recognized research and
development expense of $4.2 million in 2007, $4.3 million in 2008 and $7.8
million in 2009. We record any related engineering and
experimentation costs associated with ongoing commercial production in cost of
sales.
Self-insurance. We are
self-insured for certain exposures relating to employee and retiree medical
benefits and workers’ compensation claims. We purchase insurance from
third-party providers, which limit our maximum exposure to $0.3 million per
occurrence for employee medical benefit claims and $0.5 million per occurrence
for workers’ compensation claims. We paid $14.8 million during 2007,
$15.6 million during 2008 and $16.8 million in 2009 related to employee medical
benefits. We also paid $1.1 million during 2007, $0.9 million in 2008
and $1.1 million in 2009 related to workers’ compensation
claims. Additionally, we maintain insurance from third-party
providers for automobile, property, product, fiduciary and other liabilities,
which are subject to various deductibles and policy limits typical for these
types of insurance policies. See Note 14 for discussion of
policies provided by related parties.
Income
taxes. We
recognize deferred income tax assets and liabilities for the expected future tax
consequences of temporary differences between the income tax and financial
reporting carrying amounts of our assets and liabilities, including investments
in our subsidiaries and affiliates who are not members of our U.S. Federal
income tax group and undistributed earnings of foreign subsidiaries which are
not permanently reinvested. The earnings of our foreign subsidiaries
subject to permanent reinvestment plans aggregated $169.8 million at December
31, 2008 and $144.6 million at December 31, 2009. It is not practical
for us to determine the amount of the unrecognized deferred income tax liability
related to such earnings due to the complexities associated with the U.S.
taxation on earnings of foreign subsidiaries repatriated to the U.S. We
periodically evaluate our deferred income tax assets and recognize a valuation
allowance based on the estimate of the amount of such deferred tax assets which
we believe does not meet the more-likely-than-not recognition
criteria. We record a reserve for uncertain tax positions if we
believe it is more-likely-than-not our position will not prevail with the
applicable tax authorities. See Note 12.
Recent accounting
pronouncements. Uncertain tax
positions. On January 1, 2007, we adopted Financial Accounting
Standards Board (“FASB”) Interpretation No. (“FIN”) 48, Accounting for Uncertain Tax
Positions, which is now included with ASC Topic 740 Income Taxes. FIN
48 clarifies when and how much of a benefit we can recognize in our consolidated
financial statements for certain positions taken in our income tax returns and
enhances the disclosure requirements for our income tax policies and
reserves. Among other things, FIN 48 prohibits us from recognizing
the benefits of a tax position unless we believe it is more-likely-than-not our
position will prevail with the applicable tax authorities and limits the amount
of the benefit to the largest amount for which we believe the likelihood of
realization is greater than 50%. FIN 48 also requires companies to
accrue penalties and interest on the difference between tax positions taken on
their tax returns and the amount of benefit recognized for financial reporting
purposes under the new standard. We are required to classify any
future reserves for uncertain tax positions in a separate current or noncurrent
liability, depending on the nature of the tax position. Our adoption
of FIN 48 did not have a material impact on our consolidated financial position
or results of operations. Upon adoption of FIN 48, we recognized a
$0.2 million decrease to retained earnings.
We accrue
interest and penalties on our uncertain tax positions as a component of our
provision for income taxes. The amount of interest and penalties we
accrued during 2007, 2008 and 2009 was not material, and we had $0.2 million
accrued for interest and an immaterial amount accrued for penalties for our
uncertain tax positions at December 31, 2007 and $0.3 million accrued for
interest at each of December 31, 2008 and 2009. The following table
shows the changes in the amount of our uncertain tax positions (exclusive of the
effect of interest and penalties):
|
Year
ended December 31,
|
||||||||||||
|
2007
|
2008
|
2009
|
||||||||||
|
(In
millions)
|
||||||||||||
|
Unrecognized
tax benefits:
|
||||||||||||
|
Beginning balance
|
$ | 2.2 | $ | 1.8 | $ | 3.4 | ||||||
|
Gross decreases in tax positions
taken in prior periods
|
(0.5 | ) | (0.5 | ) | (0.6 | ) | ||||||
|
Gross increases in tax positions
taken in current period
|
0.2 | 2.7 | 3.1 | |||||||||
|
Settlements with taxing
authorities – cash paid
|
(0.1 | ) | - | - | ||||||||
|
Change in foreign currency
exchange rates
|
- | (0.6 | ) | 0.3 | ||||||||
|
Ending balance
|
$ | 1.8 | $ | 3.4 | $ | 6.2 | ||||||
If our
uncertain tax positions were recognized, a benefit of $0.4 million, $2.5 million
and $5.9 million would affect our effective income tax rate from continuing
operations in 2007, 2008 and 2009, respectively. We currently
estimate that our unrecognized tax benefits will decrease by approximately $0.6
million during the next twelve months due to the reversal of certain timing
differences and the expiration of certain statutes of limitations.
We file
income tax returns in various U.S. federal, state and local
jurisdictions. We also file income tax returns in various foreign
jurisdictions, principally in the United Kingdom, Italy, France and
Germany. Our domestic income tax returns prior to 2006 are generally
considered closed to examination by applicable tax authorities. Our
foreign income tax returns are generally considered closed to examination for
years prior to 2003 for the United Kingdom, 2005 for Italy and Germany and 2006
for France.
Noncontrolling
interest. On January 1, 2009, we adopted the accounting and
disclosure requirements of Statement of Financial Accounting Standard (“SFAS”)
No. 160, Noncontrolling
Interests in Consolidated Financial Statements, an Amendment of ARB No.
51, which is now included with Accounting Standards Codification (“ASC”)
Topic 810 Consolidation. This
principle establishes a single method of accounting for changes in a parent’s
ownership interest in a subsidiary that do not result in
deconsolidation. On a prospective basis, any changes in ownership
will be accounted for as equity transactions with no gain or loss recognized on
the transactions unless there is a change in control. Previously,
such changes in ownership would generally result either in the recognition of
additional goodwill (for an increase in ownership) or a gain or loss included in
the determination of net income (for a decrease in ownership). This
principle also standardizes the presentation of noncontrolling interest as a
component of equity on the balance sheet and on a net income basis in the
statement of income and requires expanded disclosures in the consolidated
financial statements that clearly identify and distinguish between the interests
of the parent and the interests of the noncontrolling owners of a
subsidiary. Upon adoption, we reclassified our consolidated balance
sheet and statement of income to conform to the new presentation requirements
for the noncontrolling interest in our 70%-owned French subsidiary for all
periods presented.
Other than temporary
impairments. As of June 30, 2009, we adopted FSP FAS 115-2 and
FAS 124-2, Recognition and
Presentation of Other-Than-Temporary Impairments, which is now included
with ASC Topic 320 Investments
- Debt and Equity Securities and amends existing guidance for the
recognition and measurement of other-than-temporary impairments for debt
securities classified as available-for-sale and held-to-maturity and expands the
disclosure requirements for interim and annual periods for available-for-sale
and held-to-maturity debt and equity securities to include additional
information about investments in an unrealized loss position for which an
other-than-temporary impairment has or has not been recognized. We
have included these additional disclosures in Note 4.
Subsequent
events. Beginning with the Quarterly Report for the period
ending June 30, 2009, we adopted SFAS No. 165, Subsequent Events, which is
now included with ASC Topic 855 Subsequent Events, which was subsequently amended by Accounting
Standards Update ("ASU") 2010-09. This principle
establishes general standards of accounting for and disclosure of events that
occur after the balance sheet date but before financial statements are issued,
which are referred to as subsequent events. The principle clarifies
existing guidance on subsequent events, including a requirement that a public
entity should evaluate subsequent events through the issue date of the financial
statements, the determination of when the effects of subsequent events should be
recognized in the financial statements and disclosures regarding all subsequent
events. This principle became effective for us in the second quarter
of 2009 and its adoption did not have a material effect on our Consolidated
Financial Statements.
Benefit plan asset
disclosures. During the fourth quarter of 2008, the FASB
issued FSP FAS 132 (R)-1, Employers’ Disclosures about
Postretirement Benefit Plan Assets, which is now included with ASC
Subtopic 715-20 Defined
Benefit Plans, which amends SFAS No. 87, 88 and 106 to require expanded
disclosures about employers’ pension plan assets, and we have included these
expanded disclosures in Note 13.
Revenue arrangements with multiple
deliverables. In October 2009, the FASB issued ASU 2009-13
Multiple-Deliverable Revenue
Arrangements, which will amend ASC Subtopic 605-25 Multiple-Element
Arrangements. ASU 2009-13 eliminates the residual method of
allocating revenue to each deliverable in a multiple deliverable arrangement and
requires the use of the residual selling price method of allocation using the
vendor’s best estimate of the selling price of a particular deliverable if
vendor-specific and third-party evidence of a selling price do not
exist. ASU 2009-13 also increases disclosure requirements for these
arrangements. We expect to adopt ASU 2009-13 on a prospective basis
for revenue arrangements with multiple deliverables entered into or modified
beginning in 2011, and we do not expect the adoption to have a material effect
on our Consolidated Financial Statements.
Note
3 – Inventories
|
December
31,
|
||||||||
|
2008
|
2009
|
|||||||
|
(In
millions)
|
||||||||
|
Raw
materials
|
$ | 138.0 | $ | 132.1 | ||||
|
Work-in-process
|
264.1 | 203.2 | ||||||
|
Finished
products
|
119.8 | 89.5 | ||||||
|
Inventory
consigned to customers
|
19.2 | 21.2 | ||||||
|
Supplies
|
28.6 | 29.6 | ||||||
|
Total inventories
|
$ | 569.7 | $ | 475.6 | ||||
Note
4 – Marketable securities
Our
marketable securities consist of investments in the publicly traded shares of
related parties. NL Industries, Inc., Kronos Worldwide, Inc. and
Valhi, Inc. are each majority owned subsidiaries of Contran. All of
our marketable securities are classified as available-for-sale, which are
carried at fair value using quoted prices in active markets for each marketable
security, representing inputs from the highest level (level 1) within the fair
value hierarchy. The following table summarizes our marketable
securities as of December 31, 2008 and 2009:
|
Marketable
security
|
Fair
value measurement level
|
Market
value
|
Cost
basis
|
Unrealized
gains (losses)
|
||||||||||||
|
(In
millions)
|
||||||||||||||||
|
As
of December 31, 2008:
|
||||||||||||||||
|
Valhi
|
1 | $ | 13.4 | $ | 26.4 | $ | (13.0 | ) | ||||||||
|
NL
|
1 | 3.0 | 2.5 | 0.5 | ||||||||||||
|
Kronos
|
1 | - | 0.2 | (0.2 | ) | |||||||||||
|
Total
|
$ | 16.4 | $ | 29.1 | $ | (12.7 | ) | |||||||||
|
As
of December 31, 2009:
|
||||||||||||||||
|
Valhi
|
1 | $ | 17.7 | $ | 26.6 | $ | (8.9 | ) | ||||||||
|
NL
|
1 | 1.6 | 2.5 | (0.9 | ) | |||||||||||
|
Kronos
|
1 | 1.3 | 0.7 | 0.6 | ||||||||||||
|
Total
|
$ | 20.6 | $ | 29.8 | $ | (9.2 | ) | |||||||||
During
2008 and 2009, we purchased 1.3 million shares of Valhi common stock in market
transactions for an aggregate of $26.6 million, and we held approximately 1.1%
of Valhi common stock at December 31, 2009. Additionally, we held
approximately 0.5% of NL’s outstanding common stock and 0.2% of Kronos’
outstanding common stock at December 31, 2009. Valhi and NL held an
aggregate of approximately 95% of Kronos’ outstanding common stock at December
31, 2009.
Because
we have classified all of our marketable securities as available-for-sale, any
unrealized gains or losses on the securities are recognized through other
comprehensive income. With respect to our investment in Valhi common
stock, we considered the decline in market price for Valhi common stock to be
temporary at December 31, 2009. We considered all available evidence
in reaching this conclusion. While our investment in Valhi common
stock has been in a continuous unrealized loss position since August 2008, the
positive evidence we considered to conclude the decline was temporary at
December 31, 2009 includes (i) our ability and intent to hold the investment in
Valhi common stock for a reasonable period of time sufficient for the recovery
of fair value (as evidenced by the amount of liquidity we currently have with
cash on hand and our borrowing availability) and (ii) the significant partial
recovery of fair value, as the quoted market price for Valhi common stock
increased as much as 134% from July 2009 through January 2010 as compared to the
63% decline in Valhi’s quoted market price during the period from August 2008
through June 2009. For our investment in NL, our cost basis has
exceeded its market value for less than twelve months, and we believe the
decline in market price of this security to be temporary in nature as a result
of recent market volatility.
We will
continue to monitor the quoted market prices for these securities. If
we conclude in the future that the decline in value of one or more of these
securities was other than temporary, we would recognize an impairment through an
income statement charge at that time. Such income statement
impairment charge would be offset in other comprehensive income by the reversal
of the previously recognized unrealized losses to the extent they were
previously recognized in accumulated other comprehensive income.
Note
5 – Property and equipment
|
December
31,
|
||||||||
|
2008
|
2009
|
|||||||
|
(In
millions)
|
||||||||
|
Land
and improvements
|
$ | 12.5 | $ | 13.6 | ||||
|
Buildings
and improvements
|
57.8 | 71.0 | ||||||
|
Computer
equipment and software
|
71.0 | 72.6 | ||||||
|
Manufacturing
equipment and other
|
481.1 | 565.0 | ||||||
|
Construction
in progress
|
109.3 | 35.0 | ||||||
|
Total property and
equipment
|
731.7 | 757.2 | ||||||
|
Less
accumulated depreciation
|
304.6 | 341.1 | ||||||
|
Total property and equipment,
net
|
$ | 427.1 | $ | 416.1 | ||||
Note
6 – Other noncurrent assets
|
December
31,
|
||||||||
|
2008
|
2009
|
|||||||
|
(In
millions)
|
||||||||
|
Prepaid
conversion services
|
$ | 44.7 | $ | 42.2 | ||||
|
Other
|
14.4 | 16.4 | ||||||
|
Total prepaid and other
noncurrent assets
|
$ | 59.1 | $ | 58.6 | ||||
Note
7 – Accrued and other current liabilities
|
December
31,
|
||||||||
|
2008
|
2009
|
|||||||
|
(In
millions)
|
||||||||
|
Employee
related
|
$ | 38.3 | $ | 21.8 | ||||
|
Deferred
revenue
|
18.5 | 16.9 | ||||||
|
Other
|
19.3 | 13.7 | ||||||
|
Total accrued
liabilities
|
$ | 76.1 | $ | 52.4 | ||||
Under the
terms of long-term agreements (“LTAs”) with certain of our customers, our
customers are required to purchase from us a buffer inventory of titanium
products for use by us in the production of titanium products ordered by the
customer in the future. Generally, as the related inventory is placed
into buffer, the customer is billed and takes title to the inventory, although
we could retain an obligation to further process the material as directed by the
customer. Accordingly, we defer the recognition of the revenue and
cost of sales on the buffer inventory until the final product is delivered to
the customer. As of December 31, 2008 and 2009, $13.8 million and
$13.5 million, respectively, of our deferred revenue related to the buffer
inventory. The buffer inventory is included in our inventory
consigned to customers in Note 3.
Note
8 – Bank debt
We have a
$175 million U.S. long-term credit agreement (the “U.S. Facility”)
collateralized primarily by our U.S. accounts receivable, inventory, personal
property, intangible assets and a negative pledge on our U.S. fixed
assets. The U.S. Facility matures in February 2011, and borrowings
under the U.S. Facility accrue interest at the U.S. prime rate or varying
LIBOR-based rates based on a quarterly ratio of outstanding debt to EBITDA as
defined by the agreement. We had no outstanding borrowings under the
U.S. Facility as of December 31, 2008 and 2009. The U.S. Facility
also provides for the issuance of up to $10 million of letters of
credit.
The U.S.
Facility contains certain restrictive covenants that, among other things, limit
or restrict our ability to incur debt, incur liens, make investments, make
capital expenditures or pay dividends. The U.S. Facility also
requires compliance with certain financial covenants, including minimum tangible
net worth, a fixed charge coverage ratio and a leverage ratio, and contains
other covenants customary in lending transactions of this type including
cross-default provisions with respect to our debt and obligations. We
were in compliance with all such covenants during the years ended December 31,
2008 and 2009. Borrowings under the U.S. Facility are limited to the
lesser of $175 million or a formula-determined amount based upon U.S. accounts
receivable, inventory and fixed assets (subject to pledging fixed
assets). The formula-determined amount only applies if borrowings
exceed 60% of the commitment amount or the leverage ratio exceeds a certain
level, but based on our outstanding borrowings and leverage ratio, the
formula-determined borrowing ceiling was not applicable as of December 31,
2008. At December 31, 2009, the formula-determined borrowing ceiling,
after considering any outstanding letters of credit, limited our borrowing
availability to $164.3 million due to reduced inventory levels and accounts
receivable balances.
In
November 2009, TIMET UK, our wholly-owned subsidiary in the U.K., replaced its
previous £22.5 million working capital credit facility with a new three part
facility that matures on August 31, 2012, collectively referred to as the “U.K.
Facility”. Under the U.K. Facility, TIMET UK may borrow up to an
aggregate of £22.5 million consisting of £18.0 million for revolving credit,
£3.5 million for guarantees and £1.0 million for overdrafts, subject to a
formula-determined borrowing base derived from the value of accounts receivable,
inventory and property, plant and equipment. Borrowings under the
U.K. Facility can be in various currencies, including U.S. dollars, British
pounds sterling and euros and are collateralized by substantially all of TIMET
UK’s assets. Interest on outstanding borrowings generally accrues at
rates that vary from 1.5% to 1.75% above the lender’s published base
rate. The credit agreement includes revolving credit, guarantee and
overdraft facilities and requires the maintenance of certain financial ratios
and amounts, including a minimum net worth covenant and other covenants
customary in lending transactions of this type. TIMET UK was in
compliance with all covenants during the years ended December 31, 2008 and
2009. We had no outstanding borrowings under either U.K. Facility at
December 31, 2008 and 2009.
We also
have overdraft and other credit facilities at certain of our other European
subsidiaries. These facilities accrue interest at various rates and
are payable on demand, and as of December 31, 2008 and 2009, there were no
outstanding borrowings under these facilities. Our consolidated
borrowing availability under our U.S., U.K. and other European credit facilities
aggregated to $211.4 million as of December 31, 2009.
As of
December 31, 2009, we had $3.3 million of letters of credit outstanding under
our U.S. Facility which were required by various utilities and government
entities for performance and insurance guarantees, and we had $10.2 million of
letters of credit outstanding under our European credit facilities as collateral
under certain inventory purchase contracts. These letters of credit
reduce our borrowing availability under our credit facilities.
Note
9 – Equity
Preferred
stock. At
December 31, 2008 and 2009, we were authorized to
issue 10 million shares of preferred stock. Our board of directors
determines the rights of preferred stock as to, among other things, dividends,
liquidation, redemption, conversions and voting rights.
Prior to
2007, we issued 3.9 million shares of our Series A Preferred Stock in exchange
for 3.9 million of our previously issued 6.625% mandatorily redeemable
convertible preferred securities, beneficial unsecured convertible
securities. Each share of the Series A Preferred Stock is
convertible, at any time, at the option of the holder thereof, at a conversion
price of $3.75 per share of our common stock (equivalent to a conversion rate of
thirteen and one-third shares of common stock for each share of Series A
Preferred Stock), with any partial shares paid in cash. The
conversion rate is subject to adjustment if certain events occur, including, but
not limited to, a stock dividend on our common stock, subdivisions or certain
reclassifications of our common stock or the issuance of warrants to holders of
our common stock.
Our
Series A Preferred Stock is not mandatorily redeemable but is redeemable at our
option at any time after September 1, 2007. Holders of the Series A
Preferred Stock are entitled to receive cumulative cash dividends at the rate of
6.75% of the $50 per share liquidation preference per annum per share
(equivalent to $3.375 per annum per share), when, as and if declared by our
board of directors. Whether or not declared, cumulative dividends on
Series A Preferred Stock are deducted from net income to arrive at net income
attributable to common stockholders. Our U.S. Facility contains
certain financial covenants that may restrict our ability to make dividend
payments on the Series A Preferred Stock.
During
2007 and 2008, an aggregate of 1.6 million and a nominal amount of shares of our
Series A Preferred Stock were converted into 21.3 million and 0.3 million shares
of our common stock, respectively. No Series A Preferred Stock was
converted during 2009. As a result of these conversions,
approximately 0.1 million shares of Series A Preferred Stock remain outstanding
as of December 31, 2008 and 2009.
Common
stock. At December 31,
2008 and 2009, we were authorized to issue 200 million shares of common
stock. Our U.S. Facility limits the payment of common stock dividends
under certain circumstances. Quarterly dividends may be paid in the
future when, as and if declared by our board of directors.
Treasury
stock. During 2007 our board of directors authorized the
repurchase of up to $100 million of our common stock in open market transactions
or in privately negotiated transactions, with any repurchased shares to be
retired and cancelled. During 2008 and 2009, we purchased 2.3 million
and 1.5 million shares of our common stock, respectively, in open market
transactions for aggregate purchase prices of $36.5 million and $14.7 million,
respectively, and all shares acquired under this repurchase program during 2008
and 2009 have been cancelled. At December 31, 2009, we could purchase
an additional $48.8 million of our common stock under our board of directors’
authorization.
Restricted stock
and common stock options. In 1996, we adopted our 1996
Long-Term Performance Incentive Plan (“1996 Plan”) which provides for the
discretionary grant of restricted common stock, stock options, stock
appreciation rights and other incentive compensation to our officers and other
key employees. No restricted stock options or other share-based
payments have been issued since 2000 under the 1996 Plan, and there are no
outstanding share-based instruments under the 1996 plan as of December 31,
2009.
In 2008,
we adopted our 2008 Long-Term Incentive Plan (“2008 Plan”) which provides for
the discretionary grant of restricted or unrestricted common stock, stock
options, stock appreciation rights and other incentive compensation to our
employees or other key individuals, including non-employee
directors. We are authorized to grant awards representing an
aggregate total of up to 0.5 million common shares under the 2008 Plan, and we
issued a nominal number of unrestricted common shares to our non-employee
directors during 2008 and 2009. Before the adoption of the 2008 Plan,
eligible non-employee directors were covered by an incentive plan that provided
for the issuance of share-based payments as an element of director compensation
(the “Director Plan”). The share-based payments under the Director
Plan included annual grants of our common stock to each non-employee director as
partial payment of director fees, and we issued a nominal number of shares to
our eligible non-employee directors during 2007.
As of
January 1, 2007, we had stock options outstanding to purchase 0.3 million shares
of our common stock, all of which were exercisable. A nominal number
of options were exercised in each of 2007, 2008 and 2009, and we had no options
outstanding as of December 31, 2009. The intrinsic value of our
options exercised aggregated $5.7 million in 2007, $1.0 million in 2008 and $0.3
million in 2009, and the related income tax benefit from such exercises was $2.1
million in 2007, $0.3 million in 2008 and $0.1 million in 2009. At
December 31, 2009, we had no shares available for future grant under each of the
1996 Plan and the Director Plan, and there were 0.5 million shares available for
future grant under the 2008 Plan. Shares issued under incentive plans
are newly issued shares.
Noncontrolling
interest. Noncontrolling interest relates principally to our
70%-owned French subsidiary, TIMET Savoie, S.A. Compagnie Européenne du
Zirconium-CEZUS, S.A. (“CEZUS”) holds the remaining 30% interest in TIMET
Savoie. We have the right to purchase CEZUS’ interest in TIMET Savoie
for 30% of TIMET Savoie’s equity determined under French accounting principles,
or $17.9 million as of December 31, 2009. CEZUS has the right to
require us to purchase its interest in TIMET Savoie for 30% of TIMET Savoie’s
registered capital, or $3.6 million as of December 31, 2009. TIMET
Savoie made dividend payments to CEZUS of $8.1 million in 2007, $6.8 million in
2008 and $5.5 million in 2009.
Note
10 – Other comprehensive income
The following table shows the changes
in the components of other comprehensive income attributable to TIMET
stockholders:
|
Year
ended December 31,
|
||||||||||||
|
2007
|
2008
|
2009
|
||||||||||
|
(In
millions)
|
||||||||||||
|
Currency
translation adjustment:
|
||||||||||||
|
Beginning of year
|
$ | 17.8 | $ | 27.3 | $ | (37.2 | ) | |||||
|
Change during year
|
9.5 | (64.5 | ) | 22.2 | ||||||||
|
End of year
|
$ | 27.3 | $ | (37.2 | ) | $ | (15.0 | ) | ||||
|
Unrealized
gains (losses) on marketable securities:
|
||||||||||||
|
Beginning of year
|
$ | 19.9 | $ | - | $ | (8.2 | ) | |||||
|
Change during year
|
(1.6 | ) | (8.2 | ) | 2.2 | |||||||
|
Reclassification adjustment for
realized gain included
in net income
|
(18.3 | ) | - | - | ||||||||
|
End of year
|
$ | - | $ | (8.2 | ) | $ | (6.0 | ) | ||||
|
Pension
plans:
|
||||||||||||
|
Beginning of year
|
$ | (53.4 | ) | $ | (41.4 | ) | $ | (95.5 | ) | |||
|
Amortization of prior service cost
and net losses included
in net periodic pension cost
|
2.9 | 2.0 | 6.9 | |||||||||
|
Net actuarial gain (loss) arising
during year
|
9.1 | (55.3 | ) | (30.7 | ) | |||||||
|
Net prior service cost arising
during year
|
- | (0.8 | ) | - | ||||||||
|
End of year
|
$ | (41.4 | ) | $ | (95.5 | ) | $ | (119.3 | ) | |||
|
OPEB
plan:
|
||||||||||||
|
Beginning of year
|
$ | (6.7 | ) | $ | (6.3 | ) | $ | (4.6 | ) | |||
|
Amortization of prior service cost
and net losses included
in net OPEB expense
|
0.3 | 0.1 | 0.2 | |||||||||
|
Net actuarial gain arising during
year
|
0.1 | 1.6 | 2.9 | |||||||||
|
Net prior service credit arising
during year
|
- | - | 3.8 | |||||||||
|
End of year
|
$ | (6.3 | ) | $ | (4.6 | ) | $ | 2.3 | ||||
|
Total
accumulated other comprehensive loss attributable to
TIMET stockholders:
|
||||||||||||
|
Beginning of year
|
$ | (22.4 | ) | $ | (20.4 | ) | $ | (145.5 | ) | |||
|
Comprehensive income (loss), net
of tax
|
2.0 | (125.1 | ) | 7.5 | ||||||||
|
End of year
|
$ | (20.4 | ) | $ | (145.5 | ) | $ | (138.0 | ) | |||
Note
11 – Other income and expense
|
Year
ended December 31,
|
||||||||||||
|
2007
|
2008
|
2009
|
||||||||||
|
(In
millions)
|
||||||||||||
|
Other
operating (expense) income:
|
||||||||||||
|
Loss on asset
impairment
|
$ | (6.0 | ) | $ | - | $ | - | |||||
|
Other, net
|
(0.4 | ) | (1.5 | ) | 2.0 | |||||||
|
Total other operating (expense)
income, net
|
$ | (6.4 | ) | $ | (1.5 | ) | $ | 2.0 | ||||
|
Other
non-operating income (expense):
|
||||||||||||
|
Dividends and
interest
|
$ | 7.0 | $ | 5.3 | $ | 2.1 | ||||||
|
Foreign exchange (loss) gain,
net
|
(1.2 | ) | 9.9 | 0.3 | ||||||||
|
Gain on sale of marketable and
other securities
|
18.3 | 6.7 | - | |||||||||
|
Other, net
|
0.1 | (2.5 | ) | - | ||||||||
|
Total other non-operating
income, net
|
$ | 24.2 | $ | 19.4 | $ | 2.4 | ||||||
During
2007, we capitalized the costs incurred for the initial planning and engineering
phase for the construction of a new vacuum distillation process titanium sponge
plant as part of construction in progress. During the fourth quarter
of 2007, we decided to delay the project indefinitely, and as a result we
determined that the asset was no longer realizable and recognized a $6.0 million
impairment loss related to previously capitalized costs.
On
October 26, 2007, after approval by the independent members of our board of
directors, CompX International, Inc. acquired all of our minority common stock
ownership position in CompX for $19.50 per share, a recent price at which CompX
had been repurchasing its stock in open market transactions, or an aggregate of
$52.6 million. As a result of the sale, we realized an $18.3 million
after-tax capital gain ($0.10 per diluted share) on the disposition of these
CompX shares in the fourth quarter of 2007. As consideration for the
shares, CompX issued a $52.6 million subordinated promissory note to us that
bears interest at LIBOR plus 1%, requires quarterly principal payments of $0.3
million beginning in September 2008 with the balance due in September
2014. The promissory note is subordinate to any outstanding balance
under CompX’s U.S. revolving bank credit facility, and CompX may make
prepayments of principal at any time. CompX made aggregate principal
payments to us of $7.3 million during 2008 and $0.5 million during
2009. In September 2009, we agreed to amend the terms of the note to
defer the required quarterly principal payments of $0.3 million until March 31,
2011. See Note 14.
On
December 31, 2008, we sold our investment in certain privately held securities
to Contran for $16.7 million after obtaining approval from the independent
members of our board of directors. The sales price will be paid to us
pursuant to the terms of a three-year promissory note maturing on December 31,
2011. The promissory note from Contran bears interest at prime minus
1.5% which will be accrued and paid quarterly, allows for early principal
payments at any time and requires any unpaid principal and accrued interest to
be paid at the maturity date of the promissory note. See Note
14. We accounted for our investment at our historical cost of $10.0
million, and we recognized an after-tax capital gain of $6.2 million ($0.03 per
diluted share) from the sale of this investment during the fourth quarter of
2008.
Note
12 – Income taxes
Summarized
in the following table are (i) the components of income before income taxes and
minority interest (“pre-tax income”), (ii) the difference between the provision
for income tax attributable to pre-tax income and the amounts that would be
expected using the U.S. Federal statutory income tax rate of 35%, (iii) the
components of the provision for income tax attributable to pre-tax income and
(iv) the components of the comprehensive tax provision:
|
Year
ended December 31,
|
||||||||||||
|
2007
|
2008
|
2009
|
||||||||||
|
(In
millions)
|
||||||||||||
|
Income
(loss) before income taxes:
|
||||||||||||
|
U.S.
|
$ | 300.0 | $ | 168.5 | $ | 64.9 | ||||||
|
Non-U.S.
|
93.6 | 68.8 | (8.4 | ) | ||||||||
|
Total
|
$ | 393.6 | $ | 237.3 | $ | 56.5 | ||||||
|
Expected
income tax expense, at 35%
|
$ | 137.8 | $ | 83.1 | $ | 19.8 | ||||||
|
Non-U.S.
tax rates
|
(2.1 | ) | (2.4 | ) | 1.2 | |||||||
|
U.S.
state income taxes, net
|
5.9 | 5.7 | 1.0 | |||||||||
|
Nontaxable
income
|
(12.6 | ) | (14.4 | ) | (5.4 | ) | ||||||
|
Adjustment
of deferred income tax valuation allowance
|
(6.5 | ) | (1.6 | ) | 0.6 | |||||||
|
Uncertain
tax positions, net
|
0.3 | 2.7 | 3.0 | |||||||||
|
Other,
net
|
(5.9 | ) | (4.0 | ) | 0.5 | |||||||
|
Provision for income
taxes
|
$ | 116.9 | $ | 69.1 | $ | 20.7 | ||||||
|
Provision
for income taxes:
|
||||||||||||
|
U.S. current income tax
expense
|
$ | 107.9 | $ | 58.7 | $ | 13.1 | ||||||
|
Non-U.S. current income tax
expense
|
23.7 | 14.4 | 4.4 | |||||||||
|
Total current income tax
expense
|
131.6 | 73.1 | 17.5 | |||||||||
|
U.S. deferred income tax expense
(benefit)
|
(8.9 | ) | (0.2 | ) | 9.9 | |||||||
|
Non-U.S. deferred income tax
expense (benefit)
|
(5.8 | ) | (3.8 | ) | (6.7 | ) | ||||||
|
Total deferred income tax expense
(benefit)
|
(14.7 | ) | (4.0 | ) | 3.2 | |||||||
|
Provision for income
taxes
|
$ | 116.9 | $ | 69.1 | $ | 20.7 | ||||||
|
Comprehensive
tax provision allocable to:
|
||||||||||||
|
Income before income
taxes
|
$ | 116.9 | $ | 69.1 | $ | 20.7 | ||||||
|
Additional paid in
capital
|
(2.1 | ) | (0.3 | ) | (0.1 | ) | ||||||
|
Other comprehensive
income:
|
||||||||||||
|
Currency translation
adjustment
|
(0.5 | ) | 1.5 | (1.7 | ) | |||||||
|
Pensions
adjustment
|
5.2 | (28.3 | ) | (7.6 | ) | |||||||
|
OPEB adjustment
|
0.2 | 1.0 | 4.0 | |||||||||
|
Marketable
securities
|
- | (4.4 | ) | 1.2 | ||||||||
| $ | 119.7 | $ | 38.6 | $ | 16.5 | |||||||
The following
table summarizes our deferred tax assets and deferred tax liabilities as of
December 31, 2008 and 2009:
|
December
31,
|
||||||||||||||||
|
2008
|
2009
|
|||||||||||||||
|
Assets
|
Liabilities
|
Assets
|
Liabilities
|
|||||||||||||
|
(In
millions)
|
||||||||||||||||
|
Temporary
differences relating to net assets:
|
||||||||||||||||
|
Inventories
|
$ | 17.0 | $ | - | $ | 17.3 | $ | - | ||||||||
|
Property and equipment,
including software
|
- | (41.3 | ) | - | (46.2 | ) | ||||||||||
|
Goodwill
|
3.4 | - | 2.1 | - | ||||||||||||
|
Accrued pension
cost
|
24.4 | - | 36.2 | - | ||||||||||||
|
Accrued OPEB
cost
|
11.6 | - | 7.8 | - | ||||||||||||
|
Accrued liabilities and other
deductible differences
|
21.8 | - | 15.2 | - | ||||||||||||
|
Other taxable
differences
|
- | (0.2 | ) | - | (2.7 | ) | ||||||||||
|
Tax loss and credit
carryforwards
|
3.0 | - | 11.0 | - | ||||||||||||
|
Valuation
allowance
|
(0.2 | ) | - | (0.6 | ) | - | ||||||||||
|
Gross
deferred tax assets (liabilities)
|
81.0 | (41.5 | ) | 89.0 | (48.9 | ) | ||||||||||
|
Netting
by tax jurisdiction
|
(41.5 | ) | 41.5 | (46.9 | ) | 46.9 | ||||||||||
|
Total
deferred taxes
|
39.5 | - | 42.1 | (2.0 | ) | |||||||||||
|
Less
current deferred taxes
|
21.7 | - | 25.3 | (0.4 | ) | |||||||||||
|
Net
noncurrent deferred taxes
|
$ | 17.8 | $ | - | $ | 16.8 | $ | (1.6 | ) | |||||||
During
the fourth quarter of 2007, we recognized a deferred income tax benefit related
to a $6.4 million decrease in our deferred income tax asset valuation allowance
attributable to the recognition of a capital gain on the sale of our minority
common stock ownership position in CompX. During the fourth quarter
of 2008, we recognized a $1.9 million decrease in our deferred income tax asset
valuation allowance attributable to the recognition of a capital gain on the
sale of certain privately held securities discussed in Note 11. In
2009 we recognized a $0.6 million increase in our deferred income tax asset
valuation allowance attributable to changes in U.K. tax law which impacts our
ability to recognize certain income tax attributes.
The
following table summarizes the components of the change in our deferred tax
asset valuation allowance in 2007, 2008 and 2009:
|
Year
ended December 31,
|
||||||||||||
|
2007
|
2008
|
2009 | ||||||||||
|
(In
millions)
|
||||||||||||
|
Effect
of:
|
||||||||||||
|
Income before income
taxes
|
$ | (6.5 | ) | $ | (1.6) | $ | 0.6 | |||||
|
Accumulated other comprehensive
(income) loss
|
6.8 | - | - | |||||||||
|
Currency translation adjustment
and other
|
- | 0.1 | (0.2 | ) | ||||||||
|
Change in deferred tax valuation
allowance
|
$ | 0.3 | $ | (1.5) | $ | 0.4 | ||||||
During
the second quarter of 2007, we implemented an internal corporate
reorganization. As a result, we recognized income tax benefits of
$12.6 million during 2007, $14.4 million during 2008 and $5.4 million during
2009. The internal corporate reorganization was undertaken to align
our European operations under a single European holding company.
Note
13 – Employee benefit plans
Variable
compensation plans. The majority of our
worldwide employees participate in compensation programs providing for variable
compensation and employer contributions under defined contribution pension plans
based primarily on our financial performance. The cost of these plans
was approximately $29.5 million in 2007, $22.8 million in 2008 and $8.8 million
in 2009.
Defined benefit
pension plans. We maintain
contributory defined benefit pension plans covering a majority of our U.K.
employees and a noncontributory defined benefit pension plan covering a minority
of our U.S. employees. Our funding policy is to annually contribute,
at a minimum, amounts satisfying the applicable statutory funding
requirements. The U.S. defined benefit pension plan is closed to new
participants, and in some cases, benefit levels have been frozen. The
U.K. defined benefit plan was closed to new participants in 1996; however,
employees participating in the plan when the plan closed in 1996 continue to
accrue additional benefits based on increases in compensation and
service. Information concerning our defined benefit pension plans is
set forth as follows:
|
Year
ended December 31,
|
||||||||
|
2008
|
2009
|
|||||||
|
(In
millions)
|
||||||||
|
Change
in projected benefit obligations:
|
||||||||
|
Balance at beginning of
year
|
$ | 314.0 | $ | 239.7 | ||||
|
Service cost
|
4.6 | 3.3 | ||||||
|
Participants’
contributions
|
1.5 | 0.9 | ||||||
|
Interest cost
|
16.7 | 14.8 | ||||||
|
Amendments
|
1.3 | - | ||||||
|
Actuarial (gain)
loss
|
(22.3 | ) | 54.0 | |||||
|
Benefits paid
|
(13.0 | ) | (20.4 | ) | ||||
|
Change in currency exchange
rates
|
(63.1 | ) | 22.6 | |||||
|
Balance at end of
year
|
$ | 239.7 | $ | 314.9 | ||||
|
Change
in plan assets:
|
||||||||
|
Fair value at beginning of
year
|
$ | 301.3 | $ | 162.2 | ||||
|
Actual return on plan
assets
|
(90.9 | ) | 27.6 | |||||
|
Employer
contributions
|
10.5 | 8.8 | ||||||
|
Participants’
contributions
|
1.5 | 0.9 | ||||||
|
Benefits paid
|
(13.0 | ) | (20.4 | ) | ||||
|
Change in currency exchange
rates
|
(47.2 | ) | 15.0 | |||||
|
Fair value at end of
year
|
$ | 162.2 | $ | 194.1 | ||||
|
Funded status
|
$ | (77.5 | ) | $ | (120.8 | ) | ||
|
Year
ended December 31,
|
||||||||
|
2008
|
2009
|
|||||||
|
(In
millions)
|
||||||||
|
Amounts
recognized in balance sheets-
|
||||||||
|
Noncurrent accrued pension
cost
|
$ | (77.5 | ) | $ | (120.8 | ) | ||
|
Funded status
|
(77.5 | ) | (120.8 | ) | ||||
|
Accumulated other comprehensive
loss:
|
||||||||
|
Actuarial loss
|
119.3 | 159.1 | ||||||
|
Prior service
cost
|
2.6 | 2.1 | ||||||
|
Total
|
$ | 44.4 | $ | 40.4 | ||||
|
Accumulated
benefit obligation
|
$ | 236.4 | $ | 308.4 | ||||
The
amounts shown in the table above for actuarial losses and prior service cost at
December 31, 2008 and 2009 have not yet been recognized as components of our
periodic defined benefit pension cost as of those dates. These
amounts will be recognized as components of our periodic defined benefit cost in
future years. However, these amounts, net of deferred income taxes,
are recognized in accumulated other comprehensive income (loss)
(“AOCI”). Of the amounts included in AOCI as of December 31, 2009
related to our pension plans, we currently expect to recognize net actuarial
losses of $11.6 million and prior service costs of $0.5 million as a component
of net periodic pension expense during 2010. The table below details
the changes in plan assets and benefit obligations recognized in accumulated
other comprehensive income:
|
Year
ended December 31,
|
||||||||||||
|
2007
|
2008
|
2009
|
||||||||||
|
(in
millions)
|
||||||||||||
|
Net actuarial gain (loss) arising
during the year
|
$ | 13.1 | $ | (83.1 | ) | $ | (41.2 | ) | ||||
|
Net prior service cost arising
during the year
|
- | (1.3 | ) | - | ||||||||
|
Amortization included in net
periodic pension cost:
|
||||||||||||
|
Prior service
cost
|
0.5 | 0.4 | 0.6 | |||||||||
|
Net actuarial
losses
|
3.5 | 2.4 | 9.8 | |||||||||
|
Total
|
$ | 17.1 | $ | (81.6 | ) | $ | (30.8 | ) | ||||
As of
December 31, 2008 and 2009, all of our defined benefit pension plans have
accumulated benefit obligations in excess of fair value of plan
assets.
The
components of the net periodic pension expense are set forth below:
|
Year
ended December 31,
|
||||||||||||
|
2007
|
2008
|
2009
|
||||||||||
|
(In
millions)
|
||||||||||||
|
Service
cost
|
$ | 5.5 | $ | 4.6 | $ | 3.3 | ||||||
|
Interest
cost
|
16.9 | 16.7 | 14.8 | |||||||||
|
Expected
return on plan assets
|
(21.8 | ) | (22.1 | ) | (12.9 | ) | ||||||
|
Amortization
of prior service cost
|
0.5 | 0.4 | 9.8 | |||||||||
|
Amortization
of net losses
|
3.5 | 2.4 | 0.6 | |||||||||
|
Net pension
expense
|
$ | 4.6 | $ | 2.0 | $ | 15.6 | ||||||
We used
the following weighted-average discount rate, long-term rate of return (“LTRR”),
salary rate increase and inflation assumptions to arrive at the aforementioned
benefit obligations and net periodic expense:
|
Significant
assumptions used to calculate projected and accumulated benefit
obligations at December 31,
|
|||||||||||
|
2008
|
2009
|
||||||||||
|
Inflation
rate
|
Discount
rate
|
Salary
increase
|
Inflation
rate
|
Discount
rate
|
Salary
increase
|
||||||
|
U.S.
plan
|
n/a
|
5.75%
|
n/a
|
n/a
|
5.80%
|
n/a
|
|||||
|
U.K.
plan
|
2.60%
|
6.20%
|
3.10%
|
3.60%
|
5.65%
|
4.10%
|
|||||
|
Significant
assumptions used to calculate net periodic pension expense for the year
ended December 31,
|
|||||||||
|
Year
|
Inflation
rate
|
Discount
rate
|
LTRR
|
Salary
Increase
|
|||||
|
U.S.
plan
|
2007
|
n/a
|
5.90%
|
10.00%
|
n/a
|
||||
|
U.K.
plan
|
2007
|
3.00%
|
5.10%
|
6.50%
|
3.50%
|
||||
|
U.S.
plan
|
2008
|
n/a
|
5.90%
|
10.00%
|
n/a
|
||||
|
U.K.
plan
|
2008
|
3.20%
|
5.60%
|
6.65%
|
3.70%
|
||||
|
U.S.
plan
|
2009
|
n/a
|
5.75%
|
10.00%
|
n/a
|
||||
|
U.K.
plan
|
2009
|
2.60%
|
6.20%
|
6.80%
|
3.10%
|
||||
We
currently expect to make $4.8 million in contributions to our U.S. defined
benefit pension plan and approximately $6.9 million to our U.K. defined benefit
pension plan during 2010. The U.S. plan paid benefits of
approximately $5.7 million in 2007 and $5.8 million in each of 2008 and 2009,
and the European plans paid benefits of approximately $6.7 million in 2007, $7.2
million in 2008 and $14.6 million in 2009. Benefit payments under our
European plans during 2009 include lump sum payments to certain participants
separated from employment during 2009 in lieu of annuitized payments over the
remaining benefit period.
Based
upon current projections, we believe that our pension plans will be required to
pay the following pension benefits over the next ten years:
|
Projected
retirement benefits
|
||||||||||||
|
U.S.
plan
|
U.K.
plan
|
Total
|
||||||||||
|
(In
millions)
|
||||||||||||
|
Year
ending December 31,
|
||||||||||||
|
2010
|
$ | 6.1 | $ | 6.6 | $ | 12.7 | ||||||
|
2011
|
6.1 | 6.6 | 12.7 | |||||||||
|
2012
|
6.2 | 6.9 | 13.1 | |||||||||
|
2013
|
6.1 | 7.3 | 13.4 | |||||||||
|
2014
|
6.2 | 8.3 | 14.5 | |||||||||
|
2015 through 2019
|
31.3 | 53.8 | 85.1 | |||||||||
As noted
above we are adopting the fair value measurement and disclosure provisions of
ASC Topic 715 beginning with our December 31, 2009 plan asset
values. The ASC required us to adopt these provisions on a
prospective basis for the December 31, 2009 plan assets only.
At
December 31, 2008 and 2009, our U.S. plan’s assets are invested in the CMRT;
however, our plan assets are invested only in the portion of the CMRT that does
not hold our common stock. The CMRT's long-term investment objective
is to provide a rate of return exceeding a composite of broad market equity and
fixed income indices (including the S&P 500 and certain Russell indices)
while utilizing both third-party investment managers as well as investments
directed by Mr. Simmons. Mr. Simmons is the sole trustee of the
CMRT. The trustee of the CMRT, along with the CMRT’s investment
committee, of which Mr. Simmons is a member, actively manages the investments of
the CMRT. The CMRT trustee and investment committee seek to maximize
returns in order to meet the CMRT’s long-term investment
objective. The CMRT trustee and investment committee do not maintain
a specific target asset allocation in order to achieve their objectives, but
instead they periodically change the asset mix of the CMRT based upon, among
other things, advice they receive from third-party advisors and their
expectations regarding potential returns for various investment alternatives and
what asset mix will generate the greatest overall return. During the
history of the CMRT from its inception in 1988 through December 31, 2009, the
average annual rate of return of the CMRT (excluding the CMRT’s investment in
TIMET and Valhi common stock) has been 11%. For the years ended
December 31, 2007, 2008 and 2009, the assumed long-term rate of return for plan
assets invested in the CMRT was 10%. In determining the
appropriateness of the long-term rate of return assumption, we primarily rely on
the historical rates of return achieved by the CMRT, although we consider other
factors as well including, among other things, the investment objectives of the
CMRT's managers and their expectation that such historical returns will in the
future continue to be achieved over the long-term.
At
December 31, 2009, the portion of the CMRT in which our U.S. plan is invested is
represented by investments which are valued using Level 1, Level 2 and Level 3
inputs, as defined by ASC 820-10-35, with approximately 82% valued using Level 1
inputs, 4% using Level 2 inputs and 14% using Level 3 inputs. The
CMRT is not traded on any market. The CMRT unit value is determined
semi-monthly, and we have the ability to redeem all or any portion of our
investment in the CMRT at any time based on the most recent semi-monthly
valuation. However, we do not have the right to individual assets
held by the CMRT and the CMRT has the sole discretion in determining how to meet
any redemption request. For purposes of our plan asset disclosure, we
consider the investment in the CMRT as a Level 2 input because (i) the CMRT
value is established semi-monthly and we have the right to redeem our investment
in the CMRT, in part or in whole, at anytime based on the most recent value and
(ii) approximately 86% of the assets in our portion of the CMRT are valued using
either Level 1 or Level 2 inputs, as noted above, which have observable
inputs. The total fair value of the portion of the CMRT in which our
U.S. plan assets are invested, including funds of Contran and its other
affiliates that also invest in the CMRT, was $366.3 million at December 31, 2008
and $372.7 million at December 31, 2009. At December 31, 2009
approximately 45% of this portion of the CMRT assets were invested in domestic
equity securities with the majority of these being publically traded securities;
approximately 8% were invested in publically traded international equity
securities; approximately 33% were invested in publically traded fixed income
securities; approximately 12% were invested in various privately managed limited
partnerships and the remainder was invested in real estate and cash and cash
equivalents.
Our U.K.
plan’s assets are managed by third party investment managers. These
investment managers periodically change the asset mix based upon, among other
things, advice from third-party advisors and the investment sub-committee and
their respective expectations as to what asset mix will generate the greatest
overall risk-adjusted return. At December 31, 2008, the asset mix for
the U.K. plan's assets (based on an aggregate asset value of $114.9 million) was
29% debt securities, 45% local currency equity securities, 25% foreign currency
equity securities (including U.S. dollar) and 1% cash and other
securities. In determining the expected long-term rate of return on
plan asset assumptions for our U.K. plan assets, we consider the long-term asset
mix and the expected long-term rates of return for the asset
components. In addition, we receive advice about appropriate
long-term rates of return from our third-party actuaries. We
currently have a target asset allocation of 80% to equity securities and 20% to
fixed income securities for our U.K. plan, and we expect the long-term rate of
return for plan assets to average approximately 300 basis points above the
annualized yield on 20 year U.K. government bonds. The U.K. plan
assets are valued using Level 1 inputs because they are traded in active
markets.
We
regularly review our actual asset allocation for each of our plans, and
periodically rebalance the investments in each plan to more accurately reflect
the targeted allocation when we consider it appropriate. At December
31, 2009, the fair values of our plan assets were determined using the following
inputs:
|
Total
|
Level
1 inputs
|
Level
2 inputs
|
Level
3 inputs
|
|||||||||||||
|
(in
millions)
|
||||||||||||||||
|
U.S.
plan
|
||||||||||||||||
|
CMRT
|
$ | 48.1 | $ | - | $ | 48.1 | $ | - | ||||||||
|
European
plans
|
||||||||||||||||
|
U.K. equity
securities
|
86.8 | 86.8 | - | - | ||||||||||||
|
Non-U.K. equity
securities
|
28.0 | 28.0 | - | - | ||||||||||||
|
U.K. fixed income
securities
|
29.4 | 29.4 | - | - | ||||||||||||
|
Cash, cash equivalents and
other
|
1.8 | 1.8 | - | - | ||||||||||||
|
Total
|
$ | 194.1 | $ | 146.0 | $ | 48.1 | $ | - | ||||||||
Postretirement
benefits other than pensions. We provide certain health care
and life insurance benefits on a cost-sharing basis to certain of our U.S.
retirees and certain of our active U.S. employees upon retirement, for whom
health care coverage generally terminates once the retiree (or eligible
dependent) becomes Medicare-eligible or reaches age 65, effectively limiting
coverage for these participants to less than ten years based on our minimum
retirement age. We also provide certain postretirement health care
and life insurance benefits on a cost sharing basis to closed groups of certain
of our U.S. retirees, for whom health care coverage generally reduces once the
retiree (or eligible dependent) becomes Medicare-eligible, but whose coverage
continues until death. We fund such benefits as they are incurred,
net of any contributions by the retirees.
The plan under which these benefits are provided is unfunded, and contributions
to the plan during the year equal benefits paid. The components of
accumulated OPEB obligations and periodic OPEB cost, based on a December 31
measurement date, are set forth as follows:
|
December
31,
|
||||||||||
|
2008
|
|
2009
|
|
|||||||
|
(In
millions)
|
||||||||||
|
Actuarial
present value of accumulated OPEB obligations:
|
||||||||||
|
Balance at beginning of
year
|
$ | 31.4 | $ | 30.4 | ||||||
|
Service cost
|
1.1 | 1.3 | ||||||||
|
Interest cost
|
1.6 | 1.5 | ||||||||
|
Amendments
|
- | (6.0 | ) | |||||||
|
Actuarial gain
|
(2.5 | ) | (4.6 | ) | ||||||
|
Participant
contributions
|
0.9 | 0.7 | ||||||||
|
Benefits paid
|
(2.1 | ) | (2.0 | ) | ||||||
|
Balance at end of
year
|
$ | 30.4 | $ | 21.3 | ||||||
|
Fair
value of plan assets
|
$ | - | $ | - | ||||||
|
Funded status
|
$ | (30.4 | ) | $ | (21.3 | ) | ||||
|
Amounts
recognized in balance sheets:
|
||||||||||
|
Current accrued OPEB
cost
|
$ | (1.9 | ) | $ | (1.4 | ) | ||||
|
Noncurrent accrued OPEB
cost
|
(28.5 | ) | (19.9 | ) | ||||||
|
Funded status
|
(30.4 | ) | (21.3 | ) | ||||||
|
Accumulated other comprehensive
loss:
|
||||||||||
|
Net actuarial
loss
|
8.1 | 3.2 | ||||||||
|
Prior service
credit
|
(0.7 | ) | (6.6 | ) | ||||||
|
Total
|
$ | (23.0 | ) | $ | (24.7 | ) | ||||
The
amounts shown in the table above for actuarial losses and prior service credit
at December 31, 2008 and 2009 have not yet been recognized as components of our
periodic OPEB cost as of those dates. These amounts will be
recognized as components of our periodic OPEB cost in future
years. However, these amounts, net of deferred income taxes, are
recognized in AOCI. Of the amounts included in AOCI as of December
31, 2009 related to our OPEB plan, we currently expect to recognize net
actuarial gains of $0.3 million and prior service credits of $0.9 million as a
component of net periodic OPEB expense during 2010.
The table
below details the changes in benefit obligations recognized in accumulated other
comprehensive income:
|
Year
ended December 31,
|
||||||||||||
|
2007
|
2008
|
2009
|
||||||||||
|
(In
millions)
|
||||||||||||
|
Net
actuarial gain arising during the year
|
$ | 0.1 | $ | 2.5 | $ | 4.6 | ||||||
|
Net
prior service credit arising during the year
|
- | - | 6.0 | |||||||||
|
Amortization
included in net OPEB expense:
|
||||||||||||
|
Prior service
credit
|
(0.4 | ) | (0.3 | ) | (0.1 | ) | ||||||
|
Net actuarial
losses
|
0.9 | 0.5 | 0.4 | |||||||||
|
Total
|
$ | 0.6 | $ | 2.7 | $ | 10.9 | ||||||
The
components of the net periodic OPEB expense are set forth below:
|
Year
ended December 31,
|
||||||||||||
|
2007
|
2008
|
2009
|
||||||||||
|
(In
millions)
|
||||||||||||
|
Service
cost
|
$ | 0.9 | $ | 1.1 | $ | 1.3 | ||||||
|
Interest
cost
|
1.7 | 1.6 | 1.5 | |||||||||
|
Amortization
of prior service credit
|
(0.4 | ) | (0.3 | ) | (0.1 | ) | ||||||
|
Amortization
of net losses
|
0.9 | 0.5 | 0.4 | |||||||||
|
Net OPEB expense
|
$ | 3.1 | $ | 2.9 | $ | 3.1 | ||||||
We used
the following weighted-average discount rate and health care cost trend rate
(“HCCTR”) assumptions to arrive at the aforementioned benefit obligations and
net periodic expense:
|
Significant
assumptions used to calculate accumulated OPEB obligation at December
31,
|
|||
|
2008
|
2009
|
||
|
Discount
rate
|
5.75%
|
5.65%
|
|
|
Beginning
HCCTR
|
5.46%
|
8.50%
|
|
|
Ultimate
HCCTR
|
4.00%
|
4.50%
|
|
|
Ultimate
year
|
2013
|
2017
|
|
|
Significant
assumptions used to calculate net periodic
OPEB
expense for the year ended December 31,
|
|||||
|
2007
|
2008
|
2009
|
|||
|
Discount
rate
|
5.90%
|
5.90%
|
5.75%
|
||
|
Beginning
HCCTR
|
7.17%
|
5.83%
|
5.46%
|
||
|
Ultimate
HCCTR
|
4.00%
|
4.00%
|
4.00%
|
||
|
Ultimate
year
|
2010
|
2010
|
2013
|
||
In the
fourth quarter of 2009, we amended our benefit formula for most participants of
the plan effective as of January 1, 2010, resulting in a prior service credit of
approximately $6.0 million as of December 31, 2009. Key assumptions
including the discount rate and HCCTR as of December 31, 2009 now reflect these
plan revisions to the benefit formula. If the HCCTR were increased by
one percentage point for each year, the aggregate of the service and interest
cost components of OPEB expense would have increased approximately $0.3 million
in 2009, and the actuarial present value of accumulated OPEB obligations at
December 31, 2009 would have increased approximately $1.6
million. If the HCCTR were decreased by one percentage point for each
year, the aggregate of the service and interest cost components of OPEB expense
would have decreased approximately $0.3 million in 2009, and the actuarial
present value of accumulated OPEB obligations at December 31, 2009 would
have decreased approximately $1.4 million.
Based
upon current projections, we believe that we will be required to pay the
following OPEB benefits over the next ten years:
|
Projected
OPEB
benefits
|
||||
|
(In
millions)
|
||||
|
Year
ending December 31,
|
||||
|
2010
|
$ | 1.4 | ||
|
2011
|
1.5 | |||
|
2012
|
1.6 | |||
|
2013
|
1.7 | |||
|
2014
|
1.8 | |||
|
2015 through 2019
|
11.0 | |||
Note
14 - Related party transactions
Corporations
that may be deemed to be controlled by or affiliated with Mr. Simmons sometimes
engage in (i) intercorporate transactions such as guarantees, management and
expense sharing arrangements, shared fee arrangements, joint ventures,
partnerships, loans, options, advances of funds on open account, and sales,
leases and exchanges of assets, including securities issued by both related and
unrelated parties, and (ii) common investment and acquisition strategies,
business combinations, reorganizations, recapitalizations, securities
repurchases, and purchases and sales (and other acquisitions and dispositions)
of subsidiaries, divisions or other business units, which transactions have
involved both related and unrelated parties and have included transactions which
resulted in the acquisition by one related party of a publicly-held minority
equity interest in another related party. We continuously consider,
review and evaluate such transactions, and understand that Contran and related
entities consider, review and evaluate such transactions. Depending
upon the business, tax and other objectives then relevant, it is possible that
we might be a party to one or more such transactions in the future.
Under the
terms of various intercorporate services agreements (“ISAs”) that we have
historically entered into with various related parties, including Contran,
employees of one company provide certain management, tax planning, legal,
financial, risk management, environmental, administrative, facility or other
services to the other company on a fee basis. Such charges are based
upon estimates of the time devoted by the employees of the provider of the
services to the affairs of the recipient and the compensation of such persons,
or the cost of facilities, equipment or supplies provided. Our
independent directors review and approve the fees we pay under the
ISAs. We paid Contran ISA fees of $7.4 million in 2007, $8.2 million
in 2008 and $8.6 million in 2009. This agreement is renewed annually,
and we expect to pay a net amount of $8.9 million under the ISA during
2010.
Tall
Pines Insurance Company (including a predecessor company, Valmont Insurance
Company) and EWI RE, Inc. provide for or broker insurance policies for Contran
and certain of its subsidiaries and affiliates, including us. Tall
Pines and EWI are subsidiaries of Contran. Consistent with insurance
industry practices, Tall Pines and EWI receive commissions from the insurance
and reinsurance underwriters and/or assess fees for the policies that they
provide or broker. Our aggregate premiums, including commissions, for
such policies were approximately $7.9 million in 2007, $7.8 million in 2008 and
$7.1 million in 2009. Tall Pines purchases reinsurance for
substantially all of the risks it underwrites. We expect that these
relationships with Tall Pines and EWI will continue in 2010.
Contran
and certain of its subsidiaries and affiliates, including us, purchase certain
of their insurance policies as a group, with the costs of the jointly-owned
policies being apportioned among the participating companies. With
respect to certain of such policies, it is possible that unusually large losses
incurred by one or more insureds during a given policy period could leave the
other participating companies without adequate coverage under that policy for
the balance of the policy period. As a result, Contran and certain of
its subsidiaries and affiliates, including us, have entered into a loss sharing
agreement under which any uninsured loss is shared by those entities that have
submitted claims under the relevant policy. We believe the benefits
in the form of reduced premiums and broader coverage associated with the group
coverage for such policies justify the risk associated with the potential for
any uninsured loss.
A
subsidiary of Contran owns 32% of BMI. Among other things, BMI
provides utility services (primarily water distribution, maintenance of a common
electrical facility and sewage disposal monitoring) to us and other
manufacturers within an industrial complex located in Henderson,
Nevada. Power transmission and sewer services are provided on a cost
reimbursement basis, similar to a cooperative, while water delivery is currently
provided at the same rates as are charged by BMI to an unrelated third
party. Amounts paid by us to BMI for these utility services were $2.2
million during 2007, $2.3 million during 2008 and $2.2 million during
2009. We also paid BMI an electrical facilities upgrade fee of $0.8
million in each of 2007, 2008 and 2009, and this fee terminates completely after
January 2010.
From time to time, companies related to
Contran will have loans and advances outstanding between them and various
related parties pursuant to term and demand notes. These loans and
advances are generally entered into for specific transactions or cash management
purposes. Under these loans, the lender is generally able to earn a
higher rate of return on the loan than would have been earned if the lender
invested the funds in other investments, and the borrower is able to pay a lower
rate of interest than would be paid if the borrower had incurred third-party
indebtedness. While certain of these loans may be of a lesser credit
quality than cash equivalent instruments otherwise available to the lender, the
lender will evaluate the credit risks involved and appropriately reflect those
credit risks in the terms of the applicable loan. In this regard,
during 2009 we entered into an unsecured revolving credit facility with Contran
pursuant to which, as amended, we may loan up to $60 million to
Contran. Our loans to Contran bear interest at the prime rate minus
1.5% for the first $15 million borrowed, and the prime rate for any amounts
borrowed in excess of $15 million, with all outstanding principal due on demand
(and in any event no later than December 31, 2010). The amount of our
outstanding loans we have to Contran at any time is solely at our
discretion. At December 31, 2009, Contran has an aggregate
outstanding principal balance of $33.8 million pursuant to this
facility.
We have previously purchased and sold investments in the common
stock of certain related parties. See Notes 4 and 11.
Our notes receivable from affiliates, including those resulting from the sale of
certain investments more fully discussed in Note 11 and the unsecured revolving
credit facility discussed above, are summarized in the table
below. Interest income on such notes was $2.7 million in 2008 and
$1.2 million in 2009.
|
December
31,
|
||||||||
|
2008
|
2009
|
|||||||
|
(In
millions)
|
||||||||
|
Notes
receivable from affiliates:
|
||||||||
|
CompX
|
$ | 42.7 | $ | 42.5 | ||||
|
Contran promissory note from
sale of certain securities
|
16.7 | 16.7 | ||||||
|
Contran unsecured revolving
demand promissory note
|
- | 33.8 | ||||||
|
Total notes receivable from
affiliates
|
$ | 59.4 | $ | 93.0 | ||||
|
Less
current portion of notes receivable
|
1.0 | 33.8 | ||||||
|
Noncurrent notes receivable from
affiliates
|
$ | 58.4 | $ | 59.2 | ||||
During
2007, we engaged Kronos to provide consulting services for the planning and
engineering for the construction of a new vacuum distillation process titanium
sponge plant. We incurred $0.3 million of expenses in 2007 for such
consulting services.
Based on
the previous agreements and relationships, receivables from and payables to
various related parties in the normal course of business were nominal as of
December 31, 2008 and 2009.
Note
15 – Commitments and contingencies
Long-term
agreements. We have LTAs with certain major customers,
including, among others, Boeing, Rolls-Royce plc and its German and U.S.
affiliates, United Technologies Corporation (“UTC”, Pratt & Whitney and
related companies), the Safran companies (“Safran,” Snecma and related
companies), Wyman-Gordon (a unit of Precision Castparts Corporation (“PCC”)) and
VALTIMET. These agreements have varying expiration dates through
2017, are subject to certain conditions, and generally provide for (i) minimum
market shares of the customers’ titanium requirements or firm annual volume
commitments, (ii)
formula-determined prices (including some elements based on market
pricing) and (iii) price adjustments for certain raw material and energy cost
fluctuations. Generally, the LTAs require our service and product
performance to meet specified criteria and contain a number of other terms and
conditions customary in transactions of these types. In certain
events of nonperformance by us or the customer, the LTAs may be terminated
early. Although it is possible that some portion of the business
would continue on a non-LTA basis, the termination or expiration without renewal
of one or more of the LTAs could result in a material effect on our business,
results of operations, financial position or liquidity. The LTAs were
designed to limit selling price volatility to the customer and to us, while
providing us with a committed base of volume throughout the titanium industry
business cycles.
Concentration of
credit and other risks. Substantially all of
our sales and operating income are derived from operations based in the U.S.,
the U.K., France and Italy. As shown in the table below, we generate
over half of our sales revenue from sales to the commercial aerospace
sector. As described previously, we have LTAs with certain major
aerospace customers, including Boeing, Rolls-Royce, UTC, Safran and
Wyman-Gordon. This concentration of customers may impact our overall
exposure to credit and other risks, either positively or negatively, in that all
of these customers may be similarly affected by the same economic or other
conditions.
The
following table provides supplemental customer receivable and sales revenue
information:
|
Year
ended December 31,
|
|||||
|
2007
|
2008
|
2009
|
|||
|
Significant
customer receivable balances as a percentage
of total trade receivables:
|
|||||
|
PCC and PCC-related entities
(1)
(2)
|
-
|
12%
|
15%
|
||
|
VALTIMET (1)
|
12%
|
-
|
-
|
||
|
Significant
sales revenue as a percentage of total
sales revenue:
|
|||||
|
Ten largest
customers
|
49%
|
49%
|
57%
|
||
|
Significant
customers:
|
|||||
|
Boeing
|
10%
|
12%
|
17%
|
||
|
PCC and PCC-related entities
(2)
|
11%
|
10%
|
15%
|
||
|
Commercial aerospace
sector
|
55%
|
59%
|
60%
|
||
|
Total LTAs
|
47%
|
56%
|
64%
|
||
|
Significant
LTAs:
|
|||||
|
Boeing
|
10%
|
12%
|
17%
|
||
|
Rolls-Royce (2)
|
12%
|
13%
|
13%
|
||
|
(1)
Amounts excluded for periods when the concentration is not at least
10%.
(2)
PCC and PCC-related entities serve as a supplier to certain commercial
aerospace manufacturers, including Rolls-Royce. Certain sales
we make directly to PCC and PCC-related
entities also count towards, and are reflected in the table above as, sales to Rolls-Royce under the Rolls-Royce LTA. |
|||||
Operating
leases. We
lease certain manufacturing and office facilities and various equipment under
non-cancelable operating leases with remaining terms ranging from one to twelve
years. Most of the leases contain purchase options at fair market
value and/or various term renewal options at fair market rental
rates. At December 31, 2009, future minimum payments under
non-cancelable operating leases having an initial term in excess of one year
were as follows:
|
Amount
|
||||
|
(In
millions)
|
||||
|
Year
ending December 31,
|
||||
|
2010
|
$ | 6.6 | ||
|
2011
|
5.9 | |||
|
2012
|
5.0 | |||
|
2013
|
4.3 | |||
|
2014
|
3.9 | |||
|
2015 and
thereafter
|
25.0 | |||
| $ | 50.7 | |||
Net rent
expense under all leases, including those with original terms of less than one
year, was $6.8 million in 2007, $8.1 million in 2008 and $8.1 million in
2009. We are also obligated under certain operating leases for our
pro rata share of the lessor’s operating expenses.
Purchase
agreements. We have LTAs with
titanium sponge and other suppliers that include minimum commitments to purchase
titanium sponge through 2025 and services through 2019. Certain of
our purchase agreements include take-or-pay provisions which require us to pay
penalties if we do not meet the contractual volume commitments, but we have
assumed the minimum level of required volumes and minimum or estimated prices
for the purchase commitments in the table below. We also have
agreements with a certain energy provider to purchase minimum annual levels of
electricity through 2028. Under these purchase agreements, we are
generally committed to the following minimum levels of purchases:
|
Titanium
sponge
|
Services
|
Energy
|
Total
|
|||||||||||||
|
(In
millions)
|
||||||||||||||||
|
Year
ended December 31,
|
||||||||||||||||
|
2010
|
$ | 82.7 | $ | 13.6 | $ | 2.0 | $ | 98.3 | ||||||||
|
2011
|
91.4 | 13.0 | 2.0 | 106.4 | ||||||||||||
|
2012
|
68.2 | 11.0 | 2.0 | 81.2 | ||||||||||||
|
2013
|
73.3 | 11.0 | 2.0 | 86.3 | ||||||||||||
|
2014
|
63.4 | 6.7 | 2.0 | 72.1 | ||||||||||||
|
2015
and thereafter
|
449.6 | 33.1 | 12.5 | 495.2 | ||||||||||||
| $ | 828.6 | $ | 88.4 | $ | 22.5 | $ | 939.5 | |||||||||
Environmental
matters. As a result of Environmental Protection Agency
(“EPA”) inspections, in April 2009 the EPA issued a Notice of Violation
(“Notice”) to us alleging that we violated certain provisions of the Resource
Conservation and Recovery Act and the Toxic Substances Control Act at our
Henderson plant. We responded to the EPA and are currently in ongoing
discussions with them concerning the nature and extent of required follow-up
testing and potential remediation that may be required to address the
allegations of non-compliance. We anticipate submitting detailed
proposals for testing during the first quarter of 2010 that will provide the
basis for negotiating the scope and method of any remediation required by the
Notice.
As part of our continuing environmental
assessment with respect to our plant site in Henderson, Nevada, during 2008 we
completed and submitted to the Nevada Department of Environmental Protection
(“NDEP”) a Remedial Alternative Study (“RAS”) with respect to the groundwater
located beneath the plant site. The RAS, which was submitted pursuant
to an existing agreement between the NDEP and us, addressed the presence of
certain contaminants in the plant site groundwater that require
remediation. The NDEP completed its review of the RAS and our
proposed remedial alternatives during 2008, and the NDEP issued its record of
decision in February 2009, which selected our preferred groundwater remedial
alternative action plan. We commenced the work to implement the plan
in the fourth quarter of 2009.
We had $3.9 million accrued at December
31, 2008 and $3.3 million accrued at December 31, 2009 for
remediation activities anticipated at our Henderson plant site, including
amounts accrued at the lower end of the range of estimated costs for the
groundwater remedial action plan selected by the NDEP in its record of
decision. We will continue evaluating alternative methods and timing
for all of our remediation activities, and if necessary, we may revise our
estimated costs in the future. We estimate the upper end of the range
of reasonably possible costs related to all of our environmental matters,
including the current accrual, to be approximately $5.7 million at December 31,
2009. We expect these estimated costs to be incurred over a
remediation period of at least five years.
Legal
proceedings. We record liabilities related to legal
proceedings when estimated costs are probable and reasonably
estimable. Such accruals are adjusted as further information becomes
available or circumstances change. Estimated future costs are not
discounted to their present value. It is not possible to estimate the
range of costs for certain matters. No assurance can be given that
actual costs will not exceed accrued amounts or that costs will not be incurred
with respect to matters as to which no problem is currently known or where no
estimate can presently be made. Further, additional legal proceedings
may arise in the future.
From time
to time, we are involved in various employment, environmental, contractual,
intellectual property, product liability, general liability and other claims,
disputes and litigation relating to our business. In certain
instances, we have insurance coverage for these items to eliminate or reduce our
risk of loss (other than standard deductibles, which are generally $1 million or
less). We currently believe that the outcome of these matters,
individually or in the aggregate, will not have a material adverse effect on our
financial position, results of operations or liquidity. However, all
such matters are subject to inherent uncertainties, and were an unfavorable
outcome to occur with respect to several of these matters in a given period, it
is possible that it could have a material adverse impact on our results of
operations or cash flows in that particular period.
Note
16 – Earnings per share
Basic
earnings per share is based on the weighted average number of unrestricted
common shares outstanding during each period. Diluted earnings per
share attributable to common stockholders reflects the dilutive effect of common
stock options, restricted stock and the assumed conversion of our Series A
Preferred Stock. A reconciliation of the numerator and denominator
used in the calculation of basic and diluted earnings per share is presented in
the following table:
|
Year
ended December 31,
|
||||||||||||
|
2007
|
2008
|
2009
|
||||||||||
|
(In
millions)
|
||||||||||||
|
Numerator:
|
||||||||||||
|
Net income attributable to TIMET
common stockholders
|
$ | 263.1 | $ | 162.2 | $ | 34.3 | ||||||
|
Dividends on Series A Preferred
Stock (1)
|
5.1 | 0.3 | - | |||||||||
|
Diluted net income attributable
to TIMET common
stockholders
|
$ | 268.2 | $ | 162.5 | $ | 34.3 | ||||||
|
Denominator:
|
||||||||||||
|
Average common shares
outstanding
|
162.8 | 181.4 | 180.7 | |||||||||
|
Series A Preferred Stock (1)
|
21.4 | 1.0 | - | |||||||||
|
Average dilutive stock options
and restricted
stock
|
0.1 | 0.1 | - | |||||||||
|
Diluted shares
|
184.3 | 182.5 | 180.7 | |||||||||
|
(1)
Excludes the anti-dilutive effects from conversion of the outstanding
Series A Preferred Stock in 2009.
|
||||||||||||
Note
17 – Business segment information
Our
production facilities are located in the United States, United Kingdom, France
and Italy, and our products are sold throughout the world. Our
President and Chief Executive Officer functions as our chief operating decision
maker (“CODM”), and the CODM receives consolidated financial information about
us. He makes decisions concerning resource utilization and
performance analysis on a consolidated and global basis. We have one
reportable segment, our worldwide “Titanium melted and mill products”
segment. The following table provides supplemental information to our
Consolidated Financial Statements:
|
Year
ended December 31,
|
||||||||||||
|
2007
|
2008
|
2009
|
||||||||||
|
(In
millions, except product shipment data)
|
||||||||||||
|
Titanium
melted and mill products:
|
||||||||||||
|
Melted product net
sales
|
$ | 191.9 | $ | 115.5 | $ | 69.0 | ||||||
|
Mill product net
sales
|
952.0 | 913.5 | 635.2 | |||||||||
|
Other titanium product
sales
|
135.0 | 122.5 | 69.8 | |||||||||
|
Total net sales
|
$ | 1,278.9 | $ | 1,151.5 | $ | 774.0 | ||||||
|
Melted
product shipments:
|
||||||||||||
|
Volume (metric
tons)
|
4,720 | 3,850 | 2,750 | |||||||||
|
Average selling price (per
kilogram)
|
$ | 40.65 | $ | 30.00 | $ | 25.10 | ||||||
|
Mill
product shipments:
|
||||||||||||
|
Volume (metric
tons)
|
14,230 | 15,050 | 11,425 | |||||||||
|
Average selling price (per
kilogram)
|
$ | 66.90 | $ | 60.70 | $ | 55.60 | ||||||
|
Geographic
segments:
|
||||||||||||
|
Net sales – point of
origin:
|
||||||||||||
|
United States
|
$ | 828.8 | $ | 724.2 | $ | 516.1 | ||||||
|
United Kingdom
|
263.9 | 247.7 | 148.4 | |||||||||
|
France
|
128.9 | 118.1 | 78.6 | |||||||||
|
Italy
|
56.9 | 61.4 | 30.8 | |||||||||
|
Germany
|
0.4 | 0.1 | 0.1 | |||||||||
| $ | 1,278.9 | $ | 1,151.5 | $ | 774.0 | |||||||
|
Net sales – point of
destination:
|
||||||||||||
|
United States
|
$ | 784.9 | $ | 681.1 | $ | 505.9 | ||||||
|
United Kingdom
|
173.6 | 152.9 | 112.1 | |||||||||
|
France
|
118.9 | 111.5 | 59.2 | |||||||||
|
Other locations
|
201.5 | 206.0 | 96.8 | |||||||||
| $ | 1,278.9 | $ | 1,151.5 | $ | 774.0 | |||||||
|
Long-lived assets – property and
equipment,
net:
|
||||||||||||
|
United States
|
$ | 291.2 | $ | 348.4 | $ | 329.9 | ||||||
|
United Kingdom
|
81.6 | 68.1 | 75.6 | |||||||||
|
Other Europe
|
9.2 | 10.6 | 10.6 | |||||||||
| $ | 382.0 | $ | 427.1 | $ | 416.1 | |||||||
Note
18 – Quarterly results of operations (unaudited)
|
For
the quarter ended
|
||||||||||||||||
|
March
31
|
June
30
|
Sept.
30
|
Dec.
31
|
|||||||||||||
|
(In
millions, except per share data)
|
||||||||||||||||
|
Year ended December 31,
2008: (1)
|
||||||||||||||||
|
Net sales
|
$ | 293.7 | $ | 297.3 | $ | 295.4 | $ | 265.2 | ||||||||
|
Gross margin
|
81.1 | 84.3 | 72.9 | 49.5 | ||||||||||||
|
Operating income
|
62.8 | 68.8 | 52.9 | 35.2 | ||||||||||||
|
Net income
|
42.8 | 48.6 | 41.6 | 35.2 | ||||||||||||
|
Net income attributable to TIMET
common
stockholders (2)
|
40.3 | 47.3 | 40.2 | 34.4 | ||||||||||||
|
Earnings per share attributable
to TIMET common stockholders (2)
|
$ | 0.22 | $ | 0.26 | $ | 0.22 | $ | 0.19 | ||||||||
|
Dividends declared per
common share
|
$ | 0.075 | $ | 0.075 | $ | 0.075 | $ | 0.075 | ||||||||
|
Year ended December 31,
2009:
(1)
|
||||||||||||||||
|
Net sales
|
$ | 203.4 | $ | 205.7 | $ | 181.4 | $ | 183.5 | ||||||||
|
Gross margin
|
39.4 | 31.6 | 17.7 | 24.5 | ||||||||||||
|
Operating income
|
26.4 | 15.6 | 3.5 | 9.3 | ||||||||||||
|
Net income
|
20.6 | 9.1 | 1.1 | 5.0 | ||||||||||||
|
Net income attributable to TIMET
common
stockholders
|
19.6 | 8.6 | 1.1 | 4.9 | ||||||||||||
|
Earnings per share attributable
to TIMET common stockholders
|
$ | 0.11 | $ | 0.05 | $ | 0.01 | $ | 0.03 | ||||||||
|
(1)The sum of quarterly
amounts may not agree to the full year results due to
rounding.
(2)Quarter ending December
31, 2008 includes $6.2 million gain related to the sale of certain
privately held securities ($0.03 per diluted share). See Note
11.
|
||||||||||||||||