Attached files


Sensient Technologies Corporation is a leading global developer, manufacturer and marketer of advanced color, flavor and fragrance systems. Sensient uses state-of-the-art technologies at facilities around the world to develop and manufacture customized food and beverage systems, pharmaceutical colors and coatings, cosmetic and personal care formulations, inkjet inks and colors, and other specialty colors and chemicals.
Financial Highlights
in thousands except per share, employee and shareholder data
| Years ended December 31, | 2009 | 2008 | % Change | ||||||
| Results of operations |
|||||||||
| Revenue |
$ | 1,201,412 | $ | 1,252,620 | (4 | )% | |||
| Operating Income* |
146,963 | 161,599 | (9 | )% | |||||
| Net Earnings* |
86,561 | 90,861 | (5 | )% | |||||
| Per common share |
|||||||||
| Net Earnings: |
|||||||||
| Basic* |
$ | 1.79 | $ | 1.91 | (6 | )% | |||
| Diluted* |
1.78 | 1.89 | (6 | )% | |||||
| Dividends |
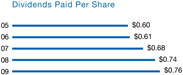
0.76 | 0.74 | 3 | % | |||||
| Book Value |
18.49 | 16.87 | 10 | % | |||||
| Other information |
|||||||||
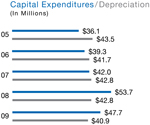
| Capital Expenditures |
$ | 47,716 | $ | 53,680 | |||||
| Depreciation and Amortization |
$ | 42,183 | $ | 44,445 | |||||
| Total Debt |
$ | 428,033 | $ | 479,895 | |||||
| Number of Employees |
3,570 | 3,613 | |||||||
| Number of Shareholders of Record |
3,082 | 3,189 | |||||||
| Average Common Shares Outstanding: |
|||||||||
| Basic |
48,379 | 47,654 | |||||||
| Diluted |
48,641 | 48,131 | |||||||
| * | Results for 2009 include charges for the proposed settlement of environmental claims and related legal expenses, net of insurance reimbursements, of $11.3 million ($6.9 million after-tax, or $0.14 per share). |
1
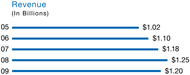
2009 Results Total 2009 revenue was $1.20 billion, compared to record revenue of $1.25 billion in 2008. Cash flow from operating activities exceeded $138 million, the highest in the Company’s history. Net earnings were $86.6 million. In January 2010, Sensient announced a proposed settlement of environmental claims against the Company stemming from an acquisition that was made over 20 years ago. Charges for this settlement were recorded in the fourth quarter of 2009, resulting in diluted earnings per share for 2009 of $1.78. Without this charge, earnings per share would have reached $1.92.
The Company demonstrated strength in key areas, but soft consumer demand kept revenues flat overall. Large customers also took a cautious approach to new product introductions, which affected revenues.
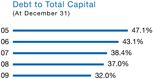
The difficult economic environment did not alter the execution of Sensient’s strategies. We remained focused on further strengthening our balance sheet. The Company’s total debt was reduced by $51.9 million, bringing our debt-to-capital ratio to 32%. Over the last six years, we have lowered outstanding debt by more than $227 million.
We have paid a dividend without interruption since public trading in the Company commenced in 1962. In 2009, we paid a quarterly dividend of 19 cents per share of common stock, amounting to 76 cents per share for the year.
Sustained Investment During a Difficult Economy
Historically, businesses have thrived in periods of economic recovery by continuing to invest in innovation during downturns. In 2009, we followed a disciplined program of investment in the most promising areas of our business. Unlike many companies, we did not lay off employees. In fact, we added sales and technical personnel to extend our geographic reach. By staying our strategic course, Sensient is particularly well positioned to succeed.
The Company’s investments focused on three areas—technology, production capabilities and distribution.
Developing New Technologies and Products
Sensient operates state-of-the-art labs and pilot plants at locations around the world. By maintaining R&D capabilities in North America, Europe, Latin America and Asia Pacific, we can better serve significant regional customers as well as multinationals.
The Company’s scientific and technical staff develop products for local consumption as well as new technologies that have global potential. For instance, our R&D strengths enable us to respond rapidly to growing worldwide consumer demand for natural colors and flavors for food and beverage products.
At the same time, our R&D effort benefits from operating as a unified Company. Information-sharing among our businesses makes product development more efficient and speeds time to market.
2

Increasing Production Capabilities
Sensient continues to add new customers and build accounts with current customers by expanding our production capabilities. In Guangzhou, China, we opened a new facility in 2009 that includes offices, labs, warehouses and a manufacturing plant. This extensive operation produces color and flavor systems for food and beverages, fragrances and pharmaceutical coatings, primarily for the Chinese marketplace.
The Company now has five locations in China. We expect China and Asia Pacific to play an increasingly important role in our growth going forward.
In 2009, Sensient also opened a facility in Alajuela, Costa Rica, which now serves as the base for the Company’s Central American and Caribbean operations. We continue to expand production capabilities at established facilities as well. In St. Louis, we completed investments in pharmaceutical colors and coatings. We also added new production for flavor extracts in Indianapolis.
Extended Distribution System
Sensient has the ability to develop entirely new products, extend existing technologies and increase production to support specific applications. We are also expanding another essential element of our business: sales and distribution.
To reach new customers—and to demonstrate our long-term commitment to emerging markets—Sensient is building an extended distribution system. As part of this initiative, we have opened satellite locations in numerous cities, including Kristianstad, Sweden, Warsaw, Poland, and Bucharest, Romania.
These offices include sales and technical personnel who introduce local manufacturers to Sensient’s products, services and R&D capabilities. We continue to refine this already successful expansion model, which entails low risk and brings significant opportunities.
A Balanced Product Mix
Sensient has weathered the difficult economic environment in large part because we maintain a robust, balanced product mix. Systems for food and beverage manufacturing sustain and even increase sales during periods of recession as manufacturers reformulate products and consumers purchase more ready-to-eat foods.
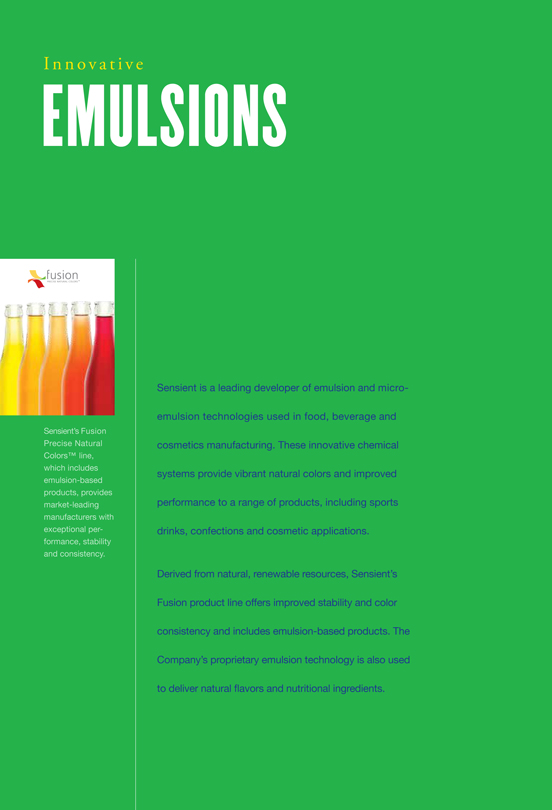
In 2009, customers increasingly turned to Sensient for advanced natural color and flavor technologies. Our line of Fusion Precise Natural ColorsTM provides highly stable, shade-specific colors derived from GMO-free raw materials. We are also expanding our line of high-performance extraction flavors, marketed under the Sensient Natural OriginsTM brand. These highly innovative natural food and beverage systems enhance our customers’ products and result in higher margins for Sensient.
We are adding to our product portfolio for non-food markets as well. We developed and are now introducing a proprietary line of self-dispersing pigment-based inkjet inks for consumer and industrial applications. These color chemicals outperform competitor products on several measures. The foundation of this new chemical technology also has applications for our global cosmetics business.
New Opportunities in 2010 and Beyond
The combination of R&D, innovative products and strong leadership makes Sensient a resilient competitor in markets around the world. We will continue to increase sales with current customers as well as add new accounts. The Company’s operational and financial discipline will drive our immediate and long-term success.
I look forward to leading the Company through a period of continuing growth.
Sincerely,

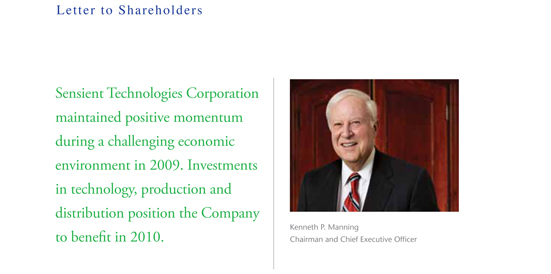
Kenneth P. Manning
Chairman and Chief Executive Officer
3
Business Profile
| • Extended distribution system provides local market access | ||
| Strategic Advantages | • Independent profit centers streamline operations | |
| • New product lines meet the growing demand for natural flavor sources | ||
| • Superior application capabilities service customer needs |
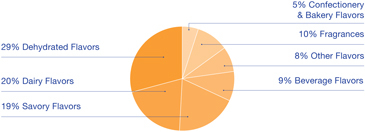
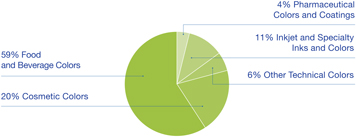
REVENUE BY PRODUCT LINE
4
|
|
Sensient Technologies Corporation 2009 Annual Report | |

| • Global reach and market leadership | ||
| Strategic Advantages | • Natural color technology outperforms competitors’ offerings | |
| • Proprietary chemistry results in superior technical colors | ||
| • Global R&D is increasing product introductions |
REVENUE BY PRODUCT LINE
5

6

8


10


12


14

15
Financial Review
| Table of Contents | ||
| Management’s Discussion & Analysis of Operations & Financial Condition | 17 | |
| Consolidated Statements of Earnings |
25 | |
| Consolidated Balance Sheets |
26 | |
| Consolidated Statements of Cash Flows |
27 | |
| Consolidated Statements of Shareholders’ Equity |
28 | |
| Notes to Consolidated Financial Statements |
30 | |
| Management’s Report on Internal Control Over Financial Reporting |
45 | |
| Report of Independent Registered Public Accounting Firm |
45 | |
| Report of Independent Registered Public Accounting Firm on Internal Control Over Financial Reporting |
46 | |
| Quarterly Data |
47 | |
| Common Stock Prices and Dividends |
47 | |
| Company Stock Performance |
47 | |
| Five Year Review |
48 | |
| Directors & Officers | 50 | |
| Investor Information | inside back cover | |
16
| Management’s Discussion & Analysis |
||
|
|
Sensient Technologies Corporation 2009 Annual Report | |
| of Operations & Financial Condition |
Overview
Although the economic environment in 2009 presented difficulties for many companies, consolidated results for Sensient Technologies Corporation (the “Company”) were relatively stable and the Company continued to strengthen its financial position. Cash flows from operating activities reached an all-time record level for the Company of $138.3 million. Total debt was reduced by $52 million in 2009 and the Company was able to refinance debt on attractive terms. The Company entered into an agreement in November 2009 to issue debt in May 2010 totaling $110 million through a private placement of notes with four financial institutions with a fixed coupon rate of 4.91%. This new debt and the Company’s existing unused capacity in its revolving loan agreement will provide required liquidity for the Company’s operations through 2012. In addition, in the fourth quarter of 2009, the Company recorded charges for the proposed settlement of legal claims against the Company related to the General Color Company Superfund site in Camden, New Jersey. By settling this matter, the Company believes it will eliminate future litigation expense and the potential for greater liability. Without the charge of $0.14 per share related to this settlement, Sensient’s earnings per share represent the best results in the history of the Company.
Revenue for 2009 was $1.20 billion compared to $1.25 billion reported in 2008. Operating income was $147.0 million in 2009 and $161.6 million in 2008. Although the impact of foreign currency translation was positive in the fourth quarter of 2009, the full year impact reduced the Company’s revenue and operating profit in 2009 by approximately $53.5 million and $9.1 million, respectively. In addition, the charges related to the settlement of legal claims reduced 2009 operating income by $11.3 million. In local currency, Sensient’s revenue was comparable with last year. In local currency and without the proposed settlement charges discussed above, operating income was above the prior year by 3.6%. Diluted earnings per share, as reported, were $1.78 in 2009 compared to $1.89 in 2008. The impact of the settlement charges on operating income and diluted earnings per share is as follows:
| (in thousands except per share amounts) |
Operating Income |
Diluted Earnings per Share | ||||
| As reported |
$ | 146,963 | $ | 1.78 | ||
| Settlement charges |
11,297 | 0.14 | ||||
| $ | 158,260 | $ | 1.92 | |||
Additional information on these items is included in Results of Operations.
Results of Operations
2009 vs. 2008
The Company reported revenue in 2009 of $1.20 billion versus $1.25 billion in 2008. Revenue in the Flavors & Fragrances Group was $772.9 million compared to $800.8 million in 2008. Color Group revenue was $374.8 million and $402.4 million in 2009 and 2008, respectively. Corporate and Other revenue, which includes the Company’s operations in the Asia Pacific region, increased 2.9% in 2009. The impact of foreign currency translation decreased consolidated revenue in 2009 by approximately $53.5 million, or 4.3%. In local currency, consolidated revenue was up 0.2% in 2009. Additional information on Group results can be found in the Segment Information section.
The Company’s gross margin increased 30 basis points to 30.7% in 2009, from 30.4% in 2008. Selling prices were increased and more than offset the impact of higher raw material costs in 2009. Gross margin was also positively impacted as benefits from lower energy costs were recognized.
Selling and administrative expense as a percent of revenue was 18.5% in 2009 compared to 17.5% in 2008. In 2009, the Company recorded charges for the proposed settlement of legal claims against the Company related to the General Colors Company Superfund site in Camden, New Jersey. The amount of the charges was approximately $11.3 million, or 0.9% of revenue.
17
| Management’s Discussion & Analysis |
||
|
|
||
| of Operations & Financial Condition continued |
Operating income was $147.0 million in 2009 compared to $161.6 million in 2008. The lower operating income was attributable to the charges related to the proposed legal settlements discussed above and the negative impact of foreign currency translation of $9.1 million. Higher profits from selling price increases were partially offset by lower volumes because of decreased demand and customer inventory destocking. Additional information on Group results can be found in the Segment Information section.
Interest expense decreased 26.4% to $23.8 million in 2009 from $32.3 million in 2008. The decrease is due to lower rates and lower average outstanding debt balances.
The effective income tax rate was 29.7% in both 2009 and 2008. The effective tax rates for both 2009 and 2008 were reduced by discrete items, including the favorable resolution of prior years’ tax matters. In addition, the rate in 2008 was lowered by the reduction of certain valuation allowances related to the expected use of tax losses and because of tax rate changes that impacted the future benefit of certain deferred tax assets. In total, these discrete items reduced the effective tax rate for 2009 and 2008 by 2.5% and 2.7%, respectively.
| 2009 | 2008 | |||||
| Rate excluding discrete items |
32.2 | % | 32.4 | % | ||
| Discrete items |
(2.5 | %) | (2.7 | %) | ||
| Reported effective tax rate |
29.7 | % | 29.7 | % | ||
The effective tax rate for 2010 is expected to be approximately 33.0% prior to the recording of any discrete items. The rate excluding discrete items in 2009 was lowered by recognition of the tax benefits on the charges taken for the proposed settlement of legal claims.
SEGMENT INFORMATION
The Company determines its operating segments based on information utilized by senior management to allocate resources and assess performance. The Company’s reportable segments consist of the Flavors & Fragrances Group and the Color Group. The results of two additional operating segments, the Asia Pacific Group and the China Group, are reported in the Corporate and Other segment.
Flavors & Fragrances Flavors & Fragrances Group revenue for the year ended December 31, 2009, decreased 3.5% to $772.9 million from $800.8 million in 2008. The unfavorable impact of foreign currency translation decreased revenue by $31.6 million, or 4.0%. Increases in selling prices ($29.0 million) were partially offset by lower volumes ($25.3 million). The increased selling prices occurred in all regions of the Group. The volume decrease occurred primarily in North America and was due to soft customer demand and inventory destocking. Demand was partly impacted by a decrease in customer new product introductions in 2009.
Gross margin increased 100 basis points in 2009 to 27.3% from 26.3% in 2008. Increases in selling prices more than offset higher raw material costs and the impact of unfavorable product mix.
The Flavors & Fragrances Group operating income was $124.5 million in 2009 compared to $123.5 million in 2008. Excluding the unfavorable impact of foreign currency translation of $4.7 million, operating profit increased $5.7 million. The increase in operating income was due to Europe ($2.7 million), Latin America ($1.6 million) and North America ($1.5 million) primarily driven by higher selling prices partially offset by increased raw material costs. Operating income as a percent of revenue increased 70 basis points to 16.1% from 15.4% in 2008 primarily for the reasons discussed above.
Color Revenue for the Color Group was $374.8 million compared to $402.4 million in 2008. The unfavorable impact of foreign exchange rates decreased revenue by approximately $22.2 million, or 5.5%. In addition, lower sales of non-food colors ($7.7 million) were partially offset by higher sales of food and beverage colors ($2.3 million). The higher sales of food and beverage colors were driven by higher selling prices across all markets partially offset by lower volumes in North America. The decreased sales of non-food colors were primarily related to lower volume. Most product lines in 2009 were impacted by soft demand and customer inventory destocking. The soft demand is partly due to a decrease in customer new product introductions during 2009.
Gross margin for the Color Group was 33.7% in 2009 compared to 35.1% in 2008. Higher raw material costs were partially offset by higher selling prices. Raw material costs improved as the year progressed, and in the fourth quarter of 2009 raw material costs were favorable in comparison to the prior year fourth quarter.
18
|
|
Sensient Technologies Corporation 2009 Annual Report | |
Color Group operating income was $58.7 million compared to $71.6 million in 2008. Excluding the unfavorable impact of foreign currency translation of $4.0 million, operating income decreased $6.8 million in non-food colors and $2.1 million in food colors. The lower operating income in non-food colors was primarily due to soft demand, customer inventory destocking and higher raw material costs. The lower operating income in food colors was primarily due to higher raw material costs and lower volumes due to soft demand and customer inventory destocking partially offset by higher selling prices. Operating income as a percent of revenue was 15.7% compared to 17.8% in 2008 primarily due to the reasons described above.
2008 vs. 2007
The Company’s revenue for 2008 was $1.25 billion, an increase of 5.7% from $1.18 billion reported in 2007. Revenue in the Flavors & Fragrances Group increased $40.1 million, or 5.3%, over 2007 to $800.8 million. Color Group revenue increased 6.2% to $402.4 million from $379.0 million reported in 2007. Corporate and Other revenue, which includes the Company’s operations in the Asia Pacific region, increased 12.0% in 2008. The impact of foreign currency translation increased revenues in the first nine months of 2008 and then began to decrease revenues in the fourth quarter as the U.S. dollar strengthened against most foreign currencies. In total, foreign currency translation added $18.5 million to revenue in 2008. Additional information on Group results can be found in the Segment Information section.
The Company’s gross margin decreased 20 basis points to 30.4% in 2008, from 30.6% in 2007. Although the increase in selling prices more than offset the dollar impact of higher raw material, energy and manufacturing costs, there was a slight negative impact on the gross margin rate as revenue increased more than the net increase in gross profit.
Selling and administrative expenses as a percent of revenue decreased to 17.5% in 2008 from 18.1% in 2007. The decrease of 60 basis points was due to a slight increase in selling and administrative expenses compared to a more significant increase in revenue. The overall increase in selling and administrative expenses was 2.0%. Normal inflationary increases and the impact of changes in foreign exchange rates were partially offset by lower share-based compensation expense.
Operating income was $161.6 million in 2008 compared to $147.4 million in 2007. The increased operating income was attributable to the higher selling prices and volume increases partially offset by higher raw material, energy and manufacturing costs discussed above. Changes in foreign exchange rates in 2008 versus 2007 increased operating income by $2.2 million.
Interest expense decreased 10.6% to $32.3 million in 2008 from $36.1 million in 2007. The decrease is due to lower rates and lower average outstanding debt balances.
The effective income tax rate was 29.7% and 30.1% in 2008 and 2007, respectively. The effective tax rates for both 2008 and 2007 were reduced by discrete items, primarily including the favorable resolution of prior years’ tax matters and the reduction of the valuation allowance related to the planned use of foreign tax losses. In addition, the 2008 reported rate was decreased and the 2007 reported rate was increased because of tax rate changes that impacted the future benefit of certain deferred tax assets. In total, these discrete items reduced the effective tax rate for 2008 and 2007 by 2.7% and 3.0%, respectively. The 2008 rate excluding discrete items decreased 70 basis points in comparison to the rate in 2007 primarily due to lower statutory rates in certain foreign jurisdictions.
| 2008 | 2007 | |||||
| Rate excluding discrete items |
32.4 | % | 33.1 | % | ||
| Discrete items |
(2.7 | )% | (3.0 | )% | ||
| Reported effective tax rate |
29.7 | % | 30.1 | % | ||
SEGMENT INFORMATION
Flavors & Fragrances Flavors & Fragrances Group revenue for the year ended December 31, 2008, increased 5.3% to $800.8 million. The increase of $40.1 million was primarily a result of increased selling prices ($32.5 million) partially offset by lower volumes ($3.0 million). The favorable impact of foreign currency translation also increased revenue by $10.9 million. Increased selling prices occurred in all regions of the Group in both dehydrated flavors and other flavors. The volume decrease occurred primarily in Latin America.
19
| Management’s Discussion & Analysis |
||
|
|
||
| of Operations & Financial Condition continued |
Gross margin was 26.3% in 2008, a 20 basis point decrease from the 26.5% gross margin in 2007. Although the increase in selling prices more than offset the dollar impact of higher raw material, energy and manufacturing costs, there was a slight negative impact on the gross margin rate as revenue increased more than the net increase in gross profit.
The Flavors & Fragrances Group operating income was $123.5 million in 2008, an increase of 7.6% from $114.8 million in 2007. The increase in operating income was primarily due to higher sales in North America ($8.7 million) and Europe ($1.1 million) partially offset by the impact of lower volumes in Latin America ($1.1 million). The increased profit in North America and Europe was primarily due to higher selling prices in dehydrated and other flavors partially offset by higher raw material, energy and manufacturing costs. Operating income as a percent of revenue increased 30 basis points to 15.4% from 15.1% in 2007 primarily for the reasons discussed above.
Color Revenue for the Color Group increased 6.2% to $402.4 million in 2008 from $379.0 million in 2007. The higher revenue was primarily due to increased sales of food and beverage colors in all markets ($7.6 million), increased sales of cosmetic colors ($5.5 million) and increased sales of pharmaceutical colors ($2.7 million). The favorable impact of foreign currency translation also increased revenue by $6.0 million. The increased sales of food and beverage colors were primarily due to higher selling prices. The increased sales of cosmetic and pharmaceutical colors were primarily due to higher volumes.
Gross margin for the Color Group was 35.1% in 2008, a 60 basis point decrease from the Group’s 35.7% gross margin in 2007. Higher raw material, energy and manufacturing costs were partially offset by higher selling prices. In the fourth quarter of 2008, higher selling prices more than offset the impact of higher raw material, energy and manufacturing costs resulting in margins that were equal to the fourth quarter of 2007.
Color Group operating income of $71.6 million in 2008 was an increase of 7.5% from $66.6 million in 2007. The increase in operating income was primarily due to higher profit in technical colors ($3.6 million) and pharmaceutical colors ($0.8 million). The favorable impact of foreign currency translation increased operating income by $2.0 million. These increases were partially offset by lower profit in cosmetic colors ($1.5 million). The higher profits in technical colors were primarily due to increased selling prices and lower costs. The higher profit in pharmaceutical colors was primarily due to higher volumes. The lower profit in cosmetic colors was primarily due to higher raw material and manufacturing costs. Operating income as a percent of revenue increased 20 basis points to 17.8% in 2008 from 17.6% in 2007 primarily due to the reasons described above.
Liquidity and Financial Position
The Company’s financial position remains strong, enabling it to meet cash requirements for operations, capital expansion programs and dividend payments to shareholders. The Company intends to fund working capital requirements, principal and interest payments, acquisitions (if any) and other liabilities with cash provided by operations, to the extent available, and short-term and long-term borrowings under new and existing credit facilities. In November 2009, the Company completed an agreement to issue debt totaling $110 million through a private placement of notes with four financial institutions. The notes will be issued in May 2010, have a final maturity of May 2017 and are unsecured. The Company intends to utilize all or a portion of the proceeds from the private placement to refinance existing debt.
The Company’s ratio of debt to total capital improved to 32.0% at December 31, 2009, compared to 37.0% and 38.4% at December 31, 2008 and 2007, respectively. The improvement in 2009 resulted from both a reduction in debt and an increase in equity. Debt was reduced by $51.9 million since December 31, 2008, and by $79.1 million since December 31, 2007.
20
|
|
Sensient Technologies Corporation 2009 Annual Report | |
In the Consolidated Statements of Cash Flows, the changes in operating assets and liabilities are presented excluding the effects of changes in foreign currency exchange rates, as these do not reflect actual cash flows. Accordingly, the amounts in the Consolidated Statements of Cash Flows do not necessarily correspond with changes in the operating assets and liabilities that are presented in the Consolidated Balance Sheets.
Net cash provided by operating activities was $138.3 million in 2009, $87.0 million in 2008 and $105.2 million in 2007. Operating cash flow provided the primary source of funds to finance operating needs, capital expenditures and shareholder dividends, and to reduce net borrowings. The increase in net cash provided by operating activities in 2009 was primarily due to a reduction of working capital in 2009 compared to an increase in net working capital in 2008. The improvement in working capital in 2009 was primarily due to a reduction in inventory which had increased during 2008 as a result of higher volumes and costs of certain raw materials.
Net cash used in investing activities was $48.0 million in 2009, $50.0 million in 2008 and $39.2 million in 2007. Capital expenditures were $47.7 million in 2009, $53.7 million in 2008 and $42.0 million in 2007.
Net cash used in financing activities was $80.4 million in 2009, $38.4 million in 2008 and $61.4 million in 2007. The Company had net reductions in debt of $54.5 million in 2009, $21.6 million in 2008 and $44.8 million in 2007. In 2009, 2008 and 2007, the Company was able to finance capital expenditures, dividend payments and any share repurchases and still reduce debt levels. The Company maintains debt levels it considers prudent based on its cash flows, interest coverage and percentage of total debt to total capital.
The Company has paid uninterrupted quarterly cash dividends since commencing public trading in its stock in 1962. The Company’s quarterly dividend has been $0.19 per share since the third quarter of 2008 when it was increased from $0.18 per share. Dividends paid per share were $0.76 in 2009, $0.74 in 2008 and $0.68 in 2007. Total dividends paid were $37.0 million, $35.6 million and $32.0 million in 2009, 2008 and 2007, respectively.
With the exception of the increase in raw material costs discussed above, the impact of inflation on both the Company’s financial position and its results of operations has been minimal and is not expected to adversely affect 2010 results.
Issuer Purchases of Equity Securities
During 2007, the Company repurchased 0.05 million shares of Company stock at a total cost of $1.3 million. There were no purchases of Company stock in 2008 or 2009. On April 27, 2001, the Board approved a share repurchase program under which the Company is authorized to repurchase up to 5.0 million shares of Company stock in addition to amounts remaining from prior Board authorizations. As of December 31, 2009, 3.0 million shares were available to be repurchased under existing authorizations. The Company’s share repurchase program has no expiration date.
Critical Accounting Policies
In preparing the financial statements in accordance with accounting principles generally accepted in the U.S., management is required to make estimates and assumptions that have an impact on the asset, liability, revenue and expense amounts reported. These estimates can also affect supplemental information disclosures of the Company, including information about contingencies, risk and financial condition. The Company believes, given current facts and circumstances, that its estimates and assumptions are reasonable, adhere to accounting principles generally accepted in the U.S. and are consistently applied. Inherent in the nature of an estimate or assumption is the fact that actual results may differ from esti-
21
| Management’s Discussion & Analysis |
||
|
|
||
| of Operations & Financial Condition continued |
mates and estimates may vary as new facts and circumstances arise. The Company makes routine estimates and judgments in determining the net realizable value of accounts receivable, inventories, property, plant and equipment, and prepaid expenses. Management believes the Company’s most critical accounting estimates and assumptions are in the following areas:
Revenue Recognition The Company recognizes revenue (net of estimated discounts, allowances and returns) when title passes, the customer is obligated to pay the Company and the Company has no remaining obligations. Such recognition typically corresponds with the shipment of goods.
Goodwill Valuation The Company reviews the carrying value of goodwill annually utilizing several valuation methodologies, including a discounted cash flow model. The Company completed its annual goodwill impairment test under ASC 350, Intangibles – Goodwill and Other, in the third quarter of 2009. In conducting its annual test for impairment, the Company estimates the fair value for each of its reporting units and compares each of these values to the net book value of each reporting unit. Fair value is estimated using both a discounted cash flow analysis and an analysis of comparable company market values. If the fair value of a reporting unit exceeds its net book value, no impairment exists. The Company has three reporting units that were tested for impairment. The Flavors and Fragrances reporting unit and the Asia Pacific reporting unit had fair values that were over 75% above their respective net book values. The fair value of the Color reporting unit, with goodwill of $313 million at its measurement date, has a premium over net book value of between 10% and 20%. The estimate of fair value for the Color reporting unit is based on current cash flow levels assuming a modest rate of future growth. A sustained reduction of cash flow from this reporting unit or an increase in the discount rate could cause the estimated fair value to fall below the net book value of the reporting unit. Changes in estimates of future cash flows caused by items such as unforeseen events or changes in market conditions could negatively affect the reporting units’ fair value and result in an impairment charge.
Income Taxes The Company estimates its income tax expense in each of the taxing jurisdictions in which it operates. The Company is subject to a tax audit in each of these jurisdictions, which could result in changes to the estimated tax expense. The amount of these changes would vary by jurisdiction and would be recorded when probable and estimable. These changes could impact the Company’s financial statements. Management has recorded valuation allowances to reduce its deferred tax assets to the amount that is more likely than not to be realized. Examples of deferred tax assets include deductions, net operating losses and tax credits which the Company believes will reduce its future tax payments. In assessing the future realization of these assets, management has considered future taxable income and ongoing tax planning strategies. An adjustment to the recorded valuation allowance as a result of changes in facts or circumstances could result in a significant change in the Company’s tax expense. The Company does not provide for deferred taxes on unremitted earnings of foreign subsidiaries which are considered to be invested indefinitely.
Commitments and Contingencies The Company is subject to litigation and other legal proceedings arising in the ordinary course of its businesses or arising under provisions related to the protection of the environment. Estimating liabilities and costs associated with these matters requires the judgment of management, who rely in part on information from Company legal counsel. When it is probable that the Company has incurred a liability associated with claims or pending or threatened litigation matters and the Company’s exposure is reasonably estimable, the Company records a charge against earnings. The Company recognizes related insurance reimbursement when receipt is deemed probable. The Company’s estimate of liabilities and related insurance recoveries may change as further facts and circumstances become known.
Market Risk Factors
The Company is exposed to market risks, including changes in interest rates, currency exchange rates and commodity prices. To manage the volatility relating to these exposures on a consolidated basis, the Company nets the exposures to take advantage of natural offsets.
22
|
|
Sensient Technologies Corporation 2009 Annual Report | |
The Company also enters into various derivative transactions for some of the remaining exposures pursuant to the Company’s policies covering hedging practices. The financial impacts of these hedging instruments are offset by corresponding changes in the underlying exposures being hedged.
The Company does not hold or issue derivative financial instruments for trading purposes. Note 1 and Note 4 to the Consolidated Financial Statements include a discussion of the Company’s accounting policies for financial instruments.
A key part of the Company’s strategy is to expand into new geographic markets. Because the Company manufactures and sells its products throughout the world, it is exposed to movements in foreign currency exchange rates. The major foreign currency exposures involve the markets in Western Europe, Mexico and Canada. The primary purpose of the Company’s foreign currency hedging activities is to protect against the volatility associated with foreign currency sales, purchases of materials and other assets and liabilities created during the normal course of business. The Company generally utilizes foreign exchange contracts with durations of less than 12 months that may or may not be designated as cash flow hedges under Accounting Standards Codification (“ASC”) 815, Derivatives and Hedging. At December 31, 2009 and 2008, the net fair values of these instruments, based on dealer quotes, were a liability of $0.3 million and an asset of $1.1 million, respectively. At December 31, 2009 and 2008, the potential gain or loss in the fair value of the Company’s outstanding foreign exchange contracts, assuming a hypothetical 10% fluctuation in the currencies of such contracts, would be approximately $2.4 million and $12.0 million, respectively. However, any change in the value of the contracts, real or hypothetical, would be significantly offset by a corresponding change in the value of the underlying hedged items. In addition, this hypothetical calculation assumes that each exchange rate would change in the same direction relative to the U.S. dollar.
The Company has certain debt denominated in Swiss Francs and Euros. These non-derivative debt instruments act as partial hedges of the Company’s Swiss Franc and Euro net asset positions. The potential increase or decrease in the annual U.S. dollar interest expense of the Company’s outstanding foreign currency-denominated debt, assuming a hypothetical 10% fluctuation in the currencies of such debt, would be approximately $0.6 million and $0.7 million at December 31, 2009 and 2008, respectively. However, any change in interest expense from fluctuations in currency, real or hypothetical, would be significantly offset by a corresponding change in the value of the foreign income before interest. In addition, this hypothetical calculation assumes that each exchange rate would change in the same direction relative to the U.S. dollar.
The Company manages its debt structure and interest rate risk through the use of fixed rate and floating rate debt and through the use of derivatives. The Company’s primary exposure is to interest rates in the U.S. and Western Europe. At December 31, 2009 and 2008, the potential increase or decrease in annual interest expense, assuming a hypothetical 10% fluctuation in interest rates of floating rate debt, would be approximately $0.2 million and $0.4 million, respectively.
The Company is the purchaser of certain commodities, such as corn, sugar, soybean meal and fruits. The Company generally purchases these commodities based upon market prices that are established with the vendor as part of the purchase process. In general, the Company does not use commodity financial instruments to hedge commodity prices due to a high correlation between the commodity cost and the ultimate selling price of the Company’s products. On occasion, the Company may enter into non-cancelable forward purchase contracts, as deemed appropriate, to reduce the effect of price fluctuations on future manufacturing requirements.
Contractual Obligations
The Company is subject to certain contractual obligations, including long-term debt, operating leases, manufacturing purchases and pension benefit obligations. The Company has unrecognized tax benefits of $12.2 million as of December 31, 2009. However, the Company cannot make a reasonably reliable estimate of the period of potential cash settlement of the liabilities and, therefore, has not included unrecognized tax benefits in the following table of significant contractual obligations as of December 31, 2009.
23
| Management’s Discussion & Analysis |
||
|
|
||
| of Operations & Financial Condition continued |
Payments Due by Period
| (in thousands) |
Total | 1 year | 2-3 years | 4-5 years | > 5 years | ||||||||||
| Long-term debt |
$ | 388,852 | $ | 31,017 | $ | 301,460 | $ | 53,410 | $ | 2,965 | |||||
| Interest payments on long-term debt |
34,156 | 13,095 | 17,012 | 3,866 | 183 | ||||||||||
| Operating lease obligations |
22,749 | 6,957 | 8,326 | 3,401 | 4,065 | ||||||||||
| Manufacturing purchase commitments |
63,668 | 60,771 | 2,897 | — | — | ||||||||||
| Pension funding obligations |
37,687 | 4,401 | 26,386 | 2,423 | 4,477 | ||||||||||
| Total contractual obligations |
$ | 547,112 | $ | 116,241 | $ | 356,081 | $ | 63,100 | $ | 11,690 | |||||
New Pronouncements
The Company adopted the additional disclosure requirements of ASC 815, Derivatives and Hedging, on January 1, 2009. See Note 4 to the Consolidated Financial Statements, Derivative Instruments and Hedging Activity, for additional information.
The Company adopted the disclosure requirements of ASC 855, Subsequent Events, on April 1, 2009. This codification topic provides disclosure requirements pertaining to events that occur after the balance sheet date, but before financial statements are issued or are available to be issued. The Company performed an evaluation of subsequent events through March 1, 2010, the date the financial statements were issued.
The Company adopted new guidance issued by the FASB pertaining to “the calculation of EPS for share-based payment awards with rights to dividends” as of January 1, 2009. This guidance considers unvested share based payments in which the holder receives nonforfeitable rights to dividends as participating securities which shall be included in the computation of earnings per share pursuant to the two-class method described in ASC 260, Earnings per Share. After evaluating the impact of this new guidance, the Company determined that its application did not have a material impact on its calculation of earnings per share. See Earnings per Share in Note 1 to the Consolidated Financial Statements for additional information on the Company’s earnings per share calculation.
Off-Balance Sheet Arrangements
The Company had no off-balance sheet arrangements as of December 31, 2009.
Forward-looking Statements
This document contains forward-looking statements that reflect management’s current assumptions and estimates of future economic circumstances, industry conditions, Company performance and financial results. Forward-looking statements include statements in the future tense, statements referring to any period after December 31, 2009, and statements including the terms “expect,” “believe,” “anticipate” and other similar terms that express expectations as to future events or conditions. The Private Securities Litigation Reform Act of 1995 provides a safe harbor for such forward-looking statements. Such forward-looking statements are not guarantees of future performance and involve known and unknown risks, uncertainties and other factors that could cause actual events to differ materially from those expressed in those statements. A variety of factors could cause the Company’s actual results and experience to differ materially from the anticipated results. These factors and assumptions include the pace and nature of new product introductions by the Company’s customers; the Company’s ability to successfully implement its growth strategies; the outcome of the Company’s various productivity-improvement and cost-reduction efforts; changes in costs of raw materials and energy; industry and economic factors related to the Company’s domestic and international business; competition from other suppliers of colors, flavors and fragrances; growth or contraction in markets for products in which the Company competes; terminations and other changes in customer relationships; industry acceptance of price increases; currency exchange rate fluctuations; cost and availability of credit; the completion of the settlement of the various legal items; and the matters discussed above including the critical accounting policies described therein. The Company does not undertake to publicly update or revise its forward-looking statements even if experience or future changes make it clear that any projected results expressed or implied therein will not be realized.
24
| Consolidated Statements |
||
|
|
Sensient Technologies Corporation 2009 Annual Report | |
| of Earnings |
| (in thousands except per share amounts) Years ended December 31, |
2009 | 2008 | 2007 | ||||||
| Revenue |
$ | 1,201,412 | $ | 1,252,620 | $ | 1,184,778 | |||
| Cost of products sold |
832,382 | 871,754 | 822,479 | ||||||
| Selling and administrative expenses |
222,067 | 219,267 | 214,929 | ||||||
| Operating Income |
146,963 | 161,599 | 147,370 | ||||||
| Interest expense |
23,788 | 32,306 | 36,127 | ||||||
| Earnings Before Income Taxes |
123,175 | 129,293 | 111,243 | ||||||
| Income taxes |
36,614 | 38,432 | 33,457 | ||||||
| Net Earnings |
$ | 86,561 | $ | 90,861 | $ | 77,786 | |||
| Earnings per share: |
|||||||||
| Basic |
$ | 1.79 | $ | 1.91 | $ | 1.66 | |||
| Diluted |
$ | 1.78 | $ | 1.89 | $ | 1.65 | |||
| Average common shares outstanding: |
|||||||||
| Basic |
48,379 | 47,654 | 46,740 | ||||||
| Diluted |
48,641 | 48,131 | 47,257 | ||||||
See notes to consolidated financial statements.
25
| Consolidated |
||
|
|
||
| Balance Sheets |
| (in thousands except share and per share amounts) December 31, |
2009 | 2008 | ||||||
| Assets |
||||||||
| Current Assets: |
||||||||
| Cash and cash equivalents |
$ | 12,219 | $ | 8,498 | ||||
| Trade accounts receivable, less allowance for losses of $3,427 and $4,295, respectively |
200,186 | 198,903 | ||||||
| Inventories |
390,011 | 381,246 | ||||||
| Prepaid expenses and other current assets |
42,668 | 30,319 | ||||||
| Deferred income taxes |
13,025 | 8,557 | ||||||
| Total current assets |
658,109 | 627,523 | ||||||
| Other assets |
38,349 | 40,878 | ||||||
| Intangible assets – at cost, less accumulated amortization of $11,014 and $10,077, respectively |
13,621 | 13,754 | ||||||
| Goodwill |
455,995 | 440,416 | ||||||
| Property, Plant and Equipment: |
||||||||
| Land |
49,429 | 47,315 | ||||||
| Buildings |
293,200 | 248,366 | ||||||
| Machinery and equipment |
630,420 | 594,858 | ||||||
| Construction in progress |
20,211 | 40,200 | ||||||
| 993,260 | 930,739 | |||||||
| Less accumulated depreciation |
(567,643 | ) | (527,873 | ) | ||||
| 425,617 | 402,866 | |||||||
| Total assets |
$ | 1,591,691 | $ | 1,525,437 | ||||
| Liabilities and Shareholders’ Equity |
||||||||
| Current Liabilities: |
||||||||
| Trade accounts payable |
$ | 88,915 | $ | 82,976 | ||||
| Accrued salaries, wages and withholdings from employees |
22,568 | 24,269 | ||||||
| Other accrued expenses |
64,789 | 52,825 | ||||||
| Income taxes |
692 | 1,988 | ||||||
| Short-term borrowings |
39,181 | 34,213 | ||||||
| Current maturities of long-term debt |
— | — | ||||||
| Total current liabilities |
216,145 | 196,271 | ||||||
| Deferred income taxes |
12,810 | 14,590 | ||||||
| Other liabilities |
14,393 | 12,682 | ||||||
| Accrued employee and retiree benefits |
50,796 | 37,616 | ||||||
| Long-term debt |
388,852 | 445,682 | ||||||
| Shareholders’ Equity: |
||||||||
| Common stock, par value $0.10 a share, authorized 100,000,000 shares; issued 53,954,874 shares |
5,396 | 5,396 | ||||||
| Additional paid-in capital |
85,504 | 82,261 | ||||||
| Earnings reinvested in the business |
922,963 | 873,444 | ||||||
| Treasury stock, 5,182,710 and 5,798,297 shares, respectively, at cost |
(103,878 | ) | (116,217 | ) | ||||
| Accumulated other comprehensive loss |
(1,290 | ) | (26,288 | ) | ||||
| 908,695 | 818,596 | |||||||
| Total liabilities and shareholders’ equity |
$ | 1,591,691 | $ | 1,525,437 | ||||
See notes to consolidated financial statements.
26
| Consolidated Statements |
||
|
|
Sensient Technologies Corporation 2009 Annual Report | |
| of Cash Flows |
| (in thousands) Years ended December 31, |
2009 | 2008 | 2007 | |||||||||
| Cash Flows from Operating Activities |
||||||||||||
| Net earnings |
$ | 86,561 | $ | 90,861 | $ | 77,786 | ||||||
| Adjustments to arrive at net cash provided by operating activities: |
||||||||||||
| Depreciation and amortization |
42,183 | 44,445 | 44,312 | |||||||||
| Share-based compensation |
3,860 | 3,798 | 4,731 | |||||||||
| Loss (gain) on assets |
1,819 | 1,358 | (467 | ) | ||||||||
| Deferred income taxes |
(3,895 | ) | 3,329 | 9,381 | ||||||||
| Changes in operating assets and liabilities: |
||||||||||||
| Trade accounts receivable |
5,013 | (16,908 | ) | (6,152 | ) | |||||||
| Inventories |
1,190 | (40,591 | ) | (15,299 | ) | |||||||
| Prepaid expenses and other assets |
(14,602 | ) | (672 | ) | (5,115 | ) | ||||||
| Accounts payable and other accrued expenses |
14,058 | (2,216 | ) | 4,217 | ||||||||
| Accrued salaries, wages and withholdings from employees |
(1,557 | ) | 2,084 | (1,753 | ) | |||||||
| Income taxes |
965 | 1,939 | (8,876 | ) | ||||||||
| Other liabilities |
2,741 | (453 | ) | 2,440 | ||||||||
| Net cash provided by operating activities |
138,336 | 86,974 | 105,205 | |||||||||
| Cash Flows from Investing Activities |
||||||||||||
| Acquisition of property, plant and equipment |
(47,716 | ) | (53,680 | ) | (41,961 | ) | ||||||
| Proceeds from sale of assets |
109 | 2,064 | 2,291 | |||||||||
| Other investing activity |
(440 | ) | 1,661 | 451 | ||||||||
| Net cash used in investing activities |
(48,047 | ) | (49,955 | ) | (39,219 | ) | ||||||
| Cash Flows from Financing Activities |
||||||||||||
| Proceeds from additional borrowings |
222,553 | 112,514 | 136,859 | |||||||||
| Debt payments |
(277,064 | ) | (134,135 | ) | (181,680 | ) | ||||||
| Purchase of treasury stock |
— | — | (1,267 | ) | ||||||||
| Dividends paid |
(37,042 | ) | (35,597 | ) | (32,017 | ) | ||||||
| Proceeds from options exercised and other equity transactions |
11,185 | 18,862 | 16,693 | |||||||||
| Net cash used in financing activities |
(80,368 | ) | (38,356 | ) | (61,412 | ) | ||||||
| Effect of exchange rate changes on cash and cash equivalents |
(6,200 | ) | (687 | ) | 913 | |||||||
| Net increase (decrease) in cash and cash equivalents |
3,721 | (2,024 | ) | 5,487 | ||||||||
| Cash and cash equivalents at beginning of year |
8,498 | 10,522 | 5,035 | |||||||||
| Cash and cash equivalents at end of year |
$ | 12,219 | $ | 8,498 | $ | 10,522 | ||||||
| Cash paid during the year for: |
||||||||||||
| Interest |
$ | 26,982 | $ | 31,975 | $ | 36,070 | ||||||
| Income taxes |
36,801 | 28,424 | 29,735 | |||||||||
| Capitalized interest |
840 | 1,999 | 1,493 | |||||||||
See notes to consolidated financial statements.
27
| Consolidated Statements |
||
|
|
||
| of Shareholders’ Equity |
| (in thousands except share and per share amounts) |
Common Stock |
Additional Paid-in Capital |
|||||
| Balances at December 31, 2006 |
$ | 5,396 | $ | 70,420 | |||
| Net earnings |
|||||||
| Unrealized loss on cash flow hedges, arising during the period, net of tax of $209 |
|||||||
| Reclassification adjustment for cash flow hedges included in net income, net of tax of $228 |
|||||||
| Pension adjustment, net of tax of $138 |
|||||||
| Foreign currency translation |
|||||||
| Total comprehensive income |
|||||||
| Cash dividends paid – $0.68 a share |
|||||||
| Adjustment to initially apply Accounting for Uncertain Tax Positions (See Note 7) |
|||||||
| Share-based compensation |
5,183 | ||||||
| Stock options exercised |
1,931 | ||||||
| Nonvested stock issued upon vesting |
(2,845 | ) | |||||
| Benefit plans |
175 | ||||||
| Purchase of treasury stock |
|||||||
| Other |
369 | ||||||
| Balances at December 31, 2007 |
5,396 | 75,233 | |||||
| Net earnings |
|||||||
| Unrealized loss on cash flow hedges, arising during the period, net of tax of $13 |
|||||||
| Reclassification adjustment for cash flow hedges included in net income, net of tax of $3 |
|||||||
| Pension adjustment, net of tax of $1,473 |
|||||||
| Foreign currency translation |
|||||||
| Total comprehensive income |
|||||||
| Cash dividends paid – $0.74 a share |
|||||||
| Share-based compensation |
4,989 | ||||||
| Stock options exercised |
2,511 | ||||||
| Nonvested stock issued upon vesting |
(1,688 | ) | |||||
| Benefit plans |
173 | ||||||
| Other |
1,043 | ||||||
| Balances at December 31, 2008 |
5,396 | 82,261 | |||||
| Net earnings |
|||||||
| Unrealized gain on cash flow hedges, arising during the period, net of tax of $118 |
|||||||
| Reclassification adjustment for cash flow hedges included in net income, net of tax of $141 |
|||||||
| Pension adjustment, net of tax of $3,329 |
|||||||
| Foreign currency translation |
|||||||
| Total comprehensive income |
|||||||
| Cash dividends paid – $0.76 a share |
|||||||
| Share-based compensation |
4,088 | ||||||
| Stock options exercised |
901 | ||||||
| Nonvested stock issued upon vesting |
(1,830 | ) | |||||
| Benefit plans |
34 | ||||||
| Other |
50 | ||||||
| Balances at December 31, 2009 |
$ | 5,396 | $ | 85,504 | |||
See notes to consolidated financial statements.
28
|
|
Sensient Technologies Corporation 2009 Annual Report | |
| Earnings Reinvested in the Business |
Accumulated Other Comprehensive Income (Loss) |
Total Comprehensive Income |
||||||||||||||
| Treasury Stock | ||||||||||||||||
| Shares | Amount | |||||||||||||||
| $ | 774,677 | 7,385,249 | $ | (147,662 | ) | $ | 1,273 | |||||||||
| 77,786 | $ | 77,786 | ||||||||||||||
| (1,462 | ) | (1,462 | ) | |||||||||||||
| 1,596 | 1,596 | |||||||||||||||
| (212 | ) | (212 | ) | |||||||||||||
| 46,775 | 46,775 | |||||||||||||||
| $ | 124,483 | |||||||||||||||
| (32,017) | ||||||||||||||||
| (2,266) | ||||||||||||||||
| 22,600 | (452 | ) | ||||||||||||||
| (676,229 | ) | 13,522 | ||||||||||||||
| (142,100 | ) | 2,845 | ||||||||||||||
| (32,992 | ) | 660 | ||||||||||||||
| 47,100 | (1,267 | ) | ||||||||||||||
| 22 | (4 | ) | ||||||||||||||
| 818,180 | 6,603,650 | (132,358 | ) | 47,970 | ||||||||||||
| 90,861 | $ | 90,861 | ||||||||||||||
| (91 | ) | (91 | ) | |||||||||||||
| 18 | 18 | |||||||||||||||
| 3,574 | 3,574 | |||||||||||||||
| (77,759 | ) | (77,759 | ) | |||||||||||||
| $ | 16,603 | |||||||||||||||
| (35,597) | ||||||||||||||||
| 59,400 | (1,191 | ) | ||||||||||||||
| (759,241 | ) | 15,217 | ||||||||||||||
| (84,200 | ) | 1,688 | ||||||||||||||
| (21,312 | ) | 427 | ||||||||||||||
| 873,444 | 5,798,297 | (116,217 | ) | (26,288 | ) | |||||||||||
| 86,561 | $ | 86,561 | ||||||||||||||
| 826 | 826 | |||||||||||||||
| (987 | ) | (987 | ) | |||||||||||||
| (6,136 | ) | (6,136 | ) | |||||||||||||
| 31,295 | 31,295 | |||||||||||||||
| $ | 111,559 | |||||||||||||||
| (37,042) | ||||||||||||||||
| 11,400 | (228 | ) | ||||||||||||||
| (502,167 | ) | 10,065 | ||||||||||||||
| (91,300 | ) | 1,830 | ||||||||||||||
| (33,520 | ) | 672 | ||||||||||||||
| $ | 922,963 | 5,182,710 | $ | (103,878 | ) | $ | (1,290 | ) | ||||||||
29
| Notes to Consolidated Financial Statements |
||
|
|
||
| Years ended December 31, 2009, 2008 and 2007 |
1.
Summary of Significant Accounting Policies
Principles of Consolidation and Basis of Presentation The consolidated financial statements include the accounts of Sensient Technologies Corporation and its subsidiaries (the “Company”). All significant intercompany accounts and transactions are eliminated.
Sensient Technologies Corporation is a leading global manufacturer and marketer of colors, flavors and fragrances. The Company uses advanced technologies at facilities around the world to develop specialty food and beverage systems, cosmetic and pharmaceutical systems, inkjet and specialty inks and colors and other specialty chemicals. The Company’s reportable segments consist of the Flavors & Fragrances and Color Groups, which are managed on a products and services basis. The Asia Pacific and China Groups, which are managed on a geographic basis, are included in Corporate and Other.
Use of Estimates The preparation of the consolidated financial statements in conformity with accounting principles generally accepted in the United States of America requires management to make estimates and assumptions that affect reported amounts of assets, liabilities, revenue and expenses during the reporting period and the disclosure of contingent assets and liabilities at the date of the financial statements. Actual results could differ from those estimates.
Revenue Recognition The Company recognizes revenue (net of estimated discounts, allowances and returns) when title of goods passes, the customer is obligated to pay the Company and the Company has no remaining obligations. Such recognition typically corresponds with the shipment of goods.
Cost of Products Sold Cost of products sold includes materials, labor and overhead expenses incurred in the manufacture of our products. Cost of products sold also includes charges for obsolete and slow moving inventories, as well as costs for quality control, purchasing and receiving costs, inspection costs, warehousing costs, internal transfer costs, other costs of our internal distribution network and costs incurred for shipping and handling. The Company records fees billed to customers for shipping and handling as revenue.
Selling and Administrative Expenses Selling and administrative expenses primarily include the salaries and related costs for executive, finance, accounting, human resources, information technology, research and development and legal personnel as well as salaries and related costs of salespersons and commissions paid to external sales agents.
Cash Equivalents The Company considers all highly liquid investments with maturities of three months or less at the date of acquisition as cash equivalents.
Accounts Receivable Receivables are recorded at their face amount, less an allowance for doubtful accounts. The allowance for doubtful accounts is based on customer-specific analysis and general matters such as current assessments of past due balances and economic conditions. Specific accounts are written off against the allowance for doubtful accounts when it is deemed that the receivable is no longer collectible.
Inventories Inventories are stated at the lower of cost or market. Market is determined on the basis of estimated realizable values. Cost is determined using the first-in, first-out (“FIFO”) method with the exception of certain locations of the Flavors & Fragrances Group where cost is determined using a weighted average method. Inventories include finished and in-process products totaling $275.5 million and $269.8 million at December 31, 2009 and 2008, respectively, and raw materials and supplies of $114.5 million and $111.4 million at December 31, 2009 and 2008, respectively.
Property, Plant and Equipment Property, plant and equipment are recorded at cost reduced by accumulated depreciation. Depreciation is provided over the estimated useful life of the related asset using the straight-line method for financial reporting. The estimated useful lives for buildings range from 5 to 40 years. Machinery and equipment have useful lives ranging from 3 to 20 years. Interest costs on significant projects constructed or developed for the Company’s own use are capitalized as part of the asset.
Goodwill and Other Intangible Assets The carrying value of goodwill and other intangible assets with indefinite lives is evaluated for impairment on an annual basis or when an indicator of impairment occurs. The impairment assessment includes comparing the carrying amount of net assets, including goodwill, of each reporting unit to their respective fair value as of the date of the assessment. Fair value was estimated based upon an evaluation of the reporting unit’s estimated future discounted cash flow as well as the public trading and private transaction valuation multiples for comparable companies. Such determination of fair value yielded no impairment in 2009, 2008 or 2007.
The cost of intangible assets with determinable useful lives is amortized on a straight-line basis to reflect the pattern of economic benefits consumed, ranging from 5 to 20 years. These assets include technological know-how, customer relationships, patents, trademarks and non-compete agreements, among others.
30
|
|
Sensient Technologies Corporation 2009 Annual Report | |
Impairment of Long-lived Assets The Company reviews long-lived assets for impairment whenever events or changes in business circumstances indicate that the carrying amount of the assets may not be fully recoverable. The Company performs undiscounted cash flow analyses to determine if potential impairment exists. If impairment is determined to exist, any related impairment loss is calculated based on the difference between fair value and carrying value.
Financial Instruments The Company may use derivative financial instruments for the purpose of hedging currency and interest rate exposures which exist as part of ongoing business operations. As a policy, the Company does not engage in speculative or leveraged transactions, nor does the Company hold or issue financial instruments for trading purposes.
Hedge effectiveness is determined by how closely the changes in the fair value of the hedging instrument offset the changes in the fair value or cash flows of the hedged item. Hedge accounting is permitted only if the hedging relationship is expected to be highly effective at the inception of the transaction and on an ongoing basis. Any ineffective portions are recognized in earnings immediately.
Interest Rate Hedging The Company is exposed to interest rate risk through its corporate borrowing activities. The objective of the Company’s interest rate risk management activities is to manage the levels of the Company’s fixed and floating interest rate exposure to be consistent with the Company’s preferred mix. The interest rate risk management program may include entering into interest rate swaps, which qualify as fair value hedges, when there is a desire to modify the Company’s exposure to interest rates. Gains or losses on fair value hedges are recognized in earnings, net of gains and losses on the fair value of the hedged instruments.
Cash Flow Hedges The primary objectives of the foreign exchange risk management activities are to understand and mitigate the impact of potential foreign exchange fluctuations on the Company’s financial results and its economic well-being. Generally, these risk management transactions involve the use of foreign currency derivatives to protect against exposure resulting from recorded accounts receivable and payable. The Company may utilize forward exchange contracts, generally with maturities of less than 12 months, which qualify as cash flow hedges. These foreign exchange contracts are intended to offset the effect of exchange rate fluctuations on recorded intercompany receivables and payables. Gains and losses on these instruments are deferred in accumulated other comprehensive (loss) income (“OCI”) until the underlying transaction is recognized in earnings.
The Company’s existing cash flow hedges are highly effective. As a result, any current impact on earnings due to cash flow hedge ineffectiveness is immaterial.
Net Investments Hedging The Company may enter into foreign-denominated debt to be used as a non-derivative instrument to hedge the Company’s net investment in foreign subsidiaries. The change in the carrying amount of the foreign-denominated debt on the Company’s books, attributable to changes in the spot foreign exchange rate, is a hedge of the net investment in its foreign subsidiaries. Changes in the fair value of debt designated as a net investment hedge are recorded in foreign currency translation in OCI.
Commodity Purchases The Company purchases certain commodities in the normal course of business which result in physical delivery of the goods and hence, are excluded from Accounting Standards Codification (“ASC”) 815, Derivatives and Hedging.
Translation of Foreign Currencies For all significant foreign operations, the functional currency is the local currency. Assets and liabilities of foreign operations are translated into U.S. dollars at current exchange rates. Revenue and expense accounts are translated into U.S. dollars at average exchange rates prevailing during the year. Adjustments resulting from the translation of foreign accounts into U.S. dollars are recorded in foreign currency translation in OCI. Transaction gains and losses that occur as a result of transactions denominated in non-functional currencies are included in earnings and were not significant during the three-year period ended December 31, 2009.
Share-Based Compensation Share-based compensation expense is recognized on a straight line basis over the vesting period of each award recipient. See Note 5, Share-Based Compensation, for additional information.
Income Taxes The Company recognizes a current tax liability or asset for the estimated taxes payable or refundable on tax returns for the current year and a deferred tax liability or asset for the estimated future tax effects attributable to temporary differences and carry-forwards. The measurement of current and deferred tax liabilities and assets is based on provisions of enacted tax law. Deferred tax assets are reduced, if necessary, by the amount of any tax benefits for which the utilization of the asset is not considered likely.
31
| Notes to Consolidated Financial Statements continued |
||
|
|
||
| Years ended December 31, 2009, 2008 and 2007 |
Earnings Per Share Basic earnings per share (“EPS”) of common stock is computed in accordance with ASC 260, Earning Per Share. The difference between basic and diluted EPS is the dilutive effect of stock options and nonvested stock. Diluted EPS assumes that non-vested stock has vested and all dilutive stock options, for which the average market price exceeds the exercise price (in-the-money), are exercised. Stock options for which the exercise price exceeds the average market price (out-of-the-money) have an anti-dilutive effect on EPS, and accordingly, are excluded from the calculation. Weighted-average common shares for the computation of EPS were:
| (in thousands) |
2009 | 2008 | 2007 | |||
| Basic weighted-average shares outstanding |
48,379 | 47,654 | 46,740 | |||
| Diluted weighted-average shares outstanding |
48,641 | 48,131 | 47,257 |
For the years 2009 and 2008, options for 0.2 million shares and 0.1 million shares, respectively, with weighted-average exercise prices of $24.11 and $26.52, respectively, were excluded from the diluted EPS calculation because their exercise prices were greater than the average market price of the common stock and their inclusion in the calculation would have been anti-dilutive. For 2007, no options were excluded from the diluted EPS calculation on that basis. All earnings per share amounts are presented on a diluted basis unless otherwise noted.
Accumulated Other Comprehensive (Loss) Income Accumulated OCI is comprised primarily of foreign currency translation, minimum pension liability and unrealized gains or losses on cash flow hedges. The components of OCI at December 31 were:
| (in thousands) |
2009 | 2008 | ||||||
| Foreign currency translation |
$ | 13,140 | $ | (17,969 | ) | |||
| Minimum pension liability (net of tax) |
(14,255 | ) | (8,305 | ) | ||||
| Unrealized losses on cash flow hedges (net of tax) |
(175 | ) | (14 | ) | ||||
| Accumulated other comprehensive loss |
$ | (1,290 | ) | $ | (26,288 | ) | ||
Research and Development Research and development costs are recorded in selling and administrative expenses in the year they are incurred. Research and development costs were $29.3 million, $28.3 million and $25.7 million during the years ended December 31, 2009, 2008 and 2007, respectively.
Advertising Advertising costs are recorded in selling and administrative expenses as they are incurred. Advertising costs were $1.0 million, $1.2 million and $1.6 million during the years ended December 31, 2009, 2008 and 2007, respectively.
Environmental Liabilities The Company records liabilities related to environmental remediation obligations when estimated future expenditures are probable and reasonably estimable. Such accruals are adjusted as further information becomes available or as circumstances change. Estimated future expenditures are discounted to their present value when the timing and amount of future cash flows are fixed and readily determinable. Recoveries of remediation costs from other parties, if any, are recognized as assets when their receipt is assured.
New Pronouncements On July 1, 2009, the Financial Accounting Standards Board (“FASB”) issued the Accounting Standards Codification (“ASC”) which became the single source of authoritative, nongovernmental U.S. generally accepted accounting principles (“GAAP”), superseding existing authoritative accounting literature. The issuance of the ASC only impacts the Company’s financial statement reference disclosures and does not change U.S. GAAP.
The Company adopted the additional disclosure requirements of ASC 815, Derivatives and Hedging, on January 1, 2009. See Note 4, Derivative Instruments and Hedging Activity, for additional information.
The Company adopted the disclosure requirements of ASC 855, Subsequent Events, on April 1, 2009. This codification topic provides disclosure requirements pertaining to events that occur after the balance sheet date, but before financial statements are issued or are available to be issued. The Company performed an evaluation of subsequent events through March 1, 2010, the date the financial statements were issued.
The Company adopted new guidance issued by the FASB pertaining to “the calculation of EPS for share-based payment awards with rights to dividends” as of January 1, 2009. This guidance considers unvested share based payments in which the holder receives nonforfeitable rights to dividends as participating securities which shall be included in the computation of earnings per share pursuant to the two-class method described in ASC 260, Earnings per Share. After evaluating the impact of this new guidance, the Company determined that its application did not have a material impact on its calculation of earnings per share. See Earnings per Share in this note, for additional information on the Company’s earnings per share calculation.
32
|
|
Sensient Technologies Corporation 2009 Annual Report | |
2.
Goodwill and Intangible Assets
At December 31, 2009 and 2008, the Company does not have any intangible assets other than goodwill that are not subject to amortization. The following table summarizes intangible assets with determinable useful lives by major category as of December 31, 2009 and 2008:
| (in thousands except weighted average amortization years) |
Weighted Average Amortization Years |
2009 | 2008 | |||||||||||||
| Cost | Accumulated Amortization |
Cost | Accumulated Amortization |
|||||||||||||
| Technological know-how |
20.0 | $ | 8,609 | $ | (3,744 | ) | $ | 8,467 | $ | (3,295 | ) | |||||
| Customer relationships |
20.0 | 7,185 | (2,690 | ) | 7,062 | (2,276 | ) | |||||||||
| Patents, trademarks, non-compete agreements and other |
17.5 | 8,841 | (4,580 | ) | 8,302 | (4,506 | ) | |||||||||
| Total finite-lived intangibles |
19.1 | $ | 24,635 | $ | (11,014 | ) | $ | 23,831 | $ | (10,077 | ) | |||||
Amortization of intangible assets was $1.3 million, $1.6 million and $1.5 million in 2009, 2008 and 2007, respectively. Estimated amortization expense each year for the five years subsequent to December 31, 2009 is $1.1 million in each year from 2010 through 2014. The changes in goodwill for the years ended December 31, 2009 and 2008, by reportable business segment, were as follows:
| (in thousands) |
Flavors & Fragrances |
Color | Corporate & Other |
Consolidated | ||||||||||||
| Balance as of December 31, 2007 |
$ | 147,949 | $ | 325,507 | $ | 3,155 | $ | 476,611 | ||||||||
| Currency translation impact |
(16,007 | ) | (20,726 | ) | 538 | (36,195 | ) | |||||||||
| Balance as of December 31, 2008 |
131,942 | 304,781 | 3,693 | 440,416 | ||||||||||||
| Currency translation impact |
7,149 | 8,472 | (42 | ) | 15,579 | |||||||||||
| Balance as of December 31, 2009 |
$ | 139,091 | $ | 313,253 | $ | 3,651 | $ | 455,995 | ||||||||
3.
Debt
Long-term debt consisted of the following unsecured obligations at December 31:
| (in thousands) |
2009 | 2008 | ||||
| 5.85% Euro-denominated senior notes due November 2013 |
$ | 27,689 | $ | 27,008 | ||
| 7.31% senior notes due November 2013 |
25,000 | 25,000 | ||||
| 5.78% Euro-denominated senior notes due November 2011 |
55,377 | 54,016 | ||||
| 7.17% senior notes due November 2011 |
30,000 | 30,000 | ||||
| Floating rate Euro-denominated senior notes due November 2011 |
27,689 | 27,008 | ||||
| 6.68% senior notes due through January 2011 |
4,286 | 6,429 | ||||
| 6.77% senior notes due through January 2010 |
15,000 | 15,000 | ||||
| 6.60% notes due through April 2009 |
— | 122,242 | ||||
| Floating Rate Term Loan due June 2012 |
99,750 | — | ||||
| Long-term revolving loan agreement |
98,912 | 129,982 | ||||
| Various other notes |
5,130 | 8,917 | ||||
| Deferred realized gains on interest rate swaps |
19 | 80 | ||||
| 388,852 | 445,682 | |||||
| Less current maturities |
— | — | ||||
| Total long-term debt |
$ | 388,852 | $ | 445,682 | ||
33
| Notes to Consolidated Financial Statements continued |
||
|
|
||
| Years ended December 31, 2009, 2008 and 2007 |
In October 2008, the Company entered into a $105 million senior unsecured term loan agreement (“Term Loan”) with a group of five banks. In March 2009, the Company borrowed the entire $105 million available and used the proceeds to repay amounts outstanding under the Company’s committed revolving credit facility. On April 1, 2009, the Company retired the entire portion of the Company’s public debt with proceeds from the Company’s revolving credit facility. The Term Loan matures on June 15, 2012, and the interest rate on the Term Loan is based on floating rates at the Company’s election of either (1) the higher of (a) the prime rate or (b) the federal funds rate plus 0.5% or (2) a Eurodollar base rate derived from LIBOR plus a margin (initially 225 basis points but subject to adjustment as the Company’s leverage ratio changes). The Company may prepay the Term Loan in whole or in part prior to the maturity date without any penalty.
In November 2009, the Company entered into an agreement to issue U.S. dollar denominated debt totaling $110 million through a private placement of notes with a group of four financial institutions. These notes will be issued in May 2010 and will have a fixed coupon rate of 4.91% with a final maturity date of May 2017. Proceeds from the sale of the notes will be used to repay existing indebtedness.
The Company has a $300 million multi-currency revolving credit facility with a group of seven banks. This credit facility matures in June 2012 and is unsecured. Interest rates on borrowings with three days notice are determined based upon LIBOR plus a margin subject to adjustment based on the Company’s debt to EBITDA ratio, as defined, or the rating accorded the Company’s senior debt by Standard & Poor’s and Moody’s, which-ever is more favorable to the Company. Without three days notice, interest is based on the higher of the prime rate or the federal funds rate plus 0.50%.
The Company’s floating rate long-term Euro-denominated notes had average coupon rates of 3.62% and 6.67% for the years ended December 31, 2009 and 2008, respectively. The borrowings under the Long-term revolving loan agreement had an average interest rate of 0.85% and 3.43% for the year ended December 31, 2009 and 2008, respectively. The borrowings under the Term Loan had an average interest rate of 2.57% for the year ended December 31, 2009.
The aggregate amounts of contractual maturities on long-term debt each year for the five years subsequent to December 31, 2009, are as follows: 2010, $31.0 million; 2011, $134.0 million; 2012, $167.5 million; 2013, $53.0 million; and 2014, $0.4 million.
The Company has approximately $31.0 million of long-term debt that matures in 2010. It is the Company’s intention to refinance these maturities under the long-term revolving loan agreement or the May 2010 private placement and, accordingly, that maturing debt has been classified as long-term debt in the Consolidated Balance Sheet.
Substantially all of the senior loan agreements contain restrictions concerning interest coverage, borrowings, investments and tangible net worth amounts. The Company is in compliance with all of these restrictions at December 31, 2009. The following table summarizes the Company’s most restrictive loan covenants calculated in accordance with the applicable agreements as of December 31, 2009:
| (dollars in thousands) |
Actual | Required | ||||||
| Debt to Capital (Maximum) |
31.9 | % | 60.0 | % | ||||
| Debt to EBITDA (Maximum) |
2.21 | 3.50 | ||||||
| Net Worth (Minimum) |
$ | 908,695 | $ | 641,078 | ||||
| Interest Coverage (Minimum) |
4.77 | 2.00 | ||||||
The Company’s short-term borrowings consisted of the following items at December 31:
| (in thousands) |
2009 | 2008 | ||||
| Direct borrowings under the revolving loan agreement |
$ | 25,000 | $ | 25,000 | ||
| Commercial paper |
— | 500 | ||||
| Uncommitted loans |
11,590 | 5,698 | ||||
| Loans of foreign subsidiaries |
2,591 | 3,015 | ||||
| Total |
$ | 39,181 | $ | 34,213 | ||
The weighted-average interest rates on short-term borrowings were 1.48% and 1.95% at December 31, 2009 and 2008, respectively.
The Company has $169.3 million available under the revolving credit facility and $25.6 million available under other lines of credit from several banks at December 31, 2009.
The Company has stand-by letters of credit outstanding of $5.9 million and $6.4 million as of December 31, 2009 and 2008, respectively.
4.
Derivative Instruments and Hedging Activity
The Company may use derivative instruments for the purpose of hedging currency, commodity and interest rate exposures, which exist as part of ongoing business operations. As a policy, the Company does not engage in speculative or leveraged transactions, nor does the Company hold or issue financial instruments for trading purposes. Hedge effectiveness is determined by how closely the changes in the fair value of the hedging instrument offset the changes in the fair value or cash flows of the hedged transaction. Hedge accounting, which generally results in the deferral of derivative gains and losses until such time as the underlying transaction is recognized in net earnings, is permitted only if the hedging relationship is expected to be highly effective at the inception of the transaction and on an ongoing basis. Any ineffective portions are recognized in earnings immediately.
34
|
|
Sensient Technologies Corporation 2009 Annual Report | |
The Company manages its exposure to foreign exchange risk by the use of forward exchange contracts and foreign currency denominated debt to reduce the effect of fluctuating foreign currencies on short-term foreign currency denominated intercompany transactions, non-functional currency raw material purchases, non-functional currency sales and other known foreign currency exposures. These derivatives may or may not be designated as hedges under ASC 815. These forward exchange contracts have maturities of less than twelve months. On January 1, 2009, the Company adopted the additional disclosure requirements of ASC 815, Derivatives and Hedging. There is no impact on the Company’s net earnings or financial position as a result of adopting this codification topic. The Company’s primary hedging activities and their accounting treatment are summarized below:
Forward Contracts Designated as Cash Flow Hedges The forward exchange contracts that have been designated as hedges are accounted for as cash flow hedges. The Company had $6.3 million and $134.8 million of forward exchange contracts, designated as hedges, outstanding as of December 31, 2009 and 2008, respectively. The fair value of these forward exchange contracts was a liability of $0.1 million and an asset of $1.5 million classified in Other liabilities and Other assets in the Company’s Consolidated Balance Sheets as of December 31, 2009 and 2008, respectively. The gains or losses on these instruments are deferred in OCI until the underlying transaction is recognized in net earnings. As of December 31, 2009, a loss of $0.2 million was deferred in OCI in the Company’s Consolidated Balance Sheet. For the periods ended December 31, 2009 and 2008, a gain of $1.1 million and a loss of $0.02 million, respectively, were reclassified into earnings in the Company’s Consolidated Statement of Earnings which offset the earnings impact of the related non-functional asset or liability that was hedged in the same period. Over the next twelve months, the Company expects to reclassify a loss of $0.2 million from OCI into net earnings.
Forward Contracts not Designated as Cash Flow Hedges The Company also utilizes forward exchange contracts that are not designated as cash flow hedges under ASC 815. These contracts are marked-to-market in net earnings immediately, at the same time as the non-functional asset or liability is marked-to-market in net earnings. The Company had $23.2 million and $23.1 million of forward exchange contracts, not designated as hedges, outstanding as of December 31, 2009 and 2008, respectively, and recognized losses of $0.6 million and $2.2 million in net earnings for the twelve month periods ended December 31, 2009, and 2008, respectively, which offset the earnings impact of the related non-functional asset or liability in the period. As of December 31, 2009 and 2008, the fair values of these forward contracts were a liability of $0.2 million and $0.4 million, respectively, which were classified in Other liabilities in the Company’s Consolidated Balance Sheets.
Net Investment Hedges The Company has certain debt denominated in Euros and Swiss Francs. These debt instruments have been designated as partial hedges of the Company’s Euro and Swiss Franc net asset positions.
Changes in the fair value of this debt attributable to changes in the spot foreign exchange rate are recorded in foreign currency translation in OCI. As of December 31, 2009 and 2008, the total value of the Company’s Euro and Swiss Franc debt was $141.7 million and $138.0 million, respectively. A loss of $3.6 million and a gain of $8.2 million has been recorded as foreign currency translation in OCI for the years ended December 31, 2009 and 2008, respectively.
Concentrations of Credit Risk Counterparties to forward exchange contracts consist of large international financial institutions. While these counterparties may expose the Company to potential losses due to the credit risk of non-performance, losses are not anticipated. Concentrations of credit risk with respect to trade accounts receivable are limited by the large number of customers, generally short payment terms and their dispersion across geographic areas.
5.
Share-Based Compensation
The Company has various stock plans under which employees and directors may be granted nonvested stock, non-qualified stock options or incentive stock options. Upon vesting, the stock options allow the participant to purchase common stock at 100% of the market price on the day the options were granted. Under the 2007 Restricted Stock Plan, up to 1.5 million shares of nonvested stock were available for employee awards. Under the 2002 Stock Option Plan, up to 2.4 million shares of common stock were available for employee awards, of which no more than 0.6 million shares may be nonvested stock. Although the Company still has options outstanding under the 1998 Stock Option Plan and the 1994 Stock Option Plan, no new awards may be granted under these plans. Under the amended 2002 Non-Employee Director Stock Plan, up to 0.09 million shares of common stock were available for director awards of nonvested stock.
As of December 31, 2009, there were 2.0 million shares available to be granted as future stock options and non-vested stock under existing stock plans. Of the shares available, 1.3 million may be awarded as nonvested stock. Stock options become exercisable over a three-year vesting period, or earlier upon retirement, and expire 10 years from the date of grant. Expense for stock options is recognized on a straight-line basis over three years from the date of grant or over the period from the date of grant until the participant is retirement-eligible, whichever is less. Treasury shares are issued for non-vested stock awards and for the exercise of stock options.
35
| Notes to Consolidated Financial Statements continued |
||
|
|
||
| Years ended December 31, 2009, 2008 and 2007 |
The Company estimated the fair value of stock options using the Black-Scholes option pricing model. The weighted-average fair value per share of options granted was $6.77 in 2008 and $5.81 in 2007. No options were granted in 2009. Significant assumptions used in estimating the fair value of awards granted are as follows:
| 2008 | 2007 | |||||
| Dividend yield |
2.3 | % | 2.7 | % | ||
| Volatility |
26.3 | % | 26.0 | % | ||
| Risk-free interest rate |
3.1 | % | 4.8 | % | ||
| Expected term (years) |
5.3 | 5.0 |
The Company’s stock plans also provide for the awarding of nonvested stock. Expense for shares of nonvested stock is recognized over five years from the date of grant or during the period from the date of grant until the participant attains age 65, whichever is less. During the period of restriction, the holder of nonvested stock has voting rights and is entitled to receive all dividends and other distributions paid with respect to the stock. The Company expenses awards for nonvested stock based on the fair value of the Company’s common stock at the date of the grant.
Total pre-tax share-based compensation recognized in the Consolidated Statements of Earnings was $3.9 million, $3.8 million and $4.7 million in 2009, 2008 and 2007, respectively. Tax related benefits of $0.5 million, $0.7 million and $0.5 million were also recognized in 2009, 2008 and 2007, respectively. Cash received from the exercise of stock options was $9.7 million, $16.0 million and $14.1 million for 2009, 2008 and 2007, respectively, and is reflected in cash flows from financing activities in the Consolidated Statements of Cash Flows.
ASC 718 requires the cash flows from the excess tax benefits the Company realizes on the exercise of stock options to be presented as cash flows from financing activities in the Consolidated Statements of Cash Flows. The excess tax benefits on the exercise of stock options for the years ended December 31, 2009, 2008 and 2007, presented as cash flows from financing activities, were not material. The following table summarizes the transactions involving the stock option plans:
| (in thousands except exercise price and life) |
Options | Weighted- Average Exercise Price |
Weighted- Average Remaining life (Years) |
Aggregate Intrinsic Value | |||||||
| Outstanding at December 31, 2006 |
2,849 | $ | 20.96 | 5.5 | $ | 10,380 | |||||
| Granted |
112 | 24.66 | |||||||||
| Exercised |
(677 | ) | 21.06 | ||||||||
| Cancelled |
(56 | ) | 21.76 | ||||||||
| Outstanding at December 31, 2007 |
2,228 | 21.10 | 5.3 | 16,008 | |||||||
| Granted |
14 | 30.07 | |||||||||
| Exercised |
(759 | ) | 21.09 | ||||||||
| Cancelled |
(33 | ) | 21.64 | ||||||||
| Outstanding at December 31, 2008 |
1,450 | 21.17 | 5.0 | 4,110 | |||||||
| Exercised |
(502 | ) | 19.34 | ||||||||
| Cancelled |
(38 | ) | 22.58 | ||||||||
| Outstanding at December 31, 2009 |
910 | $ | 22.13 | 4.4 | $ | 3,852 | |||||
| Exercisable at December 31, 2009 |
874 | $ | 21.96 | 4.2 | $ | 3,809 | |||||
The aggregate intrinsic values of stock options exercised during 2009, 2008 and 2007, were $2.5 million, $6.5 million and $4.2 million, respectively.
As of December 31, 2009, total remaining unearned compensation, net of expected forfeitures, related to unvested stock options was $0.1 million, which will be amortized over the weighted-average remaining service period of 0.9 years.
The following table summarizes information concerning outstanding and exercisable stock options at December 31, 2009:
| Range of Exercise Price | |||||||||
| (in thousands except life and exercise price) |
$18.00- 19.39 |
$19.40- 23.08 |
$23.09- 30.07 | ||||||
| Options outstanding |
174 | 318 | 418 | ||||||
| Weighted-average remaining contractual life, in years |
4.5 | 4.3 | 4.4 | ||||||
| Weighted-average exercise price |
$ | 18.58 | $ | 21.86 | $ | 23.80 | |||
| Options exercisable |
174 | 318 | 382 | ||||||
| Weighted-average exercise price |
$ | 18.58 | $ | 21.86 | $ | 23.58 | |||
The closing stock price of Sensient common stock at December 31, 2009, was $26.30.
The following table summarizes the nonvested stock activity:
| (in thousands except fair value) |
Shares | Grant Date Weighted- Average Fair Value |
Aggregate Intrinsic Value | ||||||
| Outstanding at December 31, 2006 |
551 | $ | 21.64 | $ | 13,564 | ||||
| Granted |
240 | 29.01 | |||||||
| Vested |
(309 | ) | 23.63 | ||||||
| Cancelled |
(31 | ) | 21.47 | ||||||
| Outstanding at December 31, 2007 |
451 | 24.22 | 12,764 | ||||||
| Granted |
266 | 23.02 | |||||||
| Vested |
(129 | ) | 21.33 | ||||||
| Cancelled |
(134 | ) | 23.93 | ||||||
| Outstanding at December 31, 2008 |
454 | 24.42 | 10,847 | ||||||
| Granted |
235 | 24.78 | |||||||
| Vested |
(131 | ) | 24.66 | ||||||
| Cancelled |
(134 | ) | 24.76 | ||||||
| Outstanding at December 31, 2009 |
424 | $ | 24.44 | $ | 11,142 | ||||
36
|
|
Sensient Technologies Corporation 2009 Annual Report | |
The total intrinsic values of shares vested during 2009, 2008 and 2007, was $3.3 million, $3.0 million and $8.0 million, respectively.
The fair value of the nonvested shares at the date of grant is amortized over the vesting period but not exceeding age 65 of the participant. As of December 31, 2009, total remaining unearned compensation, net of expected forfeitures, related to nonvested stock was $7.0 million, which will be amortized over the weighted-average remaining service period of 2.8 years.
6.
Retirement Plans
The Company provides benefits under defined contribution plans including a savings plan and an employee stock ownership plan (“ESOP”). The savings plan covers substantially all domestic salaried and certain non-union hourly employees and provides for matching contributions up to 4% of each employee’s salary. The ESOP covers substantially all domestic employees not covered by a defined benefit plan and provides for contributions based on a percentage of each employee’s compensation as determined by the Board of Directors. Total expense for the Company’s defined contribution plans was $3.8 million, $3.9 million and $3.6 million in 2009, 2008 and 2007, respectively.
Although the Company intends the defined contribution plans mentioned above to be the primary retirement benefit for most employees, the Company also has several defined benefit plans. The funded status of the defined benefit plans was as follows at December 31:
| (in thousands) |
2009 | 2008 | ||||||
| Benefit obligation at beginning of year |
$ | 42,478 | $ | 53,341 | ||||
| Service cost |
1,285 | 1,267 | ||||||
| Interest cost |
2,961 | 2,922 | ||||||
| Plan amendments |
2,728 | — | ||||||
| Foreign currency exchange rate changes |
1,826 | (3,902 | ) | |||||
| Benefits paid |
(2,268 | ) | (6,256 | ) | ||||
| Actuarial loss (gain) |
9,132 | (4,894 | ) | |||||
| Benefit obligation at end of year |
58,142 | 42,478 | ||||||
| Plan assets at beginning of year |
17,465 | 21,237 | ||||||
| Company contributions |
3,728 | 8,502 | ||||||
| Foreign currency exchange rate changes |
1,946 | (3,922 | ) | |||||
| Benefits paid |
(2,268 | ) | (6,256 | ) | ||||
| Actual gain (loss) on plan assets |
1,849 | (2,096 | ) | |||||
| Plan assets at end of year |
22,720 | 17,465 | ||||||
| Funded status |
$ | (35,422 | ) | $ | (25,013 | ) | ||
| Accumulated benefit obligation |
$ | 54,675 | $ | 40,594 | ||||
Amounts recognized in the Consolidated Balance Sheets at December 31:
| (in thousands) |
2009 | 2008 | ||||||
| Accrued employee and retiree benefits |
$ | (41,057 | ) | $ | (28,533 | ) | ||
| Prepaid expenses and other current assets |
5,635 | 3,520 | ||||||
| Net liability |
$ | (35,422 | ) | $ | (25,013 | ) | ||
Components of annual benefit cost:
| (in thousands) |
2009 | 2008 | 2007 | |||||||||
| Service cost |
$ | 1,285 | $ | 1,267 | $ | 1,564 | ||||||
| Interest cost |
2,961 | 2,922 | 2,851 | |||||||||
| Expected return on plan assets |
(1,103 | ) | (1,264 | ) | (1,120 | ) | ||||||
| Amortization of prior service cost |
1,824 | 1,950 | 1,950 | |||||||||
| Recognized actuarial loss |
166 | 175 | 216 | |||||||||
| Settlement expense |
— | 710 | — | |||||||||
| Defined benefit expense |
$ | 5,133 | $ | 5,760 | $ | 5,461 | ||||||
Weighted-average liability assumptions as of December 31:
| 2009 | 2008 | |||||
| Discount rate |
5.04 | % | 6.83 | % | ||
| Expected return on plan assets |
6.06 | % | 5.96 | % | ||
| Rate of compensation increase |
4.38 | % | 4.28 | % |
Weighted-average cost assumptions for the year ended December 31:
| 2009 | 2008 | |||||
| Discount rate |
6.83 | % | 6.00 | % | ||
| Expected return on plan assets |
5.96 | % | 5.98 | % | ||
| Rate of compensation increase |
4.28 | % | 4.28 | % |
The aggregate amounts of benefits expected to be paid from defined benefit plans in each of the next five years subsequent to December 31, 2009, which include employees’ expected future service are as follows: 2010, $2.4 million; 2011, $4.8 million; 2012, $23.1 million; 2013, $3.3 million; 2014, $3.0 million; and $11.7 million in total for the years 2015 through 2019.
The Company expects to contribute $4.4 million to defined benefit plans in 2010.
37
| Notes to Consolidated Financial Statements continued |
||
|
|
||
| Years ended December 31, 2009, 2008 and 2007 |
Amounts recognized in accumulated other comprehensive income were as follows:
| (in thousands) |
2009 | 2008 | ||||
| Prior service cost |
$ | 8,349 | $ | 7,421 | ||
| Unrecognized net actuarial loss |
14,250 | 5,713 | ||||
The estimated prior service cost and actuarial loss for the defined benefit plans that will be amortized from accumulated other comprehensive income into periodic benefit cost during 2010 are $3.0 million and $0.6 million, respectively.
7.
Income Taxes
The provision for income taxes was as follows:
| (in thousands) |
2009 | 2008 | 2007 | ||||||||
| Currently payable: |
|||||||||||
| Federal |
$ | 16,637 | $ | 10,467 | $ | 1,945 | |||||
| State |
2,711 | 1,902 | 1,087 | ||||||||
| Foreign |
21,161 | 22,734 | 21,044 | ||||||||
| 40,509 | 35,103 | 24,076 | |||||||||
| Deferred expense (benefit): |
|||||||||||
| Federal |
(2,287 | ) | 1,399 | 4,400 | |||||||
| State |
40 | (603 | ) | 47 | |||||||
| Foreign |
(1,648 | ) | 2,533 | 4,934 | |||||||
| (3,895 | ) | 3,329 | 9,381 | ||||||||
| Income taxes |
$ | 36,614 | $ | 38,432 | $ | 33,457 | |||||
The tax effects of temporary differences that give rise to significant portions of deferred tax assets and liabilities consisted of the following:
| (in thousands) |
2009 | 2008 | ||||||
| Deferred tax assets: |
||||||||
| Benefit plans |
$ | 12,080 | $ | 11,467 | ||||
| Liabilities and reserves |
10,505 | 5,635 | ||||||
| Foreign operating loss carryovers |
30,075 | 28,595 | ||||||
| Other |
16,569 | 17,262 | ||||||
| Gross deferred tax assets |
69,229 | 62,959 | ||||||
| Valuation allowance |
(25,682 | ) | (26,091 | ) | ||||
| Deferred tax assets |
43,547 | 36,868 | ||||||
| Deferred tax liabilities: |
||||||||
| Property, plant and equipment |
(21,934 | ) | (21,390 | ) | ||||
| Other assets |
(2,619 | ) | (2,936 | ) | ||||
| Other |
(18,779 | ) | (18,575 | ) | ||||
| Deferred tax liabilities |
(43,332 | ) | (42,901 | ) | ||||
| Net deferred tax assets (liabilities) |
$ | 215 | $ | (6,033 | ) | |||
At December 31, 2009, foreign operating loss carryovers were $108.9 million. Included in the foreign operating loss carryovers are losses of $16.5 million that expire through 2024 and $92.4 million that do not have an expiration date. At December 31, 2009, state operating loss carryovers were $119.3 million, all of which expire through 2024.
The effective tax rate differed from the statutory federal income tax rate of 35% as described below:
| 2009 | 2008 | 2007 | |||||||
| Taxes at statutory rate |
35.0 | % | 35.0 | % | 35.0 | % | |||
| State income taxes, net of federal income tax benefit |
1.6 | 1.1 | 0.7 | ||||||
| Tax credits |
(0.3 | ) | (0.2 | ) | (0.3 | ) | |||
| Taxes on foreign earnings |
(3.6 | ) | (3.2 | ) | (0.1 | ) | |||
| Resolution of prior years’ tax matters |
(2.1 | ) | (1.1 | ) | (5.3 | ) | |||
| Valuation allowance adjustments |
(0.4 | ) | (0.7 | ) | (0.9 | ) | |||
| Other, net |
(0.5 | ) | (1.2 | ) | 1.0 | ||||
| Effective tax rate |
29.7 | % | 29.7 | % | 30.1 | % | |||
Earnings before income taxes were as follows:
| (in thousands) |
2009 | 2008 | 2007 | ||||||
| United States |
$ | 46,467 | $ | 40,454 | $ | 22,470 | |||
| Foreign |
76,708 | 88,839 | 88,773 | ||||||
| Total |
$ | 123,175 | $ | 129,293 | $ | 111,243 | |||
Federal and state income taxes are provided on international subsidiary income distributed to or taxable in the U.S. during the year. At December 31, 2009, federal and state taxes have not been provided for approximately $266.1 million of unremitted earnings of the foreign subsidiaries that are considered to be invested indefinitely. Determination of the deferred tax liability on such earnings, if the Company chose to remit those earnings, is not practicable.
38
|
|
Sensient Technologies Corporation 2009 Annual Report | |
As a result of adopting the minimum recognition threshold requirements which a tax position is required to meet before being recognized in the financial statements, as detailed in ASC 740, Income Taxes, the Company recognized an increase in the liability for unrecognized tax benefits of approximately $2.3 million, which was accounted for as a reduction to the January 1, 2007, balance of retained earnings.
A reconciliation of the change in the liability for unrecognized tax benefits for 2009 and 2008 is as follows:
| (in thousands) |
2009 | 2008 | ||||||
| Balance at beginning of year |
$ | 9,481 | $ | 10,642 | ||||
| Increases for tax positions taken in the current year |
1,579 | 759 | ||||||
| Increases for tax positions taken in prior years |
4,037 | 1,199 | ||||||
| Decreases for tax positions taken in prior years |
(177 | ) | — | |||||
| Decreases related to settlements with tax authorities |
(1,786 | ) | (493 | ) | ||||
| Decreases as a result of lapse of the applicable statutes of limitations |
(1,477 | ) | (1,309 | ) | ||||
| Foreign currency exchange rate changes |
556 | (1,317 | ) | |||||
| Balance at the end of year |
$ | 12,213 | $ | 9,481 | ||||
The amount of the unrecognized tax benefits that would affect the effective tax rate, if recognized, was approximately $11.4 million. The Company recognizes interest and penalties related to the unrecognized tax benefits in income tax expense. Approximately $2.2 million of accrued interest and penalties is reported as an income tax liability at December 31, 2009. The liability for unrecognized tax benefits relates to multiple jurisdictions and is reported in Other liabilities on the Consolidated Balance Sheet at December 31, 2009.
The Company believes that it is reasonably possible that the total amount of liability for unrecognized tax benefits as of December 31, 2009, will decrease by approximately $1.3 million during 2010. The potential decrease relates to various tax matters for which the statute of limitations may expire or will be otherwise settled in 2010. The amount that is ultimately recognized in the financial statements will be dependent upon various factors including potential increases or decreases to unrecognized tax benefits as a result of examinations, settlements and other unanticipated items that may occur during the year. With limited exceptions, the Company is no longer subject to federal, state and local, or non-U.S. income tax examinations by tax authorities for years before 2004.
8.
Segment and Geographic Information
The accounting policies of the segments are the same as those described in the summary of significant accounting policies. The Company evaluates performance based on operating income of the respective business units before restructuring charges, interest expense and income taxes. Total revenue and operating income by business segment and geographic region include both sales to customers, as reported in the Company’s Consolidated Statements of Earnings, and intersegment sales, which are accounted for at prices which approximate market prices and are eliminated in consolidation. Corporate and Other revenue consists primarily of flavor, fragrances and color products sold by the Asia Pacific and China Groups.
Assets by business segment and geographic region are those assets used in the Company’s operations in each segment and geographic region. Segment assets reflect the allocation of goodwill to each segment. Corporate and Other assets consist primarily of property and investments.
39
| Notes to Consolidated Financial Statements continued |
||
|
|
||
| Years ended December 31, 2009, 2008 and 2007 |
Segment Information The Company’s operations, except for the Asia Pacific and China Groups, are managed on a products and services basis. The Company determines its operating segments based on information utilized by senior management to allocate resources and assess performance. The Company’s reportable segments consist of Flavors & Fragrances and Color. The Company’s Flavors & Fragrances segment produces flavor and fragrance products that impart a desired taste, texture, aroma or other characteristic to a broad range of consumer and other products. The Color segment produces natural and synthetic color systems for pharmaceuticals, foods and beverages; colors and formulations for cosmetics; and technical colors for industrial applications and digital imaging. Two additional segments, the Asia Pacific Group and the China Group, are included in the Corporate & Other column below.
| (in thousands) |
Flavors & Fragrances |
Colors | Corporate & Other |
Consolidated | |||||||||
| 2009 |
|||||||||||||
| Revenue from external customers |
$ | 755,525 | $ | 358,761 | $ | 87,126 | $ | 1,201,412 | |||||
| Intersegment revenue |
17,347 | 16,046 | 1,280 | 34,673 | |||||||||
| Total revenue |
772,872 | 374,807 | 88,406 | 1,236,085 | |||||||||
| Operating income (loss) |
124,482 | 58,685 | (36,204 | ) | 146,963 | ||||||||
| Interest expense |
— | — | 23,788 | 23,788 | |||||||||
| Earnings (loss) before income taxes |
124,482 | 58,685 | (59,992 | ) | 123,175 | ||||||||
| Assets |
800,156 | 651,446 | 140,089 | 1,591,691 | |||||||||
| Capital expenditures |
28,696 | 11,865 | 7,155 | 47,716 | |||||||||
| Depreciation and amortization |
24,155 | 13,098 | 4,930 | 42,183 | |||||||||
| 2008 |
|||||||||||||
| Revenue from external customers |
$ | 780,254 | $ | 388,089 | $ | 84,277 | $ | 1,252,620 | |||||
| Intersegment revenue |
20,496 | 14,275 | 1,663 | 36,434 | |||||||||
| Total revenue |
800,750 | 402,364 | 85,940 | 1,289,054 | |||||||||
| Operating income (loss) |
123,475 | 71,581 | (33,457 | ) | 161,599 | ||||||||
| Interest expense |
— | — | 32,306 | 32,306 | |||||||||
| Earnings (loss) before income taxes |
123,475 | 71,581 | (65,763 | ) | 129,293 | ||||||||
| Assets |
774,868 | 635,590 | 114,979 | 1,525,437 | |||||||||
| Capital expenditures |
33,097 | 14,193 | 6,390 | 53,680 | |||||||||
| Depreciation and amortization |
25,631 | 13,594 | 5,220 | 44,445 | |||||||||
| 2007 |
|||||||||||||
| Revenue from external customers |
$ | 741,989 | $ | 367,794 | $ | 74,995 | $ | 1,184,778 | |||||
| Intersegment revenue |
18,615 | 11,236 | 1,742 | 31,593 | |||||||||
| Total revenue |
760,604 | 379,030 | 76,737 | 1,216,371 | |||||||||
| Operating income (loss) |
114,775 | 66,565 | (33,970 | ) | 147,370 | ||||||||
| Interest expense |
— | — | 36,127 | 36,127 | |||||||||
| Earnings (loss) before income taxes |
114,775 | 66,565 | (70,097 | ) | 111,243 | ||||||||
| Assets |
790,955 | 653,731 | 119,496 | 1,564,182 | |||||||||
| Capital expenditures |
27,740 | 9,723 | 4,498 | 41,961 | |||||||||
| Depreciation and amortization |
26,174 | 13,044 | 5,094 | 44,312 | |||||||||
40
|
|
Sensient Technologies Corporation 2009 Annual Report | |
Geographic Information The Company has manufacturing facilities or sales offices in North America, South America, Europe, Asia, Australia and Africa.
| (in thousands) |
2009 | 2008 | 2007 | ||||||
| Revenue from external customers: |
|||||||||
| North America |
$ | 650,847 | $ | 674,777 | $ | 644,463 | |||
| Europe |
334,755 | 371,414 | 353,539 | ||||||
| Asia Pacific |
137,804 | 128,650 | 112,226 | ||||||
| Other |
78,006 | 77,779 | 74,550 | ||||||
| Consolidated |
$ | 1,201,412 | $ | 1,252,620 | $ | 1,184,778 | |||
| Long-lived assets: |
|||||||||
| North America |
$ | 407,758 | $ | 393,973 | $ | 410,292 | |||
| Europe |
493,263 | 478,161 | 521,085 | ||||||
| Asia Pacific |
31,605 | 25,047 | 22,287 | ||||||
| Other |
956 | 733 | 474 | ||||||
| Consolidated |
$ | 933,582 | $ | 897,914 | $ | 954,138 | |||
Sales in the United States, based on the final country of destination of the Company’s products, were $495.6 million, $507.3 million and $476.4 million in 2009, 2008 and 2007, respectively. No other country of destination exceeded 10% of consolidated sales. Total long-lived assets in the United States amounted to $311.9 million, $309.5 million and $312.1 million at December 31, 2009, 2008 and 2007, respectively.
9.
Fair Value Measurements
As of December 31, 2009 and 2008, the Company’s only assets and liabilities subject to ASC 820, Fair Value Measurements and Disclosures, are forward contracts and mutual fund investments. Both of these financial instruments were previously being recorded by the Company at fair value that meets the requirements as defined by ASC 820. Accordingly, there was no impact on the Company’s net earnings and financial position as a result of adopting this statement. The fair value of the forward contracts based on current pricing obtained for comparable derivative products (Level 2 inputs) at December 31, 2009 and 2008, was a liability of $0.3 million and an asset of $1.1 million, respectively. The fair value of the investments based on December 31, 2009 and 2008, market quotes (Level 1 inputs) was an asset of $13.5 million and $12.7 million, respectively.
The carrying values of the Company’s cash and cash equivalents, trade accounts receivable, accounts payable, accrued expenses and short term borrowings approximated fair values as of December 31, 2009 and 2008.
The fair value of the Company’s long-term debt, including current maturities, is estimated using discounted cash flows based on the Company’s current incremental borrowing rates for similar types of borrowing arrangements. The carrying value of the long-term debt at December 31, 2009 and 2008, was $388.9 million and $445.7 million, repectively. The fair value of the long-term debt at December 31, 2009 and 2008, was approximately $390.6 million and $427.3 million, respectively.
10.
Commitments and Contingencies
LEASES
The Company leases certain facilities and equipment under operating lease arrangements. Aggregate minimum rental commitments at December 31, 2009, for all noncancelable operating leases with an initial lease term greater than one year for the years ending December 31 were as follows: 2010, $7.0 million; 2011, $5.0 million; 2012, $3.3 million; 2013, $2.0 million; 2014, $1.4 million; and $4.1 million thereafter.
Rent expense totaled $10.7 million, $12.0 million and $11.6 million during the years ended December 31, 2009, 2008 and 2007, respectively.
ENVIRONMENTAL MATTERS
The Company is involved in various significant environmental matters, which are described below. The Company is also involved in other site closure and related environmental remediation and compliance activities at a manufacturing site related to a 2001 acquisition by the Company for which reserves for environmental matters were established as of the date of purchase.
41
| Notes to Consolidated Financial Statements continued |
||
|
|
||
| Years ended December 31, 2009, 2008 and 2007 |
Superfund Claim
In July 2004, the Environmental Protection Agency (“EPA”) notified the Company’s subsidiary Sensient Colors Inc. (“Sensient Colors”) that it may be a potentially responsible party (“PRP”) under the Comprehensive Environmental Response, Compensation and Liability Act (“CERCLA”) for activities at the General Color Company Superfund Site in Camden, New Jersey (the “Site”). The EPA requested reimbursement of $10.9 million in clean-up costs, plus interest. Sensient Colors advised the EPA that the Site had been expressly excluded from the Company’s 1988 stock purchase of H. Kohnstamm & Company, Inc. (now Sensient Colors). The selling shareholders had retained ownership of and liability for the Site, and some became owners of General Color Company, which continued to operate there until the mid-1990s. In a letter to the EPA in January 2005, the Company outlined legal challenges to the recoverability of certain costs and urged the EPA to pursue General Color Company and related parties. The EPA informed Sensient Colors that it was unwilling to discuss these legal challenges without prior conditions. In 2005, a private developer, Westfield Acres Urban Renewal Association II, LP, pursuant to an agreement with the EPA, began redevelopment efforts at the Site (construction of affordable housing) by demolishing buildings thereon. Thereafter, the EPA removed allegedly contaminated soil from the locations where the buildings once stood.
In March 2007, the United States filed a complaint in the U.S. District Court in New Jersey against Sensient Colors claiming “over $16 million” in response costs allegedly incurred and to be incurred by the EPA pursuant to CERCLA. Sensient Colors moved to dismiss the United States’ complaint, which motion was denied by the Court in October 2007. Sensient Colors timely filed its answer and affirmative defenses to the United States’ complaint, as well as a third-party complaint against current and former owners and/or operators of the Site. The United States moved to strike Sensient Colors’ affirmative defenses. In an August 12, 2008 Opinion and Order, following briefs and oral argument, the Court partly granted and partly denied the United States’ motion, effectively preserving most of Sensient Colors’ affirmative defenses, either as originally pled or with changes outlined by the Court. Sensient Colors promptly filed an amended pleading incorporating the revised affirmative defenses. On July 29, 2008, Sensient Colors filed a third-party complaint adding Kohnstamm Inc. (a Canadian affiliate of General Color Company) and its president Avtar Singh as defendants.
In late August 2008, in the course of reviewing documents produced by the EPA, Sensient Colors discovered an e-mail exchange between EPA officials that Sensient Colors believes supports many of the legal theories and affirmative defenses advanced by Sensient Colors in the litigation and undermines key United States cost recovery claims. By letter dated August 26, 2008, based on the above document and other evidence adduced in the case, Sensient Colors demanded that the United States dismiss its case with prejudice and reimburse Sensient Colors for attorneys’ fees and costs incurred. In response to the August 26, 2008 letter, the United States withdrew, without prejudice, its then-pending motion to limit the scope of review to EPA’s administrative record and told the Court that it would respond to Sensient’s letter by September 10, 2008. The United States then sought additional time for its review of Sensient Colors’ demand. In an October 3, 2008 Letter Order, the Court directed the United States to provide Sensient with notice of its decision with respect to the demand for dismissal by October 31, 2008. In a letter to Sensient Colors dated October 31, 2008, the United States declined to voluntarily dismiss the case but agreed, with certain conditions, not to oppose depositions of current and former EPA employees on the issues raised in Sensient Colors’ letter of August 26, 2008. The United States reserved its rights to seek limitations on discovery and to seek to limit review of EPA’s choice of response action to the administrative record.
Using the evidence that supports its demand for dismissal, Sensient Colors moved for leave to amend its responsive pleading to include a new affirmative defense, a counterclaim against the United States and the EPA, and third-party claims against certain EPA employees or agents. After briefing, the motion for leave to amend was argued before the magistrate judge on November 18, 2008. On February 13, 2009, the magistrate issued an opinion and order denying Sensient Colors’ motion for leave to amend. Sensient Colors appealed the magistrate’s decision to the district court judge. On July 22, 2009, the district court judge issued a decision affirming the magistrate’s opinion and order, largely on sovereign immunity grounds.
Sensient Colors also issued subpoenas or deposition notices to numerous current or former EPA officials. Motions were filed to block the depositions of former EPA Administrator Christine Todd Whitman, former EPA Regional Administrator Jane Kenny, and EPA On-Scene Coordinator David Rosoff. On January 28, 2009, the magistrate judge issued an opinion and order denying or delaying Sensient Color’s ability to conduct the foregoing depositions. Sensient Colors exercised its right to appeal the magistrate’s decision to the district court judge. On July 22, 2009, the district court judge issued a decision reversing the magistrate and ordering the depositions of Kenny and Rosoff to proceed.
On May 8, 2009, Sensient Colors filed a motion for summary judgment seeking dismissal with prejudice of the United States’ claims.
Prior to arguing the summary judgment motion and to scheduling the depositions of the current and former EPA officials, the United States and Sensient Colors agreed to meet with each other, with the parties involved in the Pleasant Gardens dispute described below and with interested insurers to determine if a resolution short of trial was possible. The parties met and ultimately agreed to a settlement in principle to resolve the matter by specified payments among the parties and their insurers. As a result of the proposed settlements, Sensient’s results for the quarter and year ended December 31, 2009 include pre-tax charges for estimated settlement liabilities and related legal costs, net of insurance reimbursements, of approximately $11.3 million. The proposed settlements remain subject to the preparation and execution of definitive agreements and approval of proposed consent decrees by the U.S. District Court in New Jersey and the Superior Court of New Jersey after an opportunity for public comment.
42
|
|
Sensient Technologies Corporation 2009 Annual Report | |
Pleasant Gardens Realty Corp. v. H. Kohnstamm & Co., et al.
The owner of Pleasant Gardens (“Property”), an apartment complex adjacent to the General Color Superfund Site, filed a complaint in New Jersey state court in November 2003 against H. Kohnstamm & Co. (now Sensient Colors), the Company, General Color Company, and unknown defendants. Plaintiff seeks to hold defendants liable, in an unspecified amount, for damages related to the alleged contamination of the Property. Plaintiff voluntarily dismissed the Company without prejudice. Sensient Colors filed an answer denying liability and asserting affirmative defenses. In November 2006, the Camden Redevelopment Agency (“Agency”) filed condemnation litigation against plaintiff (and other purported interested parties) to take the Property. Sensient Colors is not a party to the condemnation litigation. In advance of its filing, the Agency notified plaintiff that its appraiser had assessed the fair market value of the Property at $7.7 million and that its environmental consultant had estimated the costs for environmental cleanup, purportedly to meet requirements of the New Jersey Department of Environmental Protection (“DEP”), at $7.5 million. That amount has been held in escrow pending the outcome of the lawsuit. Sensient Colors and plaintiff have pursued a reduction in the scope and cost of the Agency’s proposed environmental cleanup in meetings with the DEP, the Agency and another party involved in the condemnation, the New Jersey Schools Construction Corporation (“NJSCC”). To the extent that there is a reduction in the condemnation value of the Property due to the Agency’s remediation of contamination for which Sensient Colors is allegedly responsible, such reduction may become a part of the damages claimed by plaintiff. In March 2007, plaintiff filed an amended complaint naming the Agency, the NJSCC and the DEP as additional defendants in furtherance of this effort. In April 2007, Sensient Colors filed its answer to the amended complaint, including cross claims against these newly added parties. The Agency, the DEP and the New Jersey Schools Development Authority (“NJSDA”) (which replaced the NJSCC as a state agency effective August 7, 2007) each filed answers, cross-claims and counter-claims; Sensient Colors has responded to all three cross-claims. Document discovery was completed in July 2008, and expert and rebuttal expert reports have been exchanged. Depositions are on-going.
Sensient Colors advised the Court and the other parties in this litigation of the developments in the Superfund Claim as described above. Sensient Colors took supplemental depositions of several DEP officials and served subpoenas upon five current or former EPA officials. The United States, though not a party to the Pleasant Gardens case, initially sought to quash those subpoenas before the Pleasant Gardens court. On November 17, 2008, the United States removed the subpoenas and related proceedings to federal court. At an initial court conference on the removed proceedings on February 19, 2009, the federal magistrate judge asked for additional briefing on the issue of the government’s standing to seek to quash the state court subpoenas. In September 2009, the federal magistrate judge ordered that former EPA officials could be deposed but only as to “individual” and not “official” matters. Sensient Colors is appealing this decision to the district court judge.
On January 8, 2009, the state court judge recused himself from the Pleasant Gardens case (as well as the related insurance coverage case) because of a conflict of interest and the Pleasant Gardens case was reassigned to another judge. In light of the recusal and reassignment, the new judge re-scheduled the trial to commence no earlier than June 1, 2009, and indicated that depending on how certain outstanding discovery issues are resolved, the trial may be deferred further. On April 20, 2009, the court further extended the pretrial schedule and set a trial date for October 5, 2009. On July 24, 2009, Sensient Colors filed a motion for summary judgment on the grounds that the DEP’s proposed remedy was arbitrary and capricious.
43
| Notes to Consolidated Financial Statements continued |
||
|
|
||
| Years ended December 31, 2009, 2008 and 2007 |
At a conference held on September 18, 2009, the state court judge ordered that discovery be completed before November 15, 2009, that dispositive motions be heard on December 11, 2009, and that the trial commence on February 8, 2010. The judge also ordered that mediation occur before November 15, 2009.
As described above, Sensient Colors met with the parties to the Pleasant Gardens litigation, to the Superfund claims described above and their respective insurers, and they ultimately agreed to a settlement in principle to resolve the matter by specified payments among the parties and their insurers. As a result of the proposed settlements, Sensient’s results for the quarter and year ended December 31, 2009, include pre-tax charges for estimated settlement liabilities and related legal costs, net of insurance reimbursements, of approximately $11.3 million. The proposed settlements remain subject to the preparation and execution of definitive agreements and approval of proposed consent decrees by the U.S. District Court in New Jersey and the Superior Court of New Jersey after an opportunity for public comment.
As of December 31, 2009, the liabilities related to environmental matters are estimated to be between $20.4 million and $22.0 million. As of December 31, 2009, the Company has accrued $20.8 million, which primarily relates to the settlement of legal claims related to the Superfund and Pleasant Gardens claims discussed above. The Company has recorded a receivable of $11.1 million for agreed upon insurance recoveries related to these liabilities. This accrual and receivable represents management’s best estimate of these items; however, the actual amounts may be different than the levels reserved or estimated, in which case the Company would need to recognize the difference in earnings in later periods. There can be no assurance that additional environmental matters will not arise in the future.
Commercial Litigation
On October 13, 2009, J. Lohr Vineyards and Wines (“Lohr”) filed suit against the Company and its subsidiary, Sensient Dehydrated Flavors LLC (“Sensient Flavors”) in the state court in Monterey, California. The complaint sought to permanently enjoin the Company and Sensient Flavors from processing onions at its Greenfield, California dehydration facility based on a limitation in Sensient Flavors’ 1972 use permit to the processing of “peppers, celery and parsley”, and based on Lohr’s claim that Sensient Flavors’ onion processing has been damaging Lohr’s grapes and wine. Lohr’s complaint, in addition to seeking injunctive relief, sets out claims for “nuisance”, “trespass”, interference with prospective business advantage, and “negligence per se”. Lohr sought damages of “over $1.6 million” for alleged losses due to an “onion taint” to its grapes, wine and vineyards, as well as punitive and other damages. On October 14, the court denied a temporary restraining order requested by Lohr against the Company and Sensient Flavors. On October 27, the court issued a preliminary injunction enjoining the Company and Sensient Flavors from processing any vegetables not expressly authorized in the 1972 use permit issued by the County to Sensient Flavors or any amendments thereto. Sensient Flavors filed an application with the Planning Department seeking an amendment to its use permit confirming its right to process onions at its Greenfield facility, but later concluded that the likely delays, expenses and regulatory uncertainties involved in pursuing the amendment to the use permit made the permit amendment not worth pursuing. Accordingly, Sensient Flavors decided not to seek to resume onion processing at its Greenfield facility and instead is pursuing arrangements for the processing of these onions at other facilities. Sensient’s production of dehydrated onion at the Greenfield facility in 2009 represented less than 10% of its total onion production in California. On December 9, 2009, the Company and Sensient Flavors reached a settlement agreement with Lohr under which the Company and Sensient Flavors undertook not to process products at the Greenfield facility other than as authorized under the existing 1972 permit, and Lohr agreed to drop its claims and dismiss its suit with prejudice, which it has done.
The Company is involved in various other claims and litigation arising in the normal course of business. In the judgment of management, which relies in part on information from Company counsel, the ultimate resolution of these actions will not materially affect the consolidated financial statements of the Company except as described above.
44
| Management’s Report on Internal Control |
||
|
|
||
| Over Financial Reporting |
The management of Sensient Technologies Corporation is responsible for establishing and maintaining adequate internal control over financial reporting. It is management’s policy to maintain a control-conscious environment through an effective system of internal accounting controls. These controls are supported by the careful selection of competent and knowledgeable personnel and by the communication of standard accounting and reporting policies and procedures throughout the Company. These controls are designed to provide reasonable assurance regarding the reliability of financial reporting and the preparation of financial statements for external purposes in accordance with generally accepted accounting principles.
Management has assessed the effectiveness of the Company’s internal control over financial reporting as of December 31, 2009. In making its assessment of internal control over financial reporting, management used the criteria set forth by the Committee of Sponsoring Organizations of the Treadway Commission in Internal Control – Integrated Framework. Based on that assessment, management has concluded that the Company’s internal control over financial reporting was effective as of December 31, 2009.
The Company’s independent registered public accounting firm has issued their report on the Company’s internal control over financial reporting. This report appears on page 46.
| Report of Independent Registered
|
| Public Accounting Firm
|
To the Board of Directors and Shareholders of
Sensient Technologies Corporation
Milwaukee, Wisconsin
We have audited the accompanying consolidated balance sheets of Sensient Technologies Corporation and subsidiaries as of December 31, 2009 and 2008, and the related consolidated statements of earnings, shareholders’ equity, and cash flows for each of the three years in the period ended December 31, 2009. These financial statements are the responsibility of the Company’s management. Our responsibility is to express an opinion on these financial statements based on our audits.
We conducted our audits in accordance with the standards of the Public Company Accounting Oversight Board (United States). Those standards require that we plan and perform the audit to obtain reasonable assurance about whether the financial statements are free of material misstatement. An audit includes examining, on a test basis, evidence supporting the amounts and disclosures in the financial statements. An audit also includes assessing the accounting principles used and significant estimates made by management, as well as evaluating the overall financial statement presentation. We believe that our audits provide a reasonable basis for our opinion.
In our opinion, the financial statements referred to above present fairly, in all material respects, the consolidated financial position of Sensient Technologies Corporation and subsidiaries at December 31, 2009 and 2008, and the consolidated results of their operations and their cash flows for each of the three years in the period ended December 31, 2009, in conformity with U.S. generally accepted accounting principles.
We also have audited, in accordance with the standards of the Public Company Accounting Oversight Board (United States), Sensient Technologies Corporation’s internal control over financial reporting as of December 31, 2009, based on criteria established in Internal Control-Integrated Framework issued by the Committee of Sponsoring Organizations of the Treadway Commission and our report dated March 1, 2010 expressed an unqualified opinion thereon.
Milwaukee, Wisconsin
March 1, 2010
45
| Report of Independent Registered Public Accounting Firm
|
|
on Internal Control Over Financial Reporting |
To the Board of Directors and Shareholders of
Sensient Technologies Corporation
Milwaukee, Wisconsin
We have audited Sensient Technologies Corporation’s internal control over financial reporting as of December 31, 2009, based on criteria established in Internal Control-Integrated Framework issued by the Committee of Sponsoring Organizations of the Treadway Commission (the COSO criteria). Sensient Technologies Corporation’s management is responsible for maintaining effective internal control over financial reporting, and for its assessment of the effectiveness of internal control over financial reporting included in the accompanying Management’s Report on Internal Control Over Financial Reporting. Our responsibility is to express an opinion on the Company’s internal control over financial reporting based on our audit.
We conducted our audit in accordance with the standards of the Public Company Accounting Oversight Board (United States). Those standards require that we plan and perform the audit to obtain reasonable assurance about whether effective internal control over financial reporting was maintained in all material respects. Our audit included obtaining an understanding of internal control over financial reporting, assessing the risk that a material weakness exists, testing and evaluating the design and operating effectiveness of internal control based on the assessed risk, and performing such other procedures as we considered necessary in the circumstances. We believe that our audit provides a reasonable basis for our opinion.
A company’s internal control over financial reporting is a process designed to provide reasonable assurance regarding the reliability of financial reporting and the preparation of financial statements for external purposes in accordance with generally accepted accounting principles. A company’s internal control over financial reporting includes those policies and procedures that (1) pertain to the maintenance of records that, in reasonable detail, accurately and fairly reflect the transactions and dispositions of the assets of the company; (2) provide reasonable assurance that transactions are recorded as necessary to permit preparation of financial statements in accordance with generally accepted accounting principles, and that receipts and expenditures of the company are being made only in accordance with authorizations of management and directors of the company; and (3) provide reasonable assurance regarding prevention or timely detection of unauthorized acquisition, use, or disposition of the company’s assets that could have a material effect on the financial statements.
Because of its inherent limitations, internal control over financial reporting may not prevent or detect misstatements. Also, projections of any evaluation of effectiveness to future periods are subject to the risk that controls may become inadequate because of changes in conditions, or that the degree of compliance with the policies or procedures may deteriorate.
In our opinion, Sensient Technologies Corporation maintained, in all material respects, effective internal control over financial reporting as of December 31, 2009, based on the COSO criteria.
We also have audited, in accordance with the standards of the Public Company Accounting Oversight Board (United States), the consolidated balance sheets of Sensient Technologies Corporation as of December 31, 2009 and 2008, and the related consolidated statements of earnings, shareholders’ equity, and cash flows for each of the three years in the period ended December 31, 2009 and our report dated March 1, 2010 expressed an unqualified opinion thereon.
Milwaukee, Wisconsin
March 1, 2010
46
|
|
Sensient Technologies Corporation 2009 Annual Report | |
| Quarterly Data | Gross Profit |
Net Earnings |
Net Earnings Per Share | ||||||||||||
| (in thousands except per share amounts) (unaudited) |
Revenue | Basic | Diluted | ||||||||||||
| 2009 |
|||||||||||||||
| First Quarter |
$ | 282,824 | $ | 86,530 | $ | 21,607 | $ | 0.45 | $ | 0.45 | |||||
| Second Quarter |
303,959 | 94,690 | 25,819 | 0.53 | 0.53 | ||||||||||
| Third Quarter |
303,179 | 93,076 | 22,829 | 0.47 | 0.47 | ||||||||||
| Fourth Quarter |
311,450 | 94,734 | 16,306 | 0.34 | 0.33 | ||||||||||
| 2008 |
|||||||||||||||
| First Quarter |
$ | 307,419 | $ | 95,642 | $ | 20,677 | $ | 0.44 | $ | 0.43 | |||||
| Second Quarter |
332,795 | 101,722 | 25,460 | 0.54 | 0.53 | ||||||||||
| Third Quarter |
318,601 | 95,896 | 24,102 | 0.50 | 0.50 | ||||||||||
| Fourth Quarter |
293,805 | 87,606 | 20,622 | 0.43 | 0.43 | ||||||||||
| Market Price | Dividends Per Share | ||||||||
| Common Stock Prices and Dividends |
High | Low | |||||||
| 2009 |
|||||||||
| First Quarter |
$ | 24.95 | $ | 18.42 | $ | 0.19 | |||
| Second Quarter |
25.40 | 22.08 | 0.19 | ||||||
| Third Quarter |
28.62 | 21.89 | 0.19 | ||||||
| Fourth Quarter |
29.07 | 24.62 | 0.19 | ||||||
| 2008 |
|||||||||
| First Quarter |
$ | 30.27 | $ | 24.99 | $ | 0.18 | |||
| Second Quarter |
33.12 | 27.76 | 0.18 | ||||||
| Third Quarter |
32.26 | 26.95 | 0.19 | ||||||
| Fourth Quarter |
28.55 | 21.05 | 0.19 | ||||||
Company Stock Performance
| This graph compares the cumulative total shareholder return for the Company’s common stock over the last five years to the total returns on the Standard & Poor’s Midcap Specialty Chemicals Index (the “S&P Midcap Specialty Chemicals Index”), the Standard & Poor’s Midcap Food Products Index (the “S&P Food Products Index”) and the Standard & Poor’s 500 Stock Index (the “S&P 500 Index”). The graph assumes a $100 investment made on December 31, 2004 and reinvestment of dividends. The stock performance shown on the graph is not necessarily indicative of future price performance. |
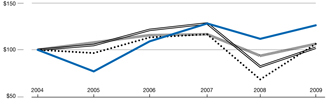
| |||||||||||

47
Five Year Review
| (in thousands except employee and per share data) Years ended December 31, |
2009 | ||||||
| Summary of Operations |
|||||||
| Revenue |
$ | 1,201,412 | 100.0 | % | |||
| Cost of products sold |
832,382 | 69.3 | % | ||||
| Selling and administrative expenses |
222,067 | 18.5 | % | ||||
| Restructuring and other charges |
— | ||||||
| Operating income |
146,963 | 12.2 | % | ||||
| Interest expense |
23,788 | 2.0 | % | ||||
| Earnings before income taxes |
123,175 | 10.3 | % | ||||
| Income taxes |
36,614 | 3.0 | % | ||||
| Net earnings |
$ | 86,561 | 7.2 | % | |||
| Earnings per share: |
|||||||
| Basic |
$ | 1.79 | |||||
| Diluted |
$ | 1.78 | |||||
| Other Related Data |
|||||||
| Dividends per share, declared and paid |
$ | 0.76 | |||||
| Average common shares outstanding: |
|||||||
| Basic |
48,379 | ||||||
| Diluted |
48,641 | ||||||
| Book value per common share |
$ | 18.49 | |||||
| Price range per common share |
18.42-29.07 | ||||||
| Share price at December 31 |
26.30 | ||||||
| Capital expenditures |
47,716 | ||||||
| Depreciation |
40,881 | ||||||
| Amortization |
1,302 | ||||||
| Total assets |
1,591,691 | ||||||
| Long-term debt |
388,852 | ||||||
| Total debt |
428,033 | ||||||
| Shareholders’ equity |
908,695 | ||||||
| Return on average shareholders’ equity |
10.0 | % | |||||
| Total debt to total capital |
32.0 | % | |||||
| Employees |
3,570 | ||||||
The 2009 results include charges for the proposed settlement of environmental claims and related legal expenses, net of insurance reimbursements, of $11.3 million ($6.9 million after-tax, or $0.14 per share).
The 2005 results include restructuring and other charges of $12.8 million ($9.8 million after tax, or $0.21 per share) related to a cost reduction program and an impairment charge. The charges were recorded in cost of products sold ($4.3 million) and in restructuring and other charges ($8.5 million).
48
|
|
Sensient Technologies Corporation 2009 Annual Report | |
| 2008 | 2007 | 2006 | 2005 | |||||||||||||||||||||||
| $ | 1,252,620 | 100.0 | % | $ | 1,184,778 | 100.0 | % | $ | 1,098,774 | 100.0 | % | $ | 1,023,930 | 100.0 | % | |||||||||||
| 871,754 | 69.6 | 822,479 | 69.5 | 766,506 | 69.7 | 731,253 | 71.4 | |||||||||||||||||||
| 219,267 | 17.5 | 214,929 | 18.1 | 202,991 | 18.5 | 189,998 | 18.6 | |||||||||||||||||||
| — | — | — | — | — | — | 8,465 | 0.8 | |||||||||||||||||||
| 161,599 | 12.9 | 147,370 | 12.4 | 129,277 | 11.8 | 94,214 | 9.2 | |||||||||||||||||||
| 32,306 | 2.6 | 36,127 | 3.0 | 35,748 | 3.3 | 35,737 | 3.5 | |||||||||||||||||||
| 129,293 | 10.3 | 111,243 | 9.4 | 93,529 | 8.5 | 58,477 | 5.7 | |||||||||||||||||||
| 38,432 | 3.1 | 33,457 | 2.8 | 27,104 | 2.5 | 14,282 | 1.4 | |||||||||||||||||||
| $ | 90,861 | 7.3 | % | $ | 77,786 | 6.6 | % | $ | 66,425 | 6.0 | % | $ | 44,195 | 4.3 | % | |||||||||||
| $ | 1.91 | $ | 1.66 | $ | 1.45 | $ | 0.95 | |||||||||||||||||||
| $ | 1.89 | $ | 1.65 | $ | 1.44 | $ | 0.94 | |||||||||||||||||||
| $ | 0.74 | $ | 0.68 | $ | 0.61 | $ | 0.60 | |||||||||||||||||||
| 47,654 | 46,740 | 45,900 | 46,746 | |||||||||||||||||||||||
| 48,131 | 47,257 | 46,204 | 47,067 | |||||||||||||||||||||||
| $ | 16.87 | $ | 17.10 | $ | 15.12 | $ | 13.43 | |||||||||||||||||||
| 21.05-33.12 | 23.66-31.99 | 16.92-25.33 | 16.82-23.97 | |||||||||||||||||||||||
| 23.88 | 28.28 | 24.60 | 17.90 | |||||||||||||||||||||||
| 53,680 | 41,961 | 39,314 | 36,102 | |||||||||||||||||||||||
| 42,798 | 42,849 | 41,658 | 43,502 | |||||||||||||||||||||||
| 1,647 | 1,463 | 1,386 | 1,357 | |||||||||||||||||||||||
| 1,525,437 | 1,564,182 | 1,454,067 | 1,398,273 | |||||||||||||||||||||||
| 445,682 | 449,621 | 441,306 | 283,123 | |||||||||||||||||||||||
| 479,895 | 507,108 | 532,532 | 553,682 | |||||||||||||||||||||||
| 818,596 | 814,421 | 704,104 | 622,228 | |||||||||||||||||||||||
| 10.7 | % | 10.2 | % | 9.9 | % | 6.8 | % | |||||||||||||||||||
| 37.0 | % | 38.4 | % | 43.1 | % | 47.1 | % | |||||||||||||||||||
| 3,613 | 3,623 | 3,582 | 3,518 | |||||||||||||||||||||||
49
| Directors and Officers
|
| Board of Directors | Elected Officers | |||
| Kenneth P. Manning, 68 |
Kenneth P. Manning, 68 | |||
| Chairman and Chief Executive Officer | Chairman and Chief Executive Officer | |||
| Sensient Technologies Corporation | With the Company 22 years | |||
| Elected Director in 1989 (2, 6) |
John F. Collopy, 40 |
|||
| Hank Brown, 70 |
Vice President and Treasurer | |||
| President Emeritus | With the Company 10 years | |||
| University of Colorado Elected Director in 2004 (1, 4, 5) |
Neil G. Cracknell, 48 |
|||
|
Fergus M. Clydesdale, Ph.D., 73 |
President and Chief Operating Officer With the Company 15 years |
|||
| Distinguished Professor, Department of Food Science, and Director of the Food Science Policy Alliance at the University of Massachusetts – Amherst Elected Director in 1998 (2, 3, 4, 6) |
John L. Hammond, 63 Senior Vice President, General Counsel and Secretary With the Company 12 years | |||
|
James A.D. Croft, 72 |
Gordon E. Hering, Ph.D., 53 |
|||
| Chairman Bartlodge Limited Elected Director in 1997 (1, 2, 3, 6) |
Vice President, Marketing & Technology With the Company 15 years |
|||
|
William V. Hickey, 65 |
Richard F. Hobbs, 62 |
|||
| President and Chief Executive Officer Sealed Air Corporation |
Senior Vice President and Chief Financial Officer With the Company 36 years |
|||
| Elected Director in 1997 (1, 2, 4, 5) |
Richard J. Malin, 43 |
|||
| Peter M. Salmon, 60 President |
Assistant Controller With the Company 18 years |
|||
| International Food Network, Inc. Elected Director in 2005 (5, 6) |
Douglas S. Pepper, 57 |
|||
|
Elaine R. Wedral, Ph.D., 65 Retired, Former President Nestle’s Research and Development |
Vice President, Administration With the Company 4 years
Stephen J. Rolfs, 45 |
|||
| Worldwide Food Service Systems | Vice President, Controller and | |||
| Elected Director in 2006 (5, 6) | Chief Accounting Officer | |||
| With the Company 12 years | ||||
| Essie Whitelaw, 62 Retired, Former Senior Vice President, Operations |
Robert J . Wilkins, 53 |
|||
| Wisconsin Physician Services | President, Asia Pacific Group | |||
| Elected Director in 1993 (3, 4) | With the Company 6 years | |||
|
Appointed Officers |
||||
|
Committees
1 Audit Committee
2 Executive Committee
3 Compensation and Development Committee
4 Nominating and Corporate Governance Committee
5 Finance Committee
6 Scientific Advisory Committee |
Douglas L. Arnold, 46 Vice President, Administrative Services With the Company 12 years
Christopher M. Daniels, 36 Assistant Treasurer With the Company 10 years |
|||
|
Patrick E. Laubacher, 52 President, Dehydrated Flavors |
||||
| With the Company 29 years | ||||
|
Jeffrey T. Makal, 46 |
||||
| Vice President, Taxation With the Company 13 years |
||||
|
James P. McCarthy, 57 |
||||
| President, Flavors & Fragrances Group | ||||
| With the Company 1 year | ||||
|
Robert L. Menzl, 53 |
||||
| Vice President, Information Technology | ||||
| With the Company 14 years | ||||
|
Edward E. Savard, 44 Vice President, Engineering With the Company 16 years |
||||
50
| Investor Information
|
World Headquarters
777 East Wisconsin Avenue
Milwaukee, Wisconsin 53202-5304
(414) 271-6755
(800) 558-9892
Fax: (414) 347-4795
E-mail: corporate.communications@sensient-tech.com
Web site: www.sensient-tech.com
Transfer Agent and Registrar
Wells Fargo Bank Minnesota, N.A.
Shareowner Services
P. O. Box 64854
St. Paul, Minnesota 55164-0854
(800) 468-9716
Web site: www.wellsfargo.com/shareownerservices
Common Stock
Sensient Technologies Corporation Common Stock is traded on the New York Stock Exchange. Ticker symbol: SXT.
There were 3,070 shareholders of record of Common Stock as of January 29, 2010.
Annual Meeting of Shareholders
The Annual Meeting of Shareholders will be held at 2:00 p.m. (CDT) on Thursday, April 22, 2010, at Trump International Hotel, 401 N. Wabash Avenue, Chicago, Illinois.
Annual Report and Proxy Statement
The Company’s annual report and proxy statement are available online at www.sensient-tech.com/financial/annualreport_and_proxy.htm.
Form 10-K
The Company’s annual report filed with the Securities and Exchange Commission on Form 10-K is available without charge from the Company’s Investor Relations Department and on its Web site at www.sensient-tech.com.
Dividends
Quarterly dividends are typically paid on the first business day of March, June, September and December.
Automatic Dividend Reinvestment Plan
The Sensient Technologies Corporation Dividend Reinvestment Plan provides shareholders with a convenient, economical way to increase their ownership of Sensient Technologies Corporation Common Stock. Through the plan, shareholders can automatically reinvest their dividends to acquire additional shares and make supplemental stock purchases without paying fees or commissions. An enrollment form and brochure describing the plan can be obtained by contacting the plan administrator, Wells Fargo Bank Minnesota at (800) 468-9716 or the Company’s Investor Relations Department at (414) 347-3779.
Investor Relations
Communications concerning the transfer of shares, lost certificates, duplicate mailings or change of address should be directed to the transfer agent.
Other shareholder information, such as news releases and information regarding corporate governance, is available on the Company’s Web site: www.sensienttech.com. Shareholders can also register to receive notification via e-mail when new information is added to the site. The Company’s Web address is provided as an inactive textual reference only, and the contents of the Web site are not incorporated in or otherwise to be regarded as part of this annual report.
Other requests for information should be directed to the Company’s Investor Relations Department at (414) 347-3779.
The Company maintains a direct mailing list for news releases and quarterly reports. If you would like your name added to this list, please contact the Company’s Investor Relations Department.
In accordance with New York Stock Exchange rules and pursuant to Rule 13a-14 under the Securities Exchange Act of 1934, Kenneth P. Manning, as the Company’s Chief Executive Officer, and Richard F. Hobbs, as the Company’s Chief Financial Officer, have certified the quality of the Company’s public disclosure in an exhibit to the Company’s Annual Report on Form 10-K for the year ended December 31, 2009. As Chief Executive Officer, in 2009 Kenneth P. Manning also has certified compliance with New York Stock Exchange corporate governance listing standards.