Attached files
Table of Contents
UNITED STATES
SECURITIES AND EXCHANGE COMMISSION
WASHINGTON, DC 20549
FORM 10-K
(Mark one)
| þ | Annual report pursuant to section 13 or 15(d) of the Securities Exchange Act of 1934 for the fiscal year ended December 31, 2009 or |
| ¨ | Transition report pursuant to section 13 or 15(d) of the Securities Exchange Act of 1934 for the transition period from to |
Commission file number 001-33834
RUBICON TECHNOLOGY, INC.
(Exact Name of Registrant as Specified in Its Charter)
| Delaware | 36-4419301 | |
| (State or Other Jurisdiction of Incorporation or Organization) |
(I.R.S. Employer Identification No.) | |
| 9931 Franklin Avenue Franklin Park, Illinois |
60131 | |
| (Address of Principal Executive Offices) | (Zip Code) | |
Registrant’s Telephone Number, Including Area Code: (847) 295-7000
Securities registered pursuant to Section 12(b) of the Act:
| Title of each class | Name of each exchange on which registered | |
| Common Stock, Par Value $0.001 per share | The NASDAQ Global Market |
Securities registered pursuant to Section 12(g) of the Act: None
Indicate by check mark if the registrant is a well-known seasoned issuer, as defined in Rule 405 of the Securities Act. Yes ¨ No þ
Indicate by check mark if the registrant is not required to file reports pursuant to Section 13 or 15(d) of the Act. Yes ¨ No þ
Indicate by check mark whether the registrant (1) has filed all reports required to be filed by Section 13 or 15(d) of the Securities Exchange Act of 1934 during the preceding 12 months (or for such shorter period that the registrant was required to file such reports), and (2) has been subject to such filing requirements for the past 90 days. Yes þ No ¨
Indicate by check mark whether the registrant has submitted electronically and posted on its corporate Website, if any, every Interactive Data File required to be submitted and posted pursuant to Rule 405 of Regulation S-T (§ 232.405 of this chapter) during the preceding 12 months (or for such shorter period that the registrant was required to submit and post such files). Yes ¨ No ¨
Indicate by check mark if disclosure of delinquent filers pursuant to Item 405 of Regulation S-K is not contained herein, and will not be contained, to the best of registrant’s knowledge, in definitive proxy or information statements incorporated by reference in Part III of this Form 10-K or any amendment to this Form 10-K. ¨
Indicate by check mark whether the registrant is a large accelerated filer, an accelerated filer, a non-accelerated filer, or a smaller reporting company. See the definitions of “large accelerated filer”, “accelerated filer” and “smaller reporting company” in Rule 12b-2 of the Exchange Act.
Large accelerated filer ¨ Accelerated filer þ Non-accelerated filer ¨ Smaller reporting company ¨
Indicate by check mark whether the registrant is a shell company (as defined in Rule 12b-2 of the Exchange Act). Yes ¨ No þ
As of June 30, 2009, there were 12,468,378 shares of common stock outstanding held by nonaffiliates of the registrant, and the aggregate market value of the common stock (based upon the closing price of these shares on the NASDAQ Global Market) was approximately $178,048,438.
The number of shares of the registrant’s common stock outstanding as of the close of business on February 26, 2010 was 20,241,150.
Documents incorporated by reference:
Portions of the Registrant’s Proxy Statement for its Annual Meeting of Stockholders are incorporated by reference into Part III, provided, that if such proxy statement is not filed with the Commission within 120 days after the end of the fiscal year covered by this Form 10-K, an amendment to this Form 10-K shall be filed no later than the end of such 120-day period.
Table of Contents
| Item of Form 10-K |
Page | |||||
| Part I |
||||||
| 1. | 2 | |||||
| 1A. | 12 | |||||
| 1B. | 21 | |||||
| 2. | 21 | |||||
| 3. | 21 | |||||
| 4. | 21 | |||||
| Part II |
||||||
| 5. | 22 | |||||
| 6. | 25 | |||||
| 7. | Management’s Discussion and Analysis of Financial Condition and Results of Operations |
26 | ||||
| 7A. | 35 | |||||
| 8. | 42 | |||||
| 9. | Changes in and Disagreements with Accountants on Accounting and Financial Disclosures |
42 | ||||
| 9A. | 42 | |||||
| 9B. | 42 | |||||
| Part III |
||||||
| 10. | 43 | |||||
| 11. | 43 | |||||
| 12. | Security Ownership of Certain Beneficial Owners and Management and Related Stockholder Matters |
43 | ||||
| 13. | Certain Relationships and Related Transactions, and Director Independence |
44 | ||||
| 14. | 44 | |||||
| Part IV |
||||||
| 15. | 45 | |||||
| 46 | ||||||
| 47 | ||||||
Table of Contents
PART I
All statements, other than statements of historical facts, included in this Annual Report on Form 10-K regarding our estimates, expectations, beliefs, intentions, projections or strategies for the future, results of operations, financial position, net sales, projected costs, prospects and plans and objectives of management for future operations may be “forward-looking statements” as defined in the Private Securities Litigation Reform Act of 1995. We have based these forward-looking statements on our current expectations and projections about future events and financial trends that we believe may affect our financial condition, results of operations, business strategy, short-term and long-term business operations and objectives and financial needs. These forward-looking statements can be identified by the use of terms and phrases such as “believe,” “plan,” “intend,” “anticipate,” “target,” “estimate,” “expect,” and the like, and/or future-tense or conditional constructions such as “will,” “may,” “could,” “should,” etc. (or the negative thereof). Items contemplating or making assumptions about actual or potential future sales, market size and trends or operating results also constitute forward-looking statements.
Moreover, we operate in a very competitive and rapidly changing environment. New risks emerge from time to time. It is not possible for our management to predict all risks, nor can we assess the impact of all factors on our business or the extent to which any factor, or combination of factors, may cause actual results to differ materially from those contained in any forward-looking statements we may make. Before investing in our common stock, investors should be aware that the occurrence of the risks, uncertainties and events described in the section entitled “Risk factors” and elsewhere in this Annual Report could have a material adverse effect on our business, results of operations and financial condition.
Although we believe that the expectations reflected in the forward-looking statements are reasonable, forward-looking statements are inherently subject to known and unknown risks and business, economic and other risks and uncertainties that may cause actual results to be materially different from those discussed in these forward-looking statements. Readers are urged not to place undue reliance on these forward-looking statements, which speak only as of the date of this Annual Report. We assume no obligation to update any forward-looking statements in order to reflect any event or circumstance that may arise after the date of this Annual Report, other than as may be required by applicable law or regulation. If one or more of these risks or uncertainties materialize, or if the underlying assumptions prove incorrect, our actual results may vary materially from those expected or projected.
This Annual Report also contains statistical data and estimates, including those relating to market size and growth rates of the markets in which we participate, that we obtained from industry publications and reports generated by market research firms. These publications typically indicate that they have obtained their information from sources they believe to be reliable, but do not guarantee the accuracy and completeness of their information. Although we have assessed the information in the publications and found it to be reasonable and believe the publications are reliable, we have not independently verified their data.
You should read this Annual Report and the documents that we reference in this Annual Report and have filed with the SEC as exhibits with the understanding that our actual future results, levels of activity, performance and events and circumstances may be materially different from what we expect.
Unless otherwise indicated, the terms “Rubicon,” the “Company,” “we,” “us,” and “our” refer to Rubicon Technology, Inc.
1
Table of Contents
| ITEM 1. | BUSINESS |
OVERVIEW
We are an advanced electronic materials provider that develops, manufactures and sells monocrystalline sapphire and other innovative crystalline products for light-emitting diodes (“LEDs”), radio frequency integrated circuits (“RFICs”), blue laser diodes, optoelectronics and other optical applications. The emergence of sapphire in commercial volumes at competitive prices has enabled the development of new technologies such as high brightness (“HB”) white, blue and green LEDs and highly-integrated RFICs. We apply our proprietary crystal growth technology to produce high-quality sapphire products efficiently to supply our end-markets, and we work closely with our customers to meet their quality and delivery needs. We believe we are the leading supplier of sapphire products to the LED industry.
We are a vertically integrated manufacturer of high-quality sapphire substrates and optical windows that are used in a variety of high-growth, high-volume end-market applications. Our largest product line is two to four inch sapphire cores and wafers for use in LEDs and blue laser diodes for solid state lighting and electronic applications. In addition, we sell six inch sapphire wafers that are used for Silicon-on-Sapphire (“SOS”) RFICs, as well as products for military, aerospace, sensor and other applications. We have also extended our technology, which gives us the ability to produce cores and wafers of up to twelve inches in diameter to support next generation LED and RFIC production. We believe that LED and SOS RFIC production will follow a similar path to that of production of integrated circuits on silicon substrates, which gradually migrated to production on larger and larger substrates in order to reduce manufacturing costs. We feel that our ability to produce large diameter sapphire substrates in high volume will enable the continued advancement of the LED and RFIC markets by enabling our customers to reduce costs. We currently sell six and eight inch wafers to LED chip manufacturers for their research and development efforts toward moving production on to these larger diameter substrates. We have also developed the ability to produce large diameter circular and rectangular sapphire windows for use in various optical window applications.
Our fully integrated in-house capabilities enable us to design, assemble and maintain proprietary crystal growth furnaces to grow high purity, low-stress, ultra low defect density sapphire crystals. In addition, we possess state-of-the-art capabilities in high precision core drilling, wafer slicing, surface lapping, edge bevel grinding and wafer cleaning processes. We foster a strong sense of innovation and agility in our product development teams in an attempt to develop new products more effectively and to rapidly capture market growth.
We plan to leverage our technological advantage in efficiently producing high-quality, large-diameter sapphire products to maintain our leadership position and capitalize on future growth opportunities. To attain this goal, we are investing in research and development activities, continuing to enhance our operational capabilities, increasing our brand recognition and diversifying into new market segments.
We are a Delaware corporation incorporated on February 7, 2001.
INDUSTRY OVERVIEW
Integrated circuits and other semiconductor devices have traditionally been fabricated on silicon substrates. However, for certain advanced applications, new electronic materials have emerged as the substrates of choice due to evolving integration and performance considerations. For example, sapphire is the preferred substrate material for HB white, blue and green LED applications due to its crystal lattice compatibility with the aluminum gallium nitride (“AlGaN”) epitaxial layers, thermal expansion properties, commercial availability and cost efficiency. Other sapphire applications include SOS integrated circuits, optical lenses and windows, and substrates for blue laser diodes.
2
Table of Contents
LED applications
Advancements in solid state lighting utilizing HB white, blue and green LEDs over the past decade represent a disruptive technology in the lighting industry, providing significant performance, environmental and economic improvements compared to traditional incandescent or fluorescent lighting. For example, traditional incandescent lamps are inefficient and costly, emitting over 90% of consumed power as heat and lasting only 1,500 to 2,000 hours. Fluorescent lamps produce light by passing electricity through toxic mercury vapor, which creates an environmental disposal problem. LEDs do not contain mercury or lead and are 4.0 to 6.6 times as efficient as traditional incandescent lamps, while providing 35,000 to 50,000 hours of light. These factors, along with their durability, small form factor, excellent color performance, and decreasing costs, have led to growing demand for LEDs in applications such as small displays for mobile devices, flashes for digital cameras, backlighting units (“BLUs”) for displays used in notebook computers, desktop monitors, LCD televisions, public display signs, automotive lights, traffic signals, and general and specialty lighting. Applications using LEDs have unit volumes in the billions and are expected to grow significantly over the next several years. The majority of HB LEDs are produced on sapphire substrates. Therefore, as the HB LED market grows, we believe the sapphire substrate market will grow as well.
Mobile devices. LEDs are used in color displays for mobile phones and other portable electronics such as GPS systems, MP3 players and digital camera flashes. LEDs are well-suited for mobile devices due to their low current drain which extends battery life and durability while generating less heat. For these reasons, the vast majority of mobile devices utilize LED lighting.
LED backlighting units for large displays. LED BLUs are beginning to replace conventional fluorescent BLUs in LCD flat panel televisions, notebook computers and desktop monitors. Benefits of LED BLUs in these applications are reduced power consumption/extended battery life, thinner displays, quicker response time and better color rendition. Displays made with LED BLUs also have no toxic materials, which help electronics manufacturers to comply with environmental regulations. According to DisplaySearch, a market research firm, LED BLUs will surpass traditional backlighting sources in large display panels in 2011, and achieve a 74% penetration in 2013.
Automotive lighting. Automobile manufacturers are increasingly using LEDs in car and truck headlights, turning and tail light functions as well as interior lighting. Benefits include near-instant response time, reduced power usage and more stylish and effective designs. Increased LED usage in other transportation vehicles such as motorcycles and commercial jets offers additional growth potential.
Commercial signage/displays. LEDs are becoming more widely used as light sources on large signs, LED displays, and outdoor displays, such as jumbo screens used in sporting arenas and electronic billboard displays.
General Illumination. LEDs are increasingly being used for replacement lamps, architectural lighting, retail displays commercial and industrial lights, residential lighting, street lights and off grid lighting for developing countries. General illumination is expected to be one of the fastest growing applications for HB LEDs.
SOS RFIC and optical applications
SOS integrated circuits consist of a thin layer of silicon grown on a sapphire substrate and are primarily used in advanced wireless and military applications, such as RFICs. In particular, SOS RFICs are currently used in high volumes for mobile phones, broadband television set-top boxes, satellites and radiation-hardened applications for the defense industry. We believe SOS devices also represent a large potential market opportunity for sapphire due to sapphire’s outstanding properties as an insulating substrate material with outstanding thermal conductivity and crystal lattice compatibility with silicon, which, among other things, enables monolithic integration in RFICs.
3
Table of Contents
Sapphire and various fluoride materials are utilized for windows and optics for aerospace, sensor, medical and laser applications. Sapphire is used in these applications due to its wide-band transmission, superior strength, scratch resistance and high strength-to-weight ratio. Sapphire’s physical properties make it very well suited for jet fighter targeting pod windows, forward-looking infrared (“FLIR”) windows for commercial and business jets as well as unmanned air vehicles or drones, rocket domes and transparent armor for military vehicles. Sapphire substrates are also used in the production of blue laser diodes. Blue laser diode technology allows much higher data storage for HD-DVD applications. Blue laser diodes are just beginning to penetrate potentially high volume applications, such as the Blu-ray Disc DVD players and leading-edge video game systems.
Sapphire substrate industry supply chain
The production process for sapphire substrates is substantially similar to that of silicon wafers. A typical process flow consists of crystal growth, fabrication, slicing, lapping and polishing steps. Output quality is measured in flatness, desired crystal planar orientation, etch pitch density and crystalline structure uniformity. A great emphasis is placed on continuously improving yields and increasing production capacity to drive costs lower to take advantage of emerging high-volume opportunities. Device manufacturers are seeking larger diameter sapphire wafers to allow them to develop higher performance applications and achieve economies of scale. Historical methods of sapphire crystal growth, which rely on lower-volume batch processes, are less able to meet the needs of leading end-market customers for high quality crystals, demanding dimensional tolerances, high production volumes, cost efficiency and on-time delivery. Sapphire is the base material that “feeds” the entire value chain.
THE RUBICON SOLUTION
We are an advanced electronic materials provider that develops, manufactures and sells monocrystalline sapphire and other innovative crystalline products for LEDs, RFICs, blue laser diodes, optoelectronics and other optical applications. As a leading producer of sapphire and provider of other crystals, we believe that the following are our principal competitive advantages:
Proprietary technology for crystal growth
We refer to the proprietary technology, equipment and processes we use in the production of our sapphire crystals as “ES2,” which stands for “evolving science, evolving solutions.” Due to our understanding of sapphire crystal growth seeding and crystal growth furnace operational parameters, we have developed a full in-house capability to design, build and maintain ES2 crystal growth furnaces with proprietary features. Our ES2 technology enables us to maintain a highly scalable, efficient operation and to produce large diameter sapphire wafers that we believe exceed the quality of any other sapphire producer today. Our competitors primarily employ the Kyropoulos, Czochralski (“CZ”) or Edge-defined Film-fed Growth (“EFG”) method to grow sapphire crystals. We believe that our ES2 technology, which employs an enhanced Kyropoulos methodology, significantly outperforms other methods of sapphire production with respect to capital costs, operating costs, throughput, quality and diameter size. Using our ES2 technology, we currently have the capability to produce sapphire products with diameters of up to eight inches in production volumes and we have developed the capability to produce larger diameter sapphire products.
High quality sapphire products
We believe our sapphire crystal wafers are best-in-class in terms of quality. Our quality advantage is exhibited by our ability to produce crystals without defects as grain boundaries, with low density of dislocations (10-100 per square centimeter) which is significantly better than the industry standard range. According to Sapphire Material, Manufacturing, Applications by E. Dobrovinskaya, L. Lytvynov and V. Pishchik (Springer 2009), sapphire grown using other methods have grain boundaries with different angles of disorientation, and significantly larger density of dislocations (5,000-100,000 per square centimeter). Our sapphire also has ultra high (99.999%) purity levels. Our high purity sapphire helps our customers realize high yields in their
4
Table of Contents
processing. In addition, because of the high purity of our products, our customers have the ability to utilize our sapphire for optical applications requiring high transmission in the ultraviolet through mid-infrared spectral ranges. Through our operational expertise in crystal growth, post-growth processing and in-process manufacturing controls of sapphire wafer production, we are able to meet or exceed our customers’ key product specifications, such as crystalline quality, dimensional tolerances and crystal orientation, while maintaining high production yields.
Vertical integration
We possess critical know-how and proprietary processes and metrology for crystal growth and sapphire processing. We grow sapphire crystals and have extensive capabilities to process sapphire into products that meet our customers’ needs from cores to wafers and window blanks to large diameter epi-polished wafers. In the areas of fabrication and slicing, we employ high volume manufacturing techniques and utilize customized tooling and metrology to hold very tight dimensional and orientation tolerances for sapphire cores and wafers. We also have high precision lapping, edge bevel grinding and annealing capabilities for as-ground wafers and window blanks. We have proprietary six and eight inch polishing and ultra-cleaning equipment and processes for SOS RFIC and other applications that demand larger-diameter epi-polished wafers. By vertically integrating our processes, we are able to achieve significant operating efficiencies and produce high-quality, high-precision products that offer cost and quality benefits to our customers. This vertical integration also helps us expand our range of products and protect our technology and manufacturing trade secrets.
High volume and flexible manufacturing capability
We provide a high volume and stable US-based supply of products for our customers. We offer reliable, consistent on-time delivery to our customers through our flexible and scalable production operations. We have developed automated manufacturing and metrology platforms at each stage of our production process that allow us to increase capacity rapidly and to switch products in manufacturing easily so that we can meet our customers’ specific product demands.
Lowest total cost for customers
We compete on the quality of our products and our service levels to supplement our competitive pricing. We believe our high sustained yields, our dedication to consistent production and performance and our commitment to lasting customer relationships help assure our customers of a reliable source of high-quality sapphire products at stable prices. Our in-process quality control practices lead to predictable customer process yields, reduced inspection costs and overall high customer satisfaction. In addition, we work closely with our customers to understand their product specifications and then align our operations to meet their needs. Through close collaboration with our customers, we help them develop new applications for our advanced sapphire products and establish ourselves as a preferred supplier. As such, we believe our solution offers the lowest total cost for our customers.
STRATEGY
Our goal is to be the leading global provider of advanced monocrystalline substrate and window materials to the solid state lighting, SOS RFIC, aerospace and optical markets. We currently occupy a leading position among sapphire producers worldwide in market volume for two through eight inch sapphire products for LEDs. A key element of our strategy is to increase the proportion of our shipments of four and six inch diameter products. The time elapsed from our beginning product development to shipping commercial volumes in the six inch sapphire substrate market was less than one year. As a result, we now have significant market share in the six inch SOS RFIC sapphire substrate market. In 2008, we developed the capability to produce eight inch diameter products in commercial volumes. While there currently is little demand for eight inch substrates, we believe this product will play an important role in future generation LED and SOS products. We have provided eight inch wafers for research and development purposes to both the LED and SOS industry and believe we will begin shipping commercial volumes of eight inch diameter product in the first half of 2011.
5
Table of Contents
Our strategy includes the following key elements:
Extend our technology and manufacturing leadership position
We believe our specialized manufacturing processes and proprietary technology and trade secrets provide us with significant competitive advantages. We have designed and developed product, equipment and process technology platforms from which we can rapidly increase capacity and stay flexible to meet our customers’ needs. At each phase of our manufacturing process, we have developed and standardized automated equipment that employs similar processes to produce a full range of products. For example, most of our furnaces can grow sapphire crystals of the same size in various orientations to produce two through six inch wafers and cores. This reduces our operating costs and significantly improves our product development cycles. In 2008, we developed the capability to produce larger sapphire crystals from which we have the ability to produce eight inch cores and wafers as well as larger diameter optical material. In 2009, we further extended our technology and now have the ability to produce up to twelve inch cores and wafers and produce even larger diameter optical material. We intend to continue to develop advanced technology platforms to further increase the size of crystals produced and offer market-leading product specifications, while maintaining product quality and manufacturing efficiencies.
Capitalize on opportunities in high-growth markets
Our sapphire products are used in multiple applications in the high-growth LED and SOS RFIC markets. We also participate in optical market segments where sapphire and fluoride materials are being adopted rapidly in new applications. We intend to continue to expand our opportunities by adding new categories and sizes of products with the goal of providing our customers in multiple high-growth end markets with a robust set of sapphire solutions. For example, one of the largest market segment opportunities is likely to come from the solid state lighting market, which will require higher brightness, lower-cost white LEDs that require larger-size LED chips. Larger LED chips are increasingly being manufactured in volume on four inch sapphire wafers. Our process to manufacture large diameter, high quality sapphire wafers is well-suited to this market and we believe our processes will help enable its growth. We already produce high volumes of four and six inch sapphire products and we continue to add large diameter sapphire production capacity in anticipation of market growth, as evidenced by the addition of eight inch diameter capabilities in 2008 and twelve inch diameter capabilities in 2009. We expect that next-generation LEDs and SOS RFICs will be produced on six inch and larger sapphire wafers to further drive cost efficiencies.
Enhance operational excellence
Our unique expertise in producing high-quality sapphire products in many sizes gives us a significant edge in process and product technology. We plan to further refine our proprietary ES2 crystal growth techniques, sapphire processing platforms and process controls to produce even higher quality crystals at greater yields. Our engineering efforts focus on the capability to design, build and maintain ES2 crystal growth furnaces with new proprietary features. We seek to continuously improve our sapphire processing and material inspection capabilities. We also promote operational excellence through lowering cycle times, raising yields, and reducing overhead costs. Our ability to understand our customers’ design and manufacturing processes enhances our ability to reach these goals. We employ Six Sigma methodologies to continuously improve our operational platforms and we provide extensive training to current and new employees.
Expand our sales and marketing efforts
We plan to enhance our brand recognition worldwide by increasing our marketing and communications programs and resources. For example, we have sponsored several LED conferences and we plan to extend our sponsorships into other markets, such as SOS RFICs and aerospace. We plan to further enhance our website, extend our public relations campaigns and increase our brand visibility in trade publications and with technical organizations. We rely on direct sales for the majority of our business and we use multiple distribution channels to extend the reach of our sales and support teams. Although we have already entered multiple markets globally, we plan to increase the scale and geographical coverage of our sales efforts.
6
Table of Contents
Penetrate new market segments
We target high growth market segments where we believe we can gain a leadership position. Although production of sapphire cores and wafers is our focus today, we intend to leverage our crystal growth and processing know-how to develop high-quality crystal products for new substrate and window applications. Sapphire is becoming increasingly popular and is replacing quartz and glass in high-performance and harsh environment applications in the aerospace, petroleum and laser industries. For example, the US military uses sapphire optical windows to construct targeting mechanisms for its jet fighters and drones and transparent armor for land vehicles. We intend to use our proprietary manufacturing technology to produce additional single crystal materials that can be used in optical applications as well as alternative substrates for certain electronic materials applications. As the electronics and optical industries continue to develop new applications that take advantage of the unique properties of both sapphire and other single crystal products, our goal is to be the provider of choice for these applications.
TECHNOLOGY
Our proprietary ES2 crystal growth technique produces high-quality sapphire crystals for use in our sapphire products. ES2 is derived from the standard Kyropoulos method of crystal growth. We developed this technique with the goal of establishing greater control over the crystal growth process while maintaining minimal temperature variations. Unlike other techniques, during the ES2 technique, the growing sapphire crystal exists in an unconstrained, low stress environment inside a closed growth chamber. The closed system allows for enhanced control of the melt, resulting in higher quality crystals. The temperature gradient between the melt and the crystal in the ES2 technique is significantly lower than in other crystal growth techniques. These aspects of the ES2 technique enable us to grow crystals that have a significantly lower dislocation density, higher crystal purity and higher uniformity than sapphire crystals grown using other techniques. The ES2 technique provides an inherent annealing process once the crystal is fully grown. This thermal annealing is an integral means of relieving stress in the crystal during the ES2 process. We believe we can readily scale our ES2 technology in a production environment while maintaining high crystal quality even as crystal boule size is increased. As a result of our proprietary ES2 technology, we believe that we currently offer the most efficient method for manufacturing large form factor, high quality sapphire in the market today.
We have automated the crystal growth process of our proprietary ES2 technique. Our furnace environments are controlled by closed-loop control systems and the overall crystal growth process is run with minimal operator intervention, which reduces the potential for human error. In addition, a single operator can supervise the control of multiple ES2 furnaces simultaneously, which reduces cost.
We believe our proprietary ES2 process provides significant advantages over other crystal growth methods such as CZ and EFG. Unlike the ES2 technique, the CZ and EFG methods grow crystals with much higher levels of stress. This stress can decrease the overall quality of the sapphire crystal and requires increased processing time to relieve this stress, which increases production costs and decreases throughput, especially in larger diameter crystals. During the EFG process, the crystal is grown in a sheet form by pulling it through a die directly from the melt; while in the CZ process, the crystal must be rotated and pulled as the aluminum oxide melt is consumed. These constrained growth environments with higher thermal gradients increase stress and decrease crystal quality.
Our research and development (“R&D”) activity plays a vital role in supporting our technology, product and revenue roadmaps. In 2009, 2008 and 2007, our R&D expenses totaled $801,000, $862,000 and $769,000, respectively. Our R&D is focused on three key areas: large diameter sapphire growth and fabrication; higher precision sapphire processing; and new crystal development. Our technical staff possesses deep and broad expertise in materials science and engineering. We also develop and utilize sophisticated metrology equipment to perform material and process characterization.
7
Table of Contents
PRODUCTS
We offer a wide variety of sapphire products designed to meet the stringent specifications of our customers. Using our proprietary ES2 technology, we grow high-quality sapphire boules. We fabricate our products from the boules and sell them in four general categories: core, as-cut, as-ground and polished. We currently offer two inch, three inch, four inch, six inch and eight inch diameter wafers, in C, R, A, and M planar orientations. A sapphire crystal has multiple orientation planes resulting from its crystalline structure symmetry.
Each orientation of the crystal structure is represented by a letter and differs in lattice structure. These variations result in different chemical, electrical, and physical properties depending on the particular orientation plane. As a result, customers require different orientation planes depending on the intended application. For example, LED manufacturers typically request C plane crystals while SOS manufacturers typically request R plane crystals.
| Product |
Size |
Orientation |
Applications | |||
| Core | 2,” 3,” 4,” 6”, 8” | C, R, A, M | • LED • Optical windows • Blue laser diode | |||
| As-Cut | 2,” 3,” 4,” 6”, 8” | C, R, A, M | • Wafers for LED • Wafers for blue laser diodes • Wafers for SOS RFICs | |||
| As-Ground | 2,” 3,” 4,” 6”, 8” | C, R, A, M | • Wafers for LED • Wafers for SOS RFICs • Blanks for optical windows • Wafer carriers | |||
| Polished | 6”, 8” | C, R, A | • Epi-polished wafers for SOS RFICs • Polished optical windows • Double-side polished wafer carriers | |||
Core
Our core product line consists of our sapphire cores drilled from sapphire boules with high-precision, and is available in two, three, four, six and eight inch diameters and in various lengths and orientations. In 2009, 2008 and 2007, sales of core accounted for 66%, 37% and 39% of our revenue.
As-cut
Our as-cut product line consists of sapphire cores sliced using a wire saw machine. We believe we are able to offer our customers one of the highest-precision cut sapphire wafers in the market. This is especially important to customers who require precise orientation planes for applications such as LEDs, SOS, RFICs and blue laser diodes. In 2009, sales of as-cut wafers accounted for less than 15% of our revenue. In 2008 and 2007, sales of as-cut wafers accounted for 24% and 26% of our revenue.
As-ground
Our as-ground product line consists of cut sapphire wafers that undergo a double-sided lapping and edge grinding process. The lapping process ensures that the surface of the wafer is flat and smooth and has a high degree of parallelism. The grinding process bevels the edges of the wafers, making them more durable and less susceptible to chipping and cracking. In 2009, 2008 and 2007, sales of as-cut wafers accounted for less than 15% of our revenue.
8
Table of Contents
Polished
Our polished product line consists of finely polished, ultra-clean, six and eight inch sapphire wafers. Our polished wafers undergo two polishing phases including both a mechanical and a chemical mechanical planarization phase. We believe we are currently one of very few firms offering six and eight inch, high-quality R-plane polished wafers. In 2009, sales of polished wafers accounted for less than 15% of our revenue. In 2008 and 2007, sales of polished wafers accounted for 24% and 15% of our revenue. During 2009, our key customer for R-plane polished substrates had supply chain management challenges and also experienced decreased demand due to the global recession. As a result, our orders for R-plane polished wafers declined in 2009 compared to 2008.
Other
We also offer optically-polished windows and ground window blanks of sapphire and various fluoride compounds, such as calcium, barium and magnesium fluoride. We provide sapphire and other crystal products in many sizes, shapes and product formats for specialty applications.
MANUFACTURING
The process of growing the crystal begins by heating the raw material, aluminum oxide, until it reaches an ideal temperature above its melting point. This ideal temperature is essential for our process because it allows us to produce high-purity crystals with very low defect rates. Following the heating, a seed rod is inserted in the melted material as the material is being cooled to crystallize into a boule. Following the growth process, each boule is rigorously inspected by using polarized lighting and magnification to find imperfections, such as bubbles, dislocations and granular deposits within the crystal.
We then drill the resulting boules into cores using our custom high-precision crystal orientation equipment and proprietary processes. We use wire saws to slice each core to be of precise size and shape. These wafers are then pre-polished using precision lapping and edge-grinding equipment and then are ready to be polished into epitaxial wafers. All of these processes are performed in clean environments to reduce the chance of crystal contamination. Epi-polishing and wafer cleaning are performed in Class 10,000 and Class 100 clean-room environments, respectively.
We are dedicated to quality assurance throughout our entire operation. We employ detailed material traceability from raw material to finished product. Our quality system is certified as ISO9001:2000 and we have in-house expertise at the Six Sigma Black Belt level.
All of our long-lived assets are located in the US.
SALES AND MARKETING
We market and sell our products through our direct sales force to customers in Asia, North America and Europe. Our direct sales force includes experienced and technically sophisticated sales professionals and engineers who are knowledgeable in the development, manufacturing and use of sapphire substrates, windows and other optical materials. Our sales staff works with customers during all stages of the substrate manufacturing process, from developing the precise composition of the substrate through manufacturing and processing the substrate to the customer’s specifications.
A key component of our marketing strategy is developing and maintaining strong relationships with our customers, especially at the senior management level. We achieve this through working closely with our customers to optimize our products for their production processes. In addition, we are able to develop long-term relationships with key customers through offering product specification assistance, providing direct access to
9
Table of Contents
enable them to evaluate and audit our operations, delivering high quality products and providing superior customer service. We believe that maintaining close relationships with senior management and providing technical support improves customer satisfaction and provides us with a competitive advantage when selling our products.
In order to increase brand recognition of our products and of Rubicon in general, we publish technical articles, advertise in trade journals, distribute promotional materials and participate in industry trade shows and conferences.
CUSTOMERS
Our principal customers are wafer polishing companies and semiconductor device manufacturers. A significant portion of our sales have been to relatively few customers. In 2009, our top three customers accounted for 48% of our revenue. In 2008, our top four customers accounted for approximately 68% of our revenue and, in 2007, our top three customers accounted for approximately 62% of our revenue. Although we are attempting to diversify and expand our customer base, we expect our sales to continue to be concentrated among a small number of customers. However, we also expect that our significant customers may change from time to time. In the year ended December 31, 2009, sales to Crystalwise Technology, Inc., Tera Xtal Technology Corp., and Iljin Display Co, Ltd. represented approximately 20%, 17% and 11% of our revenues, respectively. In the year ended December 31, 2008, sales to Peregrine Semiconductor Corp., Shinkosha Co. Ltd., Crystalwise Technology, Inc., and a fourth customer represented approximately 29%, 17%, 12% and 10% of our revenues, respectively. In 2007, sales to Crystalwise, Shinkosha and Peregrine represented approximately 26%, 21% and 15% of our revenues, respectively. No other customer accounted for 10% or more of our revenues during those periods.
In the year ended December 31, 2009, 72% of our sales were made to customers in Asia, 25% of our sales were made to customers in North America and 3% of our sales were made to customers in Europe. In the year ended December 31, 2008, 53% of our sales were made to customers in Asia, 44% of our sales were made to customers in North America and 3% of sales were made to customers in Europe. In the year ended December 31, 2007, 72% of our sales were made to customers in Asia, 26% of our sales were made to customers in North America and 2% of sales were made to customers in Europe. Since average selling prices for our products are still rebounding from pricing decreases experienced during the recession, we have chosen to limit our customer supply agreements to a short period of time, typically 90 days. Therefore, fluctuations in demand could cause our quarterly revenue to vary significantly. Our standard arrangement with all customers includes 30 day payment terms.
INTELLECTUAL PROPERTY
Our ability to compete successfully depends upon our ability to protect our proprietary technologies and other confidential information. We rely primarily upon a combination of trade secret laws and non-disclosure agreements with employees, customers and potential customers to protect our intellectual property. We have three pending patent applications with the US Patent and Trademark Office covering aspects of our core production, wafer grinding and lapping technologies. However, we believe that factors such as the technological and innovative abilities of our personnel, the success of our ongoing product development efforts and our efforts to maintain trade secret protection are more important than patents in maintaining our competitive position. We pursue the registration of certain of our trademarks in the US and currently have seven registered trademarks and one trademark application pending.
COMPETITION
We participate in an innovative, specialized and competitive industry. The products we produce must meet certain demanding requirements to succeed in the marketplace. Although we account for a significant percentage of the total market volume today, we face significant competition from other established providers of similar products as well as from potential new entrants into our markets.
10
Table of Contents
We have a few competitors that compete directly with us that are of similar size or smaller than us. These companies tend to focus on providing core and as-cut products rather than offering polished products. There are a limited number of companies that are substantially larger than us that compete with us in a relatively small segment of their overall business. These larger companies tend to focus on providing polished products to customers rather than providing core, as-cut and as-ground products.
We believe that the key competitive factors in our markets are:
| • | consistently producing high-quality products in the desired size, orientation and finish; |
| • | driving innovation through focused research and development efforts; |
| • | possessing sufficient supply capacity to meet end-market customer demands; |
| • | offering solutions through collaborative efforts with customers; |
| • | pricing; and |
| • | providing a low total cost-of-ownership for customers. |
Although we face significant competition, we believe that our proprietary ES2 crystal growth technology and business practices allow us to compete effectively on all of the above factors.
ENVIRONMENTAL REGULATION
In our manufacturing process, we use water, oils, slurries, acids, adhesives and other industrial chemicals. We are subject to a variety of federal, state and local laws regulating the discharge of these materials into the environment or otherwise relating to the protection of the environment. These include statutory and regulatory provisions under which we are responsible for the management of hazardous materials we use and the disposition of hazardous wastes resulting from our manufacturing processes. Failure to comply with such provisions, whether intentional or inadvertent, could result in fines and other liabilities to the government or third parties, injunctions requiring us to suspend or curtail operations or other remedies, which could have a material adverse effect on our business.
EMPLOYEES
As of December 31, 2009, we had 138 full-time employees. Of these 138 employees, 122 work in technology and operations. None of our employees is represented by a labor union. We consider our employee relations to be good. We believe that our future success will depend on our continued ability to attract, hire and retain qualified personnel.
OTHER INFORMATION
We file annual and quarterly reports and other information with the United States Securities and Exchange Commission, or the “SEC.” You may read and copy any documents that we file at the SEC’s public reference room at 100 F Street, N.E., Washington, D.C. 20549. Please call the SEC at 1-800-SEC-0330 for further information about the operation of the public reference room. In addition, the SEC maintains an Internet website (http://www.sec.gov) that contains reports, proxy statements, information statements and other information about issuers that file electronically with the SEC, including Rubicon. You may also access, free of charge, our reports filed with the SEC (for example, our Annual Report on Form 10-K, our Quarterly Reports on Form 10-Q and our Current Reports on Form 8-K and any amendments to those forms) indirectly through our Internet website (www.rubicon-es2.com). Reports filed with or furnished to the SEC will be available as soon as reasonably practicable after they are filed with or furnished to the SEC. Alternatively, if you would like a paper copy of any such SEC report (without exhibits) or document, write to Investor Relations, Rubicon Technology, Inc., 9931 Franklin Avenue, Franklin Park, Illinois 60131, and a copy of such requested document will be provided to you, free of charge. The information found on our website is not part of this or any other report filed with or furnished to the SEC.
11
Table of Contents
| ITEM 1A. | RISK FACTORS |
Our business is subject to a number of important risks and uncertainties, some of which are described below. The risks described below, however, are not the only risks that we face. Additional risks and uncertainties not currently known to us or that we currently deem to be immaterial may also impair our business operations. Any of these risks may have a material adverse effect on our business, financial condition, results of operations and cash flows.
We have incurred significant losses in prior periods and may incur losses in the future.
We have incurred significant losses in prior periods. In 2009, we incurred a net loss of $9.6 million, and, as of December 31, 2009, we had an accumulated deficit of $158.9 million. While we had net income of $4.4 million in 2008, we incurred a loss of $1.7 million in the fourth quarter of 2008. In 2007 and 2006, we incurred net losses of $2.9 million and $7.6 million, respectively. There can be no assurance that we will have sufficient revenue growth to offset expenses or to achieve profitability in future periods.
Our results of operations, financial condition and business will be harmed if we are unable to effectively match our capacity with customer demand.
The global economic crisis resulted in weak demand for LED and SOS products in late 2008 and most of 2009, causing a significant reduction in orders for our sapphire substrates. As a result, our manufacturing facilities were underutilized, which negatively impacted our gross margins. While demand has increased significantly in recent months and most of our manufacturing facilities are currently utilized, there can be no assurance that such sudden market changes will not occur again in the future adversely affecting our profitability.
Demand for our products has resumed in recent periods requiring expansion of our production capacity. Our capacity expansion involves significant risks, including the availability of capital equipment and the timing of its installation, availability and timing of required electric power, management of expansion costs, timing of production ramp, qualification of our new equipment and demands on management’s time. If our business does not grow fast enough to utilize this new capacity effectively, our business and financial results could be adversely affected. Conversely, delays in expanding our manufacturing capacity could impact our ability to meet future demand for our products. As a result, we might not be able to fulfill customer orders in a timely manner, which could adversely affect our customer relationships and operating results. Moreover, our efforts to increase our production capacity may not succeed in enabling us to manufacture the required quantities of our products in a timely manner or at the gross margins that we achieved in the past. There can be no assurance that we will be able to successfully reach our production, timing and cost goals for our expansion.
If LED lighting does not achieve greater market acceptance, or if alternative technologies are developed and gain market traction, prospects for our growth and profitability would be limited.
Our future success depends on increased market acceptance of LED lighting. Approximately 77% and 62% of our revenue during 2009 and 2008, respectively, was from sales of our products for use in the manufacture of LED products. Potential customers for LED lighting systems may be reluctant to adopt LED lighting as an alternative to traditional lighting technology because of its higher initial cost and relatively low light output per unit in comparison with the most powerful traditional lighting devices. In addition, our potential customers may have substantial investments and know-how related to their existing lighting technologies, and may perceive risks relating to the novelty, complexity, reliability, quality, usefulness and cost-effectiveness of LED products compared to other lighting sources available in the market. If acceptance of LED lighting does not increase significantly, then opportunities to increase our revenues and operate profitably would be limited.
Moreover, if effective new sources of light other than LED devices are developed, our current products and technologies could become less competitive or obsolete. Any of these factors could have a material and adverse impact on our growth and profitability.
12
Table of Contents
The technology used in the LED industry continues to change rapidly, and if we are unable to modify our products to adapt to future changes in the LED industry we will be unable to attract or retain customers.
We do not design or manufacture LEDs. Our ability to expand into new applications in the LED market depends on continued advancement in the design and manufacture of LEDs by others. The LED industry has been characterized by a rapid rate of development of new technologies and manufacturing processes, rapid changes in customer requirements, frequent product introductions and ongoing demands for greater functionality. Our future success will depend on our ability to develop new products for use in LED applications and to adjust our product specifications, such as our previous development of larger diameter wafers, in response to these developments in a timely manner. If our development efforts are not successful or are delayed, or if our newly developed products do not achieve market acceptance, we may be unable to attract or retain customers and our operating results could be harmed. In addition, although sapphire is currently the preferred substrate material for HB white, blue and green LED applications, we cannot assure you that the LED market will continue to demand the performance attributes of sapphire. Silicon carbide is another substrate material currently used for certain LED applications, including some that also use sapphire substrates. Other substrates being investigated and used in research and development for certain LED applications are aluminum nitride, zinc oxide and bulk gallium nitride. Research is also ongoing for the use of silicon substrates in LED applications. If sapphire is displaced as the substrate of choice for certain LED applications, our financial condition and results of operations would be materially and adversely affected unless we were able to successfully offer the competing substrate material.
Our continuing efforts to enhance our current products and to develop new products involve several risks, including:
| • | our ability to anticipate and respond in a timely manner to changes in customer requirements; |
| • | the possibility that sapphire may in the future be replaced as a preferred substrate in certain LED applications; |
| • | the significant research and development investment that we may be required to make before market acceptance of a particular new or enhanced product; |
| • | the possibility that the LED industry may not accept our new or enhanced products after we have invested a significant amount of resources in development; and |
| • | competition from new technologies, processes and products introduced by our current and/or future competitors. |
If the development and acceptance of our products for the SOS RFIC market do not meet our expectations, our future operating results may be harmed.
The level of market acceptance of our SOS RFIC products will impact our future operating results. Our success in the SOS RFIC market depends on a number of factors, including:
| • | the success of our customers’ products in current applications; and |
| • | the acceptance of SOS RFIC products for newly targeted applications. |
In addition, it is possible that other solutions, such as silicon-on-insulator, may become preferred over SOS. We cannot assure you that the RFIC market will continue to require the performance attributes of SOS solutions. If our products are not accepted more broadly in the RFIC market, our results of operations and business may be harmed.
The average selling prices of sapphire products have historically been volatile.
Historically, our industry has experienced volatility in product demand and pricing. Changes in average selling prices of our products as a result of competitive pricing pressures, increased sales discounts and new product introductions by our competitors could have a significant impact on our profitability. Although we
13
Table of Contents
attempt to optimize our product mix, introduce new products, reduce manufacturing costs and pass along certain increases in costs to our customers in order to lessen the effect of decreases in selling prices, we may not be able to successfully do so in a timely manner and our results of operations and business may be harmed.
We depend on a few customers for a major portion of our sales and our results of operations would be adversely impacted if they reduced their order volumes.
Historically, we have earned, and believe that in the future we will continue to earn, a substantial portion of our revenue from a small number of customers. In 2009, three customers each accounted for 10% or more of our revenues. In 2008, four customers each accounted for 10% or more of our revenues. In 2009, sales to Crystalwise Technology, Inc., Tera Xtal Technology Corp., and Iljin Display Co, Ltd. represented approximately 20%, 17% and 11% of our revenues, respectively. In 2008, sales to Peregrine Semiconductor Corp., Shinkosha Co. Ltd., Crystalwise Technology, Inc., and a fourth customer represented approximately 29%, 17%, 12% and 10% of our revenues, respectively. If we were to lose one of our major customers or have a major customer significantly reduce its volume of business with us, our revenues and profitability would be materially reduced unless we are able to replace such demand with other orders promptly. We expect to continue to be dependent on our significant customers, the number and identity of which may change from period to period.
We generally sell our products on the basis of purchase orders. Delays in product orders could cause our quarterly revenue to vary significantly. A number of factors could cause our customers to cancel or defer orders, including interruptions to their operations due to a downturn in their industries, natural disasters, delays in manufacturing their own product offerings into which our products are incorporated, securing other sources for the products that we manufacture or developing such products internally.
Our manufacturing processes may be interrupted or our production may be delayed if we cannot maintain sufficient electrical supply, which could adversely affect our business, financial condition and operating results.
Our manufacturing process requires a stable source of electricity. From time to time, we have experienced limited disruptions in our supply of electricity. Such disruptions, depending upon their duration, could result in a significant drop in throughput and yield of in-process crystal boules and create delays in our production. Although we use generators and other back-up sources of electricity, these replacement sources of electricity are only capable of providing effective back-up for limited periods of time. We cannot assure you that we will be successful in avoiding future disruptions in power or in mitigating the effects of such disruptions. Any material disruption in electrical supply could delay our production and could adversely affect our business, financial condition and operating results.
Our gross margins and profitability may be adversely affected by rising energy costs.
Our existing manufacturing facilities are covered under an agreement that locks our electricity prices in at current levels through December 31, 2011. Electricity prices could increase due to overall changes to the price of energy due to conditions in the Middle East, natural gas shortages in the US and other economic conditions and uncertainties regarding the outcome and implications of such events. Once our current agreement expires, if electricity prices increase significantly, we may not be able to pass these price increases through to our customers on a timely basis, if at all, which could adversely affect our gross margins and results of operations. In addition, there can be no guarantee that the electricity rates that we negotiate for our new manufacturing facilities will be comparable in cost to our existing agreement.
14
Table of Contents
Our future operating results may fluctuate significantly, which makes our future results difficult to predict and could cause our operating results for particular periods to fall below expectations.
Our revenues and operating results have fluctuated in the past and are likely to fluctuate in the future. These fluctuations are due to a number of factors, many of which are beyond our control. These factors include, among others:
| • | timing of orders from and shipments to major customers; |
| • | the gain or loss of significant customers; |
| • | fluctuations in gross margins as a result of changes in capacity utilization, product mix or other factors; |
| • | market acceptance of our products and our customers’ products; |
| • | our ability to develop, introduce and market new products and technologies on a timely basis; |
| • | the need to pay higher labor costs as we continue to grow; |
| • | announcements of technological innovations, new products or upgrades to existing products by us or our competitors; |
| • | competitive market conditions, including pricing actions by our competitors and our customers’ competitors; |
| • | developments in trade secrets, patent or other proprietary rights by us or our competitors; |
| • | announcements by us or our competitors of significant acquisitions, strategic partnerships or divestitures; |
| • | interruption of operations at our manufacturing facilities or the facilities of our suppliers; |
| • | the level and timing of capital spending of our customers; |
| • | additions or departures of key personnel; |
| • | potential seasonal fluctuations in our customers’ business activities; and |
| • | natural disasters, such as floods, hurricanes and earthquakes, as well as interruptions in power supply resulting from such events or due to other causes. |
The foregoing factors are difficult to forecast, and these, as well as other factors, could materially adversely affect our quarterly or annual operating results. If our revenues or operating results fall below the expectations of investors or any securities analysts that may publish research on our company, the price of our common stock would likely decline.
Our gross margins could decline as a result of changes in our product mix and other factors, which may adversely impact our operating results.
We anticipate that our gross margins will fluctuate from period to period as a result of the mix of products that we sell in any given period, with our larger diameter sapphire products generally yielding higher gross margins than our smaller diameter products. If our sales mix shifts to lower margin products in future periods, our overall gross margin levels and operating results would be adversely impacted. Increased competition and the adoption of alternatives to our products, more complex engineering requirements, lower demand and other factors may lead to a further downward shift in our product margins, leading to price erosion and lower revenues for us in the future.
15
Table of Contents
Our proprietary intellectual property rights may not adequately protect our products and technologies, and the failure to protect such rights could harm our competitive position and adversely affect our operating results.
To protect our technology, we have chosen to rely primarily on trade secrets rather than seeking protection through publicly filed patents. Trade secrets are inherently difficult to protect. While we believe we use reasonable efforts to protect our trade secrets, our directors, employees, consultants or contractors may unintentionally or willfully disclose our information to competitors, whether during or after the termination of their services to our company. If we were to seek to enforce a claim that a third party had illegally obtained and was using our trade secrets, it would be expensive and time consuming, and the outcome would be unpredictable. In addition, courts outside the United States are sometimes less willing to protect trade secrets than US courts. Moreover, if our competitors independently develop equivalent knowledge, methods and know-how, it will be more difficult for us to protect our intellectual property and our business could be harmed.
We have no issued patents covering our products and technologies. Although we have filed applications for three patents, there can be no assurance that these patents will be issued or that any patents issued will be of significant value to our business. Our commercial success will depend on obtaining and maintaining trade secret, patent and other intellectual property protection of our products and technologies. We will only be able to protect products and technologies from unauthorized use by third parties to the extent that valid, protectable and enforceable trade secrets, patents or other intellectual property rights cover them.
If we are not able to defend the trade secret or patent protection positions of our products and technologies, then we may not be able to successfully compete with competitors developing or marketing competing products and we may not generate enough revenue from product sales to justify the cost of development of our products and to achieve or maintain profitability.
The protection of our intellectual property rights and the defense of claims of infringement against us by third parties may subject us to costly litigation.
Other companies might allege that we are infringing certain of their patents or other rights. If we are unable to resolve these matters satisfactorily, or to obtain licenses on acceptable terms, we may face litigation. Any litigation to enforce patents issued to us, to protect trade secrets or know-how possessed by us or to defend us or indemnify others against claimed infringement of the rights of others could have a material adverse effect on our financial condition and operating results. Regardless of the validity or successful outcome of any such intellectual property claims, we may need to expend significant time and expense to protect our intellectual property rights or to defend against claims of infringement by third parties, which could have a material adverse effect on us. If we lose any such litigation where we are alleged to infringe the rights of others, we may be required to:
| • | pay substantial damages; |
| • | seek licenses from others or; |
| • | change, or stop manufacturing or selling, some or all of our products. |
Any of these outcomes could have an adverse effect on our business, results of operations or financial condition.
The markets in which we operate are very competitive, and many of our competitors and potential competitors are larger, more established and better capitalized than we are.
The markets for selling high-quality sapphire products are very competitive and have been characterized by rapid technological change. This competition could result in increased pricing pressure, reduced profit margins, increased sales and marketing expenses, and failure to increase, or the loss of, market share or expected market share, any of which would likely seriously harm our business, operating results and financial condition.
16
Table of Contents
Some of our competitors and potential competitors are substantially larger and have greater financial, technical, marketing and other resources than we do. Given their capital resources, the large companies with which we compete, or may compete in the future, are in a better position to substantially increase their manufacturing capacity and research and development efforts or to withstand any significant reduction in orders by customers in our markets. Such larger companies typically have broader product lines and market focus and thus are not as susceptible to downturns in a particular market. In addition, some of our competitors have been in operation much longer than we have and therefore may have more long-standing and established relationships with our current and potential domestic and foreign customers.
We would be at a competitive disadvantage if our competitors bring their products to market earlier, if their products are more technologically capable than ours, or if any of our competitors’ products or technologies were to become preferred in the industry. Moreover, we cannot assure you that existing or potential customers will not develop their own products, or acquire companies with products that are competitive with our products. Any of these competitive threats could have a material adverse effect on our business, operating results or financial condition.
We are subject to risks from international sales that may harm our operating results.
In 2009 and 2008, revenue from international sales was approximately 75% and 56%, respectively, of our total revenue. We expect that revenue from international sales will continue to constitute a significant portion of our total revenue for the foreseeable future. Our international sales are subject to a variety of risks, including risks arising from:
| • | trading restrictions, tariffs, trade barriers and taxes; |
| • | economic and political risks, wars, acts of terrorism, political unrest, pandemics, such as a recurrence of the SARS outbreak or avian flu, boycotts, curtailments of trade and other business restrictions; |
| • | the difficulty of enforcing contracts and collecting receivables through some foreign legal systems; |
| • | unexpected changes in regulatory requirements and other governmental approvals, permits and licenses; |
| • | sales variability as a result of transacting our foreign sales in US dollars as prices for our products become less competitive in countries with currencies that are low or are declining in value against the US dollar and more competitive in countries with currencies that are high or increasing in value against the US dollar; and |
| • | periodic foreign economic downturns. |
Our future success will depend on our ability to anticipate and effectively manage these and other risks associated with our international sales. Our failure to manage any of these risks could harm our operating results.
We are dependent on the continued services and performance of our senior management, the loss of any of whom could adversely affect our business, operating results and financial condition.
Our future success is dependent on the continued services and continuing contributions of our senior management who must work together effectively in order to design our products, expand our business, increase our revenues and improve our operating results. The loss of services of senior management, particularly Raja M. Parvez, our president and chief executive officer, and William F. Weissman, our chief financial officer, could significantly delay or prevent the achievement of our development and strategic objectives. In addition, key personnel may be distracted by activities unrelated to our business. The loss of the services, or distraction, of our senior management for any reason could adversely affect our business, operating results and financial condition.
17
Table of Contents
If we are unable to attract or retain qualified personnel, our business and product development efforts could be harmed.
Our success depends on our continued ability to identify, attract, hire, train, retain and motivate highly skilled technical, managerial, manufacturing, administrative and sales and marketing personnel. Competition for these individuals is intense, and we may not be able to successfully recruit, assimilate or retain sufficiently qualified personnel. In particular, we may encounter difficulties in recruiting and retaining a sufficient number of qualified technical personnel. The inability to attract and retain necessary technical, managerial, manufacturing, administrative and sales and marketing personnel could harm our ability to obtain new customers and develop new products and could adversely affect our business and operating results.
We rely on a limited number of suppliers for raw materials and key components.
We depend on a small number of suppliers for certain raw materials, components, services and equipment used in manufacturing our products, including key materials such as aluminum oxide and certain furnace components. We generally purchase these items with purchase orders, and we have no guaranteed supply arrangements with such suppliers. We are subject to variations in the cost of raw materials and consumables from period to period. We do not control the time and resources that these suppliers devote to our business, and we cannot be sure that these suppliers will perform their obligations to us or do so on a timely basis. In addition, some of these suppliers are located in regions of the world that may experience periods of political or economic instability.
Any significant delay in product delivery or other interruption or variation in supply from our key suppliers could prevent us from meeting demand for our products and from obtaining future business. If we were to lose key suppliers or our key suppliers were unable to support our demand, our manufacturing operations could be interrupted and we could be required to attempt to establish supply arrangements with other suppliers. In addition, the inability of our suppliers to support our demand could be indicative of a marketwide scarcity of the materials, which could result in even longer interruptions. Any such delay or interruption would impair our ability to meet our customers’ needs and, therefore, could damage our customer relationships and have a material adverse effect on our business and operating results.
Our products must meet exacting specifications, and undetected defects may occur, which may cause customers to return or stop buying our products.
Our customers establish demanding specifications for quality, performance, and reliability that our products must meet. While we inspect our products before shipment, they still may contain undetected defects. If defects occur in our products, we could experience lost revenue, increased costs, delays in, or cancellations or rescheduling of orders or shipments, product returns or discounts or damage to our reputation, any of which would harm our operating results and our business.
We are subject to numerous environmental laws and regulations, which could expose us to environmental liabilities, increase our manufacturing and related compliance costs or otherwise adversely affect our business and operating results.
In our manufacturing process, we use water, oils, slurries, acids, adhesives and other industrial chemicals. We are subject to a variety of foreign, federal, state and local laws and regulations governing the protection of the environment. These environmental laws and regulations include those relating to the use, storage, handling, discharge, emission, disposal and reporting of toxic, volatile or otherwise hazardous materials used in our manufacturing processes. These materials may have been or could be released into the environment at properties currently or previously operated by us, at other locations during the transport of the materials, or at properties to which we send substances for treatment or disposal. If we were to violate or become liable under environmental laws and regulations or become non-compliant with permits required at some of our facilities, we could be held
18
Table of Contents
financially responsible and incur substantial costs, including investigation and cleanup costs, fines and civil or criminal sanctions, third-party property damages or personal injury claims. In addition, new laws and regulations or stricter enforcement of existing laws and regulations could give rise to additional compliance costs and liabilities.
Our operations are concentrated in a small number of nearby facilities, and the unavailability of one or more of these facilities could harm our business.
Our manufacturing, research and development, sales and marketing, and administrative activities are concentrated in our facilities in the Chicago metropolitan area. If, for any reason, including as a result of natural disaster, act of terrorism, war, outbreak of disease or other similar event, any of these facilities should be damaged or destroyed or become inaccessible or inoperable, our ability to conduct our business could be adversely affected or interrupted entirely.
We may acquire other businesses, products or technologies; if we do, we may be unable to integrate them with our business effectively or at all, which may adversely affect our business, financial condition and operating results.
If we find appropriate opportunities, we may acquire complementary businesses, product lines or technologies. However, if we acquire a business, product line or technology, the process of integration may produce unforeseen operating difficulties and expenditures and may absorb significant attention of our management that would otherwise be available for the ongoing development of our business. Further, the acquisition of a business may result in the assumption of unknown liabilities or create risks with respect to our existing relationships with suppliers and customers. If we make acquisitions, we may issue shares of stock that dilute other stockholders, expend cash, incur debt, assume contingent liabilities or create additional expenses related to amortizing intangible assets, any of which may adversely affect our business, financial condition or operating results.
RISKS RELATED TO OWNERSHIP OF OUR COMMON STOCK
The price of our common stock has fluctuated substantially and may continue to do so.
Our common stock has only been publicly traded since November 16, 2007, and the trading price of our common stock has fluctuated substantially. From our initial public offering through February 26, 2010, the trading price of our common stock has ranged from a low of $2.50 to a high of $34.94.
Factors related to our company and our business, as well as broad market and industry factors, may adversely affect the market price of our common stock, regardless of our actual operating performance. Factors that could cause fluctuations in our stock price include, among other things:
| • | changes in market valuations of other companies in our industry; |
| • | changes in financial guidance or estimates by us, by investors or by any financial analysts who might cover our stock or our industry; |
| • | our ability to meet the performance expectations of financial analysts or investors; |
| • | announcements by us or our competitors of significant products, contracts, acquisitions or strategic partnerships; |
| • | general market and economic conditions; and |
| • | the size of the public float of our stock. |
Fluctuations caused by factors such as these may negatively affect the market price of our common stock. In addition, the other risks described elsewhere in this prospectus could adversely affect our stock price.
19
Table of Contents
Our board of directors does not intend to declare or pay any dividends to our stockholders in the foreseeable future.
The declaration, payment and amount of any future dividends will be made at the discretion of our board of directors, and will depend upon, among other things, the results of our operations, cash flows and financial condition, operating and capital requirements, and other factors the board of directors considers relevant. There is no plan to pay dividends in the foreseeable future, and if dividends are paid, there can be no assurance with respect to the amount of any such dividend.
The concentration of our capital stock ownership with our directors and executive officers and their affiliates will limit your ability to influence corporate matters.
Our executive officers and directors and their affiliates together own more than 28% of our outstanding capital stock and voting power. For the foreseeable future, they will have significant influence over our management and affairs and over all matters requiring stockholder approval, including the election of directors and significant corporate transactions, such as a merger or other sale of our company or our assets. Their ownership may limit your ability to influence corporate matters and, as a result, the market price of our common stock could be adversely affected.
We could be the subject of securities class action litigation due to future stock price volatility.
The stock market in general, and market prices for the securities of companies like ours, recently have experienced extreme volatility that often has been unrelated to the operating performance of the underlying companies. These broad market and industry fluctuations may adversely affect the market price of our common stock, regardless of our operating performance. When the market price of a stock declines significantly, holders of that stock have sometimes instituted securities class action litigation against the company that issued the stock. If any of our stockholders brought a lawsuit against us, our defense of the lawsuit could be costly and divert the time and attention of our management.
Our certificate of incorporation, bylaws and Delaware law may discourage takeovers and business combinations that our stockholders might consider in their best interests.
A number of provisions in our certificate of incorporation and bylaws, as well as anti-takeover provisions of Delaware law, may have the effect of delaying, deterring, preventing or rendering more difficult a change in control of Rubicon that our stockholders might consider in their best interests. These provisions include:
| • | establishment of a classified board of directors; |
| • | granting to the board of directors sole power to set the number of directors and to fill any vacancy on the board of directors, whether such vacancy occurs as a result of an increase in the number of directors or otherwise; |
| • | limitations on the ability of stockholders to remove directors; |
| • | the ability of our board of directors to designate and issue one or more series of preferred stock without stockholder approval, the terms of which may be determined at the sole discretion of the board of directors; |
| • | prohibition on stockholders from calling special meetings of stockholders; |
| • | prohibition on stockholders from acting by written consent; and |
| • | establishment of advance notice requirements for stockholder proposals and nominations for election to the board of directors at stockholder meetings. |
20
Table of Contents
These provisions may prevent our stockholders from receiving the benefit from any premium to the market price of our common stock offered by a bidder in a takeover context. Even in the absence of a takeover attempt, the existence of these provisions may adversely affect the prevailing market price of our common stock if they are viewed as discouraging takeover attempts in the future.
The foregoing provisions of our certificate of incorporation and bylaws may also make it difficult for stockholders to replace or remove our management. These provisions may facilitate management entrenchment that may delay, deter, render more difficult or prevent a change in our control, which may not be in the best interests of our stockholders.
| ITEM 1B. | UNRESOLVED STAFF COMMENTS |
None.
| ITEM 2. | PROPERTIES |
Our executive, research and development and manufacturing functions are located on property that we lease in Franklin Park, Illinois and Bensenville, Illinois. These facilities total approximately 102,600 square feet in seven buildings, which includes 30,000 square feet in our Bensenville, Illinois facility, which was opened in January 2008. The leases for these facilities terminate from July 2010 through August 2015. We do not expect that the termination of the lease in July 2010 will have an impact on our business. In the fourth quarter 2008 and throughout 2009, the worldwide economic recession impacted our business resulting in underutilization of our facilities. During the fourth quarter 2009, our crystal growth and fabrication operations returned to full utilization. We expect during 2010 the remaining operations to return to full utilization. We are currently building a 65,000 square foot facility in Penang, Malaysia which will process sapphire grown by us in our Illinois facilities into finished cores and wafers. We anticipate this facility to begin operations in the fall of 2010. We also plan to acquire a 135,000 square foot building in Illinois in 2010 to expand our crystal growth operations. We anticipate this facility beginning operations in the winter of 2010. We believe that our current facilities, together with our planned expansion, are sufficient to meet our current and expected needs.
| ITEM 3. | LEGAL PROCEEDINGS |
From time to time we may be named in claims arising in the ordinary course of business. Currently, there are no legal proceedings or claims pending against us or involving us that, in the opinion of our management, could reasonably be expected to have a material adverse effect on our business or financial condition.
| ITEM 4. | RESERVED |
21
Table of Contents
PART II
| ITEM 5. | MARKET FOR REGISTRANT’S COMMON EQUITY, RELATED STOCKHOLDER MATTERS AND ISSUER PURCHASES OF EQUITY SECURITIES |
Market Information.
Our common stock began trading on the NASDAQ Global Market under the symbol “RBCN” on November 16, 2007. As of February 26, 2010, our common stock was held by approximately 32 stockholders of record and there were 20,241,150 shares of our common stock outstanding. Because many shares of our common stock are held by brokers and institutions on behalf of stockholders, we are unable to estimate the total number of beneficial stockholders represented by these record holders. The closing sales price of our common stock on February 26, 2010 was $15.70 per share as reported by the NASDAQ Global Market. The following table sets forth the high and low sales prices for our common stock as reported on the NASDAQ Global Market for the periods indicated:
| High | Low | |||||
| Fiscal year ended December 31, 2007 |
||||||
| Fourth Quarter (beginning November 16, 2007) |
$ | 25.75 | $ | 14.00 | ||
| High | Low | |||||
| Fiscal year ended December 31, 2008 |
||||||
| First Quarter |
$ | 34.94 | $ | 19.76 | ||
| Second Quarter |
$ | 30.50 | $ | 18.65 | ||
| Third Quarter |
$ | 20.33 | $ | 6.50 | ||
| Fourth Quarter |
$ | 8.47 | $ | 2.50 | ||
| High | Low | |||||
| Fiscal year ended December 31, 2009 |
||||||
| First Quarter |
$ | 7.59 | $ | 3.12 | ||
| Second Quarter |
$ | 16.86 | $ | 5.10 | ||
| Third Quarter |
$ | 17.51 | $ | 8.70 | ||
| Fourth Quarter |
$ | 22.00 | $ | 12.65 | ||
Dividend Policy
We have never declared or paid cash dividends on our common stock. We currently intend to retain future earnings to finance the growth and development of our business, and we do not anticipate declaring or paying any cash dividends in the foreseeable future.
22
Table of Contents
Performance Graph
The following graph compares the cumulative total stockholder return on our common stock during the period from November 16, 2007 (the first trading day following our initial public offering) through December 31, 2009, with the cumulative total returns of the NASDAQ Composite Index and the RDG Technology Composite Index. The graph assumes that the value of the investment in our common stock and in each of the indices (including reinvestment of dividends) was $100 on November 16, 2007.
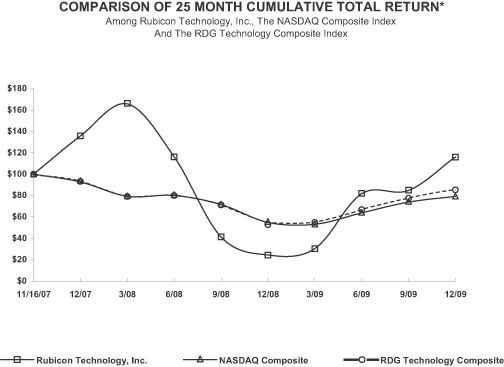
| 11/16/07 | 12/31/07 | 3/31/08 | 6/30/08 | 9/30/08 | 12/31/08 | 3/31/09 | 6/30/09 | 9/30/09 | 12/31/09 | |||||||||||
| Rubicon Technology, Inc. |
100.00 | 135.71 | 165.60 | 116.11 | 41.26 | 24.34 | 30.34 | 81.60 | 84.80 | 116.06 | ||||||||||
| NASDAQ Composite |
100.00 | 92.70 | 79.30 | 80.02 | 71.48 | 54.79 | 53.10 | 63.77 | 73.84 | 79.14 | ||||||||||
| RDG Technology Composite |
100.00 | 93.34 | 78.88 | 81.44 | 71.37 | 52.72 | 54.52 | 65.92 | 77.20 | 85.04 |
The stock price performance reflected in this graph is not necessarily indicative of future stock price performance.
23
Table of Contents
Recent Sales of Unregistered Securities
None.
Use of Proceeds
Our Registration Statement on Form S-1 (333-145880) covering the initial public offering of our shares of common stock was declared effective by the SEC on November 15, 2007.
The net offering proceeds to us after deducting expenses totaled approximately $81.0 million. As of December 31, 2009, we had used approximately $7.6 million of the net proceeds to repay borrowings outstanding under the revolving line of credit financing agreement with Hercules Technology Growth Capital, Inc. and to pay related fees and expenses. We also have used $5.7 million to repurchase shares of our common stock, $2.0 million to purchase Series D-1 preferred shares of Peregrine Semiconductor Corp. (one of our customers) and $24.2 million on capital expenditures and $1.8 million for working capital and general corporate purposes. We intend to use the remaining $39.7 million of the net proceeds for our production capacity expansion project, working capital and other general corporate purposes.
Issuer Purchases of Equity Securities
In November 2008, we announced a repurchase plan approved by our Board of Directors authorizing the purchase of up to $15 million of our outstanding common stock over a period of two years. The stock repurchase program authorizes the Company to purchase shares of our common stock in the open market at times and prices considered appropriate by the Company depending upon prevailing market conditions and other corporate considerations. There was no stock repurchased for the three months ended December 31, 2009.
24
Table of Contents
| ITEM 6. | SELECTED FINANCIAL DATA |
The following selected consolidated financial data should be read in conjunction with “Management’s Discussion and Analysis of Financial Condition and Results of Operations” and our consolidated financial statements and the related notes included elsewhere herein. The consolidated balance sheet data as of December 31, 2009 and 2008 and the consolidated statements of operations data for the years ended December 31, 2009, 2008 and 2007 are derived from our audited consolidated financial statements included elsewhere herein, which have been prepared in accordance with generally accepted accounting principles in the US. The consolidated balance sheet data as of December 31, 2007, 2006 and 2005 and the consolidated statements of operations data for the years ended December 31, 2006 and 2005 have been derived from our audited consolidated financial statements, which are not included in this Form 10-K.
SELECTED CONSOLIDATED FINANCIAL DATA
| Year ended December 31, | ||||||||||||||||||||
| 2009 | 2008 | 2007 | 2006 | 2005 | ||||||||||||||||
| (In thousands, other than share and per share data) | ||||||||||||||||||||
| Consolidated statements of operations data: |
||||||||||||||||||||
| Revenue |
$ | 19,808 | $ | 37,838 | $ | 34,110 | $ | 20,752 | $ | 16,315 | ||||||||||
| Cost of goods sold |
23,427 | 25,746 | 22,045 | 18,885 | 18,508 | |||||||||||||||
| Gross profit (loss) |
(3,619 | ) | 12,092 | 12,065 | 1,867 | (2,193 | ) | |||||||||||||
| Operating expenses: |
||||||||||||||||||||
| General and administrative |
4,811 | 6,691 | 6,157 | 3,298 | 4,688 | |||||||||||||||
| Sales and marketing |
1,137 | 968 | 675 | 1,062 | 1,266 | |||||||||||||||
| Research and development |
801 | 862 | 769 | 679 | 861 | |||||||||||||||
| Asset impairment |
— | — | — | 933 | — | |||||||||||||||
| Loss on disposal of assets |
— | 1,215 | 139 | 42 | 383 | |||||||||||||||
| Total operating expenses |
6,749 | 9,736 | 7,740 | 6,014 | 7,198 | |||||||||||||||
| Income (loss) from operations |
(10,368 | ) | 2,356 | 4,325 | (4,147 | ) | (9,391 | ) | ||||||||||||
| Other income (expense), net |
738 | 2,003 | (7,104 | ) | (3,272 | ) | (2,735 | ) | ||||||||||||
| Income (loss) before income taxes and cumulative effect of change in accounting principle |
(9,630 | ) | 4,359 | (2,779 | ) | (7,419 | ) | (12,126 | ) | |||||||||||
| Income taxes |
— | (4 | ) | (75 | ) | — | — | |||||||||||||
| Income (loss) before cumulative effect of change in accounting principle |
(9,630 | ) | 4,355 | (2,854 | ) | (7,419 | ) | (12,126 | ) | |||||||||||
| Cumulative effect of change in accounting principle(1) |
— | — | — | (221 | ) | — | ||||||||||||||
| Net income (loss) |
(9,630 | ) | 4,355 | (2,854 | ) | (7,640 | ) | (12,126 | ) | |||||||||||
| Dividends on preferred stock |
— | — | (5,625 | ) | (5,563 | ) | (3,924 | ) | ||||||||||||
| Accretion of redeemable preferred stock |
— | — | (59,934 | ) | (23,416 | ) | 4,404 | |||||||||||||
| Net income (loss) attributable to common stockholders |
$ | (9,630 | ) | $ | 4,355 | $ | (68,413 | ) | $ | (36,619 | ) | $ | (11,646 | ) | ||||||
| Net income (loss) per common share attributable to common stockholders |
||||||||||||||||||||
| Basic |
$ | (0.48 | ) | $ | 0.21 | $ | (27.22 | ) | $ | (146.57 | ) | $ | (47.52 | ) | ||||||
| Diluted |
$ | (0.48 | ) | $ | 0.19 | $ | (27.22 | ) | $ | (146.57 | ) | $ | (47.52 | ) | ||||||
| Shares used in computing net income (loss) per common share attributable to common stockholders |
||||||||||||||||||||
| Basic |
20,117,543 | 20,892,040 | 2,513,487 | 249,843 | 245,073 | |||||||||||||||
| Diluted |
20,117,543 | 21,920,861 | 2,513,487 | 249,843 | 245,073 | |||||||||||||||
| (1) | On January 1, 2006 the Company adopted FSP150-5 “Issuer’s Accounting under FASB Statement No. 150 For Freestanding Warrants and Other Similar Investments in Shares that are Redeemable” and recorded approximately $221,000 as a cumulative effect of change in accounting principle. |
| As of December 31, | |||||||||||||||||
| 2009 | 2008 | 2007 | 2006 | 2005 | |||||||||||||
| (In thousands) | |||||||||||||||||
| Consolidated balance sheet data: |
|||||||||||||||||
| Cash and cash equivalents |
$ | 3,860 | $ | 7,629 | $ | 4,380 | $ | 3,638 | $ | 1,466 | |||||||
| Working capital |
55,846 | 56,360 | 76,179 | (388 | ) | 3,600 | |||||||||||
| Total assets |
101,186 | 112,345 | 111,411 | 29,020 | 28,885 | ||||||||||||
| Convertible preferred stock warrant liability |
— | — | — | 3,773 | — | ||||||||||||
| Long-term debt and capital lease obligations, less current portion |
— | — | — | 2,628 | 4,741 | ||||||||||||
| Redeemable convertible preferred stock |
— | — | — | 93,897 | 59,365 | ||||||||||||
| Total stockholders’ equity (deficit) |
97,440 | 108,393 | 105,682 | (77,593 | ) | (39,573 | ) | ||||||||||
25
Table of Contents
| ITEM 7. | MANAGEMENT’S DISCUSSION AND ANALYSIS OF FINANCIAL CONDITION AND RESULTS OF OPERATIONS |
The following discussion and analysis of our financial condition and results of operations should be read together with our financial statements and related notes appearing elsewhere in this annual report. This discussion and analysis contains forward-looking statements that involve risks, uncertainties and assumptions. You should review the “Risk Factors” section of this annual report for a discussion of important factors that could cause actual results to differ materially from the results described in or implied by the forward-looking statements described in the following discussion and analysis.
OVERVIEW
We are an advanced electronic materials provider that develops, manufactures and sells monocrystalline sapphire and other innovative crystalline products for LEDs, RFICs, blue laser diodes, optoelectronics and other optical applications. The emergence of sapphire in commercial volumes at competitive prices has enabled the development of new technologies such as HB white, blue and green LEDs and highly-integrated RFICs. We apply our proprietary crystal growth technology to produce high-quality sapphire products efficiently to supply our end-markets, and we work closely with our customers to meet their quality and delivery needs.
We are a vertically integrated manufacturer of high-quality sapphire substrates and optical windows that are used in a variety of high-growth, high-volume end-market applications. Our largest product line is two to four inch sapphire cores and wafers for use in LEDs and blue laser diodes for solid state lighting and electronic applications. In addition, we sell six inch sapphire wafers that are used for SOS RFICs, as well as products for military, aerospace, sensor and other applications. We have also extended our technology, which gives us the ability to produce cores and wafers of up to twelve inches in diameter to support next-generation LED and SOS RFIC production. We currently sell six and eight inch wafers to LED chip manufacturers for their research and development efforts toward moving production on to these larger diameter substrates. We have also developed the ability to produce large diameter circular and rectangular sapphire windows for use in various optical window applications.
Our revenue in the fourth quarter of 2008 and through most of 2009 was significantly impacted by the global recession. Much of the sapphire we sell into the marketplace goes into LED lighting for consumer electronics. Consumer spending on these products declined during the recession, which decreased demand for our products. Toward the end of 2009, demand for sapphire began to strengthen as consumers resumed spending on consumer electronics, driven, in part, by the introduction of new products such as LED backlit LCD televisions. In addition, general lighting applications for LEDs continued to expand. We expect demand for sapphire to remain strong throughout 2010.
We sell our products on a global basis. The Asian, North American and European markets accounted for 72%, 25% and 3%, respectively, of our revenue for the year ended December 31, 2009, 53%, 44% and 3%, respectively, for the year ended December 31, 2008 and 72%, 26% and 2%, respectively, for the year ended December 31, 2007. Revenue declined in all markets in 2009 primarily due to the recession. In addition, our North American revenue in 2009 was impacted by lower orders in the period from our key customer in the SOS RFIC market due to a build-up of inventory at that customer.
We currently depend on a small number of suppliers for certain raw materials, components, services and equipment, including key materials such as aluminum oxide and certain furnace components. If the supply of these components were to be disrupted or terminated, or if these suppliers were unable to supply the quantities of raw materials required, we may have difficulty in finding or may be unable to find alternative sources for these items. As a result, we may be unable to meet the demand for our products, which could have a material adverse impact on us.
We provide direct sales from our Franklin Park, Illinois offices. Additionally, we use an independent commission-based sales representative in China to assist in supporting our customers in that country. Customers
26
Table of Contents
in China place orders directly with us. Substantially all of our revenue is generated by our direct sales force and we expect this to continue in the future.
We manufacture and ship our products from our facilities in the Chicago metropolitan area. We have approximately 102,600 square feet of manufacturing and office space. We are currently building a 65,000 square foot facility in Penang, Malaysia, which will process sapphire grown by us in our Illinois facilities into finished cores and wafers. We anticipate this facility to open in the fall of 2010. We also plan to acquire a 135,000 square foot building in Illinois in 2010 to expand our crystal growth operations. We anticipate this facility will begin operations in the winter of 2010.
Financial operations
Revenue. Our revenue consists of sales of sapphire materials sold in core, as-cut, as-ground and polished forms in two, three, four, six and eight inch diameters as well as optical materials sold as blanks or polished windows. Products are made to varying specifications, such as crystal planar orientations and thicknesses. We have focused on increasing sales of larger diameter substrates, which we define as three inch or greater in diameter, as they generally yield higher gross margins. Sales decreased across all product lines for year ended December 31, 2009, due primarily to the global recession. Demand began to improve in the second half of 2009 and we anticipate strong demand for sapphire through 2010. Average selling prices for our products declined significantly in late 2008 and early 2009 due to weak demand. However, with demand strengthening in late 2009, we began raising prices and we believe pricing will continue to increase in 2010, although it is difficult to predict the magnitude and timing of further price increases.
Historically, a significant portion of our revenue has been derived from sales to relatively few customers. For the year ended December 31, 2009, we had three customers that accounted for approximately 20%, 17%, and 11% of our revenue. For the year ended December 31, 2008, we had four customers that accounted for approximately 29%, 17%, 12% and 10% of our revenue. For the year ended December 31, 2007, we had three customers that accounted for approximately 26%, 21%, and 15% of our revenue. Other than as discussed above, none of our customers accounted for more than 10% of our revenue for such periods. Although we are attempting to diversify and expand our customer base, we expect our revenue to continue to be concentrated among a small number of customers. We expect that our significant customers may change from period to period.
We recognize revenue upon shipment to our customers. Delays in product orders or changes to the timing of shipments could cause our quarterly revenue to vary significantly. We derive a significant portion of our revenue from customers outside of the US. The majority of our sales are to the Asian market and we expect that region to continue to be a major source of revenue for us. All of our revenue and corresponding accounts receivable are denominated in US dollars.
Research and development revenue is recognized as services are performed. We execute agreements with our customers that clearly describe the scope of the project, the services we will provide, ownership of any tangible or intangible assets generated as part of the project, and the amount of consideration we will receive.
Cost of goods sold. Our cost of goods sold consists primarily of manufacturing materials, labor, manufacturing-related overhead such as utilities, depreciation and rent, provisions for excess and obsolete inventory reserves, freight and warranties. We manufacture our products at our Franklin Park, Illinois and Bensenville, Illinois manufacturing facilities based on customer orders. We purchase materials and supplies to support such demand. We are subject to variations in the cost of raw materials and consumables from period to period because we do not have long-term fixed-price agreements with our suppliers. For the years ended December 31, 2009, 2008 and 2007, utility costs represented approximately 12%, 13% and 9%, of our cost of goods sold, respectively. Our existing manufacturing facilities are covered under an agreement that locks in electricity prices in at current levels through December 31, 2011. Once our current agreement expires, if electricity prices increase significantly, we may not be able to pass these price increases through to our customers
27
Table of Contents
on a timely basis, if at all, which could adversely affect our gross margins and results of operations. In addition, there can be no guarantee that the electricity rates that we negotiate for our new manufacturing facilities will be comparable in cost to our existing agreement.
Gross profit. Our gross profit began decreasing in the second half of 2008 and we realized a gross loss for the full year 2009 due to underutilization of our facilities and staff as well as a decline in average selling prices of our products as a result of the worldwide economic downturn. With the return of demand for sapphire and the resulting increase in average selling prices in late 2009, we returned to a gross profit in the fourth quarter of 2009. We expect average selling prices to continue to increase in 2010, which would further improve gross profit. Our gross profit has been and will continue to be affected by a variety of factors, including average sales prices of our products, product mix, our ability to reduce manufacturing costs and fluctuations in the cost of electricity, raw materials and other supplies.
General and administrative expenses. General and administrative expenses (“G&A”) consist primarily of salaries and associated costs for employees in finance, human resources, information technology and administrative activities, charges for outside accounting, legal, insurance fees and stock-based compensation.
Sales and marketing expenses. Sales and marketing expenses consist primarily of salaries and associated costs for employees engaged in sales activities, commissions paid to third party representatives, product samples, charges for participation in trade shows and travel. We expect these expenses to increase in future periods based on planned additions to sales staff and travel to expand our customer base.
Research and development expenses. Research and development (“R&D”) expenses include costs related to engineering personnel, materials and other product development related costs. R&D is expensed as incurred. We believe our R&D expenses will generally increase as we continue to develop new products.
Other income (expense). Other income (expense) consists of interest income and expense, and realized gains and losses on investments. We repaid most of our outstanding indebtedness with a portion of the proceeds from our initial public offering in November 2007 and repaid the remainder in February 2008. Proceeds from our initial public offering were invested in available-for-sale and trading securities.
The change in carrying value of preferred stock warrants recorded in 2007 is associated with the value of warrants classified as liabilities. These warrants converted into common stock warrants in connection with our initial public offering. We no longer incur this non-cash gain or loss following the conversion of these warrants to common stock warrants. Additional information on our accounting for change in carrying value of preferred stock warrants is provided in “—Critical accounting policies and estimates.”
Provision for income tax. We account for income taxes under the asset and liability method whereby the expected future tax consequences of temporary differences between the book value and the tax basis of assets and liabilities are recognized as deferred tax assets and liabilities, using enacted tax rates in effect for the year in which the differences are expected to be recognized. A full valuation allowance is provided as management cannot conclude that it is more likely than not that our deferred tax assets will be realized. At December 31, 2009, we had $55.6 million in net operating loss carryforwards (“NOLs”). We believe that we are not restricted in our ability to use the full amount of the NOLs, nor is there a limit to the amount of NOLs that may be used in any given year however, we will be updating our analysis in 2010 and the results of that analysis may indicate an ownership change . If an ownership change is determined, the utilization of the net operating losses may be limited. As of December 31, 2009, no tax benefit has been recognized for these loss carryforwards.
Stock-based compensation. The majority of our stock-based compensation relates primarily to administrative personnel and is accounted for as a general and administrative expense. For the years ended December 31, 2009, 2008 and 2007, our stock-based compensation expense was $937,000, $771,000 and $754,000, respectively.
28
Table of Contents
RESULTS OF OPERATIONS
The following table sets forth our statements of operations for the periods indicated:
| Year ended December 31, |
|||||||||||
| 2009 | 2008 | 2007 | |||||||||
| (in millions) | |||||||||||
| Revenue |
$ | 19.8 | $ | 37.8 | $ | 34.1 | |||||
| Cost of goods sold |
23.4 | 25.7 | 22.0 | ||||||||
| Gross profit (loss) |
($ | 3.6 | ) | 12.1 | 12.1 | ||||||
| Operating expenses: |
|||||||||||
| General and administrative |
4.8 | 6.7 | 6.2 | ||||||||
| Sales and marketing |
1.1 | 1.0 | 0.7 | ||||||||
| Research and development |
0.8 | 0.8 | 0.8 | ||||||||
| Loss on disposal of assets |
1.2 | 0.1 | |||||||||
| Total operating expenses |
6.7 | 9.7 | 7.8 | ||||||||
| Income (loss) from operations |
(10.3 | ) | 2.4 | 4.3 | |||||||
| Other income (expense) |
0.7 | 2.0 | (7.1 | ) | |||||||
| Income (loss) before income taxes |
(9.6 | ) | 4.4 | (2.8 | ) | ||||||
| Income taxes |
— | — | (0.1 | ) | |||||||
| Net income (loss) |
($ | 9.6 | ) | $ | 4.4 | ($ | 2.9 | ) | |||
The following table sets forth our statements of operations as a percentage of revenue for the periods indicated:
| Year ended December 31, |
|||||||||
| 2009 | 2008 | 2007 | |||||||
| (percentage of total) | |||||||||
| Revenue |
100 | % | 100 | % | 100 | % | |||
| Cost of goods sold |
118 | 68 | 65 | ||||||
| Gross profit (loss) |
(18 | ) | 32 | 35 | |||||
| Operating expenses: |
|||||||||
| General and administrative |
25 | 18 | 18 | ||||||
| Sales and marketing |
5 | 2 | 2 | ||||||
| Research and development |
4 | 2 | 2 | ||||||
| Loss on disposal of assets |
3 | 1 | |||||||
| Total operating expenses |
34 | 25 | 23 | ||||||
| Income (loss) from operations |
(52 | ) | 7 | 12 | |||||
| Other income (expense) |
4 | 5 | (21 | ) | |||||
| Income (loss) before income taxes |
(48 | ) | 12 | (9 | ) | ||||
| Income taxes |
— | — | — | ||||||
| Net income (loss) |
(48 | )% | 12 | % | (9 | )% | |||
29
Table of Contents
Comparison of years ended December 31, 2009 and 2008
Revenue. Revenue was $19.8 million for the year ended December 31, 2009 and $37.8 million for the year ended December 31, 2008, a decrease of $18.0 million, or 48%. The impact of the worldwide economic crisis resulted in lower revenue across all product lines for the year ended December 31, 2009. Revenue from the sale of our LED substrate products for the year ended December 31, 2009 decreased $7.8 million. An $8.9 million decrease in revenue due to lower average selling prices as a result of reduced demand was partially offset by an increase in volume of $1.1 million. The SOS RFIC business was also impacted by the downturn in the consumer electronics market. In addition, revenue from this market was impacted by lower orders in 2009 from our key SOS RFIC customer due to a build-up of inventory at that customer. Revenue for the SOS RFIC business decreased 81%, or $7.2 million, of which $7.1 million was attributable to a decrease in volume and $146,000, was attributable to a decrease in pricing. We completed an R&D contract in 2008 and, as a result, our revenue from research and development was $1.8 million lower in 2009 than it was in the prior year. We do not currently have any open R&D contracts with customers. Revenue from our optical products was lower in 2009 by $1.3 million as the market for sapphire used for sensor and instrumentation applications was also affected by the economic slowdown. Demand for our products began to improve in the second half of 2009 and our average selling prices began to increase in the fourth quarter of 2009. Fourth quarter 2009 total revenue increased 111% from the fourth quarter 2008 as the market began to rebound significantly. We expect demand for sapphire to continue to strengthen in 2010 and anticipate a further increase in pricing of our products as a result of an increase in demand for LED based products including backlighting units used in LED backlit LCD televisions, notebook computers, and desktop monitors.
Gross profit (loss). Gross profit (loss) was ($3.6) million for the year ended December 31, 2009 and $12.1 million for the year ended December 31, 2008, a decrease of $15.7 million. The revenue decline of $18.0 million in 2009 was partially offset by a reduction in manufacturing expenses of $2.3 million. We also experienced lower contract revenue of $1.8 million in 2009 which had little or no direct costs. With the decrease in orders we also experienced lower utilization of equipment and staff which resulted in underabsorbed manufacturing costs of $5.6 million. The remaining decrease in gross profit was primarily attributable to lower average selling prices. In the fourth quarter 2009, we achieved a positive gross profit margin of 12%. With increasing prices, better product mix and improved utilization of equipment and staff, we expect gross profit to continue to improve in 2010.
General and administrative expenses. G&A expenses were $4.8 million for the year ended December 31, 2009 and $6.7 million for the year ended December 31, 2008, a decrease of $1.9 million. The decrease was primarily due an adjustment to our bad debt reserve of $1.1 million. We were able to reduce our reserve in 2009 as our customer’s improved economic condition reduced the uncertainty regarding our customer’s ability to pay us. We also experienced a decrease of $729,000 of costs associated with a follow-on public offering incurred in 2008 and not in 2009, and a $515,000 decrease in bonuses as no bonus expense was incurred in 2009. The decreases were offset by $225,000 in increased legal costs, $120,000 in increased salary and stock compensation expenses, and $84,000 in higher business insurance premiums.
Sales and marketing expenses. Sales and marketing expenses were $1.1 million for the year ended December 31, 2009 and $968,000 for the year ended December 31, 2008, an increase of $169,000. The increase in sales and marketing expenses is primarily attributable to additional payroll expenses of $138,000, which includes a salesperson in the Japan sales office that opened in 2009, as well as $27,000 in costs associated with operating the Japan sales office.
Research and development expenses. R&D expenses were $801,000 for the year ended December 31, 2009 and $862,000 for the year ended December 31, 2008, a decrease of $61,000. The decrease was primarily attributable to a decrease in payroll costs of $84,000 offset by an increase of $22,000 in materials purchased for research projects and other costs.
Other income. Other income was $738,000 for the year ended December 31, 2009 and $2.0 million for the year ended December 31, 2008, a decrease in other income of $1.3 million. The decrease was primarily due to a $1.4 million decrease in interest income as a result of lower investment principal and lower average returns.
30
Table of Contents
Comparison of years ended December 31, 2008 and 2007
Revenue. Revenue was $37.8 million for the year ended December 31, 2008 and $34.1 million for the year ended December 31, 2007, an increase of $3.7 million, or 11%. Revenue increased across all product lines except for six inch as ground wafers, which declined by $2.8 million as we shifted six inch capacity to six inch polished production. Revenue from six inch polished products to the SOS RFIC market increased by $3.9 million. Our revenue increase is also attributable to an increase in volume shipments of larger diameter substrates to the LED industry resulting in additional revenue of $1.9 million partially offset by lower pricing of $1.2 million. We also achieved higher revenue of $670,000 from optical products due to increased sales of sapphire and fluorides for military, sensor and instrumentation applications as we continued our efforts to increase our share of this market. We had higher contract research revenue of $1.1 million as we met deliverables associated with our contract for the development of eight inch wafers. Fourth quarter 2008 revenue from the LED industry was down approximately 55% from both the prior quarter and from the fourth quarter of 2007 as the impact of the worldwide economic crisis resulted in excess inventory throughout the LED supply chain which significantly reduced orders. In addition, the SOS RFIC business is largely dependent upon the consumer electronics market which also had a significant downturn in the fourth quarter of 2008. Consequently, we had no SOS RFIC revenue in the fourth quarter of 2008.
Gross profit. Gross profit was $12.1 million for the year ended December 31, 2008 and for the year ended December 31, 2007. Gross profit in 2008 was unchanged from 2007 as sales of higher margin products increased and an increase of $1.1 million of direct contract revenue which has little direct cost associated with it were partially offset by increased costs attributable to lower utilization of equipment and staff which resulted in underabsorbed manufacturing costs of approximately $1.2 million as a result of decreased demand in the fourth quarter of 2008.
General and administrative expenses. G&A expenses were $6.7 million for the year ended December 31, 2008 and $6.2 million for the year ended December 31, 2007, an increase of $533,000. The increase was primarily due to $1.1 million of higher audit, investor related, insurance, legal and board costs associated with operating as a public company, $729,000 of costs associated with a follow-on public offering, a $486,000 increase in bad debt expense due to slower customer payments, and a $93,000 increase in franchise taxes due to increased assets and capitalization of the company, partially offset by a $1.2 million reduction in bonuses due to lower performance bonuses and no IPO bonuses being paid in 2008. In addition, partially offsetting the increase were $210,000 of lawsuit settlement payments and $415,000 of financing fees associated with debt refinancing and extinguishment not incurred in 2008.
Sales and marketing expenses. Sales and marketing expenses were $968,000 for the year ended December 31, 2008 and $675,000 for the year ended December 31, 2007, an increase of $293,000. The increase in sales and marketing expenses is attributable to additional payroll expenses of $156,000 for new sales personnel to support and grow our optical and substrate businesses and payroll taxes associated with the exercise of stock options. Marketing expenses associated with efforts to increase our customer base and expand our optical business also increased by $103,000.
Research and development expenses. R&D expenses were $862,000 for the year ended December 31, 2008 and $769,000 for the year ended December 31, 2007, an increase of $93,000. The increase was primarily attributable to an increase in payroll costs of $170,000 offset by a decrease of $78,000 in materials purchased for research projects and other costs.
Other income (expense). Other income (expense) was $2.0 million for the year ended December 31, 2008 and $(7.1) million for the year ended December 31, 2007, an increase in net other income of $9.1 million. The increase was due in part to the elimination of charges relating to the carrying value of preferred stock warrants, which were $6.0 million in the year ended December 31, 2007. Interest expense decreased by $1.5 million as a result of extinguishing our debt, and interest income increased by $1.7 million on interest earned on invested
31
Table of Contents
proceeds from our IPO. Also included in the year ended December 31, 2008 was a recognized net realized loss on investments of $55,000 which reflected a gain of $1.6 million representing the initial fair value of auction rate security put options and the changes in the fair value of the put options, partially offset by a loss of $1.7 million which represented the recognizing of unrealized losses previously recorded in comprehensive income due to the transfer of auction rate securities from available-for-sale to trading securities and the subsequent changes in the fair value of the auction rate securities from the election date to the end of the year.
LIQUIDITY AND CAPITAL RESOURCES
We have historically funded our operations using a combination of issuances of common and preferred stock, a working capital line of credit and term loans and cash generated from our operations. Since our inception, we have raised approximately $136.0 million of equity from both private and public issuances of common and preferred stock.
As of December 31, 2009, we had cash and short term investments totaling $44.6 million, including cash of $1.1 million held in deposits at major banks, $2.8 million invested in money market funds and short term investments in certificates of deposit, commercial paper, state and local bonds, auction-rate securities and put options, and U.S. treasury securities of $40.7 million. Our long term investment consists of a $2.0 million investment in Peregrine Semiconductor, Corp. (one of our customers) Series D1 preferred stock. In February 2008, we began experiencing failed auctions of our entire auction-rate securities portfolio, resulting in our inability to sell these securities in the short term. All of the auction-rate securities are AAA rated by one or more of the major credit rating agencies and have contractual maturities from 2036 to 2045. Further, all of these securities are collateralized by student loans, and approximately 99% of the collateral qualifies under the Federal Family Education Loan Program and is guaranteed by the US government. We are receiving the underlying cash flows (interest and redemptions) on all of our auction-rate securities. We are unable to predict if these funds will become available before their maturity dates. We also hold put options associated with an agreement with UBS, AG related to the auction-rate securities purchased through them. It is our intent to exercise these put options at the first available date. Therefore, the auction-rate securities and the related put options have been classified as short-term investments as of December 31, 2009.
In October 2008, we entered into an agreement with UBS, AG, which provides us with certain rights to sell to UBS, AG all of our auction-rate securities that were purchased through them. We have the option to sell these securities to UBS, AG at par value from June 30, 2010 through July 2, 2012. UBS, AG, at its discretion, may purchase or sell these securities on our behalf at any time, provided we receive par value for the securities sold. The issuers of the auction-rate securities continue to have the right to redeem the securities at their discretion. This agreement also permits us to establish a demand revolving credit line in an amount equal to the par value of the securities at a net no cost. If our debt is determined to be rated below investment grade or is not rated, the amount that can be borrowed is limited to 75% of the market value of the auction-rate securities. As of December 31, 2009, we had no loans outstanding under this agreement.
Our right to sell the auction-rate securities to UBS, AG commencing on June 30, 2010 represents put options for a payment equal to the par value of the auction-rate securities. We value the put options at their estimated fair value using a discounted cash flow model. During the years ended December 31, 2009 and 2008, we recorded a realized gain (loss) of ($459,734) and $1,611,343, respectively, representing the changes in fair value of the put options. We also recorded during years ended December 31, 2009 and 2008, a gain (loss) of $506,504 and ($1,666,766) respectively, representing the changes in fair value of the auction-rate securities. Both the gain and loss from recording the change in fair value of the put options and auction-rate securities were recorded in gain (loss) on investments in the Consolidated Statements of Operations. We do not expect to need access to the auction-rate securities capital prior to the maturity of the auction-rate security put options.
32
Table of Contents
Cash flows from operating activities
Cash used in operating activities was $3.3 million for the year ended December 31, 2009. During such period, we generated a net loss of $9.6 million, which included non-cash charges of $6.3 million, including depreciation expense of $5.3 million and stock-based compensation expense of $937,000. During such period, cash from net working capital increased by $107,000 which was composed of an increase in accounts receivable of $2.4 million due to higher sales in the fourth quarter, an increase of accrued other liabilities of $463,000 primarily due to the amount owed on land purchased in Malaysia, a decrease in inventory of $1.3 million due to sales product mix requirements, a decrease in spare parts of $1.4 million due to the increased usage of furnace material inventory, a decrease in accounts payable of $445,000 due to timing of ordering and payments and a decrease in accrued payroll of $162,000 attributable to the decrease in performance based bonus expenses offset by the increase in headcount.
Cash provided by operating activities was $1.5 million for the year ended December 31, 2008. During such period, we generated net income of $4.4 million, which included non-cash charges of $6.5 million, including depreciation expense of $4.5 million, net loss on disposal of equipment of $1.2 million, and stock-based compensation expense of $771,000. We experienced an increase during such period in inventory of $5.4 million due primarily to an increase in safety stocks of raw material and sapphire boule inventory of $4.2 million and an increase of $1.0 million in other work in process and finished goods inventory. There is no shelf life to our raw material and essentially all of our products can be manufactured from any one boule. Therefore, building a safety stock of this inventory enables us to quickly respond to an increase in demand from our customers. We also experienced an increase in spare parts of $2.4 million due to an increase in furnace material inventory used to support a larger number of furnaces, deferred revenue decreased by $583,000 due to recognition of revenue deferred on a research and development project, accrued payroll decreased by $637,000 on a lower performance based bonus accrual and other accrued liabilities decreased by $252,000 due to timing of payments. The $5.6 million decrease in cash provided by operating activities for the year ended December 31, 2008, compared to the year ended December 31, 2007, is primarily attributable to an increase of $7.7 million of raw material, boule and spare parts inventories in the year ended December 31, 2008 compared to an increase of $1.3 million in the year ended December 31, 2007 as safety stocks were increased. This was partially offset by net income of $4.4 million for the year ended December 31, 2008, compared to a net loss of $2.9 million for the year ended December 31, 2007, which included $6.0 million of non-cash change in carrying value of preferred stock. Net income increased on higher revenue on higher margin larger diameter products but was partially offset by higher production costs attributable to lower utilization of equipment and staff as a result of a decrease in fourth quarter 2008 production as orders and demand declined.
Cash provided by operating activities was $7.1 million for the year ended December 31, 2007. During such period, we generated a net loss of $2.9 million and incurred non-cash charges of $11.1 million, including depreciation expense of $3.4 million, change in carrying value of preferred stock warrant expense of $6.0 million, stock-based compensation expense of $754,000, net loss on disposal of equipment of $139,000 and interest expense related to debt accretion of $769,000. We experienced an increase during such period in accounts receivable of $1.7 million on increased sales, an increase in accounts payable of $1.1 million and an increase in inventory and spare parts of $1.3 million due primarily to an increase in safety stock of raw material inventory. We also experienced an increase in corporate income and franchise taxes of $310,000 due to an increase in assets and capitalization from our initial public offering and an increase in deferred revenue of $518,000 due to revenue deferral on a research and development project. The $6.4 million increase in cash provided by operating activities for the year ended December 31, 2007, compared to the year ended December 31, 2006, is primarily attributable to a net loss of $2.9 million for the year ended December 31, 2007, compared to a net loss of $7.6 million for the year ended December 31, 2006, as sales volume and pricing increased and our production costs declined. Further, the non-cash change in carrying value of preferred stock warrant expense for the year ended December 31, 2007 was $6.0 million compared to $2.2 million for the year ended December 31, 2006. As sales increased in 2007, we experienced increases in accounts receivable and inventory partially offset by increases in accounts payable in order to meet the rising customer demands.
33
Table of Contents
Cash flows used in investing activities
Net cash provided by (used in) investing activities was $1.7 million, $4.3 million, and ($81.5) million for the years ended December 31, 2009, 2008 and 2007, respectively. In 2009, we used approximately $3.8 million to purchase components to construct additional crystal growth furnaces, approximately $645,000 to expand and upgrade our Bensenville, Illinois facility and $354,000 for other upgrades in our fabrication, slicing, and polishing operations. We also used $681,000 to purchase land in Malaysia to continue to expand our capacity. We purchased additional investments of $693,000 using investment earnings proceeds. This was offset by proceeds from sales of investments of $7.9 million. In 2008, we used approximately $12.8 million to purchase components used to construct additional crystal growth furnaces, approximately $2.0 million for infrastructure changes needed to expand operations in our Bensenville, Illinois facility and approximately $3.9 million to purchase various equipment used to expand our production capacity in support of our sales growth. We purchased additional investments of $2.0 million using investment earnings proceeds. This was partially offset by proceeds from sales of investments of $25.0 million. In 2007, we used approximately $7.1 million to purchase components used to construct additional crystal growth furnaces, approximately $1.7 million for infrastructure changes needed to commence operations in our new Bensenville, Illinois facility and approximately $1.7 million to purchase various equipment used to expand our production capacity in support of our sales growth. Also in 2007, we used the proceeds of our initial public offering to purchase short term investment securities.
We are planning on expanding our crystal growth facilities in Illinois and are building a facility in Malaysia that will support post crystal growth manufacturing. It is difficult to predict the timing of capital expenditures on these projects, but we anticipate the total cost of these projects to be between $60 and $65 million to be spent over a two year period and expect our 2010 capital expenditures to be between $35 million and $45 million.
Cash flows from financing activities
Net cash provided by (used in) financing activities was ($2.2) million, ($2.5) million and $75.1 million for the years ended December 31, 2009, 2008 and 2007, respectively. Net cash used in financing activities for 2009 reflects stock repurchases of $2.6 million, partially offset by the proceeds from the exercise of stock options of $420,000. Net cash used in financing activities for 2008 reflects stock repurchases of $3.1 million, partially offset by proceeds from the exercise of stock options of $602,000. Net cash provided by financing activities for 2007 reflects net proceeds received from our initial public offering of $81.1 million, offset by the net repayment of borrowings of $6.0 million.
Future liquidity requirements
We believe that our existing cash, cash equivalents, investments, and anticipated cash flows from operating activities will be sufficient to continue our expansion projects for the next twelve months. However, we may secure debt or additional equity financing over the next year to provide additional liquidity. Our cash needs include cash required to fund our operations, taking into account the capital needed to fund our planned expansions in the US and Asia. If the assumptions underlying our business plan regarding future revenues and expenses change, or if unexpected opportunities or needs arise, we may seek to raise additional cash by selling equity or convertible debt securities. If we raise additional funds through the issuance of equity or convertible debt securities, the percentage ownership of our stockholders could be significantly diluted, and these newly-issued securities may have rights, preferences or privileges senior to those of existing stockholders. If we obtain debt financing, a substantial portion of our operating cash flow may be dedicated to the payment of principal and interest on such indebtedness, and the terms of the debt securities issued could impose significant restrictions on our operations. If we are unable to obtain financing on terms favorable to us, we may be unable to successfully execute our business plan.
34
Table of Contents
Contractual obligations
The contractual obligations presented in the table below represent our estimates of future payments under fixed contractual obligations and commitments at December 31, 2009. Changes in our business needs as well as actions by third parties and other factors may cause these estimates to change. Because these estimates are complex and necessarily subjective, our actual payments in future periods are likely to vary from those presented in the table. The following table sets forth information relating to our contractual obligations at December 31, 2009:
| Payments due in | |||||||||||||||
| Total | Less than 1 year |
1-3 years |
3-5 years |
More than 5 years | |||||||||||
| (in millions) | |||||||||||||||
| Operating lease obligations |
$ | 5.8 | $ | 1.2 | $ | 2.3 | $ | 2.1 | $ | 0.2 | |||||
| Purchase order obligations |
1.0 | 1.0 | — | — | — | ||||||||||
| Building construction obligations |
5.3 | 5.3 | — | — | — | ||||||||||
| Total contractual obligations |
$ | 12.1 | $ | 7.5 | $ | 2.3 | $ | 2.1 | $ | 0.2 | |||||
OFF-BALANCE SHEET ARRANGEMENTS
During 2009, 2008 and 2007, we did not engage in any off-balance sheet arrangements. We do not have any interest in entities referred to as variable interest entities, which includes special purpose entities and other structured finance entities.
| ITEM 7A. | QUANTITATIVE AND QUALITATIVE DISCLOSURE ABOUT MARKET RISK |
Market risk is the risk of loss related to changes in market prices, including interest rates, of financial instruments that may adversely impact our financial position, results of operations or cash flows.
Foreign currency exchange risk. To date, substantially all of our international sales have been transacted in US dollars. Accordingly, we have limited exposure to foreign currency exchange rates and do not enter into foreign currency hedging transactions.
Interest rate risk. We do not have any long-term borrowings. Our investments consist of cash, cash equivalents, commercial paper, state and local bonds, and US treasury securities. The primary objective of our investment activities is to preserve principal while maximizing income without significantly increasing risk. We do not enter into investments for speculative purposes. Our investments are exposed to market risk due to a fluctuation in interest rates, which may affect our interest income and the fair market value of our investments. Due to the short-term nature of our investment portfolio, we do not believe an immediate 10% increase or decrease in interest rates would have a material effect on the fair market value of our portfolio, and therefore we do not expect our operating results or cash flows to be materially affected by a sudden change in market interest rates.
Inflation. Our operations have not been, and we do not expect them to be, materially affected by inflation. However, historically, the prices we charge our customers are market driven, and therefore we may not be able to increase our prices to offset any increase in our material or labor costs. Our inability or failure to do so could harm our business, financial condition and results of operations.
CRITICAL ACCOUNTING POLICIES AND ESTIMATES
The preparation of financial statements in accordance with accounting principles generally accepted in the US requires us to make estimates, assumptions and judgments that affect the amounts reported in our financial statements and the accompanying notes. We base our estimates on historical experience and various other
35
Table of Contents
assumptions that we believe to be reasonable. Although these estimates are based on our present best knowledge of the future impact on the company of current events and actions, actual results may differ from these estimates, assumptions and judgments.
We consider to be critical those accounting policies that require our most subjective or complex judgments, which often result from a need to make estimates about the effect of matters that are inherently uncertain, and that are among the most important of our accounting policies in the portrayal of our financial condition and results of operations. We believe the following to be our critical accounting policies, including the more significant estimates and assumptions used in preparation of our financial statements.
Revenue recognition. We recognize revenue from sales of products when:
| • | Persuasive evidence of an arrangement exists. We require evidence of a purchase order with the customer specifying the terms and specifications of the product to be delivered, typically in the form of a signed quotation or purchase order from the customer. |
| • | Title has passed and the product has been delivered. Title passage and product delivery generally occur when the product is delivered to a common carrier. |
| • | The price is fixed or determinable. All terms are fixed in the signed quotation or purchase order received from the customer. The purchase orders do not contain rights of cancellation, return, exchanges or refunds. |
| • | Collection of the resulting receivable is reasonably assured. Our standard arrangement with customers includes 30 day payment terms. Customers are subject to a credit review process that evaluates each customer’s financial position and its ability to pay. We determine collectability by considering the length of time the customer has been in business and our history of collections with that customer. If it is determined that collection is not probable, no product is shipped and no revenue is recognized unless cash is received in advance. |
R&D revenue is recognized as services are performed. We execute agreements with our customers that clearly describe the scope of the project, the services we will provide, ownership of any tangible or intangible assets generated as part of the project, and the amount of consideration we will receive.
There are no significant judgments or estimates associated with our revenue recognition policies or processes. All of our revenue is denominated in US dollars.
Inventory. We value our inventory at the lower of cost or market. Market is determined based on net realizable value. Cost is determined for raw materials on a first-in, first-out basis and work in process and finished goods are based on actual costs. We establish inventory reserves when conditions exist that suggest inventory may be in excess of anticipated demand or is obsolete based on customer required specifications. We evaluate the ability to realize the value of our inventory based on a combination of factors, including forecasted sales, estimated current and future market value and changes in customers’ product specifications. Recoveries of previously written-down inventory are recognized only when the related inventory is sold and revenue has been recognized. Inventory reserves increased in 2009 by $863,000 primarily as demand and pricing decreased. Based on improved demand and pricing of our products, we believe that it is unlikely that significant adjustments for inventory obsolescence will occur in 2010. Our method of estimating excess and obsolete inventory has remained consistent for all periods presented. However, if our recognition of excess or obsolete inventory is, or if our estimates of our inventory’s potential utility become, less favorable than currently expected, additional inventory reserves may be required. We determine our normal operating capacity and record as expense costs attributable to lower utilization of equipment and staff. During 2009 and 2008, we determined we were not operating at capacity and recorded as expense costs associated with lower utilization of equipment and staff of $5.6 million and $1.2 million.
36
Table of Contents
Investments. We invest available cash primarily in investment grade commercial paper, corporate notes, government securities and auction rate securities. Investments classified as available-for-sale securities are carried at fair market value with unrealized gains and losses recorded in accumulated other comprehensive income (loss). Investments in trading securities are reported at fair value, with both realized and unrealized gains and losses recorded in other income (expense), net in the Statement of Operations. Investments in which we have the ability and intent, if necessary, to liquidate in order to support our current operations are classified as short-term. Our long-term investments consist primarily of auction rate securities and put options.
We review our available for sale securities investments at the end of each quarter for other-than-temporary declines in fair value based on the specific identification method. We consider various factors in determining whether an impairment is other-than-temporary, including the severity and duration of the impairment, changes in underlying credit ratings, forecasted recovery, our ability and intent to hold the investment for a period of time sufficient to allow for any anticipated recovery in market value and the probability that the scheduled cash payments will continue to be made. When we conclude that an other-than-temporary impairment has resulted, the difference between the fair value and carrying value is written off and recorded as a charge on the Statement of Operations.
In October 2008, we entered into an agreement that provides us with the right, but not the obligation, to sell all our auction rate securities to UBS AG for par value during the period of June 30, 2010 to July 2, 2012 (the “ARS Put Options”). The ARS Put Options provide us with the opportunity to recover the estimated unrealized loss on our ARS investments. We recorded the fair value of the ARS Put Options upon receipt and included it in other long-term assets on our December 31, 2008 balance sheet. We elected fair value accounting for the ARS Put Options. Unrealized gains and losses related to the ARS Put Options will be recognized in earnings. We value the auction rate securities and ARS Put Options using a discounted cash flow model that weights various factors including interest rates and expected holding period. At December 31, 2009, the fair value recorded on the balance sheet of auction rate securities and ARS Put Options was $8.9 million and $1.2 million, respectively.
Allowance for doubtful accounts. We estimate the allowance for doubtful accounts based on an assessment of the collectability of specific customer accounts. The determination of risk for collection is assessed on a customer-by-customer basis considering our historical experience and future orders with the customer, changes in payment patterns, and recent information we have about the current status of our accounts receivable balances. If we determine that a specific customer is a risk for collection, we provide a specific allowance for credit losses to reduce the net recognized receivable to the amount we reasonably believe will be collected. We believe that based on the customers to whom we sell and the nature of our agreements with them, our estimates are reasonable. Our method of estimating collectability has remained consistent for all periods presented and with past collections experience.
Stock-based compensation. We expense stock options based upon the fair market value on the date of grant. We use the Black-Scholes option pricing model to determine the fair value of stock options. The determination of the fair value of stock-based payment awards on the date of grant using an option-pricing model will be affected by assumptions regarding a number of complex and subjective variables. These variables include our expected stock volatility over the term of the awards, actual and projected employee stock option exercise behaviors, risk-free interest rates, forfeitures and expected dividends.
The expected term represents the weighted-average period that our stock options are expected to be outstanding and is based upon the vesting term of our options, a review of a peer group of companies, and expected exercise behavior. Until November 2007, we were operating as a private company, and as a result, we were unable to use our actual price volatility data. Therefore, we estimate the volatility of our common stock based on volatility of similar entities over the expected term of our stock options. We base the risk-free interest rate that we use in the option pricing model on US Treasury zero-coupon issues with remaining terms similar to the expected term on the options. We do not anticipate paying any cash dividends in the foreseeable future and, therefore, use an expected dividend yield of zero in the option pricing model. We are required to estimate
37
Table of Contents
forfeitures at the time of grant and revise those estimates in subsequent periods if actual forfeitures differ from those estimates. The current forfeiture rate of 30% was based on our past history of pre-vesting forfeitures and the forfeiture rate has remained constant.
We allocate stock based compensation costs using a straight-line method which amortizes the fair value of each option on a straight-line basis over the service period.
Based on the variables affecting the valuation of our common stock and the method used for allocating compensation costs, we recognized $937,000 in stock-based compensation expense during the year ended December 31, 2009.
With respect to each option grant date for the year ended December 31, 2006, and through November 15, 2007, we determined the deemed fair value of our common stock. As there was no public market for our common stock during these periods, this determination was necessarily subjective. In making this determination, we considered a number of factors, including:
| • | the issuance price of our series of preferred shares to third parties; |
| • | the liquidation preference and other rights of the preferred shares; and |
| • | the fact that the option grants involved illiquid securities of a private company. |
For options granted through November 15, 2007, the board of directors set the exercise price for options granted based upon estimates of fair value. In preparing for our initial public offering, the board of directors determined that the original methodology applied did not fully comply with the requirements in the AICPA’s Practice Aid “Valuation of Privately-Held-Company Equity Securities Issued as Compensation,” which we refer to as the practice aid. Revised valuations were prepared which yielded lower fair values for our common stock. See “Valuation methodologies employed” below for further disclosure of the valuation methodology used in determining fair value per share for financial reporting purposes. Therefore, for financial reporting purposes, we determined that it was appropriate to use $5.25 for options granted in June and August 2007 as the fair value of our common stock within the Black-Scholes option pricing model is consistent with the revised valuation. For stock option grants after our initial public offering, the board of directors set the exercise price at the fair market value per share on the date of grant.
The following table sets forth option grants made during 2007, with the intrinsic value calculated based on grant date fair value.
| Date of Grant |
Number of options granted |
Exercise price | Fair value estimate per share |
Intrinsic value per share(1) | ||||
| June 2007 |
251,635 | 8.45 | 5.25 | — | ||||
| August 2007 |
198,040 | 8.45 | 5.25 | — | ||||
| November 2007 |
207,692 | 14.00 | 14.00 | — | ||||
| December 2007 |
111,758 | 17.60-18.50 | 17.60-18.50 | — |
| (1) | The financial reporting intrinsic value per share is the difference between the subsequently reassessed fair value per share for financial statement reporting purposes and the exercise price per share as established on each applicable stock option grant date by our compensation committee and board of directors as described above. There is no intrinsic value because the exercise price per share of each option equaled or exceeded the fair value of the common stock on the date of grant. |
38
Table of Contents
Valuation methodologies employed. The valuation methodologies we employed in connection with these option grants were based on various generally accepted valuation methods. Specifically, at each reporting date we analyzed the value of the company, or the business enterprise value, using market and income approaches, and then allocated the business enterprise value using contingent claims analysis, an application of option pricing theory. The allocation of the business enterprise value to convertible preferred stock, common stock, warrants and stock options at September 30, 2007, June 30, 2007 and March 31, 2007 used option pricing theory and considered the probability of an initial public offering.
In determining the business enterprise value at September 30, 2007, June 30, 2007 and March 31, 2007, we used both market and income value approaches. The market approach used both comparable company and transaction valuation methods. The comparable company market approach used revenue multiples observed in active securities markets and the transaction method used both revenue and EBITDA (earnings before interest, taxes, depreciation and amortization) multiples observed in the mergers and acquisitions market. The income approach determines a business enterprise value using the discounted present value of projected cash flow streams.
The final business enterprise value determined using the market and income approaches was then adjusted for appropriate marketability discounts. These marketability discounts were reduced at each reporting date, beginning with the December 31, 2006 reporting date, to reflect the increased probability of the initial public offering.
The allocation of the business enterprise value to each class of preferred stock and common stock was determined using contingent claims analysis, which is based on the principles of option pricing theory. Specifically, each class of security is modeled as a call option with a unique claim on our assets. The resulting claims allocate the anticipated proceeds between the different securities upon a liquidity event, which in our case was our initial public offering. In modeling each security as a call option, we used the Black-Scholes option pricing model.
Determining the fair value of our convertible preferred stock, common stock, warrants and stock options involves complex and subjective judgments involving estimates of revenue, earnings, assumed market growth rates and estimated costs, as well as appropriate discount rates. At the time of each valuation, the significant estimates used in the income approach (discounted cash flow model) included estimates of our revenue and revenue growth rates for several years into the future. Although each time we prepared such forecasts in the preparation of a valuation report we did so based on assumptions that we believed to be reasonable and appropriate, there can be no assurance that any such estimates for earlier periods have come to pass or that any such estimates for future periods will prove to be accurate.
The most significant factors contributing to the difference between the fair value of the shares of our common stock subject to our 2007 stock option grants and the initial public offering price are the increase in probability of the completion of an initial public offering of our common stock and positive changes in market conditions. Due to our history of operating losses prior to 2007, including negative gross profit in 2005, our ability to achieve our initial public offering price was highly contingent on achieving current strong operating results. Achieving strong operating results in the quarter ended September 30, 2007 and through completion of our initial public offering validated our financial projections for subsequent periods and resulted in our ability to obtain the estimated initial public offering price.
All option grants made during 2009 and 2008 were granted at an exercise price per share equal to the closing market price of our common stock on the date of grant. Therefore, there is no intrinsic value because the exercise price per share of each option was equal to the fair value of the common stock on the date of grant.
Based on the fair market value of the common stock at December 31, 2009, the intrinsic value for the options outstanding was $23,767,706 and the intrinsic value for the options exercisable was $8,625,028. At December 31, 2008, there was no aggregate intrinsic value of all stock options outstanding.
39
Table of Contents
Convertible preferred stock warrant liability. We accounted for warrants to purchase our preferred stock issued in connection with financing agreements by evaluating certain specifically identified conditions to determine whether the fair value of these warrants is required to be classified as a liability. The fair value of the warrants that are classified as liabilities are adjusted for changes in fair value at each reporting period, and the corresponding non-cash gain or loss is recorded in current period earnings. We estimated the fair market value of these warrants at the respective balance sheet dates using a Black-Scholes option-pricing model, based on the estimated market value of the underlying preferred stock at the measurement date, the remaining contractual term of the warrant, risk-free interest rates and expected dividends on and expected volatility of the price of the underlying preferred stock. These estimates, especially the market value of the underlying preferred stock and the expected volatility, are highly judgmental. The assumptions used in our Black-Scholes option pricing model for Series E, C, B, B-2 and A warrants at January 1, 2006 upon the adoption of FSP 150-5 were: (i) remaining contractual terms of 2.1 to 9.9 years; (ii) risk-free interest rate of 4.82% to 4.86%; (iii) expected volatility of 50% to 79%; and (iv) no expected dividend yield. The assumptions used in our Black-Scholes option pricing model for Series E, C, B, B-2 and A warrants at December 31, 2006 were: (i) remaining contractual terms of 1.3 to 9.1 years; (ii) risk-free interest rates of 4.70% to 5%; (iii) expected volatility of 47% to 76%; and (iv) no expected dividend yield. In each case, the fair value of the underlying preferred stock was assessed primarily by a valuation prepared by management using the practice aid.
Upon the closing of our initial public offering in November 2007, outstanding warrants to purchase our preferred stock became warrants to purchase shares of our common stock and certain of these warrants to purchase our preferred stock were net exercised. As a result, upon the conversion of the preferred stock warrants to common stock warrants, the warrants were no longer subject to fair market valuation. The then-current aggregate fair value of these warrants was reclassified from liabilities to additional paid-in-capital, a component of stockholders’ equity, and we ceased to record any related periodic fair value adjustments.
Redeemable convertible preferred stock. Prior to our initial public offering, we issued various classes of preferred stock. The holders of Series A, B, B-2, C, C-2, D, D-2 and E preferred stock had the option to sell their shares back to us at the greater of the original purchase price plus accrued and unpaid dividends or the current fair market value of the shares plus accrued and unpaid dividends. As a result, the carrying value of the preferred stock was increased by an accretion amount each period so that the carrying amounts will equal the greater of fair value plus accrued and unpaid dividends or original purchase price plus accrued and unpaid dividends. The accreted amounts are recorded to accumulated deficit. The option to sell and the related accretion of the preferred shares terminated upon the closing of our initial public offering.
The fair value of our preferred stock was determined based upon the sales price of our preferred stock to third-party investors, and in 2006 and 2007, when transactions in our preferred stock were not available, based upon valuations prepared by management using the methodology set forth in the practice aid. This methodology considered the probability and fair value of the sale of stock in an initial public offering. The valuation methodologies we used to estimate the fair value of our preferred stock have been applied consistently for all periods presented and the assumptions used were based on the best available information at that time. Accordingly, we do not believe that adjustments to amounts recorded in respect of our redeemable convertible preferred stock will be required.
RECENT ACCOUNTING PRONOUNCEMENTS
In April 2009, the Financial Accounting Standards Board (the “FASB”) issued Accounting Codification Statement (“ASC”) 825-10 (formerly FSP FAS 107-1 and APB 28-1), “Financial Instruments, Fair Value Option.” ASC 825-10 amends prior guidance to require disclosures about fair value of financial instruments for interim reporting periods of publicly traded companies as well as in annual financial statements. The pronouncement also requires those disclosures in summarized financial information at interim reporting periods. ASC 825-10 is effective for interim reporting periods ending after June 15, 2009, with early adoption permitted for periods ending after March 15, 2009. ASC 825-10 does not require disclosures for earlier periods presented
40
Table of Contents
for comparative purposes at initial adoption. In periods after initial adoption, comparative reporting at initial adoption is required. The adoption did not have a material effect on the determination or reporting of the Company’s financial results.
In April 2009, the FASB issued ASC 320-10 (formerly FSP FAS 115-2 and FAS 124-2), “Investments—Debt and Equity Securities.” ASC 320-10 amends the other-than-temporary impairment guidance for debt securities to make the guidance more operational and to improve the presentation and disclosure of other-than-temporary impairments on debt and equity securities in the financial statements. ASC 320-10 does not amend existing recognition and measurement guidance related to other-than-temporary impairments of equity securities. The effective date is for interim and annual reporting periods ending after June 15, 2009, with early adoption permitted for periods ending after March 15, 2009. Disclosures for earlier periods presented for comparative purposes at initial adoption are not required. In periods after initial adoption, comparative disclosures are required only for periods ending after initial adoption. The adoption did not have a material effect on the determination or reporting of the Company’s financial results.
In April 2009, the FASB issued ASC 820-10 (formerly FSP FAS 157-4), “Fair Value Measurements and Disclosure.” ASC 820-10 provides additional guidance for estimating fair value when the volume and level of activity for the asset or liability have significantly decreased. The pronouncement also includes guidance on identifying circumstances that indicate a transaction is not orderly. The effective date is for interim and annual reporting periods ending after June 15, 2009, with early adoption permitted for periods ending after March 15, 2009. Disclosures for earlier periods presented for comparative purposes at initial adoption are not required. In periods after initial adoption, comparative disclosures only for periods ending after initial adoption are required. The adoption did not have a material effect on the determination or reporting of the Company’s financial results.
Effective January 1, 2009, the Company implemented Topic 820-10 (formerly SFAS No. 157), “Fair Value Measurements and Disclosures,” for its nonfinancial assets and liabilities that are remeasured at fair value on a non-recurring basis. See Note 4 for disclosures associated with adoption of this standard. The adoption of Topic 820-10 had no impact on the Company’s accounting for nonfinancial assets and liabilities.
In May 2009, the FASB issued ASC 855-10 (formerly SFAS No. 165), “Subsequent Events.” ASC 855-10 sets forth: (1) the period after the balance sheet date during which management of a reporting entity should evaluate events or transactions that may occur for potential recognition or disclosure in financial statements, (2) the circumstances under which an entity should recognize events or transactions occurring after the balance sheet date in its financial statements and (3) the disclosures that an entity should make about events or transactions that occurred after the balance sheet date. The pronouncement is effective with interim and annual financial periods ending after June 15, 2009. The Company adopted ASC 855-10 at the beginning of its 2009 third quarter. The adoption did not have a significant impact on the subsequent events that the Company reports, either through recognition or disclosure, in its consolidated financial statements.
In June 2009, the FASB issued ASC 105-10 (formerly SFAS 168), “The FASB Accounting Standards Codification and the Hierarchy of Generally Accepted Accounting Principles”. ASC 105-10 will become the source of authoritative U.S. GAAP recognized by the FASB to be applied by nongovernment entities. It also modifies the GAAP hierarchy to include only two levels of GAAP; authoritative and non-authoritative. ASC 105-10 is effective for financial statements issued for interim and annual periods ending after September 15, 2009. The Company adopted ASC 105-10 for the 2009 third quarter reporting. The adoption did not have a significant impact on the reporting of the Company’s financial position, results of operations or cash flows.
In October 2009, the FASB issued new guidance that significantly changes the accounting for revenue in arrangements with multiple deliverables by requiring entities to separately account for individual deliverables in more of these arrangements and estimate the fair value of each component individually on a pro-rata basis. The guidance removes the criterion that entities must use vendor-specific objective and reliable evidence of fair value when separately accounting for deliverables, allowing for the recognition of revenue in a manner that more
41
Table of Contents
closely aligns with the economics of certain arrangements, based on management’s estimate of the selling price. The standard must be applied prospectively to revenue arrangements entered into or materially modified in fiscal years beginning on or after June 15, 2010. In addition, the FASB significantly expanded the disclosures related to multiple deliverable revenue arrangements. Although the Company continues to evaluate the impact of the adoption of this standard on its consolidated financial statements, the Company believes the impact of adoption will not be material in 2011, but could have a significant impact on future results as new or materially modified revenue arrangements with certain partners are established in the normal course of business.
| ITEM 8. | CONSOLIDATED FINANCIAL STATEMENTS AND SUPPLEMENTARY DATA |
Our consolidated financial statements, together with the related notes and the report of independent registered public accounting firm, are set forth on the pages indicated in Item 15 in this Annual Report on Form 10-K.
| ITEM 9. | CHANGES IN AND DISAGREEMENTS WITH ACCOUNTANTS ON ACCOUNTING AND FINANCIAL DISCLOSURES. |
None.
| ITEM 9A. | CONTROLS AND PROCEDURES |
Management’s Evaluation of Disclosure Controls and Procedures.
An evaluation was performed under the supervision and with the participation of our management, including our chief executive officer and chief financial officer (together, our “certifying officers”), of the effectiveness of the design and operation of our disclosure controls and procedures (as defined in Rules 13a-15(e) and 15d-15(e) under the Securities Exchange Act of 1934, as amended) as of the end of the year covered by this report. Disclosure controls and procedures are controls and other procedures designed to ensure that information required to be disclosed by us in our periodic reports filed with the SEC is recorded, processed, summarized and reported within the time periods specified by the SEC’s rules and instructions for Form 10-K, and that the information is accumulated and communicated to our management, including the chief executive officer and chief financial officer, as appropriate to allow timely decisions regarding required disclosure. Based on their evaluation, our certifying officers concluded that these disclosure controls and procedures were effective as of December 31, 2009.
Refer to management’s report on internal control over financial reporting and the report of our independent registered public accounting firm on pages F-2 and F-3.
Changes in Internal Controls over Financial Reporting
There have been no changes in our internal controls over financial reporting that occurred during the quarter ended December 31, 2009 that our certifying officers concluded materially affected, or are reasonably likely to materially affect, our internal controls over financial reporting.
| ITEM 9B. | OTHER INFORMATION |
None.
42
Table of Contents
PART III
| ITEM 10. | DIRECTORS, EXECUTIVE OFFICERS AND CORPORATE GOVERNANCE |
The Information required by Items 401, 405, 407(d)(4) and 407(d)(5) of Regulation S-K will be included under the captions “Election of Directors,” “Executive Officers,” “Section 16(a) Beneficial Ownership Reporting Compliance” and “Audit Committee” in our proxy statement for our 2010 annual meeting of stockholders and is incorporated by reference herein. If such proxy statement is not filed with the SEC within 120 days after the end of the fiscal year covered by this Form 10-K, an amendment to this Form 10-K shall be filed not later than the end of such 120-day period.
We have adopted a Code of Ethics that applies to all of our employees, officers and directors. A copy of the Code of Ethics is available on our website at www.rubicon-es2.com, and any waiver from the Code of Ethics will be timely disclosed on the Company’s website as will any amendments to the Code of Ethics.
| ITEM 11. | EXECUTIVE COMPENSATION |
The information required by Item 402 of Regulation S-K will be included under the captions “Executive Compensation” and “Director Compensation” in our proxy statement for our 2010 annual meeting of stockholders and is incorporated by reference herein. The information required by Item 407(e)(4) and 407(e)(5) of Regulation S-K will be included under the captions “Compensation Committee Interlocks and Insider Participation” and “Compensation Committee Report” in our proxy statement for our 2010 annual meeting of stockholders and is incorporated by reference herein. If such proxy statement is not filed with the SEC within 120 days after the end of the fiscal year covered by this Form 10-K, an amendment to this Form 10-K shall be filed not later than the end of such 120-day period.
| ITEM 12. | SECURITY OWNERSHIP OF CERTAIN BENEFICIAL OWNERS AND MANAGEMENT AND RELATED STOCKHOLDER MATTERS |
Securities Authorized for Issuance under Equity Compensation Plans
The following table represents securities authorized for issuance under our 2001 Equity Plan and our 2007 Stock Incentive Plan as of December 31, 2009.
Equity Compensation Plan Information
| Plan Category |
Number of Securities to be Issued Upon Exercise of Outstanding Options, Warrants and Rights |
Weighted-Average Exercise Price of Outstanding Options, Warrants and Rights |
Number of Securities Remaining Available for Future Issuances Under the Equity Compensation Plans (Excluding Securities Reflected in Column(a)) | ||||
| (a) | (b) | (c) | |||||
| Equity compensation plans approved by security holders(1) |
2,194,286 | $ | 9.48 | 874,269 | |||
| (1) | Approved before our initial public offering. |
The information required by Item 403 of Regulation S-K will be included under the caption “Security Ownership of Certain Beneficial Owners and Management and Related Shareholder Matters” in our proxy statement for our 2010 annual meeting of stockholders and is incorporated by reference herein. If such proxy statement is not filed with the SEC within 120 days after the end of the fiscal year covered by this Form 10-K, an amendment to this Form 10-K shall be filed not later than the end of such 120-day period.
43
Table of Contents
| ITEM 13. | CERTAIN RELATIONSHIPS AND RELATED TRANSACTIONS, AND DIRECTOR INDEPENDENCE |
The information required by Item 404 of Regulation S-K will be included under the caption “Certain Relationships and Related Person Transactions” in our proxy statement for our 2010 annual meeting of stockholders and is incorporated by reference herein. The information required by Item 407(a) of Regulation S-K will be included under the caption “Director Independence” in our proxy statement for our 2010 annual meeting of stockholders and is incorporated by reference herein. If such proxy statement is not filed with the SEC within 120 days after the end of the fiscal year covered by this Form 10-K, an amendment to this Form 10-K shall be filed not later than the end of such 120-day period.
| ITEM 14. | PRINCIPAL ACCOUNTING FEES AND SERVICES |
The information required by this Item will be included under the caption “Ratification of Selection of Independent Registered Public Accounting Firm” in our proxy statement for our 2010 annual meeting of stockholders and is incorporated by reference herein. If such proxy statement is not filed with the SEC within 120 days after the end of the fiscal year covered by this Form 10-K, an amendment to this Form 10-K shall be filed not later than the end of such 120-day period.
44
Table of Contents
| ITEM 15. | EXHIBITS AND CONSOLIDATED FINANCIAL STATEMENT SCHEDULES |
(a) Financial statements. The following consolidated financial statements are filed as part of this Annual Report on Form 10-K.
(b) Exhibits. The exhibits filed or incorporated by reference as a part of this report are listed in the Index to Exhibits which appears following the signature page to this Annual Report on Form 10-K and are incorporated by reference.
(c) Financial statement schedules not listed above have been omitted because they are inapplicable, are not required under applicable provisions of Regulation S-X, or the information that would otherwise be included in such schedules is contained in the registrant’s financial statements or accompanying notes.
45
Table of Contents
Pursuant to the requirements of Section 13 or 15(d) of the Securities Exchange Act of 1934, the registrant has duly caused this report to be signed on its behalf by the undersigned, thereunto duly authorized on
March 1, 2010.
| Rubicon Technology, Inc. | ||
| By | /s/ Raja M. Parvez | |
| Raja M. Parvez President and Chief Executive Officer | ||
KNOW ALL MEN BY THESE PRESENTS, that each person whose signature appears below constitutes and appoints Raja M. Parvez and William F. Weissman, jointly and severally, his or her attorney-in-fact, with the power of substitution, for him or her in any and all capacities, to sign any amendments to this Annual Report on Form 10-K and to file the same, with exhibits thereto and other documents in connection therewith, with the Securities and Exchange Commission, hereby ratifying and confirming all that each of said attorneys-in-fact, or his or her substitute or substitutes, may do or cause to be done by virtue hereof.
Pursuant to the requirements of the Securities Exchange Act of 1934, this report has been signed below by the following persons on behalf of the registrant and in the capacities indicated on March 1, 2010.
| Signature |
Title | |
| /s/ Raja M. Parvez Raja M. Parvez |
Director, President and Chief Executive Officer (Principal Executive Officer) | |
| /s/ William F. Weissman William F. Weissman |
Chief Financial Officer | |
| /s/ Don N. Aquilano Don N. Aquilano |
Chairman of the Board of Directors | |
| /s/ Donald R. Caldwell Donald R. Caldwell |
Director | |
| /s/ Gordon Hunter Gordon Hunter |
Director | |
| /s/ Michael E. Mikolajczyk Michael E. Mikolajczyk |
Director | |
| /s/ Raymond J. Spencer Raymond J. Spencer |
Director | |
46
Table of Contents
The Exhibits listed below are filed or incorporated by reference as part of this Annual Report on Form 10-K.
| Exhibit No. |
Description |
Incorporation by Reference | ||
| 3.1 | Eighth Amended and Restated Certificate of Incorporation of Rubicon Technology, Inc. | Filed as Exhibit 3.1 to Amendment No. 2, filed on November 1, 2007, to the registrant’s Registration Statement on Form S-1 (File No. 333-145880) | ||
| 3.2 | Amended and Restated Bylaws of Rubicon Technology, Inc. | Filed as Exhibit 3.2 to Amendment No. 2, filed on November 1, 2007, to the registrant’s Registration Statement on Form S-1 (File No. 333-145880) | ||
| 4.1 | Specimen Common Stock Certificate | Filed as Exhibit 4.1 to Amendment No. 3, filed on November 13, 2007, to the registrant’s Registration Statement on Form S-1 (File No. 333-145880) | ||
| 4.2 | Fourth Amended and Restated Registration Rights Agreement, dated as of November 30, 2005 | Filed as Exhibit 4.2 to the registrant’s Registration Statement on Form S-1, filed on October 11, 2007 (File No. 333-145880) | ||
| 4.3 | Third Amended and Restated Stockholders’ Agreement, dated as of June 28, 2005, by and among Rubicon Technology, Inc. and the stockholders named therein | Filed as Exhibit 4.3 to the registrant’s Registration Statement on Form S-1, filed on October 11, 2007 (File No. 333-145880) | ||
| 4.4 | Series E Stockholders’ Agreement, dated as of November 30, 2005, by and among Rubicon Technology, Inc. and the stockholders named therein | Filed as Exhibit 4.4 to the registrant’s Registration Statement on Form S-1, filed on October 11, 2007 (File No. 333-145880) | ||
| 4.5 | Form of Warrant to Purchase Shares of Series A preferred stock | Filed as Exhibit 4.5 to the registrant’s Registration Statement on Form S-1, filed on October 11, 2007 (File No. 333-145880) | ||
| 4.6 | Form of Investor Warrant to Purchase Shares of Series B preferred stock | Filed as Exhibit 4.6 to the registrant’s Registration Statement on Form S-1, filed on October 11, 2007 (File No. 333-145880) | ||
| 4.7 | Warrant to Purchase Shares of Series B preferred stock between Rubicon Technology, Inc. and Silicon Valley Bank, dated July 10, 2002 | Filed as Exhibit 4.7 to the registrant’s Registration Statement on Form S-1, filed on October 11, 2007 (File No. 333-145880) | ||
| 4.8 | Warrant to Purchase Shares of Series B preferred stock between Rubicon Technology, Inc. and GATX Ventures, Inc., dated July 10, 2002 (1) | Filed as Exhibit 4.8 to the registrant’s Registration Statement on Form S-1, filed on October 11, 2007 (File No. 333-145880) | ||
| 4.9 | Warrant to Purchase Shares of Series B preferred stock between Rubicon Technology, Inc. and GATX Ventures, Inc., dated July 10, 2002 (2) | Filed as Exhibit 4.9 to the registrant’s Registration Statement on Form S-1, filed on October 11, 2007 (File No. 333-145880) | ||
47
Table of Contents
| Exhibit No. |
Description |
Incorporation by Reference | ||
| 4.10 | Warrant to Purchase Shares of Series B preferred stock between Rubicon Technology, Inc. and Atel Ventures, Inc., dated July 28, 2003 | Filed as Exhibit 4.10 to the registrant’s Registration Statement on Form S-1, filed on October 11, 2007 (File No. 333-145880) | ||
| 4.11 | Warrant to Purchase Shares of Series B preferred stock between Rubicon Technology, Inc. and Heller Financial Leasing, Inc., dated October 24, 2003 | Filed as Exhibit 4.11 to the registrant’s Registration Statement on Form S-1, filed on October 11, 2007 (File No. 333-145880) | ||
| 4.12 | Warrant to Purchase Shares of Series B preferred stock between Rubicon Technology, Inc. and Lighthouse Capital Partners IV, L.P., dated October 24, 2003 | Filed as Exhibit 4.12 to the registrant’s Registration Statement on Form S-1, filed on October 11, 2007 (File No. 333-145880) | ||
| 4.13 | Warrant to Purchase Shares of Series C preferred stock between Rubicon Technology, Inc. and Heller Financial Leasing Inc., dated March 31, 2005 | Filed as Exhibit 4.13 to the registrant’s Registration Statement on Form S-1, filed on October 11, 2007 (File No. 333-145880) | ||
| 4.14 | Form of Investor Warrant to Purchase Shares of Series E preferred stock | Filed as Exhibit 4.14 to the registrant’s Registration Statement on Form S-1, filed on October 11, 2007 (File No. 333-145880) | ||
| 4.15 | Warrant to Purchase Shares of Series E preferred stock between Rubicon Technology, Inc. and Lighthouse Capital Partners IV, L.P., dated December 20, 2005 | Filed as Exhibit 4.15 to the registrant’s Registration Statement on Form S-1, filed on October 11, 2007 (File No. 333-145880) | ||
| 4.16 | Warrant to Purchase Shares of Series E preferred stock between Rubicon Technology, Inc. and Heller Financial Leasing, Inc., dated December 20, 2005 | Filed as Exhibit 4.16 to the registrant’s Registration Statement on Form S-1, filed on October 11, 2007 (File No. 333-145880) | ||
| 4.17 | Warrant to Purchase Shares of Series E preferred stock between Rubicon Technology, Inc. and Hercules Technology Growth Capital, Inc., dated April 9, 2007 | Filed as Exhibit 4.17 to the registrant’s Registration Statement on Form S-1, filed on October 11, 2007 (File No. 333-145880) | ||
| 10.1* | Rubicon Technology, Inc. 2001 Equity Plan, dated as of August 2, 2001 | Filed as Exhibit 10.1 to the registrant’s Registration Statement on Form S-1, filed on October 11, 2007 (File No. 333-145880) | ||
| 10.1(a)* | Amendment No. 1 to the Rubicon Technology, Inc. 2001 Equity Plan, dated as of November 6, 2001 | Filed as Exhibit 10.1(a) to the registrant’s Registration Statement on Form S-1, filed on October 11, 2007 (File No. 333-145880) | ||
| 10.1(b)* | Amendment No. 2 to the Rubicon Technology, Inc. 2001 Equity Plan, dated as of May 21, 2002 | Filed as Exhibit 10.1(b) to the registrant’s Registration Statement on Form S-1, filed on October 11, 2007 (File No. 333-145880) | ||
| 10.1(c)* | Amendment No. 3 to the Rubicon Technology, Inc. 2001 Equity Plan, dated as of May 28, 2004 | Filed as Exhibit 10.1(c) to the registrant’s Registration Statement on Form S-1, filed on October 11, 2007 (File No. 333-145880) | ||
| 10.1(d)* | Amendment No. 4 to the Rubicon Technology, Inc. 2001 Equity Plan, dated as of December 6, 2004 | Filed as Exhibit 10.1(d) to the registrant’s Registration Statement on Form S-1, filed on October 11, 2007 (File No. 333-145880) | ||
48
Table of Contents
| Exhibit No. |
Description |
Incorporation by Reference | ||
| 10.1(e)* | Amendment No. 5 to the Rubicon Technology, Inc. 2001 Equity Plan, dated as of June 28, 2005 | Filed as Exhibit 10.1(e) to the registrant’s Registration Statement on Form S-1, filed on October 11, 2007 (File No. 333-145880) | ||
| 10.1(f)* | Amendment No. 6 to the Rubicon Technology, Inc. 2001 Equity Plan, dated as of November 30, 2005 | Filed as Exhibit 10.1(f) to the registrant’s Registration Statement on Form S-1, filed on October 11, 2007 (File No. 333-145880) | ||
| 10.1(g)* | Amendment No. 7 to the Rubicon Technology, Inc. 2001 Equity Plan, dated as of July 26, 2006 | Filed as Exhibit 10.1(g) to the registrant’s Registration Statement on Form S-1, filed on October 11, 2007 (File No. 333-145880) | ||
| 10.1(h)* | Rubicon Technology, Inc. 2001 Equity Plan Form of Notice of Stock Option Grant and Stock Option Agreement | Filed as Exhibit 10.1(h) to the registrant’s Registration Statement on Form S-1, filed on October 11, 2007 (File No. 333-145880) | ||
| 10.2* | Rubicon Technology, Inc. 2007 Stock Incentive Plan dated as of August 29, 2007 | Filed as Exhibit 10.2 to the registrant’s Registration Statement on Form S-1, filed on October 11, 2007 (File No. 333-145880) | ||
| 10.3* | Rubicon Technology, Inc. Management Incentive Bonus Plan, dated as of February 28, 2007 | Filed as Exhibit 10.4 to the registrant’s Registration Statement on Form S-1, filed on October 11, 2007 (File No. 333-145880) | ||
| 10.4* | Amendment No. 1 to Rubicon Technology, Inc. Management Incentive Bonus Plan, dated as of August 29, 2007 | Filed as Exhibit 10.4(a) to the registrant’s Registration Statement on Form S-1, filed on October 11, 2007 (File No. 333-145880) | ||
| 10.5* | Executive Employment Agreement, dated as of November 17, 2005, by and between Rubicon Technology, Inc. and Raja M. Parvez | Filed as Exhibit 10.5 to the registrant’s Registration Statement on Form S-1, filed on October 11, 2007 (File No. 333-145880) | ||
| 10.5(a)* | Amendment, dated as of July 25, 2007, to Executive Employment Agreement by and between Rubicon Technology, Inc. and Raja M. Parvez | Filed as Exhibit 10.5(a) to the registrant’s Registration Statement on Form S-1, filed on October 11, 2007 (File No. 333-145880) | ||
| 10.5(b)* | Executive Employment Agreement, dated as of dated January 29, 2009, by and between Rubicon Technology, Inc. and Raja M. Parvez Executive Employment Agreement | Filed as Exhibit 10.5(b) to the registrant’s Current Report on Form 8-K filed on December 3, 2009 (File No. 1-33834) | ||
| 10.6* | Employment Agreement, dated as of March 29, 2004, by and between Rubicon Technology, Inc. and Hap Hewes | Filed as Exhibit 10.6 to the registrant’s Registration Statement on Form S-1, filed on October 11, 2007 (File No. 333-145880) | ||
| 10.7* | Severance Agreement, dated as of September 8, 2005, by and between Rubicon Technology, Inc. and Hap R. Hewes | Filed as Exhibit 10.7 to the registrant’s Registration Statement on Form S-1, filed on October 11, 2007 (File No. 333-145880) | ||
| 10.8* | Executive Employment Agreement, dated as of July 30, 2007, by and between Rubicon Technology, Inc. and William F. Weissman | Filed as Exhibit 10.8 to the registrant’s Registration Statement on Form S-1, filed on October 11, 2007 (File No. 333-145880) | ||
49
Table of Contents
| Exhibit No. |
Description |
Incorporation by Reference | ||
| 10.8(a)* | First Amendment to Executive Employment Agreement, dated as of January 29, 2009, by and between Rubicon Technology, Inc. and William F. Weissman | Filed as Exhibit 10.8(a) to the registrant’s Current Report on Form 8-K filed on December 3, 2009 (File No. 1-33834) | ||
| 10.9 | Loan and Security Agreement, dated as of April 9, 2007, by and between Rubicon Technology, Inc. and Hercules Technology Growth Capital, Inc. | Filed as Exhibit 10.9 to the registrant’s Registration Statement on Form S-1, filed on October 11, 2007 (File No. 333-145880) | ||
| 10.10 | Form of Post-IPO Change of Control Severance Agreement | Filed as Exhibit 10.10 to the registrant’s Registration Statement on Form S-1, filed on October 11, 2007 (File No. 333-145880) | ||
| 10.11 | Form of Indemnification Agreement | Filed as Exhibit 10.11 to the registrant’s Registration Statement on Form S-1, filed on October 11, 2007 (File No. 333-145880) | ||
| 10.12 | Commercial Lease, dated as of December 23, 2004, by and between Rubicon Technology, Inc. and Bartmanns, Perales & Dolter, LLC | Filed as Exhibit 10.12 to the registrant’s Registration Statement on Form S-1, filed on October 11, 2007 (File No. 333-145880) | ||
| 10.12(a) | Amendment to Commercial Lease, dated as of May 6, 2005, by and between Rubicon Technology, Inc. and Bartmanns, Perales & Dolter, LLC | Filed as Exhibit 10.12(a) to the registrant’s Registration Statement on Form S-1, filed on October 11, 2007 (File No. 333-145880) | ||
| 10.13 | Industrial Space Lease, dated as of July 29, 2005, by and among Rubicon Technology, Inc. and Radion Mogilevsky and Nanette Mogilevsky | Filed as Exhibit 10.13 to the registrant’s Registration Statement on Form S-1, filed on October 11, 2007 (File No. 333-145880) | ||
| 10.14 | Industrial Building Lease, dated as of July 18, 2007, by and between Rubicon Technology, Inc. and Phillip J. Latoria, Jr. | Filed as Exhibit 10.14 to the registrant’s Registration Statement on Form S-1, filed on October 11, 2007 (File No. 333-145880) | ||
| 10.15 | Non-Competition Agreement, dated as of April 6, 2005, by and between Rubicon Technology, Inc. and Hap Hewes | Filed as Exhibit 10.15 to Amendment No. 1, filed on October 11, 2007, to the registrant’s Registration Statement on Form S-1 (File No. 333-145880) | ||
| 10.16† | 2007 Material Purchase Meeting Record, dated as of November 7, 2006, by and between Rubicon Technology, Inc. and Shinkosha Co. Ltd. | Filed as Exhibit 10.16 to Amendment No. 1, filed on October 11, 2007, to the registrant’s Registration Statement on Form S-1 (File No. 333-145880) | ||
| 10.17† | 2007 Supply Agreement, dated as of January 5, 2007, by and between Rubicon Technology, Inc. and Crystalwise Technology, Inc. | Filed as Exhibit 10.17 to Amendment No. 1, filed on October 11, 2007, to the registrant’s Registration Statement on Form S-1 (File No. 333-145880) | ||
| 10.18† | 2008 Sapphire Material Supply Agreement, dated as of May 19, 2007, by and between Rubicon Technology, Inc. and Crystalwise Technology, Inc. | Filed as Exhibit 10.18 to Amendment No. 1, filed on October 11, 2007, to the registrant’s Registration Statement on Form S-1 (File No. 333-145880) | ||
50
Table of Contents
| Exhibit No. |
Description |
Incorporation by Reference | ||
| 10.19† | Supply Agreement, dated as of March 26, 2007, by and between Rubicon Technology, Inc. and Peregrine Semiconductor Corp. | Filed as Exhibit 10.19 to Amendment No. 2, filed on November 1, 2007, to the registrant’s Registration Statement on Form S-1 (File No. 333-145880) | ||
| 10.20† | First Amendment of 2008 Supply Agreement, by and between Crystalwise Technology, Inc. and Rubicon Technology, Inc., effective as of July 7, 2008 | Filed as Exhibit 10.17(a) to the registrant’s Quarterly Report on Form 10-Q on August 13, 2008 (File No. 1-33834) | ||
| 10.21+ | First Amendment to the 6” Supply Agreement, by and between Peregrine Semiconductor Corp. and Rubicon Technology, Inc., effective as of August 22, 2008 | Filed as Exhibit 10.1 to the registrant’s Quarterly Report on Form 10-Q on November 13, 2008 (File No. 1-33834) | ||
| 10.22+ | Second Amendment to Supply Agreement, by and between Peregrine Semiconductor Corp. and Rubicon Technology, Inc., effective as of November 25, 2008 | Filed as Exhibit 10.22 to the registrant’s Annual Report on Form 10-K on March 13, 2009 (File No. 1-33834) | ||
| 21.1 | Subsidiaries of the Company | |||
| 23.1 | Consent of Independent Registered Public Accounting Firm | |||
| 24.1 | Power of Attorney (incorporated by reference to the signature page of this Annual Report on Form 10-K) | |||
| 31.1 | Certification of Chief Executive Officer pursuant to Exchange Act Rules 13a-14(a) and 15d-14(a), as adopted pursuant to Section 302 of the Sarbanes-Oxley Act of 2003 | |||
| 31.2 | Certification of Chief Financial Officer pursuant to Exchange Act Rules 13a-14(a) and 15d-14(a), as adopted pursuant to Section 302 of the Sarbanes-Oxley Act of 2003 | |||
| 32.1 | Certifications of Chief Executive Officer and Chief Financial Officer pursuant to 18 U.S.C. Section 1350, as adopted pursuant to Section 906 of the Sarbanes-Oxley Act of 2003 | |||
| * | Management contract or compensatory plan or arrangement of the Company. |
| † | Confidential treatment has been requested and granted for certain provisions of this Exhibit pursuant to Rule 406 promulgated under the Securities Act. |
| + | Confidential treatment has been requested and granted for certain provisions of this Exhibit pursuant to Rule 24b-2 promulgated under the Exchange Act. |
51
Table of Contents
Rubicon Technology, Inc.
INDEX TO FINANCIAL STATEMENTS
F-1
Table of Contents
MANAGEMENT’S REPORT ON INTERNAL CONTROL OVER FINANCIAL REPORTING
The financial statements were prepared by management, which is responsible for their integrity and objectivity and for establishing and maintaining adequate internal controls over financial reporting.
The Company’s internal control over financial reporting is designed to provide reasonable assurance regarding the reliability of financial reporting and the preparation of financial statements for external purposes in accordance with generally accepted accounting principles. The Company’s internal control over financial reporting includes those policies and procedures that:
| i. | pertain to the maintenance of records that, in reasonable detail, accurately and fairly reflect the transactions and disposition of the assets of the Company; |
| ii. | provide reasonable assurance that transactions are recorded as necessary to permit preparation of consolidated financial statements in accordance with generally accepted accounting principles, and that receipts and expenditures of the Company are being made only in accordance with authorizations of management and directors of the Company; and |
| iii. | provide reasonable assurance regarding prevention or timely detection of unauthorized acquisition, use or disposition of the Company’s assets that could have a material effect on the consolidated financial statements. |
There are inherent limitations in the effectiveness of any internal control, including the possibility of human error and the circumvention or overriding of controls. Accordingly, even effective internal controls can provide only reasonable assurance with respect to the financial statement preparation. Further, because of changes in conditions, the effectiveness of internal controls may vary over time.
Management assessed the design and effectiveness of the Company’s internal control over financial reporting as of December 31, 2009. In making this assessment, management used the criteria set forth in Internal Control—Integrated Framework by the Committee of Sponsoring Organizations of the Treadway Commission (COSO).
Based on management’s assessment using those criteria, as of December 31, 2009, management concluded that the Company’s internal controls over financial reporting were effective.
Grant Thornton LLP, independent registered public accounting firm, has audited the consolidated financial statements of the Company for the fiscal years ended December 31, 2009, 2008 and 2007 and the Company’s internal control over financial reporting as of December 31, 2009. Their reports are presented on the following pages.
Rubicon Technology, Inc.
March 1, 2010
F-2
Table of Contents
REPORT OF INDEPENDENT REGISTERED PUBLIC ACCOUNTING FIRM
Board of Directors and Stockholders
Rubicon Technology, Inc.
We have audited Rubicon Technology, Inc.’s (a Delaware Corporation and subsidiaries) (the Company) internal control over financial reporting as of December 31, 2009, based on criteria established in Internal Control—Integrated Framework issued by the Committee of Sponsoring Organizations of the Treadway Commission (COSO). The Company’s management is responsible for maintaining effective internal control over financial reporting and for its assessment of the effectiveness of internal control over financial reporting, included in the accompanying Management’s Report on Internal Control over Financial Reporting. Our responsibility is to express an opinion on the Company’s internal control over financial reporting based on our audit.
We conducted our audit in accordance with the standards of the Public Company Accounting Oversight Board (United States). Those standards require that we plan and perform the audit to obtain reasonable assurance about whether effective internal control over financial reporting was maintained in all material respects. Our audit included obtaining an understanding of internal control over financial reporting, assessing the risk that a material weakness exists, testing and evaluating the design and operating effectiveness of internal control based on the assessed risk, and performing such other procedures as we considered necessary in the circumstances. We believe that our audit provides a reasonable basis for our opinion.
A company’s internal control over financial reporting is a process designed to provide reasonable assurance regarding the reliability of financial reporting and the preparation of financial statements for external purposes in accordance with generally accepted accounting principles. A company’s internal control over financial reporting includes those policies and procedures that (1) pertain to the maintenance of records that, in reasonable detail, accurately and fairly reflect the transactions and dispositions of the assets of the company; (2) provide reasonable assurance that transactions are recorded as necessary to permit preparation of financial statements in accordance with generally accepted accounting principles, and that the receipts and expenditures of the company are being made only in accordance with authorizations of management and directors of the company; and (3) provide reasonable assurance regarding prevention or timely detection of unauthorized acquisition, use, or disposition of the Company’s assets that could have a material effect on the financial statements.
Because of the inherent limitations, internal control over financial reporting may not prevent or detect misstatements. Also, projections of any evaluation of the effectiveness to future periods are subject to the risk that controls may become inadequate because of changes in conditions, or that the degree of compliance with the policies or procedures may deteriorate.
In our opinion, the Company maintained, in all material respects, effective internal control over financial reporting as of December 31, 2009, based on criteria established in Internal Control—Integrated Framework issued by COSO.
We also have audited, in accordance with the standards of the Public Company Accounting Oversight Board (United States), the consolidated financial statements of the Company as of December 31, 2009 and 2008 and for each of the three years in the period ending December 31, 2009 and our report dated March 1, 2010 expressed an unqualified opinion on those consolidated financial statements.
/s/ GRANT THORNTON LLP
Madison, Wisconsin
March 1, 2010
F-3
Table of Contents
REPORT OF INDEPENDENT REGISTERED PUBLIC ACCOUNTING FIRM
Board of Directors and Stockholders
Rubicon Technology, Inc.
We have audited the accompanying consolidated balance sheets of Rubicon Technology, Inc. and subsidiaries (a Delaware Corporation) (the Company) as of December 31, 2009 and 2008, and the related consolidated statements of operations, redeemable equity and stockholders’ equity (deficit), and cash flows for each of the three years in the period ended December 31, 2009. These financial statements are the responsibility of the Company’s management. Our responsibility is to express an opinion on these financial statements based on our audits.
We conducted our audits in accordance with the standards of the Public Company Accounting Oversight Board (United States). Those standards require that we plan and perform the audit to obtain reasonable assurance about whether the financial statements are free of material misstatement. An audit includes examining, on a test basis, evidence supporting the amounts and disclosures in the financial statements. An audit also includes assessing the accounting principles used and significant estimates made by management, as well as evaluating the overall financial statement presentation. We believe that our audits provide a reasonable basis for our opinion.
In our opinion, the consolidated financial statements referred to above present fairly, in all material respects, the financial position of the Company as of December 31, 2009 and 2008, and the results of their operations and their cash flows for each of the three years in the period ended December 31, 2009 in conformity with accounting principles generally accepted in the United States of America.
We also have audited, in accordance with the standards of the Public Company Accounting Oversight Board (United States), the Company’s internal control over financial reporting as of December 31, 2009, based on criteria established in Internal Control—Integrated Framework issued by the Committee of Sponsoring Organizations of the Treadway Commission (COSO) and our report dated March 1, 2010 expressed an unqualified opinion.
/s/ GRANT THORNTON LLP
Madison, Wisconsin
March 1, 2010
F-4
Table of Contents
Consolidated balance sheets
| As of December 31, | ||||||||
| 2009 | 2008 | |||||||
| (in thousands, other than share data) |
||||||||
| Assets |
||||||||
| Cash and cash equivalents |
$ | 3,860 | $ | 7,629 | ||||
| Restricted cash |
8 | 5 | ||||||
| Short-term investments |
40,716 | 37,328 | ||||||
| Accounts receivable, net |
4,967 | 2,542 | ||||||
| Inventories, net |
6,597 | 7,882 | ||||||
| Spare parts |
2,133 | 3,569 | ||||||
| Prepaid expenses and other current assets |
1,311 | 1,357 | ||||||
| Total current assets |
59,592 | 60,312 | ||||||
| Property and equipment, net |
39,525 | 39,337 | ||||||
| Investments |
2,000 | 12,696 | ||||||
| Other assets |
69 | — | ||||||
| Total assets |
$ | 101,186 | $ | 112,345 | ||||
| Liabilities and stockholders’ equity |
||||||||
| Accounts payable |
$ | 2,056 | $ | 2,440 | ||||
| Accrued payroll |
515 | 677 | ||||||
| Corporate income and franchise taxes |
171 | 255 | ||||||
| Accrued and other current liabilities |
1,004 | 580 | ||||||
| Total current liabilities |
3,746 | 3,952 | ||||||
| Commitments and contingencies (Note 11) |
||||||||
| Stockholders’ equity |
||||||||
| Preferred stock, $0.001 par value, 5,000,000 undesignated shares authorized, no shares issued or outstanding |
— | — | ||||||
| Common stock, $0.001 par value, 85,000,000 shares authorized and 21,482,558 and 21,279,692 shares issued and outstanding at December 31, 2009 and 2008 |
21 | 21 | ||||||
| Additional paid-in capital |
261,974 | 260,581 | ||||||
| Treasury stock, at cost, 1,249,975 and 730,733 shares at December 31, 2009 and 2008 |
(5,661 | ) | (3,084 | ) | ||||
| Accumulated other comprehensive income |
(10 | ) | 129 | |||||
| Accumulated deficit |
(158,884 | ) | (149,254 | ) | ||||
| Total stockholders’ equity |
97,440 | 108,393 | ||||||
| Total liabilities and stockholders’ equity |
$ | 101,186 | $ | 112,345 | ||||
The accompanying notes are an integral part of these consolidated statements.
F-5
Table of Contents
Consolidated statements of operations
| Year ended December 31, | ||||||||||||
| 2009 | 2008 | 2007 | ||||||||||
| (in thousands, other than share and per share data) |
||||||||||||
| Revenue |
$ | 19,808 | $ | 37,838 | $ | 34,110 | ||||||
| Cost of goods sold |
23,427 | 25,746 | 22,045 | |||||||||
| Gross profit (loss) |
(3,619 | ) | 12,092 | 12,065 | ||||||||
| Operating expenses: |
||||||||||||
| General and administrative |
4,811 | 6,691 | 6,157 | |||||||||
| Sales and marketing |
1,137 | 968 | 675 | |||||||||
| Research and development |
801 | 862 | 769 | |||||||||
| Loss on disposal of assets |
— | 1,215 | 139 | |||||||||
| Income (loss) from operations |
(10,368 | ) | 2,356 | 4,325 | ||||||||
| Other income (expense): |
||||||||||||
| Change in carrying value of convertible preferred stock warrants |
— | — | (6,019 | ) | ||||||||
| Interest income |
693 | 2,060 | 373 | |||||||||
| Interest expense |
(2 | ) | (2 | ) | (1,458 | ) | ||||||
| Realized gain (loss) on investments |
47 | (55 | ) | — | ||||||||
| Total other income (expense) |
738 | 2,003 | (7,104 | ) | ||||||||
| Income (loss) before income taxes |
(9,630 | ) | 4,359 | (2,779 | ) | |||||||
| Income taxes |
— | (4 | ) | (75 | ) | |||||||
| Net income (loss) |
(9,630 | ) | 4,355 | (2,854 | ) | |||||||
| Dividends on preferred stock |
— | — | (5,625 | ) | ||||||||
| Accretion of redeemable preferred stock |
— | — | (59,934 | ) | ||||||||
| Net income (loss) attributable to common stockholders |
$ | (9,630 | ) | $ | 4,355 | $ | (68,413 | ) | ||||
| Net income (loss) per common share attributable to common stockholders |
||||||||||||
| Basic |
$ | (0.48 | ) | $ | 0.21 | $ | (27.22 | ) | ||||
| Diluted |
$ | (0.48 | ) | $ | 0.19 | $ | (27.22 | ) | ||||
| Weighted average common shares outstanding used in computing net income (loss) per common share attributable to common stockholders |
||||||||||||
| Basic |
20,117,543 | 20,892,040 | 2,513,487 | |||||||||
| Diluted |
20,117,543 | 21,920,861 | 2,513,487 | |||||||||
The accompanying notes are an integral part of these consolidated statements.
F-6
Table of Contents
Consolidated Statements of redeemable equity and stockholders’ equity (deficit)
| Redeemable equity | Stockholders’ equity (deficit) | ||||||||||||||||||||||||||||||||||||
| Redeemable convertible preferred stock (Notes 7 & 8) |
Common stock | Treasury Stock | Additional paid-in capital |
Accum Other Comp Inc. |
Accum deficit |
Total stockholders’ equity (deficit) |
|||||||||||||||||||||||||||||||
| Shares | Amount | Shares | Amount | Shares | Amount | ||||||||||||||||||||||||||||||||
| (in thousands other than share data) | |||||||||||||||||||||||||||||||||||||
| Balance at December 31, 2006 |
96,270,146 | 93,897 | 252,183 | 3 | — | — | — | — | (77,596 | ) | (77,593 | ) | |||||||||||||||||||||||||
| Exercise of stock options |
— | — | 12,455 | — | — | — | 21 | — | — | 21 | |||||||||||||||||||||||||||
| Reclassification of convertible preferred stock warrants from liability to equity |
— | — | — | — | — | — | 10,388 | — | — | 10,388 | |||||||||||||||||||||||||||
| Repurchase of fractional shares |
— | — | (17 | ) | — | — | — | — | — | — | — | ||||||||||||||||||||||||||
| Net exercise of stock warrants |
— | — | 53,903 | — | — | — | — | — | — | — | |||||||||||||||||||||||||||
| Conversion of redeemable preferred stock to common stock |
(96,270,146 | ) | (139,045 | ) | 9,996,009 | 10 | — | — | 139,035 | — | — | 139,045 | |||||||||||||||||||||||||
| Conversion of accumulated preferred stock dividends to common stock |
— | (20,411 | ) | 3,654,791 | 4 | — | — | 20,407 | — | — | 20,411 | ||||||||||||||||||||||||||
| Beneficial conversion of dividends |
— | — | — | — | — | — | 30,491 | — | (30,491 | ) | — | ||||||||||||||||||||||||||
| Dividends on preferred stock |
— | 5,625 | — | — | — | — | (5,625 | ) | — | — | (5,625 | ) | |||||||||||||||||||||||||
| Restricted stock grant |
— | — | 14,284 | — | — | — | — | — | — | — | |||||||||||||||||||||||||||
| Stock-based compensation |
— | — | — | — | 754 | — | — | 754 | |||||||||||||||||||||||||||||
| Accretion of preferred stock to redemption value |
— | 59,934 | — | — | — | — | (17,266 | ) | — | (42,668 | ) | (59,934 | ) | ||||||||||||||||||||||||
| Net proceeds from initial public offering |
— | — | 6,505,000 | 7 | — | — | 81,038 | — | — | 81,045 | |||||||||||||||||||||||||||
| Unrealized gain on investments |
— | — | — | — | — | — | — | 24 | — | 24 | |||||||||||||||||||||||||||
| Net loss |
— | — | — | — | — | — | — | — | (2,854 | ) | (2,854 | ) | |||||||||||||||||||||||||
| Comprehensive loss |
— | — | — | — | — | — | — | — | — | (2 ,830 | ) | ||||||||||||||||||||||||||
| Balance at December 31, 2007 |
— | — | 20,488,608 | 24 | — | — | 259,243 | 24 | (153,609 | ) | 105,682 | ||||||||||||||||||||||||||
| Exercise of stock options |
— | — | 485,943 | — | — | — | 602 | — | — | 602 | |||||||||||||||||||||||||||
| Restricted stock grant |
— | — | 5,537 | — | — | — | — | — | — | — | |||||||||||||||||||||||||||
| Stock-based compensation |
— | — | — | — | — | — | 771 | — | — | 771 | |||||||||||||||||||||||||||
| Net exercise of stock warrants |
— | — | 292,922 | — | — | — | — | — | — | — | |||||||||||||||||||||||||||
| Stock issued to board of directors |
— | — | 6,682 | — | — | — | — | — | — | — | |||||||||||||||||||||||||||
| Unrealized gain on investments |
— | — | — | — | — | — | — | 105 | — | 105 | |||||||||||||||||||||||||||
| Offering costs from initial public offering |
— | — | — | — | — | — | (38 | ) | — | — | (38 | ) | |||||||||||||||||||||||||
| Purchase of treasury stock, at cost |
— | — | — | — | (730,733 | ) | (3,084 | ) | — | — | — | (3,084 | ) | ||||||||||||||||||||||||
| Reclassification of par value |
— | — | — | (3 | ) | — | — | 3 | — | — | — | ||||||||||||||||||||||||||
| Net income |
— | — | — | — | — | — | — | — | 4,355 | 4,355 | |||||||||||||||||||||||||||
| Comprehensive income |
— | — | — | — | — | — | — | — | — | 4,460 | |||||||||||||||||||||||||||
| Balance at December 31, 2008 |
— | $ | — | 21,279,692 | $ | 21 | (730,733 | ) | (3,084 | ) | $ | 260,581 | $ | 129 | $ | (149,254 | ) | $ | 108,393 | ||||||||||||||||||
| Exercise of stock options |
— | — | 150,621 | — | — | — | 420 | — | — | 420 | |||||||||||||||||||||||||||
| Stock-based compensation |
— | — | — | — | 973 | — | — | 973 | |||||||||||||||||||||||||||||
| Unrealized gain (loss) on investments |
— | — | — | — | — | — | — | (126 | ) | — | (126 | ) | |||||||||||||||||||||||||
| Foreign currency translation adjustments |
— | — | — | — | — | — | — | (13 | ) | — | (13 | ) | |||||||||||||||||||||||||
| Net exercise of stock warrants |
— | — | 43,885 | — | — | — | — | — | — | — | |||||||||||||||||||||||||||
| Stock issued to board of directors |
— | — | 8,360 | — | — | — | — | — | — | — | |||||||||||||||||||||||||||
| Purchase of treasury stock, at cost |
— | — | — | — | (519,242 | ) | (2,577 | ) | — | — | — | (2,577 | ) | ||||||||||||||||||||||||
| Net loss |
— | — | — | — | — | — | — | — | (9,630 | ) | (9,630 | ) | |||||||||||||||||||||||||
| Comprehensive loss |
— | — | — | — | — | — | — | — | — | (9,769 | ) | ||||||||||||||||||||||||||
| Balance at December 31, 2009 |
— | $ | — | 21,482,558 | $ | 21 | (1,249,975 | ) | ($ | 5,661 | ) | $ | 261,974 | ($ | 10 | ) | $ | (158,884 | ) | $ | 97,440 | ||||||||||||||||
The accompanying notes are an integral part of these consolidated statements.
F-7
Table of Contents
Consolidated Statements of cash flows
| Year ended December 31, | ||||||||||||
| 2009 | 2008 | 2007 | ||||||||||
| (in thousands) | ||||||||||||
| Cash flows from operating activities |
||||||||||||
| Net income (loss) |
$ | (9,630 | ) | $ | 4,355 | $ | (2,854 | ) | ||||
| Adjustments to reconcile net income (loss) to net cash provided by (used in) operating activities |
||||||||||||
| Depreciation and amortization |
5,342 | 4,452 | 3,355 | |||||||||
| Amortization of financing costs |
— | — | 11 | |||||||||
| Net loss on disposal of equipment |
— | 1,215 | 139 | |||||||||
| Change in carrying value of convertible stock warrants |
— | — | 6,019 | |||||||||
| Stock-based compensation |
937 | 771 | 754 | |||||||||
| Interest expense related to accretion |
— | — | 769 | |||||||||
| Realized (gain)/loss on investments |
(47 | ) | 55 | — | ||||||||
| Changes in operating assets and liabilities: |
||||||||||||
| Accounts receivable |
(2,425 | ) | 131 | (1,748 | ) | |||||||
| Inventories |
1,285 | (5,360 | ) | (891 | ) | |||||||
| Spare parts |
1,436 | (2,366 | ) | (397 | ) | |||||||
| Prepaid expenses and other assets |
38 | (16 | ) | (617 | ) | |||||||
| Accounts payable |
(445 | ) | (132 | ) | 1,091 | |||||||
| Accrued payroll |
(162 | ) | (637 | ) | 558 | |||||||
| Deferred revenue |
— | (583 | ) | 518 | ||||||||
| Corporate income and franchise taxes |
(84 | ) | (130 | ) | 310 | |||||||
| Accrued and other current liabilities |
463 | (252 | ) | 90 | ||||||||
| Net cash provided by (used in) operating activities |
(3,292 | ) | 1,503 | 7,107 | ||||||||
| Cash flows from investing activities |
||||||||||||
| Purchases of property and equipment |
(5,530 | ) | (18,701 | ) | (10,564 | ) | ||||||
| Proceeds from disposal of assets |
— | — | 30 | |||||||||
| Purchase of investments |
(693 | ) | (2,048 | ) | (70,941 | ) | ||||||
| Proceeds from sale of investments |
7,922 | 25,039 | — | |||||||||
| Net cash provided by (used in) investing activities |
1,699 | 4,290 | (81,475 | ) | ||||||||
| Cash flows from financing activities |
||||||||||||
| Proceeds from issuance of common stock in initial public offering, net of issuance costs |
(38 | ) | 81,045 | |||||||||
| Proceeds from exercise of options |
420 | 602 | 21 | |||||||||
| Restricted cash |
(3 | ) | 5 | 9 | ||||||||
| Proceeds from line of credit |
— | — | 3,000 | |||||||||
| Payments on line of credit |
— | — | (3,973 | ) | ||||||||
| Payments on capital lease obligations |
— | (29 | ) | (251 | ) | |||||||
| Proceeds from issuance of long-term debt |
— | — | 5,100 | |||||||||
| Payments on long-term debt |
— | — | (9,841 | ) | ||||||||
| Purchase of treasury stock |
(2,577 | ) | (3,084 | ) | — | |||||||
| Net cash provided by (used in) financing activities |
(2,160 | ) | (2,544 | ) | 75,110 | |||||||
| Effect of foreign exchange rate changes on Cash and cash equivalents |
(16 | ) | — | — | ||||||||
| Net increase (decrease) in cash and cash equivalents |
(3,769 | ) | 3,249 | 742 | ||||||||
| Cash and cash equivalents, beginning of year |
7,629 | 4,380 | 3,638 | |||||||||
| Cash and cash equivalents, end of year |
$ | 3,860 | $ | 7,629 | $ | 4,380 | ||||||
| Supplemental disclosure of cash flow information |
||||||||||||
| Cash paid during the year for interest |
$ | — | $ | 2 | $ | 845 | ||||||
| Warrants issued with debt instruments |
— | — | 596 | |||||||||
| Conversion of convertible preferred stock warrant liability to common stock warrants |
— | — | 10,388 | |||||||||
| Conversion of redeemable preferred stock and accrued dividends to common stock |
— | — | 159,456 | |||||||||
| Dividend conversion feature |
— | — | 30,491 | |||||||||
| Restricted stock grant |
— | 108 | 189 | |||||||||
| Conversion of accounts receivable to investments |
— | 2,000 | — | |||||||||
| Unrealized gain (loss) on investments |
(126 | ) | 105 | 24 | ||||||||
| Deferred offering costs included in accounts payable |
61 | — | — | |||||||||
| Stock based compensation incurred for accrued director’s fees |
36 | — | — | |||||||||
The accompanying notes are an integral part of these consolidated statements.
F-8
Table of Contents
Notes to Consolidated Financial Statements
1. SUMMARY OF SIGNIFICANT ACCOUNTING POLICIES
Description of business
Rubicon Technology, Inc., a Delaware corporation (the “Company”), is an electronic materials provider that develops, manufactures and sells monocrystalline sapphire and other innovative crystalline products for LEDs, RFICs, blue laser diodes, optoelectronics and other optical applications. The Company sells its products on a global basis to customers in Asia, North America and Europe. The Company maintains its operating facilities in the Chicago metropolitan area.
Principles of consolidation
The consolidated financial statements include the accounts of the Company and its wholly owned subsidiaries, Rubicon Worldwide LLC and Rubicon Sapphire Technology (Malaysia) SDN BHD. All intercompany transactions and balances have been eliminated in consolidation.
Initial public offering
On November 21, 2007, the Company completed its initial public offering (IPO) of common stock in which a total of 6,505,000 shares were sold at an issuance price of $14.00 per share. The Company raised a total of $91.1 million in gross proceeds from the IPO, or approximately $81.0 million in net proceeds after deducting underwriting discount and commissions of $6.4 million and estimated other offering costs of approximately $3.6 million. Upon the closing of the IPO, all shares of redeemable convertible preferred stock outstanding and preferred stock dividends automatically converted into 13,385,722 shares of common stock. Also, upon the closing of the IPO, 1,217,152 Series B preferred stock warrants, and 131,096 Series C preferred stock warrants were exercised on a “net exercise” basis, which resulted in the Company issuing 48,068 shares of common stock. The remaining preferred stock warrants outstanding converted into 806,972 warrants to purchase common stock.
Follow-on Public Offering
On May 12, 2008, the Company completed a public offering of 3,950,000 shares of its common stock at a price of $24.00 per share. The Company did not receive any of the proceeds from the sale, as all of the shares were sold by certain selling stockholders of the Company. Additionally, the underwriters were granted a 30-day option to purchase up to an additional 592,500 shares of common stock from the selling stockholders at the public offering price to cover over-allotments. The underwriters exercised such option, in part, for 353,410 shares of common stock on June 6, 2008.
A summary of the Company’s significant accounting policies applied in the preparation of the accompanying consolidated financial statements follows.
Reverse stock split
All prior period common stock amounts have been retroactively adjusted to reflect a 1 for 13 reverse stock split effective August 30, 2007. As a result of this common stock split there was an automatic change in the conversion prices of all series of preferred stock and their related dividend conversion rates at the same 1 for 13 ratio.
F-9
Table of Contents
Rubicon Technology, Inc.
Notes to Consolidated Financial Statements—(Continued)
Cash and cash equivalents
The Company considers all unrestricted highly liquid investments immediately available to be cash equivalents. Cash equivalents primarily consist of time deposits with banks, unsettled trades and brokerage money market accounts.
Restricted cash
At December 31, 2009 and 2008, in connection with certain credit agreements, the Company is required to maintain $5,000 of restricted certificates of deposit. At December 31, 2009 and 2008, the Company held $3,555 and $205 of employee funds as part of a flexible spending program.
Investments
The Company invests available cash primarily in investment grade commercial paper, corporate notes and government securities. While the Company’s investment policy no longer includes auction-rate securities as an approved investment, the Company continues to hold auction-rate securities purchased prior to the policy change. The Company also holds put options associated with an agreement with UBS, AG (see “Auction-rate securities put options” below). Investments classified as available-for-sale securities are carried at fair market value with unrealized gains and losses recorded in accumulated other comprehensive income (loss). Investments in trading securities are reported at fair value, with both realized and unrealized gains and losses recorded in other income (expense), in the Consolidated Statements of Operations. Investments in which the Company has the ability and intent, if necessary, to liquidate in order to support its current operations, are classified as short-term. The Company accounts for its investments in privately held entities, for which fair value is not readily determinable, in accordance with ASC Topic 323, Investments—Equity Methods and Joint Ventures.
The Company reviews its available-for-sale securities investments at the end of each quarter for other-than-temporary declines in fair value based on the specific identification method. The Company considers various factors in determining whether an impairment is other-than-temporary, including the severity and duration of the impairment, changes in underlying credit ratings, forecasted recovery, its ability and intent to hold the investment for a period of time sufficient to allow for any anticipated recovery in market value and the probability that the scheduled cash payments will continue to be made. When the Company concludes that an other-than-temporary impairment has resulted, the difference between the fair value and carrying value is written off and recorded as a charge on the Consolidated Statements of Operations. As of December 31, 2009, no impairment was recorded.
Auction-rate securities put options (“ARS Put Options”)
In October 2008, the Company entered into an agreement that provides the Company with the right, but not the obligation, to sell all of its auction-rate securities to UBS, AG for par value during the period from June 30, 2010 to July 2, 2012. The ARS Put Options will provide the Company with the opportunity to recover the estimated unrealized loss on its ARS investments. The Company recorded the fair value of the ARS Put Options upon receipt and included it in short-term investments at December 31, 2009 and in other long-term assets at December 31, 2008. The Company values ARS Put Options at fair value using a discounted cash flow model. Unrealized gains and losses related to the ARS Put Options are recognized in earnings. See Note 3—Investments for additional information regarding the ARS Put Options.
Treasury Stock
The Company records treasury stock purchases under the cost method whereby the entire cost of the acquired stock is recorded as treasury stock.
F-10
Table of Contents
Rubicon Technology, Inc.
Notes to Consolidated Financial Statements—(Continued)
Accounts receivable
The majority of the Company’s accounts receivable are due from manufacturers, primarily in the sapphire substrate polishing business, serving the LED industry. Credit is extended based on an evaluation of the customer’s financial condition. Accounts receivable are due based on contract terms and at stated amounts due from customers, net of an allowance for doubtful accounts. Accounts outstanding longer than the contractual payment terms are considered past due. The Company determines its allowance by considering a number of factors, including the length of time past due, the customer’s current ability to pay and the condition of the general economy and industry as a whole. The Company writes off accounts receivable when they become uncollectible, and payments subsequently received on such receivables are recorded as a reduction to bad debt expense.
The following table shows the activity of the allowance for doubtful accounts:
| Year ended December 31, | |||||||
| 2009 | 2008 | ||||||
| Beginning balance |
$ | 629,027 | $ | 189,077 | |||
| Charges to costs and expenses |
(606,497 | ) | 351,088 | ||||
| Accounts charged off, less recoveries |
36,603 | 88,862 | |||||
| Ending balance |
$ | 59,133 | $ | 629,027 | |||
Inventories
Inventories are valued at the lower of cost or market. Cost is determined using the first-in, first-out method, and includes materials, labor and overhead. The Company reduces the carrying value of its inventories for differences between the cost and the estimated net realizable value, taking into account usage, expected demand, technological obsolescence and other information. Inventories are composed of the following:
| As of December 31, | ||||||||
| 2009 | 2008 | |||||||
| Raw materials |
$ | 3,981,490 | $ | 4,295,053 | ||||
| Work in progress |
1,277,255 | 1,775,400 | ||||||
| Finished goods |
2,788,267 | 2,400,984 | ||||||
| 8,047,012 | 8,471,437 | |||||||
| Reserve for obsolescence and realization |
(1,450,070 | ) | (589,409 | ) | ||||
| $ | 6,596,942 | $ | 7,882,028 | |||||
The following table shows the activity of the obsolescence and realization reserve:
| Year ended December 31, | ||||||
| 2009 | 2008 | |||||
| Beginning balance |
$ | 589,409 | $ | 326,013 | ||
| Charges to costs and expenses |
860,661 | 263,396 | ||||
| Ending balance |
$ | 1,450,070 | $ | 589,409 | ||
F-11
Table of Contents
Rubicon Technology, Inc.
Notes to Consolidated Financial Statements—(Continued)
Property and equipment
Property and equipment consisted of the following:
| As of December 31, | ||||||||
| 2009 | 2008 | |||||||
| Land and land improvements |
$ | 623,286 | $ | — | ||||
| Machinery, equipment and tooling |
48,125,529 | 42,322,148 | ||||||
| Leasehold improvements |
6,984,938 | 6,881,185 | ||||||
| Furniture and fixtures |
715,399 | 715,399 | ||||||
| Information systems |
545,983 | 545,983 | ||||||
| Construction in progress |
4,360,621 | 5,361,318 | ||||||
| Total cost |
61,355,756 | 55,826,033 | ||||||
| Accumulated depreciation and amortization |
(21,830,250 | ) | (16,488,760 | ) | ||||
| Property and equipment, net |
$ | 39,525,506 | $ | 39,337,273 | ||||
Property and equipment are carried at cost and depreciated over their estimated useful lives using the straight-line method. The cost of maintenance and repairs is charged to expense as incurred. Significant renewals and improvements are capitalized. Depreciation and amortization expense associated with property and equipment was $5,341,490, $4,452,065 and $3,354,903 for the years ended December 31, 2009, 2008 and 2007.
Construction in progress includes costs associated with the construction of furnaces and deposits made on equipment purchases. Interest costs capitalized were not significant for the year ended December 31, 2007.
The estimated useful lives are as follows:
| Asset description |
Life | |
| Machinery, equipment and tooling |
3-10 years | |
| Leasehold improvements |
Lesser of life of lease or economic life | |
| Furniture and fixtures |
7 years | |
| Information systems |
3 years |
Impairment of long-lived assets
When circumstances, such as adverse market conditions, indicate that the carrying value of a long-lived asset may be impaired, the Company performs an analysis to review the recoverability of the asset’s carrying value. The Company makes estimates of the undiscounted cash flows (excluding interest charges) from the expected future operations of the asset. These estimates consider factors such as expected future operating income, operating trends and prospects, as well as the effects of demand, competition and other factors. If the analysis indicates that the carrying value is not recoverable from future cash flows, an impairment loss is recognized to the extent that the carrying value exceeds the estimated fair value. Any impairment losses are recorded as operating expenses, which reduce net income.
During 2009, the Company’s machinery and equipment were underutilized due to a decline in sales. The Company did not perform a recoverability test of the assets to determine if further assessment for potential impairment was required as the sales decline is considered temporary due to the worldwide economic recession and is not considered a triggering event that would indicate that the carrying value may not be recoverable. In the fourth quarter 2009, the crystal growth and fabrication operations returned to full utilization and the Company expects the remaining operations to return to full utilization in 2010. There were no impairment losses on long lived assets for the years ended December 31, 2009, 2008 and 2007.
F-12
Table of Contents
Rubicon Technology, Inc.
Notes to Consolidated Financial Statements—(Continued)
Warranty cost
The Company’s sales terms include a warranty that its products will meet certain specifications and is based on terms that are generally accepted in the marketplace. The Company records a current liability for the expected cost of warranty-related claims at the time of sale. The warranty reserve is included in accrued and other current liabilities on the balance sheet. The following table presents changes in the Company’s product warranty liability for the years ended December 31:
| 2009 | 2008 | |||||||
| (in thousands) | ||||||||
| Balance, beginning of period |
$ | 51 | $ | 30 | ||||
| Charged to cost of sales |
12 | 199 | ||||||
| Actual product warranty expenditures |
(43 | ) | (178 | ) | ||||
| Balance, end of period |
$ | 20 | $ | 51 | ||||
Fair value of financial instruments
The Company’s financial instruments consist primarily of cash and cash equivalents, short and long-term investments, accounts receivable, and accounts payable. The carrying values of these assets and liabilities approximate their fair values due to the short-term nature of these instruments at December 31, 2009 and 2008. Fair value of put options on auction rate securities is discussed in Note 3 below.
Concentration of credit risks and other risks and uncertainties
Financial instruments that could potentially subject the Company to concentrations of credit risk consist principally of cash and cash equivalents and accounts receivable. At December 31, 2009 and 2008, the Company had $798,290 and $233,324 on deposit at a financial institution in excess of amounts insured by the Federal Deposit Insurance Corporation. The Company performs periodic evaluation of this institution for relative credit standing. The Company has not experienced any losses in such accounts and management believes it is not exposed to any significant risk of loss on these balances.
The Company currently depends on a small number of suppliers for certain raw materials, components, services and equipment, including key materials such as aluminum oxide and certain furnace components. If the supply of these components were to be disrupted or terminated, or if these suppliers were unable to supply the quantities of raw materials required, the Company may have difficulty in finding or may be unable to find alternative sources for these items. As a result, the Company may be unable to meet the demand for its products, which could have a material adverse impact on the Company.
Concentration of credit risk related to revenue and accounts receivable is discussed in Note 5 below.
Revenue recognition
The Company recognizes revenue from product sales when earned. Revenue is recognized when, and if, evidence of an arrangement is obtained and the other criteria to support revenue recognition are met, including:
| • | Persuasive evidence of an arrangement exists. The Company requires evidence of a purchase order with the customer specifying the terms and specifications of the product to be delivered, typically in the form of a signed quotation or purchase order from the customer. |
F-13
Table of Contents
Rubicon Technology, Inc.
Notes to Consolidated Financial Statements—(Continued)
| • | Title has passed and the product has been delivered. Title passage and product delivery generally occur when the product is delivered to a common carrier. |
| • | The price is fixed or determinable. All terms are fixed in the signed quotation or purchase order received from the customer. The purchase orders do not contain rights of cancellation, return, exchange or refund. |
| • | Collection of the resulting receivable is reasonably assured. The Company’s standard arrangement with customers includes 30 day payment terms. Customers are subject to a credit review process that evaluates the customers’ financial position and their ability to pay. Collectability is determined by considering the length of time the customer has been in business and history of collections. If it is determined that collection is not probable, no product is shipped and no revenue is recognized unless cash is received in advance. |
The Company does not provide maintenance or other services and does not have sales that involve multiple elements or deliverables.
Shipping and handling costs
The Company records costs incurred in connection with shipping and handling products as cost of goods sold. Amounts billed to customers in connection with these costs are included in revenue and are not material for any of the periods presented in the accompanying financial statements.
Sales tax
The Company collects and remits sales taxes on products sold to customers and reports such amounts under the net method in its consolidated Statements of Operations and records a liability until remitted to the respective tax authority.
Stock-based compensation
The Company requires all share-based payments to employees, including grants of employee stock options, issued after January 1, 2006, to be measured at fair value and expensed in the Consolidated Statements of Operations over the service period (generally the vesting period) of the grant. Expense is recognized in the Consolidated Statements of Operations for these share-based payments.
Research and development
Research and development costs are expensed as incurred. Research and development expense was $800,524, $861,805 and $769,421 in 2009, 2008 and 2007.
Accounting for uncertainty in income taxes
The Company’s practice is to recognize interest and/or penalties related to income tax matters in income tax expense. The Company had no accruals for interest and penalties as of December 31, 2009 and 2008, and had no interest or penalties for years ended December 31, 2009, 2008 and 2007. The Company is subject to taxation in the US and in a state jurisdiction. Due to the existence of net operating loss carryforwards, all tax years are open to examination by tax authorities.
F-14
Table of Contents
Rubicon Technology, Inc.
Notes to Consolidated Financial Statements—(Continued)
Use of estimates
The preparation of financial statements in conformity with accounting principles generally accepted in the United States of America (“US GAAP”) requires management to make estimates and assumptions that affect the reported amounts of assets and liabilities and disclosure of contingent assets and liabilities at the date of the financial statements, and the reported amounts of revenues and expenses during the reporting period. Actual results could differ from those estimates.
Income taxes
Deferred tax assets and liabilities are provided for temporary differences between financial reporting and income tax bases of assets and liabilities, and are measured using the enacted tax rates and laws expected to be in effect when the differences will reverse. Deferred income taxes also arise from the future benefits of net operating loss carryforwards. Valuation allowances are established when necessary to reduce deferred tax assets to the amounts expected to be realized. A valuation allowance equal to 100% of the net deferred tax assets has been recognized due to uncertainty regarding the future realization of these assets.
Other comprehensive income
Other comprehensive income refers to revenue, expenses, gains and losses that, under US GAAP, are included in other comprehensive income (loss), but are excluded from net income (loss), as these amounts are recorded directly as an adjustment to stockholders’ equity (deficit), net of tax. For the year ended December 31, 2009, the Company recorded an unrecognized gain on investments and differences due to translation rates used in converting the Company’s foreign subsidiaries financial statements in accumulated other comprehensive income. For the years ended December 31, 2008 and 2007, the Company recorded an unrecognized gain on investments in accumulated other comprehensive income.
Convertible preferred stock warrant liability
The Company classifies its outstanding preferred stock warrants as liabilities as the warrants are exercisable into redeemable preferred shares. The fair value of warrants classified as liabilities is adjusted for changes in fair value at each reporting period, and the corresponding non-cash gain or loss is recorded in current period earnings. The Company’s management determined the fair value of the preferred stock warrants at January 1, 2006 and at each subsequent reporting date. The methodology used to value the warrants was a Black-Scholes option-pricing model. The determination of the fair value using this model will be affected by assumptions regarding a number of complex and subjective variables. These variables include expected stock volatility over the contractual term of the warrants, risk-free interest rates, and the estimated fair value of the underlying preferred stock. The contractual term used was equal to the remaining contractual term of the warrants. The volatility was based on an analysis of a peer group of public companies. Historical price volatilities of these companies were evaluated over a period of time equal to the contractual term of the warrants. The risk-free interest rates were based on US Treasury zero-coupon rates in effect at each reporting period with terms consistent with the remaining contractual term of the warrants. The fair value of the underlying preferred stock at January 1, 2006 and at each subsequent reporting date was determined based upon management’s valuation of the Company using market and income approaches and utilizing an option pricing methodology to allocate the Company valuation to each equity security. The allocated valuation amounts were then probability weighted based upon management’s best estimates of an initial public offering or remaining private. At the IPO all preferred stock warrants were converted to common stock warrants (see note 7) and the liability value using the IPO price as an assumption in the Black-Scholes option-pricing model, was reclassified to equity.
F-15
Table of Contents
Rubicon Technology, Inc.
Notes to Consolidated Financial Statements—(Continued)
Redeemable convertible preferred stock
The Company had issued various series of preferred stock. The holders of Series A, B, B-2, C, C-2, D, D-2, and E preferred stock had the option to sell their shares back to the Company at the greater of the original purchase price plus accrued and unpaid dividends, or the current fair market value of the shares plus accrued and unpaid dividends. As a result, the carrying value of the preferred stock was increased by an accretion amount each period so that the carrying amounts was equal to the greater of fair value plus accrued and unpaid dividends or the original cost plus accrued and unpaid dividends value for the Series A, B, B-2, C, C-2, D, D-2, and E preferred stock. The accreted amounts were recorded to additional paid-in capital, if any, and then to accumulated deficit (See Note 8). At the IPO, the option to sell was terminated and the related accretion of the preferred shares was transferred to additional paid-in-capital.
Net income (loss) per common share attributable to common stockholders
Net income (loss) per share of common stock is as follows for the years ended December 31, 2009, 2008 and 2007:
| Year Ended December 31, | |||||||||||
| 2009 | 2008 | 2007 | |||||||||
| Net income (loss) per common share: |
|||||||||||
| Basic: |
|||||||||||
| Net income (loss) |
$ | (0.48 | ) | $ | 0.21 | $ | (1.14 | ) | |||
| Net income (loss) attributable to common stockholders |
$ | (0.48 | ) | $ | 0.21 | $ | (27.22 | ) | |||
| Diluted: |
|||||||||||
| Net income (loss) |
$ | (0.48 | ) | $ | 0.19 | $ | (1.14 | ) | |||
| Net income (loss) attributable to common stockholders |
$ | (0.48 | ) | $ | 0.19 | $ | (27.22 | ) | |||
| Weighted average common shares outstanding used in: |
|||||||||||
| Basic |
20,117,543 | 20,892,040 | 2,513,487 | ||||||||
| Diluted |
20,117,543 | 21,920,861 | 2,513,487 | ||||||||
Basic net income (loss) per share is computed by dividing net income (loss) by the weighted-average number of common shares outstanding during the period. Diluted net income (loss) per common share is computed by dividing net income (loss) by the weighted-average number of diluted common shares outstanding during the period. Diluted shares outstanding are calculated by adding to the weighted shares outstanding any common stock equivalents from redeemable preferred stock, outstanding stock options and warrants based on the treasury stock method.
Diluted net loss and net loss per common share is the same as basic net loss per common share in the years ended December 31, 2009 and 2007, because the effects of potentially dilutive securities are anti-dilutive.
The number of anti-dilutive shares excluded from the calculation of diluted net loss per share is as follows as of December 31:
| 2009 | 2007 | |||
| Warrants |
242,132 | 795,845 | ||
| Stock options |
958,254 | 1,710,494 | ||
| 1,200,386 | 2,506,339 | |||
F-16
Table of Contents
Rubicon Technology, Inc.
Notes to Consolidated Financial Statements—(Continued)
Recent accounting pronouncements
In April 2009, the Financial Accounting Standards Board (the “FASB”) issued Accounting Codification Statement (“ASC”) 825-10 (formerly FSP FAS 107-1 and APB 28-1), “Financial Instruments, Fair Value Option.” ASC 825-10 amends prior guidance to require disclosures about fair value of financial instruments for interim reporting periods of publicly traded companies as well as in annual financial statements. The pronouncement also requires those disclosures in summarized financial information at interim reporting periods. ASC 825-10 is effective for interim reporting periods ending after June 15, 2009, with early adoption permitted for periods ending after March 15, 2009. ASC 825-10 does not require disclosures for earlier periods presented for comparative purposes at initial adoption. In periods after initial adoption, comparative reporting at initial adoption is required. The adoption did not have a material effect on the determination or reporting of the Company’s financial results.
In April 2009, the FASB issued ASC 320-10 (formerly FSP FAS 115-2 and FAS 124-2), “Investments—Debt and Equity Securities.” ASC 320-10 amends the other-than-temporary impairment guidance for debt securities to make the guidance more operational and to improve the presentation and disclosure of other-than-temporary impairments on debt and equity securities in the financial statements. ASC 320-10 does not amend existing recognition and measurement guidance related to other-than-temporary impairments of equity securities. The effective date is for interim and annual reporting periods ending after June 15, 2009, with early adoption permitted for periods ending after March 15, 2009. Disclosures for earlier periods presented for comparative purposes at initial adoption are not required. In periods after initial adoption, comparative disclosures are required only for periods ending after initial adoption. The adoption did not have a material effect on the determination or reporting of the Company’s financial results.
In April 2009, the FASB issued ASC 820-10 (formerly FSP FAS 157-4), “Fair Value Measurements and Disclosure.” ASC 820-10 provides additional guidance for estimating fair value when the volume and level of activity for the asset or liability have significantly decreased. The pronouncement also includes guidance on identifying circumstances that indicate a transaction is not orderly. The effective date is for interim and annual reporting periods ending after June 15, 2009, with early adoption permitted for periods ending after March 15, 2009. Disclosures for earlier periods presented for comparative purposes at initial adoption are not required. In periods after initial adoption, comparative disclosures only for periods ending after initial adoption are required. The adoption did not have a material effect on the determination or reporting of the Company’s financial results.
Effective January 1, 2009, the Company implemented Topic 820-10 (formerly SFAS 157), “Fair Value Measurements and Disclosures,” for its nonfinancial assets and liabilities that are remeasured at fair value on a non-recurring basis. See Note 4 for disclosures associated with adoption of this standard. The adoption of Topic 820-10 had no impact on the Company’s accounting for nonfinancial assets and liabilities.
In May 2009, the FASB issued ASC 855-10 (formerly SFAS 165), “Subsequent Events.” ASC 855-10 sets forth: (1) the period after the balance sheet date during which management of a reporting entity should evaluate events or transactions that may occur for potential recognition or disclosure in financial statements, (2) the circumstances under which an entity should recognize events or transactions occurring after the balance sheet date in its financial statements and (3) the disclosures that an entity should make about events or transactions that occurred after the balance sheet date. The pronouncement is effective with interim and annual financial periods ending after June 15, 2009. The Company adopted ASC 855-10 at the beginning of its 2009 third quarter. The adoption did not have a significant impact on the subsequent events that the Company reports, either through recognition or disclosure, in its consolidated financial statements.
F-17
Table of Contents
Rubicon Technology, Inc.
Notes to Consolidated Financial Statements—(Continued)
In June 2009, the FASB issued ASC 105-10 (formerly SFAS 168), “The FASB Accounting Standards Codification and the Hierarchy of Generally Accepted Accounting Principles”. ASC 105-10 will become the source of authoritative U.S. GAAP recognized by the FASB to be applied by nongovernment entities. It also modifies the GAAP hierarchy to include only two levels of GAAP: authoritative and non-authoritative. ASC 105-10 is effective for financial statements issued for interim and annual periods ending after September 15, 2009. The Company adopted ASC 105-10 for the 2009 third quarter reporting. The adoption did not have a significant impact on the reporting of the Company’s financial position, results of operations or cash flows.
In October 2009, the FASB issued new guidance that significantly changes the accounting for revenue in arrangements with multiple deliverables by requiring entities to separately account for individual deliverables in more of these arrangements and estimate the fair value of each component individually on a pro-rata basis. The guidance removes the criterion that entities must use vendor-specific objective and reliable evidence of fair value when separately accounting for deliverables, allowing for the recognition of revenue in a manner that more closely aligns with the economics of certain arrangements, based on management’s estimate of the selling price. The standard must be applied prospectively to revenue arrangements entered into or materially modified in fiscal years beginning on or after June 15, 2010. In addition, the FASB significantly expanded the disclosures related to multiple deliverable revenue arrangements. Although the Company continues to evaluate the impact of the adoption of this standard on its consolidated financial statements, the Company believes the impact of adoption will not be material in 2011, but could have a significant impact on future results as new or materially modified revenue arrangements with certain partners are established in the normal course of business.
Reclassifications
Certain prior period amounts on the balance sheet have been reclassified to conform to the current period presentation.
2. SEGMENT INFORMATION
The Company has determined that it operates in only one segment as it only reports profit and loss information on an aggregate basis to its chief operating decision maker.
Revenue is attributed by geographic region based on ship-to location of the Company’s customers. The following table summarizes revenue by geographic region:
| Year Ended December 31, | |||||||||
| 2009 | 2008 | 2007 | |||||||
| (in thousands) | |||||||||
| Asia |
$ | 14,288 | $ | 20,045 | $ | 24,605 | |||
| North America |
4,970 | 16,519 | 8,682 | ||||||
| Europe |
550 | 1,274 | 823 | ||||||
| Revenue |
$ | 19,808 | $ | 37,838 | $ | 34,110 | |||
3. INVESTMENTS
The Company invests available cash primarily in investment grade commercial paper, corporate notes and government securities. The Company’s short-term investments balance of $40.7 million as of December 31, 2009, is comprised of US Treasury securities of $21.8 million, auction-rate securities and put options of $10.1 million, corporate notes and bonds of $4.1 million, FDIC guaranteed certificates of deposit of $3.1 million and
F-18
Table of Contents
Rubicon Technology, Inc.
Notes to Consolidated Financial Statements—(Continued)
commercial paper of $1.6 million. The Company’s investments, except for the auction-rate securities, put options and long-term investments, are classified as available-for-sale securities and are carried at fair market value with unrealized gains and losses recorded in accumulated other comprehensive income (loss).
While the Company’s investment policy no longer includes auction-rate securities as an approved investment, the Company continues to hold auction-rate securities purchased prior to the policy change. In February 2008, the Company began experiencing failed auctions of its entire auction-rate securities portfolio, resulting in its inability to sell these securities in the short term. All of these auction-rate securities are AAA rated by one or more of the major credit rating agencies and have contractual maturities from 2036 to 2045. Further, all of these securities are collateralized by student loans, and approximately 99% of the collateral qualifies under the Federal Family Education Loan Program and is guaranteed by the US government. The Company is receiving the underlying cash flows (interest and redemptions) on all its auction-rate securities. The Company is unable to predict if these funds will become available before their maturity dates. The Company also holds put options associated with an agreement with UBS, AG related to the auction-rate securities purchased through them. It is the Company’s intent to exercise these put options at the first available date, therefore, the auction-rate securities and the related put options have been classified as short-term investments as of December 31, 2009. The auction-rate securities are trading securities recorded at fair value and unrealized gains and losses are reported as part of gain on investments in the Consolidated Statements of Operations. The Company’s long-term investments at December 31, 2009 consist of a $2.0 million investment in Peregrine Semiconductor, Corp. (a customer) Series D-1 Preferred shares.
As noted above, in October 2008 the Company entered into an agreement with UBS, AG, which provides the Company certain rights to sell to UBS, AG the auction-rate securities that were purchased through them. As of December 31, 2009, the Company held $10.1 million par value auction-rate securities purchased from UBS, AG. The Company has the option to sell these securities to UBS, AG at par value from June 30, 2010 through July 2, 2012. UBS, AG, at its discretion, may purchase or sell these securities on the Company’s behalf at any time provided the Company receives par value for the securities sold. The issuers of the auction-rate securities continue to have the right to redeem the securities at their discretion. The agreement also permits the Company to establish a demand revolving credit line in an amount equal to the par value of the securities at a net no cost. If the Company’s debt is determined to be rated below investment grade or is not rated, the amount that can be borrowed is limited to 75% of the market value of the auction-rate securities. As of December 31, 2009, the Company had no loans outstanding under this agreement.
The Company’s right to sell the auction-rate securities to UBS, AG, commencing on June 30, 2010, represents put options for a payment equal to the par value of the auction-rate securities. The Company values the put options at their estimated fair value using a discounted cash flow model. During the year ended December 31, 2009, the Company recorded a loss of $459,734, representing the changes in fair value of the put options. The Company also recorded a gain of $506,413, representing the change in fair value of the auction-rate securities, for the year ended December 31, 2009. Both the gain and loss from recording the change in fair value of the put options and auction-rate securities were recorded in gain (loss) on investments in the Consolidated Statements of Operations.
The Company values the auction-rate securities and put options using a discounted cash model that weighs various factors, including interest rates and expected holding period. At December 31, 2009, the fair value recorded on the balance sheet of auction-rate securities and ARS put options was $8.9 million and $1.2 million, respectively. The Company believes this is a fair value of these investments at December 31, 2009.
The investment in Peregrine Semiconductor Corp. (Peregrine) is accounted for as a cost method investment.
F-19
Table of Contents
Rubicon Technology, Inc.
Notes to Consolidated Financial Statements—(Continued)
The following table presents the amortized cost, and gross unrealized gains and losses on all securities at December 31, 2009:
| Amortized Cost |
Gross Unrealized Gains |
Gross Unrealized Losses |
Fair Value | |||||||||
| (in thousands) | ||||||||||||
| Short-term Investments: |
||||||||||||
| U.S. Treasury securities and agency (taxable) |
$ | 21,826 | $ | 3 | $ | — | $ | 21,829 | ||||
| Corporate Notes/Bonds (taxable) |
4,072 | — | 2 | 4,070 | ||||||||
| FDIC guaranteed certificates of deposit (taxable) |
3,080 | 2 | — | 3,082 | ||||||||
| Commercial Paper (taxable) |
1,642 | 1 | — | 1,643 | ||||||||
| Auction rate securities |
8,940 | — | — | 8,940 | ||||||||
| Auction rate securities put options |
1,152 | — | — | 1,152 | ||||||||
| Total short-term investments |
$ | 40,712 | $ | 6 | $ | 2 | $ | 40,716 | ||||
The Company values its investments at fair value, defined as the price that would be received to sell an asset or paid to transfer a liability (an exit price) in the principal or most advantageous market for the asset or liability in an orderly transaction between market participants on the measurement date. Valuation techniques used to measure fair value must maximize the use of observable inputs and minimize the use of unobservable inputs. The standard describes a fair value hierarchy based on three levels of inputs, of which the first two are considered observable and the last unobservable, that may be used to measure fair value which are the following:
| • | Level 1—Quoted prices in active markets for identical assets or liabilities. |
| • | Level 2—Inputs other than Level 1 that are observable, either directly or indirectly, such as quoted prices for similar assets or liabilities; quoted prices in markets that are not active; or other inputs that are observable or can be corroborated by observable market data for substantially the full term of the assets or liabilities. |
| • | Level 3—Unobservable inputs that are supported by little or no market activity and that are significant to the fair value of the assets or liabilities. |
The following table summarizes the Company’s financial assets measured at fair value on a recurring basis as of December 31, 2009:
| Level 1 | Level 2 | Level 3 | Total | |||||||||
| Cash Equivalents: |
||||||||||||
| Money market funds |
$ | 2,747 | $ | — | $ | — | $ | 2,747 | ||||
| Investments: |
||||||||||||
| Available-for-sales securities—current |
— | 30,624 | — | 30,624 | ||||||||
| Trading securities—current |
— | — | 10,092 | 10,092 | ||||||||
| Total |
$ | 2,747 | $ | 30,624 | $ | 10,092 | $ | 43,463 | ||||
F-20
Table of Contents
Rubicon Technology, Inc.
Notes to Consolidated Financial Statements—(Continued)
Level 3 assets consist of AAA-rated municipal bonds with an auction reset feature (auction rate securities) whose underlying assets are generally student loans which are substantially backed by the federal government and auction rate security put options. As of December 31, 2009, it is the company’s intent to exercise the auction-rate security put options at the first available date; therefore, the Company has classified its investment in auction-rate securities as short-term investments. These investments were valued at fair value as of December 31, 2009.
The following table provides a summary of changes in fair value of the Company’s Level 3 financial assets as of December 31, 2009:
| Level 3 assets |
||||
| Balance at January 1, 2009 |
$ | 10,696 | ||
| Redemption of auction-rate securities |
(651 | ) | ||
| Net recognized gains |
47 | |||
| Balance at December 31, 2009 |
$ | 10,092 | ||
The Company holds certain assets and liabilities that are measured at fair value on a non-recurring basis in periods subsequent to initial recognition. The fair value of a cost method investment is not estimated if there are no identified events or changes in circumstances that may have a significant adverse effect on the fair value of the investment. The aggregate carrying amount of the Company’s cost method investments was $2 million as of December 31, 2009 and 2008. As of December 31, 2009 the Company had no material assets or liabilities measured at fair value on a non-recurring basis using significant unobservable inputs (Level 3).
In addition to the debt securities noted above, the Company had approximately $1,113,000 of time deposits included in cash and cash equivalents as of December 31, 2009.
4. RELATED PARTY TRANSACTIONS
In November 2008, the Company purchased 1,345,444 shares of Peregrine Series D-1 Preferred shares for a total of $2.0 million, which represents less than 1% of shares outstanding. The terms and stock price of the purchase were the same as for the other investors who participated. Peregrine is a customer of the Company. For year ended December 31, 2009, revenue from Peregrine was $1,708,350. As of December 31, 2009, accounts receivable from Peregrine was $162,000. The pricing terms and conditions of the sales to Peregrine are similar to those available to the Company’s other non-related customers.
5. SIGNIFICANT CUSTOMERS
For the year ended December 31, 2009, the Company had three customers that accounted approximately 20%, 17% and 11% of its revenue. For the year ended December 31, 2008, the Company had four customers that accounted for approximately 29%, 17%, 12% and 10% of its revenue. For the year ended December 31, 2007, the Company had three customers that accounted for approximately 26%, 21% and 15% of its revenue.
Customers individually representing more than 10% of trade receivables accounted for approximately 68% and 61% of accounts receivable as of December 31, 2009 and 2008. The Company grants credit to customers based on an evaluation of their financial condition. Losses from credit sales are provided for in the financial statements.
6. CREDIT ARRANGEMENTS
Long-term debt
On April 9, 2007, the Company entered into a three year $12,000,000 term loan. An initial draw of $5,093,674 was used to retire all outstanding term debt, line of credit debt, terminal payments and debt fees. The
F-21
Table of Contents
Rubicon Technology, Inc.
Notes to Consolidated Financial Statements—(Continued)
term loan had an interest only period through October 13, 2007 which was extended for two quarters as the Company met the required trailing quarterly EBITDA of excess of $500,000. The term loan interest rate was prime plus 3.375%. Series E warrants to purchase 1,710,620 shares of Series E Preferred Stock were issued as part of this transaction. These warrants had an estimated fair market value of $596,151 at issuance. On November 26, 2007, the new terms loans were retired with proceeds from the IPO and the agreement was terminated. At the IPO date the Series E warrants were converted into 131,586 common stock warrants.
Lines of credit
On April 9, 2007 the Company entered into a one year $4,000,000 accounts receivable and inventory line of credit with a lender. Proceeds were used to retire all outstanding line of credit debt under a previous agreement. The line of credit interest rate was prime plus 0.25%. On November 26, 2007, the line of credit was retired with proceeds from the IPO and the agreement was terminated.
7. STOCKHOLDERS’ EQUITY (DEFICIT), REDEEMABLE STOCK CONVERSIONS, ACCRUED DIVIDEND CONVERSIONS AND WARRANT CONVERSIONS
Common Stock
As of December 31, 2009, the Company had 85,000,000 shares of common stock authorized with a par value of $0.001 and the Company had reserved 2,194,286 shares of common stock for issuance upon the exercise of outstanding common stock options. Also, 874,269 shares of the Company’s common stock were reserved for future grants of stock options (or other similar equity instruments) under the Company’s 2001 Equity Plan and 2007 Stock Incentive Plan as of December 31, 2009. In addition 281,561 shares of the Company’s common stock were reserved for future exercise of outstanding warrants as of December 31, 2009.
On November 21, 2007, the Company completed an IPO of 6,505,000 shares of its common stock (including the underwriters’ exercise of their over-allotment option) at a public offering price of $14.00 per share. Net cash proceeds from the initial public offering were $81 million after deducting offering costs.
Redeemable Stock Conversions
On August 28, 2007, 370,000 shares of Series A redeemable convertible preferred stock were converted into 204,826 shares of common stock. In addition, holders of the Series A redeemable convertible preferred stock were entitled to receive dividends. The dividends that accrued through August 28, 2007, the conversion date, were $578,923 and were paid out in the form of 60,252 shares of common stock.
In addition, in connection with the completion of the IPO on November 21, 2007, and pursuant to the amended and restated articles of incorporation of the Company, all outstanding shares of redeemable convertible preferred stock (Series A, B, B-2, C, C-2, D, D-2 and E) were converted into an aggregate of 9,791,183 shares of common stock as follows:
| Preferred Stock Series |
Amount of Common Shares | |
| Series A Conversion |
885,187 | |
| Series B Conversion |
880,403 | |
| Series B-2 Conversion |
2,149,614 | |
| Series C Conversion |
262,999 | |
| Series C-2 Conversion |
1,280,823 | |
| Series D Conversion |
86,126 | |
| Series D-2 Conversion |
655,403 | |
| Series E Conversion |
3,590,628 | |
| 9,791,183 | ||
F-22
Table of Contents
Rubicon Technology, Inc.
Notes to Consolidated Financial Statements—(Continued)
Accrued Dividend Conversions
Holders of all redeemable convertible preferred stock were entitled to receive dividends. Such dividends accrued through November 21, 2007, the closing date of the IPO and were paid out in the form of shares of common stock as follows:
| Preferred Stock Series |
Accumulated dividends |
Common shares issued upon conversion | |||
| Series A |
$ | 2,624,510 | 273,150 | ||
| Series B |
4,099,085 | 563,061 | |||
| Series B-2 |
4,930,453 | 1,351,623 | |||
| Series C |
925,926 | 95,106 | |||
| Series C-2 |
3,569,436 | 472,179 | |||
| Series D |
186,488 | 22,334 | |||
| Series D-2 |
1,139,112 | 170,807 | |||
| Series E |
2,357,495 | 646,279 | |||
| $ | 19,832,505 | 3,594,539 | |||
Warrant Conversions
During 2007, preferred stock warrants were granted, exercised and expired as follows:
| Series A | Series B | Series B-2 | Series C | Series E | ||||||||
| Preferred stock warrants outstanding at December 31, 2006 |
17,000 | 1,792,351 | 647,379 | 131,096 | 6,790,802 | |||||||
| Granted |
— | — | — | — | 1,710,620 | |||||||
| Exercised |
— | (1,217,152 | ) | — | (131,096 | ) | — | |||||
| Preferred stock warrants outstanding on November 21, 2007 |
17,000 | 575,199 | 647,379 | — | 8,501,422 | |||||||
| Conversion to common stock warrants upon IPO |
9,410 | 44,243 | 99,377 | — | 653,942 | |||||||
1,217,152 Series B warrants and 131,096 Series C warrants were exercised in full in connection with the IPO on a “net exercise” basis, which resulted in the Company issuing 48,068 shares of common stock to the warrant holders.
8. REDEEMABLE EQUITY AND STOCKHOLDERS’ EQUITY
The following are descriptions of the Series E, D, C, B and A redeemable convertible preferred stock and the Series E, C, B-2, B and A preferred stock warrants. All classes of redeemable convertible preferred stock were converted into common stock on November 21, 2007, the date the Company completed its IPO.
F-23
Table of Contents
Rubicon Technology, Inc.
Notes to Consolidated Financial Statements—(Continued)
As of December 31, 2006 the Company had redeemable convertible preferred stock, as follows (in thousands):
| As of December 31, |
2006 | ||
| Authorized shares |
139,786 | ||
| Outstanding shares: |
|||
| Series A |
1,969 | ||
| Series B |
11,445 | ||
| Series B-2 |
14,001 | ||
| Series C |
3,357 | ||
| Series C-2 |
12,693 | ||
| Series D |
865 | ||
| Series D-2 |
5,258 | ||
| Series E |
46,682 | ||
| Total outstanding shares |
96,270 | ||
| Liquidation amounts: |
|||
| Series A |
$ | 18,358 | |
| Series B and B-2 |
32,464 | ||
| Series C and C-2 |
15,368 | ||
| Series D and D-2 |
5,884 | ||
| Series E |
20,749 | ||
| Total liquidation amounts |
$ | 92,823 | |
| As of December 31, |
2006 | ||
| Cumulative proceeds, net of issuance costs: |
|||
| Series A |
$ | 10,473 | |
| Series B and B-2 |
14,204 | ||
| Series C and C-2 |
12,142 | ||
| Series D and D-2 |
4,982 | ||
| Series E |
12,989 | ||
| Total cumulative proceeds, net of issuance costs |
$ | 54,790 | |
The Company issued various series of preferred stock. At anytime after December 15, 2007, the holders of Series E, D, D-2, C, C-2, B, B-2 and A preferred stock had the option to sell their shares back to the Company at the greater of original purchase price plus accrued and unpaid dividends, or the current fair market value of the shares plus accrued and unpaid dividends. As a result, the carrying value of the preferred stock was increased by an accretion each period so that the carrying amounts will equal the greater of original purchase price plus accrued and unpaid dividends, or the current fair market value of the shares plus accrued and unpaid dividends for the Series E, D, D-2, C, C-2, B, B-2 and A preferred stock. The accreted amounts were recorded to additional paid-in capital, if any, and then to accumulated deficit. The accretion recorded during 2007 was recorded to bring the carrying value of the redeemable convertible preferred stock to their redemption values as of November 21, 2007, the date the company completed its IPO and converted all of the redeemable convertible preferred stock outstanding into common stock.
F-24
Table of Contents
Rubicon Technology, Inc.
Notes to Consolidated Financial Statements—(Continued)
Dividend conversion feature
The Company’s redeemable convertible preferred stock provided that the holder, at their discretion, could require the conversion of accumulated dividends into either cash or common stock based upon stated conversion rates. Accordingly, any excess of the fair value of common stock the holder would receive over the accumulated dividends is recorded as the dividends are accrued. At December 31, 2006 and November 21, 2007, the IPO date, the accumulated dividends were greater than the value of the shares the holder would receive upon conversion. At the closing of the IPO accumulated dividends were converted to common stock.
Series E redeemable convertible preferred stock
During 2005, the Company sold 26,762,892 shares of its Series E preferred stock at $0.2806 per share. In November 2005, 19,601,160 of those shares were issued simultaneously with the first sale of the Series E stock, as a result of the automatic conversion of $5,500,000 of principal under certain promissory notes issued by the Company from August 2005 through October 2005. In connection with the promissory notes, the Company issued detachable warrants, the number and exercise price of which were not known until the completion of the subsequent financing in November 2005. The Company recorded the fair value of the warrants of $773,621 and beneficial interest upon conversion of $678,000. The remaining 7,161,732 shares were sold in November and December 2005. In early 2006, the Company sold 19,918,625 shares of its Series E preferred stock at $0.2806 per share.
Each share of Series E preferred stock had a $0.001 par value. Each share of Series E preferred stock was entitled to a liquidation preference equal to $0.4210 per share plus any accrued but unpaid dividends on such share. The liquidation preference on the Series E was payable in preference to the payment of all liquidation preferences on all other series of preferred stock of the Company and participated pro rata with the common stock and the other series of preferred stock in any remaining assets of the Company after payment of all the liquidation preferences on outstanding preferred stock.
Each share of Series E preferred stock accrued cumulative dividends at a rate of $0.02806 per annum, compounded annually. At December 31, 2006, accumulated and undeclared dividends were $1,096,021. Each outstanding share of the Series E stock was convertible into 0.0769 shares of the Company’s common stock and, at the option of the holder, accrued dividends on such share were convertible into shares of common stock at the rate of $3.6478 per share. The holders of Series E preferred stock were entitled to vote on all matters on which holders of the Company’s common stock were entitled to vote, voting on an as-converted basis, except as the holders of common stock are entitled to vote as a separate class of stock as provided by law or the Company’s certificate of incorporation.
Series D redeemable convertible preferred stock
During 2005, the Company sold 6,123,619 shares of its Series D preferred stock at $0.8312 per share. Of those shares, 2,514,388 were issued simultaneously with the first sale of the Series D stock, as a result of the automatic conversion of $2,000,000 of principal under certain promissory notes issued by the Company in March 2005.
In connection with the sales of Series E preferred stock of the Company, certain holders participating in the Series E offering were entitled to and exchanged 5,258,432 shares of Series D stock for 5,258,432 shares of a newly authorized series of preferred stock called Series D-2 preferred stock. The terms, rights and preferences of the Series D stock and the Series D-2 stock were identical except for the rate by which such stock and related dividends were convertible into common stock of the Company. Specifically, the Series D stock was not entitled to any anti-dilution adjustment to the rate by which the Series D stock was convertible into common stock by reason of the issuance of the Series E stock.
F-25
Table of Contents
Rubicon Technology, Inc.
Notes to Consolidated Financial Statements—(Continued)
Each share of Series D and D-2 preferred stock had a $0.001 par value. In liquidation, each share of Series D and D-2 preferred stock was entitled to a liquidation preference equal to $0.8312 per share plus any accrued but unpaid dividends on such share. The liquidation preference on the Series D and D-2 stock was payable only after payment in full of the liquidation preference payable with respect to the Series E stock, but in preference to the payment of all liquidation preferences on all other series of Company’s preferred stock. After payment of all the liquidation preferences attributable to the preferred stock, the holders of the outstanding Series D and D-2 stock participated pro rata with the common stock and each other series of preferred stock in the distribution of any remaining assets of the Company.
Each share of Series D and D-2 preferred stock accrued cumulative dividends at a rate of $0.08312 per annum, compounded annually. At December 31, 2006, accumulated and undeclared Series D-2 and D dividends were $682,086 and $112,226, respectively. Each outstanding share of the Series D stock was convertible into 0.0995 shares of the Company’s common stock and, at the option of the holder; accrued dividends on such share were convertible into shares of common stock at the rate of $8.3499 per share. Each outstanding share of the Series D-2 stock was convertible into 0.1246 shares of the Company’s common stock and, at the option of the holder, accrued dividends on such share were convertible into shares of common stock at the rate of $6.669 per share. The holders of Series D and D-2 preferred stock were entitled to vote on all matters on which holders of the Company’s common stock were entitled to vote, voting on an as-converted basis, except as the holders of common stock were entitled to vote as a separate class of stock as provided by law or the Company’s certificate of incorporation.
Series C redeemable convertible preferred stock
In 2005, in connection with the sales of Series E preferred stock of the Company, certain holders participating in the Series E offering were entitled to and exchanged 12,693,013 outstanding shares of Series C preferred stock for 12,693,013 shares of a newly authorized series of preferred stock called Series C-2 preferred stock. The terms, rights and preferences of the Series C stock and the Series C-2 stock were identical except for the rate by which such stock and related dividends were convertible into common stock of the Company. Specifically, the Series C stock was not entitled to any anti-dilution adjustment to the rate by which the Series C stock was convertible into common stock by reason of the issuance of the Series E stock.
Each share of Series C and C-2 preferred stock had a $0.001 par value. In liquidation, each share of Series C and C-2 preferred stock was entitled to a liquidation preference equal to $0.7628 per share plus any accrued but unpaid dividends on such share. The liquidation preference on the Series C and C-2 stock was payable only after payment in full of the liquidation preference payable with respect to the Series E, D and D-2 stock but in preference to the payment of all liquidation preferences on all other series of the Company’s preferred stock. After payment of all the liquidation preferences attributable to the preferred stock, the holders of the outstanding Series C and C-2 stock participated pro rata with the common stock and each of the other series of preferred stock in the distribution of any remaining assets of the Company.
Each share of Series C and C-2 preferred stock accrued cumulative dividends at a rate of $0.07628 per annum, compounded annually. At December 31, 2006, accumulated and undeclared Series C-2 and C dividends were $2,471,861 and $653,662, respectively. Each outstanding share of the Series C stock was convertible into 0.0784 shares of the Company’s common stock and, at the option of the holder, accrued dividends on such share were convertible into shares of common stock at the rate of $9.7357 per share. Each outstanding share of the Series C-2 stock was convertible into 0.1009 shares of the Company’s common stock and, at the option of the holder, accrued dividends on such share were convertible into shares of common stock at the rate of $7.5595 per share. The holders of Series C and C-2 preferred stock were entitled to vote on all matters on which holders of
F-26
Table of Contents
Rubicon Technology, Inc.
Notes to Consolidated Financial Statements—(Continued)
the Company’s common stock were entitled to vote, voting on an as-converted basis, except as the holders of common stock were entitled to vote as a separate class of stock as provided by law or the Company’s certificate of incorporation.
Series B redeemable convertible preferred stock
In 2005, in connection with the sales of Series E preferred stock of the Company, certain holders participating in the Series E offering were entitled to and exchanged 14,001,191 outstanding shares of Series B stock for 14,001,191 shares of a newly authorized series of preferred stock called Series B-2 stock. The terms, rights and preferences of the Series B stock and the Series B-2 stock were identical except for the amount of the liquidation preference and the rate by which such stock and related dividends were convertible into common stock of the Company. The Series B stock was not entitled to any anti-dilution adjustment to the rate by which the Series B stock was convertible into common stock by reason of the issuance of the Series E stock.
Each share of Series B and B-2 preferred stock had a $0.001 par value. In liquidation, each share of Series B preferred stock was entitled to a liquidation preference equal to $0.8415 per share and each share of Series B-2 preferred stock was entitled to a liquidation preference equal to $1.122 per share, in each case plus any accrued but unpaid dividends on such share. The liquidation preference on the Series B and B-2 stock was payable only after payment in full of the liquidation preference payable with respect to the Series E, D, D-2, C and C-2 stock but in preference to the payment of all liquidation preferences on shares of the Company’s Series A preferred stock. After payment of all the liquidation preferences attributable to the preferred stock, the holders of the outstanding Series B and B-2 stock participated pro rata with the common stock and each of the other series of preferred stock in the distribution of any remaining assets of the Company.
Each share of Series B and B-2 preferred stock accrued cumulative dividends at a rate of $0.056 per annum, compounded annually. At December 31, 2006, accumulated and undeclared Series B-2 and B dividends were $3,919,698 and $3,204,148, respectively. Each outstanding share of the Series B stock was convertible into 0.0769 share of the Company’s common stock and, at the option of the holder; accrued dividends on such share were convertible into shares of common stock at the rate of $7.28 per share. Each outstanding share of the Series B-2 stock was convertible into 0.1535 shares of the Company’s common stock and, at the option of the holder, accrued dividends on such share were convertible into shares of common stock at the rate of $3.6478 per share. The holders of Series B and B-2 preferred stock were entitled to vote on all matters on which holders of the Company’s common stock were entitled to vote, voting on an as-converted basis, except as the holders of common stock were entitled to vote as a separate class of stock as provided by law or the Company’s certificate of incorporation.
Series A redeemable convertible preferred stock
Each share of Series A stock had a $0.001 par value. In liquidation, each share of Series A stock was entitled to a liquidation preference equal to $7.9785 per share plus any accrued but unpaid dividends on such share. The liquidation preference on the Series A stock was payable only after payment in full of the liquidation preference payable with respect to all of the other outstanding series of preferred stock. After payment of all the liquidation preferences attributable to the preferred stock, the holders of the outstanding Series A stock participated pro rata with the common stock and each of the other series of preferred stock in the distribution of any remaining assets of the Company, except that the holders of Series A were limited in their further distribution pursuant to a formula set forth in the Company’s certificate of incorporation.
F-27
Table of Contents
Rubicon Technology, Inc.
Notes to Consolidated Financial Statements—(Continued)
Each share of Series A preferred stock accrued cumulative dividends at a rate of $0.26595 per annum, compounded annually. At December 31, 2006, accumulated and undeclared Series A dividends were $2,647,658. Each outstanding share of the Series A stock was convertible into 0.5536 shares of the Company’s common stock and, at the option of the holder, accrued dividends on such share were convertible into shares of common stock at the rate of $9.6083 per share. The holders of Series A preferred stock were entitled to vote on all matters on which holders of the Company’s common stock were entitled to vote, voting on an as-converted basis, except as the holders of common stock were entitled to vote as a separate class of stock as provided by law or the Company’s certificate of incorporation.
Warrants
At December 31, 2006, the Company had 6,790,802, 131,096, 647,379, 1,792,351 and 17,000 warrants outstanding for the purchase of the Company’s Series E, C, B-2, B and A preferred stock at a price per share of $0.2806, $0.7628, $0.56, $0.56 and $5.319. The warrants were net exercised or converted to common stock at the closing of the IPO, as described in Note 7. All warrant holders had the option to convert the warrants into a number of shares determined by dividing (a) the aggregate fair market value of the shares issuable upon exercise of the warrant less the aggregate warrant price of such shares by (b) the fair value of one share. In addition, certain warrants contained an automatic exercise provision whereby the warrants were deemed automatically exercised immediately before the expiration or termination of the warrant if the fair value of one share of either (a) the preferred stock subject to the warrant or (b) the Company’s common stock issuable upon conversion, was greater than the warrant price.
During 2007 the Company issued warrants to purchase 1,710,620 shares of Series E preferred stock in conjunction with procurement of long-term debt. Upon the closing of the Company’s IPO, the Series E preferred stock warrants were converted into 131,606 common stock warrants, as described in Note 7. The warrants have an exercise price $3.6478 per share, and expire November 21, 2010. The estimated fair value of $596,151 was recorded as a reduction on the amount of the loan at the time the warrants were granted. Upon the closing of the IPO, the loan was repaid and the discount was charged to interest expense. During 2008 the warrants were exercised in full on a “net exercise” basis, resulting in the issuance of 112,423 shares of common stock.
During 2006, the Company issued warrants to purchase 571,988 shares of its Series E preferred stock in conjunction with a loan guarantee and an executive search. Upon the closing of the Company’s IPO, the Series E preferred stock warrants were converted into 43,997 common stock warrants as described in Note 7 The warrants have an exercise price of $3.6478, are immediately exercisable, and expire 10 years from the date of issuance. The fair value of the warrants of $81,230 and $31,648 was recorded as interest and recruiting expense. During 2009, 7,281 of these warrants were exercised on a “net exercise” basis, resulting in the issuance of 5,794 shares of common stock. During 2008, 12,336 of these warrants were exercised on a “net exercise” basis, resulting in the issuance of 10,736 shares of common stock.
During 2005, the Company issued warrants to purchase 3,920,169 shares of its Series E preferred stock in conjunction with the issuance of $5,500,000 of convertible promissory notes issued by the Company to investors from August 2005 through October 2005. Upon the closing of the Company’s IPO, the Series E preferred stock warrants were converted into 301,541 common stock warrants, as described in Note 7. The warrants have an exercise price of $3.6478, are immediately exercisable, and expire 10 years from the date of issuance. The fair value of the warrants of $773,621 and the value of the beneficial conversion feature contained in the notes of $678,000 were recorded as a debt discount at the time the warrants were granted. During 2009, 47,863 of these warrants were exercised on a “net exercise” basis, resulting in the issuance of 38,091 shares of common stock. During 2008, 10,232 of these warrants were exercised on a “net exercise” basis, resulting in the issuance of 8,908 shares of common stock.
F-28
Table of Contents
Rubicon Technology, Inc.
Notes to Consolidated Financial Statements—(Continued)
During 2005, the Company issued warrants to purchase 2,298,645 shares of its Series E preferred stock in conjunction with the restructuring of loans. Upon the closing of the Company’s IPO, the Series E preferred stock warrants were converted into 176,818 common stock warrants, as described in Note 7. The warrants have an exercise price of $3.6478, are immediately exercisable, and expire 10 years from the date of issuance. The fair value of the warrants, $454,575, was recorded as a reduction in the amount of the loan at the time the warrants were granted. Interest expense in the amount of $172,810 was recorded in 2007 to reflect accretion of the loan. During 2008 the warrants were exercised in full on a “net exercise” basis, resulting in the issuance of 116,497 shares of common stock.
During 2005, the Company issued warrants to purchase 131,096 shares of its Series C preferred stock in conjunction with the procurement of loans. The fair value of the warrants, approximately $5,565, was recorded as a reduction in the amount of the loan at the time the warrants were granted. The warrants were exercised in full in connection with the IPO on a “net exercise” basis, resulting in the issuance of 3,128 shares of common stock.
During 2003, the Company issued warrants to purchase a total of 2,238,837 shares of its Series B preferred stock in conjunction with the procurement of loans. The fair value of the warrants, approximately $47,000, was recorded as a debt discount at the time the warrants were granted. In 2005, in connection with the Company’s Series E preferred stock financing, holders of 647,379 of the warrants to purchase Series B preferred stock converted their warrants to warrants to purchase shares of Series B-2 preferred stock. Upon the closing of the IPO, 1,217,152 of Series B preferred stock warrants were exercised in full on a “net exercise” basis, which resulted in the issuance of 44,940 shares of common stock and 374,306 of the Series B preferred stock warrants were converted into 28,791 common stock warrants. During 2008, all of these warrants were exercised on a “net exercise” basis, resulting in the issuance of 21,985 shares of common stock. Upon the closing of the IPO, the Series B-2 preferred stock warrants were converted into 99,377 common stock warrants. During 2008, 25,699 of these warrants were exercised on a “net exercise” basis, resulting in the issuance of 22,373 shares of common stock and the remaining 73,678 of these warrants expired.
During 2002, the Company issued warrants to purchase 200,893 shares of its Series B preferred stock in conjunction with the procurement of loans. Upon the closing of the IPO, these Series B preferred stock warrants were converted into 15,452 common stock warrants. Subsequent to the IPO, 1,717 of these common stock warrants were converted into 1,074 shares of common stock on a “net exercise” basis. The warrants have an exercise price of $7.28, are immediately exercisable, and expire on November 21, 2012. The fair value of the warrants, approximately $78,000, was recorded as a reduction in the amount of the loan at the time the warrants were granted. The loans were repaid during 2003 and approximately $56,000 of unamortized warrants was recorded as interest expense.
During 2001, the Company issued warrants to purchase 894,367 shares of its Series A preferred stock in conjunction with the procurement of loans. During 2002, the Company canceled 867,966 of the warrants for no value and 9,401 warrants expired in 2006. Upon the closing of the IPO, the remaining 17,000 Series A preferred stock warrants were converted into 9,410 common stock warrants. Subsequent to the IPO, these common stock warrants were converted into 4,761 shares of common stock on a “net exercise” basis.
The fair value of warrants issued in 2006 and 2005 were estimated on the date of grant using the Black-Scholes option-pricing model with the following assumptions: risk-free interest rate of 4.39%, zero dividend yield, expected lives through the expiration dates, and volatility of 84%. The fair value of warrants issued from 2001 to 2003 was estimated on the date of grant using the Black-Scholes option pricing model with the following assumptions: risk-free interest rate of 2.8%, no dividend yield, expected lives through the expiration dates, and volatility of 65%.
F-29
Table of Contents
Rubicon Technology, Inc.
Notes to Consolidated Financial Statements—(Continued)
Treasury Stock
In November 2008, the Company authorized a stock repurchase program to purchase up to $15 million of common stock over a period of two years. The stock repurchase program authorizes the Company to repurchase shares of its common stock in the open market at times and prices considered appropriate by the Company depending upon prevailing market conditions and other corporate considerations. The treasury shares are accounted for using the cost method whereby the entire cost of the acquired stock is recorded as treasury stock. During 2009, the Company repurchased 519,242 shares at an average price of $4.96 for $2.6 million. During 2008, the Company repurchased 730,733 shares at an average price of $4.22 for $3.1 million.
9. STOCK INCENTIVE PLANS
The Company sponsors a stock option plan, the 2001 Equity Plan (the “2001 Plan”), which allows for the grant of incentive and nonqualified stock options for the purchase of common stock. Each option entitles the holder to purchase one share of common stock at the specified option exercise price. The exercise price of each incentive stock option granted must not be less than the fair market value on the grant date. At the discretion of management and with the approval of the Board of Directors, the Company may grant options under the 2001 Plan. Management and the Board of Directors determine vesting periods and expiration dates at the time of the grant.
In August 2007, the Company adopted the 2007 Stock Incentive Plan (the “2007 Plan”), which allows for the grant of incentive stock options, non-statutory stock options, stock appreciation rights, restricted stock, restricted stock units, performance awards and bonus shares. The maximum number of shares which may be awarded or sold under the 2007 Plan is 2,307,692 shares. The Board of Directors appoints a committee to administer the plan. The plan committee determines the type of award to be granted, the fair market value, the number of shares covered by the award, and the time when the award vests and may be exercised.
The following table summarizes the activity of the stock incentive and equity plans:
| Shares available for grant |
Number of options outstanding |
Weighted- average option exercise price |
Number of restricted stock and board shares issued | ||||||||
| Outstanding at December 31, 2006 |
353,999 | 1,096,225 | $ | 1.41 | |||||||
| Authorized |
2,307,692 | — | |||||||||
| Granted |
(783,409 | ) | 769,125 | 11.40 | 14,284 | ||||||
| Exercised |
— | (12,453 | ) | 1.66 | |||||||
| Canceled/forfeited |
142,403 | (142,403 | ) | 1.80 | |||||||
| Outstanding at December 31, 2007 |
2,020,685 | 1,710,494 | 5.87 | 14,284 | |||||||
| Granted |
(46,269 | ) | 34,050 | 23.30 | 12,219 | ||||||
| Exercised |
— | (485,943 | ) | 1.24 | |||||||
| Canceled/forfeited |
97,754 | (97,754 | ) | 9.69 | |||||||
| Outstanding at December 31, 2008 |
2,072,170 | 1,160,847 | 8.00 | 26,503 | |||||||
| Granted |
(1,274,827 | ) | 1,266,467 | 9.71 | 8,360 | ||||||
| Exercised |
— | (150,621 | ) | 2.79 | |||||||
| Canceled/forfeited |
76,926 | (82,407 | ) | 4.34 | |||||||
| Outstanding at December 31, 2009 |
874,269 | 2,194,286 | $ | 9.48 | 34,863 | ||||||
F-30
Table of Contents
Rubicon Technology, Inc.
Notes to Consolidated Financial Statements—(Continued)
The following table sets forth option grants made during 2009 with intrinsic value calculated based on grant date fair value.
| Date of Grant |
Number of options granted |
Exercise price |
Intrinsic value per share | ||||
| February 2009 |
759,967 | $ | 4.01 | — | |||
| April - May 2009 |
18,500 | 7.75 -8.06 | — | ||||
| July - September 2009 |
27,000 | 10.02 - 12.16 | — | ||||
| October 2009 |
11,000 | 14.57 - 16.93 | — | ||||
| December 2009 |
450,000 | 19.21 | — | ||||
At December 31, 2009, the exercise prices of outstanding options was as follows:
| Exercise Price |
Number of options outstanding |
Average remaining contractual life (years) |
Number of options exercisable | |||
| $ 0.78 - 0.91 |
209,172 | 6.49 | 166,336 | |||
| 1.56 - 4.94 |
743,617 | 7.28 | 72,450 | |||
| 7.75 - 7.99 |
13,500 | 9.32 | — | |||
| 8.06 - 8.45 |
436,022 | 7.48 | 280,175 | |||
| 10.02 - 12.16 |
27,000 | 9.62 | — | |||
| 14.00 - 14.57 |
215,192 | 8.25 | 130,769 | |||
| 16.93 - 18.50 |
86,133 | 8.17 | 40,504 | |||
| 19.21 - 21.97 |
461,950 | 8.78 | 2,987 | |||
| 27.99 - 29.43 |
1,700 | 8.18 | 425 | |||
| 2,194,286 | 8.12 | 693,646 | ||||
An analysis of restricted stock issued is as follows:
| Non-vested restricted stock as of December 31, 2007 |
14,284 | ||
| Granted |
5,537 | ||
| Vested |
(5,170 | ) | |
| Non-vested restricted stock as of December 31, 2008 |
14,651 | ||
| Vested |
(6,198 | ) | |
| Non-vested restricted stock as of December 31, 2009 |
8,453 | ||
The Company’s aggregate intrinsic value is calculated as the difference between the exercise price of the underlying stock options and the fair value of the Company’s common stock. Based on the fair market value of the common stock at December 31, 2009, the intrinsic value for the options outstanding was $23,767,706 and the intrinsic value for the options exercisable was $8,625,028. At December 31, 2008, there was no aggregate intrinsic value of all stock options outstanding. The Company uses the Black-Scholes option pricing model to value stock options. The Company uses historical stock prices of companies which it considers as a peer group as the basis for its volatility assumptions. The assumed risk-free rates were based on US Treasury rates in effect at the time of grant with a term consistent with the expected option lives. The expected term is based upon the vesting term of the Company’s options, a review of a peer group of companies, and expected exercise behavior. The forfeiture rate is based on past history of forfeited options. The expense is being allocated using the straight-
F-31
Table of Contents
Rubicon Technology, Inc.
Notes to Consolidated Financial Statements—(Continued)
line method. For the years ended December 31, 2009, 2008 and 2007, the Company recorded $823,685 $590,541 and $742,253 of stock option compensation expense. As of December 31, 2009, the Company has $4,813,476 of total unrecognized compensation cost related to nonvested awards granted under the Company’s stock-based plans that it expects to recognize over a weighted-average period of 3.25 years.
The Company continues to account for options issued prior to January 1, 2006 under the intrinsic value method.
The weighted average fair value per share of options granted for the fiscal year ended December 31, 2009 was $9.71 and the fair value of each option grant was estimated at the date of grant using the Black-Scholes option-pricing model using an expected term of 5.2 years, risk-free interest rate of 0.37%—1.41%, expected volatility of 50% and no dividend yield. The Company used an expected forfeiture rate of 30% in 2009.
For the years ended December 31, 2009, 2008 and 2007, the Company recorded $113,997 $108,077 and $11,110 of stock compensation expense related to restricted stock.
In 2009, the Board of Directors awarded stock options to purchase 300,000 shares of common stock to key executives at an exercise price of $19.21, the closing price of the shares on the date of the grant. Vesting of the options is subject to achievement of specified annual revenue and net earnings targets by December 31, 2012. The Company is recording stock compensation expense related to these options based on the probability of achieving the targets. At December 31, 2009, the Company considered the first milestone of these targets to be probable, and recorded expense accordingly.
10. INCOME TAXES
Components of the income tax provision are as follows:
| Year ended December 31, | |||||||||
| 2009 | 2008 | 2007 | |||||||
| Current |
$ | — | $ | 4,141 | $ | 74,902 | |||
| Deferred |
— | — | — | ||||||
| Total |
$ | — | $ | 4,141 | $ | 74,902 | |||
| Year ended December 31, | |||||||||
| 2009 | 2008 | 2007 | |||||||
| US |
$ | — | $ | 4,141 | $ | 74,902 | |||
| Foreign |
— | — | — | ||||||
| Total |
$ | — | $ | 4,141 | $ | 74,902 | |||
F-32
Table of Contents
Rubicon Technology, Inc.
Notes to Consolidated Financial Statements—(Continued)
The reconciliation of income tax computed at the federal statutory rate to loss before taxes is as follows:
| Year ended December 31, | |||||||||
| 2009 | 2008 | 2007 | |||||||
| U.S. Federal statutory rate |
(34.0 | )% | 34.00 | % | (34.00 | )% | |||
| State taxes |
(4.78 | )% | 4.54 | % | (4.82 | )% | |||
| Change in valuation of convertible preferred stock warrants |
— | — | 84.08 | % | |||||
| Stock option expense |
— | — | 10.24 | % | |||||
| Permanent differences |
.07 | % | .26 | % | .34 | % | |||
| Prior year true-up |
— | (6.83 | )% | — | |||||
| Other |
(.75 | )% | — | — | |||||
| Valuation allowance |
39.46 | % | (31.88 | )% | (53.14 | )% | |||
| — | % | 0.09 | % | 2.70 | % | ||||
Deferred income taxes reflect the net tax effects of the temporary differences between the carrying amount of assets and liabilities for financial reporting purposes and the amounts used for income tax purposes.
Significant components of the Company’s net deferred income taxes are as follows at December 31:
| 2009 | 2008 | |||||||
| Deferred tax assets: |
||||||||
| Allowance for doubtful accounts |
$ | 22,954 | $ | 244,175 | ||||
| Inventory reserves |
675,087 | 308,460 | ||||||
| Accrued liabilities |
143,333 | 114,455 | ||||||
| Warrant interest expense |
250,830 | 321,641 | ||||||
| Charitable contributions |
7,782 | 4,114 | ||||||
| Stock compensation expense |
747,463 | 565,071 | ||||||
| Net operating loss carryforward |
16,586,156 | 12,128,320 | ||||||
| Tax credits |
139,587 | 79,043 | ||||||
| Total deferred tax assets |
18,573,193 | 13,765,279 | ||||||
| Less valuation allowance |
(15,261,292 | ) | (11,460,903 | ) | ||||
| Net deferred tax assets |
3,311,901 | 2,304,376 | ||||||
| Deferred tax liability: |
||||||||
| Depreciation |
(3,144,766 | ) | (2,085,765 | ) | ||||
| Restricted stock compensation expense |
(42,237 | ) | (86,489 | ) | ||||
| Prepaid expenses |
(124,898 | ) | (132,122 | ) | ||||
| Net deferred taxes |
$ | — | $ | — | ||||
A valuation allowance to reduce the deferred tax assets is reported if, based on the weight of the evidence, it is more likely than not that some portion or all of the deferred tax assets will not be realized. Management has determined that a $15,261,292 and $11,460,903 valuation allowance at December 31, 2009 and 2008 is necessary to reduce the tax assets to the amount that is more likely than not to be realized. The change in valuation allowance for the current year is $3,800,389. At December 31, 2009, the Company had separate federal and Illinois net operating loss carryforwards of $55,561,185 which begin to expire in 2021 and 2013, respectively.
F-33
Table of Contents
Rubicon Technology, Inc.
Notes to Consolidated Financial Statements—(Continued)
The Company does not believe that the utilization of net operating losses are subject to limits based upon certain ownership changes however, the Company will be updating its analysis in 2010 and the results of that analysis may indicate an ownership change. If an ownership change is determined, the utilization of the net operating losses and the tax credits, may be limited. As of December 31, 2009, no tax benefit has been recognized for these loss carryforwards. Additionally, the Company has not recorded a deferred tax asset for net operating losses (“NOL”) attributable to stock option exercises in the amount of $12,833,183 because the Company cannot record these excess tax benefit stock option deductions until the benefit has been realized by actually reducing taxes payable.
The Company prescribes a recognition threshold and measurement attribute for the financial statement recognition and measurement of a tax position taken, or expected to be taken, in a tax return. There were no significant matters determined to be unrecognized tax benefits taken or expected to be taken in a tax return that have been recorded on the Company’s financial statements for the year ended December 31, 2009.
There were no interest or penalties related to income taxes that have been accrued or recognized as of and for the years ended December 31, 2009, 2008 and 2007.
The Company files income tax returns in the United States federal jurisdiction and in a state jurisdiction. During 2009, the Company began foreign operations in Malaysia and Japan and is subject to local income taxes in both jurisdictions. The Company is exempt from Malaysian income tax for a ten year period beginning in 2009. The Company’s federal tax return for the periods ended December 31, 2008 and 2007 are currently under audit by the IRS. The Company does not expect the result to have a material impact on the financial statements or result of operation of the Company. The Company is not currently subject to any state tax examinations.
11. COMMITMENTS AND CONTINGENCIES
Operating Leases
The Company leases buildings used for manufacturing and offices. The leases provide for payment of the Company’s proportionate share of operating expenses and real estate taxes.
Net rent expense under operating leases in 2009, 2008 and 2007 amounted to $1,320,417, $1,270,662 and $1,191,269, respectively.
Future minimum payments under all leases are as follows:
| Year ending December 31, |
Operating leases | ||
| 2010 |
$ | 1,224,548 | |
| 2011 |
1,113,586 | ||
| 2012 |
1,133,318 | ||
| 2013 |
1,153,589 | ||
| 2014 |
926,041 | ||
| 2015 and thereafter |
224,277 | ||
Purchase Commitments
The Company has entered into agreements to purchase equipment or components to construct furnaces. These agreements will result in the Company purchasing equipment or components for a total cost of approximately $1.0 million with deliveries occurring through April 2010.
F-34
Table of Contents
Rubicon Technology, Inc.
Notes to Consolidated Financial Statements—(Continued)
In September 2009, the Company entered into a contract of RM$450,000 (approximately US $132,000) with a consulting firm to provide project management services for the construction of a manufacturing facility in Penang Malaysia. Payments are to be made as certain construction milestones are met with a 20% hold back amount payable upon completion of the building. In October 2009, the Company entered into a contract to purchase a parcel of land in Penang Malaysia to be used for the construction of a manufacturing facility. The purchase price is RM $2,132,886 (approximately US $654,000) and is payable in two installments. The first installment for 20% of the purchase price was paid at contract signing and the remaining 80% is due upon the construction of a factory on the land or within twelve months from the date of the agreement, whichever is earlier. At December 31, 2009, the Company has accrued $499,000 for the remaining amount due under this agreement. In November 2009, the Company entered into a contract of RM$17,702,465 (approximately US $5.2 million) with a builder for purposes of constructing a manufacturing facility. Payments are to be made as certain construction milestones are met and upon approval of the project manager. Construction has commenced and is expected to be completed by the end of 2010.
Litigation
From time to time, the Company experiences routine litigation in the normal course of its business. The management of the Company does not believe any pending litigation will have a material adverse effect on the financial condition or results of operations of the Company.
12. BENEFIT PLAN
The Company sponsors a 401(k) savings plan (the “Plan”). Employees are eligible to participate in the Plan upon reaching 21 years of age. Employees make contributions to the Plan through payroll deferrals and employer matching contributions are discretionary. There were no employer matching contributions for the years ended December 31, 2009, 2008 and 2007.
13. SUBSEQUENT EVENTS
On February 16, 2010, the Company entered into an agreement to purchase a 134,400 square foot building in Batavia, Illinois to be used for the expansion of crystal growth and fabrication operations. The purchase price is $7,000,000. There is a 40 day due diligence period from signing and closing is 15 days after that. A payment of $250,000 was made at signing and the remainder is due at closing.
F-35
Table of Contents
Rubicon Technology, Inc.
Notes to Consolidated Financial Statements—(Continued)
14. QUARTERLY FINANCIAL DATA (Unaudited)
Quarterly Financial Data (Unaudited)
Summary quarterly results for the two years ended December 31, 2009 are as follows (in thousands, other than share and per share data):
| Three Months Ended | ||||||||||||||||||||
| 2009 |
March 31 | June 30 | September 30 | December 31 | Full Year | |||||||||||||||
| Revenue |
$ | 2,338 | $ | 3,205 | $ | 5,737 | $ | 8,528 | $ | 19,808 | ||||||||||
| Gross profit (loss) |
$ | (2,608 | ) | $ | (1,662 | ) | $ | (406 | ) | $ | 1,057 | $ | (3,619 | ) | ||||||
| Income (loss) from operations |
$ | (4,138 | ) | $ | (3,131 | ) | $ | (2,196 | ) | $ | (903 | ) | $ | (10,368 | ) | |||||
| Income (loss) before income taxes |
$ | (3,868 | ) | $ | (2,945 | ) | $ | (2,062 | ) | $ | (755 | ) | $ | (9,630 | ) | |||||
| Net income (loss) |
$ | (3,868 | ) | $ | (2,945 | ) | $ | (2,062 | ) | $ | (755 | ) | $ | (9,630 | ) | |||||
| Basic loss per common share |
$ | (0.19 | ) | $ | (0.15 | ) | $ | (0.10 | ) | $ | (0.04 | ) | $ | (0.48 | ) | |||||
| Diluted loss per common share |
$ | (0.19 | ) | $ | (0.15 | ) | $ | (0.10 | ) | $ | (0.04 | ) | $ | (0.48 | ) | |||||
| Weighted average common shares outstanding used in computing net loss per common share: |
||||||||||||||||||||
| Basic |
20,280,160 | 20,026,270 | 20,032,470 | 20,131,271 | 20,117,543 | |||||||||||||||
| Diluted |
20,280,160 | 20,026,270 | 20,032,470 | 20,131,271 | 20,117,543 | |||||||||||||||
| 2008 |
March 31 | June 30 | September 30 | December 31 | Full Year | |||||||||||||||
| Revenue |
$ | 10,508 | $ | 11,530 | $ | 11,758 | $ | 4,042 | $ | 37,838 | ||||||||||
| Gross profit (loss) |
$ | 3,864 | $ | 4,337 | $ | 4,244 | $ | (353 | ) | $ | 12,092 | |||||||||
| Income (loss) from operations |
$ | 1,477 | $ | 1,798 | $ | 1,276 | $ | (2,195 | ) | $ | 2,356 | |||||||||
| Income (loss) before income taxes |
$ | 2,335 | $ | 2.239 | $ | 1,668 | $ | (1,883 | ) | $ | 4,359 | |||||||||
| Net income (loss) |
$ | 2,272 | $ | 2,178 | $ | 1,619 | $ | (1,714 | ) | $ | 4,355 | |||||||||
| Basic income (loss) per common share |
$ | 0.11 | $ | 0.10 | $ | 0.08 | $ | (0.08 | ) | $ | 0.21 | |||||||||
| Diluted income (loss) per common share |
$ | 0.10 | $ | 0.10 | $ | 0.07 | $ | (0.08 | ) | $ | 0.19 | |||||||||
| Weighted average common shares outstanding used in computing net income (loss) per common share: |
||||||||||||||||||||
| Basic |
20,551,642 | 20,899,421 | 21,222,321 | 20,894,777 | 20,892,040 | |||||||||||||||
| Diluted |
22,366,654 | 22,337,443 | 22,084,570 | 20,894,777 | 21,920,861 | |||||||||||||||
F-36