Attached files
| file | filename |
|---|---|
| EX-31.1 - EXHIBIT 31.1 - ProShares Trust II | dex311.htm |
| EX-32.2 - EXHIBIT 32.2 - ProShares Trust II | dex322.htm |
| EX-23.1 - EXHIBIT 23.1 - ProShares Trust II | dex231.htm |
| EX-32.1 - EXHIBIT 32.1 - ProShares Trust II | dex321.htm |
| EX-31.2 - EXHIBIT 31.2 - ProShares Trust II | dex312.htm |
Table of Contents
UNITED STATES
SECURITIES AND EXCHANGE COMMISSION
Washington, D.C. 20549
FORM 10-K
| x | Annual report pursuant to Section 13 or 15(d) of the Securities Exchange Act of 1934 for the fiscal year ended December 31, 2009. |
or
| ¨ | Transition report pursuant to Section 13 or 15(d) of the Securities Exchange Act of 1934 for the transition period from to . |
Commission file number: 001-34200
PROSHARES TRUST II
(Exact name of registrant as specified in its charter)
| Delaware | 87-6284802 | |
| (State or other jurisdiction of incorporation or organization) |
(I.R.S. Employer Identification No.) |
c/o ProShare Capital Management LLC
7501 Wisconsin Avenue, Suite 1000
Bethesda, Maryland 20814
(Address of principal executive offices) (Zip Code)
(240) 497-6400
(Registrant’s telephone number, including area code)
Securities registered pursuant to Section 12(b) of the Act:
| Common Units of Beneficial Interest |
NYSE Arca, Inc. | |
| (Title of each class) | (Name of exchange on which registered) |
Securities registered pursuant to Section 12(g) of the Act: None
Indicate by check mark if the registrant is a well-known seasoned issuer, as defined in Rule 405 of the Securities Act. x Yes ¨ No
Indicate by check mark if the registrant is not required to file reports pursuant to Section 13 or Section 15(d) of the Act. ¨ Yes x No
Indicate by check mark whether the registrant (1) has filed all reports required to be filed by Section 13 or 15(d) of the Securities Exchange Act of 1934 during the preceding 12 months (or for such shorter period that the registrant was required to file such reports), and (2) has been subject to such filing requirements for the past 90 days. x Yes ¨ No
Indicate by check mark whether the registrant has submitted electronically and posted on its corporate Website, if any, every Interactive Data File required to be submitted and posted pursuant to Rule 405 of Regulation S-T (§232.405 of this chapter) during the preceding 12 months (or for such shorter period that the registrant was required to submit and post such files). ¨ Yes ¨ No
Table of Contents
Indicate by check mark if disclosure of delinquent filers pursuant to Item 405 of Regulation S-K (§229.405 of this Chapter) is not contained herein, and will not be contained, to the best of registrant’s knowledge, in definitive proxy or information statements incorporated by reference in Part III of this Form 10-K or any amendment to this Form 10-K. x
Indicate by check mark whether the registrant is a large accelerated filer, an accelerated filer, a non-accelerated filer or a smaller reporting company. See the definitions of “large accelerated filer,” “accelerated filer” and “smaller reporting company” in Rule 12b-2 of the Exchange Act.
| Large accelerated filer x | Accelerated filer ¨ | |
| Non-accelerated filer ¨ | Smaller reporting company ¨ | |
| (Do not check if a smaller reporting company) |
Indicate by check mark whether the registrant is a shell company (as defined in Rule 12b-2 of the Exchange Act.). ¨ Yes x No
The aggregate market value of the ProShares Ultra DJ-UBS Commodity Fund’s units held by non-affiliates as of June 30, 2009 was $30,942,000. The ProShares Ultra DJ-UBS Commodity Fund had 450,000 outstanding units as of February 19, 2010.
The aggregate market value of the ProShares UltraShort DJ-UBS Commodity Fund’s units held by non-affiliates as of June 30, 2009 was $5,237,000. The ProShares UltraShort DJ-UBS Commodity Fund had 250,000 outstanding units as of February 19, 2010.
The aggregate market value of the ProShares Ultra DJ-UBS Crude Oil Fund’s units held by non-affiliates as of June 30, 2009 was $211,218,000. The ProShares Ultra DJ-UBS Crude Oil Fund had 23,550,000 outstanding units as of February 19, 2010.
The aggregate market value of the ProShares UltraShort DJ-UBS Crude Oil Fund’s units held by non-affiliates as of June 30, 2009 was $127,678,320. The ProShares UltraShort DJ-UBS Crude Oil Fund had 4,899,900 outstanding units as of February 19, 2010.
The aggregate market value of the ProShares Ultra Gold Fund’s units held by non-affiliates as of June 30, 2009 was $154,752,000. The ProShares Ultra Gold Fund had 3,400,000 outstanding units as of February 19, 2010.
The aggregate market value of the ProShares UltraShort Gold Fund’s units held by non-affiliates as of June 30, 2009 was $51,884,000. The ProShares UltraShort Gold Fund had 6,750,000 outstanding units as of February 19, 2010.
The aggregate market value of the ProShares Ultra Silver Fund’s units held by non-affiliates as of June 30, 2009 was $74,906,500. The ProShares Ultra Silver Fund had 3,200,000 outstanding units as of February 19, 2010.
The aggregate market value of the ProShares UltraShort Silver Fund’s units held by non-affiliates as of June 30, 2009 was $72,462,500. The ProShares UltraShort Silver Fund had 16,100,000 outstanding units as of February 19, 2010.
The aggregate market value of the ProShares Ultra Euro Fund’s units held by non-affiliates as of June 30, 2009 was $7,302,500. The ProShares Ultra Euro Fund had 350,000 outstanding units as of February 19, 2010.
The aggregate market value of the ProShares UltraShort Euro Fund’s units held by non-affiliates as of June 30, 2009 was $39,660,000. The ProShares UltraShort Euro Fund had 10,950,000 outstanding units as of February 19, 2010.
The aggregate market value of the ProShares Ultra Yen Fund’s units held by non-affiliates as of June 30, 2009 was $4,940,000. The ProShares Ultra Yen Fund had 150,000 outstanding units as of February 19, 2010.
The aggregate market value of the ProShares UltraShort Yen Fund’s units held by non-affiliates as of June 30, 2009 was $41,055,000. The ProShares UltraShort Yen Fund had 5,250,000 outstanding units as of February 19, 2010.
DOCUMENTS INCORPORATED BY REFERENCE:
None.
THE FINANCIAL STATEMENT SCHEDULES CONTAINED IN PART IV OF THIS ANNUAL REPORT ON FORM 10-K CONSTITUTE THE ANNUAL REPORT WITH RESPECT TO THE COMMODITY POOLS FOR PURPOSES OF COMMODITY FUTURES TRADING COMMISSION RULE 4.22(C)
Table of Contents
PROSHARES TRUST II
| Page | ||||
| Item 1. |
1 | |||
| Item 1A. |
20 | |||
| Item 1B. |
38 | |||
| Item 2. |
38 | |||
| Item 3. |
38 | |||
| Item 4. |
38 | |||
| Item 5. |
39 | |||
| Item 6. |
44 | |||
| Item 7. |
Management’s Discussion and Analysis of Financial Condition and Results of Operations. |
47 | ||
| Item 7A. |
63 | |||
| Item 8. |
79 | |||
| Item 9. |
Changes in and Disagreements With Accountants on Accounting and Financial Disclosure. |
85 | ||
| Item 9A. |
85 | |||
| Item 9B. |
86 | |||
| Item 10. |
87 | |||
| Item 11. |
90 | |||
| Item 12. |
Security Ownership of Certain Beneficial Owners and Management and Related Stockholder Matters. |
90 | ||
| Item 13. |
Certain Relationships and Related Transactions, and Director Independence. |
90 | ||
| Item 14. |
90 | |||
| Item 15. |
92 | |||
| 92 | ||||
Table of Contents
| Item 1. | Business. |
Summary
ProShares Trust II (the “Trust”) was organized as a Delaware statutory trust on October 9, 2007 and is currently organized into separate series. The following twelve series of the Trust, ProShares Ultra DJ-UBS Commodity (formerly ProShares Ultra DJ-AIG Commodity), ProShares UltraShort DJ-UBS Commodity (formerly ProShares UltraShort DJ-AIG Commodity), ProShares Ultra DJ-UBS Crude Oil (formerly ProShares Ultra DJ-AIG Crude Oil), ProShares UltraShort DJ-UBS Crude Oil (formerly ProShares UltraShort DJ-AIG Crude Oil), ProShares Ultra Gold, ProShares UltraShort Gold, ProShares Ultra Silver, ProShares UltraShort Silver, ProShares Ultra Euro, ProShares UltraShort Euro, ProShares Ultra Yen and ProShares UltraShort Yen (each, a “Fund” and collectively, the “Funds”) issue common units of beneficial interest (“Shares”), which represent units of fractional undivided beneficial interest in and ownership of only that Fund. Each Fund’s Shares are offered separately on a continuous basis from time to time. The Shares of each Fund are listed on the New York Stock Exchange Archipelago (the “NYSE Arca”), as further described below.
ProShare Capital Management LLC serves as the Trust’s Sponsor (the “Sponsor”), commodity pool operator and commodity trading advisor. Wilmington Trust Company serves as the Trustee of the Trust. The Funds are commodity pools, as defined in the Commodity Exchange Act (the “CEA”) and the applicable regulations of the Commodity Futures Trading Commission (the “CFTC”) and are operated by the Sponsor, a commodity pool operator registered with the CFTC. The Trust is not an investment company registered under the Investment Company Act of 1940, as amended (the “1940 Act”).
Groups of Funds are collectively referred to in this Annual Report on Form 10-K in two different ways. References to “Ultra ProShares” or “UltraShort ProShares” refer to the different Funds based upon their investment objectives, but without distinguishing among the Funds’ benchmarks. References to “Commodity Index Funds”, “Commodity Funds” and “Currency Funds” refer to the different Funds according to their general benchmark categories without distinguishing among the Funds’ investment objectives or Fund-specific benchmarks.
As further described below, each “Ultra” Fund seeks daily investment results (before fees and expenses) that correspond to twice (200%) the daily performance of its corresponding benchmark. Each “UltraShort” Fund seeks daily investment results (before fees and expenses) that correspond to twice (200%) the inverse (opposite) of the daily performance of its corresponding benchmark. Each Fund generally invests in Financial Instruments (i.e., commodity-based or currency-based instruments whose value is derived from the value of an underlying asset, rate or index including futures contracts and options on futures contracts, swap agreements, forward contracts and other commodity-based or currency-based options contracts) as a substitute for investing directly in a commodity or currency in order to gain exposure to the commodity index, commodity or currency. Financial Instruments also are used to produce economically “leveraged” or “inverse” investment results for the Funds.
The Funds do not seek to achieve their stated investment objective over a period of time greater than one day because mathematical compounding prevents the Funds from achieving such results. Accordingly, results over periods of time greater than one day should not be expected to be a simple multiple (+200 or -200%) of the period return of the corresponding benchmark and will likely differ significantly.
Each Fund continuously offers and redeems its Shares in blocks of 50,000 Shares (“Creation Units”). Only Authorized Participants may purchase and redeem Shares from a Fund and then only in Creation Units. An Authorized Participant is an entity that has entered into an Authorized Participant Agreement with one or more of the Funds. Shares of the Funds are offered to Authorized Participants in Creation Units at each Fund’s respective net asset value per Share (“NAV”). Authorized Participants may then offer to the public, from time to time, Shares from any Creation Unit they create at a per-Share market price that varies depending on, among other
1
Table of Contents
factors, the trading price of the Shares of each Fund on the NYSE Arca, the NAV and the supply of and demand for the Shares at the time of the offer. Shares from the same Creation Unit may be offered at different times and may have different offering prices based upon the above factors. The form of Authorized Participant Agreement and related Authorized Participant Handbook set forth the terms and conditions under which an Authorized Participant may purchase or redeem a Creation Unit. Authorized Participants do not receive from any Fund, the Sponsor, or any of their affiliates, any underwriting fees or compensation in connection with their sale of Shares to the public.
The Sponsor maintains an Internet website at www.proshares.com, through which monthly account statements and the Trust’s Annual Report on Form 10-K, Quarterly Reports on Form 10-Q, Current Reports on Form 8-K and amendments to those reports filed or furnished pursuant to Section 13(a) or 15(d) of the Securities Exchange Act of 1934, as amended (the “1934 Act”), can be accessed free of charge, as soon as reasonably practicable after such material is electronically filed with, or furnished to, the U.S. Securities and Exchange Commission (the “SEC”). Additional information regarding the Trust may also be found on the SEC’s EDGAR database at www.sec.gov.
Investment Objectives and Principal Investment Strategies
Investment Objectives
Investment Objectives of the “Ultra ProShares”
Each “Ultra” Fund seeks daily investment results (before fees and expenses) that correspond to twice (200%) the daily performance, whether positive or negative, of its corresponding benchmark. Expenses may include, among other things, costs related to the purchase, sale and storage of commodities or currencies and the cost of leverage, all of which may be embedded in Financial Instruments used by that Fund. If an Ultra Fund is successful in meeting its objective, its value on a given day (before fees and expenses) should gain approximately twice as much on a percentage basis as its corresponding benchmark when the benchmark rises on a given day. Conversely, its value on a given day (before fees and expenses) should lose approximately twice as much on a percentage basis as the corresponding benchmark when the benchmark declines on a given day. An Ultra Fund acquires long exposure in any one of or combinations of Financial Instruments, including Financial Instruments with respect to the applicable Ultra Fund’s benchmark such that each Ultra Fund has approximately 200% exposure to the corresponding benchmark at the time of the NAV calculation.
Investment Objectives of the “UltraShort ProShares”
Each “UltraShort” Fund seeks daily investment results (before fees and expenses) that correspond to twice (200%) the inverse (opposite) of the daily performance, whether positive or negative, of its corresponding benchmark. Expenses may include, among other things, expenses related to the purchase, sale and storage of commodities or currencies and the cost of leverage, all of which may be embedded in Financial Instruments used by that Fund. If an UltraShort Fund is successful in meeting its objective, its value on a given day (before fees and expenses) should gain approximately twice as much on a percentage basis as its corresponding benchmark when the benchmark falls on a given day. Conversely, its value on a given day (before fees and expenses) should lose approximately twice as much on a percentage basis as the corresponding benchmark when the benchmark rises on a given day. An UltraShort Fund acquires short exposure in any one of or combinations of Financial Instruments, including Financial Instruments with respect to the applicable UltraShort Fund’s benchmark such that each UltraShort Fund has approximately 200% exposure to the corresponding benchmark at the time of the NAV calculation.
The Funds do not seek to achieve their stated investment objective over a period of time greater than one day because mathematical compounding prevents the Funds from achieving such results. Results over periods of time greater than one day should not be expected to be a simple multiple (+200 or -200%) of the period return of the corresponding benchmark and will likely differ significantly from such.
2
Table of Contents
The corresponding benchmark for each Fund is listed below:
ProShares Ultra DJ-UBS Commodity and ProShares UltraShort DJ-UBS Commodity: The Dow Jones—UBS Commodity IndexSM. The Dow Jones—UBS Commodity Index is designed to track commodity futures prices.
ProShares Ultra DJ-UBS Crude Oil and ProShares UltraShort DJ-UBS Crude Oil: The Dow Jones—UBS Crude Oil Sub-IndexSM. The Dow Jones—UBS Crude Oil Sub-Index is designed to track crude oil futures prices.
ProShares Ultra Gold and ProShares UltraShort Gold: the daily performance of gold bullion as measured by the U.S. Dollar P.M. fixing price for delivery in London.
ProShares Ultra Silver and ProShares UltraShort Silver: the daily performance of silver bullion as measured by the U.S. Dollar fixing price for delivery in London.
ProShares Ultra Euro and ProShares UltraShort Euro: the 4:00 P.M. (Eastern Time) spot price of the Euro versus the U.S. Dollar using Euro exchange rate, expressed in terms of U.S. Dollars per unit of foreign currency.
ProShares Ultra Yen and ProShares UltraShort Yen: the 4:00 P.M. (Eastern Time) spot price of the Japanese yen versus the U.S. Dollar using the Japanese yen exchange rate, expressed in terms of U.S. Dollars per unit of foreign currency.
Principal Investment Strategies
In seeking to achieve each Fund’s investment objective, the Sponsor uses a mathematical approach to investing. Using this approach, the Sponsor determines the type, quantity and mix of investment positions that the Sponsor believes in combination should produce daily returns consistent with a Fund’s objective. The Sponsor relies upon a pre-determined model to generate orders that result in repositioning each Fund’s investments in accordance with their daily investment objectives. Each Fund invests principally in any one of or combinations of Financial Instruments, including swap agreements, futures contracts, options on futures contracts or forward contracts with respect to the applicable Fund’s benchmark to the extent determined appropriate by the Sponsor. Assets of each Fund not invested in Financial Instruments are invested in cash equivalents (such as U.S. Treasury and agency securities, shares of money market funds, bank deposits, bank money market accounts, certain variable rate-demand notes and repurchase agreements collateralized by government securities, whether denominated in U.S. or the applicable foreign currency with respect to a Currency Fund) that may serve as collateral for the Financial Instruments. The types of commodity interests in which each Fund invests may vary daily. The Sponsor does not currently intend to invest in any commodity.
The Sponsor does not invest the assets of the Funds in Financial Instruments or other assets based on its view of the investment merit of a particular investment, nor does it conduct conventional commodity or currency research or analysis, or forecast market movement or trends, in managing the assets of the Funds. Each Fund seeks to remain fully invested at all times in securities and/or Financial Instruments that provide exposure to the Fund’s underlying benchmark without regard to market conditions, trends or direction.
For the Commodity Index Funds, a Fund may hold through Financial Instruments a representative sample of the components in the underlying index, which has aggregate characteristics similar to those of the underlying index. This “sampling” process typically involves selecting a representative sample of components in an index principally to enhance liquidity and reduce transaction costs while seeking to maintain high correlation with, and similar aggregate characteristics (e.g., underlying commodities and valuations) to, the underlying index. In addition, a Fund may obtain exposure to components not included in the underlying index, invest in assets that are not included in the underlying index or may overweight or underweight certain components contained in the
3
Table of Contents
underlying index. For further discussion of the Financial Instruments, see “Information About Financial Instruments and Commodities Markets” below.
Information About Financial Instruments and Commodities Markets
Swap Agreements
Swap agreements are two-party contracts entered into primarily by institutional investors for a specified period ranging from a day to more than a year. In a standard swap transaction, the parties agree to exchange the returns on a particular predetermined investment, instrument or index in exchange for a fixed or floating rate of return (interest rate leg) in respect of a predetermined notional amount. In the case of futures contracts based indices, such as those used by the Commodity Index Funds, the reference interest rate is zero. The gross returns to be exchanged are calculated with respect to a notional amount and the benchmark returns to which the swap is linked. Swaps are usually entered into on a net basis, that is, the two payment streams are netted out in a cash settlement on the payment date or dates specified in the agreement with the parties receiving or paying, as the case may be, only the net amount of the two payments. In a typical swap agreement entered into by an Ultra Fund, absent fees, transaction costs and interest, the Ultra Fund would be entitled to settlement payments in the event the benchmark increases and would be required to make payments to the swap counterparty in the event the benchmark decreases. In a typical swap agreement entered into by an UltraShort Fund, absent fees, transaction costs and interest, the UltraShort Fund would be required to make payments to the swap counterparty in the event the benchmark increases and would be entitled to settlement payments in the event the benchmark decreases.
Swap agreements involve, to varying degrees, elements of market risk and exposure to loss in excess of the amount which would be reflected on the Statement of Financial Condition. The notional amounts of the agreement reflects the extent of each Ultra Fund’s total investment exposure under the swap agreement. An UltraShort Fund’s exposure is not limited by the notional amount and its exposure is in theory potentially infinite as there is no fixed limit on the increase in any index value. The primary risks associated with the use of swap agreements arise from the imperfect correlation between movements in the notional amount and the price of the underlying investments and the inability of counterparties to perform. Each Fund bears the risk of loss of the net amount, if any, expected to be received under a swap agreement in the event of the default or bankruptcy of a swap counterparty. Each Fund enters into swap agreements only with large, established and well capitalized financial institutions that meet certain credit quality standards and monitoring policies. Each Fund intends to use various techniques to minimize credit risk including early termination or reset and payment, using different counterparties and limiting the net amount due from any individual counterparty.
Each Fund generally collateralizes swap agreements with cash and/or certain securities. Such collateral is generally held for the benefit of the counterparty in a segregated tri-party account at the custodian to protect the counterparty against non-payment by the Fund. In the event of a default by the counterparty, and the Fund is owed money in the swap transaction, the Fund will seek withdrawal of this collateral from the segregated account and may incur certain costs exercising its right with respect to the collateral. Each Fund remains subject to credit risk with respect to the amount it expects to receive from counterparties, as those amounts are generally not similarly collateralized by the counterparty. If a counterparty becomes bankrupt or otherwise fails to perform its obligations due to financial difficulties, the Fund may experience significant delays in obtaining any recovery in a bankruptcy or other reorganization proceeding and may obtain only limited recovery or may obtain no recovery in such circumstances.
Forward Contracts
A forward contract is a contractual obligation to purchase or sell a specified quantity of a commodity or currency at or before a specified date in the future at a specified price and, therefore, is economically similar to a futures contract. Unlike futures contracts, however, forward contracts are typically traded in the OTC markets and are not standardized contracts. Forward contracts for a given commodity or currency are generally available
4
Table of Contents
for various amounts and maturities and are subject to individual negotiation between the parties involved. Moreover, there is generally no direct means of offsetting or closing out a forward contract by taking an offsetting position as one would a futures contract on a U.S. exchange. If a trader desires to close out a forward contract position, he generally will establish an opposite position in the contract but will settle and recognize the profit or loss on both positions simultaneously on the delivery date. Thus, unlike in the futures contract market where a trader who has offset positions will recognize profit or loss immediately, in the forward market a trader with a position that has been offset at a profit will generally not receive such profit until the delivery date, and likewise a trader with a position that has been offset at a loss will generally not have to pay money until the delivery date. In recent years, however, the terms of forward contracts have become more standardized, and in some instances such contracts now provide a right of offset or cash settlement as an alternative to making or taking delivery of the underlying commodity or currency.
The forward markets provide what has typically been a highly liquid market for foreign exchange trading, and in certain cases the prices quoted for foreign exchange forward contracts may be more favorable than the prices for foreign exchange futures contracts traded on U.S. exchanges. The forward markets are largely unregulated. Forward contracts are, in general, not cleared or guaranteed by a third party. Commercial banks participating in trading foreign exchange forward contracts often do not require margin deposits, but rely upon internal credit limitations and their judgments regarding the creditworthiness of their counterparties. In recent years, however, many OTC market participants in foreign exchange trading have begun to require that their counterparties post margin.
Options on Forward Contracts
An option on a forward contract gives the buyer of the option the right, but not the obligation, to take a position at a specified price (the strike price) in the underlying forward contract. Options on forward contracts are individually negotiated between counterparties and are generally traded in the OTC market. Thus, options on forward contracts possess many of the same characteristics of forward contracts relating to offsetting positions and credit risk that are described above.
The buyer of a call option purchases the right, but not the obligation, to purchase the underlying interest at a specified price. The buyer of a put option purchases the right, but not the obligation, to sell the underlying interest at a specified price. The seller of an option is obligated to take a position in the underlying interest opposite the buyer of the option if the option is exercised. Therefore, the seller of a call option must sell the underlying interest to the buyer of the call option if the buyer chooses to exercise the option. Conversely, the seller of a put option must buy the underlying interest from the buyer of the put option if the buyer chooses to exercise the option.
A call option is considered to be in-the-money if the strike price is below the current market price and out-of-the-money if the strike price is above the current market price. A put option, on the other hand, is considered to be in-the-money if the strike price is above the current market price and out-of-the-money if the strike price is below the current market price. Options typically have limited life spans, which are tied to the delivery or settlement date of the underlying interest. Unexercised options on forward contracts become worthless at the time of expiration.
Losses to the buyer of an option are limited to the amount paid for the option. Sellers of options, however, face risk similar to that of participants in forwards markets. For example, the seller of a call option is subject to the same risk as a person who initially sold a forward contract, offset only by the amount received by selling the option.
Futures Contracts
A futures contract is a standardized contract traded on, or subject to the rules of, an exchange that calls for the future delivery of a specified quantity and type of a commodity at a specified time and place. Futures
5
Table of Contents
contracts are traded on a wide variety of commodities, including bonds, interest rates, agricultural products, stock indices, currencies, energy and metals. The size and length of futures contracts on a particular commodity are identical and are not subject to any negotiation, other than with respect to price and the number of contracts traded between the buyer and seller.
The contractual obligations of a buyer and seller may generally be satisfied by taking or making physical delivery of the underlying commodity or by making an offsetting sale or purchase of an identical futures contract on the same or linked exchange before the designated date of delivery. The difference between the price at which the futures contract is purchased or sold and the price paid for the offsetting sale or purchase, after allowing for brokerage commissions, constitutes the profit or loss to the trader. Some futures contracts, such as stock index contracts, and certain commodity futures contracts, settle in cash (reflecting the difference between the contract purchase/sale price and the contract settlement price) rather than by delivery of the underlying commodity.
Options on Futures Contracts
Options on futures contracts operate in a manner similar to options on forward contracts. An option on a futures contract gives the buyer the right, but not the obligation, to take a position at a specified price in the underlying futures contract. Unlike options on forward contracts, however, options on futures contracts are standardized contracts traded on an exchange. Furthermore, in-the-money options on futures contracts on certain exchanges are automatically exercised on their expiration date.
Options on Currencies
Options on currencies grant the holder the right, but not the obligation, to buy or sell currency at a specified exchange rate during a specified period of time.
Regulations
Futures exchanges in the United States are subject to regulation under the CEA, by the CFTC, the governmental agency having responsibility for regulation of futures exchanges and trading on those exchanges. (Investors should be aware that no governmental U.S. agency regulates the OTC foreign exchange markets.)
The CFTC has exclusive authority to designate exchanges for the trading of specific futures contracts and options on futures contracts and to prescribe rules and regulations of the marketing of each. The CFTC also regulates the activities of “commodity trading advisors” and “commodity pool operators” and the CFTC has adopted regulations with respect to certain of such persons’ activities. Pursuant to its authority, the CFTC requires a commodity pool operator, such as the Sponsor, to keep accurate, current and orderly records with respect to each pool it operates. The CFTC may suspend, modify or terminate the registration of any registrant for failure to comply with CFTC rules or regulations. Suspension, restriction or termination of the Sponsor’s registration as a commodity pool operator would prevent it, until such time (if any) as such registration were to be reinstated, from managing, and might result in the termination of, the Funds. The CEA gives the CFTC similar authority with respect to the activities of commodity trading advisors, such as the Sponsor, and requires commodity trading advisors to maintain current and accurate records within the United States. If the registration of a Sponsor as a commodity trading advisor were to be terminated, restricted or suspended, the Sponsor would be unable, until such time (if any) as such registration were to be reinstated, to render trading advice to the Funds. The Funds themselves are not registered with the CFTC in any capacity. Therefore, if the Sponsor were unable to provide services and/or trading advice to the Funds, the Funds would be unable to pursue their investment objectives unless and until the Sponsor’s ability to provide services and trading advice to the Funds was reinstated or a replacement for the Sponsor as commodity pool operator and/or commodity trading advisor could be found. Such an event could result in termination of the Funds.
6
Table of Contents
The CEA requires all Futures Commission Merchants (“FCMs”) to meet and maintain specified fitness and financial requirements, segregate customer funds from proprietary funds and account separately for all customers’ funds and positions, and to maintain specified book and records open to inspection by the staff of the CFTC. See “Item 1A. Risk Factors—Risks Related to Regulatory Requirements and Potential Legislative Changes—Failure of FCMs to segregate assets may increase losses in the Funds.”
The CEA also gives the states certain powers to enforce its provisions and the regulations of the CFTC.
Under certain circumstances, the CEA grants shareholders the right to institute a reparations proceeding before the CFTC against the Sponsor (as a registered commodity pool operator and commodity trading advisor), the FCM, as well as those of their respective employees who are required to be registered under the CEA. Shareholders may also be able to maintain a private right of action for certain violations of the CEA.
Pursuant to authority in the CEA, the National Futures Association (the “NFA”) has been formed and registered with the CFTC as a registered futures association. At the present time, the NFA is the only self regulatory organization for commodities professionals other than exchanges. As such, the NFA promulgates rules governing the conduct of commodity professionals and disciplines those professionals that do not comply with such standards. The CFTC has delegated to the NFA responsibility for the registration of commodity trading advisors, commodity pool operators, FCMs, introducing brokers and their respective associated persons and floor brokers. The Sponsor is a member of the NFA (the Funds themselves are not required to become members of the NFA). As an NFA member, the Sponsor is subject to NFA standards relating to fair trade practices, financial condition, and consumer protection. The CFTC is prohibited by statute from regulating trading on foreign commodity exchanges and markets.
Recent Legislative Efforts
Restrictive proposals aimed at financial speculators in commodities have from time to time been made in the U.S. House of Representatives and the Senate. The aims of such proposals are generally stated to be to curb excessive speculation and increase transparency and accountability in the commodities markets, including the oil and gas markets. For example, previous proposals would prohibit private and public pension funds with more than $500 million in assets from investing in agricultural and energy commodities traded on a U.S. futures exchange, foreign exchange or OTC, would direct the CFTC to establish total limits on the share of the commodity market held by financial investors and/or would direct the CFTC to impose speculative-position limits on any stakes not related to real hedging activities. The various bills and proposals could result in establishment of speculative position limits for trading that does not involve physical delivery of a commodity, regulation of speculation via unregulated foreign exchanges, and enhanced recordkeeping and information collection requirements. If proposals such as these were to be enacted into law as previously proposed, it could negatively impact the ability of investors to invest in the Funds and, consequently, for the Sponsor to manage the Funds.
Description of the Dow Jones—UBS Commodity Index SM and Sub-Indexes
Overview of the Dow Jones—UBS Family of Indices
The Dow Jones—UBS Commodity IndexSM (the “Dow Jones—UBS”) is designed to be a highly liquid and diversified benchmark for the commodity futures market. The Dow Jones—UBS is composed of futures contracts on nineteen physical commodities. Unlike equities, which entitle the holder to a continuing stake in a corporation, commodity futures contracts specify a delivery date for the underlying physical commodity. In order to avoid delivery and maintain a long futures position, nearby contracts must be sold and contracts that have not yet reached the delivery period must be purchased. This process is known as “rolling” a futures position. The Dow Jones—UBS is a “rolling index” which means that the Dow Jones—UBS Index does not take actual physical possession of the commodities it tracks, rather it purchases futures contracts of a commodity and as the time for the contract becomes due it sells those contracts and purchases new futures contracts that have not yet reached their delivery period.
7
Table of Contents
The Dow Jones—UBS is comprised of commodities in eight different sectors including, petroleum, natural gas, livestock, grains, industrial metals, precious metals, softs and vegetable oils. These eight sectors track futures contracts prices of nineteen specific commodities such as natural gas, crude oil, unleaded gasoline, heating oil, live cattle, lean hogs, wheat, corn, soybeans, soybean oil, aluminum, copper, zinc, nickel, gold, silver, sugar, cotton and coffee. The Dow Jones—UBS is designed to minimize concentration in any one commodity or sector. No single commodity may constitute less than 2% or more than 15% of the index. No related group of commodities (e.g., energy, precious metals, livestock or grains) may constitute more than 33% of the index as of the annual reweightings of the components. The Dow Jones—UBS family of indices also includes eight sub-indices that group commodities based on type, as well as single commodity sub-indices representing each of the nineteen commodities that are currently tracked by the Dow Jones—UBS.
To determine its component weightings, the Dow Jones—UBS relies primarily on liquidity data, or the relative amount of trading activity of a particular commodity. Liquidity is an important indicator of the value placed on a commodity by financial and physical market participants. The index also relies to a lesser extent on dollar-adjusted production data. The index thus relies on data that is endogenous to the futures markets (liquidity) and exogenous to the futures markets (production) in determining relative weightings. All data used in both the liquidity and production calculations is averaged over a five-year period.
In consultation with the DJ—UBS Commodity Index Advisory Committee, the DJ—UBS Commodity Index Supervisory Committee meets annually to determine the composition of the index in accordance with the rules established in the DJ-UBSCI Handbook. The Supervisory Committee consists of employees of UBS Securities LLC and Dow Jones. DJ—UBS Commodity Index Advisory Committee members are drawn from the academic, financial and legal communities.
The Dow Jones—UBS is composed of commodities traded on U.S. exchanges, with the exception of aluminum, nickel and zinc, which trade on the London Metal Exchange (“LME”). Trading hours for the U.S. commodity exchanges are between 8:00 A.M. and 3:00 P.M. (Eastern Time). The Dow Jones—UBS ER contract trades exclusively on the CBOT’s electronic trading platform. The new Dow Jones—UBS ER futures contract will trade exclusively on the Exchange’s premier electronic trading platform, e-cbot®, from 8:15 A.M. – 1:30 P.M. Central Time, Monday through Friday. A daily settlement price for the index is published at approximately 5:00 P.M. (Eastern Time).
The Dow Jones—UBS is designed to provide:
| • | Weightings that reflect economic significance |
| • | Diversification |
| • | Low volatility |
| • | Annual reweighting and rebalancing |
| • | Liquidity |
Dow Jones—UBS Commodity IndexSM
ProShares Ultra DJ-UBS Commodity and ProShares UltraShort DJ-UBS Commodity are designed to track a multiple or an inverse multiple of the daily performance of Dow Jones—UBS Commodity Index.SM. The Dow Jones-UBS Commodity Index is a proprietary index that UBS Securities LLC (successor to AIG Financial Products Corp.) developed and that Dow Jones, in conjunction with UBS Securities LLC, calculates. The methodology for determining the composition and weighting of the Index and for calculating its level is subject to modification by the Sponsors any time. Dow Jones disseminates the Index level at least every 15 seconds from 8:00 A.M. to 3:00 P.M. (Eastern Time), and publishes a daily Index level at approximately 5:00 p.m. (Eastern Time), each business day on its website at http://www.djindexes.com and on other major market data vendors.
8
Table of Contents
The Index is re-weighted and rebalanced each year in January on a price-percentage basis. The annual weightings for the Index are determined each year in June or July by UBS Securities LLC and Dow Jones under the supervision of the Dow Jones-UBS Commodity Index Oversight Committee (the “Oversight Committee”), announced after approval by the Committee and implemented the following January.
The Index is designed to track rolling futures positions in a diversified basket of 19 exchange-traded futures contracts on physical commodities. The 19 physical commodities selected for 2009 are natural gas, crude oil, unleaded gasoline, heating oil, live cattle, lean hogs, wheat, corn, soybeans, soybean oil, aluminum, copper, zinc, nickel, gold, silver, sugar, cotton and coffee.
The Index tracks what is known as a rolling futures position, which is a position where, on a periodic basis, futures contracts on physical commodities specifying delivery on a nearby date must be sold and futures contracts on physical commodities that have not yet reached the delivery period must be purchased. An investor with a rolling futures position is able to avoid delivering underlying physical commodities while maintaining exposure to those commodities. The rollover for each Index component occurs over a period of five Dow Jones-UBS business days each month according to a pre-determined schedule. The Index will reflect the performance of its underlying commodities, including roll costs, without regard to income earned on cash positions.
The Dow Jones-UBS Commodity Index is intended to reflect the overall commodity sector. The Index tracks 19 commodities from eight broad sectors such as petroleum, natural gas, livestock, grains, industrial metals, precious metals, softs and vegetable oil. The Index is composed of notional amounts of the futures contracts for each of the Index commodities with the weighting of each commodity broadly based in proportion to historical levels of the world’s production and supplies of such Index commodity. As of the date of the filing of this Annual Report on Form 10-K, the Dow Jones-UBS Commodity Index is the basis for a listed and traded futures contract on the CBOT. Futures contracts on the Index commodities currently trade on U.S. futures exchanges, with the exception of aluminum, nickel and zinc, which trade on the LME.
Dow Jones—UBS Crude Oil Sub-IndexSM
ProShares Ultra DJ-UBS Crude Oil and ProShares UltraShort DJ-UBS Crude Oil are designed to track a multiple or an inverse multiple of the daily performance of Dow Jones—UBS Crude Oil Sub-IndexSM. The Dow Jones-UBS Crude Oil Sub-IndexSM is intended to reflect the performance of crude oil as measured by the price of futures contracts of sweet, light crude oil traded on the NYMEX, including roll costs, without regard to income earned on cash positions. Crude oil is the world’s most actively traded commodity and may experience significant volatility. The price of crude oil is established by the supply and demand conditions in the global market overall, and more particularly, in the main refining centers of Singapore, Northwest Europe, and the U.S. Gulf Coast. Demand for petroleum products by consumers, as well as agricultural, manufacturing and transportation industries, determines demand for crude oil by refiners. Since the precursors of product demand are linked to economic activity, crude oil demand will tend to reflect economic conditions. However, other factors such as weather also influence product and crude oil demand. The Index will reflect the performance of its underlying commodities, including roll costs, without regard to income earned on cash positions.
Information About the Index Licensor
“Dow Jones,” “UBS®,” “Dow Jones—UBS Commodity IndexSM,” “Dow Jones—UBS Crude Oil Sub-IndexSM,” and “DJ-UBSSM” are service marks of Dow Jones & Company, Inc. and UBS Securities LLC, as the case may be, and have been licensed for use for certain purposes by the Trust (“Licensee”). Dow Jones—UBS Commodity IndexSM and Dow Jones—UBS Crude Oil Sub-IndexSM are collectively referred to as the Indexes.
9
Table of Contents
The Funds are not sponsored, endorsed, sold or promoted by Dow Jones & Company, Inc. (“Dow Jones”) or UBS Securities LLC or any of their subsidiaries or affiliates. None of Dow Jones, UBS Securities LLC or any of their subsidiaries or affiliates makes any representation or warranty, express or implied, to the owners of or counterparts to the Funds or any member of the public regarding the advisability of investing in securities or commodities generally or in the Funds particularly. The only relationship of Dow Jones, UBS Securities LLC or any of their subsidiaries or affiliates to the Licensee is the licensing of certain trademarks, trade names and service marks and of the Indexes, which are determined, composed and calculated by Dow Jones in conjunction with UBS Securities LLC regard to the Licensee or the Funds. Dow Jones and UBS Securities LLC have no obligation to take the needs of the Licensee or the shareholders of the Funds into consideration in determining, composing or calculating the Indexes. None of Dow Jones, UBS Securities LLC or any of their respective subsidiaries or affiliates is responsible for or has participated in the determination of the timing of, prices at, or quantities of the shares of the Funds that have been or are to be issued or in the determination or calculation of the equation by which the shares of the Funds are converted into cash. None of Dow Jones, UBS Securities LLC or any of their subsidiaries or affiliates shall have any obligation or liability, including, without limitation, to Fund shareholders, in connection with the administration, marketing or trading of the Funds. In addition, UBS Securities LLC and its subsidiaries and affiliates actively trade commodities, commodity indexes and commodity futures (including the Indexes), as well as swaps, options and derivatives which are linked to the performance of such commodities, commodity indexes and commodity futures. It is possible that this trading activity will affect the value of the Dow Jones-UBS Commodity IndexSM, and Fund shares.
Fund shareholders should not conclude that the inclusion of a futures contract in the Dow Jones-UBS Commodity IndexSM is any form of investment recommendation of the futures contract or the underlying exchange-traded physical commodity by Dow Jones, UBS Securities LLC or any of their subsidiaries or affiliates. The information in this Annual Report on Form 10-K regarding the Index components has been derived solely from publicly available documents. None of Dow Jones, UBS Securities LLC or any of their subsidiaries or affiliates has made any due diligence inquiries with respect to the Dow Jones-UBS Commodity IndexSM components in connection with Funds. None of Dow Jones, UBS Securities LLC or any of their subsidiaries or affiliates makes any representation that these publicly available documents or any other publicly available information regarding the Index components, including without limitation a description of factors that affect the prices of such components, are accurate or complete.
NONE OF DOW JONES, UBS SECURITIES LLC OR ANY OF THEIR SUBSIDIARIES OR AFFILIATES GUARANTEES THE ACCURACY AND/OR THE COMPLETENESS OF THE INDEXES OR ANY DATA INCLUDED THEREIN AND NONE OF DOW JONES, UBS SECURITIES LLC OR ANY OF THEIR SUBSIDIARIES OR AFFILIATES SHALL HAVE ANY LIABILITY FOR ANY ERRORS, OMISSIONS, OR INTERRUPTIONS THEREIN. NONE OF DOW JONES, UBS SECURITIES LLC OR ANY OF THEIR SUBSIDIARIES OR AFFILIATES MAKES ANY WARRANTY, EXPRESS OR IMPLIED, AS TO RESULTS TO BE OBTAINED BY THE LICENSEE, FUND SHAREHOLDERS, OR ANY OTHER PERSON OR ENTITY FROM THE USE OF THE INDEXES OR ANY DATA INCLUDED THEREIN. NONE OF DOW JONES, UBS SECURITIES LLC OR ANY OF THEIR SUBSIDIARIES OR AFFILIATES MAKES ANY EXPRESS OR IMPLIED WARRANTIES, AND EXPRESSLY DISCLAIMS ALL WARRANTIES OF MERCHANTABILITY OR FITNESS FOR A PARTICULAR PURPOSE OR USE WITH RESPECT TO THE INDEXES OR ANY DATA INCLUDED THEREIN. WITHOUT LIMITING ANY OF THE FOREGOING, IN NO EVENT SHALL DOW JONES, UBS SECURITIES LLC OR ANY OF THEIR SUBSIDIARIES OR AFFILIATES HAVE ANY LIABILITY FOR ANY LOST PROFITS OR INDIRECT, PUNITIVE, SPECIAL OR CONSEQUENTIAL DAMAGES OR LOSSES, EVEN IF NOTIFIED OF THE POSSIBILITY THEREOF. THERE ARE NO THIRD PARTY BENEFICIARIES OF ANY AGREEMENTS OR ARRANGEMENTS AMONG DOW JONES, UBS SECURITIES LLC AND THE LICENSEE.
10
Table of Contents
Description of the Commodity Benchmarks
Gold
ProShares Ultra Gold and ProShares UltraShort Gold are designed to track a multiple or an inverse multiple of the daily performance of gold bullion as measured by the U.S. Dollar P.M. fixing price for delivery in London. The Funds do not directly or physically hold the underlying gold, but instead, seek exposure to gold through the use of Financial Instruments whose value is based on the underlying price of gold to pursue their investment objective. The benchmark price of gold is the U.S. Dollar price of gold bullion as measured by the London afternoon fixing price per troy ounce of unallocated gold bullion for delivery in London through a member of the London Bullion Market Association (“LBMA”) authorized to effect such delivery.
The price of gold is volatile with fluctuations expected to affect the value of the Shares of the Fund. The price movement of gold may be influenced by a variety of factors, including announcements from central banks regarding reserve gold holdings, agreements among central banks, political uncertainties and economic concerns. The gold market is a global marketplace consisting of both OTC transactions and exchange-traded products. The OTC market generally consists of transactions in spot, forwards, options and other derivatives, while exchange-traded transactions consist of futures and options.
A London gold “fix” is conducted each trading day at 3:00 P.M. London time providing reference gold prices for that day’s trading. Many long-term contracts are priced on the basis of the London gold fix and market participants will usually refer to the London gold fix when looking for a basis for valuation. The Sponsor believes that the London fix is the most widely used benchmark for daily gold prices and is quoted by various major market data vendors.
Silver
ProShares Ultra Silver and ProShares UltraShort Silver are designed to track a multiple or an inverse multiple of the daily performance of silver bullion as measured by the U.S. Dollar fixing price for delivery in London. The Funds do not directly or physically hold the underlying silver, but instead seek exposure to silver through the use of Financial Instruments whose value is based on the underlying price of silver to pursue their investment objective. The benchmark price of silver is the U.S. Dollar price of silver bullion as measured by the London fixing price per troy ounce of unallocated silver bullion for delivery in London through a member of the LBMA authorized to effect such delivery.
The price of silver is volatile with fluctuations expected to affect the value of the Shares. The largest industrial users of silver are the photographic, jewelry, and electronic industries and developments in these industries among other factors may influence the price of silver. Like gold, the silver market is a global marketplace consisting of both OTC transactions and exchange-traded products. The OTC market generally consists of transactions in spot, forwards, options and other derivatives, while exchange-traded transactions consist of futures and options.
A London silver “fix” is conducted each trading day at 12:00 P.M. London time providing reference silver prices for that day’s trading. Many long-term contracts are priced on the basis of the London silver fix and market participants will usually refer to the London silver fix when looking for a basis for valuation. The Sponsor believes that the London fix is the most widely used benchmark for daily silver prices and is quoted by various major market data vendors.
Description of the Currencies Benchmarks
ProShares Ultra Euro, ProShares Ultra Yen, ProShares UltraShort Euro and ProShares UltraShort Yen are designed to track a multiple or an inverse multiple of the daily performance of the applicable currency as measured by the U.S. Dollar. These Funds use the 4:00 P.M. (Eastern Time) spot prices of the Euro and Japanese
11
Table of Contents
yen exchange rates as provided by Reuters, expressed in terms of U.S. Dollars per unit of foreign currency, as the basis for the spot prices of the underlying benchmark. A Currency Fund does not necessarily directly or physically hold the underlying currency and may instead seek exposure through the use of Financial Instruments whose value is based on the price of the underlying currency to pursue its investment objective.
Euro
ProShares Ultra Euro and ProShares UltraShort Euro are designed to track a multiple or an inverse multiple of the daily performance of the Euro spot price versus the U.S. Dollar. These Funds use the 4:00 P.M. (Eastern Time) Euro exchange rate as provided by Reuters, expressed in terms of U.S. Dollars per unit of foreign currency, as the basis for the underlying benchmark.
In 1998, the European Central Bank in Frankfurt was organized by Austria, Belgium, Finland, France, Germany, Ireland, Italy, Luxembourg, the Netherlands, Portugal and Spain in order to establish a common currency—the Euro. In 2001, Greece joined as the twelfth country adopting the Euro as its national currency. Unlike the U.S. Federal Reserve System, the Bank of Japan and other comparable central banks, the European Central Bank is a central authority that conducts monetary policy for an economic area consisting of many otherwise largely autonomous states.
At its inception on January 1, 1999, the Euro was launched as an electronic currency used by banks, foreign exchange dealers and stock markets. In 2002, the Euro became cash currency for approximately 300 million citizens of 12 European countries. On May 1, 2004, ten additional countries joined the European Union, of which four have adopted the Euro as their national currency. These countries are Cyprus, Malta, Slovakia and Slovenia.
According to the Bank for International Settlements Triennial Central Bank Survey of Foreign Exchange and Derivatives Market Activity in April 2007—Final results (the “BIS Survey”), average daily turnover of the U.S. Dollar in the foreign exchange market accounts for approximately 86% of global foreign exchange transactions, which makes it the most-traded currency in the world. The average daily turnover of the Euro in the foreign exchange market accounts for approximately 37% of global foreign exchange transactions, which makes it the second-most-traded currency in the world. The U.S. Dollar/Euro pair has an average daily turnover of approximately $840 billion, which makes it the most-traded currency pair, accounting for approximately 27% of the global foreign exchange transactions.
Although the European countries that have adopted the Euro are members of the European Union, the United Kingdom, Denmark and Sweden are European Union members that have not adopted the Euro as their national currency.
Japanese Yen
ProShares Ultra Yen and ProShares UltraShort Yen are designed to track a multiple or an inverse multiple of the daily performance of the Yen spot price versus the U.S. Dollar. These Funds use the 4:00 p.m. (Eastern Time) Yen exchange rate as provided by Reuters, expressed in terms of U.S. Dollars per unit of foreign currency, as the basis for the underlying benchmark.
The Japanese Yen has been the official currency of Japan since 1871. The Bank of Japan has been operating as the central bank of Japan since 1882.
As of April 2007, the average daily turnover in the foreign exchange market was approximately $3.2 trillion. The average daily turnover of the Japanese Yen in the foreign exchange market accounts for approximately 16.5% of global foreign exchange transactions, which makes it the third-most-traded currency in the world. The U.S. Dollar/Japanese Yen pair has an average daily turnover of approximately $397 billion, which makes it the second most traded currency pair, accounting for approximately 13% of global foreign exchange transactions.
12
Table of Contents
A portion of the above information was obtained from the BIS Survey information which comes from the Bank for International Settlements and maintains a website at www.bis.org.
Creation and Redemption of Shares
Each Fund creates and redeems Shares from time to time, but only in one or more Creation Units. A Creation Unit is a block of 50,000 Shares. Except when aggregated in Creation Units, the Shares are not redeemable securities.
Authorized Participants pay a fixed transaction fee of $500 in connection with each order to create or redeem a Creation Unit of Shares in order to compensate Brown Brothers Harriman & Co. (“BBH&Co.”) for services in processing the creation and redemption of Creation Units and to offset the costs of increasing or decreasing derivative positions. Authorized Participants may pay a variable transaction fee of up to 0.10% of the value of the Creation Unit that is purchased or redeemed unless the transaction fee is waived or otherwise adjusted by the Sponsor. The Sponsor provides such Authorized Participant with prompt notice in advance of any such waiver or adjustment of transaction fee. The variable transaction fee is 0.022% for the Commodity Funds and Commodity Index Funds and 0.0% for the Currency Funds. Authorized Participants may sell the Shares included in the Creation Units they purchase from the Funds to other investors.
The form of Authorized Participant Agreement and the related Authorized Participant Handbook set forth the procedures for the creation and redemption of Creation Units and for the payment of cash required for such creations and redemptions. The Sponsor may delegate its duties and obligations under the form of Authorized Participant Agreement to SEI Investments Distribution Co. (“SEI”) or BBH&Co., in its capacity as the Administrator, without consent from any shareholder or Authorized Participant. The form of Authorized Participant Agreement and the related procedures attached thereto may be amended by the Sponsor without the consent of any shareholder or Authorized Participant. Authorized Participants who purchase Creation Units from a Fund receive no fees, commissions or other form of compensation or inducement of any kind from either the Sponsor or the Fund, and no such person has any obligation or responsibility to the Sponsor or the Fund to effect any sale or resale of Shares.
Authorized Participants are cautioned that some of their activities may result in their being deemed participants in a distribution in a manner which would render them statutory underwriters and subject them to the prospectus delivery and liability provisions of the Securities Act of 1933, as amended (the “1933 Act”).
Each Authorized Participant is registered as a broker-dealer under the 1934 Act and regulated by Financial Industry Regulatory Authority (“FINRA”), or exempt from being, or otherwise not required to be, so regulated or registered, and must be qualified to act as a broker or dealer in the states or other jurisdictions where the nature of its business so requires. Certain Authorized Participants may be regulated under federal and state banking laws and regulations. Each Authorized Participant must have its own set of rules and procedures, internal controls and information barriers as it determines is appropriate in light of its own regulatory regime.
Authorized Participants may act for their own accounts or as agents for broker -dealers, custodians and other securities market participants that wish to create or redeem Creation Units.
Persons interested in purchasing Creation Units should contact the Sponsor or the Administrator to obtain the contact information for the Authorized Participants. Shareholders who are not Authorized Participants are only able to redeem their Shares through an Authorized Participant.
Pursuant to the Authorized Participant Agreement, the Sponsor agreed to indemnify the Authorized Participants against certain liabilities, including liabilities under the 1933 Act, and to contribute to the payments the Authorized Participants may be required to make in respect of those liabilities.
13
Table of Contents
The following description of the procedures for the creation and redemption of Creation Units is only a summary and an investor should refer to the relevant provisions of the Trust Agreement and the form of Authorized Participant Agreement for more detail. The Trust Agreement and the form of Authorized Participant Agreement are incorporated by reference into this Annual Report on Form 10-K.
Creation Procedures
On any Business Day, an Authorized Participant may place an order with the Distributor to create one or more Creation Units. For purposes of processing both purchase and redemption orders, a “Business Day” means any day other than a day when any of the NYSE Arca, the New York Stock Exchange (the “NYSE”), and as applicable to the underlying benchmark, the CME, the CBOT, the ICE/NYBOT, the LME or the NYMEX/COMEX is closed for regular trading. Purchase orders must be placed one hour prior to the earliest applicable closing time of the exchange upon which a benchmarked commodity or component of an index trades or upon the platform which a currency is valued. If a purchase order is received prior to the applicable cut-off time, the day on which SEI receives a valid purchase order is the purchase order date. If the purchase order is received after the applicable cut-off time, the purchase order date will be the next day. Purchase orders are irrevocable. By placing a purchase order, and prior to delivery of such Creation Units, an Authorized Participant’s DTC account will be charged the nonrefundable transaction fee due for the purchase order.
Determination of Required Payment
The total payment required to create each Creation Unit is the NAV of 50,000 Shares of the applicable Fund on the purchase order date plus the applicable transaction fee. Authorized Participants have a cut-off as shown in the table below.
| Underlying Benchmark |
Create/Redeem Cutoff |
NAV Calculation Time | ||
| Silver | 6:00 A.M. (Eastern Time) | 7:00 A.M. (Eastern Time)* | ||
| Gold | 9:00 A.M. (Eastern Time) | 10:00 A.M. (Eastern Time)* | ||
| DJ-UBS Commodity | 10:45 A.M. (Eastern Time) | 2:30 P.M. (Eastern Time) | ||
| DJ-UBS Crude Oil | 1:30 P.M. (Eastern Time) | 2:30 P.M. (Eastern Time) | ||
| Euro | 3:00 P.M. (Eastern Time) | 4:00 P.M. (Eastern Time) | ||
| Yen | 3:00 P.M. (Eastern Time) | 4:00 P.M. (Eastern Time) |
| * | For Silver and Gold, this time may vary due to differences in when daylight savings time is effective between London and New York. The actual times equate to noon London time for Silver and 3:00 P.M. London time for Gold. |
Delivery of Cash
Cash required for settlement will typically be transferred to the Custodian either: (i) through the Continuous Net Settlement (“CNS”) clearing process of the National Securities Clearing Corporation (“NSCC”), as such processes have been enhanced to effect creations and redemptions of Creation Units; or (ii) will settle outside the CNS clearing process (i.e., through the facilities of DTC on a Delivery vs. Payment basis). If the Custodian does not receive the cash by the market close on the third (3rd) Business Day following the purchase order date (T+3), such order may be charged interest for delayed settlement or cancelled. In the event a purchase order is cancelled, the Authorized Participant will be responsible for reimbursing the Fund for all costs associated with cancelling the order including costs for repositioning the portfolio. At its sole discretion, the Sponsor may agree to a delivery date other than T+3. The Creation Unit will be delivered to the Authorized Participant upon the Custodian’s receipt of the purchase amount.
Suspension or Rejection of Purchase Orders
In respect of any Fund, the Sponsor may, in its discretion, suspend the right of repurchase, or postpone the purchase settlement date: (i) for any period during which any of the NYSE Arca, NYSE, CME, CBOT,
14
Table of Contents
ICE/NYBOT, LME or NYMEX/COMEX is closed other than for customary holidays or weekend closings or when trading is suspended or restricted on such exchanges in any of the underlying commodities; (ii) for any period during which an emergency exists as a result of which the fulfillment of a purchase order is not reasonably practicable; or (iii) for such other period as the Sponsor determines to be necessary for the protection of the shareholders. The Sponsor will not be liable to any person or in any way for any loss or damages that may result from any such suspension or postponement.
The Sponsor also may reject a purchase order if:
| • | it determines that the purchase order is not in proper form; |
| • | the Sponsor believes that the purchase order would have adverse tax consequences to any Fund or its shareholders; |
| • | the order would in the opinion of counsel be illegal; or |
| • | circumstances outside the control of the Sponsor make it, for all practical purposes, not feasible to process creations of Creation Units. |
None of the Sponsor, the Administrator or the Custodian will be liable for the suspension or rejection of any purchase order.
Redemption Procedures
The procedures by which an Authorized Participant can redeem one or more Creation Units mirror the procedures for the creation of Creation Units. On any Business Day, an Authorized Participant may place an order with the Distributor to redeem one or more Creation Units. Redemption orders must be placed one hour prior to the earliest applicable closing time of the exchange upon which a benchmarked commodity or component of an index trades or upon the platform which a currency is valued. If a redemption order is received prior to the applicable cut-off time, the day on which SEI receives a valid redemption order is the redemption order date. If the redemption order is received after the applicable cut-off time, the redemption order date will be the next day. Redemption orders are irrevocable. The redemption procedures allow Authorized Participants to redeem Creation Units. Individual shareholders may not redeem directly from a Fund.
By placing a redemption order, an Authorized Participant agrees to deliver the Creation Units to be redeemed through DTC’s book-entry system to the applicable Fund not later than noon (Eastern Time), on the third (3rd) Business Day immediately following the redemption order date (T+3). By placing a redemption order, and prior to receipt of the redemption proceeds, an Authorized Participant must wire to the Custodian the non-refundable transaction fee due for the redemption order or any proceeds due will be reduced by the amount of the fee payable. At its sole discretion, the Sponsor may agree to a delivery date other than T+3.
Determination of Redemption Proceeds
The redemption proceeds from a Fund consist of the cash redemption amount. The cash redemption amount is equal to the NAV of the number of Creation Unit(s) of such Fund requested in the Authorized Participant’s redemption order as of the time of the calculation of such Fund’s NAV on the redemption order date, less transaction fees.
Delivery of Redemption Proceeds
The redemption proceeds due from a Fund are delivered to the Authorized Participant at noon (Eastern Time), on the third (3rd) Business Day immediately following the redemption order date if, by such time on such Business Day immediately following the redemption order date, the Fund’s DTC account has been credited with the Creation Units to be redeemed. The fund should be credited either: (i) through the CNS clearing process of NSCC, as such processes have been enhanced to effect creations and redemptions of Creation Units; or (ii) will settle outside the CNS clearing process (i.e., through the facilities of DTC on a Delivery vs. Payment basis). If the Fund’s DTC account has not been credited with all of the Creation Units to be redeemed by such time, the
15
Table of Contents
redemption distribution is delivered to the extent of whole Creation Units received. Any remainder of the redemption distribution is delivered on the next Business Day to the extent of remaining whole Creation Units received if the Sponsor receives the fee applicable to the extension of the redemption distribution date which the Sponsor may, from time-to-time, determine and the remaining Creation Units to be redeemed are credited to the Fund’s DTC account by noon (Eastern Time), on such next Business Day. Any further outstanding amount of the redemption order may be cancelled. The Authorized Participant will be responsible for reimbursing the Fund for all costs associated with canceling the order including costs for repositioning the portfolio.
The Sponsor is also authorized to deliver the redemption distribution notwithstanding that the Creation Units to be redeemed are not credited to the Fund’s DTC account by noon (Eastern Time), on the third (3rd) Business Day immediately following the redemption order date if the Authorized Participant has collateralized its obligation to deliver the Creation Units through DTC’s book-entry system on such terms as the Sponsor may determine from time-to-time.
Suspension or Rejection of Redemption Orders
In respect of any Fund, the Sponsor may, in its discretion, suspend the right of redemption, or postpone the redemption settlement date, (i) for any period during which any of the NYSE Arca, NYSE, CME, CBOT, ICE/NYBOT, LME or NYMEX/COMEX is closed other than for customary holidays or weekend closings or when trading is suspended or restricted on such exchanges in any of the underlying commodities; (ii) for any period during which an emergency exists as a result of which the redemption distribution is not reasonably practicable; or (iii) for such other period as the Sponsor determines to be necessary for the protection of the shareholders. The Sponsor will not be liable to any person or in any way for any loss or damages that may result from any such suspension or postponement.
The Sponsor will reject a redemption order if the order is not in proper form as described in the form of Authorized Participant Agreement or if the fulfillment of the order, in the opinion of its counsel, might be unlawful.
Creation and Redemption Transaction Fee
To compensate BBH for services in processing the creation and redemption of Creation Units and to offset some or all of the costs of increasing or decreasing derivative positions, an Authorized Participant is required to pay a fixed transaction fee of $500 per order to create or redeem Creation Units and a variable transaction fee of up to 0.10% of the value of a Creation Unit. The variable transaction fee is 0.022% for the Commodity Funds and Commodity Index Funds and 0.0% for the Currency Funds. An order may include multiple Creation Units. The transaction fee may be reduced, increased or otherwise changed by the Sponsor.
Special Settlement
The Sponsor may allow for early settlement of purchase or redemption orders. Such arrangements may result in additional charges to the Authorized Participant.
NAV
The NAV in respect of a Fund, means the total assets of the Fund including, but not limited to, all cash and cash equivalents or other debt securities less total liabilities of such Fund, each determined on the basis of generally accepted accounting principles in the United States, consistently applied under the accrual method of accounting. In particular, NAV includes any unrealized profit or loss on open swaps and futures contracts, and any other credit or debit accruing to a Fund but unpaid or not received by a Fund. The NAV per Share of each Fund is computed by dividing the value of the net assets of such Fund (i.e., the value of its total assets less total
16
Table of Contents
liabilities) by its total number of Shares outstanding. Expenses and fees are accrued daily and taken into account for purposes of determining NAV.
| Fund |
NAV Calculation Time | |
| ProShares Ultra Silver | 7:00 A.M. (Eastern Time)* | |
| ProShares UltraShort Silver | ||
| ProShares Ultra Gold | 10:00 A.M. (Eastern Time)* | |
| ProShares UltraShort Gold | ||
| ProShares Ultra DJ-UBS Commodity | 2:30 P.M. (Eastern Time) | |
| ProShares UltraShort DJ-UBS Commodity | ||
| ProShares Ultra DJ-UBS Crude Oil | 2:30 P.M. (Eastern Time) | |
| ProShares UltraShort DJ-UBS Crude Oil | ||
| ProShares Ultra Euro | 4:00 P.M. (Eastern Time) | |
| ProShares UltraShort Euro | ||
| ProShares Ultra Yen | 4:00 P.M. (Eastern Time) | |
| ProShares UltraShort Yen |
| * | For Silver and Gold, this time may vary due to differences in when daylight savings time is effective between London and New York. The actual times equate to noon London time for Silver and 3:00 P.M. London time for Gold. |
In calculating the indicative NAV of a Commodity Index Fund, the settlement value of a Commodity Index Funds’ swap agreements or forward contracts, as applicable, is determined by applying the then-current disseminated value for the applicable Dow Jones—UBS sub-index to the terms of such Commodity Index Funds’ swap agreements. In calculating the indicative NAV of a Commodity Fund or a Currency Fund, the settlement value of the Fund’s swap agreements or forward contracts, as applicable, is determined by applying the then-current disseminated values for the applicable benchmark to the terms of such Fund’s swap agreements or forward contracts. However, in the event that an underlying commodity is not trading due to the operation of daily limits or otherwise, the Sponsor may in its sole discretion choose to fair value the index level in order to value the Fund’s swap and forward agreements for purposes of NAV calculation.
All open futures contracts traded on a United States exchange are calculated at their then current market value, which is based upon the settlement price (for Funds benchmarked to the Dow Jones-UBS Crude Oil Sub-IndexSM and the Dow Jones-UBS Commodity IndexSM) or the last traded price before the NAV time (for Funds benchmarked to the London silver fix, the London PM gold fix, the Yen/USD and the Euro/USD), for that particular futures contract traded on the applicable United States exchange on the date with respect to which NAV is being determined; provided, that if a futures contract traded on a United States exchange could not be liquidated on such day, due to the operation of daily limits or other rules of the exchange upon which that position is traded or otherwise, the Sponsor may in its sole discretion choose to determine a fair value price as the basis for determining the market value of such position for such day. The current market value of all open futures contracts traded on a non-United States exchange, to the extent applicable, are based upon the settlement price for that particular futures contract traded on the applicable non-United States exchange on the date with respect to which NAV is being determined; provided further, that if a futures contract traded on a non-United States exchange, to the extent applicable, could not be liquidated on such day, due to the operation of daily limits (if applicable) or other rules of the exchange upon which that position is traded or otherwise, the Sponsor may in its sole discretion choose to determine a fair value price as the basis for determining the market value of such position for such day. The Sponsor may in its sole discretion (and under extraordinary circumstances, including, but not limited to, periods during which a settlement price of a futures contract is not available due to exchange limit orders or force majeure type events such as systems failure, natural or manmade disaster, act of God, armed conflict, act of terrorism, riot or labor disruption or any similar intervening circumstance) value any asset of a Fund pursuant to such other principles as the Sponsor deems fair and equitable so long as such principles are consistent with normal industry standards. The amount of any distribution will be a liability of such Fund from the day when the distribution is declared until it is paid.
17
Table of Contents
Indicative Optimized Portfolio Value (“IOPV”)
The IOPV is an indicator of the value of the Financial Instruments and cash and receivables less liabilities of a Fund at the time the IOPV is disseminated. The NYSE Arca calculates and disseminates every 15 seconds throughout the trading day an updated IOPV. The IOPV is calculated by the NYSE Arca using the prior day’s closing net assets of the Fund as a base and updating throughout the trading day changes in the value of swap agreements, futures contracts and forward contracts held by the Fund. The IOPV should not be viewed as an actual real time update of the NAV because NAV is calculated only once at the end of each trading day. The IOPV also should not be viewed as a precise value of the Shares.
The NYSE Arca disseminates the IOPV. In addition, the IOPV is published on the NYSE Arca’s website and is available through on-line information services such as Bloomberg and Reuters.
Dissemination of the IOPV provides additional information that is not otherwise available to the public and may be useful to investors and market professionals in connection with the trading of Shares. Investors and market professionals are able throughout the trading day to compare the market price of a Fund and the IOPV. If the market price of Shares diverges significantly from the IOPV, market professionals may have an incentive to execute arbitrage trades. Such arbitrage trades can tighten the tracking between the market price of a Fund and the IOPV and thus can be beneficial to all market participants.
Purchases and Sales in the Secondary Market, on the NYSE Arca
Eight of the Funds, ProShares Ultra DJ-UBS Commodity, ProShares UltraShort DJ-UBS Commodity, ProShares Ultra DJ-UBS Crude Oil, ProShares UltraShort DJ-UBS Crude Oil, ProShares Ultra Euro, ProShares UltraShort Euro, ProShares Ultra Yen and ProShares UltraShort Yen, began trading on the NYSE Arca on November 25, 2008. The remaining four Funds, ProShares Ultra Silver, ProShares UltraShort Silver, ProShares Ultra Gold and ProShares UltraShort Gold, began trading on the NYSE Arca on December 3, 2008. The Shares of each Fund are listed on the NYSE Arca under the following symbols:
| Fund |
Ticker | |
| ProShares Ultra DJ-UBS Commodity | UCD | |
| ProShares UltraShort DJ-UBS Commodity | CMD | |
| ProShares Ultra DJ-UBS Crude Oil | UCO | |
| ProShares UltraShort DJ-UBS Crude Oil | SCO | |
| ProShares Ultra Gold | UGL | |
| ProShares UltraShort Gold | GLL | |
| ProShares Ultra Silver | AGQ | |
| ProShares UltraShort Silver | ZSL | |
| ProShares Ultra Euro | ULE | |
| ProShares UltraShort Euro | EUO | |
| ProShares Ultra Yen | YCL | |
| ProShares UltraShort Yen | YCS |
Secondary market purchases and sales of Shares are subject to ordinary brokerage commissions and charges. The Shares of each Fund trade on the NYSE Arca, like any other exchange-listed security.
Fees and Expenses
Organization and Offering Expenses
The Trust has paid expenses incurred in connection with organizing each Fund and the initial offering of each Fund’s Shares, and the Sponsor did not charge its fee in the first year of operations of each Fund in an
18
Table of Contents
amount equal to the organization and offering expenses. The Sponsor reimbursed each Fund to the extent that its organizational and offering costs exceeded 0.95% of its average daily NAV for the first year of operations. Normal and expected expenses incurred in connection with the continuous offering of Shares of each Fund are paid by the Sponsor.
Organization and offering expenses mean those expenses incurred in connection with the Trust’s formation, the qualification and registration of the Shares of each Fund and in offering, distributing and processing the Shares of each Fund under applicable federal law, and any other expenses actually incurred and, directly or indirectly, related to the organization of each offering of the Shares of such Fund, including, but not limited to, expenses such as:
| • | initial SEC registration fees and SEC and FINRA filing fees; |
| • | costs of preparing, printing (including typesetting), amending, supplementing, mailing and distributing the Trust’s Registration Statements, the exhibits thereto and the related prospectuses; |
| • | the costs of qualifying, printing (including typesetting), amending, supplementing and mailing sales materials used in connection with the offering and issuance of the Shares; and |
| • | accounting, auditing and legal fees (including disbursements related thereto) incurred in connection therewith. |
Management Fee
Each Fund pays the Sponsor a Management Fee, monthly in arrears, in an amount equal to 0.95% per annum of its average daily NAV of such Fund to the extent that such amounts cumulatively exceeded the organizational and offering costs incurred by the Fund. No other management fee is paid by the Funds. The Management Fee is paid in consideration of the Sponsor’s trading advisory services and the other services provided to the Funds that the Sponsor pays directly.
Licensing Fee
The Sponsor pays Dow Jones—UBS a licensing fee for each Dow Jones—UBS sub-index used as a benchmark for a Commodity Index Fund.
Routine Operational, Administrative and Other Ordinary Expenses
The Sponsor pays all of the routine operational, administrative and other ordinary expenses of each Fund, generally, as determined by the Sponsor, including, but not limited to, fees and expenses of the Administrator, Custodian, Distributor, Transfer Agent and DOW-UBS, accounting and audit fees and expenses, tax preparation expenses, legal fees not in excess of $100,000 per annum, ongoing SEC registration fees not exceeding .021% per annum of the NAV of a Fund, FINRA filing fees, individual K-1 preparation and mailing fees not exceeding .10% per annum of the NAV of a Fund, and report preparation and mailing expenses.
Non-Recurring Fees and Expenses
Each Fund pays all of its non-recurring and unusual fees and expenses, if any, as determined by the Sponsor. Non-recurring and unusual fees and expenses are fees and expenses which are unexpected or unusual in nature, such as legal claims and liabilities and litigation costs or indemnification or other unanticipated expenses. Extraordinary fees and expenses also include material expenses which are not currently anticipated obligations of the Funds. Routine operational, administrative and other ordinary expenses are not deemed extraordinary expenses.
19
Table of Contents
Selling Commission
Retail investors may purchase and sell Shares through traditional brokerage accounts. Investors are expected to be charged a customary commission by their brokers in connection with purchases of Shares that will vary from investor to investor. Investors are encouraged to review the terms of their brokerage accounts for applicable charges. Also, the excess, if any, of the price at which an Authorized Participant sells a Share over the price paid by such Authorized Participant in connection with the creation of such Share in a Creation Unit may be deemed to be underwriting compensation.
Brokerage Commissions and Fees
Each Fund pays all brokerage commissions, including applicable exchange fees, NFA fees and give-up fees, pit brokerage fees and other transaction related fees and expenses charged in connection with trading activities for each Fund’s investments in CFTC regulated investments.
Other Transaction Costs
The Funds bear other transaction costs including the effects of trading spreads and financing costs associated with the use of Financial Instruments, and costs relating to the purchase of U.S. Treasury Securities or similar high credit quality short-term fixed-income or similar securities (such as shares of money market funds, bank deposits, bank money market accounts, certain variable rate-demand notes and repurchase agreements collateralized by government securities, whether denominated in U.S. or the applicable foreign currency with respect to a Currency Fund).
Employees
The Trust has no employees.
| Item 1A. | Risk Factors. |
The risk factors should be read in connection with the other information included in this Annual Report on Form 10-K, including Management’s Discussion and Analysis of Financial Condition and Results of Operations and the Funds’ Financial Statements and the related Notes to the Funds’ Financial Statements.
Risks Related to the Funds’ Operations and Management
There is risk that the objectives of the Funds will not be met.
The success of the Funds depends on a number of conditions that are beyond the control of the Funds. There is risk that the investment objectives of the Funds will not be met. The Sponsor has a relatively short history managing publicly offered commodity pools. If the experience of the Sponsor and its principals is not adequate or suitable to manage investment vehicles such as the Funds, the operations of the Funds may be adversely affected.
The Funds have limited operating history, and, as a result, investors have only a limited performance history to serve as a factor for evaluating an investment in any Fund.
Each Fund has a limited performance history upon which to evaluate an investor’s investment in the Funds. Although past performance is not necessarily indicative of future results, if the Funds had longer performance histories, such performance histories might (or might not) provide investors with more information on which to evaluate an investment in a Fund. Likewise, each benchmark has a limited history which might (or might not) be indicative of the future results of such benchmark, or of the future performance of each applicable Fund. Therefore, investors will have to make their decision to invest in each Fund on the basis of limited information.
20
Table of Contents
While close tracking of any Fund to its benchmark may be achieved on any single trading day, several factors may affect their ability to consistently achieve this correlation.
While the Funds do not expect that their daily returns will deviate adversely from their respective daily investment objectives, several factors may affect their ability to achieve this correlation. Among these factors are: (1) a Fund’s expenses, including fees, transaction costs and the cost of the investment techniques employed by that Fund (such as costs related to the purchase, sale and storage of the commodities or currencies and the cost of leverage, all of which may be embedded in Financial Instruments used by a Fund); (2) less than all of the commodities in the relevant benchmark index being held by a Commodity Index Fund or its weighting of investment exposure to such commodities being different from that of the relevant benchmark index; (3) an imperfect correlation between the performance of instruments held by a Fund, such as swaps, futures contracts and/or forward contracts, and the performance of the applicable underlying commodities indices, commodities or currencies in the cash market; (4) bid-ask spreads; (5) holding instruments traded in a market that has become illiquid or disrupted; (6) a Fund’s share prices being rounded to the nearest cent; (7) changes to a benchmark index that are not disseminated in advance; (8) the need to conform a Fund’s portfolio holdings to comply with investment restrictions or policies or regulatory or tax law requirements; (9) early and unanticipated closings of the markets on which the holdings of a Fund trade, resulting in the inability of the Fund to execute intended portfolio transactions.
Over time, the cumulative percentage increase or decrease in the NAV of the Shares of a Fund may diverge significantly from a multiple or inverse multiple of the cumulative percentage decrease or increase in the relevant benchmark due to the risks associated with the use of leverage, correlation risk and compounding risk.
Each of the Funds use investment techniques that may be considered aggressive, including the use of futures contracts, options on futures contracts, securities and indexes, forward contracts, swap agreements and similar instruments. The Funds’ investment in Financial Instruments may involve a small investment relative to the amount of investment exposure assumed and may result in losses exceeding the amounts invested. Such instruments, particularly when used to create leverage, may expose the Funds to potentially dramatic changes (losses or gains) in the value of the instruments and imperfect correlation between the value of the instruments and the security or index. The use of aggressive investment techniques also exposes the Funds to risks different from, or possibly greater than, the risks associated with investing directly in securities contained in an index underlying a Fund’s benchmark, including: (1) the risk that there may be imperfect correlation between the price of Financial Instruments and movements in the prices of the underlying securities; (2) the risk that a Financial Instrument is mispriced; (3) credit or counterparty risk on the amount the Fund expects to receive from a counterparty; (4) the risk that securities prices, interest rates and currency markets will move adversely and the Fund will incur significant losses; (5) the risk that the cost of holding a Financial Instrument might exceed its total return; (6) the risk of the Fund not achieving its daily investment objective will be more acute when the index to which a Fund is benchmarked has an extreme one-day move approaching 50% and (7) the possible absence of a liquid secondary market for any particular Financial Instrument and/or possible exchange-imposed price fluctuation limits, which may make it difficult or impossible to adjust a Fund’s position in a particular Financial Instrument when desired.
A number of factors may affect a Fund’s ability to achieve a high degree of correlation with its benchmark, and there can be no guarantee that a Fund will achieve a high degree of correlation. Failure to achieve a high degree of correlation may prevent a Fund from achieving its investment objective. A number of factors may adversely affect a Fund’s correlation with its benchmark, including fees, expenses, transaction costs, costs and risks associated with the use of leveraged investment techniques, income items, accounting standards and disruptions or illiquidity in the markets for the securities or Financial Instruments in which a Fund invests. A Fund may not have investment exposure to all securities in its underlying benchmark index, or its weighting of investment exposure to such stocks or industries may be different from that of the index. In addition, a Fund may invest in securities or Financial Instruments not included in the index underlying its benchmark. A Fund may be subject to large movements of assets into and out of the Fund, potentially resulting in the Fund being over- or
21
Table of Contents
under-exposed to its benchmark. Activities surrounding annual index reconstitutions and other index rebalancing or reconstitution events may hinder a Fund’s ability to meet its daily investment objective on that day. Each Fund seeks to rebalance its portfolio daily to keep leverage consistent with its daily investment objective.
The Funds are “leveraged” funds in the sense that they have investment objectives to match a multiple, the inverse or a multiple of the inverse of the performance of an index on a given day. The Funds are subject to all of the correlation risks described above. In addition, there is a special form of correlation risk that derives from the Funds’ having a single day investment objective in combination with the use of leverage, which is that for periods greater than one day, the effect of compounding may cause the performance of a Fund to be either greater than or less than the index performance (or the inverse of the index performance) times the stated multiple in the Fund objective, before accounting for fees and fund expenses.
The Funds are designed to provide leveraged (e.g. 200%), inverse (e.g. -100%) or inverse leveraged (e.g. -200%) results on a daily basis (before fees and expenses). The Funds, however, are unlikely to provide a simple multiple (e.g., 2x or -2x) or the inverse (e.g., -1x) of an index’s performance over periods longer than one day.
The hypothetical example below illustrates how daily leveraged and short fund returns can behave for periods longer than one day. Take a hypothetical fund XYZ that seeks to double the daily performance of index XYZ. On each day, fund XYZ performs in line with its objective (200% of the index’s daily performance before fees and expenses). Notice that over the entire five-day period, the fund’s total return is considerably less than double that of the period return of the index. For the five-day period, index XYZ gained 5.1% while fund XYZ gained 9.8%. In other scenarios, the return of a daily rebalanced fund could be greater than double the index’s return.
| Index XYZ | Fund XYZ | ||||||||||
| Level | Daily Performance |
Daily Performance |
Net Asset Value | ||||||||
| Start |
100.0 | $ | 100.00 | ||||||||
| Day 1 |
103.0 | 3.0 | % | 6.0 | % | $ | 106.00 | ||||
| Day 2 |
99.9 | -3.0 | % | -6.0 | % | $ | 99.64 | ||||
| Day 3 |
103.9 | 4.0 | % | 8.0 | % | $ | 107.61 | ||||
| Day 4 |
101.3 | -2.5 | % | -5.0 | % | $ | 102.23 | ||||
| Day 5 |
105.1 | 3.7 | % | 7.4 | % | $ | 109.80 | ||||
| Total Return |
5.1% | 9.8% | |||||||||
This effect is caused by compounding, which exists in all investments, but has a more significant impact in a leveraged fund. In general, during periods of higher index volatility, compounding will cause longer term results to be less than two times (or minus two times) the return of the index. This effect becomes more pronounced as volatility increases. Conversely, in periods of lower index volatility, fund returns over longer periods can be higher than two times (or minus two times) the return of the index. Actual results for a particular period, before fees and expenses, are also dependent on the magnitude of the index return in addition to the index volatility. Similar effects exist for Short ProShares.
The graphs that follow illustrate this point. Each of the graphs shows a simulated hypothetical one year performance of an index compared with the performance of a fund that perfectly achieves its investment objective. The graphs demonstrate that, for periods greater than one day, a leveraged fund is likely to underperform or over-perform (but not match) the index performance (or the inverse of the index performance) times the stated multiple in the fund objective. Investors should understand the consequences of holding daily rebalanced funds for periods longer than a single day and should actively monitor their investments. A one year period is used for illustrative purposes only. Deviations from the index return times the fund multiple can occur over periods as short as two days.
22
Table of Contents
To isolate the impact of leverage, these graphs assume a) no dividends paid by the companies included on the index; b) no fund expenses; and c) borrowing/lending rates (to obtain required leverage) of zero percent. If these costs and expenses were included, the fund’s performance would be lower than that shown. Each of the graphs also assumes a volatility rate of 25%, which is an approximate average of the five-year historical volatility rate of the S&P 500® Index, S&P MidCap 400™ Index, Russell 2000® Index, NASDAQ-100® Index and Dow Jones Industrial Average™. An index’s volatility rate is a statistical measure of the magnitude of fluctuations in the returns of an index. Indexes to which the Funds are benchmarked have different historical volatility rates; certain of the Funds’ historical volatility rates are substantially in excess of 25%.
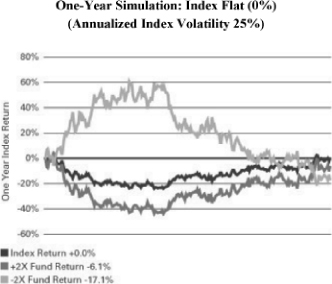
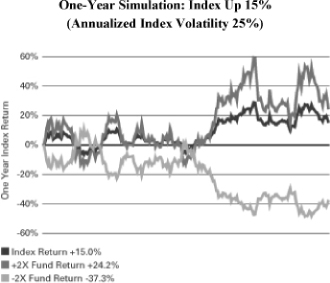
23
Table of Contents
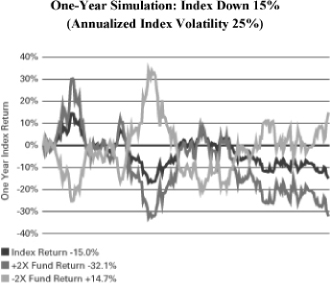
| Index |
Historical Five- Year Average Volatility Rate |
||
| Dow Jones—UBS Commodity IndexSM |
21.37 | % | |
| Dow Jones—UBS Crude Oil Sub-IndexSM |
39.19 | % | |
| Dow Jones—UBS Natural Gas Sub-IndexSM |
49.39 | % | |
| The daily performance of gold bullion as measured by the U.S. Dollar p.m. fixing price for delivery in London |
22.18 | % | |
| The daily performance of silver bullion as measured by the U.S. Dollar fixing price for delivery in London |
38.58 | % | |
| The U.S. Dollar price of the Euro |
10.08 | % | |
| The U.S. Dollar price of the Japanese Yen |
11.44 | % |
Daily objective leveraged funds if used properly and in conjunction with the investor’s view on the future direction and volatility of the markets can be useful tools for investors who want to manage their exposure to various markets and market segments and who are willing to monitor and/or periodically rebalance their portfolios. But investors considering these funds should understand that they are designed to provide a positive or negative multiple of an index on a daily basis and not for greater periods of time. As a result, fund returns will not likely be a simple multiple (e.g., 2x or -2x) or the inverse (e.g., -1x) of an index’s return for time periods longer than one day.
Additionally, investors should recognize that the degree of volatility of the underlying index can have a dramatic effect on a fund’s longer-term performance. The greater the volatility, given a particular index return, the greater the downside deviation will be of a fund’s longer-term performance from a simple multiple (e.g., 2x, -2x) or the inverse (e.g., -1x) of its index’s longer-term return. As shown in the first example, it is even possible that a fund may move in opposite direction as the index.
Price volatility, which is exacerbated by the use of leverage, may possibly cause the total loss of an investor’s investment and may adversely impact performance over periods longer than one day.
Swap agreements, futures and forward contracts have a high degree of price variability and are subject to occasional rapid and substantial changes, which will be magnified by the leveraged positions of the Funds. Consequently, investors could lose all or substantially all of their investment in a Fund.
24
Table of Contents
Each of the Funds are “leveraged” funds in the sense that each has an investment objective to match a multiple or inverse multiple of the performance of a benchmark on a given day. These Funds are subject to the correlation risks described in the preceding risk factor. In addition, as described above, there is a special form of correlation risk that derives from these Funds’ use of leverage, which is that for periods greater than one day, the use of leverage tends to cause the performance of an Ultra or UltraShort Fund to be either greater than, or less than, the benchmark performance times the stated multiple in the fund objective.
The fund performance for a leveraged fund can be estimated given certain assumptions. The tables below illustrate the impact of two factors, benchmark volatility and benchmark performance, on a leveraged fund. Benchmark volatility is a statistical measure of the magnitude of fluctuations in the returns of a benchmark and is calculated as the standard deviation of the natural logarithms of one plus the benchmark return (calculated daily), multiplied by the square root of the number of trading days per year (assumed to be 252). The tables show estimated fund returns for a number of combinations of benchmark performance and benchmark volatility over a one year period. Assumptions used in the tables include: a) no fund expenses and b) borrowing/lending rates (to obtain leverage) of zero percent. If fund expenses were included, the fund’s performance would be lower than shown. The first table below shows an example in which a leveraged fund that has an investment objective to correspond to twice (200%) of the daily performance of a benchmark. The leveraged fund could be expected to achieve a 20% return on a yearly basis if the benchmark performance was 10%, absent any costs or the correlation risk or other factors described above. However, as the table shows, with a benchmark volatility of 20%, such a fund would return 16.3%, again absent any costs or other factors described above. In the charts below, shaded areas represent those scenarios where a leveraged fund with the investment objective described will outperform (i.e., return more than) the benchmark performance times the stated multiple in the Fund’s investment objective; conversely areas not shaded represent those scenarios where the Fund will underperform (i.e., return less than) the benchmark performance times the stated multiple in the Fund’s investment objective.
Estimated Fund Return Over One Year When the Fund Objective is to Seek Daily Results, Before Fees and Expenses and Leverage Costs, that Correspond to Twice (200%) the Daily Performance of a Benchmark.
| One Year Index |
200% One Year Index Performance |
Index Volatility | ||||||||||||||||||
| 0% | 5% | 10% | 15% | 20% | 25% | 30% | 35% | 40% | ||||||||||||
| -40% |
-80% | -64.0% | -64.1% | -64.4% | -64.8% | -65.4% | -66.2% | -67.1% | -68.2% | -69.3% | ||||||||||
| -35% |
-70% | -57.8% | -57.9% | -58.2% | -58.7% | -59.4% | -60.3% | -61.4% | -62.6% | -64.0% | ||||||||||
| -30% |
-60% | -51.0% | -51.1% | -51.5% | -52.1% | -52.9% | -54.0% | -55.2% | -56.6% | -58.2% | ||||||||||
| -25% |
-50% | -43.8% | -43.9% | -44.3% | -45.0% | -46.0% | -47.2% | -48.6% | -50.2% | -52.1% | ||||||||||
| -20% |
-40% | -36.0% | -36.2% | -36.6% | -37.4% | -38.5% | -39.9% | -41.5% | -43.4% | -45.5% | ||||||||||
| -15% |
-30% | -27.8% | -27.9% | -28.5% | -29.4% | -30.6% | -32.1% | -34.0% | -36.1% | -38.4% | ||||||||||
| -10% |
-20% | -19.0% | -19.2% | -19.8% | -20.8% | -22.2% | -23.9% | -26.0% | -28.3% | -31.0% | ||||||||||
| -5% |
-10% | -9.8% | -10.0% | -10.6% | -11.8% | -13.3% | -15.2% | -17.5% | -20.2% | -23.1% | ||||||||||
| 0% |
0% | 0.0% | -0.2% | -1.0% | -2.2% | -3.9% | -6.1% | -8.6% | -11.5% | -14.8% | ||||||||||
| 5% |
10% | 10.3% | 10.0% | 9.2% | 7.8% | 5.9% | 3.6% | 0.8% | -2.5% | -6.1% | ||||||||||
| 10% |
20% | 21.0% | 20.7% | 19.8% | 18.3% | 16.3% | 13.7% | 10.6% | 7.0% | 3.1% | ||||||||||
| 15% |
30% | 32.3% | 31.9% | 30.9% | 29.3% | 27.1% | 24.2% | 20.9% | 17.0% | 12.7% | ||||||||||
| 20% |
40% | 44.0% | 43.6% | 42.6% | 40.8% | 38.4% | 35.3% | 31.6% | 27.4% | 22.7% | ||||||||||
| 25% |
50% | 56.3% | 55.9% | 54.7% | 52.8% | 50.1% | 46.8% | 42.8% | 38.2% | 33.1% | ||||||||||
| 30% |
60% | 69.0% | 68.6% | 67.3% | 65.2% | 62.4% | 58.8% | 54.5% | 49.5% | 44.0% | ||||||||||
| 35% |
70% | 82.3% | 81.8% | 80.4% | 78.2% | 75.1% | 71.2% | 66.6% | 61.2% | 55.3% | ||||||||||
| 40% |
80% | 96.0% | 95.5% | 94.0% | 91.6% | 88.3% | 84.1% | 79.1% | 73.4% | 67.0% | ||||||||||
25
Table of Contents
Estimated Fund Return Over One Year When the Fund Objective is to Seek Daily Results, Before Fees and Expenses, that Correspond to Twice (200%) the Inverse of the Daily Performance of a Benchmark.
| One Year Index |
200% Inverse of One Year Index Performance |
Index Volatility | ||||||||||||||||||
| 0% | 5% | 10% | 15% | 20% | 25% | 30% | 35% | 40% | ||||||||||||
| -40% |
80% | 177.8% | 175.7% | 169.6% | 159.6% | 146.4% | 130.3% | 112.0% | 92.4% | 71.9% | ||||||||||
| -35% |
70% | 136.7% | 134.9% | 129.7% | 121.2% | 109.9% | 96.2% | 80.7% | 63.9% | 46.5% | ||||||||||
| -30% |
60% | 104.1% | 102.6% | 98.1% | 90.8% | 81.0% | 69.2% | 55.8% | 41.3% | 26.3% | ||||||||||
| -25% |
50% | 77.8% | 76.4% | 72.5% | 66.2% | 57.7% | 47.4% | 35.7% | 23.1% | 10.0% | ||||||||||
| -20% |
40% | 56.3% | 55.1% | 51.6% | 46.1% | 38.6% | 29.5% | 19.3% | 8.2% | -3.3% | ||||||||||
| -15% |
30% | 38.4% | 37.4% | 34.3% | 29.4% | 22.8% | 14.7% | 5.7% | -4.2% | -14.4% | ||||||||||
| -10% |
20% | 23.5% | 22.5% | 19.8% | 15.4% | 9.5% | 2.3% | -5.8% | -14.5% | -23.6% | ||||||||||
| -5% |
10% | 10.8% | 10.0% | 7.5% | 3.6% | -1.7% | -8.1% | -15.4% | -23.3% | -31.4% | ||||||||||
| 0% |
0% | 0.0% | -0.7% | -3.0% | -6.5% | -11.3% | -17.1% | -23.7% | -30.8% | -38.1% | ||||||||||
| 5% |
-10% | -9.3% | -10.0% | -12.0% | -15.2% | -19.6% | -24.8% | -30.8% | -37.2% | -43.9% | ||||||||||
| 10% |
-20% | -17.4% | -18.0% | -19.8% | -22.7% | -26.7% | -31.5% | -36.9% | -42.8% | -48.9% | ||||||||||
| 15% |
-30% | -24.4% | -25.0% | -26.6% | -29.3% | -32.9% | -37.3% | -42.3% | -47.6% | -53.2% | ||||||||||
| 20% |
-40% | -30.6% | -31.1% | -32.6% | -35.1% | -38.4% | -42.4% | -47.0% | -51.9% | -57.0% | ||||||||||
| 25% |
-50% | -36.0% | -36.5% | -37.9% | -40.2% | -43.2% | -46.9% | -51.1% | -55.7% | -60.4% | ||||||||||
| 30% |
-60% | -40.8% | -41.3% | -42.6% | -44.7% | -47.5% | -50.9% | -54.8% | -59.0% | -63.4% | ||||||||||
| 35% |
-70% | -45.1% | -45.5% | -46.8% | -48.7% | -51.3% | -54.5% | -58.1% | -62.0% | -66.0% | ||||||||||
| 40% |
-80% | -49.0% | -49.4% | -50.5% | -52.3% | -54.7% | -57.7% | -61.1% | -64.7% | -68.4% | ||||||||||
The foregoing tables are intended to isolate the effect of benchmark volatility and benchmark performance on the return of a leveraged fund. The Funds’ actual returns may be significantly greater or less than the returns shown above as a result of any of the factors discussed above or under the preceding risk factor describing correlation risks.
Investors cannot be assured of the Sponsor’s continued services, which discontinuance may be detrimental to the Funds.
Investors cannot be assured that the Sponsor will be willing or able to continue to service the Funds for any length of time. If the Sponsor discontinues its activities on behalf of the Funds, the Funds may be adversely affected, as there may be no entity servicing the Funds for a period of time. If the Sponsor’s registrations with the CFTC or memberships in the NFA were revoked or suspended, the Sponsor would no longer be able to provide services and/or to render trading advice to the Funds. As the Funds themselves are not registered with the CFTC in any capacity, if the Sponsor were unable to provide services and/or trading advice to the Funds, the Funds would be unable to pursue their investment objectives unless and until the Sponsor’s ability to provide services and trading advice to the Funds was reinstated or a replacement for the Sponsor as commodity pool operator and/or commodity trading advisor could be found. Such an event could result in termination of the Funds.
Investors may be adversely affected by creation or purchase orders that are subject to postponement, suspension or rejection under certain circumstances.
The Funds may, in their discretion, suspend the right of creation or redemption or may postpone the redemption or purchase settlement date, for (1) any period during which the NYSE Arca, NYSE, CME, CBOT, ICE/NYBOT, LME or NYMEX/COMEX is closed, other than for customary holidays or weekends, or when trading is restricted or suspended or restricted on such exchanges in any of the underlying commodities, (2) any
26
Table of Contents
period during which an emergency exists as a result of which the fulfillment of a purchase order or the redemption distribution is not reasonably practicable, (3) any period during which the gold bullion U.S. Dollar p.m. fixing price for delivery in London has not been established or (4) such other period as the Sponsor determines to be necessary for the protection of the shareholders of a Fund. In addition, the Funds will reject a redemption order if the order is not in proper form as described in the Authorized Participant Agreement or if the fulfillment of the order, in the opinion of its counsel, might be unlawful. Any such postponement, suspension or rejection could adversely affect a redeeming Authorized Participant. For example, the resulting delay may adversely affect the value of the Authorized Participant’s redemption proceeds if the NAV of the applicable Fund declines during the period of delay. The Funds disclaim any liability for any loss or damage that may result from any such suspension or postponement. Suspension of creation privileges may adversely impact how Fund Shares are traded and arbitraged on the Exchange, which could cause them to trade at levels materially different (premiums and discounts) from the fair value of their underlying holdings.
An investor may be adversely affected by lack of independent advisers representing investors.
The Sponsor has consulted with counsel, accountants and other advisers regarding the formation and operation of the Funds. No counsel has been appointed to represent an investor in connection with the offering of the Shares. Accordingly, an investor should consult his, her, or its own legal, tax and financial advisers regarding the desirability of an investment in the Shares of a Fund. Lack of such consultation may lead to an undesirable investment decision with respect to investment in the Shares.
Possibility of termination of the Funds may adversely affect an investor’s portfolio.
The Sponsor may withdraw from the Funds upon 30 days’ notice, which would also cause the Funds to terminate unless a substitute sponsor were obtained. If the Sponsor withdraws, investors who wish to continue to invest in a Fund’s corresponding benchmark through a fund vehicle will have to find another vehicle, and may not be able to find another vehicle that offers the same features as such Fund.
The value of the Shares of each Fund relates directly to the value of, and realized profit or loss from, the Financial Instruments and other assets held by the Fund and fluctuations in the price of these assets could materially adversely affect an investment in the Shares.
With regard to the Commodity Index Funds or the Commodity Funds, several factors may affect the price of a commodity underlying a Commodity Index Fund or a Commodity Fund, and in turn, the Financial Instruments and other assets, if any, owned by such a Fund, including, but not limited to:
| • | The recent proliferation of commodity linked exchange traded products and their unknown effect on the commodity markets. |
| • | Large purchases or sales of physical commodities by the official sector. Governments and large institutions have large commodities holdings or may establish major commodities positions. For example, a significant portion of the aggregate world gold holdings is owned by governments, central banks and related institutions. Similarly, nations with centralized or nationalized oil production and organizations such as the Organization of Petroleum Exporting Countries control large physical quantities of crude oil. If one or more of these institutions decides to buy or sell any commodity in amounts large enough to cause a change in world prices, the price of Shares based upon a benchmark related to that commodity will be affected. |
| • | Other political factors. In addition to the organized political and institutional trading-related activities described above, peaceful political activity such as imposition of regulations or entry into trade treaties, as well as political disruptions caused by societal breakdown, insurrection and/or war may greatly influence commodities prices. |
| • | Significant increases or decreases in the available supply of a physical commodity due to natural or technological factors. Natural factors would include depletion of known cost-effective sources for a |
27
Table of Contents
| commodity or the impact of severe weather on the ability to produce or distribute the commodity. Technological factors, such as increases in availability created by new or improved extraction, refining and processing equipment and methods or decreases caused by failure or unavailability of major refining and processing equipment (for example, shutting down or constructing oil refineries), also materially influence the supply of commodities. |
| • | Significant increases or decreases in the demand for a physical commodity due to natural or technological factors. Natural factors would include such events as unusual climatological conditions impacting the demand for energy commodities. Technological factors may include such developments as substitutes for energy or other industrial commodities. |
| • | A significant increase or decrease in commodity hedging activity by commodity producers. Should there be an increase or decrease in the level of hedge activity of commodity producing companies, countries and/or organizations, it could cause a change in world prices of any given commodity, causing the price of Shares based upon a benchmark related to that commodity to be affected. |
| • | A significant change in the attitude of speculators and investors towards a commodity. Should the speculative community take a negative or positive view towards any given commodity, it could cause a change in world prices of any given commodity, the price of Shares based upon a benchmark related to that commodity will be affected. |
The impact of changes in the price of a physical commodity will affect investors differently depending upon the Fund in which investors invest. Daily increases in the price of an underlying commodity will negatively impact the daily performance of Shares of an UltraShort Fund and daily decreases in the price of an underlying commodity will negatively impact the daily performance of Shares of an Ultra Fund. For information regarding how the volatility of an index can have a negative effect on performance over time, see “—Price volatility, which is exacerbated by the use of leverage, may possibly cause the total loss of an investor’s investment and may adversely impact performance over periods longer than one day.”
With regard to the Currency Funds, several factors may affect the value of the foreign currencies or the U.S. Dollar, and in turn, the swap agreements, futures contracts, forward contracts thereof and other assets, if any, owned by a Fund, including, but not limited to:
| • | Debt level and trade deficit of the relevant foreign countries; |
| • | Inflation rates of the United States and the relevant foreign countries and investors’ expectations concerning inflation rates; |
| • | Interest rates of the United States and the relevant foreign countries and investors’ expectations concerning interest rates; |
| • | Investment and trading activities of mutual funds, hedge funds and currency funds; |
| • | Global or regional political, economic or financial events and situations; and |
| • | Sovereign action to set or restrict currency conversion. |
The impact of changes in the price of a currency will affect investors differently depending upon the Fund in which investors invest. Daily increases in the price of a currency will negatively impact the daily performance of Shares of an UltraShort Fund and daily decreases in the price of a currency will negatively impact the daily performance of Shares of an Ultra Fund. For information regarding how the volatility of an index can have a negative effect on performance over time, see “—Price volatility, which is exacerbated by the use of leverage, may possibly cause the total loss of an investor’s investment and may adversely impact performance over periods longer than one day.”
28
Table of Contents
The NAV may not always correspond to market price and, as a result, investors may be adversely affected by the creation or redemption of Creation Units at a value that differs from the market price of the Shares.
The NAV per share of the Shares of a Fund changes as fluctuations occur in the market value of the Fund’s portfolio. Investors should be aware that the public trading price of a number of Shares of a Fund otherwise amounting to a Creation Unit may be different from the NAV of an actual Creation Unit (i.e., 50,000 individual Shares may trade at a premium over, or a discount to, NAV of a Creation Unit of Shares) and similarly the public trading price per Share of the Fund may be different from the NAV per Share of the Fund. Consequently, an Authorized Participant may be able to create or redeem a Creation Unit of Shares of a Fund at a discount or a premium to the public trading price per Share of the Fund. This price difference may be due, in large part, to the fact that supply and demand forces at work in the secondary trading market for Shares of a Fund are closely related, but not identical, to the same forces influencing the price of an underlying commodity at any point in time. Investors also should note that the size of each Fund in terms of total assets held may change substantially over time and from time-to-time as Creation Units are created and redeemed.
Authorized Participants or their clients or customers may have an opportunity to realize a riskless profit if they can purchase a Creation Unit at a discount to the public trading price of the Shares of a Fund or can redeem a Creation Unit at a premium over the public trading price of the Shares of the Fund. The Sponsor expects that the exploitation of such arbitrage opportunities by Authorized Participants and their clients and customers will tend to cause the public trading price to track NAV per Share of the Funds closely over time.
The value of a Share of a Fund may be influenced by nonconcurrent trading hours between the NYSE Arca and the exchange on which the futures contracts or commodities underlying the applicable benchmark are traded. While the Shares of each Fund trade on the NYSE Arca from 9:30 A.M. to 4:00 P.M. (Eastern Time), the futures contracts or commodities underlying a benchmark may be traded during different time frames. Consequently, liquidity in the futures contracts or commodities underlying the applicable benchmark will be reduced after the close of trading at the applicable commodities exchange. As a result, during the time when the NYSE Arca is open and the applicable commodities exchange is closed, trading spreads and the resulting premium or discount on the Shares of a Fund may widen, and, therefore, increase the difference between the price of the Shares of a Fund and the NAV of such Shares.
Using leverage and/or short positions should be considered to be speculative and could result in the total loss of an investor’s investment.
The Funds use leveraged investment techniques in seeking to achieve their respective investment objectives. Leverage should cause a Fund to lose more money in market environments adverse to its daily investment objectives than a Fund that does not employ leverage, which could result in the total loss of an investor’s investment.
Because the Ultra and UltraShort Funds include a 200% multiplier, a one-day price movement of 50% or more in a relevant benchmark could result in the total loss of an investor’s investment if that price movement is contrary to the investment objective of the Fund in which an investor has invested. This would be the case with downward one-day price movements in an Ultra Fund, even though the underlying benchmark would always have a value greater than zero. In addition to the leveraged risk in which a one-day 50% upward move in a benchmark underlying an UltraShort Fund would result in the total loss of an investor’s investment, a benchmark could, in theory, rise infinitely in a one-day period, so a bearish swap agreement or short position in related futures or forward contracts would expose an UltraShort Fund to theoretically unlimited liability.
Because liability due to losses will be segregated in each Fund, losses to investors in one Fund will not subject investors in any other fund to such losses.
29
Table of Contents
Fewer representative commodities may result in greater benchmark volatility, which could adversely affect an investment in the Shares.
Each of the benchmark indices for the Commodity Index Funds is concentrated in terms of the number of commodities represented, and some of the sub-indices are highly concentrated in a single commodity. The Commodity Funds and the Currency Funds are concentrated solely on their single benchmark physical commodity or currency. Investors should be aware that other commodities benchmarks are more diversified in terms of both the number and variety of commodities included. Concentration in fewer commodities may result in a greater degree of volatility in a benchmark and the NAV of the Fund which tracks a benchmark under specific market conditions and over time.
Failure of the commodity or the currency markets, as the case may be, to exhibit low to negative correlation to general financial markets will reduce benefits of diversification and may exacerbate losses to an investor’s portfolio.
Historically, returns of the commodity or currency markets, as the case may be, have tended to exhibit low to negative correlation with the returns of other assets such as stocks and bonds. Although commodity or currency futures trading can provide a diversification benefit to investor portfolios because of its low to negative correlation with other financial assets, the fact that a benchmark is not 100% negatively correlated with financial assets such as stocks and bonds means that each respective Fund cannot be expected to be automatically profitable during unfavorable periods for the stock or bond market, or vice versa. If the Shares perform in a manner that correlates with the general financial markets or do not perform successfully, investors will obtain no diversification benefits by investing in the Shares and the Shares may produce no gains to offset their losses from other investments. Furthermore, there is no historical data regarding the correlation of daily rebalanced leveraged and short investments in commodities and/or currencies to other asset classes.
Trading on commodity exchanges outside the United States is not subject to U.S. regulation and may result in different or diminished investor protections.
Some of the Funds’ trading may be conducted on commodity exchanges outside the United States. Trading on such exchanges is not regulated by any United States governmental agency and may involve certain risks not applicable to trading on United States exchanges, including different or diminished investor protections. In trading contracts denominated in currencies other than U.S. Dollars, the Shares are subject to the risk of adverse exchange rate movements between the dollar and the functional currencies of such contracts. Investors could incur substantial losses from trading on foreign exchanges which such investors would not have otherwise been subject had the Funds’ trading been limited to U.S. markets.
An investment in the Shares may be adversely affected by competition from other methods of investing in commodities or currencies.
A Fund constitutes a new, and thus untested, type of investment vehicle. A Fund competes with other financial vehicles, including other commodity or currency pools, as the case may be, hedge funds, traditional debt and equity securities issued by companies in the commodities or currency industry, other securities backed by or linked to such commodities or currency, and direct investments in the underlying commodities or currency or commodity or currency futures contracts. Market and financial conditions, and other conditions beyond the Sponsor’s control, may make it more attractive to invest in other financial vehicles or to invest in such commodities or currencies directly, which could limit the market for the Shares and reduce the liquidity of the Shares.
30
Table of Contents
The presence of “contango” in the market prices of benchmark commodity future contracts will generally adversely affect the value of Ultra Funds, and the presence of “backwardation” in the market prices of benchmark commodity future contracts will generally adversely affect the value of UltraShort Funds.
In Funds that hold futures contracts, as the futures contracts near expiration, they are generally replaced by contracts that have a later expiration. Thus, for example, a contract purchased and held in August 2010 may specify an October 2010 expiration. For an Ultra Fund, as that contract nears expiration, it may be replaced by selling the October 2010 contract and purchasing the contract expiring in December 2010. This process is referred to as “rolling”. Rolling may have a positive or negative impact on performance. For example, historically, the prices of crude oil have frequently been higher for contracts with shorter-term expirations than for contracts with longer-term expirations, which is referred to as “backwardation.” In these circumstances, absent other factors, the sale of the October 2010 contract would take place at a price that is higher than the price at which the December 2010 contract is purchased, thereby creating a gain in connection with rolling. While crude oil has historically exhibited consistent periods of backwardation, backwardation will likely not exist in these markets at all times. The presence of contango (rather than backwardation) in crude oil at the time of rolling would be expected to adversely affect the Dow Jones—UBS Crude Oil Sub IndexSM and thus would adversely affect the value of ProShares Ultra DJ-UBS Crude Oil, which tracks daily changes in the value of the Dow Jones—UBS Crude Oil Sub IndexSM, and positively affect the value of ProShares UltraShort DJ-UBS Crude Oil which tracks daily changes in the value of the Dow Jones—UBS Crude Oil Sub IndexSM. Similarly, the presence of contango in any other relevant benchmarks and related futures contracts of a given Ultra Fund would adversely affect the value of that Ultra Fund and positively affect the value of an UltraShort Fund.
Conversely, gold and silver historically exhibit persistent “contango” markets rather than backwardation. Contango markets are those in which the prices of contracts are higher in the distant delivery months than in the nearer delivery months due to the costs of long-term storage of a physical commodity prior to delivery or other factors. The presence of backwardation (rather than contango) at the time of rolling in relevant benchmarks of a given UltraShort Fund would be expected to adversely affect the value of that UltraShort Fund which tracks daily changes in the value of the relevant benchmark and positively affect the value of that Ultra Fund which tracks daily changes in the value of the relevant benchmark.
Funds that are designed to track a multiple or inverse multiple of the daily performance of gold or silver bullion (ProShares Ultra Gold, ProShares UltraShort Gold, ProShares Ultra Silver and ProShares UltraShort Silver) do not invest in bullion itself as certain other exchange traded products do. Rather the Funds use Financial Instruments to gain exposure to these precious metals. Not investing directly in bullion may introduce additional tracking error and these Funds are subject to the effects of contango and backwardation described above.
Using Financial Instruments such as forwards and futures in an effort to replicate the performance of gold and silver bullion may introduce tracking error to the performance of the Funds. The primary cause of tracking error resulting from not investing directly in bullion is expected to be caused by the need to roll futures or forward contracts as described above and the resulting possibility that contango or backwardation can occur. Gold and silver historically exhibit contango markets during most periods. The existence of historically prevalent contango markets would be expected to adversely affect the Ultra Funds. Alternatively, the existence of backwardated markets in either silver or gold would have an adverse impact on the UltraShort Funds.
The Funds are subject to counterparty risks, credit risks and other risks associated with swap agreements and forward contracts, which could result in significant losses to the Funds.
Some of the Funds use swap agreements and/or forward contracts as a means to achieve their investment objective. These investment vehicles are typically traded on a principal-to-principal basis through dealer markets that are dominated by major money center and investment banks and other institutions and are essentially
31
Table of Contents
unregulated by the CFTC. Investors, therefore, do not receive the protection of CFTC regulation or the statutory scheme of the CEA in connection with each Fund’s swap agreements or forward contracts. The markets rely upon the integrity of market participants in lieu of the additional regulation imposed by the CFTC on participants in the futures markets. The lack of regulation in these markets could expose investors to significant losses under certain circumstances including in the event of trading abuses or financial failure by participants.
Unlike in futures contracts, the counterparty to swap agreements or forward contracts is generally a single bank or other financial institution, rather than a clearing organization backed by a group of financial institutions. As a result, a Fund is subject to credit risk with respect to the amount it expects to receive from counterparties to Financial Instruments entered into as part of that Fund’s principal investment strategy. If a counterparty becomes bankrupt or otherwise fails to perform its obligations due to financial difficulties, a Fund could suffer significant losses on these contracts and the value of an investor’s investment in a Fund may decline.
A Fund may experience significant delays in obtaining any recovery in a bankruptcy or other reorganization proceeding from a counterparty and a Fund may obtain only limited recovery or may obtain no recovery in such circumstances. The Funds typically enter into transactions with counterparties whose credit rating is investment grade, as determined by a nationally recognized statistical rating organization, or, if unrated, judged by the Sponsor to be of comparable quality.
Swaps or forward contracts have terms that make them less marketable than futures contracts. Swaps or forward contracts are less marketable because they are not traded on an exchange, do not have uniform terms and conditions, and are entered into based upon the creditworthiness of the parties and the availability of credit support, such as collateral, and in general, are not transferable without the consent of the counterparty.
Each Fund seeks to track a multiple or inverse multiple of a benchmark on a daily basis at all times even during periods in which the applicable benchmark is flat as well as when a benchmark is moving in a manner which causes a Fund’s NAV to decline, thereby causing losses to such Fund.
The Funds are not actively managed by traditional methods, which typically involve effecting changes in the composition of a portfolio on the basis of judgments relating to economic, financial and market considerations with a view toward obtaining positive results under all market conditions. Rather, the Sponsor seeks to cause the NAV to track, on a daily basis, a benchmark or in the case of the Ultra Funds or the UltraShort Funds a multiple of a Fund’s benchmark at all times, even during periods in which a benchmark is flat or moving in a manner which causes the NAV of the Funds to decline. It is possible to lose money over time when an underlying benchmark is up (down) for the corresponding Ultra (UltraShort) Fund due to the effects of daily rebalancing, volatility and compounding.
Investors who only invest in any one of an Ultra Fund or an UltraShort Fund may not be able to profit if the market value of the underlying benchmark moves against such investment.
An Ultra Fund is expected to rise as a result of any daily upward price movement in its underlying benchmark. An UltraShort Fund is expected to rise as a result of any daily downward price movement in a benchmark.
If the price of a relevant benchmark decreases on a given day, the corresponding UltraShort Fund should generally profit and the Ultra Fund should generally suffer a loss. If the price of a relevant benchmark increases on a given day, the corresponding Ultra Fund should generally profit and the UltraShort Fund should generally suffer a loss. Therefore, the investment experience of investors who plan to invest in any one of the Funds will depend upon selection of the appropriate Fund in light of the price movements of the underlying benchmark. Such selection may become unprofitable in the future if the price of the benchmark changes direction or may even become unprofitable over time regardless of index direction.
32
Table of Contents
Certain investors who decide to invest in any combination of the Ultra Fund Shares or UltraShort Fund Shares relating to the same underlying benchmark may, nevertheless, suffer losses if the investor’s investment mix between the Ultra Fund Shares and the UltraShort Fund Shares is biased in one direction and the market price of the relevant benchmark moves in the opposite direction.
A Fund’s exposure to the commodities or currencies markets may subject the Fund to greater volatility than investments in traditional securities, which may adversely affect an investor’s investment in that Fund.
A Fund’s exposure to the commodities or currencies markets may subject the Fund to greater volatility than investments in traditional securities. The value of commodity-linked Financial Instruments or currency-linked Financial Instruments may be affected by changes in overall market movements, commodity or currency benchmark, as the case may be, volatility, changes in interest rates, or factors affecting a particular industry, commodity or currency, such as drought, floods, fires, weather, livestock disease, pipeline ruptures or spills, embargoes, tariffs and international economic political and regulatory developments.
Fees are charged regardless of profitability and may result in depletion of assets.
Each Fund indirectly is subject to the fees and expenses described herein which are payable irrespective of profitability. Such fees and expenses include asset-based fees of 0.95% per annum of each Fund’s average daily NAV. Additional charges may include other fees as applicable. The Index will reflect the performance of its underlying commodities, including roll costs, without regard to income earned on cash positions.
Possible illiquid markets may exacerbate losses.
Swap agreements and forward contracts may entail breakage costs if terminated prior to the final maturity date and futures positions cannot always be liquidated at the desired price. It is difficult to execute a trade at a specific price when there is a relatively small volume of buy and sell orders in a market. A market disruption, such as when governments may take or be subject to political actions which disrupt the markets in their major commodities exports and imports, can also make it difficult to liquidate a position or find a swap or forward contract counterparty at a reasonable cost.
There can be no assurance that market illiquidity will not cause losses for the Funds. The large size of the positions which the Funds may acquire increases the risk of illiquidity by both making their positions more difficult to liquidate and increasing the losses incurred while trying to do so. Any type of disruption or illiquidity will be exacerbated due to the fact that the Funds only invest in Financial Instruments related to one commodity.
Competing claims of intellectual property rights may adversely affect the Funds and an investment in the Shares.
Parties throughout the financial industry could be granted patent applications that would limit the use of methods and systems for creating and administering interests in commodity and currency pools, as well as other elements of the Trust’s exchange-traded funds structure, any or all of which could impede the Funds from achieving their investment objectives.
Although the Sponsor does not anticipate that such filings will adversely impact the Funds, it is impossible to provide definite assurances that no such negative impact will occur. Further, it is not possible to predict whether a patent will issue at all, nor, if a patent is issued, what subject matter it will cover. The Sponsor believes that it has properly licensed or obtained the appropriate consent of all necessary parties with respect to intellectual property rights. However, other third parties may allege ownership as to such rights and may bring an action in asserting their claims. To the extent any action is brought by a third party asserting such rights, the expenses in litigating, negotiating, cross-licensing or otherwise settling such claims may adversely affect the Funds.
33
Table of Contents
Investors may be adversely affected by an overstatement or understatement of the NAV calculation of a Fund due to the valuation method employed on the date of NAV calculation.
Calculating the NAV of each Fund includes, in part, any unrealized profits or losses on open swap agreements, futures or forward contracts. Under normal circumstances, the NAV of each Fund reflects the value of its corresponding benchmark and, if applicable, the price of futures contracts held by the Fund, as of the time the NAV is being calculated. However, if a futures contract traded on an exchange could not be purchased or sold on a day when a Fund is accepting creation and redemption orders (due to the operation of daily limits or other rules of the exchange or otherwise), a Fund may be improperly exposed which could cause it to fail to meet its stated investment objective. Alternatively, the Fund may attempt to calculate the fair value of such instruments. In such a situation, there is a risk that the calculation of the relevant benchmark, and therefore, the NAV of the applicable Fund on such day, may not accurately reflect the realizable market value of the futures contracts underlying such benchmark.
Risks Related to the Funds’ Shares
The lack of active trading markets for the Shares of a Fund may result in losses on investors’ investments at the time of disposition of his, her, or its Shares.
Although the Shares of each Fund are listed and traded on the NYSE Arca, there can be no guarantee that an active trading market for the Shares of any Fund will develop or be maintained. If investors need to sell their Shares at a time when no active market for them exists, the price investors receive for their Shares, assuming that investors are able to sell them, likely will be lower than the price that investors would receive if an active market did exist.
The Shares of each Fund are new securities products and their value could decrease if unanticipated operational or trading problems arise.
The mechanisms and procedures governing the creation, redemption and offering of the Shares have been developed specifically for these securities products. Consequently, there may be unanticipated problems or issues with respect to the mechanics of the operations of the Funds and the trading of the Shares that could have a material adverse effect on an investment in the Shares. In addition, although the Funds are not actively “managed” by traditional methods, to the extent that unanticipated operational or trading problems or issues arise, the Sponsor’s past experience and qualifications may not be suitable for solving these problems or issues.
The liquidity of the Shares may also be affected by the withdrawal from participation of Authorized Participants, which could adversely affect the market price of the Shares.
In the event that one or more Authorized Participants which have substantial interests in the Shares withdraw from participation, the liquidity of the Shares will likely decrease, which could adversely affect the market price of the Shares and result in investors incurring a loss on their investment.
Shareholders that are not Authorized Participants may only purchase or sell their Shares in secondary trading markets, and the conditions associated with trading in secondary markets may adversely affect investors’ investment in the Shares.
Only Authorized Participants may create or redeem Creation Units. All other investors that desire to purchase or sell Shares must do so through the NYSE Arca or in other markets, if any, in which the Shares may be traded.
34
Table of Contents
NYSE Arca may halt trading in the Shares of a Fund which would adversely impact investors’ ability to sell Shares.
Trading in Shares of a Fund may be halted due to market conditions or, in light of NYSE Arca rules and procedures, for reasons that, in the view of the NYSE Arca, make trading in Shares of a Fund inadvisable. In addition, trading is subject to trading halts caused by extraordinary market volatility pursuant to “circuit breaker” rules that require trading to be halted for a specified period based on a specified market decline. There can be no assurance that the requirements necessary to maintain the listing of the Shares of a Fund will continue to be met or will remain unchanged. A Fund will be terminated if the Shares are delisted.
Shareholders do not have the protections associated with ownership of shares in an investment company registered under the 1940 Act.
None of the Funds are either registered as an investment company under the 1940 Act or required to register under such Act. Consequently, shareholders do not have the regulatory protections provided to investors in investment companies and regulated investment companies.
Shareholders do not have the rights enjoyed by investors in certain other vehicles and may be adversely affected by a lack of statutory rights and by limited voting and distribution rights.
The Shares have limited voting and distribution rights (for example, shareholders do not have the right to elect directors and the Funds are not required to pay regular distributions, although the Funds may pay distributions at the discretion of the Sponsor).
The value of the Shares will be adversely affected if the Funds are required to indemnify the Trustee or the Sponsor.
Under the Trust Agreement, the Trustee and the Sponsor have the right to be indemnified for any liability or expense incurred without gross negligence or willful misconduct. That means the Sponsor may require the assets of a Fund to be sold in order to cover losses or liability suffered by it or by the Trustee. Any sale of that kind would reduce the NAV of one or more Funds.
Although the Shares of each Fund are limited liability investments, certain circumstances such as bankruptcy of a Fund or indemnification of a Fund by the shareholder will increase a shareholder’s liability.
The Shares of each Fund are limited liability investments; investors may not lose more than the amount that they invest plus any profits recognized on their investment. However, shareholders could be required, as a matter of bankruptcy law, to return to the estate of a Fund any distribution they received at a time when such Fund was in fact insolvent or in violation of its Trust Agreement.
A court could potentially conclude that the assets and liabilities of one Fund are not segregated from those of another Fund and thereby potentially exposing assets in one Fund to the liabilities of another Fund.
Each Fund is a separate series of a Delaware statutory trust and not itself a separate legal entity. Section 3804(a) of the Delaware Statutory Trust Act provides that if certain provisions are in the formation and governing documents of a statutory trust organized in series and if separate and distinct records are maintained for any series and the assets associated with that series are held in separate and distinct records (directly or indirectly, including through a nominee or otherwise) and accounted for in such separate and distinct records separately from the other assets of the statutory trust, or any series thereof, then the debts, liabilities, obligations and expenses incurred, contracted for or otherwise existing with respect to a particular series are enforceable against the assets of such series only, and not against the assets of the statutory trust generally or any other series thereof and none of the debts, liabilities, obligations and expenses incurred, contracted for or otherwise existing
35
Table of Contents
with respect to the statutory trust generally or any other series thereof shall be enforceable against the assets of such series. The Sponsor is not aware of any court case that has interpreted Section 3804(a) or provided any guidance as to what is required for compliance. The Sponsor maintains separate and distinct records for each Fund and accounts for them separately but it is possible a court could conclude that the methods used did not satisfy Section 3804(a) of the Delaware Statutory Trust Act and thus potentially expose assets in one Fund to the liabilities of another Fund.
With respect to the Currency Funds, substantial purchases or sales of a foreign currency by the official sector of the relevant foreign country could adversely affect an investment in the Shares.
The official sector consists of central banks, other governmental agencies and multi-lateral institutions that buy, sell and hold foreign currencies as part of their reserve assets. The official sector holds a significant amount of foreign currencies that can be mobilized in the open market. In the event that future economic, political or social conditions or pressures require members of the official sector to buy or sell their currency simultaneously or in an uncoordinated manner, the demand for the foreign currency might not be sufficient to accommodate the sudden change in the supply of the foreign currency to the market. Consequently, the price of the foreign currency could decline, which would adversely affect an investment in the corresponding Ultra ProShares, or increase, which would adversely affect an investment in the corresponding UltraShort ProShares.
Shareholders of each Fund are subject to taxation on their share of the Fund’s taxable income, whether or not they receive cash distributions.
Shareholders of each Fund are subject to United States federal income taxation and, in some cases, state, local, or foreign income taxation on their share of the Fund’s taxable income, whether or not they receive cash distributions from the Fund. Shareholders of a Fund may not receive cash distributions equal to their share of the Fund’s taxable income or even the tax liability that results from such income.
Investors could be adversely affected if items of income, gain, deduction, loss and credit with respect to Shares of a Fund are reallocated in the event that the Internal Revenue Service (“IRS”) does not accept the assumptions or conventions used by the Fund in allocating Fund tax items.
U.S. federal income tax rules applicable to partnerships are complex and often difficult to apply to publicly traded partnerships. Each Fund applies certain assumptions and conventions in an attempt to comply with applicable rules and to report income, gain, deduction, loss and credit to shareholders of a Fund in a manner that reflects shareholders’ beneficial shares of partnership items, but these assumptions and conventions may not be in compliance with all aspects of applicable tax requirements. It is possible that the IRS will successfully assert that the conventions and assumptions used by a Fund do not satisfy the technical requirements of the Code and/or Treasury regulations and could require that items of income, gain, deduction, loss or credit be adjusted or reallocated in a manner that adversely affects investors.
Investors could be adversely affected if the current treatment of long-term capital gains under current U.S. federal income tax law is changed or repealed in the future.
Under current law, long-term capital gains are taxed to non-corporate investors at a maximum United States federal income tax rate of 15%. This tax treatment may be adversely affected, changed or repealed by future changes in tax laws at any time and is currently scheduled to expire for tax years beginning after December 31, 2010.
PROSPECTIVE INVESTORS ARE STRONGLY URGED TO CONSULT THEIR OWN TAX ADVISERS AND COUNSEL WITH RESPECT TO THE POSSIBLE TAX CONSEQUENCES TO THEM OF AN INVESTMENT IN THE SHARES OF A FUND; SUCH TAX CONSEQUENCES MAY DIFFER IN RESPECT OF DIFFERENT INVESTORS.
36
Table of Contents
Risks Related to Regulatory Requirements and Potential Legislative Changes
The Funds are subject to regulatory risk associated with futures contracts that could adversely affect the Funds’ operations and profitability and cause conflicts of interest.
The CFTC and the U.S. commodities exchanges have established limits referred to as “speculative position limits” on the maximum net long or short speculative futures positions that any person may hold or control in derivatives traded on U.S. commodities exchanges. All accounts owned or managed by the commodity trading advisers, their principals and their affiliates will be combined for position limit purposes. Because futures position limits allow a commodity trading advisor and its principals to control only a limited number of contracts in any one commodity, the Sponsor and its principals are potentially subject to a conflict among the interests of all accounts the Sponsor and its principals control which are competing for shares of that limited number of contracts. Although the Sponsor may be able to achieve the same performance results with OTC substitutes for futures contracts, the OTC market may be subject to differing prices, lesser liquidity and greater counterparty credit risks than the regulated U.S. commodities exchanges. The Sponsor may in the future reduce the size of positions that would otherwise be taken for a Fund or not trade in certain markets on behalf of the Funds in order to avoid exceeding such limits. Modification of trades that would otherwise be made by a Fund, if required, could adversely affect the Fund’s operations and profitability. A violation of speculative position limits by the Sponsor could lead to regulatory action materially adverse to a Fund’s prospects for profitability.
The CFTC has proposed and invited public comment regarding a new rule to implement speculative position limits for futures and options contracts in certain energy commodities, such position limits may apply to traders engaged in trading that is neither for bona fide hedging nor swap dealer risk management purposes. Depending on the outcome of this and any future CFTC rulemaking, the rules concerning position limits may be amended in a manner that is either detrimental or favorable to the Funds. For example, if the amended rules are detrimental to a Fund, the Fund’s ability to issue new Creation Units or to reinvest income in additional commodity futures contracts may be limited to the extent these activities would cause the Fund to exceed the applicable position limits. Limiting the size of the Fund may affect the correlation between the price of the Shares, as traded on the NYSE Arca, and the NAV of the Fund. That is, the inability to create additional Creation Units could result in Shares in the Fund trading at a premium or discount to NAV of the Fund.
In addition, it is possible that the CFTC may propose new rules that would consider futures contracts underlying OTC transactions in calculating position limits. Such a change could alter, perhaps to a material extent, the nature of an investment in the Funds or the ability of the Funds to continue to implement their investment strategies.
Failure of FCMs to segregate assets may increase losses in the Funds.
The CEA requires a clearing broker to segregate all funds received from customers from such broker’s proprietary assets. There is a risk that assets deposited by the Sponsor on behalf of each Fund as margin with the FCM may, in certain circumstances, be used to satisfy losses of other clients of the FCM which cannot be satisfied by such other clients or by the FCM. If the FCM fails to segregate the funds received from the Sponsor, the assets of the Funds might not be fully protected in the event of the FCM’s bankruptcy. Furthermore, in the event of the FCM’s bankruptcy, any Fund Shares could be limited to recovering only a pro rata share of all available funds segregated on behalf of the FCM’s combined customer accounts, even though certain property specifically traceable to a particular Fund was held by the FCM. The FCM may, from time-to-time, have been the subject of certain regulatory and private causes of action.
In the event of a bankruptcy or insolvency of any exchange or a clearing house, a Fund could experience a loss of the funds deposited through its FCM as margin with the exchange or clearing house, a loss of any profits on its open positions on the exchange, and the loss of unrealized profits on its closed positions on the exchange.
37
Table of Contents
Regulatory changes or actions may alter the operations and profitability of the Funds.
Considerable regulatory attention has been focused on non-traditional investment pools which are publicly distributed in the United States. There is a possibility of future regulatory changes altering, perhaps to a material extent, the nature of an investment in the Funds or the ability of the Funds to continue to implement their investment strategies.
The futures markets are subject to comprehensive statutes, regulations, and margin requirements. In addition, the CFTC and the exchanges are authorized to take extraordinary actions in the event of a market emergency, including, for example, the retroactive implementation of speculative position limits or higher margin requirements, the establishment of daily price limits and the suspension of trading. The regulation of swaps and futures transactions in the United States is a rapidly changing area of law and is subject to modification by government and judicial action. The effect of any future regulatory change on the Funds is impossible to predict, but could be substantial and adverse.
Legislative changes have been proposed that could make it more difficult, if not impossible, for the Funds to operate.
Restrictive proposals aimed at financial speculators in commodities have from time to time been made in the U.S. House of Representatives and the Senate. The aims of such proposals are generally stated to be to curb excessive speculation and increase transparency and accountability in the commodities markets, including the oil and gas markets. For example, previous proposals would prohibit private and public pension funds with more than $500 million in assets from investing in agricultural and energy commodities traded on a U.S. futures exchange, foreign exchange or OTC, would direct the CFTC to establish total limits on the share of the commodity market held by financial investors and/or would direct the CFTC to impose speculative-position limits on any stakes not related to real hedging activities. The various bills and proposals could result in establishment of speculative position limits for trading that does not involve physical delivery of a commodity, regulation of speculation via unregulated foreign exchanges, and enhanced recordkeeping and information collection requirements. If proposals such as these were to be enacted into law as previously proposed, it could negatively impact the ability of investors to invest in the Funds and, consequently, for the Sponsor to manage the Funds.
| Item 1B. | Unresolved Staff Comments. |
None.
| Item 2. | Properties. |
Not applicable.
| Item 3. | Legal Proceedings. |
As of the date of this annual report, there is no material pending legal proceeding to which the Trust or any Fund is a claimant or defendant or which any of their property is subject.
| Item 4. | Submission of Matters to a Vote of Security Holders. |
Reserved.
38
Table of Contents
| Item 5. | Market for Registrant’s Common Equity, Related Stockholder Matters and Issuer Purchases of Equity Securities. |
| a) | Eight of the Funds, ProShares Ultra DJ-UBS Commodity, ProShares UltraShort DJ-UBS Commodity, ProShares Ultra DJ-UBS Crude Oil, ProShares UltraShort DJ-UBS Crude Oil, ProShares Ultra Euro, ProShares UltraShort Euro, ProShares Ultra Yen and ProShares UltraShort Yen, commenced trading on the NYSE Arca on November 25, 2008. The remaining four Funds, ProShares Ultra Silver, ProShares UltraShort Silver, ProShares Ultra Gold and ProShares UltraShort Gold, commenced trading on the NYSE Arca on December 3, 2008. The following tables set forth the ranges of reported high and low sales prices of each Fund’s Shares as reported on the NYSE Arca for the periods indicated below. |
Fiscal Year 2009
| Fund |
High | Low | ||||
| ProShares Ultra DJ-UBS Commodity |
||||||
| First Quarter |
$ | 25.02 | $ | 16.35 | ||
| Second Quarter |
26.44 | 17.56 | ||||
| Third Quarter |
26.63 | 19.27 | ||||
| Fourth Quarter |
28.78 | 22.56 | ||||
| ProShares UltraShort DJ-UBS Commodity |
||||||
| First Quarter |
$ | 33.83 | $ | 23.83 | ||
| Second Quarter |
28.99 | 18.39 | ||||
| Third Quarter |
24.64 | 16.44 | ||||
| Fourth Quarter |
19.44 | 14.31 | ||||
| ProShares Ultra DJ-UBS Crude Oil |
||||||
| First Quarter |
$ | 18.65 | $ | 5.77 | ||
| Second Quarter |
14.60 | 6.80 | ||||
| Third Quarter |
13.75 | 9.11 | ||||
| Fourth Quarter |
15.00 | 10.51 | ||||
| ProShares UltraShort DJ-UBS Crude Oil |
||||||
| First Quarter |
$ | 59.76 | $ | 22.54 | ||
| Second Quarter |
36.17 | 15.51 | ||||
| Third Quarter |
23.75 | 15.23 | ||||
| Fourth Quarter |
17.76 | 12.25 | ||||
| ProShares Ultra Gold |
||||||
| First Quarter |
$ | 40.63 | $ | 26.17 | ||
| Second Quarter |
37.80 | 29.28 | ||||
| Third Quarter |
39.60 | 31.54 | ||||
| Fourth Quarter |
55.75 | 37.71 | ||||
| ProShares UltraShort Gold |
||||||
| First Quarter |
$ | 22.62 | $ | 14.00 | ||
| Second Quarter |
18.09 | 13.63 | ||||
| Third Quarter |
16.03 | 12.38 | ||||
| Fourth Quarter |
12.94 | 8.45 | ||||
| ProShares Ultra Silver |
||||||
| First Quarter |
$ | 50.85 | $ | 25.85 | ||
| Second Quarter |
57.32 | 32.01 | ||||
| Third Quarter |
64.10 | 33.86 | ||||
| Fourth Quarter |
75.57 | 52.92 | ||||
39
Table of Contents
| Fund |
High | Low | ||||
| ProShares UltraShort Silver |
||||||
| First Quarter |
$ | 20.69 | $ | 9.82 | ||
| Second Quarter |
13.81 | 7.04 | ||||
| Third Quarter |
10.98 | 4.94 | ||||
| Fourth Quarter |
5.83 | 3.66 | ||||
| ProShares Ultra Euro |
||||||
| First Quarter |
$ | 30.76 | $ | 23.39 | ||
| Second Quarter |
30.55 | 24.73 | ||||
| Third Quarter |
32.35 | 28.37 | ||||
| Fourth Quarter |
34.39 | 29.76 | ||||
| ProShares UltraShort Euro |
||||||
| First Quarter |
$ | 25.80 | $ | 19.93 | ||
| Second Quarter |
23.79 | 19.06 | ||||
| Third Quarter |
20.35 | 17.55 | ||||
| Fourth Quarter |
20.18 | 16.20 | ||||
| ProShares Ultra Yen |
||||||
| First Quarter |
$ | 30.74 | $ | 23.46 | ||
| Second Quarter |
26.38 | 22.66 | ||||
| Third Quarter |
28.62 | 23.51 | ||||
| Fourth Quarter |
33.94 | 26.41 | ||||
| ProShares UltraShort Yen |
||||||
| First Quarter |
$ | 25.68 | $ | 19.87 | ||
| Second Quarter |
26.33 | 22.52 | ||||
| Third Quarter |
24.05 | 19.95 | ||||
| Fourth Quarter |
22.40 | 18.40 | ||||
Fiscal Year 2008
| Fund |
High | Low | ||||
| ProShares Ultra DJ-UBS Commodity |
||||||
| First Quarter |
— | — | ||||
| Second Quarter |
— | — | ||||
| Third Quarter |
— | — | ||||
| Fourth Quarter |
$ | 25.45 | $ | 18.39 | ||
| ProShares UltraShort DJ-UBS Commodity |
||||||
| First Quarter |
— | — | ||||
| Second Quarter |
— | — | ||||
| Third Quarter |
— | — | ||||
| Fourth Quarter |
$ | 33.38 | $ | 24.62 | ||
| ProShares Ultra DJ-UBS Crude Oil |
||||||
| First Quarter |
— | — | ||||
| Second Quarter |
— | — | ||||
| Third Quarter |
— | — | ||||
| Fourth Quarter |
$ | 27.04 | $ | 9.75 | ||
| ProShares UltraShort DJ-UBS Crude Oil |
||||||
| First Quarter |
— | — | ||||
| Second Quarter |
— | — | ||||
| Third Quarter |
— | — | ||||
| Fourth Quarter |
$ | 49.98 | $ | 23.91 | ||
40
Table of Contents
| Fund |
High | Low | ||||
| ProShares Ultra Gold |
||||||
| First Quarter |
— | — | ||||
| Second Quarter |
— | — | ||||
| Third Quarter |
— | — | ||||
| Fourth Quarter |
$ | 36.10 | $ | 22.86 | ||
| ProShares UltraShort Gold |
||||||
| First Quarter |
— | — | ||||
| Second Quarter |
— | — | ||||
| Third Quarter |
— | — | ||||
| Fourth Quarter |
$ | 27.22 | $ | 17.86 | ||
| ProShares Ultra Silver |
||||||
| First Quarter |
— | — | ||||
| Second Quarter |
— | — | ||||
| Third Quarter |
— | — | ||||
| Fourth Quarter |
$ | 33.74 | $ | 21.60 | ||
| ProShares UltraShort Silver |
||||||
| First Quarter |
— | — | ||||
| Second Quarter |
— | — | ||||
| Third Quarter |
— | — | ||||
| Fourth Quarter |
$ | 29.97 | $ | 17.38 | ||
| ProShares Ultra Euro |
||||||
| First Quarter |
— | — | ||||
| Second Quarter |
— | — | ||||
| Third Quarter |
— | — | ||||
| Fourth Quarter |
$ | 31.92 | $ | 23.90 | ||
| ProShares UltraShort Euro |
||||||
| First Quarter |
— | — | ||||
| Second Quarter |
— | — | ||||
| Third Quarter |
— | — | ||||
| Fourth Quarter |
$ | 31.20 | $ | 19.66 | ||
| ProShares Ultra Yen |
||||||
| First Quarter |
— | — | ||||
| Second Quarter |
— | — | ||||
| Third Quarter |
— | — | ||||
| Fourth Quarter |
$ | 31.02 | $ | 27.32 | ||
| ProShares UltraShort Yen |
||||||
| First Quarter |
— | — | ||||
| Second Quarter |
— | — | ||||
| Third Quarter |
— | — | ||||
| Fourth Quarter |
$ | 24.37 | $ | 20.30 | ||
The approximate number of holders of the Shares of each Fund as of December 31, 2009 was as follows:
| Fund |
Number of Holders | |
| ProShares Ultra DJ-UBS Commodity |
1,249 | |
| ProShares UltraShort DJ-UBS Commodity |
123 | |
| ProShares Ultra DJ-UBS Crude Oil |
11,799 | |
| ProShares UltraShort DJ-UBS Crude Oil |
3,409 | |
| ProShares Ultra Gold |
353 | |
| ProShares UltraShort Gold |
6,237 |
41
Table of Contents
| Fund |
Number of Holders | |
| ProShares Ultra Silver |
210 | |
| ProShares UltraShort Silver |
2,376 | |
| ProShares Ultra Euro |
5,419 | |
| ProShares UltraShort Euro |
3,984 | |
| ProShares Ultra Yen |
6,880 | |
| ProShares UltraShort Yen |
4,595 | |
| Total: |
46,634 |
The Funds made no distributions to Shareholders during the fiscal year ended December 31, 2009. The Funds have no obligation to make periodic distributions to Shareholders.
| b) | As described in the Trust’s Registration Statement on Form S-1 (No. 333-146801), which was declared effective on November 21, 2008, its Registration Statement on Form S-1 (No. 333-156888), which was declared effective on February 13, 2009, and its Registration Statement on Form S-3 (No. 333-163511), which was automatically declared effective on December 4, 2009, substantially all of the proceeds received by each Fund from the issuance and sale of Shares to Authorized Participants are used by each Fund to enter into Financial Instruments relating to that Fund’s benchmark in combination with cash or cash equivalents and/or U.S. Treasury Securities or other high credit quality short-term fixed-income or similar securities (such as shares of money market funds, bank deposits, bank money market accounts, certain variable rate-demand notes and repurchase agreements collateralized by government securities, whether denominated in U.S. or the applicable foreign currency with respect to a Currency Fund) that may be used to collateralize swap agreements or forward contracts or deposited with FCMs as margin in connection with any futures transactions. |
Each Fund continuously offers and redeems its Shares in blocks of 50,000 Shares.
| Title of Securities |
Amount Registered |
Shares Sold For the Three Months Ended December 31, 2009 |
Sale Price of Shares Sold For the Three Months Ended December 31, 2009 |
Shares Sold For the Year Ended December 31, 2009 |
Sale Price of Shares Sold For the Year Ended December 31, 2009 | ||||||||
| ProShares Ultra DJ-UBS Commodity Common Units of Beneficial Interest |
$ | 1,500,000,000 | — | $ | — | 1,200,000 | $ | 25,899,594 | |||||
| ProShares UltraShort DJ-UBS Commodity Common Units of Beneficial Interest |
$ | 2,500,000,000 | — | $ | — | 200,000 | $ | 4,145,511 | |||||
| ProShares Ultra DJ-UBS Crude Oil Common Units of Beneficial Interest |
$ | 7,000,000,000 | 22,750,000 | $ | 269,118,972 | 127,150,000 | $ | 1,254,758,064 | |||||
| ProShares UltraShort DJ-UBS Crude Oil Common Units of Beneficial Interest |
$ | 4,500,000,000 | 6,450,000 | $ | 89,398,404 | 22,000,000 | $ | 469,708,747 | |||||
| ProShares Ultra Gold Common Units of Beneficial Interest |
$ | 3,000,000,000 | 900,000 | $ | 43,558,992 | 5,250,000 | $ | 193,756,011 | |||||
| ProShares UltraShort Gold Common Units of Beneficial Interest |
$ | 3,000,000,000 | 4,150,000 | $ | 39,843,283 | 9,850,000 | $ | 134,255,857 | |||||
| ProShares Ultra Silver Common Units of Beneficial Interest |
$ | 2,000,000,000 | 950,000 | $ | 57,446,942 | 3,500,000 | $ | 161,850,670 | |||||
42
Table of Contents
| Title of Securities |
Amount Registered |
Shares Sold For the Three Months Ended December 31, 2009 |
Sale Price of Shares Sold For the Three Months Ended December 31, 2009 |
Shares Sold For the Year Ended December 31, 2009 |
Sale Price of Shares Sold For the Year Ended December 31, 2009 | ||||||||
| ProShares UltraShort Silver Common Units of Beneficial Interest |
$ | 2,000,000,000 | 5,000,000 | $ | 23,887,658 | 23,250,000 | $ | 178,025,835 | |||||
| ProShares Ultra Euro Common Units of Beneficial Interest |
$ | 1,500,000,000 | — | $ | — | 150,000 | $ | 3,982,252 | |||||
| ProShares UltraShort Euro Common Units of Beneficial Interest |
$ | 1,500,000,000 | 3,250,000 | $ | 59,734,281 | 6,050,000 | $ | 123,512,066 | |||||
| ProShares Ultra Yen Common Units of Beneficial Interest |
$ | 1,500,000,000 | — | $ | — | 100,000 | $ | 2,725,367 | |||||
| ProShares UltraShort Yen Common Units of Beneficial Interest |
$ | 1,500,000,000 | 2,050,000 | $ | 41,484,414 | 4,950,000 | $ | 110,783,920 | |||||
| Total: |
$ | 31,500,000,000 | 45,500,000 | $ | 624,461,712 | 203,650,000 | $ | 2,663,392,660 | |||||
| c) | From October 1, 2009 through December 31, 2009, the number of Shares redeemed and average price per Share for each Fund were as follows: |
| Fund |
Total Number of Shares Redeemed |
Average Price Per Share | |||
| ProShares Ultra DJ-UBS Commodity |
|||||
| 10/01/09 to 10/31/09 |
— | $ | — | ||
| 11/01/09 to 11/30/09 |
100,000 | 26.29 | |||
| 12/01/09 to 12/31/09 |
— | — | |||
| ProShares UltraShort DJ-UBS Commodity |
|||||
| 10/01/09 to 10/31/09 |
— | — | |||
| 11/01/09 to 11/30/09 |
100,000 | 15.97 | |||
| 12/01/09 to 12/31/09 |
— | — | |||
| ProShares Ultra DJ-UBS Crude Oil |
|||||
| 10/01/09 to 10/31/09 |
16,100,000 | 12.54 | |||
| 11/01/09 to 11/30/09 |
1,500,000 | 13.74 | |||
| 12/01/09 to 12/31/09 |
8,750,000 | 12.44 | |||
| ProShares UltraShort DJ-UBS Crude Oil |
|||||
| 10/01/09 to 10/31/09 |
700,000 | 13.58 | |||
| 11/01/09 to 11/30/09 |
1,750,000 | 13.54 | |||
| 12/01/09 to 12/31/09 |
3,450,000 | 16.04 | |||
| ProShares Ultra Gold |
|||||
| 10/01/09 to 10/31/09 |
350,000 | 40.89 | |||
| 11/01/09 to 11/30/09 |
— | — | |||
| 12/01/09 to 12/31/09 |
650,000 | 46.49 | |||
| ProShares UltraShort Gold |
|||||
| 10/01/09 to 10/31/09 |
— | — | |||
| 11/01/09 to 11/30/09 |
— | — | |||
| 12/01/09 to 12/31/09 |
700,000 | 10.49 | |||
| ProShares Ultra Silver |
|||||
| 10/01/09 to 10/31/09 |
— | — | |||
| 11/01/09 to 11/30/09 |
— | — | |||
| 12/01/09 to 12/31/09 |
100,000 | 60.07 | |||
43
Table of Contents
| Fund |
Total Number of Shares Redeemed |
Average Price Per Share | |||
| ProShares UltraShort Silver |
|||||
| 10/01/09 to 10/31/09 |
— | — | |||
| 11/01/09 to 11/30/09 |
— | — | |||
| 12/01/09 to 12/31/09 |
1,600,000 | 4.45 | |||
| ProShares Ultra Euro |
|||||
| 10/01/09 to 10/31/09 |
— | — | |||
| 11/01/09 to 11/30/09 |
— | — | |||
| 12/01/09 to 12/31/09 |
— | — | |||
| ProShares UltraShort Euro |
|||||
| 10/01/09 to 10/31/09 |
— | — | |||
| 11/01/09 to 11/30/09 |
— | — | |||
| 12/01/09 to 12/31/09 |
— | — | |||
| ProShares Ultra Yen |
|||||
| 10/01/09 to 10/31/09 |
— | — | |||
| 11/01/09 to 11/30/09 |
— | — | |||
| 12/01/09 to 12/31/09 |
— | — | |||
| ProShares UltraShort Yen |
|||||
| 10/01/09 to 10/31/09 |
— | — | |||
| 11/01/09 to 11/30/09 |
— | — | |||
| 12/01/09 to 12/31/09 |
50,000 | 18.98 | |||
| Total: |
35,900,000 | $ | 13.65 | ||
| Item 6. | Selected Financial Data. |
Financial Highlights for the year ended December 31, 2009 and the period ended December 31, 2008 for each Fund are summarized below and should be read in conjunction with the Funds’ audited financial statements, and the notes and schedules related thereto, which are included in this Annual Report on Form 10-K.
PROSHARES ULTRA DJ-UBS COMMODITY
| Year Ended December 31, 2009 |
August 6, 2008 (Inception) through December 31, 2008 |
|||||||
| Total assets |
$ | 19,759,132 | $ | 3,367,988 | ||||
| Total shareholders’ equity at end of period |
19,743,932 | 3,325,011 | ||||||
| Net investment income (loss) |
(159,995 | ) | (2,396 | ) | ||||
| Net realized and unrealized gain (loss) |
5,272,629 | (223,668 | ) | |||||
| Net income (loss) |
5,112,634 | (226,064 | ) | |||||
| Net increase (decrease) in net asset value per share |
6.05 | (2.84 | ) | |||||
44
Table of Contents
PROSHARES ULTRASHORT DJ-UBS COMMODITY
| Year Ended December 31, 2009 |
August 6, 2008 (Inception) through December 31, 2008 |
|||||||
| Total assets |
$ | 3,143,524 | $ | 3,314,130 | ||||
| Total shareholders’ equity at end of period |
2,924,426 | 2,679,883 | ||||||
| Net investment income (loss) |
(34,690 | ) | (2,783 | ) | ||||
| Net realized and unrealized gain (loss) |
(2,269,710 | ) | 181,766 | |||||
| Net income (loss) |
(2,304,400 | ) | 178,983 | |||||
| Net increase (decrease) in net asset value per share |
(12.18 | ) | 1.80 | |||||
PROSHARES ULTRA DJ-UBS CRUDE OIL
| Year Ended December 31, 2009 |
August 6, 2008 (Inception) through December 31, 2008 |
|||||||
| Total assets |
$ | 359,277,448 | $ | 107,259,658 | ||||
| Total shareholders’ equity at end of period |
323,819,670 | 99,772,943 | ||||||
| Net investment income (loss) |
(2,745,473 | ) | (40,674 | ) | ||||
| Net realized and unrealized gain (loss) |
126,094,280 | 9,956,997 | ||||||
| Net income (loss) |
123,348,807 | 9,916,323 | ||||||
| Net increase (decrease) in net asset value per share |
(2.16 | ) | (10.22 | ) | ||||
PROSHARES ULTRASHORT DJ-UBS CRUDE OIL
| Year Ended December 31, 2009 |
August 6, 2008 (Inception) through December 31, 2008 |
|||||||
| Total assets |
$ | 78,978,388 | $ | 20,975,904 | ||||
| Total shareholders’ equity at end of period |
76,656,626 | 14,502,399 | ||||||
| Net investment income (loss) |
(785,316 | ) | (11,201 | ) | ||||
| Net realized and unrealized gain (loss) |
(16,268,045 | ) | (717,759 | ) | ||||
| Net income (loss) |
(17,053,361 | ) | (728,960 | ) | ||||
| Net increase (decrease) in net asset value per share |
(15.31 | ) | 4.00 | |||||
PROSHARES ULTRA GOLD
| Year Ended December 31, 2009 |
August 6, 2008 (Inception) through December 31, 2008 |
|||||||
| Total assets |
$ | 168,695,905 | $ | 28,531,021 | ||||
| Total shareholders’ equity at end of period |
156,476,709 | 27,736,722 | ||||||
| Net investment income (loss) |
(1,247,200 | ) | (10,430 | ) | ||||
| Net realized and unrealized gain (loss) |
35,041,207 | 1,721,234 | ||||||
| Net income (loss) |
33,794,007 | 1,710,804 | ||||||
| Net increase (decrease) in net asset value per share |
13.26 | 5.82 | ||||||
45
Table of Contents
PROSHARES ULTRASHORT GOLD
| Year Ended December 31, 2009 |
August 6, 2008 (Inception) through December 31, 2008 |
|||||||
| Total assets |
$ | 68,671,532 | $ | 4,094,070 | ||||
| Total shareholders’ equity at end of period |
67,602,811 | 3,875,093 | ||||||
| Net investment income (loss) |
(402,783 | ) | (2,370 | ) | ||||
| Net realized and unrealized gain (loss) |
(17,512,830 | ) | (659,607 | ) | ||||
| Net income (loss) |
(17,915,613 | ) | (661,977 | ) | ||||
| Net increase (decrease) in net asset value per share |
(8.89 | ) | (5.63 | ) | ||||
PROSHARES ULTRA SILVER
| Year Ended December 31, 2009 |
August 6, 2008 (Inception) through December 31, 2008 |
|||||||
| Total assets |
$ | 158,775,881 | $ | 10,310,952 | ||||
| Total shareholders’ equity at end of period |
145,416,382 | 10,011,149 | ||||||
| Net investment income (loss) |
(758,694 | ) | (3,611 | ) | ||||
| Net realized and unrealized gain (loss) |
36,175,592 | 133,347 | ||||||
| Net income (loss) |
35,416,898 | 129,736 | ||||||
| Net increase (decrease) in net asset value per share |
28.43 | 3.60 | ||||||
PROSHARES ULTRASHORT SILVER
| Year Ended December 31, 2009 |
August 6, 2008 (Inception) through December 31, 2008 |
|||||||
| Total assets |
$ | 68,157,270 | $ | 2,062,984 | ||||
| Total shareholders’ equity at end of period |
64,516,145 | 1,960,071 | ||||||
| Net investment income (loss) |
(388,903 | ) | (1,870 | ) | ||||
| Net realized and unrealized gain (loss) |
(37,791,186 | ) | (583,959 | ) | ||||
| Net income (loss) |
(38,180,089 | ) | (540,829 | ) | ||||
| Net increase (decrease) in net asset value per share |
(14.89 | ) | (5.40 | ) | ||||
PROSHARES ULTRA EURO
| Year Ended December 31, 2009 |
August 6, 2008 (Inception) through December 31, 2008 |
|||||||
| Total assets |
$ | 7,815,430 | $ | 4,569,933 | ||||
| Total shareholders’ equity at end of period |
7,531,857 | 4,386,411 | ||||||
| Net investment income (loss) |
(60,716 | ) | (2,894 | ) | ||||
| Net realized and unrealized gain (loss) |
562,024 | 430,635 | ||||||
| Net income (loss) |
501,308 | 427,741 | ||||||
| Net increase (decrease) in net asset value per share |
0.89 | 4.24 | ||||||
46
Table of Contents
PROSHARES ULTRASHORT EURO
| Year Ended December 31, 2009 |
August 6, 2008 (Inception) through December 31, 2008 |
|||||||
| Total assets |
$ | 100,901,360 | $ | 7,374,140 | ||||
| Total shareholders’ equity at end of period |
100,847,786 | 7,331,163 | ||||||
| Net investment income (loss) |
(349,729 | ) | (3,574 | ) | ||||
| Net realized and unrealized gain (loss) |
(8,506,207 | ) | (342,153 | ) | ||||
| Net income (loss) |
(8,855,936 | ) | (345,727 | ) | ||||
| Net increase (decrease) in net asset value per share |
(2.27 | ) | (4.05 | ) | ||||
PROSHARES ULTRA YEN
| Year Ended December 31, 2009 |
August 6, 2008 (Inception) through December 31, 2008 |
|||||||
| Total assets |
$ | 4,240,477 | $ | 3,089,602 | ||||
| Total shareholders’ equity at end of period |
3,921,267 | 2,845,053 | ||||||
| Net investment income (loss) |
(36,723 | ) | (2,671 | ) | ||||
| Net realized and unrealized gain (loss) |
(356,330 | ) | 347,374 | |||||
| Net income (loss) |
(393,053 | ) | 344,703 | |||||
| Net increase (decrease) in net asset value per share |
(2.31 | ) | 3.45 | |||||
PROSHARES ULTRASHORT YEN
| Year Ended December 31, 2009 |
August 6, 2008 (Inception) through December 31, 2008 |
|||||||
| Total assets |
$ | 67,536,287 | $ | 2,209,595 | ||||
| Total shareholders’ equity at end of period |
67,487,917 | 2,166,617 | ||||||
| Net investment income (loss) |
(348,942 | ) | (2,148 | ) | ||||
| Net realized and unrealized gain (loss) |
(1,312,337 | ) | (331,585 | ) | ||||
| Net income (loss) |
(1,661,279 | ) | (333,733 | ) | ||||
| Net increase (decrease) in net asset value per share |
(0.24 | ) | (3.34 | ) | ||||
| Item 7. | Management’s Discussion and Analysis of Financial Condition and Results of Operations. |
This information should be read in conjunction with the financial statements and notes to the financial statements included with this Annual Report on Form 10-K. The discussion and analysis that follows may contain statements that relate to future events or future performance. In some cases, such forward-looking statements can be identified by terminology such as “will,” “may,” “should,” “expect,” “plan,” “anticipate,” “believe,” “estimate,” “predict,” “potential” or the negative of these terms or other comparable terminology. None of the Trust, the Sponsor or the Trustee assumes responsibility for the accuracy or completeness of any forward-looking statements. Except as expressly required by federal securities laws, none of the Trust, the Sponsor or the Trustee is under a duty to update any of the forward-looking statements to conform such statements to actual results or to a change in expectations or predictions.
47
Table of Contents
Introduction
As further described in Item 1 of this Annual Report on Form 10-K, each “Ultra” Fund seeks daily investment results (before fees and expenses) that correspond to twice (200%) the daily performance of its corresponding benchmark. Each “UltraShort” Fund seeks daily investment results (before fees and expenses) that correspond to twice (200%) the inverse (opposite) of the daily performance of its corresponding benchmark. Each Fund generally invests in Financial Instruments (i.e., commodity-based or currency-based instruments whose value is derived from the value of an underlying asset, rate or index) as a substitute for investing directly in a commodity or currency in order to gain exposure to the commodity index, commodity or currency. Financial Instruments also are used to produce economically “leveraged” or “inverse” investment results and may include futures contracts and options on futures contracts, swap agreements, forward contracts and other commodity-based or currency-based options contracts.
The Funds do not seek to achieve their stated investment objective over a period of time greater than one day because mathematical compounding prevents the Funds from achieving such results. Accordingly, results over periods of time greater than one day should not be expected to be a simple multiple (+200 or -200%) of the period return of the corresponding benchmark and will likely differ significantly.
Liquidity and Capital Resources
In order to collateralize derivatives positions in commodities or currencies, a significant portion of the NAV of each Fund is held in cash and/or U.S. Treasury Securities, agency securities, or other high credit quality short-term fixed-income or similar securities (such as shares of money market funds, bank deposits, bank money market accounts, certain variable rate-demand notes and repurchase agreements collateralized by government securities, whether denominated in U.S. dollars or the applicable foreign currency with respect to a Currency Fund). A portion of these investments may be posted as collateral in connection with swap agreements and/or used as margin for each Fund’s trading in futures and forward contracts. The percentage that U.S. Treasury bills and other short-term fixed-income securities bear to the shareholders’ equity of each Fund varies from period to period as the market values of the underlying swaps, futures contracts and forward contracts change. During the three months and year ended December 31, 2009, each of the Funds earned interest income as follows:
| Fund |
Interest Income Three Months Ended December 31, 2009 |
Interest Income Year Ended December 31, 2009 | ||||
| ProShares Ultra DJ-UBS Commodity |
$ | 906 | $ | 4,918 | ||
| ProShares UltraShort DJ-UBS Commodity |
112 | 822 | ||||
| ProShares Ultra DJ-UBS Crude Oil |
17,009 | 110,254 | ||||
| ProShares UltraShort DJ-UBS Crude Oil |
3,727 | 24,406 | ||||
| ProShares Ultra Gold |
12,108 | 55,592 | ||||
| ProShares UltraShort Gold |
3,337 | 16,787 | ||||
| ProShares Ultra Silver |
7,826 | 28,466 | ||||
| ProShares UltraShort Silver |
4,050 | 15,541 | ||||
| ProShares Ultra Euro |
543 | 2,956 | ||||
| ProShares UltraShort Euro |
4,267 | 23,700 | ||||
| ProShares Ultra Yen |
253 | 1,709 | ||||
| ProShares UltraShort Yen |
3,761 | 25,604 | ||||
Each Fund’s underlying swaps, futures and forward contracts, as the case may be, are subject to periods of illiquidity because of market conditions, regulatory considerations and other reasons. For example, swaps and forward contracts are not traded on an exchange, do not have uniform terms and conditions, and in general are not transferable without the consent of the counterparty. In the case of futures contracts, commodity exchanges may limit fluctuations in certain futures contract prices during a single day by regulations referred to as “daily limits.” During a single day, no futures trades may be executed at prices beyond the daily limit. Once the price of
48
Table of Contents
a futures contract has increased or decreased by an amount equal to the daily limit, positions in such futures contracts can neither be taken nor liquidated unless the traders are willing to effect trades at or within the limit. Futures contract prices have occasionally moved the daily limit for several consecutive days with little or no trading. Such market conditions could prevent a Fund from promptly liquidating its futures positions.
Entry into swap agreements or forward contracts may further impact liquidity because these contractual agreements are executed “off-exchange” between private parties and, therefore, the time required to offset or “unwind” these positions may be greater than that for exchange-traded instruments. This potential delay could be exacerbated to the extent a counterparty is not a United States person.
The Trust is unaware of any other trends, demands, conditions or events that are reasonably likely to result in material changes to the Trust’s liquidity needs.
Because each Fund enters into swaps and may trade futures and forward contracts, its capital is at risk due to changes in the value of these contracts (market risk) or the inability of counterparties to perform under the terms of the contracts (credit risk).
Results of Operations for the Three Months Ended December 31, 2009 Compared to the Period Ended December 31, 2008
Since the Funds were conducting operations for only a portion of the three months ended December 31, 2008, the comparison of the results of operations of each Fund for the three months ended December 31, 2008 and 2009 may not be meaningful.
NAV of ProShares Ultra DJ-UBS Commodity
During the three months ended December 31, 2009, the Fund’s NAV increased from $19,356,364 at September 30, 2009 to $19,743,932 at December 31, 2009. The increase in the Fund’s NAV resulted primarily from the cumulative effect of the Fund seeking daily investment results (before fees and expenses) that correspond to 200% of the daily performance of the Dow Jones—UBS Commodity Index. The increase in the Fund’s NAV was offset by a decrease in outstanding Shares, which decreased from 800,014 Shares at September 30, 2009 to 700,014 Shares at December 31, 2009 due to no Shares being created and 100,000 Shares (2 Creation Units) being redeemed during the period. For the three months ended December 31, 2009, over which the Fund’s daily performance had a statistical correlation over 0.99 to 200% of the daily performance of its benchmark, the Fund’s per share NAV increased by 16.57%. During the three months ended December 31, 2009, the benchmark rose by a cumulative 9.01% and had an annualized volatility of 20%.
By comparison, during the period ended December 31, 2008, the Fund’s NAV increased from $350 at November 24, 2008 to $3,325,011 at December 31, 2008. The increase in the Fund’s NAV resulted primarily from an increase in outstanding Shares, which increased from 14 Shares at November 24, 2008 to 150,014 Shares at December 31, 2008 due to 150,000 Shares (3 Creation Units) being created and no Shares being redeemed during the period. The increase in the Fund’s NAV was offset by the cumulative effect of the Fund seeking daily investment results (before fees and expenses) that correspond to 200% of the daily performance of the Dow Jones—UBS Commodity Index. For the period ended December 31, 2008, over which the Fund’s daily performance had a statistical correlation over 0.99 to 200% of the daily performance of its benchmark, the Fund’s per share NAV decreased by 11.34%. During the period ended December 31, 2008, the benchmark declined by a cumulative 5.17% and had an annualized volatility of 33%.
NAV of ProShares UltraShort DJ-UBS Commodity
During the three months ended December 31, 2009, the Fund’s NAV decreased from $5,425,641 at September 30, 2009 to $2,924,426 at December 31, 2009. The decrease in the Fund’s NAV resulted primarily
49
Table of Contents
from a decrease in outstanding Shares, which decreased from 300,014 Shares at September 30, 2009 to 200,014 Shares at December 31, 2009 due to no Shares being created and 100,000 Shares (2 Creation Units) being redeemed during the period. The decrease in the Fund’s NAV also resulted in part from the cumulative effect of the Fund seeking daily investment results (before fees and expenses) that correspond to 200% of the inverse of the daily performance of the Dow Jones—UBS Commodity Index. For the three months ended December 31, 2009, over which the Fund’s daily performance had a statistical correlation over 0.99 to 200% of the inverse of the daily performance of its benchmark, the Fund’s per share NAV decreased by 19.15%. During the three months ended December 31, 2009, the benchmark rose by a cumulative 9.01% and had an annualized volatility of 20%.
By comparison, during the period ended December 31, 2008, the Fund’s NAV increased from $350 at November 24, 2008 to $2,679,883 at December 31, 2008. The increase in the Fund’s NAV resulted primarily from an increase in outstanding Shares, which increased from 14 Shares at November 24, 2008 to 100,014 Shares at December 31, 2008 due to 100,000 Shares (2 Creation Units) being created and no Shares being redeemed during the period. The increase in the Fund’s NAV also resulted in part from the cumulative effect of the Fund seeking daily investment results (before fees and expenses) that correspond to 200% of the inverse of the daily performance of the Dow Jones—UBS Commodity Index. For the period ended December 31, 2008, over which the Fund’s daily performance had a statistical correlation over 0.99 to 200% of the inverse of the daily performance of its benchmark, the Fund’s per share NAV increased by 7.18%. During the period ended December 31, 2008, the benchmark index declined by a cumulative 5.17% and had an annualized volatility of 33%.
NAV of ProShares Ultra DJ-UBS Crude Oil
During the three months ended December 31, 2009, the Fund’s NAV decreased from $331,839,940 at September 30, 2009 to $323,819,670 at December 31, 2009. The decrease in the Fund’s NAV resulted primarily from a decrease in outstanding Shares, which decreased from 29,250,014 Shares at September 30, 2009 to 25,650,014 Shares at December 31, 2009 due to 22,750,000 Shares (455 Creation Units) being created and 26,350,000 Shares (527 Creation Units) being redeemed during the period. The decrease in the Fund’s NAV was offset by the cumulative effect of the Fund seeking daily investment results (before fees and expenses) that correspond to 200% of the daily performance of the Dow-Jones—UBS Crude Oil Sub-Index. For the three months ended December 31, 2009, over which the Fund’s daily performance had a statistical correlation over 0.99 to 200% of the daily performance of its benchmark, the Fund’s per share NAV increased by 11.28%. During the three months ended December 31, 2009, the benchmark rose by a cumulative 6.65% and had an annualized volatility of 29%.
By comparison, during the period ended December 31, 2008, the Fund’s NAV increased from $350 at November 24, 2008 to $99,772,943 at December 31, 2008. The increase in the Fund’s NAV resulted primarily from an increase in outstanding Shares, which increased from 14 Shares at November 24, 2008 to 6,750,014 Shares at December 31, 2008 due to 7,250,000 Shares (145 Creation Units) being created and 500,000 Shares (10 Creation Units) being redeemed during the period. The increase in the Fund’s NAV was offset by the cumulative effect of the Fund seeking daily investment results (before fees and expenses) that correspond to 200% of the daily performance of the Dow-Jones—UBS Crude Oil Sub-Index. For the period ended December 31, 2008, over which the Fund’s daily performance had a statistical correlation over 0.99 to 200% of the daily performance of its benchmark, the Fund’s per share NAV decreased by 40.88%. During the period ended December 31, 2008, the benchmark index declined by a cumulative 19.40% and had an annualized volatility of 98%.
NAV of ProShares UltraShort DJ-UBS Crude Oil
During the three months ended December 31, 2009, the Fund’s NAV decreased from $83,569,426 at September 30, 2009 to $76,656,626 at December 31, 2009. The decrease in the Fund’s NAV resulted primarily from the cumulative effect of the Fund seeking daily investment results (before fees and expenses) that
50
Table of Contents
correspond to 200% of the inverse of the daily performance of the Dow-Jones—UBS Crude Oil Sub-Index. The decrease in the Fund’s NAV was offset by an increase in outstanding Shares, which increased from 5,050,014 Shares at September 30, 2009 to 5,600,014 Shares at December 31, 2009 due to 6,450,000 Shares (129 Creation Units) being created and 5,900,000 Shares (118 Creation Units) being redeemed during the period. For the three months ended December 31, 2009, over which the Fund’s daily performance had a statistical correlation over 0.99 to 200% of the inverse of the daily performance of its benchmark, the Fund’s per share NAV decreased by 17.28%. During the three months ended December 31, 2009, the benchmark rose by a cumulative 6.65% and had an annualized volatility of 29%.
By comparison, during the period ended December 31, 2008, the Fund’s NAV increased from $350 at November 24, 2008 to $14,502,399 at December 31, 2008. The increase in the Fund’s NAV resulted primarily from an increase in outstanding Shares, which increased from 14 Shares at November 24, 2008 to 500,014 Shares at December 31, 2008 due to 600,000 Shares (12 Creation Units) being created and 100,000 Shares (2 Creation Units) being redeemed during the period. The increase in the Fund’s NAV also resulted in part from the cumulative effect of the Fund seeking daily investment results (before fees and expenses) that correspond to 200% of the inverse of the daily performance of the Dow Jones—UBS Crude Oil Sub-Index. For the period ended December 31, 2008, over which the Fund’s daily performance had a statistical correlation over 0.99 to 200% of the inverse of the daily performance of its benchmark, the Fund’s per share NAV increased by 16.02%. During the period ended December 31, 2008, the benchmark index declined by a cumulative 19.40% and had an annualized volatility of 98%.
NAV of ProShares Ultra Gold
During the three months ended December 31, 2009, the Fund’s NAV increased from $137,409,978 at September 30, 2009 to $156,476,709 at December 31, 2009. The increase in the Fund’s NAV resulted primarily from the cumulative effect of the Fund seeking daily investment results (before fees and expenses) that correspond to 200% of the daily performance of gold bullion as measured by the U.S. Dollar p.m. fixing price for delivery in London. The increase in the Fund’s NAV was offset by a decrease in outstanding Shares, which decreased from 3,650,014 Shares at September 30, 2009 to 3,550,014 Shares at December 31, 2009 due to 900,000 Shares (18 Creation Units) being created and 1,000,000 Shares (20 Creation Units) being redeemed during the period. For the three months ended December 31, 2009, over which the Fund’s daily performance had a statistical correlation over 0.99 to 200% of the daily performance of its benchmark, the Fund’s per share NAV increased by 17.08%. During the three months ended December 31, 2009, the benchmark rose by a cumulative 9.21% and had an annualized volatility of 20%.
By comparison, during the period ended December 31, 2008, the Fund’s NAV increased from $350 at December 1, 2008 to $27,736,722 at December 31, 2008. The increase in the Fund’s NAV resulted primarily from an increase in outstanding Shares, which increased from 14 Shares at December 1, 2008 to 900,014 Shares at December 31, 2008 due to 900,000 Shares (18 Creation Units) being created and no Shares being redeemed during the period. The increase in the Fund’s NAV also resulted in part from the cumulative effect of the Fund seeking daily investment results (before fees and expenses) that correspond to 200% of the daily performance of gold bullion as measured by the U.S. Dollar p.m. fixing price for delivery in London. For the period ended December 31, 2008, over which the Fund’s daily performance had a statistical correlation over 0.99 to 200% of the daily performance of its benchmark, the Fund’s per share NAV increased by 23.27%. During the period ended December 31, 2008, the benchmark index rose by a cumulative 11.79% and had an annualized volatility of 37%.
NAV of ProShares UltraShort Gold
During the three months ended December 31, 2009, the Fund’s NAV increased from $38,866,260 at September 30, 2009 to $67,602,811 at December 31, 2009. The increase in the Fund’s NAV resulted primarily from an increase in outstanding Shares, which increased from 3,000,014 Shares at September 30, 2009 to
51
Table of Contents
6,450,014 Shares at December 31, 2009 due to 4,150,000 Shares (83 Creation Units) being created and 700,000 Shares (14 Creation Units) being redeemed during the period. The increase in the Fund’s NAV was offset by the cumulative effect of the Fund seeking daily investment results (before fees and expenses) that correspond to 200% of the inverse of the daily performance of gold bullion as measured by the U.S. Dollar p.m. fixing price for delivery in London. For the three months ended December 31, 2009, over which the Fund’s daily performance had a statistical correlation over 0.99 to 200% of the inverse of the daily performance of its benchmark, the Fund’s per share NAV decreased by 19.10%. During the three months ended December 31, 2009, the benchmark rose by a cumulative 9.21% and had an annualized volatility of 20%.
By comparison, during the period ended December 31, 2008, the Fund’s NAV increased from $350 at December 1, 2008 to $3,875,093 at December 31, 2008. The increase in the Fund’s NAV resulted primarily from an increase in outstanding Shares, which increased from 14 Shares at December 1, 2008 to 200,014 Shares at December 31, 2008 due to 200,000 Shares (4 Creation Units) being created and no Shares being redeemed during the period. The increase in the Fund’s NAV was offset by the cumulative effect of the Fund seeking daily investment results (before fees and expenses) that correspond to 200% of the inverse of the daily performance of gold bullion as measured by the U.S. Dollar p.m. fixing price for delivery in London. For the period ended December 31, 2008, over which the Fund’s daily performance had a statistical correlation over 0.99 to 200% of the inverse of the daily performance of its benchmark, the Fund’s per share NAV decreased by 22.50%. During the period ended December 31, 2008, the benchmark index rose by a cumulative 11.79% and had an annualized volatility of 37%.
NAV of ProShares Ultra Silver
During the three months ended December 31, 2009, the Fund’s NAV increased from $95,119,218 at September 30, 2009 to $145,416,382 at December 31, 2009. The increase in the Fund’s NAV resulted primarily from an increase in outstanding Shares, which increased from 1,700,014 Shares at September 30, 2009 to 2,550,014 Shares at December 31, 2009 due to 950,000 Shares (19 Creation Units) being created and 100,000 Shares (2 Creation Units) being redeemed during the period. The increase in the Fund’s NAV also resulted in part from the cumulative effect of the Fund seeking daily investment results (before fees and expenses) that correspond to 200% of the daily performance of silver bullion as measured by the U.S. Dollar p.m. fixing price for delivery in London. For the three months ended December 31, 2009, over which the Fund’s daily performance had a statistical correlation over 0.99 to 200% of the daily performance of its benchmark, the Fund’s per share NAV increased by 1.92%. During the three months ended December 31, 2009, the benchmark rose by a cumulative 3.28% and had an annualized volatility of 33%.
By comparison, during the period ended December 31, 2008, the Fund’s NAV increased from $350 at December 1, 2008 to $10,011,149 at December 31, 2008. The increase in the Fund’s NAV resulted primarily from an increase in outstanding Shares, which increased from 14 Shares at December 1, 2008 to 350,014 Shares at December 31, 2008 due to 350,000 Shares (7 Creation Units) being created and no Shares being redeemed during the period. The increase in the Fund’s NAV also resulted in part from the cumulative effect of the Fund seeking daily investment results (before fees and expenses) that correspond to 200% of the daily performance of silver bullion as measured by the U.S. Dollar p.m. fixing price for delivery in London. For the period ended December 31, 2008, over which the Fund’s daily performance had a statistical correlation over 0.99 to 200% of the daily performance of its benchmark, the Fund’s per share NAV increased by 14.41%. During the period ended December 31, 2008, the benchmark index rose by a cumulative 8.88% and had an annualized volatility of 53%.
NAV of ProShares UltraShort Silver
During the three months ended December 31, 2009, the Fund’s NAV increased from $56,901,321 at September 30, 2009 to $64,516,145 at December 31, 2009. The increase in the Fund’s NAV resulted primarily
52
Table of Contents
from an increase in outstanding Shares, which increased from 10,300,014 Shares at September 30, 2009 to 13,700,014 Shares at December 31, 2009 due to 5,000,000 Shares (100 Creation Units) being created and 1,600,000 Shares (32 Creation Units) being redeemed during the period. The increase in the Fund’s NAV was offset by the cumulative effect of the Fund seeking daily investment results (before fees and expenses) that correspond to 200% of the inverse of the daily performance of silver bullion as measured by the U.S. Dollar p.m. fixing price for delivery in London. For the three months ended December 31, 2009, over which the Fund’s daily performance had a statistical correlation over 0.99 to 200% of the inverse of the daily performance of its benchmark, the Fund’s per share NAV decreased by 14.76%. During the three months ended December 31, 2009, the benchmark rose by a cumulative 3.28% and had an annualized volatility of 33%.
By comparison, during the period ended December 31, 2008, the Fund’s NAV increased from $350 at December 1, 2008 to $1,960,071 at December 31, 2008. The increase in the Fund’s NAV resulted primarily from an increase in outstanding Shares, which increased from 14 Shares at December 1, 2008 to 100,014 Shares at December 31, 2008 due to 100,000 Shares (2 Creation Units) being created and no Shares being redeemed during the period. The increase in the Fund’s NAV was offset by the cumulative effect of the Fund seeking daily investment results (before fees and expenses) that correspond to 200% of the inverse of the daily performance of silver bullion as measured by the U.S. Dollar p.m. fixing price for delivery in London. For the period ended December 31, 2008, over which the Fund’s daily performance had a statistical correlation over 0.99 to 200% of the inverse of the daily performance of its benchmark, the Fund’s per share NAV decreased by 21.61%. During the period ended December 31, 2008, the benchmark index rose by a cumulative 8.88% and had an annualized volatility of 53%.
NAV of ProShares Ultra Euro
During the three months ended December 31, 2009, the Fund’s NAV decreased from $7,896,903 at September 30, 2009 to $7,531,857 at December 31, 2009. The Fund had no creation or redemption activity during the quarter. The decrease in the Fund’s NAV resulted from the cumulative effect of the Fund seeking daily investment results (before fees and expenses) that correspond to 200% of the daily performance of the spot price of the Euro versus the U.S. Dollar. For the three months ended December 31, 2009, over which the Fund’s daily performance had a statistical correlation over 0.99 to 200% of the daily performance of its benchmark, the Fund’s per share NAV decreased by 4.62%. During the three months ended December 31, 2009, the benchmark declined by a cumulative 2.15% and had an annualized volatility of 9%.
By comparison, during the period ended December 31, 2008, the Fund’s NAV increased from $350 at November 24, 2008 to $4,386,411 at December 31, 2008. The increase in the Fund’s NAV resulted primarily from an increase in outstanding Shares, which increased from 14 Shares at November 24, 2008 to 150,014 Shares at December 31, 2008 due to 150,000 Shares (3 Creation Units) being created and no Shares being redeemed during the period. The increase in the Fund’s NAV also resulted in part from the cumulative effect of the Fund seeking daily investment results (before fees and expenses) that correspond to 200% of the daily performance of the spot price of the Euro versus the U.S. Dollar. For the period ended December 31, 2008, over which the Fund’s daily performance had a statistical correlation over 0.99 to 200% of the daily performance of its benchmark, the Fund’s per share NAV increased by 16.96%. During the period ended December 31, 2008, the benchmark index rose by a cumulative 8.25% and had an annualized volatility of 21%.
NAV of ProShares UltraShort Euro
During the three months ended December 31, 2009, the Fund’s NAV increased from $38,807,426 at September 30, 2009 to $100,847,786 at December 31, 2009. The increase in the Fund’s NAV resulted primarily from an increase in outstanding Shares, which increased from 2,150,014 Shares at September 30, 2009 to 5,400,014 Shares at December 31, 2009 due to 3,250,000 Shares (65 Creation Units) being created and no Shares being redeemed during the period. The increase in the Fund’s NAV also resulted in part from the cumulative
53
Table of Contents
effect of the Fund seeking daily investment results (before fees and expenses) that correspond to 200% of the inverse of the daily performance of the spot price of the Euro versus the U.S. Dollar. For the three months ended December 31, 2009, over which the Fund’s daily performance had a statistical correlation over 0.99 to 200% of the inverse of the daily performance of its benchmark, the Fund’s per share NAV increased by 3.47%. During the three months ended December 31, 2009, the benchmark declined by a cumulative 2.15% and had an annualized volatility of 9%.
By comparison, during the period ended December 31, 2008, the Fund’s NAV increased from $350 at November 24, 2008 to $7,331,163 at December 31, 2008. The increase in the Fund’s NAV resulted primarily from an increase in outstanding Shares, which increased from 14 Shares at November 24, 2008 to 350,014 Shares at December 31, 2008 due to 350,000 Shares (7 Creation Units) being created and no Shares being redeemed during the period. The increase in the Fund’s NAV was offset by the cumulative effect of the Fund seeking daily investment results (before fees and expenses) that correspond to 200% of the inverse of the daily performance of the spot price of the Euro versus the U.S. Dollar. For the period ended December 31, 2008, over which the Fund’s daily performance had a statistical correlation over 0.99 to 200% of the inverse of the daily performance of its benchmark, the Fund’s per share NAV decreased by 16.22%. During the period ended December 31, 2008, the benchmark index rose by a cumulative 8.25% and had an annualized volatility of 21%.
NAV of ProShares Ultra Yen
During the three months ended December 31, 2009, the Fund’s NAV decreased from $4,243,160 at September 30, 2009 to $3,921,267 at December 31, 2009. The Fund had no creation or redemption activity during the quarter. The decrease in the Fund’s NAV resulted from the cumulative effect of the Fund seeking daily investment results (before fees and expenses) that correspond to 200% of the daily performance of the spot price of the Japanese Yen versus the U.S. Dollar. For the three months ended December 31, 2009, over which the Fund’s daily performance had a statistical correlation over 0.99 to 200% of the daily performance of its benchmark, the Fund’s per share NAV decreased by 7.59%. During the three months ended December 31, 2009, the benchmark declined by a cumulative 3.56% and had an annualized volatility of 11%.
By comparison, during the period ended December 31, 2008, the Fund’s NAV increased from $350 at November 24, 2008 to $2,845,053 at December 31, 2008. The increase in the Fund’s NAV resulted primarily from an increase in outstanding Shares, which increased from 14 Shares at November 24, 2008 to 100,014 Shares at December 31, 2008 due to 100,000 Shares (2 Creation Units) being created and no Shares being redeemed during the period. The increase in the Fund’s NAV also resulted in part from the cumulative effect of the Fund seeking daily investment results (before fees and expenses) that correspond to 200% of the daily performance of the spot price of the Japanese Yen versus the U.S. Dollar. For the period ended December 31, 2008, over which the Fund’s daily performance had a statistical correlation over 0.99 to 200% of the daily performance of its benchmark, the Fund’s per share NAV increased by 13.79%. During the period ended December 31, 2008, the benchmark index rose by a cumulative 6.86% and had an annualized volatility of 17%.
NAV of ProShares UltraShort Yen
During the three months ended December 31, 2009, the Fund’s NAV increased from $23,204,338 at September 30, 2009 to $67,487,917 at December 31, 2009. The increase in the Fund’s NAV resulted primarily from an increase in outstanding Shares, which increased from 1,150,014 Shares at September 30, 2009 to 3,150,014 Shares at December 31, 2009 due to 2,050,000 Shares (41 Creation Units) being created and 50,000 Shares (1 Creation Unit) being redeemed during the period. The increase in the Fund’s NAV also resulted in part from the cumulative effect of the Fund seeking daily investment results (before fees and expenses) that correspond to 200% of the inverse of the daily performance of the spot price of the Japanese Yen versus the U.S. Dollar. For the three months ended December 31, 2009, over which the Fund’s daily performance had a statistical correlation over 0.99 to 200% of the inverse of the daily performance of its benchmark, the Fund’s per share NAV increased by 6.18%. During the three months ended December 31, 2009, the benchmark declined by a cumulative 3.56% and had an annualized volatility of 11%.
54
Table of Contents
By comparison, during the period ended December 31, 2008, the Fund’s NAV increased from $350 at November 24, 2008 to $2,166,617 at December 31, 2008. The increase in the Fund’s NAV resulted primarily from an increase in outstanding Shares, which increased from 14 Shares at November 24, 2008 to 100,014 Shares at December 31, 2008 due to 100,000 Shares (2 Creation Units) being created and no Shares being redeemed during the period. The increase in the Fund’s NAV was offset by the cumulative effect of the Fund seeking daily investment results (before fees and expenses) that correspond to 200% of the inverse of the daily performance of the spot price of the Japanese Yen versus the U.S. Dollar. For the period ended December 31, 2008, over which the Fund’s daily performance had a statistical correlation over 0.99 to 200% of the inverse of the daily performance of its benchmark, the Fund’s per share NAV decreased by 13.35%. During the period ended December 31, 2008, the benchmark index rose by a cumulative 6.86% and had an annualized volatility of 17%.
Results of Operations for the Year Ended December 31, 2009 Compared to the Period Ended December 31, 2008
Since the Funds were conducting operations for only a portion of the year ended December 31, 2008, the comparison of the results of operations for each Fund for the years ended December 31, 2008 and 2009 may not be meaningful.
NAV of ProShares Ultra DJ-UBS Commodity
During the year ended December 31, 2009, the Fund’s NAV increased from $3,325,011 at December 31, 2008 to $19,743,932 at December 31, 2009. The increase in the Fund’s NAV resulted primarily from an increase in outstanding Shares, which increased from 150,014 Shares at December 31, 2008 to 700,014 Shares at December 31, 2009 due to 1,200,000 Shares (24 Creation Units) being created and 650,000 Shares (13 Creation Units) being redeemed during the period. The increase in the Fund’s NAV also resulted in part from the cumulative effect of the Fund seeking daily investment results (before fees and expenses) that correspond to 200% of the daily performance of the Dow Jones—UBS Commodity Index. For the year ended December 31, 2009, over which the Fund’s daily performance had a statistical correlation over 0.99 to 200% of the daily performance of its benchmark, the Fund’s per Share NAV increased by 27.25%. During the year ended December 31, 2009, the benchmark index rose by a cumulative 18.72% and had an annualized volatility of 25%.
By comparison, during the period ended December 31, 2008, the Fund’s NAV increased from $350 at November 24, 2008 to $3,325,011 at December 31, 2008. The increase in the Fund’s NAV resulted primarily from an increase in outstanding Shares, which increased from 14 Shares at November 24, 2008 to 150,014 Shares at December 31, 2008 due to 150,000 Shares (3 Creation Units) being created and no Shares being redeemed during the period. The increase in the Fund’s NAV was offset by the cumulative effect of the Fund seeking daily investment results (before fees and expenses) that correspond to 200% of the daily performance of the Dow Jones—UBS Commodity Index. For the period ended December 31, 2008, over which the Fund’s daily performance had a statistical correlation over 0.99 to 200% of the daily performance of its benchmark, the Fund’s per share NAV decreased by 11.34%. During the period ended December 31, 2008, the benchmark declined by a cumulative 5.17% and had an annualized volatility of 33%.
NAV of ProShares UltraShort DJ-UBS Commodity
During the year ended December 31, 2009, the Fund’s NAV increased from $2,679,883 at December 31, 2008 to $2,924,426 at December 31, 2009. The increase in the Fund’s NAV resulted primarily from an increase in outstanding Shares, which increased from 100,014 Shares at December 31, 2008 to 200,014 Shares at December 31, 2009 due to 200,000 Shares (4 Creation Units) being created and 100,000 Shares (2 Creation Units) being redeemed during the period. The increase in the Fund’s NAV was offset by the cumulative effect of the Fund seeking daily investment results (before fees and expenses) that correspond to 200% of the inverse of the daily performance of the Dow Jones—UBS Commodity Index. For the year ended December 31, 2009, over
55
Table of Contents
which the Fund’s daily performance had a statistical correlation over 0.99 to 200% of the inverse of the daily performance of its benchmark, the Fund’s per Share NAV decreased by 45.43%. During the year ended December 31, 2009, the benchmark index rose by a cumulative 18.72% and had an annualized volatility of 25%.
By comparison, during the period ended December 31, 2008, the Fund’s NAV increased from $350 at November 24, 2008 to $2,679,883 at December 31, 2008. The increase in the Fund’s NAV resulted primarily from an increase in outstanding Shares, which increased from 14 Shares at November 24, 2008 to 100,014 Shares at December 31, 2008 due to 100,000 Shares (2 Creation Units) being created and no Shares being redeemed during the period. The increase in the Fund’s NAV also resulted in part from the cumulative effect of the Fund seeking daily investment results (before fees and expenses) that correspond to 200% of the inverse of the daily performance of the Dow Jones—UBS Commodity Index. For the period ended December 31, 2008, over which the Fund’s daily performance had a statistical correlation over 0.99 to 200% of the inverse of the daily performance of its benchmark, the Fund’s per share NAV increased by 7.18%. During the period ended December 31, 2008, the benchmark index declined by a cumulative 5.17% and had an annualized volatility of 33%.
NAV of ProShares Ultra DJ-UBS Crude Oil
During the year ended December 31, 2009, the Fund’s NAV increased from $99,772,943 at December 31, 2008 to $323,819,670 at December 31, 2009. The increase in the Fund’s NAV resulted primarily from an increase in outstanding Shares, which increased from 6,750,014 Shares at December 31, 2008 to 25,650,014 Shares at December 31, 2009 due to 127,150,000 Shares (2,543 Creation Units) being created and 108,250,000 Shares (2,165 Creation Units) being redeemed during the period. The increase in the Fund’s NAV also resulted in part from the cumulative effect of the Fund seeking daily investment results (before fees and expenses) that correspond to 200% of the daily performance of the Dow-Jones—UBS Crude Oil Sub-Index. For the year ended December 31, 2009, over which the Fund’s daily performance had a statistical correlation over 0.99 to 200% of the daily performance of its benchmark, the Fund’s per Share NAV decreased by 14.59%. During the year ended December 31, 2009, the benchmark index rose by a cumulative 4.19% and had an annualized volatility of 47%.
By comparison, during the period ended December 31, 2008, the Fund’s NAV increased from $350 at November 24, 2008 to $99,772,943 at December 31, 2008. The increase in the Fund’s NAV resulted primarily from an increase in outstanding Shares, which increased from 14 Shares at November 24, 2008 to 6,750,014 Shares at December 31, 2008 due to 7,250,000 Shares (145 Creation Units) being created and 500,000 Shares (10 Creation Units) being redeemed during the period. The increase in the Fund’s NAV was offset by the cumulative effect of the Fund seeking daily investment results (before fees and expenses) that correspond to 200% of the daily performance of the Dow-Jones—UBS Crude Oil Sub-Index. For the period ended December 31, 2008, over which the Fund’s daily performance had a statistical correlation over 0.99 to 200% of the daily performance of its benchmark, the Fund’s per share NAV decreased by 40.88%. During the period ended December 31, 2008, the benchmark index declined by a cumulative 19.4% and had an annualized volatility of 98%.
NAV of ProShares UltraShort DJ-UBS Crude Oil
During the year ended December 31, 2009, the Fund’s NAV increased from $14,502,399 at December 31, 2008 to $76,656,626 at December 31, 2009. The increase in the Fund’s NAV resulted primarily from an increase in outstanding Shares, which increased from 500,014 Shares at December 31, 2008 to 5,600,014 Shares at December 31, 2009 due to 22,000,000 Shares (440 Creation Units) being created and 16,900,000 Shares (338 Creation Units) being redeemed during the period. The increase in the Fund’s NAV was offset by the cumulative effect of the Fund seeking daily investment results (before fees and expenses) that correspond to 200% of the inverse of the daily performance of the Dow-Jones—UBS Crude Oil Sub-Index. For the year ended December 31, 2009, over which the Fund’s daily performance had a statistical correlation over 0.99 to 200% of
56
Table of Contents
the inverse of the daily performance of its benchmark, the Fund’s per Share NAV decreased by 52.80%. During the year ended December 31, 2009, the benchmark index rose by a cumulative 4.19% and had an annualized volatility of 47%.
By comparison, during the period ended December 31, 2008, the Fund’s NAV increased from $350 at November 24, 2008 to $14,502,399 at December 31, 2008. The increase in the Fund’s NAV resulted primarily from an increase in outstanding Shares, which increased from 14 Shares at November 24, 2008 to 500,014 Shares at December 31, 2008 due to 600,000 Shares (12 Creation Units) being created and 100,000 Shares (2 Creation Units) being redeemed during the period. The increase in the Fund’s NAV also resulted in part from the cumulative effect of the Fund seeking daily investment results (before fees and expenses) that correspond to 200% of the inverse of the daily performance of the Dow Jones—UBS Crude Oil Sub-Index. For the period ended December 31, 2008, over which the Fund’s daily performance had a statistical correlation over 0.99 to 200% of the inverse of the daily performance of its benchmark, the Fund’s per share NAV increased by 16.02%. During the period ended December 31, 2008, the benchmark index declined by a cumulative 19.40% and had an annualized volatility of 98%.
NAV of ProShares Ultra Gold
During the year ended December 31, 2009, the Fund’s NAV increased from $27,736,722 at December 31, 2008 to $156,476,709 at December 31, 2009. The increase in the Fund’s NAV resulted primarily from an increase in outstanding Shares, which increased from 900,014 Shares at December 31, 2008 to 3,550,014 Shares at December 31, 2009 due to 5,250,000 Shares (105 Creation Units) being created and 2,600,000 Shares (52 Creation Units) being redeemed during the period. The increase in the Fund’s NAV also resulted in part from the cumulative effect of the Fund seeking daily investment results (before fees and expenses) that correspond to 200% of the daily performance of gold bullion as measured by the U.S. Dollar p.m. fixing price for delivery in London. For the year ended December 31, 2009, over which the Fund’s daily performance had a statistical correlation over 0.99 to 200% of the daily performance of its benchmark, the Fund’s per Share NAV increased by 43.03%. During the year ended December 31, 2009, the benchmark index rose by a cumulative 25.04% and had an annualized volatility of 22%.
By comparison, during the period ended December 31, 2008, the Fund’s NAV increased from $350 at December 1, 2008 to $27,736,722 at December 31, 2008. The increase in the Fund’s NAV resulted primarily from an increase in outstanding Shares, which increased from 14 Shares at December 1, 2008 to 900,014 Shares at December 31, 2008 due to 900,000 Shares (18 Creation Units) being created and no Shares being redeemed during the period. The increase in the Fund’s NAV also resulted in part from the cumulative effect of the Fund seeking daily investment results (before fees and expenses) that correspond to 200% of the daily performance of gold bullion as measured by the U.S. Dollar p.m. fixing price for delivery in London. For the period ended December 31, 2008, over which the Fund’s daily performance had a statistical correlation over 0.99 to 200% of the daily performance of its benchmark, the Fund’s per share NAV increased by 23.27%. During the period ended December 31, 2008, the benchmark index rose by a cumulative 11.79% and had an annualized volatility of 37%.
NAV of ProShares UltraShort Gold
During the year ended December 31, 2009, the Fund’s NAV increased from $3,875,093 at December 31, 2008 to $67,602,811 at December 31, 2009. The increase in the Fund’s NAV resulted primarily from an increase in outstanding Shares, which increased from 200,014 Shares at December 31, 2008 to 6,450,014 Shares at December 31, 2009 due to 9,850,000 Shares (197 Creation Units) being created and 3,600,000 Shares (72 Creation Units) being redeemed during the period. The increase in the Fund’s NAV was offset by the cumulative effect of the Fund seeking daily investment results (before fees and expenses) that correspond to 200% of the inverse of the daily performance of gold bullion as measured by the U.S. Dollar p.m. fixing price for delivery in London. For the year ended December 31, 2009, over which the Fund’s daily performance had a statistical
57
Table of Contents
correlation over 0.99 to 200% of the inverse of the daily performance of its benchmark, the Fund’s per Share NAV decreased by 45.90%. During the year ended December 31, 2009, the benchmark index rose by a cumulative 25.04% and had an annualized volatility of 22%.
By comparison, during the period ended December 31, 2008, the Fund’s NAV increased from $350 at December 1, 2008 to $3,875,093 at December 31, 2008. The increase in the Fund’s NAV resulted primarily from an increase in outstanding Shares, which increased from 14 Shares at December 1, 2008 to 200,014 Shares at December 31, 2008 due to 200,000 Shares (4 Creation Units) being created and no Shares being redeemed during the period. The increase in the Fund’s NAV was offset by the cumulative effect of the Fund seeking daily investment results (before fees and expenses) that correspond to 200% of the inverse of the daily performance of gold bullion as measured by the U.S. Dollar P.M. fixing price for delivery in London. For the period ended December 31, 2008, over which the Fund’s daily performance had a statistical correlation over 0.99 to 200% of the inverse of the daily performance of its benchmark, the Fund’s per share NAV decreased by 22.50%. During the period ended December 31, 2008, the benchmark index rose by a cumulative 11.79% and had an annualized volatility of 37%.
NAV of ProShares Ultra Silver
During the year ended December 31, 2009, the Fund’s NAV increased from $10,011,149 at December 31, 2008 to $145,416,382 at December 31, 2009. The increase in the Fund’s NAV resulted primarily from an increase in outstanding Shares, which increased from 350,014 Shares at December 31, 2008 to 2,550,014 Shares at December 31, 2009 due to 3,500,000 Shares (70 Creation Units) being created and 1,300,000 Shares (26 Creation Units) being redeemed during the period. The increase in the Fund’s NAV also resulted in part from the cumulative effect of the Fund seeking daily investment results (before fees and expenses) that correspond to 200% of the daily performance of silver bullion as measured by the U.S. Dollar p.m. fixing price for delivery in London. For the year ended December 31, 2009, over which the Fund’s daily performance had a statistical correlation over 0.99 to 200% of the daily performance of its benchmark, the Fund’s per Share NAV increased by 99.38%. During the year ended December 31, 2009, the benchmark index rose by a cumulative 57.46% and had an annualized volatility of 39%.
By comparison, during the period ended December 31, 2008, the Fund’s NAV increased from $350 at December 1, 2008 to $10,011,149 at December 31, 2008. The increase in the Fund’s NAV resulted primarily from an increase in outstanding Shares, which increased from 14 Shares at December 1, 2008 to 350,014 Shares at December 31, 2008 due to 350,000 Shares (7 Creation Units) being created and no Shares being redeemed during the period. The increase in the Fund’s NAV also resulted in part from the cumulative effect of the Fund seeking daily investment results (before fees and expenses) that correspond to 200% of the daily performance of silver bullion as measured by the U.S. Dollar p.m. fixing price for delivery in London. For the period ended December 31, 2008, over which the Fund’s daily performance had a statistical correlation over 0.99 to 200% of the daily performance of its benchmark, the Fund’s per share NAV increased by 14.41%. During the period ended December 31, 2008, the benchmark index rose by a cumulative 8.88% and had an annualized volatility of 53%.
NAV of ProShares UltraShort Silver
During the year ended December 31, 2009, the Fund’s NAV increased from $1,960,071 at December 31, 2008 to $64,516,145 at December 31, 2009. The increase in the Fund’s NAV resulted primarily from an increase in outstanding Shares, which increased from 100,014 Shares at December 31, 2008 to 13,700,014 Shares at December 31, 2009 due to 23,250,000 Shares (465 Creation Units) being created and 9,650,000 Shares (193 Creation Units) being redeemed during the period. The increase in the Fund’s NAV was offset by the cumulative effect of the Fund seeking daily investment results (before fees and expenses) that correspond to 200% of the inverse of the daily performance of silver bullion as measured by the U.S. Dollar p.m. fixing price for delivery in London. For the year ended December 31, 2009, over which the Fund’s daily performance had a statistical
58
Table of Contents
correlation over 0.99 to 200% of the inverse of the daily performance of its benchmark, the Fund’s per Share NAV decreased by 75.97%. During the year ended December 31, 2009, the benchmark index rose by a cumulative 57.46% and had an annualized volatility of 39%.
By comparison, during the period ended December 31, 2008, the Fund’s NAV increased from $350 at December 1, 2008 to $1,960,071 at December 31, 2008. The increase in the Fund’s NAV resulted primarily from an increase in outstanding Shares, which increased from 14 Shares at December 1, 2008 to 100,014 Shares at December 31, 2008 due to 100,000 Shares (2 Creation Units) being created and no Shares being redeemed during the period. The increase in the Fund’s NAV was offset by the cumulative effect of the Fund seeking daily investment results (before fees and expenses) that correspond to 200% of the inverse of the daily performance of silver bullion as measured by the U.S. Dollar p.m. fixing price for delivery in London. For the period ended December 31, 2008, over which the Fund’s daily performance had a statistical correlation over 0.99 to 200% of the inverse of the daily performance of its benchmark, the Fund’s per share NAV decreased by 21.61%. During the period ended December 31, 2008, the benchmark index rose by a cumulative 8.88% and had an annualized volatility of 53%.
NAV of ProShares Ultra Euro
During the year ended December 31, 2009, the Fund’s NAV increased from $4,386,411 at December 31, 2008 to $7,531,857 at December 31, 2009. The increase in the Fund’s NAV resulted primarily from an increase in outstanding Shares, which increased from 150,014 Shares at December 31, 2008 to 250,014 Shares at December 31, 2009 due to 150,000 Shares (3 Creation Units) being created and 50,000 Shares (1 Creation Unit) being redeemed during the period. The increase in the Fund’s NAV also resulted in part from the cumulative effect of the Fund seeking daily investment results (before fees and expenses) that correspond to 200% of the daily performance of the spot price of the Euro versus the U.S. Dollar. For the year ended December 31, 2009, over which the Fund’s daily performance had a statistical correlation over 0.99 to 200% of the daily performance of its benchmark, the Fund’s per Share NAV increased by 3.03%. During the year ended December 31, 2009, the benchmark index rose by a cumulative 2.48% and had an annualized volatility of 13%.
By comparison, during the period ended December 31, 2008, the Fund’s NAV increased from $350 at November 24, 2008 to $4,386,411 at December 31, 2008. The increase in the Fund’s NAV resulted primarily from an increase in outstanding Shares, which increased from 14 Shares at November 24, 2008 to 150,014 Shares at December 31, 2008 due to 150,000 Shares (3 Creation Units) being created and no Shares being redeemed during the period. Further adding to the NAV increase was the cumulative effect of the Fund seeking daily investment results (before fees and expenses) that correspond to 200% of the daily performance of the spot price of the Euro versus the U.S. Dollar. For the period ended December 31, 2008, over which the Fund’s daily performance had a statistical correlation over 0.99 to 200% of the daily performance of its benchmark, the Fund’s per share NAV increased by 16.96%. During the period ended December 31, 2008, the benchmark index rose by a cumulative 8.25% and had an annualized volatility of 21%.
NAV of ProShares UltraShort Euro
During the year ended December 31, 2009, the Fund’s NAV increased from $7,331,163 at December 31, 2008 to $100,847,786 at December 31, 2009. The increase in the Fund’s NAV resulted primarily from an increase in outstanding Shares, which increased from 350,014 Shares at December 31, 2008 to 5,400,014 Shares at December 31, 2009 due to 6,050,000 Shares (121 Creation Units) being created and 1,000,000 Shares (20 Creation Units) being redeemed during the period. The increase in the Fund’s NAV was offset by the cumulative effect of the Fund seeking daily investment results (before fees and expenses) that correspond to 200% of the inverse of the daily performance of the spot price of the Euro versus the U.S. Dollar. For the year ended December 31, 2009, over which the Fund’s daily performance had a statistical correlation over 0.99 to 200% of the inverse of the daily performance of its benchmark, the Fund’s per Share NAV decreased by 10.84%. During the year ended December 31, 2009, the benchmark index rose by a cumulative 2.48% and had an annualized volatility of 13%.
59
Table of Contents
By comparison, during the period ended December 31, 2008, the Fund’s NAV increased from $350 at November 24, 2008 to $7,331,163 at December 31, 2008. The increase in the Fund’s NAV resulted primarily from an increase in outstanding Shares, which increased from 14 Shares at November 24, 2008 to 350,014 Shares at December 31, 2008 due to 350,000 Shares (7 Creation Units) being created and no Shares being redeemed during the period. The increase in the Fund’s NAV was offset by the cumulative effect of the Fund seeking daily investment results (before fees and expenses) that correspond to 200% of the inverse of the daily performance of the spot price of the Euro versus the U.S. Dollar. For the period ended December 31, 2008, over which the Fund’s daily performance had a statistical correlation over 0.99 to 200% of the inverse of the daily performance of its benchmark, the Fund’s per share NAV decreased by 16.22%. During the period ended December 31, 2008, the benchmark index rose by a cumulative 8.25% and had an annualized volatility of 21%.
NAV of ProShares Ultra Yen
During the year ended December 31, 2009, the Fund’s NAV increased from $2,845,053 at December 31, 2008 to $3,921,267 at December 31, 2009. The increase in the Fund’s NAV resulted primarily from an increase in outstanding Shares, which increased from 100,014 Shares at December 31, 2008 to 150,014 Shares at December 31, 2009 due to 100,000 Shares (2 Creation Units) being created and 50,000 Shares (1 Creation Unit) being redeemed during the period. The increase in the Fund’s NAV was offset by the cumulative effect of the Fund seeking daily investment results (before fees and expenses) that correspond to 200% of the daily performance of the spot price of the Japanese Yen versus the U.S. Dollar. For the year ended December 31, 2009, over which the Fund’s daily performance had a statistical correlation over 0.99 to 200% of the daily performance of its benchmark, the Fund’s per Share NAV decreased by 8.11%. During the year ended December 31, 2009, the benchmark index declined by a cumulative 2.53% and had an annualized volatility of 13%.
By comparison, during the period ended December 31, 2008, the Fund’s NAV increased from $350 at November 24, 2008 to $2,845,053 at December 31, 2008. The increase in the Fund’s NAV resulted primarily from an increase in outstanding Shares, which increased from 14 Shares at November 24, 2008 to 100,014 Shares at December 31, 2008 due to 100,000 Shares (2 Creation Units) being created and no Shares being redeemed during the period. The increase in the Fund’s NAV also resulted in part from the cumulative effect of the Fund seeking daily investment results (before fees and expenses) that correspond to 200% of the daily performance of the spot price of the Japanese Yen versus the U.S. Dollar. For the period ended December 31, 2008, over which the Fund’s daily performance had a statistical correlation over 0.99 to 200% of the daily performance of its benchmark, the Fund’s per share NAV increased by 13.79%. During the period ended December 31, 2008, the benchmark index rose by a cumulative 6.86% and had an annualized volatility of 17%.
NAV of ProShares UltraShort Yen
During the year ended December 31, 2009, the Fund’s NAV increased from $2,166,617 at December 31, 2008 to $67,487,917 at December 31, 2009. The increase in the Fund’s NAV resulted primarily from an increase in outstanding Shares, which increased from 100,014 Shares at December 31, 2008 to 3,150,014 Shares at December 31, 2009 due to 4,950,000 Shares (99 Creation Units) being created and 1,900,000 Shares (38 Creation Units) being redeemed during the period. The increase in the Fund’s NAV was offset by the cumulative effect of the Fund seeking daily investment results (before fees and expenses) that correspond to 200% of the inverse of the daily performance of the spot price of the Japanese Yen versus the U.S. Dollar. For the year ended December 31, 2009, over which the Fund’s daily performance had a statistical correlation over 0.99 to 200% of the inverse of the daily performance of its benchmark, the Fund’s per Share NAV decreased by 1.10%. During the year ended December 31, 2009, the benchmark index declined by a cumulative 2.53% and had an annualized volatility of 13%.
By comparison, during the period ended December 31, 2008, the Fund’s NAV increased from $350 at November 24, 2008 to $2,166,617 at December 31, 2008. The increase in the Fund’s NAV resulted primarily from an increase in outstanding Shares, which increased from 14 Shares at November 24, 2008 to 100,014 Shares at December 31, 2008 due to 100,000 Shares (2 Creation Units) being created and no Shares being redeemed
60
Table of Contents
during the period. The increase in the Fund’s NAV was offset by the cumulative effect of the Fund seeking daily investment results (before fees and expenses) that correspond to 200% of the inverse of the daily performance of the spot price of the Japanese Yen versus the U.S. Dollar. For the period ended December 31, 2008, over which the Fund’s daily performance had a statistical correlation over 0.99 to 200% of the inverse of the daily performance of its benchmark, the Fund’s per share NAV decreased by 13.35%. During the period ended December 31, 2008, the benchmark index rose by a cumulative 6.86% and had an annualized volatility of 17%.
Off-Balance Sheet Arrangements and Contractual Obligations
As of February 26, 2010, the Funds have not used, nor do they expect to use in the future, special purpose entities to facilitate off-balance sheet financing arrangements and have no loan guarantee arrangements or off-balance sheet arrangements of any kind other than agreements entered into in the normal course of business, which may include indemnification provisions related to certain risks service providers undertake in performing services which are in the best interests of the Funds. While each Fund’s exposure under such indemnification provisions cannot be estimated, these general business indemnifications are not expected to have a material impact on a Fund’s financial position.
Management fee payments made to the Sponsor are calculated as a fixed percentage of each Fund’s NAV. As such, the Sponsor cannot anticipate the amount of payments that will be required under these arrangements for future periods as NAVs are not known until a future date. The agreement with the Sponsor may be terminated by either party upon 30 days written notice to the other party. One officer of the Trust also serves as an officer and owner of the Sponsor.
Market Risk
Trading in futures contracts involves each Fund entering into contractual commitments to purchase or sell a commodity underlying the Fund’s benchmark at a specified date and price, should it hold such futures contract into the deliverable period. Should a Fund enter into a contractual commitment to sell a physical commodity, it would be required to make delivery of that commodity at the contract price and then repurchase the contract at prevailing market prices or settle in cash. Since the repurchase price to which the value of a commodity can rise is unlimited, entering into commitments to sell commodities would expose a Fund to theoretically unlimited risk.
Each Fund’s exposure to market risk is influenced by a number of factors, including the liquidity of the markets in which the contracts are traded and the relationships among the contracts held. The inherent uncertainty of each Fund’s trading as well as the development of drastic market occurrences could ultimately lead to a loss of all or substantially all of investors’ capital.
Credit Risk
When a Fund enters into swap agreements, futures contracts or forward contracts, the Fund is exposed to credit risk that the counterparty to the contract will not meet its obligations.
The counterparty for futures contracts traded on United States and most foreign futures exchanges is the clearing house associated with the particular exchange. In general, clearing houses are backed by their corporate members who may be required to share in the financial burden resulting from the nonperformance by one of their members and, as such, should significantly reduce this credit risk. In cases where the clearing house is not backed by the clearing members (i.e., some foreign exchanges, which may become applicable in the future), it may be backed by a consortium of banks or other financial institutions.
Swap and forward agreements are contracted for directly with counterparties. There can be no assurance that any counterparty, clearing member or clearing house will meet its obligations to a Fund.
Swap agreements do not generally involve the delivery of securities or other underlying assets either at the outset of a transaction or upon settlement. Accordingly, if the counterparty to a swap agreement defaults, the
61
Table of Contents
Fund’s risk of loss consists of the net amount of payments that the Fund is contractually entitled to receive, if any. Swap counterparty risk is generally limited to the amount of any unrealized gains, although in the event of a counterparty bankruptcy, there could be delays and costs associated with recovery collateral posted in segregated tri-party accounts at the Fund’s custodian bank.
Forward agreements do not involve the delivery of securities at the onset of a transaction, but may be settled physically in the underlying asset if such contracts are held to expiration, particularly in the case of currency forwards. Thus, prior to settlement, if the counterparty to a forward contract defaults, a Fund’s risk of loss consists of the net amount of payments that the Fund is contractually entitled to receive, if any. However, if physically settled forwards are held until expiration (presently, there is no plan to do this), at the time of settlement, a Fund may be at risk for the full notional value of the forward contracts depending on the type of settlement procedures used.
The Sponsor attempts to minimize certain of these market and credit risks by normally:
| • | executing and clearing trades with creditworthy counterparties, as determined by the Sponsor; |
| • | limiting the outstanding amounts due from counterparties to the Funds; |
| • | not posting margin directly with a counterparty; |
| • | limiting the amount of margin or premium posted at a FCM; and |
| • | ensuring that deliverable contracts are not held to such a date when delivery of the underlying asset could be called for. |
The FCM for each Fund, in accepting orders for the purchase or sale of domestic futures contracts, is required by CFTC regulations to separately account for and segregate as belonging to the Fund, all assets of the Fund relating to domestic futures trading, and the FCM is not allowed to commingle such assets with other assets of the FCM. In addition, CFTC regulations also require the FCM to hold in a secure account assets of each Fund related to foreign futures trading.
Critical Accounting Policies
The Funds’ critical accounting policies are as follows:
Preparation of the financial statements and related disclosures in compliance with accounting principles generally accepted in the United States of America requires the application of appropriate accounting rules and guidance, as well as the use of estimates. The Sponsor’s application of these policies involves judgments and actual results may differ from the estimates used.
Each Fund has significant exposure to Financial Instruments. The Funds hold a significant portion of their assets in swaps, futures or forward contracts, all of which are recorded on a trade date basis and at fair value in the financial statements, with changes in fair value reported in the Statements of Operations.
The use of fair value to measure Financial Instruments, with related unrealized gains or losses recognized in earnings in each period, is fundamental to the Funds’ financial statements. The fair value of a Financial Instrument is the amount that would be received to sell an asset or paid to transfer a liability in an orderly transaction between market participants at the measurement date (the exit price).
Derivatives (e.g., futures, swaps and forward agreements) are generally valued using independent sources and/or agreements with counterparties or other procedures as determined by the Sponsor. Futures contracts, except for those entered into by the Gold and Silver Funds, are generally valued at the last settled price on the applicable exchange on which that future trades. Futures contracts entered into by the Gold and Silver Funds are valued at the last sales price prior to the time at which the NAV per Share of a Fund is determined. If there was no sale on that day, and for non-exchange-traded derivatives, the Sponsor may in its sole discretion choose to
62
Table of Contents
determine a fair value price as the basis for determining the market value of such position for such day. Such fair value prices would be generally determined based on available inputs about the current value of the underlying financial instrument or commodity and would be based on principles that the Sponsor deems fair and equitable so long as such principles are consistent with normal industry standards.
Fair value pricing may require subjective determinations about the value of an investment. While each Fund’s policy is intended to result in a calculation of the Fund’s NAV that fairly reflects investment values as of the time of pricing, the Fund cannot ensure that fair values determined by the Sponsor or persons acting at their direction would accurately reflect the price that the Fund could obtain for an investment if it were to dispose of that investment as of the time of pricing (for instance, in a forced or distressed sale). The prices used by the Fund may differ from the value that would be realized if the investments were sold and the differences could be material to the financial statements.
The Funds disclose the fair value of their investments in a hierarchy that prioritizes the inputs to valuation techniques used to measure fair value. See Note 2 in the Financial Statements of this Annual Report on Form 10-K for further information.
When market closing prices are not available, the Sponsor may value an asset of a Fund pursuant to the policies the Sponsor has adopted, which are consistent with normal industry standards.
Realized gains (losses) and changes in unrealized gain (loss) on open positions are determined on a specific identification basis and recognized in the Statements of Operations in the period in which the contract is closed or the changes occur, respectively.
Item 7A. Quantitative and Qualitative Disclosures About Market Risk
Quantitative Disclosure
Commodity Price Sensitivity
Each of the Commodity Funds and the Commodity Index Funds is exposed to commodity price risk through its holdings of Financial Instruments. The following tables provide information about each of the Commodity Funds’ and the Commodity Index Funds’ Financial Instruments, which are sensitive to commodity price risk. As of December 31, 2009, each of the Commodity Funds and the Commodity Index Funds’ positions were as follows:
ProShares Ultra DJ-UBS Commodity:
As of December 31, 2009, the ProShares Ultra DJ-UBS Commodity Fund was exposed to commodity price risk through its holding of swap agreements linked to the Dow Jones-UBS Commodity Index. The following table provides information about the Fund’s swap positions as of December 31, 2009, which are sensitive to commodity price risk.
Swap Agreements
| Reference Index |
Counterparty |
Long or Short |
Index Close | Notional Amount at Value | ||||||
| Dow Jones-UBS Commodity Index |
Goldman Sachs International | Long | $ | 139.187 | $ | 9,230,808 | ||||
| Dow Jones-UBS Commodity Index |
UBS AG | Long | 139.187 | 30,278,956 | ||||||
The December 31, 2009 swap notional amount is calculated by multiplying units times the closing level of the Index. The notional amount will increase (decrease) proportionally with increases (decreases) in the level of the Index. Additional gains (losses) associated with these contracts will be equal to any such subsequent increases (decreases) in notional amount, before accounting for spreads or financing costs associated with the swaps. The Fund will generally attempt to adjust its positions in Financial Instruments each day to have $2.00 of exposure to the Index for every $1.00 of net assets. While the above information properly represents the then
63
Table of Contents
current commodity price risk and is adequate for estimating the following day’s gains or losses, estimates of future values over longer periods should take the Fund’s daily rebalancing efforts into account. Future period returns, before fees and expenses, cannot be estimated simply by estimating the return of the Index and multiplying by two. See “Item 1A. Risk Factors” of this Annual Report on Form 10-K for additional information regarding performance for periods longer than one day. Swap counterparty risk is generally limited to the amount of any unrealized gains, although in the event of a counterparty bankruptcy, there could be delays and costs associated with recovering collateral posted in segregated tri-party accounts at the Fund’s custodian bank.
As of December 31, 2008, the ProShares Ultra DJ-UBS Commodity Fund was exposed to commodity price risk through its holding of swap agreements linked to the Dow Jones-UBS Commodity Index. The following table provides information about the Fund’s swap positions as of December 31, 2008, which are sensitive to commodity price risk.
Swap Agreements
| Reference Index |
Counterparty |
Long or Short |
Index Close | Notional Amount at Value | ||||||
| Dow Jones-UBS Commodity Index |
Goldman Sachs International | Long | $ | 117.244 | $ | 6,615,626 | ||||
The December 31, 2008 swap notional amount is calculated by multiplying units times the closing level of the Index. The notional amount will increase (decrease) proportionally with increases (decreases) in the level of the Index. Additional gains (losses) associated with these contracts will be equal to any such subsequent increases (decreases) in notional amount, before accounting for spreads or financing costs associated with the swaps. The Fund will generally attempt to adjust its positions in Financial Instruments each day to have $2.00 of exposure to the Index for every $1.00 of net assets. While the above information properly represents the then current commodity price risk and is adequate for estimating the following day’s gains or losses, estimates of future values over longer periods should take the Fund’s daily rebalancing efforts into account. Future period returns, before fees and expenses, cannot be estimated simply by estimating the return of the Index and multiplying by two. See “Item 1A. Risk Factors” of this Annual Report on Form 10-K for additional information regarding performance for periods longer than one day. Swap counterparty risk is generally limited to the amount of any unrealized gains, although in the event of a counterparty bankruptcy, there could be delays and costs associated with recovering collateral posted in segregated tri-party accounts at the Fund’s custodian bank.
ProShares UltraShort DJ-UBS Commodity:
As of December 31, 2009, the ProShares UltraShort DJ-UBS Commodity Fund was exposed to inverse commodity price risk through its holding of swap agreements linked to the Dow Jones-UBS Commodity Index. The following table provides information about the Fund’s short swap positions as of December 31, 2009, which are sensitive to commodity price risk.
Swap Agreements
| Reference Index |
Counterparty | Long or Short |
Index Close | Notional Amount at Value |
|||||||
| Dow Jones-UBS Commodity Index |
Goldman Sachs International |
Short | $ | 139.187 | $ | (1,001,057 | ) | ||||
| Dow Jones-UBS Commodity Index |
UBS AG | Short | 139.187 | (4,834,281 | ) | ||||||
The December 31, 2009 short swap notional amount is calculated by multiplying units times the closing level of the Index. The short notional amount will increase (decrease) proportionally with increases (decreases) in the level of the Index. Additional losses (gains) associated with these contracts will be equal to any such subsequent increases (decreases) in short notional amount, before accounting for any spreads or financing costs
64
Table of Contents
associated with the swaps. The Fund will generally attempt to adjust its positions in Financial Instruments each day to have negative $2.00 of exposure to the Index for every $1.00 of net assets. While the above information properly represents the then current commodity price risk and is adequate for estimating the following day’s gains or losses, estimates of future values over longer periods should take the Fund’s daily rebalancing efforts into account. Future period returns, before fees and expenses, cannot be estimated simply by estimating the return of the Index and multiplying by minus two. See “Item 1A. Risk Factors” of this Annual Report on Form 10-K for additional information regarding performance for periods longer than one day. Swap counterparty risk is generally limited to the amount of any unrealized gains, although in the event of a counterparty bankruptcy, there could be delays and costs associated with recovering collateral posted in segregated tri-party accounts at the Fund’s custodian bank.
As of December 31, 2008, the ProShares UltraShort DJ-UBS Commodity Fund was exposed to inverse commodity price risk through its holding of swap agreements linked to the Dow Jones-UBS Commodity Index. The following table provides information about the Fund’s short swap positions as of December 31, 2008, which are sensitive to commodity price risk.
Swap Agreements
| Reference Index |
Counterparty | Long or Short |
Index Close | Notional Amount at Value |
|||||||
| Dow Jones-UBS Commodity Index |
Goldman Sachs International |
Short | $ | 117.244 | $ | (5,452,380 | ) | ||||
The December 31, 2008 short swap notional amount is calculated by multiplying units times the closing level of the Index. The short notional amount will increase (decrease) proportionally with increases (decreases) in the level of the Index. Additional losses (gains) associated with these contracts will be equal to any such subsequent increases (decreases) in short notional amount, before accounting for any spreads or financing costs associated with the swaps. The Fund will generally attempt to adjust its positions in Financial Instruments each day to have negative $2.00 of exposure to the Index for every $1.00 of net assets. While the above information properly represents the then current commodity price risk and is adequate for estimating the following day’s gains or losses, estimates of future values over longer periods should take the Fund’s daily rebalancing efforts into account. Future period returns, before fees and expenses, cannot be estimated simply by estimating the return of the Index and multiplying by minus two. See “Item 1A. Risk Factors” of this Annual Report on Form 10-K for additional information regarding performance for periods longer than one day. Swap counterparty risk is generally limited to the amount of any unrealized gains, although in the event of a counterparty bankruptcy, there could be delays and costs associated with recovering collateral posted in segregated tri-party accounts at the Fund’s custodian bank.
ProShares Ultra DJ-UBS Crude Oil:
As of December 31, 2009, the ProShares Ultra DJ-UBS Crude Oil Fund was exposed to commodity price risk through its holding of Crude Oil futures contracts and its holding of swap agreements linked to the Dow Jones-UBS Crude Oil Sub-Index. The following table provides information about the Fund’s positions in these Financial Instruments as of December 31, 2009, which are sensitive to commodity price risk.
Futures Positions
| Contract |
Long or Short |
Expiration | Contracts | Valuation Price |
Contract Multiplier |
Notional Amount at Value | ||||||||
| Crude Oil (NYMEX) |
Long | March 2010 | 2,873 | $ | 80.02 | 1,000 | $ | 229,897,460 | ||||||
65
Table of Contents
Swap Agreements
| Reference Index |
Counterparty | Long or Short |
Index Close | Notional Amount at Value | ||||||
| Dow Jones-UBS Crude Oil Sub-Index |
Goldman Sachs International |
Long | $ | 260.122 | $ | 159,674,116 | ||||
| Dow Jones-UBS Crude Oil Sub-Index |
UBS AG | Long | 260.122 | 258,057,998 | ||||||
The December 31, 2009 futures notional amount is calculated by multiplying the number of contracts held times the valuation price times the contract multiplier. The December 31, 2009 swap notional amount is calculated by multiplying the number of units times the closing level of the Index. These notional amounts will increase (decrease) proportionally with increases (decreases) in the price of the futures contract or the level of the Index, as applicable. Additional gains (losses) associated with these contracts will be equal to any such subsequent increases (decreases) in notional amount, before accounting for spreads or transaction or financing costs. The Fund will generally attempt to adjust its positions in Financial Instruments each day to have $2.00 of exposure to the Index for every $1.00 of net assets. While the above information properly represents the then current commodity price risk and is adequate for estimating the following day’s gains or losses, estimates of future values over longer periods should take the Fund’s daily rebalancing efforts into account. Future period returns, before fees and expenses, cannot be estimated simply by estimating the return of the Index and multiplying by two. See “Item 1A. Risk Factors” of this Annual Report on Form 10-K for additional information regarding performance for periods longer than one day.
As of December 31, 2008, the ProShares Ultra DJ-UBS Crude Oil Fund was exposed to commodity price risk through its holding of Crude Oil futures contracts. The following table provides information about the Fund’s positions in these Financial Instruments as of December 31, 2008, which are sensitive to commodity price risk.
Futures Positions
| Contract |
Long or Short |
Expiration | Contracts | Valuation Price |
Contract Multiplier |
Notional Amount at Value | ||||||||
| Crude Oil (NYMEX) |
Long | March 2009 | 4,107 | $ | 48.59 | 1,000 | $ | 199,559,130 | ||||||
The December 31, 2008 futures notional amount is calculated by multiplying the number of contracts held times the valuation price times the contract multiplier. The notional amount will increase (decrease) proportionally with increases (decreases) in the price of the futures contract. Additional gains (losses) associated with these contracts will be equal to any such subsequent increases (decreases) in notional amount, before accounting for spreads or transaction or financing costs. The Fund will generally attempt to adjust its positions in Financial Instruments each day to have $2.00 of exposure to the Index for every $1.00 of net assets. While the above information properly represents the then current commodity price risk and is adequate for estimating the following day’s gains or losses, estimates of future values over longer periods should take the Fund’s daily rebalancing efforts into account. Future period returns, before fees and expenses, cannot be estimated simply by estimating the return of the Index and multiplying by two. See “Item 1A. Risk Factors” of this Annual Report on Form 10-K for additional information regarding performance for periods longer than one day.
ProShares UltraShort DJ-UBS Crude Oil:
As of December 31, 2009, the ProShares UltraShort DJ-UBS Crude Oil Fund was exposed to inverse commodity price risk through its holding of Crude Oil futures contracts and its holding of swap agreements linked to the Dow Jones-UBS Crude Oil Sub-Index. The following table provides information about the Fund’s positions in these Financial Instruments as of December 31, 2009, which are sensitive to commodity price risk.
66
Table of Contents
Futures Positions
| Contract |
Long or Short |
Expiration | Contracts | Valuation Price |
Contract Multiplier |
Notional Amount at Value |
|||||||||
| Crude Oil (NYMEX) |
Short | March 2010 | 881 | $ | 80.02 | 1,000 | $ | (70,497,620 | ) | ||||||
Swap Agreements
| Reference Index |
Counterparty | Long or Short |
Index Close | Notional Amount at Value |
|||||||
| Dow Jones-UBS Crude Oil Sub-Index |
Goldman Sachs International |
Short | $ | 260.122 | $ | (33,484,257 | ) | ||||
| Dow Jones-UBS Crude Oil Sub-Index |
UBS AG | Short | 260.122 | (49,370,522 | ) | ||||||
The December 31, 2009 short futures notional amount is calculated by multiplying the number of contracts held times the valuation price times the contract multiplier. The December 31, 2009 short swap notional amount is calculated by multiplying the number of units times the closing level of the Index. These short notional amounts will increase (decrease) proportionally with increases (decreases) in the price of the futures contract or the level of the Index, as applicable. Additional losses (gains) associated with these contracts will be equal to any such subsequent increases (decreases) in short notional amount, before accounting for spreads or transaction or financing costs. The Fund will generally attempt to adjust its positions in Financial Instruments each day to have negative $2.00 of exposure to the Index for every $1.00 of net assets. While the above information properly represents the then current commodity price risk and is adequate for estimating the following day’s gains or losses, estimates of future values over longer periods should take the Fund’s daily rebalancing efforts into account. Future period returns, before fees and expenses, cannot be estimated simply by estimating the return of the Index and multiplying by two. See “Item 1A. Risk Factors” of this Annual Report on Form 10-K for additional information regarding performance for periods longer than one day.
As of December 31, 2008, the ProShares UltraShort DJ-UBS Crude Oil Fund was exposed to inverse commodity price risk through its holding of Crude Oil futures contracts. The following table provides information about the Fund’s positions in these Financial Instruments as of December 31, 2008, which are sensitive to commodity price risk.
Futures Positions
| Contract |
Long or Short |
Expiration | Contracts | Valuation Price |
Contract Multiplier |
Notional Amount at Value |
|||||||||
| Crude Oil (NYMEX) |
Short | March 2009 | 598 | $ | 48.59 | 1,000 | $ | (29,056,820 | ) | ||||||
The December 31, 2008 short futures notional amount is calculated by multiplying the number of contracts held times the valuation price times the contract multiplier. The short notional amount will increase (decrease) proportionally with increases (decreases) in the price of the futures contract. Additional losses (gains) associated with these contracts will be equal to any such subsequent increases (decreases) in short notional amount, before accounting for spreads or transaction or financing costs. The Fund will generally attempt to adjust its positions in Financial Instruments each day to have negative $2.00 of exposure to the Index for every $1.00 of net assets. While the above information properly represents the then current commodity price risk and is adequate for estimating the following day’s gains or losses, estimates of future values over longer periods should take the Fund’s daily rebalancing efforts into account. Future period returns, before fees and expenses, cannot be estimated simply by estimating the return of the Index and multiplying by two. See “Item 1A. Risk Factors” of this Annual Report on Form 10-K for additional information regarding performance for periods longer than one day.
67
Table of Contents
ProShares Ultra Gold:
As of December 31, 2009, the ProShares Ultra Gold Fund was exposed to inverse commodity price risk through its holding of Gold futures contracts and Gold forward agreements. The following table provides information about the Fund’s positions in these Financial Instruments as of December 31, 2009, which are sensitive to commodity price risk.
Futures Positions
| Contract |
Long or Short |
Expiration | Contracts | 12/31/09 Valuation Price |
Contract Multiplier |
Notional Amount at Value | ||||||||
| Gold Futures (COMEX) |
Long | February 2010 | 89 | $ | 1,096.20 | 100 | $ | 9,756,180 | ||||||
Forward Agreements
| Reference Index |
Counterparty | Long or Short |
12/31/09 Valuation Price |
Notional Amount at Value | ||||||
| 0.995 Fine Troy Ounce Gold |
Goldman Sachs International |
Long | $ | 1,087.56 | $ | 57,553,675 | ||||
| 0.995 Fine Troy Ounce Gold |
UBS AG | Long | 1,087.56 | 245,571,048 | ||||||
The December 31, 2009 futures notional amount is calculated by multiplying the number of contracts held times the valuation price times the contract multiplier. The December 31, 2009 forward notional amount equals units multiplied by the forward price. These notional amounts will increase (decrease) proportionally with increases (decreases) in the price of the futures contract or forward price, as applicable. Additional gains (losses) associated with these contracts will be equal to any such subsequent increases (decreases) in notional amount, before accounting for spreads or transaction or financing costs. The Fund will generally attempt to adjust its positions in Financial Instruments each day to have $2.00 of exposure to the Index for every $1.00 of net assets. While the above information properly represents the then current commodity price risk and is adequate for estimating the following day’s gains or losses, estimates of future values over longer periods should take the Fund’s daily rebalancing efforts into account. Future period returns, before fees and expenses, cannot be estimated simply by estimating the return of the Index and multiplying by two. See “Item 1A. Risk Factors” of this Annual Report on Form 10-K for additional information regarding performance for periods longer than one day. Counterparty risk related to the forward agreements is generally limited to the amount of any unrealized gains, although in the event of a counterparty bankruptcy, there could be delays and costs associated with recovering collateral posted in segregated tri-party accounts at the Fund’s custodian bank.
As of December 30, 2008, the ProShares Ultra Gold Fund was exposed to inverse commodity price risk through its holding of Gold futures contracts and Gold forward agreements. The following table provides information about the Fund’s positions in these Financial Instruments as of December 30, 2008, which are sensitive to commodity price risk.
Futures Positions
| Contract |
Long or Short |
Expiration | Contracts | 12/30/08 Valuation Price |
Contract Multiplier |
Notional Amount at Value | ||||||||
| Gold Futures (COMEX) |
Long | February 2009 | 22 | $ | 873.00 | 100 | $ | 1,920,600 | ||||||
Forward Agreements
| Reference Index |
Counterparty | Long or Short |
12/30/08 Valuation Price |
Notional Amount at Value | ||||||
| 0.995 Fine Troy Ounce Gold |
Goldman Sachs International |
Long | $ | 869.77 | $ | 53,666,549 | ||||
68
Table of Contents
The December 30, 2008 futures notional amount is calculated by multiplying the number of contracts held times the valuation price times the contract multiplier. The December 30, 2008 forward notional amount equals units multiplied by the forward price. These notional amounts will increase (decrease) proportionally with increases (decreases) in the price of the futures contract or forward price, as applicable. Additional gains (losses) associated with these contracts will be equal to any such subsequent increases (decreases) in notional amount, before accounting for spreads or transaction or financing costs. The Fund will generally attempt to adjust its positions in Financial Instruments each day to have $2.00 of exposure to the Index for every $1.00 of net assets. While the above information properly represents the then current commodity price risk and is adequate for estimating the following day’s gains or losses, estimates of future values over longer periods should take the Fund’s daily rebalancing efforts into account. Future period returns, before fees and expenses, cannot be estimated simply by estimating the return of the Index and multiplying by two. See “Item 1A. Risk Factors” of this Annual Report on Form 10-K for additional information regarding performance for periods longer than one day. Counterparty risk related to the forward agreements is generally limited to the amount of any unrealized gains, although in the event of a counterparty bankruptcy, there could be delays and costs associated with recovering collateral posted in segregated tri-party accounts at the Fund’s custodian bank.
ProShares UltraShort Gold:
As of December 31, 2009, the ProShares UltraShort Gold Fund was exposed to inverse commodity price risk through its holding of Gold futures contracts and Gold forward agreements. The following table provides information about the Fund’s positions in these Financial Instruments as of December 31, 2009, which are sensitive to commodity price risk.
Futures Positions
| Contract |
Long or Short |
Expiration | Contracts | 12/31/09 Valuation Price |
Contract Multiplier |
Notional Amount at Value |
|||||||||
| Gold Futures (COMEX) |
Short | February 2010 | 28 | $ | 1,096.20 | 100 | $ | (3,069,360 | ) | ||||||
Forward Agreements
| Reference Index |
Counterparty | Long or Short |
12/31/09 Valuation Price |
Notional Amount at Value |
|||||||
| 0.995 Fine Troy Ounce Gold |
Goldman Sachs International |
Short | $ | 1,087.56 | $ | (26,099,265 | ) | ||||
| 0.995 Fine Troy Ounce Gold |
UBS AG | Short | 1,087.56 | (105,493,320 | ) | ||||||
The December 31, 2009 short futures notional amount is calculated by multiplying the number of contracts held times the valuation price times the contract multiplier. The December 31, 2009 short forward notional amount equals units multiplied by the forward price. These short notional amounts will increase (decrease) proportionally with increases (decreases) in the price of the futures contract or forward price, as applicable. Additional losses (gains) associated with these contracts will be equal to any such subsequent increases (decreases) in notional amount, before accounting for spreads or transaction or financing costs. The Fund will generally attempt to adjust its positions in Financial Instruments each day to have negative $2.00 of short exposure to the Index for every $1.00 of net assets. While the above information properly represents the then current commodity price risk and is adequate for estimating the following day’s gains or losses, estimates of future values over longer periods should take the Fund’s daily rebalancing efforts into account. Future period returns, before fees and expenses, cannot be estimated simply by estimating the return of the Index and multiplying by two. See “Item 1A. Risk Factors” of this Annual Report on Form 10-K for additional information regarding performance for periods longer than one day. Counterparty risk related to the forward agreements is generally limited to the amount of any unrealized gains, although in the event of a counterparty bankruptcy, there could be delays and costs associated with recovering collateral posted in segregated tri-party accounts at the Fund’s custodian bank.
69
Table of Contents
As of December 30, 2008, the ProShares UltraShort Gold Fund was exposed to inverse commodity price risk through its holding of Gold futures contracts and Gold forward agreements. The following table provides information about the Fund’s positions in these Financial Instruments as of December 30, 2008, which are sensitive to commodity price risk.
Futures Positions
| Contract |
Long or Short |
Expiration | Contracts | 12/30/08 Valuation Price |
Contract Multiplier |
Notional Amount at Value |
|||||||||
| Gold Futures (COMEX) |
Short | February 2009 | 4 | $ | 873.00 | 100 | $ | (349,200 | ) | ||||||
Forward Agreements
| Reference Index |
Counterparty | Long or Short |
12/30/08 Valuation Price |
Notional Amount at Value |
|||||||
| 0.995 Fine Troy Ounce Gold |
Goldman Sachs International |
Short | $ | 869.77 | $ | (7,430,445 | ) | ||||
The December 30, 2008 short futures notional amount is calculated by multiplying the number of contracts held times the valuation price times the contract multiplier. The December 30, 2008 short forward notional amount equals units multiplied by the forward price. These short notional amounts will increase (decrease) proportionally with increases (decreases) in the price of the futures contract or forward price, as applicable. Additional losses (gains) associated with these contracts will be equal to any such subsequent increases (decreases) in notional amount, before accounting for spreads or transaction or financing costs. The Fund will generally attempt to adjust its positions in Financial Instruments each day to have negative $2.00 of short exposure to the Index for every $1.00 of net assets. While the above information properly represents the then current commodity price risk and is adequate for estimating the following day’s gains or losses, estimates of future values over longer periods should take the Fund’s daily rebalancing efforts into account. Future period returns, before fees and expenses, cannot be estimated simply by estimating the return of the Index and multiplying by two. See “Item 1A. Risk Factors” of this Annual Report on Form 10-K for additional information regarding performance for periods longer than one day. Counterparty risk related to the forward agreements is generally limited to the amount of any unrealized gains, although in the event of a counterparty bankruptcy, there could be delays and costs associated with recovering collateral posted in segregated tri-party accounts at the Fund’s custodian bank.
ProShares Ultra Silver:
As of December 31, 2009, the ProShares Ultra Silver Fund was exposed to commodity price risk through its holding of Silver futures contracts and Silver forward agreements. The following table provides information about the Fund’s positions in these Financial Instruments as of December 31, 2009, which are sensitive to commodity price risk.
Futures Positions
| Contract |
Long or Short |
Expiration | Contracts | 12/31/09 Valuation Price |
Contract Multiplier |
Notional Amount at Value | ||||||||
| Silver Futures (COMEX) |
Long | March 2010 | 160 | $ | 16.845 | 5,000 | $ | 13,476,000 | ||||||
Forward Agreements
| Reference Index |
Counterparty | Long or Short |
12/31/09 Valuation Price |
Notional Amount at Value | ||||||
| 0.999 Fine Troy Ounce Silver |
Goldman Sachs International |
Long | $ | 16.9912 | $ | 70,017,337 | ||||
| 0.999 Fine Troy Ounce Silver |
UBS AG | Long | 16.9912 | 207,462,552 | ||||||
70
Table of Contents
The December 31, 2009 futures notional amount is calculated by multiplying the number of contracts held times the valuation price times the contract multiplier. The December 31, 2009 forward notional amount equals units multiplied by the forward price. These notional amounts will increase (decrease) proportionally with increases (decreases) in the price of the futures contract or forward price, as applicable. Additional gains (losses) associated with these contracts will be equal to any such subsequent increases (decreases) in notional amount, before accounting for spreads or transaction or financing costs. The Fund will generally attempt to adjust its positions in Financial Instruments each day to have $2.00 of exposure to the Index for every $1.00 of net assets. While the above information properly represents the then current commodity price risk and is adequate for estimating the following day’s gains or losses, estimates of future values over longer periods should take the Fund’s daily rebalancing efforts into account. Future period returns, before fees and expenses, cannot be estimated simply by estimating the return of the Index and multiplying by two. See “Item 1A. Risk Factors” of this Annual Report on Form 10-K for additional information regarding performance for periods longer than one day. Counterparty risk related to the forward agreements is generally limited to the amount of any unrealized gains, although in the event of a counterparty bankruptcy, there could be delays and costs associated with recovering collateral posted in segregated tri-party accounts at the Fund’s custodian bank.
As of December 31, 2008, the ProShares Ultra Silver Fund was exposed to commodity price risk through its holding of Silver futures contracts and Silver forward agreements. The following table provides information about the Fund’s positions in these Financial Instruments as of December 31, 2008, which are sensitive to commodity price risk.
Futures Positions
| Contract |
Long or Short |
Expiration | Contracts | 12/31/08 Valuation Price |
Contract Multiplier |
Notional Amount at Value | ||||||||
| Silver Futures (COMEX) |
Long | March 2009 | 12 | $ | 10.795 | 5,000 | $ | 647,700 | ||||||
Forward Agreements
| Reference Index |
Counterparty | Long or Short |
12/31/08 Valuation Price |
Notional Amount at Value | ||||||
| 0.999 Fine Troy Ounce Silver |
Goldman Sachs International |
Long | $ | 10.79 | $ | 19,383,336 | ||||
The December 31, 2008 futures notional amount is calculated by multiplying the number of contracts held times the valuation price times the contract multiplier. The December 31, 2008 forward notional amount equals units multiplied by the forward price. These notional amounts will increase (decrease) proportionally with increases (decreases) in the price of the futures contract or forward price, as applicable. Additional gains (losses) associated with these contracts will be equal to any such subsequent increases (decreases) in notional amount, before accounting for spreads or transaction or financing costs. The Fund will generally attempt to adjust its positions in Financial Instruments each day to have $2.00 of exposure to the Index for every $1.00 of net assets. While the above information properly represents the then current commodity price risk and is adequate for estimating the following day’s gains or losses, estimates of future values over longer periods should take the Fund’s daily rebalancing efforts into account. Future period returns, before fees and expenses, cannot be estimated simply by estimating the return of the Index and multiplying by two. See “Item 1A. Risk Factors” of this Annual Report on Form 10-K for additional information regarding performance for periods longer than one day. Counterparty risk related to the forward agreements is generally limited to the amount of any unrealized gains, although in the event of a counterparty bankruptcy, there could be delays and costs associated with recovering collateral posted in segregated tri-party accounts at the Fund’s custodian bank.
71
Table of Contents
ProShares UltraShort Silver:
As of December 31, 2009, the ProShares UltraShort Silver Fund was exposed to inverse commodity price risk through its holding of Silver futures contracts and Silver forward agreements. The following table provides information about the Fund’s positions in these Financial Instruments as of December 31, 2009, which are sensitive to commodity price risk.
Futures Positions
| Contract |
Long or Short |
Expiration | Contracts | 12/31/09 Valuation Price |
Contract Multiplier |
Notional Amount at Value |
|||||||||
| Silver Futures (COMEX) |
Short | March 2010 | 77 | $ | 16.845 | 5,000 | $ | (6,485,325 | ) | ||||||
Forward Agreements
| Reference Index |
Counterparty | Long or Short |
12/31/09 Valuation Price |
Notional Amount at Value |
|||||||
| 0.999 Fine Troy Ounce Silver |
Goldman Sachs International |
Short | $ | 16.9912 | $ | (31,221,330 | ) | ||||
| 0.999 Fine Troy Ounce Silver |
UBS AG | Short | 16.9912 | (91,123,806 | ) | ||||||
The December 31, 2009 short futures notional amount is calculated by multiplying the number of contracts held times the valuation price times the contract multiplier. The December 31, 2009 short forward notional amount equals units multiplied by the forward price. These short notional amounts will increase (decrease) proportionally with increases (decreases) in the price of the futures contract or forward price, as applicable. Additional losses (gains) associated with these contracts will be equal to any such subsequent increases (decreases) in notional amount, before accounting for spreads or transaction or financing costs. The Fund will generally attempt to adjust its positions in Financial Instruments each day to have negative $2.00 of short exposure to the Index for every $1.00 of net assets. While the above information properly represents the then current commodity price risk and is adequate for estimating the following day’s gains or losses, estimates of future values over longer periods should take the Fund’s daily rebalancing efforts into account. Future period returns, before fees and expenses, cannot be estimated simply by estimating the return of the Index and multiplying by two. See “Item 1A. Risk Factors” of this Annual Report on Form 10-K for additional information regarding performance for periods longer than one day. Counterparty risk related to the forward agreements is generally limited to the amount of any unrealized gains, although in the event of a counterparty bankruptcy, there could be delays and costs associated with recovering collateral posted in segregated tri-party accounts at the Fund’s custodian bank.
As of December 31, 2008, the ProShares UltraShort Silver Fund was exposed to inverse commodity price risk through its holding of Silver futures contracts and Silver forward agreements. The following table provides information about the Fund’s positions in these Financial Instruments as of December 31, 2008, which are sensitive to commodity price risk.
Futures Positions
| Contract |
Long or Short |
Expiration | Contracts | 12/31/08 Valuation Price |
Contract Multiplier |
Notional Amount at Value |
|||||||||
| Silver Futures (COMEX) |
Short | March 2009 | 2 | $ | 10.795 | 5,000 | $ | (107,950 | ) | ||||||
Forward Agreements
| Reference Index |
Counterparty | Long or Short |
12/31/08 Valuation Price |
Notional Amount at Value |
|||||||
| 0.999 Fine Troy Ounce Silver |
Goldman Sachs International |
Short | $ | 10.79 | $ | (3,809,984 | ) | ||||
72
Table of Contents
The December 31, 2008 short futures notional amount is calculated by multiplying the number of contracts held times the valuation price times the contract multiplier. The December 31, 2008 short forward notional amount equals units multiplied by the forward price. These short notional amounts will increase (decrease) proportionally with increases (decreases) in the price of the futures contract or forward price, as applicable. Additional losses (gains) associated with these contracts will be equal to any such subsequent increases (decreases) in notional amount, before accounting for spreads or transaction or financing costs. The Fund will generally attempt to adjust its positions in Financial Instruments each day to have negative $2.00 of short exposure to the Index for every $1.00 of net assets. While the above information properly represents the then current commodity price risk and is adequate for estimating the following day’s gains or losses, estimates of future values over longer periods should take the Fund’s daily rebalancing efforts into account. Future period returns, before fees and expenses, cannot be estimated simply by estimating the return of the Index and multiplying by two. See “Item 1A. Risk Factors” of this Annual Report on Form 10-K for additional information regarding performance for periods longer than one day. Counterparty risk related to the forward agreements is generally limited to the amount of any unrealized gains, although in the event of a counterparty bankruptcy, there could be delays and costs associated with recovering collateral posted in segregated tri-party accounts at the Fund’s custodian bank.
Exchange Rate Sensitivity
Each of the Currency Funds is exposed to exchange rate risk through its holdings of Financial Instruments. The following tables provide information about each of the Currency Funds’ Financial Instruments, which are sensitive to changes in exchange rates. As of December 31, 2009 and 2008, each of the Currency Funds’ positions were as follows:
ProShares Ultra Euro:
As of December 31, 2009, the ProShares Ultra Euro Fund was exposed to exchange rate price risk through its holdings of Euro/USD foreign currency forward contracts. The following table provides information about the Fund’s positions in these Financial Instruments as of December 31, 2009, which are sensitive to exchange rate price risk.
Foreign Currency Forward Contracts
| Reference Currency |
Counterparty | Long or Short |
Settlement Date |
Euro | 12/31/09 Forward Rate |
12/31/09 Market Value USD |
|||||||||
| Euro |
Goldman Sachs International |
Long | 01/08/10 | 4,573,425 | 1.4314 | $ | 6,546,398 | ||||||||
| Euro |
UBS AG | Long | 01/08/10 | 6,184,000 | 1.4314 | 8,851,774 | |||||||||
| Euro |
Goldman Sachs International |
Short | 01/08/10 | (71,600 | ) | 1.4314 | (102,488 | ) | |||||||
| Euro |
UBS AG | Short | 01/08/10 | (144,700 | ) | 1.4314 | (207,124 | ) | |||||||
The December 31, 2009 USD market value equals the number of Euros multiplied by the forward rate. These notional amounts will increase (decrease) proportionally with increases (decreases) in the forward price. The Fund will generally attempt to adjust its positions in Financial Instruments each day to have $2.00 of exposure to the Euro for every $1.00 of net assets. While the above information properly represents the then current exchange rate price risk and is adequate for estimating the following day’s gains or losses, estimates of future values over longer periods should take the Fund’s daily rebalancing efforts into account. Future period returns, before fees and expenses, cannot be estimated simply by estimating the appreciation or depreciation of the Euro and multiplying by two. See “Item 1A. Risk Factors” of this Annual Report on Form 10-K for additional information regarding performance for periods longer than one day. Counterparty risk related to foreign currency forward contracts is generally limited to the amount of any unrealized gains, although in the event of a counterparty bankruptcy, there could be delays and costs associated with recovering collateral posted in segregated tri-party accounts at the Fund’s custodian bank.
73
Table of Contents
As of December 31, 2008, the ProShares Ultra Euro Fund was exposed to exchange rate price risk through its holdings of Euro/USD foreign currency forward contracts. The following table provides information about the Fund’s positions in these Financial Instruments as of December 31, 2008, which are sensitive to exchange rate price risk.
Foreign Currency Forward Contracts
| Reference Currency |
Counterparty | Long or Short |
Settlement Date |
Euro | 12/31/08 Forward Rate |
12/31/08 Market Value USD |
|||||||||
| Euro |
Goldman Sachs International |
Long | 01/09/09 | 6,513,500 | 1.3964 | $ | 9,095,543 | ||||||||
| Euro |
Goldman Sachs International |
Short | 01/09/09 | (227,000 | ) | 1.3964 | (316,986 | ) | |||||||
The December 31, 2008 USD market value equals the number of Euros multiplied by the forward rate. These notional amounts will increase (decrease) proportionally with increases (decreases) in the forward price. The Fund will generally attempt to adjust its positions in Financial Instruments each day to have $2.00 of exposure to the Euro for every $1.00 of net assets. While the above information properly represents the then current exchange rate price risk and is adequate for estimating the following day’s gains or losses, estimates of future values over longer periods should take the Fund’s daily rebalancing efforts into account. Future period returns, before fees and expenses, cannot be estimated simply by estimating the appreciation or depreciation of the Euro and multiplying by two. See “Item 1A. Risk Factors” of this Annual Report on Form 10-K for additional information regarding performance for periods longer than one day. Counterparty risk related to foreign currency forward contracts is generally limited to the amount of any unrealized gains, although in the event of a counterparty bankruptcy, there could be delays and costs associated with recovering collateral posted in segregated tri-party accounts at the Fund’s custodian bank.
ProShares UltraShort Euro:
As of December 31, 2009, the ProShares UltraShort Euro Fund was exposed to exchange rate price risk through its holdings of Euro/USD foreign currency forward contracts. The following table provides information about the Fund’s positions in these Financial Instruments as of December 31, 2009, which are sensitive to exchange rate price risk.
Foreign Currency Forward Contracts
| Reference Currency |
Counterparty | Long or Short |
Settlement Date |
Euro | 12/31/09 Forward Rate |
12/31/09 Market Value USD |
|||||||||
| Euro |
Goldman Sachs International |
Long | 01/08/10 | 3,298,800 | 1.4314 | $ | 4,721,901 | ||||||||
| Euro |
Goldman Sachs International |
Short | 01/08/10 | (62,465,425 | ) | 1.4314 | (89,412,976 | ) | |||||||
| Euro |
UBS AG | Short | 01/08/10 | (81,656,800 | ) | 1.4314 | (116,883,500 | ) | |||||||
The December 31, 2009 USD market value equals the number of Euros multiplied by the forward rate. These notional amounts will increase (decrease) proportionally with increases (decreases) in the forward price. The Fund will generally attempt to adjust its positions in Financial Instruments each day to have negative $2.00 of short exposure to the Euro for every $1.00 of net assets. While the above information properly represents the then current exchange rate price risk and is adequate for estimating the following day’s gains or losses, estimates of future values over longer periods should take the Fund’s daily rebalancing efforts into account. Future period returns, before fees and expenses, cannot be estimated simply by estimating the appreciation or depreciation of
74
Table of Contents
the Euro and multiplying by two. See “Item 1A. Risk Factors” of this Annual Report on Form 10-K for additional information regarding performance for periods longer than one day. Counterparty risk related to foreign currency forward contracts is generally limited to the amount of any unrealized gains, although in the event of a counterparty bankruptcy, there could be delays and costs associated with recovering collateral posted in segregated tri-party accounts at the Fund’s custodian bank.
As of December 31, 2008, the ProShares UltraShort Euro Fund was exposed to exchange rate price risk through its holdings of Euro/USD foreign currency forward contracts. The following table provides information about the Fund’s positions in these Financial Instruments as of December 31, 2008, which are sensitive to exchange rate price risk.
Foreign Currency Forward Contracts
| Reference Currency |
Counterparty | Long or Short |
Settlement Date |
Euro | 12/31/08 Forward Rate |
12/31/08 Market Value USD |
|||||||||
| Euro |
Goldman Sachs International |
Long | 01/09/09 | 670,400 | 1.3964 | $ | 936,156 | ||||||||
| Euro |
Goldman Sachs International |
Short | 01/09/09 | (11,163,500 | ) | 1.3964 | (15,588,868 | ) | |||||||
The December 31, 2008 USD market value equals the number of Euros multiplied by the forward rate. These notional amounts will increase (decrease) proportionally with increases (decreases) in the forward price. The Fund will generally attempt to adjust its positions in Financial Instruments each day to have negative $2.00 of short exposure to the Euro for every $1.00 of net assets. While the above information properly represents the then current exchange rate price risk and is adequate for estimating the following day’s gains or losses, estimates of future values over longer periods should take the Fund’s daily rebalancing efforts into account. Future period returns, before fees and expenses, cannot be estimated simply by estimating the appreciation or depreciation of the Euro and multiplying by two. See “Item 1A. Risk Factors” of this Annual Report on Form 10-K for additional information regarding performance for periods longer than one day. Counterparty risk related to foreign currency forward contracts is generally limited to the amount of any unrealized gains, although in the event of a counterparty bankruptcy, there could be delays and costs associated with recovering collateral posted in segregated tri-party accounts at the Fund’s custodian bank.
ProShares Ultra Yen:
As of December 31, 2009, the ProShares Ultra Yen Fund was exposed to exchange rate price risk through its holdings of Yen/USD foreign currency forward contracts. The following table provides information about the Fund’s positions in these Financial Instruments as of December 31, 2009, which are sensitive to exchange rate price risk.
Foreign Currency Forward Contracts
| Reference Currency |
Counterparty | Long or Short |
Settlement Date |
Yen | 12/31/09 Forward Rate |
12/31/09 Market Value USD |
|||||||||
| Yen |
Goldman Sachs International |
Long | 01/08/10 | 409,800,000 | 0.010739 | $ | 4,400,924 | ||||||||
| Yen |
UBS AG | Long | 01/08/10 | 349,710,000 | 0.010739 | 3,755,606 | |||||||||
| Yen |
Goldman Sachs International |
Short | 01/08/10 | (20,780,000 | ) | 0.010739 | (223,161 | ) | |||||||
| Yen |
UBS AG | Short | 01/08/10 | (8,190,000 | ) | 0.010739 | (87,954 | ) | |||||||
75
Table of Contents
The December 31, 2009 USD market value equals the number of Yen multiplied by the forward rate. These notional amounts will increase (decrease) proportionally with increases (decreases) in the forward price. The Fund will generally attempt to adjust its positions in Financial Instruments each day to have $2.00 of exposure to the Yen for every $1.00 of net assets. While the above information properly represents the then current exchange rate price risk and is adequate for estimating the following day’s gains or losses, estimates of future values over longer periods should take the Fund’s daily rebalancing efforts into account. Future period returns, before fees and expenses, cannot be estimated simply by estimating the appreciation or depreciation of the Yen and multiplying by two. See “Item 1A. Risk Factors” of this Annual Report on Form 10-K for additional information regarding performance for periods longer than one day. Counterparty risk related to foreign currency forward contracts is generally limited to the amount of any unrealized gains, although in the event of a counterparty bankruptcy, there could be delays and costs associated with recovering collateral posted in segregated tri-party accounts at the Fund’s custodian bank.
As of December 31, 2008, the ProShares Ultra Yen Fund was exposed to exchange rate price risk through its holdings of Yen/USD foreign currency forward contracts. The following table provides information about the Fund’s positions in these Financial Instruments as of December 31, 2008, which are sensitive to exchange rate price risk.
Foreign Currency Forward Contracts
| Reference Currency |
Counterparty | Long or Short |
Settlement Date |
Yen | 12/31/08 Forward Rate |
12/31/08 Market Value USD |
|||||||||
| Yen |
Goldman Sachs International |
Long | 01/09/09 | 542,135,000 | 0.011019 | $ | 5,974,006 | ||||||||
| Yen |
Goldman Sachs International |
Short | 01/09/09 | (25,660,000 | ) | 0.011019 | (282,758 | ) | |||||||
The December 31, 2008 USD market value equals the number of Yen multiplied by the forward rate. These notional amounts will increase (decrease) proportionally with increases (decreases) in the forward price. The Fund will generally attempt to adjust its positions in Financial Instruments each day to have $2.00 of exposure to the Yen for every $1.00 of net assets. While the above information properly represents the then current exchange rate price risk and is adequate for estimating the following day’s gains or losses, estimates of future values over longer periods should take the Fund’s daily rebalancing efforts into account. Future period returns, before fees and expenses, cannot be estimated simply by estimating the appreciation or depreciation of the Yen and multiplying by two. See “Item 1A. Risk Factors” of this Annual Report on Form 10-K for additional information regarding performance for periods longer than one day. Counterparty risk related to foreign currency forward contracts is generally limited to the amount of any unrealized gains, although in the event of a counterparty bankruptcy, there could be delays and costs associated with recovering collateral posted in segregated tri-party accounts at the Fund’s custodian bank.
ProShares UltraShort Yen:
As of December 31, 2009, the ProShares UltraShort Yen Fund was exposed to exchange rate price risk through its holdings of Yen/USD foreign currency forward contracts. The following table provides information about the Fund’s positions in these Financial Instruments as of December 31, 2009, which are sensitive to exchange rate price risk.
76
Table of Contents
Foreign Currency Forward Contracts
| Reference Currency |
Counterparty | Long or Short |
Settlement Date |
Yen | 12/31/09 Forward Rate |
12/31/09 Market Value USD |
|||||||||
| Yen |
Goldman Sachs International |
Long | 01/08/10 | 87,770,000 | 0.010739 | $ | 942,580 | ||||||||
| Yen |
Goldman Sachs International |
Short | 01/08/10 | (6,109,260,000 | ) | 0.010739 | (65,608,565 | ) | |||||||
| Yen |
UBS AG | Short | 01/08/10 | (6,534,450,000 | ) | 0.010739 | (70,174,765 | ) | |||||||
The December 31, 2009 USD market value equals the number of Yen multiplied by the forward rate. These notional amounts will increase (decrease) proportionally with increases (decreases) in the forward price. The Fund will generally attempt to adjust its positions in Financial Instruments each day to have negative $2.00 of short exposure to the Yen for every $1.00 of net assets. While the above information properly represents the then current exchange rate price risk and is adequate for estimating the following day’s gains or losses, estimates of future values over longer periods should take the Fund’s daily rebalancing efforts into account. Future period returns, before fees and expenses, cannot be estimated simply by estimating the appreciation or depreciation of the Yen and multiplying by two. See “Item 1A. Risk Factors” of this Annual Report on Form 10-K for additional information regarding performance for periods longer than one day. Counterparty risk related to foreign currency forward contracts is generally limited to the amount of any unrealized gains, although in the event of a counterparty bankruptcy, there could be delays and costs associated with recovering collateral posted in segregated tri-party accounts at the Fund’s custodian bank.
As of December 31, 2008, the ProShares UltraShort Yen Fund was exposed to exchange rate price risk through its holdings of Yen/USD foreign currency forward contracts. The following table provides information about the Fund’s positions in these Financial Instruments as of December 31, 2008, which are sensitive to exchange rate price risk.
Foreign Currency Forward Contracts
| Reference Currency |
Counterparty | Long or Short |
Settlement Date |
Yen | 12/31/08 Forward Rate |
12/31/08 Market Value USD |
|||||||||
| Yen |
Goldman Sachs International |
Long | 01/09/09 | 30,925,000 | 0.011019 | $ | 340,775 | ||||||||
| Yen |
Goldman Sachs International |
Short | 01/09/09 | (423,900,000 | ) | 0.011019 | (4,671,126 | ) | |||||||
The December 31, 2008 USD market value equals the number of Yen multiplied by the forward rate. These notional amounts will increase (decrease) proportionally with increases (decreases) in the forward price. The Fund will generally attempt to adjust its positions in Financial Instruments each day to have negative $2.00 of short exposure to the Yen for every $1.00 of net assets. While the above information properly represents the then current exchange rate price risk and is adequate for estimating the following day’s gains or losses, estimates of future values over longer periods should take the Fund’s daily rebalancing efforts into account. Future period returns, before fees and expenses, cannot be estimated simply by estimating the appreciation or depreciation of the Yen and multiplying by two. See “Item 1A. Risk Factors” of this Annual Report on Form 10-K for additional information regarding performance for periods longer than one day. Counterparty risk related to foreign currency forward contracts is generally limited to the amount of any unrealized gains, although in the event of a counterparty bankruptcy, there could be delays and costs associated with recovering collateral posted in segregated tri-party accounts at the Fund’s custodian bank.
77
Table of Contents
Qualitative Disclosure
As described above in Item 7 of this Annual Report on Form 10-K, it is the investment objective of each Fund to seek daily investment results, before fees and expenses, which correspond to twice (200%) the daily performance, whether positive or negative, of its corresponding benchmark. Each Ultra ProShares Fund seeks daily investment results (before fees and expenses) that correspond to twice (200%) the daily performance of its corresponding benchmark. Each UltraShort ProShares Fund seeks daily investment results (before fees and expenses) that correspond to twice (200%) the inverse (opposite) of the daily performance of its corresponding benchmark. The Funds do not seek to achieve these stated investment objectives over a period of time greater than one day because mathematical compounding prevents the Funds from achieving such results. Performance over longer periods of time will be influenced not only by the cumulative period performance of the corresponding benchmark but equally by the intervening volatility of the benchmark as well as fees and expenses, including costs associated with the use of Financial Instruments such as financing costs and trading spreads. Future period returns, before fees and expenses, cannot be estimated simply by estimating the percent change in the corresponding benchmark and multiplying by two or negative two. Investors should monitor their ProShares holdings consistent with their strategies, as frequently as daily. See “Item 1A. Risk Factors” of this Annual Report on Form 10-K for additional information regarding performance for periods longer than one day.
Primary Market Risk Exposure
Each Fund’s investment objective and corresponding benchmark defines the primary market risks that the Funds are exposed to. For example, the primary market risk that the ProShares Ultra DJ-UBS Crude Oil and the ProShares UltraShort DJ-UBS Crude Oil Funds are exposed to are direct and inverse exposure, respectively, to the price of crude oil as measured by the return of holding and periodically rolling crude oil futures contracts (the Dow Jones-UBS Commodity Index and its sub-indexes are based on the price of rolling futures positions, rather than on the cash price for immediate delivery of the corresponding commodity).
Each Fund’s exposure to market risk is further influenced by a number of factors, including the liquidity of the markets in which the contracts are traded and the relationships among the contracts held. The inherent uncertainty of each Fund’s trading as well as the development of drastic market occurrences could ultimately lead to a loss of all or substantially all of investors’ capital.
As described above in Item 7 of this Annual Report on Form 10-K, trading in certain futures contracts or forward agreements involves each Fund entering into contractual commitments to purchase or sell a commodity underlying a Fund’s benchmark at a specified date and price, should it hold such futures contract or forward agreement into the deliverable period. Should a Fund enter into a contractual commitment to sell a physical commodity, it is required to make delivery of that commodity at the contract price and then repurchase the contract at prevailing market prices or settle in cash. Since the repurchase price to which the value of a commodity can rise is unlimited, entering into commitments to sell commodities would expose a Fund to theoretically unlimited risk.
Commodity Price Sensitivity
As further described above in “Item 1A. Risk Factors” of this Annual Report on Form 10-K, the value of the Shares of each Fund relates directly to the value of, and realized profit or loss from, the Financial Instruments and other assets held by the Fund and fluctuations in the price of these assets could materially adversely affect an investment in the Shares. With regard to the Commodity Index Funds or the Commodity Funds, several factors may affect the price of a commodity underlying a Commodity Index Fund or a Commodity Fund, and in turn, the Financial Instruments and other assets, if any, owned by such a Fund. The impact of changes in the price of a physical commodity or of a commodity index (comprised of commodity futures contracts) will affect investors differently depending upon the Fund in which investors invest. Daily increases in the price of an underlying commodity or commodity index will negatively impact the daily performance of Shares of an UltraShort Fund and daily decreases in the price of an underlying commodity or commodity index will negatively impact the daily
78
Table of Contents
performance of Shares of an Ultra Fund. Performance over time is a cumulative effect of geometrically linking each day’s leveraged or inverse leveraged returns. For instance, if a corresponding benchmark was up 10% and then down 10%, which would result in a (1.1*0.9)-1 = -1% period benchmark return, the two-day period return for a theoretical two-times fund would be equal to a (1.2 *0.8)-1 = -4% period Fund return (rather than simply two times the period return of the benchmark).
Exchange Rate Sensitivity
As further described above in “Item 1A. Risk Factors” of this Annual Report on Form 10-K, the value of the Shares of each Fund relates directly to the value of, and realized profit or loss from, the Financial Instruments and other assets held by the Fund and fluctuations in the price of these assets could materially adversely affect an investment in the Shares. With regard to the Currency Funds, several factors may affect the value of the foreign currencies or the U.S. Dollar, and, in turn, the swap agreements, futures contracts, forward contracts thereof and other assets, if any, owned by a Fund. The impact of changes in the price of a currency will affect investors differently depending upon the Fund in which investors invest. Daily increases in the price of a currency will negatively impact the daily performance of Shares of an UltraShort Fund and daily decreases in the price of a currency will negatively impact the daily performance of Shares of an Ultra Fund. Performance over time is a cumulative effect of geometrically linking each day’s leveraged or inverse leveraged returns. For instance, if a corresponding benchmark was up 10% and then down 10%, which would result in a (1.1*0.9)-1 = -1% period benchmark return, the two-day period return for a theoretical two-times fund would be equal to a (1.2 *0.8)-1 = -4% period Fund return (rather than simply two times the period return of the benchmark).
Managing Market Risks
Each Fund seeks to remain fully exposed to the corresponding benchmark at the levels implied by the relevant investment objective (200% or -200%), regardless of market direction or sentiment. As described above in Item 7 of this Annual Report on Form 10-K, this is done through the use of various Financial Instruments. No attempt is made to adjust market exposure in order to avoid changes to the benchmark that would cause the Funds to lose value.
The use of certain Financial Instruments introduces counterparty risk. A Fund will be subject to credit risk with respect to the amount it expects to receive from counterparties to Financial Instruments and repurchase agreements entered into by the Fund. A Fund may be negatively impacted if a counterparty becomes bankrupt or otherwise fails to perform its obligations due to financial difficulties. Each Fund intends to enter into swap and forward agreements only with large, established and well capitalized financial institutions that meet certain credit quality standards and monitoring policies. Each Fund may use various techniques to minimize credit risk including early termination or reset and payment, and limiting the net amount due from any individual counterparty.
Most Financial Instruments held by the Funds are “unfunded” meaning that the Fund will obtain exposure to the corresponding benchmark while still being in possession of its original cash assets. The cash positions that result from use of such Financial Instruments are held in a manner to minimize both interest rate and credit risk. During the reporting period, cash positions were maintained in a non-interest bearing demand deposit account. In the future, it is expected that a portion of this cash will be invested in cash equivalents (such as shares of money market funds, bank deposits, bank money market accounts, certain variable rate-demand notes and repurchase agreements collateralized by government securities).
| Item 8. | Financial Statements and Supplementary Data. |
Statement of Operations for three month periods ended March 31, 2009, June 30, 2009, September 30, 2009, December 31, 2009, the year ended December 31, 2009 and the period from August 6, 2008 (Inception) through December 31, 2008 for each Fund.
79
Table of Contents
PROSHARES ULTRA DJ-UBS COMMODITY
| Three months ended (unaudited) | Year ended December 31, 2009 |
|||||||||||||||||||
| March 31, 2009 |
June 30, 2009 |
September 30, 2009 |
December 31, 2009 |
|||||||||||||||||
| Net investment income (loss) |
$ | (14,679 | ) | $ | (47,980 | ) | $ | (50,418 | ) | $ | (46,918 | ) | $ | (159,995 | ) | |||||
| Net realized and unrealized gain (loss) |
$ | (946,612 | ) | $ | 2,624,628 | $ | 531,418 | $ | 3,063,195 | $ | 5,272,629 | |||||||||
| Net income (loss) |
$ | (961,291 | ) | $ | 2,576,648 | $ | 481,000 | $ | 3,016,277 | $ | 5,112,634 | |||||||||
| Net increase (decrease) in net asset value per share |
$ | (3.34 | ) | $ | 4.02 | $ | 1.36 | $ | 4.01 | $ | 6.05 | |||||||||
| For the period from August 6, 2008 (Inception) through December 31, 2008 |
||||||||||||||||||||
| Net investment income (loss) |
|
$ | (2,396 | ) | ||||||||||||||||
| Net realized and unrealized gain (loss) |
|
$ | (223,668 | ) | ||||||||||||||||
| Net income (loss) |
|
$ | (226,064 | ) | ||||||||||||||||
| Net increase (decrease) in net asset value per share |
|
$ | (2.84 | ) | ||||||||||||||||
PROSHARES ULTRASHORT DJ-UBS COMMODITY
| Three months ended (unaudited) | Year ended December 31, 2009 |
|||||||||||||||||||
| March 31, 2009 |
June 30, 2009 |
September 30, 2009 |
December 31, 2009 |
|||||||||||||||||
| Net investment income (loss) |
$ | (6,595 | ) | $ | (5,935 | ) | $ | (12,170 | ) | $ | (9,990 | ) | $ | (34,690 | ) | |||||
| Net realized and unrealized gain (loss) |
$ | 120,121 | $ | (727,500 | ) | $ | (767,674 | ) | $ | (894,657 | ) | $ | (2,269,710 | ) | ||||||
| Net income (loss) |
$ | 113,526 | $ | (733,435 | ) | $ | (779,844 | ) | $ | (904,647 | ) | $ | (2,304,400 | ) | ||||||
| Net increase (decrease) in net asset value per share |
$ | 1.13 | $ | (7.03 | ) | $ | (2.82 | ) | $ | (3.46 | ) | $ | (12.18 | ) | ||||||
| For the period from August 6, 2008 (Inception) through December 31, 2008 |
||||||||||||||||||||
| Net investment income (loss) |
|
$ | (2,783 | ) | ||||||||||||||||
| Net realized and unrealized gain (loss) |
|
$ | 181,766 | |||||||||||||||||
| Net income (loss) |
|
$ | 178,983 | |||||||||||||||||
| Net increase (decrease) in net asset value per share |
|
$ | 1.80 | |||||||||||||||||
80
Table of Contents
PROSHARES ULTRA DJ-UBS CRUDE OIL
| Three months ended (unaudited) | Year ended December 31, 2009 |
|||||||||||||||||||
| March 31, 2009 |
June 30, 2009 |
September 30, 2009 |
December 31, 2009 |
|||||||||||||||||
| Net investment income (loss) |
$ | (846,128 | ) | $ | (746,857 | ) | $ | (515,805 | ) | $ | (636,683 | ) | $ | (2,745,473 | ) | |||||
| Net realized and unrealized gain (loss) |
$ | (91,178,187 | ) | $ | 159,868,909 | $ | 2,578,193 | $ | 54,825,365 | $ | 126,094,280 | |||||||||
| Net income (loss) |
$ | (92,024,315 | ) | $ | 159,122,052 | $ | 2,062,388 | $ | 54,188,682 | $ | 123,348,807 | |||||||||
| Net increase (decrease) in net asset value per share |
$ | (6.19 | ) | $ | 4.47 | $ | (1.72 | ) | $ | 1.28 | $ | (2.16 | ) | |||||||
| For the period from August 6, 2008 (Inception) through December 31, 2008 |
||||||||||||||||||||
| Net investment income (loss) |
|
$ | (40,674 | ) | ||||||||||||||||
| Net realized and unrealized gain (loss) |
|
$ | 9,956,997 | |||||||||||||||||
| Net income (loss) |
|
$ | 9,916,323 | |||||||||||||||||
| Net increase (decrease) in net asset value per share |
|
$ | (10.22 | ) | ||||||||||||||||
PROSHARES ULTRASHORT DJ-UBS CRUDE OIL
| Three months ended (unaudited) | Year ended December 31, 2009 |
|||||||||||||||||||
| March 31, 2009 |
June 30, 2009 |
September 30, 2009 |
December 31, 2009 |
|||||||||||||||||
| Net investment income (loss) |
$ | (90,843 | ) | $ | (169,058 | ) | $ | (272,083 | ) | $ | (253,332 | ) | $ | (785,316 | ) | |||||
| Net realized and unrealized gain (loss) |
$ | 7,134,043 | $ | (30,655,136 | ) | $ | 14,773,428 | $ | (7,520,380 | ) | $ | (16,268,045 | ) | |||||||
| Net income (loss) |
$ | 7,043,200 | $ | (30,824,194 | ) | $ | 14,501,345 | $ | (7,773,712 | ) | $ | (17,053,361 | ) | |||||||
| Net increase (decrease) in net asset value per share |
$ | 2.14 | $ | (14.20 | ) | $ | (0.39 | ) | $ | (2.86 | ) | $ | (15.31 | ) | ||||||
| For the period from August 6, 2008 (Inception) through December 31, 2008 |
||||
| Net investment income (loss) |
$ | (11,201 | ) | |
| Net realized and unrealized gain (loss) |
$ | (717,759 | ) | |
| Net income (loss) |
$ | (728,960 | ) | |
| Net increase (decrease) in net asset value per share |
$ | 4.00 | ||
81
Table of Contents
PROSHARES ULTRA GOLD
| Three months ended (unaudited) | Year ended December 31, 2009 |
|||||||||||||||||||
| March 31, 2009 |
June 30, 2009 |
September 30, 2009 |
December 31, 2009 |
|||||||||||||||||
| Net investment income (loss) |
$ | (196,244 | ) | $ | (320,496 | ) | $ | (325,204 | ) | $ | (405,256 | ) | $ | (1,247,200 | ) | |||||
| Net realized and unrealized gain (loss) |
$ | (2,772,644 | ) | $ | 2,074,326 | $ | 15,296,192 | $ | 20,443,333 | $ | 35,041,207 | |||||||||
| Net income (loss) |
$ | (2,968,888 | ) | $ | 1,753,830 | $ | 14,970,988 | $ | 20,038,077 | $ | 33,794,007 | |||||||||
| Net increase (decrease) in net asset value per share |
$ | 2.28 | $ | 0.60 | $ | 3.95 | $ | 6.43 | $ | 13.26 | ||||||||||
| For the period from August 6, 2008 (Inception) through. December 31, 2008 |
||||||||||||||||||||
| Net investment income (loss) |
|
$ | (10,430 | ) | ||||||||||||||||
| Net realized and unrealized gain (loss) |
|
$ | 1,721,234 | |||||||||||||||||
| Net income (loss) |
|
$ | 1,710,804 | |||||||||||||||||
| Net increase (decrease) in net asset value per share |
|
$ | 5.82 | |||||||||||||||||
PROSHARES ULTRASHORT GOLD
| Three months ended (unaudited) | Year ended December 31, 2009 |
|||||||||||||||||||
| March 31, 2009 |
June 30, 2009 |
September 30, 2009 |
December 31, 2009 |
|||||||||||||||||
| Net investment income (loss) |
$ | (70,888 | ) | $ | (113,001 | ) | $ | (97,496 | ) | $ | (121,398 | ) | $ | (402,783 | ) | |||||
| Net realized and unrealized gain (loss) |
$ | (4,548,861 | ) | $ | (3,440,899 | ) | $ | (5,881,067 | ) | $ | (3,642,003 | ) | $ | (17,512,830 | ) | |||||
| Net income (loss) |
$ | (4,619,749 | ) | $ | (3,553,900 | ) | $ | (5,978,563 | ) | $ | (3,763,401 | ) | $ | (17,915,613 | ) | |||||
| Net increase (decrease) in net asset value per share |
$ | (3.18 | ) | $ | (1.12 | ) | $ | (2.11 | ) | $ | (2.48 | ) | $ | (8.89 | ) | |||||
| For the period from August 6, 2008 (Inception) through December 31, 2008 |
||||||||||||||||||||
| Net investment income (loss) |
|
$ | (2,370 | ) | ||||||||||||||||
| Net realized and unrealized gain (loss) |
|
$ | (659,607 | ) | ||||||||||||||||
| Net income (loss) |
|
$ | (661,977 | ) | ||||||||||||||||
| Net increase (decrease) in net asset value per share |
|
$ | (5.63 | ) | ||||||||||||||||
82
Table of Contents
PROSHARES ULTRA SILVER
| Three months ended (unaudited) | Year ended December 31, 2009 |
|||||||||||||||||||
| March 31, 2009 |
June 30, 2009 |
September 30, 2009 |
December 31, 2009 |
|||||||||||||||||
| Net investment income (loss) |
$ | (68,995 | ) | $ | (160,903 | ) | $ | (216,521 | ) | $ | (312,275 | ) | $ | (758,694 | ) | |||||
| Net realized and unrealized gain (loss) |
$ | 4,250,528 | $ | 2,380,569 | $ | 30,374,574 | $ | (830,079 | ) | $ | 36,175,592 | |||||||||
| Net income (loss) |
$ | 4,181,533 | $ | 2,219,666 | $ | 30,158,053 | $ | (1,142,354 | ) | $ | 35,416,898 | |||||||||
| Net increase (decrease) in net asset value per share |
$ | 11.22 | $ | 2.79 | $ | 13.34 | $ | 1.08 | $ | 28.43 | ||||||||||
| For the
period from August 6, 2008 (Inception) through December 31, 2008 |
||||||||||||||||||||
| Net investment income (loss) |
|
$ | (3,611 | ) | ||||||||||||||||
| Net realized and unrealized gain (loss) |
|
$ | 133,347 | |||||||||||||||||
| Net income (loss) |
|
$ | 129,736 | |||||||||||||||||
| Net increase (decrease) in net asset value per share |
|
$ | 3.60 | |||||||||||||||||
PROSHARES ULTRASHORT SILVER
| Three months ended (unaudited) | Year ended December 31, 2009 |
|||||||||||||||||||
| March 31, 2009 |
June 30, 2009 |
September 30, 2009 |
December 31, 2009 |
|||||||||||||||||
| Net investment income (loss) |
$ | (25,274 | ) | $ | (86,494 | ) | $ | (132,872 | ) | $ | (144,263 | ) | $ | (388,903 | ) | |||||
| Net realized and unrealized gain (loss) |
$ | (1,539,496 | ) | $ | (2,361,812 | ) | $ | (24,882,957 | ) | $ | (9,006,921 | ) | $ | (37,791,186 | ) | |||||
| Net income (loss) |
$ | (1,564,770 | ) | $ | (2,448,306 | ) | $ | (25,015,829 | ) | $ | (9,151,184 | ) | $ | (38,180,089 | ) | |||||
| Net increase (decrease) in net asset value per share |
$ | (8.12 | ) | $ | (2.58 | ) | $ | (3.38 | ) | $ | (0.81 | ) | $ | (14.89 | ) | |||||
| For the period from August 6, 2008 (Inception) through December 31, 2008 |
||||||||||||||||||||
| Net investment income (loss) |
|
$ | (1,870 | ) | ||||||||||||||||
| Net realized and unrealized gain (loss) |
|
$ | (538,959 | ) | ||||||||||||||||
| Net income (loss) |
|
$ | (540,829 | ) | ||||||||||||||||
| Net increase (decrease) in net asset value per share |
|
$ | (5.40 | ) | ||||||||||||||||
PROSHARES ULTRA EURO
| Three months ended (unaudited) | Year ended December 31, 2009 |
|||||||||||||||||||
| March 31, 2009 |
June 30, 2009 |
September 30, 2009 |
December 31, 2009 |
|||||||||||||||||
| Net investment income (loss) |
$ | (11,076 | ) | $ | (13,792 | ) | $ | (17,177 | ) | $ | (18,671 | ) | $ | (60,716 | ) | |||||
| Net realized and unrealized gain (loss) |
$ | (335,533 | ) | $ | 621,312 | $ | 622,620 | $ | (346,375 | ) | $ | 562,024 | ||||||||
| Net income (loss) |
$ | (346,609 | ) | $ | 607,520 | $ | 605,443 | $ | (365,046 | ) | $ | 501,308 | ||||||||
| Net increase (decrease) in net asset value per share |
$ | (2.96 | ) | $ | 2.88 | $ | 2.43 | $ | (1.46 | ) | $ | 0.89 | ||||||||
83
Table of Contents
| For the period from August 6, 2008 (Inception) through December 31, 2008 |
||||||||||||
| Net investment income (loss) |
$ | (2,894 | ) | |||||||||
| Net realized and unrealized gain (loss) |
$ | 430,635 | ||||||||||
| Net income (loss) |
$ | 427,741 | ||||||||||
| Net increase (decrease) in net asset value per share |
$ | 4.24 | ||||||||||
PROSHARES ULTRASHORT EURO
| Three months ended (unaudited) | Year ended December 31, 2009 |
|||||||||||||||||||
| March 31, 2009 |
June 30, 2009 |
September 30, 2009 |
December 31, 2009 |
|||||||||||||||||
| Net investment income (loss) |
$ | (58,136 | ) | $ | (86,464 | ) | $ | (87,627 | ) | $ | (117,502 | ) | $ | (349,729 | ) | |||||
| Net realized and unrealized gain (loss) |
$ | (2,865,163 | ) | $ | (4,426,776 | ) | $ | (3,637,848 | ) | $ | 2,423,580 | $ | (8,506,207 | ) | ||||||
| Net income (loss) |
$ | (2,923,299 | ) | $ | (4,513,240 | ) | $ | (3,725,475 | ) | $ | 2,306,078 | $ | (8,855,936 | ) | ||||||
| Net increase (decrease) in net asset value per share |
$ | 1.54 | $ | (2.68 | ) | $ | (1.76 | ) | $ | 0.63 | $ | (2.27 | ) | |||||||
| For the period from August 6, 2008 (Inception) through December 31, 2008 |
||||||||||||||||||||
| Net investment income (loss) |
|
$ | (3,574 | ) | ||||||||||||||||
| Net realized and unrealized gain (loss) |
|
$ | (342,153 | ) | ||||||||||||||||
| Net income (loss) |
|
$ | (345,727 | ) | ||||||||||||||||
| Net increase (decrease) in net asset value per share |
|
$ | (4.05 | ) | ||||||||||||||||
PROSHARES ULTRA YEN
| Three months ended (unaudited) | Year ended December 31, 2009 |
|||||||||||||||||||
| March 31, 2009 |
June 30, 2009 |
September 30, 2009 |
December 31, 2009 |
|||||||||||||||||
| Net investment income (loss) |
$ | (8,114 | ) | $ | (8,422 | ) | $ | (10,320 | ) | $ | (9,867 | ) | $ | (36,723 | ) | |||||
| Net realized and unrealized gain (loss) |
$ | (752,697 | ) | $ | 145,261 | $ | 563,132 | $ | (312,026 | ) | $ | (356,330 | ) | |||||||
| Net income (loss) |
$ | (760,811 | ) | $ | 136,839 | $ | 552,812 | $ | (321,893 | ) | $ | (393,053 | ) | |||||||
| Net increase (decrease) in net asset value per share |
$ | (4.82 | ) | $ | 1.10 | $ | 3.56 | $ | (2.15 | ) | $ | (2.31 | ) | |||||||
| For the period from August 6, 2008 (Inception) through December 31, 2008 |
||||||||||||||||||||
| Net investment income (loss) |
|
$ | (2,671 | ) | ||||||||||||||||
| Net realized and unrealized gain (loss) |
|
$ | 347,374 | |||||||||||||||||
| Net income (loss) |
|
$ | 344,703 | |||||||||||||||||
| Net increase (decrease) in net asset value per share |
|
$ | 3.45 | |||||||||||||||||
84
Table of Contents
PROSHARES ULTRASHORT YEN
| Three months ended (unaudited) | Year ended December 31, 2009 |
|||||||||||||||||||
| March 31, 2009 |
June 30, 2009 |
September 30, 2009 |
December 31, 2009 |
|||||||||||||||||
| Net investment income (loss) |
$ | (53,299 | ) | $ | (121,257 | ) | $ | (67,848 | ) | $ | (106,538 | ) | $ | (348,942 | ) | |||||
| Net realized and unrealized gain (loss) |
$ | 4,105,784 | $ | (4,771,301 | ) | $ | (4,501,610 | ) | $ | 3,854,790 | $ | (1,312,337 | ) | |||||||
| Net income (loss) |
$ | 4,052,485 | $ | (4,892,558 | ) | $ | (4,569,458 | ) | $ | 3,748,252 | $ | (1,661,279 | ) | |||||||
| Net increase (decrease) in net asset value per share |
$ | 3.58 | $ | (1.72 | ) | $ | (3.34 | ) | $ | 1.24 | $ | (0.24 | ) | |||||||
| For the period from August 6, 2008 (Inception) through December 31, 2008 |
||||||||||||||||||||
| Net investment income (loss) |
|
$ | (2,148 | ) | ||||||||||||||||
| Net realized and unrealized gain (loss) |
|
$ | (331,585 | ) | ||||||||||||||||
| Net income (loss) |
|
$ | (333,733 | ) | ||||||||||||||||
| Net increase (decrease) in net asset value per share |
|
$ | (3.34 | ) | ||||||||||||||||
See the Index to Financial Statements on Page F-1 for a list of the financial statements being filed as part of this Annual Report on Form 10-K. Those Financial Statements, and the notes and schedules related thereto, are incorporated by reference into this Item 8.
| Item 9. | Changes in and Disagreements With Accountants on Accounting and Financial Disclosure. |
Not applicable.
| Item 9A. | Controls and Procedures. |
Disclosure Controls and Procedures
Under the supervision and with the participation of the principal executive officer and principal financial officer of the Trust, Trust management has evaluated the effectiveness of the Funds’ disclosure controls and procedures, and have concluded that the disclosure controls and procedures of the Funds(as defined in Rule 13a-15(e) and 15d-15(e) under the Securities Exchange Act of 1934, as amended) were effective, as of December 31, 2009, to provide reasonable assurance that information required to be disclosed in the reports that the Trust files or submits under the 1934 Act on behalf of the Funds is recorded, processed, summarized and reported, within the time periods specified in the applicable rules and forms, and that it is accumulated and communicated to the duly authorized officers of the Trust as appropriate to allow timely decisions regarding required disclosure.
Management’s Annual Report on Internal Control Over Financial Reporting
The Trust’s Management takes responsibility for establishing and maintaining adequate internal control over financial reporting of the Funds, as defined in 1934 Act Rules 13a-15(f) and 15d-15(f). The Funds’ internal control over financial reporting is a process designed to provide reasonable assurance regarding the reliability of financial reporting and the preparation of financial statements for external purposes in accordance with accounting principles generally accepted in the United States of America. Internal control over financial reporting includes those policies and procedures that: (1) pertain to the maintenance of records that, in reasonable detail, accurately and fairly reflect the transactions and dispositions of the assets of the Funds; (2) provide reasonable assurance that transactions are recorded as necessary to permit preparation of financial statements in
85
Table of Contents
accordance with generally accepted accounting principles, and that the Funds’ receipts and expenditures are being made only in accordance with appropriate authorizations of management of the Trust on behalf of the Funds; and (3) provide reasonable assurance regarding prevention or timely detection of unauthorized acquisition, use or disposition of the Funds’ assets that could have a material effect on the Funds’ financial statements.
Because of its inherent limitations, internal control over financial reporting may not prevent or detect misstatements. Also, projections of any evaluation of effectiveness to future periods are subject to the risk that controls may become inadequate because of changes in conditions, or that the degree of compliance with the policies or procedures may deteriorate.
The principal executive officer and principal financial officer of the Trust assessed the effectiveness of the Funds’ internal control over financial reporting as of December 31, 2009. Their assessment included an evaluation of the design of the Funds’ internal control over financial reporting and testing of the operational effectiveness of their internal control over financial reporting. In making its assessment, the Trust’s management has utilized the criteria set forth by the Committee of Sponsoring Organizations of the Treadway Commission (COSO) in its report entitled Internal Control – Integrated Framework. Based on their assessment and those criteria, the principal executive officer and principal financial officer of the Trust concluded that the Funds’ internal control over financial reporting was effective as of December 31, 2009.
The effectiveness of the Funds’ internal control over financial reporting as of December 31, 2009 has been audited by PricewaterhouseCoopers LLP, the independent registered public accounting firm, as stated in their report which is included herein.
Changes in Internal Control over Financial Reporting
There were no changes in the Funds’ internal control over financial reporting that occurred during the quarter ended December 31, 2009 that have materially affected, or are reasonably likely to materially affect, the Funds’ internal control over financial reporting.
| Item 9B. | Other Information. |
Not applicable.
86
Table of Contents
| Item 10. | Directors, Executive Officers and Corporate Governance. |
The Sponsor
ProShare Capital Management LLC is the Sponsor of the Trust and the Funds. The Sponsor has exclusive management and control of all aspects of the business of each Fund. The Trustee has no duty or liability to supervise the performance of the Sponsor, nor will the Trustee have any liability for the acts or omissions of the Sponsor. The Sponsor serves as the Trust’s commodity pool operator and commodity trading advisor.
Specifically, with respect to the Trust, the Sponsor:
| • | selects the Funds’ service providers; |
| • | negotiates various agreements and fees; |
| • | performs such other services as the Sponsor believes that the Trust may require from time-to-time; |
| • | selects the FCM and Financial Instrument counterparties; |
| • | manages each Fund’s portfolio of other assets, including cash equivalents; and |
| • | manages the Funds with a view toward achieving the Funds’ investment objectives. |
Background and Principals
The Sponsor serves as both commodity pool operator and commodity trading advisor of the Trust and each Fund. The Sponsor is registered as a commodity pool operator and commodity trading advisor with the CFTC and is a member of the NFA and is a member in good standing of the NFA. The Sponsor’s membership with the NFA was originally approved on June 11, 1999. It withdrew its registration with the NFA on August 31, 2000 but later re-applied and had its registration subsequently approved on January 8, 2001. Its membership with the NFA is currently effective. The Sponsor’s registration as a commodity trading advisor was approved on June 11, 1999 and is currently effective. The Sponsor’s registration as a commodity pool operator was originally approved on June 11, 1999. It withdrew its registration as a commodity pool operator on August 30, 2000 but later re-applied and had its registration subsequently approved on November 28, 2007. Its registration as a commodity pool operator is currently effective. Its principal place of business is 7501 Wisconsin Avenue, Suite 1000, Bethesda, Maryland 20814, telephone number (240) 497-6400. The registration of the Sponsor with the CFTC and its membership in the NFA must not be taken as an indication that either the CFTC or the NFA has recommended or approved the Sponsor, the Trust and each Fund.
In its capacity as a commodity pool operator, the Sponsor is an organization which operates or solicits funds for commodity pools; that is, an enterprise in which funds contributed by a number of persons are combined for the purpose of trading futures contracts. In its capacity as a commodity trading advisor, the Sponsor is an organization which, for compensation or profit, advises others as to the value of or the advisability of buying or selling futures contracts.
87
Table of Contents
Executive Officers of the Trust and Principals and Significant Employees of the Sponsor
| Name |
Position | |
| Michael L. Sapir |
Chief Executive Officer and Principal of the Sponsor | |
| Louis M. Mayberg |
Principal Executive Officer of the Trust; Chief Financial Officer and | |
| William E. Seale |
Principal of the Sponsor | |
| Sapir Family Trust |
Principal of the Sponsor | |
| Northstar Trust |
Principal of the Sponsor | |
| Edward J. Karpowicz |
Principal Financial Officer of the Trust | |
| Todd B. Johnson |
Chief Investment Officer and Principal of the Sponsor | |
| Howard S. Rubin |
Director, Portfolio Management and Associated Person of the Sponsor | |
| Steven Schoffstall |
Portfolio Manager and Associated Person of the Sponsor | |
| Michelle Liu |
Portfolio Manager and Associated Person of the Sponsor | |
| Lisa P. Johnson |
Principal of the Sponsor | |
| Victor M. Frye |
Principal of the Sponsor |
The following is a biographical summary of the business experience of the executive officers of the Trust and the principals and significant employees of the Sponsor.
ProFund Advisors LLC (“PFA”) and ProShare Advisors LLC (“PSA”) are investment advisers registered under the Investment Advisers Act of 1940.
Michael L. Sapir, Chairman, Chief Executive Officer and a listed principal of the Sponsor since August 14, 2008; Chairman, Chief Executive Officer and a member of PFA since April 1997; and Chairman, Chief Executive Officer and a member of PSA since January 2005. As Chairman and Chief Executive Officer of the Sponsor, PSA and PFA, Mr. Sapir’s responsibilities include oversight of all aspects of the Sponsor, PSA and PFA, respectively.
Louis M. Mayberg, Chief Financial Officer, a member and a listed principal of the Sponsor since June 9, 2008; a member of PFA since April 1997; and a member of PSA, since January 2005. Principal Executive Officer of the Trust since June 2008. As Chief Financial Officer of the Sponsor, Mr. Mayberg’s responsibilities include oversight of the financial matters of the Sponsor. As Principal Executive Officer of the Trust, his responsibilities include oversight of operations of the Trust. Mr. Mayberg is 47 years old.
William E. Seale, Ph.D., a member of the Sponsor and a listed principal and a registered associated person of the Sponsor since June 11, 1999 and an NFA associated member since January 8, 2001; a member of PFA since April 1997 and a member of PSA since April 2005. As a principal and an associated person of the Sponsor, Dr. Seale is responsible for approving the trading model upon which Fund trading decisions are made. Dr. Seale has been the Chief Economist of PFA and PSA since April 2005. As Chief Economist, Dr. Seale is responsible for oversight of general economic conditions impacting the business of PFA and PSA and for contributing to product development. He served as Chief Investment Officer of PFA from January 2003 to July 2005 and from October 2006 to June 2008 and Director of Portfolio from January 1997 to January 2003. He served as Chief Investment Officer of PSA from October 2006 to June 2008. In these roles, Dr. Seale’s responsibilities included oversight of the investment management activities of the respective entities. Dr. Seale is a former commissioner of the U.S. Commodity Futures Trading Commission.
Sapir Family Trust, a listed principal of the Sponsor. The Sapir Family Trust has ownership interest in the Sponsor and PSA. The Sapir Family Trust has passive ownership interest in the Sponsor and exercises no management authority over the Funds.
88
Table of Contents
Northstar Trust, a listed principal of the Sponsor. Northstar Trust has ownership interest in Sponsor and PFA. Northstar Trust has passive ownership interest in the Sponsor and exercises no management authority over the Funds.
Edward J. Karpowicz, Principal Financial Officer of the Trust since July 2008. Mr. Karpowicz has been employed by PFA since July 2002 as Vice President of Financial Administration. Mr. Karpowicz is 47 years old.
Todd B. Johnson, a listed principal of the Sponsor since January 16, 2009 and Chief Investment Officer of the Sponsor since February 27, 2009. In this role, Mr. Johnson’s responsibilities include oversight of the investment management activities of the Sponsor. Mr. Johnson has served as Chief Investment Officer of PSA and PFA since December 2008. Prior to December 2008, Mr. Johnson served at World Asset Management (a financial services firm) – President and Chief Investment Officer, January 2006 to December 2008; Managing Director and Chief Investment Officer, Quantitative Investments, January 2002 to December 2005.
Howard Rubin, CFA, a registered associated person and an NFA associate member of the Sponsor since July 14, 2008 and Director, Portfolio Management of the Sponsor since December 1, 2009. In these roles, Mr. Rubin’s responsibilities include day-to-day portfolio management of the Funds. Mr. Rubin has served as Senior Portfolio Manager of PSA since December 2007 and Senior Portfolio Manager of the Sponsor from November 27, 2008 through November 30, 2009. Mr. Rubin has also served as Senior Portfolio Manager of PFA since November 2004 and Portfolio Manager of PFA from April 2000 through November 2004. Mr. Rubin holds the Chartered Financial Analyst (CFA) designation.
Steve Schoffstall, a registered associated person and an NFA associate member of the Sponsor since June 9, 2008, and June 2, 2008, respectively, and Portfolio Manager of the Sponsor since December 1, 2009. In these roles, Mr. Schoffstall’s responsibilities include day-to-day portfolio management of the Commodity Index Funds and Commodity Funds. Mr. Schoffstall has served as Associate Portfolio Manager of PSA since September 2007; Associate Portfolio Manager of the Sponsor from July 1, 2008 through November 30, 2009; Portfolio Analyst of PSA from May 2007 to September 2007; Junior Portfolio Analyst of PSA from December 2006 to May 2007; Portfolio Operations Specialist of PSA from June 2006 to December 2006. Mr. Schoffstall has also served as Portfolio Group Team Member and ETF Portfolio Operations Specialist of PFA from February 2005 to June 2006. Prior to February 2005, Mr. Schoffstall was not employed in the financial services industry.
Michelle Liu, a registered associated person and an NFA associate member of the Sponsor since June 12, 2009 and Portfolio Manager of the Sponsor since December 1, 2009. In these roles, Ms. Liu’s responsibilities include day-to-day portfolio management of the Currency Funds. Ms. Liu serves as a Portfolio Manager of PSA and PFA since December 2009 and served as Associate Portfolio Manager of PSA from November 2007 to November 2009. Ms. Liu has also served at FINRA as a Senior Market Operations Analyst from July 2006 through November 2007 and as a Fixed Income Domain Lead/Specialist from March 2004 through July 2006.
Lisa P. Johnson, a listed principal of the Sponsor since November 11, 2008. Ms. Johnson’s responsibilities include the review and approval of advertising material of the Sponsor. Ms. Johnson has been employed with ProFunds Distributors Inc. (“PDI”) since April 2008 as Head of Compliance. Prior to her employment with PDI, Ms. Johnson was the Senior Corporate Compliance Officer for ICMA Retirement Corporation (a financial services company) where she was employed from February 2005 to April 2008. She served as Senior Compliance Officer for Delaware Investments (a financial services firm) from January 2001 to February 2005. Ms. Johnson is FINRA registered and holds Series 7, 24 and 63 licenses. She also possesses a Certified Regulatory and Compliance Professional designation, from the NASD Institute at Wharton.
Victor Frye, a listed principal of the Sponsor since December 2, 2008. Mr. Frye’s responsibilities include the review and approval of advertising material of the Sponsor. Mr. Frye has been employed by PSA since October 2002 as Counsel and Chief Compliance Officer.
89
Table of Contents
Code of Ethics
The Trust has adopted a code of ethics (“Code of Ethics”) that applies to its Principal Executive Officer and Principal Financial Officer. A copy of the Code of Ethics can be obtained, without charge, upon written request to the Sponsor at the following address: ProShare Capital Management LLC, Attn: General Counsel, 7501 Wisconsin Avenue, Suite 1000, Bethesda, MD 20814.
| Item 11. | Executive Compensation. |
The Funds have no employees or directors and are managed by the Sponsor. None of the officers of the Trust, nor the members or officers of the Sponsor receive compensation from the Funds.
The Sponsor receives a monthly Management Fee equal to 1/12th or 0.05% (0.95% annually) of the average daily net asset value per share at the end of each month to the extent that such amounts cumulatively exceed the organization and offering costs incurred by each Fund. For the year ended December 31, 2009, the following represents Management Fees earned by the Sponsor:
| Fund |
|||
| ProShares Ultra DJ-UBS Commodity |
$ | 95,273 | |
| ProShares UltraShort DJ-UBS Commodity |
3,100 | ||
| ProShares Ultra DJ-UBS Crude Oil |
2,460,980 | ||
| ProShares UltraShort DJ-UBS Crude Oil |
442,423 | ||
| ProShares Ultra Gold |
1,014,224 | ||
| ProShares UltraShort Gold |
131,683 | ||
| ProShares Ultra Silver |
710,900 | ||
| ProShares UltraShort Silver |
257,865 | ||
| ProShares Ultra Euro |
7,827 | ||
| ProShares UltraShort Euro |
303,788 | ||
| ProShares Ultra Yen |
4,210 | ||
| ProShares UltraShort Yen |
304,905 | ||
| Item 12. | Security Ownership of Certain Beneficial Owners and Management and Related Stockholder Matters. |
Not applicable.
| Item 13. | Certain Relationships and Related Transactions, and Director Independence. |
See “Item 11. Executive Compensation” of this Annual Report on Form 10-K.
| Item 14. | Principal Accountant Fees and Services. |
(1) to (4). Fees for services performed by PricewaterhouseCoopers LLP (“PwC”) for the year ended December 31, 2009 and the period ended December 31, 2008 were as follows:
| Year Ended December 31, 2009 |
Period Ended December 31, 2008 | |||||
| Audit Fees |
$ | 573,000 | $ | 411,500 | ||
| Audit-Related Fees |
— | — | ||||
| Tax Fees |
$ | 1,977,600 | $ | 1,412,900 | ||
| All Other Fees |
— | — | ||||
| Total |
$ | 2,550,600 | $ | 1,824,400 | ||
90
Table of Contents
Audit fees for the year ended December 31, 2009 consist of fees paid to PwC for the audit of the Funds’ December 31, 2009 annual financial statements included in this Annual Report on Form 10-K for the year ended December 31, 2009. Audit fees for the period ended December 31, 2008 consist of fees paid to PwC for the audits of the Funds’ August 6, 2008 financial statements included in the Index to Financial Information in the Trust’s Registration Statement on Form S-1 (No. 333-146801) and the Funds’ December 31, 2008 annual financial statements included in its Annual Report on Form 10-K for the period ended December 31, 2008. Audit fees for the year ended December 31, 2009 and the period ended December 31, 2008 also covered services that are normally provided by the independent registered public accountants in connection with statutory and regulatory filings of registration statements.
Tax fees include certain tax compliance and reporting services provided by PwC to the Trust, including processing beneficial ownership information as it relates to the preparation of tax reporting packages and the subsequent delivery of related information to the IRS. Services also include assistance with tax reporting and related information using a web-based tax package product developed by PwC and a toll-free tax package support help line.
(5) The Sponsor approved all of the services provided by PwC described above. The Sponsor pre-approves all audit and allowed non-audit services of the Trust’s independent registered public accounting firm, including all engagement fees and terms.
(6) None of the hours expended on PwC’s engagement to audit each Fund’s financial statements for the year ended December 31, 2009 or the period ended December 31, 2008 were attributable to work performed by persons other than the principal accountant’s full-time, permanent employees.
91
Table of Contents
| Item 15. | Exhibits and Financial Statement Schedules. |
See the Index to Financial Statements on Page F-1 for a list of the financial statements being filed as part of this Annual Report on Form 10-K. Schedules may have been omitted since they are either not required, not applicable, or the information has otherwise been included.
| Exhibit No. |
Description of Document | |
| 4.1 | Trust Agreement of ProShares Trust II (1) | |
| 4.2 | Amended and Restated Trust Agreement of ProShares Trust II (2) | |
| 4.2.1 | Amended and Restated Trust Agreement of ProShares Trust II (3) | |
| 4.3 | Form of Authorized Participant Agreement (4) | |
| 10.1 | Form of Sponsor Agreement (2) | |
| 10.2 | Form of Administration and Transfer Agency Services Agreement (4) | |
| 10.3 | Form of Custodian Agreement (5) | |
| 10.4 | Form of Distribution Agreement (4) | |
| 10.5 | Form of Futures Account Agreement (4) | |
| 23.1 | Consent of Independent Registered Public Accounting Firm (6) | |
| 31.1 | Certification by Principal Executive Officer of the Trust Pursuant to Rule 13a-14(a) under the Securities Exchange Act of 1934, as amended (6) | |
| 31.2 | Certification by Principal Financial Officer of the Trust Pursuant to Rule 13a-14(a) under the Securities Exchange Act of 1934, as amended (6) | |
| 32.1 | Certification by Principal Executive Officer of the Trust Pursuant to 18 U.S.C. Section 1350, As Adopted Pursuant to Section 906 of the Sarbanes-Oxley Act of 2002 (7) | |
| 32.2 | Certification by Principal Financial Officer of the Trust Pursuant to 18 U.S.C. Section 1350, As Adopted Pursuant to Section 906 of the Sarbanes-Oxley Act of 2002 (7) | |
| (1) | Incorporated by reference to the Trust’s Registration Statement, filed on October 18, 2007. |
| (2) | Incorporated by reference to the Trust’s Registration Statement, filed on August 15, 2008. |
| (3) | Incorporated by reference to the Trust’s Registration Statement, filed on September 18, 2008. |
| (4) | Incorporated by reference to the Trust’s Registration Statement, filed on November 17, 2008. |
| (5) | Incorporated by reference to the Trust’s Registration Statement, filed on October 22, 2008. |
| (6) | Filed herewith. |
| (7) | Furnished herewith. |
92
Table of Contents
ProShares Trust II
Financial Statements as of December 31, 2009
Index
| Documents |
Page | |
| F-2 | ||
| F-3 | ||
| F-9 | ||
| F-15 | ||
| F-21 | ||
| F-27 | ||
| F-33 | ||
| F-39 | ||
| F-45 | ||
| F-51 | ||
| F-57 | ||
| F-63 | ||
| F-69 | ||
| F-75 |
F-1
Table of Contents
Reports of Independent Registered Public Accounting Firm
To the Shareholders of ProShares Trust II:
In our opinion, the accompanying statements of financial condition and the related statement of operations, changes in shareholders’ equity and of cash flows present fairly, in all material respects, the financial position of the following twelve funds included in the ProShares Trust II:
(collectively the “Funds”) at December 31, 2009 and December 31, 2008, and the results of each of their operations, changes in each of their shareholders’ equity and each of their cash flows for the year ended December 31, 2009 and the period August 6, 2008 (Inception) through December 31, 2008 in conformity with accounting principles generally accepted in the United States of America. Also in our opinion, the Trust maintained, in all material respects, effective internal control over financial reporting of the Funds as of December 31, 2009, based on criteria established in Internal Control—Integrated Framework issued by the Committee of Sponsoring Organizations of the Treadway Commission (COSO). The Trust’s management is responsible for the Funds’ financial statements, for maintaining effective internal control over financial reporting and for its assessment of the effectiveness of internal control over financial reporting included in Management’s Annual Report on Internal Control Over Financial Reporting under Item 9A. Our responsibility is to express opinions on these financial statements and on the Funds’ internal control over financial reporting based on our audits (which was an integrated audit in 2009). We conducted our audits in accordance with the standards of the Public Company Accounting Oversight Board (United States). Those standards require that we plan and perform the audits to obtain reasonable assurance about whether the financial statements are free of material misstatement and whether effective internal control over financial reporting was maintained in all material respects. Our audits of the financial statements included examining, on a test basis, evidence supporting the amounts and disclosures in the financial statements, assessing the accounting principles used and significant estimates made by management, and evaluating the overall financial statement presentation. Our audit of internal control over financial reporting included obtaining an understanding of internal control over financial reporting, assessing the risk that a material weakness exists, and testing and evaluating the design and operating effectiveness of internal control based on the assessed risk. Our audits also included performing such other procedures as we considered necessary in the circumstances. We believe that our audits provide a reasonable basis for our opinions.
A company’s internal control over financial reporting is a process designed to provide reasonable assurance regarding the reliability of financial reporting and the preparation of financial statements for external purposes in accordance with generally accepted accounting principles. A company’s internal control over financial reporting includes those policies and procedures that (i) pertain to the maintenance of records that, in reasonable detail, accurately and fairly reflect the transactions and dispositions of the assets of the company; (ii) provide reasonable assurance that transactions are recorded as necessary to permit preparation of financial statements in accordance with generally accepted accounting principles, and that receipts and expenditures of the company are being made only in accordance with authorizations of management and directors of the company; and (iii) provide reasonable assurance regarding prevention or timely detection of unauthorized acquisition, use, or disposition of the company’s assets that could have a material effect on the financial statements.
Because of its inherent limitations, internal control over financial reporting may not prevent or detect misstatements. Also, projections of any evaluation of effectiveness to future periods are subject to the risk that controls may become inadequate because of changes in conditions, or that the degree of compliance with the policies or procedures may deteriorate.
/s/ PricewaterhouseCoopers LLP
PricewaterhouseCoopers LLP
Columbus, Ohio
March 1, 2010
F-2
Table of Contents
PROSHARES ULTRA DJ-UBS COMMODITY
STATEMENTS OF FINANCIAL CONDITION
| December 31, 2009 | December 31, 2008 | ||||||
| Assets |
|||||||
| Cash |
$ | 78,112 | $ | 1,745,354 | |||
| Segregated cash balances for swap agreements |
— | 1,335,000 | |||||
| Short-term U.S. government and agency obligations (Note 3) |
18,503,052 | — | |||||
| Unrealized appreciation on swap agreements |
1,177,968 | 184,583 | |||||
| Receivable from Sponsor |
— | 33,411 | |||||
| Offering costs (Note 5) |
— | 69,640 | |||||
| Total assets |
19,759,132 | 3,367,988 | |||||
| Liabilities and shareholders’ equity |
|||||||
| Liabilities |
|||||||
| Management fee payable |
15,200 | — | |||||
| Accounts payable |
— | 42,977 | |||||
| Total liabilities |
15,200 | 42,977 | |||||
| Shareholders’ equity |
|||||||
| Paid-in capital |
14,857,362 | 3,551,075 | |||||
| Accumulated earnings (deficit) |
4,886,570 | (226,064 | ) | ||||
| Total shareholders’ equity |
19,743,932 | 3,325,011 | |||||
| Total liabilities and shareholders’ equity |
$ | 19,759,132 | $ | 3,367,988 | |||
| Shares outstanding |
700,014 | 150,014 | |||||
| Net asset value per share |
$ | 28.21 | $ | 22.16 | |||
| Market value per share (Note 2) |
$ | 28.43 | $ | 22.15 | |||
See accompanying notes to financial statements.
F-3
Table of Contents
PROSHARES ULTRA DJ-UBS COMMODITY
SCHEDULE OF INVESTMENTS
DECEMBER 31, 2009
| Principal Amount | Value | |||||
| Short-term U.S. government and agency obligations |
||||||
| Federal Agricultural Mortgage Corp., Discount Notes: |
||||||
| 0.010% due 01/07/10 |
$ | 1,000,000 | $ | 999,999 | ||
| Federal Home Loan Bank, Discount Notes: |
||||||
| 0.001% due 01/27/10 |
4,557,000 | 4,556,997 | ||||
| U.S. Treasury Bills: |
||||||
| 0.010% due 02/04/10 |
4,000,000 | 3,999,962 | ||||
| 0.030% due 02/25/10† |
961,000 | 960,956 | ||||
| 0.260% due 08/26/10† |
8,000,000 | 7,985,138 | ||||
| Total short-term U.S. government and agency obligations (cost $18,504,220) |
$ | 18,503,052 | ||||
Swap Agreements^
| Termination Date |
Notional Amount at Value* |
Unrealized Appreciation (Depreciation) | ||||||
| Swap agreement with Goldman Sachs International based on Dow Jones-UBS Commodity Index |
01/06/10 | $ | 9,230,808 | $ | 284,791 | |||
| Swap agreement with UBS AG based on Dow Jones-UBS Commodity Index |
01/06/10 | 30,278,956 | 893,177 | |||||
| $ | 1,177,968 | |||||||
| ^ | The positions and counterparties herein are as of December 31, 2009. The Funds continually evaluate different counterparties for their transactions and counterparties are subject to change. New counterparties can be added at anytime. |
| * | For swap agreements, a positive amount represents “long” exposure to the benchmark Index. A negative amount represents “short” exposure to the benchmark Index. |
| † | All or partial amount segregated as collateral for swap agreements. |
See accompanying notes to financial statements.
F-4
Table of Contents
PROSHARES ULTRA DJ-UBS COMMODITY
SCHEDULE OF INVESTMENTS
DECEMBER 31, 2008
Swap Agreements
| Termination Date |
Notional Amount at Value* |
Unrealized Appreciation (Depreciation) | ||||||
| Swap agreement with Goldman Sachs International based on Dow Jones-UBS Commodity Index |
01/06/09 | $ | 6,615,626 | $ | 184,583 | |||
| * | For swap agreements, a positive amount represents “long” exposure to the benchmark Index. A negative amount represents “short” exposure to the benchmark Index. |
See accompanying notes to financial statements.
F-5
Table of Contents
PROSHARES ULTRA DJ-UBS COMMODITY
STATEMENTS OF OPERATIONS
FOR THE YEAR ENDED DECEMBER 31, 2009 AND THE PERIOD FROM
AUGUST 6, 2008 (INCEPTION) TO DECEMBER 31, 2008
| Year ended December 31, 2009 |
August 6, 2008 (Inception) through December 31, 2008 |
|||||||
| Investment Income |
||||||||
| Interest |
$ | 4,918 | $ | — | ||||
| Expenses |
||||||||
| Management fee |
95,273 | — | ||||||
| Organization costs |
— | 27,952 | ||||||
| Offering costs |
69,640 | 7,855 | ||||||
| Limitation by Sponsor |
— | (33,411 | ) | |||||
| Total expenses |
164,913 | 2,396 | ||||||
| Net investment income (loss) |
(159,995 | ) | (2,396 | ) | ||||
| Realized and unrealized gain (loss) on investment activity |
||||||||
| Net realized gain (loss) on |
||||||||
| Swap agreements |
4,280,412 | (408,251 | ) | |||||
| Change in net unrealized appreciation/depreciation on |
||||||||
| Swap agreements |
993,385 | 184,583 | ||||||
| Short-term U.S. government and agency obligations |
(1,168 | ) | — | |||||
| Change in net unrealized appreciation/depreciation |
992,217 | 184,583 | ||||||
| Net realized and unrealized gain (loss) |
5,272,629 | (223,668 | ) | |||||
| Net income (loss) |
$ | 5,112,634 | $ | (226,064 | ) | |||
| Net income (loss) per weighted-average share |
$ | 6.84 | $ | (1.90 | ) | |||
| Weighted-average shares outstanding |
747,000 | 118,933 | ||||||
See accompanying notes to financial statements.
F-6
Table of Contents
PROSHARES ULTRA DJ-UBS COMMODITY
STATEMENTS OF CHANGES IN SHAREHOLDERS’ EQUITY
FOR THE YEAR ENDED DECEMBER 31, 2009 AND THE PERIOD FROM
AUGUST 6, 2008 (INCEPTION) TO DECEMBER 31, 2008
| Year ended December 31, 2009 |
August 6, 2008 (Inception) through December 31, 2008 |
|||||||
| Shareholders’ equity, beginning of period |
$ | 3,325,011 | $ | — | ||||
| Addition of shares (1,200,000 and 150,014, respectively) |
25,899,594 | 3,551,075 | ||||||
| Redemption of shares (650,000 and 0, respectively) |
(14,593,307 | ) | — | |||||
| Net addition (redemption) of shares |
11,306,287 | 3,551,075 | ||||||
| Net investment income (loss) |
(159,995 | ) | (2,396 | ) | ||||
| Net realized gain (loss) |
4,280,412 | (408,251 | ) | |||||
| Change in net unrealized appreciation/depreciation |
992,217 | 184,583 | ||||||
| Net income (loss) |
5,112,634 | (226,064 | ) | |||||
| Shareholders’ equity, end of period |
$ | 19,743,932 | $ | 3,325,011 | ||||
See accompanying notes to financial statements.
F-7
Table of Contents
PROSHARES ULTRA DJ-UBS COMMODITY
STATEMENTS OF CASH FLOWS
FOR THE YEAR ENDED DECEMBER 31, 2009 AND THE PERIOD FROM
AUGUST 6, 2008 (INCEPTION) TO DECEMBER 31, 2008
| Year ended December 31, 2009 |
August 6, 2008 (Inception) through December 31, 2008 |
|||||||
| Cash flow from operating activities |
||||||||
| Net income (loss) |
$ | 5,112,634 | $ | (226,064 | ) | |||
| Adjustments to reconcile net income (loss) to net cash provided by (used in) operating activities: |
||||||||
| Decrease (Increase) in segregated cash balances for swap agreements |
1,335,000 | (1,335,000 | ) | |||||
| Net purchase of short-term U.S. government and agency obligations |
(18,504,220 | ) | — | |||||
| Change in unrealized appreciation/depreciation on investments |
(992,217 | ) | (184,583 | ) | ||||
| Decrease (Increase) in receivable from Sponsor |
33,411 | (33,411 | ) | |||||
| Amortization of offering cost |
69,640 | (69,640 | ) | |||||
| Increase (Decrease) in management fee payable |
15,200 | — | ||||||
| (Decrease) Increase in accounts payable |
(42,977 | ) | 42,977 | |||||
| Net cash provided by (used in) operating activities |
(12,973,529 | ) | (1,805,721 | ) | ||||
| Cash flow from financing activities |
||||||||
| Proceeds from addition of shares |
25,899,594 | 3,551,075 | ||||||
| Payment on shares redeemed |
(14,593,307 | ) | — | |||||
| Net cash provided by (used in) financing activities |
11,306,287 | 3,551,075 | ||||||
| Net increase (decrease) in cash |
(1,667,242 | ) | 1,745,354 | |||||
| Cash, beginning of period |
1,745,354 | — | ||||||
| Cash, end of period |
$ | 78,112 | $ | 1,745,354 | ||||
See accompanying notes to financial statements.
F-8
Table of Contents
PROSHARES ULTRASHORT DJ-UBS COMMODITY
STATEMENTS OF FINANCIAL CONDITION
| December 31, 2009 | December 31, 2008 | ||||||
| Assets |
|||||||
| Cash |
$ | 90,383 | $ | 1,579,140 | |||
| Segregated cash balances for swap agreements |
485,000 | 1,400,000 | |||||
| Short-term U.S. government and agency obligations (Note 3) |
2,568,141 | — | |||||
| Receivable from Sponsor |
— | 56,576 | |||||
| Offering costs (Note 5) |
— | 278,414 | |||||
| Total assets |
3,143,524 | 3,314,130 | |||||
| Liabilities and shareholders’ equity |
|||||||
| Liabilities |
|||||||
| Management fee payable |
2,493 | — | |||||
| Accounts payable |
— | 208,046 | |||||
| Unrealized depreciation on swap agreements |
216,605 | 426,201 | |||||
| Total liabilities |
219,098 | 634,247 | |||||
| Shareholders’ equity |
|||||||
| Paid-in capital |
5,049,843 | 2,500,900 | |||||
| Accumulated earnings (deficit) |
(2,125,417 | ) | 178,983 | ||||
| Total shareholders’ equity |
2,924,426 | 2,679,883 | |||||
| Total liabilities and shareholders’ equity |
$ | 3,143,524 | $ | 3,314,130 | |||
| Shares outstanding |
200,014 | 100,014 | |||||
| Net asset value per share |
$ | 14.62 | $ | 26.80 | |||
| Market value per share (Note 2) |
$ | 14.65 | $ | 27.58 | |||
See accompanying notes to financial statements.
F-9
Table of Contents
PROSHARES ULTRASHORT DJ-UBS COMMODITY
SCHEDULE OF INVESTMENTS
DECEMBER 31, 2009
| Principal Amount | Value | |||||
| Short-term U.S. government and agency obligations |
||||||
| Federal Home Loan Bank, Discount Notes: |
||||||
| 0.001% due 01/27/10 |
$ | 1,570,000 | $ | 1,569,999 | ||
| U.S. Treasury Bills: |
||||||
| 0.260% due 08/26/10† |
1,000,000 | 998,142 | ||||
| Total short-term U.S. government and agency obligations (cost $2,568,287) |
$ | 2,568,141 | ||||
Swap Agreements^
| Termination Date |
Notional Amount at Value* |
Unrealized Appreciation (Depreciation) |
||||||||
| Swap agreement with Goldman Sachs International based on Dow Jones-UBS Commodity Index |
01/06/10 | $ | (1,001,057 | ) | $ | (34,432 | ) | |||
| Swap agreement with UBS AG based on Dow Jones-UBS Commodity Index |
01/06/10 | (4,834,281 | ) | (182,173 | ) | |||||
| $ | (216,605 | ) | ||||||||
| ^ | The positions and counterparties herein are as of December 31, 2009. The Funds continually evaluate different counterparties for their transactions and counterparties are subject to change. New counterparties can be added at anytime. |
| * | For swap agreements, a positive amount represents “long” exposure to the benchmark Index. A negative amount represents “short” exposure to the benchmark Index. |
| † | All or partial amount segregated as collateral for swap agreements. |
See accompanying notes to financial statements.
F-10
Table of Contents
PROSHARES ULTRASHORT DJ-UBS COMMODITY
SCHEDULE OF INVESTMENTS
DECEMBER 31, 2008
Swap Agreements
| Termination Date |
Notional Amount at Value* |
Unrealized Appreciation (Depreciation) |
||||||||
| Swap agreement with Goldman Sachs International based on Dow Jones-UBS Commodity Index |
01/06/09 | $ | (5,452,380 | ) | $ | (426,201 | ) | |||
| * | For swap agreements, a positive amount represents “long” exposure to the benchmark Index. A negative amount represents “short” exposure to the benchmark Index. |
See accompanying notes to financial statements.
F-11
Table of Contents
PROSHARES ULTRASHORT DJ-UBS COMMODITY
STATEMENTS OF OPERATIONS
FOR THE YEAR ENDED DECEMBER 31, 2009 AND THE PERIOD FROM
AUGUST 6, 2008 (INCEPTION) TO DECEMBER 31, 2008
| Year ended December 31, 2009 |
August 6, 2008 (Inception) through December 31, 2008 |
|||||||
| Investment Income |
||||||||
| Interest |
$ | 822 | $ | — | ||||
| Expenses |
||||||||
| Management fee |
3,100 | — | ||||||
| Organization costs |
— | 27,953 | ||||||
| Offering costs |
278,414 | 31,406 | ||||||
| Limitation by Sponsor |
(246,002 | ) | (56,576 | ) | ||||
| Total expenses |
35,512 | 2,783 | ||||||
| Net investment income (loss) |
(34,690 | ) | (2,783 | ) | ||||
| Realized and unrealized gain (loss) on investment activity |
||||||||
| Net realized gain (loss) on |
||||||||
| Swap agreements |
(2,479,160 | ) | 607,967 | |||||
| Change in net unrealized appreciation/depreciation on |
||||||||
| Swap agreements |
209,596 | (426,201 | ) | |||||
| Short-term U.S. government and agency obligations |
(146 | ) | — | |||||
| Change in net unrealized appreciation/depreciation |
209,450 | (426,201 | ) | |||||
| Net realized and unrealized gain (loss) |
(2,269,710 | ) | 181,766 | |||||
| Net income (loss) |
$ | (2,304,400 | ) | $ | 178,983 | |||
| Net income (loss) per weighted-average share |
$ | (12.47 | ) | $ | 1.79 | |||
| Weighted-average shares outstanding |
184,809 | 100,014 | ||||||
See accompanying notes to financial statements.
F-12
Table of Contents
PROSHARES ULTRASHORT DJ-UBS COMMODITY
STATEMENTS OF CHANGES IN SHAREHOLDERS’ EQUITY
FOR THE YEAR ENDED DECEMBER 31, 2009 AND THE PERIOD FROM
AUGUST 6, 2008 (INCEPTION) TO DECEMBER 31, 2008
| Year ended December 31, 2009 |
August 6, 2008 (Inception) through December 31, 2008 |
|||||||
| Shareholders’ equity, beginning of period |
$ | 2,679,883 | $ | — | ||||
| Addition of shares (200,000 and 100,014, respectively) |
4,145,511 | 2,500,900 | ||||||
| Redemption of shares (100,000 and 0, respectively) |
(1,596,568 | ) | — | |||||
| Net addition (redemption) of shares |
2,548,943 | 2,500,900 | ||||||
| Net investment income (loss) |
(34,690 | ) | (2,783 | ) | ||||
| Net realized gain (loss) |
(2,479,160 | ) | 607,967 | |||||
| Change in net unrealized appreciation/depreciation |
209,450 | (426,201 | ) | |||||
| Net income (loss) |
(2,304,400 | ) | 178,983 | |||||
| Shareholders’ equity, end of period |
$ | 2,924,426 | $ | 2,679,883 | ||||
See accompanying notes to financial statements.
F-13
Table of Contents
PROSHARES ULTRASHORT DJ-UBS COMMODITY
STATEMENTS OF CASH FLOWS
FOR THE YEAR ENDED DECEMBER 31, 2009 AND THE PERIOD FROM
AUGUST 6, 2008 (INCEPTION) TO DECEMBER 31, 2008
| Year ended December 31, 2009 |
August 6, 2008 (Inception) through December 31, 2008 |
|||||||
| Cash flow from operating activities |
||||||||
| Net income (loss) |
$ | (2,304,400 | ) | $ | 178,983 | |||
| Adjustments to reconcile net income (loss) to net cash provided by (used in) operating activities: |
||||||||
| Decrease (Increase) in segregated cash balances for swap agreements |
915,000 | (1,400,000 | ) | |||||
| Net purchase of short-term U.S. government and agency obligations |
(2,568,287 | ) | — | |||||
| Change in unrealized appreciation/depreciation on investments |
(209,450 | ) | 426,201 | |||||
| Decrease (Increase) in receivable from Sponsor |
56,576 | (56,576 | ) | |||||
| Amortization of offering cost |
278,414 | (278,414 | ) | |||||
| Increase (Decrease) in management fee payable |
2,493 | — | ||||||
| (Decrease) Increase in accounts payable |
(208,046 | ) | 208,046 | |||||
| Net cash provided by (used in) operating activities |
(4,037,700 | ) | (921,760 | ) | ||||
| Cash flow from financing activities |
||||||||
| Proceeds from addition of shares |
4,145,511 | 2,500,900 | ||||||
| Payment on shares redeemed |
(1,596,568 | ) | — | |||||
| Net cash provided by (used in) financing activities |
2,548,943 | 2,500,900 | ||||||
| Net increase (decrease) in cash |
(1,488,757 | ) | 1,579,140 | |||||
| Cash, beginning of period |
1,579,140 | — | ||||||
| Cash, end of period |
$ | 90,383 | $ | 1,579,140 | ||||
See accompanying notes to financial statements.
F-14
Table of Contents
PROSHARES ULTRA DJ-UBS CRUDE OIL
STATEMENTS OF FINANCIAL CONDITION
| December 31, 2009 | December 31, 2008 | |||||
| Assets |
||||||
| Cash |
$ | 80,936 | $ | 40,341,120 | ||
| Segregated cash balances with brokers for futures contracts |
13,574,925 | 37,425,038 | ||||
| Short-term U.S. government and agency obligations (Note 3) |
323,026,067 | — | ||||
| Unrealized appreciation on swap agreements |
21,129,076 | — | ||||
| Receivable from capital shares sold |
— | 8,810,344 | ||||
| Receivable on open futures contracts |
1,466,444 | 20,527,738 | ||||
| Receivable from Sponsor |
— | 16,192 | ||||
| Offering costs (Note 5) |
— | 139,226 | ||||
| Total assets |
359,277,448 | 107,259,658 | ||||
| Liabilities and shareholders’ equity |
||||||
| Liabilities |
||||||
| Payable for capital shares redeemed |
35,195,574 | 7,388,973 | ||||
| Management fee payable |
262,204 | — | ||||
| Accounts payable |
— | 97,742 | ||||
| Total liabilities |
35,457,778 | 7,486,715 | ||||
| Shareholders’ equity |
||||||
| Paid-in capital |
190,554,540 | 89,856,620 | ||||
| Accumulated earnings (deficit) |
133,265,130 | 9,916,323 | ||||
| Total shareholders’ equity |
323,819,670 | 99,772,943 | ||||
| Total liabilities and shareholders’ equity |
$ | 359,277,448 | $ | 107,259,658 | ||
| Shares outstanding |
25,650,014 | 6,750,014 | ||||
| Net asset value per share |
$ | 12.62 | $ | 14.78 | ||
| Market value per share (Note 2) |
$ | 12.68 | $ | 13.69 | ||
See accompanying notes to financial statements.
F-15
Table of Contents
PROSHARES ULTRA DJ-UBS CRUDE OIL
SCHEDULE OF INVESTMENTS
DECEMBER 31, 2009
| Principal Amount |
Value | |||||
| Short-term U.S. government and agency obligations |
||||||
| Federal Agricultural Mortgage Corp., Discount Notes: |
||||||
| 0.010% due 01/07/10 |
$ | 30,000,000 | $ | 29,999,950 | ||
| Federal Home Loan Bank, Discount Notes: |
||||||
| 0.001% due 01/27/10 |
29,404,000 | 29,403,979 | ||||
| U.S. Treasury Bills: |
||||||
| 0.010% due 02/04/10 |
40,000,000 | 39,999,622 | ||||
| 0.028% due 02/25/10† |
98,859,000 | 98,854,731 | ||||
| 0.260% due 08/26/10 |
125,000,000 | 124,767,785 | ||||
| Total short-term U.S. government and agency obligations |
$ | 323,026,067 | ||||
Futures Contracts Purchased
| Number of Contracts |
Notional Amount at Value |
Unrealized Appreciation (Depreciation) | ||||||
| Crude Oil – NYMEX, expires March 2010 |
2,873 | $ | 229,897,460 | $ | 16,877,800 | |||
Swap Agreements^
| Termination Date |
Notional Amount at Value* |
Unrealized Appreciation (Depreciation) | ||||||
| Swap agreement with Goldman Sachs International based on Dow Jones-UBS Crude Oil Sub-Index |
01/06/10 | $ | 159,674,116 | $ | 8,182,273 | |||
| Swap agreement with UBS AG based on Dow Jones-UBS Crude Oil Sub-Index |
01/06/10 | 258,057,998 | 12,946,803 | |||||
| $ | 21,129,076 | |||||||
| ^ | The positions and counterparties herein are as of December 31, 2009. The Funds continually evaluate different counterparties for their transactions and counterparties are subject to change. New counterparties can be added at anytime. |
| * | For swap agreements, a positive amount represents “long” exposure to the benchmark Index. A negative amount represents “short” exposure to the benchmark Index. |
| † | All or partial amount segregated as collateral for swap agreements. |
See accompanying notes to financial statements.
F-16
Table of Contents
PROSHARES ULTRA DJ-UBS CRUDE OIL
SCHEDULE OF INVESTMENTS
DECEMBER 31, 2008
Futures Contracts Purchased
| Number of Contracts |
Notional Amount at Value |
Unrealized Appreciation (Depreciation) | ||||||
| Crude Oil – NYMEX, expires March 2009 |
4,107 | $ | 199,559,130 | $ | 12,678,400 | |||
See accompanying notes to financial statements.
F-17
Table of Contents
PROSHARES ULTRA DJ-UBS CRUDE OIL
STATEMENTS OF OPERATIONS
FOR THE YEAR ENDED DECEMBER 31, 2009 AND THE PERIOD FROM
AUGUST 6, 2008 (INCEPTION) TO DECEMBER 31, 2008
| Year ended December 31, 2009 |
August 6, 2008 (Inception) through December 31, 2008 |
|||||||
| Investment Income |
||||||||
| Interest |
$ | 110,254 | $ | — | ||||
| Expenses |
||||||||
| Management fee |
2,460,980 | — | ||||||
| Brokerage commissions |
255,521 | 13,208 | ||||||
| Organization costs |
— | 27,953 | ||||||
| Offering costs |
139,226 | 15,705 | ||||||
| Limitation by Sponsor |
— | (16,192 | ) | |||||
| Total expenses |
2,855,727 | 40,674 | ||||||
| Net investment income (loss) |
(2,745,473 | ) | (40,674 | ) | ||||
| Realized and unrealized gain (loss) on investment activity |
||||||||
| Net realized gain (loss) on |
||||||||
| Futures contracts |
42,952,627 | (2,721,403 | ) | |||||
| Swap agreements |
57,831,434 | — | ||||||
| Net realized gain (loss) |
100,784,061 | (2,721,403 | ) | |||||
| Change in net unrealized appreciation/depreciation on |
||||||||
| Futures contracts |
4,199,400 | 12,678,400 | ||||||
| Swap agreements |
21,129,076 | — | ||||||
| Short-term U.S. government and agency obligations |
(18,257 | ) | — | |||||
| Change in net unrealized appreciation/depreciation |
25,310,219 | 12,678,400 | ||||||
| Net realized and unrealized gain (loss) |
126,094,280 | 9,956,997 | ||||||
| Net income (loss) |
$ | 123,348,807 | $ | 9,916,323 | ||||
| Net income (loss) per weighted-average share |
$ | 4.60 | $ | 4.38 | ||||
| Weighted-average shares outstanding |
26,814,672 | 2,266,230 | ||||||
See accompanying notes to financial statements.
F-18
Table of Contents
PROSHARES ULTRA DJ-UBS CRUDE OIL
STATEMENTS OF CHANGES IN SHAREHOLDERS’ EQUITY
FOR THE YEAR ENDED DECEMBER 31, 2009 AND THE PERIOD FROM
AUGUST 6, 2008 (INCEPTION) TO DECEMBER 31, 2008
| Year ended December 31, 2009 |
August 6, 2008 (Inception) through December 31, 2008 |
|||||||
| Shareholders’ equity, beginning of period |
$ | 99,772,943 | $ | — | ||||
| Addition of shares (127,150,000 and 7,250,014, respectively) |
1,254,758,064 | 97,245,593 | ||||||
| Redemption of shares (108,250,000 and 500,000, respectively) |
(1,154,060,144 | ) | (7,388,973 | ) | ||||
| Net addition (redemption) of shares |
100,697,920 | 89,856,620 | ||||||
| Net investment income (loss) |
(2,745,473 | ) | (40,674 | ) | ||||
| Net realized gain (loss) |
100,784,061 | (2,721,403 | ) | |||||
| Change in net unrealized appreciation/depreciation |
25,310,219 | 12,678,400 | ||||||
| Net income (loss) |
123,348,807 | 9,916,323 | ||||||
| Shareholders’ equity, end of period |
$ | 323,819,670 | $ | 99,772,943 | ||||
See accompanying notes to financial statements.
F-19
Table of Contents
PROSHARES ULTRA DJ-UBS CRUDE OIL
STATEMENTS OF CASH FLOWS
FOR THE YEAR ENDED DECEMBER 31, 2009 AND THE PERIOD FROM
AUGUST 6, 2008 (INCEPTION) TO DECEMBER 31, 2008
| Year ended December 31, 2009 |
August 6, 2008 (Inception) through December 31, 2008 |
|||||||
| Cash flow from operating activities |
||||||||
| Net income (loss) |
$ | 123,348,807 | $ | 9,916,323 | ||||
| Adjustments to reconcile net income (loss) to net cash provided by (used in) operating activities: |
||||||||
| Decrease (Increase) in segregated cash balances with brokers for futures contracts |
23,850,113 | (37,425,038 | ) | |||||
| Net purchase of short-term U.S. government and agency obligations |
(323,044,324 | ) | — | |||||
| Decrease (Increase) in receivable on futures contracts |
19,061,294 | (20,527,738 | ) | |||||
| Change in unrealized appreciation/depreciation on investments |
(21,110,819 | ) | — | |||||
| Decrease (Increase) in receivable from Sponsor |
16,192 | (16,192 | ) | |||||
| Amortization of offering cost |
139,226 | (139,226 | ) | |||||
| Increase (Decrease) in management fee payable |
262,204 | — | ||||||
| (Decrease) Increase in accounts payable |
(97,742 | ) | 97,742 | |||||
| Net cash provided by (used in) operating activities |
(177,575,049 | ) | (48,094,129 | ) | ||||
| Cash flow from financing activities |
||||||||
| Proceeds from addition of shares |
1,263,568,408 | 88,435,249 | ||||||
| Payment on shares redeemed |
(1,126,253,543 | ) | — | |||||
| Net cash provided by (used in) financing activities |
137,314,865 | 88,435,249 | ||||||
| Net increase (decrease) in cash |
(40,260,184 | ) | 40,341,120 | |||||
| Cash, beginning of period |
40,341,120 | — | ||||||
| Cash, end of period |
$ | 80,936 | $ | 40,341,120 | ||||
See accompanying notes to financial statements.
F-20
Table of Contents
PROSHARES ULTRASHORT DJ-UBS CRUDE OIL
STATEMENTS OF FINANCIAL CONDITION
| December 31, 2009 | December 31, 2008 | |||||||
| Assets |
||||||||
| Cash |
$ | 75,409 | $ | 7,925,214 | ||||
| Segregated cash balances with brokers for futures contracts |
4,162,725 | 5,449,275 | ||||||
| Short-term U.S. government and agency obligations (Note 3) |
66,495,308 | — | ||||||
| Receivable from capital shares sold |
8,244,946 | 7,269,858 | ||||||
| Receivable from Sponsor |
— | 53,143 | ||||||
| Offering costs (Note 5) |
— | 278,414 | ||||||
| Total assets |
78,978,388 | 20,975,904 | ||||||
| Liabilities and shareholders’ equity |
||||||||
| Liabilities |
||||||||
| Payable for capital shares redeemed |
— | 1,999,561 | ||||||
| Payable on open futures contracts |
1,271,069 | 4,265,898 | ||||||
| Management fee payable |
68,204 | — | ||||||
| Accounts payable |
— | 208,046 | ||||||
| Unrealized depreciation on swap agreements |
982,489 | — | ||||||
| Total liabilities |
2,321,762 | 6,473,505 | ||||||
| Shareholders’ equity |
||||||||
| Paid-in capital |
94,438,947 | 15,231,359 | ||||||
| Accumulated earnings (deficit) |
(17,782,321 | ) | (728,960 | ) | ||||
| Total shareholders’ equity |
76,656,626 | 14,502,399 | ||||||
| Total liabilities and shareholders’ equity |
$ | 78,978,388 | $ | 20,975,904 | ||||
| Shares outstanding |
5,600,014 | 500,014 | ||||||
| Net asset value per share |
$ | 13.69 | $ | 29.00 | ||||
| Market value per share (Note 2) |
$ | 13.65 | $ | 31.66 | ||||
See accompanying notes to financial statements.
F-21
Table of Contents
PROSHARES ULTRASHORT DJ-UBS CRUDE OIL
SCHEDULE OF INVESTMENTS
DECEMBER 31, 2009
| Principal Amount | Value | |||||
| Short-term U.S. government and agency obligations |
||||||
| Federal Agricultural Mortgage Corp., Discount Notes: |
||||||
| 0.010% due 01/07/10 |
$ | 1,000,000 | $ | 999,998 | ||
| Federal Home Loan Bank, Discount Notes: |
||||||
| 0.001% due 01/27/10 |
15,542,000 | 15,541,989 | ||||
| U.S. Treasury Bills: |
||||||
| 0.010% due 02/04/10 |
25,000,000 | 24,999,764 | ||||
| 0.260% due 08/26/10† |
25,000,000 | 24,953,557 | ||||
| Total short-term U.S. government and agency obligations (cost $66,498,959) |
$ | 66,495,308 | ||||
Futures Contracts Sold
| Number of Contracts |
Notional Amount at Value |
Unrealized Appreciation (Depreciation) |
|||||||
| Crude Oil – NYMEX, expires March 2010 |
881 | $ | 70,497,620 | $ | (3,063,900 | ) | |||
Swap Agreements^
| Termination Date |
Notional Amount at Value* |
Unrealized Appreciation (Depreciation) |
||||||||
| Swap agreement with Goldman Sachs International based on Dow Jones-UBS Crude Oil Sub-Index |
01/06/10 | $ | (33,484,257 | ) | $ | (589,031 | ) | |||
| Swap agreement with UBS AG based on Dow Jones-UBS Crude Oil Sub-Index |
01/06/10 | (49,370,522 | ) | (393,458 | ) | |||||
| $ | (982,489 | ) | ||||||||
| ^ | The positions and counterparties herein are as of December 31, 2009. The Funds continually evaluate different counterparties for their transactions and counterparties are subject to change. New counterparties can be added at anytime. |
| * | For swap agreements, a positive amount represents “long” exposure to the benchmark Index. A negative amount represents “short” exposure to the benchmark Index. |
| † | All or partial amount segregated as collateral for swap agreements. |
See accompanying notes to financial statements.
F-22
Table of Contents
PROSHARES ULTRASHORT DJ-UBS CRUDE OIL
SCHEDULE OF INVESTMENTS
DECEMBER 31, 2008
Futures Contracts Sold
| Number of Contracts |
Notional Amount at Value |
Unrealized Appreciation (Depreciation) |
|||||||
| Crude Oil – NYMEX, expires March 2009 |
598 | $ | 29,056,820 | $ | (3,550,590 | ) | |||
See accompanying notes to financial statements.
F-23
Table of Contents
PROSHARES ULTRASHORT DJ-UBS CRUDE OIL
STATEMENTS OF OPERATIONS
FOR THE YEAR ENDED DECEMBER 31, 2009 AND THE PERIOD FROM
AUGUST 6, 2008 (INCEPTION) TO DECEMBER 31, 2008
| Year ended December 31, 2009 |
August 6, 2008 (Inception) through December 31, 2008 |
|||||||
| Investment Income |
||||||||
| Interest |
$ | 24,406 | $ | — | ||||
| Expenses |
||||||||
| Management fee |
442,423 | — | ||||||
| Brokerage commissions |
88,885 | 4,985 | ||||||
| Organization costs |
— | 27,953 | ||||||
| Offering costs |
278,414 | 31,406 | ||||||
| Limitation by Sponsor |
— | (53,143 | ) | |||||
| Total expenses |
809,722 | 11,201 | ||||||
| Net investment income (loss) |
(785,316 | ) | (11,201 | ) | ||||
| Realized and unrealized gain (loss) on investment activity |
||||||||
| Net realized gain (loss) on |
||||||||
| Futures contracts |
(2,665,630 | ) | 2,832,831 | |||||
| Swap agreements |
(13,102,965 | ) | — | |||||
| Net realized gain (loss) |
(15,768,595 | ) | 2,832,831 | |||||
| Change in net unrealized appreciation/depreciation on |
||||||||
| Futures contracts |
486,690 | (3,550,590 | ) | |||||
| Swap agreements |
(982,489 | ) | — | |||||
| Short-term U.S. government and agency obligations |
(3,651 | ) | — | |||||
| Change in net unrealized appreciation/depreciation |
(499,450 | ) | (3,550,590 | ) | ||||
| Net realized and unrealized gain (loss) |
(16,268,045 | ) | (717,759 | ) | ||||
| Net income (loss) |
$ | (17,053,361 | ) | $ | (728,960 | ) | ||
| Net income (loss) per weighted-average share |
$ | (3.91 | ) | $ | (4.39 | ) | ||
| Weighted-average shares outstanding |
4,366,589 | 166,230 | ||||||
See accompanying notes to financial statements.
F-24
Table of Contents
PROSHARES ULTRASHORT DJ-UBS CRUDE OIL
STATEMENTS OF CHANGES IN SHAREHOLDERS’ EQUITY
FOR THE YEAR ENDED DECEMBER 31, 2009 AND THE PERIOD FROM
AUGUST 6, 2008 (INCEPTION) TO DECEMBER 31, 2008
| Year ended December 31, 2009 |
August 6, 2008 (Inception) through December 31, 2008 |
|||||||
| Shareholders’ equity, beginning of period |
$ | 14,502,399 | $ | — | ||||
| Addition of shares (22,000,000 and 600,014, respectively) |
469,708,747 | 18,849,361 | ||||||
| Redemption of shares (16,900,000 and 100,000, respectively) |
(390,501,159 | ) | (3,618,002 | ) | ||||
| Net addition (redemption) of shares |
79,207,588 | 15,231,359 | ||||||
| Net investment income (loss) |
(785,316 | ) | (11,201 | ) | ||||
| Net realized gain (loss) |
(15,768,595 | ) | 2,832,831 | |||||
| Change in net unrealized appreciation/depreciation |
(499,450 | ) | (3,550,590 | ) | ||||
| Net income (loss) |
(17,053,361 | ) | (728,960 | ) | ||||
| Shareholders’ equity, end of period |
$ | 76,656,626 | $ | 14,502,399 | ||||
See accompanying notes to financial statements.
F-25
Table of Contents
PROSHARES ULTRASHORT DJ-UBS CRUDE OIL
STATEMENTS OF CASH FLOWS
FOR THE YEAR ENDED DECEMBER 31, 2009 AND THE PERIOD FROM
AUGUST 6, 2008 (INCEPTION) TO DECEMBER 31, 2008
| Year ended December 31, 2009 |
August 6, 2008 (Inception) through December 31, 2008 |
|||||||
| Cash flow from operating activities |
||||||||
| Net income (loss) |
$ | (17,053,361 | ) | $ | (728,960 | ) | ||
| Adjustments to reconcile net income (loss) to net cash provided by (used in) operating activities: |
||||||||
| Decrease (Increase) in segregated cash balances with brokers for futures contracts |
1,286,550 | (5,449,275 | ) | |||||
| Net purchase of short-term U.S. government and agency obligations |
(66,498,959 | ) | — | |||||
| Change in unrealized appreciation/depreciation on investments |
986,140 | — | ||||||
| Decrease (Increase) in receivable from Sponsor |
53,143 | (53,143 | ) | |||||
| Amortization of offering cost |
278,414 | (278,414 | ) | |||||
| Increase (Decrease) in management fee payable |
68,204 | — | ||||||
| (Decrease) Increase in accounts payable |
(208,046 | ) | 208,046 | |||||
| (Decrease) Increase in payable on futures contracts |
(2,994,829 | ) | 4,265,898 | |||||
| Net cash provided by (used in) operating activities |
(84,082,744 | ) | (2,035,848 | ) | ||||
| Cash flow from financing activities |
||||||||
| Proceeds from addition of shares |
468,733,659 | 11,579,503 | ||||||
| Payment on shares redeemed |
(392,500,720 | ) | (1,618,441 | ) | ||||
| Net cash provided by (used in) financing activities |
76,232,939 | 9,961,062 | ||||||
| Net increase (decrease) in cash |
(7,849,805 | ) | 7,925,214 | |||||
| Cash, beginning of period |
7,925,214 | — | ||||||
| Cash, end of period |
$ | 75,409 | $ | 7,925,214 | ||||
See accompanying notes to financial statements.
F-26
Table of Contents
STATEMENTS OF FINANCIAL CONDITION
| December 31, 2009 | December 31, 2008 | |||||
| Assets |
||||||
| Cash |
$ | 96,468 | $ | 23,435,796 | ||
| Segregated cash balances for forward agreements |
— | — | ||||
| Segregated cash balances with brokers for futures contracts |
480,837 | 102,966 | ||||
| Short-term U.S. government and agency obligations (Note 3) |
168,085,670 | — | ||||
| Receivable from capital shares sold |
— | 4,661,921 | ||||
| Receivable on open futures contracts |
32,930 | 2,885 | ||||
| Receivable from Sponsor |
— | 43,098 | ||||
| Offering costs (Note 5) |
— | 284,355 | ||||
| Total assets |
168,695,905 | 28,531,021 | ||||
| Liabilities and shareholders’ equity |
||||||
| Liabilities |
||||||
| Payable for capital shares redeemed |
6,835,057 | — | ||||
| Management fee payable |
149,879 | — | ||||
| Accounts payable |
— | 208,045 | ||||
| Unrealized depreciation on forward agreements |
5,234,260 | 586,254 | ||||
| Total liabilities |
12,219,196 | 794,299 | ||||
| Shareholders’ equity |
||||||
| Paid-in capital |
120,971,898 | 26,025,918 | ||||
| Accumulated earnings (deficit) |
35,504,811 | 1,710,804 | ||||
| Total shareholders’ equity |
156,476,709 | 27,736,722 | ||||
| Total liabilities and shareholders’ equity |
$ | 168,695,905 | $ | 28,531,021 | ||
| Shares outstanding |
3,550,014 | 900,014 | ||||
| Net asset value per share |
$ | 44.08 | $ | 30.82 | ||
| Market value per share (Note 2) |
$ | 44.68 | $ | 31.60 | ||
See accompanying notes to financial statements.
F-27
Table of Contents
PROSHARES ULTRA GOLD
SCHEDULE OF INVESTMENTS
DECEMBER 31, 2009
| Principal Amount | Value | |||||
| Short-term U.S. government and agency obligations |
||||||
| Federal Agricultural Mortgage Corp., Discount Notes: |
||||||
| 0.010% due 01/07/10 |
$ | 59,000,000 | $ | 58,999,902 | ||
| Federal Home Loan Bank, Discount Notes: |
||||||
| 0.001% due 01/27/10 |
5,126,000 | 5,125,996 | ||||
| U.S. Treasury Bills: |
||||||
| 0.010% due 02/04/10 |
10,000,000 | 9,999,905 | ||||
| 0.026% due 02/25/10† |
74,000,000 | 73,997,021 | ||||
| 0.260% due 08/26/10† |
20,000,000 | 19,962,846 | ||||
| Total short-term U.S. government and agency obligations |
$ | 168,085,670 | ||||
Futures Contracts Purchased
| Number of Contracts |
Notional Amount at Value |
Unrealized Appreciation (Depreciation) |
||||||||||
| Gold Futures – COMEX, expires February 2010 |
89 | $ | 9,756,180 | $ | (194,200 | ) | ||||||
| Forward Agreements^ | ||||||||||||
| Settlement Date |
Commitment to (Deliver)/Receive |
Notional Amount at Value* |
Unrealized Appreciation (Depreciation) |
|||||||||
| Forward agreements with Goldman Sachs International based on 0.995 Fine Troy Ounce Gold |
01/04/10 | $ | 52,920 | $ | 57,553,675 | $ | (981,459 | ) | ||||
| Forward agreements with UBS AG based on 0.995 Fine Troy Ounce Gold |
01/04/10 | 225,800 | 245,571,048 | (4,252,801 | ) | |||||||
| $ | (5,234,260 | ) | ||||||||||
| ^ | The positions and counterparties herein are as of December 31, 2009. The Funds continually evaluate different counterparties for their transactions and counterparties are subject to change. New counterparties can be added at anytime. |
| * | For forward agreements, a positive amount represents “long” exposure to the underlying commodity. A negative amount represents “short” exposure to the underlying commodity. |
| † | All or partial amount segregated as collateral for forward agreements. |
See accompanying notes to financial statements.
F-28
Table of Contents
PROSHARES ULTRA GOLD
SCHEDULE OF INVESTMENTS
DECEMBER 31, 2008
Futures Contracts Purchased
| Number of Contracts |
Notional Amount at Value |
Unrealized Appreciation (Depreciation) | ||||||||
| Gold Futures – COMEX, expires February 2009 |
22 | $ | 1,920,600 | $ | 39,770 | |||||
Forward Agreements
| Settlement Date |
Commitment to (Deliver)/Receive |
Notional Amount at Value* |
Unrealized Appreciation (Depreciation) |
|||||||||
| Forward agreements with Goldman Sachs International based on 0.995 Fine Troy Ounce Gold |
01/07/09 | $ | 61,702 | $ | 53,666,549 | $ | (586,254 | ) | ||||
| * | For forward agreements, a positive amount represents “long” exposure to the underlying commodity. A negative amount represents “short” exposure to the underlying commodity. |
See accompanying notes to financial statements.
F-29
Table of Contents
PROSHARES ULTRA GOLD
STATEMENTS OF OPERATIONS
FOR THE YEAR ENDED DECEMBER 31, 2009 AND THE PERIOD FROM
AUGUST 6, 2008 (INCEPTION) TO DECEMBER 31, 2008
| Year ended December 31, 2009 |
August 6, 2008 (Inception) through December 31, 2008 |
|||||||
| Investment Income |
||||||||
| Interest |
$ | 55,592 | $ | — | ||||
| Expenses |
||||||||
| Management fee |
1,014,224 | — | ||||||
| Brokerage commissions |
4,213 | 110 | ||||||
| Organization costs |
— | 27,953 | ||||||
| Offering costs |
284,355 | 25,465 | ||||||
| Limitation by Sponsor |
— | (43,098 | ) | |||||
| Total expenses |
1,302,792 | 10,430 | ||||||
| Net investment income (loss) |
(1,247,200 | ) | (10,430 | ) | ||||
| Realized and unrealized gain (loss) on investment activity |
||||||||
| Net realized gain (loss) on |
||||||||
| Futures contracts |
1,905,831 | 28,483 | ||||||
| Forward agreements |
38,020,273 | 2,239,235 | ||||||
| Net realized gain (loss) |
39,926,104 | 2,267,718 | ||||||
| Change in net unrealized appreciation/depreciation on |
||||||||
| Futures contracts |
(233,970 | ) | 39,770 | |||||
| Forward agreements |
(4,648,006 | ) | (586,254 | ) | ||||
| Short-term U.S. government and agency obligations |
(2,921 | ) | — | |||||
| Change in net unrealized appreciation/depreciation |
(4,884,897 | ) | (546,484 | ) | ||||
| Net realized and unrealized gain (loss) |
35,041,207 | 1,721,234 | ||||||
| Net income (loss) |
$ | 33,794,007 | $ | 1,710,804 | ||||
| Net income (loss) per weighted-average share |
$ | 9.17 | $ | 3.84 | ||||
| Weighted-average shares outstanding |
3,686,863 | 445,014 | ||||||
See accompanying notes to financial statements.
F-30
Table of Contents
PROSHARES ULTRA GOLD
STATEMENTS OF CHANGES IN SHAREHOLDERS’ EQUITY
FOR THE YEAR ENDED DECEMBER 31, 2009 AND THE PERIOD FROM
AUGUST 6, 2008 (INCEPTION) TO DECEMBER 31, 2008
| Year ended December 31, 2009 |
August 6, 2008 (Inception) through December 31, 2008 |
|||||||
| Shareholders’ equity, beginning of period |
$ | 27,736,722 | $ | — | ||||
| Addition of shares (5,250,000 and 900,014, respectively) |
193,756,011 | 26,025,918 | ||||||
| Redemption of shares (2,600,000 and 0, respectively) |
(98,810,031 | ) | — | |||||
| Net addition (redemption) of shares |
94,945,980 | 26,025,918 | ||||||
| Net investment income (loss) |
(1,247,200 | ) | (10,430 | ) | ||||
| Net realized gain (loss) |
39,926,104 | 2,267,718 | ||||||
| Change in net unrealized appreciation/depreciation |
(4,884,897 | ) | (546,484 | ) | ||||
| Net income (loss) |
33,794,007 | 1,710,804 | ||||||
| Shareholders’ equity, end of period |
$ | 156,476,709 | $ | 27,736,722 | ||||
See accompanying notes to financial statements.
F-31
Table of Contents
PROSHARES ULTRA GOLD
STATEMENTS OF CASH FLOWS
FOR THE YEAR ENDED DECEMBER 31, 2009 AND THE PERIOD FROM
AUGUST 6, 2008 (INCEPTION) TO DECEMBER 31, 2008
| Year ended December 31, 2009 |
August 6, 2008 (Inception) through December 31, 2008 |
|||||||
| Cash flow from operating activities |
||||||||
| Net income (loss) |
$ | 33,794,007 | $ | 1,710,804 | ||||
| Adjustments to reconcile net income (loss) to net cash provided by (used in) operating activities: |
||||||||
| Decrease (Increase) in segregated cash balances with brokers for futures contracts |
(377,871 | ) | (102,966 | ) | ||||
| Net purchase of short-term U.S. government and agency obligations |
(168,088,591 | ) | — | |||||
| (Increase) in receivable on futures contracts |
(30,045 | ) | (2,885 | ) | ||||
| Change in unrealized appreciation/depreciation on investments |
4,650,927 | 586,254 | ||||||
| Decrease (Increase) in receivable from Sponsor |
43,098 | (43,098 | ) | |||||
| Amortization of offering cost |
284,355 | (284,355 | ) | |||||
| Increase (Decrease) in management fee payable |
149,879 | — | ||||||
| (Decrease) Increase in accounts payable |
(208,045 | ) | 208,045 | |||||
| Net cash provided by (used in) operating activities |
(129,782,286 | ) | 2,071,799 | |||||
| Cash flow from financing activities |
||||||||
| Proceeds from addition of shares |
198,417,932 | 21,363,997 | ||||||
| Payment on shares redeemed |
(91,974,974 | ) | — | |||||
| Net cash provided by (used in) financing activities |
106,442,958 | 21,363,997 | ||||||
| Net increase (decrease) in cash |
(23,339,328 | ) | 23,435,796 | |||||
| Cash, beginning of period |
23,435,796 | — | ||||||
| Cash, end of period |
$ | 96,468 | $ | 23,435,796 | ||||
See accompanying notes to financial statements.
F-32
Table of Contents
STATEMENTS OF FINANCIAL CONDITION
| December 31, 2009 | December 31, 2008 | |||||||
| Assets |
||||||||
| Cash |
$ | 75,790 | $ | 3,104,221 | ||||
| Segregated cash balances for forward agreements |
— | 540,000 | ||||||
| Segregated cash balances with brokers for futures contracts |
140,916 | 27,749 | ||||||
| Short-term U.S. government and agency obligations (Note 3) |
66,310,764 | — | ||||||
| Unrealized appreciation on forward agreements |
2,144,062 | 86,657 | ||||||
| Receivable from Sponsor |
— | 51,088 | ||||||
| Offering costs (Note 5) |
— | 284,355 | ||||||
| Total assets |
68,671,532 | 4,094,070 | ||||||
| Liabilities and shareholders’ equity |
||||||||
| Liabilities |
||||||||
| Payable for capital shares redeemed |
1,014,755 | — | ||||||
| Payable on open futures contracts |
— | 10,931 | ||||||
| Management fee payable |
53,966 | — | ||||||
| Accounts payable |
— | 208,046 | ||||||
| Total liabilities |
1,068,721 | 218,977 | ||||||
| Shareholders’ equity |
||||||||
| Paid-in capital |
86,180,401 | 4,537,070 | ||||||
| Accumulated earnings (deficit) |
(18,577,590 | ) | (661,977 | ) | ||||
| Total shareholders’ equity |
67,602,811 | 3,875,093 | ||||||
| Total liabilities and shareholders’ equity |
$ | 68,671,532 | $ | 4,094,070 | ||||
| Shares outstanding |
6,450,014 | 200,014 | ||||||
| Net asset value per share |
$ | 10.48 | $ | 19.37 | ||||
| Market value per share (Note 2) |
$ | 10.35 | $ | 19.10 | ||||
See accompanying notes to financial statements.
F-33
Table of Contents
PROSHARES ULTRASHORT GOLD
SCHEDULE OF INVESTMENTS
DECEMBER 31, 2009
| Principal Amount | Value | |||||
| Short-term U.S. government and agency obligations |
||||||
| Federal Agricultural Mortgage Corp., Discount Notes: |
||||||
| 0.010% due 01/07/10 |
$ | 23,000,000 | $ | 22,999,962 | ||
| Federal Home Loan Bank, Discount Notes: |
||||||
| 0.001% due 01/27/10 |
10,339,000 | 10,338,993 | ||||
| U.S. Treasury Bills: |
||||||
| 0.010% due 02/04/10 |
15,000,000 | 14,999,858 | ||||
| 0.040% due 02/25/10† |
3,000,000 | 2,999,817 | ||||
| 0.260% due 08/26/10† |
15,000,000 | 14,972,134 | ||||
| Total short-term U.S. government and agency obligations (cost $66,312,955) |
$ | 66,310,764 | ||||
Futures Contracts Sold
| Number of Contracts |
Notional Amount at Value |
Unrealized Appreciation (Depreciation) | |||||||||||
| Gold Futures – COMEX, expires February 2010 |
28 | $ | 3,069,360 | $ | 39,140 | ||||||||
| Forward Agreements^ | |||||||||||||
| Settlement Date |
Commitment to (Deliver)/Receive |
Notional Amount at Value* |
Unrealized Appreciation (Depreciation) | ||||||||||
| Forward agreements with Goldman Sachs International based on 0.995 Fine Troy Ounce Gold |
01/04/10 | $ | (23,998 | ) | $ | (26,099,265 | ) | $ | 443,041 | ||||
| Forward agreements with UBS AG based on 0.995 Fine Troy Ounce Gold |
01/04/10 | (97,000 | ) | (105,493,320 | ) | 1,701,021 | |||||||
| $ | 2,144,062 | ||||||||||||
| ^ | The positions and counterparties herein are as of December 31, 2009. The Funds continually evaluate different counterparties for their transactions and counterparties are subject to change. New counterparties can be added at anytime. |
| * | For forward agreements, a positive amount represents “long” exposure to the underlying commodity. A negative amount represents “short” exposure to the underlying commodity. |
| † | All or partial amount segregated as collateral for forward agreements. |
See accompanying notes to financial statements.
F-34
Table of Contents
PROSHARES ULTRASHORT GOLD
SCHEDULE OF INVESTMENTS
DECEMBER 31, 2008
Futures Contracts Sold
| Number of Contracts |
Notional Amount at Value |
Unrealized Appreciation (Depreciation) |
||||||||||||
| Gold Futures – COMEX, expires February 2009 |
4 | $ | 349,200 | $ | (22,690 | ) | ||||||||
| Forward Agreements | ||||||||||||||
| Settlement Date |
Commitment to (Deliver)/Receive |
Notional Amount at Value* |
Unrealized Appreciation (Depreciation) |
|||||||||||
| Forward agreements with Goldman Sachs International based on 0.995 Fine Troy Ounce Gold |
01/07/09 | $ | (8,543 | ) | $ | (7,430,445 | ) | $ | 86,657 | |||||
| * | For forward agreements, a positive amount represents “long” exposure to the underlying commodity. A negative amount represents “short” exposure to the underlying commodity. |
See accompanying notes to financial statements.
F-35
Table of Contents
PROSHARES ULTRASHORT GOLD
STATEMENTS OF OPERATIONS
FOR THE YEAR ENDED DECEMBER 31, 2009 AND THE PERIOD FROM
AUGUST 6, 2008 (INCEPTION) TO DECEMBER 31, 2008
| Year ended December 31, 2009 |
August 6, 2008 (Inception) through December 31, 2008 |
|||||||
| Investment Income |
||||||||
| Interest |
$ | 16,787 | $ | — | ||||
| Expenses |
||||||||
| Management fee |
131,683 | — | ||||||
| Brokerage commissions |
3,532 | 40 | ||||||
| Organization costs |
— | 27,953 | ||||||
| Offering costs |
284,355 | 25,465 | ||||||
| Limitation by Sponsor |
— | (51,088 | ) | |||||
| Total expenses |
419,570 | 2,370 | ||||||
| Net investment income (loss) |
(402,783 | ) | (2,370 | ) | ||||
| Realized and unrealized gain (loss) on investment activity |
||||||||
| Net realized gain (loss) on |
||||||||
| Futures contracts |
(640,078 | ) | (10,583 | ) | ||||
| Forward agreements |
(18,989,796 | ) | (712,991 | ) | ||||
| Net realized gain (loss) |
(19,629,874 | ) | (723,574 | ) | ||||
| Change in net unrealized appreciation/depreciation on |
||||||||
| Futures contracts |
61,830 | (22,690 | ) | |||||
| Forward agreements |
2,057,405 | 86,657 | ||||||
| Short-term U.S. government and agency obligations |
(2,191 | ) | — | |||||
| Change in net unrealized appreciation/depreciation |
2,117,044 | 63,967 | ||||||
| Net realized and unrealized gain (loss) |
(17,512,830 | ) | (659,607 | ) | ||||
| Net income (loss) |
$ | (17,915,613 | ) | $ | (661,977 | ) | ||
| Net income (loss) per weighted-average share |
$ | (5.51 | ) | $ | (4.84 | ) | ||
| Weighted-average shares outstanding |
3,249,055 | 136,681 | ||||||
See accompanying notes to financial statements.
F-36
Table of Contents
PROSHARES ULTRASHORT GOLD
STATEMENTS OF CHANGES IN SHAREHOLDERS’ EQUITY
FOR THE YEAR ENDED DECEMBER 31, 2009 AND THE PERIOD FROM
AUGUST 6, 2008 (INCEPTION) TO DECEMBER 31, 2008
| Year ended December 31, 2009 |
August 6, 2008 (Inception) through December 31, 2008 |
|||||||
| Shareholders’ equity, beginning of period |
$ | 3,875,093 | $ | — | ||||
| Addition of shares (9,850,000 and 200,014, respectively) |
134,255,857 | 4,537,070 | ||||||
| Redemption of shares (3,600,000 and 0, respectively) |
(52,612,526 | ) | — | |||||
| Net addition (redemption) of shares |
81,643,331 | 4,537,070 | ||||||
| Net investment income (loss) |
(402,783 | ) | (2,370 | ) | ||||
| Net realized gain (loss) |
(19,629,874 | ) | (723,574 | ) | ||||
| Change in net unrealized appreciation/depreciation |
2,117,044 | 63,967 | ||||||
| Net income (loss) |
(17,915,613 | ) | (661,977 | ) | ||||
| Shareholders’ equity, end of period |
$ | 67,602,811 | $ | 3,875,093 | ||||
See accompanying notes to financial statements.
F-37
Table of Contents
PROSHARES ULTRASHORT GOLD
STATEMENTS OF CASH FLOWS
FOR THE YEAR ENDED DECEMBER 31, 2009 AND THE PERIOD FROM
AUGUST 6, 2008 (INCEPTION) TO DECEMBER 31, 2008
| Year ended December 31, 2009 |
August 6, 2008 (Inception) through December 31, 2008 |
|||||||
| Cash flow from operating activities |
||||||||
| Net income (loss) |
$ | (17,915,613 | ) | $ | (661,977 | ) | ||
| Adjustments to reconcile net income (loss) to net cash provided by (used in) operating activities: |
||||||||
| Decrease (Increase) in segregated cash balances for forward agreements |
540,000 | (540,000 | ) | |||||
| (Increase) in segregated cash balances with brokers for futures contracts |
(113,167 | ) | (27,749 | ) | ||||
| Net purchase of short-term U.S. government and agency obligations |
(66,312,955 | ) | — | |||||
| Change in unrealized appreciation/depreciation on investments |
(2,055,214 | ) | (86,657 | ) | ||||
| Decrease (Increase) in receivable from Sponsor |
51,088 | (51,088 | ) | |||||
| Amortization of offering cost |
284,355 | (284,355 | ) | |||||
| Increase (Decrease) in management fee payable |
53,966 | — | ||||||
| (Decrease) Increase in payable on futures contracts |
(10,931 | ) | 10,931 | |||||
| (Decrease) Increase in accounts payable |
(208,046 | ) | 208,046 | |||||
| Net cash provided by (used in) operating activities |
(85,686,517 | ) | (1,432,849 | ) | ||||
| Cash flow from financing activities |
||||||||
| Proceeds from addition of shares |
134,255,857 | 4,537,070 | ||||||
| Payment on shares redeemed |
(51,597,771 | ) | — | |||||
| Net cash provided by (used in) financing activities |
82,658,086 | 4,537,070 | ||||||
| Net increase (decrease) in cash |
(3,028,431 | ) | 3,104,221 | |||||
| Cash, beginning of period |
3,104,221 | — | ||||||
| Cash, end of period |
$ | 75,790 | $ | 3,104,221 | ||||
See accompanying notes to financial statements.
F-38
Table of Contents
STATEMENTS OF FINANCIAL CONDITION
| December 31, 2009 | December 31, 2008 | |||||
| Assets |
||||||
| Cash |
$ | 75,670 | $ | 8,641,327 | ||
| Segregated cash balances with brokers for futures contracts |
928,138 | 73,705 | ||||
| Short-term U.S. government and agency obligations (Note 3) (cost $157,779,376 and $0, respectively) |
157,772,073 | — | ||||
| Receivable from capital shares sold |
— | 1,469,530 | ||||
| Receivable on open futures contracts |
— | 24,488 | ||||
| Receivable from Sponsor |
— | 30,776 | ||||
| Offering costs (Note 5) |
— | 71,126 | ||||
| Total assets |
158,775,881 | 10,310,952 | ||||
| Liabilities and shareholders’ equity |
||||||
| Liabilities |
||||||
| Payable for capital shares redeemed |
6,007,423 | — | ||||
| Management fee payable |
123,889 | — | ||||
| Accounts payable |
— | 42,976 | ||||
| Unrealized depreciation on forward agreements |
7,228,187 | 256,827 | ||||
| Total liabilities |
13,359,499 | 299,803 | ||||
| Shareholders’ equity |
||||||
| Paid-in capital |
109,869,748 | 9,881,413 | ||||
| Accumulated earnings (deficit) |
35,546,634 | 129,736 | ||||
| Total shareholders’ equity |
145,416,382 | 10,011,149 | ||||
| Total liabilities and shareholders’ equity |
$ | 158,775,881 | $ | 10,310,952 | ||
| Shares outstanding |
2,550,014 | 350,014 | ||||
| Net asset value per share |
$ | 57.03 | $ | 28.60 | ||
| Market value per share (Note 2) |
$ | 56.15 | $ | 31.50 | ||
See accompanying notes to financial statements.
F-39
Table of Contents
PROSHARES ULTRA SILVER
SCHEDULE OF INVESTMENTS
DECEMBER 31, 2009
| Principal Amount | Value | |||||
| Short-term U.S. government and agency obligations |
||||||
| Federal Agricultural Mortgage Corp., Discount Notes: |
||||||
| 0.010% due 01/07/10 |
$ | 32,000,000 | $ | 31,999,947 | ||
| Federal Home Loan Bank, Discount Notes: |
||||||
| 0.001% due 01/27/10 |
24,866,000 | 24,865,981 | ||||
| U.S. Treasury Bills: |
||||||
| 0.010% due 02/04/10 |
40,000,000 | 39,999,611 | ||||
| 0.035% due 02/25/10† |
11,000,000 | 10,999,420 | ||||
| 0.260% due 08/26/10† |
50,000,000 | 49,907,114 | ||||
| Total short-term U.S. government and agency obligations (cost $157,779,376) |
$ | 157,772,073 | ||||
Futures Contracts Purchased
| Number of Contracts |
Notional Amount at Value |
Unrealized Appreciation (Depreciation) |
||||||||||
| Silver Futures – COMEX, expires March 2010 |
160 | $ | 13,476,000 | $ | (568,800 | ) | ||||||
| Forward Agreements^ | ||||||||||||
| Settlement Date |
Commitment to (Deliver)/Receive |
Notional Amount at Value* |
Unrealized Appreciation (Depreciation) |
|||||||||
| Forward agreements with Goldman Sachs International based on 0.999 Fine Troy Ounce Silver |
01/04/10 | $ | 4,120,800 | $ | 70,017,337 | $ | (1,908,743 | ) | ||||
| Forward agreements with UBS AG based on 0.999 Fine Troy Ounce Silver |
01/04/10 | 12,210,000 | 207,462,552 | (5,319,444 | ) | |||||||
| $ | (7,228,187 | ) | ||||||||||
| ^ | The positions and counterparties herein are as of December 31, 2009. The Funds continually evaluate different counterparties for their transactions and counterparties are subject to change. New counterparties can be added at anytime. |
| * | For forward agreements, a positive amount represents “long” exposure to the underlying commodity. A negative amount represents “short” exposure to the underlying commodity. |
| † | All or partial amount segregated as collateral for forward agreements. |
See accompanying notes to financial statements.
F-40
Table of Contents
PROSHARES ULTRA SILVER
SCHEDULE OF INVESTMENTS
DECEMBER 31, 2008
Futures Contracts Purchased
| Number of Contracts |
Notional Amount at Value |
Unrealized Appreciation (Depreciation) |
||||||||||
| Silver Futures – COMEX, expires March 2009 |
12 | $ | 647,700 | $ | (8,045 | ) | ||||||
| Forward Agreements | ||||||||||||
| Settlement Date |
Commitment to (Deliver)/Receive |
Notional Amount at Value* |
Unrealized Appreciation (Depreciation) |
|||||||||
| Forward agreements with Goldman Sachs International based on 0.999 Fine Troy Ounce Silver |
01/07/09 | $ | 1,796,400 | $ | 19,383,336 | $ | (256,827 | ) | ||||
| * | For forward agreements, a positive amount represents “long” exposure to the underlying commodity. A negative amount represents “short” exposure to the underlying commodity. |
See accompanying notes to financial statements.
F-41
Table of Contents
PROSHARES ULTRA SILVER
STATEMENTS OF OPERATIONS
FOR THE YEAR ENDED DECEMBER 31, 2009 AND THE PERIOD FROM AUGUST 6, 2008 (INCEPTION) TO DECEMBER 31, 2008
| Year ended December 31, 2009 |
August 6, 2008 (Inception) through December 31, 2008 |
|||||||
| Investment Income |
||||||||
| Interest |
$ | 28,466 | $ | — | ||||
| Expenses |
||||||||
| Management fee |
710,900 | — | ||||||
| Brokerage commissions |
5,134 | 65 | ||||||
| Organization costs |
— | 27,952 | ||||||
| Offering costs |
71,126 | 6,370 | ||||||
| Limitation by Sponsor |
— | (30,776 | ) | |||||
| Total expenses |
787,160 | 3,611 | ||||||
| Net investment income (loss) |
(758,694 | ) | (3,611 | ) | ||||
| Realized and unrealized gain (loss) on investment activity |
||||||||
| Net realized gain (loss) on |
||||||||
| Futures contracts |
1,910,810 | 10,196 | ||||||
| Forward agreements |
41,804,200 | 388,023 | ||||||
| Net realized gain (loss) |
43,715,010 | 398,219 | ||||||
| Change in net unrealized appreciation/depreciation on |
||||||||
| Futures contracts |
(560,755 | ) | (8,045 | ) | ||||
| Forward agreements |
(6,971,360 | ) | (256,827 | ) | ||||
| Short-term U.S. government and agency obligations |
(7,303 | ) | — | |||||
| Change in net unrealized appreciation/depreciation |
(7,539,418 | ) | (264,872 | ) | ||||
| Net realized and unrealized gain (loss) |
36,175,592 | 133,347 | ||||||
| Net income (loss) |
$ | 35,416,898 | $ | 129,736 | ||||
| Net income (loss) per weighted-average share |
$ | 21.35 | $ | 0.76 | ||||
| Weighted-average shares outstanding |
1,659,192 | 170,014 | ||||||
See accompanying notes to financial statements.
F-42
Table of Contents
PROSHARES ULTRA SILVER
STATEMENTS OF CHANGES IN SHAREHOLDERS’ EQUITY
FOR THE YEAR ENDED DECEMBER 31, 2009 AND THE PERIOD FROM
AUGUST 6, 2008 (INCEPTION) TO DECEMBER 31, 2008
| Year ended December 31, 2009 |
August 6, 2008 (Inception) through December 31, 2008 |
|||||||
| Shareholders’ equity, beginning of period |
$ | 10,011,149 | $ | — | ||||
| Addition of shares (3,500,000 and 350,014, respectively) |
161,850,670 | 9,881,413 | ||||||
| Redemption of shares (1,300,000 and 0, respectively) |
(61,862,335 | ) | — | |||||
| Net addition (redemption) of shares |
99,988,335 | 9,881,413 | ||||||
| Net investment income (loss) |
(758,694 | ) | (3,611 | ) | ||||
| Net realized gain (loss) |
43,715,010 | 398,219 | ||||||
| Change in net unrealized appreciation/depreciation |
(7,539,418 | ) | (264,872 | ) | ||||
| Net income (loss) |
35,416,898 | 129,736 | ||||||
| Shareholders’ equity, end of period |
$ | 145,416,382 | $ | 10,011,149 | ||||
See accompanying notes to financial statements.
F-43
Table of Contents
PROSHARES ULTRA SILVER
STATEMENTS OF CASH FLOWS
FOR THE YEAR ENDED DECEMBER 31, 2009 AND THE PERIOD FROM
AUGUST 6, 2008 (INCEPTION) TO DECEMBER 31, 2008
| Year ended December 31, 2009 |
August 6, 2008 (Inception) through December 31, 2008 |
|||||||
| Cash flow from operating activities |
||||||||
| Net income (loss) |
$ | 35,416,898 | $ | 129,736 | ||||
| Adjustments to reconcile net income (loss) to net cash provided by (used in) operating activities: |
||||||||
| (Increase) in segregated cash balances with brokers for futures contracts |
(854,433 | ) | (73,705 | ) | ||||
| Net purchase of short-term U.S. government and agency obligations |
(157,779,376 | ) | — | |||||
| Decrease (Increase) in receivable on futures contracts |
24,488 | (24,488 | ) | |||||
| Change in unrealized appreciation/depreciation on investments |
6,978,663 | 256,827 | ||||||
| Decrease (Increase) in receivable from Sponsor |
30,776 | (30,776 | ) | |||||
| Amortization of offering cost |
71,126 | (71,126 | ) | |||||
| Increase (Decrease) in management fee payable |
123,889 | — | ||||||
| (Decrease) Increase in accounts payable |
(42,976 | ) | 42,976 | |||||
| Net cash provided by (used in) operating activities |
(116,030,945 | ) | 229,444 | |||||
| Cash flow from financing activities |
||||||||
| Proceeds from addition of shares |
163,320,200 | 8,411,883 | ||||||
| Payment on shares redeemed |
(55,854,912 | ) | — | |||||
| Net cash provided by (used in) financing activities |
107,465,288 | 8,411,883 | ||||||
| Net increase (decrease) in cash |
(8,565,657 | ) | 8,641,327 | |||||
| Cash, beginning of period |
8,641,327 | — | ||||||
| Cash, end of period |
$ | 75,670 | $ | 8,641,327 | ||||
See accompanying notes to financial statements.
F-44
Table of Contents
STATEMENTS OF FINANCIAL CONDITION
| December 31, 2009 | December 31, 2008 | |||||||
| Assets |
||||||||
| Cash |
$ | 78,312 | $ | 992,121 | ||||
| Segregated cash balances for forward agreements |
— | 820,000 | ||||||
| Segregated cash balances with brokers for futures contracts |
447,653 | 22,280 | ||||||
| Short-term U.S. government and agency obligations (Note 3) (cost $64,775,162 and $0, respectively) |
64,772,241 | — | ||||||
| Unrealized appreciation on forward agreements |
2,859,064 | 47,484 | ||||||
| Receivable from Sponsor |
— | 38,902 | ||||||
| Offering costs (Note 5) |
— | 142,197 | ||||||
| Total assets |
68,157,270 | 2,062,984 | ||||||
| Liabilities and shareholders’ equity |
||||||||
| Liabilities |
||||||||
| Payable for capital shares redeemed |
3,588,515 | — | ||||||
| Payable on open futures contracts |
— | 5,171 | ||||||
| Management fee payable |
52,610 | — | ||||||
| Accounts payable |
— | 97,742 | ||||||
| Total liabilities |
3,641,125 | 102,913 | ||||||
| Shareholders’ equity |
||||||||
| Paid-in capital |
103,237,063 | 2,500,900 | ||||||
| Accumulated earnings (deficit) |
(38,720,918 | ) | (540,829 | ) | ||||
| Total shareholders’ equity |
64,516,145 | 1,960,071 | ||||||
| Total liabilities and shareholders’ equity |
$ | 68,157,270 | $ | 2,062,984 | ||||
| Shares outstanding |
13,700,014 | 100,014 | ||||||
| Net asset value per share |
$ | 4.71 | $ | 19.60 | ||||
| Market value per share (Note 2) |
$ | 4.79 | $ | 17.51 | ||||
See accompanying notes to financial statements.
F-45
Table of Contents
PROSHARES ULTRASHORT SILVER
SCHEDULE OF INVESTMENTS
DECEMBER 31, 2009
| Principal Amount | Value | |||||
| Short-term U.S. government and agency obligations |
||||||
| Federal Agricultural Mortgage Corp., Discount Notes: |
||||||
| 0.010% due 01/07/10 |
$ | 18,000,000 | $ | 17,999,970 | ||
| Federal Home Loan Bank, Discount Notes: |
||||||
| 0.001% due 01/27/10 |
10,810,000 | 10,809,992 | ||||
| U.S. Treasury Bills: |
||||||
| 0.010% due 02/04/10 |
8,000,000 | 7,999,922 | ||||
| 0.040% due 02/25/10† |
8,000,000 | 7,999,511 | ||||
| 0.260% due 08/26/10† |
20,000,000 | 19,962,846 | ||||
| Total short-term U.S. government and agency obligations (cost $64,775,162) |
$ | 64,772,241 | ||||
Futures Contracts Sold
| Number of Contracts |
Notional Amount at Value |
Unrealized Appreciation (Depreciation) | |||||||||||
| Silver Futures – COMEX, expires March 2010 |
77 | $ | 6,485,325 | $ | 184,735 | ||||||||
| Forward Agreements^ | |||||||||||||
| Settlement Date |
Commitment to (Deliver)/Receive |
Notional Amount at Value* |
Unrealized Appreciation (Depreciation) | ||||||||||
| Forward agreements with Goldman Sachs International based on 0.999 Fine Troy Ounce Silver |
01/04/10 | $ | (1,837,500 | ) | $ | (31,221,330 | ) | $ | 787,670 | ||||
| Forward agreements with UBS AG based on 0.999 Fine Troy Ounce Silver |
01/04/10 | (5,363,000 | ) | (91,123,806 | ) | 2,071,394 | |||||||
| $ | 2,859,064 | ||||||||||||
| ^ | The positions and counterparties herein are as of December 31, 2009. The Funds continually evaluate different counterparties for their transactions and counterparties are subject to change. New counterparties can be added at anytime. |
| * | For forward agreements, a positive amount represents “long” exposure to the underlying commodity. A negative amount represents “short” exposure to the underlying commodity. |
| † | All or partial amount segregated as collateral for forward agreements. |
See accompanying notes to financial statements.
F-46
Table of Contents
PROSHARES ULTRASHORT SILVER
SCHEDULE OF INVESTMENTS
DECEMBER 31, 2008
Futures Contracts Sold
| Number of Contracts |
Notional Amount at Value |
Unrealized Appreciation (Depreciation) |
||||||||||||
| Silver Futures – COMEX, expires March 2009 |
2 | $ | 107,950 | $ | (650 | ) | ||||||||
| Forward Agreements | ||||||||||||||
| Settlement Date |
Commitment to (Deliver)/Receive |
Notional Amount at Value* |
Unrealized Appreciation (Depreciation) |
|||||||||||
| Forward agreements with Goldman Sachs International based on 0.999 Fine Troy Ounce Silver |
01/07/09 | $ | (353,100 | ) | $ | (3,809,984 | ) | $ | 47,484 | |||||
| * | For forward agreements, a positive amount represents “long” exposure to the underlying commodity. A negative amount represents “short” exposure to the underlying commodity. |
See accompanying notes to financial statements.
F-47
Table of Contents
PROSHARES ULTRASHORT SILVER
STATEMENTS OF OPERATIONS
FOR THE YEAR ENDED DECEMBER 31, 2009 AND THE PERIOD FROM
AUGUST 6, 2008 (INCEPTION) TO DECEMBER 31, 2008
| Year ended December 31, 2009 |
August 6, 2008 (Inception) through December 31, 2008 |
|||||||
| Investment Income |
||||||||
| Interest |
$ | 15,541 | $ | — | ||||
| Expenses |
||||||||
| Management fee |
257,865 | — | ||||||
| Brokerage commissions |
4,382 | 85 | ||||||
| Organization costs |
— | 27,953 | ||||||
| Offering costs |
142,197 | 12,734 | ||||||
| Limitation by Sponsor |
— | (38,902 | ) | |||||
| Total expenses |
404,444 | 1,870 | ||||||
| Net investment income (loss) |
(388,903 | ) | (1,870 | ) | ||||
| Realized and unrealized gain (loss) on investment activity |
||||||||
| Net realized gain (loss) on |
||||||||
| Futures contracts |
(664,595 | ) | (22,030 | ) | ||||
| Forward agreements |
(40,120,635 | ) | (563,763 | ) | ||||
| Net realized gain (loss) |
(40,785,230 | ) | (585,793 | ) | ||||
| Change in net unrealized appreciation/depreciation on |
||||||||
| Futures contracts |
185,385 | (650 | ) | |||||
| Forward agreements |
2,811,580 | 47,484 | ||||||
| Short-term U.S. government and agency obligations |
(2,921 | ) | — | |||||
| Change in net unrealized appreciation/depreciation |
2,994,044 | 46,834 | ||||||
| Net realized and unrealized gain (loss) |
(37,791,186 | ) | (538,959 | ) | ||||
| Net income (loss) |
$ | (38,180,089 | ) | $ | (540,829 | ) | ||
| Net income (loss) per weighted-average share |
$ | (5.89 | ) | $ | (5.41 | ) | ||
| Weighted-average shares outstanding |
6,478,233 | 100,014 | ||||||
See accompanying notes to financial statements.
F-48
Table of Contents
PROSHARES ULTRASHORT SILVER
STATEMENTS OF CHANGES IN SHAREHOLDERS’ EQUITY
FOR THE YEAR ENDED DECEMBER 31, 2009 AND THE PERIOD FROM
AUGUST 6, 2008 (INCEPTION) TO DECEMBER 31, 2008
| Year ended December 31, 2009 |
August 6, 2008 (Inception) through December 31, 2008 |
|||||||
| Shareholders’ equity, beginning of period |
$ | 1,960,071 | $ | — | ||||
| Addition of shares (23,250,000 and 100,014, respectively) |
178,025,835 | 2,500,900 | ||||||
| Redemption of shares (9,650,000 and 0, respectively) |
(77,289,672 | ) | — | |||||
| Net addition (redemption) of shares |
100,736,163 | 2,500,900 | ||||||
| Net investment income (loss) |
(388,903 | ) | (1,870 | ) | ||||
| Net realized gain (loss) |
(40,785,230 | ) | (585,793 | ) | ||||
| Change in net unrealized appreciation/depreciation |
2,994,044 | 46,834 | ||||||
| Net income (loss) |
(38,180,089 | ) | (540,829 | ) | ||||
| Shareholders’ equity, end of period |
$ | 64,516,145 | $ | 1,960,071 | ||||
See accompanying notes to financial statements.
F-49
Table of Contents
PROSHARES ULTRASHORT SILVER
STATEMENTS OF CASH FLOWS
FOR THE YEAR ENDED DECEMBER 31, 2009 AND THE PERIOD FROM
AUGUST 6, 2008 (INCEPTION) TO DECEMBER 31, 2008
| Year ended December 31, 2009 |
August 6, 2008 (Inception) through December 31, 2008 |
|||||||
| Cash flow from operating activities |
||||||||
| Net income (loss) |
$ | (38,180,089 | ) | $ | (540,829 | ) | ||
| Adjustments to reconcile net income (loss) to net cash provided by (used in) operating activities: |
||||||||
| (Increase) in segregated cash balances with brokers for futures contracts |
(425,373 | ) | (22,280 | ) | ||||
| Decrease (Increase) in segregated cash balances for forward agreements |
820,000 | (820,000 | ) | |||||
| Net purchase of short-term U.S. government and agency obligations |
(64,775,162 | ) | — | |||||
| Change in unrealized appreciation/depreciation on investments |
(2,808,659 | ) | (47,484 | ) | ||||
| Decrease (Increase) in receivable from Sponsor |
38,902 | (38,902 | ) | |||||
| Amortization of offering cost |
142,197 | (142,197 | ) | |||||
| Increase (Decrease) in management fee payable |
52,610 | — | ||||||
| (Decrease) Increase in accounts payable |
(97,742 | ) | 97,742 | |||||
| (Decrease) Increase in payable on open futures contracts |
(5,171 | ) | 5,171 | |||||
| Net cash provided by (used in) operating activities |
(105,238,487 | ) | (1,508,779 | ) | ||||
| Cash flow from financing activities |
||||||||
| Proceeds from addition of shares |
178,025,835 | 2,500,900 | ||||||
| Payment on shares redeemed |
(73,701,157 | ) | — | |||||
| Net cash provided by (used in) financing activities |
104,324,678 | 2,500,900 | ||||||
| Net increase (decrease) in cash |
(913,809 | ) | 992,121 | |||||
| Cash, beginning of period |
992,121 | — | ||||||
| Cash, end of period |
$ | 78,312 | $ | 992,121 | ||||
See accompanying notes to financial statements.
F-50
Table of Contents
STATEMENTS OF FINANCIAL CONDITION
| December 31, 2009 | December 31, 2008 | |||||
| Assets |
||||||
| Cash |
$ | 79,160 | $ | 4,467,380 | ||
| Short-term U.S. government and agency obligations (Note 3) |
7,736,270 | — | ||||
| Receivable from Sponsor |
— | 32,913 | ||||
| Offering costs (Note 5) |
— | 69,640 | ||||
| Total assets |
7,815,430 | 4,569,933 | ||||
| Liabilities and shareholders’ equity |
||||||
| Liabilities |
||||||
| Management fee payable |
6,315 | — | ||||
| Accounts payable |
— | 42,977 | ||||
| Unrealized depreciation on foreign currency forward contracts |
277,258 | 140,545 | ||||
| Total liabilities |
283,573 | 183,522 | ||||
| Shareholders’ equity |
||||||
| Paid-in capital |
6,602,808 | 3,958,670 | ||||
| Accumulated earnings (deficit) |
929,049 | 427,741 | ||||
| Total shareholders’ equity |
7,531,857 | 4,386,411 | ||||
| Total liabilities and shareholders’ equity |
$ | 7,815,430 | $ | 4,569,933 | ||
| Shares outstanding |
250,014 | 150,014 | ||||
| Net asset value per share |
$ | 30.13 | $ | 29.24 | ||
| Market value per share (Note 2) |
$ | 30.17 | $ | 29.49 | ||
See accompanying notes to financial statements.
F-51
Table of Contents
PROSHARES ULTRA EURO
SCHEDULE OF INVESTMENTS
DECEMBER 31, 2009
| Principal Amount | Value | |||||
| Short-term U.S. government and agency obligations (103% of shareholders’ equity) |
||||||
| Federal Agricultural Mortgage Corp., Discount Notes: |
||||||
| 0.010% due 01/07/10 |
$ | 3,000,000 | $ | 2,999,995 | ||
| Federal Home Loan Bank, Discount Notes: |
||||||
| 0.001% due 01/27/10 |
2,610,000 | 2,609,998 | ||||
| U.S. Treasury Bills: |
||||||
| 0.040% due 02/25/10 |
130,000 | 129,992 | ||||
| 0.260% due 08/26/10† |
2,000,000 | 1,996,285 | ||||
| Total short-term U.S. government and agency obligations (cost $7,736,562) |
$ | 7,736,270 | ||||
Foreign Currency Forward Contracts^
| Settlement Date |
Local Currency |
Notional Amount at Value (USD) |
Unrealized Appreciation (Depreciation) |
||||||||||
| Contracts to Purchase |
|||||||||||||
| Euro with Goldman Sachs International |
01/08/10 | 4,573,425 | $ | 6,546,398 | $ | (117,213 | ) | ||||||
| Euro with UBS AG |
01/08/10 | 6,184,000 | 8,851,774 | (160,354 | ) | ||||||||
| $ | (277,567 | ) | |||||||||||
| Contracts to Sell |
|||||||||||||
| Euro with Goldman Sachs International |
01/08/10 | (71,600 | ) | $ | (102,488 | ) | $ | (74 | ) | ||||
| Euro with UBS AG |
01/08/10 | (144,700 | ) | (207,124 | ) | 383 | |||||||
| $ | 309 | ||||||||||||
| ^ | The positions and counterparties herein are as of December 31, 2009. The Funds continually evaluate different counterparties for their transactions and counterparties are subject to change. New counterparties can be added at anytime. |
| † | All or partial amount segregated as collateral for foreign currency forward contracts. |
See accompanying notes to financial statements.
F-52
Table of Contents
PROSHARES ULTRA EURO
SCHEDULE OF INVESTMENTS
DECEMBER 31, 2008
Foreign Currency Forward Contracts
| Settlement Date |
Local Currency |
Notional Amount at Value (USD) |
Unrealized Appreciation (Depreciation) |
||||||||||
| Contracts to Purchase |
|||||||||||||
| Euro with Goldman Sachs International |
01/09/09 | 6,513,500 | $ | 9,095,543 | $ | (141,252 | ) | ||||||
| Contracts to Sell |
|||||||||||||
| Euro with Goldman Sachs International |
01/09/09 | (227,000 | ) | $ | (316,986 | ) | $ | 707 | |||||
See accompanying notes to financial statements.
F-53
Table of Contents
PROSHARES ULTRA EURO
STATEMENTS OF OPERATIONS
FOR THE YEAR ENDED DECEMBER 31, 2009 AND THE PERIOD FROM
AUGUST 6, 2008 (INCEPTION) TO DECEMBER 31, 2008
| Year ended December 31, 2009 |
August 6, 2008 (Inception) through December 31, 2008 |
|||||||
| Investment Income |
||||||||
| Interest |
$ | 2,956 | $ | — | ||||
| Expenses |
||||||||
| Management fee |
7,827 | — | ||||||
| Organization costs |
— | 27,952 | ||||||
| Offering costs |
69,640 | 7,855 | ||||||
| Limitation by Sponsor |
(13,795 | ) | (32,913 | ) | ||||
| Total expenses |
63,672 | 2,894 | ||||||
| Net investment income (loss) |
(60,716 | ) | (2,894 | ) | ||||
| Realized and unrealized gain (loss) on investment activity |
||||||||
| Net realized gain (loss) on |
||||||||
| Foreign currency forward contracts |
699,029 | 571,180 | ||||||
| Change in net unrealized appreciation/depreciation on |
||||||||
| Foreign currency forward contracts |
(136,713 | ) | (140,545 | ) | ||||
| Short-term U.S. government and agency obligations |
(292 | ) | — | |||||
| Change in net unrealized appreciation/depreciation |
(137,005 | ) | (140,545 | ) | ||||
| Net realized and unrealized gain (loss) |
562,024 | 430,635 | ||||||
| Net income (loss) |
$ | 501,308 | $ | 427,741 | ||||
| Net income (loss) per weighted-average share |
$ | 2.18 | $ | 3.86 | ||||
| Weighted-average shares outstanding |
230,014 | 110,825 | ||||||
See accompanying notes to financial statements.
F-54
Table of Contents
PROSHARES ULTRA EURO
STATEMENTS OF CHANGES IN SHAREHOLDERS’ EQUITY
FOR THE YEAR ENDED DECEMBER 31, 2009 AND THE PERIOD FROM
AUGUST 6, 2008 (INCEPTION) TO DECEMBER 31, 2008
| Year ended December 31, 2009 |
August 6, 2008 (Inception) through December 31, 2008 |
|||||||
| Shareholders’ equity, beginning of period |
$ | 4,386,411 | $ | — | ||||
| Addition of shares (150,000 and 150,014, respectively) |
3,982,252 | 3,958,670 | ||||||
| Redemption of shares (50,000 and 0, respectively) |
(1,338,114 | ) | — | |||||
| Net addition (redemption) of shares |
2,644,138 | 3,958,670 | ||||||
| Net investment income (loss) |
(60,716 | ) | (2,894 | ) | ||||
| Net realized gain (loss) |
699,029 | 571,180 | ||||||
| Change in net unrealized appreciation/depreciation |
(137,005 | ) | (140,545 | ) | ||||
| Net income (loss) |
501,308 | 427,741 | ||||||
| Shareholders’ equity, end of period |
$ | 7,531,857 | $ | 4,386,411 | ||||
See accompanying notes to financial statements.
F-55
Table of Contents
PROSHARES ULTRA EURO
STATEMENTS OF CASH FLOWS
FOR THE YEAR ENDED DECEMBER 31, 2009 AND THE PERIOD FROM
AUGUST 6, 2008 (INCEPTION) TO DECEMBER 31, 2008
| Year ended December 31, 2009 |
August 6, 2008 (Inception) through December 31, 2008 |
|||||||
| Cash flow from operating activities |
||||||||
| Net income (loss) |
$ | 501,308 | $ | 427,741 | ||||
| Adjustments to reconcile net income (loss) to net cash provided by (used in) operating activities: |
||||||||
| Net purchase of short-term U.S. government and agency obligations |
(7,736,562 | ) | — | |||||
| Change in unrealized appreciation/depreciation on investments |
137,005 | 140,545 | ||||||
| Decrease (Increase) in receivable from Sponsor |
32,913 | (32,913 | ) | |||||
| Amortization of offering cost |
69,640 | (69,640 | ) | |||||
| Increase (Decrease) in management fee payable |
6,315 | — | ||||||
| (Decrease) Increase in accounts payable |
(42,977 | ) | 42,977 | |||||
| Net cash provided by (used in) operating activities |
(7,032,358 | ) | 508,710 | |||||
| Cash flow from financing activities |
||||||||
| Proceeds from addition of shares |
3,982,252 | 3,958,670 | ||||||
| Payment on shares redeemed |
(1,338,114 | ) | — | |||||
| Net cash provided by (used in) financing activities |
2,644,138 | 3,958,670 | ||||||
| Net increase (decrease) in cash |
(4,388,220 | ) | 4,467,380 | |||||
| Cash, beginning of period |
4,467,380 | — | ||||||
| Cash, end of period |
$ | 79,160 | $ | 4,467,380 | ||||
See accompanying notes to financial statements.
F-56
Table of Contents
STATEMENTS OF FINANCIAL CONDITION
| December 31, 2009 | December 31, 2008 | |||||||
| Assets |
||||||||
| Cash |
$ | 76,035 | $ | 7,121,112 | ||||
| Short-term U.S. government and agency obligations (Note 3) |
98,870,358 | — | ||||||
| Unrealized appreciation on foreign currency forward contracts |
1,954,967 | 151,153 | ||||||
| Receivable from Sponsor |
— | 32,234 | ||||||
| Offering costs (Note 5) |
— | 69,641 | ||||||
| Total assets |
100,901,360 | 7,374,140 | ||||||
| Liabilities and shareholders’ equity |
||||||||
| Liabilities |
||||||||
| Management fee payable |
53,574 | — | ||||||
| Accounts payable |
— | 42,977 | ||||||
| Total liabilities |
53,574 | 42,977 | ||||||
| Shareholders’ equity |
||||||||
| Paid-in capital |
110,049,449 | 7,676,890 | ||||||
| Accumulated earnings (deficit) |
(9,201,663 | ) | (345,727 | ) | ||||
| Total shareholders’ equity |
100,847,786 | 7,331,163 | ||||||
| Total liabilities and shareholders’ equity |
$ | 100,901,360 | $ | 7,374,140 | ||||
| Shares outstanding |
5,400,014 | 350,014 | ||||||
| Net asset value per share |
$ | 18.68 | $ | 20.95 | ||||
| Market value per share (Note 2) |
$ | 18.70 | $ | 21.26 | ||||
See accompanying notes to financial statements.
F-57
Table of Contents
PROSHARES ULTRASHORT EURO
SCHEDULE OF INVESTMENTS
DECEMBER 31, 2009
| Principal Amount | Value | |||||
| Short-term U.S. government and agency obligations |
||||||
| Federal Agricultural Mortgage Corp., Discount Notes: |
||||||
| 0.010% due 01/07/10 |
$ | 15,000,000 | $ | 14,999,975 | ||
| Federal Home Loan Bank, Discount Notes: |
||||||
| 0.001% due 01/27/10 |
13,695,000 | 13,694,990 | ||||
| U.S. Treasury Bills: |
||||||
| 0.010% due 02/04/10 |
30,000,000 | 29,999,717 | ||||
| 0.040% due 02/25/10 |
250,000 | 249,985 | ||||
| 0.260% due 08/26/10† |
40,000,000 | 39,925,691 | ||||
| Total short-term U.S. government and agency obligations (cost $98,876,200) |
$ | 98,870,358 | ||||
Foreign Currency Forward Contracts^
| Settlement Date |
Local Currency |
Notional Amount at Value (USD) |
Unrealized Appreciation (Depreciation) |
||||||||||
| Contracts to Purchase |
|||||||||||||
| Euro with Goldman Sachs International |
01/08/10 | 3,298,800 | $ | 4,721,901 | $ | (10,410 | ) | ||||||
| Contracts to Sell |
|||||||||||||
| Euro with Goldman Sachs International |
01/08/10 | (62,465,425 | ) | $ | (89,412,976 | ) | $ | 782,795 | |||||
| Euro with UBS AG |
01/08/10 | (81,656,800 | ) | (116,883,500 | ) | 1,182,582 | |||||||
| $ | 1,965,377 | ||||||||||||
| ^ | The positions and counterparties herein are as of December 31, 2009. The Funds continually evaluate different counterparties for their transactions and counterparties are subject to change. New counterparties can be added at anytime. |
| † | All or partial amount segregated as collateral for foreign currency forward contracts. |
See accompanying notes to financial statements.
F-58
Table of Contents
PROSHARES ULTRASHORT EURO
SCHEDULE OF INVESTMENTS
DECEMBER 31, 2008
Foreign Currency Forward Contracts
| Settlement Date |
Local Currency |
Notional Amount at Value (USD) |
Unrealized Appreciation (Depreciation) |
||||||||||
| Contracts to Purchase |
|||||||||||||
| Euro with Goldman Sachs International |
01/09/09 | 670,400 | $ | 936,156 | $ | (10,715 | ) | ||||||
| Contracts to Sell |
|||||||||||||
| Euro with Goldman Sachs International |
01/09/09 | (11,163,500 | ) | $ | (15,588,868 | ) | $ | 161,868 | |||||
See accompanying notes to financial statements.
F-59
Table of Contents
PROSHARES ULTRASHORT EURO
STATEMENTS OF OPERATIONS
FOR THE YEAR ENDED DECEMBER 31, 2009 AND THE PERIOD FROM
AUGUST 6, 2008 (INCEPTION) TO DECEMBER 31, 2008
| Year ended December 31, 2009 |
August 6, 2008 (Inception) through December 31, 2008 |
|||||||
| Investment Income |
||||||||
| Interest |
$ | 23,700 | $ | — | ||||
| Expenses |
||||||||
| Management fee |
303,788 | — | ||||||
| Organization costs |
— | 27,952 | ||||||
| Offering costs |
69,641 | 7,856 | ||||||
| Limitation by Sponsor |
— | (32,234 | ) | |||||
| Total expenses |
373,429 | 3,574 | ||||||
| Net investment income (loss) |
(349,729 | ) | (3,574 | ) | ||||
| Realized and unrealized gain (loss) on investment activity |
||||||||
| Net realized gain (loss) on |
||||||||
| Foreign currency forward contracts |
(10,304,179 | ) | (493,306 | ) | ||||
| Change in net unrealized appreciation/depreciation on |
||||||||
| Foreign currency forward contracts |
1,803,814 | 151,153 | ||||||
| Short-term U.S. government and agency obligations |
(5,842 | ) | — | |||||
| Change in net unrealized appreciation/depreciation |
1,797,972 | 151,153 | ||||||
| Net realized and unrealized gain (loss) |
(8,506,207 | ) | (342,153 | ) | ||||
| Net income (loss) |
$ | (8,855,936 | ) | $ | (345,727 | ) | ||
| Net income (loss) per weighted-average share |
$ | (4.45 | ) | $ | (2.06 | ) | ||
| Weighted-average shares outstanding |
1,989,603 | 167,582 | ||||||
See accompanying notes to financial statements.
F-60
Table of Contents
PROSHARES ULTRASHORT EURO
STATEMENTS OF CHANGES IN SHAREHOLDERS’ EQUITY
FOR THE YEAR ENDED DECEMBER 31, 2009 AND THE PERIOD FROM
AUGUST 6, 2008 (INCEPTION) TO DECEMBER 31, 2008
| Year ended December 31, 2009 |
August 6, 2008 (Inception) through December 31, 2008 |
|||||||
| Shareholders’ equity, beginning of period |
$ | 7,331,163 | $ | — | ||||
| Addition of shares (6,050,000 and 350,014, respectively) |
123,512,066 | 7,676,890 | ||||||
| Redemption of shares (1,000,000 and 0, respectively) |
(21,139,507 | ) | — | |||||
| Net addition (redemption) of shares (5,050,000 and 350,014, respectively) |
102,372,559 | 7,676,890 | ||||||
| Net investment income (loss) |
(349,729 | ) | (3,574 | ) | ||||
| Net realized gain (loss) |
(10,304,179 | ) | (493,306 | ) | ||||
| Change in net unrealized appreciation/depreciation |
1,797,972 | 151,153 | ||||||
| Net income (loss) |
(8,855,936 | ) | (345,727 | ) | ||||
| Shareholders’ equity, end of period |
$ | 100,847,786 | $ | 7,331,163 | ||||
See accompanying notes to financial statements.
F-61
Table of Contents
PROSHARES ULTRASHORT EURO
STATEMENTS OF CASH FLOWS
FOR THE YEAR ENDED DECEMBER 31, 2009 AND THE PERIOD FROM
AUGUST 6, 2008 (INCEPTION) TO DECEMBER 31, 2008
| Year ended December 31, 2009 |
August 6, 2008 (Inception) through December 31, 2008 |
|||||||
| Cash flow from operating activities |
||||||||
| Net income (loss) |
$ | (8,855,936 | ) | $ | (345,727 | ) | ||
| Adjustments to reconcile net income (loss) to net cash provided by (used in) operating activities: |
||||||||
| Net purchase of short-term U.S. government and agency obligations |
(98,876,200 | ) | — | |||||
| Change in unrealized appreciation/depreciation on investments |
(1,797,972 | ) | (151,153 | ) | ||||
| Decrease (Increase) in receivable from Sponsor |
32,234 | (32,234 | ) | |||||
| Amortization of offering cost |
69,641 | (69,641 | ) | |||||
| Increase (Decrease) in management fee payable |
53,574 | — | ||||||
| (Decrease) Increase in accounts payable |
(42,977 | ) | 42,977 | |||||
| Net cash provided by (used in) operating activities |
(109,417,636 | ) | (555,778 | ) | ||||
| Cash flow from financing activities |
||||||||
| Proceeds from addition of shares |
123,512,066 | 7,676,890 | ||||||
| Payment on shares redeemed |
(21,139,507 | ) | — | |||||
| Net cash provided by (used in) financing activities |
102,372,559 | 7,676,890 | ||||||
| Net increase (decrease) in cash |
(7,045,077 | ) | 7,121,112 | |||||
| Cash, beginning of period |
7,121,112 | — | ||||||
| Cash, end of period |
$ | 76,035 | $ | 7,121,112 | ||||
See accompanying notes to financial statements.
F-62
Table of Contents
STATEMENTS OF FINANCIAL CONDITION
| December 31, 2009 | December 31, 2008 | ||||||
| Assets |
|||||||
| Cash |
$ | 85,344 | $ | 2,986,826 | |||
| Short-term U.S. government and agency obligations (Note 3) |
4,155,133 | — | |||||
| Receivable from Sponsor |
— | 33,137 | |||||
| Offering costs (Note 5) |
— | 69,639 | |||||
| Total assets |
4,240,477 | 3,089,602 | |||||
| Liabilities and shareholders’ equity |
|||||||
| Liabilities |
|||||||
| Management fee payable |
3,397 | — | |||||
| Accounts payable |
— | 42,975 | |||||
| Unrealized depreciation on foreign currency forward contracts |
315,813 | 201,574 | |||||
| Total liabilities |
319,210 | 244,549 | |||||
| Shareholders’ equity |
|||||||
| Paid-in capital |
3,969,617 | 2,500,350 | |||||
| Accumulated earnings (deficit) |
(48,350 | ) | 344,703 | ||||
| Total shareholders’ equity |
3,921,267 | 2,845,053 | |||||
| Total liabilities and shareholders’ equity |
$ | 4,240,477 | $ | 3,089,602 | |||
| Shares outstanding |
150,014 | 100,014 | |||||
| Net asset value per share |
$ | 26.14 | $ | 28.45 | |||
| Market value per share (Note 2) |
$ | 26.58 | $ | 28.66 | |||
See accompanying notes to financial statements.
F-63
Table of Contents
PROSHARES ULTRA YEN
SCHEDULE OF INVESTMENTS
DECEMBER 31, 2009
| Principal Amount | Value | |||||
| Short-term U.S. government and agency obligations |
||||||
| Federal Home Loan Bank, Discount Notes: |
||||||
| 0.001% due 01/27/10 |
$ | 3,037,000 | $ | 3,036,998 | ||
| U.S. Treasury Bills: |
||||||
| 0.040% due 02/25/10 |
120,000 | 119,993 | ||||
| 0.260% due 08/26/10† |
1,000,000 | 998,142 | ||||
| Total short-term U.S. government and agency obligations (cost $4,155,279) |
$ | 4,155,133 | ||||
Foreign Currency Forward Contracts^
| Settlement Date |
Local Currency |
Notional Amount at Value (USD) |
Unrealized Appreciation (Depreciation) |
||||||||||
| Contracts to Purchase |
|||||||||||||
| Yen with Goldman Sachs International |
01/08/10 | 409,800,000 | $ | 4,400,924 | $ | (173,671 | ) | ||||||
| Yen with UBS AG |
01/08/10 | 349,710,000 | 3,755,606 | (147,277 | ) | ||||||||
| $ | (320,948 | ) | |||||||||||
| Contracts to Sell |
|||||||||||||
| Yen with Goldman Sachs International |
01/08/10 | (20,780,000 | ) | $ | (223,161 | ) | $ | 3,211 | |||||
| Yen with UBS AG |
01/08/10 | (8,190,000 | ) | (87,954 | ) | 1,924 | |||||||
| $ | 5,135 | ||||||||||||
| ^ | The positions and counterparties herein are as of December 31, 2009. The Funds continually evaluate different counterparties for their transactions and counterparties are subject to change. New counterparties can be added at anytime. |
| † | All or partial amount segregated as collateral for foreign currency forward contracts. |
See accompanying notes to financial statements.
F-64
Table of Contents
PROSHARES ULTRA YEN
SCHEDULE OF INVESTMENTS
DECEMBER 31, 2008
Foreign Currency Forward Contracts
| Settlement Date |
Local Currency |
Notional Amount at Value (USD) |
Unrealized Appreciation (Depreciation) |
||||||||||
| Contracts to Purchase |
|||||||||||||
| Yen with Goldman Sachs International |
01/09/09 | 542,135,000 | $ | 5,974,006 | $ | (203,885 | ) | ||||||
| Contracts to Sell |
|||||||||||||
| Yen with Goldman Sachs International |
01/09/09 | (25,660,000 | ) | $ | (282,758 | ) | $ | 2,311 | |||||
See accompanying notes to financial statements.
F-65
Table of Contents
PROSHARES ULTRA YEN
STATEMENTS OF OPERATIONS
FOR THE YEAR ENDED DECEMBER 31, 2009 AND THE PERIOD FROM
AUGUST 6, 2008 (INCEPTION) TO DECEMBER 31, 2008
| Year ended December 31, 2009 |
August 6, 2008 (Inception) through December 31, 2008 |
|||||||
| Investment Income |
||||||||
| Interest |
$ | 1,709 | $ | — | ||||
| Expenses |
||||||||
| Management fee |
4,210 | — | ||||||
| Organization costs |
— | 27,952 | ||||||
| Offering costs |
69,639 | 7,856 | ||||||
| Limitation by Sponsor |
(35,417 | ) | (33,137 | ) | ||||
| Total expenses |
38,432 | 2,671 | ||||||
| Net investment income (loss) |
(36,723 | ) | (2,671 | ) | ||||
| Realized and unrealized gain (loss) on investment activity |
||||||||
| Net realized gain (loss) on |
||||||||
| Foreign currency forward contracts |
(241,945 | ) | 548,948 | |||||
| Change in net unrealized appreciation/depreciation on |
||||||||
| Foreign currency forward contracts |
(114,239 | ) | (201,574 | ) | ||||
| Short-term U.S. government and agency obligations |
(146 | ) | — | |||||
| Change in net unrealized appreciation/depreciation |
(114,385 | ) | (201,574 | ) | ||||
| Net realized and unrealized gain (loss) |
(356,330 | ) | 347,374 | |||||
| Net income (loss) |
$ | (393,053 | ) | $ | 344,703 | |||
| Net income (loss) per weighted-average share |
$ | (2.55 | ) | $ | 3.45 | |||
| Weighted-average shares outstanding |
154,124 | 100,014 | ||||||
See accompanying notes to financial statements.
F-66
Table of Contents
PROSHARES ULTRA YEN
STATEMENTS OF CHANGES IN SHAREHOLDERS’ EQUITY
FOR THE YEAR ENDED DECEMBER 31, 2009 AND THE PERIOD FROM
AUGUST 6, 2008 (INCEPTION) TO DECEMBER 31, 2008
| Year ended December 31, 2009 |
August 6, 2008 (Inception) through December 31, 2008 |
|||||||
| Shareholders’ equity, beginning of period |
$ | 2,845,053 | $ | — | ||||
| Addition of shares (100,000 and 100,014, respectively) |
2,725,367 | 2,500,350 | ||||||
| Redemption of shares (50,000 and 0, respectively) |
(1,256,100 | ) | — | |||||
| Net addition (redemption) of shares (50,000 and 100,014, respectively) |
1,469,267 | 2,500,350 | ||||||
| Net investment income (loss) |
(36,723 | ) | (2,671 | ) | ||||
| Net realized gain (loss) |
(241,945 | ) | 548,948 | |||||
| Change in net unrealized appreciation/depreciation |
(114,385 | ) | (201,574 | ) | ||||
| Net income (loss) |
(393,053 | ) | 344,703 | |||||
| Shareholders’ equity, end of period |
$ | 3,921,267 | $ | 2,845,053 | ||||
See accompanying notes to financial statements.
F-67
Table of Contents
PROSHARES ULTRA YEN
STATEMENTS OF CASH FLOWS
FOR THE YEAR ENDED DECEMBER 31, 2009 AND THE PERIOD FROM
AUGUST 6, 2008 (INCEPTION) TO DECEMBER 31, 2008
| Year ended December 31, 2009 |
August 6, 2008 (Inception) through December 31, 2008 |
|||||||
| Cash flow from operating activities |
||||||||
| Net income (loss) |
$ | (393,053 | ) | $ | 344,703 | |||
| Adjustments to reconcile net income (loss) to net cash provided by (used in) operating activities: |
||||||||
| Net purchase of short-term U.S. government and agency obligations |
(4,155,279 | ) | — | |||||
| Change in unrealized appreciation/depreciation on investments |
114,385 | 201,574 | ||||||
| Decrease (Increase) in receivable from Sponsor |
33,137 | (33,137 | ) | |||||
| Amortization of offering cost |
69,639 | (69,639 | ) | |||||
| Increase (Decrease) in management fee payable |
3,397 | — | ||||||
| (Decrease) Increase in accounts payable |
(42,975 | ) | 42,975 | |||||
| Net cash provided by (used in) operating activities |
(4,370,749 | ) | 486,476 | |||||
| Cash flow from financing activities |
||||||||
| Proceeds from addition of shares |
2,725,367 | 2,500,350 | ||||||
| Payment on shares redeemed |
(1,256,100 | ) | — | |||||
| Net cash provided by (used in) financing activities |
1,469,267 | 2,500,350 | ||||||
| Net increase (decrease) in cash |
(2,901,482 | ) | 2,986,826 | |||||
| Cash, beginning of period |
2,986,826 | — | ||||||
| Cash, end of period |
$ | 85,344 | $ | 2,986,826 | ||||
See accompanying notes to financial statements.
F-68
Table of Contents
STATEMENTS OF FINANCIAL CONDITION
| December 31, 2009 | December 31, 2008 | |||||||
| Assets |
||||||||
| Cash |
$ | 75,424 | $ | 1,970,377 | ||||
| Short-term U.S. government and agency obligations (Note 3) |
62,595,795 | — | ||||||
| Unrealized appreciation on foreign currency forward contracts |
4,865,068 | 135,917 | ||||||
| Receivable from Sponsor |
— | 33,660 | ||||||
| Offering costs (Note 5) |
— | 69,641 | ||||||
| Total assets |
67,536,287 | 2,209,595 | ||||||
| Liabilities and shareholders’ equity |
||||||||
| Liabilities |
||||||||
| Management fee payable |
48,370 | — | ||||||
| Accounts payable |
— | 42,978 | ||||||
| Total liabilities |
48,370 | 42,978 | ||||||
| Shareholders’ equity |
||||||||
| Paid-in capital |
69,482,929 | 2,500,350 | ||||||
| Accumulated earnings (deficit) |
(1,995,012 | ) | (333,733 | ) | ||||
| Total shareholders’ equity |
67,487,917 | 2,166,617 | ||||||
| Total liabilities and shareholders’ equity |
$ | 67,536,287 | $ | 2,209,595 | ||||
| Shares outstanding |
3,150,014 | 100,014 | ||||||
| Net asset value per share |
$ | 21.42 | $ | 21.66 | ||||
| Market value per share (Note 2) |
$ | 21.30 | $ | 21.85 | ||||
See accompanying notes to financial statements.
F-69
Table of Contents
PROSHARES ULTRASHORT YEN
SCHEDULE OF INVESTMENTS
DECEMBER 31, 2009
| Principal Amount | Value | |||||
| Short-term U.S. government and agency obligations |
||||||
| Federal Agricultural Mortgage Corp., Discount Notes: |
||||||
| 0.010% due 01/07/10 |
$ | 18,000,000 | $ | 17,999,970 | ||
| Federal Home Loan Bank, Discount Notes: |
||||||
| 0.001% due 01/27/10 |
7,944,000 | 7,943,994 | ||||
| U.S. Treasury Bills: |
||||||
| 0.010% due 02/04/10 |
18,000,000 | 17,999,830 | ||||
| 0.024% due 02/25/10 |
3,680,000 | 3,679,867 | ||||
| 0.260% due 08/26/10† |
15,000,000 | 14,972,134 | ||||
| Total short-term U.S. government and agency obligations |
$ | 62,595,795 | ||||
Foreign Currency Forward Contracts^
| Settlement Date |
Local Currency |
Notional Amount at Value (USD) |
Unrealized Appreciation (Depreciation) |
||||||||||
| Contracts to Purchase |
|||||||||||||
| Yen with Goldman Sachs International |
01/08/10 | 87,770,000 | $ | 942,580 | $ | (15,760 | ) | ||||||
| Contracts to Sell |
|||||||||||||
| Yen with Goldman Sachs International |
01/08/10 | (6,109,260,000 | ) | $ | (65,608,565 | ) | $ | 2,308,309 | |||||
| Yen with UBS AG |
01/08/10 | (6,534,450,000 | ) | (70,174,765 | ) | 2,572,519 | |||||||
| $ | 4,880,828 | ||||||||||||
| ^ | The positions and counterparties herein are as of December 31, 2009. The Funds continually evaluate different counterparties for their transactions and counterparties are subject to change. New counterparties can be added at anytime. |
| † | All or partial amount segregated as collateral for foreign currency forward contracts. |
See accompanying notes to financial statements.
F-70
Table of Contents
PROSHARES ULTRASHORT YEN
SCHEDULE OF INVESTMENTS
DECEMBER 31, 2008
Foreign Currency Forward Contracts
| Settlement Date |
Local Currency |
Notional Amount at Value (USD) |
Unrealized Appreciation (Depreciation) |
||||||||||
| Contracts to Purchase |
|||||||||||||
| Yen with Goldman Sachs International |
01/09/09 | 30,925,000 | $ | 340,775 | $ | (8,646 | ) | ||||||
| Contracts to Sell |
|||||||||||||
| Yen with Goldman Sachs International |
01/09/09 | (423,900,000 | ) | $ | (4,671,126 | ) | $ | 144,563 | |||||
See accompanying notes to financial statements.
F-71
Table of Contents
PROSHARES ULTRASHORT YEN
STATEMENTS OF OPERATIONS
FOR THE YEAR ENDED DECEMBER 31, 2009 AND THE PERIOD FROM
AUGUST 6, 2008 (INCEPTION) TO DECEMBER 31, 2008
| Year ended December 31, 2009 |
August 6, 2008 (Inception) through December 31, 2008 |
|||||||
| Investment Income |
||||||||
| Interest |
$ | 25,604 | $ | — | ||||
| Expenses |
||||||||
| Management fee |
304,905 | — | ||||||
| Organization costs |
— | 27,952 | ||||||
| Offering costs |
69,641 | 7,856 | ||||||
| Limitation by Sponsor |
— | (33,660 | ) | |||||
| Total expenses |
374,546 | 2,148 | ||||||
| Net investment income (loss) |
(348,942 | ) | (2,148 | ) | ||||
| Realized and unrealized gain (loss) on investment activity |
||||||||
| Net realized gain (loss) on |
||||||||
| Foreign currency forward contracts |
(6,039,297 | ) | (467,502 | ) | ||||
| Change in net unrealized appreciation/depreciation on |
||||||||
| Foreign currency forward contracts |
4,729,151 | 135,917 | ||||||
| Short-term U.S. government and agency obligations |
(2,191 | ) | — | |||||
| Change in net unrealized appreciation/depreciation |
4,726,960 | 135,917 | ||||||
| Net realized and unrealized gain (loss) |
(1,312,337 | ) | (331,585 | ) | ||||
| Net income (loss) |
$ | (1,661,279 | ) | $ | (333,733 | ) | ||
| Net income (loss) per weighted-average share |
$ | (0.95 | ) | $ | (3.34 | ) | ||
| Weighted-average shares outstanding |
1,751,521 | 100,014 | ||||||
See accompanying notes to financial statements.
F-72
Table of Contents
PROSHARES ULTRASHORT YEN
STATEMENTS OF CHANGES IN SHAREHOLDERS’ EQUITY
FOR THE YEAR ENDED DECEMBER 31, 2009 AND THE PERIOD FROM
AUGUST 6, 2008 (INCEPTION) TO DECEMBER 31, 2008
| Year ended December 31, 2009 |
August 6, 2008 (Inception) through December 31, 2008 |
|||||||
| Shareholders’ equity, beginning of period |
$ | 2,166,617 | $ | — | ||||
| Addition of shares (4,950,000 and 100,014, respectively) |
110,783,920 | 2,500,350 | ||||||
| Redemption of shares (1,900,000 and 0, respectively) |
(43,801,341 | ) | — | |||||
| Net addition (redemption) of shares |
66,982,579 | 2,500,350 | ||||||
| Net investment income (loss) |
(348,942 | ) | (2,148 | ) | ||||
| Net realized gain (loss) |
(6,039,297 | ) | (467,502 | ) | ||||
| Change in net unrealized appreciation/depreciation |
4,726,960 | 135,917 | ||||||
| Net income (loss) |
(1,661,279 | ) | (333,733 | ) | ||||
| Shareholders’ equity, end of period |
$ | 67,487,917 | $ | 2,166,617 | ||||
See accompanying notes to financial statements.
F-73
Table of Contents
PROSHARES ULTRASHORT YEN
STATEMENTS OF CASH FLOWS
FOR THE YEAR ENDED DECEMBER 31, 2009 AND THE PERIOD FROM
AUGUST 6, 2008 (INCEPTION) TO DECEMBER 31, 2008
| Year ended December 31, 2009 |
August 6, 2008 (Inception) through December 31, 2008 |
|||||||
| Cash flow from operating activities |
||||||||
| Net income (loss) |
$ | (1,661,279 | ) | $ | (333,733 | ) | ||
| Adjustments to reconcile net income (loss) to net cash provided by (used in) operating activities: |
||||||||
| Net purchase of short-term U.S. government and agency obligations |
(62,597,986 | ) | — | |||||
| Change in unrealized appreciation/depreciation on investments |
(4,726,960 | ) | (135,917 | ) | ||||
| Decrease (Increase) in receivable from Sponsor |
33,660 | (33,660 | ) | |||||
| Amortization of offering cost |
69,641 | (69,641 | ) | |||||
| Increase (Decrease) in management fee payable |
48,370 | — | ||||||
| (Decrease) Increase in accounts payable |
(42,978 | ) | 42,978 | |||||
| Net cash provided by (used in) operating activities |
(68,877,532 | ) | (529,973 | ) | ||||
| Cash flow from financing activities |
||||||||
| Proceeds from addition of shares |
110,783,920 | 2,500,350 | ||||||
| Payment on shares redeemed |
(43,801,341 | ) | — | |||||
| Net cash provided by (used in) financing activities |
66,982,579 | 2,500,350 | ||||||
| Net increase (decrease) in cash |
(1,894,953 | ) | 1,970,377 | |||||
| Cash, beginning of period |
1,970,377 | — | ||||||
| Cash, end of period |
$ | 75,424 | $ | 1,970,377 | ||||
See accompanying notes to financial statements.
F-74
Table of Contents
NOTES TO FINANCIAL STATEMENTS
DECEMBER 31, 2009
NOTE 1 – ORGANIZATION
ProShares Trust II (the “Trust”) was organized as a Delaware statutory trust on October 9, 2007 and offers common units of beneficial interest (the “Shares”) in each of its twelve series (each, a “Fund”, and collectively, the “Funds”). The twelve separate series are: ProShares Ultra DJ-UBS Commodity (formerly ProShares Ultra DJ-AIG Commodity), ProShares UltraShort DJ-UBS Commodity (formerly ProShares UltraShort DJ-AIG Commodity), ProShares Ultra DJ-UBS Crude Oil (formerly ProShares Ultra DJ-AIG Crude Oil), ProShares UltraShort DJ-UBS Crude Oil (formerly ProShares UltraShort DJ-AIG Crude Oil), ProShares Ultra Gold, ProShares UltraShort Gold, ProShares Ultra Silver, ProShares UltraShort Silver, ProShares Ultra Euro, ProShares UltraShort Euro, ProShares Ultra Yen and ProShares UltraShort Yen.
Each “Ultra” Fund seeks daily investment results (before fees and expenses) that correspond to twice (200%) the daily performance of its corresponding benchmark. Each “UltraShort” Fund seeks daily investment results (before fees and expenses) that correspond to twice (200%) the inverse (opposite) of the daily performance of its corresponding benchmark. Each Fund generally invests in Financial Instruments (i.e., commodity-based or currency-based instruments whose value is derived from the value of an underlying asset, rate or index) as a substitute for investing directly in a commodity or currency in order to gain exposure to the commodity index, commodity or currency. Financial Instruments also are used to produce economically “leveraged” or “inverse” investment results and may include futures contracts and options on futures contracts, swap agreements, forward contracts and other commodity-based or currency-based options contracts.
The Funds do not seek to achieve their stated investment objective over a period of time greater than one day because mathematical compounding prevents the Funds from achieving such results. Accordingly, results over periods of time greater than one day should not be expected to be a simple multiple (+200 or –200%) of the period return of the corresponding benchmark and will likely differ significantly. Investors should monitor their ProShares holdings consistent with their strategies, as frequently as daily.
The Trust had no operations prior to November 24, 2008 other than matters relating to its organization, the registration of each series under the Securities Act of 1933, as amended, and the sale and issuance to ProShare Capital Management LLC (the “Sponsor”) of fourteen Shares of each Fund at an aggregate purchase price of $350 in each of the Funds.
Eight of the Funds, ProShares Ultra DJ-UBS Commodity, ProShares UltraShort DJ-UBS Commodity, ProShares Ultra DJ-UBS Crude Oil, ProShares UltraShort DJ-UBS Crude Oil, ProShares Ultra Euro, ProShares UltraShort Euro, ProShares Ultra Yen and ProShares UltraShort Yen, commenced investment operations on November 24, 2008, and four of the Funds, ProShares Ultra Gold, ProShares UltraShort Gold, ProShares Ultra Silver and ProShares UltraShort Silver, commenced investment operations on December 1, 2008.
On May 6, 2009, UBS Securities LLC acquired the commodity business of AIG Financial Products Corp. Effective May 7, 2009, the Dow Jones-AIG Commodity Indexes were re-branded as the Dow Jones-UBS Commodity Indexes. The Dow Jones-UBS Commodity Indexes have an identical methodology to the Dow Jones-AIG Commodity Indexes and take the identical form and format of the Dow Jones-AIG Commodity Indexes. In connection therewith:
The following Indexes were renamed:
| Former Index Name | New Index Name | |
| Dow Jones-AIG Commodity Index | Dow Jones-UBS Commodity Index | |
| Dow Jones-AIG Crude Oil Sub-Index | Dow Jones-UBS Crude Oil Sub-Index |
F-75
Table of Contents
The following Funds were renamed:
| Former Fund Name | New Fund Name | |
| ProShares Ultra DJ-AIG Commodity | ProShares Ultra DJ-UBS Commodity | |
| ProShares UltraShort DJ-AIG Commodity | ProShares UltraShort DJ-UBS Commodity | |
| ProShares Ultra DJ-AIG Crude Oil | ProShares Ultra DJ-UBS Crude Oil | |
| ProShares UltraShort DJ-AIG Crude Oil | ProShares UltraShort DJ-UBS Crude Oil |
NOTE 2 – SIGNIFICANT ACCOUNTING POLICIES
The following is a summary of significant accounting policies followed by each Fund in preparation of its financial statements. These policies are in conformity with accounting principles generally accepted in the United States of America (“GAAP”).
Use of Estimates & Indemnifications
The preparation of financial statements in conformity with GAAP requires management to make estimates and assumptions that affect the reported amounts and disclosures in these financial statements. Actual results could differ from those estimates.
In the normal course of business the Trust enters into contracts that contain a variety of representations which provide general indemnifications. The Trust’s maximum exposure under these arrangements cannot be known; however, the Trust expects any risk of loss to be remote.
Statement of Cash Flows
The cash amount shown in the Statement of Cash Flows is the amount reported as cash in the Statement of Financial Condition dated December 31, 2009, and represents non-segregated cash with the custodian and does not include short-term investments.
Final Net Asset Value for Fiscal Period
The times of the calculation of the Funds’ final net asset value for creation and redemption of fund shares for the year ended December 31, 2009 were as follows. All times are Eastern Time:
| NAV Calculation Time | NAV Calculation Date | |||
| UltraSilver, UltraShort Silver |
7:00 A.M. | December 31 | ||
| Ultra Gold, UltraShort Gold |
10:00 A.M. | December 30 | ||
| Ultra DJ-UBS Commodity, UltraShort DJ-UBS Commodity |
2:30 P.M. | December 31 | ||
| Ultra DJ-UBS Crude Oil, UltraShort DJ-UBS Crude Oil |
2:30 P.M. | December 31 | ||
| Ultra Euro, UltraShort Euro |
4:00 P.M. | December 31 | ||
| Ultra Yen, UltraShort Yen |
4:00 P.M. | December 31 |
Although the Funds’ shares may continue to trade on secondary markets subsequent to the calculation of the final NAV, these times represent the final opportunity to transact in creation or redemption units for the three months and the year ended December 31, 2009.
Market value per share is determined at the close of the New York Stock Exchange and may be later than when the Funds’ NAV per share is calculated.
For financial reporting purposes, the Fund values transactions based upon the final closing price in their primary markets. Accordingly, the investment valuations in these financial statements differs from those used in the calculation of some Funds’ final creation/redemption NAV for the three months and the year ended December 31, 2009.
Investment Valuation
Short-term investments are valued at amortized cost to the extent that it approximates value. Treasury securities having a maturity of greater than sixty days are valued at market price.
F-76
Table of Contents
Derivatives (e.g., futures, swaps and forward agreements) are generally valued using independent sources and/or agreements with counterparties or other procedures as determined by the Sponsor. Futures contracts, except for the Gold and Silver Funds, are generally valued at the last settled price on the applicable exchange on which that future trades. Futures in the Gold and Silver Funds are valued at the last sales price prior to the time at which the NAV per Share of a Fund is determined. If there was no sale on that day, and for non-exchange-traded derivatives, the Sponsor may in its sole discretion choose to determine a fair value price as the basis for determining the market value of such position for such day. Such fair value price would be generally determined based on available inputs about the current value of the underlying financial instrument or commodity and would be based on principles that the Sponsor deems fair and equitable so long as such principles are consistent with normal industry standards.
Fair value pricing may require subjective determinations about the value of an investment. While the Trust’s policy is intended to result in a calculation of a Fund’s NAV that fairly reflects investment values as of the time of pricing, the Trust cannot ensure that fair values determined by the Sponsor or persons acting at their direction would accurately reflect the price that a Fund could obtain for an investment if it were to dispose of that investment as of the time of pricing (for instance, in a forced or distressed sale). The prices used by a Fund may differ from the value that would be realized if the investments were sold and the differences could be material to the financial statements.
Fair Value of Financial Instruments
The Funds disclose the fair value of their investments in a hierarchy that prioritizes the inputs to valuation techniques used to measure fair value. The disclosure requirements establish a fair value hierarchy that distinguishes between: (1) market participant assumptions developed based on market data obtained from sources independent of the Funds (observable inputs); and (2) the Funds’ own assumptions about market participant assumptions developed based on the best information available under the circumstances (unobservable inputs). The three levels defined by the disclosure requirements hierarchy are as follows:
Level I – Quoted prices (unadjusted) in active markets for identical assets or liabilities that the reporting entity has the ability to access at the measurement date.
Level II – Inputs other than quoted prices included within Level I that are observable for the asset or liability, either directly or indirectly. Level II assets include the following: quoted prices for similar assets or liabilities in active markets, quoted prices for identical or similar assets or liabilities in markets that are not active, inputs other than quoted prices that are observable for the asset or liability, and inputs that are derived principally from or corroborated by observable market data by correlation or other means (market-corroborated inputs).
Level III – Unobservable pricing input at the measurement date for the asset or liability. Unobservable inputs shall be used to measure fair value to the extent that observable inputs are not available.
In some instances, the inputs used to measure fair value might fall in different levels of the fair value hierarchy. The level in the fair value hierarchy within which the fair value measurement in its entirety falls shall be determined based on the lowest input level that is significant to the fair value measurement in its entirety.
Fair value measurements also require additional disclosure when the volume and level of activity for the asset or liability have significantly decreased, as well as when circumstances indicate that a transaction is not orderly.
F-77
Table of Contents
The following table summarizes the valuation of investments at December 31, 2009 using the fair value hierarchy:
| LEVEL I – Quoted Prices |
LEVEL II – Other Significant Observable Inputs |
||||||||||||||||||||
| Short-Term U.S. Government and Agencies |
Futures Contracts |
Short-Term U.S. Government and Agencies |
Forward Agreements |
Swap Agreements |
Total | ||||||||||||||||
| Ultra DJ-UBS Commodity |
$ | 7,985,138 | $ | — | $ | 10,517,914 | $ | — | $ | 1,177,968 | $ | 19,681,020 | |||||||||
| UltraShort DJ-UBS Commodity |
998,142 | — | 1,569,999 | — | (216,605 | ) | 2,351,536 | ||||||||||||||
| Ultra DJ-UBS Crude Oil |
124,767,785 | 16,877,800 | 198,258,282 | — | 21,129,076 | 361,032,943 | |||||||||||||||
| UltraShort DJ-UBS Crude Oil |
24,953,557 | (3,063,900 | ) | 41,541,751 | — | (982,489 | ) | 62,448,919 | |||||||||||||
| Ultra Gold |
19,962,846 | (194,200 | ) | 148,122,824 | (5,234,260 | ) | — | 162,657,210 | |||||||||||||
| UltraShort Gold |
14,972,134 | 39,140 | 51,338,630 | 2,144,062 | — | 68,493,966 | |||||||||||||||
| Ultra Silver |
49,907,114 | (568,800 | ) | 107,864,959 | (7,228,187 | ) | — | 149,975,086 | |||||||||||||
| UltraShort Silver |
19,962,846 | 184,735 | 44,809,395 | 2,859,064 | — | 67,816,040 | |||||||||||||||
| Ultra Euro |
1,996,285 | — | 5,739,985 | (277,258 | ) | — | 7,459,012 | ||||||||||||||
| UltraShort Euro |
39,925,691 | — | 58,944,667 | 1,954,967 | — | 100,825,325 | |||||||||||||||
| Ultra Yen |
998,142 | — | 3,156,991 | (315,813 | ) | — | 3,839,320 | ||||||||||||||
| UltraShort Yen |
14,972,134 | — | 47,623,661 | 4,865,068 | — | 67,460,863 | |||||||||||||||
At December 31, 2009, there were no Level III portfolio investments for which significant unobservable inputs were used to determine fair value.
The following table summarizes the valuation of investments at December 31, 2008 using the fair value hierarchy:
| LEVEL I – Quoted Prices |
LEVEL II – Other Significant Observable Inputs |
|||||||||||||||
| Futures Contracts |
Forward Agreements |
Swap Agreements |
Total | |||||||||||||
| Ultra DJ-UBS Commodity |
$ | — | $ | — | $ | 184,583 | $ | 184,583 | ||||||||
| UltraShort DJ-UBS Commodity |
— | — | (426,201 | ) | (426,201 | ) | ||||||||||
| Ultra DJ-UBS Crude Oil |
12,678,400 | — | — | 12,678,400 | ||||||||||||
| UltraShort DJ-UBS Crude Oil |
(3,550,590 | ) | — | — | (3,550,590 | ) | ||||||||||
| Ultra Gold |
39,770 | (586,254 | ) | — | (546,484 | ) | ||||||||||
| UltraShort Gold |
(22,690 | ) | 86,657 | — | 63,967 | |||||||||||
| Ultra Silver |
(8,045 | ) | (256,827 | ) | — | (264,872 | ) | |||||||||
| UltraShort Silver |
(650 | ) | 47,484 | — | 46,834 | |||||||||||
| Ultra Euro |
— | (140,545 | ) | — | (140,545 | ) | ||||||||||
| UltraShort Euro |
— | 151,153 | — | 151,153 | ||||||||||||
| Ultra Yen |
— | (201,574 | ) | — | (201,574 | ) | ||||||||||
| UltraShort Yen |
— | 135,917 | — | 135,917 | ||||||||||||
At December 31, 2008, there were no Level III portfolio investments for which significant unobservable inputs were used to determine fair value.
The inputs or methodology used for valuing investments are not necessarily an indication of the risk associated with investing in those securities.
Investment Transactions and Related Income
Investment transactions are recorded on the trade date. All such transactions are recorded on the identified cost basis and marked to market daily. Unrealized appreciation/depreciation on open contracts are reflected in the
F-78
Table of Contents
Statements of Financial Condition and changes in the unrealized appreciation/depreciation between periods are reflected in the Statements of Operations. Discounts on short-term securities purchased are amortized and reflected as Interest Income in the Statements of Operations.
Brokerage Commissions and Fees
Each Fund pays its respective brokerage commissions, including applicable exchange fees, National Futures Association (“NFA”) fees, give-up fees, pit brokerage fees and other transaction related fees and expenses charged in connection with trading activities for each Fund’s investment in U.S. Commodity Futures Trading Commission regulated investments. Brokerage commissions on futures contracts are recognized on a half-turn basis.
Federal Income Tax
Each Fund is registered as a series of a Delaware statutory trust and is treated as a partnership for U.S. federal income tax purposes. Accordingly, no Fund expects to incur U.S. federal income tax liability; rather, each beneficial owner of a Fund’s Shares is required to take into account its allocable share of its Fund’s income, gain, loss, deductions and other items for its Fund’s taxable year ending with or within the beneficial owner’s taxable year.
Management of the Funds has reviewed all open tax years and major jurisdictions and concluded that there is no tax liability resulting from unrecognized tax benefits relating to uncertain income tax positions taken or expected to be taken in future tax returns. The Funds are also not aware of any tax positions for which it is reasonably possible that the total amounts of unrecognized tax benefits will significantly change in the next twelve months. On an ongoing basis, management will monitor its tax positions taken under the interpretation to determine if adjustments to conclusions are necessary based on factors including, but not limited to, further implementation of guidance expected from the Financial Accounting Standards Board and on-going analysis of tax law, regulation, and interpretations thereof.
NOTE 3 – INVESTMENTS
Short-Term Investments
The Funds may purchase U.S. Treasury Bills, agency securities, and other high-credit quality short-term fixed income or similar securities with original maturities of one year or less. A portion of these investments may be posted as collateral in connection with swap agreements and/or used as margin for a Fund’s trading in futures and forward contracts.
Accounting for Derivative Instruments
In seeking to achieve each Fund’s investment objective, the Sponsor uses a mathematical approach to investing. Using this approach, the Sponsor determines the type, quantity and mix of investment positions that the Sponsor believes in combination should produce daily returns consistent with a Fund’s objective.
All open derivative positions at period-end for each Fund are disclosed in the Schedule of Investments and the notional value of these open positions relative to the shareholders’ equity of each Fund is generally representative of the notional value of open positions to shareholders’ equity throughout the reporting period for each respective Fund. The volume associated with derivative positions varies on a daily basis as each Fund transacts derivative contracts in order to achieve the appropriate exposure, as expressed in notional value, in comparison to shareholders’ equity consistent with each Fund’s investment objective.
Following is a description of the derivative instruments used by the Funds during the reporting period, including the primary underlying risk exposures related to each instrument type.
F-79
Table of Contents
Futures Contracts
The Funds may enter into futures contracts to gain exposure to changes in the value of an underlying commodity. A futures contract obligates the seller to deliver (and the purchaser to accept) the future delivery of a specified quantity and type of a commodity at a specified time and place. The contractual obligations of a buyer or seller may generally be satisfied by taking or making physical delivery of the underlying commodity or by making an offsetting sale or purchase of an identical futures contract on the same or linked exchange before the designated date of delivery.
Upon entering into a futures contract, each Fund is required to deposit and maintain as collateral at least such initial margin as required by the exchange on which the transaction is effected. The initial margin is segregated as cash balances with brokers for futures contracts, as disclosed in the Statements of Financial Condition, and is restricted as to its use. Pursuant to the futures contract, each Fund agrees to receive from or pay to the broker an amount of cash equal to the daily fluctuation in value of the futures contract. Such receipts or payments are known as variation margin and are recorded by each Fund as unrealized gains or losses. Each Fund will realize a gain or loss upon closing of a futures transaction.
Futures contracts involve, to varying degrees, elements of market risk (specifically commodity price risk) and exposure to loss in excess of the amount of variation margin. The face or contract amounts reflect the extent of the total exposure each Fund has in the particular classes of instruments. Additional risks associated with the use of futures contracts are imperfect correlation between movements in the price of the futures contracts and the market value of the underlying securities or commodity and the possibility of an illiquid market for a futures contract. With futures contracts, there is minimal counterparty risk to the Funds since futures contracts are exchange-traded and the exchange’s clearinghouse, as counterparty to all exchange-traded futures contracts, guarantees the futures contracts against default.
Swap Agreements
The Funds may enter into swap agreements for purposes of pursuing their investment objectives or as a substitute for investing directly in (or shorting) commodities, or to create an economic hedge against a position. Swap agreements are two-party contracts entered into primarily with institutional investors for a specified period, ranging from a day to more than one year. In a standard swap transaction, two parties agree to exchange the returns earned or realized on a particular predetermined investment, instrument or index in exchange for a fixed or floating rate of return in respect of a predetermined notional amount. In the case of futures contracts based indices, such as those used by the Commodity Index Funds, the reference interest rate is zero. The gross returns to be exchanged are calculated with respect to a notional amount and the benchmark returns to which the swap is linked. Swap agreements do not involve the delivery of securities or other underlying instruments.
Generally, swap agreements entered into by the Funds calculate and settle the obligations of the parties to the agreement on a “net basis” with a single payment. Consequently, each Fund’s current obligations (or rights) under a swap agreement will generally be equal only to the net amount to be paid or received under the agreement based on the relative values of such obligations (or rights) (the “net amount”). In a typical swap agreement entered into by an Ultra Fund, the Ultra Fund would be entitled to settlement payments in the event the benchmark increases and would be required to make payments to the swap counterparties in the event the benchmark decreases, adjusted for any transaction costs or trading spreads on the notional amount the Funds may pay. In a typical swap agreement entered into by an UltraShort Fund, the UltraShort Fund would be required to make payments to the swap counterparties in the event the benchmark increases and would be entitled to settlement payments in the event the benchmark decreases, adjusted for any transaction costs or trading spreads on the notional amount the Funds may pay.
The net amount of the excess, if any, of each Fund’s obligations over its entitlements with respect to each swap agreement is accrued on a daily basis and an amount of cash and/or securities having an aggregate NAV at least equal to such accrued excess is maintained in a segregated account by the Funds’ Custodian. Until a swap
F-80
Table of Contents
agreement is settled in cash, the gain or loss on the notional amount less any transaction costs or trading spreads payable by each Fund on the notional amount are recorded as “unrealized appreciation or depreciation on swap agreements” and, when cash is exchanged, the gain or loss realized is recorded as “realized gains or losses on swap agreements.” Swap agreements are generally valued at the last settled price of the benchmark referenced Index.
The Trust, on behalf of a Fund, may enter into agreements with certain counterparties for derivative transactions. These agreements contain various conditions, events of default, termination events, covenants and representations. The triggering of certain events or the default on certain terms of the agreement could allow a party to terminate a transaction under the agreement and request immediate payment in an amount equal to the net positions owed the party under the agreement. This could cause a Fund to have to enter into a new transaction with the same counterparty, enter into a transaction with a different counterparty or seek to achieve its investment objective through any number of different investments or investment techniques.
Swap agreements involve, to varying degrees, elements of market risk (commodity price risk) and exposure to loss in excess of the unrealized gain/loss reflected. The notional amounts reflect the extent of the total investment exposure each Fund has under the swap agreement, which may exceed the NAV of each Fund. Additional risks associated with the use of swap agreements are imperfect correlation between movements in the notional amount and the price of the underlying reference index and the inability of counterparties to perform. Each Fund bears the risk of loss of the amount expected to be received under a swap agreement in the event of the default or bankruptcy of a swap agreement counterparty. A Fund will enter into swap agreements only with large, well-capitalized and well established financial institutions. The creditworthiness of each of the firms which is a party to a swap agreement is monitored by the Sponsor. The Sponsor may use various techniques to minimize credit risk including early termination and payment, using different counterparties and limiting the net amount due from any individual counterparty. All of the outstanding swap agreements at December 31, 2009 contractually terminate within one month but may be terminated without penalty by either party daily. Upon termination, the Fund is entitled to pay or receive the “unrealized appreciation or depreciation” amount.
The Funds collateralize swap agreements with cash and/or certain securities as indicated on the Statements of Financial Condition or Schedules of Investments and such collateral is held for the benefit of the counterparty in a segregated account at the Custodian to protect the counterparty against non-payment by the Funds. In the event of a default by the counterparty, the Funds will seek return of this collateral and may incur certain costs and time delays in exercising its right with respect to the collateral.
The Funds remain subject to credit risk with respect to the amount they expect to receive from counterparties, as those amounts are not similarly collateralized by the counterparty. If a counterparty becomes bankrupt or otherwise fails to perform its obligations due to financial difficulties, the Funds may experience significant delays in obtaining any recovery in a bankruptcy or other reorganization proceeding. The Funds may obtain only limited recovery or may obtain no recovery in such circumstances.
Forward Contracts
A forward contract is an agreement between two parties to purchase or sell a specified quantity of a commodity or currency at or before a specified date in the future at a specified price. Forward contracts are typically traded in the over-the-counter (“OTC”) markets and all details of the contract are negotiated between the counterparties to the agreement. Accordingly, the forward contracts are valued by reference to the contracts traded in the OTC markets.
The contractual obligations of a buyer or seller may generally be satisfied by taking or making physical delivery of the underlying commodity or currency, establishing an opposite position in the contract and recognizing the profit or loss on both positions simultaneously on the delivery date or, in some instances, paying a cash settlement before the designated date of delivery. The forward contracts are adjusted by the daily fluctuation of the underlying commodity or currency and any gains or losses are recorded for financial statement purposes as unrealized gains or losses until the contract settlement date.
F-81
Table of Contents
Forward contracts are, in general, not cleared or guaranteed by a third party. The Funds may collateralize forward commodity contracts with cash and/or certain securities as indicated on their Statements of Financial Condition or Schedules of Investments and such collateral is held for the benefit of the counterparty in a segregated account at the Custodian to protect the counterparty against non-payment by the Funds. In the event of a default by the counterparty, the Funds will seek return of this collateral and may incur certain costs exercising its right with respect to the collateral.
The Funds remain subject to credit risk with respect to the amount they expect to receive from counterparties, as those amounts are not similarly collateralized by the counterparty. If a counterparty becomes bankrupt or otherwise fails to perform its obligations due to financial difficulties, the Funds may experience significant delays in obtaining any recovery in a bankruptcy or other reorganization proceeding. The Funds may obtain only limited recovery or may obtain no recovery in such circumstances.
Participants in trading foreign exchange forward contracts often do not require margin deposits, but rely upon internal credit limitations and their judgments regarding the creditworthiness of their counterparties.
A Fund will enter into forward contracts only with large, well-capitalized and well established financial institutions. The creditworthiness of each of the firms which is a party to a forward contract is monitored by the Sponsor.
Fair Value of Derivative Instruments
As of December 31, 2009
| Asset Derivatives |
Liability Derivatives |
|||||||||||||||
| Derivatives not |
Statements of Location |
Fund |
Unrealized Appreciation |
Statements of |
Fund |
Unrealized Depreciation |
||||||||||
| Commodities Contracts | Receivables on open futures contracts, unrealized appreciation on swap and/or forward agreements | ProShares Ultra DJ-UBS Commodity | $ | 1,177,968 | Payable on open futures contracts, unrealized depreciation on swap and/or forward agreements | ProShares UltraShort DJ-UBS Commodity | $ | 216,605 | ||||||||
| ProShares Ultra DJ-UBS Crude Oil | 38,006,876 | ** | ProShares UltraShort DJ-UBS Crude Oil | 4,046,389 | ** | |||||||||||
| ProShares UltraShort Gold | 2,183,202 | ** | ProShares Ultra Gold | 5,428,460 | ** | |||||||||||
| ProShares UltraShort Silver | 3,043,799 | ** | ProShares Ultra Silver | 7,796,987 | ** | |||||||||||
| Foreign Exchange Contracts | Unrealized appreciation on foreign currency forward contracts | ProShares Ultra Euro | 383 | Unrealized appreciation on foreign currency forward contracts | ProShares Ultra Euro | 277,641 | ||||||||||
| ProShares UltraShort Euro | 1,965,377 | ProShares UltraShort Euro | 10,410 | |||||||||||||
| ProShares Ultra Yen | 5,135 | ProShares Ultra Yen | 320,948 | |||||||||||||
| ProShares UltraShort Yen | 4,880,828 | ProShares UltraShort Yen | 15,760 | |||||||||||||
| ** | Includes cumulative appreciation/depreciation of futures contracts as reported in the Schedules of Investments. Only current day’s variation margin is reported within the Statements of Financial Condition in receivable/payable on open futures contracts. |
F-82
Table of Contents
Fair Value of Derivative Instruments
As of December 31, 2008
| Asset Derivatives |
Liability Derivatives |
|||||||||||||||
| Derivatives not |
Statements of Financial Condition Location |
Fund |
Unrealized Appreciation |
Statements of Financial Location |
Fund |
Unrealized Depreciation |
||||||||||
| Commodities Contracts | Receivables on open futures contracts, unrealized appreciation on swap and/or forward agreements | ProShares Ultra DJ-UBS Commodity | $ | 184,583 | Payable on open futures contracts, unrealized depreciation on swap and/or forward agreements | ProShares UltraShort DJ-UBS Commodity | $ | 426,201 | ||||||||
| ProShares Ultra DJ-UBS Crude Oil | 12,678,400 | ** | ProShares UltraShort DJ-UBS Crude Oil | 3,550,590 | ** | |||||||||||
| ProShares Ultra Gold | 39,770 | ** | ProShares Ultra Gold | 586,254 | ||||||||||||
| ProShares UltraShort Gold | 86,657 | ProShares UltraShort Gold | 22,690 | ** | ||||||||||||
| ProShares UltraShort Silver | 47,484 | ProShares Ultra Silver | 264,872 | ** | ||||||||||||
| ProShares UltraShort Silver | 650 | ** | ||||||||||||||
| Foreign Exchange Contracts | Unrealized appreciation on foreign currency forward agreements | ProShares UltraShort Euro | 151,153 | Unrealized depreciation on foreign currency forward agreements | ProShares Ultra Euro | 140,545 | ||||||||||
| ProShares UltraShort Yen | 135,917 | ProShares Ultra Yen | 201,574 | |||||||||||||
| ** | Includes cumulative appreciation/depreciation of futures contracts as reported in the Schedules of Investments. Only current day’s variation margin is reported within the Statements of Financial Condition in receivable/payable on open futures contracts. |
F-83
Table of Contents
The Effect of Derivative Instruments on the Statements of Operations
For the year ended December 31, 2009
| Derivatives not accounted |
Location of Gain or
(Loss) |
Fund |
Realized Gain or (Loss) on Derivatives Recognized in Income |
Change in Unrealized Appreciation/ Depreciation on Derivatives Recognized in Income |
||||||||
| Commodity Contracts | Net realized gain (loss) on transactions from futures, swaps, and/or forwards/changes in unrealized appreciation/depreciation of futures, swaps, and/or forwards | ProShares Ultra DJ-UBS Commodity | $ | 4,280,412 | $ | 993,385 | ||||||
| ProShares UltraShort DJ-UBS Commodity | (2,479,160 | ) | 209,596 | |||||||||
| ProShares Ultra DJ-UBS Crude Oil | 100,784,061 | 25,328,476 | ||||||||||
| ProShares UltraShort DJ-UBS Crude Oil | (15,768,595 | ) | (495,799 | ) | ||||||||
| ProShares Ultra Gold | 39,926,104 | (4,881,976 | ) | |||||||||
| ProShares UltraShort Gold | (19,629,874 | ) | 2,119,235 | |||||||||
| ProShares Ultra Silver | 43,715,010 | (7,532,115 | ) | |||||||||
| ProShares UltraShort Silver | (40,785,230 | ) | 2,996,965 | |||||||||
| Foreign Exchange Contracts | Net realized gain (loss) on transactions from foreign currency transactions/changes in unrealized appreciation/depreciation of foreign currency transactions | ProShares Ultra Euro | 699,029 | (136,713 | ) | |||||||
| ProShares UltraShort Euro | (10,304,179 | ) | 1,803,814 | |||||||||
| ProShares Ultra Yen | (241,945 | ) | (114,239 | ) | ||||||||
| ProShares UltraShort Yen | (6,039,297 | ) | 4,729,151 | |||||||||
The Effect of Derivative Instruments on the Statements of Operations
For the period ended December 31, 2008
| Derivatives not accounted |
Location of Gain or
(Loss) |
Fund |
Realized Gain or (Loss) on Derivatives Recognized in Income |
Change in Unrealized Appreciation/ Depreciation on Derivatives Recognized in Income |
||||||||
| Commodity Contracts | Net realized gain (loss) on transactions from futures, swaps, and/or forwards/changes in unrealized appreciation/depreciation of futures, swaps, and/or forwards | ProShares Ultra DJ-UBS Commodity* | $ | (408,251 | ) | $ | 184,583 | |||||
| ProShares UltraShort DJ-UBS Commodity* | 607,967 | (426,201 | ) | |||||||||
| ProShares Ultra DJ-UBS Crude Oil* | (2,721,403 | ) | 12,678,400 | |||||||||
| ProShares UltraShort DJ-UBS Crude Oil* | 2,832,831 | (3,550,590 | ) | |||||||||
| ProShares Ultra Gold** | 2,267,718 | (546,484 | ) | |||||||||
| ProShares UltraShort Gold** | (723,574 | ) | 63,967 | |||||||||
| ProShares Ultra Silver** | 398,219 | (264,872 | ) | |||||||||
| ProShares UltraShort Silver** | (585,793 | ) | 46,834 | |||||||||
| Foreign Exchange Contracts | Net realized gain (loss) on transactions from foreign currency transactions/changes in unrealized appreciation/depreciation of foreign currency transactions | ProShares Ultra Euro* | 571,180 | (140,545 | ) | |||||||
| ProShares UltraShort Euro* | (493,306 | ) | 151,153 | |||||||||
| ProShares Ultra Yen* | 548,948 | (201,574 | ) | |||||||||
| ProShares UltaShort Yen* | (467,502 | ) | 135,917 | |||||||||
| * | Commenced investment operations on November 24, 2008. |
| ** | Commenced investment operations on December 1, 2008. |
F-84
Table of Contents
NOTE 4 – AGREEMENTS
Management Fee
Each Fund pays the Sponsor a Management Fee, monthly in arrears, in an amount equal to 0.95% per annum of the average daily NAV of such Fund to the extent that such amounts cumulatively exceed the organization and offering costs incurred by the Fund. The Management Fee is paid in consideration of the Sponsor’s services as commodity pool operator and commodity trading advisor, and for managing the business and affairs of the Fund. From the Management Fee, the Sponsor pays the fees and expenses of the Administrator, Custodian, Distributor, Transfer Agent and the licensors for the Commodity Index Funds (Dow Jones & Company, Inc. and UBS Securities LLC, together, “DJ-UBS”), the routine operational, administrative and other ordinary expenses of each Fund, and the normal and expected expenses incurred in connection with the continuous offering of Shares of each Fund after the commencement of its trading operations, including, but not limited to, expenses such as ongoing SEC registration fees not exceeding 0.021% per annum of the NAV of a Fund and Financial Industry Regulatory Authority (“FINRA”) filing fees. Each Fund incurs and pays its non-recurring and unusual fees and expenses. No other management fee is paid by the Fund.
The Administrator
The Sponsor and the Trust, for itself and on behalf of each Fund, has appointed Brown Brothers Harriman & Co. (“BBH&Co.”) as the Administrator of the Funds, and the Sponsor, the Trust, on its own behalf and on behalf of each Fund, and BBH&Co. have entered into an Administrative Agency Agreement (the “Administration Agreement”) in connection therewith. Pursuant to the terms of the Administration Agreement and under the supervision and direction of the Sponsor and the Trust, BBH&Co. prepares and files certain regulatory filings on behalf of the Funds. BBH&Co. may also perform other services for the Funds pursuant to the Administration Agreement as mutually agreed upon by the Sponsor, the Trust and BBH&Co. from time to time. Pursuant to the terms of the Administration Agreement, BBH&Co. also serves as the Transfer Agent of the Funds. The Administrator’s fees are paid on behalf of the Funds by the Sponsor.
The Custodian
BBH&Co. serves as Custodian of the Funds, and the Trust, on its own behalf and on behalf of each Fund, and BBH&Co. have entered into a Custodian Agreement in connection therewith. Pursuant to the terms of the Custodian Agreement, BBH&Co. is responsible for the holding and safekeeping of assets delivered to it by the Funds, and performing various administrative duties in accordance with instructions delivered to BBH&Co. by the Funds. The Custodian’s fees are paid on behalf of the Funds by the Sponsor.
The Distributor
SEI Investments Distribution Co. (“SEI”), serves as Distributor of the Shares and assists the Sponsor and the Administrator with certain functions and duties relating to distribution and marketing, including taking creation and redemption orders, consulting with the marketing staff of the Sponsor and its affiliates with respect to compliance with the requirements of FINRA and/or the NFA in connection with marketing efforts, and reviewing and filing of marketing materials with FINRA and/or the NFA. SEI retains all marketing materials separately for each Fund, at c/o SEI, One Freedom Valley Drive, Oaks, PA 19456. The Sponsor, on behalf of each Fund, has entered into a Distribution Services Agreement with SEI.
Routine Operational, Administrative and Other Ordinary Expenses
The Sponsor pays all of the routine operational, administrative and other ordinary expenses of each Fund generally, as determined by the Sponsor including, but not limited to, fees and expenses of the Administrator, Custodian, Distributor, Transfer Agent, DJ-UBS, accounting and auditing fees and expenses, tax preparation expenses, legal fees not in excess of $100,000 per annum, ongoing SEC registration fees not exceeding 0.021% per annum of the NAV of a Fund, FINRA filing fees, individual K-1 preparation and mailing fees not exceeding 0.10% per annum of the NAV of a Fund, and report preparation and mailing expenses.
F-85
Table of Contents
Non-Recurring Fees and Expenses
Each Fund pays all non-recurring and unusual fees and expenses, if any, as determined by the Sponsor. Non-recurring fees and expenses are fees and expenses such as legal claims and liabilities, litigation costs or indemnification or other material expenses which are not currently anticipated obligations of the Funds. Such fees and expenses are those that are non-recurring, unexpected or unusual in nature.
NOTE 5 – ORGANIZATION AND OFFERING COSTS
Organization costs are expensed as incurred and offering costs will be amortized by the Funds over a twelve month period on a straight-line basis. The Sponsor did not collect any fee in the first year of operation of each Fund in an amount equal to the organization and offering fees. The Sponsor reimbursed each Fund to the extent that its organization and offering costs exceeded 0.95% of its average daily NAV for the first year of operations. At December 31, 2009, payable for offering costs and payable for organization costs are reflected as accounts payable in the Statements of Financial Condition and the Statements of Cash Flows.
NOTE 6 – CREATION AND REDEMPTION OF CREATION UNITS
Each Fund issues and redeems Shares from time to time, but only in one or more Creation Units. A Creation Unit is a block of 50,000 Shares of a Fund. Creation Units may be created or redeemed only by Authorized Participants.
Except when aggregated in Creation Units, the Shares are not redeemable securities. Retail investors, therefore, generally will not be able to purchase or redeem Shares directly from or with a Fund. Rather, most retail investors will purchase or sell Shares in the secondary market with the assistance of a broker. Thus, some of the information contained in these Notes to Financial Statements—such as references to the Transaction Fees imposed on purchases and redemptions—is not relevant to retail investors.
Transaction Fees on Creation and Redemption Transactions
Authorized Participants pay a fixed transaction fee of $500 in connection with each order to create or redeem a Creation Unit in order to compensate BBH&Co. for services in processing the creation and redemption of Creation Units. Authorized Participants are required to pay a variable transaction fee of up to 0.10% of the value of the Creation Unit that is purchased or redeemed unless the transaction fee is waived or otherwise adjusted by the Sponsor. The variable transaction fee is 0.022% for the Commodity Funds and Commodity Index Funds and 0.00% for the Currency Funds. The Sponsor will provide the Authorized Participant with prompt notice in advance of any such waiver or adjustment of transaction fee. Authorized Participants may sell the Shares included in the Creation Units they purchase from the Funds to other investors in the secondary market.
Transaction fees for the year ended December 31, 2009 and the period from commencement of operations through December 31, 2008, which are included in the Sale and/or Redemption of Shares on the Statements of Changes in Shareholders’ Equity, were as follows:
| Fund |
Year Ended December 31, 2009 |
Period Ended December 31, 2008 | ||||
| Ultra DJ-UBS Commodity |
$ | 9,028 | $ | 780 | ||
| UltraShort DJ-UBS Commodity |
1,258 | 550 | ||||
| Ultra DJ-UBS Crude Oil |
534,221 | 23,002 | ||||
| UltraShort DJ-UBS Crude Oil |
188,773 | 5,361 | ||||
| Ultra Gold |
64,224 | 5,619 | ||||
| UltraShort Gold |
41,076 | 998 | ||||
| Ultra Silver |
49,367 | 2,085 | ||||
| UltraShort Silver |
56,339 | 550 | ||||
| Ultra Euro |
— | — | ||||
| UltraShort Euro |
— | — | ||||
| Ultra Yen |
— | — | ||||
| UltraShort Yen |
— | — | ||||
F-86
Table of Contents
NOTE 7 – FINANCIAL HIGHLIGHTS
Selected data for a Share outstanding throughout the year ended December 31, 2009:
Ultra ProShares
| For the Year Ended December 31, 2009 | ||||||||||||||||||||||||
| Ultra DJ- UBS Commodity |
Ultra DJ- UBS Crude Oil |
Ultra Gold |
Ultra Silver |
Ultra Euro |
Ultra Yen |
|||||||||||||||||||
| Per Share Operating Performance |
||||||||||||||||||||||||
| Net asset value, at December 31, 2008 |
$ | 22.1647 | $ | 14.7811 | $ | 30.8181 | $ | 28.6021 | $ | 29.2400 | $ | 28.4465 | ||||||||||||
| Net investment income (loss) |
(0.2142 | ) | (0.1024 | ) | (0.3383 | ) | (0.4573 | ) | (0.2640 | ) | (0.2383 | ) | ||||||||||||
| Net realized and unrealized gain (loss) |
6.2546 | (2.0542 | ) | 13.5980 | 28.8809 | 1.1497 | (2.0689 | ) | ||||||||||||||||
| Change in net asset value from operations |
6.0404 | (2.1566 | ) | 13.2597 | 28.4236 | 0.8857 | (2.3072 | ) | ||||||||||||||||
| Net asset value, at December 31, 2009 |
$ | 28.2051 | $ | 12.6245 | $ | 44.0778 | $ | 57.0257 | $ | 30.1257 | $ | 26.1393 | ||||||||||||
| Market value per share, at December 31, 2008† |
$ | 22.15 | $ | 13.69 | $ | 31.60 | $ | 31.50 | $ | 29.49 | $ | 28.66 | ||||||||||||
| Market value per share, at December 31, 2009† |
$ | 28.43 | $ | 12.68 | $ | 44.68 | $ | 56.15 | $ | 30.17 | $ | 26.58 | ||||||||||||
| Total Return, at net asset value |
27.25 | % | (14.59 | )% | 43.03 | % | 99.38 | % | 3.03 | % | (8.11 | )% | ||||||||||||
| Total Return, at market value |
28.35 | % | (7.38 | )% | 41.39 | % | 78.25 | % | 2.31 | % | (7.26 | )% | ||||||||||||
| Ratios to Average Net Assets |
||||||||||||||||||||||||
| Expense ratio |
(0.95 | )% | (1.04 | )% | (0.95 | )% | (0.96 | )% | (0.95 | )% | (0.95 | )% | ||||||||||||
| Expense ratio, excluding brokerage commissions |
(0.95 | )% | (0.95 | )% | (0.95 | )% | (0.95 | )% | (0.95 | )% | (0.95 | )% | ||||||||||||
| Net investment income (loss) |
(0.92 | )% | (1.00 | )% | (0.91 | )% | (0.92 | )% | (0.91 | )% | (0.91 | )% | ||||||||||||
| UltraShort ProShares | ||||||||||||||||||||||||
| For the Year Ended December 31, 2009 | ||||||||||||||||||||||||
| UltraShort DJ-UBS Commodity |
UltraShort DJ-UBS Crude Oil |
UltraShort Gold |
UltraShort Silver |
UltraShort Euro |
UltraShort Yen |
|||||||||||||||||||
| Per Share Operating Performance |
||||||||||||||||||||||||
| Net asset value, at December 31, 2008 |
$ | 26.7951 | $ | 29.0040 | $ | 19.3741 | $ | 19.5980 | $ | 20.9453 | $ | 21.6631 | ||||||||||||
| Net investment income (loss) |
(0.1877 | ) | (0.1798 | ) | (0.1240 | ) | (0.0600 | ) | (0.1758 | ) | (0.1992 | ) | ||||||||||||
| Net realized and unrealized gain (loss) |
(11.9863 | ) | (15.1356 | ) | (8.7691 | ) | (14.8288 | ) | (2.0940 | ) | (0.0393 | ) | ||||||||||||
| Change in net asset value from operations |
(12.1740 | ) | (15.3154 | ) | (8.8931 | ) | (14.8888 | ) | (2.2698 | ) | (0.2385 | ) | ||||||||||||
| Net asset value, at December 31, 2009 |
$ | 14.6211 | $ | 13.6886 | $ | 10.4810 | $ | 4.7092 | $ | 18.6755 | $ | 21.4246 | ||||||||||||
| Market value per share, at December 31, 2008† |
$ | 27.58 | $ | 31.66 | $ | 19.10 | $ | 17.51 | $ | 21.26 | $ | 21.85 | ||||||||||||
| Market value per share, at December 31, 2009† |
$ | 14.65 | $ | 13.65 | $ | 10.35 | $ | 4.79 | $ | 18.70 | $ | 21.30 | ||||||||||||
| Total Return, at net asset value |
(45.43 | )% | (52.80 | )% | (45.90 | )% | (75.97 | )% | (10.84 | )% | (1.10 | )% | ||||||||||||
| Total Return, at market value |
(46.88 | )% | (56.89 | )% | (45.81 | )% | (72.64 | )% | (12.04 | )% | (2.52 | )% | ||||||||||||
| Ratios to Average Net Assets |
||||||||||||||||||||||||
| Expense ratio |
(0.95 | )% | (1.07 | )% | (0.96 | )% | (0.96 | )% | (0.95 | )% | (0.95 | )% | ||||||||||||
| Expense ratio, excluding brokerage commissions |
(0.95 | )% | (0.95 | )% | (0.95 | )% | (0.95 | )% | (0.95 | )% | (0.95 | )% | ||||||||||||
| Net investment income (loss) |
(0.93 | )% | (1.03 | )% | (0.92 | )% | (0.92 | )% | (0.89 | )% | (0.89 | )% | ||||||||||||
F-87
Table of Contents
Selected data for a Share outstanding throughout the period ended December 31, 2008:
| Ultra ProShares | ||||||||||||||||||||||||
| From Commencement of Operations through December 31, 2008 | ||||||||||||||||||||||||
| Ultra DJ-UBS Commodity* |
Ultra DJ-UBS Crude Oil* |
Ultra Gold+ |
Ultra Silver+ |
Ultra Euro* |
Ultra Yen* |
|||||||||||||||||||
| Per Share Operating Performance | ||||||||||||||||||||||||
| Net asset value, beginning of period |
$ | 25.0000 | $ | 25.0000 | $ | 25.0000 | $ | 25.0000 | $ | 25.0000 | $ | 25.0000 | ||||||||||||
| Net investment income (loss) |
(0.0201 | ) | (0.0179 | ) | (0.0234 | ) | (0.0212 | ) | (0.0261 | ) | (0.0267 | ) | ||||||||||||
| Net realized and unrealized gain (loss) |
(2.8152 | ) | (10.2010 | ) | 5.8415 | 3.6233 | 4.2661 | 3.4732 | ||||||||||||||||
| Change in net asset value from operations |
(2.8353 | ) | (10.2189 | ) | 5.8181 | 3.6021 | 4.2400 | 3.4465 | ||||||||||||||||
| Net asset value, end of period |
$ | 22.1647 | $ | 14.7811 | $ | 30.8181 | $ | 28.6021 | $ | 29.2400 | $ | 28.4465 | ||||||||||||
| Market value per share, beginning of period† |
$ | 25.00 | $ | 25.00 | $ | 25.00 | $ | 25.00 | $ | 25.00 | $ | 25.00 | ||||||||||||
| Market value per share, end of period† |
$ | 22.15 | $ | 13.69 | $ | 31.60 | $ | 31.50 | $ | 29.49 | $ | 28.66 | ||||||||||||
| Total Return, at net asset value^ |
(11.34 | )% | (40.88 | )% | 23.27 | % | 14.41 | % | 16.96 | % | 13.79 | % | ||||||||||||
| Total Return, at market value^ |
(11.40 | )% | (45.24 | )% | 26.40 | % | 26.00 | % | 17.96 | % | 14.64 | % | ||||||||||||
| Ratios to Average Net Assets** |
||||||||||||||||||||||||
| Expense ratio |
(0.95 | )% | (1.41 | )% | (0.96 | )% | (0.97 | )% | (0.95 | )% | (0.95 | )% | ||||||||||||
| Expense ratio, excluding brokerage commissions |
(0.95 | )% | (0.95 | )% | (0.95 | )% | (0.95 | )% | (0.95 | )% | (0.95 | )% | ||||||||||||
| Net investment income (loss) |
(0.95 | )% | (1.41 | )% | (0.96 | )% | (0.97 | )% | (0.95 | )% | (0.95 | )% | ||||||||||||
UltraShort ProShares
| UltraShort DJ-UBS Commodity* |
UltraShort DJ-UBS Crude Oil* |
UltraShort Gold+ |
UltraShort Silver+ |
UltraShort Euro* |
UltraShort Yen* |
|||||||||||||||||||
| Per Share Operating Performance |
||||||||||||||||||||||||
| Net asset value, beginning of period |
$ | 25.0000 | $ | 25.0000 | $ | 25.0000 | $ | 25.0000 | $ | 25.0000 | $ | 25.0000 | ||||||||||||
| Net investment income (loss) |
(0.0278 | ) | (0.0674 | ) | (0.0173 | ) | (0.0187 | ) | (0.0213 | ) | (0.0215 | ) | ||||||||||||
| Net realized and unrealized gain (loss) |
1.8229 | 4.0714 | (5.6086 | ) | (5.3833 | ) | (4.0334 | ) | (3.3154 | ) | ||||||||||||||
| Change in net asset value from operations |
1.7951 | 4.0040 | (5.6259 | ) | (5.4020 | ) | (4.0547 | ) | (3.3369 | ) | ||||||||||||||
| Net asset value, end of period |
$ | 26.7951 | $ | 29.0040 | $ | 19.3741 | $ | 19.5980 | $ | 20.9453 | $ | 21.6631 | ||||||||||||
| Market value per share, beginning of period† |
$ | 25.00 | $ | 25.00 | $ | 25.00 | $ | 25.00 | $ | 25.00 | $ | 25.00 | ||||||||||||
| Market value per share, end of period† |
$ | 27.58 | $ | 31.66 | $ | 19.10 | $ | 17.51 | $ | 21.26 | $ | 21.85 | ||||||||||||
| Total Return, at net asset value^ |
7.18 | % | 16.02 | % | (22.50 | )% | (21.61 | )% | (16.22 | )% | (13.35 | )% | ||||||||||||
| Total Return, at market value^ |
10.32 | % | 26.64 | % | (23.60 | )% | (29.96 | )% | (14.96 | )% | (12.60 | )% | ||||||||||||
| Ratios to Average Net Assets** |
||||||||||||||||||||||||
| Expense ratio |
(0.95 | )% | (1.71 | )% | (0.97 | )% | (1.00 | )% | (0.95 | )% | (0.95 | )% | ||||||||||||
| Expense ratio, excluding brokerage commissions |
(0.95 | )% | (0.95 | )% | (0.95 | )% | (0.95 | )% | (0.95 | )% | (0.95 | )% | ||||||||||||
| Net investment income (loss) |
(0.95 | )% | (1.71 | )% | (0.97 | )% | (1.00 | )% | (0.95 | )% | (0.95 | )% | ||||||||||||
| * | Fund commenced operations on November 24, 2008. |
| + | Fund commenced operations on December 1, 2008. |
| ^ | Percentages are not annualized for the period ended December 31, 2008. |
| The returns for a share outstanding for 2008 are calculated based on initial offering price upon commencement of investment operations of $25.0000. |
| ** | Percentages are annualized. |
| † | Market values are determined at the close of the New York Stock Exchange, which may be later than when the Funds’ net asset value is calculated. |
F-88
Table of Contents
NOTE 8 – RISK
Correlation Risk
The Funds do not seek to achieve their stated investment objective over a period of time greater than one day because mathematical compounding prevents the Funds from achieving such results. Accordingly, results over periods of time greater than one day should not be expected to be a simple multiple (+200 or -200%) of the period return of the corresponding benchmark and will likely differ significantly.
A number of factors may affect a Fund’s ability to achieve a high degree of correlation with its benchmark, and there can be no guarantee that a Fund will achieve a high degree of correlation. A failure to achieve a high degree of correlation may prevent a Fund from achieving its investment objective. A number of factors may adversely affect a Fund’s correlation with its benchmark, including fees, expenses, transaction costs, costs associated with the use of leveraged investment techniques, income items, accounting standards and disruptions or illiquidity in the markets for the commodities or Financial Instruments (i.e., commodity-based or currency-based instruments whose value is derived from the value of an underlying asset, rate or index) in which the Fund invests. A Fund may be subject to large movements of assets into and out of the Fund, potentially resulting in the Fund being over- or under-exposed to its benchmark. In addition, there is a special form of correlation risk that derives from these Funds’ use of leverage, which is that for periods greater than one day, the use of leverage tends to cause the performance of a Fund to be either greater than or less than the target return for the same period stated in the fund objective, before accounting for fees and fund expenses. In general, given a particular index return, increased volatility of the index may cause a decrease in the performance relative to the target return for the same period.
Counterparty Risk
A Fund will be subject to credit risk with respect to the amount it expects to receive from counterparties to Financial Instruments and repurchase agreements entered into by the Fund. A Fund may be negatively impacted if a counterparty becomes bankrupt or otherwise fails to perform its obligations due to financial difficulties. The Funds structure swap agreements such that either party can terminate the contract without penalty prior to the termination date. A Fund may experience significant delays in obtaining any recovery in a bankruptcy or other reorganization proceeding and a Fund may obtain only limited recovery or may obtain no recovery in such circumstances. The Funds typically enter into transactions with counterparties whose credit ratings are investment grade, as determined by a nationally recognized statistical rating organization, or, if unrated, judged by the Sponsor to be of comparable quality.
Leverage Risk
Leverage offers a means of magnifying market movements into larger changes in an investment’s value and provides greater investment exposure than an unleveraged investment. Swap agreements, borrowing, futures contracts and forward contracts, all may be used to create leverage. Each Fund employs leveraged investment techniques to achieve its investment objective.
Liquidity Risk
In certain circumstances, such as the disruption of the orderly markets for the commodities or Financial Instruments in which a Fund invests, a Fund might not be able to dispose of certain holdings quickly or at prices that represent true market value in the judgment of the Sponsor. Such a situation may prevent a Fund from limiting losses, realizing gains or achieving a high correlation or inverse correlation with its underlying index.
NOTE 9 – SUBSEQUENT EVENTS
Management has evaluated the possibility of subsequent events existing in the Funds’ financial statements through the date the financial statements were issued. Management has determined that there are no material events that would require disclosure in its Funds’ financial statements through this date.
F-89
Table of Contents
Pursuant to the requirements of Section 13 or 15(d) of the Securities Exchange Act of 1934, the registrant has duly caused this report to be signed on its behalf by the undersigned, thereunto duly authorized.
| PROSHARES TRUST II |
| /s/ LOUIS MAYBERG |
| By: Louis Mayberg Principal Executive Officer Date: March 1, 2010 |
Pursuant to the requirements of the Securities Exchange Act of 1934, this report has been signed below by the following persons on behalf of the registrant and in the capacities and on the dates indicated.
| /s/ LOUIS MAYBERG |
| By: Louis Mayberg Principal Executive Officer Date: March 1, 2010 |
| /s/ EDWARD KARPOWICZ |
| By: Edward Karpowicz Principal Financial Officer Date: March 1, 2010 |